Table of Contents
|
UNITED STATES
SECURITIES AND EXCHANGE COMMISSION
|
Washington, D.C. 20549
|
|
Form 10-K
Table of Contents |
UNITED STATES
SECURITIES AND EXCHANGE COMMISSION
Washington, D.C. 20549
Form 10-K
x☒ Annual Report Pursuant to Section 13 or 15(d) of the Securities Exchange
Act of 1934 for the fiscal year ended July 31, 20112013 or
☐o Transition Report Pursuant to Section 13 or 15(d) of the Securities
Exchange Act of 1934
for the transition period from __________ to __________
Commission File Number: 1-7891
DONALDSON COMPANY, INC.
(Exact name of registrant as specified in its charter)
| Delaware | 41-0222640 |
DONALDSON COMPANY, INC.
|
(Exact name of registrant as specified in its charter)
|
| | | | | |
Delaware
| 41-0222640
|
(State or other jurisdiction of | (I.R.S. Employer
|
incorporation or organization)
| (I.R.S. Employer
Identification No.) |
| | | | | |
| |
1400 West 94th Street,
Minneapolis, Minnesota | 55431 |
(Address of principal executive offices) | (Zip Code) |
Registrant’s telephone number, including area code: (952) 887-3131
Securities registered pursuant to Section 12(b) of the Act:
| | | | | |
| Title of each class | | | Name of each exchange
on which registered | |
Common Stock, $5 Par Value | New York Stock Exchange |
Preferred Stock Purchase Rights | New York Stock Exchange |
Securities registered pursuant to Section 12(g) of the Act: NONE
Indicate by check mark if the registrant is a well-known seasoned issuer, as defined in Rule 405 of the Securities Act.x☒ Yeso☐ No
Indicate by check mark if the registrant is not required to file reports pursuant to Section 13 or Section 15(d) of the Act.o☐ Yesx☒ No
Indicate by check mark whether the registrant (1) has filed all reports required to be filed by Section 13 or 15(d) of the Securities Exchange Act of 1934 during the preceding 12 months (or for such shorter period that the registrant was required to file such reports), and (2) has been subject to such filing requirements for the past 90 days.x☒ Yeso☐ No
Indicate by check mark whether the registrant has submitted electronically and posted on its corporate Website, if any, every Interactive Data File required to be submitted and posted pursuant to Rule 405 of Regulation S-T during the preceding 12 months (or for such short period that the registrant was required to submit and post such files)x☒ Yeso☐ No
Indicate by check mark if disclosure of delinquent filers pursuant to Item 405 of Regulation S-K is not contained herein, and will not be contained, to the best of registrant’s knowledge, in definitive proxy or information statements incorporated by reference in Part III of this Form 10-K or any amendment to this Form 10-K.o☒
Indicate by check mark whether the registrant is a large accelerated filer, an accelerated filer, a non-accelerated filer, or a smaller reporting company. See the definitions of “large accelerated filer,” “accelerated filer” and “smaller reporting company” in Rule 12b-2 of the Exchange Act. (Check one):
| |
Large accelerated filerx☒ | Accelerated filero☐ |
| |
Non-accelerated filero☐ | Smaller reporting companyo
|
| |
(Do(Do not check if a smaller reporting company)
| Smaller reporting company ☐ |
Indicate by check mark whether the registrant is a shell company (as defined in Rule 12b-2 of the Act).
o☐ Yesx☒ No
As of January 28, 2011,31, 2013, the last business day of the registrant’s most recently completed second fiscal quarter, the aggregate market value of voting and non-voting common stock held by non-affiliates of the registrant was $4,424,036,897$5,466,451,890 (based on the closing price of $58.04$37.61 as reported on the New York Stock Exchange as of that date).
As of August 31, 2011,2013, there were approximately 74,522,228146,109,145 shares of the registrant’s common stock outstanding.
Documents Incorporated by Reference
Portions of the registrant’s Proxy Statement for its 20112013 annual meeting of stockholders (the “2011“2013 Proxy Statement”) are incorporated by reference in Part III, as specifically set forth in Part III.
DONALDSON COMPANY, INC.
ANNUAL REPORT ON FORM 10-K
TABLE OF CONTENTS
Table of Contents
PART I
Item 1. Business
General
Donaldson Company, Inc. (“Donaldson”(Donaldson or the “Company”)Company) was founded in 1915 and organized in its present corporate form under the laws of the State of Delaware in 1936.
The Company is a worldwide manufacturer of filtration systems and replacement parts. The Company’s product mix includes air and liquid filtration systems and exhaust and emission control products. Products are manufactured at 39 plants around the world and through three3 joint ventures. The Company has two reporting segments: Engine Products and Industrial Products. Products in the Engine Products segment consist of air filtration systems, exhaust and emissions systems, liquid filtration systems, and replacement filters. The Engine Products segment sells to original equipment manufacturers (“OEMs”)(OEMs) in the construction, mining, agriculture, aerospace, defense, and truck markets and to OEM dealer networks, independent distributors, private label accounts, and large equipment fleets. Products in the Industrial Products segment consist of dust, fume, and mist collectors, compressed air purification systems, air filtration systems for gas turbines, PTFE membrane-based products, and specialized air filtration systems for applications including computer hard disk drives.drives and semi-conductor manufacturing. The Industrial Products segment sells to various industrial dealers, distributors, and end-users, OEMs of gas-fired turbines, and OEMs and end-users requiring clean air.
The table below shows the percentage of total net sales contributed by the principal classes of similar products for each of the last three fiscal years:
| | | | | | | | | | | |
| | Year Ended July 31, | | | Year Ended July 31, | |
| | 2011 | | 2010 | | 2009 | | | 2013 | | | 2012 | | | 2011 | |
Engine Products segment | | | | | | | | | | | | | | | | | | | |
Off-Road Products | | 14 | % | | 12 | % | | 13 | % | | | 15% | | | | 15% | | | | 14% | |
Aerospace and Defense Products | | 5 | % | | 6 | % | | 6 | % | |
On-Road Products | | 5 | % | | 4 | % | | 4 | % | | | 5% | | | | 7% | | | | 5% | |
Aftermarket Products* | | 38 | % | | 37 | % | | 30 | % | | | 37% | | | | 36% | | | | 38% | |
Retrofit Emissions Products | | 1 | % | | 1 | % | | 2 | % | | | 1% | | | | 1% | | | | 1% | |
*includes replacement part sales to the Company’s OEMs customers | | | | | | | | |
| | | | | | | | |
| Aerospace and Defense Products | | | | 4% | | | | 4% | | | | 5% | |
| *includes replacement part sales to the Company’s OEM Customers | | | | | | | | | | | | | |
Industrial Products segment | | | | | | | | | | | | | | | | | | | |
Industrial Filtration Solutions Products | | 22 | % | | 22 | % | | 26 | % | | | 22% | | | | 22% | | | | 22% | |
Gas Turbine Products | | 7 | % | | 8 | % | | 11 | % | | | 9% | | | | 7% | | | | 7% | |
Special Applications Products | | 8 | % | | 10 | % | | 8 | % | | | 7% | | | | 8% | | | | 8% | |
FinancialTotal net sales contributed by the principal classes of similar products and financial information about segment operations appearsappear in Note KL in the Notes to Consolidated Financial Statements on page 49.53.
The Company makes its annual reports on Form 10-K, quarterly reports on Form 10-Q, and current reports on Form 8-K, and amendments to those reports, available free of charge through its website at www.donaldson.com, as soon as reasonably practicable after it electronically files such material with (or furnishes such material to) the Securities and Exchange Commission. Also available on the Company’s website are corporate governance documents, including the Company’s code of business conduct and ethics, corporate governance guidelines, Audit Committee charter, Human Resources Committee charter, and Corporate Governance Committee charter. These documents are also available in print, free of charge to any shareholder who requests them. The information contained on the Company’s website is not incorporated by reference into this Annual Report on Form 10-K and should not be considered to be part of this Form 10-K.
Seasonality
A number of the Company’s end markets are dependent on the construction, agricultural, and power generation industries, which are generally stronger in the second half of the Company’s fiscal year. The first two quarters of the fiscal year also contain the traditional summer and winter holiday periods, which are characterized by more Customer plant closures.
Table of Contents
Competition
Principal methods of competition in both the Engine and Industrial Products segments are technology and innovation, price, geographic coverage, service, and product performance. The Company competes in a number of highly competitive filtration markets in both segments. The Company believes it is a market leader withwithin many of its product lines. The Company believeslines, specifically within the Engine Products segment it is a market leader in its Off-Road Equipment and On-Road Products lines for OEMs and is a significant participant in the aftermarket for replacement filters. The Engine Products segment’s principal competitors include several large global competitors and many regional competitors, especially in the Engine Aftermarket Products business. The Industrial Products segment’s principal competitors vary from country to country and include several large regional and global competitors and a significant number of smaller competitors who compete in a specific geographical region or in a limited number of product applications.
Raw Materials
The principal raw materials that the Company uses are steel, filter media, and plastics. Commodity prices generally increased throughoutpetroleum-based products. Purchased raw materials represent approximately 60 to 65 percent of the year, butCompany’s cost of goods sold. Of that amount, steel, including fabricated parts, represents approximately 25 percent. Filter media represents approximately 15 to 20 percent and the impact was moderated by certain long term supply contracts. The Company anticipates a further impact from rising commodity prices in Fiscal 2012, as compared to Fiscal 2011, specifically for steelremainder is primarily made up of petroleum-based products and media, as these supply contracts expired during the latter half of Fiscal 2011. The Company experienced no significant supply problems in the purchase of its major raw materials.other components. The Company typically has multiple sources of supply for the raw materials essential to its business, andbut does rely primarily on two media suppliers. The Company is not required to carry significant amounts of raw material inventory to secure supplier allotments. However, the Company does stock finished goods inventory at its regional distribution centers in order to meet anticipated Customer demand. The Company has not experienced significant supply problems in the purchase of its major raw materials.
Patents and Trademarks
The Company owns various patents and trademarks, which it considers in the aggregate to constitute a valuable asset, including patents and trademarks for products sold under the Ultra-Web®, PowerCore®, and Donaldson® trademarks. However, it does not regard the validity of any one patent or trademark as being of material importance.
Major Customers
There were no Customers that accounted for over 10 percent of net sales in Fiscal 2011, 20102013, 2012, or 2009.2011. There were no Customers that accounted for over 10 percent of gross accounts receivable in Fiscal 2011 or 2010.2013 and one Customer over 10 percent of gross accounts receivable in Fiscal 2012.
Backlog
At August 31, 2011,2013, the backlog of orders expected to be delivered within 90 days was $423.8$351.7 million. All of thisThis entire backlog is expected to be shipped during Fiscal 2012.2014. The 90-day backlog at August 31, 2010,2012, was $361.1$403.7 million. Backlog is one of many indicators of business conditions in the Company’s markets. However, it is not always indicative of future results for a number of reasons, including short lead times in the Company’s replacement parts businesses and the timing of orders in many of the Company’s Engine OEM and Industrial markets.
Research and Development
During Fiscal 2011,2013, the Company spent $55.3$62.6 million on research and development activities. Research and development expenses include basic scientific research and the application of scientific advances to the development of new and improved products and their uses. The Company spent $44.5$59.6 million and $40.6$55.3 million in Fiscal 20102012 and Fiscal 2009,2011, respectively, on research and development activities. Substantially all commercial research and development is performed in-house.
Environmental Matters
The Company does not anticipate any material effect on its capital expenditures, earnings, or competitive position during Fiscal 20122014 due to compliance with government regulations regulating the discharge of materials into the environment or otherwise relating to the protection of the environment.
Employees
The Company employed over 13,00012,400 persons in worldwide operations as of August 31, 2011.2013.
Geographic Areas
Financial information about geographic areas appears in Note KL of the Notes to Consolidated Financial Statements on page 49.53.
Table of Contents
Item 1A. Risk Factors
There are inherent risks and uncertainties associated with our global operations that involve the manufacturing and sale of products for highly demanding Customer applications throughout the world. These risks and uncertainties could adversely affect our operating performance and financial condition. The following discussion, along with discussions elsewhere in this report, outlines the risks and uncertainties that we believe are the most material to our business. In light of the global economic slowdown in recent years and the continued uncertainty, webusiness at this time. We want to further highlight the risks and uncertainties associated with: world economic factors and conditions, the ongoing global economic uncertainty, that is impacting many regionsthe reduced demand for hard disk drive products with the increased use of the world, the financial condition of our suppliers and Customers,flash memory, the potential for some Customers to increase their reliance on their own filtration capabilities, currency fluctuations, commodity prices, political factors, the Company’sour international operations, the possible reduced demand for hard disk drive products with the increased use of flash memory, highly competitive markets, inability to hire and retain key employees, governmental laws and regulations, including the impact of the various economic stimulus and financial reform measures, being implemented by governments around the world, the implementation of our new information technology systems, failure or breach of information technology and trade secret security, potential global events resulting in market instability, and unpredictability in the world’s markets, including financial bailouts and defaults of sovereign nations, political changes, military and terrorist activities including political unrest in the Middle East, other political changes, health outbreaks, natural disasters, and other factors discussed below. The Company undertakesWe undertake no obligation to publicly update or revise any forward-looking statements, whether as a result of new information, future events or otherwise.
Operating internationally carries risks which could negatively affect our financial performance.
We have sales and manufacturing operations throughout the world, with the heaviest concentrations in North America,the Americas, Europe, and Asia. Our stability, growth, and profitability are subject to a number of risks of doing business internationally that could harm our business, including:
| · | |
| •
| political and military events, |
| · | |
| •
| legal and regulatory requirements, including import, export, defense regulations, anti-corruption laws, and foreign exchange controls, |
| · | |
| •
| tariffs and trade barriers, |
| · | |
| •
| potential difficulties in staffing and managing local operations, |
| · | |
| •
| credit risk of local Customers and distributors, |
| · | |
| •
| difficulties in protecting intellectual property, |
| · | |
| •
| local economic, political, and social conditions, specifically in the Middle East, China, Thailand, and Thailandother emerging markets where we have significant investments and do business, |
| · | |
| •
| potential global health outbreaks. outbreaks, and |
Due to the international scope of our operations, we are subject to a complex system of import- and export-related laws and regulations. Any alleged or actual violations may subject us to government scrutiny, investigation, and civil and criminal penalties, and may limit our ability to import or export our products or to provide services outside the United States (U.S.). In addition, the U.S. Foreign Corrupt Practices Act and similar foreign anti-corruption laws generally prohibit companies and their intermediaries from making improper payments or providing anything of value to improperly influence foreign government officials for the purpose of obtaining or retaining business, or obtaining an unfair advantage. Recent years have seen a substantial increase in the global enforcement of anti-corruption laws. Violations of these laws may result in severe criminal or civil sanctions, could disrupt our business, and result in an adverse effect on our reputation, business, and results of operations or financial condition.
Maintaining a competitive advantage requires continuing investment with uncertain returns.
We operate in highly competitive markets and have numerous competitors who may already be well-established in those markets. We expect our competitors to continue improving the design and performance of their products and to introduce new products that could be competitive in both price and performance. We believe that we have certain technological advantages over our competitors, but maintaining these advantages requires us to continually invest in research and development, sales and marketing, and Customer service and support. There is no guarantee that we will be successful in maintaining these advantages. We make investments in new technologies that address increased performance and regulatory requirements around the globe. There is no guarantee that we will be successful in completing development or achieving sales of these products or that the margins on such products will be acceptable. Our financial performance may be negatively impacted if a competitor’s successful product innovation reaches the market before ours or gains broader market acceptance.
A few of our major OEM Customers also manufacture filtration systems. Although these OEM Customers rely on us and other suppliers for some of their filtration systems, they sometimes choose to manufacture additional filtration systems for their own use. There is also a risk that a Customer could acquire one or more of our competitors.
Table of Contents
We may be adversely impacted by changes in technology that could reduce or eliminate the demand for our products. These risks include:
| · | |
| •
| breakthroughs in technology which provide a viable alternative to diesel engines and |
| · | |
| •
| reduced demand for disk drive products by flash memory or a similar technology, which would reduce the use of disk drives and therefore eliminate the need for our filtration solutions in disk drives. drives |
| · | other breakthroughs in filtration technologies that could displace our products |
Difficulties with our information technology systems and security could adversely affect our results.
We have many information technology systems that are important to the operation of its businesses, some of which are managed by third parties. These systems are used to process, transmit, and store electronic information, and to manage or support a variety of business processes and activities. We could encounter difficulties in developing new systems, maintaining and upgrading existing systems, and preventing information security breaches. There may be other challenges and risks as we upgrade and standardize our Enterprise Resource Planning (ERP) system on a worldwide basis. Such difficulties could lead to significant additional expenses and/or disruption in business operations that could adversely affect our results. Additionally, information technology security threats are increasing in frequency and sophistication. These threats pose a risk to the security of our systems and networks and the confidentiality, availability, and integrity of our data. Should such an attack succeed, it could lead to the compromising of confidential information, manipulation and destruction of data, defective products, production downtimes, and operations disruptions. The occurrence of any of these events could adversely affect our reputation, and could result in litigation, regulatory action, potential liability, and increased costs and operational consequences of implementing further data protection matters.
Demand for our products relies on economic and industrial conditions worldwide.
Changes in economic or industrial conditions could impact ourresults of operations or financial condition in any particular period as our business can be sensitive to varying conditions by region across the globe.
While sales to Caterpillar accounted for slightly less than 10 percent of our net sales in Fiscal 2013, 2012, and 2011, an adverse change in Caterpillar’s financial performance or a material reduction in our sales to Caterpillar could negatively impact our operating results.
We participate in highly competitive markets with pricing pressure. If we are not able to compete effectively our margins and results of operations could be adversely affected.
The businesses and product lines in which we participate are very competitive and we risk losing business based on a wide range of factors including technology, price, geographic coverage, product performance, and Customer service. Large Customers continue to seek productivity gains and lower prices from us and their other suppliers. We may lose business or negatively impact our margins if we are unable to deliver the best value to our Customers.
Demand for our products relies on economic and industrial conditions worldwide.
Demand for our products tends to respond to varying levels of economic, construction, agricultural, mining, and industrial activity in the United States and in other industrialized nations.
Sales to Caterpillar accounted for slightly less than 10 percent of our net sales in Fiscal 2011, 2010 and 2009. An adverse change in Caterpillar’s financial performance or a material reduction in our sales to Caterpillar could negatively impact our operating results.
Changes in our product mix impacts our financial performance.
We sell products that have varying profit margins. Our financial performance can be impacted depending on the mix of products we sell during a given period.Our outlook assumes a certain geographic mix of sales as well as a product mix of sales. If actual results vary from this projected geographic and product mix of sales, our results could be negatively impacted.
Unavailable or higher cost materials could impact our financial performance.
We obtain raw materials including steel, filter media, plastics,petroleum-based products, and other components from third-party suppliers and tend to carry limited raw material inventories. An unanticipated delay in delivery by our suppliers could result in the inability to deliver on-time and meet the expectations of our Customers. This could negatively affect our financial performance. An increase in commodity prices could also result in lower operating margins.
Difficulties with the Company’s information technology systems could adversely affect our results.
The Company has many information technology systems that are important to the operation of its businesses. The Company could encounter difficulties in developing new systems or maintaining and upgrading existing systems. Such difficulties could lead to significant expenses due to disruption in business operations and could adversely affect the Company’s results.
Unfavorable fluctuations in foreign currency exchange rates could negatively impact our results and financial position.
We have operations in many countries. Each of our subsidiaries reports its results of operations and financial position in its relevant foreignfunctional currency, which is then translated into U.S. dollars. This translated financial information is included in our consolidated financial statements. The strengthening of the U.S. dollar in comparison to the foreign currencies of our subsidiaries could have a negative impact on our results and financial position.
Acquisitions may have an impact on our results.
We have made and continue to pursue acquisitions. We cannot guarantee that these acquisitions will have a positive impact on our results. These acquisitions could negatively impact our profitability due to operating and integration inefficiencies, the incurrence of debt, contingent liabilities, and amortization expenses related to intangible assets. There are also a number of other risks involved in acquisitions. We could lose key existing Customers, have difficulties in assimilating the acquired operations, assume unanticipated legal liabilities, or lose key employees.
ComplianceCosts associated with environmental and product laws and regulations can be costly.lawsuits or investigations may have an adverse effect on our results of operations.
We are subject to many environmental laws and regulations in the jurisdictions in which we operate. We routinely incur costs in order to comply with these laws and regulations. We may be adversely impacted by new or changing laws and regulations that affect both our operations and our ability to develop and sell products that meet our Customers’ requirements. We are involved in various product liability, product warranty, intellectual property, environmental claims, and other legal proceedings that arise in and outside of the ordinary course of our business. It is not possible to predict the outcome of investigations and lawsuits, and we could incur judgments, fines, or penalties or enter into settlements of lawsuits and claims that could have an adverse effect on our business, results of operations, and financial condition in any particular period.
Additional tax expense or tax exposure could impact our financial performance.
We are subject to income taxes in various jurisdictions in which we operate. Our tax liabilities are dependent upon the location of Contents
earnings among these different jurisdictions. Our provision for income taxes and cash tax liability could be adversely affected by numerous factors, including income before taxes being lower than anticipated in countries with lower statutory tax rates and higher than anticipated in countries with higher statutory tax rates, changes in the valuation of deferred tax assets and liabilities, and changes in tax laws and regulations. We are also subject to the continuous examination of our income tax returns tax authorities. The results of audit and examination of previously filed tax returns and continuing assessments of our tax exposures may have an adverse effect on the Company’s provision for income taxes and cash tax liability.
Compliance with environmental and product laws and regulations can be costly.
We are subject to many environmental and product laws and regulations in the jurisdiction we operate. We routinely incur costs in order to comply with these laws and regulations. We may be adversely impacted by new or changing laws and regulations that affect both our operations and our ability to develop and sell products that meet our Customers’ requirements.
Item 1B. Unresolved Staff Comments
None.
Item 2. Properties
The Company’s principal administrative office and research facilities are located in Bloomington, a suburb of Minneapolis, Minnesota. The Company’s principal European administrative and engineering offices are located in Leuven, Belgium. The Company also has extensive operations in the Asia-Pacific region.
The Company’s principal manufacturing and distribution activities are located throughout the world. The following is a summary of the principal plants and other materially important physical properties owned or leased by the Company.
| Americas | |
Americas
| Europe / Middle East / Africa |
Auburn, Alabama (E) | Kadan, Czech Republic (I) |
Riverbank, California (I)* | Klasterec, Czech Republic |
Valencia, California (E)* | Domjean, France (E) |
Dixon, Illinois | Paris, France (E)* |
Frankfort, Indiana | Dulmen, Germany (E) |
Cresco, Iowa | Flensburg,Haan, Germany (I)
|
Grinnell, Iowa (E) | Haan, Germany (I)
Ostiglia, Italy (E) |
Nicholasville, Kentucky | Ostiglia, Italy
|
Bloomington, Minnesota
| Cape Town, South Africa |
Chillicothe, Missouri (E)
Bloomington, Minnesota | Johannesburg, South Africa* |
Chesterfield, Missouri (E)* | Hull, United Kingdom |
Philadelphia, Pennsylvania (I)
Chillicothe, Missouri (E) | Leicester, United Kingdom (I) |
Greeneville, Tennessee
Philadelphia, Pennsylvania (I) | |
Baldwin, Wisconsin
Greeneville, Tennessee | Australia |
Baldwin, Wisconsin | Wyong, Australia |
| Stevens Point, Wisconsin | Wyong, Australia
|
Sao Paulo, Brazil (E)* | Asia |
Brockville, Canada (I)(E)* | Asia
Wuxi, China |
Aguascalientes, Mexico | Hong Kong, China*
New Delhi, India |
Monterrey, Mexico (I) | Wuxi, China
Gunma, Japan |
| New Delhi, India
Rayong, Thailand (I) |
Joint Venture Facilities | Gunma, Japan
Third-Party Logistics Providers |
Champaign, Illinois (E) | Rayong, Thailand (I)
Santiago, Chile |
Jakarta, Indonesia | Wuxi, China |
Dammam, Saudi Arabia (I) | Third-Party Logistics Providers
Mumbai, India |
| Santiago, Chile
Chennai, India |
Distribution Centers | Wuxi, China
|
Wyong, Australia
| Mumbai, India
|
Brugge, Belgium
| Plainfield, Indiana (I) |
Rensselaer, Indiana
Wyong, Australia | Gunma, Japan |
Ostiglia, Italy
Brugge, Belgium | Singapore |
Aguascalientes, Mexico
Sao Paulo, Brazil* | Greeneville, Tennessee (I) |
Johannesburg, South Africa
Rensselaer, Indiana | |
| Jakarta, Indonesia | |
| Aguascalientes, Mexico | |
The Company’s properties are utilized for both the Engine and Industrial Products segments except as indicated with an (E) for Engine or (I) for Industrial. The Company leases certain of its facilities, primarily under long-term leases. The facilities denoted with an asterisk (*) are leased facilities. In Wuxi, China, and Bloomington, Minnesota a portion of the activities are conducted in leased facilities. The Company uses third-party logistics providers for some of its product distribution and neither leases nor owns the facilities. The Company considers its properties to be suitable for their present purposes, well-maintained, and in good operating condition.
Table of Contents
Item 3. Legal Proceedings
The Company records provisions with respect to identified claims or lawsuits when it is probable that a liability has been incurred and the amount of the loss can be reasonably estimated. Claims and lawsuits are reviewed quarterly and provisions are taken or adjusted to reflect the status of a particular matter. The Company believes the recorded reserves in its consolidated financial statements are adequate in light of the probable and estimable outcomes. Any recorded liabilities were not material to the Company’s financial position, results of operationoperations or liquidity, and the Company does not believe that any of the currently identified claims or litigation will materially affect its financial position, results of operation or liquidity.
The Company has reached a preliminary agreement to settle the class action lawsuits that were previously disclosed in its SEC filings, including most recently the Form 10-Q for the quarter ending April 30, 2011. On March 31, 2008, S&E Quick Lube, a filter distributor, filed a lawsuit alleging that 12 filter manufacturers, including the Company, engaged in a conspiracy to fix prices, rig bids, and allocate U.S. Customers for aftermarket automotive filters. The U.S. cases have been consolidated into a single multi-district litigation in the Northern District of Illinois. The Company denies any liability and has vigorously defended the claims raised in these lawsuits. The settlement will fully resolve all claims brought against the Company in the lawsuits and the Company does not admit any liability or wrongdoing. The settlement is still subject to Court approval and will not have a material impact on the Company’s financial position, results of operations or liquidity.
The Company has reached a preliminary agreement with the Air Resources Board for the State of California (“ARB”) to settle regulatory claims brought by ARB in connection with the sales of our Diesel Multi-Stage Filter System (“DMF”) for an immaterial amount. On May 19, 2010, ARB revoked its verification of the Company’s DMF for use with on-road diesel engines, for which verification was originally issued on December 16, 2005. The Company denies that any sales were made in California without ARB verification. The Company is not currently selling any DMF product and is working with the Environmental Protection Agency to verify the product for any future sales.
Item 4. (Removed and Reserved)Mine Safety Disclosures
Not applicable.
Executive Officers of the Registrant
Current information regarding executive officers is presented below. All terms of office are for one year. There are no arrangements or understandings between individual officers and any other person pursuant to which the officer was selected as an executive officer.
| | | | | | | |
Name | | Age | | Positions and Offices Held | | First Fiscal Year
Appointed as an
Executive Officer | | Age | | Positions and Offices Held | | First Fiscal Year
Appointed as an
Executive Officer |
Tod E. Carpenter | Tod E. Carpenter | | 52 | | Vice President, Europe and Middle East | | 2008 | | 54 | | Senior Vice President, Engine Products | | 2008 |
| | | | | |
William M. Cook | William M. Cook | | 58 | | Chairman, President and Chief Executive Officer | | 1994 | | 60 | | Chairman, President and Chief Executive Officer | | 1994 |
| | | | | |
Sandra N. Joppa | Sandra N. Joppa | | 46 | | Vice President, Human Resources | | 2005 | | 48 | | Vice President, Human Resources | | 2006 |
| | | | | |
Norman C. Linnell | Norman C. Linnell | | 52 | | Vice President, General Counsel and Secretary | | 1996 | | 54 | | Vice President, General Counsel and Secretary | | 1996 |
| | | | | |
Charles J. McMurray | Charles J. McMurray | | 57 | | Senior Vice President, Industrial Products | | 2003 | | 59 | | Senior Vice President, Chief Administrative Officer | | 2003 |
| | | | | |
Mary Lynne Perushek | Mary Lynne Perushek | | 53 | | Vice President and Chief Information Officer | | 2006 | | 55 | | Vice President and Chief Information Officer | | 2007 |
| | | | | |
David W. Timm | | 58 | | Vice President, Asia-Pacific | | 2007 | |
| | | | | |
Thomas R. VerHage | | 58 | | Vice President and Chief Financial Officer | | 2004 | |
| | | | | |
| James F. Shaw | | | 44 | | Vice President and Chief Financial Officer | | 2012 |
| Wim Vermeersch | | | 47 | | Vice President, Europe and Middle East | | 2012 |
Jay L. Ward | Jay L. Ward | | 47 | | Senior Vice President, Engine Products | | 2006 | | 49 | | Senior Vice President, Industrial Products | | 2006 |
| | | | | |
Debra L. Wilfong | | 56 | | Vice President and Chief Technology Officer | | 2007 | |
| | | | | |
| Eugene X. Wu | | | 45 | | Vice President, Asia Pacific | | 2012 |
Mr. Carpenter joined the Company in 1996 and has held various positions, including Gas Turbine Systems General Manager from 2002 to 2004; General Manager, Industrial Filtration Systems (“IFS’)(IFS) Sales from 2004 to 2006; General Manager, IFS Americas in 2006; and Vice President, Global IFS from 2006 to 2008. Mr. Carpenter was appointed2008; and Vice President, Europe and Middle East in August 2008.from 2008 to 2011. In October 2011, Mr. Carpenter has beenwas appointed Senior Vice President, Engine Products, effective October 1, 2011.Products.
Mr. Cook joined the Company in 1980 and has held various positions, including CFO and Senior Vice President, International from 2001 to 2004 and President and CEO from 2004 to 2005. Mr. Cook was appointed Chairman, President and CEO in July 2005.
Table of Contents
Ms. Joppa was appointed Vice President, Human Resources and Communications in November 2005. Prior to that time, Ms. Joppa held various positions at General Mills, a consumer food products company, from 1989 to 2005, including service as Director of Human Resources for several different operating divisions from 1999 to 2005.
Mr. Linnell joined the Company in 1996 as General Counsel and Secretary and was appointed Vice President, General Counsel and Secretary in 2000.
Mr. McMurray joined the Company in 1980 and has held various positions, including Director, Global Information Technology from 2001 to 2003; Vice President, Human Resources from 2004 to 2005; and Vice President, Information Technology, Europe, South Africa, and Mexico from 2005 to 2006. Mr. McMurray became2006; and Senior Vice President Industrial Products in September 2006.from 2006 to 2011. In 2011, Mr. McMurray has beenwas appointed Senior Vice President and Chief Administrative Officer, effective October 1, 2011.Officer.
Ms. Perushek was appointed Vice President and Chief Information Officer in November 2006. Prior to that time, Ms. Perushek was Vice President of Global Information Technology at H.B. Fuller Company, a worldwide manufacturer of adhesive products, from 2005 to 2006 and Chief Information Officer for Young America Corporation, a marketing company, from 1999 to 2004.
Mr. TimmShaw joined the Company in 19832004 and has held various positions, including General Manager, Disk Drive from 1995 to 2005Director, Corporate Compliance/Internal Audit, and General Manager, Gas Turbine Systems Products from 2005 to 2006. Mr. Timm was appointed Vice President, Asia-Pacific in December 2006. The Company has announced that Mr. Timm will retire from the Company at the end of 2011, with his replacement to be announced at a later date.
Mr. VerHage was appointed Vice President and Chief Financial Officer in March 2004. Prior to that time, Mr. VerHage was a partner for Deloitte & Touche, LLP, an international accounting firm, from 2002 to 2004. The Company has announced that Mr. VerHage is leaving the Company on October 31, 2011 and that James F. Shaw, age 42, currentlyCorporate Controller and Principal Accounting Officer for the Company, has beenfrom 2004 to 2011. Mr. Shaw was appointed Vice President and Chief Financial Officer effective November 1, 2011. Prior to joining Donaldson, Mr. Shaw held various positions at Deloitte & Touche, LLP and Arthur Andersen, LLP.
Mr. Vermeersch joined the Company in 1992 and has held various positions, including Director, Gas Turbine Systems, Asia Pacific from 2000 to 2005; Manager, Aftermarket and Service IFS, Belgium from 2005 to 2006; Manager, IFS, Belgium from 2006 to 2007; Director, Gas Turbine Systems, Europe, Middle East and North Africa, from 2007 to 2010; and Director, Engine, Europe, Middle East and North Africa from 2010 to 2011. Mr. Vermeersch was appointed Vice President, Europe and Middle East in January 2012.
Mr. Ward joined the Company in 1998 and has held various positions, including Director, Operations from 2001 to 2003; Director, Product and Business Development, IFS Group from 2003 to 2004; Managing Director, Europe from 2004 to 2006; and Vice President, Europe and Middle East from 2006 to 2008. Mr. Ward was appointed Senior Vice President, Engine Products in August 2008. Mr. Ward has been2008 and was appointed Senior Vice President, Industrial Products, effectivein October 1, 2011.
Ms. WilfongMr. Wu was appointed Vice President, and Chief Technology OfficerAsia Pacific in May 2007.January 2012. Prior to that time, Ms. WilfongMr. Wu was Director, Researchthe Global Vice President and DevelopmentPresident of Asia Pacific at 3M Company, an international consumerGreif, Inc., a global leader in industrial packaging products company,and services, from 20002005 to 2007, most recently as Director, Research2010; and Development forChief Advisor to Chairman of the 3M Automotive DivisionBoard of Wanhua Industrial Group, a global chemical industry leader, from 20062010 to 2007.2011.
PART II
Item 5. Market for Registrant’s Common Equity, Related Stockholder Matters and Issuer Purchases of Equity Securities
The common shares of the Company are traded on the New York Stock Exchange under the symbol DCI. The amount and frequency of all cash dividends declared on the Company’s common stock for Fiscal 20112013 and 20102012 appear in Note PQ of the Notes to Consolidated Financial Statements on page 54.56. The Company’s dividend payout ratio target is 20approximately 30 percent to 40 percent of the average earnings per share of the last three years. This is a change from the previous target of 25 percent to 30 percent of the average earnings per share of the last three years. This guidance is expected to be used for future dividend payouts. As of September 22, 2011,25, 2013, there were 1,9501,862 shareholders of record of common stock.
The low and high sales prices for the Company’s common stock for each full quarterly period during Fiscal 20112013 and 20102012 were as follows:
| | | | | | | | |
| | First Quarter | | Second Quarter | | Third Quarter | | Fourth Quarter |
Fiscal 2011 2013 | $30.90 - 38.18 | | $40.8631.83 - 50.1938.30 | | $48.5134.26 - 60.28 38.08 | | $54.5934.35 - 62.90 | | $54.62 - 63.04
39.36 |
| Fiscal 2012 | $23.19 - 33.33 | | $30.48 - 36.52 | | $34.02 - 38.89 | | | |
Fiscal 2010
| | $32.6030.51 - 39.82 | | $35.24 - 45.19
| | $37.24 - 47.38
| | $40.51 - 48.21
36.82 |
Table of Contents
The following table sets forth information in connection with purchases made by, or on behalf of, the Company or any affiliated purchaser of the Company, of shares of the Company’s common stock during the quarterly period ended July 31, 2011.2013.
| | | | | | | | | | | | | |
Period | | Total Number of
Shares Purchased
(1) | | Average Price
Paid per Share | | Total Number of
Shares Purchased as
Part of Publicly
Announced Plans or
Programs | | Maximum Number
of Shares that May
Yet Be Purchased
Under the Plans or
Programs | |
May 1 - May 31, 2011 | | | — | | $ | — | | | — | | | 6,187,240 | |
June 1 - June 30, 2011 | | | 900,000 | | $ | 56.35 | | | 900,000 | | | 5,287,240 | |
July 1 - July 31, 2011 | | | 291,558 | | $ | 59.23 | | | 256,648 | | | 5,030,592 | |
Total | | | 1,191,558 | | $ | 57.06 | | | 1,156,648 | | | 5,030,592 | |
The Company initiated the purchase of an additional 162,900 shares for $9.2 million in July 2011 that are not included in Fiscal 2011 repurchases as the transactions did not settle until after fiscal year end. These repurchases will be included in Fiscal 2012 activity.
| Period | | | Total Number of
Shares Purchased
(1) | | | Average Price
Paid per Share | | | Total Number of
Shares Purchased as
Part of Publicly
Announced Plans or
Programs | | | Maximum Number
of Shares that May
Yet Be Purchased
Under the Plans or
Programs | |
| May 1 - May 31, 2013 | | | | — | | | $ | — | | | | — | | | | 3,737,155 | |
| June 1 - June 30, 2013 | | | | 1,037,194 | | | $ | 35.69 | | | | 1,031,318 | | | | 2,705,837 | |
| July 1 - July 31, 2013 | | | | 152,067 | | | $ | 35.53 | | | | 135,034 | | | | 2,570,803 | |
| | Total | | | | 1,189,261 | | | $ | 35.67 | | | | 1,166,352 | | | | 2,570,803 | |
_________________
| (1) | |
| (1)
| On March 26, 2010, the Company announced that the Board of Directors authorized the repurchase of up to 8.016.0 million shares of common stock. This repurchase authorization which is effective until terminated by the Board of Directors, replaced the existing authority that was authorized on March 31, 2006.Directors. There were no repurchases of common stock made outside of the Company’s current repurchase authorization during the quarter ended July 31, 2011.2013. However, the “Total Number of Shares Purchased” column of the table above includes 34,91022,909 previously owned shares tendered by option holders in payment of the exercise price of options during the quarter. While not considered repurchases of shares, the Company does at times withhold shares that would otherwise be issued under equity-based awards to cover the withholding taxes due as a result of exercising stock options or payment of equity-based awards. |
TableOn January 27, 2012, the Company announced that its Board of ContentsDirectors declared a two-for-one stock split effected in the form of a 100 percent stock dividend. The stock split was distributed March 23, 2012, to stockholders of record as of March 2, 2012. Earnings and dividends per share and weighted average shares outstanding are presented in this Form 10-K after the effect of the 100 percent stock dividend. The two-for-one stock split is reflected in the share amounts in all periods presented in the table above and elsewhere in this annual Form 10-K.
The graph below compares the cumulative total stockholder return on the Company’s common stock for the last five fiscal years with the cumulative total return of the Standard & Poor’s 500 Stock Index and the Standard & Poor’s Industrial Machinery Index. The graph and table assume the investment of $100 in each of the Company’s common stock and the specified indexes at the beginning of the applicable period, and assume the reinvestment of all dividends.
COMPARISON OF 5 YEAR CUMULATIVE TOTAL RETURN
Among Donaldson Company, Inc., the S&P 500 Index
and the S&P Industrial Machinery Index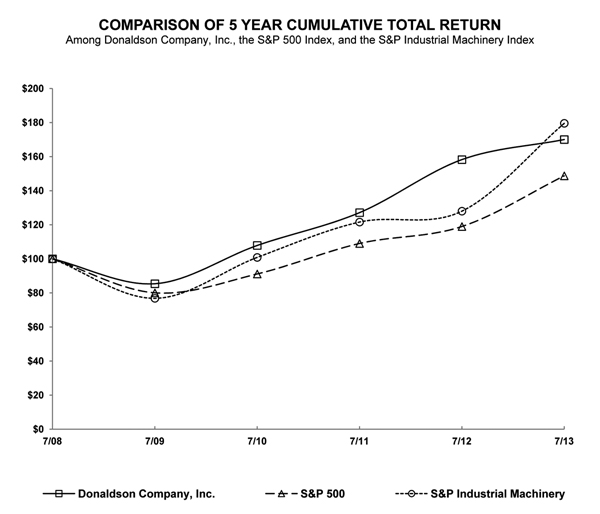
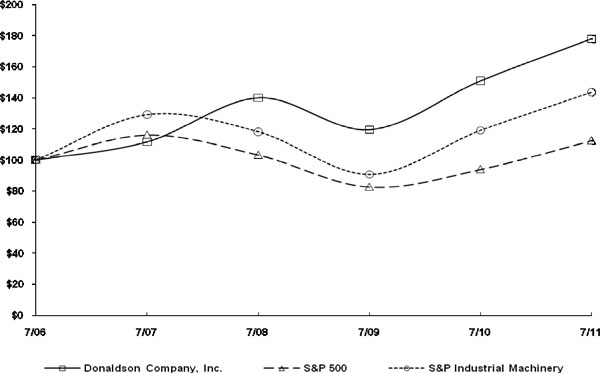
| | | | | | | | | | | | | | | | | | | |
| | Year Ended July 31, | |
| | 2011 | | 2010 | | 2009 | | 2008 | | 2007 | | 2006 | |
Donaldson Company, Inc. | | $ | 177.91 | | $ | 150.95 | | $ | 119.50 | | $ | 139.95 | | $ | 111.77 | | $ | 100.00 | |
S&P 500 | | | 112.56 | | | 94.07 | | | 82.64 | | | 103.25 | | | 116.13 | | | 100.00 | |
S&P Industrial Machinery | | | 143.55 | | | 119.05 | | | 90.70 | | | 118.06 | | | 129.23 | | | 100.00 | |
Table of Contents
| | | Year Ended July 31, | |
| | | 2013 | | | 2012 | | | 2011 | | | 2010 | | | 2009 | | | 2008 | |
| Donaldson Company, Inc. | | $ | 170.03 | | | $ | 158.25 | | | $ | 127.12 | | | $ | 107.86 | | | $ | 85.39 | | | $ | 100.00 | |
| S&P500 | | | 148.71 | | | | 118.97 | | | | 109.02 | | | | 91.11 | | | | 80.04 | | | | 100.00 | |
| S&P Industrial Machinery | | | 179.57 | | | | 127.98 | | | | 121.59 | | | | 100.84 | | | | 76.83 | | | | 100.00 | |
Item 6. Selected Financial Data
The following table sets forth selected financial data for each of the fiscal years in the five-year period ended July 31, 20112013 (in millions, except per share data):
| | | | | | | | | | | | | | | | | |
| | Year Ended July 31, | | | Year Ended July 31, | |
| | 2011 | | 2010 | | 2009 | | 2008 | | 2007 | | | 2013 | | | 2012 | | | 2011 | | | 2010 | | | 2009 | |
Net sales | | $ | 2,294.0 | | $ | 1,877.1 | | $ | 1,868.6 | | $ | 2,232.5 | | $ | 1,918.8 | | | $ | 2,436.9 | | | $ | 2,493.2 | | | $ | 2,294.0 | | | $ | 1,877.1 | | | $ | 1,868.6 | |
Income from continuing operations | | 225.3 | | 166.2 | | 131.9 | | 172.0 | | 150.7 | | |
| Net earnings | | | | 247.4 | | | | 264.3 | | | | 225.3 | | | | 166.2 | | | | 131.9 | |
Diluted earnings per share | | 2.87 | | 2.10 | | 1.67 | | 2.12 | | 1.83 | | | | 1.64 | | | | 1.73 | | | | 1.43 | | | | 1.05 | | | | 0.83 | |
Total assets | | 1,726.1 | | 1,499.5 | | 1,334.0 | | 1,548.6 | | 1,319.0 | | | | 1,743.6 | | | | 1,730.1 | | | | 1,726.1 | | | | 1,499.5 | | | | 1,334.0 | |
Long-term obligations | | 205.7 | | 256.2 | | 253.7 | | 176.5 | | 129.0 | | | | 102.8 | | | | 203.5 | | | | 205.7 | | | | 256.2 | | | | 253.7 | |
Cash dividends declared per share | | 0.560 | | 0.480 | | 0.460 | | 0.430 | | 0.370 | | | | 0.450 | | | | 0.335 | | | | 0.280 | | | | 0.240 | | | | 0.230 | |
Cash dividends paid per share | | 0.535 | | 0.470 | | 0.455 | | 0.420 | | 0.360 | | | | 0.410 | | | | 0.320 | | | | 0.268 | | | | 0.235 | | | | 0.228 | |
Item 7. Management’s Discussion and Analysis of Financial Condition and Results of OperationOperations
Results of OperationOperations
The following discussion of the Company’s financial condition and results of operations should be read in conjunction with the Consolidated Financial Statements and Notes thereto and other financial information included elsewhere in this report.
Overview
The Company is a worldwide manufacturer of filtration systems and replacement parts. The Company’s core strengths are leading filtration technology, strong Customer relationships, and its global presence. The Company operates through two reporting segments, Engine Products and Industrial Products, and has a product mix including air and liquid filtration systems and exhaust and emission control products. As a worldwide business, the Company’s results of operations are affected by conditions in the global economic environment. Under normalmost economic conditions, the Company’s market diversification between its OEM and replacement parts Customers, its diesel engine and industrial end markets, and its North American and international end markets has helped to limit the impact of weakness in any one product line, market, or geography on the consolidated results of the Company.
The Company reported record sales in Fiscal 20112013 of $2,294.0$2,436.9 million, up 22.2down 2.3 percent from $1,877.1$2,493.2 million in the prior year. The Company’s results were positivelynegatively impacted by foreign currency translation, which increaseddecreased sales by $49.8$32.2 million. Excluding the current year impact of foreign currency translation, worldwide sales increased 19.6decreased 1.0 percent.
Although net sales excluding foreign currency translation is not a measure of financial performance under GAAP,generally accepted accounting principles in the United States of America (U.S.) (U.S. GAAP), the Company believes it is useful in understanding its financial results and provides a comparable measure for understanding the operating results of the Company between different fiscal periods excluding the impact of foreign currency translation. The following is a reconciliation to the most comparable U.S. GAAP financial measure of this non-GAAP financial measure (in millions):
| | | | | | | |
| | Year Ended July 31, | |
| | 2011 | | 2010 | |
Net sales, excluding foreign currency translation | | $ | 2,244.2 | | $ | 1,833.9 | |
Foreign currency translation impact | | | 49.8 | | | 43.2 | |
Net sales | | $ | 2,294.0 | | $ | 1,877.1 | |
| | | Net Sales | | | Percent
Change in
Net Sales | |
| Year ended July 31, 2011 | | $ | 2,294.0 | | | | NA | |
| Net sales change, excluding foreign currency translation impact | | | 237.9 | | | | 10.4 | % |
| Foreign currency translation impact | | | (38.7 | ) | | | (1.7 | )% |
| Year ended July 31, 2012 | | $ | 2,493.2 | | | | 8.7 | % |
| Net sales change, excluding foreign currency translation impact | | | (24.1 | ) | | | (1.0 | )% |
| Foreign currency translation impact | | | (32.2 | ) | | | (1.3 | )% |
| Year ended July 31, 2013 | | $ | 2,436.9 | | | | (2.3 | )% |
The Company also reported record net earnings in Fiscal 20112013 of $225.3$247.4 million, an increasea decrease of 35.66.4 percent from $166.2$264.3 million in the prior year. The Company’s net earnings were also positivelynegatively impacted by foreign currency translation, which increaseddecreased net earnings by $6.1$2.1 million. Excluding the current year impact of foreign currency translation, net earnings increased 31.9decreased 5.6 percent.
Table of Contents
Although net earnings excluding foreign currency translation is not a measure of financial performance under U.S. GAAP, the Company believes it is useful in understanding its financial results and provides a comparable measure for understanding the operating results of the Company between different fiscal periods excluding the impact of foreign currency translation. The following is a reconciliation to the most comparable U.S. GAAP financial measure of this non-GAAPnon-U.S. GAAP financial measure (in millions):
| | | | | | | |
| | Year Ended July 31, | |
| | 2011 | | 2010 | |
Net earnings, excluding foreign currency translation | | $ | 219.2 | | $ | 162.6 | |
Foreign currency translation impact, net of tax | | | 6.1 | | | 3.6 | |
Net earnings | | $ | 225.3 | | $ | 166.2 | |
| | | Net Earnings | | | Percent
Change in
Net Earnings | |
| Year ended July 31, 2011 | | $ | 225.3 | | | | NA | |
| Net earnings change, excluding foreign currency translation impact | | | 43.0 | | | | 19.1 | % |
| Foreign currency translation impact | | | (4.0 | ) | | | (1.8 | )% |
| Year ended July 31, 2012 | | $ | 264.3 | | | | 17.3 | % |
| Net earnings change, excluding foreign currency translation impact | | | (14.8 | ) | | | (5.6 | )% |
| Foreign currency translation impact | | | (2.1 | ) | | | (0.8 | )% |
| Year ended July 31, 2013 | | $ | 247.4 | | | | (6.4 | )% |
The Company reported diluted earnings per share of $2.87,$1.64, a 36.75.2 percent increasedecrease from $2.10$1.73 in the prior year.
As discussed above, the Company recorded full year records forFollowing are net sales and net earnings. In addition, operating margin was a record of 13.7 percent for the year. The Company’s manufacturing plants and distribution centers executed very well and continued to make both capital and operating investments which, along with the Company’s Continuous Improvement initiatives, resulted in a record year and puts the Company in a position to profitably support its Customers’ global growth plans. These improvements were slightly offset by increases in purchased raw material and freight costs.
Following is financial information forproduct within the Company’s Engine and Industrial Products segments.segments and a comparison of earnings before income taxes. Corporate and Unallocated includes corporate expenses determined to be non-allocable to the segments and interest income and expense. See further discussion of segment information in Note KL of the Company’s Notes to Consolidated Financial Statements.
| | | | | | | | | | | | | |
| | Engine
Products | | Industrial
Products | | Corporate &
Unallocated | | Total
Company | |
| | (thousands of dollars) | |
2011 | | | | | | | | | | | | | |
Net sales | | $ | 1,440,495 | | $ | 853,534 | | $ | — | | $ | 2,294,029 | |
Earnings before income taxes | | | 211,255 | | | 123,871 | | | (22,863 | ) | | 312,263 | |
| | | | | | | | | | | | | |
2010 | | | | | | | | | | | | | |
Net sales | | $ | 1,126,007 | | $ | 751,057 | | $ | — | | $ | 1,877,064 | |
Earnings before income taxes | | | 155,833 | | | 91,084 | | | (16,741 | ) | | 230,176 | |
| | | | | | | | | | | | | |
2009 | | | | | | | | | | | | | |
Net sales | | $ | 1,027,685 | | $ | 840,944 | | $ | — | | $ | 1,868,629 | |
Earnings before income taxes | | | 85,896 | | | 87,427 | | | (11,898 | ) | | 161,425 | |
| | | 2013 | | | 2012 | | | 2011 | |
| | | (thousands of dollars) | |
| Engine Products segment: | | | | | | | | | | | | |
| Off-Road Products | | $ | 358,834 | | | $ | 376,870 | | | $ | 327,557 | |
| On-Road Products | | | 128,446 | | | | 163,934 | | | | 127,107 | |
| Aftermarket Products* | | | 900,419 | | | | 907,306 | | | | 861,393 | |
| Retrofit Emissions Products | | | 12,298 | | | | 15,354 | | | | 19,555 | |
| Aerospace and Defense Products | | | 104,191 | | | | 106,676 | | | | 104,883 | |
| Total Engine Products segment | | | 1,504,188 | | | | 1,570,140 | | | | 1,440,495 | |
| Industrial Products segment: | | | | | | | | | | | | |
| Industrial Filtration Solutions Products | | | 529,751 | | | | 553,453 | | | | 507,646 | |
| Gas Turbine Products | | | 232,922 | | | | 180,669 | | | | 154,726 | |
| Special Applications Products | | | 170,087 | | | | 188,986 | | | | 191,162 | |
| Total Industrial Products segment | | | 932,760 | | | | 923,108 | | | | 853,534 | |
| Total Company | | $ | 2,436,948 | | | $ | 2,493,248 | | | $ | 2,294,029 | |
For_________________
* Includes replacement part sales to the twelve months ended July 31, 2010 and 2009, net sales reflect the reclassification of $31,636 and $25,724, respectively, earnings before income taxes reflect a reclassification of $5,360 and $2,099, respectively, as a result of an internal reorganization of Industrial Hydraulics from Industrial Products to Engine Products, which became effective August 1, 2010.Company’s OEM Customers
| | | Engine | | | Industrial | | | Corporate & | | | Total | |
| | | Products | | | Products | | | Unallocated | | | Company | |
| | | (thousands of dollars) | |
| 2013 | | | | | | | | | | | | |
| Net sales | | $ | 1,504,188 | | | $ | 932,760 | | | $ | — | | | $ | 2,436,948 | |
| Earnings before income taxes | | | 220,892 | | | | 139,108 | | | | (11,819 | ) | | | 348,181 | |
| 2012 | | | | | | | | | | | | | | | | |
| Net sales | | $ | 1,570,140 | | | $ | 923,108 | | | $ | — | | | $ | 2,493,248 | |
| Earnings before income taxes | | | 227,941 | | | | 149,249 | | | | (6,410 | ) | | | 370,780 | |
| 2011 | | | | | | | | | | | | | | | | |
| Net sales | | $ | 1,440,495 | | | $ | 853,534 | | | $ | — | | | $ | 2,294,029 | |
| Earnings before income taxes | | | 211,255 | | | | 123,871 | | | | (22,863 | ) | | | 312,263 | |
Many factors contributed to the Company’s results for each of the Company’s reportingreportable segments for Fiscal 2011,2013, including an improvementa weakening in global economic conditions in many of the Company’s end markets, partially offset by the Company’s program of Continuous Improvement initiatives new product introductions,and emerging market growth, and the expansion of the Company’s distribution capabilities.growth.
In the Engine Products segment, the Company experienced increaseddecreased sales in all end-markets and regions withmost end-markets. Earnings before income taxes as a percentage of Engine Products segment sales of 14.7 percent increased slightly from 14.5 percent in the exception of Aerospace and Defense Products.prior year. The percentage earnings improvementincrease for the current fiscal yeartwelve months ended July 31, 2013, was primarily driven by better absorption of fixed costs due to improved volumes at our manufacturing plants, andbenefits from the Company’s ongoing Continuous Improvement initiatives. Theinitiatives and a higher percentage of sales coming from replacement filters, partially offset by increased incremental expenses related to the Company’s Strategic Business Systems project (which is the Company’smulti-year implementation of a global enterprise resource planning system), higher pension and insurance costs, and lower fixed cost absorption as a result of lower production volumes (primarily in the first half of the year). In addition, the Engine Products segment incurred $1.7 million in restructuring expenses compared to none in the prior year. These expenses related to employee severance costs associated with a reduction in workforce. Off-Road Product sales decreased by 4.8 percent driven by a decline in the mining equipment markets and weakness in the construction equipment markets, which were partially offset by strength in the agriculture equipment markets across the globe. On-Road Products sales decreased by 21.6 percent as a result of reduced truck builds by the Company’s OEM Customers in the U.S., Europe, and Japan. Aftermarket Products sales increasesdecreases were driven by continued improvement inlower equipment utilization rates in the mining, construction, and transportation industries globally. The Off-Road Product sales increase is driven by higher demand for agriculture and mining equipment, due to continued strong commodity prices and improved sales of heavy construction equipment, which was due to increased global infrastructure spending, especially in developing economies. On-Road Products sales improved as North America and Europe heavy truck build rates continued rebounding.
Table of Contentsindustries.
In the Industrial Products segment, where many product lines are later economic cycle businesses, sales increased primarily due to improvingstrong global economies leading to greater Customer demand. Indemand for Gas Turbine Systems products. Earnings before income taxes as a percentage of Industrial Filtration Solutions Products segment sales of new dust collection equipment14.9 percent decreased from 16.2 percent in the prior year. The decline in earnings as a percentage of sales over the prior year was driven by a shift in product mix to large first fit Gas Turbine projects which generally utilize outside subcontractors, less absorption of fixed manufacturing costs in businesses other than Gas Turbine Systems, increased incremental expenses related to the Company’s Strategic Business Systems project, and replacement filters continuedhigher pension and insurance costs, partially offset by benefits from the Company’s ongoing Continuous Improvement initiatives. In addition, the Industrial Products segment incurred $2.3 million in restructuring expenses compared to grow.none in the prior year. These expenses related to employee severance costs associated with a reduction in workforce. Gas Turbine Products sales remained slowincreased by 28.9 percent due to staticstrong Customer demand for large gas turbine power generation projects as a result of unchangedincreased global power generationelectricity requirements. The increase inIn Industrial Filtration Solutions Products, sales declined due to reduced capital investment by manufacturers. Sales in Special Applications Products isdecreased by 10.0 percent due to strong sales in certain product linesreduced demand for filtration products serving the electronics industries and weakness in industrial end markets resulting in lower sales of the Company’s membrane semiconductor, imaging, and venting end markets.products.
Following are net sales by product within both the Engine and Industrial Products segments:Outlook
| | | | | | | | | | |
| | 2011 | | 2010 | | 2009 | |
| | (thousands of dollars) | |
Engine Products segment: | | | | | | | | | | |
Off-Road Products | | $ | 327,557 | | $ | 222,329 | | $ | 243,691 | |
Aerospace and Defense Products | | | 104,883 | | | 111,977 | | | 119,094 | |
On-Road Products | | | 127,107 | | | 81,874 | | | 71,958 | |
Aftermarket Products* | | | 861,393 | | | 691,899 | | | 561,846 | |
Retrofit Emissions Products | | | 19,555 | | | 17,928 | | | 31,096 | |
Total Engine Products segment | | | 1,440,495 | | | 1,126,007 | | | 1,027,685 | |
Industrial Products segment: | | | | | | | | | | |
Industrial Filtration Solutions Products | | | 507,646 | | | 423,050 | | | 477,908 | |
Gas Turbine Products | | | 154,726 | | | 150,131 | | | 206,760 | |
Special Applications Products | | | 191,162 | | | 177,876 | | | 156,276 | |
Total Industrial Products segment | | | 853,534 | | | 751,057 | | | 840,944 | |
|
Total Company | | $ | 2,294,029 | | $ | 1,877,064 | | $ | 1,868,629 | |
| · | |
| *
| Includes replacement part sales to the Company’s OEM Customers.
|
Outlook
The Company forecasts continued expansion in many of its end markets, with higher growth in emerging economies. The Company forecasts its full year Fiscal 2012 EPS to be between $3.15 and $3.45.
| | |
| •
| The Company is planning its total Fiscal 20122014 sales to be between $2.45 and $2.60$2.55 billion, or up about 7an increase of 1 to 155 percent from Fiscal 2011.2013. Foreign currency translation is based on the Company’s plannedforecasted rates for the Euro at US$1.421.32 and 8197 Yen to the US$.
|
| · | |
| •
| The Company’s full year Fiscal 20122014 operating margin is forecasted to be 13.714.1 to 14.514.9 percent. Included in this forecast is approximately $30 million in expense increases for our Strategic Business Systems project and incentive compensation. |
| · | |
| •
| The Company’s full year Fiscal 20122014 tax rate is projected to be between 28 and 3031 percent. |
| · | The Company forecasts its full year Fiscal 2014 EPS to be between $1.65 and $1.85. |
| •
· | The Company projects that cash generated by operating activities will be between $275 and $305 million in Fiscal 2012.million. Capital spending in Fiscal 2012 is estimated to be approximately $100$90 million. |
Engine Products – The Company forecasts full year sales to increase 8 to 15 percent, including the impact of foreign currency translation.
| | |
| •
| The Company anticipates sales torepurchasing between 2 and 4 percent of its agricultural, mining, and construction equipment OEM Customers to grow at a more moderate pacediluted outstanding shares in Fiscal 2012 compared to Fiscal 2011’s growth rate. The Company also expects to continue to benefit from increased market share on their Customers’ new Tier IV equipment platforms. |
| | |
| •
| In the On-Road Products’ business, the Company believes build rates for heavy and medium duty trucks at their OEM Customers will be higher than Fiscal 2011, but are expected to grow at a more normal rate.
|
| | |
| •
| Sales of the Company’s Aftermarket Products are expected to remain strong based on current utilization rates for both off-road equipment and on-road heavy trucks. The Company should also benefit as its distribution
FY14. |
Table of Contents
| | |
| | networks continue to expand in the emerging economies and from the increasing number of systems installed in the field with their proprietary filtration systems.
|
| | |
| •
| The Company forecasts modest sales gains in Aerospace and Defense Products for Fiscal 2012 as the continued slowdown in military spending is anticipated to be offset by increased commercial aerospace sales.
13 |
Industrial Products - The Company forecasts full year FY12 sales to increase 7 to 15 percent, including the impact of foreign currency translation.
| | |
| •
| The Company’s Industrial Filtration Solutions Products’ sales are projected to increase 7 to 14 percent, assuming demand for new filtration equipment and replacement filters both continue to improve as general industrial capital activity and spending increase globally.
|
| | |
| •
| The Company anticipates its Gas Turbine Products’ sales to increase 14 to 22 percent due to improvement in the power generation market and ongoing strength in the oil and gas market segment.
|
| | |
| •
| Special Applications Products’ sales are projected to increase 2 to 9 percent primarily due to growing salesTable of their membranes products.
Contents |
Fiscal 20112013 Compared to Fiscal 20102012
Engine Products SegmentThe Engine Products segment sells to OEMs in the construction, mining, agriculture, aerospace, defense, and truck markets and to independent distributors, OEM dealer networks, private label accounts, and large equipment fleets. Products include air filtration systems, exhaust and emissions systems, liquid filtration systems including hydraulics, fuel, lube, and replacement filters.
Sales for the Engine Products segment were $1,440.5$1,504.2 million, an increasea decrease of 27.94.2 percent from $1,126.0$1,570.1 million in the prior year.year with decreases across all businesses. Fiscal 2013 Engine Products sales decreased by 11.3 percent in Asia, 3.6 percent in the United States increased by 25.9 percentAmericas, and were flat in Fiscal 2011Europe compared to Fiscal 2010. International Engine Products sales increased 29.8 percent from the prior year.2012. The impact of foreign currency increaseddecreased total sales by $31.5$23.8 million, or 2.81.6 percent. Earnings before income taxes as a percentage of Engine Products segment sales of 14.7 percent increased from 13.8 percent in the prior year. The earnings improvement for the current fiscal year was driven by better absorption of fixed costs due to improved volumes and the Company’s ongoing Continuous Improvement initiatives, partially offset by increased commodity costs compared to the prior year. There were $1.9 million in restructuring expenses for the Engine Products segment in the prior year.
Worldwide sales of Off-Road Products were $327.6$358.8 million, an increasea decrease of 47.34.8 percent from $222.3$376.9 million in the prior year. Sales declined 18.5 percent in Asia and 7.7 percent in the Americas, partially offset by growth of 3.0 percent in Europe. The sales decreases were driven by a decline in the mining equipment markets as commodity prices moderated and reductions in mining investments kept production of new mining equipment below prior year levels. Reductions in large non-residential construction and non-building infrastructure projects lead to lower demand for larger construction equipment. These decreases were partially offset by strength in the agriculture equipment market globally.
Worldwide sales of On-Road Products were $128.4 million, a decrease of 21.6 percent from $163.9 million in the prior year. Sales decreased 31.4 percent in the Americas, 19.7 percent in Asia, and 6.7 percent in Europe. Sales decreases were a result of a decrease in global truck builds, especially in the U.S, as well as OEM Customer initiatives to reduce inventory. According to published industry data, North American Class 8 truck build rates decreased 19.0 percent and medium-duty truck build rates increased 4.9 percent over the prior year.
Worldwide sales of Aftermarket Products were $900.4 million, a decrease of 0.8 percent from $907.3 million in the prior year. Sales in the United States increased 35.8 percent over the prior fiscal year. Internationally, sales of Off-Road Products were up 56.0 percent from the prior year, with sales increasing in Asia and Europe by 58.2decreased 4.4 percent and 55.61.8 percent, respectively. The Company’s overall increase was driven by higher demand for agriculture, construction, and mining equipment due to continued strong commodity prices and improved sales of heavy construction equipment, which was due to increased global infrastructure spending, especially in developing economies. Off-Road Productsrespectively, while sales in the U.S. also benefited from market share gains on new platforms that began production during calendar year 2011. These increases were slightly offset by U.S. residential and non-residential construction markets, which showed continued weakness, resulting in lower sales of the Company’s products into those markets.
Worldwide sales of Aerospace and Defense Products were $104.9 million, a 6.3 percent decrease from $112.0 million in the prior year. Sales in the United States decreased 8.7 percent over the prior year as a result of slowdowns in U.S. military activity, which is causing an associated slowdown in government procurement spending for major programs. Internationally, sales of Aerospace and Defense Products increased 3.0 percent over the prior year. The international sales increased primarily due to market share gains resulting from improving the Company’s Aerospace distribution capabilities in Europe.
Worldwide sales of On-Road Products were $127.1 million, an increase of 55.2 percent from $81.9 million in the prior year. On-Road Products sales in the United States increased 86.0 percent from the prior year. Class 8 build rates increased 47.8 percent and medium duty truck build rates increased 37.1 percent over the prior year. International On-Road Products sales increased 27.4 percent from the prior year, driven by increased sales in Europe of 45.6Americas grew 4.1 percent. This increase is consistent with the increase in European build rates. The overall sales increase was a result of an increase in Customer truck build rates, higher content per truck, and a slightly higher market share.
Worldwide Engine Aftermarket Products sales of $861.4 million increased 24.5 percent from $691.9 million in the prior year. Sales in the United States increased 26.3 percent over the prior year. International sales increased 23.1
Table of Contents
percent from the prior year,decreases were primarily driven by sales increases in Asia, Latin America and Europe of 37.8 percent, 25.7 percent, and 13.5 percent, respectively. The sales increases in the U.S. and internationally were attributable to improved On-Road and Off-Road equipmentlower utilization rates from a year ago, the Company’s increased distribution and market share growth, and the continued increase in the percentage of equipment inacross the field that useson-road and off-road equipment markets along with the Company’s proprietary filtration systems.negative impacts of foreign currency translation.
Worldwide sales of Retrofit Emissions Products were $19.6$12.3 million, an increasea decrease of 9.119.9 percent from $17.9$15.4 million in the prior year. The Company’s Retrofit Emissions Products sales are solely in the United States.U.S. The sales of these products are highly dependent on government regulations. Sales were impacted by a lack of government funding availability and delayed government verification of new products throughout Fiscal 2013.
Worldwide sales of Aerospace and Defense Products were $104.2 million, a decrease of 2.3 percent from $106.7 million in the prior year. Sales of Retrofit EmissionsAerospace and Defense Products increased overall, but challenges still remainwere relatively flat over the prior year in Europe, while sales decreased 2.2 percent in the supply chain for certain components and delaysAmericas. The sales decrease was due to a continued slowdown in regulatory approval for certain of the Company’s products have impacted the Company’s sales.U.S. military spending, which is forecasted to continue in Fiscal 2014.
Industrial Products SegmentThe Industrial Products segment sells to various industrial distributors, dealers, and end-users, OEMs of gas-fired turbines, and OEMs and end-users requiring clean air. Products include dust, fume, and mist collectors, compressed air purification systems, air filtration systems for gas turbines, PTFE membrane basedmembrane-based products, and specialized air and gas filtration systems for various applications including computer hard disk drives.drives and other electronic equipment.
Sales for the Industrial Products segment were $853.5$932.8 million, an increase of 13.61.0 percent from $751.1$923.1 million in the prior year. Internationalyear driven by 28.9 percent sales growth in Gas Turbine Products, partially offset by sales decreases in Special Applications Products and Industrial Filtration Solutions Products of 10.0 percent and 4.3 percent, respectively. Fiscal 2013 Industrial Products sales increased 8.5by 2.9 percent and salesin Asia, 0.9 percent in the United States increased 27.2 percent from the prior year.Americas, and were flat in Europe compared to Fiscal 2012. The impact of foreign currency increaseddecreased sales by $18.3$8.4 million, or 2.40.9 percent. Earnings before income taxes as a percentage of Industrial Products segment sales of 14.5 percent increased from 12.1 percent in the prior year. The improvement in earnings as a percent of sales over the prior year was driven by better leverage of fixed operating costs and better plant utilization. Restructuring expenses in Fiscal 2011 were $0.7 million, a decrease from $8.3 million in Fiscal 2010.
Worldwide sales of Industrial Filtration Solutions Products of $507.6were $529.8 million, increased 20.0a 4.3 percent decrease from $423.1$553.5 million in the prior year. Sales decreased 13.5 percent and 6.4 percent in Asia and Europe, respectively, partially offset by a sales increase in the United States, Europe and Asia increased 25.3Americas of 3.4 percent, 12.9 percent, and 26.2 percent, respectively. Thecompared to the prior year. Demand for new filtration equipment was weak due to lower capital investment by manufacturers in most of the Company’s major regions. This was partially offset by increased sales were due to increased manufacturing activity, higher investment in capital equipment by manufacturers, and the continued strengthening of replacement filter sales due to utilization of existing equipment. North American general industrial activity remained strong as evidencedfilters for equipment installed previously. Sales were also negatively impacted by a 110 percent increase in machine tool consumptionforeign currency translation. The externally published durable goods index in the United StatesU.S. increased 2.7 percent during Fiscal 20112013 as compared to Fiscal 2010.last year.
Worldwide sales of Gas Turbine Products were $154.7$232.9 million, an increase of 3.128.9 percent from $150.1$180.7 million in the prior year. Gas Turbine Products sales are typically large systems and, as a result, the Company’s shipments and revenues fluctuate from period to period. Sales slightly improvedof large Gas Turbine Products were strong due to additionalhigh demand for the large systems used in power generation primarily in the Middle East and Asia. The Company also experienced moderate demand for its smaller systems used in the oil and gas industry as a result of higher average oil pricesapplications and an increase in Aftermarket sales for replacement filters. These increases were slightly offset by a decline in theincreased sales of air filtrationreplacement filters for systems forpreviously installed. The Company anticipates its Gas Turbine Products’ sales will decrease 18 to 24 percent from record sales of in Fiscal 2013 due to the forecasted slowdown in large turbines used forturbine power generation.generation projects by its Customers in Fiscal 2014.
Worldwide sales of Special Applications Products were $191.2$170.1 million, a 7.510.0 percent increasedecrease from $177.9$189.0 million in the prior year. International sales of Special Application Products increased 6.1Sales decreased 13.0 percent overand 11.7 percent in Europe and Asia, respectively, from the prior year, primarily in Europe, which increased 47.0 percent. Domestic Special Application Products sales increased 17.1 percent. The global sales increases were driven by strong sales in some of the Company’s product lines serving the membrane, semiconductor, imaging, and venting end markets, partially offset by a slightsales increase in the Americas of 1.0 percent. The sales decline was primarily due to a global decline in computer sales which resulted in lower demand for the Company’s hard disk drive filter sales due to softfilters. This lower demand in the global end market for hard disk drives. Overall,drive filters is forecasted to continue in Fiscal 2014. According to the declineInternational Data Corporation, the number of disk drives produced in disk driveFiscal 2013 declined 9.2 percent from the prior year period. In addition, weakness in industrial end markets resulted in lower sales is comparable with published disk drive build rates.of the Company’s membrane products. Capital spending trends have been weak due to the recession in Europe, declines in Asia, and a slowdown in the U.S.
Consolidated ResultsThe Company reported net earnings for Fiscal 20112013 of $225.3$247.4 million compared to $166.2$264.3 million in Fiscal 2010, an increase2012, a decrease of 35.66.4 percent. Diluted net earnings per share were $2.87, up 36.7$1.64, down 5.2 percent from $2.10$1.73 in the prior year. The Company’s operating income of $315.3$343.3 million increaseddecreased from prior year operating income of $238.2$363.0 million by 32.35.4 percent.
The table below shows the percentage of total operating income contributed by each segment for each of the last three fiscal years. Corporate and Unallocated includes corporate expenses determined to be non-allocable to the segments, interest income, and interest expense:
| | | | | | | | | | | |
| | 2011 | | 2010 | | 2009 | | | 2013 | | | 2012 | | | 2011 | |
Engine Products | | 64.1 | % | | 63.1 | % | | 45.7 | % | | | 60.8 | % | | | 59.1 | % | | | 64.1 | % |
Industrial Products | | 38.7 | % | | 37.8 | % | | 50.6 | % | | | 39.7 | % | | | 40.3 | % | | | 38.7 | % |
Corporate and Unallocated | | | (2.8 | )% | | (0.9 | )% | | 3.7 | % | | | (0.5 | )% | | | 0.6 | % | | | (2.8) | % |
Total Company | | | 100.0 | % | | 100.0 | % | | 100.0 | % | | | 100.0 | % | | | 100.0 | % | | | 100.0 | % |
Table of Contents
International operating income, prior to corporate expense allocations, totaled 80.274.0 percent of consolidated operating income in Fiscal 20112013 as compared to 80.369.7 percent in Fiscal 2010.2012. Total international operating income increased 32.14.3 percent from the prior year. This increase is attributable to increased Customer sales and the leverage of fixed costs with the higher volume of sales. The table below shows the percentage of total operating income contributed by each major geographic region for each of the last three fiscal years:
| | | | | | | | | | | |
| | 2011 | | 2010 | | 2009 | | | 2013 | | | 2012 | | | 2011 | |
United States | | 19.8 | % | | 19.7 | % | | 22.1 | % | | | 26.0 | % | | | 30.3 | % | | | 19.8 | % |
Europe | | 31.0 | % | | 24.6 | % | | 23.3 | % | | | 31.6 | % | | | 29.9 | % | | | 31.0 | % |
Asia - Pacific | | 39.6 | % | | 45.3 | % | | 43.5 | % | | | 30.3 | % | | | 31.1 | % | | | 39.6 | % |
Other | | | 9.6 | % | | 10.4 | % | | 11.1 | % | | | 12.1 | % | | | 8.7 | % | | | 9.6 | % |
Total Company | | | 100.0 | % | | 100.0 | % | | 100.0 | % | | | 100.0 | % | | | 100.0 | % | | | 100.0 | % |
For more information regarding the Company’s net sales by geographic region, see Note L to the Consolidated Financial Statements.
Gross margin for Fiscal 20112013 was 35.534.8 percent, an increaseor a 0.2 percent decrease from 35.1 percent in the prior year. The improved gross margin was the result of better fixed cost absorption and the Company’s ongoing Continuous Improvement initiatives of approximately $27 million, which were partially offset by increases in purchased raw material (steel and petrochemical based raw materials) of approximately $19 million, net of selective price increases to Customers. Within gross margin, the Company incurred minimal restructuring and asset impairment charges during the fiscal year, compared to $7.5 million last year. The fiscal 2010 charges were primarily related to a downsizing at a plant in Germany and included severance and asset impairments for the building and inventory.
Operating expenses for Fiscal 2011 were $498.5 million or 21.7 percent of sales, as compared to $420.5 million or 22.435.0 percent in the prior year. The decrease in operating expenses as a percentagegross margin is primarily attributable to the mix impact of sales is drivenlarge Gas Turbine project shipments and the impact of lower absorption of fixed costs due to the lower production volumes in the Company’s plants. These decreases were partially offset by the higher volume of sales and benefits from the Company’s ongoing Continuous Improvement initiatives. In addition,initiatives, which include Lean, Kaizen, Six Sigma, and cost reduction efforts. Within gross profit, the current year includedCompany incurred $1.6 million in restructuring charges compared to minimal restructuring charges during Fiscal 2012. The Fiscal 2013 expenses were employee severance costs related to a $1.9 million reduction in restructuring expensesworkforce.
The principal raw materials that the Company uses are steel, filter media, and petroleum-based products. Purchased raw materials represents approximately 60 to 65 percent of the Company’s cost of goods sold. Of that amount, steel, including fabricated parts, represents approximately 25 percent. Filter media represents approximately 15 to 20 percent and the remainder is primarily made up of petroleum-based products and other components. The cost the Company paid for steel during Fiscal 2013, varied by grade, but in aggregate, it slightly decreased during the fiscal year. The Company’s cost of filter media also varies by type and slightly increased at the end of the fiscal year. The cost of petroleum-based products (plastics, rubber, and adhesives) was generally flat. Commodity prices in aggregate generally decreased throughout Fiscal 2013 as compared to Fiscal 2010. These benefits2012. The Company anticipates a moderately unfavorable impact from commodity prices in Fiscal 2014, as compared to Fiscal 2013, specifically for steel, petroleum-based products, and media based on recent market information for purchased commodities. The Company strives to recover or offset material cost through selective price increases to its Customers and through the Company’s Continuous Improvement initiatives, which include material substitutions, process improvements, and product redesigns.
Operating expenses for Fiscal 2013 were partially offset by costs for our strategic$503.8 million or 20.7 percent of sales, as compared to $510.7 million or 20.5 percent in the prior year. Restructuring expenses included in operating investments totaling $13.9expenses were $2.4 million for the fiscal year, which were employee severance costs related to a reduction in workforce. The Company’s ongoing cost containment actions and higher compensation related expenses such aslower incentive compensation of $9.2 millionhelped to offset the restructuring expenses, higher pension expenses, and pension expense of $5.1 million over the prior year.incremental expenses related to its Strategic Business Systems project.
Interest expense of $12.5$10.9 million increased $0.5decreased $0.6 million from $12.0$11.5 million in the prior year. Net otherOther income, net totaled $9.5$15.8 million in Fiscal 2011 up2013, down from $3.9$19.3 million in the prior year. The increasedecrease of $5.6$3.5 million over the prior year is primarily attributable to increasedin other income was driven by a $1.7 million decrease in interest income, of $2.0a $1.6 million increased earnings from non-consolidated joint ventures of $2.1 million, and increased royalty income of $1.4 million. Components of other income for Fiscal 2011 were as follows: interest income of $3.3 million, earnings from non-consolidated joint ventures of $4.1 million, royalty income of $8.7 million, partially offset by charitable donations of $1.1 million,decrease in foreign exchange losses of $4.5gains, and a $1.0 million and other miscellaneous income and expense items resultingdecrease in expenses of $1.0 million.royalty income.
The effective tax rate for Fiscal 20112013 was 27.929.0 percent compared to 27.828.7 percent in Fiscal 2010.2012. The average underlyingincrease in effective tax rate remained at 29.7 percent, while discrete items were also a consistent percentageis primarily due to the incremental benefits derived in Fiscal 2012 from the favorable settlement of pre-tax profits. Fiscal 2010 contained $4.3 million of discretetax audits. This was partially offset by an increase in tax benefits from international operations and the expirationretroactive reinstatement of the statute of limitations at foreign subsidiaries. Fiscal 2011 contained $5.8 million of discrete tax benefits primarily fromResearch and Experimentation Credit in the release of reserves afterU.S. in the favorable conclusions of foreign tax audits, the expiration of statutes in various jurisdictions, and the positive impact of dividends from some foreign subsidiaries.current year.
Total backlog at July 31, 2011,2013, was $816.4$715.8 million, up 29.9down 10.4 percent from the same period in the prior year. Backlog is one of many indicators of business conditions in the Company’s markets. However, it is not always indicative of future results for a number of reasons, including short lead times in the Company’s replacement parts businesses and the timing of the receipt of orders in many of the Company’s Engine OEM and Industrial markets. In the Engine Products segment, total open order backlog increased 36.6decreased 6.7 percent from the prior year. In the Industrial Products segment, total open order backlog increased 14.9decreased 18.4 percent from the prior year. Because some of the change in backlog can be attributed to a change in the ordering patterns of the Company’s Customers and/or the impact of foreign exchange translation rates, it may not necessarily correspond to future sales.
Fiscal 20102012 Compared to Fiscal 20092011
Engine Products SegmentThe Engine Products segment sells to OEMs in the construction, mining, agriculture, aerospace, defense, and truck markets and to independent distributors, OEM dealer networks, private label accounts, and large equipment fleets. Products include air filtration systems, exhaust and emissions systems, liquid filtration systems including hydraulics, fuel, lube, and replacement filters.
Table of Contents
Sales for the Engine Products segment were $1,126.0$1,570.1 million, an increase of 9.69.0 percent from $1,027.7$1,440.5 million in the prior year. Engine Products sales in the United States remained relatively flatU.S. increased by 11.3 percent in Fiscal 20102012 compared to Fiscal 2009, increasing only 0.5 percent in the current fiscal year.2011. International Engine Products sales increased 19.66.9 percent from the prior year. The impact of foreign currency increaseddecreased total sales by $24.9$24.3 million, or 2.41.7 percent. Earnings before income taxes as a percentage of Engine Products segment sales of 13.814.5 percent increaseddecreased from 8.414.7 percent in the prior year. The percentage earnings improvementdecrease for the current fiscal yeartwelve months ended July 31, 2012, was driven by a greatershift in product mix of higher-margin Aftermarket sales versus lower-margin first-fit product sales, better absorption of fixed manufacturing costs duefrom replacement parts to the increase in production volumes and benefits related to completed restructuring efforts and otherfirst fit products, which carry a lower margin, partially offset by ongoing Continuous Improvement initiatives. In addition, restructuring expenses for the Engine Products segment were down $5.3 million over the prior year, but this was more than offset by $6.2 million of increased warranty expenses related to Retrofit Emissions Products.
Worldwide sales of Off-Road Products were $222.3$376.9 million, a decreasean increase of 8.815.1 percent from $243.7$327.6 million in the prior year. Sales in the United States decreased 15.0U.S. increased 17.4 percent to $95.1 million forover the prior fiscal year. Internationally, sales of Off-Road Products were down 3.4up 13.5 percent from the prior year, with sales decreasingincreasing in Europe and Asia by 10.712.9 percent whichand 12.3 percent, respectively. The sales increases were slightly offset by an increase in Off-Road sales in Asia of 7.4 percent. The Company’s overall decrease was driven by a weakness in the early portionhigher demand for agriculture and mining equipment, and improved sales of the fiscal year with a gradual strengthening in end-markets in the last half of the fiscal year. This was evident in the gradual improvement of sales to OEMs during the last months of the fiscal year. The first half of the year was down primarily due to declines in spending in the residential and non-residentialheavy construction markets. The latter half of the year saw increases in the mining industry as a result of higher commodity prices and improvements in worldwide construction activity.equipment.
Worldwide sales of On-Road Products were $81.9$163.9 million, an increase of 13.829.0 percent from $72.0$127.1 million in the prior year. On-Road Products sales in the United StatesU.S. increased 3.439.3 percent from the prior year, primarily as a result of a slight market share improvement and higher content per truck. The Company performed better than the impact due to the change in truck build rates for the year in Class 8 truck builds, which decreased by 3.7 percent and medium duty truck build rates which increased 0.3 percent.year. International On-Road Products sales increased 25.215.3 percent from the prior year, driven by increased sales in Asia of 45.220.8 percent, as a result of the tsunami recovery in Japan. The sales increase in North America was the combined result of an increase in Customer truck build rates and higher filter content per truck. According to published industry data, North American Class 8 truck build rates increased 48.5 percent and medium-duty truck exports bybuild rates increased 24.0 percent over the Company’s Japanese OEM Customers to higher growth emerging markets, and rebounding sales in Europe during the second half of the fiscalprior year.
Worldwide Engine Aftermarket Products sales of $691.9$907.3 million increased 23.15.3 percent from $561.8$861.4 million in the prior year. Sales in the United StatesU.S increased 14.77.7 percent over the prior year. International sales increased 29.73.5 percent from the prior year, primarily driven by sales increases in Asia, Latin America, Europe, and EuropeAsia of 36.915.7 percent, 28.92.7 percent, and 24.71.2 percent, respectively. The sales increases in the United StatesU.S., Latin America, and internationallyEurope were driven by rebounds inattributable to improved On-Road and Off-Road equipment utilization rates, the Company’s increased distribution capabilities, dealer-distributor network growth, improved market position, and the continued increase in the mining, construction, and transportation industries.percentage of equipment in the field that uses the Company’s proprietary filtration systems. The Company also improved its distribution capabilitiesbegan to be closer to and better serve its Customers and increasedsee moderation beginning in the second quarter of Fiscal 2012 in the Chinese economy, which negatively impacted Aftermarket Products sales due to the Company’s recent market share “wins.”in China as well as other regions of Asia.
Worldwide sales of Retrofit Emissions Products were $17.9$15.4 million, a decrease of 42.321.5 percent from $31.1$19.6 million in the prior year. The Company’s Retrofit Emissions Products sales are solely in the United States. SalesU.S. The sales of Retrofit Emissions Products decreased asthese products are highly dependent on government regulations and a resultlack of continuing postponements in thefunding availability of government grant money and delays and losses of regulatory approval for certain of the Company’s products, including the DMF product.throughout Fiscal 2012.
Worldwide sales of Aerospace and Defense Products were $112.0$106.7 million, a 6.01.7 percent decreaseincrease from $119.1$104.9 million in the prior year. Sales in the United States decreased 9.0U.S. increased 1.4 percent over the prior year as a result of slowdowns in government procurement for major defense programs. Internationally,and international sales of Aerospace and Defense Products increased 8.02.7 percent over the prior year. The international sales increased primarily asincrease was due to improvements in Aerospace Products demand which was mostly offset by a result of the startup of recent defense program wins.continued slowdown in U.S. military activity.
Industrial Products SegmentThe Industrial Products segment sells to various industrial dealers, distributors, and end-users, OEMs of gas-fired turbines, and OEMs and end-users requiring clean air. Products include dust, fume, and mist collectors, compressed air purification systems, air filtration systems for gas turbines, PTFE membrane basedmembrane-based products, and specialized air and gas filtration systems for various applications including computer hard disk drives.drives and semi-conductor manufacturing.
Sales for the Industrial Products segment were $751.1$923.1 million, a decreasean increase of 10.78.2 percent from $840.9$853.5 million in the prior year. International Industrial Products sales decreased 9.0increased 3.9 percent and sales in the United States decreased 15.0U.S. increased 17.8 percent from the prior year. The impact of foreign currency increaseddecreased sales by $17.2$14.4 million, or 2.01.8 percent. Despite the 10.7 percent decrease in sales, earningsEarnings before income taxes as a percentage of Industrial Products segment sales were 12.1of 16.2 percent increasingincreased from 10.414.5 percent in the prior year. The improvement in earnings as a percentpercentage of
Table of Contents
sales over the prior year was driven by better leverage of fixed operating costs and the continued successful execution on large project shipments, increased plant utilization, improved product mix, and Continuous Improvement initiatives. Restructuringlarger projects, both of which were partially offset by the impact of the flood in Thailand. In addition, the Industrial Products segment did not incur any restructuring expenses in Fiscal 2010 were $8.3 million, a decrease from $10.1as compared to $0.7 million in Fiscal 2009.the prior year.
Worldwide sales of Industrial Filtration Solutions Products of $423.1$553.5 million decreased 11.5increased 9.0 percent from $478.0$507.6 million in the prior year. Sales in the United States,U.S., Asia and Europe and Asia decreased 11.9increased 16.8 percent, 12.07.8 percent, and 8.02.4 percent, respectively. SalesThe Company continued to experience strong market conditions, especially in Mexico decreased 20.9 percent in Fiscal 2010 as compared to Fiscal 2009. Overall, the Company experienced weak sales conditionsU.S., for its Industrial Filtration Solutions Products duringresulting in continued strong demand for the beginning of the fiscal year, with conditions improving towards the end of the fiscal year. The decreased sales in Europe and Asia were due to reduced demand forCompany’s industrial dust collectors and compressed air purification systems due to the downturn in general manufacturing activity. Domestic sales decreased due to a decline in general industrial activity that did not stabilize until latereplacement parts. The externally published durable goods index in the fiscal year, as evidenced by a 19U.S. increased 8.4 percent drop in machine tool consumption in the United States during fiscal year 2010Fiscal 2012 as compared to fiscal year 2009.last year.
Worldwide sales of Gas Turbine Products were $150.1$180.7 million, a decreasean increase of 27.416.8 percent from $206.8$154.7 million in the prior year. Gas Turbine Products sales are typically large systems and, as a result, the Company’s shipments and revenues fluctuate from period to period. Incoming orders declined 9 percent in Fiscal 2010 versus Fiscal 2009, a reflectionSales of the reduced demandlarge Gas Turbine Products for power generation projects globally. Sales remained slow due to a decelerationwere stable for the first six months of Fiscal 2012 before increasing in Customerthe second half of the fiscal year. The Company also experienced additional demand for largeits smaller systems used in oil and gas turbine power generation projects as a result of the decrease in global electrical power requirementsapplications and also as a result of one Customer’s increased utilization of its own internal filtration businesses.for replacement filters.
Worldwide sales of Special Applications Products were $177.9$189.0 million, a 13.81.1 percent increasedecrease from $156.3$191.2 million in the prior year. Domestic Special Application Products sales increased 5.8 percent, driven by an increase in sales to industrial Customers of PTFE membranes.9.6 percent. International sales of Special Application Products increased 15.1decreased 2.8 percent over the prior year, primarily in Asia which increased 18.6decreased 3.6 percent. These internationalThe sales increases were driven by improveddecline was due to a decrease in demand for the Company’s Customers’ hard disk drives asproducts serving the end-markets for computers, data storage devices, and other electronic products rebounded. Overall,electronics industry which was affected by the Company’s market growth is comparable with published disk drive build rates.flooding in Thailand in the second half of calendar 2011.
Consolidated ResultsThe Company reported net earnings for Fiscal 20102012 of $166.2$264.3 million compared to $131.9$225.3 million in Fiscal 2009,2011, an increase of 26.017.3 percent. Diluted net earnings per share were $2.10,$1.73, up 25.721.0 percent from $1.67$1.43 in the prior year. The Company’s operating income of $238.2$363.0 million increased from prior year operating income of $170.0$315.3 million by 40.215.1 percent.
The table below shows the percentage of total operating income contributed by each segment for each of the last three fiscal years. Corporate and Unallocated includes corporate expenses determined to be non-allocable to the segments, interest income, and interest expense:
| | | | | | | | | | | |
| | 2010 | | 2009 | | 2008 | | | 2012 | | | 2011 | | | 2010 | |
Engine Products | | 63.1 | % | | 45.7 | % | | 61.1 | % | | | 59.1 | % | | | 64.1 | % | | | 63.1 | % |
Industrial Products | | 37.8 | % | | 50.6 | % | | 42.1 | % | | | 40.3 | % | | | 38.7 | % | | | 37.8 | % |
Corporate and Unallocated | | | (0.9 | )% | | 3.7 | % | | (3.2 | )% | | | 0.6 | % | | | (2.8 | )% | | | (0.9 | )% |
Total Company | | | 100.0 | % | | 100.0 | % | | 100.0 | % | | | 100.0 | % | | | 100.0 | % | | | 100.0 | % |
International operating income, prior to corporate expense allocations, totaled 80.369.7 percent of consolidated operating income in Fiscal 20102012 as compared to 77.980.2 percent in Fiscal 2009.2011. Total international operating income increased 44.60.1 percent from the prior year. This increase is attributable to increased Customer sales and stronger foreign currencies. The table below shows the percentage of total operating income contributed by each major geographic region for each of the last three fiscal years:
| | | | | | | | | | | |
| | 2010 | | 2009 | | 2008 | | | 2012 | | | 2011 | | | 2010 | |
United States | | 19.7 | % | | 22.1 | % | | 10.6 | % | | | 30.3 | % | | | 19.8 | % | | | 19.7 | % |
Europe | | 24.6 | % | | 23.3 | % | | 43.3 | % | | | 29.9 | % | | | 31.0 | % | | | 24.6 | % |
Asia - Pacific | | 45.3 | % | | 43.5 | % | | 37.9 | % | | | 31.1 | % | | | 39.6 | % | | | 45.3 | % |
Other | | | 10.4 | % | | 11.1 | % | | 8.2 | % | | | 8.7 | % | | | 9.6 | % | | | 10.4 | % |
Total Company | | | 100.0 | % | | 100.0 | % | | 100.0 | % | | | 100.0 | % | | | 100.0 | % | | | 100.0 | % |
Gross margin for Fiscal 20102012 was 35.135.0 percent, an increasea decrease from 31.635.5 percent in the prior year. The improveddecrease in gross margin wasis attributable to the resultcombination of improvedthe higher level of first fit and project sales which generally carry a lower margin, the Company’s planned ramp-up for its newest plant in Mexico, lower fixed cost absorption ain Asia, and increased purchased commodity costs from higher mixprices during the first half of replacement filter sales, savingsthe year and unfavorable foreign exchange rates in the second half of the year. These decreases were partially offset by the benefits from restructuring actions andthe Company’s ongoing Continuous Improvement initiatives. Within gross margin,profit, the Company incurred minimal restructuring and asset impairment charges during Fiscal 2011.
The principal raw materials that the Company uses are steel, filter media, and petroleum-based products. Purchased raw materials represents approximately 60 to 65 percent of Contents
the Company’s cost of goods sold. Of that amount, steel, including fabricated parts, represents approximately 25 percent. Filter media represents approximately 15 to 20 percent and the remainder is primarily made up of petroleum-based products and other components. The cost the Company paid for steel during Fiscal 2012, varied by grade, but in aggregate, it slightly decreased in the second half of Fiscal 2012. The Company’s cost of filter media also varies by type but it moderated slightly during the fiscal year since reaching a historical high at the end of Fiscal 2011. Petroleum-based products were generally flat. Commodity prices in aggregate generally decreased throughout Fiscal 2012 after strong increases in the last half of Fiscal 2011. The impact was moderated by certain long term supply arrangements. However, the full year impact of commodity prices was still unfavorable to Fiscal 2011. The Company strives to recover or offset material cost through selective price increases to its Customers and through the Company’s Continuous Improvement initiatives, which include material substitution, process improvement, and product redesigns.
$7.5Operating expenses for Fiscal 2012 were $510.7 million or 20.5 percent of sales, as compared to $498.5 million or 21.7 percent in the prior year. The decrease in operating expenses as a percentage of sales is driven by the higher volume of sales. In addition, the current year had reduced distribution and warranty costs as a percent of sales. The prior year included $0.7 million in restructuring and asset impairment charges during the fiscal year, compared to $10.1 million last year. This year’s charges were primarily related to a downsizing at a plant in Germany and included severance and asset impairments for the building and inventory.charges.
Operating expenses for Fiscal 2010 were $420.5 million or 22.4 percent of sales, as compared to $419.8 million or 22.5 percent in the prior year. Operating expenses as a percent of sales was relatively flat and included $15.1 million of higher incentive compensation expense partially offset by a $5.0 million decrease in restructuring costs as compared to the prior year. During the fiscal year the Company increased warranty accruals due to specific warranty matters in our Retrofit Emissions Products group, recording an expense of $6.2 million for this matter during the year.
Interest expense of $12.0$11.5 million decreased $5.0$1.0 million from $17.0$12.5 million in the prior year as a result of reduced debt levels and lower interest rates throughout the year. Net other income totaled $3.9$19.3 million in Fiscal 2010 down2012, up from $8.5$9.5 million in the prior year. ComponentsThe increase of $9.8 million in other income for Fiscal 2010 were as follows:was driven by an increase in foreign exchange gains of $6.3 million, an increase of $1.2 million in interest income, an increase of $0.6 million in income from unconsolidated affiliates, an increase of $0.4 million in royalty income, and an insurance recovery of $1.3 million, earnings from non-consolidated joint ventures of $2.0 million, royalty income of $7.2 million, charitable donations of $1.6 million, foreign exchange losses of $4.6 million, and other miscellaneous income and expense items resulting in expenses of $0.4 million.
The effective tax rate for Fiscal 20102012 was 27.828.7 percent compared to 18.327.9 percent in Fiscal 2009.2011. The increase in effective tax rate is primarily due to a decreasean unfavorable shift in the mix of earnings between tax jurisdictions, which increased the underlying average tax rate over the prior year to 30.8 percent from 29.7 percent. The increase in the underlying average tax rate was partially offset by incremental discrete tax benefits. Fiscal 20092012 contained $19.6$7.7 million of discrete tax benefits which predominantly occurred infrom the second quarter, and primarily related to changes to uncertain tax position reserves in connection with the effectivefavorable settlements of court cases and examinationstax audits, the expiration of statutes in various jurisdictions, covering various years.and other discrete items. Fiscal 20102011 contained $4.3$5.8 million of discrete tax benefits, primarily recorded infrom the second quarter, fromrelease of reserves after the favorable conclusions of foreign tax audits, the expiration of statutes in various jurisdictions, and the statutepositive impact of limitations atdividends from some foreign subsidiaries and other discrete items. Without consideration of discrete items, the average underlying tax rate improved over the prior year to 29.7 percent from 30.4 percent mainly due to the mix of earnings between tax jurisdictions.subsidiaries.
Total backlog at July 31, 2010,2012, was $628.3$798.6 million, up 19.0down 0.5 percent from the same period in the prior year. Backlog is one of many indicators of business conditions in the Company’s markets. However, it is not always indicative of future results for a number of reasons, including short lead times in the Company’s replacement parts businesses and the timing of the receipt of orders in many of the Company’s Engine OEM and Industrial markets. In the Engine Products segment, total open order backlog increased 31.5decreased 5.9 percent from the prior year. In the Industrial Products segment, total open order backlog decreased 1.8increased 13.9 percent from the prior year. Because some of the change in backlog can be attributed to a change in the ordering patterns of the Company’s Customers and/or the impact of foreign exchange translation rates, it may not necessarily correspond to future sales.
Liquidity and Capital Resources
Financial ConditionAt July 31, 2011,2013, the Company’s capital structure was comprised of $61.0$107.9 million of current debt, $205.7$102.8 million of long-term debt, and $934.7$1,085.2 million of shareholders’ equity. The Company had cash and cash equivalents of $273.5$224.1 million and short-term investments of $99.8 million at July 31, 2011.2013. The ratio of long-term debt to total capital was 18.08.7 percent and 25.518.3 percent at July 31, 20112013 and 2010,2012, respectively.
Total debt outstanding decreased $45.0$90.4 million during the year to $266.7$210.6 million outstanding at July 31, 2011.2013 as a result of reductions in short-term borrowings. Short-term borrowings outstanding at the end of the year were $36.9decreased $86.0 million less thanas the prior year, and long-term debt decreased $8.1 million (including current maturities) from the prior year.Company used cash on hand to pay off its short-term borrowings.
The following table summarizes the Company’s cash obligations as of July 31, 2011,2013, for the years indicated (thousands of dollars):
| | | | | | | | | | | | | | | | | |
| | Payments Due by Period | | | | | | Payments Due by Period | |
Contractual Obligations | | Total | | Less than 1
year | | 1 - 3 years | | 3 - 5 years | | More than 5
years | | | Total | | | Less than
1 year | | | 1 - 3
years | | 3 - 5
years | | | More than
5 years | |
Long-term debt obligations | | $ | 247,037 | | $ | 45,595 | | $ | 101,442 | | $ | — | | $ | 100,000 | | | $ | 196,848 | | | $ | 96,848 | | | $ | — | | $ | 100,000 | | | $ | — | |
Capital lease obligations | | 796 | | 428 | | 360 | | 8 | | — | | | | 2,520 | | | | 981 | | | | 1,393 | | | 146 | | | | — | |
Interest on long-term debt obligations | | 49,508 | | 11,946 | | 19,752 | | 10,960 | | 6,850 | | | | 26,309 | | | | 8,449 | | | | 11,009 | | | 6,851 | | | | — | |
Operating lease obligations | | 26,579 | | 10,546 | | 12,196 | | 3,006 | | 831 | | | | 26,698 | | | | 11,431 | | | | 12,270 | | | 2,872 | | | | 125 | |
Purchase obligations(1) | | 246,872 | | 236,709 | | 9,339 | | 824 | | — | | | | 195,976 | | | | 178,649 | | | | 16,189 | | | 1,138 | | | | — | |
Pension and deferred compensation(2) | | | 78,324 | | | 5,070 | | | 10,533 | | | 10,372 | | | 52,349 | | | | 115,517 | | | | 15,415 | | | | 14,418 | | | 14,239 | | | | 71,445 | |
Total(3) | | $ | 649,116 | | $ | 310,294 | | $ | 153,622 | | $ | 25,170 | | $ | 160,030 | | | $ | 563,868 | | | $ | 311,773 | | | $ | 55,279 | | $ | 125,246 | | | $ | 71,570 | |
Table of Contents_________________
| (1) | |
| (1)
| Purchase obligations consist primarily of inventory, tooling, contract employment services and capital expenditures. The Company’s purchase orders for inventory are based on expected Customer demand, and quantities and dollar volumes are subject to change. |
| (2) | |
| (2)
| Pension and deferred compensation consists of long-term pension liabilities and salary and bonus deferrals elected by certain executives under the Company’s deferred compensation plan. Deferred compensation balances earn interest based on a Treasurytreasury bond rate as defined by the plan (10-year treasury bond STRIP rate plus two percent for deferrals prior to January 1, 2011 and 10-year treasury bond rates for deferrals after December 31, 2010) and approved by the Human Resources Committee of the Board of Directors, and are payable at the election of the participants. |
| (3) | |
| (3)
| In addition to the above contractual obligations, the Company may be obligated for additional cash outflows of $21.5$19.5 million offor potential tax obligations, including accrued interest and penalties. The payment and timing of any such payments isare affected by the ultimate resolution of the tax years that are under audit or remain subject to examination by the relevant taxing authorities,authorities. Therefore, quantification of an estimated range and are therefore not currently capabletiming of estimation by period. future payments cannot be made at this time. |
The Company’s general funding policy for its pension plans is to make at least the minimum contributions as required by applicable regulations. Additionally,On December 7, 2012, the Company may elect to make additional contributions up to the maximum tax deductible contribution. As such, the Company made contributions of $20.6 million to its U.S. pension plans in Fiscal 2011. There is no minimum funding requirement for the Company’s U.S. pension plans for Fiscal 2012. The Company is currently evaluating whether or notentered into a U.S. pension contribution will be made in Fiscal 2012. The Company made contributions of $7.1 million to its non-U.S. pension plans in Fiscal 2011 and estimates that it will contribute approximately $4.7 million in Fiscal 2012 based upon the local government prescribed funding requirements. Future estimates of the Company’s pension plan contributions may change significantly depending on the actual rate of return on plan assets, discount rates, and regulatory requirements.
The Company has anew five-year, multi-currency revolving credit facility with a group of banks under which the Company may borrow up to $250$250.0 million. This facility matures on April 2, 2013. The agreement provides that loans may be made under a selection of currencies and rate formulas including Base Rate AdvancesLoans or Off ShoreLIBOR Rate Advances.Loans. The interest rate on each advance is based on certain market interest rates and leverage ratios. Facility fees and other fees on the entire loan commitment are payable over the duration of this facility. This new facility replaced the previous five-year, $250.0 million multicurrency revolving credit facility that was terminated upon entering the new facility. There were no outstanding amounts at July 31, 2013 and $80.0 million was nothing outstanding at July 31, 2011 and $50.0 million outstanding at July 31, 2010.2012 under these facilities. At July 31, 20112013 and 2010, $238.62012, $237.8 million and $180.0$159.1 million, respectively, waswere available for further borrowing under such facilities. The amount available for further borrowing reflects a reduction for issued standby letters of credit, as discussed below. The weighted average interest rate on short-term borrowings outstanding at July 31, 2010 was 0.6 percent. OurCompany’s multi-currency revolving facility contains debt covenants specifically related to maintaining a certain interest coverage ratio and a certain leverage ratio as well as other covenants that, under certain circumstances, can restrict ourthe Company’s ability to incur additional indebtedness, make investments and other restricted payments, create liens, and sell assets. As of July 31, 2011,2013, the Company was in compliance with all such covenants.
The Company has threetwo uncommitted credit facilities in the United States,U.S., which provide unsecured borrowings for general corporate purposes. At July 31, 20112013 and 2010,2012, there was $56.9$50.0 million and $70.0$41.3 million available for use, respectively.respectively, under these two facilities. There was $13.1 millionwere no amounts outstanding at July 31, 20112013 and nothing$8.7 million was outstanding at July 31, 2010.2012.
The Company has a €100 million program for issuing treasury notes for raising short, medium, and long-term financing for its European operations. There was nothingwere no outstanding amounts on this program at July 31, 20112013 or 2010.2012. Additionally, the Company’s European operations have lines of credit with an available limit of €45.6€44.9 million or $59.8 million. There was nothingwere no amounts outstanding on these lines of credit as of July 31, 20112013 or 2010.2012.
Other international subsidiaries may borrow under various credit facilities. There was nothing$9.2 million outstanding under these credit facilities as of July 31, 2011 or 2010.2013 and $6.4 million outstanding as of July 31, 2012.
Also, at July 31, 20112013 and 2010,2012, the Company had outstanding standby letters of credit totaling $11.4$12.2 million and $10.9 million, respectively, upon which no amounts had been drawn. The letters of credit guarantee payment to third parties in the event the Company is in breach of a specified bond financing agreement and insurance contract terms as detailed in each letter of credit.
During Fiscal 2011,2013, credit in the global credit markets became morewas accessible than in recent years and market interest rates remained low. The Company believes that its current financial resources, together with cash generated by operations, are sufficient to continue financing its operations for the next twelve months. There can be no assurance, however, that the cost or availability of future borrowings will not be impacted by future capital market disruptions.
Certain note agreements contain debt covenants related to working capital levels and limitations on indebtedness. As of July 31, 2011,2013, the Company was in compliance with all such covenants. The Company currently expects to remain in compliance with these covenants.
Table of Contents
Shareholders’ equity increased $188.1by $175.2 million in Fiscal 2011 to $934.7from $910.0 million at July 31, 2011.2012 to $1,085.2 million at July 31, 2013. The increase was primarily due to the current year earnings of $225.3$247.4 million, changes$46.9 million (net of tax) of favorable adjustments related to the pension liability, favorable foreign currency translation of $72.5$17.4 million, $13.8 million of stock options exercised, $12.2$13.5 million in tax reductions related to employee plans, $7.2$12.4 million (net of tax)stock options exercised, and $8.3 million of adjustments related to the pension liability, and $6.5 millionequity impact of stock option expense. These increases were partially offset by $108.9 millionthe repurchase of treasury stock repurchasesfor $102.6 million and $42.8$66.0 million of dividend declarations.dividends declared.
The Company’s inventory balance was $234.8 million as of July 31, 2013, compared to $256.1 million as of July 31, 2012. Excluding the impact of foreign exchange fluctuations, inventories decreased $20.2 million. The Company decreased inventory levels to match the decrease in Customer demand experienced during the year. Additionally, as of July 31, 2012 several large gas turbine projects were being constructed that were not ready for shipment. Those units have since shipped resulting in decreases in our inventory balances. The Company’s accounts receivable balance was $430.8 million as of July 31, 2013, compared to $438.8 million as of July 31, 2012. Excluding the impact of foreign exchange fluctuations, accounts receivable decreased $3.4 million.
Cash FlowsDuring Fiscal 2011, $246.12013, $315.9 million of cash was generated from operating activities, compared with $203.0$259.7 million in Fiscal 2010.2012. The increase in cash generated from operating activities of $43.1$56.2 million was primarily attributable to the Company’s net earnings increase of $59.1 million overchanges in working capital needs resulting in lower accounts receivable and inventory levels versus the prior year, partially offset by changesa decrease in working capital needs resulting from increased inventoryaccounts payable due to support increased demand and a larger discretionary pension contribution than the prior year. Cash flow generated by operationsreduction in purchasing activity. Operating cash flows and cash on hand waswere used primarily to support $59.9$94.3 million of net capital expenditures, $108.9$102.6 million forof stock repurchases, $41.0$60.3 million forof dividend payments, and to reduce total$87.0 million of short-term debt by $50.0 million.repayments. Cash and cash equivalents increased $41.5decreased $1.7 million during Fiscal 2011.2013.
The majority of the Company’s cash and cash equivalents are held by its foreign subsidiaries as over half of the Company’s earnings occur outside the U.S. Most of these funds are considered permanently reinvested outside the U.S., and will only be repatriated when it is tax effective to do so, as the cash generated from U.S. operations is anticipated to be sufficient for the U.S cash needs. If additional cash were required for the Company’s operations in the U.S., it may be subject to additional U.S. taxes if funds were repatriated from certain foreign subsidiaries.
Net capital expenditures for property, plant, and equipment totaled $59.9$94.3 million in Fiscal 20112013 and $42.7$77.2 million in Fiscal 2010.2012. Net capital expenditures is comprised of purchases of property, plant, and equipment of $60.6$94.9 million and $43.1$78.1 million in Fiscal 20112013 and 2010,2012, respectively, partially offset by proceeds from the sale of property, plant, and equipment of $0.8$0.6 million in Fiscal 20112013 and $0.5$1.0 million in Fiscal 2010.2012. Fiscal 20112013 capital expenditures primarily related to new plant capacity additions, productivity enhancinginformation and lab technology, productivity-enhancing investments at various plants worldwide,manufacturing sites, and tooling to manufacture new products.
Capital spending in Fiscal 20122014 is plannedestimated to be approximately $100.0 million.$90.0 million.The Company’s capital spending in Fiscal 2014 will be approximately 20 percent related to capacity expansion, 30 percent for technology initiatives, including the Strategic Business Systems project, 30 percent for tooling for new products, and 20 percent will be in the form of automation or cost reduction projects related to the Company’s ongoing Continuous Improvement initiatives. It is anticipated that Fiscal 20122014 capital expenditures will be financed primarily by cash on hand, cash generated from operations, and existing lines of credit as needed.credit.
The Company expects that cash generated by operating activities will be between $275 and $305 million in Fiscal 2012.2014. At July 31, 2011,2013, the Company had cash and cash equivalents of $273.5$224.1 million which exists at subsidiaries outsideand short-term investments of the United States.$99.8 million. The Company also had $295.5$287.8 million available under existing credit facilities in the United States, €145.6U.S., €144.9 million or $209.7$192.8 million, available under existing credit facilities in Europe, and $67.5$50.4 million available under various credit facilities and currencies in Asia and the rest of the world. The Company believes that the combination of existing cash, available credit under existing credit facilities, and the expected cash generated by operating activities will be adequate to meet cash requirements for Fiscal 2012,2014, including debt repayment, issuance of anticipated dividends, possible share repurchase activity, and capital expenditures.
Shares and Stock Split At the Company’s Annual Meeting of Stockholders on November 18, 2011, the shareholders approved an increase in the number of authorized shares of common stock, par value $5.00, from 120,000,000 to 240,000,000 and the total number of shares of stock which the Company has the authority to issue from 121,000,000 to 241,000,000.
On January 27, 2012, the Company announced that its Board of Directors declared a two-for-one stock split effected in the form of a 100 percent stock dividend. The stock split was distributed March 23, 2012, to stockholders of record as of March 2, 2012. Earnings and dividends per share and weighted average shares outstanding are presented in this Form 10-K after the effect of the 100 percent stock dividend. The two-for-one stock split is reflected in the share amounts in all periods presented in this Form 10-K.
DividendsThe Company’s dividend policy is to maintain a payout ratio, which allows dividends to increase with the long-term growth of earnings per share. The Company’s dividend payout ratio target is 20approximately 30 percent to 3040 percent of the prior three years average earnings per share of the last three years.share. Including the Company’s declaration on July 29, 201126, 2013, of a $0.15$0.13 per share dividend to be paid, the dividend payout ratio was 28.133.7 percent of the prior three years average diluted earnings per share on July 31, 2011.2013.
Share Repurchase PlanThe Board of Directors authorized the repurchase of 8.016.0 million shares of common stock under the stock repurchase plan dated March 26, 2010. In Fiscal 2011,2013, the Company repurchased 2.03.0 million shares of common stock for $108.9$102.6 million, or 2.52.0 percent of its diluted outstanding shares, at an average price of $55.67$34.34 per share. The Company repurchased 1.74.5 million shares for $66.7$130.2 million in Fiscal 2010.2012. The Company repurchased 0.83.9 million shares for $32.8$108.9 million in Fiscal 2009.2011. As of July 31, 2011,2013, the Company had remaining authorization to repurchase 5.02.6 million shares pursuant to the current authorization. The Company initiatedSubsequently, on September 27, 2013, the purchaseBoard of an additional 162,900Directors authorized the repurchase of 15.0 million shares in July 2011 for $9.2 million that are not included in Fiscal 2011 repurchases asof common stock under the transactions did not settle until after fiscal year end. These repurchases will be included in Fiscal 2012 activity.stock repurchase plan dated September 27, 2013 and cancelled the remaining shares from the previously approved authorization.
Off-Balance Sheet ArrangementsThe Company does not have any off-balance sheet arrangements, with the exception of the guarantee of 50 percent of certain debt of its joint venture, AFSIAdvanced Filtration Systems Inc. (AFSI), as further discussed in Note LM of the Company’s Notes to Consolidated Financial Statements. As of July 31, 2011,2013, the joint venture had $24.6$29.1 million of outstanding debt. The Company does not believe that this guarantee will have a current or future effect on its financial condition, results of operation,operations, liquidity, or capital resources.
�� New Accounting Standards In December 2010,February 2013, the FASBFinancial Accounting Standards Board (FASB) updated the accounting guidance relating to the annual goodwill impairment test.disclosure requirements for accumulated other comprehensive income. The updated guidance requires companies to perform the second stepdisclose amounts reclassified out of the impairment test to measure the amount of impairment loss, if any, when it is more likely than not that goodwill impairment exists when the carrying amount of a reporting unit is zero or negative. In considering whether it is more likely than not that goodwill impairment exists, an entity shall evaluate whether there are adverse qualitative factors.accumulated other comprehensive income by component. The updated guidance
Table of Contents
does not affect how net income or other comprehensive income are calculated or presented. The updated guidance is effective for the Company beginning in the first quarter of fiscal year 2012.2014. The adoption of this guidancestandard is not expected to have a material impact on the Company’s consolidated financial statements.
In May 2011,February 2013, the FASB updated the accountingissued guidance related to fair value measurements. The updated guidance results in a consistent definitionobligations resulting from joint and several liability arrangements for which the total amount of fair value and common requirements for measurement of and disclosure about fair value between U.S. GAAP and International Financial Reporting Standards (IFRS). The updatedthe obligation is fixed at the reporting date. This guidance is effective for the Company beginning in the thirdfirst quarter of fiscal year 2012.Fiscal 2015. The Company is currently evaluating the impact of adoption of this accounting guidancestandard is not expected to have a material impact on itsthe Company’s consolidated financial statements.
In June 2011, the FASB updated the disclosure requirements for comprehensive income. The updated guidance requires companies to disclose the total of comprehensive income, the components of net income, and the components of other comprehensive income either in a single continuous statement of comprehensive income or in two separate but consecutive statements. The updated guidance does not affect how earnings per share is calculated or presented. The updated guidance is effective for the Company beginning in the third quarter of fiscal year 2012. The Company is currently evaluating the impact of adoption of this accounting guidance on its consolidated financial statements.
Market Risk
The Company’s market risk includes the potential loss arising from adverse changes in foreign currency exchange rates and interest rates. The Company manages foreign currency market risk from time to time through the use of a variety of financial and derivative instruments. The Company does not enter into any of these instruments for trading purposes to generate revenue. Rather, the Company’s objective in managing these risks is to reduce fluctuations in earnings and cash flows associated with changes in foreign currency exchange rates. The Company uses forward exchange contracts and other hedging activities to hedge the U.S. dollar value resulting from existing recognized foreign currency denominated asset and liability balances and also for anticipated foreign currency transactions. The Company also naturally hedges foreign currency through its production in the countries in which it sells its products. The Company’s market risk on interest rates is the potential decrease in fair value of long-term debt resulting from a potential increase in interest rates. See further discussion of these market risks below and in Note EF of the Notes to Consolidated Financial Statements.
Foreign CurrencyDuring Fiscal 2011,2013, the U.S. dollar was generally weakerstronger than in Fiscal 20102012 compared to many of the currencies of the foreign countries in which the Company operates. The overall weaknessstrength of the dollar had a positivenegative impact on the Company’s international net sales results because the foreign denominated revenues translated into morefewer U.S. dollars.
It is not possible to determine the true impact of foreign currency translation changes. However, the direct effect on reported net sales and net earnings can be estimated. For the year ended July 31, 2011,2013, the impact of foreign currency translation resulted in an overall increasedecrease in reported net sales of $49.8$32.2 million, an increase in operating expenses of $9.7$8.0 million, and a decrease in reported net earnings of $6.1$2.1 million. Foreign currency translation had a positivenegative impact in mostmany regions around the world. The stronger U.S. dollar relative to the yen resulted in a total decrease of $17.9 million in reported net sales. In Europe, the weakerstronger U.S. dollar relative to the euro and British pound resulted in a total increasedecrease of $8.1$9.3 million in reported net sales. The stronger U.S. dollar relative to the South African rand, the Brazilian real, and the Indian rupee had a negative impact on foreign currency translation with a decrease in reported net sales of $8.1 million, $2.6 million, and $1.6 million, respectively. The weaker U.S. dollar relative to the Japanese yen, Australian dollar, Mexican peso and Chinese renminbi South African rand, and Thai baht also had a positive impact on foreign currency translation, with an increase in reported net sales of $15.6 million, $8.8 million, $5.0 million, $4.8 million, $4.4$4.3 million and $4.1 million, respectively, and an increase in reported net earnings of $1.1 million, $1.2 million, $0.6 million, $0.9 million, $0.4 million, and $1.0$3.1 million, respectively.
The Company maintains significant assets and operations in Europe, Asia-Pacific, South Africa, and Mexico, resulting in exposure to foreign currency gains and losses. A portion of the Company’s foreign currency exposure is naturally hedged by incurring liabilities, including bank debt, denominated in the local currency in which the Company’s foreign subsidiaries are located.
The foreign subsidiaries of the Company generally purchase the majority of their input costs and then sell to many of their Customers in the same local currency.
The Company may be exposed to cost increases relative to local currencies in the markets to which it sells. To mitigate such adverse trends, the Company, from time to time, enters into forward exchange contracts and other hedging activities. Additionally, foreign currency positions are partially offsetting and are netted against one another to reduce exposure.
Some products made in the United StatesU.S. are sold abroad. As a result, sales of such products are affected by the value of the U.S. dollar relative to other currencies. Any long-term strengthening of the U.S. dollar could depress these
Table of Contents
sales. Also, competitive conditions in the Company’s markets may limit its ability to increase product pricing in the face of adverse currency movements.
InterestThe Company’s exposure to market risks for changes in interest rates relates primarily to its short-term investments, short-term borrowings, and interest rate swap agreements, as well as the potential increase in fair value of long-term debt resulting from a potential decrease in interest rates. The Company has no earnings or cash flow exposure due to market risks on its long-term debt obligations as a result of the fixed-rate nature of the debt. However, interest rate changes would affect the fair market value of the debt. As of July 31, 2011,2013, the estimated fair value of long-term debt with fixed interest rates was $268.3$112.3 million compared to its carrying value of $247.0$100.0 million. The fair value is estimated by discounting the projected cash flows using the rate thatof which similar amounts of debt could currently be borrowed. As of July 31, 2011,2013, the Company’s financial liabilities with exposure to changes in interest rates consisted mainly of $13.1$9.2 million of short-term debt outstanding. Assuming a hypothetical increase of one-half percent in short-term interest rates, with all other variables remaining constant, interest expense would have increased $0.4$0.3 million and interest income would have increased $1.5 million in Fiscal 2011.2013.
Pensions The Company is exposed to market return fluctuations on its qualified defined benefit pension plans. Although the market value of these assets increased inIn Fiscal 2011,2013, we adjustedmaintained our long–term rate of return from 8.0 percent to 7.75at 7.50 percent on our U.S. plans, and from a weighted average of 6.175.20 percent to 6.035.48 percent on our non-U.S. plans, to reflect our future expectation for returns. In addition, we adjusted our discount rate used to value our pension obligation for our U.S. plans from 5.253.59 percent to 4.914.58 percent and from 5.174.13 percent to 5.364.04 percent for the non-U.S plans. Our plans were underfundedoverfunded by $30.5$7.8 million at July 31, 2011,2013, since the projected benefit obligation exceeded the fair value of the plan assets.assets exceeded the projected benefit obligation.
Critical Accounting Policies
The Company’s consolidated financial statements are prepared in conformity with generally accepted accounting principles in the United States of America (U.S. GAAP).U.S. GAAP. The preparation of these financial statements requires the use of estimates, judgments, and assumptions that affect the reported amounts of assets and liabilities at the date of the financial statements and the reported amounts of revenue and expenses during the periods presented. Management bases these estimates on historical experience and various other assumptions that are believed to be reasonable under the circumstances, the results of which form the basis for making judgments about the recorded values of certain assets and liabilities. The Company believes its use of estimates and underlying accounting assumptions adheres to U.S. GAAP and is consistently applied. Valuations based on estimates and underlying accounting assumptions are reviewed for reasonableness on a consistent basis throughout the Company. Management believes the Company’s critical accounting policies that require more significant judgments and estimates used in the preparation of its consolidated financial statements and that are the most important to aid in fully understanding its financial results are the following:
Revenue recognition, warranty, and allowance for doubtful accountsRevenue is recognized when both product ownership and the risk of loss have transferred to the Customer and the Company has no remaining obligations. The Company records estimated discounts and rebates as a reduction of sales in the same period revenue is recognized. For the Company’s Gas Turbine Systems sales, it must carefully monitor the shipment of each part that comprises the entirety of the GTS project and may only recognize revenue when the last element of the entire GTS project is shipped or according to particular Incoterms terms. Accruals for warranties on products sold are recorded based on historical return percentages and specific product recall campaigns. Allowances for doubtful accounts are estimated by management based on evaluation of potential losses related to Customer receivable balances. The Company determines the allowance based on historical write-off experience in the industry, regional economic data, and evaluation of specific Customer accounts for risk of loss. The Company reviews its allowance for doubtful accounts monthly. Account balances are charged off against the allowance when the Company feels it is probable the receivable will not be recovered. The Company does not have any off-balance sheet credit exposure related to its Customers. The establishment of this reserve requires the use of judgment and assumptions regarding the potential for losses on receivable balances. Though management considers these balances adequate and proper, changes in economic conditions in specific markets in which the Company operates could have an effect on reserve balances required.
Goodwill and other intangible assetsGoodwill is assessed for impairment annually, or more frequently if events or changes in circumstances indicate that the asset might be impaired. The Company performs impairment assessments for its reporting units and uses a discounted cash flow model based on management’s judgments and assumptions to determine the estimated fair value. An impairment loss generally would be recognized when the carrying amount of the reporting unit’s net assets exceeds the estimated fair value of the reporting unit. The Company performed an impairment assessment during the third quarter of Fiscal 20112013 to satisfy its annual impairment requirement. The impairment assessment in the third quarter indicated that the estimated fair valuevalues of eachthe reporting unit exceeded itsunits to which goodwill is assigned continued to significantly exceed the corresponding carrying amount,values of the respective reporting units, including recorded goodwill and, as such, no impairment existed at that time. Other intangible assets with definite lives continue to be amortized over their estimated useful lives. Definite lived intangible
Table of Contents
assets are also subject to impairment assessments. A considerable amount of management judgment and assumptions are required in performing the impairment assessments, principally in determining the fair value of each reporting unit. The important assumptions utilized in these assessments include the (i) discount rate; (ii) projected revenue, gross margin, operating income; and (iii) terminal value. While the Company believes its judgments and assumptions are reasonable, different assumptions could change the estimated fair values and, therefore, impairment charges could be required.
Income taxesAs part of the process of preparing the Company’s Consolidated Financial Statements, management is required to estimate income taxes in each of the jurisdictions in which the Company operates. This process involves estimating actual current tax exposure together with assessing temporary differences resulting from differing treatment of items for tax and book accounting purposes. These differences result in deferred tax assets and liabilities, which are included within the Company’s Consolidated Balance Sheet. These assets and liabilities are evaluated by using estimates of future taxable income streams and the impact of tax planning strategies. Management assesses the likelihood that deferred tax assets will be recovered from future taxable income and to the extent management believes that recovery is not likely, a valuation allowance is established. To the extent that a valuation allowance is established or increased, an expense within the tax provision is included in the statement of operations. Reserves are also estimated for uncertain tax positions that are currently unresolved. The Company routinely monitors the potential impact of such situations and believes that it iswas properly reserved.reserved at July 31, 2013. Valuations related to tax accruals and assets can be impacted by changes to tax codes, changes in statutory tax rates, and the Company’s future taxable income levels. As of July 31, 2011,2013, the liability for unrecognized tax benefits, accrued interest, and penalties was $21.5$19.5 million.
Employee Benefit PlansThe Company incurs expenses relating to employee benefits such as non-contributory defined benefit pension plans and postretirement health care benefits. In accounting for these employment costs, management must make a variety of assumptions and estimates including mortality rates, discount rates, overall Company compensation increases, expected return on plan assets, and health care cost trend rates. The Company considers historical data as well as current facts and circumstances and uses a third-party specialist to assist management in determining these estimates.
To develop the assumption regarding the expected long-term rate of return on assets for its U.S. pension plans, the Company considered the historical returns and the future expectations for returns for each asset class, as well as the target asset allocation of the pension portfolio. This resulted in the selection of the 7.757.50 percent long-term rate of return on assets assumption as of July 31, 20112013, for developing the Fiscal 20122014 expense for the Company’s U.S. pension plans. In addition, we lowered ourthe Company increased the discount rate used to value ourthe pension obligation for ourits U.S. plans from 5.253.59 percent to 4.914.58 percent. The Company also selected the long-term rate of return on assets for its non-U.S. plans of 4.13 percent and adjusted the discount rate used to 4.04 percent for developing the Fiscal 2014 expense. The expected long-term rate of return on assets assumption for the plans outside the U.S. reflects the investment allocation and expected total portfolio returns specific to each plan and country.
Reflecting the relatively long-term nature of the plans’ obligations, approximately 4560 percent of the plans assets are invested in equity securities, 3025 percent in alternative investments (funds of hedge funds), 10fixed income, and 15 percent in real assets (investments into funds containing commodities and real estate), 10 percent in fixed income, and 5 percent in private equity. Within equity securities, the Company targets an allocation of 15 percent international, 15 percent equity long / short, 10 percent small cap, and 5 percent large cap..
A one percent change in the expected long-term rate of return on U.S. plan assets, from 8.07.50 percent, would have changed the Fiscal 20112013 annual pension expense by approximately $2.7$4.1 million. The expected long-term rate of return on assets assumption for the plans outside the U.S. follows the same methodology as described above, but reflects the investment allocation and expected total portfolio returns specific to each plan and country.
The Company’s objective in selecting a discount rate for its pension plans is to select the best estimate of the rate at which the benefit obligations could be effectively settled on the measurement date, taking into account the nature and duration of the benefit obligations of the plan. In making this best estimate, the Company looks at rates of return on high-quality fixed-income investments currently available and expected to be available during the period to maturity of the benefits. This process includes assessing the universe of bonds available on the measurement date with a quality rating of Aa or better. Similar appropriate benchmarks are used to determine the discount rate for the non-U.S. plans. As of the measurement date of July 31, 2011,2013, the Company decreasedincreased its discount rate for the U.S. pension plans to 4.914.58 percent from 5.253.59 percent as of July 31, 2010.2011. The decreaseincrease of 3499 basis points is consistent with published bond indices. The change increaseddecreased the Company’s U.S. projected benefit obligation as of July 31, 20112013, by approximately $7.2$36.5 million and is expected to increasedecrease pension expense in fiscal year 20122014 by approximately $0.5$3.3 million. The rates discussed above are weighted average rates as we havethe Company has multiple plans both in the U.S. and internationally.
The Company expects that global pension expenses will decrease approximately $3.7 million in Fiscal 2014 as compared to Fiscal 2013, which is driven primarily by the changes in assumptions. In July 2013, the Company announced that effective August 1, 2013, the plan will be frozen to any Employees hired on or after August 1, 2013. Then effective, August 1, 2016, Employees hired prior to August 1, 2013 would no longer continue to accrue Company contribution credits under the plan. Additionally, in July 2013, the Company announced that Employees hired on or after August 1, 2013 will be eligible for a 3 percent annual Company retirement contribution in addition to the Company’s 401(k) match. Effective August 1, 2016, Employees hired prior to August 1, 2013 will be eligible for the 3 percent annual Company retirement contribution.
Safe Harbor Statement under the Securities Reform Act of 1995
The Company, through its management, may make forward-looking statements reflecting the Company’s current views with respect to future events and financial performance. These forward-looking statements, which may be
Table of Contents
included in reports filed under the Securities Exchange Act of 1934, as amended (the “Exchange Act”)Exchange Act), in press releases and in other documents and materials as well as in written or oral statements made by or on behalf of the Company, are subject to certain risks and uncertainties, including those discussed in Item 1A of this Form 10-K, which could cause actual results to differ materially from historical results or those anticipated. The words or phrases “will likely result,” “are expected to,” “will continue,” “estimate,” “project,” “believe,” “expect,” “anticipate,” “forecast,” and similar expressions are intended to identify forward-looking statements within the meaning of Section 21e of the Exchange Act and Section 27A of the Securities Act of 1933, as amended, as enacted by the Private Securities Litigation Reform Act of 1995 (“PSLRA”)(PSLRA). In particular the Company desires to take advantage of the protections of the PSLRA in connection with the forward-looking statements made in this Annual Report on Form 10-K, including those contained in the “Outlook” section of Item 7. Management’s Discussion and Analysis of Financial Condition and Results of Operation.Operations. All statements other than statements of historical fact are forward-looking statements. These statements do not guarantee future performance.
Readers are cautioned not to place undue reliance on these forward-looking statements, which speak only as of the date such statements are made. In addition, the Company wishes to advise readers that the factors listed in Item 1A of this Form 10-K, as well as other factors, could affect the Company’s performance and could cause the Company’s actual results for future periods to differ materially from any opinions or statements expressed. These factors include, but are not limited to risks associated with: world economic factors and the ongoing economic uncertainty, the reduced demand for hard disk drive products with the increased use of flash memory, the potential for some Customers to increase their reliance on their own filtration capabilities, currency fluctuations, commodity prices, political factors, the Company’s international operations, highly competitive markets, environmental laws and regulations, including regulatory approvals for Retrofit Emission Products, governmental laws and regulations, including the impact of the various economic stimulus and financial reform measures, being implemented, the implementation of our new information technology systems, failure or breach of information technology and trade secret security, potential global events resulting in market instability including financial bailouts and defaults of sovereign nations, political changes, military and terrorist activities, health outbreaks, natural disasters, and other factors included in Item 1A of this Report on Form 10-K. The Company undertakes no obligation to publicly update or revise any forward-looking statements, whether as a result of new information, future events or otherwise.
Item 7A. Quantitative and Qualitative Disclosures about Market Risk
Market risk disclosure appears in Management’s Discussion and Analysis on page 21under23 under “Market Risk.”
Table of Contents
Item 8. Financial Statements and Supplementary Data
Management’s Report on Internal Control over Financial Reporting
Management is responsible for establishing and maintaining adequate internal control over financial reporting for the Company. Management conducted an evaluation of the effectiveness of internal control over financial reporting based on the framework inInternal Control – Integrated Framework issued by the Committee of Sponsoring Organizations of the Treadway Commission (“COSO”)(COSO). Based on this evaluation, management concluded that the Company’s internal control over financial reporting was effective as of July 31, 2011.2013. The Company’s independent registered public accounting firm, PricewaterhouseCoopers LLP, has audited the effectiveness of the Company’s internal control over financial reporting as of July 31, 2011,2013, as stated in this report which follows in Item 8 of this Form 10-K.
| |
/s/ William M. Cook | /s/ Thomas R. VerHage James F. Shaw |
| |
William M. Cook | Thomas R. VerHage
James F. Shaw |
Chief Executive Officer | Chief Financial Officer |
September 23, 2011 27, 2013 | September 23, 2011 27, 2013 |
Table of Contents
Report of Independent Registered Public Accounting Firm
To the Shareholders and Board of Directors of Donaldson Company, Inc.
In our opinion, the accompanying consolidated balance sheets and the related statements of earnings, comprehensive income, shareholders’ equity and cash flows present fairly, in all material respects, the financial position of Donaldson Company, Inc. and its subsidiaries at July 31, 20112013 and 2010,July 31, 2012, and the results of their operations and their cash flows for each of the three years in the period ended July 31, 2011,2013 in conformity with accounting principles generally accepted in the United States of America. In addition, in our opinion, the financial statement schedule listed in the index appearing under item 15(II)Item 15(2) presents fairly, in all material respects, the information set forth therein when read in conjunction with the related consolidated financial statements. Also in our opinion, the Company maintained, in all material respects, effective internal control over financial reporting as of July 31, 2011,2013, based on criteria established inInternal Control - Integrated Framework issued by the Committee of Sponsoring Organizations of the Treadway Commission (COSO). The Company’s management is responsible for these financial statements and financial statement schedule, for maintaining effective internal control over financial reporting and for its assessment of the effectiveness of internal control over financial reporting, included in the accompanying Management’s Report on Internal Control over Financial Reporting. Our responsibility is to express opinions on these financial statements, on the financial statement schedule and on the Company’s internal control over financial reporting based on our integrated audits. We conducted our audits in accordance with the standards of the Public Company Accounting Oversight Board (United States). Those standards require that we plan and perform the audits to obtain reasonable assurance about whether the financial statements are free of material misstatement and whether effective internal control over financial reporting was maintained in all material respects. Our audits of the financial statements included examining, on a test basis, evidence supporting the amounts and disclosures in the financial statements, assessing the accounting principles used and significant estimates made by management, and evaluating the overall financial statement presentation. Our audit of internal control over financial reporting included obtaining an understanding of internal control over financial reporting, assessing the risk that a material weakness exists, and testing and evaluating the design and operating effectiveness of internal control based on the assessed risk. Our audits also included performing such other procedures as we considered necessary in the circumstances. We believe that our audits provide a reasonable basis for our opinions.
A company’s internal control over financial reporting is a process designed to provide reasonable assurance regarding the reliability of financial reporting and the preparation of financial statements for external purposes in accordance with generally accepted accounting principles. A company’s internal control over financial reporting includes those policies and procedures that (i) pertain to the maintenance of records that, in reasonable detail, accurately and fairly reflect the transactions and dispositions of the assets of the company; (ii) provide reasonable assurance that transactions are recorded as necessary to permit preparation of financial statements in accordance with generally accepted accounting principles, and that receipts and expenditures of the company are being made only in accordance with authorizations of management and directors of the company; and (iii) provide reasonable assurance regarding prevention or timely detection of unauthorized acquisition, use, or disposition of the company’s assets that could have a material effect on the financial statements.
Because of its inherent limitations, internal control over financial reporting may not prevent or detect misstatements. Also, projections of any evaluation of effectiveness to future periods are subject to the risk that controls may become inadequate because of changes in conditions, or that the degree of compliance with the policies or procedures may deteriorate.
/s/ PricewaterhouseCoopers LLP
PricewaterhouseCoopers LLP
Minneapolis, Minnesota
September 23, 201127, 2013
Table of Contents
Consolidated Statements of Earnings
Donaldson Company, Inc. and Subsidiaries
| | | | | | | | | | |
| | Year ended July 31, | |
| | 2011 | | 2010 | | 2009 | |
| | (thousands of dollars, except share
and per share amounts) | |
Net sales | | $ | 2,294,029 | | $ | 1,877,064 | | $ | 1,868,629 | |
Cost of sales | | | 1,480,233 | | | 1,218,316 | | | 1,278,923 | |
Gross margin | | | 813,796 | | | 658,748 | | | 589,706 | |
Selling, general and administrative | | | 443,227 | | | 376,018 | | | 379,108 | |
Research and development | | | 55,286 | | | 44,486 | | | 40,643 | |
Operating income | | | 315,283 | | | 238,244 | | | 169,955 | |
Interest expense | | | 12,525 | | | 11,975 | | | 17,018 | |
Other income, net | | | (9,505 | ) | | (3,907 | ) | | (8,488 | ) |
Earnings before income taxes | | | 312,263 | | | 230,176 | | | 161,425 | |
Income taxes | | | 86,972 | | | 64,013 | | | 29,518 | |
Net earnings | | $ | 225,291 | | $ | 166,163 | | $ | 131,907 | |
Weighted average shares - basic | | | 77,196,370 | | | 77,848,528 | | | 77,967,141 | |
Weighted average shares - diluted | | | 78,598,459 | | | 79,177,772 | | | 79,199,838 | |
Net earnings per share - basic | | $ | 2.92 | | $ | 2.13 | | $ | 1.69 | |
Net earnings per share - diluted | | $ | 2.87 | | $ | 2.10 | | $ | 1.67 | |
| | | Year ended July 31, | |
| | | 2013 | | | 2012 | | | 2011 | |
| | | (thousands of dollars, except share and per share amounts) | |
| Net sales | | $ | 2,436,948 | | | $ | 2,493,248 | | | $ | 2,294,029 | |
| Cost of sales | | | 1,589,821 | | | | 1,619,485 | | | | 1,480,233 | |
| Gross profit | | | 847,127 | | | | 873,763 | | | | 813,796 | |
| Selling, general, and administrative | | | 441,168 | | | | 451,158 | | | | 443,227 | |
| Research and development | | | 62,630 | | | | 59,589 | | | | 55,286 | |
| Operating income | | | 343,329 | | | | 363,016 | | | | 315,283 | |
| Other income, net | | | (15,762 | ) | | | (19,253 | ) | | | (9,505 | ) |
| Interest expense | | | 10,910 | | | | 11,489 | | | | 12,525 | |
| Earnings before income taxes | | | 348,181 | | | | 370,780 | | | | 312,263 | |
| Income taxes | | | 100,804 | | | | 106,479 | | | | 86,972 | |
| Net earnings | | $ | 247,377 | | | $ | 264,301 | | | $ | 225,291 | |
| Weighted average shares - basic | | | 148,273,904 | | | | 150,286,403 | | | | 154,392,740 | |
| Weighted average shares - diluted | | | 150,455,193 | | | | 152,940,605 | | | | 157,196,918 | |
| Net earnings per share - basic | | $ | 1.67 | | | $ | 1.76 | | | $ | 1.46 | |
| Net earnings per share - diluted | | $ | 1.64 | | | $ | 1.73 | | | $ | 1.43 | |
The accompanying notes are an integral part of these Consolidated Financial Statements.
Consolidated Statements of Contents
Comprehensive Income
Consolidated Balance Sheets
Donaldson Company, Inc. and Subsidiaries
| | | | | | | |
| | At July 31, | |
| | 2011 | | 2010 | |
| | (thousands of dollars, except
share amounts) | |
Assets | | | | | | | |
Current assets | | | | | | | |
Cash and cash equivalents | | $ | 273,494 | | $ | 232,000 | |
Accounts receivable, less allowance of $6,908 and $6,315 | | | 445,700 | | | 358,917 | |
Inventories, net | | | 271,476 | | | 203,631 | |
Deferred income taxes | | | 29,805 | | | 22,054 | |
Prepaids and other current assets | | | 46,107 | | | 43,613 | |
Total current assets | | $ | 1,066,582 | | $ | 860,215 | |
Property, plant and equipment, net | | | 391,502 | | | 365,892 | |
Goodwill | | | 171,741 | | | 165,315 | |
Intangible assets, net | | | 53,496 | | | 58,292 | |
Other assets | | | 42,772 | | | 49,792 | |
Total assets | | $ | 1,726,093 | | $ | 1,499,506 | |
| | | | | | | |
Liabilities and shareholders’ equity | | | | | | | |
Current liabilities | | | | | | | |
Short-term borrowings | | $ | 13,129 | | $ | 50,000 | |
Current maturities of long-term debt | | | 47,871 | | | 5,536 | |
Trade accounts payable | | | 215,918 | | | 165,907 | |
Accrued employee compensation and related taxes | | | 86,974 | | | 73,632 | |
Accrued liabilities | | | 64,008 | | | 40,546 | |
Other current liabilities | | | 68,344 | | | 53,635 | |
Total current liabilities | | | 496,244 | | | 389,256 | |
Long-term debt | | | 205,748 | | | 256,192 | |
Deferred income taxes | | | 11,196 | | | 7,076 | |
Other long-term liabilities | | | 78,194 | | | 100,349 | |
Total liabilities | | | 791,382 | | | 752,873 | |
Commitments and contingencies (Note N) | | | | | | | |
Shareholders’ equity | | | | | | | |
Preferred stock, $1.00 par value, 1,000,000 shares authorized, none issued | | | — | | | — | |
Common stock, $5.00 par value, 120,000,000 shares authorized, 88,643,194 shares issued in 2011 and 2010 | | | 443,216 | | | 443,216 | |
Retained earnings | | | 925,542 | | | 744,247 | |
Stock compensation plans | | | 24,736 | | | 22,326 | |
Accumulated other comprehensive income (loss) | | | 40,027 | | | (40,486 | ) |
Treasury stock, 13,245,864 and 12,222,381 shares in 2011 and 2010, at cost | | | (498,810 | ) | | (422,670 | ) |
Total shareholders’ equity | | | 934,711 | | | 746,633 | |
Total liabilities and shareholders’ equity | | $ | 1,726,093 | | $ | 1,499,506 | |
| | | At July 31, | |
| | | 2013 | | | 2012 | | | 2011 | |
| | | (thousands of dollars, except share amounts) | |
| Net earnings | | $ | 247,377 | | | $ | 264,301 | | | $ | 225,291 | |
| Foreign currency translation gain (loss) | | | 17,435 | | | | (98,723 | ) | | | 72,505 | |
| Gain (loss) on hedging derivatives, net of deferred taxes of | | | | | | | | | | | | |
| ($196), $117, and ($280), respectively | | | 120 | | | | (672 | ) | | | 842 | |
| Pension and postretirement liability adjustment, net of deferred | | | | | | | | | | | | |
| taxes of ($25,656), $23,527, and ($4,021), respectively | | | 46,860 | | | | (42,520 | ) | | | 7,166 | |
| Total comprehensive income | | $ | 311,792 | | | $ | 122,386 | | | $ | 305,804 | |
The accompanying notes are an integral part of these Consolidated Financial Statements.
Table of Contents
Consolidated Statements of Cash FlowsBalance Sheets
Donaldson Company, Inc. and Subsidiaries
| | | | | | | | | | |
| | Year ended July 31, | |
| | 2011 | | 2010 | | 2009 | |
| | (thousands of dollars) | |
Operating Activities | | | | | | | | | | |
Net earnings | | $ | 225,291 | | $ | 166,163 | | $ | 131,907 | |
Adjustments to reconcile net earnings to net cash provided by operating activities | | | | | | | | | | |
Depreciation and amortization | | | 60,491 | | | 59,232 | | | 58,597 | |
Equity in losses (earnings) of affiliates, net of distributions | | | (2,585 | ) | | 183 | | | (982 | ) |
Deferred income taxes | | | 1,957 | | | 3,025 | | | (4,726 | ) |
Tax benefit of equity plans | | | (9,873 | ) | | (4,625 | ) | | (2,663 | ) |
Stock compensation plan expense | | | 9,234 | | | 8,253 | | | 1,900 | |
Other, net | | | (11,991 | ) | | (6,110 | ) | | (7 | ) |
Changes in operating assets and liabilities, net of acquired businesses | | | | | | | | | | |
Accounts receivable | | | (62,274 | ) | | (79,308 | ) | | 116,983 | |
Inventories | | | (52,999 | ) | | (25,826 | ) | | 66,145 | |
Prepaids and other current assets | | | 7,233 | | | (3,970 | ) | | (11,489 | ) |
Trade accounts payable and other accrued expenses | | | 81,571 | | | 85,988 | | | (78,738 | ) |
Net cash provided by operating activities | | | 246,055 | | | 203,005 | | | 276,927 | |
Investing Activities | | | | | | | | | | |
Purchases of property, plant and equipment | | | (60,633 | ) | | (43,149 | ) | | (46,080 | ) |
Proceeds from sale of property, plant and equipment | | | 782 | | | 490 | | | 511 | |
Acquisitions, investments and divestitures of affiliates | | | 3,493 | | | (250 | ) | | (74,318 | ) |
Net cash used in investing activities | | | (56,358 | ) | | (42,909 | ) | | (119,887 | ) |
Financing Activities | | | | | | | | | | |
Proceeds from long-term debt | | | 6,774 | | | 531 | | | 80,471 | |
Repayments of long-term debt | | | (13,353 | ) | | (5,508 | ) | | (7,745 | ) |
Change in short-term borrowings | | | (36,603 | ) | | 20,713 | | | (103,695 | ) |
Purchase of treasury stock | | | (108,929 | ) | | (66,696 | ) | | (32,773 | ) |
Dividends paid | | | (41,013 | ) | | (36,242 | ) | | (35,166 | ) |
Tax benefit of equity plans | | | 9,873 | | | 4,625 | | | 2,663 | |
Exercise of stock options | | | 15,899 | | | 13,053 | | | 4,476 | |
Net cash used in financing activities | | | (167,352 | ) | | (69,524 | ) | | (91,769 | ) |
Effect of exchange rate changes on cash | | | 19,149 | | | (2,259 | ) | | (4,941 | ) |
Increase in cash and cash equivalents | | | 41,494 | | | 88,313 | | | 60,330 | |
Cash and cash equivalents, beginning of year | | | 232,000 | | | 143,687 | | | 83,357 | |
Cash and cash equivalents, end of year | | $ | 273,494 | | $ | 232,000 | | $ | 143,687 | |
| | | | | | | | | | |
Supplemental Cash Flow Information | | | | | | | | | | |
Cash paid during the year for: | | | | | | | | | | |
Income taxes | | $ | 57,688 | | $ | 40,032 | | $ | 41,196 | |
Interest | | | 12,852 | | | 11,446 | | | 14,861 | |
| | | At July 31, | |
| | | 2013 | | | 2012 | |
| | | (thousands of dollars, except share amounts) | |
| Assets | | | | | | | | |
| Current assets | | | | | | | | |
| Cash and cash equivalents | | $ | 224,138 | | | $ | 225,789 | |
| Short-term investments | | | 99,750 | | | | 92,362 | |
| Accounts receivable, less allowance of $7,040 and $6,418 | | | 430,766 | | | | 438,796 | |
| Inventories, net | | | 234,820 | | | | 256,116 | |
| Deferred income taxes | | | 26,464 | | | | 25,158 | |
| Prepaids and other current assets | | | 39,724 | | | | 47,441 | |
| Total current assets | | $ | 1,055,662 | | | $ | 1,085,662 | |
| Property, plant, and equipment, net | | | 419,280 | | | | 384,909 | |
| Goodwill | | | 165,568 | | | | 162,949 | |
| Intangible assets, net | | | 41,307 | | | | 46,200 | |
| Other assets | | | 61,739 | | | | 50,362 | |
| Total assets | | $ | 1,743,556 | | | $ | 1,730,082 | |
| Liabilities and shareholders’ equity | | | | | | | | |
| Current liabilities | | | | | | | | |
| Short-term borrowings | | $ | 9,190 | | | $ | 95,147 | |
| Current maturities of long-term debt | | | 98,664 | | | | 2,346 | |
| Trade accounts payable | | | 186,460 | | | | 199,182 | |
| Accrued employee compensation and related taxes | | | 68,954 | | | | 80,550 | |
| Accrued liabilities | | | 38,527 | | | | 49,242 | |
| Other current liabilities | | | 74,640 | | | | 72,056 | |
| Total current liabilities | | | 476,435 | | | | 498,523 | |
| Long-term debt | | | 102,774 | | | | 203,483 | |
| Deferred income taxes | | | 23,604 | | | | 4,611 | |
| Other long-term liabilities | | | 55,556 | | | | 113,451 | |
| Total liabilities | | | 658,369 | | | | 820,068 | |
| Commitments and contingencies (Note M and Note O) | | | | | | | | |
| Shareholders’ equity | | | | | | | | |
| Preferred stock, $1.00 par value, 1,000,000 shares authorized, none issued | | | — | | | | — | |
| Common stock, $5.00 par value, 240,000,000 shares authorized, | | | | | | | | |
| 151,643,194 shares issued in both 2013 and 2012 | | | 758,216 | | | | 758,216 | |
| Retained earnings | | | 532,307 | | | | 366,788 | |
| Stock compensation plans | | | 21,745 | | | | 24,948 | |
| Accumulated other comprehensive income (loss) | | | (37,473 | ) | | | (101,888 | ) |
| Treasury stock, 5,490,725 and 3,980,832 shares in 2013 and 2012, at cost | | | (189,608 | ) | | | (138,050 | ) |
| Total shareholders’ equity | | | 1,085,187 | | | | 910,014 | |
| Total liabilities and shareholders’ equity | | $ | 1,743,556 | | | $ | 1,730,082 | |
The accompanying notes are an integral part of these Consolidated Financial Statements.
Table of Contents
Consolidated Statements of Changes in Shareholders’ EquityCash Flows
Donaldson Company, Inc. and Subsidiaries
| | | | | | | | | | | | | | | | | | | | | | |
| | Common
Stock | | Additional
Paid-in
Capital | | Retained
Earnings | | Stock
Compensation
Plans | | Accumulated Other
Comprehensive
Income (Loss) | | Treasury
Stock | | Total | |
| | (thousands of dollars, except per share amounts) | |
Balance July 31, 2008 | | $ | 443,216 | | $ | — | | $ | 522,476 | | $ | 27,065 | | $ | 112,883 | | $ | (365,605 | ) | $ | 740,035 | |
Comprehensive income | | | | | | | | | | | | | | | | | | | | | | |
Net earnings | | | | | | | | | 131,907 | | | | | | | | | | | | 131,907 | |
Foreign currency translation | | | | | | | | | | | | | | | (63,385 | ) | | | | | (63,385 | ) |
Pension liability adjustment, net of deferred taxes | | | | | | | | | | | | | | | (58,593 | ) | | | | | (58,593 | ) |
Net loss on cash flow hedging derivatives | | | | | | | | | | | | | | | (582 | ) | | | | | (582 | ) |
Comprehensive income | | | | | | | | | | | | | | | | | | | | | 9,347 | |
Treasury stock acquired | | | | | | | | | | | | | | | | | | (32,773 | ) | | (32,773 | ) |
Stock options exercised | | | | | | (2,998 | ) | | (6,151 | ) | | | | | | | | 12,104 | | | 2,955 | |
Deferred stock and other activity | | | | | | (529 | ) | | (88 | ) | | (4,344 | ) | | | | | 3,710 | | | (1,251 | ) |
Performance awards | | | | | | (266 | ) | | (60 | ) | | (2,827 | ) | | | | | 1,932 | | | (1,221 | ) |
Stock option expense | | | | | | | | | 4,143 | | | | | | | | | | | | 4,143 | |
Tax reduction - employee plans | | | | | | 3,793 | | | | | | | | | | | | | | | 3,793 | |
Adjustment to adopt retirement benefit compensation guidance, net of tax | | | | | | | | | (887 | ) | | | | | | | | | | | (887 | ) |
Dividends ($0.460 per share) | | | | | | | | | (35,523 | ) | | | | | | | | | | | (35,523 | ) |
Balance July 31, 2009 | | | 443,216 | | | — | | | 615,817 | | | 19,894 | | | (9,677 | ) | | (380,632 | ) | | 688,618 | |
Comprehensive income | | | | | | | | | | | | | | | | | | | | | | |
Net earnings | | | | | | | | | 166,163 | | | | | | | | | | | | 166,163 | |
Foreign currency translation | | | | | | | | | | | | | | | (15,961 | ) | | | | | (15,961 | ) |
Pension liability adjustment, net of deferred taxes | | | | | | | | | | | | | | | (14,780 | ) | | | | | (14,780 | ) |
Net loss on cash flow hedging derivatives | | | | | | | | | | | | | | | (68 | ) | | | | | (68 | ) |
Comprehensive income | | | | | | | | | | | | | | | | | | | | | 135,354 | |
Treasury stock acquired | | | | | | | | | | | | | | | | | | (66,696 | ) | | (66,696 | ) |
Stock options exercised | | | | | | (5,608 | ) | | (7,678 | ) | | 2,676 | | | | | | 22,951 | | | 12,341 | |
Deferred stock and other activity | | | | | | (704 | ) | | (30 | ) | | (244 | ) | | | | | 1,707 | | | 729 | |
Performance awards | | | | | | 7 | | | (7 | ) | | | | | | | | | | | — | |
Stock option expense | | | | | | | | | 6,891 | | | | | | | | | | | | 6,891 | |
Tax reduction - employee plans | | | | | | 6,305 | | | | | | | | | | | | | | | 6,305 | |
Dividends ($0.480 per share) | | | | | | | | | (36,909 | ) | | | | | | | | | | | (36,909 | ) |
Balance July 31, 2010 | | | 443,216 | | | — | | | 744,247 | | | 22,326 | | | (40,486 | ) | | (422,670 | ) | | 746,633 | |
Comprehensive income | | | | | | | | | | | | | | | | | | | | | | |
Net earnings | | | | | | | | | 225,291 | | | | | | | | | | | | 225,291 | |
Foreign currency translation | | | | | | | | | | | | | | | 72,505 | | | | | | 72,505 | |
Pension liability adjustment, net of deferred taxes | | | | | | | | | | | | | | | 7,166 | | | | | | 7,166 | |
Net gain on cash flow hedging derivatives | | | | | | | | | | | | | | | 842 | | | | | | 842 | |
Comprehensive income | | | | | | | | | | | | | | | | | | | | | 305,804 | |
Treasury stock acquired | | | | | | | | | | | | | | | | | | (108,929 | ) | | (108,929 | ) |
Stock options exercised | | | | | | (10,792 | ) | | (7,854 | ) | | 1,862 | | | | | | 30,604 | | | 13,820 | |
Deferred stock and other activity | | | | | | (1,418 | ) | | 174 | | | 548 | | | | | | 2,185 | | | 1,489 | |
Performance awards | | | | | | (7 | ) | | 7 | | | | | | | | | | | | — | |
Stock option expense | | | | | | | | | 6,462 | | | | | | | | | | | | 6,462 | |
Tax reduction - employee plans | | | | | | 12,217 | | | | | | | | | | | | | | | 12,217 | |
Dividends ($0.560 per share) | | | | | | | | | (42,785 | ) | | | | | | | | | | | (42,785 | ) |
Balance July 31, 2011 | | $ | 443,216 | | $ | — | | $ | 925,542 | | $ | 24,736 | | $ | 40,027 | | $ | (498,810 | ) | $ | 934,711 | |
| | | Year ended July 31, | |
| | | 2013 | | | 2012 | | | 2011 | |
| | | (thousands of dollars) | |
| Operating Activities | | | | | | | | | | | | |
| Net earnings | | $ | 247,377 | | | $ | 264,301 | | | $ | 225,291 | |
| Adjustments to reconcile net earnings to net cash provided by | | | | | | | | | | | | |
| operating activities | | | | | | | | | | | | |
| Depreciation and amortization | | | 64,290 | | | | 61,165 | | | | 60,491 | |
| Equity in losses (earnings) of affiliates, net of distributions | | | 1,637 | | | | (2,380 | ) | | | (2,585 | ) |
| Deferred income taxes | | | 8,347 | | | | 6,344 | | | | 1,957 | |
| Tax benefit of equity plans | | | (11,191 | ) | | | (10,316 | ) | | | (9,873 | ) |
| Stock compensation plan expense | | | 9,148 | | | | 10,553 | | | | 9,234 | |
| Other, net | | | (6,175 | ) | | | (24,346 | ) | | | (11,991 | ) |
| Changes in operating assets and liabilities, net of acquired businesses | | | | | | | | | | | | |
| Accounts receivable | | | 3,705 | | | | (17,877 | ) | | | (62,274 | ) |
| Inventories | | | 20,142 | | | | (4,149 | ) | | | (52,999 | ) |
| Prepaids and other current assets | | | 13,495 | | | | (17,378 | ) | | | 7,233 | |
| Trade accounts payable and other accrued expenses | | | (34,852 | ) | | | (6,205 | ) | | | 81,571 | |
| Net cash provided by operating activities | | | 315,923 | | | | 259,712 | | | | 246,055 | |
| Investing Activities | | | | | | | | | | | | |
| Purchases of property, plant, and equipment | | | (94,895 | ) | | | (78,139 | ) | | | (60,633 | ) |
| Proceeds from sale of property, plant, and equipment | | | 558 | | | | 969 | | | | 782 | |
| Purchases of short-term investments | | | (99,339 | ) | | | (187,575 | ) | | | (64,482 | ) |
| Proceeds from sale of short-term investments | | | 97,365 | | | | 88,277 | | | | 64,482 | |
| Acquisitions and divestitures of affiliates | | | — | | | | — | | | | 3,493 | |
| Net cash used in investing activities | | | (96,311 | ) | | | (176,468 | ) | | | (56,358 | ) |
| Financing Activities | | | | | | | | | | | | |
| Proceeds from long-term debt | | | — | | | | — | | | | 6,774 | |
| Repayments of long-term debt | | | (1,353 | ) | | | (46,205 | ) | | | (13,353 | ) |
| Change in short-term borrowings | | | (86,957 | ) | | | 96,715 | | | | (36,603 | ) |
| Purchase of treasury stock | | | (102,572 | ) | | | (130,233 | ) | | | (108,929 | ) |
| Dividends paid | | | (60,320 | ) | | | (47,684 | ) | | | (41,013 | ) |
| Tax benefit of equity plans | | | 11,191 | | | | 10,316 | | | | 9,873 | |
| Exercise of stock options | | | 16,043 | | | | 13,691 | | | | 15,899 | |
| Net cash used in financing activities | | | (223,968 | ) | | | (103,400 | ) | | | (167,352 | ) |
| Effect of exchange rate changes on cash | | | 2,705 | | | | (27,549 | ) | | | 19,149 | |
| Increase (decrease) in cash and cash equivalents | | | (1,651 | ) | | | (47,705 | ) | | | 41,494 | |
| Cash and cash equivalents, beginning of year | | | 225,789 | | | | 273,494 | | | | 232,000 | |
| Cash and cash equivalents, end of year | | $ | 224,138 | | | $ | 225,789 | | | $ | 273,494 | |
| Supplemental Cash Flow Information | | | | | | | | | | | | |
| Cash paid during the year for: | | | | | | | | | | | | |
| Income taxes | | $ | 84,898 | | | $ | 91,915 | | | $ | 57,688 | |
| Interest | | | 13,531 | | | | 13,410 | | | | 12,852 | |
The accompanying notes are an integral part of these Consolidated Financial Statements.
Consolidated Statements of Contents
Changes in Shareholders’ Equity
Donaldson Company, Inc. and Subsidiaries
| | | | | | Additional | | | | | | Stock | | | Accumulated Other | | | | | | | |
| | | Common | | | Paid-in | | | Retained | | | Compensation | | | Comprehensive | | | Treasury | | | | |
| | | Stock | | | Capital | | | Earnings | | | Plans | | | Income (Loss) | | | Stock | | | Total | |
| | | (thousands of dollars, except per share amounts) | |
| Balance July 31, 2010 | | $ | 443,216 | | | | — | | | | 744,247 | | | | 22,326 | | | | (40,486 | ) | | | (422,670 | ) | | | 746,633 | |
| Comprehensive income | | | | | | | | | | | | | | | | | | | | | | | | | | | | |
| Net earnings | | | | | | | | | | | 225,291 | | | | | | | | | | | | | | | | 225,291 | |
| Foreign currency translation | | | | | | | | | | | | | | | | | | | 72,505 | | | | | | | | 72,505 | |
| Pension liability adjustment, net of deferred taxes | | | | | | | | | | | | | | | | | | | 7,166 | | | | | | | | 7,166 | |
| Net gain on cash flow hedging derivatives | | | | | | | | | | | | | | | | | | | 842 | | | | | | | | 842 | |
| Comprehensive income | | | | | | | | | | | | | | | | | | | | | | | | | | | 305,804 | |
| Treasury stock acquired | | | | | | | | | | | | | | | | | | | | | | | (108,929 | ) | | | (108,929 | ) |
| Stock options exercised | | | | | | | (10,792 | ) | | | (7,854 | ) | | | 1,862 | | | | | | | | 30,604 | | | | 13,820 | |
| Deferred stock and other activity | | | | | | | (1,418 | ) | | | 174 | | | | 548 | | | | | | | | 2,185 | | | | 1,489 | |
| Performance awards | | | | | | | (7 | ) | | | 7 | | | | | | | | | | | | | | | | — | |
| Stock option expense | | | | | | | | | | | 6,462 | | | | | | | | | | | | | | | | 6,462 | |
| Tax reduction - employee plans | | | | | | | 12,217 | | | | | | | | | | | | | | | | | | | | 12,217 | |
| Dividends ($0.280 per share) | | | | | | | | | | | (42,785 | ) | | | | | | | | | | | | | | | (42,785 | ) |
| Balance July 31, 2011 | | | 443,216 | | | | — | | | | 925,542 | | | | 24,736 | | | | 40,027 | | | | (498,810 | ) | | | 934,711 | |
| Comprehensive income | | | | | | | | | | | | | | | | | | | | | | | | | | | | |
| Net earnings | | | | | | | | | | | 264,301 | | | | | | | | | | | | | | | | 264,301 | |
| Foreign currency translation | | | | | | | | | | | | | | | | | | | (98,723 | ) | | | | | | | (98,723 | ) |
| Pension liability adjustment, net of deferred taxes | | | | | | | | | | | | | | | | | | | (42,520 | ) | | | | | | | (42,520 | ) |
| Net gain on cash flow hedging derivatives | | | | | | | | | | | | | | | | | | | (672 | ) | | | | | | | (672 | ) |
| Comprehensive income | | | | | | | | | | | | | | | | | | | | | | | | | | | 122,386 | |
| Treasury stock acquired | | | | | | | | | | | | | | | | | | | | | | | (130,233 | ) | | | (130,233 | ) |
| Stock options exercised | | | | | | | (9,834 | ) | | | (5,116 | ) | | | | | | | | | | | 27,698 | | | | 12,748 | |
| Deferred stock and other activity | | | | | | | (2,158 | ) | | | 312 | | | | 213 | | | | | | | | 1,926 | | | | 293 | |
| Performance awards | | | | | | | | | | | (9 | ) | | | (1 | ) | | | | | | | | | | | (10 | ) |
| Stock option expense | | | | | | | | | | | 7,800 | | | | | | | | | | | | | | | | 7,800 | |
| Tax reduction - employee plans | | | | | | | 11,992 | | | | | | | | | | | | | | | | | | | | 11,992 | |
| Two-for-one Stock split | | | 315,000 | | | | | | | | (776,369 | ) | | | | | | | | | | | 461,369 | | | | — | |
| Dividends ($0.335 per share) | | | | | | | | | | | (49,673 | ) | | | | | | | | | | | | | | | (49,673 | ) |
| Balance July 31, 2012 | | | 758,216 | | | | — | | | | 366,788 | | | | 24,948 | | | | (101,888 | ) | | | (138,050 | ) | | | 910,014 | |
| Comprehensive income | | | | | | | | | | | | | | | | | | | | | | | | | | | | |
| Net earnings | | | | | | | | | | | 247,377 | | | | | | | | | | | | | | | | 247,377 | |
| Foreign currency translation | | | | | | | | | | | | | | | | | | | 17,435 | | | | | | | | 17,435 | |
| Pension liability adjustment, net of deferred taxes | | | | | | | | | | | | | | | | | | | 46,860 | | | | | | | | 46,860 | |
| Net gain on cash flow hedging derivatives | | | | | | | | | | | | | | | | | | | 120 | | | | | | | | 120 | |
| Comprehensive income | | | | | | | | | | | | | | | | | | | | | | | | | | | 311,792 | |
| Treasury stock acquired | | | | | | | | | | | | | | | | | | | | | | | (102,572 | ) | | | (102,572 | ) |
| Stock options exercised | | | | | | | (10,836 | ) | | | (21,256 | ) | | | | | | | | | | | 44,463 | | | | 12,371 | |
| Deferred stock and other activity | | | | | | | (2,125 | ) | | | (1,677 | ) | | | (1,586 | ) | | | | | | | 4,496 | | | | (892 | ) |
| Performance awards | | | | | | | (573 | ) | | | (1,161 | ) | | | (1,617 | ) | | | | | | | 2,055 | | | | (1,296 | ) |
| Stock option expense | | | | | | | | | | | 8,300 | | | | | | | | | | | | | | | | 8,300 | |
| Tax reduction - employee plans | | | | | | | 13,534 | | | | | | | | | | | | | | | | | | | | 13,534 | |
| Dividends ($0.450 per share) | | | | | | | | | | | (66,064 | ) | | | | | | | | | | | | | | | (66,064 | ) |
| Balance July 31, 2013 | | $ | 758,216 | | | $ | — | | | $ | 532,307 | | | $ | 21,745 | | | $ | (37,473 | ) | | $ | (189,608 | ) | | $ | 1,085,187 | |
The accompanying notes are an integral part of these Consolidated Financial Statements.
NOTES TO CONSOLIDATED FINANCIAL STATEMENTS
Donaldson Company, Inc. and Subsidiaries
NOTE A Summary of Significant Accounting Policies
Description of BusinessDonaldson Company, Inc. (“Donaldson”(Donaldson or the “Company”)Company), is a worldwide manufacturer of filtration systems and replacement parts. The Company’s product mix includes air and liquid filtration systems and exhaust and emission control products. Products are manufactured at 39 plants around the world and through three3 joint ventures. Products are sold to original equipment manufacturers (“OEMs”)(OEMs), distributors, dealers, and directly to end-users.
Principles of ConsolidationThe Consolidated Financial Statements include the accounts of Donaldson Company, Inc. and all majority-owned subsidiaries. All intercompany accounts and transactions have been eliminated. The Company’s three joint ventures that are not majority-owned are accounted for under the equity method. The Company does not have any variable interests in variable interest entities as of July 31, 2011. The Company uses a fiscal period which ends on a calendar basis for international affiliates and on the Friday nearest to July 31 for U.S. purposes.2013.
Use of EstimatesThe preparation of Financial Statements in conformity with U.S. GAAPgenerally accepted accounting principles in the United States of America (U.S.) (U.S. GAAP) requires management to make estimates and assumptions that affect the amounts reported in the financial statements and accompanying notes. Actual results could differ from those estimates.
Foreign Currency TranslationFor foreign operations, local currencies are considered the functional currency. Assets and liabilities are translated to U.S. dollars at year-end exchange rates and the resulting gains and losses arising from the translation of net assets located outside the United StatesU.S. are recorded as a cumulative translation adjustment, a component of Accumulated other comprehensive income (loss) (AOCI) in the Consolidated Balance Sheets. Elements of the Consolidated Statements of Earnings are translated at average exchange rates in effect during the year. Realized and unrealized foreign currency transaction gains and losses are included in Other income, net in the Consolidated Statements of Earnings. Foreign currency transaction lossestranslation gains of $4.5 million, $4.6$0.2 million and $0.2$1.8 million, and a loss of $4.5 million are included in Other income, net in the Consolidated Statements of Earnings in Fiscal 2013, 2012, and 2011, 2010, and 2009, respectively.
Cash EquivalentsThe Company considers all highly liquid temporary investments with aan original maturity of three months or less when purchased to be cash equivalents. Cash equivalents are carried at cost that approximates market value.
Short-Term Investments Classification of the Company’s investments as current or non-current is dependent upon management’s intended holding period, the investment’s maturity date, and liquidity considerations based on market conditions. If management intends to hold the investments for longer than one year as of the balance sheet date, they are classified as non-current. The Company does not have anySee Note B for disclosures related to the Company’s short-term investments as of July 31, 2011.investments.
Accounts Receivable and Allowance for Doubtful AccountsTrade accounts receivable are recorded at the invoiced amount and do not bear interest. The allowance for doubtful accounts is the Company’s best estimate of the amount of probable credit losses in its existing accounts receivable. The Company determines the allowance based on historical write-off experience in the industry, regional economic data, and evaluation of specific Customer accounts for risk of loss. The Company reviews its allowance for doubtful accounts monthly. Past due balances over 90 days and over a specified amount are reviewed individually for collectability. All other balances are reviewed on a pooled basis by type of receivable. Account balances are charged off against the allowance when the Company feels it is probable the receivable will not be recovered. The Company does not have any off-balance-sheet credit exposure related to its Customers.
Table of Contents
InventoriesInventories are stated at the lower of cost or market. U.S. inventories are valued using the last-in, first-out (“LIFO”)(LIFO) method, while the international subsidiaries usenon-U.S. inventories are valued using the first-in, first-out (“FIFO”)(FIFO) method. Inventories valued at LIFO were approximately 33 percent and 3130 percent of total inventories at July 31, 20112013 and 2010,2012, respectively. For inventories valued under the LIFO method, the FIFO cost exceeded the LIFO carrying values by $37.1$37.8 million and $32.7$37.4 million at July 31, 20112013 and 2010,2012, respectively. Results of operations for all periods presented were not materially affected by the liquidation of LIFO inventory. As of July 31, 2011 and 2010, the Company had obsolete inventory reserves of $14.5 million and $14.9 million, respectively. The components of inventory are as follows (thousands of dollars):
| | | | | | | |
| | At July 31, | |
| | 2011 | | 2010 | |
Materials | | $ | 110,466 | | $ | 79,371 | |
Work in process | | | 33,917 | | | 23,163 | |
Finished products | | | 127,093 | | | 101,097 | |
Total inventories | | $ | 271,476 | | $ | 203,631 | |
| | | At July 31, | |
| | | 2013 | | | 2012 | |
| Raw materials | | $ | 99,814 | | | $ | 111,808 | |
| Work in process | | | 29,097 | | | | 30,767 | |
| Finished products | | | 105,909 | | | | 113,541 | |
| Total inventories | | $ | 234,820 | | | $ | 256,116 | |
Property, Plant, and EquipmentProperty, plant, and equipment are stated at cost. Additions, improvements, or major renewals are capitalized, while expenditures that do not enhance or extend the asset’s useful life are charged to operating expense as incurred. Depreciation is computed under the straight-line method. Depreciation expense was $58.8 million in Fiscal 2013, $55.3 million in Fiscal 2012, and $54.5 million in Fiscal 2011, $53.2 million in Fiscal 2010, and $52.9 million in Fiscal 2009.2011. The estimated useful lives of property, plant, and equipment are 10 to 40 years for buildings, including building improvements, and 3 to 10 years for machinery and equipment. The components of property, plant, and equipment are as follows (thousands of dollars):
| | | | | | | | |
| | At July 31, | | | At July 31, | |
| | 2011 | | 2010 | | | 2013 | | | 2012 | |
Land | | $ | 22,578 | | $ | 21,771 | | | $ | 21,116 | | | $ | 21,062 | |
Buildings | | 266,482 | | 240,787 | | | | 270,022 | | | | 258,082 | |
Machinery and equipment | | 625,439 | | 587,977 | | | | 687,797 | | | | 643,199 | |
Construction in progress | | | 31,375 | | | 26,223 | | | | 46,078 | | | | 27,276 | |
Less accumulated depreciation | | | (554,372 | ) | | (510,866 | ) | | | (605,733 | ) | | | (564,710 | ) |
Total property, plant and equipment, net | | $ | 391,502 | | $ | 365,892 | | |
| Total property, plant, and equipment, net | | | $ | 419,280 | | | $ | 384,909 | |
Internal-Use SoftwareThe Company capitalizes direct costs of materials and services used in the development and purchase of internal-use software. Amounts capitalized are amortized on a straight-line basis over a period of five years and are reported as a component of machinery and equipment within property, plant, and equipment.
Goodwill and Other Intangible AssetsGoodwill represents the excess of the purchase price over the fair value of net assets acquired in business combinations under the purchase method of accounting. Other intangible assets, consisting primarily of patents, trademarks, and Customer relationships and lists, are recorded at cost and are amortized on a straight-line basis over their estimated useful lives of 3 to 20 years. Goodwill is assessed for impairment annually or if an event occurs or circumstances change that would indicate the carrying amount may be impaired. The impairment assessment for goodwill is done at a reporting unit level. Reporting units are one level below the business segment level, but can be combined when reporting units within the same segment have similar economic characteristics. An impairment loss generally would be recognized when the carrying amount of the reporting unit’s net assets exceeds the estimated fair value of the reporting unit. The Company completed its annual impairment assessment in the third quarters of Fiscal 20112013 and 2010,2012, which indicated no impairment.
Recoverability of Long-Lived AssetsThe Company reviews its long-lived assets, including identifiable intangibles, for impairment when events or changes in circumstances indicate that the carrying amount of an asset may not be recoverable. If impairment indicators are present and the estimated future undiscounted cash flows are less than the carrying value of the assets, the carrying value is reduced. There were no significant impairment charges recorded in Fiscal 2013 or Fiscal 2012.
Income TaxesThe provision for income taxes is computed based on the pretaxpre-tax income included in the Consolidated Statements of Earnings. Deferred tax assets and liabilities are recognized for the expected future tax consequences attributed to differences between the financial statement carrying amounts of existing assets and liabilities and their respective tax basis. Deferred tax assets and liabilities are measured using the enacted tax rates expected to apply to taxable income in the years in which those temporary differences are expected to reverse.
Table of Contents
Valuation allowances are recorded to reduce deferred tax assets when it is more likely than notmore-likely-than-not that a tax benefit will not be realized.
Comprehensive Income (Loss)Comprehensive income (loss) consists of net income, foreign currency translation adjustments, net changes in the funded status of pension retirement obligations, and net gain or loss on cash flow hedging derivatives, and is presented in the Consolidated Statements of Changes in Shareholders’ Equity. The components of the ending balances of Accumulated other comprehensive income (loss)AOCI are as follows (thousands of dollars):
| | | | | | | | | | | |
| | At July 31, | | | At July 31, | |
| | 2011 | | 2010 | | 2009 | | | 2013 | | | 2012 | | | 2011 | |
Foreign currency translation adjustment | | $ | 131,699 | | $ | 59,194 | | $ | 75,155 | | | $ | 50,411 | | | $ | 32,976 | | | $ | 131,699 | |
Net gain (loss) on cash flow hedging derivatives, net of deferred taxes | | 380 | | (462 | ) | | (394 | ) | | | (172 | ) | | | (292 | ) | | | 380 | |
Pension liability adjustment, net of deferred taxes | | | (92,052 | ) | | (99,218 | ) | | (84,438 | ) | |
| Pension and postretirement liability adjustment, net of deferred taxes | | | | (87,712 | ) | | | (134,572 | ) | | | (92,052 | ) |
Total accumulated other comprehensive income (loss) | | $ | 40,027 | | $ | (40,486 | ) | $ | (9,677 | ) | | $ | (37,473 | ) | | $ | (101,888 | ) | | $ | 40,027 | |
Cumulative foreign currency translation is not adjusted for income taxes.
Earnings Per ShareThe Company’s basic net earnings per share are computed by dividing net earnings by the weighted average number of outstanding common shares. The Company’s diluted net earnings per share is computed by dividing net earnings by the weighted average number of outstanding common shares and common equivalent shares relating to stock options and stock incentive plans. Certain outstanding options were excluded from the diluted net earnings per share calculations because their exercise prices were greater than the average market price of the Company’s common stock during those periods. There were 494,34922,619 options, 845,8271,063,135 options, and 1,158,451988,698 options excluded from the diluted net earnings per share calculation for the fiscal year ended July 31, 2013, 2012, and 2011, 2010, and 2009, respectively.
The following table presents information necessary to calculate basic and diluted earnings per share:
| | | | | | | | | | | |
| | 2011 | | 2010 | | 2009 | | | 2013 | | | 2012 | | | 2011 | |
| | (thousands of dollars, except per share amounts) | | | (thousands, except per share amounts) | |
Weighted average shares - basic | | 77,196 | | 77,849 | | 77,967 | | | | 148,274 | | | | 150,286 | | | | 154,393 | |
Diluted share equivalents | | | 1,402 | | | 1,329 | | | 1,233 | | | | 2,181 | | | | 2,655 | | | | 2,804 | |
Weighted average shares - diluted | | | 78,598 | | | 79,178 | | | 79,200 | | | | 150,455 | | | | 152,941 | | | | 157,197 | |
Net earnings for basic and diluted earnings per share computation | | $ | 225,291 | | $ | 166,163 | | $ | 131,907 | | | $ | 247,377 | | | $ | 264,301 | | | $ | 225,291 | |
Net earnings per share - basic | | $ | 2.92 | | $ | 2.13 | | $ | 1.69 | | | $ | 1.67 | | | $ | 1.76 | | | $ | 1.46 | |
Net earnings per share - diluted | | $ | 2.87 | | $ | 2.10 | | $ | 1.67 | | | $ | 1.64 | | | $ | 1.73 | | | $ | 1.43 | |
On January 27, 2012, the Company announced that its Board of Directors declared a two-for-one stock split effected in the form of a 100 percent stock dividend. The stock split was distributed March 23, 2012, to stockholders of record as of March 2, 2012. Earnings and dividends per share and weighted average shares outstanding are presented in this Form 10-K after the effect of the 100 percent stock dividend. The two-for-one stock split is reflected in the share amounts in all periods presented in the table above and elsewhere in this annual Form 10-K.
Treasury StockRepurchased common stock is stated at cost and is presented as a separate reduction of shareholders’ equity.
Research and DevelopmentResearch and development costs are charged against earnings in the year incurred. Research and development expenses include basic scientific research and the application of scientific advances to the development of new and improved products and their uses.
Stock-Based CompensationThe Company offers stock-based employee compensation plans, which are more fully described in Note I.J. Stock-based employee compensation cost is recognized using the fair-value based method.
Revenue RecognitionRevenue is recognized when both all the following criteria are satisfied:(a) persuasive evidence of a sales arrangement exists; (b) price is fixed and determinable; (c) collectability is reasonably assured; and (d) delivery has occurred.At that time, product ownership and the risk of loss have transferred to the Customer and the Company has no remaining obligations. The Company records estimated discounts and rebates as a reduction of sales in the same period revenue is recognized. Shipping and handling costs for Fiscal 2013, 2012, and 2011 2010, and 2009 totaling $61.9$66.2 million, $49.8$67.0 million, and $50.4$61.9 million, respectively, are classified as a component of operatingselling, general, and administrative expenses.
Product WarrantiesThe Company provides for estimated warranty costs at the time of sale and accrues for specific items at the time their existence is known and the amounts are determinable. The Company estimates warranty costs using standard quantitative measures based on historical warranty claim experience and evaluation of specific Customer warranty issues. For a warranty reserve reconciliation see Note M.
Table of ContentsN.
Derivative Instruments and Hedging ActivitiesThe Company recognizes all derivatives on the balance sheet at fair value. Derivatives that are not designated as hedges are adjusted to fair value through income. If the derivative is designated as a hedge, depending on the nature of the hedge, changes in the fair value of derivatives are either offset against the change in fair value of the hedged assets, liabilities, or firm commitments through earnings or recognized in shareholders’ equity through other comprehensive income until the hedged item is recognized. Gains or losses related to the ineffective portion of any hedge are recognized through earnings in the current period.
Exit or Disposal ActivitiesThe Company accounts for costs relating to exit or disposal activities based on FASBthe Financial Accounting Standards Board (FASB) guidance related to exit or disposal cost obligations. This guidance addresses recognition, measurement, and reporting of costs associated with exit and disposal activities including restructuring. See Note O for disclosures related to restructuring.
GuaranteesUpon issuance of a guarantee, the Company recognizes a liability for the fair value of an obligation assumed under a guarantee. See Note LM for disclosures related to guarantees.
New Accounting Standards In December 2010,February 2013, the FASB updated the accounting guidance relating to the annual goodwill impairment test.disclosure requirements for AOCI. The updated guidance requires companies to perform the second stepdisclose amounts reclassified out of the impairment test to measure the amount of impairment loss, if any, when it is more likely thanAOCI by component. The updated guidance does not that goodwill impairment exists when the carrying amount of a reporting unit is zeroaffect how net income or negative. In considering whether it is more likely than not that goodwill impairment exists, an entity shall evaluate whether thereother comprehensive income are adverse qualitative factors.calculated or presented. The updated guidance is effective for the Company beginning in the first quarter of fiscal year 2012.Fiscal 2014. The adoption of this guidancestandard is not expected to have a material impact on the Company’s consolidated financial statements.
In May 2011,February 2013, the FASB updated the accountingissued guidance related to fair value measurements. The updated guidance results in a consistent definitionobligations resulting from joint and several liability arrangements for which the total amount of fair value and common requirements for measurement of and disclosure about fair value between U.S. GAAP and International Financial Reporting Standards (IFRS). The updatedthe obligation is fixed at the reporting date. This guidance is effective for the Company beginning in the thirdfirst quarter of fiscal year 2012.Fiscal 2015. The Company is currently evaluating the impact of adoption of this accounting guidancestandard is not expected to have a material impact on itsthe Company’s consolidated financial statements.
In June 2011, the FASB updated the disclosure requirements for comprehensive income. The updated guidance requires companies to disclose the totalNOTE B Short-Term Investments
All short-term investments are time deposits and have original maturities in excess of comprehensive income, the components of net income, and the components of other comprehensive income either in a single continuous statement of comprehensive income or in two separatethree months but consecutive statements. The updated guidance does not affect how earnings per share is calculated or presented. The updated guidance is effective for the Company beginning in the third quarter of fiscal year 2012.more than twelve months. The Company is currently evaluating the impacthad $99.8 million in short-term investments as of adoptionJuly 31, 2013 and $92.4 million as of this accounting guidance on its consolidated financial statements.July 31, 2012.
NOTE BC Goodwill and Other Intangible Assets
The Company has allocated goodwill to its Industrial Products and Engine Products segments. As of August 1, 2010, as a result of an internal reorganization, the Company transferred Industrial Hydraulics, a component of its Industrial Filtration Solutions Products within the Industrial Products segment to Aftermarket Products within the Engine Products segment, along with the goodwill associated with this component. Disposition of goodwill during Fiscal 2011 relates to the sale of the Company’s Ultracool chiller business, based in Terrassa, Spain, for $3.6 million, which resulted in a gain on sale of $0.4 million in the second quarter. The Ultracool chiller business manufactured industrial circulation chillers and was part of the Company’s Industrial Products segment. There was no acquisition or disposition activity during Fiscal 2010.2013 or 2012. The Company completed its annual impairment assessments in the third quarters of Fiscal 20112013 and 2010.2012. The results of this assessment showed that the fair values of the reporting units to which goodwill is assigned continue to exceed the book values of the respective reporting units, resulting in no goodwill impairment.
Table of Contents
Following is a reconciliation of goodwill for the years ended July 31, 20112013 and 2010:2012:
| | | | | | | | | | |
| | Engine
Products | | Industrial
Products | | Total Goodwill | |
| | (thousands of dollars) | |
Balance as of July 31, 2009 | | $ | 61,582 | | $ | 107,445 | | $ | 169,027 | |
Foreign exchange translation | | | (668 | ) | | (3,044 | ) | | (3,712 | ) |
Balance as of July 31, 2010 | | $ | 60,914 | | $ | 104,401 | | $ | 165,315 | |
Goodwill transferred | | | 11,258 | | | (11,258 | ) | | — | |
Disposition activity | | | — | | | (325 | ) | | (325 | ) |
Foreign exchange translation | | | 794 | | | 5,957 | | | 6,751 | |
Balance as of July 31, 2011 | | $ | 72,966 | | $ | 98,775 | | $ | 171,741 | |
| | | Engine | | | Industrial | | | Total | |
| | | Products | | | Products | | | Goodwill | |
| | | (thousands of dollars) | |
| Balance as of July 31, 2011 | | $ | 72,966 | | | $ | 98,775 | | | $ | 171,741 | |
| Foreign exchange translation | | | (1,219 | ) | | | (7,573 | ) | | | (8,792 | ) |
| Balance as of July 31, 2012 | | $ | 71,747 | | | $ | 91,202 | | | $ | 162,949 | |
| Foreign exchange translation | | | 574 | | | | 2,045 | | | | 2,619 | |
| Balance as of July 31, 2013 | | $ | 72,321 | | | $ | 93,247 | | | $ | 165,568 | |
Intangible assets are comprised of patents, trademarks, and Customer relationships and lists. Following is a reconciliation of intangible assets for the years ended July 31, 20112013 and 2010:2012:
| | | | | | | | | | | | Gross | | | | | | Net | |
| | Gross
Carrying
Amount | | Accumulated
Amortization | | Net
Intangible
Assets | | | Carrying | | Accumulated | | Intangible | |
| | (thousands of dollars) | | | Amount | | | Amortization | | | Assets | |
Balance as of July 31, 2009 | | $ | 85,809 | | $ | (20,423 | ) | $ | 65,386 | | |
| | | | (thousands of dollars) | |
| Balance as of July 31, 2011 | | | $ | 85,439 | | | $ | (31,943 | ) | | $ | 53,496 | |
| Amortization expense | | | | — | | | | (5,778 | ) | | | (5,778 | ) |
| Retirements | | | | (1,530 | ) | | | 1,530 | | | | — | |
| Foreign exchange translation | | | | (3,834 | ) | | | 2,316 | | | | (1,518 | ) |
| Balance as of July 31, 2012 | | | $ | 80,075 | | | $ | (33,875 | ) | | $ | 46,200 | |
Amortization expense | | — | | (6,007 | ) | | (6,007 | ) | | | — | | | | (5,503 | ) | | | (5,503 | ) |
Foreign exchange translation | | | (2,322 | ) | | 1,235 | | | (1,087 | ) | | | 1,807 | | | | (1,197 | ) | | | 610 | |
Balance as of July 31, 2010 | | $ | 83,487 | | $ | (25,195 | ) | $ | 58,292 | | |
Amortization expense | | — | | (5,917 | ) | | (5,917 | ) | |
Foreign exchange translation | | | 1,952 | | | (831 | ) | | 1,121 | | |
Balance as of July 31, 2011 | | $ | 85,439 | | $ | (31,943 | ) | $ | 53,496 | | |
| Balance as of July 31, 2013 | | | $ | 81,882 | | | $ | (40,575 | ) | | $ | 41,307 | |
Net intangible assets consist of patents, trademarks, and trade names of $20.0$13.3 million and $20.5$16.1 million as of July 31, 20112013 and 2010,2012, respectively, and Customer related intangibles of $33.5$28.0 million and $37.8$30.1 million as of July 31, 20112013 and 2010,2012, respectively. As of July 31, 2013, patents, trademarks, and trade names had a weighted average remaining life of 9.33 years and Customer related intangibles had a weighted average remaining life of 11.78 years. Expected amortization expense relating to existing intangible assets is as follows (in thousands):
| | | | | | |
Fiscal Year | | | | | | |
2012 | | $ | 5,863 | | |
2013 | | $ | 5,700 | | |
2014 | | $ | 5,327 | | | $5,167 | |
2015 | | $ | 5,221 | | | $5,072 | |
2016 | | $ | 5,206 | | | $5,070 | |
| 2017 | | | $4,924 | |
| 2018 | | | $3,555 | |
NOTE CD Credit Facilities
TheOn December 7, 2012, the Company hasentered into a new five-year, multi-currency revolving credit facility with a group of banks under which the Company may borrow up to $250$250.0 million. This facility matures on April 2, 2013. The agreement provides that loans may be made under a selection of currencies and rate formulas including Base Rate AdvancesLoans or Off ShoreLIBOR Rate Advances.Loans. The interest rate on each advance is based on certain market interest rates and leverage ratios. Facility fees and other fees on the entire loan commitment are payable over the duration of this facility. This new facility replaced the previous five-year, $250.0 million multicurrency revolving credit facility that was terminated upon entering the new facility. There was nothingwere no amounts outstanding at July 31, 2011,2013 and $50.0$80.0 million outstanding at July 31, 2010.2012 under these facilities. At July 31, 20112013 and 2010, $238.62012, $237.8 million and $180.0$159.1 million, respectively, were available for further borrowing under such facilities. The amount available for further borrowing reflects a reduction for issued standby letters of credit, as discussed below. The weighted average interest rate on these short-term borrowings outstanding at July 31, 2010 was 0.6 percent. OurCompany’s multi-currency revolving facility contains debtfinancial covenants specifically related to maintaining a certain interest coverage ratio and a certain leverage ratio as well as other covenants that, under certain circumstances, can restrict ourthe Company’s ability to incur additional indebtedness, make investments and other restricted payments, create liens, and sell assets. As of July 31, 2011,2013, the Company was in compliance with all such covenants. The Company expects to remain in compliance with these covenants.
The Company has two uncommitted credit facilities in the U.S., which provide unsecured borrowings for general corporate purposes. At July 31, 2013 and 2012, there was $50.0 million and $41.3 million available for use, respectively. There were no amounts outstanding at July 31, 2013 and $8.7 million outstanding at July 31, 2012. The weighted average interest rate on the short-term borrowings outstanding at July 31, 2012 was 1.0 percent.
The Company has a €100.0 million, or $133.0 million, program for issuing treasury notes for raising short-, medium-, and long-term financing for its European operations. There were no amounts outstanding on this program at July 31, 2013 or 2012. Additionally, the Company’s European operations have lines of Contents
credit with an available limit of €44.9 million or $59.8 million. There was nothing outstanding on these lines of credit as of July 31, 2013 or 2012.
Other international subsidiaries may borrow under various credit facilities. There was $9.2 million outstanding under these credit facilities as of July 31, 2013, and $6.4 million as of July 31, 2012. The weighted average interest rate on these short-term borrowings outstanding at July 31, 2013 and July 31, 2012, was 0.4 percent and 0.5 percent, respectively.
NOTE E Long-Term Debt
Long-term debt consists of the following:
| | | 2013 | | | 2012 | |
| | | (thousands of dollars) | |
| 6.59% Unsecured senior notes, interest payable semi-annually, principal payment of $80.0 million due November 14, 2013 | | $ | 80,000 | | | $ | 80,000 | |
| 5.48% Unsecured senior notes, interest payable semi-annually, principal payment of $50.0 million due June 1, 2017 | | | 50,000 | | | | 50,000 | |
| 5.48% Unsecured senior notes, interest payable semi-annually, principal payment of $25.0 million due September 28, 2017 | | | 25,000 | | | | 25,000 | |
| 5.48% Unsecured senior notes, interest payable semi-annually, principal payment of $25.0 million due November 30, 2017 | | | 25,000 | | | | 25,000 | |
| 2.019% Guaranteed senior note, interest payable semi-annually, principal payment of ¥1.65 billion due May 18, 2014 | | | 16,848 | | | | 21,117 | |
| Capitalized lease obligations and other, with various maturity dates and interest rates | | | 2,520 | | | | 774 | |
| Terminated interest rate swap contracts | | | 2,070 | | | | 3,938 | |
| Total | | | 201,438 | | | | 205,829 | |
| Less current maturities | | | 98,664 | | | | 2,346 | |
| Total long-term debt | | $ | 102,774 | | | $ | 203,483 | |
Annual maturities of long-term debt are $98.7 million in 2014, $1.1 million in 2015, $1.1 million in 2016, $50.5 million in 2017, and $50.0 million thereafter. Certain note agreements contain debt covenants related to working capital levels and limitations on indebtedness. As of July 31, 2011,2013, the Company was in compliance with all such covenants. The Company currently expects to remain in compliance with these covenants.
The Company has three uncommitted credit facilities in the United States, which provide unsecured borrowings for general corporate purposes. At July 31, 2011 and 2010, there was $56.9 million and $70.0 million available for use. There was $13.1 million outstanding at July 31, 2011 and nothing outstanding at July 31, 2010. The weighted average interest rate on these short-term borrowings outstanding at July 31, 2011 was 0.9 percent.
The Company has a €100 million program for issuing treasury notes for raising short, medium, and long-term financing for its European operations. There was nothing outstanding on this program at July 31, 2011 or 2010. Additionally, the Company’s European operations have lines of credit with an available limit of €45.6 million. There was nothing outstanding on these lines of credit as of July 31, 2011 or 2010.
Other international subsidiaries may borrow under various credit facilities. There was nothing outstanding under these credit facilities as of July 31, 2011 or 2010.
As discussed further in Note L, at July 31, 2011 and 2010, the Company had outstanding standby letters of credit totaling $11.4 million, upon which no amounts had been drawn. The letters of credit guarantee payment to third parties in the event the Company is in breach of specified bond financing agreement and insurance contract terms as detailed in each letter of credit.
NOTE D Long-Term Debt
Long-term debt consists of the following:
| | | | | | | |
| | 2011 | | 2010 | |
| | (thousands of dollars) | |
6.39% Unsecured senior notes due August 15, 2010, interest payable semi-annually. This note was repaid on August 16, 2010 | | $ | — | | $ | 4,999 | |
4.85% Unsecured senior notes, interest payable semi-annually, principal payment of $30.0 million due December 17, 2011 | | | 30,000 | | | 30,000 | |
6.59% Unsecured senior notes, interest payable semi-annually, principal payment of $80.0 million due November 14, 2013 | | | 80,000 | | | 80,000 | |
5.48% Unsecured senior notes, interest payable semi-annually, principal payment of $50.0 million due June 1, 2017 | | | 50,000 | | | 50,000 | |
5.48% Unsecured senior notes, interest payable semi-annually, principal payment of $25.0 million due September 28, 2017 | | | 25,000 | | | 25,000 | |
5.48% Unsecured senior notes, interest payable semi-annually, principal payment of $25.0 million due November 30, 2017 | | | 25,000 | | | 25,000 | |
1.418% Guaranteed senior notes, interest payable semi-annually, principal payment of ¥1.2 billion due January 31, 2012 | | | 15,595 | | | 13,884 | |
2.019% Guaranteed senior note, interest payable semi-annually, principal payment of ¥1.65 billion due May 18, 2014 | | | 21,442 | | | 19,091 | |
Variable Rate Industrial Development Revenue Bonds (“Low Floaters”) interest payable monthly, principal payment of $7.755 million due September 1, 2024, interest rate of 0.40% as of April 25, 2011. These bonds were repaid on April 25, 2011. | | | — | | | 7,755 | |
Capitalized lease obligations and other, with various maturity dates and interest rates | | | 796 | | | 890 | |
Terminated interest rate swap contracts | | | 5,786 | | | 5,109 | |
Total | | | 253,619 | | | 261,728 | |
Less current maturities | | | 47,871 | | | 5,536 | |
Total long-term debt | | $ | 205,748 | | $ | 256,192 | |
Table of Contents
Annual maturities of long-term debt are $46.0 million in 2012, $0.3 million in 2013, $101.5 million in 2014, and $100.0 million thereafter. There are no maturities in 2015 or 2016. As of July 31, 2011, the estimated fair value of long-term debt with fixed interest rates was $268.3 million compared to its carrying value of $247.0 million. On April 25, 2011, the Company paid off its Variable Rate Industrial Development Revenue Bond for $7.8 million.
Certain note agreements contain debt covenants related to working capital levels and limitations on indebtedness. As of July 31, 2011, the Company was in compliance with all such covenants. The Company currently expects to remain in compliance with these covenants.
NOTE EF Financial Instruments
DerivativesThe Company uses forward exchange contracts to manage its exposure to fluctuations in foreign exchange rates. The Company also uses interest rate swaps to manage its exposure to changes in the fair value of its fixed-rate debt resulting from interest rate fluctuations. It is the Company’s policy to enter into derivative transactions only to the extent true exposures exist; the Company does not enter into derivative transactions for speculative or trading purposes. The Company enters into derivative transactions only with counterparties with high credit ratings. These transactions may expose the Company to credit risk to the extent that the instruments have a positive fair value, but the Company has not experienced any material losses, nor does the Company anticipate any material losses.
The Company enters into forward exchange contracts of generally less than one year to hedge forecasted foreign currency transactions between its subsidiaries and to reduce potential exposure related to fluctuations in foreign exchange rates for existing recognized assets and liabilities. It also utilizes forward exchange contracts for anticipated intercompany and third-party transactions such as purchases, sales, and dividend payments denominated in local currencies. Forward exchange contracts are designated as cash flow hedges as they are designed to hedge the variability of cash flows associated with the underlying existing recognized or anticipated transactions. Changes in the value of derivatives designated as cash flow hedges are recorded in other comprehensive income (loss) in shareholders’ equity until earnings are affected by the variability of the underlying cash flows. At that time, the applicable amount of gain or loss from the derivative instrument that is deferred in shareholders’ equity is reclassified to earnings. The Company expects to record $0.2 million of net deferred gainslosses from these forward exchange contracts during the next twelve months. Effectiveness is measured using spot rates to value both the hedge contract and the hedged item. The excluded forward points, as well as any ineffective portions of hedges, are recorded in earnings through the same line as the underlying transaction. During Fiscal 2013, 2012, and 2011, 2010,$0.4 million, $0.4 million, and 2009, $1.1 million $0.2 million, and $0.4 million of losses, respectively, were recorded due to the exclusion of forward points from the assessment of hedge effectiveness.
The impact on Accumulated other comprehensive income (loss) (OCI)OCI and earnings from foreign exchange contracts that qualified as cash flow hedges for the twelve months ended July 31, 20112013 and 2010,2012, was as follows (thousands of dollars):
| | | | | | | | |
| | July 31, | | | July 31, | |
| | 2011 | | 2010 | | | 2013 | | | 2012 | |
Net carrying amount at beginning of year | | $ | (660 | ) | $ | (650 | ) | | $ | (373 | ) | | $ | 241 | |
Cash flow hedges deferred in OCI | | (782 | ) | | (3,789 | ) | | | 672 | | | | 2,229 | |
Cash flow hedges reclassified to income (effective portion) | | 1,963 | | 3,788 | | | | 81 | | | | (2,960 | ) |
Change in deferred taxes | | | (280 | ) | | (9 | ) | | | (196 | ) | | | 117 | |
Net carrying amount at July 31 | | $ | 241 | | $ | (660 | ) | | $ | (184 | ) | | $ | (373 | ) |
Fair Value of Financial InstrumentsAt July 31, 2011 and 2010, the Company’s financial instruments included cash and cash equivalents, accounts receivable, accounts payable, short-term borrowings, long-term debt, and derivative contracts. The fair values of cash and cash equivalents, accounts receivable, accounts payable, and short-term borrowings approximated carrying values because of the short-term nature of these instruments. Derivative contracts are reported at their fair values based on third-party quotes. As of July 31, 2011, the estimated fair value of long-term debt with fixed interest rates was $268.3 million compared to its carrying value of $247.0 million. The fair value is estimated by discounting the projected cash flows using the rate that similar amounts of debt could currently be borrowed.
Credit RiskThe Company is exposed to credit loss in the event of nonperformance by counterparties in interest rate swaps and foreign exchange forward contracts. Collateral is generally not required of the counterparties or of the Company. In the unlikely event a counterparty fails to meet the contractual terms of an interest rate swap or foreign exchange forward contract, the Company’s risk is limited to the fair value of the instrument. The Company had no interest rate swaps outstanding at July 31, 2011. There was one interest rate swap outstanding at July 31, 2010, which
Table of Contents
was subsequently terminated August 17, 2010.2013 or 2012. The Company actively monitors its exposure to credit risk through the use of credit approvals and credit limits, and by selecting major international banks and financial institutions as counterparties. The Company has not had any historical instances of non-performance by any counterparties, nor does it anticipate any future instances of non-performance.
NOTE FG Fair Value
The following summarizesFair Value of Financial InstrumentsAt July 31, 2013 and 2012, the Company’s financial instruments included cash and cash equivalents, accounts receivable, accounts payable, short-term investments, short-term borrowings, long-term debt, and derivative contracts. The fair values of cash and cash equivalents, accounts receivable, accounts payable, and short-term borrowings approximated carrying values because of the short-term nature of these instruments. Derivative contracts are reported at their fair values based on third-party quotes. As of July 31, 2013, the estimated fair value of outstanding derivatives at July 31, 2011,long-term debt with fixed interest rates was $112.3 million compared to its carrying value of $100.0 million and 2010, on the Consolidated Balance Sheets (thousandsestimated fair value of dollars):
| | | | | | | |
| | At July 31, | |
| | 2011 | | 2010 | |
Asset derivatives recorded under the caption Prepaids and other current assets Foreign exchange contracts | | $ | 945 | | $ | 807 | |
| | | | | | | |
Asset derivatives recorded under the caption Other assets Interest rate swap asset | | $ | — | | $ | 4,590 | |
| | | | | | | |
Liability derivatives recorded under the caption Other current liabilities Foreign exchange contracts | | $ | 1,470 | | $ | 2,127 | |
The Company’s derivative financial instruments present certain market and counterparty risks; however, concentration of counterparty risk is mitigated as the Company dealsshort-term debt with a variety of major banks worldwide. In addition, only conventional derivative financial instruments are utilized. The Company would not be materially impacted if any of the counterpartiesfixed interest rates was $98.2 million compared to the derivative financial instruments outstandingcarrying value of $96.8 million. The fair value is estimated by discounting the projected cash flows using the rate that similar amounts of debt could currently be borrowed, which is classified as Level 2 in the fair value hierarchy.
Derivative contracts are reported at July 31, 2011, failed to perform according to the terms of its agreement. At this time, the Company does not require collateral or any other form of securitization to be furnished by the counterparties to its derivative instruments.
their fair values based on third-party quotes.The fair values of the Company’s financial assets and financial liabilities listed below reflect the amounts that would be received to sell the assets or paid to transfer the liabilities in an orderly transaction between market participants at the measurement date (exit price). The fair values are based on inputs other than quoted prices that are observable for the asset or liability. These inputs include foreign currency exchange rates and interest rates. The financial assets and financial liabilities are primarily valued using standard calculations and models that use as their basis readily observable market parameters. Industry standard data providers are the primary source for forward and spot rate information for both interest rates and currency rates.
| | | | | | | |
| | Significant Other Observable Inputs
(Level 2)* | |
| | At July 31, | |
| | 2011 | | 2010 | |
Forward exchange contracts – net liability position | | $ | (525 | ) | $ | (1,320 | ) |
Interest rate swaps – net asset position | | | — | | | 4,590 | |
*Inputs
The following summarizes the Company’s fair value of outstanding derivatives at July 31, 2013, and 2012, on the Consolidated Balance Sheets:
| | | Significant Other Observable Inputs | |
| | | (Level 2)* | |
| | | At July 31, | |
| | | 2013 | | | 2012 | |
| | | (thousands of dollars) | |
| Asset derivatives recorded under the caption Prepaids and other current assets | | | | | | | | |
| Foreign exchange contracts | | $ | 734 | | | $ | 526 | |
| Liability derivatives recorded under the caption Other current liabilities | | | | | | | | |
| Foreign exchange contracts | | | (845 | ) | | | (1,424 | ) |
| Forward exchange contracts - net liablity position | | $ | (111 | ) | | $ | (898 | ) |
_________________
| * | Inputs to the valuation methodology of level 2 assets include quoted prices for similar assets or liabilities in active markets; quoted prices for identical or similar assets or liabilities in inactive markets; inputs other than quoted prices that are observable for the asset or liability; and inputs that are derived principally from or corroborated by observable market data by correlation or other means. |
The Company holds equity method investments which are classified in other assets in the consolidated balance sheets and held at cost. The aggregate carrying amount of these investments was $18.8 million and $20.1 million as of July 31, 2013 and 2012, respectively. These equity method investments are measured at fair value on a nonrecurring basis. The fair value of the Company’s equity method investments has not been estimated as there have been no identified events or changes in circumstance that would have had an adverse impact on the value of these investments. In the event that these investments were required to be measured, these investments would fall within Level 3 of the fair value hierarchy, due to the valuation methodologyuse of level 2significant unobservable inputs to determine fair value, as the investments are privately-held entities or divisions of public companies without quoted market prices.
Goodwill is assessed for impairment annually or more frequently if events or changes in circumstances indicate that the asset might be impaired. As there have been no events or circumstances that have had an adverse impact on the value of these assets, include quoted pricesthe Company has not been required to record an impairment and therefore these assets are not recorded at fair value. In the event that an impairment was recognized, the fair value would be classified within Level 3 of the fair value hierarchy. Refer to Note C for similarfurther discussion of the annual goodwill impairment analysis and carrying values of goodwill and other intangible assets.
The Company assesses the impairment of intangible assets and property, plant, and equipment whenever events or changes in circumstances indicate that the carrying amount of intangible assets or liabilitiesproperty, plant, and equipment assets may not be recoverable. There were no significant impairment charges recorded in active markets; quoted pricesFiscal 2013 or Fiscal 2012. Refer to Note C for identical or similar assets or liabilities in inactive markets; inputs other than quoted prices that are observable forfurther discussion of the asset or liability;annual goodwill impairment analysis and inputs that are derived principally from or corroborated by observable market data by correlation or other means.carrying values of intangible assets.
NOTE GH Employee Benefit Plans
Pension PlansThe Company and certain of its international subsidiaries have defined benefit pension plans for many of their hourly and salaried employees. There are two types of U.S. plans. The first type of U.S. plan is a traditional defined benefit pension plan primarily for production employees. The second is a plan for salaried workers that provides defined benefits pursuant to a cash balance feature whereby a participant accumulates a benefit comprised of a percentage of current salary that varies with years of service, interest credits and transition credits. The international plans generally provide pension benefits based on years of service and compensation level.
On July 31, 2013, the Company adopted a sunset freeze on its U.S. salaried pension plan. Effective August 1, 2013, there will be no new entrants into the plan. Then effective, August 1, 2016, employees hired prior to August 1, 2013 would no longer continue to accrue Company contribution credits under the plan. The accounting for this amendment is reflected in the current year balance sheet and resulted in decreased pension liabilities of $11.7 million with an offset to AOCI as of July 31, 2013 due to a freeze in previously assumed salary increases.
Table of Contents
Net periodic pension costs for the Company’s pension plans include the following components:
| | | | | | | | | | | | 2013 | | | 2012 | | | 2011 | |
| | 2011 | | 2010 | | 2009 | | | (thousands of dollars) | |
| | (thousands of dollars) | | |
Net periodic cost: | | | | | | | | |
Service cost | | $ | 16,148 | | $ | 13,184 | | $ | 15,385 | | | $ | 19,439 | | | $ | 15,464 | | | $ | 16,148 | |
Interest cost | | 19,440 | | 19,445 | | 18,481 | | | | 16,953 | | | | 19,436 | | | | 19,440 | |
Expected return on assets | | (27,538 | ) | | (28,390 | ) | | (29,143 | ) | | | (28,111 | ) | | | (28,114 | ) | | | (27,538 | ) |
Transition amount amortization | | 225 | | 226 | | 193 | | |
Prior service cost amortization | | 449 | | 293 | | 438 | | | | 591 | | | | 725 | | | | 674 | |
Actuarial loss amortization | | 3,962 | | 2,864 | | 1,088 | | | | 10,362 | | | | 5,696 | | | | 3,962 | |
Curtailment loss | | | — | | | — | | | 910 | | |
Net periodic benefit cost | | $ | 12,686 | | $ | 7,622 | | $ | 7,352 | | | $ | 19,234 | | | $ | 13,207 | | | $ | 12,686 | |
During Fiscal 2009, negotiations with one of our unions resulted in a freeze in pension benefits at one of our U.S. plants. In exchange for the freezing of the plan, participants were made eligible for a Company match in a defined contribution plan. The freeze in the plan resulted in a curtailment loss of $0.9 million during Fiscal 2009.
The obligations and funded status of the Company’s pension plans as of 20112013 and 2010,2012, is as follows:
| | | | | | | | |
| | 2011 | | 2010 | | | 2013 | | | 2012 | |
| | (thousands of dollars) | | | (thousands of dollars) | |
Change in benefit obligation: | | | | | | | | | | | | | |
Benefit obligation, beginning of year | | $ | 377,903 | | $ | 338,154 | | | $ | 461,492 | | | $ | 404,012 | |
Service cost | | 16,148 | | 13,183 | | | | 19,439 | | | | 15,464 | |
Interest cost | | 19,440 | | 19,445 | | | | 16,953 | | | | 19,436 | |
Plan amendments | | 1,639 | | — | | | | (9 | ) | | | (781 | ) |
Participant contributions | | 1,058 | | 1,043 | | | | 1,207 | | | | 1,130 | |
Actuarial loss | | 1,034 | | 31,918 | | |
| Actuarial loss/(gain) | | | | (27,176 | ) | | | 51,914 | |
Currency exchange rates | | 6,936 | | (6,531 | ) | | | 1,225 | | | | (9,689 | ) |
| Curtailment | | | | (11,692 | ) | | | — | |
Benefits paid | | | (20,146 | ) | | (19,309 | ) | | | (16,496 | ) | | | (19,994 | ) |
Benefit obligation, end of year | | $ | 404,012 | | $ | 377,903 | | | $ | 444,943 | | | $ | 461,492 | |
| | | | | | | | | | | | | |
Change in plan assets: | | | | | | | | | | | | | |
Fair value of plan assets, beginning of year | | $ | 319,734 | | $ | 297,479 | | | $ | 387,576 | | | $ | 373,555 | |
Actual return on plan assets | | 38,758 | | 31,013 | | | | 51,524 | | | | 4,442 | |
Company contributions | | 27,655 | | 15,064 | | | | 28,186 | | | | 37,915 | |
Participant contributions | | 1,058 | | 1,043 | | | | 1,207 | | | | 1,130 | |
Currency exchange rates | | 6,496 | | (5,556 | ) | | | 727 | | | | (9,472 | ) |
Benefits paid | | | (20,146 | ) | | (19,309 | ) | | | (16,496 | ) | | | (19,994 | ) |
Fair value of plan assets, end of year | | $ | 373,555 | | $ | 319,734 | | | $ | 452,724 | | | $ | 387,576 | |
| | | | | | | | | | | | | |
Funded status: | | | | | | | | | | | | | |
Underfunded status at July 31, 2011 and 2010 | | $ | (30,457 | ) | $ | (58,169 | ) | |
| Funded/(Underfunded) status at July 31, 2013 and 2012 | | | $ | 7,781 | | | $ | (73,916 | ) |
The net underfundedoverfunded status of $30.5$7.8 million at July 31, 20112013 is recognized in the accompanying Consolidated Balance Sheet as $6.4 million within Other assets for the Company’s over-funded plans and $36.9 million within Other long-term liabilities for the Company’s underfunded plans. Included in Accumulated other comprehensive lossSheet. AOCI at July 31, 2011 are the following amounts that have not yet been recognized in net periodic pension expense:2013 consists primarily of unrecognized actuarial losses, of $134.7 million, unrecognized prior service cost of $5.1 million, and unrecognized transition obligations of $3.0 million. The actuarial loss, prior service cost and unrecognized transition obligation are included in Accumulated other comprehensive loss, net of tax. The amountsloss expected to be recognized in net periodic pension expense during Fiscal 2012 are $5.8 million, $0.5 million, and $0.2 million, respectively.2014 is $8.1 million. The accumulated benefit obligation for all defined benefit pension plans was $365.2$427.8 million and $332.4$423.6 million at July 31, 20112013 and 2010,2012, respectively.
Table of Contents
The projected benefit obligation, accumulated benefit obligation and fair value of plan assets for pension plans with accumulated benefit obligations in excess of plan assets were $294.2$20.5 million, $282.3$19.7 million, and $262.4$8.4 million, respectively, as of July 31, 2011,2013, and $282.7$347.5 million, $266.0$335.1 million, and $230.3$277.5 million, respectively, as of July 31, 2010.2012.
For the years ended July 31, 20112013 and 20102012 the U.S. pension plans represented approximately 7170 percent and 7371 percent, respectively, of the Company’s total plan assets, and approximately 7271 percent and 74 percent, respectively, of the Company’s total projected benefit obligation.obligation, and approximately 75 percent and 71 percent, respectively, of the Company’s total pension expense.
The weighted-average discount ratesrate and rates of increase in future compensation levels used in determining the actuarial present value of the projected benefit obligation are as follows:
| | | | | | | | |
Weighted average actuarial assumptions | | 2011 | | 2010 | | | 2013 | | | 2012 | |
All U.S. plans: | | | | | | | | | | | | | |
Discount rate | | 4.91 | % | | 5.25 | % | | | 4.58 | % | | | 3.59 | % |
Rate of compensation increase | | 4.50 | % | | 5.00 | % | | | 2.61 | % | | | 2.61 | % |
Non - U.S. plans: | | | | | | | | | | | | | |
Discount rate | | 5.36 | % | | 5.17 | % | | | 4.04 | % | | | 4.13 | % |
Rate of compensation increase | | 3.57 | % | | 3.69 | % | | | 2.92 | % | | | 2.86 | % |
The weighted-average discount rates, expected returns on plan assets and rates of increase in future compensation levels used to determine the net periodic benefit cost are as follows:
| | | | | | | | | | | |
Weighted average actuarial assumptions | | 2011 | | 2010 | | 2009 | | | 2013 | | | 2012 | | | 2011 | |
All U.S. plans: | | | | | | | | | | | | | | | | | | | |
Discount rate | | 5.25 | % | | 6.00 | % | | 6.00 | % | | | 3.59 | % | | | 4.91 | % | | | 5.25 | % |
Expected return on plan assets | | 8.00 | % | | 8.50 | % | | 8.50 | % | | | 7.50 | % | | | 7.75 | % | | | 8.00 | % |
Rate of compensation increase | | 5.00 | % | | 5.00 | % | | 5.00 | % | | | 2.61 | % | | | 4.50 | % | | | 5.00 | % |
Non - U.S. plans: | | | | | | | | | | | | | | | | | | | |
Discount rate | | 5.17 | % | | 5.90 | % | | 6.30 | % | | | 4.13 | % | | | 5.36 | % | | | 5.17 | % |
Expected return on plan assets | | 6.17 | % | | 6.64 | % | | 7.14 | % | | | 5.20 | % | | | 6.03 | % | | | 6.17 | % |
Rate of compensation increase | | 3.69 | % | | 3.87 | % | | 4.48 | % | | | 2.86 | % | | | 3.57 | % | | | 3.69 | % |
Expected Long-Term Rate of ReturnTo develop the expected long-term rate of return on assets assumption, the Company considered the historical returns and the future expectations for returns for each asset class, as well as the target asset allocation of the pension portfolio. As of our measurement date of July 31, 2011,2013, the Company decreasedmaintained its long-term rate of return for the U.S. pension plans to 7.75 percent from 8.0 percent as of July 31, 2010. The Company believes that based on the asset mix and the target asset allocation, the 7.75 percent rate is an appropriate rate. This is slightly below the Company’s twenty year average but above the five and ten year averages. Thus, the Company will use the 7.75 percent rate for the calculation of its Fiscal 2012 net periodic cost.at 7.50 percent. The expected long-term rate of return on assets assumption for the plans outside the U.S. reflects the investment allocation and expected total portfolio returns specific to each plan and country. The expected long-term rate of return on assets shown in the pension benefit disclosure for non-U.S. plans is an asset-based weighted average of all non-U.S. plans.
Discount RateThe Company’s objective in selecting a discount rate is to select the best estimate of the rate at which the benefit obligations could be effectively settled on the measurement date, taking into account the nature and duration of the benefit obligations of the plan. In making this best estimate, the Company looks at rates of return on high-quality fixed-income investments currently available, and expected to be available, during the period to maturity of the benefits. This process includes looking at the universe of bonds available on the measurement date with a quality rating of Aa or better. Similar appropriate benchmarks are used to determine the discount rate for the non-U.S. plans. The discount rate disclosed in the assumptions used to determine net periodic benefit cost and to determine benefit obligations is based upon a weighted average, using year-end projected benefit obligations.
Table of Contents
Plan Assets The Company used the following definitions to classify pension assets into either Level 1, Level 2, or Level 3:
Level 1 – Quoted prices in active markets for identical assets or liabilities that the reporting entity has the ability to access at the measurement date.
Level 2 – Inputs other than quoted prices available in Level 1 that are observable either directly or indirectly.
Level 3 – Unobservable inputs for the asset or liability.
The fair values of the assets held by the U.S. pension plans by asset category are as follows (in millions):
| | | | Quoted Prices in | | | | | | | | |
| | | | Active Markets | | Significant | | Significant | | | | |
| | | | for Identical | | Observable | | Unobservable | | | | |
| | | | | | | | | | | | | | | Assets | | Inputs | | Inputs | | | | |
Asset Category | | Quoted Prices in
Active Markets
for Identical
Assets
(Level 1) | | Significant
Observable
Inputs
(Level 2) | | Significant
Unobservable
Inputs
(Level 3) | | Total | | | (Level 1) | | | (Level 2) | | | (Level 3) | | | Total | |
| 2013 | | | | | | | | | | | | | | | | | |
| Cash | | | $ | 18.5 | | | $ | — | | | $ | — | | | $ | 18.5 | |
| Global Equity Securities | | | | 82.5 | | | | 50.2 | | | | 19.4 | | | | 152.1 | |
| Fixed Income Securities | | | | 42.9 | | | | 20.8 | | | | 60.8 | | | | 124.5 | |
| Real Assets | | | | — | | | | — | | | | 22.1 | | | | 22.1 | |
| Total U.S. Assets at July 31, 2013 | | | $ | 143.9 | | | $ | 71.0 | | | $ | 102.3 | | | $ | 317.2 | |
| 2012 | | | | | | | | | | | | | | | | | |
| Cash | | | $ | 0.9 | | | $ | — | | | $ | — | | | $ | 0.9 | |
| Global Equity Securities | | | | 61.5 | | | | 57.3 | | | | 19.4 | | | | 138.2 | |
| Fixed Income Securities | | | | 29.2 | | | | 19.5 | | | | 55.0 | | | | 103.7 | |
| Real Assets | | | | — | | | | — | | | | 31.4 | | | | 31.4 | |
| Total U.S. Assets at July 31, 2012 | | | $ | 91.6 | | | $ | 76.8 | | | $ | 105.8 | | | $ | 274.2 | |
2011 | | | | | | | | | | | | | | | | | | | | | | | | | |
Cash | | $ | 0.3 | | $ | — | | $ | — | | $ | 0.3 | | | $ | 0.3 | | | $ | — | | | $ | — | | | $ | 0.3 | |
Global Equity Securities | | 64.8 | | 56.2 | | 0.3 | | 121.3 | | | | 64.8 | | | | 56.2 | | | | 17.9 | | | | 138.9 | |
Fixed Income Securities | | 36.6 | | — | | — | | 36.6 | | | | 36.6 | | | | 20.1 | | | | 31.4 | | | | 88.1 | |
Private Equity | | — | | — | | 17.6 | | 17.6 | | |
Absolute Return | | — | | 20.1 | | 31.4 | | 51.5 | | |
Real Assets | | | — | | | — | | | 38.0 | | | 38.0 | | | | — | | | | — | | | | 38.0 | | | | 38.0 | |
Total U.S. Assets at July 31, 2011 | | $ | 101.7 | | $ | 76.3 | | $ | 87.3 | | $ | 265.3 | | | $ | 101.7 | | | $ | 76.3 | | | $ | 87.3 | | | $ | 265.3 | |
2010 | | | | | | | | | | |
Cash | | $ | 0.9 | | $ | — | | $ | — | | $ | 0.9 | | |
Global Equity Securities | | 48.7 | | 50.2 | | 2.4 | | 101.3 | | |
Fixed Income Securities | | 17.1 | | — | | — | | 17.1 | | |
Private Equity | | — | | — | | 14.8 | | 14.8 | | |
Absolute Return | | — | | 39.4 | | 33.1 | | 72.5 | | |
Real Assets | | | — | | | 9.6 | | | 16.3 | | | 25.9 | | |
Total U.S. Assets at July 31, 2010 | | $ | 66.7 | | $ | 99.2 | | $ | 66.6 | | $ | 232.5 | | |
The 2010 information in the above table contains adjustments to the classifications within the fair value hierarchy from that reported in the prior year.
Global equityEquity consists primarily of publicly traded U.S. and non-U.S. equities, Europe, Australasia, Far East (EAFE) index funds, equity private placement funds, private equity investments, and some cash and cash equivalents. Publicly traded equities are valued at the closing price reported in the active market in which the individual securities are traded. Index funds are valued at the net asset value (NAV) as determined by the custodian of the fund. The NAV is based on the fair value of the underlying assets owned by the fund, minus its liabilities then divided by the number of units outstanding. Private equity consists of interests in partnerships that invest in U.S. and non-U.S. equity and debt securities. This may include a diversified mix of partnership interests including buyouts, restructured/distressed debt, growth equity, mezzanine/subordinated debt, real estate, special situation partnerships, and venture capital investments. Partnership interest are valued using the most recent general partner statement of fair value, updated for any subsequent partnership interests’ cash flow.
The target allocation for Global Equity investments is 60 percent. The underlying global equity investment managers within the Plan will invest primarily in equity securities spanning across market capitalization, geography, style (value, growth), and other diversifying characteristics. Managers may invest in common stocks or American Depository Receipts (ADRs), mutual funds, bank or trust company pooled funds, international stocks, stock options for hedging purposes, stock index futures, financial futures for purposes of replicating a major market index, and private equity partnerships. The Long/Short Equity managers within Global Equity may take long or short positions in equity securities and have the ability to shift exposure from net long to net short. Long/Short Equity managers made up about 15 percent of the global equity portfolio at year-end, and are considered less liquid, as the funds can be partially liquidated on a quarterly basis. Long-only managers are considered liquid. The long-only investment managers are typically valued daily, while long/short equity is valued on a monthly basis. Private equity is considered illiquid and performance is typically valued on a quarterly basis. The underlying assets, however, may be valued less frequently, such as annually, or if and when a potential buyer is identified and has submitted a bid to similar types of investments.
Fixed income consists primarily of investment and non-investment grade debt securities but may include up to 10% in high yield securities rated B or higher by Moody’s or S&P. It may also include up to 20% in securities denominated in foreign currencies.and alternative fixed income-like investments. Corporate and other bonds and notes are valued at either the yields currently available on comparable securities of issuers with similar credit ratings or valued under a discounted cash flows approach that maximizes observable inputs, such as current yields of similar instruments, but includes adjustments for certain risks that may not be observable such as credit and liquidity risks.
Private equity consists of interests in partnerships that invest in U.S. and non-U.S. debt and equity securities. The portfolio is a diversified mix of partnership interests including buyouts, distressed debt, growth equity, mezzanine, real estate, and venture capital investments. Partnership interests are valued using the most recent general partner statement of fair value, updated for any subsequent partnership interests’ cash flow.
Absolute return consists Alternative fixed income-like investments consist primarily of private partnership interests in hedge funds of funds. Partnership interests are valued using the NAV as determined by the administrator or custodian of the fund.
The target allocation for Fixed Income is 25 percent. The Fixed Income class may invest in Debt securities issued or guaranteed by the U.S., its agencies or instrumentalities (including U.S. Government Agency mortgage backed securities), or other investment grade rated debt issued by foreign governments; corporate bonds, debentures and other forms of corporate debt obligations, including equipment trust certificates; Indexed notes, floaters and other variable rate obligations; bank collective funds; mutual funds; insurance company pooled funds and guaranteed investments; futures and options for the purpose of yield curve management; and private debt investments. Fixed Income risk is driven by various factors including, but not limited to,interest rate levels and changes, credit risk, and duration. The current fixed income investment is considered liquid, with daily pricing and liquidity. The Fixed Income class may also invest in a variety of alternative investments. Alternatives cover an enormous variety of traditional and non-traditional investments and investment strategies, spanning various levels of risk and return. These investments can be made in a broad array of non-traditional investment strategies (including, but not limited to, commodities and futures, distressed securities, short/long--or both--fixed income, international opportunities, relative value) with multiple hedge fund managers. This class is considered less liquid to illiquid. The liquidity ranges from quarterly to semi-annually and illiquid. Alternative investments are typically valued on a quarterly basis.
Real Assetsassets consist of commodity funds, Real Estate Investment Trusts (REITS), and interests in partnerships that invest in private real estate, commodity, and timber investments. Private investments are valued using the most recent partnership statement of fair value, updated for any subsequent partnership interests’ cash flows. Commodity funds and REITS are valued at the closing price reported in the active market in which they are traded.it is traded.
TableThe target allocation for Real Assets is 15 percent. The Fund will invest in real assets to provide a hedge against unexpected inflation, to capture unique sources of Contentsreturns, and to provide diversification benefits. The Fund will pursue a real asset strategy through a fund of funds, private investments, and/or a direct investment program that may invest long, short, or both in assets including, but not limited to, domestic and international properties, buildings and developments, timber, and/or commodities. Real assets range from less liquid to illiquid, with about two-thirds of the real asset allocation having monthly liquidity and one-third illiquid. Real asset manager performance is typically reported quarterly, though underlying assets may be valued less frequently.
The following table sets forth a summary of changes in the fair values of the U.S. pension plans’ Level 3 assets for the years ended July 31, 20112013, 2012, and 20102011 (in millions):
| | | | | | | | | | | | | | | | | | Global Equity | | | Fixed Income | | | Real Assets | | | Total | |
| | Global
Equity | | Private
Equity | | Absolute
Return | | Real Assets | | Total | | |
Beginning balance at August 1, 2009 | | $ | 2.7 | | $ | 11.4 | | $ | 41.4 | | $ | 15.5 | | $ | 71.0 | | |
| Beginning balance at August 1, 2010 | | | $ | 17.3 | | | $ | 33.1 | | | $ | 16.2 | | | $ | 66.6 | |
Unrealized gains | | 0.1 | | 1.8 | | 2.8 | | 0.1 | | 4.8 | | | | 1.5 | | | | 2.1 | | | | 3.4 | | | | 7.0 | |
Realized gains | | — | | — | | 0.7 | | — | | 0.7 | | | | 1.0 | | | | — | | | | — | | | | 1.0 | |
Purchases, sales, issuances and settlements, net | | | (0.4 | ) | | 1.6 | | | (11.8 | ) | | 0.7 | | | (9.9 | ) | |
Ending balance at July 31, 2010 | | $ | 2.4 | | $ | 14.8 | | $ | 33.1 | | $ | 16.3 | | $ | 66.6 | | |
| Purchases | | | | 2.3 | | | | — | | | | 30.4 | | | | 32.7 | |
| Sales | | | | (4.2 | ) | | | (3.8 | ) | | | (12.0 | ) | | | (20.0 | ) |
| Ending balance at July 31, 2011 | | | $ | 17.9 | | | $ | 31.4 | | | $ | 38.0 | | | $ | 87.3 | |
Unrealized gains | | — | | 1.5 | | 2.1 | | 3.4 | | 7.0 | | | | 0.1 | | | | 0.6 | | | | (2.1 | ) | | | (1.4 | ) |
Realized gains | | — | | 1.0 | | — | | — | | 1.0 | | | | 1.5 | | | | 0.4 | | | | — | | | | 1.9 | |
Purchases, sales, issuances and settlements, net | | | (2.1 | ) | | 0.3 | | | (3.8 | ) | | 18.3 | | | 12.7 | | |
Ending balance at July 31, 2011 | | $ | 0.3 | | $ | 17.6 | | $ | 31.4 | | $ | 38.0 | | $ | 87.3 | | |
| Purchases | | | | 1.0 | | | | 17.0 | | | | 2.8 | | | | 20.8 | |
| Sales | | | | (1.1 | ) | | | (1.7 | ) | | | — | | | | (2.8 | ) |
| Net transfers into (out of) level 3 | | | | — | | | | 7.3 | | | | (7.3 | ) | | | — | |
| Ending balance at July 31, 2012 | | | $ | 19.4 | | | $ | 55.0 | | | $ | 31.4 | | | $ | 105.8 | |
| Unrealized gains | | | | (0.8 | ) | | | 6.4 | | | | 1.1 | | | | 6.7 | |
| Realized gains | | | | 1.7 | | | | 0.7 | | | | — | | | | 2.4 | |
| Purchases | | | | 2.1 | | | | — | | | | 1.0 | | | | 3.1 | |
| Sales | | | | (3.0 | ) | | | (1.3 | ) | | | (11.4 | ) | | | (15.7 | ) |
| Ending balance at July 31, 2013 | | | $ | 19.4 | | | $ | 60.8 | | | $ | 22.1 | | | $ | 102.3 | |
The following table sets forth a summary of the U.S. pension plans’ assets valued at NAV for the year ended July 31, 2013 (in millions):
| | | Fair Value | | Unfunded
Commitments | | Redemption Frequency
(If Currently Eligible) | | Redemption
Notice Period |
| Global Equity | | $ | 100.4 | | $ | 7.3 | | Daily, Quarterly, Annually | | 10 - 100 days |
| Fixed Income | | | 124.5 | | | — | | Daily, Quarterly, Semi-Annually | | 65 - 120 days |
| Real Assets | | | 22.1 | | | 9.4 | | Monthly, Quarterly | | 30 - 95 days |
| Total | | $ | 247.0 | | $ | 16.7 | | | | |
Fair values of the assets held by the international pension plans by asset category are as follows (in millions):
| | | | Quoted Prices in | | | | | | | | |
| | | | Active Markets | | Significant | | Significant | | | | |
| | | | for Identical | | Observable | | Unobservable | | | | |
| | | | | | | | | | | | | | | Assets | | Inputs | | Inputs | | | | |
Asset Category | | Quoted Prices in
Active Markets
for Identical
Assets
(Level 1) | | Significant
Observable
Inputs
(Level 2) | | Significant
Unobservable
Inputs
(Level 3) | | Total | | | (Level 1) | | | (Level 2) | | | (Level 3) | | | Total | |
| 2013 | | | | | | | | | | | | | | | | | |
| Cash | | | $ | 0.6 | | | $ | — | | | $ | — | | | $ | 0.6 | |
| Global Equity Securities | | | | 63.8 | | | | — | | | | — | | | | 63.8 | |
| Fixed Income Securities | | | | 6.9 | | | | 21.0 | | | | — | | | | 27.9 | |
| Equity/Fixed Income | | | | 16.9 | | | | — | | | | 26.3 | | | | 43.2 | |
| Total International Assets at July 31, 2013 | | | $ | 88.2 | | | $ | 21.0 | | | $ | 26.3 | | | $ | 135.5 | |
| 2012 | | | | | | | | | | | | | | | | | |
| Global Equity Securities | | | $ | 37.1 | | | $ | — | | | $ | — | | | $ | 37.1 | |
| Fixed Income Securities | | | | 5.9 | | | | 28.4 | | | | — | | | | 34.3 | |
| Equity/Fixed Income | | | | 13.3 | | | | — | | | | 21.8 | | | | 35.1 | |
| Real Assets | | | | — | | | | 6.8 | | | | — | | | | 6.8 | |
| Total International Assets at July 31, 2012 | | | $ | 56.3 | | | $ | 35.2 | | | $ | 21.8 | | | $ | 113.3 | |
2011 | | | | | | | | | | | | | | | | | | | | | | | | | |
Global Equity Securities | | $ | 33.5 | | $ | — | | $ | — | | $ | 33.5 | | | $ | 33.5 | | | $ | — | | | $ | — | | | $ | 33.5 | |
Fixed Income Securities | | — | | 26.5 | | — | | 26.5 | | | | — | | | | 26.5 | | | | — | | | | 26.5 | |
Equity/Fixed Income | | 15.4 | | — | | 26.3 | | 41.7 | | | | 15.4 | | | | — | | | | 26.3 | | | | 41.7 | |
Real Assets | | | — | | | 6.5 | | | — | | | 6.5 | | | | — | | | | 6.5 | | | | — | | | | 6.5 | |
Total International Assets at July 31, 2011 | | $ | 48.9 | | $ | 33.0 | | $ | 26.3 | | $ | 108.2 | | | $ | 48.9 | | | $ | 33.0 | | | $ | 26.3 | | | $ | 108.2 | |
2010 | | | | | | | | | | |
Global Equity Securities | | $ | 26.8 | | $ | — | | $ | — | | $ | 26.8 | | |
Fixed Income Securities | | — | | 20.7 | | — | | 20.7 | | |
Equity/Fixed Income | | 12.5 | | — | | 21.7 | | 34.2 | | |
Real Assets | | | — | | | 5.5 | | | — | | | 5.5 | | |
Total International Assets at July 31, 2010 | | $ | 39.3 | | $ | 26.2 | | $ | 21.7 | | $ | 87.2 | | |
Global equity consists of diversified growth funds invested across a fixed weights indexbroad range of traditional and alternative asset classes which may include but are not limited to equities, investment grade and high yield bonds, property, private equity, infrastructure, commodities and currencies. They may invest directly or hold up to 100 percent of the fund used to maintain a fixed 50/50 distribution between UKin other collective investment vehicles and overseas assets. Publiclymay use exchange traded equities are valued atand over the closing price reported in the active market in which the individual securities are traded.counter financial derivatives, such as currency forwards or futures, for both investment as well as hedging purposes.
Fixed income consists primarily of corporate bond funds with the investment objective to achieve active corporate bond returns which are inflation linked and paid as a single payment in 2055.grade debt securities. Corporate bonds and notes are valued at either the closing price reported if traded on an active market or at yields currently available on comparable securities of issuers with similar credit ratings or valued under a discounted cash flows approach that maximizes observable inputs, such as current yields of similar instruments, but includes adjustments for certain risks that may not be observable such as credit and liquidity risks. These funds may also aim to provide liability hedging by offering interest rate and inflation protections which replicates the liability profile of a typical defined benefit pension scheme.
Equity/Fixed Income consists of Level 1 assets that are part of a unit linked fund with a strategic asset allocation of 40%40 percent fixed income products and 60%60 percent equity type products. Assets are valued at either the closing price reported if traded on an active market or at yields currently available on comparable securities of issuers with similar credit ratings. Index funds are valued at the net asset value as determined by the custodian of the fund. The Level 3 assets are composed of mathematical reserves on individual contracts and the Company does not have any influence on the investment decisions as made by the insurer due to the specific minimum guaranteed return characteristics of this type of contract. European insurers in general, broadly have a strategic asset allocation with 80%-90%80 percent to 90 percent fixed income products and 20%-10%20 percent to 10 percent equity type products (including real estate).
Table of Contents
Real Assets consists of property funds. Property funds are valued using the most recent partnership statement of fair value, updated for any subsequent partnership interests’ cash flows.
The following table sets forth a summary of changes in the fair values of the International pension plans’ Level 3 assets for the years ended July 31, 2013, 2012, and 2011 (in millions):
| | | Equity/Fixed | |
| | | Income | |
| Beginning balance at August 1, 2010 | | $ | 21.7 | |
| Unrealized gains | | | 0.9 | |
| Foreign currency exchange | | | 2.5 | |
| Purchases | | | 6.2 | |
| Sales | | | (5.0 | ) |
| Ending balance at July 31, 2011 | | $ | 26.3 | |
| Unrealized gains | | | 1.4 | |
| Foreign currency exchange | | | (3.8 | ) |
| Purchases | | | 2.6 | |
| Sales | | | (4.6 | ) |
| Net transfers into (out of) Level 3 | | | (0.1 | ) |
| Ending balance at July 31, 2012 | | $ | 21.8 | |
| Unrealized gains | | | 1.1 | |
| Foreign currency exchange | | | 1.7 | |
| Purchases | | | 2.6 | |
| Sales | | | (0.9 | ) |
| Net transfers into (out of) Level 3 | | | — | |
| Ending balance at July 31, 2013 | | $ | 26.3 | |
The following table sets forth a summary of the International pension plans’ assets valued at NAV for the year ended July 31, 2011 and 20102013 (in millions):
| | | | |
| | Equity/Fixed
Income | |
Beginning balance at August 1, 2009 | | $ | 23.1 | |
Unrealized gains | | | 0.3 | |
Foreign currency exchange | | | (1.9 | ) |
Purchases, sales, issuances and settlements, net | | | 0.2 | |
Ending balance at July 31, 2010 | | $ | 21.7 | |
Unrealized gains | | | 0.9 | |
Foreign currency exchange | | | 2.5 | |
Purchases, sales, issuances and settlements, net | | | 1.2 | |
Ending balance at July 31, 2011 | | $ | 26.3 | |
| | Fair Value | | Unfunded
Commitments |
Commitments Redemption Frequency
(If Currently Eligible) | Redemption
Notice Period |
| Fixed Income | | $ | 13.8 | | $ | — | Weekly | N/A |
| Equity/Fixed Income | | | 32.6 | | | — | Daily, Yearly | 90 days |
| Total | | $ | 46.4 | | $ | — | | |
Investment Policies and Strategies.For the Company’s U.S. plans, the Company uses a total return investment approach to achieve a long-term return on plan assets, with what the Company believes to be a prudent level of risk for the purpose of meeting its retirement income commitments to employees. The plan’splans’ investments are diversified to assist in managing risk. The Company’s asset allocation guidelines target an allocation of 4560 percent global equity securities, 3025 percent alternative investments (funds of hedge funds), 10fixed income and 15 percent real assets (investments into funds containing commodities and real estate), 10 percent fixed income, and 5 percent private equity. Within equity securities, the Company will target an allocation of 15 percent international, 15 percent equity long/short, 10 percent small cap and 5 percent large cap.. These target allocation guidelines are determined in consultation with the Company’s investment consultant, and through the use of modeling the risk/return trade-offs among asset classes utilizing assumptions about expected annual return, expected volatility/standard deviation of returns, and expected correlations with other asset classes.
For the Company’s non-U.S. plans, the general investment objectives are to maintain a suitably diversified portfolio of secure assets of appropriate liquidity which will generate income and capital growth to meet, together with any new contributions from members and the Company, the cost of current and future benefits. Investment policy and performance is measured and monitored on an ongoing basis by the Company’s investment committee through its use of an investment consultant and through quarterly investment portfolio reviews.
Estimated Contributions and Future PaymentsThe Company’s general funding policy for its pension plans is to make at least the minimum contributions as required by applicable regulations. Additionally, theThe Company may elect to make additional contributions up to the maximum tax deductible contribution. As such, the Company made contributions of $20.6$21.5 million to its U.S. pension plans in Fiscal 2011. There is no2013. The minimum funding requestrequirement for the Company’s U.S. pension plans for Fiscal 2012. The2014 is $7.9 million. Per the Pension Protection Act of 2006, this obligation could be met with existing credit balances that resulted from payments above the minimum obligation in prior years. As such, the Company is currently evaluating whether ordoes not anticipate making a contribution in Fiscal 2014 to its U.S. pension contribution will be made in Fiscal 2012.plans. The Company made contributions of $7.1$6.7 million to its non-U.S. pension plans in Fiscal 20112013 and estimates that it will contribute approximately $4.7$5.6 million in Fiscal 20122014 based upon the local government prescribed funding requirements. Future estimates of the Company’s pension plan contributions may change significantly depending on the actual rate of return on plan assets, discount rates, and regulatory requirements.
Estimated future benefit payments for the Company’s U.S. and non-U.S. plans are as follows (thousands of dollars):
| | | | | |
Fiscal Year | | | | | | |
2012 | | $ | 25,769 | | |
2013 | | $ | 23,314 | | |
2014 | | $ | 25,648 | | | $ 23,305 | |
2015 | | $ | 26,242 | | | $ 20,622 | |
2016 | | $ | 25,323 | | | $ 23,447 | |
2017-2021 | | $ | 148,290 | | |
| 2017 | | | $ 28,181 | |
| 2018 | | | $ 25,624 | |
| 2019-2023 | | | $137,068 | |
Table of Contents
Postemployment and Postretirement Benefit PlansThe Company provides certain postemployment and postretirement health care benefits for certain U.S. employees for a limited time after termination of employment. The Company has recorded a liability for its postretirement benefit plan in the amount of $1.5$1.3 million and $1.6$1.5 million as of July 31, 20112013 and July 31, 2010,2012, respectively. The annual cost resulting from these benefits is not material. For measurement purposes, a 7.47.2 percent annual rate of increase in the per capita cost of covered health care benefits was assumed for Fiscal 2011.2013. The Company has assumed that the long-term rate of increase will decrease gradually to an ultimate annual rate of 4.5 percent. A one-percentage point increase in the health care cost trend rate would increase the Fiscal 20112013 and 20102012 liability by $0.1 million.
Retirement Savings and Employee Stock Ownership PlanThe Company provides a contributory employee savings plan to U.S. employees that permits participants to make contributions by salary reduction pursuant to section 401(k) of the Internal Revenue Code. Employee contributions of up to 25 percent of compensation are matched at a rate equaling 100 percent of the first 3 percent contributed and 50 percent of the next 2 percent contributed. The Company’s contributions under this plan are based on the level of employee contributions as well as a discretionary contribution based on performance of the Company.contributions. Total contribution expense for these plans was $9.1$7.3 million, $4.5$5.5 million, and $5.1$9.1 million for the years ended July 31, 2011, 2010,2013, 2012, and 2009,2011, respectively. This plan also includes shares from an Employee Stock Ownership Plan (“ESOP”)(ESOP). As of July 31, 2011,2013, all shares of the ESOP have been allocated to participants. Total ESOP shares are considered to be shares outstanding for earnings per share calculations. In July 2013, the Company announced that Employees hired on or after August 1, 2013 will be eligible for a 3 percent annual Company retirement contribution in addition to the Company’s 401(k) match. Effective August 1, 2016, Employees hired prior to August 1, 2013 will be eligible for the 3 percent annual Company retirement contribution.
Deferred Compensation and Other Benefit PlansThe Company provides various deferred compensation and other benefit plans to certain executives. The deferred compensation plan allows these employees to defer the receipt of all of their bonus and other stock related compensation and up to 75 percent of their salary to future periods. Other benefit plans are provided to supplement the benefits for a select group of highly compensated individuals which are reduced because of compensation limitations set by the Internal Revenue Code. The Company has recorded a liability in the amount of $9.2$9.5 million and $8.8 million asfor both of the yearyears ended July 31, 20112013 and July 31, 2010, respectively,2012, related primarily to its deferred compensation plans.
NOTE HI Shareholders’ Equity
Stock RightsOn January 27, 2006, the Board of Directors of the Company approved the extension of the benefits afforded by the Company’s existing rights plan by adopting a new shareholder rights plan. Pursuant to the Rights Agreement, dated as of January 27, 2006 by and between the Company and Wells Fargo Bank, N.A., as Rights Agent, one right was issued on March 3, 2006 for each outstanding share of common stock of the Company upon the expiration of the Company’s existing rights. Each of the new rights entitles the registered holder to purchase from the Company one one-thousandth of a share of Series A Junior Participating Preferred Stock, without par value, at a price of $143.00 per one one-thousandth of a share. The rights, however, will not become exercisable unless and until, among other things, any person acquires 15 percent or more of the outstanding common stock of the Company. If a person acquires 15 percent or more of the outstanding common stock of the Company (subject to certain conditions and exceptions more fully described in the Rights Agreement), each right will entitle the holder (other than the person who acquired 15 percent or more of the outstanding common stock) to purchase common stock of the Company having a market value equal to twice the exercise price of a right. The rights are redeemable under certain circumstances at $.001 per right and will expire, unless earlier redeemed, on March 2, 2016.
Stock Compensation PlansThe Stock Compensation Plans in the Consolidated Statements of Changes in Shareholders’ Equity consist of the balance of amounts payable to eligible participants for stock compensation that was deferred to a Rabbi Trust pursuant to the provisions of the 2010 Master Stock Incentive Plan, as well as performance awards payable in common stock discussed further in Note I.
Table of ContentsJ.
Treasury StockThe Company believes that the share repurchase program is a way of providing return to its shareholders. The Board of Directors authorized the repurchase, at the Company’s discretion, of up to 8.016.0 million shares of common stock under the stock repurchase plan dated March 26, 2010. As of July 31, 2011,2013, the Company had remaining authorization to repurchase 5.02.6 million shares under this plan. Following is a summary of treasury stock share activity for Fiscal 20112013 and 2010:2012:
| | | | | | | | | 2013 | | | 2012 | |
| | 2011 | | 2010 | | |
Balance at beginning of year | | 12,222,381 | | 11,295,409 | | |
| Beginning balance at August 1, 2012 | | | | 3,980,832 | | | | 13,245,864 | |
Stock repurchases | | 1,956,648 | | 1,651,600 | | | | 2,986,794 | | | | 4,503,587 | |
Net issuance upon exercise of stock options | | (862,981 | ) | | (667,991 | ) | | | (1,288,560 | ) | | | (1,270,526 | ) |
Issuance under compensation plans | | (62,304 | ) | | (46,197 | ) | | | (174,408 | ) | | | (89,528 | ) |
Other activity | | | (7,880 | ) | | (10,440 | ) | |
Balance at end of year | | | 13,245,864 | | | 12,222,381 | | |
| Stock split and other activity | | | | (13,933 | ) | | | (12,408,565 | ) |
| Ending balance at July 31, 2013 | | | | 5,490,725 | | | | 3,980,832 | |
The Company initiated the purchase of an additional 162,900 shares for $9.2 million in July 2011 that are not included in Fiscal 2011 repurchases as the transactions did not settle until after fiscal year end. These repurchases will be included in Fiscal 2012 activity.
NOTE IJ Stock Option Plans
Employee Incentive PlansIn November 2010 shareholders approved the 2010 Master Stock Incentive Plan (the “Plan”)Plan) that replaced the 2001 Plan that was scheduled to expire on December 31, 2010 and provided for similar awards. The Plan extends through September 2020 and allows for the granting of nonqualified stock options, incentive stock options, restricted stock, restricted stock units, stock appreciation rights (“SAR”)(SAR), dividend equivalents, and other stock-based awards. Options under the Plan are granted to key employees at market price at the date of grant. Options are generally exercisable for up to 10 years from the date of grant. The Plan also allows for the granting of performance awards to a limited number of key executives. As administered by the Human Resources Committee of the Company’s Board of Directors to date, these performance awards are payable in common stock and are based on a formula which measures performance of the Company over a three-year period. Performance award expense under these plans totaled $0.1 million in Fiscal 2013, $1.9 million in Fiscal 2012, and $1.8 million in Fiscal 2011 and $0.5 million in Fiscal 2010. The Company recorded a net reversal of performance award expense in Fiscal 2009 of $3.1 million due to the reversal of $3.6 million of Long-Term Compensation Plan expense recognized in prior periods based upon actual and forecasted results.2011.
Stock options issued fromafter Fiscal 2001 to Fiscal 20112002 become exercisable for non-executives in equal increments over three years. Stock options issued inafter Fiscal 20112010 become exercisable for executives in equal increments over three years. Stock options issued from Fiscal 20012003 to Fiscal 2010 became exercisable for most executives immediately upon the date of grant. Certain other stock options issued to executives during Fiscal 2004, 2006, and 2007 became exercisable in equal increments over three years. For Fiscal 2011,2013, the Company recorded pretaxpre-tax compensation expense associated with stock options of $6.5$8.3 million and recorded $2.4$2.7 million of related tax benefit. For Fiscal 20102012 and 2009,2011, the Company recorded pretaxpre-tax compensation expense associated with stock options of $6.9$7.8 million and $4.1$6.5 million, respectively, and $2.5 million and $1.5$2.1 million, respectively, of related tax benefit.
Stock-based employee compensation cost is recognized using the fair-value based method. The Company determined the fair value of these awards using the Black-Scholes option pricing model, with the following weighted average assumptions:
| | | | | | | | | | | |
| | 2011 | | 2010 | | 2009 | | 2013 | | 2012 | | 2011 |
Risk - free interest rate | | <0.12 - 3.1 | % | | < 0.01 - 3.9 | % | | 1.4 - 4.0 | % | <0.03 - 1.7% | | <0.11 - 1.8% | | <0.12 - 3.1% |
Expected volatility | | 25.5 - 34.7 | % | | 24.4 - 32.3 | % | | 21.6 - 25.5 | % | 22.5 - 29.7% | | 25.8 - 31.9% | | 25.5 - 34.7% |
Expected dividend yield | | 1.0 | % | | 1.0 | % | | 1.0 | % | 1.0 - 1.4% | | 1.0% | | 1.0% |
| | | | | | | | |
Expected life | | | | | | | | |
Director original grants without reloads | | 8 years | | 8 years | | 8 years | | 8 years | | 8 years | | 8 years |
Non - officer original grants | | 8 years | | 7 - 8 years | | 7 years | | 7 years | | 7 years | | 8 years |
Officer original grants with reloads | | — | | 4 years | | 4 years | | |
Reload grants | | <8 years | | <8 years | | <5 years | | <5 years | | <8 years | | <8 years |
Officer original grants without reloads | | 8 years | | 8 years | | 7 years | | 8 years | | 8 years | | 8 years |
Table of ContentsBlack-Scholes is a widely accepted stock option pricing model. The weighted average fair value for options granted during Fiscal 2013, 2012, and 2011 is $8.18, $9.37, and $8.63 per share, respectively, using the Black-Scholes pricing model.
Reload grants are grants made to officers or directors who exercised a reloadable option during the fiscal year and made payment of the purchase price using shares of previously owned Company stock. The reload grant is for the number of shares equal to the shares used in payment of the purchase price and/or withheld for minimum tax withholding. Beginning in Fiscal 2011, options no longer have a reload provision for officersOfficers and directors.Directors.
Black-Scholes is a widely accepted stock option pricing model; however, the ultimate value of stock options granted will be determined by the actual lives of options granted and the actual future price levels of the Company’s common stock. The weighted average fair value for options granted during Fiscal 2011, 2010, and 2009 is $17.26, $13.23, and $8.56 per share, respectively, using the Black-Scholes pricing model.
The following table summarizes stock option activity:
| | | | | | | |
| | Options
Outstanding | | Weighted
Average Exercise
Price | |
Outstanding at July 31, 2008 | | | 5,181,778 | | $ | 25.62 | |
Granted | | | 366,588 | | | 34.23 | |
Exercised | | | (505,363 | ) | | 17.64 | |
Canceled | | | (44,878 | ) | | 39.04 | |
Outstanding at July 31, 2009 | | | 4,998,125 | | | 26.94 | |
Granted | | | 643,974 | | | 42.41 | |
Exercised | | | (848,990 | ) | | 20.84 | |
Canceled | | | (21,297 | ) | | 41.94 | |
Outstanding at July 31, 2010 | | | 4,771,812 | | | 30.04 | |
Granted | | | 551,601 | | | 57.22 | |
Exercised | | | (1,121,751 | ) | | 23.10 | |
Canceled | | | (7,665 | ) | | 47.20 | |
Outstanding at July 31, 2011 | | | 4,193,997 | | | 35.44 | |
| | | | | | | Weighted | |
| | | | Options | | | Average Exercise | |
| | | | Outstanding | | | Price | |
| | Outstanding at July 31, 2010 | | | | 9,543,624 | | | $ | 15.02 | |
| | Granted | | | | 1,103,202 | | | | 28.61 | |
| | Exercised | | | | (2,243,502 | ) | | | 11.55 | |
| | Canceled | | | | (15,330 | ) | | | 23.60 | |
| | Outstanding at July 31, 2011 | | | | 8,387,994 | | | | 17.72 | |
| | Granted | | | | 1,082,979 | | | | 34.76 | |
| | Exercised | | | | (1,379,827 | ) | | | 11.90 | |
| | Canceled | | | | (34,819 | ) | | | 27.45 | |
| | Outstanding at July 31, 2012 | | | | 8,056,327 | | | | 20.97 | |
| | Granted | | | | 965,050 | | | | 33.91 | |
| | Exercised | | | | (1,607,081 | ) | | | 14.79 | |
| | Canceled | | | | (84,476 | ) | | | 33.94 | |
| | Outstanding at July 31, 2013 | | | | 7,329,820 | | | | 23.88 | |
The total intrinsic value of options exercised during Fiscal 2013, 2012, and 2011 2010,was $33.7 million, $29.5 million, and 2009 was $34.2 million, $19.5 million, and $9.1 million, respectively.
Shares reserved at July 31, 20112013 for outstanding options and future grants were 8,307,431.13,656,154. Shares reserved consist of shares available for grant plus all outstanding options. Upon shareholder approval of the 2010 Master Stock Incentive Plan, 4,600,000 shares were added to shares reserved. Remaining shares available for grant under the 2001 plan were removed from the shares reserved calculation.
The following table summarizes information concerning outstanding and exercisable options as of July 31, 2011:2013:
| | | | | | | | | | | | | | | | |
Range of Exercise Prices | | Number
Outstanding | | Weighted
Average
Remaining
Contractual
Life (Years) | | Weighted
Average
Exercise
Price | | Number
Exercisable | | Weighted
Average
Exercise
Price | |
$12 to $22 | | | 658,066 | | | 1.19 | | $ | 17.89 | | | 658,066 | | $ | 17.89 | |
$22 to $32 | | | 1,102,423 | | | 2.94 | | | 30.12 | | | 1,086,511 | | | 30.09 | |
$32 to $42 | | | 1,121,686 | | | 5.67 | | | 34.95 | | | 1,101,164 | | | 34.96 | |
$42 and above | | | 1,311,822 | | | 8.23 | | | 49.15 | | | 655,381 | | | 44.34 | |
| | | 4,193,997 | | | 5.05 | | | 35.44 | | | 3,501,122 | | | 32.00 | |
| | | | | | Weighted | | | | | | | | | | |
| | | | | | Average | | | Weighted | | | | | | Weighted | |
| | | | | | Remaining | | | Average | | | | | | Average | |
| | | Number | | | Contractual | | | Exercise | | | Number | | | Exercise | |
| Range of Exercise Prices | | Outstanding | | | Life (Years) | | | Price | | | Exercisable | | | Price | |
| $0.00 to $15.89 | | | 1,156,373 | | | | 1.26 | | | $ | 15.29 | | | | 1,156,373 | | | $ | 15.29 | |
| $15.90 to $20.89 | | | 1,935,678 | | | | 3.79 | | | | 17.44 | | | | 1,935,678 | | | | 17.44 | |
| $20.90 to $25.89 | | | 1,375,689 | | | | 5.73 | | | | 21.79 | | | | 1,375,689 | | | | 21.79 | |
| $25.90 to $30.89 | | | 909,199 | | | | 7.36 | | | | 29.15 | | | | 599,727 | | | | 29.16 | |
| $30.90 and above | | | 1,952,881 | | | | 8.36 | | | | 34.35 | | | | 456,550 | | | | 34.88 | |
| | | | 7,329,820 | | | | 5.42 | | | | 23.88 | | | | 5,524,017 | | | | 20.79 | |
At July 31, 2011,2013, the aggregate intrinsic value of shares outstanding and exercisable was $85.0$90.7 million and $81.9$85.4 million, respectively.
Table of Contents
The following table summarizes the status of options which contain vesting provisions:
| | | | | | | |
| | Options | | Weighted
Average Grant
Date Fair
Value | |
Non - vested at July 31, 2010 | | | 407,453 | | $ | 12.89 | |
Granted | | | 482,250 | | | 18.45 | |
Vested | | | (189,913 | ) | | 12.27 | |
Canceled | | | (6,915 | ) | | 15.42 | |
Non - vested at July 31, 2011 | | | 692,875 | | | 16.90 | |
| | | | | | | Weighted | |
| | | | | | | Average Grant | |
| | | | | | | Date Fair | |
| | | | Options | | | Value | |
| | Non - vested at July 31, 2012 | | | | 1,805,397 | | | $ | 9.22 | |
| | Granted | | | | 850,500 | | | | 8.80 | |
| | Vested | | | | (822,350 | ) | | | 8.90 | |
| | Canceled | | | | (27,744 | ) | | | 8.98 | |
| | Non - vested at July 31, 2013 | | | | 1,805,803 | | | | 9.18 | |
The total fair value of shares vested during Fiscal 2013, 2012, and 2011 2010,was $29.8 million, $19.5 million, and 2009 was $10.5 million, $8.0 million, and $7.9 million, respectively.
As of July 31, 2011,2013, there was $6.1$7.5 million of total unrecognized compensation cost related to non-vested stock options granted under the Plan. This unvested cost is expected to be recognized during Fiscal 2012,2014, Fiscal 2013,2015, and Fiscal 2014.2016.
NOTE JK Income Taxes
The components of earnings before income taxes are as follows:
| | | | | | | | | | | |
| | 2011 | | 2010 | | 2009 | | | 2013 | | | 2012 | | | 2011 | |
| | (thousands of dollars) | | | (thousands of dollars) | |
Earnings before income taxes: | | | | | | | | | | | | | | | | | | | |
United States | | $ | 117,562 | | $ | 85,987 | | $ | 69,863 | | | $ | 147,317 | | | $ | 171,101 | | | $ | 117,562 | |
Foreign | | | 194,701 | | | 144,189 | | | 91,562 | | | | 200,864 | | | | 199,679 | | | | 194,701 | |
Total | | $ | 312,263 | | $ | 230,176 | | $ | 161,425 | | | $ | 348,181 | | | $ | 370,780 | | | $ | 312,263 | |
The components of the provision for income taxes are as follows:
| | | | | | | | | | | |
| | 2011 | | 2010 | | 2009 | | | 2013 | | | 2012 | | | 2011 | |
| | (thousands of dollars) | | | (thousands of dollars) | |
Income taxes: | | | | | | | | | | | | | | | | | | | |
Current | | | | | | | | | | | | | | | | | | | |
Federal | | $ | 26,675 | | $ | 25,455 | | $ | 18,624 | | | $ | 35,820 | | | $ | 45,468 | | | $ | 26,675 | |
State | | 3,555 | | 2,206 | | 2,444 | | | | 4,337 | | | | 4,012 | | | | 3,555 | |
Foreign | | | 54,785 | | | 33,327 | | | 13,176 | | | | 52,300 | | | | 50,655 | | | | 54,785 | |
| | | 85,015 | | | 60,988 | | | 34,244 | | | | 92,457 | | | | 100,351 | | | | 85,015 | |
Deferred | | | | | | | | | | | | | | | | | | | |
Federal | | 8,556 | | 3,860 | | (3,888 | ) | | | 7,071 | | | | 7,391 | | | | 8,556 | |
State | | 191 | | 20 | | 90 | | | | 312 | | | | 722 | | | | 191 | |
Foreign | | | (6,790 | ) | | (855 | ) | | (928 | ) | | | 964 | | | | (1,769 | ) | | | (6,790 | ) |
| | | 1,957 | | | 3,025 | | | (4,726 | ) | | | 8,347 | | | | 6,344 | | | | 1,957 | |
Total | | $ | 86,972 | | $ | 64,013 | | $ | 29,518 | | | $ | 100,804 | | | $ | 106,479 | | | $ | 86,972 | |
Table of Contents
The following table reconciles the U.S. statutory income tax rate with the effective income tax rate:
| | | | | | | | | | | |
| | 2011 | | 2010 | | 2009 | | | 2013 | | | 2012 | | | 2011 | |
Statutory U.S. federal rate | | 35.0 | % | | 35.0 | % | | 35.0 | % | | | 35.0 | % | | | 35.0 | % | | | 35.0 | % |
State income taxes | | 1.0 | | 0.8 | | 1.3 | | | | 1.2 | % | | | 1.2 | % | | | 1.0 | % |
Foreign taxes at lower rates | | (6.6 | ) | | (8.2 | ) | | (7.5 | ) | | | (6.1 | )% | | | (6.0 | )% | | | (6.6 | )% |
Export, manufacturing and research credits | | (1.6 | ) | | (0.9 | ) | | (0.5 | ) | |
| Export, manufacturing, and research credits | | | | (1.5 | )% | | | (1.0 | )% | | | (1.6 | )% |
U.S. tax impact on repatriation of earnings | | (0.3 | ) | | 0.1 | | 0.7 | | | | (0.2 | )% | | | 0.8 | % | | | (0.3 | )% |
Change in unrecognized tax benefits | | 0.1 | | 1.2 | | (10.6 | ) | | | 0.5 | % | | | (1.0 | )% | | | 0.1 | % |
Other | | | 0.3 | | | (0.2 | ) | | (0.1 | ) | | | 0.1 | % | | | (0.3 | )% | | | 0.3 | % |
| | | 27.9 | % | | 27.8 | % | | 18.3 | % | | | 29.0 | % | | | 28.7 | % | | | 27.9 | % |
The tax effects of temporary differences that give rise to deferred tax assets and liabilities are as follows:
| | | | | | | | |
| | 2011 | | 2010 | | | 2013 | | | 2012 | |
| | (thousands of dollars) | | | (thousands of dollars) | |
Deferred tax assets: | | | | | | | | | | | | | |
Accrued expenses | | $ | 12,243 | | $ | 9,130 | | | $ | 11,580 | | | $ | 10,666 | |
Compensation and retirement plans | | 33,298 | | 39,438 | | | | 23,578 | | | | 52,986 | |
Tax credit and NOL carryforwards | | 1,173 | | 954 | | |
Inventory reserves | | 9,545 | | 8,324 | | |
| NOL carryforwards | | | | 3,279 | | | | 3,146 | |
| LIFO and inventory reserves | | | | 5,037 | | | | 2,796 | |
Other | | | 3,311 | | | 1,846 | | | | 3,890 | | | | 3,697 | |
Deferred tax assets: | | 59,570 | | 59,692 | | |
| Deferred tax assets, gross | | | | 47,364 | | | | 73,291 | |
Valuation allowance | | | (692 | ) | | (604 | ) | | | (3,228 | ) | | | (2,945 | ) |
Net deferred tax assets | | | 58,878 | | | 59,088 | | | | 44,136 | | | | 70,346 | |
Deferred tax liabilities: | | | | | | | | | | | | | |
Depreciation and amortization | | (37,112 | ) | | (30,248 | ) | | | (45,737 | ) | | | (38,796 | ) |
Other | | | (1,119 | ) | | (1,420 | ) | | | (663 | ) | | | (394 | ) |
Deferred tax liabilities | | | (38,231 | ) | | (31,668 | ) | | | (46,400 | ) | | | (39,190 | ) |
Net deferred tax asset | | $ | 20,647 | | $ | 27,420 | | |
| Prepaid tax assets | | | | 4,015 | | | | 4,251 | |
| Net tax asset | | | $ | 1,751 | | | $ | 35,407 | |
Deferred income tax assets on the face of the balance sheet include $4.0 million and $4.3 million of prepaid tax assets related to intercompany transfers of inventory as of July 31, 2013 and July 31, 2012, respectively.
The effective tax rate for Fiscal 20112013 was 27.929.0 percent compared to 27.828.7 percent in Fiscal 2010.2012. The average underlyingincrease in the effective tax rate remained at 29.7 percent, while discrete items were also a consistent percentageis primarily due to the incremental benefits derived in Fiscal 2012 from the favorable settlement of pre-tax profits. Fiscal 2010 contained $4.3 million of discretetax audits. This was partially offset by an increase in tax benefits from international operations and the expirationretroactive reinstatement of the statute of limitations at foreign subsidiariesResearch and other discrete items. Fiscal 2011 contained $5.8 million of discrete tax benefits primarily fromExperimentation Credit in the release of reserves afterU.S. in the favorable conclusions of foreign tax audits, the expiration of statutes in various jurisdictions, and the favorable impact of dividends from some foreign subsidiaries.current year.
The Company has not provided for U.S. income taxes on additional undistributed earnings of non-U.S. subsidiaries of approximately $623.0$757.0 million. The Company currently intends to permanentlyindefinitely reinvest these undistributed earnings overseas as there are significant investment opportunities there and the Company does not intend to incur a tax costor to repatriate these funds.the earnings only when it is tax effective to do so. If any portion were to be distributed, the related U.S. tax liability may be reduced by foreign income taxes paid on those earnings plus any available foreign tax credit carryovers. Determination of the unrecognized deferred tax liability related to these undistributed earnings is not practicable.
The Company has cumulative pre-tax loss carryforwards of $4.8$3.1 million, which exist in various international subsidiaries. If fully realized, the unexpired net operating losses may be carried forward to offset future local income tax payments of $1.2$0.9 million, at current rates of tax. Approximately 12 percent of these net operating losses expire within the next three years, while theThe majority of the remaining net operating loss carryforwards expire more than 5 years out or have no statutory expiration under current local laws. However, as it is more-likely-than-not that certain of these losses will not be realized, a valuation allowance of $0.7$0.8 million exists as of July 31, 2011.2013.
The Company maintains a reserve for uncertain tax benefits. The accounting standard defines the threshold for recognizing the benefits of tax return positions in the financial statements as “more-likely-than-not” to be sustained by the taxing authorities based solely on the technical merits of the position. If the recognition threshold is met, the tax benefit is measured and recognized as the largest amount of tax benefit that in the Company’s judgment is greater than
Table of Contents
50 percent likely to be realized. A reconciliation of the beginning and ending amount of gross unrecognized tax benefits is as follows:
| | | | | | | | | | | |
| | 2011 | | 2010 | | 2009 | | | 2013 | | | 2012 | | | 2011 | |
| | (thousands of dollars) | | | (thousands of dollars) | |
Gross unrecognized tax benefits at beginning of fiscal year | | $ | 18,994 | | $ | 16,928 | | $ | 32,002 | | | $ | 16,514 | | | $ | 20,005 | | | $ | 18,994 | |
Additions for tax positions of the current year | | 7,406 | | 3,122 | | 3,527 | | | | 5,453 | | | | 3,323 | | | | 7,406 | |
Additions for tax positions of prior years | | 668 | | 470 | | 772 | | | | 407 | | | | 261 | | | | 668 | |
Reductions for tax positions of prior years | | (164 | ) | | (179 | ) | | (8,258 | ) | | | (1,640 | ) | | | (4,462 | ) | | | (4,059 | ) |
Settlements | | (3,895 | ) | | — | | (10,092 | ) | | | (277 | ) | | | — | | | | — | |
Reductions due to lapse of applicable statute of limitations | | | (3,004 | ) | | (1,347 | ) | | (1,023 | ) | | | (2,038 | ) | | | (2,613 | ) | | | (3,004 | ) |
Gross unrecognized tax benefits at end of fiscal year | | $ | 20,005 | | $ | 18,994 | | $ | 16,928 | | | $ | 18,419 | | | $ | 16,514 | | | $ | 20,005 | |
The Company recognizes interest and penalties accrued related to unrecognized tax benefits in income tax expense. During the fiscal year ended July 31, 2011,2013, the Company recognized interest expense, net of tax benefit, of approximately $0.3 million. At July 31, 20112013 and July 31, 2010,2012, accrued interest and penalties on a gross basis were $1.5$1.1 million and $2.5$1.3 million, respectively.
The Company’s uncertain tax positions are affected by the tax years that are under audit or remain subject to examination by the relevant taxing authorities. The following tax years, in addition to the current year, remain subject to examination, at least for certain issues, by the major tax jurisdictions indicated:
| | |
Major Jurisdictions | | Open Tax Years |
Belgium | | 2010
2011 through 2012 |
China | | 20012003 through 2010
2012 |
France | | 2010 through 2012 |
| Germany | | 2009 through 2012 |
| Italy | | 2003 through 2012 |
| Japan | | 2012 |
| Mexico | | 2008 through 20102012 |
Germany
Thailand | | 20092005 through 2010
2012 |
Italy
United Kingdom | | 2003 through 2010
2012 |
Japan
| | 2009 through 2010
|
Mexico
| | 2006 through 2010
|
Thailand
| | 2005 through 2010
|
United Kingdom
| | 2010
|
United States | | 20082011 through 2010
2012 |
If the Company were to prevail on all unrecognized tax benefits recorded, substantially all of the unrecognized tax benefits would benefit the effective tax rate. With an average statute of limitations of about 5 years, up to $3.0$0.8 million of the unrecognized tax benefits could potentially expire in the next 12 month period, unless extended by audit. It is possible that quicker than expected settlement of either current or future audits and disputes would cause additional reversals of previously recorded reserves in the next 12 month period. Currently, the Company has approximately $0.2 million of unrecognized tax benefits that are in formal dispute with various taxing authorities related to transfer pricing and deductibility of expenses. Quantification of an estimated range and timing of future audit settlements cannot be made at this time.
NOTE KL Segment Reporting
Consistent with FASB guidance related to segment reporting, the Company identified two reportable segments: Engine Products and Industrial Products. Segment selection was based on the internal organizational structure, management of operations, and performance evaluation by management and the Company’s Board of Directors.
The Engine Products segment sells to OEMs in the construction, mining, agriculture, aerospace, defense, and truck markets and to independent distributors, OEM dealer networks, private label accounts, and large equipment fleets. Products include air filtration systems, exhaust and emissions systems, liquid filtration systems including hydraulics, fuel and lube, and replacement filters.
The Industrial Products segment sells to various industrial dealers, distributors, and end-users, OEMs of gas-fired turbines, and OEMs and end-users requiring clean air. Products include dust, fume, and mist collectors, compressed air purification systems, air filtration systems for gas turbines, PTFE membrane basedmembrane-based products, and specialized air and gas filtration systems for applications including computer hard disk drives.drives and semi-conductor manufacturing.
Corporate and Unallocated includes corporate expenses determined to be non-allocable to the segments, interest income, and interest expense. Assets included in Corporate and Unallocated principally are cash and cash equivalents,
Table of Contents
inventory reserves, certain prepaids, certain investments, other assets, and assets allocated to general corporate purposes.
The Company has an internal measurement system to evaluate performance and allocate resources based on profit or loss from operations before income taxes. The Company’s manufacturing facilities serve both reporting segments. Therefore, the Company uses an allocation methodology to assign costs and assets to the segments. A certain amount of costs and assets relate to general corporate purposes and are not assigned to either segment. Certain accounting policies applied to the reportable segments differ from those described in the summary of significant accounting policies. The reportable segments account for receivables on a grossnet basis and account for inventory on a standard cost basis.
Segment allocated assets are primarily accounts receivable, inventories, property, plant, and equipment, and goodwill. Reconciling items included in Corporate and Unallocated are created based on accounting differences between segment reporting and the consolidated, external reporting as well as internal allocation methodologies.
The Company is an integrated enterprise, characterized by substantial intersegment cooperation, cost allocations, and sharing of assets. Therefore, we do not represent that these segments, if operated independently, would report the operating profit and other financial information shown below. In the following table, reclassifications have been made in prior periods as a result of an internal reorganization of Industrial Hydraulics from Industrial Products to Engine Products, which became effective August 1, 2010.
Segment detail is summarized as follows:
| | | | | | | | | | | | | | | Engine | | Industrial | | Corporate & | | Total | |
| | Engine
Products | | Industrial
Products | | Corporate &
Unallocated | | Total
Company | | | Products | | | Products | | | Unallocated | | | Company | |
| | (thousands of dollars) | | | (thousands of dollars) | |
| 2013 | | | | | | | | | | |
| Net sales | | | $ | 1,504,188 | | | $ | 932,760 | | | $ | — | | | $ | 2,436,948 | |
| Depreciation and amortization | | | | 35,815 | | | | 22,447 | | | | 6,028 | | | | 64,290 | |
| Equity earnings in unconsolidated affiliates | | | | 4,000 | | | | 693 | | | | — | | | | 4,693 | |
| Earnings before income taxes | | | | 220,892 | | | | 139,108 | | | | (11,819 | ) | | | 348,181 | |
| Assets | | | | 826,151 | | | | 527,416 | | | | 389,989 | | | | 1,743,556 | |
| Equity investments in unconsolidated affiliates | | | | 15,563 | | | | 3,277 | | | | — | | | | 18,840 | |
| Capital expenditures, net of acquired businesses | | | | 52,864 | | | | 33,134 | | | | 8,897 | | | | 94,895 | |
| 2012 | | | | | | | | | | | | | | | | | |
| Net sales | | | $ | 1,570,140 | | | $ | 923,108 | | | $ | — | | | $ | 2,493,248 | |
| Depreciation and amortization | | | | 36,646 | | | | 18,852 | | | | 5,667 | | | | 61,165 | |
| Equity earnings in unconsolidated affiliates | | | | 3,966 | | | | 769 | | | | — | | | | 4,735 | |
| Earnings before income taxes | | | | 227,941 | | | | 149,249 | | | | (6,410 | ) | | | 370,780 | |
| Assets | | | | 845,176 | | | | 520,739 | | | | 364,167 | | | | 1,730,082 | |
| Equity investments in unconsolidated affiliates | | | | 17,304 | | | | 2,822 | | | | — | | | | 20,126 | |
| Capital expenditures, net of acquired businesses | | | | 46,816 | | | | 24,083 | | | | 7,240 | | | | 78,139 | |
2011 | | | | | | | | | | | | | | | | | | | | | | | | | |
Net sales | | $ | 1,440,495 | | $ | 853,534 | | $ | — | | $ | 2,294,029 | | | $ | 1,440,495 | | | $ | 853,534 | | | $ | — | | | $ | 2,294,029 | |
Depreciation and amortization | | 36,338 | | 19,396 | | 4,757 | | 60,491 | | | | 36,338 | | | | 19,396 | | | | 4,757 | | | | 60,491 | |
Equity earnings in unconsolidated affiliates | | 3,302 | | 803 | | — | | 4,105 | | | | 3,302 | | | | 803 | | | | — | | | | 4,105 | |
Earnings before income taxes | | 211,255 | | 123,871 | | (22,863 | ) | | 312,263 | | | | 211,255 | | | | 123,871 | | | | (22,863 | ) | | | 312,263 | |
Assets | | 888,080 | | 519,730 | | 318,283 | | 1,726,093 | | | | 888,080 | | | | 519,730 | | | | 318,283 | | | | 1,726,093 | |
Equity investments in unconsolidated affiliates | | 16,619 | | 2,558 | | — | | 19,177 | | | | 16,619 | | | | 2,558 | | | | — | | | | 19,177 | |
Capital expenditures, net of acquired businesses | | 36,423 | | 19,442 | | 4,768 | | 60,633 | | | | 36,423 | | | | 19,442 | | | | 4,768 | | | | 60,633 | |
| | | | | | | | | | |
2010 | | | | | | | | | | |
Net sales | | $ | 1,126,007 | | $ | 751,057 | | $ | — | | $ | 1,877,064 | | |
Depreciation and amortization | | 33,433 | | 20,935 | | 4,864 | | 59,232 | | |
Equity earnings in unconsolidated affiliates | | 1,859 | | 160 | | — | | 2,019 | | |
Earnings before income taxes | | 155,833 | | 91,084 | | (16,741 | ) | | 230,176 | | |
Assets | | 702,300 | | 477,154 | | 320,052 | | 1,499,506 | | |
Equity investments in unconsolidated affiliates | | 14,860 | | 625 | | — | | 15,485 | | |
Capital expenditures, net of acquired businesses | | 24,355 | | 15,250 | | 3,544 | | 43,149 | | |
| | | | | | | | | | |
2009 | | | | | | | | | | |
Net sales | | $ | 1,027,685 | | $ | 840,944 | | $ | — | | $ | 1,868,629 | | |
Depreciation and amortization | | 32,287 | | 20,386 | | 5,924 | | 58,597 | | |
Equity earnings in unconsolidated affiliates | | 2,172 | | 94 | | — | | 2,266 | | |
Earnings before income taxes | | 85,896 | | 87,427 | | (11,898 | ) | | 161,425 | | |
Assets | | 631,278 | | 474,291 | | 228,427 | | 1,333,996 | | |
Equity investments in unconsolidated affiliates | | 15,474 | | 517 | | — | | 15,991 | | |
Capital expenditures, net of acquired businesses | | 25,390 | | 16,032 | | 4,658 | | 46,080 | | |
Table of Contents
Following are net sales by product within the Engine Products segment and Industrial Products segment:
| | | | | | | | | | | |
| | 2011 | | 2010 | | 2009 | | | 2013 | | | 2012 | | | 2011 | |
| | (thousands of dollars) | | | (thousands of dollars) | |
Engine Products segment: | | | | | | | | | | | | | | | | | | | |
Off-Road Products | | $ | 327,557 | | $ | 222,329 | | $ | 243,691 | | | $ | 358,834 | | | $ | 376,870 | | | $ | 327,557 | |
Aerospace and Defense Products | | 104,883 | | 111,977 | | 119,094 | | |
On-Road Products | | 127,107 | | 81,874 | | 71,958 | | | | 128,446 | | | | 163,934 | | | | 127,107 | |
Aftermarket Products* | | 861,393 | | 691,899 | | 561,846 | | | | 900,419 | | | | 907,306 | | | | 861,393 | |
Retrofit Emissions Products | | | 19,555 | | | 17,928 | | | 31,096 | | | | 12,298 | | | | 15,354 | | | | 19,555 | |
| Aerospace and Defense Products | | | | 104,191 | | | | 106,676 | | | | 104,883 | |
Total Engine Products segment | | | 1,440,495 | | | 1,126,007 | | | 1,027,685 | | | | 1,504,188 | | | | 1,570,140 | | | | 1,440,495 | |
| | | | | | | | |
Industrial Products segment: | | | | | | | | | | | | | | | | | | | |
Industrial Filtration Solutions Products | | 507,646 | | 423,050 | | 477,908 | | | | 529,751 | | | | 553,453 | | | | 507,646 | |
Gas Turbine Products | | 154,726 | | 150,131 | | 206,760 | | | | 232,922 | | | | 180,669 | | | | 154,726 | |
Special Applications Products | | | 191,162 | | | 177,876 | | | 156,276 | | | | 170,087 | | | | 188,986 | | | | 191,162 | |
Total Industrial Products segment | | | 853,534 | | | 751,057 | | | 840,944 | | | | 932,760 | | | | 923,108 | | | | 853,534 | |
| | | | | | | | |
Total Company | | $ | 2,294,029 | | $ | 1,877,064 | | $ | 1,868,629 | | | $ | 2,436,948 | | | $ | 2,493,248 | | | $ | 2,294,029 | |
_________________
| |
* | Includes replacement part sales to the Company’s OEM Customers. |
Geographic sales by origination and property, plant, and equipment:
| | | | | | | | | | | | Property, Plant, & | |
| | Net Sales | | Property, Plant &
Equipment - Net | | | Net Sales | | | Equipment - Net | |
| | | | (thousands of dollars) | |
| 2013 | | | | | | |
| United States | | | $ | 1,010,934 | | | $ | 166,614 | |
| Europe | | | | 678,996 | | | | 123,710 | |
| Asia - Pacific | | | | 546,406 | | | | 75,206 | |
| Other | | | | 200,612 | | | | 53,750 | |
| Total | | | $ | 2,436,948 | | | $ | 419,280 | |
| | | | | | | | | | |
| 2012 | | | | | | | | | |
| United States | | | $ | 1,064,474 | | | $ | 146,328 | |
| Europe | | | | 678,619 | | | | 114,266 | |
| Asia - Pacific | | | | 572,163 | | | | 80,200 | |
| Other | | | | 177,992 | | | | 44,115 | |
| Total | | | $ | 2,493,248 | | | $ | 384,909 | |
| | (thousands of dollars) | | | | | | | | | |
2011 | | | | | | | | | | | | | |
United States | | $ | 941,218 | | $ | 141,584 | | | $ | 941,218 | | | $ | 141,584 | |
Europe | | 653,275 | | 131,739 | | | | 653,275 | | | | 131,739 | |
Asia - Pacific | | 540,874 | | 81,035 | | | | 540,874 | | | | 81,035 | |
Other | | | 158,662 | | | 37,144 | | | | 158,662 | | | | 37,144 | |
Total | | $ | 2,294,029 | | $ | 391,502 | | | $ | 2,294,029 | | | $ | 391,502 | |
| | | | | | |
2010 | | | | | | |
United States | | $ | 745,400 | | $ | 139,717 | | |
Europe | | 545,803 | | 122,646 | | |
Asia - Pacific | | 460,470 | | 72,950 | | |
Other | | | 125,391 | | | 30,579 | | |
Total | | $ | 1,877,064 | | $ | 365,892 | | |
| | | | | | |
2009 | | | | | | |
United States | | $ | 778,979 | | $ | 141,052 | | |
Europe | | 567,117 | | 138,350 | | |
Asia - Pacific | | 419,423 | | 71,686 | | |
Other | | | 103,110 | | | 29,980 | | |
Total | | $ | 1,868,629 | | $ | 381,068 | | |
ConcentrationsThere were no Customers over 10 percent of net sales during Fiscal 2011, 2010,2013, 2012, and 2009.2011. There were no Customers over 10 percent of gross accounts receivable in Fiscal 2013 or Fiscal 2011 and 2010.one Customer over 10 percent of gross accounts receivable in Fiscal 2012.
NOTE LM Guarantees
The Company and Caterpillar Inc. equally own the shares of Advanced Filtration Systems Inc. (AFSI), an unconsolidated joint venture, and guarantee certain debt of the joint venture. As of July 31, 2011,2013, the joint venture had $24.6$29.1 million of outstanding debt, of which the Company guarantees half. In addition, during Fiscal 2013, 2012, and 2011, 2010, and
Table of Contents
2009, the Company recorded its equity in earnings of this equity method investment of $1.6$2.3 million, $0.4$2.0 million, and $1.0$1.6 million and royalty income of $6.0 million, $6.2 million, $5.4 million, and $5.1$6.2 million, respectively, related to AFSI.
At July 31, 20112013 and 2010,2012, the Company had a contingent liability for standby letters of credit totaling $11.4$12.2 million and $20.0$10.9 million, respectively, which have been issued and are outstanding. The letters of credit guarantee payment to third parties in the event the Company is in breach of a specified bond financing agreement and insurance contract terms as detailed in each letter of credit. At July 31, 20112013 and 2010,2012, there were no amounts drawn upon these letters of credit.
NOTE MN Warranty
The Company provides for warranties on certain products. In addition, the Company may incur specific Customer warranty issues. Following is a reconciliation of warranty reserves (in thousands of dollars):
| | | | | |
Balance at July 31, 2009 | | $ | 9,215 | | |
| Balance at July 31, 2011 | | | $ | 19,720 | |
Accruals for warranties issued during the reporting period | | 12,389 | | | | 5,002 | |
Accruals related to pre-existing warranties (including changes in estimates) | | (1,244 | ) | | | (2,956 | ) |
Less settlements made during the period | | | (4,653 | ) | | | (10,861 | ) |
Balance at July 31, 2010 | | $ | 15,707 | | |
| Balance at July 31, 2012 | | | $ | 10,905 | |
Accruals for warranties issued during the reporting period | | 8,406 | | | | 5,940 | |
Accruals related to pre-existing warranties (including changes in estimates) | | 7,735 | | | | (1,081 | ) |
Less settlements made during the period | | | (12,128 | ) | | | (5,238 | ) |
Balance at July 31, 2011 | | $ | 19,720 | | |
| Balance at July 31, 2013 | | | $ | 10,526 | |
During Fiscal 2011, the increase in warranty accruals was primarily due to three
There were no significant specific warranty matters: onematters accrued for in Fiscal 2013 or Fiscal 2012. These warranty matters are not expected to have a material impact on the Company’s results of operations, liquidity, or financial position. There were no significant settlements made in Fiscal 2013. The settlements made during Fiscal 2012 were primarily in relation to the Company’s Retrofit Emissions Product group for $3.6 million, one in the Company’s Off-Road Products group for $1.8 million, and one in the On-Road Product group for $4.1 million. These warranty accruals were partially offset by supplier and insurance recoveries of $4.2 million. During Fiscal 2010, the Company increased warranty accruals due to a specific warranty matter in our Retrofit Emissions Products group and recorded an expense of $6.2 million for this matter.
NOTE NO Commitments and Contingencies
Operating Leases The Company enters into operating leases primarily for office and warehouse facilities, production and non-production equipment, automobiles, and computer equipment. Total expense recorded under operating leases for the periods ended July 31, 2013 and 2012 were $27.5 million and $26.8 million, respectively. Future commitments under operating leases are: $11.4 million in Fiscal 2014, $8.0 million in Fiscal 2015, $4.3 million in Fiscal 2016, $1.9 million in Fiscal 2017, $1.0 million in Fiscal 2018, and $0.1 million thereafter.
LitigationThe Company records provisions with respect to identified claims or lawsuits when it is probable that a liability has been incurred and the amount of the loss can be reasonably estimated. Claims and lawsuits are reviewed quarterly and provisions are taken or adjusted to reflect the status of a particular matter. The Company believes the recorded reserves in its consolidated financial statements are adequate in light of the probable and estimable outcomes. The recorded liabilities were not material to the Company’s financial position, results of operationoperations, or liquidity and the Company does not believe that any of the currently identified claims or litigation will materially affect its financial position, results of operationoperations, or liquidity.
TheNOTE P Quarterly Financial Information (Unaudited)
| | | First | | | Second | | | Third | | | Fourth | |
| | | Quarter | | | Quarter | | | Quarter | | | Quarter | |
| | | (thousands of dollars) | |
| 2013 | | | | | | | | | | | | | | | | |
| Net sales | | $ | 588,947 | | | $ | 596,036 | | | $ | 619,371 | | | $ | 632,594 | |
| Gross margin | | | 198,293 | | | | 198,977 | | | | 221,501 | | | | 228,356 | |
| Net earnings | | | 54,113 | | | | 50,813 | | | | 69,842 | | | | 72,609 | |
| Basic earnings per share | | | 0.36 | | | | 0.34 | | | | 0.47 | | | | 0.49 | |
| Diluted earnings per share | | | 0.36 | | | | 0.34 | | | | 0.46 | | | | 0.48 | |
| Dividends declared per share | | | 0.090 | | | | 0.100 | | | | 0.130 | | | | 0.130 | |
| Dividends paid per share | | | 0.090 | | | | 0.090 | | | | 0.100 | | | | 0.130 | |
| | | | | | | | | | | | | | | | | |
| 2012 | | | | | | | | | | | | | | | | |
| Net sales | | $ | 608,295 | | | $ | 580,883 | | | $ | 647,237 | | | $ | 656,833 | |
| Gross margin | | | 214,934 | | | | 200,817 | | | | 228,229 | | | | 229,783 | |
| Net earnings | | | 68,553 | | | | 53,821 | | | | 70,946 | | | | 70,981 | |
| Basic earnings per share | | | 0.46 | | | | 0.36 | | | | 0.47 | | | | 0.47 | |
| Diluted earnings per share | | | 0.45 | | | | 0.35 | | | | 0.46 | | | | 0.47 | |
| Dividends declared per share | | | 0.075 | | | | 0.080 | | | | 0.090 | | | | 0.090 | |
| Dividends paid per share | | | 0.075 | | | | 0.075 | | | | 0.080 | | | | 0.090 | |
Note: the above table reflects the impact of the two-for-one stock split that occurred on March 23, 2012.
NOTE Q Subsequent Events
On August 13, 2013, the Company has reachedannounced it had entered into a preliminarydefinitive agreement to settlesell Ultratroc Gmbh (Ultratroc), a wholly owned subsidiary and manufacturer of compressed air dryers located in Flensburg, Germany, which was effective September 23, 2013. The Ultratroc business is currently part of the class action lawsuits that were previously disclosed in its SEC filings, including most recentlyCompany’s Industrial Products segment. Under the Form 10-Q forterms of the quarter ending April 30, 2011. On March 31, 2008, S&E Quick Lube, a filter distributor, filed a lawsuit alleging that 12 filter manufacturers, includingagreement, Donaldson will continue selling Ultratroc’s compressed air dryers and will retain the Company, engaged in a conspiracynaming rights to fix prices, rig bids,the brand names “Donaldson Ultrafilter” and allocate U.S. Customers for aftermarket automotive filters.“Ultrafilter.” The U.S. cases have been consolidated into a single multi-district litigation in the Northern District of Illinois. The Company denies any liability and has vigorously defended the claims raised in these lawsuits. The settlement will fully resolve all claims brought against the Company in the lawsuits and the Company does not admit any liability or wrongdoing. The settlement is still subject to Court approval andsale will not have a material impact on the Company’s financial position, results of operations, liquidity, or liquidity.
The Company has reached a preliminary agreement with the Air Resources Board for the State of California (“ARB”) to settle regulatory claims brought by ARB in connection with the sales of our Diesel Multi-Stage Filter System (“DMF”) for an immaterial amount. On May 19, 2010, ARB revoked its verification of the Company’s DMF for use with on-road diesel engines, for which verification was originally issued on December 16, 2005. The Company denies that any sales were made in California without ARB verification. The Company is not currently selling any DMF product and is working with the Environmental Protection Agency to verify the product for any future sales.financial position.
Table of Contents
NOTE O Restructuring
The following is a reconciliation of restructuring reserves (in thousands of dollars):
| | | | |
Balance at July 31, 2008 | | $ | — | |
Accruals for restructuring during the reporting period | | | 17,755 | |
Less settlements made during the period | | | (13,915 | ) |
Balance at July 31, 2009 | | $ | 3,840 | |
Accruals for restructuring during the reporting period | | | 8,023 | |
Less settlements made during the period | | | (7,724 | ) |
Balance at July 31, 2010 | | $ | 4,139 | |
Accruals for restructuring during the reporting period | | | 759 | |
Less settlements made during the period | | | (4,898 | ) |
Balance at July 31, 2011 | | $ | — | |
Certain restructuring actions commenced in Fiscal 2009 in response to the dramatic downturn in the worldwide economy and these actions and related costs carried over into Fiscal 2010 and Fiscal 2011. In Fiscal 2011, the Engine Products segment incurred minimal restructuring expenses and Industrial Products segment incurred $0.7 million in restructuring expenses. The restructuring expenses in Fiscal 2011 include employee severance costs for approximately five employees related to the completion of the Company’s planned restructuring activities. The Company did not previously anticipate these additional charges in Fiscal 2011.
The fiscal 2010 costs were employee severance costs related to the reduction in workforce of approximately 550 employees. In addition to these restructuring costs, the Company recorded $2.1 million in asset impairment costs related to the downsizing of a plant in Germany. Fiscal 2009 included $17.3 million in employee severance costs related to the reduction in workforce of approximately 2,800 employees. In addition, $0.5 million was incurred primarily for distribution center consolidation and production line transfers.
Restructuring and asset impairment expense detail is summarized as follows (in thousands):
| | | | | | | | | | |
| | Fiscal Year | |
| | 2011 | | 2010 | | 2009 | |
Gross Margin | | $ | 20 | | $ | 7,488 | | $ | 10,109 | |
Operating expenses | | | 739 | | | 2,677 | | | 7,646 | |
Total restructuring and asset impairment expenses | | $ | 759 | | $ | 10,165 | | $ | 17,755 | |
Table of Contents
NOTE P Quarterly Financial Information (Unaudited)
| | | | | | | | | | | | | |
| | First
Quarter | | Second
Quarter | | Third
Quarter | | Fourth
Quarter | |
| | (In thousands) | |
2011 | | | | | | | | | | | | | |
Net sales | | $ | 536,909 | | $ | 537,105 | | $ | 594,565 | | $ | 625,450 | |
Gross margin | | | 188,090 | | | 189,543 | | | 209,158 | | | 227,005 | |
Net earnings | | | 53,134 | | | 44,579 | | | 61,811 | | | 65,767 | |
Basic earnings per share | | | 0.69 | | | 0.57 | | | 0.80 | | | 0.86 | |
Diluted earnings per share | | | 0.68 | | | 0.56 | | | 0.79 | | | 0.84 | |
Dividends declared per share | | | — | | | 0.260 | | | — | | | 0.300 | |
Dividends paid per share | | | 0.125 | | | 0.130 | | | 0.130 | | | 0.150 | |
| | | | | | | | | | | | | |
2010 | | | | | | | | | | | | | |
Net sales | | $ | 428,080 | | $ | 436,122 | | $ | 497,619 | | $ | 515,243 | |
Gross margin | | | 148,400 | | | 145,947 | | | 177,371 | | | 187,030 | |
Net earnings | | | 34,569 | | | 30,966 | | | 49,458 | | | 51,170 | |
Basic earnings per share | | | 0.44 | | | 0.40 | | | 0.64 | | | 0.66 | |
Diluted earnings per share | | | 0.44 | | | 0.39 | | | 0.62 | | | 0.65 | |
Dividends declared per share | | | — | | | 0.115 | | | 0.120 | | | 0.245 | |
Dividends paid per share | | | 0.115 | | | 0.115 | | | 0.120 | | | 0.120 | |
The quarter ended October 31, 2010 included restructuring charges after-tax of $0.6 million or $0.01 per share. The quarters ended October 31, 2009, January 31, 2010, April 30, 2010, and July 31, 2010, include restructuring charges after-tax of $0.9 million or $0.01 per share, $3.6 million or $0.05 per share, $2.7 million or $0.03 per share, and less than $0.1 million, respectively.
Item 9. Changes in and Disagreements with Accountants on Accounting and Financial Disclosure
None.
Item 9A. Controls and Procedures
Evaluation of Disclosure Controls and Procedures
As of the end of the period covered by this report (the “Evaluation Date”)Evaluation Date), the Company carried out an evaluation, under the supervision and with the participation of management, including the Chief Executive Officer and the Chief Financial Officer, of the effectiveness of the design and operation of the Company’s disclosure controls and procedures (as defined in Rule 13a-15(e) of the Exchange Act). Based upon that evaluation, the Chief Executive Officer and Chief Financial Officer concluded that, as of the Evaluation Date, the Company’s disclosure controls and procedures were effective to ensure that information required to be disclosed by the Company in the reports that it files or submits under the Exchange Act is (i) recorded, processed, summarized and reported within the time periods specified in applicable rules and forms, and (ii) accumulated and communicated to our management, including our Chief Executive Officer and Chief Financial Officer, to allow timely decisions regarding required disclosure.
Changes in Internal Control over Financial Reporting
No change in the Company’s internal control over financial reporting (as defined in Rule 13a-15(f) of the Exchange Act) identified in connection with such evaluation during the fiscal quarter ended July 31, 2011,2013, has materially affected, or is reasonably likely to materially affect, the Company’s internal control over financial reporting.
The Company is in the process of a multi-year implementation of a Strategic Business System project (which is the Company’s global enterprise resource planning, or ERP, system). In fiscal 2014, the Company expects this system will be deployed in certain operations, primarily in the Americas. In response to business integration activities related to the new system, the Company will align and streamline the design and operation of the financial reporting controls environment to be responsive to the changing operating environment.
Management’s Report on Internal Control over Financial Reporting
See Management’s Report on Internal Control over Financial Reporting under Item 8 on page 25.27.
Report of Independent Registered Public Accounting Firm
See Report of Independent Registered Public Accounting Firm under Item 8 on page 26.28.
Table of Contents
Item 9B. Other Information
None.
PART III
Item 10. Directors, Executive Officers, and Corporate Governance
The information under the captions “Item 1: Election of Directors”; “Director Selection Process,” “Audit Committee,” “Audit Committee Expertise; Complaint-Handling Procedures,” and “Section 16(a) Beneficial Ownership Reporting Compliance” of the 20112013 Proxy Statement is incorporated herein by reference. Information on the Executive Officers of the Company is found under the caption “Executive Officers of the Registrant” on page 67 of this Annual Report on Form 10-K.
The Company has adopted a code of business conduct and ethics in compliance with applicable rules of the Securities and Exchange Commission that applies to its principal executive officer, its principal financial officer and its principal accounting officer or controller, or persons performing similar functions. A copy of the code of business conduct and ethics is posted on the Company’s website at www.donaldson.com. The code of business conduct and ethics is available in print, free of charge to any shareholder who requests it. The Company will disclose any amendments to, or waivers of, the code of business conduct and ethics for the Company’s principal executive officer, principal financial officer, and principal accounting officer on the Company’s website.
Item 11. Executive Compensation
The information under the captions “Executive Compensation” and “Director Compensation” of the 20112013 Proxy Statement is incorporated herein by reference.
Item 12. Security Ownership of Certain Beneficial Owners and Management and Related Stockholder Matters
The information under the caption “Security Ownership” of the 20112013 Proxy Statement is incorporated herein by reference.
Table of Contents
The following table sets forth information as of July 31, 20112013 regarding the Company’s equity compensation plans:
| | | | | | | | | | |
Plan Category | | Number of securities
to be issued upon
exercise of
outstanding options,
warrants and rights | | Weighted - average
exercise price of
outstanding options,
warrants and rights | | Number of securities
remaining available for
future issuance under
equity compensation plans
(excluding securities
reflected in column (a)) | | | Number of securities
to be issued upon exercise
of outstanding options,
warrants, and rights | | | Weighted – average
exercise price of
outstanding options,
warrants, and rights | | | Number of securities
remaining available for
future issuance under
equity compensation
plans (excluding
securities reflected
in column (a)) | |
| | (a) | | (b) | | (c) | | | | (a) | | | | (b) | | | | (c) | |
Equity compensation plans approved by security holders: | | | | | | | | | | | | | | | | | | | |
1980 Master Stock Compensation Plan: | | | | | | | | | | | | | | | | | | | |
Stock Options | | — | | — | | — | | |
Deferred Stock Gain Plan | | 42,057 | | $ | 13.9878 | | — | | | | 57,775 | | | $ | 7.6108 | | | | — | |
| | | | | | | | |
1991 Master Stock Compensation Plan: | | | | | | | | | | | | | | | | | | | |
Stock Options | | 114,744 | | $ | 19.3523 | | — | | |
Deferred Stock Option Gain Plan | | 342,685 | | $ | 34.4576 | | — | | | | 572,991 | | | $ | 18.3960 | | | | — | |
Deferred LTC/Restricted Stock | | 134,158 | | $ | 22.7091 | | — | | | | 220,008 | | | $ | 12.1824 | | | | — | |
| | | | | | | | |
2001 Master Stock Incentive Plan: | | | | | | | | | | | | | | | | | | | |
Stock Options | | 3,164,380 | | $ | 32.6285 | | — | | | | 3,999,220 | | | $ | 18.5604 | | | | — | |
Deferred Stock Option Gain Plan | | 21,600 | | $ | 59.9872 | | — | | | | 3,511 | | | $ | 29.0143 | | | | — | |
Deferred LTC/Restricted Stock | | 152,118 | | $ | 30.3986 | | — | | | | 270,002 | | | $ | 18.1362 | | | | — | |
Long-Term Compensation | | 71,059 | | $ | 40.8296 | | — | | | | 74,773 | | | $ | 23.7350 | | | | — | |
| | | | | | | | |
2010 Master Stock Incentive Plan: | | | | | | | | | | | | | | | | | | | |
Stock Options | | 407,500 | | $ | 58.1400 | | See Note 1 | | | | 2,304,260 | | | $ | 32.5917 | | | | See Note 1 | |
Deferred LTC/Restricted Stock | | — | | $ | — | | — | | |
| Stock Options for Non-Employee Directors | | | | 409,200 | | | | 32.6111 | | | | | |
Long-Term Compensation | | | — | | $ | — | | | — | | | | 32,641 | | | $ | 31.6252 | | | | — | |
Subtotal for plans approved by security holders | | | 4,450,301 | | $ | 34.4754 | | | | | | | 7,944,381 | | | $ | 23.1784 | | | | | |
| | | | | | | | |
Equity compensation plans not approved by security holders: | | | | | | | | | | | | | | | | | | | |
Non-qualified Stock Option Program for Non - Employee Directors | | 507,373 | | $ | 38.4163 | | See Note 2 | | |
| Non-qualified Stock Option Program for Non-Employee Directors | | | | 617,140 | | | $ | 19.9868 | | | | See Note 2 | |
ESOP Restoration | | | 25,016 | | $ | 13.0282 | | | See Note 3 | | | | 39,259 | | | $ | 7.0989 | | | | See Note 3 | |
Subtotal for plans not approved by security holders | | | 532,389 | | $ | 37.2234 | | | | | | | 656,399 | | | | 19.2160 | | | | | |
Total | | | 4,982,690 | | $ | 34.769 | | | | | | | 8,600,780 | | | | 22.8760 | | | | | |
Note 1: The 2010 Master Stock Incentive Plan limits the number of shares authorized for issuance to 4,600,0009,200,000 during the 10-year term of the plan in addition to any shares forfeited under the 2001 plan. The Plan allows for the granting of nonqualified stock options, incentive stock options, restricted stock, restricted stock units, SAR, dividend equivalents, and other stock-based awards. There are currently 4,112,3696,326,334 shares of the authorization remaining.
Note 2: The stock option program for non-employee directors (filed as exhibit 10-H to Form 10-Q report filed for the first quarter ended October 31, 2008) provides for each non-employee director to receive annual option grants of 7,20014,400 shares. The 2010 Master Stock Incentive Plan, which was approved by the Company’s stockholders on November 19, 2010, provides for the issuance of stock options to non-employee directors, and the stock option program for non-employee directors has been adopted as a sub-plan under the 2010 Master Stock Incentive Plan and shares issued to directors after December 10, 2010 will be issued under the 2010 Master Stock Incentive Plan.
Note 3: The Company has a non-qualified ESOP Restoration Plan established on August 1, 1990 (filed as exhibit 10-D to the Company’s 2009 Form 10-K report), to supplement the benefits for executive employees under the Company’s Employee Stock Ownership Plan that would otherwise be reduced because of the compensation limitations under the Internal Revenue Code. The ESOP’s 10-year term was completed on July 31, 1997 and the only ongoing benefits under the ESOP Restoration Plan are the accrual of dividend equivalent rights to the participants in the Plan.
Item 13. Certain Relationships and Related Transactions, and Director Independence
The information under the captions “Policy and Procedures Regarding Transactions with Related Persons” and “Board Oversight and Director Independence” of the 20112013 Proxy Statement is incorporated herein by reference.
Table of Contents
Item 14. Principal Accounting Fees and Services
The information under the captions “Independent Auditor Fees” and “Audit committeeCommittee Pre-Approval Policies and Procedures” of the 20112013 Proxy Statement is incorporated herein by reference.
PART IV
Item 15. Exhibits, Financial Statement Schedules
Documents filed with this report:
(1) Financial Statements
Report of Independent Registered Public Accounting Firm
Consolidated Statements of Earnings — years ended July 31, 2013, 2012 and 2011
Consolidated Balance Sheets — July 31, 2013 and 2012
Consolidated Statements of Comprehensive Income — years ended July 31, 2013, 2012 and 2011
Consolidated Statements of Cash Flows — years ended July 31, 2013, 2012 and 2011
Consolidated Statements of Changes in Shareholders’ Equity — years ended July 31, 2013, 2012 and 2011
Notes to Consolidated Financial Statements
(2) Financial Statement Schedules —
Schedule II Valuation and qualifying accounts
All other schedules (Schedules I, III, IV and V) for which provision is made in the applicable accounting regulations of the Securities and Exchange Commission are not required under the related instruction, or are inapplicable, and therefore have been omitted.
(3) Exhibits
The exhibits listed in the accompanying index are filed as part of this report or incorporated by reference as indicated therein.
| | |
| (1)
| Financial Statements
|
| | |
| | Consolidated Statements of Earnings — years ended July 31, 2011, 2010 and 2009
|
| | |
| | Consolidated Balance Sheets — July 31, 2011 and 2010
|
| | |
| | Consolidated Statements of Cash Flows — years ended July 31, 2011, 2010 and 2009
|
| | |
| | Consolidated Statements of Changes in Shareholders’ Equity — years ended July 31, 2011, 2010 and 2009
|
| | |
| | Notes to Consolidated Financial Statements
|
| | |
| | Report of Independent Registered Public Accounting Firm
|
| | |
| (2)
| Financial Statement Schedules —
|
| | |
| | Schedule II Valuation and qualifying accounts
|
| | |
| | All other schedules (Schedules I, III, IV and V) for which provision is made in the applicable accounting regulations of the Securities and Exchange Commission are not required under the related instruction, or are inapplicable, and therefore have been omitted.
|
| | |
| (3)
| Exhibits
|
| | |
| | The exhibits listed in the accompanying index are filed as part of this report or incorporated by reference as indicated therein.
59 |
Table of Contents
SIGNATURES
Pursuant to the requirements of Section 13 or 15(d) of the Securities Exchange Act of 1934, the registrant has duly caused this report to be signed on its behalf by the undersigned, thereunto duly authorized.
| | |
| DONALDSON COMPANY, INC. | |
| | |
Date:September 23, 201127, 2013 | By: /s/ | /s/ William M. Cook | |
| | |
| William M. Cook | |
|
Chief Executive Officer
| |
Pursuant to the requirements of the Securities Exchange Act of 1934, this report has been signed below by the following persons on behalf of the registrant and in the capacities indicated on September 23, 2011.27, 2013.
| | |
/s/ William M. Cook | | President, Chief Executive Officer and Chairman |
William M. Cook | | (principal executive officer) Principal Executive Officer) |
| | |
/s/ Thomas R. VerHage James F. Shaw | | Vice President and Chief Financial Officer |
Thomas R. VerHage
| | (principal financial officer)
|
| | |
/s/ James F. Shaw
| | Controller
(Principal Financial Officer) |
James F. Shaw
| | (principal accounting officer)
|
| /s/ Melissa A. Osland | | Controller |
*
Melissa A. Osland | | Director
(Principal Accounting Officer) |
| | |
| * | | Director |
| F. Guillaume Bastiaens | | |
| | |
* | | Director |
Andrew J. Cecere | | |
| | |
| * | | Director |
| Janet M. Dolan | | |
| | |
* | | Director |
Jack W. Eugster
| | |
| | |
*
| | Director
|
John F. Grundhofer
| | |
| | |
*
| | Director
|
Michael J. Hoffman | | |
| | |
* | | Director |
Paul David Miller | | |
| | |
* | | Director |
Jeffrey Noddle | | |
| | |
* | | Director |
Willard D. Oberton | | |
| | | |
* | | Director | |
James J. Owens | | | |
| | |
| * | | Director |
| Ajita G. Rajendra | | |
| | |
* | | Director |
John P. Wiehoff | | |
| | |
*By: /s/ Norman C. Linnell | | |
Norman C. Linnell | | |
As attorney-in-fact | | |
| | | | | |
Table of Contents
SCHEDULE II - VALUATION AND QUALIFYING ACCOUNTS
DONALDSON COMPANY, INC. AND SUBSIDIARIES
(thousands of dollars)
| | | | | | | | | | | | | | | | |
| | | | | Additions | | | | | | | |
Description | | Balance at
Beginning
of Period | | Charged to
Costs and
Expenses | | Charged to
Other Accounts
(A) | | Deductions
(B) | | Balance at
End of Period | |
Year ended July 31, 2011: | | | | | | | | | | | | | | | | |
Allowance for doubtful accounts deducted from accounts receivable | | $ | 6,315 | | $ | 482 | | $ | 481 | | $ | (370 | ) | $ | 6,908 | |
|
Year ended July 31, 2010: | | | | | | | | | | | | | | | | |
Allowance for doubtful accounts deducted from accounts receivable | | $ | 7,387 | | $ | 1,063 | | $ | (293 | ) | $ | (1,842 | ) | $ | 6,315 | |
|
Year ended July 31, 2009: | | | | | | | | | | | | | | | | |
Allowance for doubtful accounts deducted from accounts receivable | | $ | 7,509 | | $ | 1,240 | | $ | (534 | ) | $ | (828 | ) | $ | 7,387 | |
| | | | | | Additions | | | | | | | |
| | | Balance at | | | Charged to | | | Charged to | | | | | | Balance at | |
| | | Beginning of | | | Costs and | | | Other Accounts | | | Deductions | | | End of | |
| Description | | Period | | | Expenses | | | (A) | | | (B) | | | Period | |
| Year ended July 31, 2013: | | | | | | | | | | | | | | | | | | | | |
| Allowance for doubtful accounts deducted | | | | | | | | | | | | | | | | | | | | |
| from accounts receivable | | $ | 6,418 | | | $ | 1,241 | | | $ | 230 | | | $ | (849 | ) | | $ | 7,040 | |
| Year ended July 31, 2012: | | | | | | | | | | | | | | | | | | | | |
| Allowance for doubtful accounts deducted | | | | | | | | | | | | | | | | | | | | |
| from accounts receivable | | $ | 6,908 | | | $ | 1,151 | | | $ | (676 | ) | | $ | (965 | ) | | $ | 6,418 | |
| Year ended July 31, 2011: | | | | | | | | | | | | | | | | | | | | |
| Allowance for doubtful accounts deducted | | | | | | | | | | | | | | | | | | | | |
| from accounts receivable | | $ | 6,315 | | | $ | 482 | | | $ | 481 | | | $ | (370 | ) | | $ | 6,908 | |
Note A - Allowance for doubtful accounts foreign currency translation losses (gains) recorded directly to equity.
Note B - Bad debts charged to allowance, net of reserves and changes in estimates.
Table of Contents
EXHIBIT INDEX
ANNUAL REPORT ON FORM 10-K
| | |
* 3-A | — | Restated Certificate of Incorporation of Registrant as currently in effect (Filed as Exhibit 3-A to 2010 Form 10-K Report) 10-Q Report for the Second Quarter ended January 31, 2012) |
| *3-B | — | |
3-B
| —
| Certificate of Designation, Preferences and Rights of Series A Junior Participating Preferred Stock of Registrant, dated as of March 3, 2006 (Filed as Exhibit 3-B to 2011 Form 10-K Report) |
| | |
* 3-C | — | Amended and Restated Bylaws of Registrant (as of January 30, 2009) (Filed as Exhibit 3-C to Form 10- Q10-Q Report for the Second Quarter ended January 31, 2009) |
| * 4 | — | ** |
* 4 4-A | — | **
|
| | |
4-A
| —
| Preferred Stock Amended and Restated Rights Agreement between Registrant and Wells Fargo Bank, N.A., as Rights Agent, dated as of January 27, 2006 (Filed as Exhibit 4-A to 2011 Form 10-K Report) |
| *10-A | — | |
10-A
| —
| Officer Annual Cash Incentive Plan*Plan (Filed as Exhibit 10-A to 2011 Form 10-K Report)** * |
| *10-B | — | |
*10-B
| —
| 1980 Master Stock Compensation Plan as Amended (Filed as Exhibit 10-A to Form 10-Q Report filed for the first quarter ended October 31, 2008)*** |
| *10-C | — | |
*10-C
| —
| Form of Performance Award Agreement under 1991 Master Stock Compensation Plan (Filed as Exhibit 10-B to Form 10-Q Report filed for the first quarter ended October 31, 2008)*** |
| *10-D | — | |
*10-D
| —
| ESOP Restoration Plan (2003 Restatement) (Filed as Exhibit 10-D to 2009 Form 10-K Report)*** |
| *10-E | — | |
*10-E
| —
| Deferred Compensation Plan for Non-employee Directors as amended (Filed as Exhibit 10-C to Form 10-Q Report filed for the first quarter ended October 31, 2008)*** |
| *10-F | — | |
*10-F
| —
| Independent Director Retirement and Benefit Plan as amended (Filed as Exhibit 10-D to Form 10-Q Report filed for the first quarter ended October 31, 2008)*** |
| *10-G | — | |
10-G
| —
| Supplemental Executive Retirement Plan (2008 Restatement) **(Filed as Exhibit 10-G to 2011 Form 10-K Report)* ** |
| *10-H | — | |
*10-H
| —
| 1991 Master Stock Compensation Plan as amended (Filed as Exhibit 10-E to Form 10-Q Report filed for the first quarter ended October 31, 2008)*** |
| *10-I | — | |
*10-I
| —
| Form of Restricted Stock Award under 1991 Master Stock Compensation Plan (Filed as Exhibit 10-F to Form 10-Q Report filed for the first quarter ended October 31, 2008)*** |
| *10-J | — | |
*10-J
| —
| Form of Agreement to Defer Compensation for certain Executive Officers (Filed as Exhibit 10-G to Form 10-Q Report filed for the first quarter ended October 31, 2008)*** |
| *10-K | — | |
*10-K
| —
| Stock Option Program for Non-employee Directors (Filed as Exhibit 10-H to Form 10-Q Report filed for the first quarter ended October 31, 2008)*** |
| *10-L | — | |
*10-L
| —
| Note Purchase Agreement among Donaldson Company, Inc. and certain listed Insurance Companies Dated as of July 15, 1998 (Filed as Exhibit 10-I to Form 10-Q Report filed for the first quarter ended October 31, 2008) |
| *10-M | — | |
*10-M
| —
| Second Supplement and First Amendment to Note Purchase Agreement among Donaldson Company, Inc. and certain listed Insurance Companies dated as of September 30, 2004 (Filed as Exhibit 10-N to 2010 Form 10-K Report) |
| *10-N | — | |
*10-N
| —
| 2001 Master Stock Incentive Plan (Filed as Exhibit 10-O to 2009 Form 10-K Report)*** |
| *10-O | — | |
*10-O
| —
| Form of Officer Stock Option Award Agreement under the 2001 Master Stock Incentive Plan (Filed as Exhibit 10-P to 2010 Form 10-K Report)*** |
| *10-P | — | |
*10-P
| —
| Form of Non-Employee Director Non-Qualified Stock Option Agreement under the 2001 Master Stock Incentive Plan (Filed as Exhibit 10-Q to 2010 Form 10-K Report)*** |
| *10-Q | — | |
10-Q
| —
| Restated Compensation Plan for Non-Employee Directors dated July 28, 2006 **(Filed as Exhibit 10-Q to 2011 Form 10-K Report)* ** |
| *10-R | — | |
10-R
| —
| Restated Long-Term Compensation Plan dated May 23, 2006 **(Filed as Exhibit 10-R to 2011 Form 10-K Report)* ** |
| *10-S | — | |
10-S
| —
| Qualified Performance-Based Compensation Plan **(Filed as Exhibit 10-S to 2011 Form 10-K Report)* ** |
| *10-T | — | |
10-T
| —
| Deferred Compensation and 401(k) Excess Plan (2008 Restatement) (Filed as Exhibit 10-T to 2011 form 10-K Report)*** |
| *10-U | — | |
10-U
| —
| Deferred Stock Option Gain Plan (2008 Restatement) (Filed as Exhibit 10-U to 2011 Form 10-K Report) ***** |
| *10-V | — | |
10-V
| —
| Excess Pension Plan (2008 Restatement) (Filed as Exhibit 10-V to 2011 Form 10-K Report) ***** |
| *10-W | — | |
*10-W
| —
| Form of Management Severance Agreement for Executive Officers (Filed as Exhibit 10-A to Form 10-Q Report for the Third Quarter ended April 30, 2008)*** |
| *10-X | — | |
*10-X
| —
| 2010 Master Stock Incentive Plan (Filed as Exhibit 4.5 to Registration Statement on Form S-* (File No. 333-170729) filed on November 19, 2010)*** |
| *10-Y | — | |
*10-Y
| —
| Form of Officer Stock Option Award Agreement under the 2010 Master Stock Incentive Plan (Filed as Exhibit 10.1 to Form 8-K Report filed on December 16, 2010) *** |
| *10-Z | — | |
*10-Z
| —
| Form of Restricted Stock Award Agreement under the 2010 Master Stock Incentive Plan (Filed as Exhibit 10.2 to Form 8-K Report filed on December 16, 2010) *** |
Table of Contents
| | |
*10-AA | — | Non-Employee Director Automatic Stock Option Grant Program (Filed as Exhibit 10-AA to 2011 Form 10-K Report)*** |
| *10-BB | — | Form of Indemnification Agreement for Directors (Filed as Exhibit 10.1 to Form 8-K Report filed on April 2, 2012)*** |
| *10-CC | — | Form of Employee Director Non-Qualified Stock Option Agreement under the 2010 Master Stock Incentive Plan (Filed as Exhibit 10-CC to 2012 Form 10-K Report)*** |
| *10-DD | — | Form of Management Severance Agreement for Executive Officers (Filed as Exhibit 10.1 to Form 8-K Report filed March 7, 2013)*** |
| *10-EE | — | Compensation Plan for Non-Employee Directors (Filed as Exhibit 10-B to Form 10-Q Report filed March 7, 2013)*** |
| 10-FF | — | Non-Employee Director Automatic Stock Option Grant Program*** |
| *10-GG | — | Credit Agreement among Donaldson Company, Inc. and certain listed lending parties dated as of December 7, 2012 (Filed as Exhibit 10.1 to Form 8-K Report filed December 13, 2012)* |
11 | — | Computation of net earnings per share (See “Earnings Per Share” in “Summary of Significant Accounting Policies” in Note A in the Notes to Consolidated Financial Statements on page 31) 34) |
| 21 | — | Subsidiaries |
21
23 | — | Subsidiaries
|
| | |
23
| —
| Consent of PricewaterhouseCoopers LLP |
| 24 | — | |
24
| —
| Powers of Attorney |
| 31-A | — | |
31-A
| —
| Certification of Chief Executive Officer pursuant to Section 302 of the Sarbanes-Oxley Act of 2002 |
| 31-B | — | |
31-B
| —
| Certification of Chief Financial Officer pursuant to Section 302 of the Sarbanes-Oxley Act of 2002 |
| 32 | — | |
32
| —
| Certifications of Chief Executive Officer and Chief Financial Officer pursuant to 18 U.S.C. Section |
| | 1350, as adopted pursuant to Section 906 of the Sarbanes-Oxley Act of 2002 |
| 101 | — | |
101
| —
| The following financial information from the Donaldson Company, Inc. Annual Report on Form 10-K |
| | for the fiscal year ended July 31, 20112013 as filed with the Securities and Exchange Commission, formatted in Extensible Business Reporting Language (XBRL): (i) the Consolidated Statements of Earnings, (ii) the Consolidated Balance Sheets, (iii) the Consolidated Statements of Cash Flows (iv) the Consolidated Statement of Changes in Shareholders’ Equity and (v) the Notes to Consolidated Financial Statements. |
_________________
| |
* | Exhibit has previously been filed with the Securities and Exchange Commission and is incorporated herein by reference as an exhibit. |
| |
** | Pursuant to the provisions of Regulation S-K Item 601(b)(4)(iii)(A) copies of instruments defining the rights of holders of certain long-term debts of the Company and its subsidiaries are not filed and in lieu thereof the Company agrees to furnish a copy thereof to the Securities and Exchange Commission upon request. |
| |
***
| |
*** Denotes compensatory plan or management contract.
Note: Exhibits have been furnished only to the Securities and Exchange Commission. Copies will be furnished to individuals upon request.
61