1400 West 94th Street, Minneapolis, Minnesota 55431 (Address of principal executive offices) (Zip Code) Common Stock, $5 Par Value ☒ Non-accelerated filer Factors” in this Annual Report on Form 10-K (Annual Report). Year Ended July 31, 2014 2013 2012 Engine Products segment Off-Road Products 14% 15% 15% On-Road Products 5% 5% 7% Aftermarket Products* 41% 38% 37% Aerospace and Defense Products 4% 4% 4% *includes replacement part sales to the Company’s OEM Customers Industrial Products segment Industrial Filtration Solutions Products 23% 22% 22% Gas Turbine Products 6% 9% 7% Special Applications Products 7% 7% 8% years ended July 31, 2016, 2015 and 2014: included in Item 8 of this Annual Report. substitution, process improvement, and product redesigns. July 31, 2015.xAnnual Report Pursuant to Section 13 or 15(d) of the Securities ExchangeAct of 1934 for the fiscal year ended July 31, 2014 oroTransition Report Pursuant to Section 13 or 15(d) of the SecuritiesExchange Act of 1934 for the transition period from __________ to __________☒ Annual Report Pursuant to Section 13 or 15(d) of the Securities Exchange Act of 1934 for the fiscal year ended July 31, 2016 or ☐ Transition Report Pursuant to Section 13 or 15(d) of the Securities Exchange Act of 1934 for the transition period from __________ to __________ 
DONALDSON COMPANY, INC.(Exact name of registrant as specified in its charter)Delaware 41-0222640 Delaware41-0222640(I.R.S. EmployerTitle of each class Name of each exchange
on which registeredNew York Stock Exchange Preferred Stock Purchase RightsNew York Stock Exchangex ☒ Yeso ☐ Noo ☐ Yesx ☒ Nox ☒ Yeso ☐ Nox. ☒ Yeso ☐ NoxLarge accelerated filer x☒Accelerated filer o☐o☐ (Do not check if a smaller reporting company)Smaller reporting company o☐o☐ Yesx ☒ No2014,2016, the last business day of the registrant’s most recently completed second fiscal quarter, the aggregate market value of voting and non-voting common stock held by non-affiliates of the registrant was $5,927,321,901$3,714,825,006 (based on the closing price of $41.26$28.18 as reported on the New York Stock Exchange as of that date).24, 2014,21, 2016, there were approximately 138,365,916132,675,711 shares of the registrant’s common stock outstanding.20142016 annual meeting of stockholders (the “2014“2016 Proxy Statement”) are incorporated by reference in Part III, as specifically set forth in Part III.PagePage 3677710102626275858595959606161616263Customercustomer relationships and its global presence. Products are manufactured at 3942 plants around the world and through three joint ventures.andsystems as well as replacement filters. The Engine Products segment sells to original equipment manufacturers (OEMs) in the construction, mining, agriculture, aerospace, defense and truck markets, and to independent distributors, OEM dealer networks, private label accounts and large equipment fleets. Products in the Industrial Products segment consist of dust, fume and mist collectors, compressed air purification systems, air filtration systems for gas turbines, PTFEpolytetrafluoroethylene (PTFE) membrane-based products and specialized air and gas filtration systems for applications including computer hard disk drives and semi-conductor manufacturing. The Industrial Products segment sells to various industrial dealers, distributors, OEMs of gas-fired turbines and OEMs and end-users requiring clean filtration solutions and replacement filters.this report in Part I, Item 1A, “Risk Factors.”last three fiscal years: Year Ended July 31, 2016 2015 2014 Engine Products segment Off-Road Products 10% 11% 14% On-Road Products 6% 6% 5% Aftermarket Products* 43% 41% 41% Aerospace and Defense Products 4% 5% 4% Industrial Products segment Industrial Filtration Solutions Products 23% 22% 23% Gas Turbine Products 7% 8% 6% Special Applications Products 7% 7% 7% * Includes replacement part sales to the Company’s OEM customers K18 in the Notes to Consolidated Financial Statements on page 54.and current reports on Form 8-K, proxy statements and other information (including amendments to those reports,reports) available free of charge through its website at www.donaldson.com, as soon as reasonably practicable after it electronically files such material with (or furnishes such material to) the Securities and Exchange Commission. Also available on the Company’s website are corporate governance documents, including the Company’s Code of Business Conduct and Ethics, Corporate Governance Guidelines, Audit Committee charter, Human Resources Committee charter and Corporate Governance Committee charter. These documents are also available in print, free of charge, to any person who requests them in writing to the attention of Investor Relations, MS 102, Donaldson Company, Inc., 1400 West 94th94th Street, Minneapolis,Bloomington, Minnesota 55431. The information contained on the Company’s website is not incorporated by reference into this Annual Report on Form 10-K and should not be considered to be part of this Form 10-K.report.Customercustomer plant closures. and innovation, price, geographic coverage, service and product performance. The Company competes in a number of highly competitive filtration markets in both segments. The Company believes it is a market leader within many of its product lines, specifically within its Off-Road Equipment and On-Road Products lines for OEMs, and is a significant participant in the aftermarket for replacement filters. The Engine Products segment’s principal competitors include several large global competitors and many regional competitors, especially in the Engine Aftermarket Products business. The Industrial Products segment’s principal competitors vary from country to country and include several large regional and global competitors and a significant number of smaller competitors who compete in a specific geographical region or in a limited number of product applications.products.products including plastics, rubber, and adhesives. Purchased raw materials represent approximately 6060% to 65 percent65% of the Company’s cost of goods sold. Of that amount, steel, including fabricated parts, represents approximately 25 percent.20%. Filter media represents approximately 15 to 20 percent20% and the remainder is primarily made up of petroleum-based products and other raw material components.typically has multiple sourcesanticipates a moderately favorable impact from commodity prices in fiscal 2017, as compared to fiscal 2016, specifically for petroleum-based products. On an ongoing basis, the Company enters into selective supply arrangements with certain of supply forits suppliers that allow the raw materials essentialCompany to reduce volatility in its costs. The Company strives to recover or offset all material cost increases through selective price increases to its business, but does rely primarily on two media suppliers. The Company is not required to carry significant amounts of rawcustomers and the Company’s cost reduction initiatives, which include material inventory to secure supplier allotments. However, the Company does stock finished goods inventory at its regional distribution centers in order to meet anticipated Customer demand. The Company has not experienced significant supply problems in the purchase of its major raw materials., and Donaldson® trademarks. However, itthe Company does not regard the validity of any one patent or trademark as being of material importance. There wereCustomerscustomers that accounted for over 10 percent10% of net sales in Fiscal 2014, 2013, or 2012. There werethe years ended July 31, 2016, 2015 and 2014. The Company had no Customerscustomers that accounted for over 10 percent10% of gross accounts receivable in Fiscal 2014at July 31, 2016 or Fiscal 2013.2014,2016, the backlog of orders expected to be delivered within 90 days was $375.1$323.0 million. The 90-day backlog at August 31, 2013,2015, was $351.7$331.0 million. Backlog is one of many indicators of business conditions in the Company’s markets. However, it is not always indicative of future results for a number of reasons, including short lead times in the Company’s replacement parts businesses and the timing of orders in many of the Company’s Engine Products OEM and Industrial Products markets.Fiscalthe years ended July 31, 2016, 2015 and 2014, the Company spent $55.5 million, $60.2 million and $61.8 million, respectively, on research and development activities. Research and development expenses include basic scientific research and the application of scientific advances to the development of new and improved products and their uses. The Company spent $62.6 million and $59.6 million in Fiscal 2013 and Fiscal 2012, respectively, on research and development activities. Substantially all commercial research and development is performed in-house.
2016.
Customercustomer applications throughout the world. These risks and uncertainties could adversely affect our operating performance and financial condition. The following discussion, along with discussions elsewhere in this report, outlineoutlines the risks and uncertainties that we believe are the most material to our business at this time. We want to further highlight the risks and uncertainties associated with: world economic factors and ongoing global economic uncertainty, the reduced demand for hard disk drive products with the increased use of flash memory, the potential for some Customers to increase their reliance on their own filtration capabilities, currency fluctuations, commodity prices, political factors, our international operations, highly competitive markets, governmental laws and regulations, including the impact of the various economic stimulus and financial reform measures, the implementation of our new information technology systems, information security and data breaches, potential global events resulting in market instability including financial bailouts and defaults of sovereign nations, military and terrorist activities, including political unrest in the Middle East and Ukraine, other political changes, health outbreaks, natural disasters, and other factors discussed below. We undertake no obligation to publicly update or revise any forward-looking statements, whether as a result of new information, future events, or otherwise.Operating internationally carries risks whichnegatively affectimpact our results or financial performance. We have sales and manufacturing operations throughout the world, with the heaviest concentrationscondition in the Americas, Europe, and Asia. Our stability, growth, and profitability are subject to a number of risks of doing business internationally that could harmany particular period as our business including:•political and military events,•legal and regulatory requirements, including import, export, defense regulations, anti-corruption laws, and foreign exchange controls,•tariffs and trade barriers,•potential difficulties in staffing and managing local operations,•credit risk of local Customers and distributors,•difficulties in protecting intellectual property,•local economic, political, and social conditions, specifically in the Middle East, Ukraine, China, Thailand, and other emerging markets where we do business,•potential global health outbreaks, and•natural disasters. Duecan be sensitive to the international scope of our operations, we are subject to a complex system of import-varying conditions in all major geographies and export-related laws and regulations. Any alleged or actual violations may subject us to government scrutiny, investigation, and civil and criminal penalties, and may limit our ability to import or export our products or to provide services outside the United States (U.S.). In addition, the U.S. Foreign Corrupt Practices Act andsimilar foreign anti-corruption laws generally prohibit companies and their intermediaries from making improper payments or providing anything of value to improperly influence foreign government officials for the purpose of obtaining or retaining business, or obtaining an unfair advantage. Recent years have seen a substantial increase in the global enforcement of anti-corruption laws. Violations of these laws may result in severe criminal or civil sanctions, could disrupt our business, and result in an adverse effect on our reputation, business, and results of operations or financial condition.MaintainingProducts - maintaining a competitive advantage requires continuing investment with uncertain returns.
We In addition, we may be adversely impacted by changes in technology that could reduce or eliminate the demand for our products. These risks include:
|
| |
|
| |
|
|
Difficultiesinclude wider adoption of technologies providing alternatives to diesel engines.
Demand for our products relies on economic and industrial conditions worldwide.
Changes in economic or industrial conditions could impact our results of operations or financial condition in any particular period as our business can be sensitive to varying conditions by region across the globe.
While sales to Caterpillar accounted for slightly less than 10 percent of our net sales in Fiscal 2014, 2013, and 2012,
We participate in highly competitive markets with pricing pressure. If we are not able to compete effectively our margins and results of operations could be adversely affected.
The businesses and product lines in which we participate are very competitive and we risk losing business based on a wide range of factors including technology, price, geographic coverage, product performance, and Customer service. Large Customers continue to seek productivity gains and lower prices from us and their other suppliers. We may lose business or negatively impact our margins if we are unable to deliver the best value to our Customers.
Changes in our product mix impact our financial performance.
We sell products that have varying profit margins. Our financial performance can be impacted depending on the mix of products we sell during a given period. Our outlook assumes a certain geographic mix of sales as well as a product mix of sales. If actual results vary from this projected geographic and product mix of sales, our results could be negatively impacted.
Unavailable or higher cost materials could impact our financial performance.
We obtain raw materials including steel, filter media, petroleum-based products, and other components from third-party suppliers and tend to carry limited raw material inventories. An unanticipated delay in delivery by our suppliers could result in the inability to deliver on-time and meet the expectations of our Customers. This could negatively affect our financial performance. An increase in commodity prices could also result in lower operating margins.
Unfavorable fluctuationsunfavorable fluctuation in foreign currency exchange rates could negativelyadversely impact our results and financial position.
result of operations.
Acquisitions In addition, decreased value of local currency may have an impact onmake it difficult for some of our results.
We have madecustomers, distributors and continueend users to pursue acquisitions. We cannot guarantee that these acquisitions will have a positive impact onpurchase our results. These acquisitions could negatively impact our profitability due to operatingproducts.
CostsRegulatory - costs associated with lawsuits, investigations or investigationscomplying with laws and regulations may have an adverse effect on our results of operations.
Additional
net income.
assessments of our tax exposures may have an adverse effect on the Company’sour provision for income taxes and cash tax liability.
Compliance
Weno assurance, however, that the cost or availability of future borrowings will not be impacted by future capital market disruptions.
Americas Riverbank, California (I)* Valencia, California (E)* Dixon, Illinois Frankfort, Indiana Cresco, Iowa Nicholasville, Kentucky Chesterfield, Missouri (E)* Stevens Point, Wisconsin Sao Paulo, Brazil (E)* Brockville, Canada (E)* New Delhi, India Aguascalientes, Mexico Rayong, Thailand (I) Distribution Centers Most, Czech Republic Dammam, Saudi Arabia (I) The Company’s properties are utilized for both the Engine and Industrial Products segments except as indicated with an (E) for Engine or (I) for Industrial. The Company leases certain of its facilities, primarily under long-term leases. The facilities denoted Name Age Positions and Offices Held First Fiscal Year Amy C. Becker 49 Vice President, General Counsel and Secretary 2014 Tod E. Carpenter 55 Chief Operating Officer 2008 William M. Cook 61 Chairman, President and Chief Executive Officer 1994 Sandra N. Joppa 49 Vice President, Human Resources 2006 Mary Lynne Perushek 56 Vice President and Chief Information Officer 2007 Thomas R. Scalf 48 Senior Vice President, Engine Products 2014 James F. Shaw 45 Vice President and Chief Financial Officer 2012 Wim Vermeersch 48 Vice President, Europe and Middle East 2012 Jay L. Ward 50 Senior Vice President, Industrial Products 2006 Eugene X. Wu 46 Vice President, Asia Pacific 2012 On April 1, 2015, Mr. Chief Executive Officer. 2013, Ms. PricewaterhouseCoopers LLP. President of Blow Molded Specialties, Inc., a manufacturing company focused on the extrusion of blow molded parts and assemblies. $ $ $ $ Period Total Number of Average Price Total Number of Maximum Number May 1 - May 31, 2014 756,257 $ 41.35 756,257 10,544,144 June 1 - June 30, 2014 1,204,889 $ 41.29 1,204,889 9,339,255 July 1 - July 31, 2014 801,028 $ 40.86 795,545 8,543,710 Total 2,762,174 $ 41.18 2,756,691 8,543,710 (1) On Year Ended July 31, 2009 2010 2011 2012 2013 2014 Donaldson Company, Inc. $ 100.00 $ 126.32 $ 148.88 $ 185.33 $ 199.13 $ 216.11 S&P 500 100.00 113.83 136.21 148.64 185.80 217.28 S&P Industrial Machinery 100.00 131.25 158.27 166.58 233.72 274.37 Year Ended July 31, 2014 2013 2012 2011 2010 Net sales $ 2,473.5 $ 2,436.9 $ 2,493.2 $ 2,294.0 $ 1,877.1 Net earnings 260.2 247.4 264.3 225.3 166.2 Basic earnings per share 1.79 1.67 1.76 1.46 1.07 Diluted earnings per share 1.76 1.64 1.73 1.43 1.05 Total assets 1,942.4 1,743.6 1,730.1 1,726.1 1,499.5 Long-term obligations 243.7 102.8 203.5 205.7 256.2 Cash dividends declared per share 0.610 0.450 0.335 0.280 0.240 Cash dividends paid per share 0.575 0.410 0.320 0.268 0.235 1995 statement below. decreased 4.5% Net Sales Percent Year ended July 31, 2012 $ 2,493.2 NA Net sales change, excluding foreign currency translation impact (24.1 ) (1.0 )% Foreign currency translation impact (32.2 ) (1.3 )% Year ended July 31, 2013 $ 2,436.9 (2.3 )% Net sales change, excluding foreign currency translation impact 48.0 2.0 % Foreign currency translation impact (11.4 ) (0.5 )% Year ended July 31, 2014 $ 2,473.5 1.5 % Net Earnings Percent Year ended July 31, 2012 $ 264.3 NA Net earnings change, excluding foreign currency translation impact (14.8 ) (5.6 )% Foreign currency translation impact (2.1 ) (0.8 )% Year ended July 31, 2013 $ 247.4 (6.4 )% Net earnings change, excluding foreign currency translation impact 13.8 5.6 % Foreign currency translation impact (1.0 ) (0.4 )% Year ended July 31, 2014 $ 260.2 5.2 % 2014 2013 2012 (thousands of dollars) Engine Products segment: Off-Road Products $ 342,205 $ 358,834 $ 376,870 On-Road Products 130,029 128,446 163,934 Aftermarket Products* 1,012,165 912,717 922,660 Aerospace and Defense Products 99,628 104,191 106,676 Total Engine Products segment 1,584,027 1,504,188 1,570,140 Industrial Products segment: Industrial Filtration Solutions Products 553,356 529,751 553,453 Gas Turbine Products 156,860 232,922 180,669 Special Applications Products 179,223 170,087 188,986 Total Industrial Products segment 889,439 932,760 923,108 Total Company $ 2,473,466 $ 2,436,948 $ 2,493,248 Engine Industrial Corporate & Total (thousands of dollars) 2014 Net sales $ 1,584,027 $ 889,439 $ — $ 2,473,466 Earnings before income taxes 233,920 133,978 (7,195 ) 360,703 2013 Net sales $ 1,504,188 $ 932,760 $ — $ 2,436,948 Earnings before income taxes 220,892 139,108 (11,819 ) 348,181 2012 Net sales $ 1,570,140 $ 923,108 $ — $ 2,493,248 Earnings before income taxes 227,941 149,249 (6,410 ) 370,780 2014 2013 2012 Engine Products 61.5 % 60.8 % 59.1 % Industrial Products 37.9 % 39.7 % 40.3 % Corporate and Unallocated 0.6 % (0.5 )% 0.6 % Total Company 100.0 % 100.0 % 100.0 % 2014 2013 2012 United States 20.3 % 26.0 % 30.3 % Europe 33.7 % 31.6 % 29.9 % Asia - Pacific 33.8 % 30.3 % 31.1 % Other 12.2 % 12.1 % 8.7 % Total Company 100.0 % 100.0 % 100.0 % address its level of profitability and also invest in other strategic initiatives. 5.5%. North America, and new program wins in Europe. in North America. fluctuations, Aftermarket products sales increased 2.1% with sales in the Americas increasing by 1.6%, Europe by 3.1% and Asia by 0.8%. Industrial Products Segment 3.5%. In constant currency fiscal 2016 Industrial Products sales decreased $27.3 million, or 3.1%. are consistent with fiscal 2015. $16.3 million. 2013 2012 2011 Engine Products 60.8 % 59.1 % 64.1 % Industrial Products 39.7 % 40.3 % 38.7 % Corporate and Unallocated (0.5 )% 0.6 % (2.8 )% Total Company 100.0 % 100.0 % 100.0 % 2013 2012 2011 United States 26.0 % 30.3 % 19.8 % Europe 31.6 % 29.9 % 31.0 % Asia - Pacific 30.3 % 31.1 % 39.6 % Other 12.1 % 8.7 % 9.6 % Total Company 100.0 % 100.0 % 100.0 % Payments Due by Period Contractual Obligations Total Less than 1 - 3 3 - 5 More than Long-term debt obligations $ 241,051 $ — $ — $ 116,051 $ 125,000 Capital lease obligations 3,177 1,329 1,766 82 — Interest on long-term debt obligations 64,861 10,294 20,481 10,836 23,250 Operating lease obligations 31,464 12,877 13,504 4,976 107 Purchase obligations(1) 162,727 154,297 8,412 2 16 Pension and deferred compensation(2) 91,504 17,913 10,670 10,597 52,324 Total(3) $ 594,784 $ 196,710 $ 54,833 $ 142,544 $ 200,697 2016. 1.25%. At July 31, 2016 and 2015, there was $38.2 million and $49.7 million, respectively, available under these two credit facilities. 2015, which had a maturity date of less than twelve months. At July 31, 2016 and 2015, there were no amounts drawn upon these letters of credit. Cash Equivalents Off-Balance Sheet Arrangements incurred in the future. The Company will continue to monitor results and expected cash flows in the future to assess whether goodwill impairment in the GTS reporting unit may be necessary. Defined Benefit Pension PlansThe Company incurs expenses relating to employee benefits such as non-contributory defined benefit pension plans. In accounting for these defined benefit pension plans, management must make a variety of assumptions and estimates including mortality rates, discount rates, overall Company compensation increases, expected return on plan assets, and health care cost trend rates. The Company considers historical data as well as current facts and circumstances and uses a third-party specialist to assist management in determining these estimates. Reflecting the relatively long-term nature of the U.S. plans’ obligations, approximately allocations for the U.S. plans. The Company relevant projected cash outflows. this Annual Report. Tod E. Carpenter September Year ended July 31, 2014 2013 2012 (thousands of dollars, except share Net sales $ 2,473,466 $ 2,436,948 $ 2,493,248 Cost of sales 1,595,640 1,589,821 1,619,485 Gross profit 877,826 847,127 873,763 Selling, general, and administrative 460,250 441,168 451,158 Research and development 61,837 62,630 59,589 Operating income 355,739 343,329 363,016 Other income, net (15,164 ) (15,762 ) (19,253 ) Interest expense 10,200 10,910 11,489 Earnings before income taxes 360,703 348,181 370,780 Income taxes 100,479 100,804 106,479 Net earnings $ 260,224 $ 247,377 $ 264,301 Weighted average shares - basic 145,594,300 148,273,904 150,286,403 Weighted average shares - diluted 147,641,113 150,455,193 152,940,605 Net earnings per share - basic $ 1.79 $ 1.67 $ 1.76 Net earnings per share - diluted $ 1.76 $ 1.64 $ 1.73 At July 31, 2014 2013 2012 (thousands of dollars, except share amounts) Net earnings $ 260,224 $ 247,377 $ 264,301 Foreign currency translation gain (loss) (2,122 ) 17,435 (98,723 ) Gain (loss) on hedging derivatives, net of deferred taxes of ($69), ($196), and $117, respectively 71 120 (672 ) Pension and postretirement liability adjustment, net of deferred taxes of $1,319, ($25,656), and $23,527, respectively (6,286 ) 46,860 (42,520 ) Total comprehensive income $ 251,887 $ 311,792 $ 122,386 At July 31, 2014 2013 (thousands of dollars, Assets Current assets Cash and cash equivalents $ 296,418 $ 224,138 Short-term investments 127,201 99,750 Accounts receivable, less allowance of $6,763 and $7,040 474,157 430,766 Inventories, net 253,351 234,820 Deferred income taxes 27,886 26,464 Prepaids and other current assets 46,264 39,724 Total current assets $ 1,225,277 $ 1,055,662 Property, plant, and equipment, net 451,665 419,280 Goodwill 166,406 165,568 Intangible assets, net 36,045 41,307 Other long-term assets 63,018 61,739 Total assets $ 1,942,411 $ 1,743,556 Liabilities and shareholders’ equity Current liabilities Short-term borrowings $ 185,303 $ 9,190 Current maturities of long-term debt 1,738 98,664 Trade accounts payable 216,603 186,460 Accrued employee compensation and related taxes 84,944 68,954 Accrued liabilities 40,845 38,527 Other current liabilities 80,147 74,640 Total current liabilities 609,580 476,435 Long-term debt 243,726 102,774 Deferred income taxes 22,386 23,604 Other long-term liabilities 64,236 55,556 Total liabilities 939,928 658,369 Commitments and contingencies (Note L and Note N) Shareholders’ equity Preferred stock, $1.00 par value, 1,000,000 shares authorized, none issued — — Common stock, $5.00 par value, 240,000,000 shares authorized, 758,216 758,216 Retained earnings 702,435 532,307 Stock compensation plans 19,601 21,745 Accumulated other comprehensive income (loss) (45,810 ) (37,473 ) Treasury stock, 11,237,522 and 5,490,725 shares in 2014 and 2013, at cost (431,959 ) (189,608 ) Total shareholders’ equity 1,002,483 1,085,187 Total liabilities and shareholders’ equity $ 1,942,411 $ 1,743,556 Year ended July 31, 2014 2013 2012 (thousands of dollars) Operating Activities Net earnings $ 260,224 $ 247,377 $ 264,301 Adjustments to reconcile net earnings to net cash provided by operating activities Depreciation and amortization 67,163 64,290 61,165 Equity in losses (earnings) of affiliates, net of distributions (3,384 ) 1,637 (2,380 ) Deferred income taxes (7,762 ) 8,347 6,344 Tax benefit of equity plans (8,781 ) (11,191 ) (10,316 ) Stock compensation plan expense 11,640 9,148 10,553 Loss on sale of business 905 — — Other, net 10,041 (6,175 ) (24,346 ) Changes in operating assets and liabilities, net of acquired businesses Accounts receivable (44,851 ) 3,705 (17,877 ) Inventories (19,273 ) 20,142 (4,149 ) Prepaids and other current assets (7,769 ) 13,495 (17,378 ) Trade accounts payable and other accrued expenses 59,686 (34,852 ) (6,205 ) Net cash provided by operating activities 317,839 315,923 259,712 Investing Activities Purchases of property, plant, and equipment (97,210 ) (94,895 ) (78,139 ) Proceeds from sale of property, plant, and equipment 395 558 969 Purchases of short-term investments (108,793 ) (99,339 ) (187,575 ) Proceeds from sale of short-term investments 81,486 97,365 88,277 Net cash used in investing activities (124,122 ) (96,311 ) (176,468 ) Financing Activities Proceeds from long-term debt 125,000 — — Repayments of long-term debt (81,898 ) (1,353 ) (46,205 ) Change in short-term borrowings 175,344 (86,957 ) 96,715 Purchase of treasury stock (279,395 ) (102,572 ) (130,233 ) Dividends paid (83,070 ) (60,320 ) (47,684 ) Tax benefit of equity plans 8,781 11,191 10,316 Exercise of stock options 14,437 16,043 13,691 Net cash used in financing activities (120,801 ) (223,968 ) (103,400 ) Effect of exchange rate changes on cash (636 ) 2,705 (27,549 ) Increase (decrease) in cash and cash equivalents 72,280 (1,651 ) (47,705 ) Cash and cash equivalents, beginning of year 224,138 225,789 273,494 Cash and cash equivalents, end of year $ 296,418 $ 224,138 $ 225,789 Supplemental Cash Flow Information Cash paid during the year for: Income taxes $ 93,086 $ 84,898 $ 91,915 Interest 11,050 13,531 13,410 Common Additional Retained Stock Accumulated Treasury Total (thousands of dollars, except per share amounts) Balance July 31, 2011 $ 443,216 — $ 925,542 $ 24,736 $ 40,027 $ (498,810 ) $ 934,711 Comprehensive income Net earnings 264,301 264,301 Foreign currency translation (98,723 ) (98,723 ) Pension liability adjustment, net of deferred taxes (42,520 ) (42,520 ) Net gain on cash flow hedging derivatives (672 ) (672 ) Comprehensive income 122,386 Treasury stock acquired (130,233 ) (130,233 ) Stock options exercised (9,834 ) (5,116 ) 27,698 12,748 Deferred stock and other activity (2,158 ) 312 213 1,926 293 Performance awards (9 ) (1 ) (10 ) Stock option expense 7,800 7,800 Tax reduction - employee plans 11,992 11,992 Two-for-one Stock split 315,000 (776,369 ) 461,369 — Dividends ($0.335 per share) (49,673 ) (49,673 ) Balance July 31, 2012 758,216 — 366,788 24,948 (101,888 ) (138,050 ) 910,014 Comprehensive income Net earnings 247,377 247,377 Foreign currency translation 17,435 17,435 Pension liability adjustment, net of deferred taxes 46,860 46,860 Net gain on cash flow hedging derivatives 120 120 Comprehensive income 311,792 Treasury stock acquired (102,572 ) (102,572 ) Stock options exercised (10,836 ) (21,256 ) 44,463 12,371 Deferred stock and other activity (2,125 ) (1,677 ) (1,586 ) 4,496 (892 ) Performance awards (573 ) (1,161 ) (1,617 ) 2,055 (1,296 ) Stock option expense 8,300 8,300 Tax reduction - employee plans 13,534 13,534 Dividends ($0.450 per share) (66,064 ) (66,064 ) Balance July 31, 2013 758,216 — 532,307 21,745 (37,473 ) (189,608 ) 1,085,187 Comprehensive income Net earnings 260,224 260,224 Foreign currency translation (2,122 ) (2,122 ) Pension liability adjustment, net of deferred taxes (6,286 ) (6,286 ) Net gain on cash flow hedging derivatives 71 71 Comprehensive income 251,887 Treasury stock acquired (279,395 ) (279,395 ) Stock options exercised (7,000 ) (10,493 ) 30,538 13,045 Deferred stock and other activity (3,144 ) (1,772 ) (431 ) 4,855 (492 ) Performance awards (409 ) (505 ) (1,713 ) 1,651 (976 ) Stock option expense 9,933 9,933 Tax reduction - employee plans 10,553 10,553 Dividends ($0.61 per share) (87,259 ) (87,259 ) Balance July 31, 2014 $ 758,216 $ — $ 702,435 $ 19,601 $ (45,810 ) $ (431,959 ) $ 1,002,483 At July 31, 2014 2013 Raw materials $ 112,522 $ 99,814 Work in process 17,256 29,097 Finished products 123,573 105,909 Total inventories $ 253,351 $ 234,820 At July 31, 2014 2013 Land $ 20,558 $ 21,116 Buildings 273,599 270,022 Machinery and equipment 753,637 687,797 Construction in progress 51,394 46,078 Less accumulated depreciation (647,523 ) (605,733 ) Total property, plant, and equipment, net $ 451,665 $ 419,280 Income TaxesThe provision for income taxes is computed based on the pre-tax income reported for financial statement purposes. Deferred tax assets and liabilities are recognized for the expected future tax consequences attributed to differences between the financial statement carrying amounts of existing assets and liabilities and their respective tax basis. Deferred tax assets and liabilities are measured using the enacted tax rates expected to apply to taxable income in the years in which those temporary differences are expected to reverse. Valuation allowances are recorded to reduce deferred tax assets when it is more-likely-than-not that a tax benefit will not be realized. At July 31, 2014 2013 2012 Foreign currency translation adjustment $ 48,289 $ 50,411 $ 32,976 Net loss on cash flow hedging derivatives, net of deferred taxes (101 ) (172 ) (292 ) Pension and postretirement liability adjustment, net of deferred taxes (93,998 ) (87,712 ) (134,572 ) Total accumulated other comprehensive loss $ (45,810 ) $ (37,473 ) $ (101,888 ) 2014 2013 2012 (thousands, except per share amounts) Weighted average shares - basic 145,594 148,274 150,286 Diluted share equivalents 2,047 2,181 2,655 Weighted average shares - diluted 147,641 150,455 152,941 Net earnings for basic and diluted earnings per share computation $ 260,224 $ 247,377 $ 264,301 Net earnings per share - basic $ 1.79 $ 1.67 $ 1.76 Net earnings per share - diluted $ 1.76 $ 1.64 $ 1.73 Treasury StockRepurchased common stock is stated at cost (determined on an average cost basis) and is presented as a reduction of shareholders’ equity. Stock-Based CompensationThe Company offers stock-based employee compensation plans, which are more fully described in Note expenses for the years ended July 31, 2016, 2015 and 2014, respectively. calculate basic and diluted earnings per share (in millions, except per share amounts): Engine Industrial Total (thousands of dollars) Balance as of July 31, 2012 $ 71,747 $ 91,202 $ 162,949 Foreign exchange translation 574 2,045 2,619 Balance as of July 31, 2013 $ 72,321 $ 93,247 $ 165,568 Foreign exchange translation 52 786 838 Balance as of July 31, 2014 $ 72,373 $ 94,033 $ 166,406 Gross Accumulated Net (thousands of dollars) Balance as of July 31, 2012 $ 80,075 $ (33,875 ) $ 46,200 Amortization expense — (5,503 ) (5,503 ) Foreign exchange translation 1,807 (1,197 ) 610 Balance as of July 31, 2013 $ 81,882 $ (40,575 ) $ 41,307 Amortization expense — (5,154 ) (5,154 ) Retirements (775 ) 600 (175 ) Foreign exchange translation 176 (109 ) 67 Balance as of July 31, 2014 $ 81,283 $ (45,238 ) $ 36,045 2015 (in millions): Fiscal Year 2015 $ 5,029 2016 $ 5,027 2017 $ 4,910 2018 $ 3,474 2019 $ 2,923 Thereafter $ 14,682 1.25%. At July 31, 2016 and 2015, there was $38.2 million and $49.7 million, respectively, available for under these two credit facilities. less than twelve months. 2014 2013 (thousands of dollars) 6.59% Unsecured senior notes, interest payable semi-annually, principal payment of $80.0 million due November 14, 2013 — 80,000 5.48% Unsecured senior notes, interest payable semi-annually, principal payment of $50.0 million due June 1, 2017 50,000 50,000 5.48% Unsecured senior notes, interest payable semi-annually, principal payment of $25.0 million due September 28, 2017 25,000 25,000 5.48% Unsecured senior notes, interest payable semi-annually, principal payment of $25.0 million due November 30, 2017 25,000 25,000 3.72% Unsecured senior notes, interest payable semi-annually, principal payment of $125.0 million due March 27, 2024 125,000 — 2.019% Guaranteed senior note, interest payable semi-annually, principal payment of ¥1.65 billion due May 18, 2014 — 16,848 Variable Rate Guaranteed senior note, interest payable quarterly, principal payment of ¥1.65 billion due May 19, 2019 and an interest rate of 0.56% as of July 31, 2014 16,051 — Capitalized lease obligations and other, with various maturity dates and interest rates 3,177 2,520 Terminated interest rate swap contracts 1,236 2,070 Total 245,464 201,438 Less current maturities 1,738 98,664 Total long-term debt $ 243,726 $ 102,774 In November 2010, the shareholders approved the 2010 Master Stock Incentive Plan (the Plan). The Plan extends through September 2020 and allows for the granting of nonqualified stock options, incentive stock options, restricted stock, restricted stock units, stock appreciation rights, dividend equivalents and other stock-based awards. Options under the Plan are granted to key employees whereby the option exercise price is equivalent to the market price of the Company's common stock at the date of grant. Options are generally exercisable for up to 10 years from the date of grant. The Plan also allows for the granting of performance awards to a limited number of key executives. As administered by the Human Resources Committee of the Company’s Board of Directors to date, these performance awards are payable in common stock and are based on a formula which measures performance of the Company over a three-year period. Performance award expense under these plans totaled $0.3 million, $0.1 million and $0.7 million in the years ended July 31, 2016, 2015 and 2014, respectively. Significant Other Observable Inputs At July 31, 2014 2013 (thousands of dollars) Asset derivatives recorded under the caption Prepaids and other current assets Foreign exchange contracts $ 931 $ 734 Liability derivatives recorded under the caption Other current liabilities Foreign exchange contracts (1,242 ) (845 ) Forward exchange contracts - net liability position $ (311 ) $ (111 ) The Company assesses the impairment of 2014 2013 2012 (thousands of dollars) Service cost $ 18,821 $ 19,439 $ 15,464 Interest cost 19,499 16,953 19,436 Expected return on assets (30,794 ) (28,111 ) (28,114 ) Prior service cost and transition amortization 590 591 725 Actuarial loss amortization 7,403 10,362 5,696 Net periodic benefit cost $ 15,519 $ 19,234 $ 13,207 2014 2013 (thousands of dollars) Change in benefit obligation: Benefit obligation, beginning of year $ 444,943 $ 461,492 Service cost 18,821 19,439 Interest cost 19,499 16,953 Plan amendments — (9 ) Participant contributions 1,308 1,207 Actuarial loss/(gain) 29,638 (27,176 ) Currency exchange rates 8,873 1,225 Divestiture (3,200 ) — Curtailment — (11,692 ) Benefits paid (21,229 ) (16,496 ) Benefit obligation, end of year $ 498,653 $ 444,943 Change in plan assets: Fair value of plan assets, beginning of year $ 452,724 $ 387,576 Actual return on plan assets 45,978 51,524 Company contributions 4,263 28,186 Participant contributions 1,308 1,207 Currency exchange rates 9,912 727 Divestiture (3,086 ) — Benefits paid (21,229 ) (16,496 ) Fair value of plan assets, end of year $ 489,870 $ 452,724 Funded status: Funded/(Underfunded) status at July 31, 2014 and 2013 $ (8,783 ) $ 7,781 Amounts recognized on the consolidated balance sheets consist of: Other long-term assets 17,800 23,234 Other current liabilities (832 ) (949 ) Other long-term liabilities (25,751 ) (14,504 ) Recognized asset / (liability) $ (8,783 ) $ 7,781 Weighted average actuarial assumptions 2014 2013 All U.S. plans: Discount rate 4.33 % 4.58 % Rate of compensation increase 2.61 % 2.61 % Non - U.S. plans: Discount rate 3.64 % 4.04 % Rate of compensation increase 2.79 % 2.92 % Weighted average actuarial assumptions 2014 2013 2012 All U.S. plans: Discount rate 4.58 % 3.59 % 4.91 % Expected return on plan assets 7.50 % 7.50 % 7.75 % Rate of compensation increase 2.61 % 2.61 % 4.50 % Non - U.S. plans: Discount rate 4.04 % 4.13 % 5.36 % Expected return on plan assets 5.48 % 5.20 % 6.03 % Rate of compensation increase 2.92 % 2.86 % 3.57 % Asset Category Quoted Prices in Significant Significant Total 2014 Cash $ 14.2 — — $ 14.2 Global Equity Securities 107.3 87.3 21.1 215.7 Fixed Income Securities 27.0 — 58.7 85.7 Real Assets 7.1 — 13.5 20.6 Total U.S. Assets at July 31, 2014 $ 155.6 $ 87.3 $ 93.3 $ 336.2 2013 Cash $ 18.5 $ — $ — $ 18.5 Global Equity Securities 82.5 50.2 19.4 152.1 Fixed Income Securities 42.9 20.8 60.8 124.5 Real Assets — — 22.1 22.1 Total U.S. Assets at July 31, 2013 $ 143.9 $ 71.0 $ 102.3 $ 317.2 2012 Cash $ 0.9 $ — $ — $ 0.9 Global Equity Securities 61.5 57.3 19.4 138.2 Fixed Income Securities 29.2 19.5 55.0 103.7 Real Assets — — 31.4 31.4 Total U.S. Assets at July 31, 2012 $ 91.6 $ 76.8 $ 105.8 $ 274.2 Global Equity Fixed Income Real Assets Total Beginning balance at August 1, 2011 $ 17.9 $ 31.4 $ 38.0 $ 87.3 Unrealized gains 0.1 0.6 (2.1 ) (1.4 ) Realized gains 1.5 0.4 — 1.9 Purchases 1.0 17.0 2.8 20.8 Sales (1.1 ) (1.7 ) — (2.8 ) Net transfers into (out of) Level 3 — 7.3 (7.3 ) — Ending balance at July 31, 2012 $ 19.4 $ 55.0 $ 31.4 $ 105.8 Unrealized gains (0.8 ) 6.4 1.1 6.7 Realized gains 1.7 0.7 — 2.4 Purchases 2.1 — 1.0 3.1 Sales (3.0 ) (1.3 ) (11.4 ) (15.7 ) Ending balance at July 31, 2013 $ 19.4 $ 60.8 $ 22.1 $ 102.3 Unrealized gains 1.7 (2.0 ) — (0.3 ) Realized gains 2.4 8.9 0.8 12.1 Purchases 2.0 20.0 2.7 24.7 Sales (4.4 ) (29.0 ) (12.1 ) (45.5 ) Ending balance at July 31, 2014 $ 21.1 $ 58.7 $ 13.5 $ 93.3 Fair Value Unfunded Redemption Frequency Redemption Global Equity $ 215.7 $ 5.2 Daily, Monthly, Quarterly, Annually 10 - 100 days Fixed Income 85.7 — Daily, Quarterly, Semi-Annually 60 - 120 days Real Assets 20.6 6.9 Daily, Quarterly 95 days Total $ 322.0 $ 12.1 Asset Category Quoted Prices in Significant Significant Total 2014 Cash $ 5.7 $ — $ — $ 5.7 Global Equity Securities 71.3 — — 71.3 Fixed Income Securities 4.8 23.3 — 28.1 Equity/Fixed Income 18.0 — 30.5 48.5 Total Non-U.S. Assets at July 31, 2014 $ 99.8 $ 23.3 $ 30.5 $ 153.6 2013 Cash $ 0.6 $ — $ — $ 0.6 Global Equity Securities 63.8 — — 63.8 Fixed Income Securities 6.9 21.0 — 27.9 Equity/Fixed Income 16.9 — 26.3 43.2 Total Non-U.S. Assets at July 31, 2013 $ 88.2 $ 21.0 $ 26.3 $ 135.5 2012 Global Equity Securities $ 37.1 $ — $ — $ 37.1 Fixed Income Securities 5.9 28.4 — 34.3 Equity/Fixed Income 13.3 — 21.8 35.1 Real Assets — 6.8 — 6.8 Total Non-U.S. Assets at July 31, 2012 $ 56.3 $ 35.2 $ 21.8 $ 113.3 Equity/Fixed Beginning balance at August 1, 2011 $ 26.3 Unrealized gains 1.4 Foreign currency exchange (3.8 ) Purchases 2.6 Sales (4.6 ) Net transfers into (out of) Level 3 (0.1 ) Ending balance at July 31, 2012 $ 21.8 Unrealized gains 1.1 Foreign currency exchange 1.7 Purchases 2.6 Sales (0.9 ) Ending balance at July 31, 2013 $ 26.3 Unrealized gains 4.3 Realized gains 0.1 Foreign currency exchange 0.1 Purchases 3.1 Sales (3.4 ) Ending balance at July 31, 2014 $ 30.5 Fair Value Unfunded Redemption Frequency Redemption Fixed Income 23.3 — Weekly 7 days Equity/Fixed Income 30.5 — Yearly 90 days Total $ 53.8 $ — Fiscal Year 2015 $ 23,032 2016 $ 22,728 2017 $ 27,717 2018 $ 25,059 2019 $ 27,754 2020-2024 $ 149,865 NOTE Stock Compensation PlansThe Stock Compensation Plans in the Consolidated Statements of Changes in Shareholders’ Equity consist of the balance of amounts payable to eligible participants for stock compensation that was deferred to a Rabbi Trust pursuant to the provisions of the 2010 Master Stock Incentive Plan, as well as performance awards payable in common stock discussed further in Note 2014 2013 Beginning balance 5,490,725 3,980,832 Stock repurchases 6,795,545 2,986,794 Net issuance upon exercise of stock options (863,249 ) (1,288,560 ) Issuance under compensation plans (175,160 ) (174,408 ) Other activity (10,339 ) (13,933 ) Ending balance 11,237,522 5,490,725 (Thousands of dollars) Foreign Pension Derivative Total Balance as of July 31, 2013, net of tax $ 50,411 $ (87,712 ) $ (172 ) $ (37,473 ) Other comprehensive (loss) income before reclassifications and tax (2,949 ) (16,120 ) 413 (18,656 ) Tax benefit (expense) — 4,391 (145 ) 4,246 Other comprehensive (loss) income before reclassifications, net of tax $ (2,949 ) $ (11,729 ) $ 268 (14,410 ) Reclassifications, before tax 827 8,514 (273 ) 9,068 Tax benefit (expense) — (3,071 ) 76 (2,995 ) Reclassifications, net of tax 827 5,443 (b) (197 ) 6,073 Other comprehensive (loss) income, net of tax (2,122 ) (6,286 ) 71 (c) (8,337 ) Balance as of July 31, 2014, net of tax $ 48,289 $ (93,998 ) $ (101 ) $ (45,810 ) (a) Taxes are not provided on cumulative translation adjustments as substantially all translation adjustments relate to earnings that are intended to be indefinitely reinvested outside the U.S. Relates to foreign currency cash flow hedges that were reclassified from accumulated other comprehensive loss to other income, net (see Note 2014 2013 2012 Risk - free interest rate 0.31 - 2.8 % 0.02 - 1.7 % 0.10 - 1.8 % Expected volatility 18.2 - 28.0 % 22.5 - 29.7 % 25.8 - 31.9 % Expected dividend yield 1.4 - 1.6 % 1.0 - 1.4 % 1.0 % Expected life Director and officer grants 8 years 8 years 8 years Non - officer original grants 7 years 7 years 7 years Reload grants ≤6 years ≤5 years ≤8 years Options Weighted Outstanding at July 31, 2011 8,387,994 $ 17.72 Granted 1,082,979 34.76 Exercised (1,379,827 ) 11.90 Canceled (34,819 ) 27.45 Outstanding at July 31, 2012 8,056,327 20.97 Granted 965,050 33.91 Exercised (1,607,081 ) 14.79 Canceled (84,476 ) 33.94 Outstanding at July 31, 2013 7,329,820 23.88 Granted 900,073 42.17 Exercised (1,008,848 ) 18.80 Canceled (23,163 ) 34.02 Outstanding at July 31, 2014 7,197,882 26.84 Range of Exercise Prices Number Weighted Weighted Number Weighted $0.00 to $16.69 1,003,381 1.18 $ 15.93 1,003,381 $ 15.93 $16.70 to $22.69 2,197,543 4.12 19.13 2,197,543 19.13 $22.70 to $28.69 400,114 3.41 22.97 400,114 22.97 $28.70 to $34.69 1,839,809 7.25 31.58 1,254,101 30.59 $34.70 and above 1,757,035 8.10 38.64 622,680 35.52 7,197,882 5.44 26.84 5,477,819 23.31 credit. At July 31, 2016 and 2015, there were no amounts drawn upon these letters of credit. Options Weighted Non - vested at July 31, 2013 1,805,803 $ 9.18 Granted 849,850 11.63 Vested (915,677 ) 9.24 Canceled (19,913 ) 9.47 Non - vested at July 31, 2014 1,720,063 10.35 2014 2013 2012 (thousands of dollars) Earnings before income taxes: United States $ 131,396 $ 147,317 $ 171,101 Foreign 229,307 200,864 199,679 Total $ 360,703 $ 348,181 $ 370,780 2014 2013 2012 (thousands of dollars) Income taxes: Current Federal $ 48,981 $ 35,820 $ 45,468 State 4,724 4,337 4,012 Foreign 54,536 52,300 50,655 108,241 92,457 100,135 Deferred Federal (9,465 ) 7,071 7,391 State 365 312 722 Foreign 1,338 964 (1,769 ) (7,762 ) 8,347 6,344 Total $ 100,479 $ 100,804 $ 106,479 2014 2013 2012 Statutory U.S. federal rate 35.0 % 35.0 % 35.0 % State income taxes 1.1 % 1.2 % 1.2 % Foreign operations (6.1 )% (6.3 )% (5.2 )% Export, manufacturing, and research credits (0.8 )% (1.5 )% (1.0 )% Change in unrecognized tax benefits (1.1 )% 0.5 % (1.0 )% Other (0.2 )% 0.1 % (0.3 )% 27.9 % 29.0 % 28.7 % 2014 2013 (thousands of dollars) Deferred tax assets: Accrued expenses $ 11,118 $ 11,580 Compensation and retirement plans 32,317 23,578 NOL and tax credit carryforwards 3,471 3,279 LIFO and inventory reserves 5,482 5,037 Other 4,470 3,890 Deferred tax assets, gross 56,858 47,364 Valuation allowance (3,471 ) (3,228 ) Net deferred tax assets 53,387 44,136 Deferred tax liabilities: Depreciation and amortization (49,901 ) (45,737 ) Other (1,025 ) (663 ) Deferred tax liabilities (50,926 ) (46,400 ) Prepaid tax assets 4,392 4,015 Net tax asset $ 6,853 $ 1,751 The Company 2014 2013 2012 (thousands of dollars) Gross unrecognized tax benefits at beginning of fiscal year $ 18,419 $ 16,514 $ 20,005 Additions for tax positions of the current year 2,959 5,453 3,323 Additions for tax positions of prior years 1,706 407 261 Reductions for tax positions of prior years (7,113 ) (1,640 ) (4,462 ) Settlements (240 ) (277 ) — Reductions due to lapse of applicable statute of limitations (726 ) (2,038 ) (2,613 ) Gross unrecognized tax benefits at end of fiscal year $ 15,005 $ 18,419 $ 16,514 The Company has an internal measurement system to evaluate performance and allocate resources based on Engine Industrial Corporate & Total (thousands of dollars) 2014 Net sales $ 1,584,027 $ 889,439 $ — $ 2,473,466 Depreciation and amortization 38,925 23,942 4,296 67,163 Equity earnings in unconsolidated affiliates 5,596 940 — 6,536 Earnings before income taxes 233,920 133,978 (7,195 ) 360,703 Assets 900,083 572,000 470,328 1,942,411 Equity investments in unconsolidated affiliates 17,439 3,959 — 21,398 Capital expenditures 56,340 34,652 6,218 97,210 2013 Net sales $ 1,504,188 $ 932,760 $ — $ 2,436,948 Depreciation and amortization 35,815 22,447 6,028 64,290 Equity earnings in unconsolidated affiliates 4,000 693 — 4,693 Earnings before income taxes 220,892 139,108 (11,819 ) 348,181 Assets 826,151 527,416 389,989 1,743,556 Equity investments in unconsolidated affiliates 15,563 3,277 — 18,840 Capital expenditures 52,864 33,134 8,897 94,895 2012 Net sales $ 1,570,140 $ 923,108 $ — $ 2,493,248 Depreciation and amortization 36,646 18,852 5,667 61,165 Equity earnings in unconsolidated affiliates 3,966 769 — 4,735 Earnings before income taxes 227,941 149,249 (6,410 ) 370,780 Assets 845,176 520,739 364,167 1,730,082 Equity investments in unconsolidated affiliates 17,304 2,822 — 20,126 Capital expenditures 46,816 24,083 7,240 78,139 2014 2013 2012 (thousands of dollars) Engine Products segment: Off-Road Products $ 342,205 $ 358,834 $ 376,870 On-Road Products 130,029 128,446 163,934 Aftermarket Products* 1,012,165 912,717 922,660 Aerospace and Defense Products 99,628 104,191 106,676 Total Engine Products segment 1,584,027 1,504,188 1,570,140 Industrial Products segment: Industrial Filtration Solutions Products 553,356 529,751 553,453 Gas Turbine Products 156,860 232,922 180,669 Special Applications Products 179,223 170,087 188,986 Total Industrial Products segment 889,439 932,760 923,108 Total Company $ 2,473,466 $ 2,436,948 $ 2,493,248 Net Sales Property, Plant, & (thousands of dollars) 2014 United States $ 1,019,926 $ 196,712 Europe 728,554 128,904 Asia - Pacific 517,305 72,089 Other 207,681 53,960 Total $ 2,473,466 $ 451,665 2013 United States $ 1,010,934 $ 166,614 Europe 678,996 123,710 Asia - Pacific 546,406 75,206 Other 200,612 53,750 Total $ 2,436,948 $ 419,280 2012 United States $ 1,064,474 $ 146,328 Europe 678,619 114,266 Asia - Pacific 572,163 80,200 Other 177,992 44,115 Total $ 2,493,248 $ 384,909 equipment by geographic region are summarized as follows (in millions): 2015. Balance at July 31, 2012 $ 10,905 Accruals for warranties issued during the reporting period 5,940 Accruals related to pre-existing warranties (including changes in estimates) (1,081 ) Less settlements made during the period (5,238 ) Balance at July 31, 2013 $ 10,526 Accruals for warranties issued during the reporting period 4,339 Accruals related to pre-existing warranties (including changes in estimates) (1,185 ) Less settlements made during the period (4,651 ) Balance at July 31, 2014 $ 9,029 First Second Third Fourth (thousands of dollars) 2014 Net sales $ 599,384 $ 581,622 $ 624,234 $ 668,226 Gross profit 214,394 201,648 223,461 238,323 Net earnings 61,592 58,340 67,336 72,956 Basic earnings per share 0.42 0.40 0.46 0.51 Diluted earnings per share 0.41 0.39 0.46 0.50 Dividends declared per share 0.140 0.140 0.165 0.165 Dividends paid per share 0.130 0.140 0.140 0.165 2013 Net sales $ 588,947 $ 596,036 $ 619,371 $ 632,594 Gross profit 198,293 198,977 221,501 228,356 Net earnings 54,113 50,813 69,842 72,609 Basic earnings per share 0.36 0.34 0.47 0.49 Diluted earnings per share 0.36 0.34 0.46 0.48 Dividends declared per share 0.090 0.100 0.130 0.130 Dividends paid per share 0.090 0.090 0.100 0.130 The Company of this Annual Report. Report. Plan Category Number of securities Weighted - average Number of securities (a) (b) (c) Equity compensation plans approved by security holders: 1980 Master Stock Compensation Plan: Deferred Stock Gain Plan 44,312 $ 8.1173 — 1991 Master Stock Compensation Plan: Deferred Stock Option Gain Plan 527,737 $ 19.3285 — Deferred LTC/Restricted Stock 200,760 $ 12.7226 — 2001 Master Stock Incentive Plan: Stock Options 3,166,009 $ 19.3330 — Deferred LTC/Restricted Stock 238,861 $ 18.9174 — 2010 Master Stock Incentive Plan: Stock Options 2,936,465 $ 34.9944 See Note 1 Stock Options for Non-Employee Directors 517,712 34.7748 Long-Term Compensation 52,128 $ 32.6187 — Subtotal for plans approved by security holders 7,683,984 $ 26.1980 Equity compensation plans not approved by security holders: Non-qualified Stock Option Program for Non-Employee Directors 577,696 $ 19.4558 See Note 2 ESOP Restoration 35,367 $ 7.5708 See Note 3 Subtotal for plans not approved by security holders 613,063 18.7702 Total 8,297,047 25.6491 President, Chief Executive Officer (Principal Executive Officer) /s/ Vice President and Chief Financial Officer (Principal Financial Officer) /s/ Melissa A. Osland Controller Melissa A. Osland (Principal Accounting Officer) * Director Michael J. Hoffman Willard D. Oberton James J. Owens Ajita G. Rajendra * Amy C. Becker As attorney-in-fact Additions Description Balance at Charged to Charged to Deductions Balance at Year ended July 31, 2014: Allowance for doubtful accounts deducted from accounts receivable $ 7,040 $ 393 $ (1 ) $ (669 ) $ 6,763 Year ended July 31, 2013: Allowance for doubtful accounts deducted from accounts receivable $ 6,418 $ 1,241 $ 230 $ (849 ) $ 7,040 Year ended July 31, 2012: Allowance for doubtful accounts deducted from accounts receivable $ 6,908 $ 1,151 $ (676 ) $ (965 ) $ 6,418 EXHIBIT INDEX *3-B — Certificate of Designation, Preferences and Rights of Series A Junior Participating Preferred Stock of Registrant, dated as of March 3, 2006 (Filed as Exhibit 3-B to 2011 Form 10-K Report) *3-C — Amended and Restated Bylaws of Registrant (as of *4 — ** *4-A — Preferred Stock Amended and Restated Rights Agreement between Registrant and Wells Fargo Bank, N.A., as Rights Agent, dated as of January 27, 2006 (Filed as Exhibit 4-A to 2011 Form 10-K Report) *10-A — Officer Annual Cash Incentive Plan (Filed as Exhibit 10-A to 2011 Form 10-K Report)*** *10-B — 1980 Master Stock Compensation Plan as Amended (Filed as Exhibit 10-A to Form 10-Q Report filed for the first quarter ended October 31, 2008)*** *10-C — Form of Performance Award Agreement under 1991 Master Stock Compensation Plan (Filed as Exhibit 10-B to Form 10-Q Report filed for the first quarter ended October 31, 2008)*** *10-D — ESOP Restoration Plan (2003 Restatement) (Filed as Exhibit 10-D to 2009 Form 10-K Report)*** *10-E — Compensation Plan for *10-F — Independent Director Retirement and Death Benefit Plan as amended (Filed as Exhibit 10-D to Form 10-Q Report filed for the first quarter ended October 31, 2008)*** *10-G — Supplemental Executive Retirement Plan (2008 Restatement) (Filed as Exhibit 10-G to 2011 Form 10-K Report)*** *10-H — 1991 Master Stock Compensation Plan as amended (Filed as Exhibit 10-E to Form 10-Q Report filed for the first quarter ended October 31, 2008)*** *10-I — Form of Restricted Stock Award under 1991 Master Stock Compensation Plan (Filed as Exhibit 10-F to Form 10-Q Report filed for the first quarter ended October 31, 2008)*** *10-J — Form of Agreement to Defer Compensation for certain Executive Officers (Filed as Exhibit 10-G to Form 10-Q Report filed for the first quarter ended October 31, 2008)*** *10-K — Stock Option Program for Non-employee Directors (Filed as Exhibit 10-H to Form 10-Q Report filed for the first quarter ended October 31, 2008)*** *10-L — Note Purchase Agreement among Donaldson Company, Inc. and certain listed Insurance Companies Dated as of July 15, 1998 (Filed as Exhibit 10-I to Form 10-Q Report filed for the first quarter ended October 31, 2008) *10-M — Second Supplement and First Amendment to Note Purchase Agreement among Donaldson Company, Inc. and certain listed Insurance Companies dated as of September 30, 2004 (Filed as Exhibit 10-N to 2010 Form 10-K Report) *10-N — 2001 Master Stock Incentive Plan (Filed as Exhibit 10-O to 2009 Form 10-K Report)*** *10-O — Form of Officer Stock Option Award Agreement under the 2001 Master Stock Incentive Plan (Filed as Exhibit 10-P to 2010 Form 10-K Report)*** *10-P — Form of Non-Employee Director Non-Qualified Stock Option Agreement under the 2001 Master Stock Incentive Plan (Filed as Exhibit 10-Q to 2010 Form 10-K Report)*** *10-Q — Restated Compensation Plan for Non-Employee Directors dated July 28, 2006 (Filed as Exhibit 10-Q to 2011 Form 10-K Report)*** *10-R — Restated Long-Term Compensation Plan dated May 23, 2006 (Filed as Exhibit 10-R to 2011 Form 10-K Report)*** *10-S — Qualified Performance-Based Compensation Plan (Filed as Exhibit 10-S to 2011 Form 10-K Report)*** *10-T — *10-U — Deferred Stock Option Gain Plan (2008 Restatement) (Filed as Exhibit 10-U to 2011 Form 10-K Report) *** *10-V — Excess Pension Plan (2008 Restatement) (Filed as Exhibit 10-V to 2011 Form 10-K Report) *** *10-W — Form of Management Severance Agreement for Executive Officers (Filed as Exhibit 10-A to Form 10-Q Report for the Third Quarter ended April 30, 2008)*** *10-X — 2010 Master Stock Incentive Plan (Filed as Exhibit 4.5 to Registration Statement on Form — Form of Officer Stock Option Award Agreement under the 2010 Master Stock Incentive Plan (Filed as Exhibit 10.1 to Form 8-K Report filed on December 16, 2010) *** *10-Z — Form of Restricted Stock Award Agreement under the 2010 Master Stock Incentive Plan (Filed as Exhibit 10.2 to Form 8-K Report filed on December 16, 2010) *** *10-AA — Non-Employee Director Automatic Stock Option Grant Program (Filed as Exhibit 10-AA to 2011 *10-BB — Form of Indemnification Agreement for Directors (Filed as Exhibit 10.1 to Form 8-K Report filed on April 2, 2012)*** *10-CC — Form of Non-Employee Director Non-Qualified Stock Option Agreement under the 2010 Master Stock Incentive Plan (Filed as Exhibit 10-CC to 2012 Form 10-K Report)*** *10-DD — Form of Management Severance Agreement for Executive Officers (Filed as Exhibit 10.1 to Form 8-K Report filed October 4, 2012)*** *10-EE — Compensation Plan for Non-Employee Directors (Filed as Exhibit 10-B to Form 10-Q Report filed December 6, 2012)*** *10-FF — Non-Employee Director Automatic Stock Option Grant Program (Filed as Exhibit 10-FF to 2013 Form 10-K Report)*** *10-GG — Credit Agreement among Donaldson Company, Inc. and certain listed lending parties dated as of December 7, 2012 (Filed as Exhibit 10.1 to Form 8-K Report filed December 13, 2012)* *10-HH — Note Purchase Agreement, dated as of March 27, 2014, by and among Donaldson Company, Inc. and the purchasers named therein (Filed as Exhibit 10.1 to Form 8-K filed April 2, 2014) *10-II — Form of Employment Agreement for Director Level Employees in Belgium (unofficial English translation) (Filed as Exhibit 10-II to 2014 Form 10-K Report)*** — First Amendment, dated as of March 9, 2015, to Note Purchase Agreement dated as of March 27, 2014, by and among Donaldson Company, Inc. and the purchasers named therein (Filed as Exhibit 10.1 to Form 8-K on March 12, 2015) 21 — Subsidiaries 23 — Consent of PricewaterhouseCoopers LLP 24 — Powers of Attorney 31-A — Certification of Chief Executive Officer pursuant to Section 302 of the Sarbanes-Oxley Act of 2002 31-B — Certification of Chief Financial Officer pursuant to Section 302 of the Sarbanes-Oxley Act of 2002 32 — Certifications of Chief Executive Officer and Chief Financial Officer pursuant to 18 U.S.C. Section 1350, as adopted pursuant to Section 906 of the Sarbanes-Oxley Act of 2002 101 — The following financial information from the Donaldson Company, Inc. Annual Report on Form 10-K for the fiscal year ended July 31, ** ***Item1B. a suburb of Minneapolis, Minnesota. The Company’s principal European administrative and engineering offices are located in Leuven, Belgium. The Company also has extensive operations in the Asia-Pacific and Latin America regions.Company.Company as of July 31, 2016.AmericasEurope / Middle East / AfricaEurope/Africa/Middle East Auburn, Alabama (E) Kadan, Czech Republic (I) Klasterec, Czech Republic Domjean, France (E) Paris, France (E)* Dulmen, Germany (E) Haan, Germany (I) Grinnell,Waterloo, Iowa (E)Ostiglia, Italy (E) Skarbimierz, Poland Bloomington, Minnesota Cape Town, South Africa Bloomington, MinnesotaJohannesburg, South Africa*Johannesburg, South Africa* Chillicothe, Missouri (E) Abu Dhabi, United Arab Emirates Harrisonville, Missouri (I) Hull, United Kingdom Chillicothe, Missouri (E)Leicester, United Kingdom (I) Philadelphia, Pennsylvania (I)Greeneville, TennesseeAustraliaAsia/Pacific Baldwin, WisconsinWyong, AustraliaWyong, Australia AsiaWuxi, China Wuxi, ChinaAguascalientes, MexicoGunma, Japan Monterrey, Mexico (I) Gunma, JapanThird-Party Logistics Providers Wyong, Australia Santiago, Chile Brugge, Belgium Wuxi, China Sao Paulo, Brazil* Bogotá, Colombia Rensselaer, Indiana Cartagena, Colombia Jakarta, Indonesia Mumbai, India Aguascalientes, Mexico Chennai, India Lozorno, Slovakia Plainfield, Indiana (I) Johannesburg, South Africa Gunma, Japan Seoul, South Korea* Auckland, New Zealand Lima, Peru Singapore Greeneville, Tennessee (I) Laredo, Texas Joint Venture Facilities Jakarta, Indonesia Champaign, Illinois (E) Third-Party Logistics ProvidersJakarta, IndonesiaSantiago, ChileWuxi, ChinaMumbai, IndiaDistribution CentersChennai, IndiaWyong, AustraliaPlainfield, Indiana (I)Brugge, BelgiumGunma, JapanSao Paulo, Brazil*Lima, PeruRensselaer, IndianaSingaporeJakarta, IndonesiaGreeneville, Tennessee (I)Aguascalientes, MexicoJohannesburg, South AfricaSeoul, South Korea*reservesestimated liability in its consolidated financial statements areis adequate in light of the probable and estimable outcomes. Any recorded liabilities were not material to the Company’s financial position, results of operations or liquidity and the Company does not believe that any of the currently identified claims or litigation will materially affect its financial position, results of operations or liquidity.terms ofofficers hold office until their successors are for one year.elected and qualify, or their earlier death, resignation or removal. There are no arrangements or understandings between individual officers and any other person pursuant to which the officer was selected as an executive officer.
Appointed as an
Executive OfficerName Age Positions and Offices Held Amy C. Becker 51 Vice President, General Counsel and Secretary 2014 Tod E. Carpenter 57 President and Chief Executive Officer 2008 Sheila G. Kramer 57 Vice President, Human Resources 2015 Scott J. Robinson 49 Vice President and Chief Financial Officer 2015 Thomas R. Scalf 50 Senior Vice President, Engine Products 2014 Jeffrey E. Spethmann 51 Senior Vice President, Industrial Products 2016 Wim Vermeersch 50 Vice President, Europe, Middle East and Africa 2012 Cook joined the Company in 1980 and has held various positions, including CFO and Senior Vice President, International from 2001 to 2004 andCarpenter was appointed President and CEO from 2004 to 2005. Mr. Cook was appointed Chairman, President and CEO in July 2005.JoppaKramer was appointed Vice President, Human Resources in November 2005.October 2015. Prior to that time,joining the Company, Ms. Joppa held various positions at General Mills, a consumer food products company, from 1989 to 2005, including service as Director ofKramer was Vice President, Human Resources for several different operating divisionsTaylor Corporation, a print and graphics media company, from 19992013 until September 2015. From 1991 to 2005.PerushekKramer was with Lifetouch, Inc., a photography company, where she held various human resources roles including Corporate Vice President, Human Resources from 2009 to 2013.InformationFinancial Officer in November 2006.December 2015. Prior to joining the Company, Mr. Robinson was the Chief Financial Officer for Imation Corp. a global scalable storage and data security company, a position he held since August 2014. During his 11 years with Imation, he also served as the Investor Relations Officer, Corporate Controller and Chief Accounting Officer. Prior to that, time, Ms. Perushek was Vice President of Global Information Technologyhe held positions at H.B. Fuller Company, a worldwide manufacturer of adhesive products, from 2005 to 2006,Deluxe Corporation and Chief Information Officer for Young America Corporation, a marketing company, from 1999 to 2004.ShawSpethmann joined the Company in 20042013 and has held various positions, including Director, Corporate Compliance/Internal Audit,Vice President of the Exhaust & Emissions business unit from 2013 to 2014 and Corporate Controller and Principal Accounting OfficerVice President, Global Industrial Air Filtration from 20042014 to 2011.2016. Mr. Shaw Spethmannand Chief Financial Officer effective November 2011.of Industrial Products in April 2016. Prior to joining Donaldson,the Company, from 1999 to 2012, Mr. ShawSpethmann held various positions at Deloitte & Touche, LLPof General Manager and Arthur Andersen, LLP.Gas Turbine Systems,GTS, Asia Pacific from 2000 to 2005; Manager, Aftermarket and Service IFS,Industrial Filtration Solutions, Belgium from 2005 to 2006; Manager, IFS,Industrial Filtration Solutions, Belgium from 2006 to 2007; Director, Gas Turbine Systems,GTS, Europe, Middle East and North Africa, from 2007 to 2010; and Director, Engine, Europe, Middle East and North Africa from 2010 to 2011. Mr. Vermeersch was appointed Vice President, Europe and Middle East in January 2012. Mr. Ward joined the Company in 1998 and has held various positions, including Director, Operations from 2001 to 2003; Director, Product and Business Development, IFS Group from 2003 to 2004; Managing Director, Europe from 2004 to 2006; and Vice President, Europe and Middle East from 2006 to 2008. Mr. Ward was appointed Senior Vice President, Engine Products in August 2008 and was appointed Senior Vice President, Industrial Products, in October 2011. Mr. Wu was appointed Vice President, Asia Pacific in January 2012. Prior to that time, Mr. Wu was the Global Vice President and President of Asia Pacific at Greif, Inc., a global leader in industrial packaging products and services, from 2005 to 2010; and Chief Advisor to Chairman of the Board of Wanhua Industrial Group, a global chemical industry leader, from 2010 to 2011.shares of the Company arestock, par value $5.00 per share, is traded on the New York Stock Exchange under the symbol DCI. The amount and frequency of all cash dividends declared on the Company’s common stock for Fiscal 2014 and 2013 appear in Note O of the Notes to Consolidated Financial Statements on page 58."DCI." The Company’s dividend payout ratio target is approximately 30 percent35% to 40 percent45% of the average earnings per share offor the last three years. This guidance is expected to be used for future dividend payouts. As of September 24, 2014,21, 2016, there were 1,7791,615 shareholders of record of common stock.lowhigh and highlow sales prices for the Company’s common stock for each full quarterly period during Fiscal 2014the years ended July 31, 2016 and 20132015 were as follows:First QuarterSecond QuarterThird QuarterFourth QuarterFiscal 2014$34.60 - 41.31$38.98 - 43.74$38.66 - 43.39$38.77 - 43.00Fiscal 201330.9034.38 - 38.1831.8331.88 - 38.3034.2633.57 - 38.0834.3537.08 - 39.362015 $42.63 - 36.47 $43.31 - 36.04 $38.46 - 36.16 $37.79 - 31.62 Year Ended July 31, First Quarter Second Quarter Third Quarter Fourth Quarter 2016 $ 0.170 $ 0.170 $ 0.170 $ 0.175 2015 $ 0.165 $ 0.165 $ 0.165 $ 0.170 sets forthsummarizes information in connection with purchases made by, or on behalf of, the Company or any affiliated purchaser of the Company, of shares of the Company’s common stock during the quarterly periodthree months ended July 31, 2014.
Shares Purchased (1)
Paid per Share
Shares Purchased
as Part of Publicly
Announced Plans
or Programs
of Shares that May
Yet Be Purchased
Under the Plans or
ProgramsPeriod Total Number of
Shares Purchased (1) Average Price
Paid per Share Total Number of
Shares Purchased
as Part of Publicly
Announced Plans
or Programs Maximum Number
of Shares that May
Yet Be Purchased
Under the Plans or
ProgramsMay 1 - May 31, 2016 — $ — — 10,974,199 June 1 - June 30, 2016 290,877 $ 35.07 270,000 10,704,199 July 1 - July 31, 2016 200,000 $ 34.23 200,000 10,504,199 Total 490,877 $ 34.73 470,000 10,504,199 September 27, 2013, the Company announced thatMay 29, 2015, the Board of Directors authorized the repurchase of up to 15.014.0 million shares of the Company's common stock. This repurchase authorization which is effective until terminated by the Board of Directors, replaced the existing authority that was authorized on March 26, 2010.Directors. There were no470,000 repurchases of common stock made outside of the Company’sCompany's current repurchase authorization during the quarterthree months ended July 31, 2014.2016. However, the “Total"Total Number of Shares Purchased”Purchased" column of the table above includes 5,48320,877 shares of previously owned shares tendered by option holders in payment of the exercise price of options during the quarter. While not considered repurchases of shares, the Company does at times withhold shares that would otherwise be issued under equity-based awards to cover the withholding of taxes due as a result of exercising stock options or payment of equity-based awards. On January 27, 2012, the Company announced that its Board of Directors declared a two-for-one stock split effected in the form of a 100 percent stock dividend. The stock split was distributed March 23, 2012, to stockholders of record as of March 2, 2012. Earnings and dividends per share and weighted average shares outstanding are presented in this Form 10-K after the effect of the 100 percent stock dividend. The two-for-one stock split is reflected in the share amounts in all periods presented in the table above and elsewhere in this annual Form 10-K.reportAnnual Report is also incorporated herein by reference.stockholdershareholder return on the Company’s common stock for the last five fiscal years with the cumulative total return of the Standard & Poor’s 500 Stock Index and the Standard & Poor’s Industrial Machinery Index. The graph and table assume the investment of $100 in each of the Company’s common stock and the specified indexes at the beginning of the applicable period and assume the reinvestment of all dividends.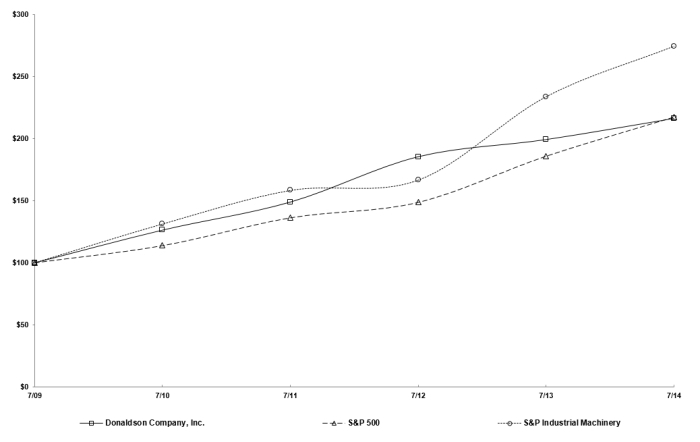

Year Ended July 31, 2011 2012 2013 2014 2015 2016 Donaldson Company, Inc. $ 100.00 $ 124.48 $ 133.75 $ 145.16 $ 127.96 $ 140.61 S&P 500 100.00 109.13 136.41 159.52 177.40 187.36 S&P Industrial Machinery 100.00 105.26 147.68 173.36 184.07 213.16 sets forthsummarizes selected financial data for each of the fiscal years in the five-year period ended July 31, 20142016 (in millions, except per share data): Year Ended July 31, 2016 2015 2014 2013 2012 Net sales $ 2,220.3 $ 2,371.2 $ 2,473.5 $ 2,436.9 $ 2,493.3 Net earnings 190.8 208.1 260.2 247.4 264.3 Basic earnings per share 1.43 1.51 1.79 1.67 1.76 Diluted earnings per share 1.42 1.49 1.76 1.64 1.73 Total assets 1,788.6 1,809.5 1,942.4 1,743.6 1,730.1 Long-term obligations 351.8 389.2 243.7 102.8 203.5 Cash dividends declared per share 0.690 0.670 0.610 0.450 0.335 Cash dividends paid per share 0.685 0.665 0.575 0.410 0.320 Item7. The following discussion (MD&A) is intended to help the reader understand the Company's results of the Company’soperations and financial condition and results of operationsfor the three years ended July 31, 2016. The MD&A should be read in conjunction with the Company's Consolidated Financial Statements and Notes theretoincluded in Item 8 of this Annual Report. This discussion contains forward-looking statements that involve risks and other financial information includeduncertainties. The Company’s actual results could differ materially from those anticipated in these forward-looking statements as a result of various factors, including those discussed elsewhere in this report. The CompanyCustomercustomer relationships and its global presence. The Company operates through two reporting segments, Engine Products and Industrial Products, and has a product mix including air filtration systems, exhaust and emission systems, liquid filtration systems includingfor hydraulics, fuel, and lube andapplications as well as replacement filters. As a worldwide business, the Company’s results of operations are affected by conditions in the global economic environment. Under most economic conditions, the Company’s market diversification between its OEM and replacement parts Customers,customers, its diesel engine and industrial end markets and its global end markets has helped to limit the impact of weakness in any one product line, market or geography on the consolidated operating results of the Company. �� The Company reportedin Fiscal 2014 of $2,473.5for the year ended July 31, 2016 were $2,220.3 million up 1.5 percent from $2,436.9as compared to $2,371.2 million in the prior year. The Company’s resultsyear, a decrease of $150.9 million or 6.4%. Net sales were negatively impacted by foreign currency translation which decreased sales by $11.4$74.2 million. ExcludingOn a constant currency basis, net sales for the current year impactended July 31, 2016 decreased 3.2% from the prior fiscal year.foreign currency translation, worldwide sales increased 2.0 percent. The Company reported net earnings in Fiscal 2014 of $260.2$17.3 million an increase of 5.2 percentor 8.3%, from $247.4$208.1 million in the prior year.fiscal 2015. The Company’s net earnings were negatively impacted by foreign currency translation, which decreased net earnings by $1.0approximately $7.9 million. Excluding the current year impact of foreign currency translation, net earnings increased 5.6 percent. Year Ended July 31, Percent of Net Sales 2016 2015 2014 2016 2015 2014 Net sales $ 2,220.3 $ 2,371.2 $ 2,473.5 100.0 % 100.0 % 100.0 % Cost of sales 1,465.5 1,562.6 1,595.7 66.0 % 65.9 % 64.5 % Gross profit 754.8 808.6 877.8 34.0 % 34.1 % 35.5 % Selling, general and administrative 425.1 460.1 460.3 19.1 % 19.4 % 18.6 % Research and development 55.5 60.2 61.8 2.5 % 2.5 % 2.5 % Operating income 274.2 288.3 355.7 12.3 % 12.2 % 14.4 % Other income, net (3.9 ) (15.5 ) (15.2 ) (0.2 )% (0.7 )% (0.6 )% Interest expense 20.7 15.2 10.2 0.9 % 0.6 % 0.4 % Earnings before income taxes 257.4 288.6 360.7 11.6 % 12.2 % 14.6 % Income taxes 66.6 80.5 100.5 3.0 % 3.4 % 4.1 % Net earnings $ 190.8 $ 208.1 $ 260.2 8.6 % 8.8 % 10.5 % Net earnings per share – diluted $ 1.42 $ 1.49 $ 1.76 Year Ended July 31, Percent of Net Sales 2016 2015 2014 2016 2015 2014 Engine Products $ 1,391.3 $ 1,484.1 $ 1,584.0 62.7 % 62.6 % 64.0 % Industrial Products 829.0 887.1 889.5 37.3 % 37.4 % 36.0 % Net sales $ 2,220.3 $ 2,371.2 $ 2,473.5 100.0 % 100.0 % 100.0 % Year Ended July 31, Percent of Net Sales 2016 2015 2014 2016 2015 2014 United States $ 937.3 $ 1,007.3 $ 1,019.9 42.2 % 42.5 % 41.2 % Europe 632.7 671.3 728.6 28.5 % 28.3 % 29.5 % Asia Pacific 449.9 470.7 517.3 20.3 % 19.9 % 20.9 % Other 200.4 221.9 207.7 9.0 % 9.3 % 8.4 % Total $ 2,220.3 $ 2,371.2 $ 2,473.5 100.0 % 100.0 % 100.0 % and net earnings excluding foreign currency translation areis not measuresa measure of financial performance under generally accepted accounting principles in the United States of America (U.S. GAAP),GAAP, the Company believes they arethat it is useful in understanding its financial results and provide comparable measures for understanding the operating results of the Company between different fiscal periods. Following are reconciliationsThe following is a reconciliation to the most comparable U.S. GAAP financial measuresmeasure of thesethis non-GAAP financial measuresmeasure for the years ended July 31, 2016, 2015 and 2014 (in millions):
Change in
Net Sales
Change in
Net Earnings The Company reported diluted earnings per share of $1.76, a 7.3 percent increase from $1.64 in the prior year. Following are net sales by product within the Company’s Engine and Industrial Products segments and a comparison of earnings before income taxes. Corporate and Unallocated includes corporate expenses determined to be non-allocable to the segments, such as interest income and interest expense. See further discussion of segment information in Note K of the Company’s Notes to Consolidated Financial Statements. Year Ended July 31, 2016 2015 2014 Prior year net sales $ 2,371.2 $ 2,473.5 $ 2,436.9 Change in net sales excluding translation (76.7 ) 32.5 48.0 Impact of foreign currency translation (1) (74.2 ) (134.8 ) (11.4 ) Current year net sales $ 2,220.3 $ 2,371.2 $ 2,473.5 * Includes replacement part sales to(1)The impact of foreign currency translation is calculated by translating current period foreign currency revenue into U.S. dollars using the Company’s OEM Customersaverage foreign currency exchange rates for the prior fiscal year period rather than actual current period foreign currency exchange rates.
Products
Products
Unallocated
CompanyCompany’s overallfiscal 2016 sales increaseddecrease of $150.9 million compared to the prior year period. Many factors contributed to the Company’s results for each of its reportable segments for Fiscal 2014. The Company saw mixed conditions in its OEM first-fit equipment end markets with some improving, some stable, and some weakening. Conditions were better for aftermarket sales as the Company saw continued strength in demand for replacement filters in both its Engine and Industrial end markets. These sales increases were partially offsetfiscal 2015 was primarily driven by a 32.7 percent decrease in its Gas Turbine sales from Fiscal 2013 sales of $232.9 million. As the Company has discussed previously, there was a large increase in the Company’s gas turbine shipments in Fiscal 2013, and the overall industry is now absorbing that new electrical generation capacity, resulting in the Fiscal 2014 decrease over the prior year period. The Company’s sales increased in Europe by $49.6$74.2 million or 7.3 percent, and in the Americas by $27.3 million, or 2.4 percent, compared to Fiscal 2013, partially offset by a $29.1 million, or 5.3 percent, decrease in Asia. In the Engine Products segment, the Company experienced mixed results in its end-markets. Off-Road Product sales decreased by 4.6 percent driven by weakness in mining and agricultural equipment markets, which was partially offset by an improving construction equipment market. Aftermarket Products sales increased 10.9 percent, driven by increases in utilization rates of equipment fleets, increased sales of the Company’s proprietary replacement filters, and expansion of the Company’s product portfolio and distribution. PowerCore brand replacement filter sales contributed $15.4 million to the increase over the prior year. On-Road Products sales increased by 1.2 percent, primarily due to growth after the Euro VI diesel emissions regulations went into effect January 1, 2014. Earnings before income taxes as a percentage of Engine Products segment sales of 14.8 percent increased slightly from 14.7 percent in the prior year. In the Industrial Products segment, where many product lines are later economic cycle businesses, sales decreased primarily due to a 32.7 percent decrease in Gas Turbine Systems products due to fewer shipments of large systems used in power generation. Earnings before income taxes as a percentage of Industrial Products segment sales of 15.1 percent increased from 14.9 percent in the prior year. Industrial Filtration Solutions Products sales increased 4.5 percent due to strong replacement air filter sales and improved manufacturing activity. This was partially offset by continued soft new equipment sales, due to the continued weak capital spending environment, particularly in the Americas. Sales in Special Applications Products increased by 5.4 percent due to an increase in demand for the Company’s disk drive, semiconductor, and venting products, partially offset by weakness in industrial end-markets impacting the Company’s membrane product sales.Outlook The following Outlook excludes the impact of the Company’s pending acquisition of Northern Technical L.L.C., which is expected to close in September 2014. See Note P of the Company’s Notes to Consolidated Financial Statements.•The Company forecasts its total Fiscal 2015 sales to be between $2.57 and $2.67 billion, or an increase of 4 to 8 percent from Fiscal 2014.•The Company’s Fiscal 2015 operating margin is forecasted to be 14.1 to 14.9 percent. Included in this forecast is approximately $10 million in incremental operating expense increases for the Company’s Global ERP Project and targeted sales growth initiatives.•The Company’s Fiscal 2015 tax rate is anticipated to be between 27 and 30 percent.•The Company forecasts its Fiscal 2015 EPS to be between $1.81 and $2.01.•The Company projects that cash generated by its operating activities will be between $260 and $300 million. Capital spending is estimated to be between $90 and $100 million. The Company plans to repurchase between 2 and 4 percent of its outstanding shares in FY15.Fiscal 2014 Compared to Fiscal 2013 Engine Products SegmentThe Engine Products segment sells to OEMs in the construction, mining, agriculture, aerospace, defense, and truck markets, and to independent distributors, OEM dealer networks, private label accounts, and large equipment fleets. Products include air filtration systems, exhaust and emissions systems, liquid filtration systems including hydraulics, fuel and lube, and replacement filters. Sales for the Engine Products segment were $1,584.0 million, an increase of 5.3 percent from $1,504.2 million. Fiscal 2014 Engine Products sales increased by 11.6 percent in Europe and 5.3 percent in the Americas, partially offset by a decrease of 0.5 percent in Asia, compared to Fiscal 2013. The impact of foreign currency decreased total sales by $13.7 million, or 0.9 percent. Worldwide sales of Off-Road Products were $342.2 million, a decrease of 4.6 percent from $358.8 million in the prior year. Sales declined 13.6 percent in Asia and 6.4 percent in the Americas, partially offset by growth of 2.7 percent in Europe. The sales decreases were driven by continued weakness in mining equipment marketstranslation and a decline in the agricultural equipment market, driven by anticipated lower farm cash receipts in key grain producing regions moderating agricultural sales. These decreases were partially offset by an improving construction equipment market, particularly in North America,Company's first-fit portions of the Engine and new program wins in Europe. WorldwideIndustrial segments. Fiscal 2016 sales of On-Road Products were $130.0 million, an increase of 1.2 percent from $128.4decreased $92.8 million in the prior year. Sales increased 37.5 percent in Europe, partially offset by sales decreases of 4.2 percent in the AmericasEngine Products segment and 2.7 percent in Asia. The increase in Europe was due primarily to growth after the Euro VI diesel emissions regulations went into effect January 1, 2014. Sales decreased in the Americas primarily due to lower emissions sales in that region for an OEM program the Company no longer supplies, totaling $6.3 million. Worldwide sales of Aftermarket Products were $1,012.2 million, an increase of 10.9 percent from $912.7$58.1 million in the prior year. Sales increased 14.8 percent in Europe, 12.3 percentIndustrial Products segment. Unfavorable foreign currency exchange rates decreased sales in the Americas,Engine Products and 6.6 percentIndustrial Products segments by $43.4 million and $30.8 million, respectively. In addition to the impacts of foreign currency, the Engine Products segment experienced a decline in Asia. The overall sales increases were primarilythe Off-Road product business driven by increases in utilization rates of equipment fleets, increased sales of the Company’s proprietary replacement filters, and expansion of the Company’s product portfolio and distribution. PowerCore brand replacement filter sales contributed $15.4 million to the increase over the prior year period. Worldwide sales of Aerospace and Defense Products were $99.6 million, a decrease of 4.4 percent from $104.2 millioncontinued weakness in the prior year. Sales of Aerospaceglobal agricultural, mining and Defense Productsconstruction equipment markets with decreased 10.2 percentbuild rates in the Americas, partially offset by sales increases of 16.6 percent over the prior year in Europe. The sales decrease was due to the continued slowdown in U.S. military ground vehicle spending, which is forecasted to continue into Fiscal 2015, partially offset by higher helicopter air filter sales, which increased $2.9 million over the prior year. Industrial Products Segmentall regions. The Industrial Products segment sells to various industrial distributors, dealers, and end-users, OEMs of gas-fired turbines, and OEMs and end-users requiring clean air. Products include dust, fume, and mist collectors, compressed air purification systems, air filtration systems for gas turbines and compressors, PTFE membrane-based products, and specialized air and gas filtration systems for various applications including computer hard disk drives and other electronic equipment. Sales for the Industrial Products segment were $889.4 million, aexperienced it's most significant sales decrease of 4.6 percent from $932.8 million in the prior year. This result wasGas Turbine Systems business. Historically, GTS sales were driven by a 32.7 percent sales decline in Gas Turbine Products, partially offset by sales increases in Special Applications Products and Industrial Filtration Solutions Products of 5.4 percent and 4.5 percent, respectively. Industrial Products sales decreased by 9.8 percent in Asia and 4.9 percent in the Americas, and grew by 2.0 percent in Europe compared to Fiscal 2013. The impact of foreign currency decreased total sales by $2.3 million, or 0.3 percent. Worldwide sales of Industrial Filtration Solutions Products were $553.4 million, a 4.5 percent increase from $529.8 million in the prior year. Sales increased 9.4 percent, 7.9 percent, and 1.7 percent in Asia, Europe, and the Americas, respectively. Strong replacement air filter sales, due to improved manufacturing activity, were partially offset by continued soft new dust collector equipment sales, due to the continued weak capital spending environment, particularly in the Americas. The externally published durable goods index in the U.S., which has historically been a leading indicator for equipment sales, increased 5.4 percent as compared to last year. Worldwide sales of Gas Turbine Products were $156.9 million, a decrease of 32.7 percent from $232.9 million in the prior year. Gas Turbine Products sales are typically large systems and, as a result, the Company’sCompany's shipments and revenues fluctuatefluctuated from period to period. Sales of Gas Turbine Products systems were down for the year, primarily due to fewer shipments of large systems usedBeginning in power generation compared to the prior year period. There was a large increase in the Company’s gas turbine shipments in Fiscal 2013, and the overall industry is now absorbing that new electrical generation capacity, driving the Fiscal 2014 decrease over the prior year period. Worldwide sales of Special Applications Products were $179.2 million, a 5.4 percent increase from $170.1 million in the prior year. Sales increased 10.6 percent and 5.9 percent in Europe and Asia, respectively, from the prior year, partially offset by a sales decrease in the Americas of 1.5 percent. The sales increases were driven by a worldwide increase in demand for the Company’s disk drive, semiconductor, and venting products, partially offset by weakness in industrial end-markets impacting the Company’s membrane product sales. Consolidated ResultsThe Company reported net earnings for Fiscal 2014 of $260.2 million compared to $247.4 million in Fiscal 2013, an increase of 5.2 percent. Diluted net earnings per share were $1.76, up 7.3 percent from $1.64 in the prior year. The Company’s operating income of $355.7 million increased by 3.6 percent from prior year operating income of $343.3 million. The table below shows the percentage of total operating income contributed by each segment for each of the last three fiscal years. Corporate and Unallocated includes corporate earnings and expenses determined to be non-allocable to the segments, such as interest income and interest expense: International operating income, prior to corporate expense allocations, totaled 79.7 percent of consolidated operating income in Fiscal 2014 as compared to 74.0 percent in Fiscal 2013. Total international operating income increased 11.6 percent from the prior year. The table below shows the percentage of total operating income contributed by each major geographic region for each of the last three fiscal years: For more information regarding the Company’s net sales by geographic region, see Note K to the Consolidated Financial Statements. Gross margin for Fiscal 2014 was 35.5 percent, or a 0.7 percent increase from 34.8 percent in the prior year. The increase in gross margin is primarily attributable to positive mix impacts from the reduction in large Gas Turbine projects, and a higher percentage of replacement filter sales, which was due to strong utilization of existing equipment in the field and the Company’s focus on innovative products that capture higher levels of aftermarket sales. Overall, product mix had a positive 50 basis points impact on gross margin. In addition, the Company’s ongoing Continuous Improvement initiatives, which include Lean, Kaizen, Six Sigma, and cost reduction efforts, improved gross margin by 60 basis points. Offsetting these benefits was a 40 basis points reduction in margin from higher engineering costs and lower fixed cost absorption. Within gross profit,2016, the Company incurred $1.7 million in restructuring charges compared to $1.6 million in Fiscal 2013. The Fiscal 2014 expenses were employee severance costs related to reductions in workforce. The principal raw materials that the Company uses are steel, filter media, and petroleum-based products. Purchased raw materials represents approximately 60 to 65 percent of the Company’s cost of goods sold. Of that amount, steel, including fabricated parts, represents approximately 25 percent. Filter media represents approximately 15 to 20 percent and the remainder is primarily made up of petroleum-based products and other components. The cost the Company paid for steel during Fiscal 2014, varied by grade, but in aggregate, it slightly increased during the fiscal year. The Company’s cost of filter media also varies by type and slightly decreased during the fiscal year. The cost of petroleum-based products (plastics, rubber, and adhesives) slightly decreased during the fiscal year. The Company anticipates a moderately unfavorable impact from commodity prices in Fiscal 2015, as compared to Fiscal 2014, specifically for steel and petroleum-based products, based on recent market information for purchased commodities. The Company strives to recover or offset material cost through selective price increases to its Customers and through the Company’s Continuous Improvement initiatives, which include material substitutions, process improvements, and product redesigns. Operating expenses for Fiscal 2014 were $522.1 million or 21.1 percent of sales, as compared to $503.8 million or 20.7 percent in the prior year. The increase in operating expenses as a percent of sales was primarily due to higher incentive compensation expenses, the incremental expenses related to the Company’s Global ERP Project and increased travel expenses, which contributed 90 basis points in total. These increases were partially offset by improved fixed cost leverage and lower warranty expenses, which reduced the Company’s operating expenses as percent of sales by 50 basis points. Restructuring expenses included in operating expenses were $0.4 million for the year, which were employee severance costs related to a reduction in workforce. Interest expense of $10.2 million decreased $0.7 million from $10.9 million in the prior year. Other income, net totaled $15.2 million in Fiscal 2014, down from $15.8 million in the prior year. The decrease of $0.6 million in other income was driven by $0.9 million of restructuring expenses related to the sale of a facility in Germany. In addition, the prior year included the impact of a favorable insurance recovery. These decreases were partially offset by an increase in foreign exchange gains of $1.5 million and an increase of $1.4 million in income generated from the Company’s joint venture with Caterpillar. The effective tax rate for Fiscal 2014 was 27.9 percent compared to 29.0 percent in Fiscal 2013. The decrease in the effective tax rate is primarily due to the favorable settlement of a tax audit, the remeasurement of certain deferred tax assets, and a favorablestrategic shift in the mixGTS business to be more selective in bidding of earnings between tax jurisdictions. This was partially offset by tax costs associatedlarge projects and shifting the strategy to grow the GTS replacement part business. In contrast to fiscal 2015, the Company experienced more typical seasonality in fiscal 2016 with certain foreign dividend distributions andsales improving the expirationsecond half of the Research and Experimentation Credit inyear.U.S. in the current year. Totalbacklog of orders expected to be delivered within 90 days was $323.0 million. The 90-day backlog at JulyAugust 31, 2014,2015, was $748.2 million, up 4.5 percent from$331.0 million. The backlog of orders expected to be delivered within 90 was increased 3.0% for the same period inEngine Products segment and increased 1.6% for the prior year.Industrial Products segment. Backlog is one of many indicators of business conditions in the Company’s markets. However, it is not always indicative of future results for a number of reasons, including short lead times in the Company’s replacement parts businesses and the timing of the receipt of orders in many of the Company’s Engine OEM and Industrial markets. InEngine Products segment, total open order backlogCompany uses are steel, filter media, and petroleum-based products including plastics, rubber, and adhesives. Purchased raw materials represent approximately 60% to 65% of the Company’s cost of goods sold. Of that amount, steel, including fabricated parts, represents approximately 20%. Filter media represents approximately 20% and the remainder is primarily made up of petroleum-based products and other raw material components.1.1 percentduring the fiscal year. The steel costs decrease was largely related to the decline in market prices but was also affected by continuous improvement efforts. The Company’s cost of filter media also varies by type and decreased slightly year over year. The cost of petroleum-based products were also down in relation to lower costs for petrochemicals and continuous improvement efforts. The Company anticipates a moderately favorable impact from commodity prices in fiscal 2017, as compared to fiscal 2016, specifically for petroleum-based products. On an ongoing basis, the Company enters into selective supply arrangements with certain of its suppliers that allow the Company to reduce volatility in its costs. The Company strives to recover or offset all material cost increases through selective price increases to its customers and the Company’s continuous improvement cost reduction initiatives, which include material substitution, process improvement, and product redesigns.InThe effective tax rate in fiscal 2015 was favorably impacted by the Industrial Products segment, total open order backlog increased 18.4 percent fromreinstatement of the Research and Experimentation Credit in the U.S. for calendar year 2014, non-recurring tax costs associated with foreign dividend distributions recorded during the prior year. Because someyear and an increase in tax benefits from international operations. The effective tax rate in fiscal 2014 was favorably impacted by the settlement of a tax audit and the change in backlog can be attributedremeasurement of certain deferred tax assets due to a change in tax rates in certain foreign jurisdictions.ordering patternsyear ended July 31, 2016, net earnings was $190.8 million as compared to $208.1 million in fiscal 2015, a decrease of $17.3 million or 8.3%. Diluted net earnings was $1.42 per share, a decrease of 4.7% from diluted net earnings of $1.49 for the year ended July 31, 2015.Company’s Customers and/Company between different fiscal periods. The following is a reconciliation to the most comparable GAAP financial measure of this non-GAAP financial measure for the years ended July 31, 2016, 2015 and 2014 (in millions): Year Ended July 31, 2016 2015 2014 Prior year net earnings $ 208.1 $ 260.2 $ 247.4 Change in net earnings excluding translation (9.4 ) (37.8 ) 13.8 Impact of foreign currency translation (7.9 ) (14.3 ) (1.0 ) Current year net earnings $ 190.8 $ 208.1 $ 260.2 Year Ended July 31, 2016 2015 Fiscal 2016 fourth quarter actions $ 3.5 $ — Fiscal 2016 third quarter actions 4.1 — Fiscal 2016 first quarter actions 6.2 — Fiscal 2015 actions (1) 2.3 16.9 Total $ 16.1 $ 16.9 Year Ended July 31, 2016 2015 Engine Products segment $ 8.8 $ 9.2 Industrial Products segment 7.3 3.8 Corporate & Unallocated — 3.9 Total $ 16.1 $ 16.9 Year Ended July 31, 2016 2015 Cost of sales $ 5.7 $ 8.4 Selling, general and administrative 10.4 8.5 Total $ 16.1 $ 16.9 impactfiscal 2016 actions are estimated to result in approximately $40 million of foreign exchange translation rates, it may not necessarily correspondannual pre-tax savings. The savings are a result of reduction in workforce and therefore, the savings are expected to future sales.Fiscal 2013 Comparedcommence immediately and will allow the Company to Fiscal 2012 Year Ended July 31, Increase (Decrease) 2016 2015 2014 2016 vs 2015 2015 vs 2014 Net sales Engine Products segment $ 1,391.3 $ 1,484.1 $ 1,584.0 $ (92.8 ) $ (99.9 ) Industrial Products segment 829.0 887.1 889.5 (58.1 ) (2.4 ) Total $ 2,220.3 $ 2,371.2 $ 2,473.5 $ (150.9 ) $ (102.3 ) Earnings before income taxes Engine Products segment $ 163.5 $ 186.3 $ 233.9 $ (22.8 ) $ (47.6 ) Industrial Products segment 119.0 123.3 134.0 (4.3 ) (10.7 ) Corporate and Unallocated (1) (25.1 ) (21.0 ) (7.2 ) (4.1 ) (13.8 ) Total $ 257.4 $ 288.6 $ 360.7 $ (31.2 ) $ (72.1 ) (1) Corporate and Unallocated includes corporate expenses determined to be non-allocable to the segments such as interest income and interest expense. The Corporate and Unallocated results were determined on a consistent basis for all periods presented. The change in Corporate and Unallocated from fiscal 2014 to fiscal 2016 was driven by higher interest expense and foreign exchange losses. Year Ended July 31, Increase (Decrease) 2016 2015 2014 2016 vs 2015 2015 vs 2014 Engine Products Segment Off-Road Products $ 216.6 $ 261.1 $ 342.2 $ (44.5 ) $ (81.1 ) On-Road Products 127.2 138.4 130.0 (11.2 ) 8.4 Aftermarket Products* 951.5 980.7 1,012.2 (29.2 ) (31.5 ) Aerospace and Defense Products 96.0 103.9 99.6 (7.9 ) 4.3 Total Engine Products segment $ 1,391.3 $ 1,484.1 $ 1,584.0 $ (92.8 ) $ (99.9 ) * Includes replacement part sales to the Company’s OEM customers OEMsOEM customers in the construction, mining, agriculture, aerospace, defense, and truck markets,end-markets, and to independent distributors, OEM dealer networks, private label accounts, and large equipment fleets. Products include air filtration systems, exhaust and emissions systems, liquid filtration systems includingfor hydraulics, fuel and lube application, and replacement filters. Sales$1,504.2$1,484.1 million, a decrease of 4.2 percent6.3% from $1,570.1$1,584.0 million in Fiscal 2012 with decreases across all businesses. Fiscal 2013 Engine Products sales decreased by 11.3 percent in Asia, 3.6 percent in the Americas, and were flat in Europe compared to Fiscal 2012.fiscal prior year. The impact of the changes in foreign currency decreased total sales by $23.8$82.0 million, or 1.6 percent.$358.8$261.1 million, a decrease of 4.8 percent23.7% from $376.9$342.2 million in Fiscal 2012. Sales declined 18.5 percent in Asia and 7.7 percent in the Americas, partially offset by growth of 3.0 percent in Europe.prior year. The sales decreases weredecrease was driven by a declinecontinued weakness in the mining and agricultural equipment markets as commodity prices moderated and reductions in mining investments kept production of new mining equipment below Fiscal 2012 levels. Reductions in large non-residential construction and non-building infrastructure projects led to lower demand for larger construction equipment.markets. These decreases were partially offset by strengthan improving construction equipment end-market, particularly in the agriculture equipment market globally.$128.4$138.4 million, a decreasean increase of 21.6 percent6.4% from $163.9$130.0 million in Fiscal 2012. Sales decreased 31.4 percentthe prior year. The increase overall is due to an increase in the Americas, 19.7 percent in Asia, and 6.7 percent in Europe. Sales decreases were a result of a decrease in global truck builds, especially in the U.S., as well as OEM Customer initiatives to reduce inventory. According to published industry data, North Americancustomer new Class 8 truck build rates decreased 19.0 percent and medium-duty truck build rates increased 4.9 percent over Fiscal 2012.$912.7$980.7 million, a decrease of 1.1 percent3.1% from $922.7$1,012.2 million in Fiscal 2012. Sales in Asia and Europe decreased 4.4 percent and 1.8 percent, respectively, while sales in the Americas grew 3.4 percent.prior year. The overall sales decreases were primarily driven by lowerthe impact of the change in foreign currency exchange rates, partially offset by increases in the utilization rates of equipment acrossfleets, increased sales of the on-roadCompany’s proprietary replacement filters and off-road equipment markets along withexpansion of the negative impactsCompany’s product portfolio and distribution capabilities. Net of foreign currency translation.$104.2$103.9 million, an increase of 4.2% from $99.6 million in the prior year.2.3 percent from $106.7 millionsales in Fiscal 2012. Sales of Aerospace and Defense Products were relatively flat over Fiscal 2012 in Europe, while sales decreased 2.2 percent in the Americas.fiscal 2014. The salespercentage earnings decrease was driven by lower fixed cost absorption due to a continued slowdowndecrease in U.S. military spending.sales volumes. Year Ended July 31, Increase (Decrease) 2016 2015 2014 2016 vs 2015 2015 vs 2014 Industrial Products segment: Industrial Filtration Solutions Products $ 517.9 $ 529.0 $ 553.4 $ (11.1 ) $ (24.4 ) Gas Turbine Products 149.6 186.9 156.9 (37.3 ) 30.0 Special Applications Products 161.5 171.2 179.2 (9.7 ) (8.0 ) Total Industrial Products segment $ 829.0 $ 887.1 $ 889.5 $ (58.1 ) $ (2.4 ) distributors, OEMsand end-users, OEM customers of gas-fired turbines and OEMs and end-users requiring clean air. Products include dust, fume, and mist collectors, compressed air purification systems, air filtration systems for gas turbines and compressors, PTFE membrane-based products, and specialized air and gas filtration systems for various applications including computer hard disk drives and semi-conductor manufacturing. Salesother electronic equipment.$932.8$829.0 million an increase of 1.0 percent from $923.1as compared to $887.1 million in Fiscal 2012the prior year period, a decrease of $58.1 million or 6.5%. This decrease was driven by 28.9 percenta 20.0% decrease in GTS sales growth in Gas Turbine Products, partially offset by sales decreases in Special Applications Products and Industrial Filtration Solutions Productsthe impact of 10.0 percent and 4.3 percent, respectively. Fiscal 2013 Industrial Products sales increased by 2.9 percent in Asia, 0.9 percent in the Americas, and were flat in Europe compared to Fiscal 2012.foreign currency translation. The impact of foreign currency translation during fiscal 2016 decreased Industrial Products sales by $8.4$30.8 million, or 0.9 percent.Products were $529.8$517.9 million, a 4.3 percent2.1% decrease from $553.5fiscal 2015. In constant currency, fiscal 2016 sales increased $7.7 million, in Fiscal 2012.or 1.5%. Sales decreased 13.5 percentof both aftermarket and 6.4 percent in Asia and Europe, respectively, partially offset by a sales increase in the Americas of 3.4 percent, compared to Fiscal 2012. Demand for new filtration equipment was weak due to lower capital investment by manufacturers in most of the Company’s major regions. This was partially offset by increased sales of replacement filters for equipment installed previously. Sales were also negatively impacted by foreign currency translation. The externally published durable goods index in the U.S. increased 2.7 percent during Fiscal 2013 as compared to Fiscal 2012.Gas Turbine ProductsGTS were $232.9$149.6 million, an increase of 28.9 percenta 20.0% decrease from $180.7fiscal 2015. In constant currency, fiscal 2016 sales decreased $33.9 million, in Fiscal 2012. Gas Turbine Productsor 18.1%. GTS sales are typically large systems and, as a result, the Company’sCompany's shipments and revenues fluctuate from period to period.large0.3% from $889.5 million in the prior year. This result was driven by a 4.4% decline in Industrial Filtration Solutions Products and a 4.5% decline in Special Applications Products, partially offset by a 19.2% sales increase in Gas Turbine Products. The impact of foreign currency decreased net sales by $52.1 million, or 5.9%.strong$186.9 million, an increase of 19.2% from $156.9 million in the prior year. Sales of Gas Turbine Products systems were due to high demand for theincreased shipments of large filtration systems used in power generation primarily inas well as the Middle East and Asia. The Company also experienced moderate demand for its smaller systems used in oil and gas applications and increasedbenefit of the acquisition of Northern Technical, which generated sales of replacement filters for systems previously installed.$170.1$171.2 million, a 10.0 percent4.5% decrease from $189.0$179.2 million in Fiscal 2012. Sales decreased 13.0 percent and 11.7 percent in Europe and Asia, respectively, from Fiscal 2012, partially offset by a sales increase in the Americas of 1.0 percent.prior year. The sales decline was primarily due tothe result of a global declinedecrease in computer sales which resulted in lower demand for the Company’s hard disk drive filters. According to the International Data Corporation, the numbermembrane products.disk drives produced in Fiscal 2013 declined 9.2 percent from the Fiscal 2012 period. In addition, weakness in industrial end markets resulted in lowerIndustrial Products' sales, of the Company’s membrane products. Consolidated ResultsThe Company reported net earnings for Fiscal 2013 of $247.4 million compared to $264.3 million in Fiscal 2012, a decrease of 6.4 percent. Diluted netfrom 15.1% in fiscal 2014. The fiscal 2015 percentage earnings per share were $1.64, down 5.2 percent from $1.73 in Fiscal 2012. The Company’s operating income of $343.3 million decreased from Fiscal 2012 operating income of $363.0 million by 5.4 percent. The table below shows the percentage of total operating income contributed by each segment for each of the last three fiscal years. Corporate and Unallocated includes corporate expenses determined to be non-allocable to the segments such as interest income and interest expense: International operating income, prior to corporate expense allocations, totaled 74.0 percent of consolidated operating income in Fiscal 2013 as compared to 69.7 percent in Fiscal 2012. Total international operating income increased 4.3 percent from Fiscal 2012. The table below shows the percentage of total operating income contributed by each major geographic region for each of the last three fiscal years: Gross margin for Fiscal 2013 was 34.8 percent, or a 0.2 percent decrease from 35.0 percent in Fiscal 2012. The decrease in gross margin is primarily attributable to the mix impact of large Gas Turbine project shipments and the impact of lower absorption of fixed costs due to the lower production volumes in the Company’s plants. These decreases were partially offset by the benefits from the Company’s ongoing Continuous Improvement initiatives, which include Lean, Kaizen, Six Sigma, and cost reduction efforts. Within gross profit, the Company incurred $1.6 million in restructuring charges compared to minimal restructuring charges during Fiscal 2012. The Fiscal 2013 expenses were employee severance costs related to a reduction in workforce. The principal raw materials that the Company uses are steel, filter media, and petroleum-based products. Purchased raw materials represents approximately 60 to 65 percent of the Company’s cost of goods sold. Of that amount, steel, including fabricated parts, represents approximately 25 percent. Filter media represents approximately 15 to 20 percent and the remainder is primarily made up of petroleum-based products and other components. The cost the Company paid for steel during Fiscal 2013, varied by grade, but in aggregate, it slightly decreased during the fiscal year. The Company’s cost of filter media also varies by type and slightly increased at the end of the fiscal year. The cost of petroleum-based products (plastics, rubber, and adhesives) was generally flat. Commodity prices in aggregate generally decreased throughout Fiscal 2013 as compared to Fiscal 2012. The Company strives to recover or offset material cost through selective price increases to its Customers and through the Company’s Continuous Improvement initiatives, which include material substitutions, process improvements, and product redesigns. Operating expenses for Fiscal 2013 were $503.8 million or 20.7 percent of sales, as compared to $510.7 million or 20.5 percent in Fiscal 2012. Restructuring expenses included in operating expenses were $2.4 million for the year, which were employee severance costs related to a reduction in workforce. The Company’s ongoing cost containment actions and lower incentive compensation helped to offset the restructuring expenses, higher pension expenses, and the incremental expenses related to its Global ERP Project. Interest expense of $10.9 million decreased $0.6 million from $11.5 million in Fiscal 2012. Other income, net totaled $15.8 million in Fiscal 2013, down from $19.3 million in Fiscal. The decrease of $3.5 million in other income was driven by lower fixed cost absorption due to a $1.7 million decrease in interest income, a $1.6 million decrease in foreign exchange gains, and a $1.0 million decrease in royalty income. The effective tax rate for Fiscal 2013 was 29.0 percent compared to 28.7 percent in Fiscal 2012. The increase in effective tax rate is primarily due to the incremental benefits derived in Fiscal 2012 from the favorable settlement of tax audits. This was partially offset by an increase in tax benefits from international operationssales volumes and the retroactive reinstatement of the Research and Experimentation Creditnegative mix impacts from larger projects in the U.S. in Fiscal 2013. Total backlogGas Turbine Systems and Industrial Filtration Solutions businesses.2013, was $715.8 million, down 10.4 percent from the same period in Fiscal 2012. Backlog is one of many indicators of business conditions in the Company’s markets. However, it is not always indicative of future results for a number of reasons, including short lead times in the Company’s replacement parts businesses2016 and the timing of the receipt of orders in many of the Company’s Engine OEM and Industrial markets. In the Engine Products segment, total open order backlog decreased 6.7 percent from Fiscal 2012. In the Industrial Products segment, total open order backlog decreased 18.4 percent from Fiscal 2012. Because some of the change in backlog can be attributed to a change in the ordering patterns of the Company’s Customers and/or the impact of foreign exchange translation rates, it may not necessarily correspond to future sales.Liquidity and Capital Resources Financial ConditionAt July 31, 2014, the Company’s capital structure was comprised2015 is summarized as follows (in millions): July 31, 2016 2015 Long-term debt $ 351.8 $ 389.2 Shareholders' equity 771.4 778.7 Total long-term capital $ 1,123.2 $ 1,167.9 Ratio of long-term debt to total long-term capital 31.3 % 33.3 % $187.0 million of current debt, $243.7 million ofJuly 31, 2016, long-term debt and $1,002.5 millionrepresented 31.3% of total long-term capital, defined as long-term debt plus total shareholders’ equity. The Company had cash and cash equivalents of $296.4 million and short-term investments of $127.2 millionequity, compared to 33.3% at July 31, 2014. The ratio of2015. to total capital was 19.6 percent and 8.7 percent at July 31, 2014 and 2013, respectively. Total debt outstanding increased $220.1 million during the year to $430.8 million outstanding at July 31, 2014, as a result of increases in short-term and long-term borrowings, offset by2016 was $351.8 million compared to $389.2 million at the prior year end, a decrease in current maturities of long-term debt. Short-term borrowings outstanding at the end of the year increased $176.1 million driven by$37.4 million.drawing $180.0 million on the Company’s multi-currency revolving credit facility. The following table summarizes the Company’s cash obligations as of July 31, 2014, for the years indicated (thousands of dollars):
1 year
years
years
5 years(1)Purchase obligations consist primarily of inventory, tooling, and capital expenditures. The Company’s purchase orders for inventory are based on expected Customer demand and quantities and dollar volumes are subject to change.(2)Pension and deferred compensation consists of long-term pension liabilities and salary and bonus deferrals elected by certain executives under the Company’s Deferred Compensation Plan. Deferred compensation balances earn interest based on a treasury bond rate as defined by the plan (10-year treasury bond STRIP rate plus two percent for deferrals prior to January 1, 2011 and 10-year treasury bond rates for deferrals after December 31, 2010) and approved by the Human Resources Committee of the Board of Directors, and are payable at the election of the participants.(3)In addition to the above contractual obligations, the Company may be obligated for additional cash outflows of $16.7 million for potential tax obligations, including accrued interest and penalties. The payment and timing of any such payments is affected by the ultimate resolution of the tax years that are under audit or remain subject to examination by the relevant taxing authorities. Therefore, quantification of an estimated range and timing of future payments cannot be made at this time. The Company hasentered into a five-year,First Amendment (Amendment) to its 5 year, multi-currency revolving credit facility with a group of banks under whichbanks. The Amendment increased the Company may borrowCompany's borrowing availability up to $250.0$400.0 million. The agreement provides that loans may be made under a selection of currencies and rate formulas including Base Rate Loans or LIBOR Rate Loans.Loans, as defined in the Amendment. The interest rate on each advance is based on certain market interest rates and leverage ratios. Facility fees and other fees on the entire loan commitment are payable over the duration of this facility. There was $180.0$130.0 million outstanding at July 31, 20142016, and no$160.0 million outstanding amounts at July 31, 2013, under these facilities.2015 and all borrowings which were outstanding on those dates had maturities which were less than twelve months. At July 31, 20142016 and 2013, $62.22015, $262.7 million and $237.8$232.2 million, respectively, were available for further borrowing under such facilities. The amount available for further borrowing reflects a reduction for issued standby letters of credit, as discussed below.in Note 6. The Company’s multi-currency revolving facility contains debtfinancial covenants specifically related to maintaining a certain interest coverage ratio and a certain leverage ratio as well as other covenants that, under certain circumstances, can restrict the Company’s ability to incur additional indebtedness, make investments and other restricted payments, create liens and sell assets. As of July 31, 2014,was in complianceentered into a First Supplement to Note Purchase Agreement (First Supplement) with all such covenants. Oninstitutional investors which supplements a Note Purchase Agreement, dated March 27, 2014,2014. Pursuant to the First Supplement, the Company issued $25.0 million of senior unsecured notes due April 16, 2025, and $125.0 million of senior unsecured notes due March 27, 2024.June 17, 2030. The debt was issued at face value and bears interest payable semi-annually at an annual rate of interest of 3.72 percent.2.93% and 3.18%, respectively. The proceeds from the notes were primarily used to refinance existing debt and for general corporate purposes. The notes contain debt covenants specifically related to maintaining a certain leverage ratio as well asand other covenants that, under certain circumstances, can restrict the Company’s ability to incur additional indebtedness, make investments and other restricted payments, create liens and sell assets. As July 31, 2014, the Company was in compliance with all such covenants. On May 19, 2014, the Company refinanced its 1.65issued a ¥1.0 billion yen guaranteed note that matured on May 18, 2014.was guaranteed by the Company. The debt was issued at face value or approximately $16.1of ¥1.0 billion (approximately $9.7 million as ofat July 31, 2014,2016) is due May 19, 2019,July 15, 2021 and bears interest payable quarterly at a variable interest rate. The interest rate was 0.56 percent0.25% as of July 31, 2014.At July 31, 2014 and 2013, there was $45.7 million and $50.0 million available for use, respectively, under these two facilities. There was $4.3$26.8 million outstanding at July 31, 20142016, and no amounts$15.3 million outstanding at July 31, 2013.2015 and all borrowings which were outstanding on those dates had maturities which were less than twelve months. The weighted average interest rate on the short-term borrowings outstanding at July 31, 2014,2016, was 0.91 percent.or $133.9(approximately $111.1 million at July 31, 2016) program for issuing treasury notes for raising short, medium,short-, medium- and long-term financing for its European operations. There were no amounts outstanding amounts onunder this program at July 31, 20142016 or 2013.2015. Additionally, the Company’s European operations have lines of credit with an available limit of €43.6€44.0 million or $58.3 million.(approximately $48.9 million at July 31, 2016). There werewas no amountsamount outstanding at July 31, 2016, and there was $10.4 million outstanding on these lines of credit as ofat July 31, 2014 or 2013.$1.0approximately $8.7 million outstanding under these credit facilities as of July 31, 20142016, and $9.2$1.6 million outstanding as of July 31, 2013.2015 and all borrowings which were outstanding on those dates had maturities which were less than twelve months. At July 31, 2016 and 2015, there was approximately $45.5 million and $47.2 million available for use, respectively, under these facilities. The weighted average interest rate on these short-term borrowings outstanding at July 31, 20142016 and July 31, 2013,2015, was 0.75 percent0.32% and 0.44 percent,0.41%, respectively. Also, at20142016 and 2013,2015, the Company had outstandinga contingent liability for standby letters of credit totaling $7.3 million and $7.8 million, respectively, which have been issued and $12.2 million, respectively, upon which no amounts had been drawn.are outstanding. The letters of credit guarantee payment to third parties in the event the Company is in breach of insurance contract terms as detailed in each letter of credit.Fiscal 2014,fiscal 2016, credit in the global credit markets was accessible and market interest rates remained low. The Company believes that its current financial resources, together with cash generated by operations, are sufficient to continue financing its operations for the next twelve months. There can be no assurance, however, that the cost or availability of future borrowings will not be impacted by future capital market disruptions.2014,2016, the Company was in compliance with all such covenants. Shareholders’by $82.7$7.3 million from $1,085.2to $771.4 million at July 31, 2013, to $1,002.5 million at July 31, 2014. The decrease was primarily due to the repurchase2016 as purchases of treasury stock for $279.4 million and $87.3 millionpayments of dividends declared. These decreasespaid were partially offset by currentnet earnings for the year earnings of $260.2 million, $13.0 million of stock options exercised, $10.6 million in tax reductions related to employee plans, and $9.9 million of the equity impact of stock option expense. The Company’s inventory balance was $253.4 million as ofended July 31, 2014, compared2016.$234.8 million as of July 31, 2013. Excluding the impact of foreign exchange fluctuations, inventories increased $18.2 million. Current year inventory levels increased over prior yeargenerate cash to match the increased Customer demand as compared to the prior year. Additionally, as of July 31, 2014, several large gas turbine projects were being constructed for Fiscal 2015 projects, resulting in an increase in the inventory balance held at year end. The Company’s accounts receivable balance was $474.2 million as of July 31, 2014, compared to $430.8 million as of July 31, 2013. Excluding the impact of foreign exchange fluctuations, accounts receivable increased $43.8 million driven by the timing of receipt of payments from some of our larger Customers compared to the fourth quarter of the prior fiscal year. Cash FlowsDuring Fiscal 2014, $317.8 million offund its operating, investing, and financing activities. Significant factors affecting liquidity are: cash wasflows generated from operating activities, capital expenditures, acquisitions, dispositions, dividends, repurchase of outstanding shares, adequacy of available bank lines of credit and the ability to attract long-term capital with satisfactory terms. The Company generates substantial cash from the operation of its businesses and remains in a strong financial position, with sufficient liquidity available for reinvestment in existing businesses and strategic acquisitions. July 31, 2016 2015 2014 Net cash provided by (used in): Operating activities $ 286.1 $ 212.8 $ 317.8 Investing activities (55.6 ) (111.7 ) (124.1 ) Financing activities (175.0 ) (179.0 ) (120.8 ) Effect of exchange rate changes on cash (2.2 ) (28.6 ) (0.6 ) Increase (decrease) in cash and cash equivalents $ 53.3 $ (106.5 ) $ 72.3 with $315.9to $212.8 million in Fiscal 2013.during the prior fiscal year, an increase of $73.3 million. The increase in cash generated by operating activities resulted from a $99.6 million higher cash inflows from working capital relative to the prior fiscal year, partially offset by lower net earnings of $17.3 million. The higher cash inflows from working capital was primarily attributable to improvements in inventories and accounts receivable of $55.3 million and $29.2 million, compared to fiscal 2015 driven by active working capital management.$1.9$105.0 million was primarily attributable to ana decrease in net income of $52.1 million combined with higher cash outflows from working capital relative to fiscal 2014. The higher cash outflow from working capital was primarily attributable to $76.9 million increase in cash used for trade accounts payable dueand accrued expenses compared to anfiscal 2014.purchasing activity,days sales outstanding reflects delayed payments and longer payment terms associated with some large GTS projects during fiscal 2016. The Company’s days sales outstanding is also impacted by the mix of foreign sales, particularly in countries where extended payment terms are customary. Days sales outstanding is calculated using the count back method, which calculates the number of days of most recent revenue that is reflected in the net accounts receivable balance.changesproceeds from sales of short-term investments. Capital expenditures for property, plant and equipment during fiscal 2016 totaled $72.9 million compared to $93.8 million during fiscal 2015, a decrease of $20.9 million. Fiscal 2016 and fiscal 2015 expenditures primarily related to the Company’s Global ERP Project, global plant capacity additions, information and lab technology equipment, productivity-enhancing investments at manufacturing sites and tooling to manufacture new products.workingfiscal 2017 is estimated to be between $70 and $80 million. It is anticipated that fiscal 2017 capital needs resulting in increases in accounts receivable and inventory levels versus the prior year. Operating cash flows,expenditures will be financed primarily by cash on hand, cash generated from operations, and lines of credit.facilitiesincluding current maturities, by $15.4 million as debt repayments exceeded proceeds from long-term debt of $9.6 million. Short-term borrowings at July 31, 2016 were usedreduced by $23.6 million from July 31, 2015.support $97.2the issuance of $150.0 million of net capital expenditures, $279.4 million of stock repurchases, $83.1 million of dividend payments, and $81.9 million of long-term debt repayments. senior unsecured notes during in April 2015.cash equivalents increased $72.3 million during Fiscal 2014.the end of the year, the Company held $296.4 million inJuly 31, 2016 and 2015, cash and cash equivalents up from $224.1were $243.2 million and $189.9 million, respectively. The Company did not hold any short-term investments at July 31, 2013. Short-term investments were $127.2 million compared to $99.8 million at July 31, 2013.2016. Short-term investments may change year to year based on maturity dates of existing investments, the Company’s outlook for cash needs,requirements and available access to other sources of liquidity. The amount of unused lines of credit as of July 31, 2014, was approximately $357.6 million. Current maturities of long-term debt of $1.7 million at year-end decreased from $98.7 million at July 31, 2013, as the Company repaid $80.0 million of current maturities of 6.59 percent unsecured senior notes due November 14, 2013. Long-term debt of $243.7 million at July 31, 2014, increased from $102.8 million at July 31, 2013, due to the issuance of $125.0 million of senior unsecured notes during the third quarter. Long-term debt represented 19.6 percent of total long-term capital, defined as long-term debt plus total shareholders’ equity, compared to 8.7 percent at July 31, 2013.overnearly half of the Company’s earnings occur outside the U.S. Most of these funds are considered permanently reinvested outside the U.S., and will only be repatriated when it is tax effective to do so, as the cash generated from U.S. operations plus the Company’s short-term debt facilities are anticipated to be sufficient for the Company's U.S operation’s cash needs. If additional cash werewas required for the Company’s operations in the U.S., it may be subject to additional U.S. taxes if funds were repatriated from certain foreign subsidiaries. Net capital expenditures for property, plant, and equipment totaled $96.8 million in Fiscal 2014, $94.3 million in Fiscal 2013, and $77.2 million in Fiscal 2012. Fiscal 2014 capital expenditures primarily related to the Company’s Global ERP Project, plant capacity additions, information and lab technology, productivity-enhancing investments at manufacturing sites, and tooling to manufacture new products. Capital spending in Fiscal 2015 is estimated to be between $90 and $100 million. The Company’s capital spending in Fiscal 2015 will be approximately 25 percent for technology initiatives, including the Global ERP Project and research and development labs, 30 percent for tooling for new products, 30 percent will be in the form of automation or cost reduction projects related to the Company’s ongoing Continuous Improvement initiatives, and 15 percent related to capacity expansion. It is anticipated that Fiscal 2015 capital expenditures will be financed primarily by cash on hand, cash generated from operations, and lines of credit.$260$260.0 million and $300$300.0 million in Fiscal 2015.fiscal 2017. At July 31, 2014,2016, the Company had cash and cash equivalents of $296.4$243.2 million and short-term investments of $127.2 million. The Company also had $107.9$506.4 million available under existing credit facilities in the U.S., €143.6 million or $192.2 million, available under existing credit facilities in Europe, and $57.5 million available under various credit facilities and currencies in Asia and the restlines of the world.credit. The Company believes that the combination of existing cash, available credit under existing credit facilities and the expected cash generated by operating activities will be adequate to meet cash requirements for Fiscal 2015,fiscal 2017, including debt repayment, issuancerepayments, payment of anticipated dividends, possible share repurchase activity, potential acquisitions and capital expenditures. Shares and Stock Split At the Company’s Annual Meeting of Stockholders on November 18, 2011, the shareholders approved an increase in the number of authorized shares of common stock, par value $5.00, from 120,000,000 to 240,000,000 and the total number of shares of stock which the Company has the authority to issue from 121,000,000 to 241,000,000. On January 27, 2012, the Company announced that its Board of Directors declared a two-for-one stock split effected in the form of a 100 percent stock dividend. The stock split was distributed March 23, 2012, to stockholders of record as of March 2, 2012. Earnings and dividends per share and weighted average shares outstanding are presented in this Form 10-K after the effect of the 100 percent stock dividend. The two-for-one stock split is reflected in the share amounts in all periods presented in this Form 10-K. DividendsThe Company’s dividend policy is to maintain a payout ratio, which allows dividends to increase with the long-term growth of earnings per share. The Company’s dividend payout ratio target is approximately 30 percent to 40 percent of the prior three years average earnings per share. Including the Company’s declaration on July 25, 2014, of a $0.165 per share dividend to be paid on September 5, 2014, the dividend payout ratio was 38.8 percent of the prior three years average diluted earnings per share on July 31, 2014. Share Repurchase PlanThe Board of Directors authorized the repurchase of 15.0 million shares of common stock under the stock repurchase plan dated September 27, 2013. In Fiscal 2014, the Company repurchased 6.8 million shares of common stock for $279.4 million, or 4.6 percent of its diluted outstanding shares, at an average price of $41.11 per share, of which 0.3 million were repurchased under the prior share repurchase authority. Under the prior stock repurchase plan, the Company repurchased 3.0 million shares for $102.6 million in Fiscal 2013 and 4.5 million shares for $130.2 million in Fiscal 2012. As of July 31, 2014, the Company had remaining authorization to repurchase 8.5 million shares pursuant to the current authorization.50 percent50% of certain debt of its joint venture with Caterpillar, Advanced Filtration Systems Inc. (AFSI), as further discussed in Note L of the Company’s Notes to Consolidated Financial Statements.. As of July 31, 2014,2016, the joint venture had $28.7$24.8 million of outstanding debt.debt, of which the Company guarantees half. The Company does not believe that this guarantee will have a current or future effect on its financial condition, results of operations, liquidity, or capital resources.New Accounting Standards Not Yet Adopted In February 2013,Financial Accounting Standards Board (FASB) issued guidance relatedCompany’s contractual obligations as of July 31, 2016, for the years indicated (in millions): Payments Due by Period Total Long-term debt obligations $ 400.6 $ 50.0 $ 65.9 $ 9.7 $ 275.0 Capital lease obligations 2.0 0.8 1.0 0.2 — Interest on long-term debt obligations 106.8 13.6 21.7 18.7 52.8 Operating lease obligations 25.4 �� 10.0 12.6 2.6 0.2 Purchase obligations (1) 126.2 120.2 5.2 0.2 0.6 Pension and deferred compensation (2) 91.3 15.8 11.9 11.4 52.2 Total (3) $ 752.3 $ 210.4 $ 118.3 $ 42.8 $ 380.8 obligations resulting from jointchange.several liability arrangementsdeferred compensation consists of long-term pension liabilities and salary and bonus deferrals elected by certain executives under the Company’s Deferred Compensation Plan. Deferred compensation balances earn interest based on a treasury bond rate as defined by the plan (10-year treasury bond STRIP rate plus two percent for whichdeferrals prior to January 1, 2011 and 10-year treasury bond rates for deferrals after December 31, 2010) are approved by the total amountHuman Resources Committee of the obligation is fixedBoard of Directors, and are payable at the reporting date. This guidance is effective forelection of the Company beginning the first quarter of Fiscal 2015. The adoption of this standard is not expected to have a material impact on the Company’s consolidated financial statements.participants.May 2014, the FASB issued amended revenue recognition guidance to clarify the principles for recognizing revenue from contracts with Customers. The guidance requires an entity to recognize revenue to depict the transfer of goods or services to Customers in an amount that reflects the consideration to which an entity expects to be entitled in exchange for those goods or services. The guidance also requires expanded disclosures relatingaddition to the nature, amount, timing, and uncertainty of revenue and cash flows arising from contracts with Customers. Additionally, qualitative and quantitative disclosures are required about Customer contracts, significant judgments and changes in judgments, and assets recognized fromabove contractual obligations, the costs to obtain or fulfill a contract. This accounting guidance is effective for the Company beginning in the first quarter of Fiscal 2018 using one of two prescribed retrospective methods. Early adoption is not permitted. The Company is evaluating the impact of the amended revenue recognition guidance on the Company’s consolidated financial statements. In June 2014, the FASB issued amended guidance related to share-based payments where terms of the award provide that a performance target could be achieved after the requisite service period. This guidance is effective for the Company beginning the first quarter of Fiscal 2018. The Company is evaluating the impact of the amended share-based payment guidance on the Company’s consolidated financial statements.Market Risk The Company’s market risk includes the potential loss arising from adverse changes in foreign currency exchange rates and interest rates. The Company manages foreign currency market risk from time to time through the use of a variety of financial and derivative instruments. The Company does not enter into any of these instruments for trading purposes to generate revenue. Rather, the Company’s objective in managingthese risks is to reduce fluctuations in earnings and cash flows associated with changes in foreign currency exchange rates. The Company uses forward exchange contracts and other hedging activities to hedge the U.S. dollar value resulting from existing recognized foreign currency denominated asset and liability balances and also for anticipated foreign currency transactions. The Company also naturally hedges foreign currency through its production in the countries in which it sells its products. The Company’s market risk on interest rates is the potential decrease in fair value of long-term debt resulting from a potential increase in interest rates. See further discussion of these market risks below. Foreign CurrencyDuring Fiscal 2014, the U.S. dollar was generally stronger than in Fiscal 2013 compared to many of the currencies of the foreign countries in which the Company operates. The overall strength of the dollar had a negative impact on the Company’s international net sales results because the foreign denominated revenues translated into fewer U.S. dollars. It is not possible to determine the true impact of foreign currency translation changes. However, the direct effect on reported net sales and net earnings can be estimated. For the year ended July 31, 2014, the impact of foreign currency translation resulted in an overall decrease in reported net sales of $11.4 million and a decrease in reported net earnings of $1.0 million. Foreign currency translation had a negative impact in many regions around the world. The stronger U.S. dollar relative to the yen resulted in a total decrease of $17.7 million in reported net sales. The stronger U.S. dollar relative to the Australian Dollar, the South African rand, the Brazilian real, and the Indian rupee had a negative impact on foreign currency translation with a decrease in reported net sales of $7.8 million, $7.2 million, $3.1 million, and $2.2 million, respectively. In Europe, the weaker U.S. dollar relative to the euro and British pound resulted in a total increase of $28.6 million in reported net sales. Additionally, the weaker U.S. dollar relative to the Chinese renminbi had a positive impact on foreign currency translation, with an increase in reported net sales of $2.3 million. The Company maintains significant assets and operations in Europe, Asia-Pacific, and South Africa, resulting in exposure to foreign currency gains and losses. A portion of the Company’s foreign currency exposure is naturally hedged by incurring liabilities, including bank debt, denominated in the local currency in which the Company’s foreign subsidiaries are located. The foreign subsidiaries of the Company generally purchase the majority of their input costs and then sell to many of their Customers in the same local currency. The Company may be exposed to cost increases relative to local currencies in the markets to which it sells. To mitigateobligated for additional cash outflows of $17.5 million for potential tax obligations, including accrued interest and penalties. The payment and timing of any such adverse trends, the Company, from time to time, enters into forward exchange contracts and other hedging activities. Additionally, foreign currency positions are partially offsetting and are netted against one another to reduce exposure. Some products made in the U.S. are sold abroad. As a result, sales of such products arepayments is affected by the valueultimate resolution of the U.S. dollar relativetax years that are under audit or remain subject to other currencies. Any long-term strengtheningexamination by the relevant taxing authorities. Therefore, quantification of the U.S. dollar could depress these sales. Also, competitive conditions in the Company’s markets may limit its ability to increase product pricing in the facean estimated range and timing of adverse currency movements. InterestThe Company’s exposure to market risks for changes in interest rates relates primarily to its short-term investments, short-term borrowings, and interest rate swap agreements, as well as the potential increase in fair value of long-term debt resulting from a potential decrease in interest rates. The Company has limited earnings or cash flow exposure due to market risks on its long-term debt obligations as a result of the majority of the debt being fixed-rate. However, interest rate changes would affect the fair market value of the debt. As of July 31, 2014, the estimated fair value of long-term debt with fixed interest rates was $237.6 million compared to its carrying value of $225.0 million. The fair value is estimated by discounting the projected cash flows using the rate of which similar amounts of debt could currentlyfuture payments cannot be borrowed. As of July 31, 2014, the Company’s financial liabilities with exposure to changes in interest rates consisted mainly of $185.3 million of short-term debt outstanding and ¥1.65 billion or $16.1 million of variable rate long-term debt. Assuming a hypothetical increase of one-half percent in short-term interest rates, with all other variables remaining constant, interest expense would have increased $0.4 million and interest income would have increased $1.9 million in Fiscal 2014. Pensions The Company is exposed to market return fluctuations on its qualified defined benefit pension plans. In Fiscal 2014, the Company reduced its long–term rate of return from 7.50 percent to 7.14 percent on its U.S. plans and increased its weighted average discount rate of 5.20 percent to 5.48 percent on its non-U.S. plans, to reflect its future expectation for returns. In addition, the Company adjusted the discount rate used to value its pension obligation for its U.S. plans from 3.59 percent to 4.58 percent and from 4.13 percent to 4.04 percent for the non-U.S plans. The plans were underfunded by $8.8 millionmade at July 31, 2014, since the projected benefit obligation exceeded the fair value of the plan assets.this time. U.S. GAAP. The preparation of these financial statements requires the use of estimates, judgments, and assumptions that affect the reported amounts of assets and liabilities at the date of the financial statements and the reported amounts of revenue and expenses during the periods presented. Management bases these estimates on historical experience and various other assumptions that are believed to be reasonable under the circumstances, the results of which form the basis for making judgments about the recorded values of certain assets and liabilities. The Company believes its use of estimates and underlying accounting assumptions adheres to U.S. GAAP and is consistently applied. Valuations based on estimates and underlying accounting assumptions are reviewed for reasonableness on a consistent basis throughout the Company. Management believes theThe Company’s critical accounting policiesCritical Accounting Policies are those that require more significant judgments and estimates used in the preparation of its consolidated financial statements and that are the most important to aid in fully understanding its financial resultsresults. The Company's Critical Accounting Policies are the following:Customer,customer, the Company has no remaining obligations, the selling price is fixed and determinable, and collectability is reasonably assured. Although theThe vast majority of the Company’s sales agreements containare for standard termsproducts with product ownership and conditions, there are alsorisk of loss transferring to the customer when the product has shipped, at which point revenue is recognized. Although less common, the Company does have sales agreements that contain multiple elements orwith customers requiring product ownership and risk of loss to transfer at the customer’s location. For these non-standard terms, and conditions. the Company defers revenue on these product sales until the product has been delivered.Gas Turbine Systems (GTS)GTS sales, which typically consistsconsist of multiple shipments of components that will comprise the entire GTS project, it must carefully monitor the transfer of title related to each portion of a system salesale. The Company defers revenue recognition until product ownership and may defer recognitionrisk of revenue untilloss has transferred to the customer for all components and when all terms specified in the contract are met which may include requirements such as the requirement for the Company to deliver technical documentation to the customer or a quality inspection which may be required to be approved by the customer. Therecognized.recognized Goodwill and other intangible assetsGoodwill is assessed for impairment annually, or more frequently if events or changes in circumstances indicate that the asset mightmay be impaired. The Company performs impairment assessments for its reporting units and uses a discounted cash flow model based on management’s judgments and assumptions to determine the estimated fair value. An impairment loss generally would be recognized when the carrying amount of the reporting unit’s net assets exceeds the estimated fair value of the reporting unit. The Company performed an impairment assessment during the third quarter of Fiscal 2014 to satisfy its annual impairment requirement.fiscal 2016. The impairmentresults of this assessment in the third quarter indicatedshowed that the estimated fair values of the reporting units to which goodwill is assigned continued to significantly exceed the corresponding carrying values of the respective reporting units including recordedresulting in no goodwill and, as such, no impairment existed atimpairment. Of the Company's five reporting units that time. Other intangible assets with definite lives continue to be amortized over their estimated useful lives. Definite lived intangible assets are also subject to impairment assessments. A considerable amount of management judgment and assumptions are required in performing the impairment assessments, principally in determining the fair value of each reporting unit. The important assumptions utilized in these assessments include the (i) discount rate; (ii) projected revenue, gross margin, operating income; and (iii) terminal value. While the Company believes its judgments and assumptions are reasonable, different assumptions could changecontain goodwill, the estimated fair values during the Company's annual third quarter fiscal 2016 impairment tests exceeded the respective carrying values by at least 34%.therefore,softening demand for large-turbine projects. Given the challenges facing this business, the Company revisited its strategic focus and priorities. The Company will continue to focus on innovative products while growing the aftermarket business but will be more selective in taking on large-turbine projects, which resulted in the revised forecast associated with its GTS reporting unit.chargesassessment using a discounted cash flow model based on management's judgments and assumptions to determine the estimated fair value of the reporting unit. Based on the results of this assessment, the Company concluded the estimated fair value of the GTS reporting unit exceeded the respective carrying amount of the reporting unit by approximately 38%. Therefore, the second step of the impairment test was not necessary for this reporting unit.required.2014.2016. As of July 31, 2014,2016, the liability for unrecognized tax benefits, accrued interest, and penalties was $16.7 million.$17.5 million.This resulted in the selection of the 7.14 percent long-term rate of return on assets assumption as of July 31, 2014, for developing the Fiscal 2015 expense for the Company’s U.S. pension plans. In addition, the Company decreased the discount rate used to value the pension obligation for its U.S. plans from 4.58 percent to 4.33 percent. The Company also selected the long-term rate of return on assets for its non-U.S. plans of 5.41 percent and adjusted the discount rate used to 3.64 percent for developing the Fiscal 2015 expense. The expected long-term rate of return on assets assumption for the plans outside the U.S. reflects the investment allocation and expected total portfolio returns specific to each plan and country.65 percent65% of the plansplans’ assets are invested in equity securities, 30 percent30% in fixed income, and 5 percent5% in real assets (investments into funds containing commodities and real estate). In Fiscal 2015,fiscal 2016, the Company plans to begincontinue investing in liability-driven investment funds, which will change the asset allocations.U.S. plan assets from 7.14 percent, would have changed the Fiscal 2014fiscal 2016 annual pension expense by approximately $4.5$4.6 million. The expected long-term rate of return on assets assumption for the plans outside the U.S. follows the same methodology as described above, but reflects the investment allocation and expected total portfolio returns specific to each plan and country.As of the measurement date of July 31, 2014, the Company decreased itsThis resulted in a weighted average discount rate for the U.S. pension plans of 3.65% down from 4.33% in the prior year and decreased the weighted average discount rate used for its non-U.S. plans from 3.14% to 4.33 percent from 4.58 percent as of July 31, 2013.2.08%. Effective August 1, 2016, the Company changed to the split/spot rate method to estimate the service and interest costs for its U.S., United Kingdom, and Belgium plans. The decrease of 25 basis points is consistent with published bond indices. The change increasednew method utilizes a full yield curve approach to estimate service and interests costs by applying specific spot rates along the Company’s U.S. projectedyield curve used to determine the benefit obligation as of July 31, 2014, by approximately $8.3 million and is expected to increase pension expense in Fiscal 2015 by approximately $0.7 million. The rates discussed above are weighted average rates as the Company has multiple plans both in the U.S. and internationally.Fiscal 2014,fiscal 2016, the Company’s global pension expense was $15.5$17.8 million. TheEffective August 1, 2016, participants in the U.S. salaried plan no longer continue to accrue Company expects that global pension expenses will increase approximately $3.1 millioncontribution credits under the plan but are eligible for a 3.0% annual Company retirement contribution in Fiscal 2015 as comparedaddition to Fiscal 2014, which is driven primarily by the changes in assumptions. Company’s match to their 401(k) accounts. In July 2013, the Company announced that, effective August2013, the salaried planSummary of Significant Accounting Policies included in the U.S. was frozen to any Employees hired on or after August 1, 2013. Then, effective August 1, 2016, Employees hired prior to August 1, 2013, would no longer continue to accrue Company contribution credits under that plan. Additionally, in July 2013, the Company announced that Employees hired on or after August 1, 2013, would be eligible for a 3.0 percent annual Company retirement contribution in addition to the Company’s 401(k) match. Effective August 1, 2016, Employees hired prior to August 1, 2013, will be eligible for the 3.0 percent annual Company retirement contribution.Form 10-K,Annual Report, which could cause actual results to differ materially from historical results or those anticipated. The words or phrases “will likely result,” “are expected to,” “will continue,” “will allow,” “estimate,” “project,” “believe,” “expect,” “anticipate,” “forecast,”“forecast” and similar expressions are intended to identify forward-looking statements within the meaning of Section 21e of the Exchange Act and Section 27A of the Securities Act of 1933, as amended, as enacted by the Private Securities Litigation Reform Act of 1995 (PSLRA). In particular, the Company desires to take advantage of the protections of the PSLRA in connection with the forward-looking statements made in this Annual Report, on Form 10-K, including those contained in the “Outlook” section of Item 7.7 Management’s Discussion and Analysis of Financial Condition and Results of Operations. All statements other than statements of historical fact are forward-looking statements. These statements do not guarantee future performance.Form 10-K,Annual Report, as well as other factors, could affect the Company’s performance and could cause the Company’s actual results for future periods to differ materially from any opinions or statements expressed. These factors include, but are not limited to, risks associated with: world economic factors and industrial market conditions; the ongoing economic uncertainty,Company's ability to maintain certain competitive advantages over competitors; pricing pressures; the reduced demand for hard disk drive products withCompany's ability to protect and enforce its intellectual property rights; the increased use of flash memory,Company's dependence on global operations; customer concentration in certain cyclical industries; commodity availability and pricing; the potential for some Customers to increase their reliance on their own filtration capabilities, currency fluctuations, commodity prices, political factors, the Company’s international operations, highly competitive markets, governmental laws and regulations, including the impactcontinued implementation of the various economic stimulusCompany's global ERP information technology system and financial reform measures, the implementation of ourother new information technology systems,systems; information security and data breaches, potential global events resultingbreaches; foreign currency fluctuations; governmental laws and regulations; changes in market instability includingtax laws, regulations and results of examinations; the Company's ability to attract and retain key personnel; changes in capital and credit markets; execution of the Company's acquisition strategy; the possibility of goodwill or intangible asset impairment; execution of restructuring plans; the Company's ability to maintain an effective system of internal control over financial bailouts and defaults of sovereign nations, military and terrorist activities, health outbreaks, natural disasters,reporting and other factors included in Item 1A Risk Factors of this Report on Form 10-K.Annual Report. The Company undertakes no obligation to publicly update or revise any forward-looking statements, whether as a result of new information, future events or otherwise. Marketdisclosure appearsincludes the potential loss arising from adverse changes in Management’s Discussionforeign currency exchange rates and Analysisinterest rates. The Company manages foreign currency market risk from time to time through the use of a variety of financial andpage 22 under “Market Risk.”interest rates is the potential decrease in fair value of long-term debt resulting from a potential increase in interest rates. See further discussion of these market risks below.for the Company.as such term is defined in Exchange Act Rule 13a-15(f). Management conducted an evaluation of the Company has assessed the effectiveness of the Company’s internal control over financial reporting based onas of July 31, 2016. In making its assessment of internal control financial reporting, management used the frameworkcriteria described inInternal Control –- Integrated Framework –- version 19922013 issued by the Committee of Sponsoring Organizations of the Treadway Commission (COSO). Based on this evaluation, management concluded that the Company’s internal control over financial reporting was effective as of July 31, 2014.2016 based on criteria in Internal Control-Integrated Framework issued by the COSO. The Company’s independent registered public accounting firm, PricewaterhouseCoopers LLP, has audited the effectiveness of the Company’s internal control over financial reporting as of July 31, 2014,2016, as stated in itstheir report which follows in Item 8 of this Form 10-K.appears herein./s/ William M. Cook/s/ James F. Shaw/s/ Tod E. Carpenter /s/ Scott J. Robinson William M. CookJames F. ShawScott J. Robinson President and Chief Executive Officer Chief Financial Officer 26, 2014September 26, 201423, 20162014 2016and July 31, 2013,2015, and the results of their operations and their cash flows for each of the three years in the period ended July 31, 2014 2016in conformity with accounting principles generally accepted in the United States of America. In addition, in our opinion, the financial statement schedule listed in the accompanying index appearing under Item 15(2) presents fairly, in all material respects, the information set forth therein when read in conjunction with the related consolidated financial statements. Also in our opinion, the Company maintained, in all material respects, effective internal control over financial reporting as of July 31, 2014,2016, based on criteria established inInternal Control - Integrated Framework – version 1992(2013)issued by the Committee of Sponsoring Organizations of the Treadway Commission (COSO). The Company’sCompany's management is responsible for these financial statements, and financial statement schedule, for maintaining effective internal control over financial reporting and for its assessment of the effectiveness of internal control over financial reporting included in accompanying Management’s Report on Internal Control over Financial Reporting.Reporting appearing under Item 8A. Our responsibility is to express opinions on these financial statements on the financial statement schedule, and on the Company’sCompany's internal control over financial reporting based on our integrated audits. We conducted our audits in accordance with the standards of the Public Company Accounting Oversight Board (United States). Those standards require that we plan and perform the audits to obtain reasonable assurance about whether the financial statements are free of material misstatement and whether effective internal control over financial reporting was maintained in all material respects. Our audits of the financial statements included examining, on a test basis, evidence supporting the amounts and disclosures in the financial statements, assessing the accounting principles used and significant estimates made by management, and evaluating the overall financial statement presentation. Our audit of internal control over financial reporting included obtaining an understanding of internal control over financial reporting, assessing the risk that a material weakness exists, and testing and evaluating the design and operating effectiveness of internal control based on the assessed risk. Our audits also included performing such other procedures as we considered necessary in the circumstances. We believe that our audits provide a reasonable basis for our opinions./s/ PricewaterhouseCoopers LLPPricewaterhouseCoopers LLPMinneapolis, MinnesotaSeptember 26, 2014Consolidated Statements of Earnings
and per share amounts) Year ended July 31, 2016 2015 2014 Net sales $ 2,220.3 $ 2,371.2 $ 2,473.5 Cost of sales 1,465.5 1,562.6 1,595.7 Gross profit 754.8 808.6 877.8 Selling, general and administrative 425.1 460.1 460.3 Research and development 55.5 60.2 61.8 Operating income 274.2 288.3 355.7 Other income, net (3.9 ) (15.5 ) (15.2 ) Interest expense 20.7 15.2 10.2 Earnings before income taxes 257.4 288.6 360.7 Income taxes 66.6 80.5 100.5 Net earnings $ 190.8 $ 208.1 $ 260.2 Weighted average shares – basic 133.8 137.8 145.6 Weighted average shares – diluted 134.8 139.4 147.6 Net earnings per share – basic $ 1.43 $ 1.51 $ 1.79 Net earnings per share – diluted $ 1.42 $ 1.49 $ 1.76 Cash dividends declared per share $ 0.690 $ 0.670 $ 0.610 Donaldson Company, Inc. and Subsidiaries Year ended July 31, 2016 2015 2014 Net earnings $ 190.8 $ 208.1 $ 260.2 Other comprehensive income (loss) Foreign currency translation loss (18.5 ) (119.1 ) (2.1 ) Pension and postretirement liability adjustment, net of deferred taxes of $14.4, $(0.2) and $1.3, respectively (25.2 ) 3.4 (6.3 ) Gain (loss) on hedging derivatives, net of deferred taxes of $(0.1), $0.4 and $(0.1), respectively 0.1 (0.5 ) 0.1 Net other comprehensive loss (43.6 ) (116.2 ) (8.3 ) Total comprehensive income $ 147.2 $ 91.9 $ 251.9 Consolidated Balance Sheets
except share amounts)
151,643,194 shares issued in both 2014 and 2013 As of July 31, 2016 2015 ASSETS Current assets: Cash and cash equivalents $ 243.2 $ 189.9 Short-term investments — 27.5 Accounts receivable, less allowance of $8.6 and $6.7 452.4 460.0 Inventories, net 234.1 265.0 Deferred income taxes 29.0 28.2 Prepaids and other current assets 51.0 60.1 Total current assets 1,009.7 1,030.7 Property, plant and equipment, net 469.8 470.6 Goodwill 229.3 223.7 Intangible assets, net 38.5 37.9 Other long-term assets 41.3 46.6 Total assets $ 1,788.6 $ 1,809.5 LIABILITIES AND SHAREHOLDERS' EQUITY Current liabilities: Short-term borrowings $ 165.5 $ 187.3 Current maturities of long-term debt 51.2 1.8 Trade accounts payable 143.3 179.2 Accrued employee compensation and related taxes 61.0 66.5 Accrued liabilities 37.5 42.9 Other current liabilities 85.3 82.9 Total current liabilities 543.8 560.6 Long-term debt 351.8 389.2 Deferred income taxes 3.1 12.5 Other long-term liabilities 118.5 68.5 Total liabilities 1,017.2 1,030.8 Commitments and contingencies (Note 17) Shareholders’ equity: Preferred stock, $1.00 par value, 1,000,000 shares authorized, none issued — — Common stock, $5.00 par value, 240,000,000 shares authorized, 151,643,194 shares issued 758.2 758.2 Retained earnings 905.1 815.2 Non-controlling interest 4.0 3.9 Stock compensation plans 16.7 17.9 Accumulated other comprehensive income (loss) (205.6 ) (162.0 ) Treasury stock, 18,750,503 and 17,044,950 shares, at cost (707.0 ) (654.5 ) Total shareholders’ equity 771.4 778.7 Total liabilities and shareholders’ equity $ 1,788.6 $ 1,809.5 Donaldson Company, Inc. and Subsidiaries Year ended July 31, 2016 2015 2014 Operating Activities Net earnings $ 190.8 $ 208.1 $ 260.2 Adjustments to reconcile net earnings to net cash provided by operating activities Depreciation and amortization 74.9 74.3 67.2 Equity in earnings of affiliates, net of distributions (0.3 ) (1.1 ) (3.4 ) Deferred income taxes (3.3 ) (5.6 ) (7.8 ) Tax benefit of equity plans (2.7 ) (6.8 ) (8.8 ) Stock compensation plan expense 7.3 10.7 11.6 Loss on sale of business — — 0.9 Other, net 11.7 25.1 10.1 Changes in operating assets and liabilities, net of acquired businesses Accounts receivable 8.5 (20.7 ) (44.8 ) Inventories 29.1 (26.2 ) (19.3 ) Prepaids and other current assets 0.8 (27.8 ) (7.8 ) Trade accounts payable and other accrued expenses (30.7 ) (17.2 ) 59.7 Net cash provided by operating activities 286.1 212.8 317.8 Investing Activities Purchases of property, plant and equipment (72.9 ) (93.8 ) (97.2 ) Proceeds from sale of property, plant and equipment 2.2 0.2 0.4 Purchases of short-term investments — (27.0 ) (108.8 ) Proceeds from sale of short-term investments 28.0 114.5 81.5 Acquisitions, net of cash acquired (12.9 ) (105.6 ) — Net cash used in investing activities (55.6 ) (111.7 ) (124.1 ) Financing Activities Proceeds from long-term debt 9.6 150.0 125.0 Repayments of long-term debt (1.4 ) (4.2 ) (81.9 ) Change in short-term borrowings (23.6 ) 2.8 175.4 Purchase of treasury stock (84.3 ) (256.3 ) (279.4 ) Dividends paid (91.2 ) (91.2 ) (83.1 ) Tax benefit of equity plans 2.7 6.8 8.8 Exercise of stock options 13.2 13.1 14.4 Net cash used in financing activities (175.0 ) (179.0 ) (120.8 ) Effect of exchange rate changes on cash (2.2 ) (28.6 ) (0.6 ) Increase (decrease) in cash and cash equivalents 53.3 (106.5 ) 72.3 Cash and cash equivalents, beginning of year 189.9 296.4 224.1 Cash and cash equivalents, end of year $ 243.2 $ 189.9 $ 296.4 Supplemental Cash Flow Information Cash paid during the year for: Income taxes $ 67.8 $ 85.6 $ 93.1 Interest $ 19.7 $ 14.7 $ 11.1 Total Balance July 31, 2013 $ 758.2 $ — $ 532.3 $ — $ 21.8 $ (37.5 ) $ (189.6 ) $ 1,085.2 Comprehensive income Net earnings 260.2 260.2 Foreign currency translation (2.1 ) (2.1 ) Pension liability adjustment, net of deferred taxes (6.3 ) (6.3 ) Net gain on cash flow hedging derivatives, net of deferred taxes 0.1 0.1 Comprehensive income 251.9 Treasury stock acquired (279.4 ) (279.4 ) Stock options exercised (7.0 ) (10.5 ) 30.5 13.0 Deferred stock and other activity (3.1 ) (1.8 ) (0.5 ) 4.9 (0.5 ) Performance awards (0.4 ) (0.5 ) (1.7 ) 1.6 (1.0 ) Stock option expense 9.9 9.9 Tax reduction - employee plans 10.5 10.5 Dividends ($0.61 per share) (87.2 ) (87.2 ) Balance July 31, 2014 758.2 — 702.4 — 19.6 (45.8 ) (432.0 ) 1,002.4 Comprehensive income Net earnings 208.1 208.1 Foreign currency translation (119.1 ) (119.1 ) Pension liability adjustment, net of deferred taxes 3.4 3.4 Net gain on cash flow hedging derivatives, net of deferred taxes (0.5 ) (0.5 ) Comprehensive income 91.9 Purchase of IFIL 3.9 3.9 Treasury stock acquired (256.3 ) (256.3 ) Stock options exercised (5.7 ) (13.1 ) 30.2 11.4 Deferred stock and other activity (1.9 ) (0.7 ) (1.1 ) 3.0 (0.7 ) Performance awards (0.1 ) (0.1 ) (0.6 ) 0.6 (0.2 ) Stock option expense 9.5 9.5 Tax reduction - employee plans 7.7 7.7 Dividends ($0.67 per share) (90.9 ) (90.9 ) Balance July 31, 2015 758.2 — 815.2 3.9 17.9 (162.0 ) (654.5 ) 778.7 Comprehensive income Net earnings 190.8 190.8 Foreign currency translation (18.5 ) (18.5 ) Pension liability adjustment, net of deferred taxes (25.2 ) (25.2 ) Net gain on cash flow hedging derivatives, net of deferred taxes 0.1 0.1 Comprehensive income 147.2 Treasury stock acquired (84.3 ) (84.3 ) Stock options exercised (1.4 ) (14.7 ) 29.0 12.9 Deferred stock and other activity (1.3 ) (1.4 ) 0.1 (0.7 ) 2.5 (0.8 ) Performance awards (0.5 ) 0.3 (0.2 ) Stock option expense 6.7 6.7 Tax reduction - employee plans 2.7 2.7 Dividends ($0.69 per share) (91.5 ) (91.5 ) Balance July 31, 2016 $ 758.2 $ — $ 905.1 $ 4.0 $ 16.7 $ (205.6 ) $ (707.0 ) $ 771.4 Donaldson Company, Inc. and Subsidiaries
Stock
Paid-in
Capital
Earnings
Compensation
Plans
Other
Comprehensive
Income (Loss)
StockNOTES TO CONSOLIDATED FINANCIAL STATEMENTSA1. Summary of Significant Accounting Policies Company, Inc. (Donaldson or the Company), is a worldwide manufacturer of filtration systems and replacement parts. The Company’s core strengths are leading filtration technology, strong Customercustomer relationships and its global presence. Products are manufactured at 3942 plants around the world and through three joint ventures. Products are sold to original equipment manufacturers (OEMs),OEMs, distributors, dealers and directly to end-users.subsidiaries.subsidiaries along with the majority stake in IFIL.USA. All intercompany accounts and transactions have been eliminated. The Company’s three joint ventures that are not majority-owned are accounted for under the equity method.generally accepted accounting principles in the United States of America (U.S.) (U.S. GAAP)GAAP requires management to make estimates and assumptions that affect the amounts reported in the financial statements and accompanying notes. Actual results could differ from those estimates.other comprehensive income (loss) (AOCI)Other Comprehensive Income (Loss) in the Consolidated Balance Sheets. Elements of the Consolidated Statements of Earnings are translated at average exchange rates in effect during the year. Realized and unrealized foreign currency transaction gains and losses are included in Other income,Income, net in the Consolidated Statements of Earnings. Foreign currency translationtransaction gains (losses) of $1.7$(4.7) million, $0.2$2.1 million, and $1.8$1.7 million are included in Other income,Income, net in the Consolidated Statements of Earnings in Fiscalthe years ended July 31, 2016, 2015 and 2014, 2013, and 2012, respectively. As of July 31, 2014 and 2013, the The Company’s short-term investments consistedconsist exclusively of time deposits with durations longer than 3 months, but less than 1one year. These investments are carried at cost, which approximates their estimated fair value. Classification of the Company’s investments as current or non-current is dependent upon management’s intended holding period, the investment’s maturity date and liquidity considerations based on market conditions. If management intends to hold the investments for longer than one year as of the balance sheet date, they are classified as non-current.receivablereceivables are recorded at the invoiced amount and do not bear interest. The allowance for doubtful accounts is the Company’s best estimate of the amount of credit losses in its existing accounts receivable. The Company determines the allowance based on historical write-off experience in the industry, regional economic data and evaluation of specific Customercustomer accounts for risk of loss. The Company reviews its allowance for doubtful accounts monthly. Past due balances over 90 days and over a specified amount are reviewed individually for collectability. All other balances are reviewed on a pooled basis by type of receivable. Account balances are charged off against the allowancereserved for when the Company feels it is probable the receivable will not be recovered. The Company does not have any off-balance-sheetoff-balance sheet credit exposure related to its Customers.customers.Table of ContentsInventories InventoriesInventories are stated at the lower of cost or market. U.S. inventories are valued using the last-in, first-out (LIFO) method while the non-U.S. inventories are valued using the first-in, first-out (FIFO) method. Inventories valued at LIFO were approximately 33 percent29.0% and 34.2% of total inventories at July 31, 20142016 and 2013.2015, respectively. For inventories valued under the LIFO method, the FIFO cost exceeded the LIFO carrying values by $37.9$39.8 million and $37.8$41.6 million at July 31, 20142016 and 2013,2015, respectively. Results of operations for all periods presented were not materially affected by the liquidation of LIFO inventory. The components of inventory are as follows (thousands of dollars):underusing the straight-line method. Depreciation expense was $68.8 million, $66.9 million and $62.0 million in Fiscalthe years ended July 31, 2016, 2015 and 2014, $58.8 million in Fiscal 2013, and $55.3 million in Fiscal 2012.respectively. The estimated useful lives of property, plant and equipment are 10ten to 40forty years for buildings, including building improvements and 3three to 10ten years for machinery and equipment. The components of property, plant, and equipment are as follows (thousands of dollars):Customercustomer relationships and lists, are recorded at cost and are amortized on a straight-line basis over their3three to 20twenty years. Goodwill is assessed for impairment annually or if an event occurs or circumstances change that would indicate the carrying amount may be impaired. The impairment assessment for goodwill is done at a reporting unit level. Reporting units are one level below the operating segment level but can be combined when reporting units within the same operating segment have similar economic characteristics. An impairment loss generally would be recognized when the carrying amount of the reporting unit’s net assets exceeds the estimated fair value of the reporting unit. significant impairment charges recorded in Fiscal 2014, Fiscal 2013,fiscal 2016 or Fiscal 2012.fiscal 2014. Comprehensive Income (Loss)Comprehensive income (loss) consists of net income, foreign currency translation adjustments, net changes in the funded status of pension retirement obligations, and net gains or losses on cash flow hedging derivatives, and is presented in the Consolidated Statements of Changes in Shareholders’ Equity. The components of the ending balances of AOCI are as follows (thousands of dollars): Cumulative foreign currency translation is not adjusted for income taxes. See Note H for additional disclosures related to AOCI. Earnings Per Share The Company’s basic net earnings per share are computed by dividing net earnings by the weighted average number of outstanding common shares. The Company’s diluted net earnings per share is computed by dividing net earnings by the weighted average number of outstanding common shares and common equivalent shares relating to stock options and stock incentive plans. Certain outstanding options were excluded from the diluted net earnings per share calculations because their exercise prices were greater than the average market price of the Company’s common stock during those periods. There were 884,138 options, 22,619 options, and 1,063,135 options excluded from the diluted net earnings per share calculation for the fiscal year ended July 31, 2014, 2013, and 2012, respectively. The following table presents information necessary to calculate basic and diluted earnings per share: On January 27, 2012, the Company announced that its Board of Directors declared a two-for-one stock split effected in the form of a 100 percent stock dividend. The stock split was distributed March 23, 2012, to stockholders of record as of March 2, 2012. Earnings and dividends per share and weighted average shares outstanding are presented in this Form 10-K after the effect of the 100 percent stock dividend. The two-for-one stock split is reflected in the share amounts in all periods presented in the table above and elsewhere in this annual Form 10-K.costsexpenses are charged against earnings in the year incurred. Research and development expensescosts include basic scientific research and the application of scientific advances to the development of new and improved products and their uses.I.10. Stock-based employee compensation cost iscosts are recognized using the fair-value based method.all the following criteria are satisfied: (a) persuasive evidence of a sales arrangement exists; (b) price is fixed and determinable; (c) collectability is reasonably assured; and (d) delivery has occurred. At that time,both product ownership and the risk of loss have transferred to the Customer andcustomer, the Company has no remaining obligations.obligations, the selling price is fixed and determinable, and collectability is reasonably assured. The vast majority of the Company’s sales agreements are for standard products with product ownership and risk of loss transferring to the customer when the product has shipped, at which point revenue is recognized. Although less common, the Company does have sales agreements with customers requiring product ownership and risk of loss to transfer at the customer’s location. For these non-standard terms, the Company defers revenue on these product sales until the product has been delivered.for Fiscal 2014, 2013, and 2012 totaled $64.2of $56.3 million, $66.2$63.2 million and $67.0$64.2 million respectively, and are classified as a component of selling, general and administrative expenses.Customercustomer warranty issues. For a reconciliation of warranty reserve reconciliationreserves, see Note M.8.Recently Not Yet AdoptedIn February 2013,May 2014, the Financial Accounting Standards Board (FASB) issued Accounting Standards Update (ASU) 2014-09, Revenue from Contracts with Customers (Topic 606) (ASU 2014-09), which amended revenue recognition guidance to clarify the principles for recognizing revenue from contracts with customers. The guidance requires an entity to recognize revenue to depict the transfer of goods or services to customers in an amount that reflects the consideration to which an entity expects to be entitled in exchange for those goods or services. The guidance also requires expanded disclosures relating to the nature, amount, timing and uncertainty of revenue and cash flows arising from contracts with customers. Additionally, qualitative and quantitative disclosures are required about customer contracts, significant judgments and changes in judgments and assets recognized from the costs to obtain or fulfill a contract. In 2016, the FASB updatedissued ASU 2016-08, ASU 2016-10, ASU 2016-11, and ASU 2016-12 to clarify, among other things, the disclosure requirementsimplementation guidance related to principal versus agent considerations, identifying performance obligations, and accounting for AOCI.licenses of intellectual property. This accounting guidance is effective for the Company beginning in the first quarter of fiscal 2019. Early application is not permitted. The updatedamendments in this update are to be applied on a retrospective basis, either to each prior reporting period presented or by presenting the cumulative effect of applying the update recognized at the date of initial application. The Company is evaluating the impact that this will have on the Company’s consolidated financial statements.requires companiesrequiring the issuance of debt costs related to disclose amounts reclassified outa recognized debt liability be presented on the balance sheet as a direct deduction from the amount of AOCI by component.the debt liability, consistent with debt discounts and premiums. This accounting guidance is effective for the Company beginning in the first quarter of fiscal 2017. The updatedadoption of ASU 2015-03 will only result in a reclassification of debt issuance costs on the balance sheet.only impacts disclosure requirements and does not affect howrequiring a company to categorize investments for which fair values are measured using the net income or other comprehensive income are calculated. The updatedasset value (NAV) per share practical expedient. ASU 2015-07 also limits the disclosures to investments for which the entity has elected to measure the fair value using the practical expedient. This accounting guidance was adopted byis effective for the Company beginning in the first quarter of Fiscal 2014. For additional2017. ASU 2015-07 will only affect the Company's disclosures. July 31, 2016 2015 Raw materials $ 92.5 $ 113.4 Work in process 18.4 22.6 Finished products 123.2 129.0 Total inventories $ 234.1 $ 265.0 July 31, 2016 2015 Land $ 20.0 $ 20.0 Buildings 280.4 272.6 Machinery and equipment 810.9 783.1 Construction in progress 39.3 52.4 Less: accumulated depreciation (680.8 ) (657.5 ) Net property, plant and equipment $ 469.8 $ 470.6 refernecessary to Note H. Year Ended July 31, 2016 2015 2014 Weighted average common shares – basic 133.8 137.8 145.6 Diluted share equivalents 1.0 1.6 2.0 Weighted average common shares – diluted 134.8 139.4 147.6 Net earnings for basic and diluted earnings per share computation $ 190.8 $ 208.1 $ 260.2 Net earnings per share: Basic $ 1.43 $ 1.51 $ 1.79 Diluted $ 1.42 $ 1.49 $ 1.76 B5. Goodwill and Other Intangible Assetsacquisition or disposition activity during Fiscal 2014the years ended July 31, 2016 and 2015.2013.more frequently if events or changes in circumstances indicate that the asset may be impaired. The Company completed its annualperformed an impairment assessments inassessment during the third quartersquarter of Fiscal 2014 and 2013.fiscal 2016. The results of this assessment showed that the estimated fair values of the reporting units to which goodwill is assigned continued to significantly exceed the corresponding carrying values of the respective reporting units resulting in no goodwill impairment. Following Of the Company's five reporting units that contain goodwill, the estimated fair values during its annual third quarter fiscal 2016 impairment tests exceeded the respective carrying values by at least 34%.20142016 and 2013:
Products
Products
Goodwill Balance as of July 31, 2014 $ 72.4 $ 94.0 $ 166.4 Goodwill acquired — 66.8 66.8 Foreign exchange translation (1.4 ) (8.1 ) (9.5 ) Balance as of July 31, 2015 71.0 152.7 223.7 Goodwill acquired 6.3 — 6.3 Foreign exchange translation — (0.7 ) (0.7 ) Balance as of July 31, 2016 $ 77.3 $ 152.0 $ 229.3 Customercustomer relationships and lists. FollowingThe following is a reconciliation of intangible assets for the years ended July 31, 20142016 and 2013:
Carrying
Amount
Amortization
Intangible
Assets Balance as of July 31, 2014 $ 81.3 $ (45.3 ) $ 36.0 Intangibles acquired 10.0 — 10.0 Amortization expense — (6.8 ) (6.8 ) Foreign exchange translation (4.2 ) 2.9 (1.3 ) Balance as of July 31, 2015 87.1 (49.2 ) 37.9 Intangibles acquired 6.6 — 6.6 Amortization expense — (6.1 ) (6.1 ) Foreign exchange translation 3.1 (3.0 ) 0.1 Balance as of July 31, 2016 $ 96.8 $ (58.3 ) $ 38.5 $11.5$7.8 million and $13.3$8.8 million and customer related intangibles of $30.7 million and $29.1 million as of July 31, 20142016 and 2013, respectively, and Customer related intangibles of $24.5 million and $28.0 million as of July 31, 2014 and 2013,2015, respectively. As of July 31, 2014,2016, patents, trademarks, and trade names had a weighted average remaining life of 7.957.4 years and Customercustomer related intangibles had a weighted average remaining life of 11.1312.4 years. Expected amortization expense relating to existing intangible assets is as follows (in thousands)millions):Year Ending July 31, Amount 2017 $ 6.0 2018 4.8 2019 4.5 2020 4.2 2021 4.0 Thereafter 15.0 Total expected amortization expense $ 38.5 C6. Credit Facilities Thehas a five-year,entered into an Amendment to its 5 year, multi-currency revolving credit facility with a group of banks under whichbanks. The Amendment increased the Company may borrowCompany's borrowing availability up to $250.0$400.0 million. The agreement provides that loans may be made under a selection of currencies and rate formulas including Base Rate Loans or LIBOR Rate Loans.Loans, as defined in the Amendment. The interest rate on each advance is based on certain market interest rates and leverage ratios. Facility fees and other fees on the entire loan commitment are payable over the duration of this facility. There was $180.0$130.0 million outstanding at July 31, 20142016, and no amounts$160.0 million outstanding at July 31, 2013.2015 and all borrowings which were outstanding on those dates had maturities which were less than twelve months. At July 31, 20142016 and 2013, $62.22015, $262.7 million and $237.8$232.2 million, respectively, were available for further borrowing under such facilities. The amount available for further borrowing reflects a reduction for issued standby letters of credit, as discussed below.in Note 16. The Company’s multi-currency revolving facility contains financial covenants2014,2016, the Company was in compliance with all such covenants. The Company expects to remain in compliance with these covenants.At July 31, 2014 and 2013, there was $45.7 million and $50.0 million available for use, respectively, under these two facilities. There was $4.3$26.8 million outstanding at July 31, 2014,2016, and no amounts$15.3 million outstanding at July 31, 2013.2015 and all borrowings which were outstanding on those dates had maturities which were less than twelve months. The weighted average interest rate on the short-term borrowings outstanding at July 31, 2014,2016, was 0.91 percent.or $133.9(approximately $111.1 million at July 31, 2016) program for issuing treasury notes for raising short-, medium-, and long-term financing for its European operations. There were no amounts outstanding onunder this program at July 31, 20142016 or 2013.2015. Additionally, the Company’s European operations have lines of credit with an available limit of €43.6€44.0 million or $58.3 million.(approximately $48.9 million at July 31, 2016). There were no amounts outstanding at July 31, 2016, and there was $10.4 million amount outstanding on these lines of credit as of July 31, 2014 or 2013.Table2015, which had a maturity date of Contents$1.0approximately $8.7 million outstanding under these credit facilities as of July 31, 2014,2016, and $9.2$1.6 million as of July 31, 2013.2015 and all borrowings which were outstanding on those dates had maturities which were less than twelve months. At July 31, 20142016 and 2013,2015, there was $57.5approximately $45.5 million and $50.4$47.2 million available for use, respectively, under these facilities. The weighted average interest rate on these short-term borrowings outstanding at July 31, 20142016 and July 31, 2013,2015, was 0.75 percent0.32% and 0.44 percent,0.41%, respectively.D Long-Term7. Debtfollowing: Annualfollowing (in millions): July 31, 2016 2015 5.48% Unsecured senior notes, interest payable semi-annually, principal payment of $50.0 million due June 1, 2017 $ 50.0 $ 50.0 5.48% Unsecured senior notes, interest payable semi-annually, principal payment of $25.0 million due September 28, 2017 25.0 25.0 5.48% Unsecured senior notes, interest payable semi-annually, principal payment of $25.0 million due November 30, 2017 25.0 25.0 3.72% Unsecured senior notes, interest payable semi-annually, principal payment of $125.0 million due March 27, 2024 125.0 125.0 2.93% Unsecured senior notes, interest payable semi-annually, principal payment of $25.0 million due April 16, 2025 25.0 25.0 3.18% Unsecured senior notes, interest payable semi-annually, principal payment of $125.0 million due June 17, 2030 125.0 125.0 Variable Rate Guaranteed senior note, interest payable quarterly, principal payment of ¥1.65 billion due May 19, 2019 and an interest rate of 0.41% as of July 31, 2016 16.0 13.3 Variable Rate Guaranteed senior note, interest payable quarterly, principal payment of ¥1.00 billion due July 15, 2021 and an interest rate of 0.25% as of July 31, 2016 9.7 — Capitalized lease obligations and other, with various maturity dates and interest rates 1.9 1.9 Terminated interest rate swap contracts 0.4 0.8 Total 403.0 391.0 Less current maturities 51.2 1.8 Total long-term debt $ 351.8 $ 389.2 $1.7 million in Fiscal 2015, $1.8 million in Fiscal 2016, $50.8 million in Fiscal 2017, $50.1 million in Fiscal 2018, and $141.1 million thereafter. as follows (in millions):Year Ended July 31, Amount 2017 $ 51.2 2018 50.4 2019 16.5 2020 0.2 2021 9.7 Thereafter 275.0 Total estimated future maturities $ 403.0 2014,2016, the Company was in compliance with all such covenants.2014,2014. Pursuant to the First Supplement, the Company issued $25.0 million of senior unsecured notes due April 16, 2025, and $125.0 million of senior unsecured notes due March 27, 2024.June 17, 2030. The debt was issued at face value and bears interest payable semi-annually at an annual rate of interest of 3.72 percent.2.93% and 3.18%, respectively. The proceeds from the notes were primarily used to refinance existing debt and for general corporate purposes. The notes contain debt covenants specifically related to maintaining a certain leverage ratio as well asand other covenants that, under certain circumstances, can restrict the Company’s ability to incur additional indebtedness, make investments and other restricted payments, create liens and sell assets. As of July 31, 2014,2016, the Company was in compliance with all such covenants.May 19, 2014,July 22, 2016, a Japanese Subsidiary of the Company refinanced its 1.65issued a ¥1.0 billion yen guaranteed note that matured on May 18, 2014.was guaranteed by the Company. The debt was issued at face value or approximately $16.1of ¥1.0 billion (approximately $9.7 million as ofat July 31, 2014,2016), is due May 19, 2019,July 15, 2021 and bears interest payable quarterly at a variable interest rate. The interest rate was 0.56 percent0.25% as of July 31, 2014.2016. Year Ended July 31, 2016 2015 Balance at beginning of period $ 8.6 $ 9.0 Accruals for warranties issued during the reporting period 4.6 3.7 Accruals related to pre-existing warranties (including changes in estimates) 2.9 0.4 Less settlements made during the period (4.2 ) (4.5 ) Balance at end of period $ 11.9 $ 8.6 TableContentsfiscal 2016, the Company took additional actions including the closure of the Company's Hong Kong location. These actions, consisting of lease termination costs and one-time termination benefits have been completed and resulted in a total pre-tax charge of $3.5 million during the year ended July 31, 2016, which was in line with expectations. Year Ended July 31, 2016 2015 Fiscal 2016 fourth quarter actions $ 3.5 $ — Fiscal 2016 third quarter actions 4.1 — Fiscal 2016 first quarter actions 6.2 — Fiscal 2015 actions (1) 2.3 16.9 Total $ 16.1 $ 16.9 Year Ended July 31, 2016 2015 Engine Products segment $ 8.8 $ 9.2 Industrial Products segment 7.3 3.8 Corporate & Unallocated — 3.9 Total $ 16.1 $ 16.9 Year Ended July 31, 2016 2015 Cost of sales $ 5.7 $ 8.4 Selling, general and administrative 10.4 8.5 Total $ 16.1 $ 16.9 E Fair Value10. Equity Based Compensation Year Ended July 31, 2016 2015 2014 Risk-free interest rate 1.6 - 2.3% 0.05 - 2.3% 0.31 - 2.8% Expected volatility 21.8 - 25.9% 18.6 - 26.7% 18.2 - 28.0% Expected dividend yield 1.7 % 1.6 % 1.4 - 1.6% Expected life: Director and officer grants 8 years 8 years 8 years Non - officer original grants 7 years 7 years 7 years Reload grants (1) N/A ≤4 years ≤6 years Outstanding at July 31, 2013 7,329,820 $ 23.88 Granted 900,073 42.17 Exercised (1,008,848 ) 18.80 Canceled (23,163 ) 34.02 Outstanding at July 31, 2014 7,197,882 26.84 Granted 1,023,836 38.58 Exercised (916,566 ) 18.54 Canceled (113,710 ) 38.67 Outstanding at July 31, 2015 7,191,442 29.38 Granted 969,450 28.19 Exercised (916,789 ) 19.39 Canceled (421,713 ) 36.95 Outstanding at July 31, 2016 6,822,390 30.09 Range of Exercise Prices $0.00 to $17.69 701,940 1.85 $ 17.14 701,940 $ 17.14 $17.70 to $23.69 1,296,206 2.59 21.45 1,296,206 21.45 $23.70 to $29.69 1,656,585 7.11 28.55 746,735 29.13 $29.70 to $35.69 1,533,036 5.85 34.23 1,506,269 34.27 $35.70 and above 1,634,623 7.85 40.19 808,384 40.78 6,822,390 5.60 30.09 5,059,534 28.89 Options Non - vested at July 31, 2015 1,757,140 $ 10.36 Granted 969,450 7.10 Vested (829,409 ) 10.19 Canceled (134,325 ) 9.64 Non - vested at July 31, 2016 1,762,856 8.70 Year Ended July 31, 2016 2015 2014 Service cost $ 18.4 $ 20.4 $ 18.8 Interest cost 18.9 19.1 19.5 Expected return on assets (28.8 ) (29.5 ) (30.8 ) Prior service cost and transition amortization 0.8 0.6 0.6 Actuarial loss amortization 8.5 7.1 7.4 Settlement loss — 3.9 — Net periodic benefit cost 17.8 21.6 15.5 Other changes recognized in other comprehensive income Net actuarial loss 53.6 3.5 15.2 Amortization of asset obligations (0.4 ) (0.2 ) (0.2 ) Amortization of prior service cost (0.4 ) (0.4 ) (0.4 ) Amortization of net actuarial loss (8.5 ) (11.0 ) (7.4 ) Total recognized in other comprehensive income 44.3 (8.1 ) 7.2 Total recognized in net periodic benefit costs and other comprehensive income $ 62.1 $ 13.5 $ 22.7 Year Ended July 31, 2016 2015 Change in projected benefit obligation: Projected benefit obligation, beginning of year $ 498.7 $ 498.7 Service cost 18.4 20.4 Interest cost 18.9 19.1 Participant contributions 1.0 1.2 Actuarial loss 50.0 13.1 Currency exchange rates (17.2 ) (18.2 ) Settlement — (9.2 ) Benefits paid (32.5 ) (26.4 ) Projected benefit obligation, end of year $ 537.3 $ 498.7 Change in fair value of plan assets: Fair value of plan assets, beginning of year $ 478.5 $ 489.9 Actual return on plan assets 22.2 35.0 Company contributions 4.2 5.5 Participant contributions 1.0 1.2 Currency exchange rates (17.9 ) (17.5 ) Settlement — (9.2 ) Benefits paid (32.5 ) (26.4 ) Fair value of plan assets, end of year $ 455.5 $ 478.5 Funded status: Projected benefit obligation in excess of plan assets at end of fiscal year $ (81.8 ) $ (20.2 ) Amounts recognized on the consolidated balance sheets consist of: Other long-term assets $ 1.4 $ 10.3 Other current liabilities (1.5 ) (2.9 ) Other long-term liabilities (81.7 ) (27.6 ) Net recognized liability $ (81.8 ) $ (20.2 ) Projected Benefit Obligation Year Ended July 31, Weighted average actuarial assumptions 2016 2015 All U.S. plans: Discount rate 3.65 % 4.33 % Rate of compensation increase 2.56 % 2.56 % Non - U.S. plans: Discount rate 2.08 % 3.14 % Rate of compensation increase 2.69 % 2.68 % Net Periodic Benefit Cost Year Ended July 31, Weighted average actuarial assumptions 2016 2015 2014 All U.S. plans: Discount rate 4.33 % 4.33 % 4.58 % Expected return on plan assets 6.99 % 7.14 % 7.50 % Rate of compensation increase 2.56 % 2.61 % 2.61 % Non - U.S. plans: Discount rate 3.14 % 3.64 % 4.04 % Expected return on plan assets 4.83 % 5.41 % 5.48 % Rate of compensation increase 2.68 % 2.79 % 2.92 % Financial InstrumentsPlan Assets U.S Pension Plans Asset Category Total July 31, 2016 Cash $ 1.2 $ — $ — $ 1.2 Global Equity Securities 62.2 83.1 17.1 162.4 Fixed Income Securities 72.2 — 47.3 119.5 Real Assets 5.9 — 7.9 13.8 Total U.S. Assets $ 141.5 $ 83.1 $ 72.3 $ 296.9 July 31, 2015 Cash $ 1.9 $ — $ — $ 1.9 Global Equity Securities 76.6 84.6 19.5 180.7 Fixed Income Securities 0.9 64.1 54.7 119.7 Real Assets 6.0 — 13.0 19.0 Total U.S. Assets $ 85.4 $ 148.7 $ 87.2 $ 321.3 July 31, 2014 Cash $ 14.2 $ — $ — $ 14.2 Global Equity Securities 107.3 87.3 21.1 215.7 Fixed Income Securities 27.0 — 58.7 85.7 Real Assets 7.1 — 13.5 20.6 Total U.S. Assets $ 155.6 $ 87.3 $ 93.3 $ 336.2 U.S. Pension Plans Global Equity Fixed Income Real Assets Total Ending balance at July 31, 2013 $ 19.4 $ 60.8 $ 22.1 $ 102.3 Unrealized gains (losses) 1.7 (2.0 ) — (0.3 ) Realized gains 2.4 8.9 0.8 12.1 Purchases 2.0 20.0 2.7 24.7 Sales (4.4 ) (29.0 ) (12.1 ) (45.5 ) Ending balance at July 31, 2014 $ 21.1 $ 58.7 $ 13.5 $ 93.3 Unrealized gains (losses) (0.3 ) (3.7 ) 0.7 (3.3 ) Realized gains 2.8 5.1 0.6 8.5 Purchases 1.8 — 0.8 2.6 Sales (5.9 ) (5.4 ) (2.6 ) (13.9 ) Ending balance at July 31, 2015 $ 19.5 $ 54.7 $ 13.0 $ 87.2 Unrealized gains (losses) (1.3 ) (2.5 ) (2.4 ) (6.2 ) Realized gains 2.5 0.8 0.4 3.7 Purchases 0.6 — 0.1 0.7 Sales (4.2 ) (5.7 ) (3.2 ) (13.1 ) Ending balance at July 31, 2016 $ 17.1 $ 47.3 $ 7.9 $ 72.3 Fair Value Global Equity $ 162.4 $ 2.7 Daily, Monthly, Quarterly, Annually 10 - 100 days Fixed Income 47.3 — Daily, Quarterly, Semi-Annually 60 - 120 days Real Assets 13.8 2.2 Daily, Quarterly 95 days Total $ 223.5 $ 4.9 Non-U.S. Pension Plans Asset Category Total July 31, 2016 Cash $ 0.5 $ — $ — $ 0.5 Global Equity Securities 69.2 — — 69.2 Fixed Income Securities 4.6 35.8 — 40.4 Equity/Fixed Income 16.7 — 31.8 48.5 Total Non-U.S. Assets $ 91.0 $ 35.8 $ 31.8 $ 158.6 July 31, 2015 Global Equity Securities $ 71.7 $ — $ — $ 71.7 Fixed Income Securities 4.2 35.9 — 40.1 Equity/Fixed Income 17.2 — 28.2 45.4 Total Non-U.S. Assets $ 93.1 $ 35.9 $ 28.2 $ 157.2 July 31, 2014 Cash $ 5.7 $ — $ — $ 5.7 Global Equity Securities 71.3 — — 71.3 Fixed Income Securities 4.8 23.3 — 28.1 Equity/Fixed Income 18.0 — 30.5 48.5 Total Non-U.S. Assets $ 99.8 $ 23.3 $ 30.5 $ 153.6 Non-U.S. Pension Plans Ending balance at July 31, 2013 $ 26.3 Unrealized gains 4.3 Realized gains 0.1 Foreign currency exchange 0.1 Purchases 3.1 Sales (3.4 ) Ending balance at July 31, 2014 $ 30.5 Unrealized gains 1.3 Realized gains — Foreign currency exchange (5.5 ) Purchases 2.7 Sales (0.8 ) Ending balance at July 31, 2015 $ 28.2 Unrealized gains 2.7 Realized gains — Foreign currency exchange 0.3 Purchases 2.7 Sales (2.1 ) Ending balance at July 31, 2016 $ 31.8 Fair Value Fixed Income $ 35.8 $ — Weekly 7 days Equity/Fixed Income 31.8 — Yearly 90 days Total $ 67.6 $ — Year Ending July 31, Estimated Future Benefit Payments 2017 $ 26.6 2018 25.1 2019 27.4 2020 25.7 2021 27.6 2022-2026 137.6 Year Ended July 31, 2016 2015 2014 Earnings before income taxes: United States $ 90.7 $ 92.4 $ 131.4 Foreign 166.7 196.2 229.3 Total $ 257.4 $ 288.6 $ 360.7 Year Ended July 31, 2016 2015 2014 Income tax provision (benefit): Current Federal $ 19.9 $ 28.5 $ 49.0 State 3.1 2.9 4.7 Foreign 46.9 54.7 54.6 69.9 86.1 108.3 Deferred Federal (0.3 ) (4.2 ) (9.5 ) State (0.2 ) 0.1 0.4 Foreign (2.8 ) (1.5 ) 1.3 (3.3 ) (5.6 ) (7.8 ) Total $ 66.6 $ 80.5 $ 100.5 Year Ended July 31, 2016 2015 2014 Statutory U.S. federal rate 35.0 % 35.0 % 35.0 % State income taxes 0.8 % 0.9 % 1.1 % Foreign operations (8.1 )% (7.9 )% (6.1 )% Export, manufacturing, and research credits (1.6 )% (1.1 )% (0.8 )% Change in unrecognized tax benefits (1.0 )% 1.3 % (1.1 )% Other 0.8 % (0.3 )% (0.2 )% Effective income tax rate 25.9 % 27.9 % 27.9 % July 31, 2016 2015 Deferred tax assets: Accrued expenses $ 12.1 $ 10.6 Compensation and retirement plans 59.5 39.1 NOL and tax credit carryforwards 6.5 4.3 LIFO and inventory reserves 5.4 6.9 Other 4.0 5.0 Gross deferred tax assets 87.5 65.9 Valuation allowance (3.3 ) (2.7 ) Net deferred tax assets 84.2 63.2 Deferred tax liabilities: Depreciation and amortization (57.5 ) (50.6 ) Other (1.2 ) (2.4 ) Deferred tax liabilities (58.7 ) (53.0 ) Prepaid tax assets 4.2 4.4 Net tax asset $ 29.7 $ 14.6 Year Ended July 31, 2016 2015 2014 Gross unrecognized tax benefits at beginning of fiscal year $ 18.2 $ 15.0 $ 18.4 Additions for tax positions of the current year 3.4 4.7 2.9 Additions for tax positions of prior years 0.1 0.1 1.7 Reductions for tax positions of prior years (4.9 ) (0.6 ) (7.1 ) Settlements (0.1 ) — (0.2 ) Reductions due to lapse of applicable statute of limitations (1.0 ) (1.0 ) (0.7 ) Gross unrecognized tax benefits at end of fiscal year $ 15.7 $ 18.2 $ 15.0 20142016 and 2013,2015, accrued interest and penalties on a gross basis were $1.8 million.included cashare reported in one of three levels based on the lowest level of significant input used as follows:Level 1 Inputs to the fair value measurement are quoted prices in active markets for identical assets or liabilities. Level 2 Inputs to the fair value measurement include quoted prices in active markets for similar assets or liabilities, quoted prices for identical or similar assets or liabilities in markets that are not active and inputs other than quoted prices that are observable for the asset or liability, either directly or indirectly. Level 3 Inputs to the fair value measurement are unobservable inputs or valuation techniques. cash equivalents, accounts receivable, accounts payable, short-term borrowings, long-term debt, and derivative contracts. The fair2015, the carrying values of cash and cash equivalents, short-term investments, accounts receivable,receivables, short-term borrowings and trade accounts payable and short-term borrowings approximated carrying valuesapproximate fair value because of the short-term nature of these instruments and are classified as Level 1 in the fair value hierarchy. Derivative contracts are reported at their fair values based on third-party quotes. As of July 31, 2014,2016, the estimated fair value of long-term debt with fixed interest rates was $237.6$394.4 million compared to its carrying value of $225.0$375.0 million. The fair value is estimated by discounting the projected cash flows using the rate that similar amounts of debt could currently be borrowed, which is classified as Level 2 in the fair value hierarchy.2014,2016 and 2013, on2015, included in the accompanying Consolidated Balance Sheets:
(Level 2)*
Sheets (in millions): July 31, 2016 2015 Assets Prepaids and other current assets Foreign exchange contracts $ 1.1 $ 3.6 Liabilities Other current liabilities Foreign exchange contracts (2.4 ) (2.2 ) Forward exchange contracts - net asset (liability) position $ (1.3 ) $ 1.4 ** Inputs to the valuation methodology of levelLevel 2 assets include quoted prices for similar assets or liabilities in active markets; quoted prices for identical or similar assets or liabilities in inactive markets; inputs other than quoted prices that are observable for the asset or liability;liability and inputs that are derived principally from or corroborated by observable market data by correlation or other means.consolidated balance sheets.accompanying Consolidated Balance Sheets. The aggregate carrying amount of these investments was $21.4$18.7 million and $18.8$18.3 million as of July 31, 20142016 and 2013,2015, respectively. These equity method investments are measured at fair value on a nonrecurring basis. The fair value of the Company’s equity method investments has not been estimated as there have been no identified events or changes in circumstance that would have had an adverse impact on the value of these investments. In the event that these investments were required to be measured, these investments would fall within Level 3 of the fair value hierarchy, due to the use of significant unobservable inputs to determine fair value, as the investments are in privately-held entities or divisions of public companies without quoted market prices.and intangible assets areis assessed for impairment annually or more frequently if events or changes in circumstances indicate that the asset might be impaired. The Company’s goodwill and intangible assets are not recorded at fair value as there have been no events or circumstances that would have an adverse impact on the value of these assets. In the event that an impairment was recognized, the fair value would be classified within Level 3 of the fair value hierarchy. Definite lived intangible assets are subject to impairment assessments as triggering events occur which could indicate that the asset might be impaired. Refer to Note B5 for further discussion of the annual goodwill impairment analysis and carrying values of goodwill and other intangible assets. intangible assets and property, plant and equipment whenever events or changes in circumstances indicate that the carrying amount of property, plant and equipment assets may not be recoverable. There were no significant impairment charges recorded in Fiscal 2014, Fiscal 2013, or Fiscal 2012. Refer to Note B for further discussion of the annual goodwill impairment analysis and carrying values of intangible assets.NOTE F Employee Benefit Plans Pension PlansThe Company and certain of its international subsidiaries have defined benefit pension plans for many of their hourly and salaried employees. There are two types of U.S. plans. The first type of U.S. plan is a traditional defined benefit pension plan primarily for production employees. The second is a plan for salaried workers that provides defined benefits pursuant to a cash balance feature whereby a participant accumulates a benefit comprised of a percentage of current salary that varies with years of service, interest credits and transition credits. The non-U.S. plans generally provide pension benefits based on years of service and compensation level. On July 31, 2013, the Company adopted a sunset freeze on its U.S. salaried pension plan. Effective August 1, 2013, there are no longer any new entrants into the plan. Then effective, August 1, 2016, employees hired prior to August 1, 2013, will no longer continue to accrue Company contribution credits under the plan. Net periodic pension costs for the Company’s pension plans include the following components: The obligations and funded status of the Company’s pension plans as of 2014 and 2013, is as follows: AOCI at July 31, 2014 consists primarily of unrecognized actuarial losses, net of tax. The loss expected to be recognized in net periodic pension expense during Fiscal 2015 is $7.6 million. The accumulated benefit obligation for all defined benefit pension plans was $476.1 million and $427.8 million at July 31, 2014 and 2013, respectively. The projected benefit obligation, accumulated benefit obligation, and fair value of plan assets for pension plans with accumulated benefit obligations in excess of plan assets were $234.8 million, $233.8 million, and $215.9 million, respectively, as of July 31, 2014, and $20.5 million, $19.7 million, and $8.4 million, respectively, as of July 31, 2013. For the years ended July 31, 20142016, 2015 and 2013, the U.S. pension plans represented approximately 69 percent and 70 percent, respectively, of the Company’s total plan assets, approximately 69 percent and 71 percent, respectively, of the Company’s total projected benefit obligation, and approximately 80 percent and 75 percent, respectively, of the Company’s total pension expense. The weighted-average discount rate and rates of increase in future compensation levels used in determining the actuarial present value of the projected benefit obligation are as follows: The weighted-average discount rates, expected returns on plan assets and rates of increase in future compensation levels used to determine the net periodic benefit cost are as follows: Expected Long-Term Rate of ReturnTo develop the expected long-term rate of return on assets assumption, the Company considered the historical returns and the future expectations for returns for each asset class, as well as the target asset allocation of the pension portfolio. In Fiscal 2014 the Company adopted a plan to adjust the target asset allocation for all U.S. plans and to employ differing allocation strategies for each plan. These investment changes, which will be implemented in the first quarter of Fiscal 2015, will help the Company to maintain or reduce the risk profile while continuing to ensure an appropriate funded status in each plan. Therefore, as of the measurement date of July 31, 2014, the Company reduced its long-term rate of return for the U.S. pension plans to an asset-based weighted average of 7.14 percent. The expected long-term rate of return on assets shown in the pension benefit disclosure for non-U.S. plans is an asset-based weighted average of all non-U.S. plans. Discount RateThe Company’s objective in selecting a discount rate is to select the best estimate of the rate at which the benefit obligations could be effectively settled on the measurement date, taking into account the nature and duration of the benefit obligations of the plan. In making this best estimate, the Company looks at rates of return on high-quality fixed-income investments currently available, and expected to be available, during the period to maturity of the benefits. This process includes looking at the universe of bonds available on the measurement date with a quality rating of Aa or better. Similar appropriate benchmarks are used to determine the discount rate for the non-U.S. plans. The discount rate disclosed in the assumptions used to determine net periodic benefit cost and to determine benefit obligations is based upon a weighted average, using year-end projected benefit obligations. Plan Assets The Company used the following definitions to classify pension assets into either Level 1, Level 2, or Level 3: Level 1 – Quoted prices in active markets for identical assets or liabilities that the reporting entity has the ability to access at the measurement date. Level 2 – Inputs other than quoted prices available in Level 1 that are observable either directly or indirectly. Level 3 – Unobservable inputs for the asset or liability. The fair values of the assets held by the U.S. pension plans by asset category are as follows (in millions):
Active Markets
for Identical
Assets
(Level 1)
Observable
Inputs
(Level 2)
Unobservable
Inputs
(Level 3) Global Equity consists primarily of publicly traded U.S. and non-U.S. equities, Europe, Australasia, Far East (EAFE) index funds, equity private placement funds, private equity investments, and some cash and cash equivalents. Publicly traded equities are valued at the closing price reported in the active market in which the individual securities are traded. Index funds are valued at the net asset value (NAV) as determined by the custodian of the fund. The NAV is based on the fair value of the underlying assets owned by the fund, minus its liabilities then divided by the number of units outstanding. Private equity consists of interests in partnerships that invest in U.S. and non-U.S. equity and debt securities. This may include a diversified mix of partnership interests including buyouts, restructured/distressed debt, growth equity, mezzanine/subordinated debt, real estate, special situation partnerships, and venture capital investments. Partnership interest is valued using the most recent general partner statement of fair value, updated for any subsequent partnership interests’ cash flow. The target allocation for Global Equity investments was 65 percent. The underlying global equity investment managers within the Plan will invest primarily in equity securities spanning across market capitalization, geography, style (value, growth), and other diversifying characteristics. Managers may invest in common stocks or American Depository Receipts (ADRs), mutual funds, bank or trust company pooled funds, international stocks, stock options for hedging purposes, stock index futures, financial futures for purposes of replicating a major market index, and private equity partnerships. The Long/Short Equity managers within Global Equity may take long or short positions in equity securities and have the ability to shift exposure from net long to net short. Long/Short Equity managers made up about 15 percent of the global equity portfolio at year-end, and are considered less liquid, as the funds can be partially liquidated on a quarterly basis. Long-only managers are considered liquid. The long-only investment managers are typically valued daily, while long/short equity is valued on a monthly basis. Private equity is considered illiquid and performance is typically valued on a quarterly basis. The underlying assets, however, may be valued less frequently, such as annually, or if and when a potential buyer is identified and has submitted a bid to similar types of investments. Fixed income consists primarily of investment and non-investment grade debt securities and alternative fixed income-like investments. Corporate and other bonds and notes are valued at either the yields currently available on comparable securities of issuers with similar credit ratings or valued under a discounted cash flows approach that maximizes observable inputs, such as current yields of similar instruments, but includes adjustments for certain risks that may not be observable such as credit and liquidity risks. Alternative fixed income-like investments consist primarily of private partnership interests in hedge funds of funds. Partnership interests are valued using the NAV as determined by the administrator or custodian of the fund. The target allocation for Fixed Income was 30 percent. The Fixed Income class may invest in Debt securities issued or guaranteed by the U.S., its agencies or instrumentalities (including U.S. Government Agency mortgage backed securities), or other investment grade rated debt issued by foreign governments; corporate bonds, debentures and other forms of corporate debt obligations, including equipment trust certificates; Indexed notes, floaters and other variable rate obligations; bank collective funds; mutual funds; insurance company pooled funds and guaranteed investments; futures and options for the purpose of yield curve management; and private debt investments. Fixed Income risk is driven by various factors including, but not limited to,interest rate levels and changes, credit risk, and duration. The current fixed income investment is considered liquid, with daily pricing and liquidity. The Fixed Income class is also invested in a variety of alternative investments. Alternatives cover an enormous variety of traditional and non-traditional investments and investment strategies, spanning various levels of risk and return. These investments can be made in a broad array of non-traditional investment strategies (including, but not limited to, commodities and futures, distressed securities, short/long--or both--fixed income, international opportunities, relative value) with multiple hedge fund managers. This class is considered less liquid to illiquid. The liquidity ranges from quarterly to semi-annually and illiquid. Alternative investments are typically valued on a quarterly basis. Real assets consist of commodity funds, Real Estate Investment Trusts (REITS), and interests in partnerships that invest in private real estate, commodity, and timber investments. Private investments are valued using the most recent partnership statement of fair value, updated for any subsequent partnership interests’ cash flows. Commodity funds and REITS are valued at the closing price reported in the active market in which it is traded. The target allocation for Real Assets was 5 percent. The Fund invests in real assets to provide a hedge against unexpected inflation, to capture unique sources of returns, and to provide diversification benefits. The Fund pursues a real asset strategy through a fund of funds, private investments, and/or a direct investment program that may invest long, short, or both in assets including, but not limited to, domestic and international properties, buildings and developments, timber, and/or commodities. Real assets range from less liquid to illiquid, with about two-thirds of the real asset allocation having monthly liquidity and one-third illiquid. Real asset manager performance is typically reported quarterly, though underlying assets may be valued less frequently. Reflecting the relatively long-term nature of the plans’ obligations, approximately 65 percent of the plans assets are invested in equity securities, 30 percent in fixed income, and 5 percent in real assets (investments into funds containing commodities and real estate). In Fiscal 2015, the Company plans to begin investing in liability-driven investment funds, which will change the asset allocations. The following table sets forth a summary of changes in the fair values of the U.S. pension plans’ Level 3 assets for the years ended July 31, 2014, 2013, and 2012 (in millions): The following table sets forth a summary of the U.S. pension plans’ assets valued at NAV for the year ended July 31, 2014 (in millions):
Commitments
(If Currently Eligible)
Notice Period Fair values of the assets held by the non-U.S. pension plans by asset category are as follows (in millions):
Active Markets
for Identical
Assets
(Level 1)
Observable
Inputs
(Level 2)
Unobservable
Inputs
(Level 3) Global equity consists of publicly traded diversified growth funds invested across a broad range of traditional and alternative asset classes which may include, but are not limited to, equities, investment grade and high yield bonds, property, private equity, infrastructure, commodities and currencies. They may invest directly or hold up to 100 percent of the fund in other collective investment vehicles and may use exchange traded and over the counter financial derivatives, such as currency forwards or futures, for both investment as well as hedging purposes. Fixed income consists primarily of investment grade debt securities. Corporate bonds and notes are valued at either the yields currently available on comparable securities of issuers with similar credit ratings or valued under a discounted cash flows approach that maximizes observable inputs, such as current yields of similar instruments, but includes adjustments for certain risks that may not be observable such as credit and liquidity risks. These funds may also aim to provide liability hedging by offering interest rate and inflation protections which replicates the liability profile of a typical defined benefit pension scheme. Equity/Fixed Income consists of Level 1 assets that are part of a unit linked fund with a strategic asset allocation of 40 percent fixed income products and 60 percent equity type products. Assets are valued at either the closing price reported if traded on an active market or at yields currently available on comparable securities of issuers with similar credit ratings. Index funds are valued at the net asset value as determined by the custodian of the fund. The Level 3 assets are composed of mathematical reserves on individual contracts and the Company does not have any influence on the investment decisions as made by the insurer due to the specific minimum guaranteed return characteristics of this type of contract. European insurers in general, broadly have a strategic asset allocation with 80 percent to 90 percent fixed income products and 20 percent to 10 percent equity type products (including real estate). Real Assets consists of property funds. Property funds are valued using the most recent partnership statement of fair value, updated for any subsequent partnership interests’ cash flows. The following table sets forth a summary of changes in the fair values of the non-U.S. pension plans’ Level 3 assets for the years ended July 31, 2014, 2013, and 2012 (in millions):
Income The following table sets forth a summary of the non-U.S. pension plans’ assets valued at NAV for the year ended July 31, 2014 (in millions):
Commitments
(If Currently Eligible)
Notice Period Investment Policies and StrategiesFor the Company’s U.S. plans, the Company uses a total return investment approach to achieve a long-term return on plan assets, with what the Company believes to be a prudent level of risk for the purpose of meeting its retirement income commitments to employees. The plans’ investments are diversified to assist in managing risk. In Fiscal 2014, the Company’s asset allocation guidelines targeted an allocation of 65 percent global equity securities, 30 percent fixed income, and 5 percent real assets (investments into funds containing commodities and real estate). These target allocation guidelines are determined in consultation with the Company’s investment consultant, and through the use of modeling the risk/return trade-offs among asset classes utilizing assumptions about expected annual return, expected volatility/standard deviation of returns, and expected correlations with other asset classes. In Fiscal 2015, the Company plans to begin investing in liability-driven investment funds, which will change the asset allocations. For the Company’s non-U.S. plans, the general investment objectives are to maintain a suitably diversified portfolio of secure assets of appropriate liquidity which will generate income and capital growth to meet, together with any new contributions from members and the Company, the cost of current and future benefits. Investment policy and performance is measured and monitored on an ongoing basis by the Company’s investment committee through its use of an investment consultant and through quarterly investment portfolio reviews. Estimated Contributions and Future PaymentsThe Company’s general funding policy for its pension plans is to make at least the minimum contributions as required by applicable regulations. Additionally, the Company may elect to make additional contributions up to the maximum tax deductible contribution. The Company made contributions of $0.6 million to its U.S. pension plans in Fiscal 2014. The minimum funding requirement for the Company’s U.S. plans is $12.2 million in Fiscal 2015. Per the Pension Protection Act of 2006, this obligation could be met with existing credit balances that resulted from payments above the minimum obligation in prior years. As such, the Company does not anticipate making a contribution in Fiscal 2015 to its U.S. pension plans. The Company made contributions of $3.7 million to its non-U.S. pension plans in Fiscal 2014 and estimates that it will contribute approximately $3.9 million in Fiscal 2015 based upon the local government prescribed funding requirements. Future estimates of the Company’s pension plan contributions may change significantly depending on the actual rate of return on plan assets, discount rates, and regulatory requirements. Estimated future benefit payments for the Company’s U.S. and non-U.S. plans are as follows (thousands of dollars): Postemployment and Postretirement Benefit PlansThe Company provides certain postemployment and postretirement health care benefits for certain U.S. employees for a limited time after termination of employment. The Company has recorded a liability for its postretirement benefit plan in the amount of $1.3 million for both the years ended July 31, 2014 and 2013. The annual cost resulting from these benefits is not material. For measurement purposes, a 7.0 percent annual rate of increase in the per capita cost of covered health care benefits was assumed for Fiscal 2014. The Company has assumed that the long-term rate of increase will decrease gradually to an ultimate annual rate of 4.5 percent. A one-percentage point increase in the health care cost trend rate would increase the Fiscal 2014 and 2013 liability by $0.1 million. Retirement Savings and Employee Stock Ownership PlanThe Company provides a contributory employee savings plan to U.S. employees that permits participants to make contributions by salary reduction pursuant to section 401(k) of the Internal Revenue Code. Employee contributions of up to 25 percent of compensation are matched at a rate equaling 100 percent of the first 3 percent contributed and 50 percent of the next 2 percent contributed. The Company’s contributions under this plan are based on the level of employee contributions. Total contribution expense for these plans was $8.1 million, $7.3 million, and $5.5 million for the years ended July 31, 2014, 2013, and 2012, respectively. This plan also includes shares from an Employee Stock Ownership Plan (ESOP). As of July 31, 2014, all shares of the ESOP have been allocated to participants. Total ESOP shares are considered to be shares outstanding for earnings per share calculations. In July 2013, the Company announced that Employees hired on or after August 1, 2013 will be eligible for a 3 percent annual Company retirement contribution in addition to the Company’s 401(k) match. Effective August 1, 2016, Employees hired prior to August 1, 2013 will be eligible for the 3 percent annual Company retirement contribution. Deferred Compensation and Other Benefit PlansThe Company provides various deferred compensation and other benefit plans to certain executives. The deferred compensation plan allows these employees to defer the receipt of all of their bonus and other stock related compensation and up to 75 percent of their salary to future periods. Other benefit plans are provided to supplement the benefits for a select group of highly compensated individuals which are reduced because of compensation limitations set by the Internal Revenue Code. The Company has recorded a liability of $9.1 million and $9.5 million the years ended July 31, 2014 and July 31, 2013, respectively, related primarily to its deferred compensation plans.G14. Shareholders’ Equity Stock RightsOn January 27, 2006, the Board of Directors of the Company approved the extension of the benefits afforded by the Company’s existing rights plan by adopting a new shareholder rights plan. Pursuant to the Rights Agreement, dated as of January 27, 2006 by and between the Company and Wells Fargo Bank, N.A., as Rights Agent, one right was issued on March 3, 2006 for each outstanding share of common stock of the Company upon the expiration of the Company’s existing rights. Each of the new rights entitles the registered holder to purchase from the Company one one-thousandth of a share of Series A Junior Participating Preferred Stock, without par value, at a price of $143.00 per one one-thousandth of a share. The rights, however, will not become exercisable unless and until, among other things, any person acquires 15 percent or more of the outstanding common stock of the Company. If a person acquires 15 percent or more of the outstanding common stock of the Company (subject to certain conditions and exceptions more fully described in the Rights Agreement), each right will entitle the holder (other than the person who acquired 15 percent or more of the outstanding common stock) to purchase common stock of the Company having a market value equal to twice the exercise price of a right. The rights are redeemable under certain circumstances at $.001 per right and will expire, unless earlier redeemed, on March 2, 2016.I.10.15.014.0 million shares of common stock under the Company’s stock repurchase plan dated May 29, 2015. This repurchase authorization, which is effective until terminated by the Board of Directors, replaced the Company’s previous stock repurchase plan dated September 27, 2013. As of July 31, 2014,2016, the Company had remaining authorization to repurchase 8.510.5 million shares under this plan. Following is a summary of treasuryTreasury stock share activity for Fiscal 2014the years ended July 31, 2016 and 2013:2015 is summarized as follows: Year Ended July 31, 2016 2015 Beginning balance 17,044,950 11,237,522 Stock repurchases 2,540,000 6,675,147 Net issuance upon exercise of stock options (764,756 ) (773,385 ) Issuance under compensation plans (59,787 ) (85,611 ) Other activity (9,904 ) (8,723 ) Ending balance 18,750,503 17,044,950 H15. Accumulated Other Comprehensive Loss In the first quarter of Fiscal 2014, the Company prospectively adopted guidance issued by the FASB that requires additional disclosure related to the impact of reclassification adjustments out of accumulated other comprehensive income or loss on net income. follows:
currency
translation
adjustment
(a)
benefits
financial
instruments
follows (in millions): Total Balance as of July 31, 2015, net of tax $ (70.8 ) $ (90.6 ) $ (0.6 ) $ (162.0 ) Other comprehensive loss before reclassifications and tax (18.5 ) (55.4 ) (0.4 ) (74.3 ) Tax benefit — 19.4 0.1 19.5 Other comprehensive loss before reclassifications, net of tax (18.5 ) (36.0 ) (0.3 ) (54.8 ) Reclassifications, before tax — 15.8 0.6 16.4 Tax expense — (5.0 ) (0.2 ) (5.2 ) Reclassifications, net of tax — 10.8 0.4 (b) 11.2 Other comprehensive (loss) income, net of tax (18.5 ) (25.2 ) 0.1 (43.6 ) Balance as of July 31, 2016, net of tax $ (89.3 ) $ (115.8 ) $ (0.5 ) $ (205.6 ) Balance as of July 31, 2014, net of tax $ 48.3 $ (94.0 ) $ (0.1 ) $ (45.8 ) Other comprehensive loss before reclassifications and tax (119.1 ) (5.2 ) (1.9 ) (126.2 ) Tax benefit — 2.0 0.7 2.7 Other comprehensive loss before reclassifications, net of tax (119.1 ) (3.2 ) (1.2 ) (123.5 ) Reclassifications, before tax — 8.7 1.0 9.7 Tax expense — (2.1 ) (0.3 ) (2.4 ) Reclassifications, net of tax — 6.6 0.7 (b) 7.3 Other comprehensive (loss) income, net of tax (119.1 ) 3.4 (0.5 ) (116.2 ) Balance as of July 31, 2015, net of tax $ (70.8 ) $ (90.6 ) $ (0.6 ) $ (162.0 ) Amounts were reclassified from accumulated other comprehensive loss to other income, net.(b) (b)Primarily includes net amortization of prior service costs and actuarial losses included in net periodic benefit cost (see Note F) that were reclassified from accumulated other comprehensive loss to operating expenses or cost of sales.(c)E)13).I Stock Option Plans Employee Incentive PlansIn November 2010, shareholders approved16. Guarantees2010 Master Stock Incentive Plan (the Plan). The Plan extends through September 2020shares of AFSI, an unconsolidated joint venture, and allows for the granting of nonqualified stock options, incentive stock options, restricted stock, restricted stock units, stock appreciation rights (SAR), dividend equivalents, and other stock-based awards. Options under the Plan are granted to key employees at market price at the date of grant. Options are generally exercisable for up to 10 years from the date of grant. The Plan also allows for the granting of performance awards to a limited number of key executives. As administered by the Human Resources Committeeguarantee certain debt of the Company’s Boardjoint venture. As of Directors to date, these performance awards are payable in common stock and are based on a formulaJuly 31, 2016, the joint venture had $24.8 million of outstanding debt, of which measures performance of the Company over a three-year period. Performance award expense under these plans totaled $0.7 million in Fiscal 2014, $0.1 million in Fiscal 2013, $1.9 million in Fiscal 2012. Stock options for non-executives are exercisable in equal increments over three years. Stock options issued after Fiscal 2010 become exercisable for executives in equal increments over three years. Stock options issued from Fiscal 2004 to Fiscal 2010 became exercisable for most executives immediately upon the date of grant. For Fiscal 2014, the Company recorded pre-tax compensation expense associated with stock optionsits equity in earnings (loss) of $9.9this equity method investment of $(0.7) million, $2.3 million, and recorded $3.2$3.7 million and royalty income of $5.1 million, $5.8 million, and $6.8 million, respectively, related tax benefit. For Fiscal 2013to AFSI.2012,2015, the Company recorded pre-tax compensation expense associated with stock optionshad a contingent liability for standby letters of $8.3credit totaling $7.3 million and $7.8 million, respectively, which have been issued and $2.7 millionare outstanding. The letters of credit guarantee payment to third parties in the event the Company is in breach of a specified bond financing agreement and $2.5 million, respectively,insurance contract terms, as detailed in each letter of related tax benefit. Stock-based employee compensation cost is recognized using the fair-value based method. The Company determined the fair value of these awards using the Black-Scholes option pricing model, with the following weighted average assumptions: Black-Scholes is a widely accepted stock option pricing model. The weighted average fair value for options granted during Fiscal 2014, 2013, and 2012 was $11.44, $8.18, and $9.37 per share, respectively, using the Black-Scholes pricing model. Reload grants are grants made to officers or directors who exercised a reloadable option during the fiscal year and made payment of the purchase price using shares of previously owned Company stock. The reload grant is for the number of shares equal to the shares used in payment of the purchase price and/or withheld for minimum tax withholding. Options with a reload provision were no longer issued to officers with more than five years of service and all directors beginning in Fiscal 2006. The Company continued to issue options with a reload provision to officers with less than five years of service until Fiscal 2011 when this was discontinued. The following table summarizes stock option activity:
Outstanding
Average
Exercise Price The total intrinsic value of options exercised during Fiscal 2014, 2013, and 2012 was $21.5 million, $33.7 million, and $29.5 million, respectively. Shares reserved at July 31, 2014 for outstanding options and future grants were 12,599,147. Shares reserved consist of shares available for grant plus all outstanding options. The following table summarizes information concerning outstanding and exercisable options as of July 31, 2014:
Outstanding
Average
Remaining
Contractual
Life (Years)
Average
Exercise
Price
Exercisable
Average
Exercise
Pricethe aggregate intrinsic value of shares outstanding and exercisable was $89.0$25.4 million, $28.1 million, and $84.9$28.0 million, respectively. The following table summarizes the status of options which contain vesting provisions:
Average Grant
Date Fair
Value The total fair value of shares vested during Fiscal 2014, 2013, and 2012 was $35.5 million, $29.8 million, and $19.5 million, respectively.2014, there was $7.7 million of total unrecognized compensation cost related to non-vested stock options granted2016, the estimated future minimum lease payments under the Plan. This unvested cost is expected to be recognized during Fiscal 2015, Fiscal 2016, and Fiscal 2017.NOTE J Income Taxes The components of earnings before income taxesoperating leases are as follows: The components of the provision for income taxes are as follows:Year Ending July 31, Operating Leases 2017 $ 10.0 2018 8.1 2019 4.5 2020 1.8 2021 0.8 Thereafter 0.2 Total future minimum lease payments $ 25.4 Table of ContentsLitigation The following table reconciles the U.S. statutory income tax rate with the effective income tax rate: The tax effects of temporary differences that give rise to deferred tax assets and liabilities are as follows: Deferred income tax assets on the face of the balance sheet include $4.4 million and $4.0 million of prepaid tax assets related to intercompany transfers of inventory as of July 31, 2014 and 2013, respectively. The effective tax rate for Fiscal 2014 was 27.9 percent compared to 29.0 percent in Fiscal 2013. The decrease in the effective tax rate is primarily due to the favorable settlement of a tax audit, the remeasurement of certain deferred tax assets due to a change in tax rates in certain foreign jurisdictions, and a favorable shift in the mix of earnings between tax jurisdictions. This was partially offset by tax costs associated with foreign dividend distributions and the expiration of the Research and Experimentation Credit in the U.S. in the current year.has not provided for U.S. income taxes on additional undistributed earnings of non-U.S. subsidiaries of approximately $914.0 million. The Company currently intendsrecords provisions with respect to indefinitely reinvest these undistributed earnings as there are significant investment opportunities outside the U.S.identified claims or to repatriate the earnings onlylawsuits when it is tax effective to do so. If any portion were to be distributed,probable that a liability has been incurred and the related U.S. tax liability may be reduced by foreign income taxes paid on those earnings plus any available foreign tax credit carryovers. Determinationamount of the unrecognized deferred taxloss can be reasonably estimated. Claims and lawsuits are reviewed quarterly and provisions are taken or adjusted to reflect the status of a particular matter. The Company believes the recorded estimated liability relatedin its consolidated financial statements is adequate in light of the probable and estimable outcomes. The recorded liabilities were not material to these undistributed earnings is not practicable. In August 2014,the Company’s results of operations, liquidity or financial position and the Company repatriated $52.4 million of cash held by its foreign subsidiaries in the form of a cash dividend. This dividend represented a portiondoes not believe that any of the total planned dividends for Fiscal 2015. At this time, the Company anticipates the net tax impactcurrently identified claims or litigation will materially affect its results of the Fiscal 2015 dividends to be tax neutral.maintains a reserve for uncertain tax benefits. The accounting standard defines the threshold for recognizing the benefits of tax return positions in the financial statements as “more-likely-than-not” to be sustained by the taxing authorities based solely on the technical merits of the position. If the recognition threshold is met, the tax benefit is measured and recognized as the largest amount of tax benefit that in the Company’s judgment is greater than 50 percent likely to be realized. A reconciliation of the beginning and ending amount of gross unrecognized tax benefits is as follows: The Company recognizes interest and penalties accrued related to unrecognized tax benefits in income tax expense. During the fiscal year ended July 31, 2014, the Company recognized interest expense, net of tax benefit, of approximately $0.3 million. At July 31, 2014 and July 31, 2013, accrued interest and penalties on a gross basis were $1.7 million and $1.1 million, respectively. The Company files income tax returns in the U.S. federal jurisdiction and various state and foreign jurisdictions. With few exceptions, the Company is no longer subject to state and foreign income tax examinations by tax authorities for years before 2008. The IRS has completed examinations of the company’s U.S. federal income tax returns through 2012. If the Company were to prevail on all unrecognized tax benefits recorded, substantially all of the unrecognized tax benefits would benefit the effective tax rate. With an average statute of limitations of about 5 years, up to $1.0 million of the unrecognized tax benefits could potentially expire in the next 12 month period, unless extended by audit. It is possible that quicker than expected settlement of either current or future audits and disputes would cause additional reversals of previously recorded reserves in the next 12 month period. Currently, the Company has approximately $0.2 million of unrecognized tax benefits that are in formal dispute with various taxing authorities related to transfer pricing and deductibility of expenses. Quantification of an estimated range and timing of future audit settlements cannot be made at this time.NOTE K Segment Reporting Consistent with FASB guidance related to segment reporting, the Company identified two reportable segments: Engine Products and Industrial Products. Segment selectiondetermination was based on the internal organizational structure, management of operations and performance evaluation by management and the Company’s Board of Directors.original equipment manufacturers (OEM)OEMs in the construction, mining, agriculture, aerospace, defense and truck markets,end-markets and to independent distributors, OEM dealer networks, private label accounts and large equipment fleets. Products include air filtration systems, exhaust and emissions systems and liquid filtration systems including hydraulics, fuel, and lube and replacement filters. are cash and cash equivalents, inventory reserves, certain prepaids, certain investments, other assets and assets allocated to general corporate purposes.profit or loss from operationsearnings before income taxes. The Company’s manufacturing facilities serve both reporting segments. Therefore, the Company uses an allocation methodology to assign costs and assets to the segments. A certain amount of costs and assets relate to general corporate purposes and are not assigned to either segment. The accounting policy applied to inventory for the reportable segments differs from that described in the summary of significant accounting policies. The reportable segments account for inventory on a standard cost basis, which is consistent with ourthe Company's internal reporting.follows:
Products
Products
Unallocated
Company Fiscal 2016 Net sales $ 1,391.3 $ 829.0 $ — $ 2,220.3 Depreciation and amortization 38.5 28.1 8.3 74.9 Equity earnings in unconsolidated affiliates 1.0 1.2 — 2.2 Earnings (loss) before income taxes 163.5 119.0 (25.1 ) 257.4 Assets 841.4 646.9 300.3 1,788.6 Equity investments in unconsolidated affiliates 14.3 4.4 — 18.7 Capital expenditures 37.5 27.3 8.1 72.9 Fiscal 2015 Net sales $ 1,484.1 $ 887.1 $ — $ 2,371.2 Depreciation and amortization 43.3 26.4 4.6 74.3 Equity earnings in unconsolidated affiliates 4.1 1.0 — 5.1 Earnings (loss) before income taxes 186.3 123.3 (21.0 ) 288.6 Assets 887.7 634.0 287.8 1,809.5 Equity investments in unconsolidated affiliates 15.1 3.2 — 18.3 Capital expenditures 54.6 33.4 5.8 93.8 Fiscal 2014 Net sales $ 1,584.0 $ 889.5 $ — $ 2,473.5 Depreciation and amortization 38.9 24.0 4.3 67.2 Equity earnings in unconsolidated affiliates 5.6 0.9 — 6.5 Earnings (loss) before income taxes 233.9 134.0 (7.2 ) 360.7 Assets �� 900.1 572.0 470.3 1,942.4 Equity investments in unconsolidated affiliates 17.4 4.0 — 21.4 Capital expenditures 56.3 34.7 6.2 97.2 Following are netsegment:
segment is summarized as follows (in millions): Year Ended July 31, 2016 2015 2014 Engine Products segment: Off-Road Products $ 216.6 $ 261.1 $ 342.2 On-Road Products 127.2 138.4 130.0 Aftermarket Products* 951.5 980.7 1,012.2 Aerospace and Defense Products 96.0 103.9 99.6 Total Engine Products segment 1,391.3 1,484.1 1,584.0 Industrial Products segment: Industrial Filtration Solutions Products 517.9 529.0 553.4 Gas Turbine Products 149.6 186.9 156.9 Special Applications Products 161.5 171.2 179.2 Total Industrial Products segment 829.0 887.1 889.5 Total Company $ 2,220.3 $ 2,371.2 $ 2,473.5 ** Includes replacement part sales to the Company’s OEM Customers.customers. Geographicequipment:
Equipment – Net Net Sales (1) Property, Plant and Equipment, Net 2016 United States $ 937.3 $ 192.9 Europe 632.7 148.1 Asia Pacific 449.9 60.1 Other 200.4 68.7 Total $ 2,220.3 $ 469.8 2015 United States $ 1,007.3 $ 209.0 Europe 671.3 141.7 Asia Pacific 470.7 63.8 Other 221.9 56.1 Total $ 2,371.2 $ 470.6 2014 United States $ 1,019.9 $ 196.7 Europe 728.6 128.9 Asia Pacific 517.3 72.1 Other 207.7 54.0 Total $ 2,473.5 $ 451.7 Customerscustomers with over 10 percent10% of net sales during Fiscalthe years ended July 31, 2016, 2015 and 2014, 2013, and 2012.respectively. There were no Customerscustomers over 10 percent10% of gross accounts receivable in Fiscal 2014 or Fiscal 2013.NOTE L Guarantees The Company and Caterpillar Inc. equally own the shares of Advanced Filtration Systems Inc. (AFSI), an unconsolidated joint venture, and guarantee certain debt of the joint venture. As ofat July 31, 2014, the joint venture had $28.7 million of outstanding debt, of which the Company guarantees half. In addition, during Fiscal 2014, 2013, and 2012, the Company recorded its equity in earnings of this equity method investment of $3.7 million, $2.3 million, and $2.0 million and royalty income of $6.8 million, $6.0 million, and $6.2 million, respectively, related to AFSI. At2016 or July 31, 2014 and 2013, the Company had a contingent liability for standby letters of credit totaling $7.8 million and $12.2 million, respectively, which have been issued and are outstanding. The letters of credit guarantee payment to third parties in the event the Company is in breach of a specified bond financing agreement and insurance contract terms as detailed in each letter of credit. At July 31, 2014 and 2013, there were no amounts drawn upon these letters of credit.M Warranty The Company provides for warranties on certain products. In addition, the Company may incur specific Customer warranty issues. Following is a reconciliation of warranty reserves (in thousands of dollars): There were no significant specific warranty matters accrued for in Fiscal 2014 or Fiscal 2013. These warranty matters are not expected to have a material impact on the Company’s results of operations, liquidity, or19. Quarterly Financial Information (Unaudited)position. There were no significant settlements made in Fiscal 2014 or Fiscal 2013.NOTE N Commitments and Contingencies Operating Leases The Company enters into operating leases primarily for office and warehouse facilities, production and non-production equipment, automobiles, and computer equipment. Total expense recorded under operating leasesinformation for the periodsyears ended July 31, 20142016 and 2013 were $28.0 million and $27.5 million, respectively. Future commitments under operating leases are: $12.9 million in Fiscal 2015 $8.5 million in Fiscal 2016, $5.0 million in Fiscal 2017, $3.5 million in Fiscal 2018, $1.5 million in Fiscal 2019, and $0.1 million thereafter. LitigationThe Company records provisions with respect to identified claims or lawsuits when it is probable that a liability has been incurred and the amount of the loss can be reasonably estimated. Claims and lawsuits are reviewed quarterly and provisions are taken or adjusted to reflect the status of a particular matter. The Company believes the recorded reserves in its consolidated financial statements are adequate in light of the probable and estimable outcomes. The recorded liabilities were not material to the Company’s financial position, results of operations, or liquidity and the Company does not believe that any of the currently identified claims or litigation will materially affect its financial position, results of operations, or liquidity. Fiscal 2016 Net sales $ 538.0 $ 517.2 $ 571.3 $ 593.8 Gross profit 178.1 170.8 196.6 209.3 Net earnings 38.5 38.0 54.8 59.5 Basic earnings per share 0.29 0.28 0.41 0.44 Diluted earnings per share 0.29 0.28 0.41 0.44 Dividends declared per share 0.170 0.170 0.175 0.175 Dividends paid per share 0.170 0.170 0.170 0.175 Fiscal 2015 Net sales $ 596.5 $ 588.5 $ 575.6 $ 610.6 Gross profit 209.1 203.1 194.1 202.3 Net earnings 55.9 48.0 47.8 56.4 Basic earnings per share 0.40 0.35 0.35 0.41 Diluted earnings per share 0.40 0.34 0.34 0.41 Dividends declared per share — 0.330 — 0.340 Dividends paid per share 0.165 0.165 0.165 0.170 Table of ContentsNOTE O Quarterly Financial Information (Unaudited)
Quarter
Quarter
Quarter
QuarterNOTE P Subsequent Events On August 14, 2014, the Company announced that it entered into an agreement to acquire 100 percent of the voting equity interests in Northern Technical L.L.C., a manufacturer of gas turbine inlet air filtration systems and replacement filters. The acquisition of Northern Technical reinforces the Company’s commitment to growth with a company that is an excellent strategic fit with its existing Gas Turbine Products business. The acquisition will allow Donaldson to leverage Northern Technical’s strong Customer relationships in the Middle East, the largest gas turbine market in the world, with significant continued growth expected over the next decade. The acquisition is expected to close in the first quarter of Fiscal 2015, subject to normal closing conditions. Asend of the period covered by this report (the Evaluation Date), the Company, carried out an evaluation, under the supervision and with the participation of management, including theits Chief Executive Officer and the Chief Financial Officer, ofevaluated the effectiveness of the designCompany’s disclosure controls and operationprocedures as of the end of the period. Based on their evaluation, as of the end of the period covered the Company’s Chief Executive Officer and Chief Financial Officer concluded that the Company’s disclosure controls and procedures (as defined in RuleRules 13a-15(e) and 15d-15(e) under the Securities Exchange Act of the Exchange Act). Based upon that evaluation, the Chief Executive Officer and Chief Financial Officer concluded that,1934, as of the Evaluation Date, theamended) were effective. The Company’s disclosure controls and procedures were effective to ensureare designed so that information required to be disclosed by the Companyissuer in the reports that it files or submits under the Security Exchange Act of 1934, as amended, is (i) recorded, processed, summarized and reported within the time periods specified in applicablethe Commission’s rules and forms, and (ii)that such information is accumulated and communicated to our management including ourof the Company, with the participation of its Chief Executive Officer and Chief Financial Officer, as appropriate to allow timely decisions regarding required disclosure. No changein Ruleby Rules 13a-15(f) ofunder the Exchange Act) identified in connection with such evaluationthat occurred during the fiscal quarter ended July 31, 2014,2016 that has materially affected, or is reasonably likely to materially affect, the Company’sCompany's internal control over financial reporting.is in the process ofhas completed a multi-year implementation of a Globalglobal enterprise resource planning system (Global ERP Project. In the second quarter of Fiscal 2014, the Company began deploying the system in certain operations, primarily in the Americas. The deployment continued in the second half of Fiscal 2014 to additional operations also in the Americas. In Fiscal 2015, the Company expects this system will continue to be deployed further in the Americas and Europe.Project). In response to business integration activities related to the new system, the Company will alignhas aligned and streamlinestreamlined the design and operation of the financial reporting controls environment to be responsive to the changingchange in the operating environment.◦ Review and approval by management of all delivery terms on gas turbine projects. ◦ Expanded use of third party documents for support of the decision as to when recognition of revenue is appropriate. ◦ The utilization of standard forms for determining and documenting the revenue recognition decision. on page 27.on page 28.of this Annual Report.Item9B.20142016 Proxy Statement is incorporated herein by reference. Information on the Executive Officers of the Company is found under the caption “Executive Officers of the Registrant” on page 7in Part I of this Annual Report on Form 10-K.principal executive officer,Principal Executive Officer, its principal financial officerPrincipal Financial Officer and its principal accounting officerPrincipal Accounting Officer or controller,Controller or persons performing similar functions. A copy of the code of business conduct and ethics is posted on the Company’s website at www.donaldson.com.www.donaldson.com. The code of business conduct and ethics is available in print, free of charge, to any shareholder who requests it. The Company will disclose any amendments to or waivers of the code of business conduct and ethics for the Company’s principal executive officer, principal financial officer,Principal Executive Officer, Principal Financial Officer and principal accounting officerPrincipal Accounting Officer on the Company’s website.20142016 Proxy Statement is incorporated herein by reference.Item12. The information under the caption “Security Ownership” of the 2014 Proxy Statement is incorporated herein by reference.20142016, regarding the Company’s equity compensation plans:
to be issued upon exercise
of outstanding options,
warrants, and rights
exercise price of
outstanding options,
warrants, and rights
remaining available for
future issuance under
equity compensation
plans (excluding
securities reflected in
column (a))Plan Category (a) (b) (c) 1980 Master Stock Compensation Plan: Deferred Stock Gain Plan 34,720 $ 6.10 — 1991 Master Stock Compensation Plan: Deferred Stock Option Gain Plan 497,365 $ 2.09 — Deferred LTC/Restricted Stock 186,270 $ 13.68 — 2001 Master Stock Incentive Plan: Stock Options 1,632,355 $ 20.23 — Deferred LTC/Restricted Stock 120,620 $ 19.99 — 2010 Master Stock Incentive Plan: Stock Options 3,977,849 $ 34.30 See Note 1 Deferred LTC/Restricted Stock 68 41.15 Stock Options for Non-Employee Directors 815,500 34.20 Long-Term Compensation 24,272 $ 36.59 — 7,289,019 $ 28.05 396,686 $ 19.97 See Note 2 ESOP Restoration 27,783 $ 8.60 See Note 3 424,469 19.23 Total 7,713,488 27.56 Note 1: The 2010 Master Stock Incentive Plan limits the number of shares authorized for issuance to 9,200,000 during the 10-year term of the plan in addition to any shares forfeited under the 2001 plan. The Planplan allows for the granting of nonqualified stock options, incentive stock options, restricted stock, restricted stock units, SAR, dividend equivalents, and other stock-based awards. There are currently 5,401,2653,909,233 shares of the authorization remaining.Note 2: The stock option program for non-employee directors (filed as exhibit 10-H to Form 10-Q report filed for the first quarter ended October 31, 2008)non-Employee Directors provides for each non-employee directornon-Employee Director to receive annual option grants of 14,400 shares. The 2010 Master Stock Incentive Plan, which was approved by the Company’s stockholders on November 19, 2010, provides for the issuance of stock options to non-employee directors,non-Employee Directors, and the stock option program for non-employee directorsnon-Employee Directors has been adopted as a sub-plan under the 2010 Master Stock Incentive Plan and shares issued to directorsDirectors after December 10, 2010, will beare issued under the 2010 Master Stock Incentive Plan. Based on Mercer’s Director compensation review, the Committee approved changing the annual stock option grant from a fixed number of shares to a fixed value. The annual stock option grant will be based on a $140,000 fixed value. This change is designed to maintain a stable value of equity grantfor ourthe Company's Director compensation. The number of options granted will be determined by dividing the fixed value of $140,000 by the Black-Scholes value as of the date of the grant (the shares will be rounded to the nearest 100 shares). This change was effective for stock options granted beginning in January 2014.Note 3: The Company has a non-qualified ESOP Restoration Plan established on August 1, 1990, (filed as exhibit 10-D to the Company’s 2009 Form 10-K report), to supplement the benefits for executive employeesEmployees under the Company’s Employee Stock Ownership Plan that would otherwise be reduced because of the compensation limitations under the Internal Revenue Code. The ESOP’s 10-year term was completed on July 31, 1997, and the only ongoing benefits under the ESOP Restoration Plan are the accrual of dividend equivalent rights to the participants in the Plan.plan.20142016 Proxy Statement is incorporated herein by reference.20142016 Proxy Statement is incorporated herein by reference.(1) Financial Statements Report of Independent Registered Public Accounting Firm Consolidated Statements of Earnings — years ended July 31, 2014, 2013,2016, 2015 and 20122014 Consolidated Statements of Comprehensive Income — years ended July 31, 2014, 2013,2016, 2015 and 20122014 Consolidated Balance Sheets — July 31, 20142016 and 20132015 Consolidated Statements of Cash Flows — years ended July 31, 2014, 2013,2016, 2015 and 20122014 Consolidated Statements of Changes in Shareholders’ Equity — years ended July 31, 2014, 2013,2016, 2015 and 20122014 Notes to Consolidated Financial Statements (2) Financial Statement Schedules —Schedule II Valuation and qualifying accounts All other schedules (Schedules I, II, III, IV and V) for which provision is made in the applicable accounting regulations of the Securities and Exchange Commission are not required under the related instruction, or are inapplicable, and therefore have been omitted. (3) Exhibits The exhibits listed in the accompanying index are filed as part of this report or incorporated by reference as indicated therein. DONALDSON COMPANY, INC.Date:September 26, 2014By: /s/ William M. CookWilliam M. CookDate: September 23, 2016 By: /s/ Tod E. Carpenter 26, 2014.23, 2016./s/ William M. CookTod E. Carpenter and ChairmanWilliam M. Cook*Director, Chief Operating OfficerTod E. CarpenterJames F. ShawJames F. Shaw* Chairman of the Board *DirectorF. Guillaume BastiaensDirector Andrew Cecere Andrew Cecere*DirectorJanet M. Dolan*Director* Director *DirectorPaul David MillerDirector *DirectorJeffrey Noddle*Director* Director *Director* Director *Director* Director *DirectorDirector John P. Wiehoff *By: *By: /s//s/ Amy C. BeckerSCHEDULE II - VALUATION AND QUALIFYING ACCOUNTSDONALDSON COMPANY, INC. AND SUBSIDIARIES(thousands of dollars)
Beginning of
Period
Costs and
Expenses
Other Accounts
(A)
(B)
End of
PeriodNote A - Allowance for doubtful accounts foreign currency translation losses (gains) recorded directly to equity.Note B - Bad debts charged to allowance, net of reserves and changes in estimates.* 3-A—*3-A — Restated Certificate of Incorporation of Registrant as currently in effect (Filed as Exhibit 3-A to Form 10-Q Report for the Second Quarter ended January 31, 2012) January 30, 2009)July 29, 2016) (Filed as Exhibit 3-C to Form 10-Q8-K Report for the Second Quarter ended January 31, 2009)Non-employeeNon-Employee Directors as amended (Filed as Exhibit 10-C to Form 10-Q Report filed for the first quarter ended October 31, 2008)*** form—S-*S-8 (File No. 333-170729) filed on November 19, 2010)****10-Y
Form 10-K Report)***11*10-KK — First Supplement, dated as of April 15, 2015, to Note Purchase Agreement, dates as of March 27, 2014, by and among Donaldson Company, Inc. and the purchasers named therein (as amended)(Filed as Exhibit 10.1 to Form 8-K report on April 21, 2015) 10-LL — Form of Separation and General Release Agreement, dated as of February 12, 2016, by and between James F. Shaw and Donaldson Company, Inc. *** 10-MM — Form of Separation and General Release Agreement, dated as of March 1, 2016, by and between Jay L. Ward and Donaldson Company, Inc. *** *10-1 — First Amendment, dated as of October 28, 2014, to Credit Agreement, dated as of December 7, 2012, among Donaldson Company Inc., each of the lenders from time to time parties to the Credit Agreement (the “Lenders”) and Wells Fargo National Association, as administrative agent for the Lenders and issuer of letter of credit (Filed as Exhibit 10.1 on Form 8-K filed October 29, 2014) 11 — Computation of net earnings per share (See “Earnings Per Share” in “Summary of Significant Accounting Policies” in Note A in the Notes to Consolidated Financial Statements on page 34)included in Item 8)20142016 as filed with the Securities and Exchange Commission, formatted in Extensible Business Reporting Language (XBRL): (i) the Consolidated Statements of Earnings, (ii) the Consolidated Balance Sheets, (iii) the Consolidated Statements of Cash Flows (iv) the Consolidated Statement of Changes in Shareholders’ Equity and (v) the Notes to Consolidated Financial Statements.** Exhibit has previously been filed with the Securities and Exchange Commission and is incorporated herein by reference as an exhibit. Pursuant to the provisions of Regulation S-K Item 601(b)(4)(iii)(A) copies of instruments defining the rights of holders of certain long-term debts of the Company and its subsidiaries are not filed and in lieu thereof the Company agrees to furnish a copy thereof to the Securities and Exchange Commission upon request. Denotes compensatory plan or management contract. Note: Exhibits have been furnished only to the Securities and Exchange Commission. Copies will be furnished to individuals upon request. Note: Exhibits have been furnished only to the Securities and Exchange Commission. Copies will be furnished to individuals upon request.65