PART I
Item 1. Business
GENERAL INFORMATION
Unless otherwise indicated, “we,” “us,” “our” and similar terms, as well as references to the “Company,” refer to O’Reilly Automotive, Inc. and its subsidiaries, collectively “we,” “us,” “our,” the “Company,” or “O’Reilly,”Subsidiaries. O’Reilly is one of the largest specialty retailers of automotive aftermarket parts, tools, supplies, equipment and accessories in the United States (“U.S.”), selling our products to both do-it-yourself (“DIY”) and professional service provider customers, our “dual market strategy.” The business was founded in 1957 by Charles F. O’Reilly and his son, Charles H. “Chub’’ O’Reilly, Sr., and initially operated from a single store in Springfield, Missouri. Our common stock has traded on The NASDAQ Global Select Market under the symbol “ORLY” since April 22, 1993.
After the close of business on November 29, 2019, we completed the acquisition of Mayoreo de Autopartes y Aceites, S.A. de C.V. (“Mayasa”), a specialty retailer of automotive aftermarket parts headquartered in Guadalajara, Jalisco, Mexico pursuant to a stock purchase agreement. At the time of the acquisition, Mayasa operated six distribution centers, 21 Orma Autopartes stores and served over 2,000 independent jobber locations in 28 Mexican states.
At December 31, 2016,2019, we operated 4,8295,439 stores in 47 states.states in the United States and 21 stores in Mexico. Our stores carry an extensive product line, including
| ● | new and remanufactured automotive hard parts and maintenance items, such as alternators, batteries, brake system components, belts, chassis parts, driveline parts, engine parts, fuel pumps, hoses, starters, temperature control, water pumps, antifreeze, appearance products, engine additives, filters, fluids, lighting, oil and wiper blades; and |
| ● | accessories, such as floor mats, seat covers and truck accessories. |
Our stores offer many enhanced services and programs to our customers, such as
| ● | battery diagnostic testing; |
| ● | battery, wiper and bulb replacement; |
| ● | check engine light code extraction, where allowed by law; |
| ● | custom hydraulic hoses; |
| ● | drum and rotor resurfacing; |
| ● | electrical and module testing; |
| ● | loaner tool program; |
| ● | machine shops; |
| ● | professional paint shop mixing and related materials; and |
| ● | used oil, oil filter and battery recycling. |
See the “Risk Factors” section of Item 1A of this annual report on Form 10-K for a description of certain risks relevant to our business. These risk factors include, among others, deteriorating economic conditions, competition in the automotive aftermarket business, our sensitivity to regional economic and weather conditions, future growth assurance, our dependence upon key and other personnel, our relationships with key suppliers and availability of key products, our acquisition strategies, complications in our distribution centers (“DCs”), failure to achieve high levels of service and product quality, unanticipated fluctuations in our quarterly results, the volatility of the market price of our common stock, our increased debt levels, a downgrade in our credit ratings, data security, and environmental legislation and other regulations.
OUR BUSINESS
Our goal is to continue to achieve growth in sales and profitability by capitalizing on our competitive advantages and executing our growth strategy. We remain confident in our ability to continue to gain market share in our existing markets and grow our business in new markets by focusing on our dual market strategy and the core O’Reilly values, including superior customer service and expense control. Our intent is to be the dominant auto parts provider in all the markets we serve, by providing a higher level of customer service and a better value position than our competitors to both DIY and professional service provider customers.
3
Competitive Advantages
We believe our effective dual market strategy, superior customer service, technically proficient store personnel, strategic distribution network and experienced management team make up our key competitive advantages, which cannot be easily duplicated.
Proven Ability to Execute Our Dual Market Strategy:
For more than 3540 years, we have established a track record of effectively serving, at a high level, both DIY and professional service provider customers. We believe our proven ability to effectively execute a dual market strategy is a unique competitive advantage. The execution of this strategy enables us to better compete by targeting a larger base of automotive aftermarket parts consumers, capitalizing on our existing retail and distribution infrastructure, operating profitably in both large markets and less densely populated geographic areas that typically attract fewer competitors, and enhancing service levels offered to DIY customers through the offering of a broad inventory and the extensive product knowledge required by professional service provider customers.
In 2016,2019, we derived approximately 58%56% of our sales from our DIY customers and approximately 42%44% of our sales from our professional service provider customers. Historically, we have increased our sales to professional service provider customers at a faster pace than the increase in our sales to DIY customers due to the more fragmented nature of the professional service provider business, which offers a greater opportunity for consolidation. We believe we will continue to have a competitive advantage on the professional service provider portion of our business, due to our systems, knowledge and experience serving the professional service provider side of the automotive aftermarket, supported by our approximately 750825 full-time sales staff dedicated solely to calling upon and servicing the professional service provider customer. We will also continue to expand and enhance the level of offerings focused on growing our DIY business and will continue to execute our proven dual market strategy in both existing and new markets.
Superior Customer Service:
We seek to provide our customers with an efficient and pleasant in-store experience by maintaining attractive stores in convenient locations with a wide selection of automotive products. We believe that the satisfaction of DIY and professional service provider customers is substantially dependent upon our ability to provide, in a timely fashion, the specific automotive products needed to complete their repairs. Accordingly, each O’Reilly store carries, or has same or next day availability to, a broad selection of automotive products designed to cover a wide range of vehicle applications. We continuously refine the inventory levels and assortments carried in each of our stores and within our network, based in large part on the sales movement tracked by our inventory control system, market vehicle registration data, failure rates and management’s assessment of the changes and trends in the marketplace. We have no material backorders for the products we sell.
We seek to attract new DIY and professional service provider customers and to retain existing customers by offering superior customer service, the key elements of which are identified below:
| ● | superior in-store service through highly-motivated, technically-proficient store personnel (“Professional Parts People”); |
| ● | an extensive selection and availability of products; |
| ● | many enhanced service programs, including battery and electrical testing, battery, wiper and bulb replacement and check engine light code extractions; |
| ● | attractive stores in convenient locations; |
| ● | competitive pricing, supported by a good, better, best product assortment designed to meet all of our customers’ quality and value preferences; and |
| ● | a robust point-of-sale system integrated with our proprietary electronic catalog, which contains a wide variety of product images, schematics and technical specifications and equips our Team Members with highly effective tools to source products in our extensive supply network. |
Technically Proficient Professional Parts People:
Our highly-motivated, technically-proficient Professional Parts People provide us with a significant competitive advantage, particularly over less specialized retail operators. We require our Professional Parts People to undergo extensive and ongoing training and to be knowledgeable, particularly with respect to hard part repairs, in order to better serve the technically-oriented professional
Strategic Regional Tiered Distribution Network:
We believe our commitment to a robust, regional, tiered distribution network provides superior replenishment and access to hard-to-find parts and enables us to optimize product availability and inventory levels throughout our store network. Our strategic, regional,
4
tiered distribution network includes DCs and Hub stores. Our inventory management and distribution systems electronically link each of our stores to one or more DCs, which provides for efficient inventory control and management. We currently operate 2728 regional DCs, which provide our stores with same-day or overnight access to an average of 148,000159,000 stock keeping units (“SKUs”), many of which are hard-to-find items not typically stocked by other auto parts retailers. To augment our robust distribution network, we operate 312a total of 356 Hub stores that also provide delivery service and same-day access to an average of 45,00068,000 SKUs from a Super Hub or 42,000 SKUs from a Hub to other stores within the surrounding area. We believe this timely access to a broad range of products is a key competitive advantage in satisfying customer demand and generating repeat business.
Experienced Management Team:
Our Company philosophy is to “promote from within” and the vast majority of our senior management, district managers and store managers have been promoted from within the Company. We augment this promote from within philosophy by pursuing strategic hires with a strong emphasis on automotive aftermarket experience. We have a strong management team comprised of 216 senior management with 185 professionalsmanagers who average 1821 years of service; 242270 corporate managers who average 16 years of service; and 474540 district managers who average 1214 years of service. Our management team has demonstrated the consistent ability to successfully execute our business plan and growth strategy by generating 2427 consecutive years of record revenues and earnings and positive comparable store sales results since becoming a public company in April of 1993.
Growth Strategy
Aggressively Open New Stores:
We intend to continue to consolidate the fragmented automotive aftermarket. During 2016,2019, we opened 210200 net, new domestic stores, as well as 20 net, additional stores from the Bennett Auto Supply (“Bennett”), Inc. acquisition and acquired 48 Bond Auto Parts21 additional stores andfrom the Mayasa acquisition. In 2020, we plan to open approximately 190180 net, new stores, in 2017, which will increase our penetration in existing markets and allow for expansion into new, contiguous markets. The sites for these new stores have been identified, and to date, we have not experienced significant difficulties in locating suitable sites for construction of new stores or identifying suitable acquisition targets for conversion to O’Reilly stores. We typically open new stores by
| (i) | constructing a new facility or renovating an existing one on property we purchase or lease and stocking the new store with fixtures and inventory; |
| (ii) | acquiring an independently owned auto parts store (“jobber store”), typically by the purchase of substantially all of the inventory and other assets (other than realty) of such store; or |
| (iii) | purchasing multi-store chains. |
New store sites are strategically located in clusters within geographic areas that complement our distribution network in order to achieve economies of scale in management, advertising and distribution. Other key factors we consider in the site selection process include population density and growth patterns, demographic lifestyle segmentation, age and per capita income, vehicle traffic counts, vehicles in operation, number and type of existing automotive repair facilities and competing auto parts stores within a predetermined radius.
We target both small and large markets for expansion of our store network. While we have, faced, and expect to continue to face, aggressive competition in the more densely populated markets, we believe we have competed effectively, and are well positioned to continue to compete effectively, in such markets and to achieve our goal of continued profitable sales growth within these markets. We also believe that with our dual market strategy, we are better able to operate stores in less densely populated areas, which would not otherwise support a national chain store selling primarily to the retail automotive aftermarket. Therefore, we continue to pursue opening new stores in less densely populated market areas as part of our growth strategy.
Grow Sales in Existing Stores:
Profitable comparable store sales growth is also an important part of our growth strategy. To achieve improved sales and profitability at existing O’Reilly stores, we continually strive to improve the service provided to our customers. We believe that while competitive pricing is an essential component of successful growth in the automotive aftermarket business, it is customer satisfaction, whether of the DIY consumer or professional service provider, resulting from superior customer service, that generates increased sales and profitability.
Selectively Pursue Strategic Acquisitions:
The automotive aftermarket industry is still highly fragmented, and we believe the ability of national auto parts chains, such as ourselves,like O’Reilly, to operate more efficiently and effectively than smaller independent operators, will result in continued industry consolidation. Our intention is to continue to selectively pursue strategic acquisition targetsacquisitions that will strengthen our position as a leading automotive aftermarket parts supplier in existing markets and provide a springboard for expansion into new markets.
5
Continually Enhance Store Design and Location:
Our current prototype store design features optimized square footage, high ceilings, convenient interior store layouts, in-store signage, bright lighting, convenient ingress, and egress and parking, and dedicated counters to serve professional service provider customers, each designed to increase sales and operating efficiencies andto enhance overall customer service. We continually update the location and condition of our store network through systematic renovation and relocation of our existing stores to enhance store performance. During 2016,2019, we relocated 2012 stores and renovated 30performed minor to major updates or renovations to approximately 1,500 additional stores. We believe that our ability to consistently achieve growth in comparable store sales is due in part to our commitment to maintaining an attractive store network, which is strategically located to best serve our customers.
Omnichannel Growth Strategy:
Our Omnichannel growth strategies reflect the Growthcontinued evolution of customer preferences in researching and Functionalitycompleting purchases. More than ever before, our customers’ purchase decisions are informed by a range of interactions, whether in-person, over the phone, or through a variety of digital channels, as they seek to find the professional parts knowledge and the product availability they need to meet their automotive repair and maintenance needs. Our E-Commerce Website:
Team Members
As of January 31, 2017,2020, we employed 74,71582,167 Team Members (42,289(53,159 full-time Team Members and 32,42629,008 part-time Team Members), of whom 63,38068,679 were employed at our U.S. stores, 7,9078,607 were employed at our U.S. DCs, and 3,4283,620 were employed at our U.S. corporate and regional offices.offices, and 1,261 were employed in Mexico. A union represents 4950 stores (493(489 Team Members) in the Greater Bay Area in California and has for many years. In addition,years, and approximately 10434 Team Members who drive over-the-road trucks in threetwo of our domestic DCs are represented by labor unions as well. In addition, the Company assumed collective bargaining agreements with various unions in Mexico in connection with its acquisition of Mayasa; however, none of the Company’s Team Members are specifically affiliated with, or members of, those unions. Except for theseWith the exception of the previously described Team Members, our Team Members are not represented by labor unions. Our tradition for 6063 years has been to treat all of our Team Members with honesty and respect and to commit significant resources to instill in them our “Live Green” culture, which emphasizes the importance of each Team Member’s contribution to the success of O’Reilly. This focus on professionalism and respect has created an industry-leading team, and we consider our relations with our Team Members to be excellent.
Store Network
New Store Site Selection:
In selecting sites for new stores, we seek to strategically locate store sites in clusters within geographic areas in order to achieve economies of scale in management, advertising and distribution. Other key factors we consider in the site selection process are
| ● | population density; |
| ● | demographics, including age, ethnicity, life style and per capita income; |
| ● | market economic strength, retail draw and growth patterns; |
| ● | number, age and percent of makes and models of registered vehicles; |
| ● | the number, type and sales potential of existing automotive repair facilities; |
| ● | the number of auto parts stores and other competitors within a predetermined radius; |
| ● | physical location, traffic count, size, economics and presentation of the site; |
| ● | financial review of adjacent existing locations; and |
| ● | the type and size of store that should be developed. |
When entering new, more densely populated markets, we generally seek to initially open several stores within a short span of time in order to maximize the effect of initial promotional programs and achieve economies of scale. After opening this initial cluster of new stores, we seek to begin penetrating the less densely populated surrounding areas. As these store clusters mature, we evaluate the need to open additional locations in the more densely populated markets where we believe opportunities exist to expand our market share or to
6
improve the level of service provided in high volume areas. This strategy enables us to achieve additional distribution and advertising efficiencies in each market.
Store Locations and Size:
As a result of our dual market strategy, we are able to profitably operate in both large, densely populated markets and small, less densely populated areas that would not otherwise support a national chain selling primarily to the retail automotive aftermarket. Our U.S. stores, on average, carry approximately 23,00022,000 SKUs and average approximately 7,3007,400 total square feet in size. At December 31, 2016,2019, we had a total of approximately 3540 million square feet in our 4,8295,439 domestic stores. Our domestic stores are served primarily by the nearest DC, which averages 148,000159,000 SKUs, but also have same-day access to the broad selection of inventory available at one of our 312356 Hub stores, which onare comprised of 85 Super Hubs that average approximately 15,700 square feet and carry approximately 45,000an average of 68,000 SKUs and 271 Hubs that average approximately 10,60010,000 square feet in size.
We believe that our stores are “destination stores’’stores” generating their own traffic rather than relying on traffic created by the presence of other stores in the immediate vicinity. Consequently, most of our stores are freestanding buildings or prominent end caps situated on or near major traffic thoroughfares and offer ample parking, easy customer access and are generally located in close proximity to our professional service provider customers.
7
The following table sets forth the geographic distribution and activity of our stores as of December 31, 20162019 and 2015:2018:
| | | | | | | | | | | | | | | | | | |
| | | | | | | 2019 Net, New and | | | | | | | | | |||
| | December 31, 2018 | | Acquired Stores | | December 31, 2019 | ||||||||||||
|
| |
|
| | |
| % of Total | | |
|
| | Cumulative | ||||
| | Store | | % of Total | | Store | | Store | | Store | | % of Total | | % of Total | ||||
State | | Count | | Store Count | | Change | | Change | | Count | | Store Count | | Store Count | ||||
Texas | | 706 | | 13.5 | % | | 29 |
| 13.2 | % | | 735 | | 13.5 | % | | 13.5 | % |
California | | 553 | | 10.6 | % | | 1 |
| 0.5 | % | | 554 | | 10.2 | % | | 23.7 | % |
Florida | | 200 | | 3.8 | % | | 39 |
| 17.7 | % | | 239 | | 4.4 | % | | 28.1 | % |
Georgia | | 205 | | 3.9 | % | | 9 |
| 4.1 | % | | 214 | | 3.9 | % | | 32.0 | % |
Illinois | | 203 | | 3.9 | % | | 8 |
| 3.6 | % | | 211 | | 3.9 | % | | 35.9 | % |
Missouri | | 201 | | 3.9 | % | | 2 |
| 0.9 | % | | 203 | | 3.7 | % | | 39.6 | % |
Ohio | | 196 | | 3.8 | % | | 7 |
| 3.2 | % | | 203 | | 3.7 | % | | 43.3 | % |
North Carolina | | 173 | | 3.3 | % | | 12 |
| 5.5 | % | | 185 | | 3.4 | % | | 46.7 | % |
Tennessee | | 176 | | 3.4 | % | | 7 |
| 3.2 | % | | 183 | | 3.4 | % | | 50.1 | % |
Michigan | | 168 | | 3.2 | % | | 7 |
| 3.2 | % | | 175 | | 3.2 | % | | 53.3 | % |
Washington | | 156 | | 3.0 | % | | 2 |
| 0.9 | % | | 158 | | 2.9 | % | | 56.2 | % |
Alabama | | 139 | | 2.7 | % | | 8 |
| 3.6 | % | | 147 | | 2.7 | % | | 58.9 | % |
Indiana | | 137 | | 2.6 | % | | 10 |
| 4.5 | % | | 147 | | 2.7 | % | | 61.6 | % |
Arizona | | 139 | | 2.7 | % | | 1 |
| 0.5 | % | | 140 | | 2.6 | % | | 64.2 | % |
Minnesota | | 125 | | 2.4 | % | | 1 |
| 0.5 | % | | 126 | | 2.3 | % | | 66.5 | % |
Louisiana | | 121 | | 2.3 | % | | 3 |
| 1.3 | % | | 124 | | 2.3 | % | | 68.8 | % |
Wisconsin | | 121 | | 2.3 | % | | 3 |
| 1.3 | % | | 124 | | 2.3 | % | | 71.1 | % |
Oklahoma | | 121 | | 2.3 | % | | 1 |
| 0.5 | % | | 122 | | 2.2 | % | | 73.3 | % |
Arkansas | | 112 | | 2.1 | % | | 2 |
| 0.9 | % | | 114 | | 2.1 | % | | 75.4 | % |
South Carolina | | 108 | | 2.1 | % | | 2 |
| 0.9 | % | | 110 | | 2.0 | % | | 77.4 | % |
Colorado | | 102 | | 2.0 | % | | 3 |
| 1.3 | % | | 105 | | 1.9 | % | | 79.3 | % |
Kentucky | | 95 | | 1.7 | % | | 6 |
| 2.7 | % | | 101 | | 1.9 | % | | 81.2 | % |
Kansas | | 85 | | 1.6 | % | | — |
| — | % | | 85 | | 1.7 | % | | 82.9 | % |
Virginia | | 78 | | 1.5 | % | | 7 |
| 3.2 | % | | 85 | | 1.7 | % | | 84.6 | % |
Mississippi | | 78 | | 1.5 | % | | 2 |
| 0.9 | % | | 80 | | 1.5 | % | | 86.1 | % |
Iowa | | 77 | | 1.5 | % | | 1 |
| 0.5 | % | | 78 | | 1.4 | % | | 87.5 | % |
Oregon | | 70 | | 1.3 | % | | 2 |
| 0.9 | % | | 72 | | 1.3 | % | | 88.8 | % |
Utah | | 64 | | 1.2 | % | | 1 |
| 0.5 | % | | 65 | | 1.2 | % | | 90.0 | % |
New Mexico | | 56 | | 1.1 | % | | 4 |
| 1.8 | % | | 60 | | 1.1 | % | | 91.1 | % |
Nevada | | 56 | | 1.1 | % | | — |
| — | % | | 56 | | 1.0 | % | | 92.1 | % |
Nebraska | | 45 | | 0.9 | % | | 2 |
| 0.9 | % | | 47 | | 0.9 | % | | 93.0 | % |
Massachusetts | | 39 | | 0.7 | % | | 7 |
| 3.2 | % | | 46 | | 0.8 | % | | 93.8 | % |
Idaho | | 44 | | 0.8 | % | | 1 |
| 0.5 | % | | 45 | | 0.8 | % | | 94.6 | % |
Maine | | 35 | | 0.7 | % | | (1) |
| (0.5) | % | | 34 | | 0.6 | % | | 95.2 | % |
Pennsylvania | | 24 | | 0.5 | % | | 9 |
| 4.1 | % | | 33 | | 0.6 | % | | 95.8 | % |
New Hampshire | | 32 | | 0.6 | % | | — |
| — | % | | 32 | | 0.6 | % | | 96.4 | % |
Montana | | 28 | | 0.5 | % | | — |
| — | % | | 28 | | 0.5 | % | | 96.9 | % |
Vermont | | 24 | | 0.5 | % | | — |
| — | % | | 24 | | 0.4 | % | | 97.3 | % |
Connecticut | | 20 | | 0.4 | % | | 3 |
| 1.3 | % | | 23 | | 0.4 | % | | 97.7 | % |
Wyoming | | 21 | | 0.4 | % | | 1 |
| 0.5 | % | | 22 | | 0.4 | % | | 98.1 | % |
South Dakota | | 18 | | 0.3 | % | | — |
| — | % | | 18 | | 0.3 | % | | 98.4 | % |
West Virginia | | 15 | | 0.3 | % | | 2 |
| 0.9 | % | | 17 | | 0.3 | % | | 98.7 | % |
New York | | 3 | | 0.1 | % | | 14 |
| 6.4 | % | | 17 | | 0.3 | % | | 99.0 | % |
Alaska | | 15 | | 0.3 | % | | — |
| — | % | | 15 | | 0.3 | % | | 99.3 | % |
North Dakota | | 15 | | 0.3 | % | | — |
| — | % | | 15 | | 0.3 | % | | 99.6 | % |
Hawaii | | 12 | | 0.2 | % | | — |
| — | % | | 12 | | 0.2 | % | | 99.8 | % |
Rhode Island | | 8 | | 0.2 | % | | 2 |
| 0.9 | % | | 10 | | 0.2 | % | | 100.0 | % |
Total U.S. stores | | 5,219 | | 100.0 | % | | 220 | | 100.0 | % | | 5,439 | | 100.0 | % | | | |
| | | | | | | | | | | | | | | | | | |
Mexico | | — | | | | | 21 | | | | | 21 | | | | | | |
Total stores |
| 5,219 |
| | | | 241 |
| | | | 5,460 |
| | | |
| |
8
| December 31, 2015 | 2016 Net, New and Acquired Stores | December 31, 2016 | |||||||||||||||||||
| State | Store Count | % of Total Store Count | Store Change | % of Total Store Change | Store Count | % of Total Store Count | Cumulative % of Total Store Count | ||||||||||||||
| Texas | 639 | 14.0 | % | 28 | 10.9 | % | 667 | 13.8 | % | 13.8 | % | ||||||||||
| California | 523 | 11.4 | % | 11 | 4.3 | % | 534 | 11.0 | % | 24.8 | % | ||||||||||
| Missouri | 193 | 4.2 | % | 2 | 0.8 | % | 195 | 4.0 | % | 28.8 | % | ||||||||||
| Georgia | 181 | 4.0 | % | 6 | 2.3 | % | 187 | 3.9 | % | 32.7 | % | ||||||||||
| Illinois | 178 | 3.9 | % | 8 | 3.1 | % | 186 | 3.9 | % | 36.6 | % | ||||||||||
| Ohio | 161 | 3.5 | % | 8 | 3.1 | % | 169 | 3.5 | % | 40.1 | % | ||||||||||
| Florida | 143 | 3.1 | % | 20 | 7.8 | % | 163 | 3.4 | % | 43.5 | % | ||||||||||
| Tennessee | 154 | 3.4 | % | 8 | 3.1 | % | 162 | 3.4 | % | 46.9 | % | ||||||||||
| Michigan | 149 | 3.3 | % | 9 | 3.5 | % | 158 | 3.3 | % | 50.2 | % | ||||||||||
| North Carolina | 149 | 3.3 | % | 6 | 2.3 | % | 155 | 3.2 | % | 53.4 | % | ||||||||||
| Washington | 154 | 3.4 | % | 1 | 0.4 | % | 155 | 3.2 | % | 56.6 | % | ||||||||||
| Arizona | 133 | 2.9 | % | 3 | 1.1 | % | 136 | 2.8 | % | 59.4 | % | ||||||||||
| Alabama | 120 | 2.6 | % | 5 | 1.9 | % | 125 | 2.6 | % | 62.0 | % | ||||||||||
| Oklahoma | 119 | 2.6 | % | 2 | 0.8 | % | 121 | 2.5 | % | 64.5 | % | ||||||||||
| Indiana | 118 | 2.6 | % | 2 | 0.8 | % | 120 | 2.5 | % | 67.0 | % | ||||||||||
| Minnesota | 118 | 2.6 | % | 1 | 0.4 | % | 119 | 2.5 | % | 69.5 | % | ||||||||||
| Wisconsin | 109 | 2.4 | % | 9 | 3.5 | % | 118 | 2.4 | % | 71.9 | % | ||||||||||
| Louisiana | 103 | 2.3 | % | 6 | 2.3 | % | 109 | 2.3 | % | 74.2 | % | ||||||||||
| Arkansas | 105 | 2.3 | % | 2 | 0.8 | % | 107 | 2.2 | % | 76.4 | % | ||||||||||
| Colorado | 96 | 2.1 | % | 3 | 1.1 | % | 99 | 2.1 | % | 78.5 | % | ||||||||||
| South Carolina | 89 | 1.9 | % | 2 | 0.8 | % | 91 | 1.9 | % | 80.4 | % | ||||||||||
| Kansas | 80 | 1.8 | % | 2 | 0.8 | % | 82 | 1.7 | % | 82.1 | % | ||||||||||
| Kentucky | 73 | 1.6 | % | 4 | 1.6 | % | 77 | 1.6 | % | 83.7 | % | ||||||||||
| Mississippi | 75 | 1.6 | % | — | 0.0 | % | 75 | 1.6 | % | 85.3 | % | ||||||||||
| Iowa | 70 | 1.5 | % | 3 | 1.1 | % | 73 | 1.5 | % | 86.8 | % | ||||||||||
| Oregon | 61 | 1.3 | % | 5 | 1.9 | % | 66 | 1.4 | % | 88.2 | % | ||||||||||
| Virginia | 61 | 1.3 | % | 5 | 1.9 | % | 66 | 1.4 | % | 89.6 | % | ||||||||||
| Utah | 60 | 1.3 | % | 1 | 0.4 | % | 61 | 1.3 | % | 90.9 | % | ||||||||||
| Nevada | 53 | 1.2 | % | 1 | 0.4 | % | 54 | 1.1 | % | 92.0 | % | ||||||||||
| New Mexico | 47 | 1.0 | % | 5 | 1.9 | % | 52 | 1.1 | % | 93.1 | % | ||||||||||
| Nebraska | 37 | 0.8 | % | 4 | 1.6 | % | 41 | 0.8 | % | 93.9 | % | ||||||||||
| Idaho | 38 | 0.8 | % | 2 | 0.8 | % | 40 | 0.8 | % | 94.7 | % | ||||||||||
| New Hampshire | 20 | 0.4 | % | 18 | 7.0 | % | 38 | 0.8 | % | 95.5 | % | ||||||||||
| Maine | 35 | 0.8 | % | — | 0.0 | % | 35 | 0.7 | % | 96.2 | % | ||||||||||
| Massachusetts | 13 | 0.3 | % | 17 | 6.6 | % | 30 | 0.6 | % | 96.8 | % | ||||||||||
| Montana | 27 | 0.6 | % | — | 0.0 | % | 27 | 0.6 | % | 97.4 | % | ||||||||||
| Vermont | — | — | % | 24 | 9.3 | % | 24 | 0.5 | % | 97.9 | % | ||||||||||
| Wyoming | 19 | 0.4 | % | 1 | 0.4 | % | 20 | 0.4 | % | 98.3 | % | ||||||||||
| South Dakota | 12 | 0.3 | % | 4 | 1.6 | % | 16 | 0.3 | % | 98.6 | % | ||||||||||
| Alaska | 15 | 0.3 | % | — | 0.0 | % | 15 | 0.3 | % | 98.9 | % | ||||||||||
| North Dakota | 15 | 0.3 | % | — | 0.0 | % | 15 | 0.3 | % | 99.2 | % | ||||||||||
| Hawaii | 12 | 0.3 | % | — | 0.0 | % | 12 | 0.2 | % | 99.4 | % | ||||||||||
| Pennsylvania | 3 | 0.1 | % | 9 | 3.5 | % | 12 | 0.2 | % | 99.6 | % | ||||||||||
| West Virginia | 9 | 0.2 | % | 3 | 1.1 | % | 12 | 0.2 | % | 99.8 | % | ||||||||||
| Connecticut | 2 | — | % | 3 | 1.1 | % | 5 | 0.1 | % | 99.9 | % | ||||||||||
| Rhode Island | — | — | % | 3 | 1.1 | % | 3 | 0.1 | % | 100.0 | % | ||||||||||
| New York | — | — | % | 2 | 0.8 | % | 2 | — | % | 100.0 | % | ||||||||||
| Total | 4,571 | 100.0 | % | 258 | 100.0 | % | 4,829 | 100.0 | % | ||||||||||||
Management Structure
Each of our stores is staffed with a store manager and one or more assistant managers, in addition to parts specialists, retail and/or installer service specialists and other positions required to meet the specific needs of each store. Each of our 474540 district managers has general supervisory responsibility for an average of ten10 stores, which provides our stores with a strong operational support.
Store and district managers complete a comprehensive training program to ensure each has a thorough understanding of customer service, leadership, inventory management and store profitability, as well as all other sales and operational aspects of our business model. Store and district managers are also required to complete a structured training program that is specific to their position, including attending a week-long manager development program at the corporate headquarters in Springfield, Missouri. Store and district managers also receive continuous training through online assignments,training, field workshops, regional meetings and our annual managers’leadership conference.
We provide financial incentives to all store Team Members through incentive compensation programs. Under our incentive compensation programs, base salary is augmented by incentive compensation based on individual and store sales and profitability. In addition, each of our district managers participates in our stock option and bonus programs, and store managers participate in bonus programs based on their store’s performance. We believe our incentive compensation programs significantly increase the motivation and overall performance of our store Team Members and enhance our ability to attract and retain qualified management and other personnel.
Professional Parts People
We believe our highly trained team of Professional Parts People is essential in providing superior customer service to both DIY and professional service provider customers. A significant portion of our business is from professional service provider customers; therefore, our Professional Parts People are required to be highly technically proficient in automotive products. In addition, we have found that the typical DIY customer often seeks assistance from Professional Parts People, particularly when purchasing hard parts. The ability of our Professional Parts People to provide such assistance to the DIY customer creates a favorable impression and is a significant factor in generating repeat DIY business.
We screen prospective Team Members to identify highly motivated individuals who either have experience with automotive parts or repairs, or automotive aptitude. New store Team Members go through a comprehensive orientation focused on the culture of our Company, as well as the requirements for their specific job position. Additionally, during their first year of employment, our parts specialists go through extensive automotive systems and product knowledge training to ensure they are able to provide high levels of service to our customers. Once all of the required training has been satisfied, our parts specialists become eligible to take the O’Reilly Certified Parts Professional test. Passing the O’Reilly test helps prepare them to become certified by the National Institute for Automotive Service Excellence (“ASE”).
All of our stores have the ability to service professional service provider customers. For this reason, select Team Members in each store complete extensive sales call training with a regional field sales manager. Afterward, theseThese Team Members then spend at least one day per week calling on existing and potential professional service provider customers. Additionally, each Team Member engaged in such sales activities participates in quarterly advanced training programs for sales and business development.
Distribution Systems
We believe that our tiered distribution model provides industry-leading parts availability and store in-stock positions, while lowering our inventory carrying costs by controlling the depth of our inventory. Moreover, we believe our ongoing, significant capital investments made in our DC network allowsallow us to efficiently service new stores that are planned to open in contiguous market areas as well as servicing our existing store network. Our distribution expansion strategy complements our new store opening strategy by supporting newly established clusters of stores, and additional penetration into existing markets, in the regions surrounding each DC.
Distribution Centers:
As of December 31, 2019, we operated 2728 domestic DCs comprised of approximately 10.611.4 million operating square feet (see the “Properties” table in Item 2 of this annual report on Form 10-K for a detailed listing ofmore information about DC operating square footages). Our DCs stock an average of 148,000159,000 SKUs and most DCs are linked to and have the ability to access multiple other regional DCs’ on-hand inventory.
9
Our DCs provide five-night-a-week delivery, primarily via a Company-owned fleet, to all of our stores in the continental United States. In addition, stores within an individual DC’s metropolitan area receive multiple daily deliveries from the DC’s “city counter,” mostmany of which receive this service seven days per week. Our DCs provide weekend service to not only the stores they service via their city counters but also to strategic Hub locations, which redistribute products to surrounding stores. Our national Hub store network provides additional service throughout the week, and on weekends, to surrounding stores.
As part of our continuing efforts to enhance our distribution network in 2017,2020, we plan to
| ● | continue to enhance our distribution network through the engineering, design, expansion or relocation of new or current DCs; |
| ● | continue to utilize routing software to continue to enhance logistics efficiencies; |
| ● | continue to implement labor management software to improve DC productivity and overall operating efficiency; |
| ● | continue to define and implement best practices in all DCs; and |
| ● | make proven, return-on-investment based capital enhancements to material handling equipment in DCs, including conveyor systems, picking modules, lift equipment and computer hardware. |
Hub stores:
We currently operate 312a total of 356 strategically located Hub stores. In addition to serving DIY and professional service provider customers in their markets, Hub stores also provide delivery service to our other stores within the surrounding area and access to an expanded selection of SKUs on a same-day basis. Our Hub storesstore network consists of 85 Super Hubs that average approximately 10,60015,700 square feet and carry an average of 45,00068,000 SKUs and 271 Hubs that average approximately 10,000 square feet and carry an average of 42,000 SKUs.
Products and Purchasing
Our stores offer DIY and professional service provider customers a wide selection of products for domestic and imported automobiles, vans and trucks. Our merchandise generally consists of nationally recognized, well-advertised, premium name brand products, such as AC Delco, Armor All, Bosch, BWD, Cardone, Castrol, Dorman, Fel-Pro, Gates Rubber, Lucas Oil, Mobil1, Monroe, Moog, Pennzoil, Prestone, Quaker State,Standard, STP, Turtle Wax, Valvoline, Wagner, and Wix, and a wide selection of quality proprietary private label products, which span the entire good, better and best value spectrum, under our BestTest®, BrakeBest®, Cartek®, Import Direct®, Master Pro®MasterPro®, Micro-Gard®MicroGard®, Murray®, Omnispark®, O’Reilly Auto Parts®, Precision®, Power Torque®, Super Start®, and Ultima® brands. Our proprietary private label products are produced by nationally recognizedrespected automotive manufacturers, meet or exceed original equipment manufacturer specifications and consist of house brands and nationally recognized proprietary bands, which we have acquired or developed over time. Our “good” houseproprietary brands provide a great combination of quality and value, a characteristic important to our DIY customers, while our proprietary national brands offer “better” and “best” proprietary brands offer options for our more heavy-duty DIY customers, as well as our professional service provider customers, who require highoften prefer higher quality products that can be relied upon to support and grow their businesses.
We have no long-term contracts with material purchase commitments with any of our suppliers, nor have we experienced difficulty in obtaining satisfactory alternative supply sources for automotive parts. We believe that alternative supply sources exist at competitive costs for substantially all of the automotive products that we sell. It is our policy to take advantage of payment and seasonal purchasing discounts offered by our suppliers and to utilize extended dating terms available from suppliers. We have entered into various programs and arrangements with certain suppliers that provided for extended dating and payment terms for inventory purchases. As a whole, we consider our relationships with our suppliers to be very good.
We purchase automotive products in substantial quantities from over 900735 suppliers, the five largest of which accounted for approximately 23%24% of our total purchases in 2016.2019. Our largest supplier in 20162019 accounted for approximately 6%7% of our total purchases and the next four largest suppliers each accounted for approximately 3% to 5%6% of our total purchases.
Marketing
Retail and Online Marketing:
Our integrated marketing program, which includes radio, direct mailstrategy and newspaper distribution,Omnichannel efforts include national media channels, in-store, online,digital, and social media promotions, and sports andactivation, as well as marketing the O’Reilly brand through automotive event sponsorships to aggressively attract DIY customers. The marketing strategy we employ is highly effective and has led to a measurable increase in awareness of the O’Reilly Brand across our geographic footprint. We utilize a combination of brand, product and price messaging to drive retail traffic and purchases, which frequently coincide with key sales events. We also utilize a problem-resolution communication strategy, which encourages vehicle owners to perform regular maintenance on their vehicles, protecting their long-term automotive investment and establishing O’Reilly as their partner for auto parts needs.
10
Professional Marketing:
To develop our website, and popular social media platforms are used to provide excellent customer service through interaction and dialoguecontinued relationships with our customers.
INDUSTRY ENVIRONMENT
The automotive aftermarket industry includes all products and services purchased for light and heavy-duty vehicles after the original sale. The total size of the automotive aftermarket is estimated to be approximately $268$297 billion, according to The Auto Care Association. This market is made up of four segments: labor share of professional service provider sales, auto parts share of professional service provider sales, DIY sales and tire sales. We estimate that O’Reilly’s addressable market within this industry is approximately $154$90 billion to $100 billion, which includes the auto parts share of professional service provider sales at wholesale and DIY sales.sales at retail. We do not sell tires or perform for-fee automotive repairs or installations.
Competition
The sale of automotive aftermarket items is highly competitive in many areas, including customer service, product availability, store location, brand recognition and price. We compete in both the DIY and professional service provider portions of the automotive aftermarket and are one of the largest specialty retailers within that market. We compete primarily with
| ● | national retail and wholesale automotive parts chains (such as AutoZone, Inc., Advance Auto Parts, CARQUEST, NAPA and the Pep Boys - Manny, Moe and Jack, Inc.); |
| ● | regional retail and wholesale automotive parts chains; |
| ● | wholesalers or jobber stores (some of which are associated with national automotive parts distributors or associations such as NAPA, CARQUEST, Bumper to Bumper and Auto Value); |
| ● | automobile dealers; and |
| ● | mass merchandisers and online retailers that carry automotive replacement parts, maintenance items and accessories (such as Wal-Mart Stores, Inc. and Amazon.com, Inc.). |
We compete on the basis of customer service, which includes merchandise selection and availability, technical proficiency and helpfulness of store personnel, price, store layout, continually enhancing the Omnichannel experience and convenient and accessible store locations. Our dual market strategy requires significant capital, such as the capital expenditures required for our distribution and store networks and working capital needed to maintain inventory levels necessary for providing products to both the DIY and professional service provider portions of the automotive aftermarket.
Inflation and Seasonality
We have been successful, in many cases, in reducing the effects of merchandise cost increases principally by taking advantage of supplier incentive programs, economies of scale resulting from increased volume of purchases and selective forward buying. To the extent our acquisition costs increase due to base commodity price increases industry wide, we have typically been able to pass along these increased costs through higher retail prices for the affected products. As a result, we do not believe our operations have been materially, adversely affected by inflation.
To some extent our business is seasonal, primarily as a result of the impact of weather conditions on customer buying patterns. Store sales, profits and inventory levels have historically been higher in the second and third quarters (April through September) than in the first and fourth quarters (October through March) of the year.
Regulations
We are subject to federal, state and local laws and governmental regulations relating to our business, including, but not limited to, those related to the handling, storage and disposal of hazardous substances, the recycling of batteries and used lubricants, and the ownership and operation of real property.
11
As part of our operations, we handle hazardous materials in the ordinary course of business and our customers may bring hazardous materials onto our property in connection with, for example, our oil and battery recycling programs. We currently provide a recycling program for batteries and the collection of used lubricants at certain stores as a service to our customers pursuant to agreements with third-party suppliers. The batteries and used lubricants are collected by our Team Members, deposited into supplier-provided containers and pallets, and then disposed ofrecycled by the third-party suppliers. In general, our agreements with such suppliers contain provisions that are designed to limit our potential liability under applicable environmental regulations for any damage or contamination, which may be caused by the batteries and lubricants to off-site properties (including as a result of waste disposal) and to our properties, when caused by the supplier.
Compliance with any such laws and regulations has not had a material adverse effect on our operations to date. However, we cannot give any assurance that we will not incur significant expenses in the future in order to comply with any such laws or regulations.
INFORMATION ABOUT OUR EXECUTIVE OFFICERS OF THE REGISTRANT
Gregory D. Johnson, age 56,54, Chief Executive Officer has been an O’Reilly Team Member for 32 years. Mr. Henslee’s O’Reilly career began as a Parts Specialist and progressed through the roles of Assistant Store Manager, District Manager, Computer Operations Manager, Director of Computer Operations and Loss Prevention, Vice President of Store Operations, Senior Vice President, President of Merchandise, Distribution, Information Systems and Loss Prevention, Chief Executive Officer and Co-President, and Chief Executive Officer and President. Mr. Henslee has held the position of Chief Executive Officer since 2005.
Jeff M. Shaw
, age
Brad Beckham, age 46,41, Executive Vice President of FinanceStore Operations and Sales, has been an O’Reilly Team Member for 23 years. Mr. Beckham’s primary areas of responsibility are Store Operations and Sales for O’Reilly’s Store Operations. Mr. Beckham’s O’Reilly career began as a Parts Specialist and progressed through the roles of Store Manager, District Manager, Regional Manager, Divisional Vice President, Vice President of Eastern Store Operations and Sales, Senior Vice President of Eastern Store Operations and Sales, and Senior Vice President of Central Store Operations. Mr. Beckham has held the position of Executive Vice President of Store Operations and Sales since 2018.
Tom McFall, age 49, Executive Vice President and Chief Financial Officer, has been an O’Reilly Team Member for 1013 years. Mr. McFall’s primary areas of responsibility are Finance, Accounting, Information Technology, Legal, and Risk Management. Mr. McFall’s career began with Ernst & Young LLP in Detroit, Michigan, where he achieved the position of Audit Manager, before accepting a position with Murray’s Discount Auto Stores (“Murray’s”). Mr. McFall served Murray’s for eight years through the roles
Jonathan Andrews, age 55,52, Senior Vice President of Professional Sales,Human Resources and Training, has been an O’Reilly Team Member for 34seven years. Mr. Bartholomew’sAndrews’s primary areaareas of responsibility is Professional Sales.are Human Resources and Training. Mr. Bartholomew’sAndrews has over 25 years of human resources experience. Mr. Andrews’s career includes human resource positions with Cargill, Inc., Tyson Foods, Inc. and AutoNation, Inc. Mr. Andrews served AutoNation for 10 years as Director of Human Resources and Senior Director of Human Resources. In 2012, Mr. Andrews joined O’Reilly career began as a Delivery SpecialistVice President of Human Resources and progressed through the rolesrole of Parts Specialist, Assistant Manager, Night Manager, Merchandising Set Up Crew Supervisor, Equipment Sales Manager, Regional Field Sales Manager, Director of Southern Division Sales, and Vice President of Professional Sales.Human Resources and Training. Mr. BartholomewAndrews has held the position of Senior Vice President of Professional SalesHuman Resources and Training since 2013.
Doug Bragg, age 38,50, Senior Vice President of Central Store Operations and Sales, has been an O’Reilly Team Member for 2029 years. Mr. Beckham’sBragg’s primary areas of responsibility are Store Operations and Sales for O’Reilly’sO’Reilly Central Store Operations. Mr. Beckham’sBragg’s O’Reilly career began as a Parts SpecialistDistribution Center Team Member and progressed through the roles of Assistant Store Manager, Store Manager, District Manager, Regional Manager, and Divisional Vice President, Vice President of Eastern Store Operations and Sales, and Senior Vice President of Eastern Store Operations and Sales.President. Mr. Beckham has been a Senior Vice President since 2014 andBragg has held the position of Senior Vice President of Central Store Operations and Sales since July of 2016.
12
Robert Dumas, age 57, Senior Vice President of Western Store Operations and Sales, has been an O’Reilly Team Member for 39 years. Mr. Childers’s primary areas of responsibility are Store Operations and Sales for O’Reilly’s Western Store operations. Mr. Childers’s career began as a Parts Specialist and progressed through the roles of Store Manager, District Manager, Regional Manager, Vice President of CSK Store Operations Integration, and Vice President of Western Store Operations and Sales. Mr. Childers has held the position of Senior Vice President of Western Store Operations and Sales since 2014.
Larry L. Ellis
,age
Jeremy A. Fletcher
Jeffrey L. Groves
, age
Brent Kirby, age 61,51, Senior Vice President of Inventory Management,Omnichannel, has been an O’Reilly Team Member for 43 years.since 2018. Mr. Johnson’sKirby’s primary areas of responsibility are Inventory Management, Purchasing, Logistics,Marketing, Advertising, Electronic Catalog, Customer Satisfaction and Store Design.Digital business areas while working cross functionally to deliver our Omnichannel strategy. Mr. Johnson’sKirby has over 30 years of experience in the retail industry. Prior to joining O’Reilly, Mr. Kirby held the position of Chief Supply Chain Officer for Lowe’s Companies, Inc. (“Lowe’s”), with direct responsibility for leading the global supply chain supporting Lowe’s U.S.-based home improvement business. In this role, Mr. Kirby was responsible for team members across a diverse network of distribution centers, manufacturing facilities, direct-to-consumer parcel operations and last mile delivery operations. Mr. Kirby began his retail career began as a Distribution Center Team Memberhardware associate with Lowe’s and progressed through various positions at the roles of Customer Service Manager, Inventory Control Manager, Director of Store Inventory Management,store, district and regional levels before being promoted to Senior Vice President of Store Inventory Management.Operations and later Chief Omnichannel Officer. In 2018, Mr. Johnson has held the position ofKirby joined O’Reilly as Senior Vice President of Inventory ManagementOmnichannel and has held this position since 2010.
Scott Kraus
, age
Jeffrey A. Lauro
, age
Jason Tarrant, age 45,39, Senior Vice President of Western Store Operations and Sales, has been an O’Reilly Team Member for 18 years, which includes continuous years of service with a company acquired by O’Reilly. Mr. Tarrant’s primary areas of responsibility are Store Operations and Sales for O’Reilly Western Store Operations. Mr. Tarrant’s O’Reilly career began as a Parts Specialist and progressed through the roles of Assistant Store Manager, Store Manager, District Manager, Regional Field Sales Manager, Regional Manager, and Divisional Vice President. Mr. Tarrant has held the position of Senior Vice President of Western Store Operations and Sales since 2018.
13
Darin Venosdel, age 49, Senior Vice President of Inventory Management, has been an O’Reilly Team Member for 22 years. Mr. Venosdel’s primary areas of responsibility are Inventory Management, Purchasing and Store Design. Mr. Venosdel’s O’Reilly career began as a Programmer/Analyst and progressed through the roles of Application Development Manager, Director of Application Development, Director of Inventory Management, and Vice President of Inventory Management. Mr. Venosdel has held the position of Senior Vice President of Inventory Management since 2018.
David Wilbanks, age 48, Senior Vice President of Merchandise, has been an O’Reilly Team Member since 2012.for seven years. Mr. Wilbanks’s primary areas of responsibility are Merchandise and Pricing. Mr. Wilbanks has over 2530 years of experience in the automotive aftermarket industry. Mr. Wilbanks’s career began as a counter technician for an independent jobber and progressed to becoming an ASE Certified Master Technician for an automotive dealership, before accepting a position with AutoZone, Inc. (“AutoZone”). Mr. Wilbanks served AutoZone for twelve years as a financial analyst, Category Manager, and Director of Merchandise. In 2012, Mr. Wilbanks joined O’Reilly as Vice President of Merchandise and has held the position of Senior Vice President of Merchandise since March of 2016.
SERVICE MARKS AND TRADEMARKS
We have registered, acquired and/or been assigned the following service marks and trademarks:trademarks in the United States: BENNETT AUTO SUPPLY®; BESTEST®; BETTER PARTS. BETTER PRICES.®; BETTER PARTS, BETTER PRICES....EVERYDAY!®; BOND AUTO PARTS®; BRAKEBEST®; BRAKEBEST HD®; CARTEK®; CARTEK PRO®; CERTIFIED AUTO REPAIR®; CHECKER AUTO PARTS®; CSK PROSHOP®; CUSTOMIZE YOUR RIDE®; CSK PROSHOP®DO IT RIGHT DEALS®; DO IT RIGHT REBATE®; DRIVE WITH THE LEADER!®; FIRST CALL®; FLEET & HEAVY DUTY PROFESSIONAL PARTS PEOPLE®; FRIENDLIEST PARTS STORE IN TOWN®; FROM OUR STORE TO YOUR DOOR®; HI-LO®; IMPORT DIRECT®; KRAGEN AUTO PARTS®; MASTER PRO®; MASTER PRO REFINISHING®; MASTERPRO SELECT®; MASTERPRO UNDERCAR®; MICROGARD®; MURRAY®; MURRAY CLIMATE CONTROL®; MURRAY TEMPERATURE CONTROL®; MURRAY’S MASCOT® (Design only); MURRAY PLUS®; MURRAY ULTRA®; MURRAY’S AUTO PARTS®; O LOW PRICE GUARANTEE! ®; O® (Shamrock inside of “O”); OMNISPARK®; O’REILLY®; O’REILLY AUTO COLOR PROFESSIONAL PAINT PEOPLE®; O’REILLY AUTO PARTS®; O’REILLY AUTO PARTS PROFESSIONAL PARTS PEOPLE®; O’REILLY AUTOMOTIVE®; O’REILLY O’REWARDS®; O’REILLY RACING®; O’REILLY SELECT®; O’REWARDS®; PARTNERSHIP NETWORK®; PARTS CITY®; PARTS CITY AUTO COLOR PROFESSIONAL PAINT PEOPLE®; PARTS CITY AUTO PARTS®; PARTS CITY TOOL BOX®; PARTS FOR YOUR CAR WHEREVER YOU ARE®; PARTS PAYOFF®; POWER TORQUE®; PRECISION®; PRECISION HUB ASSEMBLIES®; PRIORITY PARTS®; PROXONE®; QUIETECH®; REAL WORLD TRAINING®; SCHUCK’S®¡SIGUE ADELANTE CON O’REILLY!®; SERIOUS ABOUT YOUR CAR…SO ARE WE!®SCHUCK’S AUTO SUPPLY®; SUPER START®; TOOLBOX®; ULTIMA®; and ULTIMA®ULTIMA SELECT®. Some of the service marks and trademarks listed above may also have a design associated therewith. Each of the service marks and trademarks are in duration for as long as we continue to use and seek renewal of such marks –marks. The above list includes only the duration of each of thesetrademarks and service marks that are currently and validly registered with the United States Patent and Trademark Office. It does not include trademarks is typically between five and ten years per renewal.or service marks which may also be in use, but are not yet registered. We believe that our business is not otherwise dependent upon any patent, trademark, service mark or copyright.
Solely for convenience, our service marks and trademarks may appear in this report without the ® or ™ symbol, which is not intended to indicate that we will not assert, to the fullest extent under applicable law, our rights or the right to these service marks and trademarks.
AVAILABLE INFORMATION
Our Internet address is
Item 1A. Risk Factors
Our future performance is subject to a variety of risks and uncertainties. Although the risks described below are the risks that we believe are material, there may also be risks of which we are currently unaware, or that we currently regard as immaterial based upon the information available to us that later may prove to be material. Interested parties should be aware that the occurrence of the events described in these risk factors, elsewhere in this Form 10-K and in our other filings with the Securities and Exchange Commission could
14
have a material adverse effect on our business, operating results and financial condition. Actual results, therefore, may materially differ from anticipated results described in our forward-looking statements.
Deteriorating economic conditions may adversely impact demand for our products, reduce access to credit and cause our customers and others, with which we do business, to suffer financial hardship, all of which could adversely impact our business, results of operations, financial condition and cash flows.
Although demand for many of our products is primarily non-discretionary in nature and tend to be purchased by consumers out of necessity, rather than on an impulse basis, our sales are impacted by constraints on the economic health of our customers. The economic health of our customers is affected by many factors, including, among others, general business conditions, interest rates, inflation, consumer debt levels, the availability of consumer credit, currency exchange rates, taxation, fuel prices, unemployment levels and other matters that influence consumer confidence and spending.spending, such as a prolong public health crisis or epidemic (such as the coronavirus). Many of these factors are outside of our control. Our customers’ purchases, including purchases of our products, could decline during periods when income is lower, when prices increase in response to rising costs, or in periods of actual or perceived unfavorable economic conditions.conditions or political uncertainty. In addition, restrictions on access to telematics, diagnostic tools and repair information imposed by the original vehicle manufacturers or by governmental regulations may force vehicle owners to rely on dealers to perform maintenance and repairs. If any of these events occur, or if unfavorable economic conditions challenge the consumer environment, our business, results of operations, financial condition and cash flows could be adversely affected.
Overall demand for products sold in the automotive aftermarket is dependent upon many factors including the total number of vehicle miles driven in the U.S., the total number of registered vehicles in the U.S., the age and quality of these registered vehicles and the level of unemployment in the U.S. Adverse changes in these factors could lead to a decreased level of demand for our products, which could negatively impact our business, results of operations, financial condition and cash flows.
In addition, economic conditions, including decreased access to credit, may result in financial difficulties leading to restructurings, bankruptcies, liquidations and other unfavorable events for our customers, suppliers, logistics and other service providers and financial institutions that are counterparties to our credit facilities. Furthermore, the ability of these third parties to overcome these difficulties may increase. If third parties, on whom we rely for merchandise, are unable to overcome difficulties resulting from the deterioration in economic conditions, the cause of which could include a prolonged public health crisis or epidemic (such as the coronavirus), and provide us with the merchandise we need, or if counterparties to our credit facilities do not perform their obligations, our business, results of operations, financial condition and cash flows could be adversely affected.
The automotive aftermarket business is highly competitive, and we may have to risk our capital to remain competitive.
Both the do-it-yourself (“DIY”)DIY and professional service provider portions of our business are highly competitive, particularly in the more densely populated areas that we serve. Some of our competitors are larger than we are and have greater financial resources. In addition, some of our competitors are smaller than we are, but have a greater presence than we do in a particular market. Online and mobile platforms may allow customers to quickly compare prices and product assortments between us and a range of competitors, which could result in pricing pressure. Some online competitors may have a lower cost structure than we do, as a result of our strategy of providing an exceptional in-store experience and superior parts availability supported by our extensive store network and robust, regional distribution footprint, which could also create pricing pressure. We may have to expend more resources and risk additional capital to remain competitive.competitive, and our results of operations, financial condition and cash flows could be adversely affected. For a list of our principal competitors, see the “Competition” section of Item 1 of this annual report on Form 10-K.
We are sensitive to regional economic and weather conditions that could impact our costs and sales.
Our business is sensitive to national and regional economic and weather conditions, and natural disasters. Unusually inclement weather, such as significant rain, snow, sleet, freezing rain, flooding, seismic activity and hurricanes, has historically discouraged our customers from visiting our stores during the affected period and reduced our sales, particularly to DIY customers. Extreme weather conditions, such as extreme heat and extreme cold temperatures, may enhance demand for our products due to increased failure rates of our customers’ automotive parts, while temperate weather conditions may have a lesser impact on failure rates of automotive parts. In addition, our stores and distribution centers (“DCs”)DCs located in coastal regions may be subject to increased insurance claims resulting from regional weather conditions and our results of operations, financial condition and cash flows could be adversely affected.
We cannot assure future growth will be achieved.
We believe that our ability to open additional, profitable stores at a high growth rate will be a significant factor in achieving our growth objectives for the future. Our ability to accomplish our growth objectives is dependent, in part, on matters beyond our control, such as weather conditions, zoning, and other issues related to new store site development, the availability of qualified management personnel and general business and economic conditions. We cannot be sure that our growth plans for 20172020 and beyond will be achieved. Failure
15
to achieve our growth objectives may negatively impact the trading price of our common stock. For a discussion of our growth strategies, see the “Growth Strategy” section of Item 1 of this annual report on Form 10-K.
In order to be successful, we will need to retain and motivate key employees.
Our success has been largely dependent on the efforts of certain key personnel. In order to be successful, we will need to retain and motivate executives and other key employees. Experienced management and technical personnel are in high demand and competition for their talents is intense. We must also continue to motivate employees and keep them focused on our strategies and goals. Our business, results of operations and cash flows could be materially adversely affected by the unexpected loss of the services of one or more of our key employees. We cannot be sure that we will be able to continue to attract qualified personnel, which could cause us to be less efficient
A change in the relationship with any of our key suppliers, the unavailability of our key products at competitive prices or changes in trade policies could affect our financial health.
Our business depends on developing and maintaining close relationships with our suppliers and on our suppliers’ ability or willingness to sell quality products to us at favorable prices and terms. Many factors outside of our control may harm these relationships and the ability or willingness of these suppliers to sell us products on favorable terms. For example, financial or operational difficulties that our suppliers may face could increase the cost of the products we purchase from them or our ability to source productproducts from them. In addition, the trend toward consolidation among automotive parts suppliers, as well as the off-shoring of manufacturing capacity to foreign countries, may disrupt or end our relationship with some suppliers and could lead to less competition and result in higher prices. We could also be negatively impacted by suppliers who might experience work stoppages, labor strikes, a prolonged public health crisis or epidemic (such as the coronavirus) or other interruptions to, or difficulties in the, manufacture or supply of the products we purchase from them. Changes in U.S. trade policies, practices, tariffs or taxes could affect our ability and our suppliers’ ability to source product at current volumes and/or prices.
Risks associated with future acquisitions may not lead to expected growth and could result in increased costs and inefficiencies.
We expect to continue to make acquisitions as an element of our growth strategy. Acquisitions involve certain risks that could cause our actual growth and profitability to differ from our expectations, examplesexpectations. Examples of such risks include the following:
| ● | We may not be able to continue to identify suitable acquisition targets or to acquire additional companies at favorable prices or on other favorable terms. |
| ● | Our management’s attention may be distracted. |
| ● | We may fail to retain key personnel from acquired businesses. |
| ● | We may assume unanticipated legal liabilities and other problems. |
| ● | We may not be able to successfully integrate the operations (accounting and billing functions, for example) of businesses we acquire to realize economic, operational and other benefits. |
| ● | We may fail, or be unable to, discover liabilities of businesses that we acquire for which we or the subsequent owner or operator may be liable. |
Business interruptions in our distribution centers or other facilities may affect our store hours, operability of our computer systems, and/or availability and distribution of merchandise, which may affect our business.
Weather, terrorist activities, war or other disasters, or the threat of them, may result in the closure of one or more of our DCs or other facilities, or may adversely affect our ability to deliver inventory to our stores on a nightly basis. This may affect our ability to timely provide products to our customers, resulting in lost sales or a potential loss of customer loyalty. Some of our merchandise is imported from other countries and these goods could become difficult or impossible to bring into the United States, and we may not be able to obtain such merchandise from other sources at similar prices. Such a disruption in revenue could potentially have a negative impact on our results of operations, financial condition and cash flows.
We rely extensively on our computer systems to manage inventory, process transactions and timely provide products to our customers. Our systems are subject to damage or interruption from power outages, telecommunications failures, computer viruses, security breaches or other catastrophic events. If our systems are damaged or fail to function properly, we may experience loss of critical data and interruptions or delays in our ability to manage inventories or process customer transactions. Such a disruption of our systems could negatively impact revenue and potentially have a negative impact on our results of operations, financial condition and cash flows.
16
Failure to achieve and maintain a high level of product and service quality may reduce our brand value and negatively impact our business.
We believe our Company has built an excellent reputation as a leading retailer in the automotive aftermarket industry. We believe our continued success depends, in part, on our ability to preserve, grow and leverage the value of our brand. Brand value is based, in large part, on perceptions of subjective qualities and even isolated incidents can erode trust and confidence, particularly if they result in adverse publicity, governmental investigations or litigation, which can negatively impact these perceptions and lead to adverse effects on our business or Team Members.
Risks related to us and unanticipated fluctuations in our quarterly operating results could affect our stock price.
We believe that quarter-to-quarter comparisons of our financial results are not necessarily meaningful indicators of our future operating results and should not be relied on as an indication of future performance. If our quarterly operating results fail to meet the expectations of analysts, the trading price of our common stock could be negatively affected. We cannot be certain that our growth plans and business strategies will be successful or that they will successfully meet the expectations of these analysts. If we fail to adequately address any of these risks or difficulties, our stock price would likely suffer.
The market price of our common stock may be volatile and could expose us to securities class action litigation.
The stock market and the price of our common stock may be subject to wide fluctuations based upon general economic and market conditions. The market price of our common stock may also be affected by our ability to meet analysts’ expectations and failure to meet such expectations, even slightly, could have an adverse effect on the market price of our common stock.
In addition, stock market volatility has had a significant effect on the market prices of securities issued by many companies for reasons unrelated to the operating performance of these companies. Downturns in the stock market may cause the price of our common stock to decline. In the past, following periods of volatility in the market price of a company’s securities, securities class action litigation has often been institutedinitiated against such companies. If similar litigation were institutedinitiated against us, it could result in substantial costs and a diversion of our management’s attention and resources, which could have an adverse effect on our business.
Our increased debt levels could adversely affect our cash flow and prevent us from fulfilling our obligations.
We have an unsecured revolving credit facility and unsecured senior notes, which could have important consequences to our financial health. For example, our level of indebtedness could, among other things,
| ● | make it more difficult to satisfy our financial obligations, including those relating to the senior unsecured notes and our credit facility; |
| ● | increase our vulnerability to adverse economic and industry conditions; |
| ● | limit our flexibility in planning for, or reacting to, changes and opportunities in our industry, which may place us at a competitive disadvantage; |
| ● | require us to dedicate a substantial portion of our cash flows to service the principal and interest on the debt, reducing the funds available for other business purposes, such as working capital, capital expenditures or other cash requirements; |
| ● | limit our ability to incur additional debt with acceptable terms, if at all; and |
| ● | expose us to fluctuations in interest rates, including changes that may result from the implementation of new benchmark rates that replace LIBOR. |
In addition, the terms of our financing obligations include restrictions, such as affirmative, negative and financial covenants, conditions on borrowing and subsidiary guarantees. A failure to comply with these restrictions could result in a default under our financing obligations or could require us to obtain waivers from our lenders for failure to comply with these restrictions. The occurrence of a default that remains uncured or the inability to secure a necessary consent or waiver could have a material adverse effect on our business, financial condition, results of operations and cash flows.
A downgrade in our credit rating would impact our cost of capital and could impact the market value of our unsecured senior notes, as well as limit our access to attractive supplier financing programs.
Credit ratings are an important component of our cost of capital. These ratings are based upon, among other factors, our financial strength. Our current credit ratings provide us with the ability to borrow funds at favorable rates. A downgrade in our current credit rating from either rating agency could adversely affect our cost of capital by causing us to pay a higher interest rate on borrowed funds under our unsecured revolving credit facility and a higher facility fee on commitments under our unsecured revolving credit facility. A downgrade in our current credit rating could also adversely affect the market price and/or liquidity of our unsecured senior notes, preventing a holder from selling the unsecured senior notes at a favorable price, as well as adversely affect our ability to issue new notes in the future. In addition, a downgrade in our current credit rating could limit the financial institutions willing to commit funds to our
17
supplier financing programs at attractive rates. Decreased participation in our supplier financing programs would lead to an increase in working capital needed to operate the business, adversely affecting our cash flows.
A breach of customer, supplier, Team Member or Company information could damage our reputation or result in substantial additional costs or possible litigation.
Our business involves the storage of personal information about our customers, suppliers, Team Members and Team Members.the Company, some of which is entrusted to third-party service providers and vendors. We and our third-party service providers and vendors have taken reasonable and appropriate steps to protect this information; however, ifthese security measures may be breached due to cyber-attacks, Team Member error, system compromises, fraud, hacking or other intentional or unintentional acts, which could result in unauthorized parties gaining access to such information. The methods used to obtain unauthorized access are constantly evolving and may be difficult to anticipate or detect for long periods of time. If we experience a significant data security breach, we could be exposed to damage to our reputation, additional costs, lost sales, litigation or possible regulatory action. TheIn addition, the regulatory environment related to information security and privacy is constantly evolving, and compliance with those requirements could result in additional costs. There is no guarantee that the procedures that we and our third-party service providers and vendors have implemented to protect against unauthorized access to secured data are adequate to safeguard against all data security breaches, and such a breach could potentially have a negative impact on our results of operations, financial condition and cash flows.
Litigation, governmental proceedings, environmental legislation and regulations and employment legislation and regulations and healthcare reform legislation may affect our business, financial condition, results of operations and cash flows.
We are, and in the future may become, involved in lawsuits, regulatory inquiries, and governmental and other legal proceedings, arising out of the ordinary course of our business. The damages sought against us in some of these litigation proceedings may be material and may adversely affect our business, results of operations, financial condition and cash flows.
Environmental legislation and regulations, like the initiatives to limit greenhouse gas emissions and bills related to climate change, could adversely impact all industries. While it is uncertain whether these initiatives will become law, additional climate change related mandates could potentially be forthcoming and these matters, if enacted, could adversely impact our costs, by, among other things, increasing fuel prices.
Our business is subject to employment legislation and regulations, including requirements related to minimum wage. Our success depends, in part, on our ability to manage operating costs and identify opportunities to reduce costs. Our ability to meet labor needs, while controlling costs is subject to external factors, such as minimum wage legislation. A violation of, or change in, employment legislation and/or regulations could hinder our ability to control costs, which could have a material adverse effect on our business, results of operations, financial condition and cash flows.
Risks associated with international operations could result in additional costs and Affordable Care Act, as well as other healthcare reform legislation consideredinefficiencies.
In addition to many of the risks we face in our U.S. operations, international operations present a unique set of risks and challenges, including local laws and customs, U.S. laws applicable to foreign operations, and political and socio-economic conditions. Our ability to operate effectively and grow in international markets could be impacted by Congress and state legislatures, significantly impacts our healthcare cost structure and increases our healthcare-related expenses. We continue to evaluate potentialthese risks resulting in legal liabilities, additional impacts the healthcare reform legislation will have on our businesscosts, and the steps necessary to mitigatedistraction of management’s attention. Compliance with the Foreign Corrupt Practices Act and protection of intellectual property rights surrounding items such impacts. If we cannot effectively mitigateas tradenames and trademarks in foreign jurisdictions can pose significant challenges.
In addition, our operations in international markets are conducted primarily in the potential additional impactslocal currency of those countries. Given that our Consolidated Financial Statements are denominated in U.S. dollars, amounts of assets, liabilities, net sales, and other revenues and expenses denominated in local currencies must be translated into U.S. dollars using exchange rates for the healthcare reform legislation,current period. As a result, foreign currency exchange rates and fluctuations in those rates may adversely impact our results of operations, financial condition and cash flows may be adversely impacted.
None.
Stores, distribution centers stores, and other properties
Of the 4,8295,460 stores that we operated at December 31, 2016, 1,9122019, 2,235 stores were owned, 2,8423,151 stores were leased from unaffiliated parties, 21 of which were located in Mexico, and 7574 stores were leased from entities in which certainthat include one or more of our affiliated directors or members of our affiliated director’stheir immediate family, and an executive officer of the Company are affiliated.family. Leases with unaffiliated parties generally provide for payment of a fixed base rent, payment of certain tax, insurance and maintenance expenses and an original term of, at a minimum, 10 years, subject to one or more renewals at our
18
option. We have entered into separate master lease agreements with each of the affiliated entities for the occupancy of the stores covered thereby. Such master lease agreements with sixtwo of the seven affiliated entities have been modified to extend the term of the lease agreement for specific stores. The master lease agreements or modifications thereto expire on dates ranging from MarchJuly 31, 2018,2020, to September 30, 2031. We believe that the lease agreements with the affiliated entities are on terms comparable to those obtainable from third parties.
The following table provides information regarding our U.S. domestic regional DCs in operation as of December 31, 2019:
| | | | | | |
| | | | |
| Operating Square Footage (1) |
Principal Use | | Nature of Occupancy | | Number of Locations | | (in thousands) |
Distribution center | | Owned | | 20 |
| 8,595 |
Distribution center | | Leased (2) | | 8 |
| 2,799 |
Total | | | | 28 |
| 11,394 |
| (1) | DC operating square footage includes floor and mezzanine operating square footage and excludes subleased square footage. |
| (2) | Terms expiring on dates ranging from March 31, 2022, to June 30, 2035. |
In addition, we acquired six small distribution centers in Mexico from the Mayasa acquisition; these distribution centers do not serve U.S. stores and are immaterial in the aggregate. We have two distribution system expansion projects under construction in the Nashville and Memphis, Tennessee, markets, both of which are expected to be completed in 2020. With the completion of our new Nashville area DC, two of our smaller, existing Tennessee DCs will cease being used as distribution facilities.
We believe that our present facilities are in good condition, are adequately insured and are adequate for the conduct of our current operations. The store servicing capability of our 2728 existing U.S. DCs is approximately 5,5006,135 stores, providing a growth capacity of more than 650 stores.695 U.S. stores, which will increase by approximately 190 stores with the completion of our two Tennessee market area DCs in 2020. We believe the growth capacity in our 27 existingDCs, along with the additional capacity of our new Nashville and Memphis, Tennessee, markets DCs, will provide us with the DC infrastructure needed for near-term expansion. However, as we expand our geographic footprint, we will continue to evaluate our existing distribution system infrastructure and will adjust our distribution system capacity as needed to support our future growth.
Our corporate office operations occur primarily in Springfield, Missouri, and as of December 31, 2019, the total square footage was 0.6 million square feet, substantially all of which was owned.
We also own or lease other properties that are not material in the aggregate.
Item 3. Legal Proceedings
The Company is currently involved in litigation incidental to the ordinary conduct of the Company’s business. The Company records reservesaccrues for litigation losses in instances where a material adverse outcome is probable and the Company is able to reasonably estimate the probable loss. The Company reservesaccrues for an estimate of material legal costs to be incurred in pending litigation matters. Although the Company cannot ascertain the amount of liability that it may incur from any of these matters, it does not currently believe that, in the aggregate, these matters, taking into account applicable insurance and reserves,accruals, will have a material adverse effect on its consolidated financial position, results of operations or cash flows in a particular quarter or annual period.
Item 4. Mine Safety Disclosures
19
PART II
Item 5. Market Forfor Registrant’s Common Equity, Related Stockholder Matters and Issuer Purchases of Equity Securities
Common stock:
Shares of O’Reilly Automotive, Inc. (the “Company”)the Company’s common stock are traded on The NASDAQ Global Select Market (“Nasdaq”) under the symbol “ORLY.” The Company’s common stock began trading on April 22, 1993; no cash dividends have been declared since that time, and the Company does not anticipate paying any cash dividends in the foreseeable future.
As of February 21, 2017,14, 2020, the Company had approximately 238,000392,000 shareholders of common stock based on the number of holders of record and an estimate of individual participants represented by security position listings.
| 2016 | 2015 | ||||||||||||||
| High | Low | High | Low | ||||||||||||
| First Quarter | $ | 276.64 | $ | 232.16 | $ | 219.38 | $ | 179.96 | |||||||
| Second Quarter | 277.82 | 253.32 | 232.41 | 214.05 | |||||||||||
| Third Quarter | 290.63 | 271.33 | 256.47 | 230.82 | |||||||||||
| Fourth Quarter | 285.53 | 253.00 | 276.26 | 247.29 | |||||||||||
| For the Year | $ | 290.63 | $ | 232.16 | $ | 276.26 | $ | 179.96 | |||||||
Sales of unregistered securities:
There were no sales of unregistered securities during the year ended December 31, 2016.
Issuer purchases of equity securities:
The following table identifies all repurchases during the fourth quarter ended December 31, 2016,2019, of any of the Company’s securities registered under Section 12 of the Securities Exchange Act of 1934, as amended, by or on behalf of the Company or any affiliated purchaser (in thousands, except per share data):
| | | | | | | | | | |
|
| |
| | |
| Total Number of |
| Maximum Dollar Value | |
| | Total | | Average | | Shares Purchased as | | of Shares that May Yet | ||
| | Number of | | Price Paid | | Part of Publicly | | Be Purchased Under the | ||
Period | | Shares Purchased | | per Share | | Announced Programs | | Programs (1) | ||
October 1, 2019, to October 31, 2019 |
| 88 | | $ | 393.84 |
| 88 | | $ | 658,656 |
November 1, 2019, to November 30, 2019 |
| 61 | |
| 441.75 |
| 61 | |
| 631,663 |
December 1, 2019, to December 31, 2019 |
| 143 | |
| 441.93 |
| 143 | | $ | 568,684 |
Total as of December 31, 2019 |
| 292 | | $ | 427.33 |
| 292 | |
|
|
| Period | Total Number of Shares Purchased | Average Price Paid per Share | Total Number of Shares Purchased as Part of Publicly Announced Programs | Maximum Dollar Value of Shares that May Yet Be Purchased Under the Programs (1) | ||||||||||
| October 1, 2016, to October 31, 2016 | 288 | $ | 276.77 | 288 | $ | 603,610 | ||||||||
| November 1, 2016, to November 30, 2016 | 1,265 | 264.44 | 1,265 | 1,019,107 | ||||||||||
| December 1, 2016, to December 31, 2016 | 472 | 278.40 | 472 | $ | 887,826 | |||||||||
| Total as of December 31, 2016 | 2,025 | $ | 269.45 | 2,025 | ||||||||||
| (1) | |
| Under the Company’s share repurchase program, as approved by its Board of Directors on January 11, 2011, the Company may, from time to time, repurchase shares of its common stock, solely through open market purchases effected through a broker dealer at prevailing market prices, based on a variety of factors such as price, corporate trading policy requirements and overall market conditions not to exceed a dollar limit authorized by the Board of Directors. The Company’s Board of Directors may increase or otherwise modify, renew, suspend or terminate the share repurchase program at any time, without prior notice. As announced on May 31, 2019, and February |
The Company repurchased a total of 5.73.9 million shares of its common stock under its publicly announced share repurchase program during the year ended December 31, 2016,2019, at an average price per share of $264.21,$369.55, for a total investment of $1.5$1.4 billion. Subsequent to the end of the year and through February 28, 2017,2020, the Company repurchased an additional 1.40.9 million shares of its common stock, at an average price per share of $267.32,$400.78, for a total investment of $387.5$363.4 million. The Company has repurchased a total of 58.477.1 million shares of its common stock under its share repurchase program since the inception of the program in January of 2011 and through February 28, 2017,2020, at an average price of $124.14,$162.72, for a total aggregate investment of $7.2$12.5 billion.
20
Stock performance graph:
The graph below shows the cumulative total shareholder return assuming the investment of $100, on December 31, 2011,2014, and the reinvestment of dividends thereafter, if any, in the Company’s common stock versus the Standard and Poor’s S&P 500 Retail Index (“S&P 500 Retail Index”) and the Standard and Poor’s S&P 500 Index (“S&P 500”).
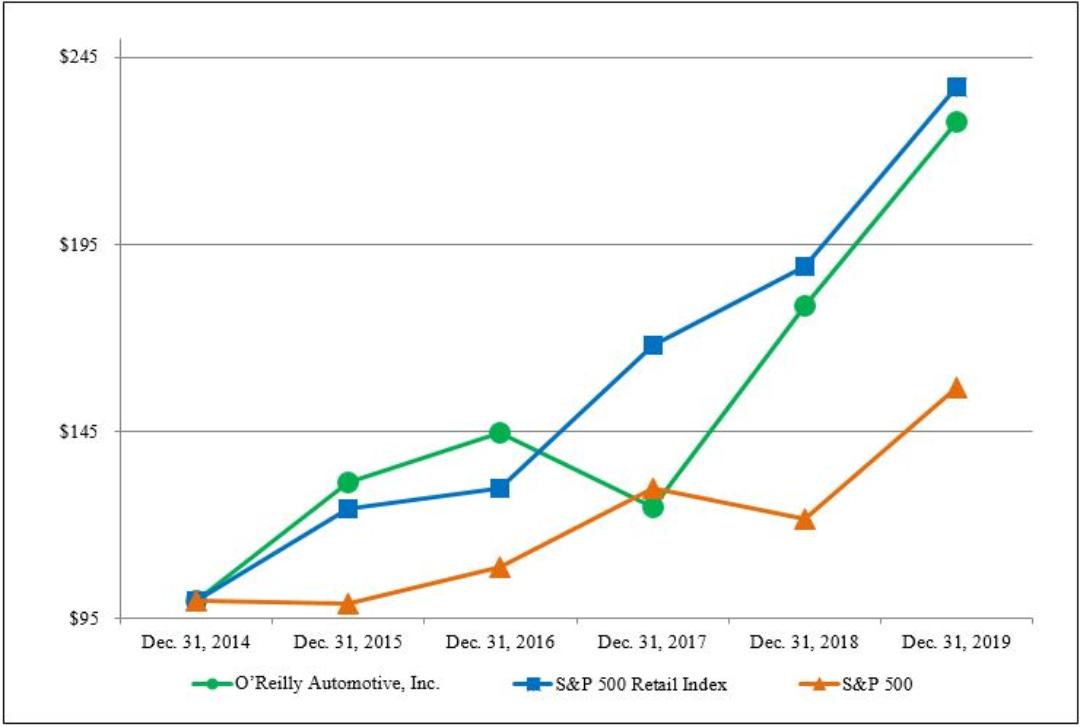
| | | | | | | | | | | | | | | | | | |
| | December 31, | ||||||||||||||||
Company/Index |
| 2014 |
| 2015 |
| 2016 |
| 2017 |
| 2018 |
| 2019 | ||||||
O’Reilly Automotive, Inc. | | $ | 100 | | $ | 132 | | $ | 145 | | $ | 125 | | $ | 179 | | $ | 228 |
S&P 500 Retail Index | |
| 100 | |
| 124 | |
| 130 | |
| 168 | |
| 189 | |
| 237 |
S&P 500 | | $ | 100 | | $ | 99 | | $ | 109 | | $ | 130 | | $ | 122 | | $ | 157 |
21

| December 31, | ||||||||||||||||||||||||
| Company/Index | 2011 | 2012 | 2013 | 2014 | 2015 | 2016 | ||||||||||||||||||
| O’Reilly Automotive, Inc. | $ | 100 | $ | 112 | $ | 161 | $ | 241 | $ | 317 | $ | 348 | ||||||||||||
| S&P 500 Retail Index | 100 | 125 | 180 | 197 | 245 | 257 | ||||||||||||||||||
| S&P 500 | $ | 100 | $ | 113 | $ | 147 | $ | 164 | $ | 163 | $ | 178 | ||||||||||||
Item 6. Selected Financial Data
The table below compares O’Reilly Automotive, Inc.’s (the “Company”)the “Company’s selected financial data over a ten-year period.period:
| | | | | | | | | | | | | | | | | | | | | |
Years ended December 31, |
| 2019 | 2018 | 2017 | 2016 | 2015 | 2014 | 2013 | 2012 | 2011 | 2010 | ||||||||||
(In thousands, except per share, Team Members, stores and ratio data) |
|
|
|
|
|
|
|
|
|
|
| ||||||||||
| | | | | | | | | | | | | | | | | | | | | |
INCOME STATEMENT DATA: |
|
|
|
|
|
|
|
|
|
|
| ||||||||||
| | | | | | | | | | | | | | | | | | | | | |
Sales ($) |
| 10,149,985 | 9,536,428 | 8,977,726 | 8,593,096 | 7,966,674 | 7,216,081 | 6,649,237 | 6,182,184 | 5,788,816 | 5,397,525 | ||||||||||
Cost of goods sold, including warehouse and distribution expenses |
| 4,755,294 | 4,496,462 | 4,257,043 | 4,084,085 | 3,804,031 | 3,507,180 | 3,280,236 | 3,084,766 | 2,951,467 | 2,776,533 | ||||||||||
Gross profit |
| 5,394,691 | 5,039,966 | 4,720,683 | 4,509,011 | 4,162,643 | 3,708,901 | 3,369,001 | 3,097,418 | 2,837,349 | 2,620,992 | ||||||||||
Selling, general and administrative expenses |
| 3,473,965 | 3,224,782 | 2,995,283 | 2,809,805 | 2,648,622 | 2,438,527 | 2,265,516 | 2,120,025 | 1,973,381 | 1,887,316 | ||||||||||
Former CSK officer clawback |
| — | — | — | — | — | — | — | — | (2,798) | — | ||||||||||
Legacy CSK Department of Justice investigation charge |
| — | — | — | — | — | — | — | — | — | 20,900 | ||||||||||
Operating income |
| 1,920,726 | 1,815,184 | 1,725,400 | 1,699,206 | 1,514,021 | 1,270,374 | 1,103,485 | 977,393 | 866,766 | 712,776 | ||||||||||
Write-off of asset-based revolving credit agreement debt issuance costs |
| — | — | — | — | — | — | — | — | (21,626) | — | ||||||||||
Termination of interest rate swap agreements |
| — | — | — | — | — | — | — | — | (4,237) | — | ||||||||||
Gain on settlement of note receivable |
| — | — | — | — | — | — | — | — | — | 11,639 | ||||||||||
Other income (expense), net |
| (130,397) | (121,097) | (87,596) | (62,015) | (53,655) | (48,192) | (44,543) | (35,872) | (25,130) | (35,042) | ||||||||||
Total other income (expense) |
| (130,397) | (121,097) | (87,596) | (62,015) | (53,655) | (48,192) | (44,543) | (35,872) | (50,993) | (23,403) | ||||||||||
Income before income taxes |
| 1,790,329 | 1,694,087 | 1,637,804 | 1,637,191 | 1,460,366 | 1,222,182 | 1,058,942 | 941,521 | 815,773 | 689,373 | ||||||||||
Provision for income taxes (a)(b) |
| 399,287 | 369,600 | 504,000 | 599,500 | 529,150 | 444,000 | 388,650 | 355,775 | 308,100 | 270,000 | ||||||||||
Net income ($) (a)(b) |
| 1,391,042 | 1,324,487 | 1,133,804 | 1,037,691 | 931,216 | 778,182 | 670,292 | 585,746 | 507,673 | 419,373 | ||||||||||
| | | | | | | | | | | | | | | | | | | | | |
Basic earnings per common share: |
|
|
|
|
|
|
|
|
|
|
| ||||||||||
Earnings per share – basic ($) |
| 18.07 | 16.27 | 12.82 | 10.87 | 9.32 | 7.46 | 6.14 | 4.83 | 3.77 | 3.02 | ||||||||||
Weighted-average common shares outstanding – basic |
| 76,985 | 81,406 | 88,426 | 95,447 | 99,965 | 104,262 | 109,244 | 121,182 | 134,667 | 138,654 | ||||||||||
| | | | | | | | | | | | | | | | | | | | | |
Earnings per common share -assuming dilution: (a)(b) |
|
|
|
|
|
|
|
|
|
|
| ||||||||||
Earnings per share – assuming dilution ($) |
| 17.88 | 16.10 | 12.67 | 10.73 | 9.17 | 7.34 | 6.03 | 4.75 | 3.71 | 2.95 | ||||||||||
Weighted-average common shares outstanding – assuming dilution |
| 77,788 | 82,280 | 89,502 | 96,720 | 101,514 | 106,041 | 111,101 | 123,314 | 136,983 | 141,992 | ||||||||||
| | | | | | | | | | | | | | | | | | | | | |
SELECTED OPERATING DATA: |
|
|
|
|
|
|
|
|
|
|
| ||||||||||
| | | | | | | | | | | | | | | | | | | | | |
Number of Team Members at year end (c) |
| 81,223 | 78,882 | 75,552 | 74,580 | 71,621 | 67,569 | 61,909 | 53,063 | 49,324 | 46,858 | ||||||||||
Total number of stores at year end (d)(e) |
| 5,460 | 5,219 | 5,019 | 4,829 | 4,571 | 4,366 | 4,166 | 3,976 | 3,740 | 3,570 | ||||||||||
Number of U.S. stores at year end (d) | | 5,439 | 5,219 | 5,019 | 4,829 | 4,571 | 4,366 | 4,166 | 3,976 | 3,740 | 3,570 | ||||||||||
Number of Mexico stores at year end (e) | | 21 | — | — | — | — | — | — | — | — | — | ||||||||||
Store square footage at year end (c)(f) | | 40,227 | 38,455 | 36,685 | 35,123 | 33,148 | 31,591 | 30,077 | 28,628 | 26,530 | 25,315 | ||||||||||
Sales per weighted-average store ($) (c)(g) |
| 1,881 | 1,842 | 1,807 | 1,826 | 1,769 | 1,678 | 1,614 | 1,590 | 1,566 | 1,527 | ||||||||||
Sales per weighted-average square foot ($) (c)(f)(h) |
| 255 | 251 | 248 | 251 | 244 | 232 | 224 | 224 | 221 | 216 | ||||||||||
Percentage increase in comparable store sales (c)(i) |
| 4.0 | % | 3.8 | % | 1.4 | % | 4.8 | % | 7.5 | % | 6.0 | % | 4.6 | % | 3.5 | % | 4.6 | % | 8.8 | % |
22
| Years ended December 31, | 2016 | 2015 | 2014 | 2013 | 2012 | 2011 | 2010 | 2009 | 2008 | 2007 | ||||||||||
| (In thousands, except per share, Team Members, stores and ratio data) | ||||||||||||||||||||
| INCOME STATEMENT DATA: | ||||||||||||||||||||
| Sales ($) | 8,593,096 | 7,966,674 | 7,216,081 | 6,649,237 | 6,182,184 | 5,788,816 | 5,397,525 | 4,847,062 | 3,576,553 | 2,522,319 | ||||||||||
| Cost of goods sold, including warehouse and distribution expenses | 4,084,085 | 3,804,031 | 3,507,180 | 3,280,236 | 3,084,766 | 2,951,467 | 2,776,533 | 2,520,534 | 1,948,627 | 1,401,859 | ||||||||||
| Gross profit | 4,509,011 | 4,162,643 | 3,708,901 | 3,369,001 | 3,097,418 | 2,837,349 | 2,620,992 | 2,326,528 | 1,627,926 | 1,120,460 | ||||||||||
| Selling, general and administrative expenses | 2,809,805 | 2,648,622 | 2,438,527 | 2,265,516 | 2,120,025 | 1,973,381 | 1,887,316 | 1,788,909 | 1,292,309 | 815,309 | ||||||||||
| Former CSK officer clawback | — | — | — | — | — | (2,798 | ) | — | — | — | — | |||||||||
| Legacy CSK Department of Justice investigation charge | — | — | — | — | — | — | 20,900 | — | — | — | ||||||||||
| Operating income | 1,699,206 | 1,514,021 | 1,270,374 | 1,103,485 | 977,393 | 866,766 | 712,776 | 537,619 | 335,617 | 305,151 | ||||||||||
| Write-off of asset-based revolving credit agreement debt issuance costs | — | — | — | — | — | (21,626 | ) | — | — | — | — | |||||||||
| Termination of interest rate swap agreements | — | — | — | — | — | (4,237 | ) | — | — | — | — | |||||||||
| Gain on settlement of note receivable | — | — | — | — | — | — | 11,639 | — | — | — | ||||||||||
| Other income (expense), net | (62,015 | ) | (53,655 | ) | (48,192 | ) | (44,543 | ) | (35,872 | ) | (25,130 | ) | (35,042 | ) | (40,721 | ) | (33,085 | ) | 2,337 | |
| Total other income (expense) | (62,015 | ) | (53,655 | ) | (48,192 | ) | (44,543 | ) | (35,872 | ) | (50,993 | ) | (23,403 | ) | (40,721 | ) | (33,085 | ) | 2,337 | |
| Income before income taxes | 1,637,191 | 1,460,366 | 1,222,182 | 1,058,942 | 941,521 | 815,773 | 689,373 | 496,898 | 302,532 | 307,488 | ||||||||||
| Provision for income taxes | 599,500 | 529,150 | 444,000 | 388,650 | 355,775 | 308,100 | 270,000 | 189,400 | 116,300 | 113,500 | ||||||||||
| Net income ($) | 1,037,691 | 931,216 | 778,182 | 670,292 | 585,746 | 507,673 | 419,373 | 307,498 | 186,232 | 193,988 | ||||||||||
| Basic earnings per common share: | ||||||||||||||||||||
| Earnings per share – basic ($) | 10.87 | 9.32 | 7.46 | 6.14 | 4.83 | 3.77 | 3.02 | 2.26 | 1.50 | 1.69 | ||||||||||
| Weighted-average common shares outstanding – basic | 95,447 | 99,965 | 104,262 | 109,244 | 121,182 | 134,667 | 138,654 | 136,230 | 124,526 | 114,667 | ||||||||||
| Earnings per common share -assuming dilution: | ||||||||||||||||||||
| Earnings per share – assuming dilution ($) | 10.73 | 9.17 | 7.34 | 6.03 | 4.75 | 3.71 | 2.95 | 2.23 | 1.48 | 1.67 | ||||||||||
| Weighted-average common shares outstanding – assuming dilution | 96,720 | 101,514 | 106,041 | 111,101 | 123,314 | 136,983 | 141,992 | 137,882 | 125,413 | 116,080 | ||||||||||
| SELECTED OPERATING DATA: | ||||||||||||||||||||
| Number of Team Members at year end | 74,580 | 71,621 | 67,569 | 61,909 | 53,063 | 49,324 | 46,858 | 44,880 | 40,735 | 23,576 | ||||||||||
| Number of stores at year end (a) | 4,829 | 4,571 | 4,366 | 4,166 | 3,976 | 3,740 | 3,570 | 3,421 | 3,285 | 1,830 | ||||||||||
| Total store square footage at year end (b) | 35,123 | 33,148 | 31,591 | 30,077 | 28,628 | 26,530 | 25,315 | 24,200 | 23,205 | 12,439 | ||||||||||
| Sales per weighted-average store (c)($) | 1,826 | 1,769 | 1,678 | 1,614 | 1,590 | 1,566 | 1,527 | 1,424 | 1,379 | 1,430 | ||||||||||
| Sales per weighted-average square foot (b)(d)($) | 251 | 244 | 232 | 224 | 224 | 221 | 216 | 202 | 201 | 212 | ||||||||||
| Percentage increase in comparable store sales (e)(f) | 4.8 | % | 7.5 | % | 6.0 | % | 4.6 | % | 3.5 | % | 4.6 | % | 8.8 | % | 4.8 | % | 1.3 | % | 3.7 | % |
| Years ended December 31, | 2016 | 2015 | 2014 | 2013 | 2012 | 2011 | 2010 | 2009 | 2008 | 2007 | ||||||||||
| (In thousands, except per share, Team Members, stores and ratio data) | ||||||||||||||||||||
| BALANCE SHEET DATA: | ||||||||||||||||||||
| Working capital (g)($) | (142,674 | ) | (36,372 | ) | 252,082 | 430,832 | 478,093 | 1,028,330 | 1,029,861 | 900,857 | 749,276 | 573,328 | ||||||||
| Total assets (g)($) | 7,204,189 | 6,676,684 | 6,532,083 | 6,057,895 | 5,741,241 | 5,494,174 | 5,031,950 | 4,695,536 | 4,551,586 | 2,279,737 | ||||||||||
| Inventory turnover (h) | 1.5 | 1.5 | 1.4 | 1.4 | 1.4 | 1.5 | 1.4 | 1.4 | 1.6 | 1.6 | ||||||||||
| Accounts payable to inventory (i) | 105.7 | % | 99.1 | % | 94.6 | % | 86.6 | % | 84.7 | % | 64.4 | % | 44.3 | % | 42.8 | % | 46.9 | % | 43.2 | % |
| Current portion of long-term debt and short-term debt ($) | — | — | 25 | 67 | 222 | 662 | 1,431 | 106,708 | 8,131 | 25,320 | ||||||||||
| Long-term debt, less current portion (g)($) | 1,887,019 | 1,390,018 | 1,388,397 | 1,386,828 | 1,087,789 | 790,585 | 357,273 | 684,040 | 724,564 | 75,149 | ||||||||||
| Shareholders’ equity ($) | 1,627,136 | 1,961,314 | 2,018,418 | 1,966,321 | 2,108,307 | 2,844,851 | 3,209,685 | 2,685,865 | 2,282,218 | 1,592,477 | ||||||||||
| CASH FLOW DATA: | ||||||||||||||||||||
| Cash provided by operating activities ($) | 1,454,167 | 1,281,476 | 1,190,430 | 908,026 | 1,251,555 | 1,118,991 | 703,687 | 285,200 | 298,542 | 299,418 | ||||||||||
| Capital expenditures ($) | 476,344 | 414,020 | 429,987 | 395,881 | 300,719 | 328,319 | 365,419 | 414,779 | 341,679 | 282,655 | ||||||||||
| Free cash flow (j)($) | 977,823 | 867,456 | 760,443 | 512,145 | 950,836 | 790,672 | 338,268 | (129,579 | ) | (43,137 | ) | 16,763 | ||||||||
| | | | | | | | | | | | | | | | | | | | | |
Years ended December 31, |
| 2019 | 2018 | 2017 | 2016 | 2015 | 2014 | 2013 | 2012 | 2011 | 2010 | ||||||||||
(In thousands, except per share, Team Members, stores and ratio data) |
|
|
|
|
|
|
|
|
|
|
| ||||||||||
| | | | | | | | | | | | | | | | | | | | | |
SELECT BALANCE SHEET AND CASH FLOW DATA: |
|
|
|
|
|
|
|
|
|
|
| ||||||||||
| | | | | | | | | | | | | | | | | | | | | |
Working capital ($) (j) |
| (635,765) | (350,918) | (249,694) | (142,674) | (36,372) | 252,082 | 430,832 | 478,093 | 1,028,330 | 1,029,861 | ||||||||||
Total assets ($) (j) |
| 10,717,160 | 7,980,789 | 7,571,885 | 7,204,189 | 6,676,684 | 6,532,083 | 6,057,895 | 5,741,241 | 5,494,174 | 5,031,950 | ||||||||||
Inventory turnover (c)(k) |
| 1.4 | 1.4 | 1.4 | 1.5 | 1.5 | 1.4 | 1.4 | 1.4 | 1.5 | 1.4 | ||||||||||
Accounts payable to inventory (c)(l) |
| 104.6 | % | 105.7 | % | 106.0 | % | 105.7 | % | 99.1 | % | 94.6 | % | 86.6 | % | 84.7 | % | 64.4 | % | 44.3 | % |
Current portion of long-term debt and short-term debt ($) |
| — | — | — | — | — | 25 | 67 | 222 | 662 | 1,431 | ||||||||||
Long-term debt, less current portion ($) (j) |
| 3,890,527 | 3,417,122 | 2,978,390 | 1,887,019 | 1,390,018 | 1,388,397 | 1,386,828 | 1,087,789 | 790,585 | 357,273 | ||||||||||
Shareholders’ equity ($) (a) |
| 397,340 | 353,667 | 653,046 | 1,627,136 | 1,961,314 | 2,018,418 | 1,966,321 | 2,108,307 | 2,844,851 | 3,209,685 | ||||||||||
Cash provided by operating activities ($) (m) |
| 1,708,479 | 1,727,555 | 1,403,687 | 1,510,713 | 1,345,488 | 1,190,430 | 908,026 | 1,251,555 | 1,118,991 | 703,687 | ||||||||||
Capital expenditures ($) |
| 628,057 | 504,268 | 465,940 | 476,344 | 414,020 | 429,987 | 395,881 | 300,719 | 328,319 | 365,419 | ||||||||||
Free cash flow ($) (m)(n) |
| 1,020,649 | 1,188,584 | 889,059 | 978,375 | 868,390 | 760,443 | 512,145 | 950,836 | 790,672 | 338,268 | ||||||||||
| (a) | During the year ended December 31, 2017, the Company adopted a new accounting standard that requires excess tax benefits related to share-based compensation payments to be recorded through the income statement. In compliance with the standard, the Company did not restate prior period amounts to conform to current period presentation. The Company recorded a cumulative effect adjustment to opening retained earnings, due to the adoption of the new accounting standard. See Note 1 “Summary of Significant Accounting Policies” to the Consolidated Financial Statements of the annual report on Form 10-K for the year ended December 31, 2017, for more information. |
| (b) | Following the enactment of the U.S. Tax Cuts and Jobs Act in December of 2017, the Company revalued its deferred income tax liabilities, which resulted in a one-time benefit to the Company’s Consolidated Statement of Income for the year ended December 31, 2018 and 2017. See Note 13 “Income Taxes” to the Consolidated Financial Statements of the annual report on Form 10-K for the year ended December 31, 2018, for more information. |
| (c) | Represents O’Reilly U.S. operations only. |
| (d) | In 2008, 2012, 2016, and |
| (e) | In 2019, the Company acquired Mayoreo de Autopartes y Aceites, S.A. de C.V. (“Mayasa”), which added 21 stores to the O’Reilly store count. Financial results for this acquired company have been included in the Company’s consolidated financial statements beginning from the date of the acquisition. |
| (g) | |
| Sales per weighted-average store are weighted to consider the approximate dates of store openings, acquisitions or closures. |
| (h) | |
| Sales per weighted-average square foot are weighted to consider the approximate dates of domestic store openings, acquisitions, expansions or closures. |
| (i) | |
| Comparable store sales are calculated based on the change in sales of U.S. stores open at least one year and excludes sales of specialty machinery, sales to independent parts stores, sales to Team Members, sales from Leap Day during the years ended December 31, 2016 |
| (j) | |
| Certain prior period amounts have been reclassified to conform to current period presentation, due to the Company’s adoption of new accounting standards during the fourth quarter ended December 31, 2015. See Note 1 “Summary of Significant Accounting Policies” to the Consolidated Financial Statements of the annual report on Form 10-K for the year ended December 31, |
| (k) | |
| Inventory turnover is calculated as cost of goods sold for the last 12 months divided by average inventory. Average inventory is calculated as the average of inventory for the trailing four quarters used in determining the denominator. |
| (l) | |
| Accounts payable to inventory is calculated as accounts payable divided by inventory. |
| (m) | Certain prior period amounts have been reclassified to conform to current period presentation, due to the Company’s adoption of a new accounting standard during the first quarter ended March 31, 2017. See Note 1 “Summary of Significant Accounting Policies” to the Consolidated Financial Statements of the annual report on Form 10-K for the year ended December 31, 2017, for more information. |
| Free cash flow is calculated as net cash provided by operating activities less capital expenditures, excess tax benefit from share-based compensation payments, and investment in tax credit equity investments for the period. |
23
Item 7. Management’s Discussion and Analysis of Financial Condition and Results of Operations
In Management’s Discussion and Analysis, we provide a historical and prospective narrative of our general financial condition, results of operations, liquidity and certain other factors that may affect our future results, including
| ● | an overview of the key drivers of the automotive aftermarket industry; |
| ● | key events and recent developments within our company; |
| ● | our results of operations for the years ended December 31, 2019, 2018, and 2017; |
| ● | our liquidity and capital resources; |
| ● | any contractual obligations, to which we are committed; |
| ● | any off-balance sheet arrangements we utilize; |
| ● | our critical accounting estimates; |
| ● | the inflation and seasonality of our business; |
| ● | our quarterly results for the years ended December 31, 2019, and 2018; and |
| ● | recent accounting pronouncements that may affect our Company. |
The review of Management’s Discussion and Analysis should be made in conjunction with our consolidated financial statements, related notes and other financial information, forward-looking statements and other risk factors included elsewhere in this annual report.
FORWARD-LOOKING STATEMENTS
We claim the protection of the safe-harbor for forward-looking statements within the meaning of the Private Securities Litigation Reform Act of 1995. You can identify these statements by forward-looking words such as “estimate,” “may,” “could,” “will,” “believe,” “expect,” “would,” “consider,” “should,” “anticipate,” “project,” “plan,” “intend” or similar words. In addition, statements contained within this annual report that are not historical facts are forward-looking statements, such as statements discussing, among other things, expected growth, store development, integration and expansion strategy, business strategies, future revenues and future performance. These forward-looking statements are based on estimates, projections, beliefs and assumptions and are not guarantees of future events and results. Such statements are subject to risks, uncertainties and assumptions, including, but not limited to, the economy in general, inflation, tariffs, product demand, the market for auto parts, competition, weather, risks associated with the performance of acquired businesses, our ability to hire and retain qualified employees, consumer debt levels, our increased debt levels, credit ratings on public debt, governmental regulations, information security and cyber-attacks, terrorist activities, war and the threat of war. Actual results may materially differ from anticipated results described or implied in these forward-looking statements. Please refer to the “Risk Factors” section ofin this annual report on Form 10-K for the year ended December 31, 2016,2019, and subsequent Securities and Exchange Commission filings, for additional factors that could materially affect our financial performance. Forward-looking statements speak only as of the date they were made, and we undertake no obligation to publicly update any forward-looking statements, whether as a result of new information, future events or otherwise, except as required by applicable law.
OVERVIEW
We are a specialty retailer of automotive aftermarket parts, tools, supplies, equipment and accessories in the United States. We are one of the largest U.S. automotive aftermarket specialty retailers, selling our products to both do-it-yourself (“DIY”)DIY customers and professional service providers – our “dual market strategy.” Our stores carry an extensive product line consisting of new and remanufactured automotive hard parts, maintenance items, accessories, a complete line of auto body paint and related materials, automotive tools and professional service provider service equipment.
Our extensive product line includes an assortment of products that are differentiated by quality and price for most of the product lines we offer. For many of our product offerings, this quality differentiation reflects “good,” “better,” and “best” alternatives. Our sales and total gross marginprofit dollars are highest for the “best” quality category of products. Consumers’ willingness to select products at a higher point on the value spectrum is a driver of sales and profitability in our industry. We have ongoing initiatives focused on marketing and training to educate customers on the advantages of ongoing vehicle maintenance, as well as “purchasing up” on the value spectrum.
Our stores also offer enhanced services and programs to our customers, including used oil, oil filter and battery recycling; battery, wiper and bulb replacement; battery diagnostic testing; electrical and module testing; check engine light code extraction; loaner tool program; drum and rotor resurfacing; custom hydraulic hoses; professional paint shop mixing and related materials; and machine shops. As of December 31, 2016,2019, we operated 4,8295,439 stores in 47 states.
We are influenced by a number of general macroeconomic factors that influence both our industry and our consumers, including, but not limited to, fuel costs, unemployment trends, interest rates, and other economic factors. Due to the nature of these macroeconomic
24
factors, we are unable to determine how long current conditions will persist and the degree of impact future changes may have on our business.
The sustained trends of low U.S. unemployment have been favorable to our industry through the support of miles driven and consumer preferences and spending habits, and competition. We have ongoing initiatives aimed at tailoring our product offering to adjust to customers’ changing preferences, and weconfidence; however, this has also have initiatives focusedresulted in pressure on marketing and training to educate customers on the advantages of ongoing vehicle maintenance, as well as “purchasing up” on the value spectrum.
We believe the key drivers of current and future long-term demand offor the products sold within the automotive aftermarket include the number of U.S. miles driven, number of U.S. registered vehicles, new light vehicle registrations and average vehicle age and unemployment.
Number of Miles Driven
The number of total miles driven in the U.S. influences the demand for repair and maintenance products sold within the automotive aftermarket. In total, vehicles in the U.S. are driven approximately 3three trillion miles per year, resulting in ongoing wear and tear and a corresponding continued demand for the repair and maintenance products necessary to keep these vehicles in operation. According to the Department of Transportation, the number of total miles driven in the U.S. increased 2.8%, 3.5%0.4% and 1.7%1.2% in 2016, 20152018 and 2014,2017, respectively, and wethrough November of 2019, year-to-date miles driven increased 0.9%. We would expect to continue to see modest improvements in total miles driven in the U.S., supported by an increasing number of registered vehicles on the road, resulting in continued demand for automotive aftermarket products.
Size and Age of U.S. Registered Vehicles, New Lightthe Vehicle Registrations and Average Vehicle Age
The total number of vehicles on the road and the average age of the vehicle population heavily influence the demand for products sold within the automotive aftermarket industry. As reported by The Auto Care Association, the total number of registered vehicles increased 6%8.1% from 20052008 to 2015,2018, bringing the number of light vehicles on the road to 258272 million by the end of 2015.2018. For the year ended December 31, 2016,2019, the seasonally adjusted annual rate of light vehiclesvehicle sales in the U.S. (“SAAR”) was approximately 18.316.7 million, contributing to the continued growth in the total number of registered vehicles on the road. In the past decade, vehicle scrappage rates have remained relatively stable, ranging from 4.4% to 5.7% annually. As a result, over the past decade, the average age of the U.S. vehicle population has increased, growing 22%20.6%, from 9.49.7 years in 20052008 to 11.511.7 years in 2015. 2018.
We believe this increase in average age can be attributed to better engineered and manufactured vehicles, which can be reliably driven at higher mileages due to better quality power trains, and interiors and exteriors, and the consumer’s willingness to invest in maintaining these higher-mileage, better built vehicles. As the average age of the vehiclevehicles on the road increases, a larger percentage of miles are being driven by vehicles that are outside of a manufacturer warranty. These out-of-warranty, older vehicles generate strong demand for automotive aftermarket products as they go through more routine maintenance cycles, have more frequent mechanical failures and generally require more maintenance than newer vehicles. We believe consumers will continue to invest in these reliable, higher-quality, higher-mileage vehicles and these investments, along with an increasing total light vehicle fleet, will support continued demand for automotive aftermarket products.
We remain confident in our ability to gain market share in our existing markets and grow our business in new markets by focusing on our dual market strategy and the core O’Reilly values of hard work and excellent customer service.
KEY EVENTS AND RECENT DEVELOPMENTS
Several key events have had or may have a significant impact on our operations and are identified below:
| ● | After the close of business on December 31, 2018, we completed an asset purchase of Bennett, a privately held automotive parts supplier operating 33 stores and a warehouse in Florida. These stores were not operated by the Company in 2018 and were therefore not included in our 2018 store count. Beginning January 1, 2019, the operations of the acquired Bennett locations were included in the Company’s store count, consolidated financial statements and results of operations. During the year ended December 31, 2019, the Company merged 13 of these acquired Bennett stores into existing O’Reilly locations and rebranded the remaining 20 Bennett stores as O’Reilly stores. |
| ● | Under the Company’s share repurchase program, as approved by our Board of Directors in January of 2011, we may, from time to time, repurchase shares of our common stock, solely through open market purchases effected through a broker dealer at prevailing market prices, based on a variety of factors such as price, corporate trading policy requirements and overall market conditions. Our Board of Directors may increase or otherwise modify, renew, suspend or terminate the share repurchase program at any time, without prior notice. As announced on May 31, 2019, and February 5, 2020, our Board of Directors approved a resolution each time to increase the authorization amount under our share repurchase program by an additional $1.00 billion, resulting in a cumulative authorization amount of $13.75 billion. Each additional authorization is effective for a |
25
| three-year period, beginning on its respective announcement date. As of February 28, 2020, we had repurchased approximately 77.1 million shares of our common stock at an aggregate cost of $12.54 billion under this program. |
| ● | On May 20, 2019, we issued $500 million aggregate principal amount of unsecured 3.900% Senior Notes due 2029 (“3.900% Senior Notes due 2029”) at a price to the public of 99.991% of their face value with U.S. Bank National Association (“U.S. Bank”) as trustee. Interest on the 3.900% Senior Notes due 2029 is payable on June 1 and December 1 of each year, which began on December 1, 2019, and is computed on the basis of a 360-day year. |
| ● | After the close of business on November 29, 2019, we completed the acquisition of Mayasa, a specialty retailer of automotive aftermarket parts headquartered in Guadalajara, Jalisco, Mexico pursuant to a stock purchase agreement. At the time of the acquisition, Mayasa operated six distribution centers, 21 Orma Autopartes stores and served over 2,000 independent jobber locations in 28 Mexican states. The results of Mayasa’s operations have been included in the Company’s consolidated financial statements and results of operations beginning from the date of acquisition. Pro forma results of operations related to the acquisition of Mayasa are not presented as Mayasa’s results are not material to the Company’s results of operations. |
RESULTS OF OPERATIONS
The following table includes income statement data as a percentage of sales for the years ended December 31, 2016, 20152019, 2018 and 2014:
| | | | | | | | | |
| | For the Year Ended |
| ||||||
| | December 31, |
| ||||||
|
| 2019 | | 2018 | | 2017 | |||
Sales |
| 100.0 | % | | 100.0 | % | | 100.0 | % |
Cost of goods sold, including warehouse and distribution expenses |
| 46.9 | | 47.2 | | 47.4 | |||
Gross profit |
| 53.1 | | 52.8 | | 52.6 | |||
Selling, general and administrative expenses |
| 34.2 | | 33.8 | | 33.4 | |||
Operating income |
| 18.9 | | 19.0 | | 19.2 | |||
Interest expense |
| (1.4) | | (1.3) | | (1.0) | |||
Interest income |
| 0.1 | | — | | — | |||
Income before income taxes (1) |
| 17.6 | | 17.8 | | 18.2 | |||
Provision for income taxes |
| 3.9 | | 3.9 | | 5.6 | |||
Net income |
| 13.7 | % | | 13.9 | % | | 12.6 | % |
| For the Year Ended December 31, | ||||||||
| 2016 | 2015 | 2014 | ||||||
| Sales | 100.0 | % | 100.0 | % | 100.0 | % | ||
| Cost of goods sold, including warehouse and distribution expenses | 47.5 | 47.7 | 48.6 | |||||
| Gross profit | 52.5 | 52.3 | 51.4 | |||||
| Selling, general and administrative expenses | 32.7 | 33.2 | 33.8 | |||||
Operating income (1) | 19.8 | 19.0 | 17.6 | |||||
| Interest expense | (0.8 | ) | (0.7 | ) | (0.7 | ) | ||
| Interest income | 0.1 | — | — | |||||
| Income before income taxes | 19.1 | 18.3 | 16.9 | |||||
| Provision for income taxes | 7.0 | 6.6 | 6.1 | |||||
| Net income | 12.1 | % | 11.7 | % | 10.8 | % | ||
| (1) | |
| Each percentage of sales amount is computed independently and may not compute to presented totals. |
2019 Compared to 2015
Sales:
Sales for the year ended December 31, 2016,2019, increased $626$614 million, or 6%, to $8.59$10.15 billion from $7.97$9.54 billion for the same period one year ago, representing an increase of 8%.in 2018. Comparable store sales for stores open at least one year increased 4.8%4.0% and 7.5%3.8% for the years ended December 31, 20162019 and 2015,2018, respectively. ComparableU.S. domestic comparable store sales are calculated based on the change in sales offor stores open at least one year and exclude sales of specialty machinery, sales to independent parts stores and sales to Team MembersMembers. Online sales, resulting from ship-to-home orders and pickup in-store orders, for stores open at least one year, are included in the comparable store sales from Leap Day during the year ended December 31, 2016.calculation.
26
The following table presents the components of the increase in sales for the year ended December 31, 20162019 (in millions):
| Increase in Sales for the Year Ended December 31, 2016, Compared to the Same Period in 2015 | |||
| Store sales: | |||
| Comparable store sales | $ | 375 | |
| Non-comparable store sales: | |||
| Sales for stores opened throughout 2015, excluding stores open at least one year that are included in comparable store sales | 115 | ||
| Sales for stores opened throughout 2016 and sales from acquired Bond stores | 106 | ||
| Sales from Leap Day | 24 | ||
| Sales in 2015 for stores that have closed | (4 | ) | |
| Non-store sales: | |||
| Includes sales of machinery and sales to independent parts stores and Team Members | 10 | ||
| Total increase in sales | $ | 626 | |
| | | |
|
| Increase in Sales for the Year Ended | |
| | December 31, 2019 | |
| | Compared to the Same Period in 2018 | |
Store sales: |
| |
|
Comparable store sales | | $ | 375 |
Non-comparable store sales: | |
| |
Sales for stores opened throughout 2018, excluding stores open at least one year that are included in comparable store sales | |
| 87 |
Sales for stores opened throughout 2019 and sales from the acquired Bennett and Mayasa stores | |
| 141 |
Decline in sales for stores that have closed | |
| (8) |
Non-store sales: | |
|
|
Includes sales of machinery and sales to independent parts stores and Team Members | |
| 19 |
Total increase in sales | | $ | 614 |
We believe the increased sales achieved by our stores were the result of store growth, sales from one additional day due to Leap Day for the year ended December 31, 2016, sales from the acquired 48 Bond stores, the high levels of customer service provided by our well-trained and technically proficient Team Members, superior inventory availability, including same day and over-night access to inventory in our regional distribution centers, enhanced services and programs offered in our stores, a broaderbroad selection of product offerings in most of our stores with a dynamic catalog system to identify and source parts, a targeted promotional and advertising effort through a variety of media and localized promotional events, continued improvement in the merchandising and store layouts of our stores, compensation programs for all store Team Members that provide incentives for performance and our continued focus on serving both DIY and professional service provider customers.
Our comparable store sales increase for the year ended December 31, 2016,2019, was driven by an increase in average ticket values for both DIY and professional service provider customers. Transaction counts were flat for the year ended December 31, 2019, comprised of positive transaction counts for professional service provider customers, offset by negative transaction counts for DIY customers. The improvement in average ticket values was the result of the increasing complexity and cost of replacement parts necessary to maintain the newer population of vehicles and increased selling prices on a same-SKU basis, as compared to one year ago. The increased complexity and replacement costs are a result of the current population of better-engineered and more technically advanced vehicles that require less frequent repairs, as the component parts are more durable and last for longer periods of time, which creates pressure on customer transaction counts. However, when repairs are needed, the cost of replacement parts is, on average, greater, which benefits average ticket values. The increase in selling prices on a same-SKU basis was driven by increases in average ticket values and customeracquisition costs of inventory, which were passed through in market prices. Transaction counts for the year ended December 31, 2019, as compared to the same period in 2018, were also negatively impacted by wetter, cooler than normal temperatures in many of our markets during the first half of 2019, which is a headwind to DIY business. DIY transaction counts continue to be impacted by the inflationary environment.
We opened 200 net, new U.S. stores during the year ended December 31, 2019, compared to opening 200 net, new U.S. stores during the year ended December 31, 2018. In addition, on January 1, 2019, we began operating 33 acquired Bennett stores, and during the year ended December 31, 2019, we merged 13 of these acquired Bennett stores into existing O’Reilly locations and rebranded the remaining 20 Bennett stores as O’Reilly stores. After the close of business on November 29, 2019, we acquired 21 stores from Mayasa. As of December 31, 2019, we operated 5,439 stores in 47 U.S. states and 21 stores in Mexico compared to 5,219 U.S. stores in 47 states at December 31, 2018. We anticipate U.S. new store growth will be approximately 180 net, new store openings in 2020.
Gross profit:
Gross profit for the year ended December 31, 2019, increased 7% to $5.39 billion (or 53.1% of sales) from $5.04 billion (or 52.8% of sales) for the same period in 2018. The increase in gross profit dollars for the year ended December 31, 2019, was primarily the result of sales from new stores and the increase in comparable store sales at existing stores. The increase in gross profit as a percentage of sales for the year ended December 31, 2019, was due to a benefit from selling through inventory purchased prior to recent industry-wide acquisition cost increases and corresponding selling price increases. Beginning in the last six months of 2018, inventory acquisition costs in our industry increased, as a result of tariffs on products imported from China and other increases in supplier input costs, which were passed through in higher retail and wholesale prices in our industry. We determine inventory cost using the last-in, first-out (“LIFO”) method, but have, over time, seen our LIFO reserve balance exhausted, as a result of cumulative historical acquisition cost decreases. Our policy is to not write up inventory in excess of replacement cost, and accordingly, we are effectively valuing our inventory at replacement cost.
27
Selling, general and administrative expenses:
Selling, general and administrative expenses (“SG&A”) for the year ended December 31, 2019, increased 8% to $3.47 billion (or 34.2% of sales) from $3.22 billion (or 33.8% of sales) for the same period in 2018. The increase in total SG&A dollars for the year ended December 31, 2019, was the result of Team Members, facilities and vehicles to support our increased sales and store count. The increase in SG&A as a percentage of sales for the year ended December 31, 2019, was principally due to wage pressure, driven by a low unemployment, inflationary environment, and other variable costs, including health benefit costs and cost of insurance, primarily auto related, and increased spending on Omnichannel and technology initiatives.
Operating income:
As a result of the impacts discussed above, operating income for the year ended December 31, 2019, increased 6% to $1.92 billion (or 18.9% of sales) from $1.82 billion (or 19.0% of sales) for the same period in 2018.
Other income and expense:
Total other expense for the year ended December 31, 2019, increased 8% to $130 million (or 1.3% of sales), from $121 million (or 1.3% of sales) for the same period in 2018. The increase in total other expense for the year ended December 31, 2019, was the result of increased interest expense on higher average outstanding borrowings, partially offset by an increase in the value of our trading securities.
Income taxes:
Our provision for income taxes for the year ended December 31, 2019, increased 8% to $399 million (22.3% effective tax rate) from $370 million (21.8% effective tax rate) for the same period in 2018. The increase in our provision for income taxes for the year ended December 31, 2019, was the result of higher taxable income and lower excess tax benefits from share-based compensation. The increase in our effective tax rate for the year ended December 31, 2019, was the result of lower excess tax benefits from share-based compensation. During the years ended December 31, 2019 and 2018, excess tax benefits from share-based compensation were approximately $26 million and $35 million, respectively.
Net income:
As a result of the impacts discussed above, net income for the year ended December 31, 2019, increased 5% to $1.39 billion (or 13.7% of sales), from $1.32 billion (or 13.9% of sales) for the same period in 2018.
Earnings per share:
Our diluted earnings per common share for the year ended December 31, 2019, increased 11% to $17.88 on 78 million shares from $16.10 on 82 million shares for the same period in 2018.
2018 Compared to 2017
Sales:
Sales for the year ended December 31, 2018, increased $559 million, or 6%, to $9.54 billion from $8.98 billion for the same period in 2017. Comparable store sales for stores open at least one year increased 3.8% and 1.4% for the years ended December 31, 2018 and 2017, respectively. Comparable store sales are calculated based on the change in sales for stores open at least one year and exclude sales of specialty machinery, sales to independent parts stores and sales to Team Members. Online sales, resulting from ship-to-home orders and pickup in-store orders, for stores open at least one year, are included in the comparable store sales calculation.
28
The following table presents the components of the increase in sales for the year ended December 31, 2018 (in millions):
| | | |
|
| Increase in Sales for the Year Ended | |
| | December 31, 2018, | |
| | Compared to the Same Period in 2017 | |
Store sales: |
| |
|
Comparable store sales | | $ | 336 |
Non-comparable store sales: | |
|
|
Sales for stores opened throughout 2017, excluding stores open at least one year that are included in comparable store sales | |
| 101 |
Sales for stores opened throughout 2018 | |
| 120 |
Decline in sales for stores that have closed | |
| (7) |
Non-store sales: | |
|
|
Includes sales of machinery and sales to independent parts stores and Team Members | |
| 9 |
Total increase in sales | | $ | 559 |
We believe the increased sales achieved by our stores were the result of store growth, the high levels of customer service provided by our well-trained and technically proficient Team Members, superior inventory availability, including same day and over-night access to inventory in our regional distribution centers, enhanced services and programs offered in our stores, a broad selection of product offerings with a dynamic catalog system to identify and source parts, a targeted promotional and advertising effort through a variety of media and localized promotional events, continued improvement in the merchandising and store layouts of our stores, compensation programs for all store Team Members that provide incentives for performance and our continued focus on serving both our DIY and professional service provider customers.
Our comparable store sales increase for the year ended December 31, 2018, was driven by an increase in average ticket values for both DIY and professional service provider customers and positive transaction counts for professional service provider customers, offset by negative transaction counts for DIY customers. The improvement in average ticket values was the result of the increasing complexity and cost of replacement parts necessary to maintain the current population of better engineeredbetter-engineered and more technically advanced vehicles.vehicles and same SKU inflation. These better engineered,better-engineered, more technically advanced vehicles require less frequent repairs, as the component parts are more durable and last for longer periods of time. This decrease in repair frequency creates pressure on customer transaction counts; however, when repairs are needed, the cost of replacement parts is, on average, greater, which is a benefit to average ticket values. Customer transaction counts for both DIY and professional service provider customers increased forDuring the year ended December 31, 2016, despite the added pressure from the better engineered, more technically advance vehicles requiring less frequent repairs. The increase in customer2018, DIY transaction counts was supportedalso continued to be pressured by an increase in miles driven, and the corresponding increase in vehicle maintenance, lower year-over-yearincreased gas prices and decreasing unemployment levels, creatingother inflationary impacts, resulting in an overall positive macroeconomic environment. The increase in our DIY customer transaction counts benefited from our continued focus on ensuring our stores are staffed with knowledgeable parts professionals to assist our DIY customers during high DIY traffic periods, such as nightsincreased deferral of vehicle maintenance and weekends. The increase in our professional service provider customer transaction counts benefited fromrepairs over the continued growth of our less mature markets and our better parts and service availability.
We opened 210200 net, new stores and acquired 48 Bond stores during the year ended December 31, 2016,2018, compared to opening 205190 net, new stores forduring the year ended December 31, 2015.2017. As of December 31, 2016,2018, we operated 4,8295,219 stores in 47 states compared to 4,5715,019 stores in 4447 states at December 31, 2015. We anticipate new2017. After the close of business on December 31, 2018, we acquired the 33 Bennett stores that were not included in our 2018 store growth will be 190 net, new store openingscount and were not operated by the Company in 2017, slightly below the 2016 net, new store openings, due to the resources necessary to convert the acquired 48 Bond stores to our systems, inventory selection and décor packages during 2017.
Gross profit:
Gross profit for the year ended December 31, 2016,2018, increased 7% to $4.51$5.04 billion (or 52.5%52.8% of sales) from $4.16$4.72 billion (or 52.3%52.6% of sales) for the same period one year ago, representing an increase of 8%.in 2017. The increase in gross profit dollars for the year ended December 31, 2016,2018, was primarily athe result of sales from new stores and the increase in comparable store sales at existing stores, sales from new stores and one additional day due to Leap Day.stores. The increase in gross profit as a percentage of sales for the year ended December 31, 2016,2018, was primarily due to product acquisition cost improvements,a non-cash LIFO charge in 2017, partially offset by a larger non-cash last-in, first-out (“LIFO”) impact. Product acquisition cost improvements are the result of our ongoing negotiations with our suppliers to improve our inventory purchase costs based on our increasing scale.an increase in distribution expenses. The non-cash LIFO impact is the result of these continued product acquisition cost reductions, andincrease in distribution expenses was primarily due to these reductions, we fully depleted our LIFO reserve in 2013. Our policy iswage pressure and increased transportation costs, as compared to not write up inventory in excess of replacement cost, and accordingly, we are effectively valuing our inventory at replacement cost.2017. During the yearsyear ended December 31, 20162018, we did not realize net acquisition cost decreases, and 2015,as a result, we did not record a LIFO charge. During the year ended December 31, 2017, our LIFO costs were written down by approximately $49$22 million and $28 million, respectively, to reflect replacement cost.
Selling, general and administrative expenses:
SG&A”)&A for the year ended December 31, 2016,2018, increased 8% to $2.81$3.22 billion (or 32.7%33.8% of sales) from $2.65$3.00 billion (or 33.2%33.4% of sales) for the same period one year ago, representing an increase of 6%.in 2017. The increase in total SG&A dollars for the year ended December 31, 2016,2018, was primarily the result of additional Team Members, facilities and vehicles to support our increased sales and store count, the planned allocation of a portion of the tax savings realized as a result of the U.S. Tax Cuts and one additional day dueJobs Act, enacted in December 2017 (the “Tax Act”) and unfavorable comparison to Leap Day.a 2017 benefit of $9.1 million from the reduction in our legal accrual following the expiration of the statute of limitations related to a legacy claim. The decreaseincrease in SG&A as a percentage of sales for the year ended December 31, 2016,2018, was primarily due to our tax savings allocation initiatives and the result of increased leverage of store occupancy costs on comparable store sales growth and a $19 million litigation loss charge in the prior year, resulting from an adverse verdict in a contract dispute with a former service provider.2017 legal accrual benefit.
29
Operating income:
As a result of the impacts discussed above, operating income for the year ended December 31, 2016,2018, increased 5% to $1.70$1.82 billion (or 19.8%19.0% of sales) from $1.51$1.73 billion (or 19.0%19.2% of sales) for the same period one year ago, representing an increase of 12%.
Other income and expense:
Total other expense for the year ended December 31, 2016,2018, increased 38% to $62$121 million (or 0.7%1.3% of sales), from $54$88 million (or 0.7%1.0% of sales) for the same period one year ago, representing an increase of 16%.in 2017. The increase in total other expense for the year ended December 31, 2016,2018, was primarily the result of increased interest expense on higher average outstanding borrowings and increased amortization of debt issuance costs, partially offset by an increase in the value of our trading securities. For additional information concerning our trading securities, see Notes to Consolidated Financial Statements in this annual report on Form 10-K.
Income taxes:
Our provision for income taxes for the year ended December 31, 2016, increased2018, decreased 27% to $600$370 million (36.6%(21.8% effective tax rate) from $529$504 million (36.2%(30.8% effective tax rate) for the same period one year ago, representing an increase of 13%.in 2017. The increasedecreases in our provision for income taxes for the year ended December 31, 2016, was the result of higher taxable income in 2016, primarily driven by our strong operating results, and higher effective tax rates. The increase in our effective tax rate for the year ended December 31, 2016, was2018, were primarily
Net income:
As a result of the impacts discussed above, net income for the year ended December 31, 2016,2018, increased 17% to $1.04$1.32 billion (or 12.1%13.9% of sales), from $931 million$1.13 billion (or 11.7%12.6% of sales) for the same period one year ago, representing an increase of 11%.
Earnings per share:
Our diluted earnings per common share for the year ended December 31, 2016,2018, increased 17%27% to $10.73$16.10 on 9782 million shares from $9.17$12.67 on 10290 million shares for the same period one year ago.
| Increase in Sales for the Year Ended December 31, 2015, Compared to the Same Period in 2014 | |||
| Store sales: | |||
| Comparable store sales | $ | 531 | |
| Non-comparable store sales: | |||
| Sales for stores opened throughout 2014, excluding stores open at least one year that are included in comparable store sales | 117 | ||
| Sales for stores opened throughout 2015 | 102 | ||
| Sales in 2014 for stores that have closed | (6 | ) | |
| Non-store sales: | |||
| Includes sales of machinery and sales to independent parts stores and Team Members | 7 | ||
| Total increase in sales | $ | 751 | |
LIQUIDITY AND CAPITAL RESOURCES
Our long-term business strategy requires capital to open new stores, fund strategic acquisitions, expand distribution infrastructure, operate and maintain our existing stores and may include the opportunistic repurchase of shares of our common stock through our Board-approved share repurchase program. The primary sources of our liquidity are funds generated from operations and borrowed under our unsecured revolving credit facility. Decreased demand for our products or changes in customer buying patterns could negatively impact our ability to generate funds from operations. Additionally, decreased demand or changes in customer buying patterns could impact our ability to meet the debt covenants of our credit agreement and, therefore, negatively impact the funds available under our unsecured revolving credit facility. We believe that cash expected to be provided by operating activities and availability under our unsecured revolving credit
Liquidity and related ratios:
The following table highlights our liquidity and related ratios as of December 31, 20162019 and 20152018 (dollars in millions):
| | | | | | | | | |
| | December 31, | | Percentage | |||||
Liquidity and Related Ratios |
| 2019 |
| 2018 | | Change | |||
Current assets | | $ | 3,834 | | $ | 3,543 |
| 8.2 | % |
Current liabilities | |
| 4,469 | |
| 3,894 |
| 14.8 | % |
Working capital (1) | |
| (636) | |
| (351) |
| (81.2) | % |
Total debt | |
| 3,891 | |
| 3,417 |
| 13.9 | % |
Total equity | | $ | 397 | | $ | 354 |
| 12.3 | % |
Debt to equity (2) | |
| 9.79:1 | |
| 9.66:1 |
| 1.3 | % |
| December 31, | Percentage Change | ||||||||||
| Liquidity and Related Ratios | 2016 | 2015 | |||||||||
| Current assets | $ | 3,258 | $ | 3,010 | 8.2 | % | |||||
| Current liabilities | 3,401 | 3,046 | 11.7 | % | |||||||
Working capital (1) | (143 | ) | (36 | ) | (297.2 | )% | |||||
| Total debt | 1,887 | 1,390 | 35.8 | % | |||||||
| Total equity | $ | 1,627 | $ | 1,961 | (17.0 | )% | |||||
Debt to equity (2) | 1.16:1 | 0.71:1 | 63.4 | % | |||||||
| (1) | |
| Working capital is calculated as current assets less current liabilities. |
| (2) | |
| Debt to equity is calculated as total debt divided by total equity. |
Current assets increased 8%, current liabilities increased 12%15%, total debt increased 36%14% and total equity decreased 17%increased 12% from 20152018 to 2016.2019. The increase in current assets was primarily due to the increase in inventory, resulting from our distribution expansion projects and the opening and acquiring of 210241 net, new stores and acquiring 48 Bond stores in 2016.2019. The increase in current liabilities was primarily due to the adoption of
30
ASC 842 during 2019, resulting in the recognition of $316 million of current operating lease liabilities at December 31, 2019, and an increase in accounts payable, resulting from inventory growth related to distribution expansion projects and new store openings supported in part by our suppliers and additional supplier participation in our supplier financing program during the year.openings. Our accounts payable to inventory ratio was 105.7%104.4% as of December 31, 2016,2019, as compared to 99.1%105.7% for the same period in the prior year.2018. The increase in total debt was attributable to the issuance of $500 million of 3.550%3.900% Senior Notes due 2026.2029 and borrowings of $261 million on our revolving credit facility at December 31, 2019. The decreaseincrease in total equity resultedwas due to a decrease in retained deficit, resulting from net income for the year ended December 31, 2019, and increased additional paid-in-capital, which was due to employee stock option exercises, partially offset by the impact of share repurchase activity, under our share repurchase program, on retained deficit and additional paid-in-capital and retained earnings, partially offset by an increase in retained earnings from strong net income for the year.
The following table identifies cash provided by/(used in) our operating, investing and financing activities for the years ended December 31, 2016, 20152019, 2018 and 20142017 (in thousands):
| | | | | | | | | |
| | For the Year Ended | |||||||
| | December 31, | |||||||
Liquidity: |
| 2019 |
| 2018 |
| 2017 | |||
Total cash provided by/(used in): |
| |
|
| |
|
| |
|
Operating activities | | $ | 1,708,479 | | $ | 1,727,555 | | $ | 1,403,687 |
Investing activities | |
| (796,746) | |
| (534,302) | |
| (464,223) |
Financing activities | |
| (902,811) | |
| (1,208,286) | |
| (1,039,714) |
Effect of exchange rate changes on cash | | | 169 | | | — | | | — |
Net increase (decrease) in cash and cash equivalents | | $ | 9,091 | | $ | (15,033) | | $ | (100,250) |
| | | | | | | | | |
Capital expenditures | | $ | 628,057 | | $ | 504,268 | | $ | 465,940 |
Free cash flow (1) | | | 1,020,649 | | | 1,188,584 | |
| 889,059 |
| For the Year Ended December 31, | ||||||||||||
| Liquidity | 2016 | 2015 | 2014 | |||||||||
| Total cash provided by/(used in): | ||||||||||||
| Operating activities | $ | 1,454,167 | $ | 1,281,476 | $ | 1,190,430 | ||||||
| Investing activities | (529,096 | ) | (407,188 | ) | (423,402 | ) | ||||||
| Financing activities | (894,774 | ) | (1,008,547 | ) | (747,786 | ) | ||||||
| Net increase (decrease) in cash and cash equivalents | $ | 30,297 | $ | (134,259 | ) | $ | 19,242 | |||||
| Capital expenditures | $ | 476,344 | $ | 414,020 | $ | 429,987 | ||||||
Free cash flow (1) | 977,823 | 867,456 | 760,443 | |||||||||
| (1) | |
| Calculated as net cash provided by operating activities, less capital expenditures, excess tax benefit from share-based compensation payments, and investment in tax credit equity investments for the period. |
Cash and cash equivalents balances held outside of the U.S. were $5.7 million as of December 31, 2019, which was generally utilized to support the liquidity needs of foreign operations in Mexico, and no cash or cash equivalents were held outside of the U.S. as of December 31, 2018 and 2017.
Operating activities:
The increasedecrease in net cash provided by operating activities in 20162019 compared to 20152018 was primarily due to
The increase in net cash provided by operating activities in 20152018 compared to 20142017 was primarily due to an increase in netincreased operating income, reduced cash taxes paid, due to the Tax Act, and a greater increase in income taxes payable, partially offset by a smaller decrease in net inventory investment and a decrease in accrued payroll-related liabilities. The larger increase in income taxes payable was primarilyreduction of accounts receivable, due to the resultbusiness day timing of higher accrued income taxes payable at the end of 2015,year-end 2018, as compared to the end of 2014. Our net inventory investment continues to decrease as a result of the impact of our enhanced supplier financing programs. The smaller decrease in net inventory investment in 2015 was the result of fewer new suppliers entering our supplier financing programs in 2015, as compared to 2014. Our accounts payable to inventory ratio was 99.1% and 94.6%
Investing activities:
The increase in net cash used in investing activities in 20162019 compared to 20152018 was primarily the result of an increase in capital expenditures, investments in tax credit equity investments and an increase in other investing activities in 2016.activities. Total capital expenditures were $476$628 million in 2019 versus $504 million in 2018, and the increase was primarily related to distribution expansion projects, the timing of property acquisitions and construction costs for new stores and technology investments during 2019, as compared to 2018. Investments in tax credit equity investments were the result of entering into tax credit equity investments for the purpose of receiving renewable energy tax credits. The increase in other investing activities was due to the acquisition of Mayasa in 2019.
The increase in net cash used in investing activities in 2018 compared to 2017 was primarily the result of an increase in capital expenditures in 2018 and an increase in other investing activities. Total capital expenditures were $504 million and $414$466 million in 20162018 and 2015,2017, respectively, and the increase was primarily related to the timing of property acquisitions, closings, and construction costs for new stores and our distribution expansion projectsthe mix of owned versus leased stores opened during 2016,2018, as compared to 2015.2017. The increase in other investing activities was primarily due to small acquisitions during 2016.
31
We opened 210, 205,200, 200, and 200190 net, new domestic stores in 2016, 20152019, 2018 and 2014, respectively,2017, respectively. In addition, on January 1, 2019, we began operating 33 acquired Bennett stores, and during the year ended December 31, 2019, we merged 13 of these acquired 48 BondBennett stores in 2016.into existing O’Reilly locations and rebranded the remaining 20 Bennett stores as O’Reilly stores. After the close of business on November 29, 2019, we acquired 21 stores from Mayasa. We plan to open 190approximately 180 net, new domestic stores in 2017.2020. The current costs associated with the opening of a new store, including the cost of land acquisition, building improvements, fixtures, vehicles, net inventory investment and computer equipment, are estimated to average approximately $1.5 million to $1.8 million; however, such costs may be significantly reduced where we lease, rather than purchase, the store site.
Financing activities:
The decrease in net cash used in financing activities during 2016in 2019 compared to 20152018 was primarily attributable to net proceeds from the issuancea lower level of long-term debt during 2016, partially offset by a greater impact from the repurchases of our common stock under our share repurchase programin 2019, compared to 2018, and a higher level of net borrowings during 2016.
The increase in net cash used in financing activities during 2015in 2018 compared to 20142017 was primarily attributable to a greater impact from thelower level of net borrowings during 2018, as compared to 2017, partially offset by a lower level of repurchases of our common stock under our share repurchase program during 2015.
Unsecured revolving credit facility:
On January 14, 2011, weApril 5, 2017, the Company entered into a credit agreement as amended by Amendment No. 1 dated as of September 9, 2011, as further amended by Amendment No. 2 dated as of July 2, 2013, and as further amended by Amendment No. 3 dated as of June 18, 2015 (the “Credit Agreement”). The Credit Agreement provides for a $600 millionfive-year $1.20 billion unsecured revolving credit facility (the “Revolving Credit Facility”) arranged by JPMorgan Chase Bank, of America, N.A., which is scheduled to mature in July 2018.April 2022. The Credit Agreement includes a $200 million sub-limit for the issuance of letters of credit and a $75 million sub-limit for swing line borrowings. As described in the Credit Agreement governing the Revolving Credit Facility, wethe Company may, from time to time, subject to certain conditions, increase the aggregate commitments under the Revolving Credit Facility by up to $200 million.
As of December 31, 20162019 and 2015,2018, we had outstanding letters of credit, primarily to support obligations related to workers’ compensation, general liability and other insurance policies, in the amounts of $39 million and $38$35 million, respectively, reducing the aggregate availability under the Revolving Credit FacilityAgreement by those amounts. As of December 31, 20162019 and 2015,2018, we had no outstanding borrowings under the Revolving Credit Facility.
Senior Notes:
On March 8, 2016,May 20, 2019, we issued $500 million aggregate principal amount of unsecured 3.550%3.900% Senior Notes due 20262029 (“3.550%3.900% Senior Notes due 2026”2029”) at a price to the public of 99.832%99.991% of their face value with United MissouriU.S. Bank N.A.National Association (“UMB”U.S. Bank”) as trustee. Interest on the 3.550%3.900% Senior Notes due 20262029 is payable on March 15June 1 and September 15December 1 of each year, which began with the first interest payment on September 15, 2016,December 1, 2019, and is computed on the basis of a 360-day year.
We have issued a cumulative $1.90$3.65 billion aggregate principal amount of unsecured senior notes, which are due between January 2021 and March 20262029, with UMB Bank, N.A. and U.S. Bank as trustee.trustees. Interest on the senior notes, ranging from 3.550% to 4.875%, is payable semi-annually and is computed on the basis of a 360-day year.
Debt covenants:
The indentures governing our senior notes contain covenants that limit our ability and the ability of certain of our subsidiaries to, among other things: (i)things, create certain liens on assets to secure certain debt; (ii)debt and enter into certain sale and leaseback transactions;transactions, and (iii)limit our ability to merge or consolidate with another company or transfer all or substantially all of our or its property, in each case as set forth in the indentures. These covenants are, however, subject to a number of important limitations and exceptions. As of December 31, 2016,2019, we were in compliance with the covenants applicable to our senior notes.
The Credit Agreement contains certain covenants, including limitations on indebtedness, a minimum consolidated fixed charge coverage ratio of 2.50 times2.50:1.00 and a maximum consolidated leverage ratio of 3.00 times.3.50:1.00. The consolidated fixed charge coverage ratio includes a calculation of earnings before interest, taxes, depreciation, amortization, rent and non-cash share-based compensation expense (“EBITDAR”).to fixed charges. Fixed charges include interest expense, capitalized interest and rent expense. The consolidated leverage ratio includes a calculation of adjusted debt to EBITDAR.earnings before interest, taxes, depreciation, amortization, rent and non-cash share-based compensation expense. Adjusted debt includes outstanding debt, outstanding stand-by letters of credit and similar instruments, six-timesfive-times rent expense and excludes any premium or discount recorded in conjunction with the issuance of long-term debt. In the event that we should default on any covenant contained within the Credit Agreement, certain actions may be taken, including, but not limited to, possible termination of commitments, immediate payment of outstanding principal amounts plus accrued interest and other amounts payable under the Credit Agreement and litigation from our lenders.
32
We had a consolidated fixed charge coverage ratio of 6.155.21 times and 5.995.38 times as of December 31, 20162019 and 2015,2018, respectively, and a consolidated leverage ratio of 1.632.20 times and 1.522.10 times as of December 31, 20162019 and 2015,2018, respectively, remaining in compliance with all covenants related to the borrowing arrangements. Under our current financing plan, we have targeted an adjusted debt to EBITDAR ratio range of 2.00 times to 2.25 times.
The table below outlines the calculations of the consolidated fixed charge coverage ratio and consolidated leverage ratio covenants, as defined in the Credit Agreement governing the Revolving Credit Facility, for the years ended December 31, 20162019 and 20152018 (dollars in thousands):
| | | | | | | |
| | | For the Year Ended | ||||
| | | December 31, | ||||
| |
| 2019 |
| 2018 | ||
GAAP net income | | $ | 1,391,042 | | $ | 1,324,487 | |
Add: | Interest expense | |
| 139,975 | |
| 122,129 |
| Rent expense (1) | |
| 338,697 | |
| 317,283 |
| Provision for income taxes | |
| 399,287 | |
| 369,600 |
| Depreciation expense | |
| 270,076 | |
| 255,866 |
| Amortization expense | |
| 799 | |
| 3,071 |
| Non-cash share-based compensation | |
| 21,921 | |
| 20,176 |
Non-GAAP EBITDAR | | $ | 2,561,797 | | $ | 2,412,612 | |
| | | | | | | |
| Interest expense | | $ | 139,975 | | $ | 122,129 |
| Capitalized interest | |
| 12,998 | |
| 9,092 |
| Rent expense (1) | |
| 338,697 | |
| 317,283 |
Total fixed charges | | $ | 491,670 | | $ | 448,504 | |
| | | | | | | |
Consolidated fixed charge coverage ratio | |
| 5.21 | |
| 5.38 | |
| | | | | | | |
GAAP debt | | $ | 3,890,527 | | $ | 3,417,122 | |
Add: | Stand-by letters of credit | |
| 38,870 | |
| 35,148 |
| Discount on senior notes | |
| 3,515 | |
| 4,294 |
| Debt issuance costs | |
| 16,958 | |
| 15,584 |
| Five-times rent expense | |
| 1,693,485 | |
| 1,586,415 |
Non-GAAP adjusted debt | | $ | 5,643,355 | | $ | 5,058,563 | |
| | | | | | | |
Consolidated leverage ratio | |
| 2.20 | |
| 2.10 | |
(1) | The table below outlines the calculation of Rent expense and reconciles Rent expense to Total lease cost, per Accounting Standard Codification 842 (“ASC 842”), adopted and effective January 1, 2019, the most directly comparable GAAP financial measure, for the twelve months ended December 31, 2019 (in thousands): |
| | | | |
Total lease cost, per ASC 842, for the year ended December 31, 2019 |
| $ | 398,294 | |
Less: | Variable non-contract operating lease components, related to property taxes and insurance, for the year ended December 31, 2019 | |
| 59,597 |
Rent expense for the year ended December 31, 2019 | | $ | 338,697 | |
The table below outlines the calculation of Free cash flow and reconciles Free cash flow to Net cash provided by operating activities, the most directly comparable GAAP financial measure, for the years ended December 31, 2019, 2018 and 2017 (in thousands):
| | | | | | | | | | |
| | | For the Year Ended | |||||||
| | | December 31, | |||||||
| |
| 2019 |
| 2018 |
| 2017 | |||
Cash provided by operating activities | | $ | 1,708,479 | | $ | 1,727,555 | | $ | 1,403,687 | |
Less: | Capital expenditures | |
| 628,057 | |
| 504,268 | |
| 465,940 |
| Excess tax benefit from share-based compensation payments | |
| 25,992 | |
| 34,703 | |
| 48,688 |
| Investment in tax credit equity investments | |
| 33,781 | |
| — | |
| — |
Free cash flow | | $ | 1,020,649 | | $ | 1,188,584 | | $ | 889,059 | |
33
| For the Year Ended December 31, | |||||||
| 2016 | 2015 | ||||||
| GAAP net income | $ | 1,037,691 | $ | 931,216 | |||
| Add: Interest expense | 70,931 | 57,129 | |||||
| Rent expense | 283,253 | 273,259 | |||||
| Provision for income taxes | 599,500 | 529,150 | |||||
| Depreciation expense | 217,009 | 203,388 | |||||
| Amortization expense | 857 | 6,868 | |||||
| Non-cash share-based compensation | 18,859 | 21,899 | |||||
| Non-GAAP EBITDAR | $ | 2,228,100 | $ | 2,022,909 | |||
| Interest expense | $ | 70,931 | $ | 57,129 | |||
| Capitalized interest | 7,933 | 7,423 | |||||
| Rent expense | 283,253 | 273,259 | |||||
| Total fixed charges | $ | 362,117 | $ | 337,811 | |||
| Consolidated fixed charge coverage ratio | 6.15 | 5.99 | |||||
| GAAP debt | $ | 1,887,019 | $ | 1,390,018 | |||
| Add: Stand-by letters of credit | 38,680 | 37,536 | |||||
| Discount on senior notes | 3,149 | 2,877 | |||||
| Debt issuance costs | 9,832 | 7,105 | |||||
| Six-times rent expense | 1,699,518 | 1,639,554 | |||||
| Non-GAAP adjusted debt | $ | 3,638,198 | $ | 3,077,090 | |||
| Consolidated leverage ratio | 1.63 | 1.52 | |||||
Free cash flow, the consolidated fixed charge coverage ratio and the consolidated leverage ratio discussed and presented in the tables above are not derived in accordance with United States generally accepted accounting principles (“GAAP”). We do not, nor do we suggest investors should, consider such non-GAAP financial measures in isolation from, or as a substitute for, GAAP financial information. We believe that the presentation of our free cash flow, consolidated fixed charge coverage ratio and consolidated leverage ratio provides meaningful supplemental information to both management and investors and reflects the required covenants under ourthe Credit Agreement. We include these items in judging our performance and believe this non-GAAP information is useful to investors as well. Material limitations of these non-GAAP measures are that such measures do not reflect actual GAAP amounts. We compensate for such limitations by presenting, in the tables above, a reconciliation to the most directly comparable GAAP measures.
Share repurchase program:
In January of 2011, our Board of Directors approved a share repurchase program. Under the program, we may, from time to time, repurchase shares of our common stock, solely through open market purchases effected through a broker dealer at prevailing market prices, based on a variety of factors such as price, corporate trading policy requirements and overall market conditions. Our Board of Directors may increase or otherwise modify, renew, suspend or terminate the share repurchase program at any time, without prior notice. As announced on May 31, 2019, and February 10, 2016, May 27, 2016, and November 16, 2016,5, 2020, our Board of Directors each time approved a resolution to increase the authorization amount under our share repurchase program by an additional $750 million,$1.00 billion, resulting in a cumulative authorization amount of $7.75$13.75 billion. Each additional authorization is effective for a three-year period, beginning on its respective announcement date.
The following table identifies shares of our common stock that have been repurchased as part of our publicly announced share repurchase program for the year ended December 31, 2019 and 2018 (in thousands, except per share data):
| For the Year Ended December 31, | |||||||
| 2016 | 2015 | ||||||
| Shares repurchased | 5,698 | 4,901 | |||||
| Average price per share | $ | 264.21 | $ | 231.81 | |||
| Total investment | $ | 1,505,371 | $ | 1,136,139 | |||
| | | | | | |
| | For the Year Ended | ||||
| | December 31, | ||||
|
| 2019 |
| 2018 | ||
Shares repurchased |
| | 3,877 |
| | 6,061 |
Average price per share | | $ | 369.55 | | $ | 282.80 |
Total investment | | $ | 1,432,752 | | $ | 1,713,953 |
As of December 31, 2016,2019, we had $888$569 million remaining under our share repurchase program. Subsequent to the end of the year and through February 28, 2017,2020, we repurchased an additional 1.40.9 million shares of our common stock under our share repurchase program, at an average price of $267.32,$400.78, for a total investment of $388$363 million. We have repurchased a total of 5877.1 million shares of our common stock under our share repurchase program since the inception of the program in January of 2011 and through February 28, 2017,2020, at an average price of $124.14$162.72 for a total aggregate investment of $7.25$12.54 billion. As of February 28, 2017,2020, we had approximately $500 million$1.21 billion remaining under our share repurchase program.
CONTRACTUAL OBLIGATIONS
Our contractual obligations as of December 31, 2016,2019, included commitments for short and long-term debt arrangements, interest payments related to long-term debt, future payments under non-cancelable lease arrangements, self-insurance reserves, purchase obligations for construction contract commitments and other long-term liabilities, which are identified in the table below and are fully disclosed in Note 6 “Leasing,5 “Leases,” Note 911 “Share-Based Compensation and Benefit Plans” and Note 1013 “Commitments” to the Consolidated Financial Statements. We expect to fund these commitments primarily with operating cash flows expected to be generated in the normal course of business or through borrowings under our Revolving Credit Facility.
Deferred income taxes, as well as commitments with various suppliers for the purchase of inventory, are not reflected in the table below due to the absence of scheduled maturities, the nature of the account or the commitment’s cancellation terms. Due to the absence of scheduled maturities, the timing of certain of these payments cannot be determined, except for amounts estimated to be payable in 2017,2020, which are included in “Current liabilities” on our Consolidated Balance Sheets.
We record a reserve for potential liabilities related to uncertain tax positions, including estimated interest and penalties, which are fully disclosed in Note 1215 “Income Taxes” to the Consolidated Financial Statements. These estimates are not included in the table below because the timing related to the ultimate resolution or settlement of these positions cannot be determined. As of December 31, 2016,2019, we recorded a net liability of $41$36.6 million related to these uncertain tax positions on our Consolidated Balance Sheets, all of which was included as a component ofin “Other liabilities.”
We record a reserve for the projected obligation related to future payments under the Company’s nonqualified deferred compensation plan, which is fully disclosed in Note 911 “Share-Based Compensation and Benefit Plans” to the Consolidated Financial Statements. This
34
December 31, 2016,2019, we recorded a liability of $20$32 million related to this uncertain liability on our Consolidated Balance Sheets, all of which was included as a component ofin “Other liabilities.”
The following table identifies the estimated payments of the Company’s contractual obligations as of December 31, 20162019 (in thousands):
| | | | | | | | | | | | | | | |
| | Payments Due By Period | |||||||||||||
| | | | Before | | Years | | Years | | Years 5 | |||||
Contractual Obligations |
| Total |
| 1 Year |
| 1 and 2 |
| 3 and 4 |
| and Over | |||||
Long-term debt principal and interest payments (1) | | $ | 4,779,438 | | $ | 157,958 | | $ | 1,624,882 | | $ | 477,935 | | $ | 2,518,663 |
Future minimum lease payments under operating leases (2) | |
| 2,437,219 | |
| 316,050 | |
| 574,102 | |
| 456,857 | |
| 1,090,210 |
Self-insurance reserves (3) | |
| 168,279 | |
| 79,079 | |
| 54,148 | |
| 21,772 | |
| 13,280 |
Construction commitments | |
| 100,086 | |
| 100,086 | |
| — | |
| — | |
| — |
Capital contributions to certain tax credit equity investments (4) | | | 95,000 | | | 95,000 | | | — | | | — | | | — |
Total contractual cash obligations | | $ | 7,580,022 | | $ | 748,173 | | $ | 2,253,132 | | $ | 956,564 | | $ | 3,622,153 |
| Payments Due By Period | ||||||||||||||||||||
| Contractual Obligations | Total | Before 1 Year | Years 1 and 2 | Years 3 and 4 | Years 5 and Over | |||||||||||||||
Long-term debt principal and interest payments (1) | $ | 2,390,661 | $ | 78,950 | $ | 157,900 | $ | 945,713 | $ | 1,208,098 | ||||||||||
Future minimum lease payments under operating leases (2) | 2,256,668 | 276,178 | 514,290 | 428,098 | 1,038,102 | |||||||||||||||
Self-insurance reserves (3) | 138,687 | 67,921 | 44,498 | 16,881 | 9,387 | |||||||||||||||
| Construction commitments | 79,618 | 79,618 | — | — | — | |||||||||||||||
| Total contractual cash obligations | $ | 4,865,634 | $ | 502,667 | $ | 716,688 | $ | 1,390,692 | $ | 2,255,587 | ||||||||||
| (1) | |
| Our Revolving Credit Facility, which has a maximum aggregate commitment of |
| (2) | |
| The minimum lease payments above do not include |
| (3) | |
| We use various self-insurance mechanisms to provide for potential liabilities from workers’ compensation, vehicle and general liability, and employee health care benefits. The self-insurance reserves above are at the undiscounted obligation amount. The self-insurance reserves liabilities are recorded on our Consolidated Balance Sheets at our estimate of their net present value and do not have scheduled maturities; however, we can estimate the timing of future payments based upon historical patterns. See Note |
| (4) | We have entered into an agreement to make capital contributions to certain tax credit equity investments for the purpose of receiving renewable energy tax credits. We are required to make capital contributions upon achievement of project milestones by the solar energy farms, the timing of which is variable and outside of the Company’s control. See Note 13 “Commitments” to the Consolidated Financial Statements for further information on our capital contribution obligations. |
OFF-BALANCE SHEET ARRANGEMENTS
Off-balance sheet arrangements are transactions, agreements, or other contractual arrangements with an unconsolidated entity, for which we have an obligation to the entity that is not recorded in our consolidated financial statements. We historically utilized various off-balance sheet financial instruments, including sale-leaseback and synthetic lease transactions, but we have not entered into any such transactions for over five10 years and do not plan to utilize off-balance sheet arrangements in the future to fund our working capital requirements, operations or growth plans.
We issue stand-by letters of credit provided by a $200 million sub limitsub-limit under the Revolving Credit Facility that reduce our available borrowings under the Revolving Credit Facility. Those letters of credit are issued primarily to satisfy the requirements of workers’ compensation, general liability and other insurance policies. Substantially all of the outstanding letters of credit have a one-year term from the date of issuance. Letters of credit totaling $39 million and $38$35 million were outstanding at December 31, 20162019 and 2015,2018, respectively.
We have entered into an agreement to make capital contributions to certain tax credit equity investments for the purpose of receiving renewable energy tax credits. We are required to make capital contributions totaling $95 million upon achievement of project milestones by the solar energy farms, the timing of which is variable and outside of the Company’s control.
We do not have any off-balance sheet financing that has, or is reasonably likely to have, a material, current or future effect on our financial condition, cash flows, results of operations, liquidity, capital expenditures or capital resources. See “Contractual Obligations” section of Item 7 of this annual report on Form 10-K and Note 6 “Leasing” to the Consolidated Financial Statements for further information on our operating leases.
35
CRITICAL ACCOUNTING POLICIES AND ESTIMATES
The preparation of our financial statements in accordance with GAAP requires the application of certain estimates and judgments by management. Management bases its assumptions, estimates, and adjustments on historical experience, current trends and other factors believed to be relevant at the time the consolidated financial statements are prepared. Management believes that the following policies are critical due to the inherent uncertainty of these matters and the complex and subjective judgments required in establishing these
Inventory Obsolescence and Shrink:
Inventory, which consists of automotive hard parts, maintenance items, accessories and tools, is stated at the lower of cost or market. The extended nature of the life cycle of our products is such that the risk of obsolescence of our inventory is minimal. The products that we sell generally have applications in our markets for a relatively long period of time in conjunction with the corresponding vehicle population. We have developed sophisticated systems for monitoring the life cycle of a given product and, accordingly, have historically been very successful in adjusting the volume of our inventory in conjunction with a decrease in demand. We do record a reserve to reduce the carrying value of our inventory through a charge to cost of sales in the isolated instances where we believe that the market value of a product lineproducts is lower than our recorded cost. This reserve is based on our assumptions about the marketability of our existing inventory and is subject to uncertainty to the extent that we must estimate, at a given point in time, the market value of inventory that will be sold in future periods. Ultimately, our projections could differ from actual results and could result in a material impact to our stated inventory balances. We have historically not had to materially adjust our obsolescence reserves due to the factors discussed above and do not anticipate that we will experience material changes in our estimates in the future.
We also record a reserve to reduce the carrying value of our perpetual inventory to account for quantities in our perpetual records above the actual existing quantities on hand caused by unrecorded shrink. We estimate this reserve based on the results of our extensive and frequent cycle counting programs and periodic, full physical inventories. To the extent that our estimates do not accurately reflect the actual unrecorded inventory shrinkage, we could potentially experience a material impact to our inventory balances. We have historically been able to provide a timely and accurate measurement of shrink and have not experienced material adjustments to our estimates. If the shrink reserve changed 10% from the estimate that we recorded based on our historical experience at December 31, 2016,2019, the financial impact would have been approximately less than $1 million or less than 0.1% of pretax income for the year ended December 31, 2016.
Valuation of Long-Lived Assets and Goodwill:
We evaluate the carrying value of long-lived assets for impairment whenever events or changes in circumstances indicate the carrying value of these assets might exceed their current fair values. As part of the evaluation, we review performance at the store level to identify any stores with current period operating losses that should be considered for impairment. A potential impairment has occurred if the projected future undiscounted cash flows realized from the best possible use of the asset are less than the carrying value of the asset. The estimate of cash flows includes management’s assumptions of cash inflows and outflows directly resulting from the use of that asset in operations. If the carrying amount of an asset exceeds its estimated future cash flows, an impairment charge is recognized for the amount by which the carrying amount of the asset exceeds the fair value of the assets. Our impairment analyses contain estimates due to the inherently judgmental nature of forecasting long-term estimated cash flows and determining the ultimate useful lives and fair values of the assets. Actual results could differ from these estimates, which could materially impact our impairment assessment.
We review goodwill for impairment annually during the fourth quarter, or when events or changes in circumstances indicate the carrying value of these assets might exceed their current fair values. We have never recorded an impairment to goodwill. The process of evaluating goodwill for impairment involves a detailed qualitative assessment to be performed first and then, based on the conclusion of the totality of events and circumstances, a quantitative assessment may be performed, which involves the determination of the fair value of our Company using the market approach. InherentWhen a quantitative assessment is performed, inherent in such fair value determinations are certain judgments and estimates, including estimates that incorporate assumptions marketplace participants would use in making their estimates of fair value. In the future, if events or market conditions affect the estimated fair value to the extent that an asset is impaired, we will adjust the carrying value of these assets in the period in which the impairment occurs; however,occurs. Based on our qualitative assessment, we do not believe there has been any change of events or circumstances that would indicate that a reevaluation of goodwill is required as of December 31, 2016,2019, nor do we believe goodwill iswould be at risk of failing impairment testing. If the price of O’Reilly’s stock, which was a primary input used to determine our market capitalization during step one of goodwill impairment testing, changed by 10% from the value used during testing, the results and our conclusions would not have changed and no further steps would have been required.
Supplier Concessions:
We receive concessions from our suppliers through a variety of programs and arrangements, including co-operative advertising, allowances for warranties, merchandise allowances and volume purchase rebates. Co-operative advertising allowances that are
36
incremental to our advertising program, specific to a product or event and identifiable for accounting purposes are reported as a reduction of advertising expense in the period in which the advertising occurred. All other material supplier concessions are recognized as a reduction to the cost of sales. Amounts receivable from suppliers also include amounts due to us relating to supplier purchases and product returns. Management regularly reviews amounts receivable from suppliers and assesses the need for a reserve for uncollectible amounts based on our evaluation of our suppliers’ financial position and corresponding ability to meet their financial obligations. Based on our historical results and current assessment, we have not recorded a reserve for uncollectible amounts in our consolidated financial statements, and we do not believe there is a reasonable likelihood that our ability to collect these amounts will differ from our expectations. The eventual ability of our suppliers to pay us the obliged amounts could differ from our assumptions and estimates, and we may be exposed to losses or gains that could be material.
Warranty Reserves:
We offer warranties on certain merchandise we sell with warranty periods ranging from 30 days to limited lifetime warranties. The risk of loss arising from warranty claims is typically the obligation of our suppliers. Certain suppliers provide upfront allowances to us in lieu of accepting the obligation for warranty claims. For this merchandise, when sold, we bear the risk of loss associated with the cost of warranty claims. Differences between supplier allowances received in lieu of warranty obligations and estimated warranty expense are recorded as an adjustment to the cost of sales. Estimated warranty costs, which are recorded as obligations at the time of sale, are based on the historical failure rate of each individual product line. Our historical experience has been that failure rates are relatively consistent over time and that the ultimate cost of warranty claims has been driven by volume of units sold as opposed to fluctuations in failure rates or the variation of the cost of individual claims. If warranty reserves were changed 10% from our estimated reserves at December 31, 2016,2019, the financial impact would have been approximately $4$6 million or 0.2%0.3% of pretax income for the year ended December 31, 2016.
Self-Insurance Reserves:
We use a combination of insurance and self-insurance mechanisms to provide for potential liabilities from workers’ compensation, general liability, vehicle liability, property loss, and Team Member health care benefits. With the exception of certain Team Member health care benefit liabilities, employment related claims and litigation, certain commercial litigation and certain regulatory matters, we obtain third-party insurance coverage to limit our exposure for any individual workers’ compensation, general liability, vehicle liability or property loss claim. When estimating our self-insurance liabilities, we consider a number of factors, including historical claims experience and trend-lines, projected medical and legal inflation, growth patterns and exposure forecasts. The assumptions made by management as they relate to each of these factors represent our judgment as to the most probable cumulative impact of each factor to our future obligations. Our calculation of self-insurance liabilities requires management to apply judgment to estimate the ultimate cost to settle reported claims and claims incurred but not yet reported as of the balance sheet date, and the application of alternative assumptions could result in a different estimate of these liabilities. Actual claim activity or development may vary from our assumptions and estimates, which may result in material losses or gains. As we obtain additional information that affects the assumptions and estimates we used to recognize liabilities for claims incurred in prior accounting periods, we adjust our self-insurance liabilities to reflect the revised estimates based on this additional information. These liabilities are recorded at our estimate of their net present value, using a credit-adjusted discount rate. These liabilities do not have scheduled maturities, but we can estimate the timing of future payments based upon historical patterns. We could apply alternative assumptions regarding the timing of payments or the applicable discount rate that could result in materially different estimates of the net present value of the liabilities. If self-insurance reserves were changed 10% from our estimated reserves at December 31, 2016,2019, the financial impact would have been approximately $13$16 million or 0.8%0.9% of pretax income for the year ended December 31, 2016.
Legal Reserves:
We maintain reserves for expenses associated with litigation, for which O’Reilly is currently involved. We are currently involved in litigation incidental to the ordinary conduct of our business. Management, with the assistance of outside legal counsel, must make estimates of potential legal obligations and possible liabilities arising from such litigation and records reserves for these expenditures. If legal reserves were changed 10% from our estimated reserves at December 31, 2016,2019, the financial impact would have been approximately $4$1 million or 0.2%less than 0.1% of pretax income for the year ended December 31, 2016.
Taxes:
We operate within multiple taxing jurisdictions and are subject to audit in these jurisdictions. These audits can involve complex issues, which may require an extended period of time to resolve. We regularly review our potential tax liabilities for tax years subject to audit. The amount of such liabilities is based on various factors, such as differing interpretations of tax regulations by the responsible tax authority, experience with previous tax audits and applicable tax law rulings. Changes in our tax liability may occur in the future as our assessments change based on the progress of tax examinations in various jurisdictions and/or changes in tax regulations. In management’s opinion, adequate provisions for income taxes have been made for all years presented. The estimates of our potential tax liabilities contain uncertainties because management must use judgment to estimate the exposures associated with our various tax
37
positions and actual results could differ from our estimates. Alternatively, we could have applied assumptions regarding the eventual outcome of the resolution of open tax positions that could differ from our current estimates but would still be reasonable given the nature of a particular position. While our estimates are subject to the uncertainty noted in the preceding discussion, our initial estimates of our potential tax liabilities have historically not been materially different from actual results, except in instances where we have reversed liabilities that were recorded for periods that were subsequently closed with the applicable taxing authority.
INFLATION AND SEASONALITY
We have generally been successful in reducing the effects of merchandise cost increases principally by taking advantage of supplier incentive programs, economies of scale resulting from increased volume of purchases and selective forward buying. To the extent our acquisition cost increased due to base commodity price increases industry-wide, we have typically been able
To some extent, our business is seasonal primarily as a result of the impact of weather conditions on customer buying patterns. While we have historically realized operating profits in each quarter of the year, our store sales and profits have historically been higher in the second and third quarters (April through September) than in the first and fourth quarters (October through March) of the year.
QUARTERLY RESULTS
The following tables set forth certain quarterly unaudited operating data for fiscal years ended December 31, 20162019 and 2015.2018. The unaudited quarterly information includes all adjustments, which management considers necessary for a fair presentation of the information shown (in thousands, except per share and comparable store sales data):
| | | | | | | | | | | | | | | | |
| | Fiscal 2019 | ||||||||||||||
| | First | | Second | | Third | | Fourth | ||||||||
|
| Quarter | | Quarter | | Quarter | | Quarter | ||||||||
Comparable store sales |
| | 3.2 | % | | | 3.4 | % | | | 5.0 | % | | | 4.4 | % |
Sales | | $ | 2,410,608 | | $ | 2,589,874 | | $ | 2,666,528 | | $ | 2,482,975 | ||||
Gross profit | |
| 1,279,290 | |
| 1,368,287 | |
| 1,422,530 | |
| 1,324,584 | ||||
Operating income | |
| 444,786 | |
| 498,074 | |
| 536,363 | |
| 441,503 | ||||
Net income | |
| 321,152 | |
| 353,681 | |
| 391,293 | |
| 324,916 | ||||
Earnings per share – basic (1) | | $ | 4.09 | | $ | 4.56 | | $ | 5.14 | | $ | 4.29 | ||||
Earnings per share – assuming dilution (1) | | $ | 4.05 | | $ | 4.51 | | $ | 5.08 | | $ | 4.25 | ||||
| | | | | | | | | | | | | | | | |
| | Fiscal 2018 |
| |||||||||||||
| | First | | Second | | Third | | Fourth | ||||||||
|
| Quarter | | Quarter | | Quarter | | Quarter | ||||||||
Comparable store sales |
| | 3.4 | % | | | 4.6 | % | | | 3.9 | % | | | 3.3 | % |
Sales | | $ | 2,282,681 | | $ | 2,456,073 | | $ | 2,482,717 | | $ | 2,314,957 | ||||
Gross profit | |
| 1,201,258 | |
| 1,288,638 | |
| 1,315,755 | |
| 1,234,315 | ||||
Operating income | |
| 422,846 | |
| 479,150 | |
| 485,148 | |
| 428,040 | ||||
Net income | |
| 304,906 | |
| 353,073 | |
| 366,151 | |
| 300,357 | ||||
Earnings per share – basic (1) | | $ | 3.65 | | $ | 4.32 | | $ | 4.54 | | $ | 3.76 | ||||
Earnings per share – assuming dilution (1) | | $ | 3.61 | | $ | 4.28 | | $ | 4.50 | | $ | 3.72 | ||||
| Fiscal 2016 | |||||||||||||||
| First Quarter | Second Quarter | Third Quarter | Fourth Quarter | ||||||||||||
| Comparable store sales | 6.1 | % | 4.3 | % | 4.2 | % | 4.8 | % | |||||||
| Sales | $ | 2,096,150 | $ | 2,176,689 | $ | 2,220,955 | $ | 2,099,302 | |||||||
| Gross profit | 1,097,579 | 1,127,179 | 1,170,026 | 1,114,227 | |||||||||||
| Operating income | 418,626 | 425,061 | 447,809 | 407,710 | |||||||||||
| Net income | 255,374 | 257,794 | 278,493 | 246,030 | |||||||||||
Earnings per share – basic (1) | $ | 2.63 | $ | 2.69 | $ | 2.93 | $ | 2.62 | |||||||
Earnings per share – assuming dilution (1) | $ | 2.59 | $ | 2.65 | $ | 2.90 | $ | 2.59 | |||||||
| Fiscal 2015 | |||||||||||||||
| First Quarter | Second Quarter | Third Quarter | Fourth Quarter | ||||||||||||
| Comparable store sales | 7.2 | % | 7.2 | % | 7.9 | % | 7.7 | % | |||||||
| Sales | $ | 1,901,903 | $ | 2,035,518 | $ | 2,080,201 | $ | 1,949,052 | |||||||
| Gross profit | 986,959 | 1,058,791 | 1,089,254 | 1,027,639 | |||||||||||
| Operating income | 350,373 | 385,768 | 415,260 | 362,620 | |||||||||||
| Net income | 212,864 | 233,508 | 266,268 | 218,576 | |||||||||||
Earnings per share – basic (1) | $ | 2.09 | $ | 2.32 | $ | 2.68 | $ | 2.22 | |||||||
Earnings per share – assuming dilution (1) | $ | 2.06 | $ | 2.29 | $ | 2.64 | $ | 2.19 | |||||||
| (1) | |
| Earnings per share amounts are computed independently for each quarter and annual period. The quarterly earnings per share amounts may not sum to equal the full-year earnings per share amount. |
The unaudited operating data presented above should be read in conjunction with our consolidated financial statements and related notes included elsewhere in this annual report, and the other financial information included therein.
RECENT ACCOUNTING PRONOUNCEMENTS
See Note 1 “Summary of 2014,Significant Accounting Policies” to the Consolidated Financial Accounting Standards Board (the “FASB”) issued Accounting Standard Update (“ASU”) No. 2014-09, “Revenue from Contracts with Customers (Topic 606)” (“ASU 2014-09”). Under ASU 2014-09, an entity is required to follow a five-step process to determine the amount of revenue to recognize when promised goods or services are transferred to customers. ASU 2014-09 offers specific accounting guidanceStatements for costs to obtain or fulfill a contract with a customer. In addition, an entity is required to disclose sufficient information to understand the nature, amount, timing, and uncertainty of revenue and cash flows arising from contracts with customers. In August of 2015, the FASB issued ASU No. 2015-14, “Revenue from Contracts with Customers (Topic 606): Deferral of the Effective Date” (“ASU 2015-14”), to defer the effective date of ASU 2014-09 by one year. For public companies, ASU 2015-14 changes ASU 2014-09 to be effective for annual reporting periods beginning after December 15, 2017, including interim periods within that reporting period. These ASUs can be adopted retrospectively or as a cumulative-effective adjustment at the date of adoption, with early adoption allowed, but not before December 15, 2016. We will adopt this guidance beginning with our first quarter ending March 31, 2018. We have established a task force, composed of multiple functional groups inside of the Company, that is currently in the process of evaluating critical components of this new guidance and the potential impact of the guidance on our financial position, results of operations and cash flows. Based on the preliminary work completed, we are considering the potential implications of the new standard on our recognition of customer related accounts receivable, warranty costs
38
Item 7A. Quantitative and Qualitative Disclosures about Market Risk
Interest rate risk:
We are subject to interest rate risk to the extent we borrow against our unsecured revolving credit facility (the “Revolving Credit Facility”) with variable interest rates based on either aan Alternative Base Rate or EurodollarAdjusted LIBO Rate, as defined in the credit agreement governing the Revolving Credit Facility. As of December 31, 2016,2019, we had no outstanding borrowings under our Revolving Credit Facility.
We had outstanding fixed rate debt of $1.90$3.65 billion and $1.40$3.15 billion as of December 31, 20162019 and 2015,2018, respectively. The fair value of our fixed rate debt was estimated at $1.98$3.88 billion and $1.47$3.12 billion as of December 31, 20162019 and 2015,2018, respectively, which was determined by reference to quoted market prices.
Cash equivalents risk:
We invest certain of our excess cash balances in short-term, highly-liquid instruments with maturities of 90 days or less. We do not expect any material losses from our invested cash balances and we believe that our interest rate exposure is minimal. As of December 31, 2016,2019, our cash and cash equivalents totaled $147$40 million.
Foreign currency risk:
Foreign currency exposures arising from transactions include firm commitments and anticipated transactions denominated in a currency other than our entities’ functional currencies. To minimize our risk, we generally enter into transactions denominated in the respective functional currencies. Our foreign currency exposure arises from Mexican peso-denominated revenues and profits and their translation into U.S. dollars.
We view our investments in Mexican subsidiaries as long-term. The net asset exposure in the Mexican subsidiaries translated into U.S. dollars using the year-end exchange rates was $151.9 million at December 31, 2019. The year-end exchange rates of the Mexican peso with respect to the U.S. dollar increased by approximately 3% from the acquisition date of November 29, 2019. The potential loss in value of our net assets in the Mexican subsidiaries resulting from a 10% change in quoted foreign currency exchange rates at December 31, 2019, would be approximately $13.8 million. Any changes in our net assets in the Mexican subsidiaries relating to foreign currency exchange rates would be reflected in the financial statement through the foreign currency translation component of accumulated other comprehensive income, unless the Mexican subsidiaries are sold or otherwise disposed.
A 10% change in average exchange rates would not have had a material impact on our results of operations.
39
MANAGEMENT’S REPORT ON INTERNAL CONTROL OVER FINANCIAL REPORTING
The management of O’Reilly Automotive, Inc. and Subsidiaries (the “Company”), under the supervision and with the participation of the Company’s principal executive officer and principal financial officer and effected by the Company’s Board of Directors, is responsible for establishing and maintaining adequate internal control over financial reporting as defined in Rule 13(a)-15(f) or 15(d)-15(f) under the Securities Exchange Act of 1934, as amended. The Company’s internal control system is designed to provide reasonable assurance regarding the reliability of financial reporting and the preparation of financial statements for external purposes in accordance with accounting principles generally accepted in the United States.
Internal control over financial reporting includes all policies and procedures that
| ● | pertain to the maintenance of records that, in reasonable detail, accurately and fairly reflect the transactions and dispositions of the assets of the Company; |
| ● | provide reasonable assurance that transactions are recorded as necessary to permit preparation of financial statements in accordance with accounting principles generally accepted in the United States of America, and that receipts and expenditures of the Company are being made only in accordance with authorizations of management and directors of the Company; and |
| ● | provide reasonable assurance regarding prevention or timely detection of unauthorized acquisition, use or disposition of the Company’s assets that could have a material effect on the financial statements. |
Management recognizes that all internal control systems, no matter how well designed, have inherent limitations. Therefore, even those systems determined to be effective can provide only reasonable assurance with respect to financial statement preparation and presentation. Also, projections of any evaluation of effectiveness to future periods are subject to risk. Over time, controls may become inadequate because of changes in conditions or deterioration in the degree of compliance with policies or procedures.
Under the supervision and with the participation of the Company’s principal executive officer and principal financial officer, management assessed the effectiveness of the Company’s internal control over financial reporting as of December 31, 2016.2019. In making this assessment, management used the criteria set forth by the Committee of Sponsoring Organizations of the Treadway Commission (“COSO”) in
As permitted by guidance issued by the Securities and Exchange Commission, management excluded from its assessment of its system of internal control over financial reporting the operations associated with the acquisition of Mayoreo de Autopartes y Aceites, S.A. de C.V. (“Mayasa”), pursuant to a stock purchase agreement, which was completed after the close of business on November 29, 2019. The acquired operations were included in the consolidated financial statements of the Company, which constituted 2% of total assets as of December 31, 2019, and less than 1% of revenues and less than 1% of net income for the year ended December 31, 2019.
Ernst & Young LLP, Independent Registered Public Accounting Firm, has audited the Company’s consolidated financial statements and has issued an attestation report on the effectiveness of the Company’s internal control over financial reporting, as stated in their report, which is included herein.
| | | | | |||
/s/ | Gregory D. Johnson | | /s/ | Thomas McFall | |||
Gregory D. Johnson | | Thomas McFall | |||||
Chief Executive Officer and | | Executive Vice President | |||||
Co-President | | Chief Financial Officer | |||||
February 28, | | February 28, 2020 | |||||
41
REPORT OF INDEPENDENT REGISTERED PUBLIC ACCOUNTING FIRM
To the Shareholders and the Board of Directors and Shareholders of O’Reilly Automotive, Inc. and Subsidiaries
Opinion on Internal Control Over Financial Reporting
We have audited O’Reilly Automotive, Inc. and Subsidiaries’ internal control over financial reporting as of December 31, 2016,2019, based on criteria established in Internal Control - Control—Integrated Framework issued by the Committee of Sponsoring Organizations of the Treadway Commission (2013 framework) (the COSO criteria). In our opinion, O’Reilly Automotive, Inc. and Subsidiaries’Subsidiaries (the Company) maintained, in all material respects, effective internal control over financial reporting as of December 31, 2019, based on the COSO criteria.
As indicated in the accompanying Management’s Report on Internal Control over Financial Reporting, management’s assessment of and conclusion on the effectiveness of internal control over financial reporting did not include the internal controls of Mayoreo de Autopartes y Aceites, S.A. de C.V. (Mayasa), which is included in the 2019 consolidated financial statements of the Company and constituted 2% of total assets as of December 31, 2019 and less than 1% of revenues and less than 1% of net income for the year ended December 31, 2019. Our audit of internal control over financial reporting of the Company also did not include an evaluation of the internal control over financial reporting of Mayasa.
We also have audited, in accordance with the standards of the Public Company Accounting Oversight Board (United States) (PCAOB), the consolidated balance sheets of the Company as of December 31, 2019 and 2018, the related consolidated statements of income, comprehensive income, shareholders’ equity and cash flows for each of the three years in the period ended December 31, 2019, and the related notes and financial statement schedule listed in the Index at Item 15(a) and our report dated February 28, 2020 expressed an unqualified opinion thereon.
Basis for Opinion
The Company’s management is responsible for maintaining effective internal control over financial reporting and for its assessment of the effectiveness of internal control over financial reporting included in the accompanying Management’s Report on Internal Control Overover Financial Reporting. Our responsibility is to express an opinion on the company’sCompany’s internal control over financial reporting based on our audit.
We conducted our audit in accordance with the standards of the Public Company Accounting Oversight Board (United States).PCAOB. Those standards require that we plan and perform the audit to obtain reasonable assurance about whether effective internal control over financial reporting was maintained in all material respects.
Our audit included obtaining an understanding of internal control over financial reporting, assessing the risk that a material weakness exists, testing and evaluating the design and operating effectiveness of internal control based on the assessed risk, and performing such other procedures as we considered necessary in the circumstances. We believe that our audit provides a reasonable basis for our opinion.
Definition and Limitations of Internal Control Over Financial Reporting
A company’s internal control over financial reporting is a process designed to provide reasonable assurance regarding the reliability of financial reporting and the preparation of financial statements for external purposes in accordance with generally accepted accounting principles. A company’s internal control over financial reporting includes those policies and procedures that (1) pertain to the maintenance of records that, in reasonable detail, accurately and fairly reflect the transactions and dispositions of the assets of the company; (2) provide reasonable assurance that transactions are recorded as necessary to permit preparation of financial statements in accordance with generally accepted accounting principles, and that receipts and expenditures of the company are being made only in accordance with authorizations of management and directors of the company; and (3) provide reasonable assurance regarding prevention or timely detection of unauthorized acquisition, use, or disposition of the company’s assets that could have a material effect on the financial statements.
Because of its inherent limitations, internal control over financial reporting may not prevent or detect misstatements. Also, projections of any evaluation of effectiveness to future periods are subject to the risk that controls may become inadequate because of changes in conditions, or that the degree of compliance with the policies or procedures may deteriorate.
/s/ Ernst & Young LLP
Kansas City, Missouri
February 28, 2020
42
REPORT OF INDEPENDENT REGISTERED PUBLIC ACCOUNTING FIRM
To the Shareholders and the Board of Directors of O’Reilly Automotive, Inc. and Subsidiaries maintained, in all material respects, effective internal control over financial reporting as of December 31, 2016, based
Opinion on the COSO criteria.
We also have audited in accordance with the standards of the Public Company Accounting Oversight Board (United States), theaccompanying consolidated balance sheets of O’Reilly Automotive, Inc. and Subsidiaries (the Company) as of December 31, 20162019 and 2015, and2018, the related consolidated statements of income, comprehensive income, shareholders’ equity and cash flows for each of the three years in the period ended December 31, 2016, of O’Reilly Automotive, Inc. and Subsidiaries and our report dated February 28, 2017, expressed an unqualified opinion thereon.
We also includedhave audited, in accordance with the standards of the Public Company Accounting Oversight Board (United States) (PCAOB), the Company’s internal control over financial statement schedule listedreporting as of December 31, 2019, based on criteria established in Internal Control-Integrated Framework issued by the Index at Item 15(a). Committee of Sponsoring Organizations of the Treadway Commission (2013 framework)and our report dated February 28, 2020 expressed an unqualified opinion thereon.
Adoption of New Accounting Standard
As discussed in Note 1 to the consolidated financial statements, the Company changed its method for accounting for leasing arrangements upon the adoption of Accounting Standard Codification Topic 842, Leases (“ASC 842”), on January 1, 2019. See below for discussion of our related critical audit matter.
Basis for Opinion
These financial statements and schedule are the responsibility of the Company’s management. Our responsibility is to express an opinion on thesethe Company’s financial statements and schedule based on our audits.
We conducted our audits in accordance with the standards of the Public Company Accounting Oversight Board (United States).PCAOB. Those standards require that we plan and perform the audit to obtain reasonable assurance about whether the financial statements are free of material misstatement. An audit includesmisstatement, whether due to error or fraud. Our audits included performing procedures to assess the risks of material misstatement of the financial statements, whether due to error or fraud, and performing procedures that respond to those risks. Such procedures included examining, on a test basis, evidence supportingregarding the amounts and disclosures in the financial statements. An auditOur audits also includes assessingincluded evaluating the accounting principles used and significant estimates made by management, as well as evaluating the overall presentation of the financial statement presentation.statements. We believe that our audits provide a reasonable basis for our opinion.
Critical Audit Matters
The critical audit matters communicated below are matters arising from the current period audit of the financial statements referredthat were communicated or required to above present fairly,be communicated to the audit committee and that: (1) relate to accounts or disclosures that are material to the financial statements and (2) involved our especially challenging, subjective or complex judgments. The communication of critical audit matters does not alter in all material respects, the consolidated financial position of O’Reilly Automotive, Inc. and Subsidiaries at December 31, 2016 and 2015, and the consolidated results of their operations and their cash flows for each of the three years in the period ended December 31, 2016, in conformity with U.S. generally accepted accounting principles. Also, inany way our opinion on the related financial statement schedule, when considered in relation to the basicconsolidated financial statements, taken as a whole, presents fairly in all material respectsand we are not, by communicating the information set forth therein.critical audit matters below, providing separate opinions on the critical audit matters or on the accounts or disclosures to which they relate.
| | |
| | Valuation of Self-insurance Reserves |
Description of the Matter | | At December 31, 2019, the Company’s self-insurance reserve was $157 million. As discussed in Note 1 of the financial statements, self-insurance liabilities are estimated based upon historical claim experience and trend-lines. Furthermore, certain of these liabilities were recorded at an estimate of their net present value, using a discount rate. Auditing management’s self-insurance reserves was complex and judgmental and required us to use our actuarial specialists due to the estimation required in determining the ultimate claim value and net present value |
43
of certain liabilities. The estimate is sensitive to assumptions such as the projected cost inflation, claim growth patterns and exposure forecasts. | ||
How We Addressed the Matter in Our Audit | | We obtained an understanding, evaluated the design of controls over the Company’s self-insurance estimation process and tested the operating effectiveness of those controls including management’s controls over reviewing the appropriateness of assumptions and the completeness and accuracy of the data underlying the reserves. To test the Company’s determination of the estimated self-insurance reserves, we performed audit procedures that included, among others, involving a specialist to assist in the development of an independent actuarial estimate for the reserve balance based upon current industry and economic trends, comparing certain selected assumptions used by management to our independent estimates which were developed with the assistance of our specialists, testing the underlying data used by management in the development of the reserves and testing the mathematical accuracy of the calculations. |
| | |
| | Adoption of New Lease Accounting Standard |
Description of the Matter | | As discussed above and in Note 1 to the consolidated financial statements, the Company adopted Accounting Standard Codification Topic 842, Leases (“ASC 842”), on January 1, 2019. The adoption of ASC 842 resulted in the recognition of right-of-use operating lease assets and operating lease liabilities of approximately $1.9 billion as of January 1, 2019. Since most of the leases do not provide a determinable implicit rate, the Company estimated its incremental borrowing rate (IBR) used to calculate its right of use assets and lease liabilities. Auditing the Company’s adoption of ASC 842 was challenging and involved subjective auditor judgment because the Company is party to a significant number of lease contracts and certain aspects of adopting ASC 842 required management to exercise judgment in applying the new standard to its portfolio of lease contracts. In particular, auditing management’s estimate of the incremental borrowing rate was especially challenging as it involved a high degree of subjective auditor judgment when testing the reasonableness of the inputs and appropriateness of the rates applied to each lease. |
How We Addressed the Matter in Our Audit | | We obtained an understanding and evaluated the design of controls over the Company’s accounting for the adoption of the ASC 842. We tested the operating effectiveness of those controls over management’s application of accounting policies, evaluation of the completeness of the lease portfolio, and over management’s review of the IBR. To test the Company’s implementation of the new leasing standard, our audit procedures included, among others, an evaluation of the completeness of the population of contracts that meet the definition of a lease under ASC 842 and testing the accuracy of the Company’s calculations of initial right-of-use assets and lease liabilities. Additionally, we evaluated management’s methodology for developing the IBR, sensitized the impacts of discounting, and compared the management’s IBRs to the Company’s existing market transactions with comparable terms. |
/s/ Ernst & Young LLP
We have served as the Company’s auditor since 1992.
Kansas City, Missouri
44
O’REILLY AUTOMOTIVE, INC. AND SUBSIDIARIES
CONSOLIDATED BALANCE SHEETS
(In thousands, except share data)
| December 31, | |||||||
| 2016 | 2015 | ||||||
| Assets | |||||||
| Current assets: | |||||||
| Cash and cash equivalents | $ | 146,598 | $ | 116,301 | |||
| Accounts receivable, less allowance for doubtful accounts $12,040 in 2016 and $9,637 in 2015 | 197,274 | 161,078 | |||||
| Amounts receivable from suppliers | 82,105 | 72,609 | |||||
| Inventory | 2,778,976 | 2,631,015 | |||||
| Other current assets | 53,022 | 29,023 | |||||
| Total current assets | 3,257,975 | 3,010,026 | |||||
| Property and equipment, at cost | 4,832,342 | 4,372,250 | |||||
| Less: accumulated depreciation and amortization | 1,708,911 | 1,510,694 | |||||
| Net property and equipment | 3,123,431 | 2,861,556 | |||||
| Notes receivable, less current portion | — | 13,219 | |||||
| Goodwill | 785,399 | 757,142 | |||||
| Other assets, net | 37,384 | 34,741 | |||||
| Total assets | $ | 7,204,189 | $ | 6,676,684 | |||
| Liabilities and shareholders’ equity | |||||||
| Current liabilities: | |||||||
| Accounts payable | $ | 2,936,656 | $ | 2,608,231 | |||
| Self-insurance reserves | 67,921 | 72,741 | |||||
| Accrued payroll | 71,717 | 59,101 | |||||
| Accrued benefits and withholdings | 74,454 | 72,203 | |||||
| Income taxes payable | — | 1,444 | |||||
| Other current liabilities | 249,901 | 232,678 | |||||
| Total current liabilities | 3,400,649 | 3,046,398 | |||||
| Long-term debt | 1,887,019 | 1,390,018 | |||||
| Deferred income taxes | 90,166 | 79,772 | |||||
| Other liabilities | 199,219 | 199,182 | |||||
| Shareholders’ equity: | |||||||
| Preferred stock, $0.01 par value: | |||||||
| Authorized shares - 5,000,000 | |||||||
| Issued and outstanding shares - none | — | — | |||||
| Common stock, $0.01 par value: | |||||||
| Authorized shares – 245,000,000 | |||||||
| Issued and outstanding shares – | |||||||
| 92,851,815 as of December 31, 2016, and | |||||||
| 97,737,171 as of December 31, 2015 | 929 | 977 | |||||
| Additional paid-in capital | 1,336,707 | 1,281,497 | |||||
| Retained earnings | 289,500 | 678,840 | |||||
| Total shareholders’ equity | 1,627,136 | 1,961,314 | |||||
| Total liabilities and shareholders’ equity | $ | 7,204,189 | $ | 6,676,684 | |||
| | | | | | |
| | December 31, | ||||
| | 2019 | | 2018 | ||
Assets |
| |
|
| |
|
Current assets: |
| |
|
| |
|
Cash and cash equivalents | | $ | 40,406 | | $ | 31,315 |
Accounts receivable, less allowance for doubtful accounts $14,417 in 2019 and $13,238 in 2018 | |
| 214,915 | |
| 192,026 |
Amounts receivable from suppliers | |
| 79,492 | |
| 78,155 |
Inventory | |
| 3,454,092 | |
| 3,193,344 |
Other current assets | |
| 44,757 | |
| 48,262 |
Total current assets | |
| 3,833,662 | |
| 3,543,102 |
| | | | | | |
Property and equipment, at cost | |
| 6,191,427 | |
| 5,645,552 |
Less: accumulated depreciation and amortization | |
| 2,243,224 | |
| 2,058,550 |
Net property and equipment | |
| 3,948,203 | |
| 3,587,002 |
| | | | | | |
Operating lease, right-of-use assets | | | 1,928,369 | | | — |
Goodwill | |
| 936,814 | |
| 807,260 |
Other assets, net | |
| 70,112 | |
| 43,425 |
Total assets | | $ | 10,717,160 | | $ | 7,980,789 |
| | | | | | |
Liabilities and shareholders’ equity | |
|
| |
|
|
Current liabilities: | |
|
| |
|
|
Accounts payable | | $ | 3,604,722 | | $ | 3,376,403 |
Self-insurance reserves | |
| 79,079 | |
| 77,012 |
Accrued payroll | |
| 100,816 | |
| 86,520 |
Accrued benefits and withholdings | |
| 98,539 | |
| 89,082 |
Income taxes payable | |
| — | |
| 11,013 |
Current portion of operating lease liabilities | | | 316,061 | | | — |
Other current liabilities | |
| 270,210 | |
| 253,990 |
Total current liabilities | |
| 4,469,427 | |
| 3,894,020 |
| | | | | | |
Long-term debt | |
| 3,890,527 | |
| 3,417,122 |
Operating lease liabilities, less current portion | | | 1,655,297 | | | — |
Deferred income taxes | |
| 133,280 | |
| 105,566 |
Other liabilities | |
| 171,289 | |
| 210,414 |
| | | | | | |
Shareholders’ equity: | |
|
| |
|
|
Preferred stock, $0.01 par value: | |
| | | | |
Authorized shares – 5,000,000 | | | | | | |
Issued and outstanding shares – NaN | | | — | |
| — |
Common stock, $0.01 par value: | |
| | | | |
Authorized shares – 245,000,000 | | | | | | |
Issued and outstanding shares – | | | | | | |
75,618,659 as of December 31, 2019, and | | | | | | |
79,043,919 as of December 31, 2018 | | | 756 | |
| 790 |
Additional paid-in capital | |
| 1,280,760 | |
| 1,262,063 |
Retained deficit | |
| (889,066) | |
| (909,186) |
Accumulated other comprehensive income | | | 4,890 | | | — |
Total shareholders’ equity | |
| 397,340 | |
| 353,667 |
| | | | | | |
Total liabilities and shareholders’ equity | | $ | 10,717,160 | | $ | 7,980,789 |
See accompanying Notes to consolidated financial statements.
45
O’REILLY AUTOMOTIVE, INC. AND SUBSIDIARIES
CONSOLIDATED STATEMENTS OF INCOME
(In thousands, except per share data)
| For the Year Ended December 31, | |||||||||||
| 2016 | 2015 | 2014 | |||||||||
| Sales | $ | 8,593,096 | $ | 7,966,674 | $ | 7,216,081 | |||||
| Cost of goods sold, including warehouse and distribution expenses | 4,084,085 | 3,804,031 | 3,507,180 | ||||||||
| Gross profit | 4,509,011 | 4,162,643 | 3,708,901 | ||||||||
| Selling, general and administrative expenses | 2,809,805 | 2,648,622 | 2,438,527 | ||||||||
| Operating income | 1,699,206 | 1,514,021 | 1,270,374 | ||||||||
| Other income (expense): | |||||||||||
| Interest expense | (70,931 | ) | (57,129 | ) | (53,290 | ) | |||||
| Interest income | 4,224 | 2,340 | 2,301 | ||||||||
| Other, net | 4,692 | 1,134 | 2,797 | ||||||||
| Total other expense | (62,015 | ) | (53,655 | ) | (48,192 | ) | |||||
| Income before income taxes | 1,637,191 | 1,460,366 | 1,222,182 | ||||||||
| Provision for income taxes | 599,500 | 529,150 | 444,000 | ||||||||
| Net income | $ | 1,037,691 | $ | 931,216 | $ | 778,182 | |||||
| Earnings per share-basic: | |||||||||||
| Earnings per share | $ | 10.87 | $ | 9.32 | $ | 7.46 | |||||
| Weighted-average common shares outstanding – basic | 95,447 | 99,965 | 104,262 | ||||||||
| Earnings per share-assuming dilution: | |||||||||||
| Earnings per share | $ | 10.73 | $ | 9.17 | $ | 7.34 | |||||
| Weighted-average common shares outstanding – assuming dilution | 96,720 | 101,514 | 106,041 | ||||||||
| | | | | | | | | |
| | For the Year Ended | |||||||
| | December 31, | |||||||
|
| 2019 |
| 2018 |
| 2017 | |||
Sales | | $ | 10,149,985 | | $ | 9,536,428 | | $ | 8,977,726 |
Cost of goods sold, including warehouse and distribution expenses | |
| 4,755,294 | |
| 4,496,462 | |
| 4,257,043 |
Gross profit | |
| 5,394,691 | |
| 5,039,966 | |
| 4,720,683 |
| | | | | | | | | |
Selling, general and administrative expenses | |
| 3,473,965 | |
| 3,224,782 | |
| 2,995,283 |
Operating income | |
| 1,920,726 | |
| 1,815,184 | |
| 1,725,400 |
| | | | | | | | | |
Other income (expense): | |
|
| |
|
| |
|
|
Interest expense | |
| (139,975) | |
| (122,129) | |
| (91,349) |
Interest income | |
| 2,545 | |
| 2,521 | |
| 2,347 |
Other, net | |
| 7,033 | |
| (1,489) | |
| 1,406 |
Total other expense | |
| (130,397) | |
| (121,097) | |
| (87,596) |
| | | | | | | | | |
Income before income taxes | |
| 1,790,329 | |
| 1,694,087 | |
| 1,637,804 |
Provision for income taxes | |
| 399,287 | |
| 369,600 | |
| 504,000 |
Net income | | $ | 1,391,042 | | $ | 1,324,487 | | $ | 1,133,804 |
| | | | | | | | | |
Earnings per share-basic: | |
|
| |
|
| |
|
|
Earnings per share | | $ | 18.07 | | $ | 16.27 | | $ | 12.82 |
Weighted-average common shares outstanding – basic | |
| 76,985 | |
| 81,406 | |
| 88,426 |
| | | | | | | | | |
Earnings per share-assuming dilution: | |
|
| |
|
| |
|
|
Earnings per share | | $ | 17.88 | | $ | 16.10 | | $ | 12.67 |
Weighted-average common shares outstanding – assuming dilution | |
| 77,788 | |
| 82,280 | |
| 89,502 |
See accompanying Notes to consolidated financial statements.
46
O’REILLY AUTOMOTIVE, INC. AND SUBSIDIARIES
CONSOLIDATED STATEMENTS OF COMPREHENSIVE INCOME
(In thousands)
| Common Stock | Additional Paid-In Capital | Retained Earnings | Total | |||||||||||||||
| Shares | Par Value | |||||||||||||||||
| Balance at December 31, 2013 | 105,940 | $ | 1,059 | $ | 1,118,929 | $ | 846,333 | $ | 1,966,321 | |||||||||
| Net income | — | — | — | 778,182 | 778,182 | |||||||||||||
| Issuance of common stock under employee benefit plans, net of forfeitures and shares withheld to cover taxes | 86 | 1 | 11,180 | — | 11,181 | |||||||||||||
| Net issuance of common stock upon exercise of stock options | 1,320 | 13 | 59,581 | — | 59,594 | |||||||||||||
| Excess tax benefit from share-based compensation | — | — | 49,150 | — | 49,150 | |||||||||||||
| Share based compensation | — | — | 20,474 | — | 20,474 | |||||||||||||
| Share repurchases, including fees | (5,743 | ) | (57 | ) | (64,385 | ) | (802,042 | ) | (866,484 | ) | ||||||||
| Balance at December 31, 2014 | 101,603 | $ | 1,016 | $ | 1,194,929 | $ | 822,473 | $ | 2,018,418 | |||||||||
| Net income | — | — | — | 931,216 | 931,216 | |||||||||||||
| Issuance of common stock under employee benefit plans, net of forfeitures and shares withheld to cover taxes | 59 | — | 11,630 | — | 11,630 | |||||||||||||
| Net issuance of common stock upon exercise of stock options | 976 | 10 | 52,901 | — | 52,911 | |||||||||||||
| Excess tax benefit from share-based compensation | — | — | 63,078 | — | 63,078 | |||||||||||||
| Share based compensation | — | — | 20,274 | — | 20,274 | |||||||||||||
| Share repurchases, including fees | (4,901 | ) | (49 | ) | (61,315 | ) | (1,074,849 | ) | (1,136,213 | ) | ||||||||
| Balance at December 31, 2015 | 97,737 | $ | 977 | $ | 1,281,497 | $ | 678,840 | $ | 1,961,314 | |||||||||
| Net income | — | — | — | 1,037,691 | 1,037,691 | |||||||||||||
| Issuance of common stock under employee benefit plans, net of forfeitures and shares withheld to cover taxes | 56 | 1 | 12,613 | — | 12,614 | |||||||||||||
| Net issuance of common stock upon exercise of stock options | 757 | 8 | 47,386 | — | 47,394 | |||||||||||||
| Excess tax benefit from share-based compensation | — | — | 55,994 | — | 55,994 | |||||||||||||
| Share based compensation | — | — | 17,566 | — | 17,566 | |||||||||||||
| Share repurchases, including fees | (5,698 | ) | (57 | ) | (78,349 | ) | (1,427,031 | ) | (1,505,437 | ) | ||||||||
| Balance at December 31, 2016 | 92,852 | $ | 929 | $ | 1,336,707 | $ | 289,500 | $ | 1,627,136 | |||||||||
| | | | | | | | | |
| | For the Year Ended | |||||||
| | December 31, | |||||||
|
| 2019 |
| 2018 |
| 2017 | |||
Net income | | $ | 1,391,042 | | $ | 1,324,487 | | $ | 1,133,804 |
Other comprehensive income: | | | | | | | | | |
Foreign currency translation adjustments | |
| 4,890 | |
| — | |
| — |
Total other comprehensive income | | | 4,890 | | | — | | | — |
| | | | | | | | | |
Comprehensive income | | $ | 1,395,932 | | $ | 1,324,487 | | $ | 1,133,804 |
See accompanying Notes to consolidated financial statements.
47
O’REILLY AUTOMOTIVE, INC. AND SUBSIDIARIES
CONSOLIDATED STATEMENTS OF SHAREHOLDERS’ EQUITY
(In thousands)
| For the Year Ended December 31, | |||||||||||
| 2016 | 2015 | 2014 | |||||||||
| Operating activities: | |||||||||||
| Net income | $ | 1,037,691 | $ | 931,216 | $ | 778,182 | |||||
| Adjustments to reconcile net income to net cash provided by operating activities: | |||||||||||
| Depreciation and amortization of property, equipment and intangibles | 217,866 | 210,256 | 194,205 | ||||||||
| Amortization of debt discount and issuance costs | 2,451 | 2,106 | 2,086 | ||||||||
| Excess tax benefit from share-based compensation | (55,994 | ) | (63,078 | ) | (49,150 | ) | |||||
| Deferred income taxes | 10,394 | (22,650 | ) | 1,487 | |||||||
| Share-based compensation programs | 18,859 | 21,899 | 23,095 | ||||||||
| Other | 6,434 | 6,839 | 5,592 | ||||||||
| Changes in operating assets and liabilities: | |||||||||||
| Accounts receivable | (38,548 | ) | (23,858 | ) | (19,271 | ) | |||||
| Inventory | (119,270 | ) | (76,226 | ) | (179,742 | ) | |||||
| Accounts payable | 322,427 | 191,064 | 360,646 | ||||||||
| Income taxes payable | 26,880 | 81,617 | 32,158 | ||||||||
| Accrued payroll | 12,616 | (19,341 | ) | 12,923 | |||||||
| Accrued benefits and withholdings | (808 | ) | 17,970 | 28,899 | |||||||
| Other | 13,169 | 23,662 | (680 | ) | |||||||
| Net cash provided by operating activities | 1,454,167 | 1,281,476 | 1,190,430 | ||||||||
| Investing activities: | |||||||||||
| Purchases of property and equipment | (476,344 | ) | (414,020 | ) | (429,987 | ) | |||||
| Proceeds from sale of property and equipment | 5,119 | 2,758 | 2,880 | ||||||||
| Payments received on notes receivable | 1,047 | 4,074 | 3,705 | ||||||||
| Other | (58,918 | ) | — | — | |||||||
| Net cash used in investing activities | (529,096 | ) | (407,188 | ) | (423,402 | ) | |||||
| Financing activities: | |||||||||||
| Proceeds from the issuance of long-term debt | 499,160 | — | — | ||||||||
| Payment of debt issuance costs | (4,125 | ) | — | — | |||||||
| Principal payments on capital leases | — | (25 | ) | (72 | ) | ||||||
| Repurchases of common stock | (1,505,437 | ) | (1,136,213 | ) | (866,484 | ) | |||||
| Excess tax benefit from share-based compensation | 55,994 | 63,078 | 49,150 | ||||||||
| Net proceeds from issuance of common stock | 59,634 | 64,613 | 69,620 | ||||||||
| Net cash used in financing activities | (894,774 | ) | (1,008,547 | ) | (747,786 | ) | |||||
| Net increase (decrease) in cash and cash equivalents | 30,297 | (134,259 | ) | 19,242 | |||||||
| Cash and cash equivalents at beginning of the year | 116,301 | 250,560 | 231,318 | ||||||||
| Cash and cash equivalents at end of the year | $ | 146,598 | $ | 116,301 | $ | 250,560 | |||||
| Supplemental disclosures of cash flow information: | |||||||||||
| Income taxes paid | $ | 569,677 | $ | 485,824 | $ | 416,458 | |||||
| Interest paid, net of capitalized interest | 63,648 | 55,061 | 51,203 | ||||||||
| | | | | | | | | | | | | | | | | |
|
| | | | |
| |
| | | Accumulated |
| | | |||
| | | | | | | Additional | | Retained | | Other | | | | |||
| | Common Stock | | Paid-In | | Earnings | | Comprehensive | | | | ||||||
|
| Shares |
| Par Value |
| Capital |
| (Deficit) | | Income |
| Total | |||||
Balance at December 31, 2016 |
| 92,852 | | $ | 929 | | $ | 1,336,707 | | $ | 289,500 | | $ | — | | $ | 1,627,136 |
Cumulative effective adjustment from adoption of ASU 2016-09 | | — | |
| — | |
| 434 | |
| (266) | |
| — | | | 168 |
Net income |
| — | |
| — | |
| — | |
| 1,133,804 | |
| — | |
| 1,133,804 |
Issuance of common stock under employee benefit plans, net of forfeitures and shares withheld to cover taxes |
| 66 | |
| — | |
| 13,466 | |
| — | |
| — | |
| 13,466 |
Net issuance of common stock upon exercise of stock options |
| 685 | |
| 7 | |
| 33,222 | |
| — | |
| — | |
| 33,229 |
Share based compensation |
| — | |
| — | |
| 17,773 | |
| — | |
| — | |
| 17,773 |
Share repurchases, including fees |
| (9,301) | |
| (93) | |
| (136,559) | |
| (2,035,878) | |
| — | |
| (2,172,530) |
Balance at December 31, 2017 |
| 84,302 | | $ | 843 | | $ | 1,265,043 | | $ | (612,840) | | $ | — | | $ | 653,046 |
Net income |
| — | |
| — | |
| — | |
| 1,324,487 | |
| — | |
| 1,324,487 |
Issuance of common stock under employee benefit plans, net of forfeitures and shares withheld to cover taxes |
| 58 | |
| — | |
| 14,173 | |
| — | |
| — | |
| 14,173 |
Net issuance of common stock upon exercise of stock options |
| 745 | |
| 8 | |
| 57,160 | |
| — | |
| — | |
| 57,168 |
Share based compensation |
| — | |
| — | |
| 18,806 | |
| — | |
| — | |
| 18,806 |
Share repurchases, including fees |
| (6,061) | |
| (61) | |
| (93,119) | |
| (1,620,833) | |
| — | |
| (1,714,013) |
Balance at December 31, 2018 |
| 79,044 | | $ | 790 | | $ | 1,262,063 | | $ | (909,186) | | $ | — | | $ | 353,667 |
Cumulative effective adjustment from adoption of ASU 2016-02 | | — | | | — | | | — | | | (1,410) | | | — | | | (1,410) |
Net income |
| — | |
| — | |
| — | |
| 1,391,042 | |
| | |
| 1,391,042 |
Other comprehensive income | | — | | | — | | | — | | | — | | | 4,890 | | | 4,890 |
Issuance of common stock under employee benefit plans, net of forfeitures and shares withheld to cover taxes |
| 46 | |
| — | |
| 15,302 | |
| — | |
| — | |
| 15,302 |
Net issuance of common stock upon exercise of stock options |
| 406 | |
| 5 | |
| 46,101 | |
| — | |
| — | |
| 46,106 |
Share based compensation |
| — | |
| — | |
| 20,534 | |
| — | |
| — | |
| 20,534 |
Share repurchases, including fees |
| (3,877) | |
| (39) | |
| (63,240) | |
| (1,369,512) | |
| — | |
| (1,432,791) |
Balance at December 31, 2019 |
| 75,619 | | $ | 756 | | $ | 1,280,760 | | $ | (889,066) | | $ | 4,890 | | $ | 397,340 |
See accompanying Notes to consolidated financial statements.
48
O’REILLY AUTOMOTIVE, INC. AND SUBSIDIARIES
CONSOLIDATED STATEMENTS OF CASH FLOWS
(In thousands)
| | | | | | | | | |
| | For the Year Ended | |||||||
| | December 31, | |||||||
|
| 2019 |
| 2018 |
| 2017 | |||
Operating activities: |
| |
|
| |
|
| |
|
Net income | | $ | 1,391,042 | | $ | 1,324,487 | | $ | 1,133,804 |
Adjustments to reconcile net income to net cash provided by operating activities: | |
|
| |
|
| |
|
|
Depreciation and amortization of property, equipment and intangibles | |
| 270,875 | |
| 258,937 | |
| 233,845 |
Amortization of debt discount and issuance costs | |
| 3,916 | |
| 3,470 | |
| 2,871 |
Deferred income taxes | |
| 21,158 | |
| 20,160 | |
| (4,593) |
Share-based compensation programs | |
| 21,921 | |
| 20,176 | |
| 19,401 |
Other | |
| 7,529 | |
| 9,895 | |
| 11,790 |
Changes in operating assets and liabilities: | |
| | |
| | |
|
|
Accounts receivable | |
| (15,577) | |
| 18,138 | |
| (27,742) |
Inventory | |
| (239,912) | |
| (163,367) | |
| (231,802) |
Accounts payable | |
| 213,423 | |
| 177,676 | |
| 253,265 |
Income taxes payable | |
| (20,139) | |
| 22,903 | |
| 14,220 |
Accrued payroll | |
| 14,296 | |
| 9,373 | |
| 5,430 |
Accrued benefits and withholdings | |
| 16,868 | |
| 28,022 | |
| 3,042 |
Other | |
| 23,079 | |
| (2,315) | |
| (9,844) |
Net cash provided by operating activities | |
| 1,708,479 | |
| 1,727,555 | |
| 1,403,687 |
| | | | | | | | | |
Investing activities: | |
|
| |
|
| |
|
|
Purchases of property and equipment | |
| (628,057) | |
| (504,268) | |
| (465,940) |
Proceeds from sale of property and equipment | |
| 7,118 | |
| 4,784 | |
| 4,464 |
Investment in tax credit equity investments | | | (33,781) | | | — | | | — |
Other, including acquisitions, net of cash acquired | |
| (142,026) | |
| (34,818) | |
| (2,747) |
Net cash used in investing activities | |
| (796,746) | |
| (534,302) | |
| (464,223) |
| | | | | | | | | |
Financing activities: | |
|
| |
|
| |
|
|
Proceeds from borrowings on revolving credit facility | |
| 2,708,000 | |
| 2,414,000 | |
| 3,101,000 |
Payments on revolving credit facility | |
| (2,734,000) | |
| (2,473,000) | |
| (2,755,000) |
Proceeds from the issuance of long-term debt | |
| 499,955 | |
| 498,660 | |
| 748,800 |
Payment of debt issuance costs | |
| (3,990) | |
| (3,923) | |
| (7,590) |
Repurchases of common stock | |
| (1,432,791) | |
| (1,714,013) | |
| (2,172,530) |
Net proceeds from issuance of common stock | |
| 60,206 | |
| 72,146 | |
| 45,762 |
Other | |
| (191) | |
| (2,156) | |
| (156) |
Net cash used in financing activities | |
| (902,811) | |
| (1,208,286) | |
| (1,039,714) |
| | | | | | | | | |
Effect of exchange rate changes on cash | | | 169 | | | — | | | — |
Net increase (decrease) in cash and cash equivalents | |
| 9,091 | |
| (15,033) | |
| (100,250) |
Cash and cash equivalents at beginning of the year | |
| 31,315 | |
| 46,348 | |
| 146,598 |
Cash and cash equivalents at end of the year | | $ | 40,406 | | $ | 31,315 | | $ | 46,348 |
| | | | | | | | | |
Supplemental disclosures of cash flow information: | |
|
| |
|
| |
|
|
Income taxes paid | | $ | 394,931 | | $ | 311,376 | | $ | 496,728 |
Interest paid, net of capitalized interest | |
| 134,634 | |
| 117,938 | |
| 77,766 |
See accompanying Notes to Consolidated Financial Statements
49
O’REILLY AUTOMOTIVE, INC. AND SUBSIDIARIES
NOTES TO CONSOLIDATED FINANCIAL STATEMENTS
December 31, 2019
NOTE 1
– SUMMARY OF SIGNIFICANT ACCOUNTING POLICIES
Nature of business:
O’Reilly Automotive, Inc. and its subsidiaries,Subsidiaries, collectively, “O’Reilly” or the “Company,” is a specialty retailer and supplier of automotive aftermarket parts. The Company’s stores carry an extensive product line, including new and remanufactured automotive hard parts, maintenance items and various automotive accessories. As of December 31, 2016,2019, the Company owned and operated 4,8295,439 stores in 47 U.S. states and 21 stores in Mexico, servicing both do-it-yourself (“DIY”) and the professional service provider customers. The Company’s robust distribution system provides stores with same-day or overnight access to an extensive inventory of hard-to-find items not typically stocked in the stores of other auto parts retailers.
Segment reporting:
The Company is managed and operated by a single management team reporting to the chief operating decision maker. O’Reilly stores have similar characteristics, including the nature of the products and services, the type and class of customers and the methods used to distribute products and provide service to its customers and, as a whole, make up a single operating segment. The Company does not prepare discrete financial information with respect to product lines, types of customers or geographic locations and as such has one1 reportable segment.
Principles of consolidation:
The consolidated financial statements include the accounts of the Company and its wholly-owned subsidiaries. All inter-company balances and transactions have been eliminated in consolidation.
Use of estimates:
The preparation of the consolidated financial statements, in conformity with United States (“U.S.”) generally accepted accounting principles (“GAAP”), requires management to make estimates and assumptions that affect the amounts reported in the consolidated financial statements and accompanying notes. Actual results could materially differ from those estimates.
Cash equivalents:
Cash equivalents include investments with maturities of 90 days or less on the date of purchase.
Foreign Currency:
The Company accounts for its Mexican operations using the local market currency, the Mexican peso, and converts its financial statements compiled for these operations from the Mexican peso to U.S. dollars. The cumulative gain on currency translation is included as a component of “Accumulated other comprehensive income” on the accompanying Consolidated Balance Sheets. See Note 12 for further information concerning the Company’s accumulated other comprehensive income.
Accounts receivable:
The Company maintains allowances for doubtful accounts for estimated losses resulting from the inability of the Company’s customers to make required payments. The Company considers the following factors when determining if collection is reasonably assured: customer creditworthiness, past transaction history with the customer, current economic and industry trends and changes in customer payment terms. Allowances for doubtful accounts are determined based on historical experience and an evaluation of the current composition of accounts receivable. Amounts due to the Company from its Team Members are included as a component of accounts receivable.in “Accounts receivable” on the accompanying Consolidated Balance Sheets. These amounts consist primarily of purchases of merchandise on Team Member accounts. Accounts receivable due from Team Members was approximately $1.2$0.9 million and $1.1 million as of December 31, 20162019 and 2015,2018, respectively.
The Company grants credit to certain customers who meet the Company’s pre-established credit requirements. Concentrations of credit risk with respect to these receivables are limited because the Company’s customer base consists of a large number of small customers, spreading the credit risk across a broad base. The Company also controls this credit risk through credit approvals, credit limits and accounts receivable and credit monitoring procedures. Generally, the Company does not require security when credit is granted to customers. Credit losses are provided for in the Company’s consolidated financial statements and have consistently been within management’s expectations.
50
The Company receives concessions from its suppliers through a variety of programs and arrangements, including allowances for new stores and warranties, volume purchase rebates and co-operative advertising. Co-operative advertising allowances that are incremental to the Company’s advertising program, specific to a product or event and identifiable for accounting purposes are reported as a reduction of advertising expense in the period in which the advertising occurred. All other supplier concessions are recognized as a reduction to the cost of sales. Amounts receivable from suppliers also includesinclude amounts due to the Company for changeover merchandise and product returns. The Company regularly reviews supplier receivables for collectability and assesses the need for a reserve for uncollectable amounts based on an evaluation of the Company’s suppliers’ financial positions and corresponding abilities to meet financial obligations. Management does not believe there is a reasonable likelihood that the Company will be unable to collect the amounts receivable from suppliers and the Company did not record a reserve for uncollectable amounts from suppliers in the consolidated financial statements as of December 31, 20162019 or 2015.
Inventory:
Inventory, which consists of automotive hard parts, maintenance items, accessories and tools, is stated at the lower of cost or market. Inventory also includes capitalized costs related to procurement, warehousing and distribution centers (“DC”s). Cost has been determined using the last-in, first-out (“LIFO”) method, which more accurately matches costs with related revenues. Over time, as the Company’s merchandise inventory purchases have increased, the Company negotiated improved acquisition costs from its suppliers and the corresponding price deflation exhausted the Company’s LIFO reserve balance. The Company’s policy is to not write up the value of its inventory in excess of its replacement cost, and accordingly, the Company’s merchandise inventory has been effectively recorded at replacement cost since December 31, 2013. The replacement cost of inventory was $2.78$3.47 billion and $2.63$3.20 billion as of December 31, 20162019 and 2015,2018, respectively. LIFO costs exceeded replacement costs by $132.0$31.0 million and $85.9$107.3 million at December 31, 20162019 and 2015,2018, respectively.
Fair value of financial instruments:
The Company uses the fair value hierarchy, which prioritizes the inputs used to measure the fair value of certain of its financial instruments. The hierarchy gives the highest priority to unadjusted quoted prices in active markets for identical assets or liabilities (Level 1 measurement) and the lowest priority to unobservable inputs (Level 3 measurement). The Company uses the income and market approaches to determine the fair value of its assets and liabilities. The three levels of the fair value hierarchy are set forth below:
| ● | Level 1 – Quoted prices (unadjusted) in active markets for identical assets or liabilities that the reporting entity can access at the measurement date. |
| ● | Level 2 – Inputs other than quoted prices in active markets included within Level 1 that are observable for the asset or liability, either directly or indirectly. |
| ● | Level 3 – Unobservable inputs for the asset or liability. |
See Note 23 for further information concerning the Company’s financial and non-financial assets and liabilities measured at fair value on a recurring and non-recurring basis.
Property and equipment:
Property and equipment are carried at cost. Depreciation is calculated using the straight-line method, generally over the estimated useful lives of the assets. Leasehold improvements are amortized over the lesser of the lease term or the estimated economic life of the assets. The lease term includes renewal options determined by management at lease inception, for which failure to execute renewal options would result in a substantial economic penalty to the Company. Maintenance and repairs are charged to expense as incurred. Upon retirement or sale, the cost and accumulated depreciation are eliminated and the gain or loss, if any, is recognized in the Company’s Consolidated Statements of Income. The Company reviews long-lived assets for impairment whenever events or changes in circumstances indicate that the carrying amount of an asset may not be fully recoverable.
Goodwill and other intangibles:
The accompanying Consolidated Balance Sheets at December 31, 20162019 and 2015,2018, include goodwill and other intangible assets recorded as the result of acquisitions. The Company operates a single reporting unit and reviews goodwill for impairment annually during the fourth quarter, or when events or changes in circumstances indicate the carrying value of these assets might exceed their current fair values, rather than systematically amortizingvalues. During 2019, the goodwill against earnings.impairment test included a qualitative assessment. During 2016 and 2015,2018, the goodwill impairment test included a quantitative assessment, which compared the fair value of the reporting unit to its carrying amount, including goodwill. The Company operatesCompany’s qualitative assessment found no evidence to suggest it is more likely than not that its fair value is less than its carrying amount, including goodwill, as a single reporting unit, and the Companyof December 31, 2019. The Company’s quantitative assessment determined that its fair value exceeded
51
its carrying value, including goodwill, as of December 31, 2016 and 2015; as2018. As such, no0 goodwill impairment adjustment was required as of December 31, 20162019 and 2015.2018. Finite-lived intangibles are carried at amortized cost and amortization is calculated using the straight-line method, generally over the estimated useful lives of the intangibles.
Impairment of long-lived assets:
The Company reviews its long-lived assets for impairment whenever events or changes in circumstances indicate that the carrying value of an asset may not be recoverable. When such an event occurs, the Company compares the sum of the undiscounted expected future cash flows of the asset (asset group) with the carrying amounts of the asset. If the undiscounted expected future cash flows are less than the carrying value of the assets, the Company measures the amount of impairment loss as the amount by which the carrying amount of the assets exceeds the fair value of the assets. The Company has not historically recorded any material impairment charges to its long-
Valuation of investments:
The Company has an unsecured obligation to pay, in the future, the value of deferred compensation and a Company match relating to employee participation in the Company’s nonqualified deferred compensation plan (the “Deferred Compensation Plan”). See Note 9 for further information concerning the Company’s benefit plans. The future obligation is adjusted to reflect the performance, whether positive or negative, of selected investment measurement options, chosen by each participant. The Company invests in various marketable securities with the intention of selling these securities to fulfill its future obligations under the Deferred Compensation Plan. The investments in this plan were stated at fair value based on quoted market prices, were accounted for as trading securities and were included as a component ofin “Other assets, net” on the accompanying Consolidated Balance Sheets as of December 31, 20162019 and 2015.2018. See Note 23 for further information concerning the fair value measurements of the Company’s marketable securities.
Leases:
The Company leases certain office space, retail stores, distribution centers and equipment under long-term, non-cancelable operating leases. Lease components are not accounted for separately from nonlease components. Leases generally include renewal options and some include options to purchase, provisions for percentage rent based on sales and/or incremental step increase provisions. The exercise of renewal options is typically at the Company’s sole discretion and all operating lease expense is recognized on a straight-line basis over the lease term. The Company’s lease agreements do not contain any material residual value guarantees or material restrictive covenants. The Company rents or subleases certain surplus real estate to third parties. Right-of-use assets and corresponding operating lease liabilities are recognized for all leases with an initial term greater than 12 months. See Note 5 for further information concerning the Company’s operating leases.
Self-insurance reserves:
The Company uses a combination of insurance and self-insurance mechanisms to provide for potential liabilities for Team Member health care benefits, workers’ compensation, vehicle liability, general liability and property loss. With the exception of certain Team Member health care benefit liabilities, employment related claims and litigation, certain commercial litigation and certain regulatory matters, the Company obtains third-party insurance coverage to limit its exposure. The Company estimates its self-insurance liabilities by considering a number of factors, including historical claims experience and trend-lines, projected medical and legal inflation, growth patterns and exposure forecasts. Certain of these liabilities were recorded at an estimate of their net present value, using a credit-adjusted discount rate.
The following table identifies the components of the Company’s self-insurance reserves as of December 31, 20162019 and 20152018 (in thousands):
| December 31, | |||||||
| 2016 | 2015 | ||||||
| Self-insurance reserves (undiscounted) | $ | 138,687 | $ | 141,173 | |||
| Self-insurance reserves (discounted) | 129,437 | 131,990 | |||||
| | | | | | |
| | December 31, | ||||
|
| 2019 |
| 2018 | ||
Self-insurance reserves (undiscounted) | | $ | 168,397 | | $ | 157,538 |
Self-insurance reserves (discounted) | |
| 156,585 | |
| 146,718 |
The current portion of the Company’s discounted self-insurance reserves totaled $67.9$79.1 million and $72.7$77.0 million as of December 31, 20162019 and 2015,2018, respectively, which was included in “Self-insurance reserves” on the accompanying Consolidate Balance Sheets as of December 31, 20162019 and 2015.2018. The remainder was included was included as a component ofin “Other liabilities” on the accompanying Consolidated Balance Sheets as of December 31, 20162019 and 2015.2018.
52
Warranties:
The Company offers warranties on certain merchandise it sells with warranty periods ranging from 30 days to limited lifetime warranties. The risk of loss arising from warranty claims is typically the obligation of the Company’s suppliers. Certain suppliers provide upfront allowances to the Company in lieu of accepting the obligation for warranty claims. For this merchandise, when sold, the Company bears the risk of loss associated with the cost of warranty claims. Differences between supplier allowances received by the Company, in lieu of warranty obligations and estimated warranty expense, are recorded as an adjustment to cost of sales. Estimated warranty costs, which are recorded as obligations at the time of sale, are based on the historical failure rate of each individual product line. The Company’s historical experience has been that failure rates are relatively consistent over time and that the ultimate cost of warranty claims to the Company has been driven by volume of units sold as opposed to fluctuations in failure rates or the variation of the cost of individual claims. See Note 78 for further information concerning the Company’s aggregate product warranty liabilities.
Litigation reserves:
O’Reilly is currently involved in litigation incidental to the ordinary conduct of the Company’s business. The Company records reservesaccrues for litigation losses in instances where a material adverse outcome is probable and the Company is able to reasonably estimate the probable loss. The Company reservesaccrues for an estimate of material legal costs to be incurred in pending litigation matters. Although the Company cannot ascertain the amount of liability that it may incur from any of these matters, it does not currently believe that, in the aggregate, these matters, taking into account applicable insurance and reserves,accruals, will have a material adverse effect on its consolidated financial position, results of operations or cash flows in a particular quarter or annual period. See Note 14 for further information concerning the Company’s litigation reserves.
Share repurchases:
In January of 2011, the Company’s Board of Directors approved a share repurchase program. Under the program, the Company may, from time to time, repurchase shares of its common stock, solely through open market purchases effected through a broker dealer at prevailing market prices, based on a variety of factors such as price, corporate trading policy requirements and overall market conditions.
Revenue recognition:
The Company’s primary source of revenue is derived from the sale of automotive aftermarket parts and merchandise to its customers. Revenue is recognized when performance obligations under the terms of a contract with a customer are satisfied, in an amount representing the consideration the Company expects to receive in exchange for transferring goods to the customer. Generally, the Company’s performance obligations are satisfied when the customer takes possession of the merchandise, which normally occurs immediately at the point of sale or through same day delivery of the merchandise. All sales are recorded net of estimated returns allowances, discounts and taxes. The company does not recognize revenue related to product warranties, as these are considered assurance warranty obligations.
Over-the-counter retail sales to DIY customers are recorded when the customer takes possession of the merchandise. Internet retail sales, included in sales to DIY customers, are recorded when the merchandise is shipped or when the customer picks up the merchandise at a store. Sales to professional service provider customers, also referred to as “commercial sales,” are recorded upon same-day delivery of the merchandise to the customer, generally at the customer’s place of business. WholesaleOther sales and sales adjustments primarily includes sales to Team Members, wholesale sales to other retailers also referred(“jobber sales”), equipment sales, discounts, rebates, deferred revenue adjustments relating to as “jobberthe Company’s retail loyalty program and adjustments to estimated sales” returns allowances. Sales to Team Members are recorded when the Team Member takes possession of the merchandise. Jobber sales are recorded upon shipment of the merchandise from a regional DCdistribution center with same-day delivery to the jobber customer’s location. Internet retail sales are recorded when the merchandise is shipped or when the merchandise is picked up in a store. All sales are recorded net of estimated returns allowances, discounts and taxes.
The Company maintains a retail loyalty program named O’Reilly O’Rewards, designed to build brand recognition. The program allowswhich represents a retail customer to enroll at no charge, does not impose a membership fee and provides members with the ability to earn loyalty points by making qualifying purchases at the Company’s stores. Upon reaching established thresholds, the members are automatically issued coupons, which expire 90 days after issuance, have no cash value and may be redeemed for most items in the Company’s stores with a total purchase price equal to or greater than the value of the coupon. Points accrued in a member’s account, which have not been awarded to the member with a coupon, expire 12 months after the date that they were earned.performance obligation. The Company records a deferred revenue liability, based on a breakage adjusted, estimated redemption rate, and a corresponding reduction in revenue in periods when loyalty points are earned by members. The Company recognizes revenue and a corresponding reduction to the deferred revenue liability in periods when loyalty program issued coupons are redeemed by members.members, generally within a period of three months from issuance, or when unredeemed points expire, generally within 12 months after the date they were earned, which satisfies the Company’s performance obligation. See Note 10 for further information concerning the Company’s revenue.
53
Cost of goods sold and selling, general and administrative expenses:
The following table illustrates the primary costs classified in each major expense category:
| | |
Cost of goods sold, including warehouse and distribution expenses | Selling, general and administrative expenses | |
Total cost of merchandise sold, including: | | Payroll and benefit costs for store and corporate Team Members |
Freight expenses associated with acquiring merchandise and with moving merchandise inventories from the Company’s distribution centers to the stores | | Occupancy costs of store and corporate facilities |
Defective merchandise and warranty costs | | Depreciation and amortization related to store and corporate assets |
Supplier allowances and incentives, including: | | Vehicle expenses for store delivery services |
Allowances that are not reimbursements for specific, incremental and identifiable costs | | Self-insurance costs |
Cash discounts on payments to suppliers | | Closed store expenses |
Costs associated with the Company’s supply chain, including: | | Other administrative costs, including: |
Payroll and benefit costs | | Accounting, legal and other professional services |
Warehouse occupancy costs | | Bad debt, banking and credit card fees |
Transportation costs | | Supplies |
Depreciation | | Travel |
Inventory shrinkage | | Advertising costs |
Advertising expenses:
Advertising expense consists primarily of expenses related to the Company’s integrated marketing program, which includes television, radio, in-store, digital and social media promotions, as well as sports and event sponsorships and direct mail and newspaper distribution, in-store and online promotions, and sports and event sponsorships.promotional distribution. The Company expenses advertising costs as incurred. The Company also participates in cooperative advertising arrangements with certain of its suppliers. Advertising expense, net of cooperative advertising allowances from suppliers that were incremental to the advertising program, specific to the product or event and identifiable for accounting purposes, total $83.0 million, $79.3 million, $81.4 million and $79.0$83.7 million for the years ended December 31, 2016, 20152019, 2018 and 2014,2017, respectively, which were included as a component ofin “Selling, general and administrative expenses” on the accompanying Consolidated Statements of Income.
Share-based compensation and benefit plans:
The Company sponsors employee share-based benefitcompensation plans and employee and director share-based compensationbenefit plans. The Company recognizes compensation expense over the requisite service period for its share-based plans based on the fair value of the awards on the date of the grant, award or issuance. Share-based plans include stock option awards, restricted stock awards and stock appreciation rights issued under the Company’s employee incentive plans and director stock plan, stock issued through the Company’s employee stock purchase plan and restricted stock awarded to employees and directors through other compensation plans.plan. See Note 911 for further information concerning the Company’s share-based compensation and benefit plans.
Pre-opening expenses:
Costs associated with the opening of new stores, which consist primarily of payroll and occupancy costs, are charged to “Selling, general and administrative expenses” on the accompanying Consolidated Statements of Income as incurred. Costs associated with the opening of new distribution centers, which consist primarily of payroll and occupancy costs, are included as a component ofin “Cost of goods sold, including warehouse and distribution expenses” on the accompanying Consolidated Statements of Income as incurred.
Interest expense:
The Company capitalizes interest costs as a component of construction in progress, based on the weighted-average interest rates incurred on its long-term borrowings. Total interest costs capitalized for the years ended December 31, 2016, 20152019, 2018 and 2014,2017, were $7.9$13.0 million, $7.4$9.1 million and $11.5$8.5 million, respectively, which were included in “Interest expense” on the accompanying Consolidated Statements of Income.
In conjunction with the issuance or amendment of long-term debt instruments, the Company incurs various costs, including debt registration fees, accounting and legal fees and underwriter and book runner fees. Debt issuance costs related to the Company’s long-term unsecured senior notes are recorded as a reduction of the principal amount of the corresponding unsecured senior notes. Debt issuance costs related to the Company’s unsecured revolving credit facility are recorded as an asset. These debt issuance costs have been deferred and are being amortized over the term of the corresponding debt instrument and the amortization expense is included as a component ofin “Interest expense” on the accompanying Consolidated Statements of Income. Deferred debt issuance costs totaled $10.6$18.0 million and $8.3$17.1 million, net of accumulated amortization, as of December 31, 20162019 and 2015,2018, respectively, of which $0.7$1.1 million and $1.2$1.5 million
54
were included as a component ofin “Other assets, net” as of December 31, 20162019 and 2015,2018, respectively, with the remainder included in “Long-term debt” on the accompanying Consolidated Balance Sheets.
The Company issued its long-term unsecured senior notes at a discount. The original issuance discountdiscounts on the senior notes isare recorded as a reduction of the principal amount due forof the corresponding senior notes and isare accreted over the term of the applicable senior note, with the accretion expense included as a component ofin “Interest expense” on the accompanying Consolidated Statements of Income. Original issuance discounts, net of accretion, totaled $3.1$3.5 million and $2.9$4.3 million as of December 31, 20162019 and 2015,2018, respectively.
See Note 57 for further information concerning debt issuance costs and original issuance discounts associated with the Company’s issuances of long-term debt instruments.
Income taxes:
The Company accounts for income taxes using the liability method, which requires the recognition of deferred tax assets and liabilities for the expected future tax consequences of events that have been included in the financial statements. Under this method, deferred tax assets and liabilities are determined based on differences between the U.S. GAAP basis and tax basis of assets and liabilities using enacted tax rules and rates currently scheduled to be in effect for the year in which the differences are expected to reverse. Tax carry forwards are also recognized in deferred tax assets and liabilities under this method. The effect of a change in tax rates on deferred tax assets and liabilities is recognized in income in the period of the enactment date. The Company would record a valuation allowance against deferred tax assets to the extent it is more likely than not the amount will not be realized, based upon evidence available at the time of the determination and any change in the valuation allowance is recorded in the period of a change in such determination.
The Company invests in certain tax credit funds that promote renewable energy. These investments generate a return primarily through the realization of federal tax credits and other tax benefits. The Company accounts for its renewable energy investments using the deferral method. Under this method, realized investment tax credits are recognized as a reduction of the renewable energy investments.
The Company regularly reviews its potential tax liabilities for tax years subject to audit. The
Earnings per share:
Basic earnings per share is calculated by dividing net income by the weighted-average number of common shares outstanding during the fiscal period. Diluted earnings per share is calculated by dividing the weighted-average number of common shares outstanding plus the common stock equivalents associated with the potential impact of dilutive stock options. Certain common stock equivalents that could potentially dilute basic earnings per share in the future were not included in the fully diluted computation because they would have been antidilutive. Generally, stock options are antidilutive and excluded from the earnings per share calculation when the exercise price exceeds the market price of the common shares. See Note 1316 for further information concerning the Company’s common stock equivalents.
New accounting pronouncements:
In February of 2016, the FASB issued ASU No. 2016-02, “Leases (Topic 842)” (“ASU 2016-02”). Under ASU 2016-02, an entity will beis required to recognize right-of-use assets and lease liabilities on its balance sheet and disclose key information about leasing arrangements. ASU 2016-02 offers specific accounting guidance for a lessee, a lessor and sale and leaseback transactions. Lessees and lessors are required to disclose qualitative and quantitative information about leasing arrangements to enable a user of the financial statements to assess the amount, timing and uncertainty of cash flows arising from leases. In July of 2018, the FASB issued ASU No. 2018-11, “Leases (Topic 842): Targeted Improvement” (“ASU 2018-11”), to provide an additional, optional transition method for adopting ASU 2016-02, which allows for an entity to choose to apply the new lease standard at adoption date and recognize a cumulative-effective adjustment to the opening balance of retained earnings in the period of adoption, while comparative periods presented will continue to be in accordance with current U.S. GAAP Topic 840. For public companies, ASU 2016-02Topic 842 is effective for annual reporting periods beginning after December 15, 2018, including interim periods within that reporting period, and requires a modified retrospective adoption, with early adoption permitted.period. The Company will adoptadopted this new guidance beginning with its first quarter ending March 31, 2019.2019, using the additional, optional transition method, the package of transitional practical expedients relating to the identification, classification and initial direct costs of leases commencing before the effective date of
55
Topic 842, the transitional practical expedient for the treatment of existing land easements and the practical expedient to make an accounting policy election, by class of underlying asset, to not separate nonlease components from lease components; however, the Company did not elect the hindsight transitional practical expedient. The Company has established a task force, composed of multiple functional groups insidemade an accounting policy election to not apply recognition requirements of the Company, that is currently inguidance to short-term leases. Due to the process of evaluating critical componentsadoption of this new guidance, the Company recognized right-of-use assets and lease liabilities of $1.9 billion and $2.0 billion, respectively, on the potential impactaccompanying Condensed Consolidated Balance Sheets as of December 31, 2019. The difference between the right-of-use assets and lease liabilities on the accompanying Condensed Consolidated Balance Sheet was primarily due to the accrual for straight-line rent expense. The Company made an adjustment to opening “Retained Deficit” on the accompanying Condensed Consolidated Balance Sheet in the amount of $1.4 million, net of the guidance on the Company’s financial position, results of operations and cash flows. Based on the preliminary work completed, the Company is considering the potential implications of the new standard on determining the discount ratedeferred tax impact, related to be used in valuing new and existing leases, the treatment of existing favorable and unfavorable lease agreements acquired in connection with previous acquisitions, procedural and operational changes that may be necessary to comply with the provisions of the guidance and all applicable financial statement disclosures required by the new guidance, all of which are areas that could potentially be impacted by adoption of the guidance. At this time, the task force has not completed its full evaluation; however, the Company believes the adoption of this new guidance. With the new guidance will have a material impact on the total assets and total liabilities reported on the Company’s consolidated balance sheets.
In June of 2016, the FASB issued ASU No. 2016-13, “Financial Instruments - Credit Losses (Topic 326): Measurement of Credit Losses on Financial Instruments” (“ASU 2016-13”). Under ASU 2016-13, businesses and other organizations are required to present financial assets, measured at amortized costs basis, at the net amount expected to be collected. The allowance for credit losses is a valuation account that is deducted from the amortized cost basis, such as trade receivables. The measurement of expected credit loss will be based on historical experience, current conditions, and reasonable and supportable forecasts that affect the collectibility of the reported amount. For public companies, ASU 2016-13 is effective for annual reporting periods beginning after December 15, 2019, including interim periods within that reporting period, and requires a modified retrospective adoption, with early adoption permitted. The Company will adopt this guidance beginning with its first quarter ending March 31, 2020. The application of this new guidance is not expected to have a material impact on the Company’s consolidated financial condition, results of operations or cash flows.
In January of 2017, the FASB issued ASU No. 2017-04, “Intangibles - Goodwill and Other (Topic 350): Simplifying the Test for Goodwill Impairment” (“ASU 2017-04”). ASU 2017-04 eliminates the second step in the previous process for goodwill impairment testing; instead, the test is now a one-step process that calls for goodwill impairment loss to be measured as the excess of the reporting unit’s carrying amount over its fair value. For public companies, ASU 2017-04 is effective for annual reporting periods beginning after December 15, 2019, including interim periods within that reporting period, and requires prospective adoption, with early adoption after January 1, 2017. The Company will adoptearly adopted this guidance beginning with its first quarter ending March 31, 2019. The application of this new guidance isdid not expected to have a material impact on the Company’s consolidated financial condition, results of operations or cash flows.
NOTE 2 – BUSINESS COMBINATION
After the close of business on November 29, 2019, the Company completed the acquisition of Mayoreo de Autopartes y Aceites, S.A. de C.V. (“Mayasa”), a specialty retailer of automotive aftermarket parts headquartered in Guadalajara, Jalisco, Mexico pursuant to a stock purchase agreement. At the time of the acquisition, Mayasa operated 6 distribution centers, 21 Orma Autopartes stores and served over 2,000 independent jobber locations in 28 Mexican states. The results of Mayasa’s operations have been included in the Company’s consolidated financial statements beginning from the date of acquisition. Pro forma results of operations related to the acquisition of Mayasa are not presented as Mayasa’s results are not material to the Company’s results of operations.
The purchase price allocation process consists of collecting data and information to enable the Company to value the assets acquired and liabilities assumed as a result of the business combination. Potential identifiable intangible assets under evaluation include, but are not limited to, trade names and trademarks, non-compete agreements and customer relationships. In addition, other assets, including internal use software, and other liabilities may be identified, valued and recorded. Due to the close proximity of the Mayasa acquisition closing date and the Company’s fiscal year end, the Company remains in the initial measurement period.
The preliminary purchase price allocation, which is provisional and will change as additional information is obtained and valuation work is completed during the initial measurement period, resulted in the initial recognition of $128.1 million of goodwill and intangible assets included in “Goodwill” on the accompanying Consolidated Balance Sheets as of December 31, 2019. Goodwill generated from this acquisition is not amortizable for tax purposes.
See Note 6 for further information concerning the Company’s goodwill and other intangible assets.
56
NOTE 23 – FAIR VALUE MEASUREMENTS
Financial assets and liabilities measured at fair value on a recurring basis:
The Company’s marketable securities were accounted for as trading securities and the carrying amount of the Company’sits marketable securities were included as a component ofin “Other assets, net” on the accompanying Consolidated Balance Sheets as of December 31, 20162019 and 2015.2018. The Company recorded an increase in fair value related to its marketable securities in the amount of $1.9$5.8 million for the
The tables below identify the estimated fair value of the Company’s marketable securities, determined by reference to quoted market prices (Level 1), as of December 31, 20162019 and 20152018 (in thousands):
| December 31, 2016 | |||||||||||||||
Quoted Prices in Active Markets for Identical Instruments (Level 1) | Significant Other Observable Inputs (Level 2) | Significant Unobservable Inputs (Level 3) | Total | ||||||||||||
| Marketable securities | $ | 20,462 | $ | — | $ | — | $ | 20,462 | |||||||
| December 31, 2015 | |||||||||||||||
| Quoted Prices in Active Markets for Identical Instruments (Level 1) | Significant Other Observable Inputs (Level 2) | Significant Unobservable Inputs (Level 3) | Total | ||||||||||||
| Marketable securities | $ | 16,895 | $ | — | $ | — | $ | 16,895 | |||||||
| | | | | | | | | | | | |
| | December 31, 2019 | ||||||||||
| | Quoted Priced in Active Markets | | Significant Other | | Significant | | | | |||
| | for Identical Instruments | | Observable Inputs | | Unobservable Inputs | | | | |||
|
| (Level 1) |
| (Level 2) |
| (Level 3) |
| Total | ||||
Marketable securities | | $ | 32,201 | | $ | — | | $ | — | | $ | 32,201 |
| | | | | | | | | | | | |
| | December 31, 2018 | ||||||||||
| | Quoted Prices in Active Markets | | Significant Other | | Significant | | | ||||
| | for Identical Instruments | | Observable Inputs | | Unobservable Inputs | | | ||||
|
| (Level 1) |
| (Level 2) |
| (Level 3) |
| Total | ||||
Marketable securities | | $ | 25,493 | | $ | — | | $ | — | | $ | 25,493 |
Non-financial assets and liabilities measured at fair value on a nonrecurring basis:
Certain long-lived non-financial assets and liabilities may be required to be measured at fair value on a nonrecurring basis in certain circumstances, including when there is evidence of impairment. These non-financial assets and liabilities may include assets acquired in a business combination or property and equipment that are determined to be impaired. As of December 31, 20162019 and 2015,2018, the Company did not have any non-financial assets or liabilities that had been measured at fair value subsequent to initial recognition.
Fair value of financial instruments:
The carrying amounts of the Company’s senior notes and unsecured revolving credit facility borrowings are included in “Long-term debt” on the accompanying Consolidated Balance Sheets as of December 31, 20162019 and 2015. See Note 5 for further information concerning the Company’s senior notes.
The table below identifies the estimated fair value of the Company’s senior notes, using the market approach. The fair values as of December 31, 20162019 and 2015,2018, were determined by reference to quoted market prices of the same or similar instruments (Level 2) (in thousands):
| December 31, 2016 | December 31, 2015 | ||||||||||||||
| Carrying Amount | Estimated Fair Value | Carrying Amount | Estimated Fair Value | ||||||||||||
| $500 million, 4.875% Senior Notes due 2021 | $ | 496,758 | $ | 538,678 | $ | 495,951 | $ | 542,078 | |||||||
| $300 million, 4.625% Senior Notes due 2021 | 298,679 | 321,633 | 298,396 | 319,620 | |||||||||||
| $300 million, 3.800% Senior Notes due 2022 | 297,868 | 310,802 | 297,535 | 303,595 | |||||||||||
| $300 million, 3.850% Senior Notes due 2023 | 298,355 | 307,860 | $ | 298,136 | $ | 302,468 | |||||||||
| $500 million, 3.550% Senior Notes due 2026 | $ | 495,359 | $ | 498,537 | |||||||||||
| | | | | | | | | | | | |
| | December 31, 2019 | | December 31, 2018 | ||||||||
| | Carrying Amount | | Estimated Fair Value | | Carrying Amount | | Estimated Fair Value | ||||
Senior Notes | | $ | 3,629,527 | | $ | 3,881,925 | | $ | 3,130,122 | | $ | 3,116,046 |
The carrying amount of the Company’s unsecured revolving credit facility approximates fair value, as borrowings under the facility bear variable interest at current market rates. See Note 7 for further information concerning the Company’s senior notes and unsecured revolving credit facility.
The accompanying Consolidated Balance Sheets include other financial instruments, including cash and cash equivalents, accounts receivable, amounts receivable from suppliers and accounts payable. Due to the short-term nature of these financial instruments, the Company believes that the carrying values of these instruments approximate their fair values.
57
NOTE 34 – PROPERTY AND EQUIPMENT
The following table identifies the types and balances of property and equipment included in “Property and equipment, at cost” on the accompanying Consolidated Balance Sheets as of December 31, 20162019 and 2015,2018, and includes the estimated useful lives for its types of property and equipment (in thousands, except original useful lives):
| Original Useful Lives | December 31, 2016 | December 31, 2015 | |||||||
| Land | $ | 648,689 | $ | 590,244 | |||||
| Buildings and building improvements | 15 – 39 years | 1,805,347 | 1,603,389 | ||||||
| Leasehold improvements | 3 – 25 years | 593,785 | 554,198 | ||||||
| Furniture, fixtures and equipment | 3 – 20 years | 1,215,929 | 1,108,127 | ||||||
| Vehicles | 5 – 10 years | 359,362 | 313,401 | ||||||
| Construction in progress | 209,230 | 202,891 | |||||||
| Total property and equipment | 4,832,342 | 4,372,250 | |||||||
| Less: accumulated depreciation and amortization | 1,708,911 | 1,510,694 | |||||||
| Net property and equipment | $ | 3,123,431 | $ | 2,861,556 | |||||
| | | | | | | | |
|
| Original Useful |
| | | | ||
| | Lives | | December 31, 2019 | | December 31, 2018 | ||
Land | | | | $ | 805,556 |
| $ | 745,050 |
Buildings and building improvements | | 15 – 39 years | |
| 2,378,074 |
| | 2,147,969 |
Leasehold improvements | | 3 – 25 years | |
| 751,155 |
| | 686,058 |
Furniture, fixtures and equipment | | 3 – 20 years | |
| 1,450,444 |
| | 1,350,808 |
Vehicles | | 5 – 10 years | |
| 447,939 |
| | 424,421 |
Construction in progress | | | |
| 358,259 |
| | 291,246 |
Total property and equipment | | | |
| 6,191,427 |
| | 5,645,552 |
Less: accumulated depreciation and amortization | | | |
| 2,243,224 |
| | 2,058,550 |
Net property and equipment | | | | $ | 3,948,203 | | $ | 3,587,002 |
The Company recorded depreciation and amortization expense related to property and equipment in the amounts of $217.0$267.3 million, $203.4$246.0 million and $193.4$232.7 million for the years ended December 31, 2016, 20152019, 2018 and 2014,2017, respectively, which were primarily included as a component ofin “Selling, general and administrative expenses” on the accompanying Consolidated Statements of Income.
The Company recorded a charge of $1.9 million and $11.4 million related to property and equipment for the year ended December 31, 2019 and 2018, respectively, primarily due to the disposal of certain software projects that were no longer expected to provide a long-term benefit, which was included in “Selling, general and administrative expenses” on the accompanying Consolidated Statements of Income.
NOTE 5 – LEASES
Operating lease commitments:
See Note 1 for further information concerning the Company’s adoption of Accounting Standard Codification 842 - Leases.
The following table summarizes Total lease cost for the year ended December 31, 2019, which was primarily included in “Selling, general and administrative expenses” on the accompanying Consolidated Statements of Income (in thousands):
| | | |
| | For the Year Ended | |
|
| December 31, 2019 | |
Operating lease cost | | $ | 320,480 |
Short-term operating lease cost | |
| 5,899 |
Variable operating lease cost | |
| 76,027 |
Sublease income | |
| (4,112) |
Total lease cost | | $ | 398,294 |
The following table summarizes the Net rent expense amounts, prior to the adoption of Accounting Standard Codification 842 – Leases, for the years ended December 31, 2018 and 2017, which were included in “Selling, general and administrative expenses” on the accompanying Consolidated Statements of Income (in thousands):
| | | | | | |
| | For the Year Ended | ||||
| | December 31, | ||||
|
| 2018 |
| 2017 | ||
Minimum operating lease expense | | $ | 305,613 | | $ | 289,245 |
Contingent rents | |
| 806 | |
| 1,049 |
Other lease related occupancy costs | |
| 14,449 | |
| 12,478 |
Total rent expense | |
| 320,868 | |
| 302,772 |
Less: sublease income | |
| 3,585 | |
| 4,158 |
Net rent expense | | $ | 317,283 | | $ | 298,614 |
58
The following table summarizes other lease related information for the year ended December 31, 2019:
| | | | |
|
| For the Year Ended | ||
| | December 31, 2019 | ||
Cash paid for amounts included in the measurement of operating lease liabilities: |
| |
| |
Operating cash flows from operating leases (in thousands) | | $ | 318,048 | |
Right-of-use assets obtained in exchange for new operating lease liabilities (in thousands) | | $ | 233,584 | |
Weighted-average remaining lease term - operating leases | |
| 10.4 | Years |
Weighted-average discount rate - operating leases | |
| 4.1 | % |
The following table identifies the future minimum lease payments under all of the Company’s operating leases for each of the next five years, and in the aggregate thereafter, and reconciles to the present value of the “Operating lease liabilities, less current portion” included in the accompanying Consolidated Balance Sheet as of December 31, 2019 (in thousands):
| | | | | | | | | |
| | December 31, 2019 | |||||||
|
| Related Parties |
| Non-Related Parties |
| Total | |||
2020 | | $ | 4,765 | | $ | 311,285 | | $ | 316,050 |
2021 | | | 4,347 | | | 294,909 | | | 299,256 |
2022 | |
| 3,590 | |
| 271,256 | |
| 274,846 |
2023 | |
| 3,218 | |
| 240,815 | |
| 244,033 |
2024 | |
| 1,472 | |
| 211,352 | |
| 212,824 |
Thereafter | |
| 2,801 | |
| 1,087,409 | |
| 1,090,210 |
Total operating lease payments | |
| 20,193 | |
| 2,417,026 | |
| 2,437,219 |
Less: present value discount | |
| 2,049 | |
| 463,812 | |
| 465,861 |
Total operating lease liabilities | |
| 18,144 | |
| 1,953,214 | |
| 1,971,358 |
Less: current portion of operating lease liabilities | |
| 4,765 | |
| 311,296 | |
| 316,061 |
Operating lease liabilities, less current portion | | $ | 13,379 | | $ | 1,641,918 | | $ | 1,655,297 |
See Note 14 for further information concerning the Company’s related party operating leases.
The future minimum lease payments under the Company’s operating leases, in the table above, do not include potential amounts for percentage rent and other variable operating lease related costs and have not been reduced by expected future minimum sublease income under non-cancelable subleases, which was approximately $18.6 million as of December 31, 2019.
The present value discount component of the future minimum lease payments under the Company’s operating leases, in the table above, was primarily calculated using the Company’s incremental borrowing rate based on information available at the lease commencement or modification date. Inputs for the calculation of the Company’s incremental borrowing rate include valuations and yields of U.S. domestic investment grade corporate bonds and the applicable credit spread over comparable U.S. Treasury rates, adjusted to a collateralized basis by estimating the credit spread improvement that would result from an upgrade of one ratings classification. For leases that commenced prior to January 1, 2019, the incremental borrowing rate used was as of January 1, 2019. When the implicit rate of a lease is available, the implicit rate is used in the calculation and not the Company’s incremental borrowing rate.
NOTE 46 – GOODWILL AND OTHER INTANGIBLES
Goodwill:
Goodwill is reviewed for impairment annually during the fourth quarter, or more frequently if events or changes in business conditionscircumstances indicate that impairment may exist. Goodwill is not amortizable for financial statement purposes. The Company did not record any goodwill impairment during the years ended December 31, 20162019 or 2015.
The carrying amount of the Company’s goodwill was included in “Goodwill” on the accompanying ConsolidateConsolidated Balance Sheets as of December 31, 20162019 and 2015.2018, respectively. During the yearyears ended December 31, 20162019 and 2015,2018, the Company recorded an increase in goodwill of $28.3$1.5 million and $0.8$18.2 million, respectively, resulting from small acquisitions.
The preliminary purchase price allocation related to the acquisition of Mayasa resulted in the initial recognition of goodwill and intangible assets in the amount of $128.1 million as of December 31, 2019, including changes resulting from foreign currency translations. This provisional amount will change as additional information is obtained and valuation work is completed during the initial measurement period.
59
The following table identifies the changes in goodwill and acquisition intangibles, which were included in “Goodwill” on the accompanying Consolidated Balance Sheets for the years ended December 31, 20162019 and 20152018 (in thousands):
| 2016 | 2015 | ||||||
| Goodwill, balance at January 1, | $ | 757,142 | $ | 756,384 | |||
| Change in goodwill | 28,257 | 758 | |||||
| Goodwill, balance at December 31, | $ | 785,399 | $ | 757,142 | |||
| | | | | | |
|
| 2019 |
| 2018 | ||
Goodwill, balance at January 1, | | $ | 807,260 | | $ | 789,058 |
Change in goodwill related to small acquisitions | |
| 1,464 | |
| 18,202 |
Provisional goodwill and intangibles related to Mayasa acquisition | | | 128,090 | | | — |
Goodwill, balance at December 31, | | $ | 936,814 | | $ | 807,260 |
As of December 31, 20162019 and 2015,2018, other than goodwill, the Company did not have any other indefinite-lived intangible assets.
Intangibles other than goodwill:
The following table identifies the components of the Company’s amortizable intangibles as of December 31, 20162019 and 20152018 (in thousands):
| Cost of Amortizable Intangibles | Accumulated Amortization (Expense) Benefit | Net Amortizable Intangibles | |||||||||||||||||||||
| December 31, 2016 | December 31, 2015 | December 31, 2016 | December 31, 2015 | December 31, 2016 | December 31, 2015 | ||||||||||||||||||
| Amortizable intangible assets: | |||||||||||||||||||||||
| Favorable leases | $ | 27,960 | $ | 32,070 | $ | (18,104 | ) | $ | (19,991 | ) | $ | 9,856 | $ | 12,079 | |||||||||
| Non-compete agreements | 1,887 | 732 | (414 | ) | (409 | ) | 1,473 | 323 | |||||||||||||||
| Total amortizable intangible assets | $ | 29,847 | $ | 32,802 | $ | (18,518 | ) | $ | (20,400 | ) | $ | 11,329 | $ | 12,402 | |||||||||
| Unfavorable leases | $ | 19,950 | $ | 28,580 | $ | 15,840 | $ | 22,415 | $ | 4,110 | $ | 6,165 | |||||||||||
| | | | | | | | | | | | | | | | | | |
| | Cost of Amortizable | | Accumulated Amortization | | | ||||||||||||
| | Intangibles | | (Expense) Benefit | | Net Amortizable Intangibles | ||||||||||||
|
| December 31, |
| December 31, |
| December 31, |
| December 31, |
| December 31, |
| December 31, | ||||||
| | 2019 | | 2018 | | 2019 | | 2018 | | 2019 | | 2018 | ||||||
Amortizable intangible assets: |
| |
|
| |
|
| |
|
| |
|
| |
|
| |
|
Favorable leases | | $ | — | | $ | 18,930 | | $ | — | | $ | (12,564) | | $ | — | | $ | 6,366 |
Non-compete agreements | |
| 2,717 | |
| 2,757 | |
| (928) | |
| (679) | |
| 1,789 | |
| 2,078 |
Total amortizable intangible assets | | $ | 2,717 | | $ | 21,687 | | $ | (928) | | $ | (13,243) | | $ | 1,789 | | $ | 8,444 |
| | | | | | | | | | | | | | | | | | |
Unfavorable leases | | $ | — | | $ | 10,180 | | $ | — | | $ | 8,486 | | $ | — | | $ | 1,694 |
During the years ended December 31, 20162019 and 2015,2018, the Company recorded non-compete agreement assets in conjunction with small acquisitions in the amounts of $1.1less than $0.1 million and $0.2$0.9 million, respectively.
With the adoption of Accounting Standard Codification 842 – Leases, the Company’s favorable lease assets and unfavorable lease liabilities, from a previous acquisition, were eliminated. See Note 1 for further information concerning the Company’s adoption of Accounting Standard Codification 842 – Leases.
In prior years, the Company recorded favorable lease assets in conjunction with the acquisition of CSK Auto Corporation (“CSK”);a previous acquisition; these favorable lease assets represent the values of operating leases acquired with favorable terms. These favorable leases had an estimated weighted-average remaining useful life of approximately 9.0 years as of December 31, 2016. For the years ended December 31, 2016, 20152018 and 2014,2017, the Company recorded amortization expense of $2.1 million, $2.7$1.4 million and $3.9$1.6 million, respectively, related to its amortizable intangible assets, which were included as a component ofin “Other assets, net” on the accompanying Consolidated Balance Sheets as of December 31, 2016 and 2015.
In prior years, the Company recorded unfavorable lease liabilities in conjunction with the acquisition of CSK;a previous acquisition; these unfavorable lease liabilities represent the values of operating leases acquired with unfavorable terms. These unfavorable leases had an estimated weighted-average remaining useful life of approximately 3.7 years as of December 31, 2016. For the years ended December 31, 2016, 20152018 and 2014,2017, the Company recognized an amortized benefit of $2.1 million, $2.8$0.9 million and $3.7$1.5 million, respectively, related to these unfavorable operating leases, which were included as a component ofin “Other liabilities” on the accompanying Consolidated Balance Sheets as of December 31, 2016 and 2015.
The following table identifies the estimated amortization expense and benefit of the Company’s intangibles for each of the next five years as of December 31, 20162019 (in thousands):
| | | |
| | December 31, 2019 | |
|
| Amortization Expense | |
2020 | | $ | 296 |
2021 | |
| 275 |
2022 | |
| 247 |
2023 | |
| 218 |
2024 | |
| 201 |
Total | | $ | 1,237 |
60
| December 31, 2016 | |||||||||||
| Amortization Expense | Amortization Benefit | Total Amortization Expense | |||||||||
| 2017 | $ | (2,072 | ) | $ | 1,493 | $ | (579 | ) | |||
| 2018 | (1,599 | ) | 923 | (676 | ) | ||||||
| 2019 | (1,377 | ) | 712 | (665 | ) | ||||||
| 2020 | (1,197 | ) | 541 | (656 | ) | ||||||
| 2021 | (969 | ) | 389 | (580 | ) | ||||||
| Total | $ | (7,214 | ) | $ | 4,058 | $ | (3,156 | ) | |||
The following table identifies the amounts of the Company’s financing facilities, which were included in “Long-term debt” on the accompanying Consolidated Balance Sheets as of December 31, 20162019 and 20152018 (in thousands):
| December 31, | |||||||
| 2016 | 2015 | ||||||
| Revolving Credit Facility | $ | — | $ | — | |||
$500 million, 4.875% Senior Notes due 2021(1), effective interest rate of 4.959% | 496,758 | 495,951 | |||||
$300 million, 4.625% Senior Notes due 2021(2), effective interest rate of 4.646% | 298,679 | 298,396 | |||||
$300 million, 3.800% Senior Notes due 2022(3), effective interest rate of 3.845% | 297,868 | 297,535 | |||||
$300 million, 3.850% Senior Notes due 2023(4), effective interest rate of 3.851% | 298,355 | $ | 298,136 | ||||
$500 million, 3.550% Senior Notes due 2026(5), effective interest rate of 3.570% | $ | 495,359 | |||||
| | | | | | |
| | December 31, | ||||
| | | 2019 | | | 2018 |
Revolving Credit Facility, weighted-average variable interest rate of 3.318% | | $ | 261,000 | | $ | 287,000 |
4.875% Senior Notes due 2021, effective interest rate of 4.949% | |
| 500,000 | |
| 500,000 |
4.625% Senior Notes due 2021, effective interest rate of 4.644% | |
| 300,000 | |
| 300,000 |
3.800% Senior Notes due 2022, effective interest rate of 3.845% | |
| 300,000 | |
| 300,000 |
3.850% Senior Notes due 2023, effective interest rate of 3.851% | |
| 300,000 | |
| 300,000 |
3.550% Senior Notes due 2026, effective interest rate of 3.570% | |
| 500,000 | |
| 500,000 |
3.600% Senior Notes due 2027, effective interest rate of 3.619% | |
| 750,000 | |
| 750,000 |
4.350% Senior Notes due 2028, effective interest rate of 4.383% | |
| 500,000 | |
| 500,000 |
3.900% Senior Notes due 2029, effective interest rate of 3.901% | | | 500,000 | | | — |
Principal amount of long-term debt | | | 3,911,000 | | | 3,437,000 |
Less: Unamortized discount and debt issuance costs | | | 20,473 | | | 19,878 |
Long-term debt | | $ | 3,890,527 | | $ | 3,417,122 |
The following table identifies the principal maturities of the Company’s financing facilities as of December 31, 20162019 (in thousands):
| Scheduled Maturities | |||
| 2017 | $ | — | |
| 2018 | — | ||
| 2019 | — | ||
| 2020 | — | ||
| 2021 | 800,000 | ||
| Thereafter | 1,100,000 | ||
| Total | $ | 1,900,000 | |
| | | |
|
| Scheduled Maturities | |
2020 | | $ | — |
2021 | |
| 800,000 |
2022 | |
| 561,000 |
2023 | |
| 300,000 |
2024 | |
| — |
Thereafter | |
| 2,250,000 |
Total | | $ | 3,911,000 |
Unsecured revolving credit facility:
On January 14, 2011,April 5, 2017, the Company entered into a credit agreement as amended by Amendment No. 1 dated as of September 9, 2011, as further amended by Amendment No. 2 dated as of July 2, 2013, and as further amended by Amendment No. 3 dated as of June 18, 2015 (the “Credit Agreement”). The Credit Agreement provides for a $600 million$1.2 billion unsecured revolving credit facility (the “Revolving Credit Facility”) arranged by JPMorgan Chase Bank, of America, N.A., which is scheduled to mature in July 2018.April 2022. The Credit Agreement includes a $200 million sub-limit for the issuance of letters of credit and a $75 million sub-limit for swing line borrowings under the Revolving Credit Facility. As described in the Credit Agreement governing the Revolving Credit Facility, the Company may, from time to time, subject to certain conditions, increase the aggregate commitments under the Revolving Credit Facility by up to $200 million.
As of December 31, 20162019 and 2015,2018, the Company had outstanding letters of credit, primarily to support obligations related to workers’ compensation, general liability and other insurance policies, in the amounts of $38.7$38.9 million and $37.5$35.1 million, respectively, reducing the aggregate availability under the Revolving Credit Facility by those amounts. As of December 31, 2016 and 2015, the Company had no outstanding borrowings under the Revolving Credit Facility.
Borrowings under the Revolving Credit Facility (other than swing line loans) bear interest, at the Company’s option, at theeither an Alternate Base Rate or Eurodollaran Adjusted LIBO Rate (both as defined in the Credit Agreement) plus an applicable margin. Swing line loans made under the Revolving Credit Facility bear interest at thean Alternate Base Rate plus the applicable margin for Alternate Base Rate loans. In addition, the Company pays a facility fee on the aggregate amount of the commitments under the Credit Agreement in an amount equal to a percentage of such commitments. The interest rate margins and facility fee are based upon the better of the ratings assigned to the Company’s debt by Moody’s Investor Service, Inc. and Standard & Poor’s Ratings Services, subject to limited exceptions. As of December 31, 2016,2019, based upon the Company’s current credit ratings, its margin for Alternate Base Rate loans was 0.000%, its margin for Eurodollar Rate loansRevolving Loans was 0.875%0.900% and its facility fee was 0.125%0.100%.
The Credit Agreement contains certain covenants, including limitations on subsidiary indebtedness, a minimum consolidated fixed charge coverage ratio of 2.50 times2.50:1.00 and a maximum consolidated leverage ratio of 3.00 times.3.50:1.00. The consolidated fixed charge coverage ratio includes a calculation of earnings before interest, taxes, depreciation, amortization, rent and non-cash share-based compensation expense to fixed charges. Fixed charges include interest expense, capitalized interest and rent expense. The consolidated leverage ratio
61
includes a calculation of adjusted debt to earnings before interest, taxes, depreciation, amortization, rent and non-cash share-based compensation expense. Adjusted debt includes outstanding debt, outstanding stand-by letters of credit and similar instruments, six-timesfive-times rent expense and excludes any premium or discount recorded in conjunction with the issuance of long-term debt. The consolidated fixed charge coverage ratio includes a calculation of earnings before interest, taxes, depreciation, amortization, rent and non-cash share-based compensation expense. Fixed charges include interest expense, capitalized interest and rent expense. In the event that the Company should default on any covenant (subject to customary grace periods, cure rights and materiality thresholds) contained withinin the Credit Agreement, certain actions may be taken, including, but not limited to, possible termination of commitments, immediate payment of outstanding principal amounts plus accrued interest and other amounts payable under the Credit Agreement and litigation from lenders. As of December 31, 2016,2019, the Company remained in compliance with all covenants under the Credit Agreement.
Senior notes:
On March 8, 2016,May 20, 2019, the Company issued $500 million aggregate principal amount of unsecured 3.550%3.900% Senior Notes due 20262029 (“3.550%3.900% Senior Notes due 2026”2029”) at a price to the public of 99.832%99.991% of their face value under its shelf registration statement with United MissouriU.S. Bank N.A.National Association (“UMB”U.S. Bank”) as trustee. Interest on the 3.550%3.900% Senior Notes due 20262029 is payable on March 15June 1 and September 15December 1 of each year, which began with the first interest payment on September 15, 2016,December 1, 2019, and is computed on the basis of a 360-day year.
The Company has issued a cumulative $1.9$3.7 billion aggregate principal amount of unsecured senior notes, which are due between January 2021 and March 20262029, with UMB Bank, N.A. and U.S. Bank as trustee.trustees. Interest on the senior notes, ranging from 3.550% to 4.875%, is payable semi-annually and is computed on the basis of a 360-day year.
| December 31, 2016 | |||||||||||
| Related Parties | Non-Related Parties | Total | |||||||||
| 2017 | $ | 4,634 | $ | 271,544 | $ | 276,178 | |||||
| 2018 | 4,571 | 262,056 | 266,627 | ||||||||
| 2019 | 3,099 | 244,564 | 247,663 | ||||||||
| 2020 | 2,313 | 223,528 | 225,841 | ||||||||
| 2021 | 1,846 | 200,411 | 202,257 | ||||||||
| Thereafter | 5,546 | 1,032,556 | 1,038,102 | ||||||||
| Total | $ | 22,009 | $ | 2,234,659 | $ | 2,256,668 | |||||
| For the Year Ended December 31, | |||||||||||
| 2016 | 2015 | 2014 | |||||||||
| Minimum operating lease expense | $ | 273,559 | $ | 263,479 | $ | 254,565 | |||||
| Contingent rents | 892 | 947 | 759 | ||||||||
| Other lease related occupancy costs | 13,241 | 12,852 | 11,688 | ||||||||
| Total rent expense | 287,692 | 277,278 | 267,012 | ||||||||
| Less: sublease income | 4,439 | 4,019 | 3,984 | ||||||||
| Net rent expense | $ | 283,253 | $ | 273,259 | $ | 263,028 | |||||
The Company’s product warranty liabilities are included in “Other current liabilities” on the accompanying Consolidated Balance Sheets as of December 31, 20162019 and 2015.2018. The following table identifies the changes in the Company’s aggregate product warranty liabilities for the years ended December 31, 20162019 and 20152018 (in thousands):
| 2016 | 2015 | ||||||
| Warranty liabilities, balance at January 1, | $ | 35,223 | $ | 34,226 | |||
| Warranty claims | (73,925 | ) | (61,819 | ) | |||
| Warranty accruals | 75,325 | 62,816 | |||||
| Warranty liabilities, balance at December 31, | $ | 36,623 | $ | 35,223 | |||
| | | | | | |
|
| 2019 |
| 2018 | ||
Warranty liabilities, balance at January 1, | | $ | 52,220 | | $ | 44,398 |
Warranty claims | |
| (99,267) | |
| (89,557) |
Warranty accruals | |
| 108,116 | |
| 97,379 |
Warranty liabilities, balance at December 31, | | $ | 61,069 | | $ | 52,220 |
NOTE 89 – SHARE REPURCHASE PROGRAM
In January of 2011, the Company’s Board of Directors approved a share repurchase program. Under the program, the Company may, from time to time, repurchase shares of its common stock, solely through open market purchases effected through a broker dealer at prevailing market prices, based on a variety of factors such as price, corporate trading policy requirements and overall market conditions. The Company’s Board of Directors may increase or otherwise modify, renew, suspend or terminate the share repurchase program at any time, without prior notice. As announced on May 31, 2019, and February 10, 2016, May 27, 2016, and November 16, 2016,5, 2020, the Company’s Board of Directors each time approved a resolution to increase the authorization amount under the share repurchase program by an additional $750 million,$1.0 billion, resulting in a cumulative authorization amount of $7.8$13.8 billion. Each additional authorization is effective for a three-year period, beginning on its respective announcement date.
The following table identifies shares of the Company’s common stock that have been repurchased as part of the Company’s publicly announced share repurchase program for the year ended December 31, 2019 and 2018 (in thousands, except per share data):
| For the Year Ended December 31, | |||||||
| 2016 | 2015 | ||||||
| Shares repurchased | 5,698 | 4,901 | |||||
| Average price per share | $ | 264.21 | $ | 231.81 | |||
| Total investment | $ | 1,505,371 | $ | 1,136,139 | |||
| | | | | | |
| | For the Year Ended | ||||
| | December 31, | ||||
|
| 2019 |
| 2018 | ||
Shares repurchased |
| | 3,877 |
| | 6,061 |
Average price per share | | $ | 369.55 | | $ | 282.80 |
Total investment | | $ | 1,432,752 | | $ | 1,713,953 |
As of December 31, 2016,2019, the Company had $887.8$568.7 million remaining under its share repurchase program. Subsequent to the end of the year and through February 28, 2017,2020, the Company repurchased an additional 1.40.9 million shares of its common stock under its share repurchase program, at an average price of $267.32,$400.78, for a total investment of $387.5$363.4 million. The Company has repurchased a total of 58.477.1 million shares of its common stock under its share repurchase program since the inception of the program in January of 2011 and through February 28, 2017,2020, at an average price of $124.14,$162.72, for a total aggregate investment of $7.2$12.5 billion.
62
NOTE 10 – REVENUE
The table below identifies the Company’s revenues disaggregated by major customer type for the years ended December 31, 2019, 2018 and 2017 (in thousands):
| | | | | | | | | |
| | For the Year Ended | |||||||
| | December 31, | |||||||
|
| 2019 |
| 2018 |
| 2017 | |||
Sales to do-it-yourself customers | | $ | 5,612,390 | | $ | 5,351,035 | | $ | 5,113,288 |
Sales to professional service provider customers |
| | 4,369,541 |
| | 4,035,898 |
| | 3,724,220 |
Other sales and sales adjustments |
| | 168,054 |
| | 149,495 |
| | 140,218 |
Total sales | | $ | 10,149,985 | | $ | 9,536,428 | | $ | 8,977,726 |
As of December 31, 2019 and 2018, the Company had recorded a deferred revenue liability of $4.1 million and $4.3 million, respectively, related to its loyalty program, which were included in “Other liabilities” on the accompanying Consolidated Balance Sheets. During the years ended December 31, 2019, 2018 and 2017, the Company recognized $15.6 million, $15.9 million and $17.6 million, respectively, of revenue related to its loyalty program, which were included in “Sales” on the accompanying Consolidated Statements of Income.
NOTE 911 – SHARE-BASED COMPENSATION AND BENEFIT PLANS
The Company recognizes share-based compensation expense based on the fair value of the grants, awards or shares at the time of the grant, award or issuance. Share-based compensation includes stock option awards, restricted stock awards and stock appreciation rights issued under the Company’s employee incentive plans and director stock plan, restricted stock awarded under the Company’s employee incentive plans, performance incentive plan and director stock plan, stock issued through the Company’s employee stock purchase plan and stock awarded to employees through other benefit programs.
The table below identifies the shares that have been authorized for issuance and the shares available for future issuance under the Company plans, as of December 31, 20162019 (in thousands):
| December 31, 2016 | ||||||
| Plans | Total Shares Authorized for Issuance under the Plans | Shares Available for Future Issuance under the Plans | ||||
| Employee Incentive Plans | 34,000 | 6,086 | ||||
| Director Stock Plan | 1,000 | 263 | ||||
| Performance Incentive Plan | 650 | 388 | ||||
| Employee Stock Purchase Plans | 4,250 | 710 | ||||
| Profit Sharing and Savings Plan | 4,200 | 349 | ||||
| | | | |
| | December 31, 2019 | ||
|
| Total Shares Authorized for |
| Shares Available for Future |
Plans | | Issuance under the Plans | | Issuance under the Plans |
Incentive Plans |
| 34,650 |
| 5,749 |
Employee Stock Purchase Plan |
| 4,250 |
| 551 |
Profit Sharing and Savings Plan |
| 4,200 |
| 349 |
Stock options:
The Company’s employee incentive plans provide for the granting of stock options for the purchase of common stock of the Company to certain key employees of the Company. Employee stock options are granted at an exercise price that is equal to the closing market price of the Company’s common stock on the date of the grant. Employee stock options granted under the plans expire after ten10 years and typically vest 25% per year, over four years. The Company records compensation expense for the grant date fair value of the option awards adjusted for estimated forfeitures, evenly over the vesting period or minimum required service period.
The table below identifies the employee stock option activity under these plans during the year ended December 31, 2016:2019:
| | | | | | | | | | | |
|
| |
| |
| Average |
| Aggregate | |||
| | Shares | | Weighted- Average | | Remaining | | Intrinsic Value | |||
| | (in thousands) | | Exercise Price | | Contractual Terms | | (in thousands) | |||
Outstanding at December 31, 2018 |
| 1,860 | | $ | 178.57 |
|
| |
| |
|
Granted |
| 214 | |
| 370.63 |
|
| |
| |
|
Exercised |
| (406) | |
| 113.66 |
|
| |
| |
|
Forfeited or expired |
| (33) | |
| 263.15 |
|
| |
| |
|
Outstanding at December 31, 2019 |
| 1,635 | | $ | 218.10 |
| 5.9 | Years | | $ | 360,003 |
Vested or expected to vest at December 31, 2019 |
| 1,598 | | $ | 215.97 |
| 5.9 | Years | | $ | 355,172 |
Exercisable at December 31, 2019 |
| 1,033 | | $ | 170.77 |
| 4.6 | Years | | $ | 276,414 |
63
Shares (in thousands) | Weighted-Average Exercise Price | Average Remaining Contractual Terms | Aggregate Intrinsic Value (in thousands) | |||||||||
| Outstanding at December 31, 2015 | 3,291 | $ | 81.04 | |||||||||
| Granted | 308 | 267.00 | ||||||||||
| Exercised | (751 | ) | 62.81 | |||||||||
| Forfeited or expired | (59 | ) | 144.91 | |||||||||
| Outstanding at December 31, 2016 | 2,789 | $ | 105.11 | 5.1 Years | $ | 483,331 | ||||||
| Vested or expected to vest at December 31, 2016 | 2,744 | $ | 103.29 | 5.0 Years | $ | 480,582 | ||||||
| Exercisable at December 31, 2016 | 2,027 | $ | 65.45 | 3.9 Years | $ | 431,637 | ||||||
| Shares (in thousands) | Weighted-Average Exercise Price | Average Remaining Contractual Terms | Aggregate Intrinsic Value (in thousands) | |||||||||
| Outstanding at December 31, 2015 | 17 | $ | 45.13 | |||||||||
| Granted | — | — | ||||||||||
| Exercised | (6 | ) | 39.99 | |||||||||
| Forfeited | — | — | ||||||||||
| Outstanding at December 31, 2016 | 11 | $ | 48.31 | 0.3 Years | $ | 2,416 | ||||||
| Vested or expected to vest at December 31, 2016 | 11 | $ | 48.31 | 0.3 Years | $ | 2,416 | ||||||
| Exercisable at December 31, 2016 | 11 | $ | 48.31 | 0.3 Years | $ | 2,416 | ||||||
The fair value of each stock option award is estimated on the date of the grant using the Black-Scholes option pricing model. The Black-Scholes model requires the use of assumptions, including the risk free rate, expected life, expected volatility and expected dividend yield.
| ● | Risk-free interest rate – The United States Treasury rates in effect at the time the options are granted for the options’ expected life. |
| ● | Expected life – Represents the period of time that options granted are expected to be outstanding. The Company uses historical experience to estimate the expected life of options granted. |
| ● | Expected volatility – Measure of the amount, by which the Company’s stock price is expected to fluctuate, based on a historical trend. |
| ● | Expected dividend yield – The Company has not paid, nor does it have plans in the foreseeable future to pay, any dividends. |
The table below identifies the weighted-average assumptions used for grantsstock options awarded by the Company during the years ended December 31, 2016, 20152019, 2018 and 2014:
| December 31, | ||||||||
| 2016 | 2015 | 2014 | ||||||
| Risk free interest rate | 1.44 | % | 1.52 | % | 1.60 | % | ||
| Expected life | 5.5 Years | 5.7 Years | 5.3 Years | |||||
| Expected volatility | 22.3 | % | 22.3 | % | 24.3 | % | ||
| Expected dividend yield | — | % | — | % | — | % | ||
| | | | | | | | | |
| | December 31, | |||||||
|
| 2019 | | 2018 | | 2017 | |||
Risk free interest rate |
| 2.26 | % | | 2.63 | % | | 1.98 | % |
Expected life |
| 5.7 | Years | | 5.9 | Years | | 5.4 | Years |
Expected volatility |
| 25.1 | % | | 24.0 | % | | 22.4 | % |
Expected dividend yield |
| — | % | | — | % | | — | % |
Upon adoption of ASU 2016-09, during the three months ended March 31, 2017, the Company elected to change its accounting policy to account for forfeitures as they occur. Prior to the year ended December 31, 2017, the Company’s forfeiture rate iswas the estimated percentage of options awarded that arewere expected to be forfeited or canceled prior to becoming fully vested. The Company’svested, and the estimate iswas evaluated periodically and iswas based upon historical experience at the time of evaluation and reducesreduced expense ratably over the vesting period or the minimum required service period.
The following table summarizes activity related to stock options awarded by the Company for the years ended December 31, 2016, 20152019, 2018 and 2014:
| For the Year Ended December 31, | |||||||||||
| 2016 | 2015 | 2014 | |||||||||
| Compensation expense for stock options awarded (in thousands) | $ | 15,404 | $ | 18,209 | $ | 18,705 | |||||
| Income tax benefit from compensation expense related to stock options (in thousands) | 5,753 | 6,811 | 6,923 | ||||||||
| Total intrinsic value of stock options exercised (in thousands) | 157,115 | 169,248 | 147,236 | ||||||||
| Cash received from exercise of stock options (in thousands) | 47,394 | 105,822 | 59,594 | ||||||||
| Weighted-average grant-date fair value of options awarded | $ | 63.42 | $ | 51.56 | $ | 38.18 | |||||
| Weighted-average remaining contractual life of exercisable options | 3.9 Years | 4.2 Years | 4.6 Years | ||||||||
| | | | | | | | | |
| | For the Year Ended | |||||||
| | December 31, | |||||||
|
| 2019 | | 2018 | | 2017 | |||
Compensation expense for stock options awarded (in thousands) | | $ | 18,044 | | $ | 16,521 | | $ | 15,561 |
Income tax benefit from compensation expense related to stock options (in thousands) | |
| 4,436 | |
| 4,093 | |
| 5,934 |
Total intrinsic value of stock options exercised (in thousands) | |
| 117,489 | |
| 156,327 | |
| 135,533 |
Cash received from exercise of stock options (in thousands) | |
| 46,106 | |
| 61,403 | |
| 33,229 |
Weighted-average grant-date fair value of options awarded | | $ | 105.37 | | $ | 76.57 | | $ | 62.79 |
Weighted-average remaining contractual life of exercisable options (in years) | |
| 4.6 | |
| 4.4 | |
| 3.8 |
At December 31, 2016,2019, the remaining unrecognized compensation expense related to unvested stock option awards was $26.4$33.7 million, and the weighted-average period of time, over which this cost will be recognized, is 2.6 years.
Restricted stock:
The Company’s performance incentive plans provide for the awardawarding of shares of restricted stock to its corporate and senior managementcertain key employees that vest evenly over a three-year period and are held in escrow until such vesting has occurred. Generally, unvested shares are forfeited when an employee ceases employment. The fair value of shares awarded under these plans is based on the closing market price of the Company’s common stock on the date of award and compensation expense is recorded over the vesting period or minimum required service period.
64
The table below identifies the employee restricted stock activity under these plans during the year ended December 31, 20162019 (in thousands, except per share data):
| | | | | |
| | | | Weighted-Average Grant-Date | |
|
| Shares |
| Fair Value | |
Non-vested at December 31, 2018 |
| 4 | | $ | 260.42 |
Granted during the period |
| 2 | |
| 344.66 |
Vested during the period (1) |
| (2) | |
| 259.43 |
Forfeited during the period |
| — | |
| — |
Non-vested at December 31, 2019 |
| 4 | | $ | 301.40 |
| Shares | Weighted-Average Grant-Date Fair Value | |||||
| Non-vested at December 31, 2015 | 7 | $ | 128.27 | |||
| Granted during the period | 1 | 256.34 | ||||
Vested during the period (1) | (5 | ) | 140.91 | |||
| Forfeited during the period | — | 150.85 | ||||
| Non-vested at December 31, 2016 | 3 | $ | 204.33 | |||
| (1) | |
| Includes |
The Company’s director stock plan providesincentive plans provide for the awardawarding of shares of restricted stock to the directors of the Company that vest evenly over a three-year periodperiod and are held in escrow until such vesting has occurred. Unvested shares are forfeited when a director ceases their service on the Company’s Board of Directors for reasons other than death or retirement. The fair value of shares awarded under this planthese plans is based on the closing market price of the Company’s common stock on the date of award, and compensation expense is recorded evenly over the vestingminimum required service period.
The table below identifies the director restricted stock activity under this planthese plans during the year ended December 31, 20162019 (in thousands, except per share data):
| Shares | Weighted-Average Grant-Date Fair Value | |||||
| Non-vested at December 31, 2015 | 7 | $ | 167.73 | |||
| Granted during the period | 2 | 268.54 | ||||
| Vested during the period | (3 | ) | 149.49 | |||
| Forfeited during the period | — | — | ||||
| Non-vested at December 31, 2016 | 6 | $ | 222.77 | |||
| | | | | |
| | | | Weighted-Average Grant-Date | |
|
| Shares |
| Fair Value | |
Non-vested at December 31, 2018 |
| 5 | | $ | 261.07 |
Granted during the period |
| 2 | |
| 367.77 |
Vested during the period |
| (3) | |
| 280.41 |
Forfeited during the period |
| — | |
| — |
Non-vested at December 31, 2019 |
| 4 | | $ | 312.96 |
The following table summarizes activity related to restricted stock awarded by the Company for the years ended December 31, 2016, 20152019, 2018 and 20142017 (in thousands, except per share data):
| For the Year Ended December 31, | |||||||||||
| 2016 | 2015 | 2014 | |||||||||
| Compensation expense for restricted shares awarded | $ | 1,293 | $ | 1,625 | $ | 2,621 | |||||
| Income tax benefit from compensation expense related to restricted shares | $ | 483 | $ | 610 | $ | 970 | |||||
| Total fair value of restricted shares at vest date | $ | 2,384 | $ | 3,284 | $ | 3,749 | |||||
| Shares awarded under the plans | 4 | 4 | 16 | ||||||||
| Weighted-average grant-date fair value of shares awarded under the plans | $ | 264.24 | $ | 208.56 | $ | 147.23 | |||||
| | | | | | | | | |
| | For the Year Ended | |||||||
| | December 31, | |||||||
|
| 2019 |
| 2018 |
| 2017 | |||
Compensation expense for restricted shares awarded | | $ | 1,387 | | $ | 1,370 | | $ | 1,628 |
Income tax benefit from compensation expense related to restricted shares | | $ | 341 | | $ | 340 | | $ | 621 |
Total fair value of restricted shares at vest date | | $ | 1,633 | | $ | 1,230 | | $ | 1,202 |
Shares awarded under the plans | |
| 4 | |
| 5 | |
| 4 |
Weighted-average grant-date fair value of shares awarded under the plans | | $ | 355.91 | | $ | 263.89 | | $ | 253.78 |
At December 31, 2016,2019, the remaining unrecognized compensation expense related to unvested restricted share awards was $0.9$0.3 million, and the weighted-average period of time, over which this cost will be recognized, is 0.10.5 years
Employee stock purchase plan:
The Company’s employee stock purchase plan (the “ESPP”) permits eligible employees to purchase shares of the Company’s common stock at 85% of the fair market value. Employees may authorize the Company to withhold up to 5% of their annual salary to participate in the plan. The fair value of shares issued under the ESPP is based on the average of the high and low market prices of the Company’s common stock during the offering periods. Compensation expense is recognized based on the discount between the grant-date fair value and the employee purchase price for the shares sold to employees.
65
The following table below summarizes activity related to the Company’s ESPP for the years ended December 31, 2016, 20152019, 2018 and 20142017 (in thousands, except per share data):
| For the Year Ended December 31, | |||||||||||
| 2016 | 2015 | 2014 | |||||||||
| Compensation expense for shares issued under the ESPP | $ | 2,162 | $ | 2,065 | $ | 1,769 | |||||
| Income tax benefit from compensation expense for shares issued under the ESPP | $ | 807 | $ | 773 | $ | 655 | |||||
| Shares issued under the ESPP | 54 | 60 | 77 | ||||||||
| Weighted-average price of shares issued under the ESPP | $ | 227.12 | $ | 195.04 | $ | 130.12 | |||||
| | | | | | | | | |
| | For the Year Ended | |||||||
| | December 31, | |||||||
|
| 2019 |
| 2018 |
| 2017 | |||
Compensation expense for shares issued under the ESPP | | $ | 2,490 | | $ | 2,285 | | $ | 2,212 |
Income tax benefit from compensation expense related to shares issued under the ESPP | | $ | 612 | | $ | 566 | | $ | 844 |
Shares issued under the ESPP | |
| 43 | |
| 53 | |
| 64 |
Weighted-average price of shares issued under the ESPP | | $ | 329.69 | | $ | 245.26 | | $ | 196.72 |
Profit sharing and savings plan:
The Company sponsors a contributory profit sharing and savings plan (the “401(k) Plan”) that covers substantially all employees who are at least 21 years of age and have completed one year of service. The Company makes matching contributions equal to 100% of the first 2% of each employee’s wages that are contributed and 25% of the next 4% of each employee’s wages that are contributed. An employee generally must be employed on December December��31 to receive that year’s Company matching contribution, with the matching contribution funded annually at the beginning of the subsequent year following the year in which the matching contribution was earned.
Nonqualified deferred compensation plan:
The Company sponsors a nonqualified deferred compensation plan (the “Deferred Compensation Plan”) for highly compensated employees whose contributions to the 401(k) Plan are limited due to the application of the annual limitations under the Internal Revenue Code. The Deferred Compensation Plan provides these employees with the opportunity to defer the full 6% of matched compensation, including salary and incentive based compensation, that was precluded under the Company’s 401(k) Plan, which is then matched by the Company using the same formula as the 401(k) Plan. An employee generally must be employed on December 31 to receive that year’s Company matching contribution, with the matching contribution funded annually at the beginning of the subsequent year following the year in which the matching contribution was earned. In the event of bankruptcy, the assets of this plan are available to satisfy the claims of general creditors. The Company has an unsecured obligation to pay, in the future, the value of the deferred compensation and Company match, adjusted to reflect the performance, whether positive or negative, of selected investment measurement options chosen by each participant during the deferral period. The liability for compensation deferred under the Deferred Compensation Plan was $20.5$32.2 million and $16.9$25.5 million as of December 31, 20162019 and 2015,2018, respectively, which were included as a component ofin “Other liabilities” on the Consolidated Balance Sheets. The Company expensed matching contributions under the Deferred Compensation Plan in the amounts of $0.1$0.2 million, $0.1 million and $0.2$0.1 million for the years ended December 31, 2016, 20152019, 2018 and 2014,2017, respectively, which were primarily included as a component ofin “Selling, general and administrative expenses” on the accompanying Consolidated Statements of Income.
Stock appreciation rights:
During the year ended December 31, 2019, the Company awarded 8,009 stock appreciation rights under the incentive plan, all of which were outstanding at December 31, 2019. Stock appreciation rights granted under the plan expire after 10 – COMMITMENTS
66
NOTE 12 – ACCUMULATED OTHER COMPREHENSIVE INCOME
Accumulated other comprehensive income includes adjustments for foreign currency translations. The table below summarizes activity for changes in accumulated other comprehensive income included in “Accumulated other comprehensive income” on the accompanying Consolidated Balance Sheets as of December 31, 2019 and 2018 (in thousands):
| | | | | | |
| | Foreign | | Total Accumulated Other | ||
| | Currency (1) | | Comprehensive Income | ||
Accumulated other comprehensive income, balance at December 31, 2017 | | $ | — | | $ | — |
Change in accumulated other comprehensive income | | | — | | | — |
Accumulated other comprehensive income, balance at December 31, 2018 | | | — | | | — |
Change in accumulated other comprehensive income | | | 4,890 | | | 4,890 |
Accumulated other comprehensive income, balance at December 31, 2019 | | $ | 4,890 | | $ | 4,890 |
| (1) | Foreign currency is not shown net of additional U.S. tax, as other basis differences of non-U.S. subsidiaries are intended to be permanently reinvested. |
NOTE 13 – COMMITMENTS
Construction commitments:
As of December 31, 2019, the Company had construction commitments in the amount of $79.6$100.1 million.
Letters of credit commitments:
As of December 31, 2016,2019, the Company had outstanding letters of credit, primarily to satisfy workers’ compensation, general liability and other insurance policies, in the amount of $38.7$38.9 million. See Note 57 for further information concerning the Company’s letters of credit commitments.
Debt financing commitments:
Each series of senior notes areis redeemable in whole, at any time, or in part, from time to time, at the Company’s option upon not less than 30 nor more than 60 days notice at a redemption price, plus any accrued and unpaid interest to, but not including, the redemption date, equal to the greater of (i) 100% of the principal amount thereof or (ii) the sum of the present valuevalues of the remaining scheduled payments of principal and interest thereon discounted to the redemption date on a semiannual basis at the applicable Treasury Yield plus basis points identified in the indenturesindenture governing such series of senior notes; provided, that on or after the notes.date that is three months prior to the maturity date of the series of senior notes, such series of senior notes is redeemable at a redemption price equal to par plus accrued and unpaid interest to, but not including, the redemption date. In addition, if at any time the Company undergoes a Change of Control Triggering Event, as defined in the indenturesindenture governing thesuch series of senior notes, the holders may require the Company to repurchase all or a portion of their senior notes at a price equal to 101% of the principal amount of the notes being repurchased, plus accrued and unpaid interest, if any, but not including the repurchase date. See Note 57 for further information concerning the Company’s debt financing commitments.
Self-insurance reserves:
The Company uses a combination of insurance and self-insurance mechanisms to provide for the potential liabilities for Team Member health care benefits, workers’ compensation, vehicle liability, general liability and property loss. With the exception of certain Team Member health care benefit liabilities, employment related claims and litigation, certain commercial litigation and certain regulatory matters, the Company obtains third-party insurance coverage to limit its exposure to this obligation.
Solar investment:
The Company has entered into an agreement to make capital contributions to certain tax credit equity investments for the purpose of receiving renewable energy tax credits. The Company is required to make capital contributions totaling $95.4 million upon achievement of project milestones by the solar energy farms, the timing of which is variable and outside of the Company’s control.
NOTE 1114 – RELATED PARTIES
The Company leases certain land and buildings related to 7574 of its O’Reilly Auto Parts stores under fifteen- or twenty-year operating lease agreements with entities in which certainthat include one or more of the Company’s affiliated directors or members of an affiliated director’s immediate family, and an executive officer of the Company are affiliated.family. Generally, these lease agreements provide for renewal options for an additional five years at the option of the Company and the lease agreements are periodically modified to further extend the lease term for specific stores under the agreements. Lease payments under these operating leases totaled $4.5$4.7 million, $4.5$4.6 million and $4.6 million during the years ended
67
December 31, 2016, 20152019, 2018 and 2014,2017, respectively. The Company believes that the lease agreements with the affiliated entities are on terms comparable to those obtainable from third parties. See Note 65 for further information concerning the Company’s operating leases.
NOTE 1215 – INCOME TAXES
The following table identifies components of income from continuing operations before income taxes included in “Income before income taxes” on the accompanying Consolidated Statements of Income for the years ended December 31, 2019, 2018 and 2017 (in thousands):
| | | | | | | | | |
| | For the Year Ended | |||||||
| | December 31, | |||||||
| | 2019 | | 2018 | | 2017 | |||
Domestic | | $ | 1,790,207 | | $ | 1,694,087 | | $ | 1,637,804 |
International | | | 122 | | | — | | | — |
Income before income taxes | | $ | 1,790,329 | | $ | 1,694,087 | | $ | 1,637,804 |
Provision for income taxes:
The following tables reconcile the amounts included in “Provision for income taxes” on the accompanying Consolidated Statements of Income for the years ended December 31, 2019, 2018 and 2017 (in thousands):
| | | | | | | | | |
| | For the Year Ended | |||||||
| | December 31, | |||||||
|
| 2019 |
| 2018 |
| 2017 | |||
Current: | | | | | | | | | |
Federal income tax expense | | $ | 315,061 | | $ | 289,953 | | $ | 467,577 |
State income tax expense | |
| 62,795 | |
| 59,487 | |
| 41,183 |
International income tax expense | | | 273 | | | — | | | — |
Total current | | | 378,129 | | | 349,440 | | | 508,760 |
| | | | | | | | | |
Deferred: | | | | | | | | | |
Federal income tax expense (benefit) | | | 19,367 | | | 16,309 | | | (13,053) |
State income tax expense | | | 2,027 | | | 3,851 | | | 8,293 |
International income tax benefit | | | (236) | | | — | | | — |
Total deferred | | | 21,158 | | | 20,160 | | | (4,760) |
| | | | | | | | | |
Net income tax expense | | $ | 399,287 | | $ | 369,600 | | $ | 504,000 |
The following table outlines the reconciliation of the “Provision for income taxes” amounts included on the accompanying Consolidated Statements of Income to the amounts computed at the federal statutory rate for the years ended December 31, 2019, 2018 and 2017 (in thousands):
| | | | | | | | | |
| | For the Year Ended | |||||||
| | December 31, | |||||||
|
| 2019 |
| 2018 |
| 2017 | |||
Federal income taxes at statutory rate | | $ | 375,942 | | $ | 355,758 | | $ | 573,231 |
State income taxes, net of federal tax benefit | |
| 54,739 | |
| 56,345 | |
| 39,062 |
Excess tax benefit from share-based compensation | |
| (25,992) | |
| (34,703) | |
| (48,688) |
Revaluation of deferred tax liability | |
| — | |
| (1,262) | |
| (53,240) |
Other items, net | |
| (5,402) | |
| (6,538) | |
| (6,365) |
Total provision for income taxes | | $ | 399,287 | | $ | 369,600 | | $ | 504,000 |
The U.S. Tax Cuts and Jobs Act, enacted in December 2017 (the “Tax Act”), significantly reduced the federal corporate income tax rate for tax years beginning in 2018 and required the Company to revalue its deferred income tax liabilities. The Company recorded a one-time tax benefit of $53.2 million in “Provision for income taxes” on the accompanying Consolidated Statements of Income for the year ended December 31, 2017, to reflect the reduced federal corporate income tax rate in the tax years the deferred tax differences are expected to reverse. This provisional tax benefit from the revaluation of the Company’s deferred income tax liabilities was recorded based on the Company’s initial evaluation of the impact of the Tax Act. During the year ended December 31, 2018, the Company completed its evaluation of the impact of the Tax Act and recorded an additional $1.3 million of tax benefit, finalizing the revaluation
68
of its deferred income tax liabilities due to the Tax Act, which was recorded in “Provision for income taxes” on the accompanying Consolidated Statements of Income for the year ended December 31, 2018.
Deferred income tax assets and liabilities:
Deferred income taxes reflect the net tax effects of temporary differences between the carrying amounts of assets and liabilities for financial reporting purposes and the amounts used for income tax purposes, and also include the tax effect of carryforwards.
The following table identifies significant components of the Company’s net deferred tax liabilities included in “Deferred income taxes” on the accompanying Consolidated Balance Sheets as of December 31, 20162019 and 20152018 (in thousands):
| December 31, | |||||||
| 2016 | 2015 | ||||||
| Deferred tax assets: | |||||||
| Allowance for doubtful accounts | $ | 2,686 | $ | 2,492 | |||
| Tax credits | 9,363 | 11,747 | |||||
| Other accruals | 153,955 | 151,635 | |||||
| Net operating losses | 304 | 337 | |||||
| Other | 19,870 | 19,051 | |||||
| Total deferred tax assets | 186,178 | 185,262 | |||||
| Deferred tax liabilities: | |||||||
| Inventories | 76,694 | 82,313 | |||||
| Property and equipment | 157,228 | 141,930 | |||||
| Other | 42,422 | 40,791 | |||||
| Total deferred tax liabilities | 276,344 | 265,034 | |||||
| Net deferred tax liabilities | $ | (90,166 | ) | $ | (79,772 | ) | |
| For the Year Ended December 31, 2016 | |||||||||||
| Current | Deferred | Total | |||||||||
| Federal income tax expense | $ | 540,090 | $ | 7,558 | $ | 547,648 | |||||
| State income tax expense | 49,016 | 2,836 | 51,852 | ||||||||
| Net income tax expense | $ | 589,106 | $ | 10,394 | $ | 599,500 | |||||
| For the Year Ended December 31, 2015 | |||||||||||
| Current | Deferred | Total | |||||||||
| Federal income tax expense (benefit) | $ | 504,558 | $ | (21,973 | ) | $ | 482,585 | ||||
| State income tax expense (benefit) | 47,242 | (677 | ) | 46,565 | |||||||
| Net income tax expense (benefit) | $ | 551,800 | $ | (22,650 | ) | $ | 529,150 | ||||
| For the Year Ended December 31, 2014 | |||||||||||
| Current | Deferred | Total | |||||||||
| Federal income tax expense | $ | 399,271 | $ | 5,987 | $ | 405,258 | |||||
| State income tax expense (benefit) | 43,242 | (4,500 | ) | 38,742 | |||||||
| Net income tax expense | $ | 442,513 | $ | 1,487 | $ | 444,000 | |||||
| For the Year Ended December 31, | |||||||||||
| 2016 | 2015 | 2014 | |||||||||
| Federal income taxes at statutory rate | $ | 573,020 | $ | 511,128 | $ | 427,764 | |||||
| State income taxes, net of federal tax benefit | 35,285 | 32,137 | 25,320 | ||||||||
| Other items, net | (8,805 | ) | (14,115 | ) | (9,084 | ) | |||||
| Total provision for income taxes | $ | 599,500 | $ | 529,150 | $ | 444,000 | |||||
| | | | | | |
| | December 31, | ||||
|
| 2019 |
| 2018 | ||
Deferred tax assets: |
| |
|
| |
|
Allowance for doubtful accounts | | $ | 2,008 | | $ | 1,944 |
Tax credits | |
| 3,417 | |
| 5,606 |
Other accruals | |
| 97,189 | |
| 105,894 |
Operating lease liability | | | 494,093 | | | — |
Other | |
| 15,732 | |
| 14,770 |
Total deferred tax assets | |
| 612,439 | |
| 128,214 |
| | | | | | |
Deferred tax liabilities: | |
|
| |
|
|
Inventories | |
| 65,346 | |
| 62,846 |
Property and equipment | |
| 162,613 | |
| 140,019 |
Operating lease asset | | | 479,821 | | | — |
Other | |
| 37,939 | |
| 30,915 |
Total deferred tax liabilities | |
| 745,719 | |
| 233,780 |
| | | | | | |
Net deferred tax liabilities | | $ | (133,280) | | $ | (105,566) |
As of December 31, 2016,2019, the Company had tax credit carryforwards available for state tax purposes, net of federal impact, in the amount of $9.4 million. As of December 31, 2016, the Company had net operating loss carryforwards available for state purposes in the amount of $9.8 million. The Company’s state net operating loss carryforwards$3.4 million, which generally expire in years ranging from 2022 to 2028, and the Company’s tax credits generally expire in 2024.
Unrecognized tax benefits:
The following table summarizes the changes in the gross amount of unrecognized tax benefits, excluding interest and penalties, for the years ended December 31, 2016, 20152019, 2018 and 20142017 (in thousands):
| 2016 | 2015 | 2014 | |||||||||
| Unrealized tax benefit, balance at January 1, | $ | 36,928 | $ | 49,598 | $ | 50,459 | |||||
| Additions based on tax positions related to the current year | 6,116 | 5,405 | 4,665 | ||||||||
| Additions based on tax positions related to prior years | — | 995 | — | ||||||||
| Payments related to items settled with taxing authorities | (195 | ) | (4,012 | ) | (300 | ) | |||||
| Reductions due to the lapse of statute of limitations and settlements | (8,051 | ) | (15,058 | ) | (5,226 | ) | |||||
| Unrealized tax benefit, balance at December 31, | $ | 34,798 | $ | 36,928 | $ | 49,598 | |||||
| | | | | | | | | |
|
| 2019 |
| 2018 |
| 2017 | |||
Unrealized tax benefit, balance at January 1, | | $ | 33,766 | | $ | 35,388 | | $ | 34,798 |
Additions based on tax positions related to the current year | |
| 4,627 | |
| 3,550 | |
| 6,299 |
Additions based on tax positions related to prior years | |
| — | |
| 4,255 | |
| — |
Payments related to items settled with taxing authorities | |
| (443) | |
| (2,792) | |
| — |
Reductions due to the lapse of statute of limitations and settlements | |
| (6,475) | |
| (6,635) | |
| (5,709) |
Unrealized tax benefit, balance at December 31, | | $ | 31,475 | | $ | 33,766 | | $ | 35,388 |
For the years ended December 31, 2016, 20152019, 2018 and 2014,2017, the Company recorded a reserve for unrecognized tax benefits, including interest and penalties, in the amounts of $40.6$36.6 million, $43.6$38.9 million and $58.4$40.9 million, respectively. All of the unrecognized tax benefits recorded as of December 31, 2016, 20152019, 2018 and 2014,2017, respectively, would affect the Company’s effective tax rate if recognized, generally net of the federal tax effect of approximately $13.8$7.7 million. The Company recognizes interest and penalties related to uncertain tax positions in income tax expense. As of December 31, 2016, 20152019, 2018 and 2014,2017, the Company had accrued approximately $5.8$5.1 million, $6.7$5.1 million and $8.8$5.5 million, respectively, of interest and penalties related to uncertain tax positions before the benefit of the deduction for interest on state and federal returns. During the years ended December 31, 2016, 20152019, 2018 and 2014,2017, the Company recorded tax expense related to an increase in its liability for interest and penalties in the amounts of $2.4$2.7 million, $2.8$2.3 million and $2.8$2.0 million, respectively. Although unrecognized tax benefits for individual tax positions may increase or decrease during 2017,2020, the Company expects a reduction of $7.4$7.8 million of unrecognized tax benefits during the one-year period subsequent to December 31, 2016,2019, resulting from settlement or expiration of the statute of limitations.
The Company’s United States federal income tax returns for tax years 20152016 and beyond remain subject to examination by the Internal Revenue Service (“IRS”). The IRS concluded an examination of the O’Reilly consolidated 20122014, 2015 and 20132016 federal income tax
69
returns in the secondthird quarter of 2015. The statute of limitations for the Company’s federal income tax returns for tax years 2012 and prior expired on September 15, 2016. The statute of limitations for the Company’s U.S. federal income tax return for 2013 will expire on September 15, 2017, unless otherwise extended. The IRS is currently conducting an examination of the Company’s consolidated returns for tax years 2014 and 2015.2018. The Company’s state income tax returns remain subject to examination by various state authorities for tax years ranging from 20052008 through 2015.
NOTE 1316 – EARNINGS PER SHARE
The following table illustrates the computation of basic and diluted earnings per share for the years ended December 31, 2016, 20152019, 2018 and 20142017 (in thousands, except per share data):
| | | | | | | | | |
| | For the Year Ended | |||||||
| | December 31, | |||||||
|
| 2019 |
| 2018 |
| 2017 | |||
Numerator (basic and diluted): |
| |
|
| |
|
| |
|
Net income | | $ | 1,391,042 | | $ | 1,324,487 | | $ | 1,133,804 |
| | | | | | | | | |
Denominator: | |
|
| |
|
| |
|
|
Weighted-average common shares outstanding – basic | |
| 76,985 | |
| 81,406 | |
| 88,426 |
Effect of stock options (1) | |
| 803 | |
| 874 | |
| 1,076 |
Weighted-average common shares outstanding – assuming dilution | |
| 77,788 | |
| 82,280 | |
| 89,502 |
| | | | | | | | | |
Earnings per share: | |
|
| |
|
| |
|
|
Earnings per share-basic | | $ | 18.07 | | $ | 16.27 | | $ | 12.82 |
Earnings per share-assuming dilution | | $ | 17.88 | | $ | 16.10 | | $ | 12.67 |
| | | | | | | | | |
Antidilutive potential common shares not included in the calculation of diluted earnings per share: | |
|
| |
|
| |
|
|
Stock options (1) | |
| 229 | |
| 567 | |
| 715 |
Weighted-average exercise price per share of antidilutive stock options (1) | | $ | 368.11 | | $ | 268.55 | | $ | 252.16 |
| For the Year Ended December 31, | |||||||||||
| 2016 | 2015 | 2014 | |||||||||
| Numerator (basic and diluted): | |||||||||||
| Net income | $ | 1,037,691 | $ | 931,216 | $ | 778,182 | |||||
| Denominator: | |||||||||||
| Weighted-average common shares outstanding – basic | 95,447 | 99,965 | 104,262 | ||||||||
Effect of stock options (1) | 1,273 | 1,549 | 1,779 | ||||||||
| Weighted-average common shares outstanding – assuming dilution | 96,720 | 101,514 | 106,041 | ||||||||
| Earnings per share: | |||||||||||
| Earnings per share-basic | $ | 10.87 | $ | 9.32 | $ | 7.46 | |||||
| Earnings per share-assuming dilution | $ | 10.73 | $ | 9.17 | $ | 7.34 | |||||
| Antidilutive potential common shares not included in the calculation of diluted earnings per share: | |||||||||||
Stock options (1) | 332 | 245 | 363 | ||||||||
Weighted-average exercise price per share of antidilutive stock options (1) | $ | 265.77 | $ | 216.29 | $ | 151.65 | |||||
| (1) | |
| See Note |
Subsequent to the end of the year and through February 28, 2017,2020, the Company repurchased 1.40.9 million shares of its common stock, at an average price of $267.32,$400.78, for a total investment of $387.5$363.4 million.
The following tables set forth certain quarterly unaudited operating data for the fiscal years ended December 31, 20162019 and 2015.2018. The unaudited quarterly information includes all adjustments, which the Company considers necessary for a fair presentation of the information shown (in thousands, except per share data):
| | | | | | | | | | | | |
| | Fiscal 2019 | ||||||||||
|
| First |
| Second |
| Third |
| Fourth | ||||
| | Quarter | | Quarter | | Quarter | | Quarter | ||||
Sales | | $ | 2,410,608 | | $ | 2,589,874 | | $ | 2,666,528 | | $ | 2,482,975 |
Gross profit | |
| 1,279,290 | |
| 1,368,287 | |
| 1,422,530 | |
| 1,324,584 |
Operating income | |
| 444,786 | |
| 498,074 | |
| 536,363 | |
| 441,503 |
Net income | |
| 321,152 | |
| 353,681 | |
| 391,293 | |
| 324,916 |
Earnings per share – basic (1) | | $ | 4.09 | | $ | 4.56 | | $ | 5.14 | | $ | 4.29 |
Earnings per share – assuming dilution (1) | | $ | 4.05 | | $ | 4.51 | | $ | 5.08 | | $ | 4.25 |
| | | | | | | | | | | | |
70
| Fiscal 2016 | |||||||||||||||
| First Quarter | Second Quarter | Third Quarter | Fourth Quarter | ||||||||||||
| Sales | $ | 2,096,150 | $ | 2,176,689 | $ | 2,220,955 | $ | 2,099,302 | |||||||
| Gross profit | 1,097,579 | 1,127,179 | 1,170,026 | 1,114,227 | |||||||||||
| Operating income | 418,626 | 425,061 | 447,809 | 407,710 | |||||||||||
| Net income | 255,374 | 257,794 | 278,493 | 246,030 | |||||||||||
Earnings per share – basic (1) | $ | 2.63 | $ | 2.69 | $ | 2.93 | $ | 2.62 | |||||||
Earnings per share – assuming dilution (1) | $ | 2.59 | $ | 2.65 | $ | 2.90 | $ | 2.59 | |||||||
| | Fiscal 2018 | ||||||||||
|
| First |
| Second |
| Third |
| Fourth | ||||
| | Quarter | | Quarter | | Quarter | | Quarter | ||||
Sales | | $ | 2,282,681 | | $ | 2,456,073 | | $ | 2,482,717 | | $ | 2,314,957 |
Gross profit | |
| 1,201,258 | |
| 1,288,638 | |
| 1,315,755 | |
| 1,234,315 |
Operating income | |
| 422,846 | |
| 479,150 | |
| 485,148 | |
| 428,040 |
Net income | |
| 304,906 | |
| 353,073 | |
| 366,151 | |
| 300,357 |
Earnings per share – basic (1) | | $ | 3.65 | | $ | 4.32 | | $ | 4.54 | | $ | 3.76 |
Earnings per share – assuming dilution (1) | | $ | 3.61 | | $ | 4.28 | | $ | 4.50 | | $ | 3.72 |
| Fiscal 2015 | |||||||||||||||
| First Quarter | Second Quarter | Third Quarter | Fourth Quarter | ||||||||||||
| Sales | $ | 1,901,903 | $ | 2,035,518 | $ | 2,080,201 | $ | 1,949,052 | |||||||
| Gross profit | 986,959 | 1,058,791 | 1,089,254 | 1,027,639 | |||||||||||
| Operating income | 350,373 | 385,768 | 415,260 | 362,620 | |||||||||||
| Net income | 212,864 | 233,508 | 266,268 | 218,576 | |||||||||||
Earnings per share – basic (1) | $ | 2.09 | $ | 2.32 | $ | 2.68 | $ | 2.22 | |||||||
Earnings per share – assuming dilution (1) | $ | 2.06 | $ | 2.29 | $ | 2.64 | $ | 2.19 | |||||||
| (1) | |
| Earnings per share amounts are computed independently for each quarter and annual period. The quarterly earnings per share amounts may not sum to equal the full-year earnings per share amount. |
The unaudited operating data presented above should be read in conjunction with the Company’s consolidated financial statements and related notes, and the other financial information included therein.
71
Item 9. Changes in and Disagreements Withwith Accountants on Accounting and Financial Disclosure
None.
Item 9A. Controls and Procedures
EVALUATION OF DISCLOSURE CONTROLS AND PROCEDURES
As of the end of the period covered by this report, the Company’s management, of O’Reilly Automotive, Inc. and Subsidiaries (the “Company”), under the supervision and with the participation of its Chief Executive Officer and Chief Financial Officer, evaluated the effectiveness of the design and operation of the Company’s disclosure controls and procedures pursuant to Rule 13a-15(b) and as defined in Rule 13a-15(e) of the Securities Exchange Act of 1934, as amended (the “Exchange Act”). Based on that evaluation, the Chief Executive Officer and the Chief Financial Officer concluded that the Company’s disclosure controls and procedures as of the end of the period covered by this report are functioning effectively to provide reasonable assurance that the information required to be disclosed by the Company, including its consolidated subsidiaries, in reports filed under the Exchange Act is recorded, processed, summarized and reported within the time periods specified in the Securities and Exchange Commission’s rules and forms and is accumulated and communicated to management, including the Company’s Chief Executive Officer and Chief Financial Officer, as appropriate to allow timely decisions regarding required disclosure.
CHANGES IN INTERNAL CONTROLS
There were no changes in the Company’s internal control over financial reporting during the fiscal quarter ended December 31, 2016,2019, that have materially affected, or are reasonably likely to materially affect, the Company’s internal control over financial reporting.
INTERNAL CONTROL OVER FINANCIAL REPORTING
The management of the Company, under the supervision and with the participation of the Company’s principal executive officer and principal financial officer and effected by the Company’s Board of Directors, is responsible for establishing and maintaining adequate internal control over financial reporting as defined in Rule 13(a)-15(f) or 15(d)-15(f) under the Exchange Act. The Company’s internal control system is designed to provide reasonable assurance regarding the reliability of financial reporting and the preparation of financial statements for external purposes in accordance with accounting principles generally accepted in the United States.
Internal control over financial reporting includes all policies and procedures that
| ● | pertain to the maintenance of records that, in reasonable detail, accurately and fairly reflect the transactions and dispositions of the assets of the Company; |
| ● | provide reasonable assurance that transactions are recorded as necessary to permit preparation of financial statements in accordance with accounting principles generally accepted in the United States of America, and that receipts and expenditures of the Company are being made only in accordance with authorizations of management and directors of the Company; and |
| ● | provide reasonable assurance regarding prevention or timely detection of unauthorized acquisition, use or disposition of the Company’s assets that could have a material effect on the financial statements. |
Management recognizes that all internal control systems, no matter how well designed, have inherent limitations. Therefore, even those systems determined to be effective can provide only reasonable assurance with respect to financial statement preparation and presentation. Also, projections of any evaluation of effectiveness to future periods are subject to risk. Over time, controls may become inadequate because of changes in conditions or deterioration in the degree of compliance with policies or procedures.
Under the supervision and with the participation of the Company’s principal executive officer and principal financial officer, management assessed the effectiveness of the Company’s internal control over financial reporting as of December 31, 2016.2019. In making this assessment, management used the criteria set forth by the Committee of Sponsoring Organizations of the Treadway Commission in
As permitted by guidance issued by the Securities and Exchange Commission, management excluded from its assessment of its system of internal control over financial reporting the operations associated with the acquisition of Mayoreo de Autopartes y Aceites, S.A. de C.V. (“Mayasa”), pursuant to a stock purchase agreement, which was completed after the close of business on November 29, 2019. The acquired operations were included in the consolidated financial statements of the Company, which constituted 2% of total assets as of December 31, 2019, and less than 1% of revenues and less than 1% of net income for the year ended December 31, 2019.
72
Ernst & Young LLP, Independent Registered Public Accounting Firm, has audited the Company’s consolidated financial statements and has issued an attestation report on the effectiveness of the Company’s internal control over financial reporting, which is included in Item 8.
Item 9B. Other Information
Not Applicable.
73
PART III
Item 10. Directors, Executive Officers and Corporate Governance
Certain information required by Part III is incorporated by reference from O’Reilly Automotive, Inc. and Subsidiaries’ (the “Company”)the Company’s Proxy Statement on Schedule 14A for the 20172020 Annual Meeting of Shareholders (“Proxy Statement”), which will be filed with the Securities and Exchange Commission (the “SEC”) within 120 days of the end of the Company’s most recent fiscal year. Except for those portions specifically incorporated in this Annual Report on Form 10-K by reference to the Company’s Proxy Statement, no other portions of the Proxy Statement are deemed to be filed as part of this Annual Report on Form 10-K.
Directors and Officers:
The information regarding the directors of the Company will be included in the Company’s Proxy Statement under the caption “Proposal 1 - Election of Directors” and “Information Concerning the Board of Directors” and is incorporated herein by reference. The Proxy Statement will be filed with the SEC within 120 days of the end of the Company’s most recent fiscal year. The information regarding executive officers called for by Item 401 of Regulation S-K is included in Part I, in accordance with General Instruction G(3) to Form 10-K, for the Company’s executive officers who are not also directors.
Code of Ethics:
The Company’s Board of Directors has adopted a code of ethics that applies to all of its directors, officers (including its chief executive officer, chief operating officer, chief financial officer, chief accounting officer, controller and any person performing similar functions), and Team Members. The Company’s Code of Ethics is available on its website at
Corporate Governance:
The Corporate Governance/Nominating Committee of the Board of Directors does not have a written policy on the consideration of Director candidates recommended by shareholders. It is the view of the Board of Directors that all candidates, whether recommended by a shareholder or the Corporate Governance/Nominating Committee, shall be evaluated based on the same established criteria for persons to be nominated for election to the Board of Directors and its committees.
The Board of Directors has established an Audit Committee pursuant to Section 3(a)(58)(A) of the Exchange Act. The Audit Committee currently consists of Jay D. Burchfield, Thomas T. Hendrickson, Paul R. Lederer, John R. Murphy, Dana M. Perlman and Ronald Rashkow,Andrea M. Weiss, each an independent director in accordance with The Nasdaq Stock Market Marketplace Rule 5605(a)(2), the standards of Rule 10A-3 of the Exchange Act and the requirements of The Nasdaq Stock Market Marketplace Rule 5605(c)(2). In addition, our Board of Directors has determined that Mr. Murphy, ChairmanHendrickson, Chairperson of the Audit Committee, qualifies as an audit committee financial expert under Item 407(d)(5) of Regulation S-K.
Item 11. Executive Compensation
Director and Officer Compensation:
The information required by Item 402 of Regulation S-K will be included in O’Reilly Automotive, Inc. and Subsidiaries’ (the “Company”)the Company’s Proxy Statement on Schedule 14A for the 2017 Annual Meeting of Shareholders (“Proxy Statement”) under the captions “Compensation of Executive Officers” and “Compensation of Directors” and is incorporated herein by reference.
Compensation Committee:
The information required by Item 407(e)(4) and (e)(5) of Regulation S-K will be included in the Company’s Proxy Statement under the captions “Compensation Committee Interlocks and Insider Participation” and “Compensation Committee Report” and is incorporated herein by reference.
Item 12. Security Ownership of Certain Beneficial Owners and Management and Related Stockholder Matters
The information required by Item 201(d) of Regulation S-K will be included in O’Reilly Automotive, Inc. and Subsidiaries’ (the “Company”)the Company’s Proxy Statement on Schedule 14A for the 2017 Annual Meeting of Shareholders (“Proxy Statement”) under the caption “Equity Compensation Plans” and is incorporated herein by reference.
The information required by Item 403 of Regulation S-K will be included in the Company’s Proxy Statement under the captions “Security Ownership of Certain Beneficial Owners” and “Security Ownership of Directors and Management” and is incorporated herein by reference.
74
Item 13. Certain Relationships and Related Transactions, and Director Independence
The information required by Item 404 of Regulation S-K will be included in the O’Reilly Automotive, Inc. and Subsidiaries’ (the “Company”)Company’s Proxy Statement on Schedule 14A for the 2017 Annual Meeting of Shareholders (“Proxy Statement”) under the caption “Certain Relationships and Related Transactions” and is incorporated herein by reference.
The information required by Item 407(a) of Regulation S-K will be included in the Company’s Proxy Statement under the caption “Director Independence” and is incorporated herein by reference.
Item 14. Principal Accountant Fees and Services
The information required by Item 9(e) of Schedule 14A will be included in O’Reilly Automotive, Inc. and Subsidiaries’the Company’s Proxy Statement on Schedule 14A for the 2017 Annual Meeting of Shareholders under the caption “Fees Paid to Independent Registered Public Accounting Firm” and is incorporated herein by reference.
75
| (a) | The following documents are filed as part of this Annual Report on Form 10-K: |
| 1. | Financial Statements - O’Reilly Automotive, Inc. and Subsidiaries |
The following consolidated financial statements of O’Reilly Automotive, Inc. and Subsidiaries included in the Annual Shareholders’ Report of the registrant for the year ended December 31, 2016,2019, are filed with this Annual Report in Part II, Item 8:
Management’s Report on Internal Control over Financial Reporting
Report of Independent Registered Public Accounting Firm – Internal Control over Financial Reporting
Report of Independent Registered Public Accounting Firm – Financial Statements
Consolidated Balance Sheets as of December 31, 20162019 and 2015
Consolidated Statements of Income for the years ended December 31, 2016, 20152019, 2018 and 2014
Consolidated Statements of Comprehensive Income for the years ended December 31, 2019, 2018 and 2017
Consolidated Statements of Shareholders’ Equity for the years ended December 31, 2016, 20152019, 2018 and 2014
Consolidated Statements of Cash Flows for the years ended December 31, 2016, 20152019, 2018 and 2014
Notes to Consolidated Financial Statements for the years ended December 31, 2016, 20152019, 2018 and 2014
| 2. | Financial Statement Schedules - O’Reilly Automotive, Inc. and Subsidiaries |
The following consolidated financial statement schedule of O’Reilly Automotive, Inc. and Subsidiaries is included in Item 15(a):
Schedule II - Valuation and qualifying accounts
All other schedules, for which provision is made in the applicable accounting regulations of the Securities and Exchange Commission, are not required under the related instructions or are inapplicable, and therefore have been omitted.
| 3. | Exhibits |
| Description | Balance at Beginning of Period | Additions - Charged to Costs and Expenses | Additions - Charged to Other Accounts - Describe | Deductions - Describe | Balance at End of Period | ||||||||||||||||
| Sales and returns allowances: | |||||||||||||||||||||
| For the year ended December 31, 2016 | $ | 7,978 | $ | 1,617 | $ | — | $ | — | $ | 9,595 | |||||||||||
| For the year ended December 31, 2015 | 6,855 | 1,123 | — | — | 7,978 | ||||||||||||||||
| For the year ended December 31, 2014 | $ | 6,500 | $ | 355 | $ | — | $ | — | $ | 6,855 | |||||||||||
| Allowance for doubtful accounts: | |||||||||||||||||||||
| For the year ended December 31, 2016 | $ | 9,637 | $ | 9,587 | $ | — | $ | 7,184 | (1) | $ | 12,040 | ||||||||||
| For the year ended December 31, 2015 | 8,713 | 7,119 | — | 6,195 | (1) | 9,637 | |||||||||||||||
| For the year ended December 31, 2014 | $ | 6,661 | $ | 8,919 | $ | — | $ | 6,867 | (1) | $ | 8,713 | ||||||||||
| | | ||||
|---|---|---|---|---|---|---|
Exhibit No. | Description | |||||
| | | ||||
3.1 | | |||||
3.2 | | |
4.1 | | Form of Stock Certificate for Common Stock, filed as Exhibit 4.1 to the Registration Statement of the Registrant on Form S-1, File No. 33-58948, is incorporated herein by this reference. |
4.2 | | |
4.3 | | |
4.4 | | |
4.5 | | |
76
| | |
|---|---|---|
Exhibit No. | Description | |
| | |
4.6 | | |
4.7 | | |
4.8 | | |
4.9 | | |
4.10 | | |
4.11 | | |
4.12 | | |
4.13 | | |
4.14 | | |
4.15 | | |
4.16 | | |
4.17 | | |
4.18 | | |
4.19 | | |
4.20 | | |
10.1 (a) | | Form of Employment Agreement between the Registrant and David E. O’Reilly, filed as Exhibit 10.1 to the Registration Statement of the Registrant on Form S-1, File No. 33-58948, is incorporated herein by this reference. |
10.2 (a) | ||
| ||
O’Reilly Automotive, Inc. Profit Sharing and Savings Plan, filed as Exhibit 4.1 to the Registration Statement of the Registrant on Form S-8, File No. 33-73892, is incorporated herein by this reference. |
10.3 (a) | ||
| ||
10.4 (a) | | |
77
| | |
|---|---|---|
Exhibit No. | Description | |
| | |
10.5 (a) | ||
| ||
10.6 (a) | ||
| ||
10.7 (a) | ||
| ||
10.8 (a) | | |
10.9 (a) | | |
10.10 (a) | ||
| ||
10.11 (a) | | |
10.12 (a) | | |
10.13 (a) | | |
10.14 (a) | | |
10.15 (a) | | |
10.16 (a) | | |
10.17 | | |
10.18 (a) | | |
10.19 (a) | | |
21.1 | | |
23.1 | | Consent of Ernst & Young LLP, independent registered public accounting firm, filed herewith. |
31.1 | | |
31.2 | | |
78
| | |
|---|---|---|
Exhibit No. | Description | |
| | |
32.1 * | | |
32.2 * | | |
101.INS | | iXBRL Instance Document – the instance document does not appear in the Interactive Data File because its XBRL tags are embedded within the Inline XBRL document. |
101.SCH | | iXBRL Taxonomy Extension |
101.CAL | | iXBRL Taxonomy Extension Calculation |
101.DEF | | iXBRL Taxonomy Extension Definition |
101.LAB | | iXBRL Taxonomy Extension Label |
101.PRE | | iXBRL Taxonomy Extension Presentation |
104 | | Cover Page Interactive Data File, formatted as Inline XBRL, contained in Exhibit 101 attachments. |
| | |
(a) | | Management contract or compensatory plan or arrangement. |
* | | Furnished (and not filed) herewith pursuant to Item 601 (b)(32)(ii) of Regulation S-K. |
79
O’REILLY AUTOMOTIVE, INC. AND SUBSIDIARIES
SCHEDULE II - VALUATION AND QUALIFYING ACCOUNTS
(in thousands)
| | | | | | | | | | | | | | | | |
|
| |
| Additions - |
| Additions - |
| |
| | | |||||
| | Balance at | | Charged to | | Charged to | | | | | Balance at | |||||
| | Beginning of | | Costs and | | Other Accounts - | | Deductions - | | End of | ||||||
Description | | Period | | Expenses | | Describe | | Describe | | Period | ||||||
Allowance for doubtful accounts: |
| |
|
| |
|
| |
|
| |
| | |
| |
For the year ended December 31, 2019 | | $ | 13,238 | | $ | 9,461 | | $ | — | | $ | 8,282 | (1) | | $ | 14,417 |
For the year ended December 31, 2018 | |
| 12,717 | |
| 9,475 | |
| — | |
| 8,954 | (1) | |
| 13,238 |
For the year ended December 31, 2017 | | $ | 12,040 | | $ | 8,598 | | $ | — | | $ | 7,921 | (1) | | $ | 12,717 |
| (1) | Uncollectable accounts written off. |
80
SIGNATURES
Pursuant to the requirements of Section 13 or 15(d) of the Securities Exchange Act of 1934, as amended, the registrant has duly caused this report to be signed on its behalf by the undersigned, thereunto duly authorized.
| | | | |
| O’REILLY AUTOMOTIVE, INC. | | ||
| (Registrant) | | ||
| | | | |
| Date: | February 28, 2020 | | |
| | | | |
| By: | /s/ | Gregory D. Johnson | |
| | Gregory D. Johnson | | |
| | Chief Executive Officer and | | |
| | Co-President | | |
Pursuant to the requirements of the Securities Exchange Act of 1934, as amended, this report has been signed below by the following persons on behalf of the registrant in the capacities and on the dates indicated.
| | | | | |
Date: | February 28, 2020 | | | | |
| | | | | |
| | | | | |
| /s/ | David O’Reilly | | /s/ | Larry O’Reilly |
| David O’Reilly | | Larry O’Reilly | ||
| Director and Chairman of the Board | | Director and Vice Chairman of the Board | ||
| | | | | |
| | | | | |
| /s/ | Rosalie O’Reilly Wooten | | /s/ | Greg Henslee |
| Rosalie O’Reilly Wooten | | Greg Henslee | ||
| Director | | Executive Vice Chairman of the Board | ||
| | | | | |
| | | | | |
| /s/ | Jay D. Burchfield | | /s/ | Thomas T. Hendrickson |
| Jay D. Burchfield | | Thomas T. Hendrickson | ||
| Director | | Director | ||
| | | | | |
| | | | | |
| /s/ | John R. Murphy | | /s/ | Dana M. Perlman |
| John R. Murphy | | Dana M. Perlman | ||
| Director | | Director | ||
| | | | | |
| | | | | |
| /s/ | Andrea M. Weiss | | | |
| Andrea M. Weiss | | | | |
| Director | | | | |
| | | | | |
| | | | | |
| /s/ | Gregory D. Johnson | | /s/ | Thomas McFall |
| Gregory D. Johnson | | Thomas McFall | ||
| Chief Executive Officer and | | Executive Vice President and | ||
| Co-President | | Chief Financial Officer | ||
| (Principal Executive Officer) | | (Principal Financial and Accounting Officer) | ||
81