0000898174 rga:LongevitySwapMember us-gaap:OtherIncomeMember 2018-01-01 2018-12-31 0000898174 us-gaap:ValuationAllowanceOfDeferredTaxAssetsMember 2017-12-31
UNITED STATES
SECURITIES AND EXCHANGE COMMISSION
Washington, DCD.C. 20549
FORM 10-K
☒Annual report pursuant to Section 13 or 15(d) of the Securities Exchange Act of 1934 for the fiscal year ended December 31, 20192022
☐Transition report pursuant to Section 13 or 15(d) of the Securities Exchange Act of 1934
Commission file number 1-11848
REINSURANCE GROUP OF AMERICA, INCORPORATED
(Exact name of registrant as specified in its charter)
|
| | | | | | | |
| Missouri | | 43-1627032 |
(State or other jurisdiction
of incorporation or organization)
| | (I.R.S. Employer
Identification No.)
|
16600 Swingley Ridge Road,, Chesterfield,, Missouri63017
(Address (Address of principal executive offices) (Zip Code)
Registrant’s telephone number, including area code: (636) (636) 736-7000
Securities registered pursuant to Section 12(b) of the Act:
|
| | | | | | | | | | | | | |
| Title of each class | | Trading Symbol(s) | | Name of each exchange on which registered |
| Common Stock, par value $0.01 | | RGA | | New York Stock Exchange |
6.20% Fixed-To-Floating Rate Subordinated Debentures due 2042 | | RZA | | New York Stock Exchange |
| 5.75% Fixed-To-Floating Rate Subordinated Debentures due 2056 | | RZB | | New York Stock Exchange |
| 7.125% Fixed Rate Reset Subordinated Debentures due 2052 | | RZC | | New York Stock Exchange |
Securities registered pursuant to Section 12(g) of the Act: None
Indicate by check mark if the registrant is a well-known seasoned issuer, as defined in Rule 405 of the Securities Act.
Yes x No ☐
Indicate by check mark if the registrant is not required to file reports pursuant to Section 13 or Section 15(d) of the Act.
Yes ☐ No x
Indicate by check mark whether the registrant (1) has filed all reports required to be filed by Section 13 or 15(d) of the Securities Exchange Act of 1934 during the preceding 12 months (or for such shorter period that the registrant was required to file such reports), and (2) has been subject to such filing requirements for the past 90 days. Yes x No ☐
Indicate by check mark whether the registrant has submitted electronically every Interactive Data File required to be submitted pursuant to Rule 405 of Regulation S-T (§232.405 of this chapter) during the preceding 12 months (or for such shorter period that the registrant was required to submit such files). Yes x No ☐
Indicate by check mark whether the registrant is a large accelerated filer, an accelerated filer, a non-accelerated filer, a smaller reporting company, or an emerging growth company. See the definitions of “large accelerated filer,” “accelerated filer,” “smaller reporting company” and “emerging growth company” in Rule 12b-2 of the Exchange Act.
Large accelerated filer x Accelerated filer ☐ Non-accelerated filer ☐ Smaller reporting company ☐ Emerging growth company ☐
If an emerging growth company, indicate by check mark if the registrant has elected not to use the extended transition period for complying with any new or revised financial accounting standards provided pursuant to Section 13(a) of the Exchange Act. ☐
Indicate by check mark whether the registrant has filed a report on and attestation to its management’s assessment of
the effectiveness of its internal control over financial reporting under Section 404(b) of the Sarbanes-Oxley Act (15 U.S.C.
7262(b)) by the registered public accounting firm that prepared or issued its audit report. x
If securities are registered pursuant to Section 12(b) of the Act, indicate by check mark whether the financial statements of the registrant included in the filing reflect the correction of an error to previously issued financial statements. ☐
Indicate by check mark whether any of those error corrections are restatements that required a recovery analysis of incentive-based compensation received by any of the registrant’s executive officers during the relevant recovery period pursuant to §240.10D-1(b). ☐
Indicate by check mark whether the registrant is a shell company. Yes ☐ No x
The aggregate market value of the stock held by non-affiliates of the registrant, based upon the closing sale price of the common stock on June 30, 2019,2022, as reported on the New York Stock Exchange was approximately $9.8$7.9 billion.
As of January 31, 2020, 62,583,9582023, 66,860,481 shares of the registrant’s common stock were outstanding.
DOCUMENTS INCORPORATED BY REFERENCE
Part III of this Form 10-K incorporates by reference certain information from the Registrant’s Definitive Proxy Statement for the Annual Meeting of Shareholders (the “Proxy Statement”) to be held inon May 2020,24, 2023, to be filed by the Registrant with the Securities and Exchange Commission pursuant to Regulation 14A not later than 120 days after the year ended December 31, 2019.2022.
REINSURANCE GROUP OF AMERICA, INCORPORATED AND SUBSIDIARIES
TABLE OF CONTENTS
| | | | | | | | |
| | |
| Item | | Page |
| PART I |
| | |
| 1 | | |
| 1A | | |
| 1B | | |
| 2 | | |
| 3 | | |
| 4 | | |
|
| PART II |
| | |
| 5 | | |
| 6 | | |
| 7 | | |
| 7A | | |
| 8 | | |
| 9 | | |
| 9A | | |
| 9B | | |
|
| PART III |
| | |
| 10 | | |
| 11 | | |
| 12 | | |
| 13 | | |
| 14 | | |
|
| PART IV |
| | |
| 15 | | |
| 16 | | |
| | |
| | |
| |
|
| | |
| | | |
| Item | | Page |
| PART I |
| | | |
| 1 | | |
| 1A | | |
| 1B | | |
| 2 | | |
| 3 | | |
| 4 | | |
| |
| PART II |
| | | |
| 5 | | |
| 6 | | |
| 7 | | |
| 7A | | |
| 8 | | |
| 9 | | |
| 9A | | |
| 9B | | |
| |
| PART III |
| | | |
| 10 | | |
| 11 | | |
| 12 | | |
| 13 | | |
| 14 | | |
| |
| PART IV |
| | | |
| 15 | | |
| 16 | | |
Item 1. BUSINESS
Reinsurance Group of America, Incorporated (“RGA”) is an insurance holding company that was formed on December 31, 1992. The consolidated financial statements herein include the assets, liabilities, and results of operations of RGA and its subsidiaries, all of which are wholly owned, (collectively,and is referred to as the “Company”)., “we”, “us” and “our” in this Annual Report on Form 10-K.
The Company is a leading global provider of traditional life and health reinsurance and financial solutions with operations in the U.S., Latin America, Canada, Europe, the Middle East, Africa, Asia and Australia. Reinsurance is an arrangement under which an insurance company, the “reinsurer,” agrees to indemnify another insurance company, the “ceding company,” for all or a portion of the insurance and/or investment risks underwritten by the ceding company. Reinsurance is designed to (i) to:
i.reduce the net amount at risk on individual risks, thereby enabling the ceding company to increase the volume of business it can underwrite, as well as increase the maximum risk it can underwrite on a single risk; (ii)
ii.enhance the ceding company’s financial strength and surplus position; (iii)
iii.stabilize operating results by leveling fluctuations in the ceding company’s loss experience; and (iv)
iv.assist the ceding company in meeting applicable regulatory requirements.
The Company has the following geographic-based and business-based operational segments:
•U.S. and Latin America;
•Canada;
•Europe, Middle East and Africa; Africa (“EMEA”);
•Asia Pacific; and
•Corporate and Other.
Geographic-based operations are further segmented into traditional and financial solutions businesses. The Company’s segments primarily write traditional reinsurance and financial solutions business that is wholly or partially retained in one or more of RGA’s reinsurance subsidiaries. See “Segments” for more information concerning the Company’s operating segments.
Impacts of the COVID-19 Pandemic on RGA’s Business
The COVID-19 global pandemic and the response thereto continued to result in increases in mortality, morbidity and other insurance risks during 2022, and is expected to have a negative impact on the Company’s mortality business. The global financial markets have stabilized since the beginning of the pandemic; however, they continue to be in a state of uncertainty due to COVID-19, an increase in inflation, higher interest rates and ongoing supply chain issues.The extent to which the Company’s future results continue to be affected by COVID-19 will largely depend on, among other factors, country-specific circumstances, measures by public and private institutions, the impact of new variants of the virus, and vaccination levels globally. Given these many variables, the Company cannot reliably predict the future impact of the pandemic on its business, results of operations and financial condition. For a further discussion of the risks, uncertainties and actions taken in response to COVID-19, refer to Item 1A "Risk Factors" and Item 7 "Management's Discussion and Analysis of Financial Condition and Results of Operations.”
Traditional Reinsurance
Traditional reinsurance includes individual and group life and health, disability, long-term care and critical illness reinsurance. reinsurance, as further described below:
•Life reinsurance primarily refers to reinsurance of individual or group-issued term, whole life, universal life, and joint and last survivor insurance policies.
•Health and disability reinsurance primarily refers to reinsurance of individual or group health policies.
•Long-term care reinsurance provides benefits in the event a person is no longer able to perform some specified activities of daily living.
•Critical illness reinsurance provides a benefit in the event of the diagnosis of a pre-defined critical illness.
Traditional reinsurance is written on a facultative or automatic treaty basis. Facultative reinsurance is individually underwritten by the reinsurer for each policy to be reinsured, with the pricing and other terms established based upon rates negotiated in advance. Facultative reinsurance is normally purchased by ceding companies for medically impaired lives, unusual risks, or liabilities in excess of the binding limits specified in their automatic reinsurance treaties.
An automatic reinsurance treaty provides that the ceding company will cede risks to a reinsurer on specified blocks of policies where the underlying policies meet the ceding company’s underwriting criteria. In contrast to facultative reinsurance, the reinsurer does not approve each individual policy being reinsured. Automatic reinsurance treaties generally provide that the reinsurer will be liable for a portion of the risk associated with the specified policies written by the ceding company. Automatic reinsurance treaties specify the ceding company’s binding limit, which is the maximum amount of risk on a given life that can be ceded automatically to the reinsurer and that the reinsurer must accept. The binding limit may be stated either as a multiple of the ceding company’s retention or as a stated dollar amount.
Facultative and automatic reinsurance may be written as yearly renewable term, coinsurance, modified coinsurance or coinsurance with funds withheld. Under a yearlywithheld, as further described below:
•Yearly renewable term treaty the– The reinsurer assumes primarily the mortality or morbidity risk. Under a coinsurance
•Coinsurance arrangement depending– Depending upon the terms of the contract, the reinsurer may share in the risk of loss due to mortality or morbidity, lapses, and the investment risk, if any, inherent in the underlying policy.
•Modified coinsurance and coinsurance with funds withheld differagreements – Differ from coinsurance arrangements in that the assets supporting the reserves are retained by the ceding company.
Generally, the amount of life and health reinsurance ceded is stated on an excess or a quota share basis. Reinsurance on an excess basis covers amounts in excess of an agreed-upon retention limit. Retention limits vary by ceding company and also may vary by the age or underwriting classification of the insured, the product, and other factors. Under quota share reinsurance, the ceding company states its retention in terms of a fixed percentage of the risk with the remainder to be ceded to one or more reinsurers up to the maximum binding limit.
Many reinsurance agreements include recapture rights that permit the ceding company to reassume all or a portion of the risk formerly ceded to the reinsurer after an agreed-upon period of time or in some cases due to deterioration in the financial condition or ratings of the reinsurer. Recapture of business previously ceded does not affect premiums ceded prior to the recapture of such business, but would reduce premiums in subsequent periods. The potential adverse effects of recapture rights are mitigated by the following factors: (i) recapture rights vary by treaty and the risk of recapture is a factor that is considered when pricing a reinsurance agreement; (ii) ceding companies generally may exercise their recapture rights only to the extent they have increased their retention limits for the reinsured policies; (iii) ceding companies generally must recapture all of the policies eligible for
recapture under the agreement in a particular year if any are recaptured, which prevents a ceding company from recapturing only the most profitable policies; and (iv) the ceding company is sometimes required to pay a fee to the reinsurer upon recapture. In addition, when a ceding company recaptures reinsured policies, the reinsurer generally releases the reserves it maintained to support the recaptured portion of the policies.
Financial Solutions
Financial solutions include asset-intensive reinsurance, longevity reinsurance, asset-intensive reinsurance, capital solutions and stable value products.products and capital solutions.
Asset-Intensive Reinsurance
Asset-intensive reinsurance refers to transactions with a significant investment component, which qualify as reinsurance under U. S.U.S. generally accepted accounting principles (“GAAP”). Asset-intensive reinsurance allows the Company’s clients to manage their investment risk and available capital to pursue new growth opportunities.
An ongoing partnership with clients is important with asset-intensive reinsurance because of the active management involved in this type of reinsurance. This active management includes investment decisions, investment and claims management, and the determination of non-guaranteed elements. Some examples of asset-intensive reinsurance are:are fixed deferred annuities, immediate/payout annuities, indexed annuities, unit-linked variable annuities, universal life, corporate-owned life insurance and bank-owned life insurance, unit-linked variable life, immediate/payout annuities, whole life, disabled life reserves, and extended term insurance.
Longevity Reinsurance
RGA’s longevity reinsurance products are reinsurance contracts from which the Company earns premium for assuming the longevity risk of pension plans and other annuity products that have been insured by third parties. In many countries, companies are increasingly interested in reducing their exposure to longevity risk related to employee retirement benefits and individual annuities. This concern comes from both the absolute size of the risk and also through the volatility that
changes in life expectancy can have on their reported earnings. In addition, insurance companies that offer lifetime annuities are seeking ways to manage their current exposure, while also recognizing the potential to take on more risk from employers and individuals.
The Company has entered into reinsurance transactions on existing longevity business for clients in the U.S., Europe and Canada. These have been arrangements with traditional insurance companies, as well as customized arrangements for banks dealing with pension schemes. During the fourth quarter of 2022, the Company entered the U.S. pension risk transfer market, and has begun working with partners to provide pension plan sponsors solutions that will enable them to diversify and protect the benefits provided to the annuitants.
Stable Value Products
The Company provides guaranteed investment contracts to retirement plans that include investment-only, stable value wrap products. The assets are owned by the trustees of such plans, who invest the assets under the terms of investment guidelines to which the Company agrees. The contracts contain a guarantee of a minimum rate of return on participant balances supported by the underlying assets, and a guarantee of liquidity to meet certain participant-initiated plan cash flow requirements.
Capital Solutions
Capital solutions includes financial reinsurance and fee-based transactions which assist ceding companies in meeting applicable regulatory requirements by enhancing the ceding companies’ financial strength and regulatory surplus position. While low risk, these transactions do meet the risk transfer guidelines under National Association of Insurance Commissioners (“NAIC”) reporting rules, providing protection against significantly adverse changes in the business. Financial reinsurance and fee-based transactions do not qualify as reinsurance under GAAP due to the remote-risk nature of the transactions and are reported in accordance with deposit accounting guidelines or other applicable accounting guidelines.
As a holding company, RGA is separate and distinct from its subsidiaries and has no significant business operations of its own. Therefore, it relies on capital raising efforts, interest income on undeployed corporate investments and dividends from its insurance companies and other subsidiaries as the principal source of cash flow to meet its obligations, pay dividends and repurchase common stock. Information regarding the cash flow and liquidity needs of RGA may be found in Part II, Item 7, Management’s Discussion and Analysis of Financial Condition and Results of Operations -– Liquidity and Capital Resources.
Regulation
The following table provides the jurisdiction of the regulatory authority for RGA’s primary operating and captive subsidiaries:
|
| | | | | | | |
| Subsidiary | | Regulatory Authority Jurisdiction |
| RGA Reinsurance Company (“RGA Reinsurance”) | | Missouri |
| Parkway Reinsurance Company (“Parkway Re”) | | Missouri |
| Rockwood Reinsurance Company (“Rockwood Re”) | | Missouri |
| Castlewood Reinsurance Company (“Castlewood Re”) | | Missouri |
| Chesterfield Reinsurance Company (“Chesterfield Re”) | | Missouri |
ReinsuranceRGA Life and Annuity Insurance Company of Missouri, Incorporated (“RCM”RGA Life and Annuity”) | | Missouri |
Timberlake Reinsurance Company II (“Timberlake Re”) | | South Carolina |
| RGA Life Reinsurance Company of Canada (“RGA Canada”) | | Canada |
| RGA Reinsurance Company (Barbados) Ltd. (“RGA Barbados”) | | Barbados |
| RGA Americas Reinsurance Company, Ltd. (“RGA Americas”) | | Bermuda |
| Manor Reinsurance, Ltd. (“Manor Re”) | | Barbados |
| RGA Atlantic Reinsurance Company Ltd. (“RGA Atlantic”) | | Barbados |
| RGA Worldwide Reinsurance Company, Ltd. (“RGA Worldwide”) | | Barbados |
| RGA Global Reinsurance Company, Ltd. (“RGA Global”) | | Bermuda |
| RGA Reinsurance Company of Australia Limited (“RGA Australia”) | | Australia |
| RGA International Reinsurance Company dac (“RGA International”) | | Ireland |
| RGA Reinsurance Company of South Africa, Limited (“RGA South Africa”) | | South Africa |
| Aurora National Life Assurance Company (“Aurora National”) | | California |
Greenhouse Life Insurance Company (“Greenhouse”) | | Arizona |
| Omnilife Insurance Company, Limited | | United Kingdom |
| Hodge Life Assurance Company Limited | | United Kingdom |
| | |
Certain of the Company’s subsidiaries are subject to regulations in the other jurisdictions in which they are licensed or authorized to do business. Insurance laws and regulations, among other things, establish minimum capital requirements and
limit the amount of dividends, distributions, and intercompany payments that affiliates can make without regulatory approval. Additionally, insurance laws and regulations impose restrictions on the amounts and types of investments that insurance companies may hold. New capital standards (discussed below) are being developed and are likely to be applied to one or more of the Company’s subsidiaries to either require more capital and/or limit the extent to which some forms of existing capital may be counted in an evaluation of financial strength by its regulators.
U.S. Regulation
Insurance Regulation
The insurance laws and regulations, as well as the level of supervisory authority that may be exercised by the various state insurance departments, vary by jurisdiction. These laws and regulations generally grantgenerally:
•Grant broad powers to supervisory agencies or regulators to examine and supervise insurance companies and insurance holding companies with respect to every significant aspect of the conduct of the insurance business. This includes the power to pre-approve the execution or modification of contractual arrangements. These laws and regulations generally require
•Require insurance companies to meet certain solvency standards and asset tests, to maintain minimum standards of financial strength and to file certain reports with regulatory authorities (including information concerning their capital structure, ownership and financial condition). These laws and regulations subject
•Subject insurers to potential assessments for amounts paid by guarantee funds.
RGA Reinsurance, Chesterfield Re and RCMRGA Life and Annuity are subject to the state of Missouri’s adoption of the National Association of Insurance Commissioners (“NAIC”) Model Audit Rule, which requires an insurer to have an annual audit by an independent certified public accountant, provide an annual management report of internal control over financial reporting, file the resulting reports with the Director of Insurance and maintain an audit committee.committee under certain conditions. Aurora National and Greenhouse areis subject to similar regulation by the StatesState of California and Arizona respectively.California.
The Insurance Holding Company System Regulatory Acts in the U.S. permitspermit the Missouri regulator to request and consider similar information in its regulation of the solvency of and capital standards for RGA Reinsurance, Chesterfield Re and RCM.RGA Life and Annuity. In addition, the California and Arizona regulators areregulator is permitted to request and consider in theirits regulation of the solvency of and capital standards for Aurora National, and Greenhouse respectively. Informationinformation about the operations of other subsidiaries of RGA and the extent to which contagion risk posed by those operations may also exist.
In addition, RGA is subject to a supervisory college, conducted by its group supervisor the Missouri Department of Commerce and Insurance (“MDCI”). The supervisory college is comprised of insurance regulators of the major jurisdictions in which RGA has established insurance branches and subsidiaries. Since the inception of the supervisory college in October 2012, the MDCI has conducted regular in-person supervisory college meetings in addition to numerous regulator-only conference calls. These meetings bring aboutgenerate requests for information from RGA’s regulators as they monitor RGA’s solvency, governance and
overall management. While the supervisory college has the ability to impose limitations on the activities of the insurance subsidiaries of RGA, particularly since RGA has met the requirements to becomebeen designated by its group supervisor as an internationally active insurance group,Internationally Active Insurance Group (“IAIG”), no such limitations have been imposed to date. The existence of the supervisory college does generally help RGA’shelps regulators understand itsRGA’s business to a greater degree and does encourageencourages a more global view by RGA of its own regulation.
RGA’s reinsurance subsidiaries are required to file statutory financial statements in each jurisdiction in which they are licensed and may be subject to onsite, periodic examinations by the insurance regulators of the jurisdictions in which each is licensed, authorized, or accredited. To date, none of the regulators’ reports related to the Company’s periodic examinations have contained material adverse findings.
Although some of the rates and policy terms of U.S. direct insurance agreements are regulated by state insurance departments, the rates, policy terms, and conditions of reinsurance agreements generally are not subject to regulation by any regulatory authority. The sameauthority, which is also true outside of the U.S. In the U.S., however, the NAIC Model Law on Credit for Reinsurance, which has been adopted in most states, including Missouri, imposes certain requirements for an insurer to take reserve credit for risk ceded to a reinsurer. Generally, the reinsurer is required to be licensed, accredited or accreditedcertified in the insurer’s state of domicile or the reinsurer must be domiciled in a jurisdiction that is found by the U.S. regulators to observe the standards established in the U.S. – E.U. Covered Agreement. Otherwise, the reinsurer must post security for reserves transferred to the reinsurer in the form of letters of credit or assets placed in trust. A forthcoming alternative will allowThe option for a U.S.-U.S. domiciled insurer to obtain credit for the reserves it cedes to what will be termed a “reciprocal reinsurer”. A reciprocal reinsurer is a reinsurer that is domiciled in a jurisdiction that observes the standards established in the U.S.-EU-CoveredU.S. – E.U. Covered Agreement oris termed ceding reinsurance to a similar bi-lateral trade agreement dealing with reinsurance.“reciprocal reinsurer.” Insurers ceding business to reciprocal reinsurers will beare permitted to take reserve credit without the reinsurer having to establish security. The NAIC Life and Health Reinsurance Agreements Model Regulation, which has been adopted in most states, including Missouri, imposes additional requirements for insurers to claim reserve credit for reinsurance ceded (excluding yearly renewable term reinsurance and non-proportionalnon-
proportional reinsurance). These requirements include bona fide risk transfer, an insolvency clause, written agreements, and filing of reinsurance agreements involving in force business, among other things. Outside of the U.S., rules for reinsurance and requirements for minimum risk transfer are less specific and are less likely to be published as rules, but nevertheless standards can be imposed to varying extents.
U.S. Valuation of Life Policies Model Regulation (commonly referred to as Regulation XXX), implemented beginning in the U.S.2002 for various types of life insurance business, significantly increased the level of reserves that U.S. life insurance and life reinsurance companies must holdmaintain on their statutory financial statements for various types of life insurance business, primarily certain level premium term life products. The reserve levels required under Regulation XXX are normally in excess of reserves required under GAAP. In situations where primary insurers have reinsured business to reinsurers that are unlicensed and unaccredited in the U.S., the reinsurer must provide collateral equal to its reinsurance reserves in order for the ceding company to receive statutory financial statement credit. Reinsurers have historically utilized letters of credit for the benefit of the ceding company, or have placed assets in trust for the benefit of the ceding company, or have used other structures as the primary forms of collateral. An exception to this requirement will soonis expected to exist for reinsurance ceded to reciprocal reinsurers.
RGA Reinsurance is the primary subsidiary of the Company subject to Regulation XXX. In order to manage the effect of Regulation XXX on its statutory financial statements, RGA Reinsurance has retroceded a majority of Regulation XXX reserves to unaffiliated and affiliated unlicensed reinsurers and special purpose reinsurers, or captives. RGA Reinsurance’s statutory capital may be significantly reduced if the unaffiliated or affiliated reinsurer is unable to provide the required collateral to support RGA Reinsurance’s statutory reserve credits and RGA Reinsurance cannot find an alternative source for the collateral. The NAIC has requirements for life insurers using special purpose reinsurers. Current standards addressing the use of captive reinsurers allow captives organized prior to 2016 to continue in accordance with their currently approved plans. State insurance regulators that regulate domestic insurance companies have placed additional restrictions on the use of newly established captive reinsurers, which may increase costs and add complexity. While RGA Reinsurance’s reserve financing arrangements using special purpose reinsurers or “captive reinsurers” are permitted, the rules place limitations on RGA Reinsurance’s ability to utilize captive reinsurers to finance reserve growth related to future business. Such limitations have causedAs a result, RGA Reinsurance may need to alter the Companytype and volume of business it reinsures, increase prices on those products, raise additional capital to utilize alternative retrocessionsupport higher regulatory reserves or implement higher cost strategies, primarily involving the use of a certified reinsurer as discussed below.
RGA Reinsurance, Chesterfield Re, Parkway Re, Rockwood Re, Castlewood Re and RCM prepare statutory financial statements in conformity with accounting practices prescribed or permitted by the State of Missouri. Timberlake Re prepares statutory financial statements in conformity with accounting practices prescribed or permitted by the State of South Carolina. Aurora National prepares its statutory financial statements in conformity with accounting practices prescribed or permitted by the State of California and Greenhouse prepares its statutory financial statements in conformity with accounting practices of the State of Arizona. Each of these states require domestic insurance companies to prepare their statutory financial statements in accordance with the NAIC Accounting Practices and Procedures manual subject to any deviations permitted by each state’s insurance commissioner. The Company’s non-U.S. subsidiaries are subject to the regulations and reporting requirements of their respective countries of domicile.
Based on the growth of the Company’s business and the pattern of reserve levels under Regulation XXX associated with term life business and other statutory reserve requirements, the amount of ceded reserve credits is expected to grow, albeit, with the implementation of principles-based reserves in the U.S., reserve growth is proceeding at slower rates than in the immediate past. This growth will require the Company to retrocede business to affiliated or unaffiliated parties, to obtain additional letters of credit, put additional assets in trust, or utilize other funding mechanisms to support reserve credits. If the Company is unable to support the reserve credits, the regulatory capital levels of several of its subsidiaries may be significantly reduced, while the regulatory capital requirements
for these subsidiaries would not change. The reduction in regulatory capital could affect the Company’s ability to write new business and retain existing business.
Affiliated captives are commonly used in the insurance industry to help manage statutory reserve and collateral requirements and are often domiciled in the same state as the insurance company that sponsors the captive. The NAIC has analyzed the insurance industry’s use of affiliated captive reinsurers to satisfy certain reserve requirements and has adopted measures to promote uniformity in both the approval and supervision of such reinsurers. Current standards addressing the use of captive reinsurers allow captives organized prior to 2016 to continue in accordance with their currently approved plans. State insurance regulators that regulate the Company’s domestic insurance companies have placed additional restrictions onStandards imposed upon the use of newly established captive reinsurers, which mayinsurers for transactions after 2015 increase costs and add complexity.complexity to the use of captive insurers. As a result, the Company may need to alter the type and volume of business it reinsures, increase prices on those products, raise additional capital to support higher regulatory reserves or implement higher cost strategies.
In the U.S., the introduction of thea certified reinsurer has provideddesignation provides an alternative way to manage regulatory reserves and collateral requirements. In 2014, RGA Americas was designated as a certified reinsurer by the MDCI. This designation allows the Company to retrocede business to RGA Americas in lieu of using captives for collateral requirements. Beginning in 2017, the NAIC approved principles-based reserving for U.S. insurers,insurers; however, implementation required approval by the states. To achieve this, the NAIC amended the standard valuation law to adopt life principles-based reserving (PBR) that was effective January 1, 2017, allowing a three-year adoption period. The Company has begun its implementation of principlesadopted PBR in 2020, and PBR reserves are determined based reserving, however as some aspectson the terms of the new regulation remain unresolved, the full impactreinsurance agreement which may differ from those of the new requirements is yet unknown. The Company has chosen not to establish captives subject to the new regulations as it evaluates the impact of the regulations on new captives, and how these new captives fit into the Company’s overall risk management and financing programs.direct policies.
Reinsurers may place assets in trust to satisfy collateral requirements for certain treaties. In addition, the Company holds securities in trust to satisfy collateral requirements under certain third-party reinsurance treaties. Under certain conditions in some treaties, the Company may be obligated to move reinsurance from one subsidiary of RGA to another subsidiary, post additional collateral for the ceding insurer or allow the ceding insurer to cancel the reinsurance. These conditions include change in control, level of capital or ratings of the subsidiary, insolvency, nonperformance under a treaty, or loss of the
subsidiary’s reinsurance license. If the Company is ever required to perform under these obligations, the risk to the consolidated company under the reinsurance treaties would not change; however, additional capital may be required due to the change in jurisdiction of the subsidiary reinsuring the business and may create a strain on liquidity, possibly causing a reduction in dividend payments or hampering the Company’s ability to write new business or retain existing business. In the event that a treaty is terminated, the future profits related to the terminated treaty may be lost.
RGA Reinsurance, Chesterfield Re, Parkway Re, Rockwood Re, Castlewood Re and RGA Life and Annuity prepare statutory financial statements in conformity with accounting practices prescribed or permitted by the State of Missouri. Aurora National prepares its statutory financial statements in conformity with accounting practices prescribed or permitted by the State of California. Each of these states require domestic insurance companies to prepare their statutory financial statements in accordance with the NAIC Accounting Practices and Procedures manual subject to any deviations permitted by each state’s insurance commissioner. The Company’s non-U.S. subsidiaries are subject to the regulations and reporting requirements of their respective countries of domicile.
Capital Requirements
Risk-Based Capital (“RBC”) guidelines promulgated by the NAIC are applicable to RGA Reinsurance, RCM,RGA Life and Annuity, Aurora National, Greenhouse and Chesterfield Re, and identify minimum capital requirements based upon business levels and asset mix. These subsidiaries maintain capital levels in excess of the amounts required by the applicable guidelines. Timberlake Re, Parkway Re, Rockwood Re and Castlewood Re’s capital requirements are determined solely by their licensing orders issued by their states of domicile. Pursuant to its licensing order issued by the South Carolina Department of Insurance, Timberlake Re only calculates RBC as a means of demonstrating its ability to pay principalMDCI, and interest on its surplus note issued to Timberlake Financial, L.L.C. (“Timberlake Financial”). It isare not otherwise subject to the RBC guidelines. Similarly, ParkwayAs to RGA Reinsurance, RGA Life and Annuity, Aurora National and Chesterfield Re, Rockwood Re and Castlewood Re are not subject to the requirements of the NAIC’s RBC guidelines. Aa decline in the RBC of one or more of the Company’s U.S. insurers can cause the appearance of less capitalization in its U.S. insurers, individually, or when considered as a group.
The development of a group capital calculation by the NAIC will also have relevance to RGA Reinsurance, RCM, Aurora National, Greenhouse and Chesterfield Re along with captive reinsurers Timberlake Re, Parkway Re, Rockwood Re and Castlewood Re. While the NAIC is still working ondeveloping its group capital calculation and has not yet articulated the ways in which it intends U.S. states to use the calculation, the calculation is expected to be used to assess the adequacy of capital within an insurance group domiciled in the U.S., particularly where the group isfor groups such as RGA that are designated an Internationally Active Insurance Group (“IAIG”)IAIG by the group supervisor. The Company cannot currently predict the effect that any proposed or future group capital standard will have on its financial condition or operations or the financial condition or operations of its subsidiaries.
Regulations in international jurisdictions also require certain minimum capital levels, and subject the companies operating in such jurisdictions, to oversight by the applicable regulatory bodies. RGA’s subsidiaries meet the minimum capital requirements in their respective jurisdictions. The International Association of Insurance Supervisors continues work on its insurance capital standard. While the insurance capital standard is a model for capital standards and not a standard that must be followed on its own in any jurisdiction, it is likely to influence capital requirements for insurers around the world and may lead to a need for additional capital in one or more of RGA’s subsidiaries. The Company cannot predict the effect that any proposed or future legislation or rulemaking in the countries in which it operates may have on the financial condition or operations of the Company or its subsidiaries.
Insurance Holding Company Regulations
RGA Reinsurance, Chesterfield Re Parkway Re, Rockwood Re, Castlewood Re and RCMRGA Life and Annuity are subject to regulation under the insurance and insurance holding company statutes of Missouri. Aurora National is subject to regulation under the insurance and insurance holding company statutes of California. Greenhouse is subject to insurance holding company statutes of Arizona. These insurance holding company laws and regulations generally require insurance and reinsurance subsidiaries of insurance holding companies to register and file with the home state regulator certain reports describing, among other information, capital structure, ownership, financial condition, certain intercompany transactions, and general business operations. The insurance holding company statutes and regulations also require prior approval of, or in certain circumstances, prior notice to the home state regulator of, certain material intercompany transfers of assets, as well as certain transactions between insurance companies, their parent companies and affiliates.
Under current Missouri California and ArizonaCalifornia insurance laws and regulations, no person may acquire any voting security or security convertible into a voting security of an insurance holding company, such as RGA, if as a result of the acquisition such person would “control” the insurance holding company. “Control” is presumed to exist under Missouri California and ArizoniaCalifornia law if a person directly or indirectly owns or controls 10% or more of the voting securities of another person. Changes in control of an insurer are not permitted under the laws of these states unless: (i) certain filings are made with the home state regulator, (ii) certain requirements are met, including a public hearing, and (iii) approval or exemption is granted by the home state regulator. Additionally, revisions to the insurance holding company regulations of Missouri California and ArizonaCalifornia require increased disclosure to regulators of matters within the RGA group of companies.
Restrictions on Dividends and Distributions
Current Missouri law, applicable to RCMRGA Life and Annuity and its subsidiaries, RGA Reinsurance and Chesterfield Re, permits the payment of dividends or distributions by each company that together with dividends or distributions paid during the preceding twelve months by that company do not exceed the greater of (i) 10% of the insurer’s statutory capital and surplus
as of the preceding December 31, or (ii) the insurer’s statutory net gain from operations for the preceding calendar year. Any proposed dividend in excess of this amount is considered an “extraordinary dividend” and may not be paid until it has been approved, or a 30-day waiting period has passed during which it has not been disapproved, by the Director of the MDCI. Additionally, dividends may be paid only to the extent the insurer has unassigned surplus (as opposed to contributed surplus). The regulatory limitations and other restrictions described herein could limit the Company’s financial flexibility in the future should it choose to or need to use subsidiary dividends as a funding source for its obligations. See Note 11 -– “Financial Condition and Net Income on a Statutory Basis - Significant Subsidiaries”Basis” in the Notes to Consolidated Financial Statements for additional information on the Company’s dividend restrictions.
The California Insurance Holding Company Act defines an extraordinary dividend consistent with the definition found in the Missouri Insurance Holding Company Act and imposes an identical restriction upon the ability of Aurora National to pay dividends to RGA Reinsurance. In contrast to both the Missouri and the California Insurance Holding Company Acts, the NAIC Model Insurance Holding Company System Regulatory Act and the Arizona Insurance Holding Company Act each definedefines an extraordinary dividend as a dividend or distribution that together with dividends or distributions paid during the preceding twelve months exceeds the lesser of (i) 10% of statutory capital and surplus as of the preceding December 31, or (ii) statutory net gain from operations for the preceding calendar year. The Company is unable to predict whether, when, or if, Missouri will enact a new regulation for extraordinary dividends.
Missouri insurance laws and regulations also require that the statutory surplus of Chesterfield Re, RCMRGA Life and Annuity and RGA Reinsurance following any dividend or distribution be reasonable in relation to their outstanding liabilities and adequate to meet their financial needs. The Director of the MDCI may call for a rescission of the payment of a dividend or distribution by these entities that would cause their statutory surplus to be inadequate under the standards of the Missouri insurance regulations. California and Arizona insurance laws and regulations impose the same restrictions on Aurora National and Greenhouse, respectively, as to the dividends or distributions that are made.
Pursuant to the South Carolina Director of Insurance, Timberlake Re may declare dividends subject to a minimum Total Adjusted Capital threshold, as defined by the NAIC’s RBC regulation. As of December 31, 2019, Timberlake Re met the minimum required threshold. Any dividends paid by Timberlake Re would be paid to Timberlake Financial, which in turn is subject to contractual limitations on the amount of dividends it can pay to RCM.
Dividend payments from non-U.S. operations are subject to similar restrictions established by local regulators. The non-U.S. regulatory regimes also commonly limit the dividend payments to the parent to a portion of the prior year’s statutory income, as determined by the local accounting principles. The regulators of the Company’s non-U.S. operations may also limit or prohibit profit repatriations or other transfers of funds to the U.S. if such transfers are deemed to be detrimental to the solvency or financial strength of the non-U.S. operations, or for other reasons. Most of the non-U.S. operating subsidiaries are second tier subsidiaries that are owned by various non-U.S. holding companies. The capital and rating considerations applicable to the first tier subsidiaries may also impact the dividend flowdividends paid to RGA.
Default or Liquidation
In the event that RGA defaults on any of its debt or other obligations, or becomes the subject of bankruptcy, liquidation, or reorganization proceedings, the creditors and stockholders of RGA will have no right to proceed against the assets of any of the subsidiaries of RGA. If any of RGA’s reinsurance subsidiaries were to be liquidated or dissolved, the liquidation or dissolution would be conducted in accordance with the rules and regulations of the appropriate governing body in the state or country of the subsidiary’s domicile. The creditors of any such reinsurance company including, without limitation, holders of its reinsurance agreements and state guaranty associations (if applicable), would be entitled to payment in full from such assets before RGA, as a direct or indirect stockholder, would be entitled to receive any distributions or other payments from the remaining assets of the liquidated or dissolved subsidiary.
Federal Regulation
Since the 2010 enactment of the Dodd-Frank Wall Street Reform and Consumer Protection Act, there has been renewed interest by the U.S. federal government inhas paid greater attention to the manner in which insurance and reinsurance is regulated.regulated, particularly when U.S. insurers and reinsurers are doing business outside of the U.S. Under the Dodd-Frank Act, recent activity by the Federal Insurance Office within the U.S. Treasury Department has resulted in the negotiation ofnegotiated a “covered agreement” with the European Union.Union, as well as a similar “covered agreement��� with the United Kingdom (“UK”) (together, the “Covered Agreements”). The covered agreement,Covered Agreements, while promoting the recognition of U.S. state insurance regulators as group supervisors of U.S.-based global reinsurers such as RGA, also provides for an elimination of the collateral that has to be posted by reinsurers based in the European Union, and by NAIC’s anticipated extension of the rules, to those reinsurers based in Bermudaadditional jurisdictions that seek evaluation by the NAIC for treatment comparable to that given to members of the European Union under the U.S. – E.U. Covered Agreement. A similar covered agreement is in place between the U.S. and Switzerland,the UK providing comparable results to both countries. The extension of the Covered Agreement treatment to additional jurisdictions will provide for the elimination of the collateral that reinsurers domiciled in those jurisdictions must currently post in favor of U.S. ceding insurers. This agreement,The Covered Agreements, coupled with new state credit for reinsurance laws, has the potential to lower the cost at which RGA Reinsurance’s competitors are able to provide reinsurance to U.S. insurers. Additionally, under the Dodd-Frank Act, one or more of RGA’s client ceding insurers domiciled in the U.S. may from time-to-time be designated for solvency supervisionsystemically important by the Federal Reserve.
Insurers can bethat are designated systemically important so ascan be subject to warrant the imposition of an additional layer of regulation over already existing state regulation. While it is not currently expected that any RGA entity would be deemed to be systemically important and become subject to this additional scrutiny, the reinsurance programs RGA maintains with the
insurers so designated as systemically important entities are subject to scrutiny by the Federal Reserve. While no U.S. insurers or reinsurers are currently designated as systemically important entities, and the international designation of “Globally Systemically Important Insurers” has been suspended by the Financial Stability Board, it isremains possible that one or more of RGA’s clients will be given this designation in the future leading to additional scrutiny of those clients’ reinsurance programs by the Federal Reserve.
With the potential regulation of some U.S. domiciled insurers by the U.S. government, it is possible that the scope of the federal government’s ability to regulate insurers and reinsurers will be expanded. It is not possible to predict the effect of such decisions or changes in law on the operation of the Company, but the Dodd-Frank Act makes it more likely than in the past that insurance or reinsurance may be to some extent become regulated at the federal level. A shift in regulation from the state to the federal level may bring into question the continued validity of the McCarran-Ferguson Act, which exempts the “business of insurance” from most federal laws, including anti-trust laws. With the McCarran-Ferguson Act exemption for the business of insurance, a reinsurer may set rate, underwriting and claims handling standards for its ceding company clients to follow.
Environmental Considerations Related to Real Property Ownership, Development and Mortgage Investment
Federal, state and local environmental laws and regulations apply to the Company’s ownership and operation of real property. Inherent in owning and operating real property are the risks of hidden environmental liabilities and the costs of any required clean-up. Under the laws of certain states, contamination of a property may give rise to a lien on the property to secure recovery of the costs of clean-up. In several states, this lien has priority over the lien of an existing mortgage against such property. In addition, in some states and under the federal Comprehensive Environmental Response, Compensation, and Liability Act of 1980 (“CERCLA”), the Company may be liable, in certain circumstances, as an “owner” or “operator,” for costs of cleaning-up releases or threatened releases of hazardous substances at a property mortgaged to it. The Company also risks environmental liability when it forecloses on a property mortgaged to it, although federal legislation provides for a safe harbor from CERCLA liability for secured lenders that foreclose and sell the mortgaged real estate, provided that certain requirements are met. However, there are circumstances in which actions taken could still expose the Company to CERCLA liability. Application of various other federal and state environmental laws could also result in the imposition of liability on the Company for costs associated with environmental hazards.
In addition to conducting an environmental assessment while underwriting a mortgage loan,loans, the Company routinely conducts environmental assessments prior to taking title to real estate through foreclosure on real estate collateralizing mortgages that it holds. Although unexpected environmental liabilities can always arise, the Company seeks to minimize this risk by undertaking these environmental assessments and complying with its internal procedures, and as a result, the Company believes that any costs associated with compliance with environmental laws and regulations or any clean-up of properties would not have a material adverse effect on the Company’s results of operations.
International Regulation
RGA’s international insurance operations are principally regulated by insurance regulatory authorities in the jurisdictions in which they are located or operate branch offices. The regulationThese regulations includes minimum capital, solvency and governance requirements. The authority of RGA’s international operations to conduct business is subject to licensing requirements, inspections and approvals and these authorizations are subject to modification and revocation. Periodic examinations of the insurance company books and records, financial reporting requirements, risk management processes and governance procedures are among the techniques used by regulators to supervise RGA’s non-U.S. insurance businesses. The regulators of RGA’s non-U.S. insurance companies, the California Department of Insurance and the ArizonaCalifornia Department of Insurance are also invited to be part of the supervisory college held by the MDCI, RGA’s group supervisor.
Bermuda’s Insurance Act 1978 (the “Bermuda Insurance Act”) distinguishes between insurers carrying on long-term business, insurers carrying on special purpose business and insurers carrying on general business. There are five classifications of insurers carrying on long-term business, ranging from Class A insurers to Class E insurers. Taking a risk-based approach to regulation that looks at the nature, scale and complexity of an insurer’s business, the Bermuda Monetary Authority (“BMA”)
typically applies less regulatory oversight to Class A captive insurers and greater regulatory oversight to Class E commercial insurers. The Company’s subsidiaries domiciled in Bermuda are licensed for long-term business and are classified as Class E insurers and are therefore subject to extensive regulation and supervision by the Bermuda Monetary Authority (“BMA”). BMA.Such regulation includes rules regarding privacy, anti-money laundering, bank secrecy, anti-corruption and foreign asset control in addition to insurance regulation. To that end, the BMA has broad powers to regulate business activities of the Company’s Bermuda domiciled subsidiaries, mandate capital and surplus requirements, regulate trade and claims practices and require strong enterprise risk management and corporate governance activities.
The Company’s Bermuda subsidiaries, as Class E insurers, file annual statutory financial statements and annual audited financial statements prepared in accordance with accounting principles generally accepted in the U.S.within four months of the end of each fiscal year, unless such deadline is specifically extended. The Bermuda Insurance Act prescribes rules for the preparation of the statutory financial statements. In addition, the Company’s Bermuda subsidiaries are required to file with the BMA a capital and solvency return along with its annual statutory financial return.
The Company’s Bermuda subsidiaries must at all times maintain a minimum margin of solvency (“MMS”) and an enhanced capital requirement (“ECR”) in accordance with the provisions of the Bermuda Insurance Act. If either the minimum MMS or ECR is not met then the Bermuda Insurance Act mandates certain actions and filings with the BMA including the filing of a written report detailing the circumstances giving rise to the failure and the manner and time within which the insurer intends to rectify the failure. The BMA has embedded an economic balance sheet (“EBS”) framework as part of the Bermuda Solvency Capital Requirement (“BSCR”) that forms the basis for an insurer’s ECR. As Class E insurers, the Company’s Bermuda subsidiaries’ ECR is established by reference to the Class E BSCR model, which provides a method for determining an insurer’s capital requirements by taking into account the risk characteristics of different aspects of the insurer’s business. The BSCR formula establishes capital requirements for different categories of risk such as fixed income investment risk, equity investment risk, long-term interest rate/liquidity risk, currency risk, concentration risk, credit risk, operational risk and seven categories of long-term insurance risk. Depending on the risk category, the capital requirement is either determined by applying shocks or by applying prescribed factors, where such shocks and factors were developed by the BMA and were calibrated at 99% Tail Value-at-Risk (“TVaR”) over a one-year time horizon.
Under the Bermuda Insurance Act, the Company’s Bermuda subsidiaries are prohibited from declaring or paying a dividend if they are not meeting their ECR or MMS requirements or if the declaration or payment of the dividend would cause such a breach. Failing to meet the MMS requirement on the last day of any financial year prohibits a company from declaring or paying any dividends during the next financial year without the approval of the BMA. Additional actions and filings may be required before a company can declare and pay a dividend depending on its prior year statutory capital and surplus. The restrictions on declaring or paying dividends and distributions under the Bermuda Insurance Act are in addition to those under Bermuda’s Companies Act 1981 (the “Companies Act”). Under the Companies Act, the Company’s Bermuda subsidiaries may not declare or pay a dividend, or make a distribution out of contributed surplus, if there are reasonable grounds for believing that: (1) the company is, or would after the payment be, unable to pay its liabilities as they become due, or (2) the realizable value of the company’s assets would thereby be less than its liabilities.
The Company’s subsidiaries domiciled in Barbados are subject to regulation and supervision by the Financial Services Commission in Barbados. Recently enacted economic substance requirements in Bermuda and Barbados may place additional requirements, including reporting requirements, on the Company’s subsidiaries domiciled in those countries in order to demonstrate purpose and governance of those entities and their operations to greater levels than required in the past.
Much like the adoption of the Dodd-Frank Act in the U.S., regulators around the world continue to consider ways to avoid a recurrence of the causes of the 2008 -– 2009 financial crisis. A group leading this effort is the Financial Stability Board (“FSB”). The FSB consists of representatives of national financial authorities of the G20 nations. The G20, and the FSB and related governmental bodies have developed proposals to address issues such as group supervision, capital and solvency standards, systemic economic risk and corporate governance, including executive compensation and many other related issues associated with the financial crisis. At the direction of the FSB, the International Association of Insurance Supervisors (“IAIS”) has developed a model framework for the supervision of IAIG’sIAIGs that contemplates “group-wide supervision” across national boundaries. RGA now qualifieshas been designated as an IAIG, bringingwhich may bring about requirements for RGA to conduct a group-wide risk and solvency assessment to monitor and manage its overall solvency. At this time RGA cannot predict what additional capital requirements, compliance costs or other burdens these requirements would impose on it, if adopted for the evaluation of a U.S.- domiciled insurance group. There is also the potential for inconsistent or conflicting regulation of the RGA group of companies as lawmakers and regulators in multiple jurisdictions simultaneously pursue these initiatives.
Additionally, RGA International, operating in the European Economic Area (“EEA”), is subject to the Solvency II measures developed by the European Insurance and Occupational Pensions Authority and will be required to abide by the evolving risk management practices, capital standards and disclosure requirements of the Solvency II framework. Additionally, the Company’s clients located in the EEA will need to abide by these standards in operating their insurance businesses,
including the management of their ceded reinsurance. Currently, insurers and reinsurers located in the EEA are operating under Solvency II. The Company expects Solvency II to have a significant influence on not only the regulation of solvency measures applied to insurers and reinsurers operating within the EEA, but the Company also expects the solvency regulation measures to influence future regulatory structures of countries outside of the EEA, including Japan. Influences of the Solvency II -– type framework are already present in the insurance regulation of Bermuda and China and currently influence the solvency measures imposed upon RGA Global and RGA Americas.
As a result of the 2016 Brexit referendum, under which the United Kingdom (“UK”) exited the European Union effective January 31, 2020, the regulatory approval of RGA International as a reinsurer of insurance business written by UK domiciled insurers remains susceptible to termination after the end of 2020. While it currently appears that any post Brexit insurance regulation in the UK will permit the separate registration of RGA International as a branch in the UK, there exists questions as to what requirements will be imposed upon reinsurers domiciled outside of the UK after implementation of the Brexit initiative.
New and proposed restrictions in many European and AsianAdditionally, some countries on RGA’s ability to transfer data from one country to another also threaten to make its operations less efficient. In Europe, the General Data Protection Regulation (“GDPR”), which establishes uniform data privacy laws across the European Union (“EU”) is effective for all EU member states and is extraterritorial in that it applies to EU entities, as well as entities established in the EU that offer goods or services to data subjects in the EU or monitor consumer behavior that takes place in the EU. The GDPR anticipates the processing of data for reinsurance and other purposes and applies standards and rules that covered entities must establish and monitor with respect to such processing and use. Many of the restrictions enacted by jurisdictions outside of the EU either do not anticipate the processing of data for reinsurance purposes at all or place costly restrictions on the ability of a reinsurer to service its business by requiring processing to be done within the borders of the country in which the insured consumer resides.
Additionally, requirements effective in Indonesia limit the amount of insurance business that can be ceded to reinsurers not domiciled in that country.foreign reinsurers. Requirements of this type are proposed from time-to-time in developing markets. These forced
localization requirements have the impact of limiting the amount of reinsurance business RGA can conduct in those countries without the participation of a local reinsurer.
RGA expects the scope and extent of regulation outside of the U.S., as well as group regulatory oversight generally, to continue to increase.
Privacy and Cybersecurity Regulation
Various jurisdictions in which the Company’s subsidiaries and their clients operate have established laws protecting the privacy and handling of consumers’ private data. The area of cybersecurity has also come under increased scrutiny from insurance regulators. These laws and regulations vary country to country and state to state, but they generally require the establishment of programs to detect and prevent unauthorized access to personal data and to mitigate theft of personal data. They also may require the Company, among other things, to notify client insurers or individuals of any security breach involving protected data, and to provide individuals with the right to access personal data and with the right to be forgotten.
In the U.S. the NAIC adopted the Insurance Data Security Model Law which establishes standards for data security and for the investigation of and notification of insurance regulators of cybersecurity events involving unauthorized access to certain private information belonging to insureds. To date, this Model Law has not been widely adopted, but the Company expects further adoption in the future. The cybersecurity regulation in New York is applicable to many of the Company’s clients, and it requires the Company to demonstrate the existence and soundness of its cybersecurity program to those clients. The California Consumer Privacy Act of 2018 (“CCPA”) grants all California residents the right to know what information a business has collected from them and the sourcing and sharing of that information. The CCPA also gives the California consumer the right to have a business delete their personal information with some exceptions. The California restrictions, and related exceptions becomebecame effective on January 1, 2020. The Company expects that the exceptions will apply to a significant portion of its business. Laws and regulations similar to the New York cybersecurity regulation and the CCPA, as well as measures similar to the NAIC’s Insurance Data Security Model Law are likely to be adopted by more U.S. states in the newnear future, if not by the U.S. federal government.
In addition, new and proposed privacy and cybersecurity laws and regulations in many European and Asian countries restrict RGA’s ability to transfer data and impose other requirements on holders of data. In Europe, the General Data Protection Regulation (“GDPR”), which establishes uniform data privacy laws across the European Union (“EU”) is effective for all EU member states and is extraterritorial in that it applies to EU entities, as well as entities established in the EU that offer goods or services to data subjects in the EU or monitor consumer behavior that takes place in the EU. The GDPR anticipates the processing of data for reinsurance and other purposes and applies standards and rules that covered entities must establish and monitor with respect to such processing and use. Many of the restrictions enacted by jurisdictions outside of the EU either do not anticipate the processing of data for reinsurance purposes at all or place costly restrictions on the ability of a reinsurer to service its business by requiring processing to be done within the borders of the country in which the insured consumer resides. Further adoptions of laws patterned after the GDPR are expected around the world.
Ratings
Insurer financial strength ratings, sometimes referred to as claims paying ratings, represent the opinions of rating agencies regarding the financial ability of an insurance company to meet its obligations under an insurance policy. The Company’s insurer financial strength ratings as of the date of this filing are listed in the table below for each rating agency that meets with the Company’s management on a regular basis. As of the date of this filing, allthe Standard & Poor’s (“S&P”), A.M. Best Company (“A.M. Best”), and the Moody’s Investors Service (“Moody’s”) ratings listed below are on stable outlook.
|
| | | | | | | | | | | | | | | | |
| Insurer Financial Strength Ratings | A.M. Best Company(1) | Moody’s
Investors
| ServiceMoody’s (2)
| Standard &
| Poor’sS&P (3)
|
| RGA Reinsurance Company | A+ | A1 | A1 | | AA- |
| RGA Life Reinsurance Company of Canada | A+ | Not Rated | | | AA- |
| RGA International Reinsurance Company dac | Not Rated | Not Rated | | | AA- |
| RGA Global Reinsurance Company, Ltd. | Not Rated | Not Rated | | | AA- |
| RGA Reinsurance Company of Australia Limited | Not Rated | Not Rated | | | AA- |
| RGA Reinsurance Company (Barbados) Ltd. | Not Rated | Not Rated | | | AA- |
| RGA Americas Reinsurance Company, Ltd. | A+ | Not Rated | | | AA- |
| RGA Atlantic Reinsurance Company Ltd. | A+ | Not Rated | Not Rated | | AA- |
| RGA Worldwide Reinsurance Company, Ltd. | | | | | AA- |
| Aurora National Life Assurance Company | A+ | | | | |
| Omnilife Insurance Company Limited | Not Rated | Not Rated | | | A+ |
| |
(1) | An A.M. Best Company (“A.M. Best”) insurer financial strength rating of “A+” (superior) is the second highest out of sixteen possible ratings and is assigned to companies that have, in A.M. Best’s opinion, a superior ability to meet their ongoing insurance obligations. |
| |
(2) | A Moody’s Investors Service (“Moody’s”) insurer financial strength rating of “A1” (good) is the fifth highest rating out of twenty-one possible ratings and indicates that Moody’s believes the insurance company offers good financial security; however, elements may be present which suggest a susceptibility to impairment sometime in the future. |
| |
(3) | A Standard & Poor’s (“S&P”) insurer financial strength rating of “AA-” (very strong) is the fourth highest rating out of twenty-two possible ratings. According to S&P’s rating scale, a rating of “AA-” means that, in S&P’s opinion, the insurer has very strong financial security characteristics. An S&P insurer financial strength rating of “A+” (strong) is the fifth highest rating out of twenty-two possible ratings. According to S&P’s rating scale, a rating of “A+” means that, in S&P’s opinion, the insurer has strong financial security characteristics. |
The ability to write reinsurance partially depends on a reinsurer’s financial condition and its issuer financial strength ratings. These ratings are based on a company’s ability to pay policyholder obligations and are not directed toward the protection of investors. A ratings downgrade could adversely affect the Company’s ability to compete. See Item 1A – “Risk Factors” for more on the potential effects of a ratings downgrade.
Underwriting
Automatic. The Company’s management determines whether to write automatic reinsurance business by considering many factors, including the types of risks to be covered; the ceding company’s retention limit and binding authority, product, and pricing assumptions; and the ceding company’s underwriting standards, financial strength and distribution systems. For automatic business, the Company ensures that the underwriting standards, procedures and guidelines of its ceding companies are priced appropriately and consistent with the Company’s expectations. To this end, the Company conducts periodic reviews of the ceding companies’ underwriting and claims personnel and procedures.
Facultative. The Company has developed underwriting policies, procedures and standards with the objective of controlling the quality of business written as well as its pricing. The Company’s underwriting process emphasizes close collaboration between its underwriting, actuarial, and administration departments. Management periodically updates these underwriting policies, procedures, and standards to account for changing industry conditions, market developments, and changes occurring in the field of medical technology. These policies, procedures, and standards are documented in electronic underwriting manuals made available to all the Company’s underwriters. The Company regularly performs internal reviews of both its underwriters and underwriting process.
The Company’s management determines whether to accept facultative reinsurance business on a prospective insured by reviewing the application, medical information and other underwriting information appropriate to the age of the prospective insured and the face amount of the application. An assessment of medical and financial history follows with decisions based on underwriting knowledge, manual review and consultation with the Company’s medical directors as necessary. Many facultative applications involve individuals with multiple medical impairments, such as heart disease, high blood pressure, and diabetes, which require a complex underwriting/mortality assessment. The Company employs medical directors and medical consultants to assist its underwriters in making these assessments.
Pricing
The Company has pricing actuaries dedicated in every geographic market and in every product category who develop reinsurance treaty rates following the Company’s policies, procedures and standards. Biometric assumptions are based primarily on the Company’s own mortality, morbidity and persistency experience, reflecting industry and client-specific experience. Economic and asset-related pricing assumptions are based on current and long-term market conditions and are developed by actuarial and investment personnel with appropriate experience and expertise. The Company’s view of short- and long-term risks are reflected in pricing consistent with its internal capital model. For transactional business with material day-one invested assets there is diligence on the expected asset portfolio that is reflected in the pricing assumption. For transactional business focusing on tail risk the Company has policies and procedures related to views on transaction-specific tail risk events.
A transaction process ensures that the business reflects the input of internal areas of expertise in deal teams and has procedures for escalation based on the size and nature of the risks. Management has established a high-level oversight of the processes and results of these activities, which includes peer reviews in every market as well as centralized procedures and processes for reviewing and auditing pricing activities.
Operations
The Company’s business has been primarily obtained directly, rather than through brokers. The Company has an experienced sales and marketing staff that works to provide responsive service and maintain existing relationships.
The Company’s administration, auditing, valuation and finance departments are responsible for treaty compliance auditing, financial analysis of results, generation of internal management reports, and periodic audits of administrative and underwriting practices. A significant effort is focused on periodic audits of administrative and underwriting practices, and treaty compliance of clients.
The Company’s claims departments review and verify reinsurance claims, obtain the information necessary to evaluate claims, and arrange for timely claims payments. Claims are subjected to a detailed review process to ensure that the risk was properly ceded, the claim complies with the contract provisions, and the ceding company is current in the payment of reinsurance premiums to the Company. In addition, the claims departments monitor both specific claims and the overall claims handling procedures of ceding companies.
Customer Base
The Company provides reinsurance products primarily to the largest life insurance companies in the world. In 2019,2022, the Company’s five largest clients generated approximately $2.6 billion or 20.6%18% of the Company’s gross premiums and other revenues. In addition, 29thirty-six other clients each generated annual gross premiums and other revenues of $100 million or more, and the aggregate gross premiums and other revenues from these clients represented approximately 44.1%50% of the Company’s gross premiums and other revenues. No individual client generated 10% or more of the Company’s total gross premiums and other revenues. For the purpose of this disclosure, companies that are within the same insurance holding company structure are combined.
Competition
New reinsurance opportunities continue to be highly price competitive; however, companies that consistently win business are financially strong, provide flexible terms and conditions, have a positive reputation, deliver excellent service, and demonstrate execution certainty and a long-term commitment to the business underwritten. The Company’s competition includesCompany competes globally with other reinsurance companies, traditional insurance providers, ofprivate equity firms and other financial services companies.
Human Capital Resources
The Company continuously strives to fulfill its purpose; to make financial protection accessible to all. The Company’s global team of approximately 3,800 employees consistently develop innovative solutions for its clients, deliver long-term returns for its investors, and privatecreate a meaningful impact in the communities where its employees live and work. Driving the Company’s success is a shared commitment to pursue work that matters, to serve an industry with a strong social mission, and to create sustainable long-term value for all its stakeholders.
The Company’s Culture
The Company’s people, the way they work and the culture they cultivate are all key differentiators. The Company’s employees describe RGA as a collaborative, results-driven, customer-centric, and an ethical organization.
Work at the Company is undertaken in an environment of high collaboration, which encourages innovation and entrepreneurship and demands the highest integrity. The Company’s practice of combining technical expertise with curiosity and creativity, in partnership with its clients, defines the way it works internally and externally.
From the beginning, the Company was built on trust. Trusted relationships – starting with its employees and extending to its clients, partners, and investors – remain the foundation of its success. In the Company’s most recent engagement survey, the Company demonstrated its employees’ trust in what it does. Trust throughout the global workforce at the Company rated in the 90th percentile among the hundreds of other companies participating in the survey, which was conducted by a globally recognized workforce consulting firm. The Company honors its commitments to its employees, who in turn enable the Company to fulfill its commitments to its clients, shareholders, and society.
The Company’s engagement score was equal when comparing genders globally. The overall engagement score for U.S. employees in under-represented groups was one percentage point better than the overall U.S. average. Results from the global engagement survey, together with the Company’s retention rates, highlight the commitment of the Company’s Board of Directors and executive leadership team to its employees and its employees’ commitment to the Company.
Talent Attraction, Retention and Development
As a global reinsurer, the Company’s continued growth and vitality is built on attracting, selecting, developing and retaining exceptional talent in order to execute its strategy and to continue producing innovative solutions for its clients. The Company’s focus on employee retention has resulted in a three-year average annual voluntary attrition rate of approximately 7% globally.
The Company’s hybrid approach to flexible work arrangements (“WorkWise”), prioritizes meeting business requirements while accommodating personal work styles in how, when, and where its employees work. Living the Company’s purpose and fulfilling its commitments to partners, employees and employee’s communities is its priority. WorkWise strengthens the Company’s ability to attract and retain individuals to the organization. The many ways that the Company’s teams connect, whether remote, hybrid, or in-person, reflect its culture and commitment to growth and innovation.
The Company invests significant resources to create and sustain a learning environment, ensuring its employees at all levels continue to develop professionally throughout their career with the Company. While technical expertise is critical, the Company also focuses on the development of highly effective interpersonal and leadership skills.
Compensation and Benefits and Pay Equity
The Company is committed to fostering a company culture that is inclusive, collaborative, and socially responsible. The Company is strengthened by its diverse workforce and recognizes that its employees are its greatest asset.
The Company’s compensation programs, comprised of salary together with short and long-term incentives, strike a balance between external market competitiveness and internal equity, firms. balancing global consistency with local market variations. This balance is achieved through consistent application of program standards on a global basis, while targeting compensation at competitive levels in the markets where it competes for talent.
The Company’s benefit programs are an integral part of its employees’ total reward package. Benefits are aligned with local market practices and include healthcare, retirement and savings, education assistance, flexible work programs, employee assistance programs, wellness programs, and parental leave programs, amongst others.
The Company has long been committed to ensuring equal pay for equal work. The annual pay equity study, conducted by a third-party consultant, considered the average pay of females to males in comparable roles. The study analyzed the pay practices of all U.S. and non-U.S. employees in countries with more than 50 employees, representing approximately 90% of the Company’s employees worldwide. Each year the results vary slightly due to changes in the employee population. Results increased this year with women paid on average 99.7% of what men are paid for comparable jobs. In addition, in the U.S., when using the same methodology of comparable roles, the average non-Caucasian to Caucasian pay ratio was 100.3%.
The Company is committed to gender and racial pay equity and will continue to review pay equity annually, and take action as required, to ensure its compensation programs remain aligned with its commitment to diversity, equity, and inclusion. Ensuring the Company’s compensation practices are equitable is imperative to maintain the Company’s culture and to ensure fair treatment of its employees.
Corporate Social Responsibility, Diversity, Equity and Inclusion
The Company believes that creating long-term value for its primarystakeholders implicitly requires enacting and executing sustainable business practices and strategies that, while delivering competitive returns, also take into account environmental, social and governance ("ESG") issues. The Company strives to govern itself in a sustainable manner that recognizes the need for strong governance, effective management systems and robust controls alongside its long-term operational goals and strategies. The Company understands that it has a responsibility to monitor and control its ecological and societal impact and adopt responsible practices on ESG issues in addition to its obligations regarding corporate strategy, risks, opportunities, and performance.
The Company strives to cultivate an inclusive environment in which diverse backgrounds, experiences, and perspectives are welcomed and employees feel comfortable and encouraged to discuss diversity, equity, and inclusion topics. The Company’s diversity, equity, and inclusion initiatives are focused in four areas: (i) enabling an inclusive workplace; (ii) attracting, retaining and engaging a diverse workforce; (iii) fostering diverse partnerships in the communities where the Company operates; and (iv) ensuring accountability and responsibility throughout the Company. 100% of the Company’s global reinsurance competitorsemployees have undertaken Everyday (Unconscious) Bias training and the Company has extended the Inclusive Leadership course to include all leaders. The Company has integrated diversity, equity, and inclusion training into its leadership development offerings and expanded education offerings to include Mitigating Bias in Interviewing, Psychological Safety, and new manager training. The Company’s education and accountability initiatives are the following, or their affiliates: Munich Re, Swiss Re, Hannover Refoundation of its efforts to promote diversity, equity, and SCOR Global Re. In addition,inclusion.
The Company’s Diversity, Equity and Inclusion Councils proactively leverage diverse teams around the world and serve as thought leaders for the Company may compete with Pacific Life, Prudential Financial,to advance diversity, equity, and Canada Lifeinclusion. They work to implement the Company’s diversity, equity, and inclusion strategy and policies and advise on the Company’s diversity, equity, and inclusion needs and the progress of these initiatives globally.
The Company’s Environmental Social and Governance (ESG) Report offers additional information across the areas of: Business Ethics & Responsible Practices; Responsible Investment Approach; Sustainable Innovation for Social Impact; Culture of Care; and Environmental Stewardship. RGA’s ESG Report can be found in select risk acquisition. Within the reinsurance industry, the competitors can change from year to yearour Investor section of our website at www.rgare.com The contents of our ESG Report and related supplemental information are not incorporated by region.
Employees
As of December 31, 2019,reference into this Annual Report on Form 10-K or in any other report or document the Company had 3,188 employees located throughoutfiles with the world. We believe that our employee relations are satisfactory.
The Company obtains substantially all of its revenues through reinsurance agreements that cover a portfolio of life and health insurance products, including term life, credit life, universal life, whole life, group life and health, joint and last survivor insurance, critical illness, disability, longevity as well as asset-intensive (e.g., annuities), financial reinsurance and other capital motivated solutions. Generally, the Company, through various subsidiaries, has provided reinsurance for mortality, morbidity, lapse and investment-related risks associated with such products. With respect to asset-intensive products, the Company has also provided reinsurance for investment-related risks.
Additional information regarding the operations of the Company’s segments and geographic operations is contained in Note 15 – “Segment Information” in the Notes to Consolidated Financial Statements.
U.S. and Latin America Operations
The U.S. and Latin America operations market traditional life and health reinsurance, reinsurance of asset-intensive products, financial reinsurance and other capital motivated solutions, primarily to U.S. life insurance companies. The U.S. and Latin America operations include business generated by its offices in the U.S., Mexico and Brazil. The offices in Mexico and Brazil provide services to clients in other Latin American countries.
Traditional Reinsurance
The U.S. and Latin America Traditional segment provides individual and group life and health reinsurance, including long term care, to domestic clients for a variety of products through yearly renewable term agreements, coinsurance, and modified coinsurance. This business has been accepted under many different rate scales, with rates often tailored to suit the underlying product and the needs of the ceding company. Premiums typically vary for smokers and non-smokers, males and females, and may include a preferred underwriting class discount. Reinsurance premiums are paid in accordance with the treaty, regardless of the premium mode for the underlying primary insurance. This business is made up of facultative and automatic treaty business.
Automatic business is generated pursuant to treaties that generally require the underlying policies to meet the ceding company’s underwriting criteria, although in certain cases such policies may be rated substandard. In contrast to facultative reinsurance, reinsurers do not engage in underwriting assessments of each risk assumed through an automatic treaty.
As the Company does not apply its underwriting standards to each policy ceded to it under automatic treaties, the U.S. and Latin America operations generally require ceding companies to retain a portion of the business written on an automatic basis, thereby increasing the ceding companies’ incentives to underwrite risks with due care and, when appropriate, to contest claims diligently.
The U.S. and Latin America facultative reinsurance operation involves the assessment of the risks inherent in (i) multiple impairments, such as heart disease, high blood pressure, and diabetes; (ii) cases involving large policy face amounts; and (iii) financial risk cases (i.e. cases involving policies disproportionately large in relation to the financial characteristics of the proposed insured). The U.S. and Latin America operations’ marketing efforts have focused on developing facultative relationships
with client companies because management believes facultative reinsurance represents a substantial segment of the reinsurance activity of many large insurance companies and also serves as an effective means of expanding the U.S. and Latin America operations’ automatic business.
Only a portion of approved facultative applications ultimately result in reinsurance, as applicants for impaired risk policies often submit applications to several primary insurers, which in turn seek facultative reinsurance from several reinsurers. Ultimately, only one insurance company and one reinsurer are likely to obtain the business. The Company tracks the percentage of declined and placed facultative applications on a client-by-client basis and generally works with clients to seek to maintain such percentages at levels deemed acceptable. As the Company applies its underwriting standards to each application submitted to it facultatively, it generally does not require ceding companies to retain a portion of the underlying risk when business is written on a facultative basis.
In addition, several of the Company’s U.S. and Latin America clients have purchased life insurance policies insuring the lives of their executives. These policies have generally been issued to fund deferred compensation plans and have been reinsured with the Company.
Financial Solutions -– Asset-Intensive Reinsurance
The Company’s U.S. and Latin America Asset-Intensive operations primarily concentrate on the investment risk within underlying annuities and other investment oriented products. These reinsurance agreements are mostly structured as coinsurance, with some on a coinsurance with funds withheld, or modified coinsurance of primarily investment risk such that the Company recognizes profits or losses primarily from the spread between the investment earnings and amounts credited on the underlying contract liabilities.
The Company also provides guaranteed investment contracts to retirement plans that include investment-only, stable value wrap products. The assets are owned by the trustees of such plans, who invest the assets under the terms of investment guidelines to which the Company agrees. The contracts contain a guarantee of a minimum rate of return on participant balances supported by the underlying assets, and a guarantee of liquidity to meet certain participant-initiated plan cash flow requirements.
The Company primarily targets highly rated, financially secure companies as clients for asset-intensive business. These companies may wish to limit their own exposure to certain products or blocks of business. Ongoing asset/liability analysis is required for the management of asset-intensive business. The Company’s analysis is a cross discipline analysis between the Company’s underwriting, actuarial, investment and other departments throughout the organization and is completed in conjunction with an asset/liability analysis performed by the ceding companies.
During the fourth quarter of 2022, the Company entered the U.S. pension risk transfer market, and has begun working with partners to provide pension plan sponsors solutions that will enable them to diversify and protect the benefits provided to the annuitants.
Financial Solutions -– Capital Solutions
The Company’s U.S. and Latin America Capital Solutions operations assist ceding companies in meeting applicable regulatory requirements while enhancing their financial strength and regulatory surplus position. The Company assumes regulatory insurance liabilities from the ceding companies. In addition, the Company has committed to provide statutory reserve or asset support to third parties by funding loans or assuming real estate leases if certain defined events occur. Generally, such amounts are offset by receivables from ceding companies that are repaid by the future regulatory profits from the reinsured block of business. The Company structures its financial reinsurance and other capital solution transactions so that the projected future profits of the underlying reinsured business significantly exceed the amount of regulatory surplus provided to the ceding company.
The Company primarily targets highly rated insurance companies for capital solutions business. A careful analysis is performed before providing any regulatory surplus enhancement to the ceding company. This analysis is intended to ensure that the Company understands the risks of the underlying insurance product and that the transaction has a high likelihood of being repaid through the future regulatory profits of the underlying business. If the future regulatory profits of the business are not sufficient to repay the Company or if the ceding company becomes financially distressed and is unable to make payments under the treaty, the Company may incur losses. A staff of actuaries and accountants track experience for each treaty on a quarterly basis in comparison to models of expected results.
Customer Base
The U.S. and Latin America operations market life reinsurance and financial solutions primarily to U.S. life insurance companies. The treaties underlying this business generally are terminable by either party on 90 days written notice, but only with respect to future new business. Existing business generally is not terminable, unless the underlying policies terminate or are recaptured. In 2019,2022, the five largest clients generated approximately $1.8$1.7 billion or 27.2%24% of U.S. and Latin America operation’s gross premiums and other revenues. In addition, 5051 other clients each generated annual gross premiums and other revenues of $20 million or more, and the aggregate gross premiums from these clients represented approximately 65.3%68% of U.S. and Latin America operation’s gross premiums and other revenues. For the purpose of this disclosure, companies that are within the same insurance holding company structure are combined.
Canada Operations
The Company operates in Canada primarily through RGA Canada. RGA Canada employs its own underwriting, actuarial, claims, pricing, accounting, systems, marketing and administrative staff in offices located in Montreal and Toronto.
Traditional Reinsurance
RGA Canada assists clients with capital management and mortality and morbidity risk management and is primarily engaged in individual life reinsurance, and to a lesser extent creditor, group life and health, critical illness and disability reinsurance, through yearly renewable term and coinsurance agreements. Creditor insurance covers the outstanding balance on personal, mortgage or commercial loans in the event of death, disability or critical illness and is generally shorter in duration than individual life insurance.
The business is generally composed of facultative and automatic treaty business. Automatic business is generated pursuant to treaties that generally require the underlying policies to meet the ceding company’s underwriting criteria, although in certain cases such policies may be rated substandard. In contrast to facultative reinsurance, reinsurers do not engage in underwriting assessments of each risk assumed through an automatic treaty.
RGA Canada generally requires ceding companies to retain a portion of the business written on an automatic basis, thereby increasing the ceding companies’ incentives to underwrite risks with due care and, when appropriate, to contest claims diligently.
Facultative reinsurance involves the assessment of the risks from a medical and financial perspective. RGA Canada is recognized as a leader in facultative reinsurance, and this has served to maintain a strong market share on automatic business.
RGA Canada supports over half the companies active in the living benefits and group insurance markets. Solid claims management expertise and innovative product development capabilities support a growing share of these markets.
Financial Solutions
The Company’s Canada Financial Solutions operations primarily concentrates on the investment and longevity risk within underlying annuities and other investment oriented products. These reinsurance agreements are mostly structured as coinsurance, with some on a coinsurance with funds withheld, or modified coinsurance of primarily investment risk such that the Company recognizes profits or losses primarily from the spread between the investment earnings and amounts credited on the underlying contract liabilities. Canada’s Financial Solutions operations also provide capital solutions to assist ceding companies in meeting applicable regulatory requirements while enhancing their financial strength and regulatory position.
The Company primarily targets highly rated, financially secure companies as clients for its financial solutions business. These companies may wish to limit their own exposure to certain products or blocks of business. Ongoing asset/liability analysis is required for the management of asset-intensive business. The Company’s analysis is a cross discipline analysis between the Company’s underwriting, actuarial, investment and other departments throughout the organization and is completed in conjunction with an asset/liability analysis performed by the ceding companies.
Customer Base
Clients include most of the life insurers in Canada, although the number of life insurers is much smaller compared to the U.S. In 2019,2022, the five largest clients generated approximately $731$821 million or 60.1%59% of Canada operation’s gross premiums and other revenues. In addition, 1011 other clients each generated annual gross premiums and other revenues of $20 million or more, and the aggregate gross premiums and other revenues from these clients represented approximately 33.6%36% of Canada operation’s gross premiums and other revenues. For the purpose of this disclosure, companies that are within the same insurance holding company structure are combined.
Europe, Middle East and Africa Operations
The Europe, Middle East and Africa (“EMEA”) operations serve clients from subsidiaries, licensed branch offices and/or representative offices primarily located in France, Germany, Ireland, Italy,the UK, Continental Europe, the Middle East, the Netherlands, Poland,and South Africa, Spain and the UK.Africa. EMEA’s office in the Middle East is located in the United Arab Emirates (“UAE”).
EMEA’s operations in the UK, Continental Europe, South Africa and the Middle East employ their own underwriting, actuarial, claims, pricing, accounting, marketing and administration staffs with additional support services provided by the Company’s staff in the U.S. and Canada.other geographical locations.
Traditional Reinsurance
The principal types of reinsurance for this segment include individual and group life and health, critical illness, disability and underwritten annuities. Traditional reinsurance in the UK, South Africa, Italy and Germany consists predominantly of long
term contracts, which are not terminable for existing risk without recapture or natural expiry, whereas in other markets within the region contracts are predominantly short term, renewing annually.
Financial Solutions
The Company’s EMEA Financial Solutions segment includes longevity, asset-intensive and financial reinsurance. Longevity reinsurance takes the form of closed block annuity reinsurance and longevity swap structures. Asset-intensive business for this segment consists of coinsurance of payout annuities. Financial reinsurance assists ceding companies in meeting applicable regulatory requirements while enhancing their financial strength. TheseFinancial reinsurance transactions do not
qualify as reinsurance under U.S. GAAP, due to the low risk nature of the transactions and are reported in accordance with deposit accounting guidelines.
Customer Base
In 2019,2022, the five largest clients generated approximately $868 million$1.0 billion or 45.8%43% of EMEA operation’s gross premiums and other revenues. In addition, 2023 other clients each generated annual gross premiums and other revenues of $20 million or more, and the aggregate gross premiums and other revenues from these clients represented approximately 36.8%41% of EMEA operation’s gross premiums and other revenues. For the purpose of this disclosure, companies that are within the same insurance holding company structure are combined.
Asia Pacific Operations
The Asia Pacific operations serve clients from subsidiaries, licensed branch offices and/or representative offices in Australia, China, Hong Kong, India, Japan, Malaysia, New Zealand, Singapore, South Koreathroughout Asia and Taiwan.Australia.
The Asian offices provide full reinsurance services with additional support services provided by the Company’s staff in the U.S. and Canada. In addition, a regional team based in Hong Kong has been established in recent years to provide support to the Asian offices to accommodate business growth in the region. RGA Australia employs its own underwriting, actuarial, claims, pricing, accounting, systems, marketing, and administration service.
Traditional Reinsurance
The principal types of reinsurance for this segment include individual and group life and health, critical illness, disability and superannuationwritten through yearly renewable term and coinsurance agreements. The reinsurance of criticaltreaties include:
•Individual and group life and health,
•Critical illness, coveragewhich provides a benefit in the event of the diagnosis of pre-defined critical illness. illness
•Disability, reinsurancewhich provides income replacement benefits in the event the policyholder becomes disabled due to accident or illness. illness
•Superannuation which is the Australian government mandated compulsory retirement savings program. Superannuation funds accumulate retirement funds for employees, and, in addition, typically offer life and disability insurance coverage.
Reinsurance agreements may be either facultative or automatic agreements covering primarily individual risks and, in some markets, group risks.
Financial Solutions
The Asia Pacific Financial Solutions segment includes financial reinsurance, asset-intensive and certain disability, and life and health blocks that contain material investment risks. Financial reinsurance assists ceding companies in meeting applicable regulatory requirements while enhancing their financial strength. TheseFinancial reinsurance transactions do not qualify as reinsurance under GAAP, due to the remote risk nature of the transactions and are reported in accordance with deposit accounting guidelines. Asset-intensive business for this segment primarily concentrates on the investment risk within underlying annuities and life insurance policies. These reinsurance agreementsAsset-intensive transactions are mostly structured to take on investment risk such that the Company recognizes profits or losses primarily from the spread between the investment earnings and the interest credited on the underlying annuity contract liabilities.
Customer Base
In 2019,2022, the five largest clients generated approximately $1.3$1.4 billion or 46.8%45% of Asia Pacific operation’s gross premiums and other revenues. In addition, 1924 other clients each generated annual gross premiums and other revenues of $20 million or more, and the aggregate gross premiums and other revenues from these clients represented approximately 35.5%40% of Asia Pacific operation’s gross premiums and other revenues. For the purpose of this disclosure, companies that are within the same insurance holding company structure are combined.
Corporate and Other
Corporate and Other revenues primarily include investment income from unallocated invested assets, investment related gains and losses and service fees. Corporate and Other expenses consist of the offset to capital charges allocated to the operating segments within the policy acquisition costs and other insurance income line item, unallocated overhead and executive costs, interest expense related to debt, and the investment income and expense associated with the Company’s collateral finance and securitization transactions and service business expenses. Additionally, Corporate and Other includes results from certain wholly-owned subsidiaries, such as RGAx, and joint ventures that, among other activities, develop and market technology, and provide
consulting and outsourcing solutions for the insurance and reinsurance industries. In the past two years, theThe Company has increased its investment and expendituresinvests in this area in an effort to both support its clients and accelerate the
development of new solutions and services to increase customer engagement within the life insurance industry and hence generate new future revenue streams.
|
| | | | |
| D. | Financial Information About Foreign Operations |
The Company’s foreign operations are primarily in Canada, Asia Pacific, EMEA and Latin America. Revenue, income (loss) before income taxes, which include investment related gains (losses), interest expense, depreciation and amortization, and identifiable assets attributable to these geographic regions are identified in Note 15 – “Segment Information” in the Notes to Consolidated Financial Statements. Although there are risks inherent to foreign operations, such as currency fluctuations and restrictions on the movement of funds, as described in Item 1A – “Risk Factors”, the Company’s financial position and results of operations have not been materially adversely affected thereby to date.
Copies of the Company’s Annual Report on Form 10-K, Quarterly Reports on Form 10-Q, Current Reports on Form 8-K, and amendments to those reports are available free of charge through the Company’s website (www.rgare.com) as soon as reasonably practicable after the Company electronically files such reports with the Securities and Exchange Commission (www.sec.gov). Information provided on such websites does not constitute part of this Annual Report on Form 10-K.
Item 1A. RISK FACTORS
In the Risk Factors below, we refer to the Company as “we,” “us,” or “our.” Investing in our securities involves certain risks. Any of the following risks could materially adversely affect our business, financial condition or results of operations. These risks are not exclusive, and additional risks to which we are subject include, but are not limited to, the factors mentioned under “Cautionary Note Regarding Forward-Looking Statements” in Item 7 below and the risks of our businesses described elsewhere in this Annual Report on Form 10-K. Many of these risks are interrelated and occur under similar business and economic conditions, and the occurrence of certain of them may in turn cause the emergence, or exacerbate the effect, of others. Such a combination could materially increase the severity of the impact on our business, liquidity, financial condition and results of operations.
Risks Related to Our Business
Our business, results of operations and financial condition have been, and will likely continue to be, adversely affected by the COVID-19 pandemic, future epidemics and pandemics and the response thereto.
The COVID-19 pandemic increased mortality rates in certain jurisdictions and populations. Additionally, the COVID-19 pandemic and the response thereto caused significant disruption in the international and U.S. economies and financial markets and severely impacted, global economic conditions, which resulted in substantial volatility in the global financial markets, increased unemployment and operational challenges such as the temporary closures of businesses, sheltering-in-place directives and increased remote work protocols. Governments and central banks around the world reacted to the economic crisis caused by the pandemic by implementing stimulus and liquidity programs and cutting interest rates. These reactions increased government liabilities and balance sheets, which has been partially responsible for inflation in the United States and other jurisdictions. As a result, the U.S. Federal Reserve and other central banks have raised interest rates and may elect to further raise interest rates in the future. An increase in the number of future COVID-19 cases or a future epidemic or pandemic may again raise mortality rates in certain jurisdictions and populations and cause additional disruptions in international and U.S. economies and financial markets, which could severely impact our business, results of operations and financial condition.
Depending on the length of the pandemic, future increases in COVID-19 cases or the severity of prevalent virus strains, the availability, effectiveness and use of treatments and vaccines, and the extent and success of actions by governments and central banks, the adverse mortality rates and impact on the global economy may deepen, and our results of operations and financial condition in future quarters will continue to be adversely affected. The ultimate number of claims and financial impact resulting from the COVID-19 pandemic, the response thereto or any future epidemic or pandemic is inherently uncertain. Actual claims and financial impact from these events could vary materially from current estimates due to several factors, including the inherent uncertainties in making such determinations and the evolving nature of an epidemic or pandemic and the availability, effectiveness and use of treatments and vaccines. Additionally, the long-term health consequences for individuals who have recovered from COVID-19 and the related impact, if any, on mortality and morbidity are all unknown.
Moreover, the effects of COVID-19, the response thereto and a future epidemic or pandemic will heighten the other risks described below and in any subsequent Quarterly Report on Form 10-Q or Current Report on Form 8-K.
We make assumptions when pricing our products relating to mortality, morbidity, lapsation, investment returns and expenses, and significant deviations in experience could negatively affect our financial condition and results of operations.
Our life reinsurance contracts expose us to mortality, risk, which is the risk that the level of death claims may differ from that which we assumed in pricing our reinsurance contracts. Some of our annuitymorbidity and pension reinsurance contracts expose us to longevity risk, which is the risk that the length of time we pay annuity or pension benefits may exceed that which we assumed in pricing our reinsurance contracts. Some of our reinsurance contracts expose us to morbidity risk, which is the risk that the claims we pay if an insured person becomes critically ill or disabled differ from that which we assumed in pricing our reinsurance contracts.lapse risk. Our risk analysis and underwriting processes are designed with the objective of controlling the quality of the business and establishing appropriate pricing for the risks we assume. Among other things, these processes rely heavily on our underwriting, our analysis of mortality, longevity and morbidity trends, lapse rates, expenses and our understanding of medical impairments and their effect on mortality, longevity or morbidity.
We expect mortality, longevity, morbidity and lapse experience to fluctuate somewhat from period to period, but believe they should remain reasonably predictable over a period of many years. Mortality,For example, mortality, longevity, morbidity or lapse experience that is less favorable than the rates that we used in pricing a reinsurance agreement may cause our net income to be less than otherwise expected because the premiums we receive for the risks we assume may not be sufficient to cover the claims and profit margin. Furthermore, even if the total benefits paid over the life of the contract do not exceed the expected amount, unexpected increases in the incidence of deaths or illness can cause us to pay more benefits in a given reporting period than expected, adversely affecting our net income in any particular reporting period. Likewise, adverse experience could impair our ability to offset certain unamortized deferred acquisition costs and adversely affect our net income in any particular reporting period. We perform annual tests to establish that deferred policy acquisition costs remain recoverable at all times. These tests require us to make a significant number of assumptions. If our financial performance significantly deteriorates to the point where a premium deficiency exists, a cumulative charge to current operations will be recorded, which may adversely affect our net income in a particular reporting period.
We utilize assumptions, estimates and models to evaluate our business, results of operations and financial condition, and develop scenarios to evaluate our potential exposure to mortality claims, potential investment portfolio losses and other risks associated with our assets and liabilities, both related to COVID-19 and otherwise. The scenarios and related analyses are subject to various assumptions, professional judgment, uncertainties and the inherent limitations of any statistical analysis, including the use and quality of historical internal and industry data. Consequently, actual losses may differ materially from what the scenarios may illustrate. This potential difference could be even greater for events with limited or unmodelled annual frequency, such as the COVID-19 pandemic and the response thereto.
We regularly review our reserves and associated assumptions as part of our ongoing assessment of our business performance and risks. If we conclude that our reserves are insufficient to cover actual or expected policy and contract benefits and claim payments as a result of changes in experience, assumptions or otherwise, we would be required to increase our reserves and incur charges in the period in which we make the determination. The amounts of such increases may be significant and this
could materially adversely affect our financial condition and results of operations and may require us to generate or fund additional capital in our businesses.
Our financial condition and results of operations may also be adversely affected if our actual investment returns and expenses differ from our pricing and reserve assumptions. Changes in economic conditions may lead to changes in market interest rates or changes in our investment strategies, either of which could cause our actual investment returns and expenses to differ from our pricing and reserve assumptions.
Changes in accounting standards may adversely affect our reported results of operations and financial condition.
The Company’s consolidated financial statements are prepared in conformity with GAAP. If we are required to adopt revised accounting standards in the future, it may adversely affect our reported results of operations and financial condition. For a discussion of the impact of accounting pronouncements issued but not yet implemented, see Item 8. “Financial Statements and Supplementary Data - Notes to Consolidated Financial Statements - Note 2 Significant Accounting Policies and Pronouncements”. In August 2018, the Financial Accounting Standards Board issued guidance that will significantly change the accounting for long-duration insurance contracts. This guidance will become effective for the Company on January 1, 2022. We are still evaluating the impact this guidance will have on our consolidated financial statements, but it could negatively impact our reported profitability, financial position and financial ratios. In addition, the required adoption of new accounting standards may result in significant incremental costs associated with initial implementation and ongoing compliance.
Our reinsurance subsidiaries are highly regulated, and changes in these regulations could negatively affect our business.
Our reinsurance subsidiaries are subject to government regulation in each of the jurisdictions in which they are licensed or authorized to do business. Governmental agencies have broad administrative power to regulate many aspects of the reinsurance business, which may include reinsurance terms and capital adequacy. These agencies are concerned primarily with the protection of policyholders and their direct insurers rather than shareholders or holders of debt securities of reinsurance companies. Moreover, insurance laws and regulations, among other things, establish minimum capital requirements and limit the amount of dividends, tax distributions and other payments our reinsurance subsidiaries can make without prior regulatory approval, and impose restrictions on the amount and type of investments we may hold. The MDCI, our insurance group supervisor, regulates the solvency of our entire group and, in particular, regulates dealings between our reinsurance subsidiaries and other entities within our insurance holding company system. The regulation of our reinsurance subsidiaries in this way necessitates restrictions upon RGA as the ultimate parent of these entities.
Over the past several years, insurance regulators have increased their scrutiny of insurance holding company systems both within and outside of the U.S. Currently the Company meets the criteria for identification as an “Internationally Active Insurance Group.” We expect to continue to meet the criteria for this designation. While the full impact of designation as an Internationally Active Insurance Group has yet to be determined by regulators, it is clear that one aspect of such designation will be the continued emphasis of the supervisory college in which insurance regulators who are charged with supervising the solvency of one or more of the Company’s insurance subsidiaries meet and discuss the Company’s operations and solvency as a group. These efforts are coordinated and led by the MDCI as group supervisor, but involve input from all insurance regulators that directly supervise the Company’s significant reinsurance subsidiaries. Much of the additional scrutiny under insurance holding company regulatory acts and designation as an International Active Insurance Group is on activities of the insurance company’s entire group, which includes the group’s parent company and any non-insurance subsidiaries. While the laws have not extended direct regulation to RGA and its non-insurance subsidiaries, the manner in which the insurance regulators regulate our reinsurance subsidiaries may influence the activities of all other entities within the Company. Insurance holding company system regulatory actsoperate in the U.S. now provide for an expanded supervision of insurance groups operating in the U.S, including a review of enterprise risk management programs as well as expanded review of agreements between licensed insurers and their group members. Missouri, Arizona and California have each adopted these new standards as law.
The IAIS has developed and adopted the Common Framework for Supervision of Internationally Active Insurance Groups, or “ComFrame.” It is possible that ComFrame could lead to enhanced supervision of and higher capital standards for the Company on a global basis if the IAIS, the NAIC and the U.S. states adopt the proposed provisions or provisions similar to those proposed. While it is not yet known how or the extent to which these measures will impact us, such measures could be influential in the design of a group capital standard in the U.S. and could result in increased costs of compliance, additional disclosure and less flexibility in capital management, which could adversely impact our business and results of operations. The NAIC continues work on the development of a group capital calculation to be used as an analytical tool applied to U.S.-based insurance groups. The group capital calculation will be used in addition to the risk-based capital requirement that is applied on a legal entity level basis in the U.S. The group capital calculation has the potential to increase the amount of capital that an insurer or reinsurer is required to have and could result in the Company being subject to increased regulatory requirements.
At the U.S. federal level, the Dodd-Frank Wall Street Reform and Consumer Protection Act (the “Dodd-Frank Act”) established a Financial Stability Oversight Council to identify financial institutions, including insurers and reinsurers, which are
systemically important to the U.S. financial system. From time to time, one or more of our client insurance companies may be designated systemically important. Such designations could impact us through additional scrutiny of the client’s reinsurance programs with us, including a consideration of the volume of business ceded by the insurer to us. We do not currently anticipate that the Financial Stability Oversight Council will find RGA or any of our U.S. subsidiaries to be systemically important, but such a finding could ultimately subject the identified entity to additional capital requirements based on business levels and asset mix and other supervision. Currently, there are no U.S. insurers under supervision as systemically important financial institutions. The designation of RGA as a systemically important financial institution would bring additional scrutiny and could impact our ability to pay dividends. Moreover, more stringent restrictions may be adopted from time to time in other jurisdictions in which our reinsurance subsidiaries are domiciled, which could, under certain circumstances, significantly reduce or restrict dividends or other amounts payable to us by our subsidiaries unless they obtain approval from insurance regulatory authorities. We cannot predict the effect that any recommendations of the NAIC or proposed or future legislation or rule-making in the U.S. or elsewhere may have on our business, financial condition or results of operations, but the Dodd-Frank Act provides an avenue for the U.S. federal government to scrutinize one or more insurers or reinsurers that would otherwise be solely evaluated at the state level. Solvency evaluation of insurers and reinsurers at the federal level could serve to ultimately bring about a shift in regulation from the state to the federal level. Such a shift may bring into question the continued validity of the McCarran-Ferguson Act, which exempts the “business of insurance” from most federal laws, including anti-trust laws. With the McCarran-Ferguson Act exemption for the business of insurance, a reinsurer may set rate, underwriting and claims handling standards for its ceding company clients to follow.
We operate in many jurisdictions around the worldworld. We are subject to the laws and insurance regulations of the U.S. Additionally, a substantial portion of our operations occur outside of the United States.U.S. These international businesses are subject to the insurance, tax and other laws and regulations in the countries in which they are organized and in which they operate. These laws and regulations may apply heightened scrutiny to non-domestic companies, which can adversely affect our operations, liquidity, profitability and regulatory capital. Foreign governments and regulatory bodies from time to time consider legislation and regulations that could subject us to new or different requirements and such changes could negatively impact our operations in the relevant jurisdictions. CertainSee “Item 1. Business – B. Corporate Structure – Regulation” for a summary of certain U.S. state and federal laws and foreign laws and regulations applicable to our subsidiaries arebusiness. Our failure to comply with these and other laws and regulations could subject us to the Solvency II measures developed by the European Insurancepenalties from governmental or self-regulatory authorities, costs associated with remedying any such failure or related claims, harm to our business relationships and Occupational Pensions Authority and are required to abide by the evolving risk management practices, capital standards and disclosure requirementsreputation, or interrupt our operations, any of the Solvency II framework. We may also be subject to similar solvency regulations in other regions, such as Bermuda and China, where influences of the Solvency II - type framework are already present in the insurance regulation, and Japan. See “Regulation - International Regulation” in Item 1, Business. There can be no assurance at this time that Solvency II and such similar solvency regulations will not result in broader consequences to the Company orwhich could negatively impact our business, financial condition orposition and results of operations. We also expect to adopt new International Financial Reporting Standards for insurance contracts in many jurisdictions in which our subsidiaries operate effective in 2022. While we expect the adoption of these standards to create implementation demands, we are still evaluating the new requirements and it is unclear what impact there will be in the financial positions of the affected subsidiaries.
A downgrade in our ratings or in the ratings of our reinsurance subsidiaries could adversely affect our ability to compete.
Our financial strength and credit ratings are important factors in our competitive position. Rating organizations periodically review the financial performance and condition of insurers, including our reinsurance subsidiaries. These ratings are based on an insurance company’s ability to pay its obligations and are not directed toward the protection of investors. Rating organizations assign ratings based upon several factors. While most of the factors considered relate to the rated company, some of the factors relate to general economic conditions and circumstances outside the rated company’s control. The various rating agencies periodically review and evaluate our capital adequacy in accordance with their established guidelines and capital models. In order to maintain our existing ratings, we may commit from time to time to manage our capital at levels commensurate with such guidelines and models. If our capital levels are insufficient to fulfill any such commitments, we could be required to reduce our risk profile by, for example, retroceding some of our business or by raising additional capital by issuing debt, hybrid or equity securities. Additionally, rating agencies may make changes in their capital models and rating methodologies, which could increase the amount of capital required to support our ratings. In December 2021 S&P announced proposed changes to its rating methodologies. The proposed changes have not been finalized. Thus, the impact, if any, that these changes may have on our ratings is unknown. Any such actions could have a material adverse impact on our earnings and financial condition or materially dilute our shareholders’ equity ownership interests.
Any downgrade in the ratings of our reinsurance subsidiaries could adversely affect their ability to sell products, retain existing business, and compete for attractive acquisition opportunities. The ability of our subsidiaries to write reinsurance partially depends on their financial condition and is influenced by their ratings. Upon certain downgrade events, some of our reinsurance contracts would either permit our client
ceding insurers to terminate such reinsurance contracts or require us to post collateral to secure our obligations under these reinsurance contracts, either of which could negatively impact our ability to conduct business and our results of operations. Ratings are subject to revision or withdrawal at any time by the assigning rating organization. A rating is not a recommendation to buy, sell or hold securities, and each rating should be evaluated independently of any other rating.
We believe that the rating agencies consider the financial strength and flexibility of a parent company and its consolidated operations when assigning a rating to a particular subsidiary of that company. A downgrade in the rating or outlook of RGA, among other factors, could adversely affect our ability to raise and then contribute capital to our subsidiaries for the purpose of facilitating their operations and growth. A downgrade could also increase our own cost of capital. For example, the facility fee and interest rate for our syndicated revolving credit facility and certain other credit facilities are based on our senior long-term debt ratings. A decrease in those ratings could result in an increase in costs for thatunder those credit facility and others.facilities. Also, if there is a downgrade in the rating of RGA, or
any of our rated subsidiaries, some of our reinsurance contracts would either permit our client ceding insurers to terminate such reinsurance contracts or require us to post additional collateral to secure our obligations under thesesuch reinsurance contracts. Accordingly, we believe a ratings downgrade of RGA, or any of our rated subsidiaries, could negatively impact our ability to conduct business.
We cannot assure you that actions taken by ratings agencies would not result in a material adverse effect on our business, financial condition or results of operations. In addition, it is unclear what effect, if any, a ratings change would have on the price of our securities in the secondary market.
The availability and cost of collateral, including letters of credit, asset trusts and other credit facilities, as well as regulatory changes relating to the use of captive insurance companies, could adversely affect our business, financial condition or results of operations.
Regulatory reserve requirements in various jurisdictions in which we operate may be significantly higher than the reserves required under GAAP. Accordingly, we reinsure, or retrocede, business to affiliated and unaffiliated reinsurers to reduce the amount of regulatory reserves and capital we are required to hold in certain jurisdictions.
A regulation As described in the“Item 1. Business – B. Corporate Structure – Regulation – U.S. Regulation”, commonlyRegulation XXX and principles-based reserves (commonly referred to as Regulation XXX,PBR) requires U.S. life insurance and life reinsurance companies to hold a relatively high level of regulatory or statutory, reserves on their statutory financial statements for various types of life insurance business, primarily certain level term life products. The reserve levels required under Regulation XXX increase over time and are normally in excess of reserves required under GAAP. The degree to which these reserves will increase and the ultimate level of reserves will depend upon the mix of our business and future production levels in the U.S.business. Based on the assumed growth rate of growth in our current business plan and the increasingincreased level of regulatory reserves associated with some of this business, we expect the amount of our required regulatory reserves and our need to grow significantly.
In orderfinance these reserves may continue to reduce the effect of Regulation XXX, our principal U.S. operating subsidiary, RGA Reinsurance Company, has retroceded Regulation XXX-related reserves to affiliatedgrow. Changes in laws and unaffiliated reinsurers, including affiliated insurers governed by captive insurance laws. Additionally, some of our reinsurance subsidiaries in foreign jurisdictions enter into various reinsurance arrangements with affiliatedregulations and unaffiliated reinsurers from time to time in order to reduce statutory capital and reserve requirements.
Following a regulatory review by state insurance regulators of the life insurance industry’s use of affiliated captive reinsurers to satisfy certain reserve requirements, measures were adopted and implemented in 2015 to promote uniformity in both the approval and supervision of such reinsurers. These standards allow each of our current captives to continue in accordance with their previously approved plans, but place restrictions on the use of such captive reinsurers for new programs making them less effective than previous captive programs. As a result, captive reinsurance has become less a part of our reserve growth financing than earlier. It is also possible that additional restrictions could be introduced to further limit our ability to reinsureretrocede certain products, maintain risk based capital ratios and deploy excess capital. Further, the ultimate working of the group capital calculationbusiness may discourage the continued use of captives or other types of reserve financing. As a result, we may need to alter the type and volume of business we reinsure, increase prices on those products, raise additional capital to support higher regulatory reserves or implement higher cost strategies, all of which could adversely impact our competitive positionreserving requirements and thus our financial condition and results of operations. We cannot estimate the impact of discontinuing or altering our captive strategy in response to potential regulatory changes due to many unknown variables such as the cost and availability of alternative capital, the ultimate outcome of the NAIC’s group capital calculation methodology and use, changes in regulatory reserve requirements under a principle-based reserving approach, changes in acceptable collateral for statutory reserves, the long-term impact of the “certified reinsurer” option in the laws and regulations of certain jurisdictions where we operate, the potential for increased pricing of products offered by us and the potential change in the mix of products sold or offered by us or our clients.
In December of 2017, the U.S. and the European Union completed negotiation of a covered agreement under the authority provided in the Dodd-Frank Act. The covered agreement is a bilateral trade agreement under which both the U.S. and the member countries of the European Union agreed to eliminate collateral for reinsurance cessions from insurers domiciled in their home jurisdiction to reinsurers domiciled in the foreign jurisdiction, accept each other’s regulators as the group supervisor and rely on the group capital calculation at use in the insurer’s/reinsurer’s home jurisdiction. Currently, the U.S. regulators are implementing the terms of the covered agreement in a way that preserves the certified reinsurer concept, but this status could be altered or eliminated in U.S. reinsurance reserve credit regulation in the future. Such alteration or elimination may impact the cost or the availability of alternative capital, which may or may not be offset by the reduction in collateral that may ultimately result from the covered agreement.
As a general matter, for us to reduce regulatory reserves on business that we retrocede, the affiliated or unaffiliated reinsurer must provide an equal amount of regulatory-compliant collateral. Such collateral may be provided in the form of a letter of credit from a commercial bank, through the placement of assets in trust for our benefit, or through a capital markets securitization.
In connection with these reserve requirements, we face the following risks:
The availability of collateral and the related cost of such collateral in the future could affect the type and volume of business we reinsure and could increase our costs.
We may need to raise additional capital to support higher regulatory reserves, which could increase our overall cost of capital.
If we, or our retrocessionaires, are unable to obtain or provide sufficient collateral to support our statutory ceded reserves, we may be required to increase regulatory reserves. In turn, this reserve increase could significantly reduce our statutory capital levels and adversely affect our ability to satisfy required regulatory capital levels, unless we are able to raise additional capital to contribute to our operating subsidiaries.
Because Furthermore, term life insurance is a particularly price-sensitive product, and any increase in insurance premiums charged on these products by life insurance companies, in order to compensate them for the increased statutory reserve requirements or higher costs of insurance they face, may result in a significant loss of volume in their life insurance operations, which could, in turn, adversely affect our life reinsurance operations.
We cannot assure you that we will be able to implement actions to mitigate the effect of increasing regulatory reserve requirements.
In addition, we maintain credit and letter of credit facilities with various financial institutions as a potential source of collateral and excess liquidity. Our ability to utilize these facilities is conditioned on our satisfaction of covenants and other requirements contained in the facilities. Our ability to utilize these facilities is also subject to the continued willingness and ability of the lenders to provide funds or issue letters of credit. Our failure to comply with the covenants in these facilities, or the failure of the lenders to meet their commitments, would restrict our ability to access these facilities when needed, adversely affecting our liquidity, financial condition and results of operations.
Changes in the equity markets, interest rates and volatility affect the profitability of variable annuities with guaranteed living benefits that we reinsure, which may have a material adverse effect on our business and profitability.
We reinsure variable annuity products that include guaranteed minimum living benefits. Thesebenefits (“GMLB”). GMLB include guaranteed minimum withdrawal benefits, guaranteed minimum accumulation benefits and guaranteed minimum income benefits. The amount of reserves related to these benefitsGMLB is based on their fair value and is affected by changes in equity markets, interest rates and volatility. Accordingly, strong equity markets, increases in interest rates and decreases in volatility will generally decrease the fair value of the liabilities underlying the benefits.
Conversely, a decrease in the equity markets along with a decrease in interest rates and an increase in volatility will generally result in an increase in the fair value of the liabilities underlying the benefits, which increases the amount of reserves that we must carry. Such an increase in reserves would result in a charge to our earnings in the quarter in which we increase our reserves. We maintain a customized dynamic hedging program that is designed to mitigate the risks associated with income volatility around the change in reserves on guaranteed benefits. However, hedge positions may not be effective to fully offset changes in the carrying value of the guarantees due to, among other things, the time lag between changes in such values and corresponding changes in the hedge positions, high levels of volatility in the equity and derivatives markets, extreme swings in interest rates, unexpected contract holder behavior, and divergence between the performance of the underlying funds and hedging indices. These factors, individually or collectively, may have a material adverse effect on our liquidity, capital levels, financial condition or results of operations.
RGA is an insurance holding company, and our ability to pay principal, interest and dividends on securities is limited.
RGA is an insurance holding company, with our principal assets consisting of the stock of our reinsurance company subsidiaries, and substantially all of our income is derived from those subsidiaries. Our ability to pay principal and interest on any debt securities or dividends on any preferred or common stock depends, in part, on the ability of our reinsurance company subsidiaries, our principal sources of cash flow, to declare and distribute dividends or advance money to RGA. We are not permitted to pay common stock dividends or make payments of interest or principal on securities that rank equal or junior to our subordinated debentures and junior subordinated debentures, until we pay any accrued and unpaid interest on such debentures. Our reinsurance company subsidiaries are subject to various statutory and regulatory restrictions, applicable to insurance companies generally, that limit the amount of cash dividends, loans and advances that those subsidiaries may pay to us. Covenants contained in certain of our debt agreements also restrict the ability of certain subsidiaries to pay dividends and make other distributions or loans to us. In addition, we cannot assure you that more stringent dividend restrictions will not be adopted, as discussed above under “Our reinsurance subsidiaries are highly regulated, and changes in these regulations could negatively affect our business.”
As a result of our insurance holding company structure, upon the insolvency, liquidation, reorganization, dissolution or other winding-up of one of our reinsurance subsidiaries, all creditors of that subsidiary would be entitled to payment in full out of the assets of such subsidiary before we, as shareholder, would be entitled to any payment. Our subsidiaries would have to pay
their direct creditors in full before our creditors, including holders of common stock, preferred stock or debt securities of RGA, could receive any payment from the assets of such subsidiaries.
We are exposed to foreign currency risk.
We are a multi-national company with operations in numerous countries and, as a result, are exposed to foreign currency risk to the extent that exchange rates of foreign currencies are subject to adverse change over time. The U.S. dollar value of our net investments in foreign operations, our foreign currency transaction settlements and the periodic conversion of the foreign-denominated earnings to U.S. dollars (our reporting currency) are each subject to adverse foreign exchange rate movements. A significant portion of our revenues and our fixed maturity securities available for saleavailable-for-sale are denominated in currencies other than the U.S. dollar. We use hedging strategies and foreign-denominated revenues and investments to fund foreign-denominated expenses and liabilities when possible to mitigate exposure to foreign currency fluctuations. In addition, we utilize hedging strategies to mitigate exposure to foreign currency fluctuation.
Our international operations involve inherent risks.
A significant portion of our net premiums come from our operations outside of the U.S. One of our strategies is to grow these international operations. International operations subject us to various inherent risks. We may not be able to manage the growth of these operations effectively, particularly given the recent rates of growth. Our international operations expose us to mortality and morbidity experience, and supply and demand for our products that are specific to these markets as well as altered exposure to epidemic and pandemic risks that may be difficult to anticipate. In addition to the regulatory and foreign currency risks identified above, other related risks include the following:
managing the growth of these operations effectively, particularly given the recent rates of growth;
changes in mortality and morbidity experience and the supply and demand for our products that are specific to these markets and that may be difficult to anticipate;
political and economic instability in the regions of the world, and the potential for deteriorating economic and political relationships between the countries, where we operate;
uncertainty arising out of foreign government sovereignty over our international operations;
increased exposure to epidemic and pandemic risks;
operations, potentially uncertain or adverse tax consequences including(including the repatriation of earnings from our non-U.S. subsidiaries;subsidiaries) and
potential reduction in opportunities resulting from market access restrictions.
Some of our international operations are in emerging markets where these risks are heightened, and we anticipate that we will continue to do business in such markets. Our pricing assumptions may be less predictable in emerging markets, and deviations in actual experience from these assumptions could impact our profitability in these markets. Additionally, lack of legal certainty and stability in the emerging markets exposes us to increased risk of disruption and adverse or unpredictable actions by regulators and may make it more difficult for us to enforce our contracts, which may negatively impact our business.
The decision by the UK to exit the European Union (“EU”), or Brexit, created significant uncertainty about the future of insurance and reinsurance regulation in the UK as well as the terms upon which a reinsurer will be permitted to access the UK market or operate to serve other markets from within the UK. The eventual effects of the UK’s withdrawal from the EU on our business or our investment portfolios remains uncertain at this time and will depend on agreements the UK makes to retain access to EU markets either during a transitional period or more permanently. It is possible that there will be greater restrictions, requirements and regulatory complexities on reinsurance provided in the UK by entities located outside of the UK, which may adversely affect our business, financial condition or results of operations. Furthermore, Brexit could adversely affect European and worldwide economic conditions and could contribute to greater instability in the global financial markets before and after the terms of the UK’s future relationship with the EU are settled.
We cannot assure you that we will be able to manage the risks associated with our international operations effectively or that theythese risks will not have an adverse effect on our business, financial condition or results of operations.
We depend on the performance of others, and their failure to perform in a satisfactory manner would negatively affect us.
In the normal course of business, we seek to limit our exposure to losses from our reinsurance contracts by ceding a portion of the reinsurance to other insurance enterprises or retrocessionaires. We cannot assure you that these insurance enterprises or retrocessionaires will be able to fulfill their obligations to us. As of December 31, 2019, the external retrocession pool members participating in our excess retention pool that have been reviewed by A.M. Best Company were rated “A-” or better. A rating of “A-” is the fourth highest rating out of sixteen possible ratings. We are also subject to the risk that our clients will be unable to fulfill their obligations to us under our reinsurance agreements with them.
We rely upon our insurance company clients to provide timely, accurate information. We may experience volatility in our earnings as a result of erroneous or untimely reporting from our clients. We work closely with our clients and monitor their
reporting to minimize this risk. We also rely on original underwriting decisions made by our clients. Weclients and cannot assure you that theseour clients’ processes or those of our clients will adequately control business quality or establish appropriate pricing.
For some reinsurance agreements, the ceding company withholds and legally owns and manages assets equal to the net statutory reserves, and we reflect these assets as funds withheld at intereston reinsurance assumed on our balance sheet. If a ceding company was to become insolvent, we would need to assert a claim on the assets supporting our reserve liabilities. We attempt to mitigate our risk of loss by offsetting amounts for claims or allowances that we owe the ceding company with amounts that the ceding company owes to us. We are subject to the investment performance on the withheld assets, although we do not directly control them. We help to set, and monitor compliance with, the investment guidelines followed by these ceding companies. However, to the extent that such investment guidelines are not appropriate, or to the extent that the ceding companies do not adhere to such guidelines, our risk of loss could increase, which could materially adversely affect our financial condition and results of operations. For additional information on funds withheld at interest, see “Investments-Funds“Investments – Funds Withheld at Interest” in Management’s Discussion and Analysis of Financial Condition and Results of Operations.
We use the services of third-partiesthird parties such as asset managers, software vendors and administrators to perform various functions that are important to our business. For instance, we have engaged third party investment managers to manage certain assets where our investment management expertise is limited, who we rely on to provide investment advice and execute investment transactions that are within our investment policy guidelines. Our third partythird-party service providers rely on their computer systems and their ability to maintain the security, confidentiality, integrity and privacy of those systems and the data residing on such systems. Our service providers may be subject to cybersecurity attacks and may not sufficiently protect their information technology and related data, which may impact their ability to provide us services and protect our data, which may subject us to losses and harm our reputation. Poor performance on the part of these outside vendors could negatively affect our operations and financial performance.
As with all financial services companies, our ability to conduct business depends on consumer confidence in the industry and our financial strength. Actions of competitors, and financial difficulties of other companies in the industry, and related adverse publicity, could undermine consumer confidence and harm our reputation and business.
Epidemics and pandemics, natural and man-made disasters, catastrophes and events, including terrorist attacks, could adversely affect our business, financial condition and results of operations.
Epidemics, pandemics, such as the novel coronavirus, pandemics,COVID-19, as well as natural disasters, climate change and terrorist attacks, and other catastrophes and events can adversely affect our business, financial condition and results of operations because they exacerbate mortality and morbidity risk. The likelihood, timing, and severity of these events cannot be predicted. A pandemic or other disaster could have a major impact on the global economy or the economies of particular countries or regions, including travel, trade, tourism, the health system, food supply, consumption, and overall economic output. Additionally, anyAny such events could have a material negative impact on the financial markets, potentially impacting the value and liquidity of our invested assets, access to capital markets and credit, and the business of our clients. In addition, a pandemic or other disaster that affected our employees or the employees of companies with which we do business could disrupt our business operations. The effectiveness of external parties, including governmental and non-governmental organizations, in combating the spread and severity of such an event could have a material impact on the losses we experience. These events could cause a material adverse effect on our results of operations in any period and, depending on their severity, could also materially and adversely affect our financial condition.
Additionally, the The impact of an increase in global average temperatures could cause changes in weather patterns, resulting in more severe and more frequent natural disasters such as forest fires, hurricanes, tornadoes, floods and storm surges and may, over the
longer term, impact disease incidence and severity, food and water supplies and the general health of impacted populations. These climate change trends are expected to continue in the future and may impact nearly all sectors of the economy to varying degrees. We cannot predict the long-term impacts of climate change for the Company and our clients, but such events may adversely impact our mortality and morbidity rates and also may impact asset prices, financial markets and general economic conditions.
We believe our reinsurance programs are sufficient to reasonably limit our net losses for individual life claims relating to potential future natural disasters and terrorist attacks under some circumstances. However, the consequences of natural disasters, climate change, terrorist attacks, armed conflicts, epidemics and pandemics are unpredictable, and we may not be able to foresee events that could have an adverse effect on our business.
We operate in a highly competitive and dynamic industry.industry and competition, tax law changes, and other factors could adversely affect our business.
The reinsurance industry is highly competitive, and we encounter significant competition in all lines of business from other reinsurance companies, as well as competition from other providers of financial services. Our competitors vary by geographic market, and many of our competitors have greater financial resources than we do. Our ability to compete depends on, among other things, pricing and other terms and conditions of reinsurance agreements, our ability to maintain strong financial strength ratings, and our service and experience in the types of business that we underwrite. Competition from other reinsurers could adversely affect our competitive position.
We compete based on the strength of our underwriting operations, insights on mortality trends, based on our large book of business, our ability to efficiently execute transactions, our client relationships and our responsive service. We believe our quick response time to client requests for individual underwriting quotes, our underwriting expertise and our ability to structure solutions to meet clients’ needs are important elements to our strategy and lead to other business opportunities with our clients. Our business will be adversely affected if we are unable to maintain these competitive advantages.
The insurance and reinsurance industries are subject to ongoing changes from market pressures brought about by customer demands, changes in law, changes in economic conditions such as interest rates and investment performance, technological innovation, marketing practices and new providers of insurance and reinsurance solutions. Because of these and other factors, we are required to anticipate market trends and make changes to differentiate our products and services from those of our competitors. Failure to anticipate these market trends or to differentiate our products and services may affect our ability to grow or to maintain our current position in the industry. A failure by the insurance industry to meet evolving consumer demands, including demands to address disparate impacts that may exist against certain groups in insurers’ underwriting and sales models, could adversely affect the insurance industry and our operating results. Similarly, our failure to meet the changing demands of our insurance company clients through innovative product development, effective distribution channels and investments in technology could negatively impact our financial performance over the long-term. Additionally, our failure to adjust our strategies in response to changing economic conditions could impact our competitive position and have a material adverse effect on our business, financial condition and results of operations.
Tax law changes or a prolonged economic downturn could reduce the demand for insurance products, which could adversely affect our business.
Under the U.S. Internal Revenue Code, income tax payable by policyholders on investment earnings is deferred during the accumulation period of some life insurance and annuity products. To the extent thatIf the U.S. Internal Revenue Code is revised to reduce benefits associated with the tax-deferred status of certain life insurance and annuity products, or to increase the tax-deferred status of competing products, all life insurance companies would be adversely affected with respect to their ability to sell such products, and, depending on grandfathering provisions, by the surrenders of existing annuity contracts and life insurance policies. In addition, life insurance products are often used to fund estate tax obligations. The estate tax provisions of the U.S. Internal Revenue Code have been revised frequently in the past. If Congress adopts legislation in the future to reduce or eliminate the estate tax, our U.S. life insurance company customers could face reduced demand for some of their life insurance products, which in turn could negatively affect our reinsurance business. We cannot predict whether any tax legislation impacting corporate taxes or insurance products will be enacted, what the specific terms of any such legislation will be or whether any such legislation would have a material adverse effect on our business, financial condition and results of operations.
Weak conditions in global capital markets and the economy, as well as inflation, may materially adversely affect our business and results of operations.
Our results of operations, financial condition, cash flows and statutory capital position are materially affected by conditions in global capital markets and the economy. A general economic downturn or a downturn in the capital markets could adversely affect the market for many life insurance and annuity products. Factors such as consumer spending, business investment, government spending, the volatility and strength of the capital markets, deflation and inflation affect the economic environment and thus the profitability of our business. An economic downturn may yield higher unemployment and lower family income, corporate earnings, business investment and consumer spending, and could result in decreased demand for life insurance and annuity products. BecauseAs we obtain substantially all of our revenues through reinsurance arrangements that cover a portfolio of life insurance products and annuities, our business would be harmed if the market for annuities or life insurance was adversely affected. Therefore, adverse changes in the economy such as a recession could adversely affect our business, financial condition and results of operations.
An increase in inflation could affect our business in several ways. In our group life and disability businesses, premiums and claims cost may increase as compensation levels increase. However, during inflationary periods with rising interest rates, the value of fixed income investments falls which could increase realized and unrealized losses, resulting in additional deferred tax assets that may not be realizable. Inflation may also increase the Company’s compensation expenses and other costs, potentially putting pressure on profitability. Prolonged and elevated inflation could adversely affect the financial markets and the economy generally, and dispelling it may require governments to pursue a restrictive fiscal and monetary policy, which could constrain overall economic activity, inhibit revenue growth and reduce the number of attractive investment opportunities.
Our investments and derivative financial instruments are subject to risks of credit defaults, changes in foreign exchange rates, and changes in market values. Periods of macroeconomic weakness or recession, heightened volatility or disruption in the financial and credit markets could increase these risks, potentially resulting in other-than-temporary impairment of assets in our investment portfolio. We are also subject to the risk that cash flows generated from the collateral underlying the structured products we own may differ from our expectations in timing or amount. In addition, many of our classes of investments, but in particular our alternative investments, may produce investment income that fluctuates significantly from period to period. Any event reducing the estimated fair value of these securities, other than on a temporary basis, could have a material and adverse effect on our business, results of operations, financial condition, liquidity and cash flows. Difficult financial, economic and geopolitical conditions could cause our investment portfolio to incur material losses.
Changes in interest rates, reduced liquidity in the financial markets or a slowdown in U.S. or global economic conditions have and, in the future, may also adversely affect the values and cash flows of the assets in our investment portfolio. Our corporate fixed income portfolio has been, and in the future may be, adversely impacted by delayed principal or interest payments, ratings downgrades, increased bankruptcies and credit spreads widening in distressed industries and individual companies. Our investments in mortgage loans and mortgage-backed securities have been, and in the future could be, negatively affected by delays or failures of borrowers to make payments of principal and interest when due or delays or moratoriums on foreclosures or enforcement actions with respect to delinquent or defaulted mortgages. Market dislocations, decreases in observable market activity or unavailability of information may restrict our access to key inputs used to derive certain estimates and assumptions made in connection with financial reporting or otherwise, including estimates and changes in long term macro-economic assumptions relating to estimated expected credit losses.
Additionally, increased economic uncertainty and increased unemployment resulting from a recession or negative economic conditions may result in policyholders seeking sources of liquidity and withdrawing from, or cancelling, their policies at rates greater than expected. If policyholder lapse and surrender rates significantly exceed expectations, it could have a material adverse effect on our business, results of operations and financial condition.
We could be subject to additional income tax liabilities.
We are subject to income taxes in the U.S. and numerous foreign jurisdictions. Tax laws, regulations and administrative practices in various jurisdictions may be subject to significant change, with or without notice, due to economic, political and other conditions, and significant judgment is required in evaluating and estimating our provision and accruals for these taxes. Furthermore, we establish deferred tax assets to the extent our portfolio of fixed maturity securities is in an unrealized loss position. Realization of these losses could result in the inability to recover all of the tax benefits, resulting in a valuation allowance against the deferred tax asset. Realized losses may have a material adverse impact on our results.
The U.S. recently enacted tax reform legislation commonly referredTreasury Department and the IRS continue to asissue guidance under the U.S. Tax Cuts and Jobs Act of 2017 (“U.S. Tax Reform”), which, among other things, includes changes to U.S. federal tax rates, imposes significant additional limitations on as well as the deductibilityInflation Reduction Act passed in August of interest and net operating losses, allows for the expensing of certain capital expenditures and implements a number of changes impacting operations outside of the U.S. including, but not limited to, imposing a one-time tax on accumulated post-1986 deferred foreign income2022, that has not previously been subject to tax, modifying the treatment of certain intercompany transactions that are viewed as eroding the U.S. tax base and imposing a minimum tax on overseas operations that operatemay result in low tax jurisdictions.
In addition, a number of countries are actively pursuing changes to their tax laws applicable to multinational corporations.interpretations different from ours. Foreign governments may enact tax laws in response to U.S. Tax Reform that could result in further changes to global taxation and materially affect our financial position and results of operations. In addition, a number of countries are actively pursuing changes to their tax laws applicable to multinational corporations.
Our abilityChanges in accounting standards may adversely affect our reported results of operations and financial condition.
The Company’s consolidated financial statements are prepared in conformity with GAAP. If we are required to minimize additional tax payments by restructuring various aspectsadopt revised accounting standards in the future, it may adversely affect our reported results of our business operations may be hindered by uncertainty regarding U.S. Tax Reform,and financial condition. In August 2018, the Financial Accounting Standards Board issued guidance that will significantly change the accounting for long-duration insurance contracts, and was effective for the Company on January 1, 2023. For a discussion of the impact of new long-duration insurance guidance and other new tax lawsaccounting pronouncements issued but not yet implemented, see “New Accounting Pronouncements” in Note 2 – “Significant Accounting Principles and future guidance issued byPronouncements” in the U.S. Treasury Department, foreign taxing authorities or insurance regulators. For instance,Notes to the U.S. Treasury Department, the IRS, and other standard-setting bodies could interpret or issue guidance on how U.S. Tax Reform will be applied that is different from our interpretations. WeConsolidated Financial Statements.
continue to examine the impact that U.S. Tax Reform and other tax legislation may have on our business. The impact of such tax legislation on our financial position and operations is uncertain and could be adverse.
Acquisitions and significant transactions involve varying degrees of risk that could affect our profitability.
We have made, and may in the future make, acquisitions, either of selected blocks of business or other companies. The success of these acquisitions depends on, among other factors, our ability to appropriately price and evaluate the risks of the acquired business. Additionally, acquisitions may expose us to operational challenges and various risks, including:
the ability to integrate the acquired business, operations and data with our systems;
as well as the availability of funding sufficient to meet increased capital needs;
needs, the ability to fund cash flow shortages that may occur if anticipated revenues are not realized or are delayed whether by general economic or market conditions or unforeseen internal difficulties; and
the possibility that the value of investments acquired in an acquisition may be lower than expected or may diminish due to credit defaults or changes in interest rates and that liabilities assumed may be greater than expected (due to, among other factors, less favorable than expected mortality or morbidity experience).
Additionally, acquisitions may expose us to other operational challenges and various risks, including the ability to integrate the acquired business operations and data with our systems. A failure to successfully manage the operational challenges and risks associated with or resulting from significant transactions, including acquisitions, could adversely affect our business, financial condition or results of operations.
Our risk management policies and procedures could leave us exposed to unidentified or unanticipated risk, which could negatively affect our business, financial condition or results of operations.
Our risk management policies and procedures, designed to identify, monitor and manage both internal and external risks, may not adequately predict future exposures, which could be significantly greater than expected. In addition, these identified risks may not be the only risks facing us. Additional risks and uncertainties not currently known to us, or that we currently deem to be immaterial, may adversely affect our business, financial condition or results of operations.
There are inherent limitations to risk management strategies because there may exist, or develop in the future, risks that we have not appropriately anticipated or identified. If our risk management framework proves ineffective, we may suffer unexpected losses and could be materially adversely affected. As our businesses change and the markets in which we operate evolve, our risk management framework may not evolve at the same pace as those changes. As a result, there is a risk that new business strategies may present risks that are not appropriately identified, monitored or managed. In times of market stress, unanticipated market movements or unanticipated claims experience resulting from adverse mortality, morbidity or policyholder behavior, the effectiveness of our risk management strategies may be limited, resulting in losses. In addition, under difficult or less liquid market conditions, our risk management strategies may not be less effective and/or more expensive because other market participants may be using the same or similar strategies to manage risk under the same challenging market conditions. In such circumstances, it may be difficult or more expensive for us to mitigate risk due to the activity of such other market participants.
Past or future misconduct by our employees or employees of our vendors could result in violations of law, regulatory sanctions and serious reputational or financial harm and the precautions we take to prevent and detect this activity may not be effective. There can be no assurance that our controls and procedures that we employ, which are designed to monitor associates’ business decisions and prevent us from taking excessive or inappropriate risks will be effective. We review our compensation policies and practices as part of our overall risk management program, but it is possible that our compensation policies and practices could inadvertently incentivize excessive or inappropriate risk taking. If our associates take excessive or inappropriate risks, those riskstaking, which could harm our reputation and have a material adverse effect on our results of operations or financial condition.
The failure in cyber or other information security systems, including a failure to maintain the security, confidentiality, integrity or privacy of sensitive data residing on such systems, as well as the occurrence of unanticipated events affecting our disaster recovery systems and business continuity planning, could impair our ability to conduct business effectively.
Our business is highly dependent upon the effective operation of our computer systems. The failure of our computer systems or disaster recovery capabilities for any reason could cause significant interruptions in our operations and result in a failure to maintain the security, confidentiality, integrity or privacy of sensitive or personal data related to our customers, insured individuals or employees. Like other global companies, we have experienced threats to our data and systems from time to time. However, we have not detected or identified any evidence to indicate we have experienced a material breach of cybersecurity. Administrative and technical controls, security measures and other preventative actions we take to reduce the risk of such incidents and protect our information technology may not be sufficient to prevent physical and electronic break-ins, and similar disruptions from unauthorized tampering with our computer systems. Such a failure could harm our reputation, subject us to investigations, litigation, regulatory sanctions and other claims and expenses, lead to loss of customers and revenues and otherwise adversely affect our business, financial condition or results of operations.
We rely on our computer systems for a variety of business functions across our global operations, including for the administration of our business, underwriting, claims, performing actuarial analysis and maintaining financial records. We depend heavily upon these computer systems to provide reliable service, data and reports. Upon a disaster such as a natural catastrophe, epidemic, industrial accident, blackout, computer virus, terrorist attack or war, unanticipated problems with our disaster recovery systems could have a material adverse impact on our ability to conduct business and on our financial condition and results of operations, particularly if those problems affect our computer-based data processing, transmission, storage and retrieval systems and destroy valuable data. While we maintain liability insurance for cybersecurity and network interruption losses, our insurance may not be sufficient to protect us against all losses. In addition, if a significant number of our
managers were unavailable upon a disaster, our ability to effectively conduct business could be severely compromised. These interruptions also may interfere with our clients’ ability to provide data and other information to us, and our employees’ ability to perform their job responsibilities.
Failure to protect the confidentiality of information could adversely affect our reputation and have a material adverse effect on our business, financial condition and results of operations.
Many jurisdictions in which we operate have enacted laws to safeguard the privacy and security of personal information. Additionally, various government agencies have established rules protecting the privacy and security of such information. These laws and rules vary greatly by jurisdiction. The NAIC has adopted an Insurance Data Security Model Law which is intended to establish the standards for data security and standards for the investigation and notification of data breaches applicable to insurance licensees in states adopting such law. Some of our employees have access to personal information of policy holders. We rely on internal controls to protect the confidentiality of this information. It is possible that an employee could, intentionally or unintentionally, disclose or misappropriate confidential information or our data could be the subject of a cybersecurity attack. If we fail to maintain adequate internal controls or if our employees fail to comply with our policies, misappropriation or intentional or unintentional inappropriate disclosure or misuse of client information could occur. Such internal control inadequacies or non-compliance could materially damage our reputation or lead to civil or criminal penalties, which, in turn, could have a material adverse effect on our business, financial condition and results of operations. In addition, we analyze customer data to better manage our business. There has been increased scrutiny, including from U.S. state regulators, regarding the use of “big data” techniques. We cannot predict what, if any, actions may be taken with regard to “big data,” but any inquiries could cause reputational harm and any limitations could have a material impact on our business, financial condition and results of operations.
Managing key employee attraction, retention and succession is critical to our success.
Our success depends in large part upon our ability to identify, hire, retain and motivate highly skilled employees. We would be adversely affected if we fail to adequately plan for the succession of our senior management and other key employees. While we have succession plans and long-term compensation plans designed to retain our existing employees and attract and retain additional qualified personnel in the future, our succession plans may not operate effectively and our compensation plans cannot guarantee that the services of these employees will continue to be available to us.
Litigation and regulatory investigations and actions may result in financial losses or harm our reputation.
We are, and in the future may be, subject to litigation and regulatory investigations or actions in the ordinary course of our business.from time to time. A substantial legal liability or a significant federal, state or other regulatory action against us, as well as regulatory inquiries or investigations, could harm our reputation, result in material fines or penalties, result in significant legal costs and otherwise have a material adverse effect on our business, financial condition and results of operations. Regulatory inquiries and litigation may also cause volatility in the price of stocks of companies in our industry or in our stock price. Material pending litigation and regulatory matters affecting us, if any, are discussed inFor additional information, see Item 8. “Financial Statements and Supplementary Data -– Notes to Consolidated Financial Statements -– Note 12 Commitments, Contingencies and Guarantees”Guarantees.”
Risks Related to Our Investments
Adverse capital and credit market conditions and access to credit facilities may significantly affect our ability to meet liquidity needs, access to capital and cost of capital.
The capital and credit markets experience varying degrees of volatility and disruption. In some periods, the markets have exerted downward pressure on availability of liquidity and credit capacity for certain issuers.
We need liquidity to make our benefit payments, to pay our operating expenses, interest on our debt and dividends on our capital stock and to replace certain maturing liabilities. Without sufficient liquidity, we will be forced to curtail our operations, and our business will be adversely affected. The principal sources of our liquidity are reinsurance premiums under reinsurance treaties and cash flows from our investment portfolio and other assets. Sources of liquidity in normal markets also include proceeds from the issuance of a variety of short- and long-term instruments, including medium- and long-term debt, subordinated and junior subordinated debt securities, capital securities and common stock.
If current resources do not satisfy our needs, we may have to seek additional financing. The availability of additional financing will depend on a variety of factors such as market conditions, the general availability of equity and credit, the volume of trading activities, the overall availability of credit to the financial services industry, our credit ratings and credit capacity, as well as the possibility that customers or lenders could develop a negative perception of our long- or short-term financial prospects. Similarly, our access to funds may be impaired if regulatory authorities or rating agencies take negative actions against us. Our internal sources of liquidity may prove to be insufficient, and in such case, we may not be able to successfully obtain additional financing on favorable terms, or at all.
Disruptions, uncertainty or volatility in the capital and credit markets may also limit our access to capital required to operate our business, most significantly our reinsurance operations. Such market conditions may limit our ability to replace maturing liabilities in a timely manner, satisfy statutory capital requirements, generate fee income and market-related revenue to meet liquidity needs and access the capital necessary to grow our business. As such, we may be forced to delay raising capital, issue shorter tenor securities than we prefer, or bear an unattractive cost of capital, which could decrease our profitability and significantly reduce our financial flexibility. Further, our ability to finance our statutory reserve requirements depends on market conditions. If market capacity is limited for a prolonged period, of time, our ability to obtain new funding for such purposes may be hindered and, as a result, our ability to write additional business in a cost-effective manner may be limited or otherwise adversely affected.
We also rely on our unsecured credit facilities, including our $850 million syndicated credit facility, as potential sources of liquidity. Our credit facilities contain administrative, reporting, legal and financial covenants, and our syndicated credit facility includes requirements to maintain a specified minimum consolidated net worth and a minimum ratio of consolidated indebtedness to total capitalization. If we were unable to access our credit facilities it could materially impact our capital position. The availability of these facilities could be critical to our credit and financial strength ratings and our ability to meet our obligations as they come due in a market when alternative sources of credit are unavailable.
Difficult conditions in the global capital markets and the economy generally may materially adversely affect our business, financial condition and results of operations.
Our results of operations, financial condition, cash flows and statutory capital position are materially affected by conditions in the global capital markets and the economy generally, both in the U.S. and elsewhere around the world. Poor economic conditions, volatility and disruptions in capital markets or financial asset classes and geopolitical upheaval (including trade disputes) can have an adverse effect on our business because our investment portfolio and some of our liabilities are sensitive to changing market factors. Additionally, disruptions in one market or asset class can also spread to other markets or asset classes.
Concerns over U.S. fiscal policy and the trajectory of the U.S. national debt could have severe repercussions to the U.S. and global credit and financial markets, further exacerbate concerns over sovereign debt and disrupt economic activity in the U.S. and elsewhere. As a result, our access to, or cost of, liquidity may deteriorate. As a result of uncertainty regarding U.S. national debt, the market value of some of our investments may decrease, and our capital adequacy could be adversely affected. Further downgrades, together with the sustained current trajectory of the U.S. national debt, could have adverse effects on our business, financial conditionPolitical and results of operations.
Past economic uncertainties and weakness and disruption of the financial markets around the world, such as geopolitical upheaval (including trade disputes), the results of Brexit, and deteriorating economic and political relationships between countries, the solvency of certain European Union member states and of financial institutions that have significant direct or indirect exposure to debt issued by such countries, have led and may continue to lead to concerns over capital markets access. In addition, there are ongoing risks around the world related to interest rate fluctuations, slowing global growth, commodity prices and the devaluation of certain currencies. These events and continuing market upheavals may have an adverse effect on us, in part because we have a large investment portfolio and are also dependent upon customer behavior. Our revenues may decline in such circumstances and our profit margins may erode. In addition, upon prolonged market events, such as the global credit crisis, we could incur significant investment-related losses. Even in the absence of a market downturn, we are exposed to substantial risk of loss due to market volatility.
If our investment strategy is unsuccessful, we could suffer losses.
The success of our investment strategy is crucial to the success of our business. In particular, weWe structure our investments to match our anticipated liabilities under reinsurance treaties to the extent we believe necessary. If our calculations with respect to these reinsurance liabilities are incorrect, or if we improperly structure our investments to match such liabilities, we could be forced to liquidate investments prior to maturity at a significant loss.
Our investment guidelines limit non-investment grade fixed maturity securities in our investment portfolio. While any investment carries some risk, the risks associated with lower-rated securities are greater than the risks associated with investment grade securities. The risk of loss of principal or interest through default is greater because lower-rated securities are usually unsecured and are often subordinated to an issuer’s other obligations. Additionally, the issuers of these securities frequently have relatively high debt levels and are thus more sensitive to difficult economic conditions, specific corporate developments and rising
interest rates, which could impair an issuer’s capacity or willingness to meet its financial commitment on such lower-rated securities. As a result, the market price of these securities may be quite volatile, and the risk of loss is greater.
The success of any investment activity is affected by general economic conditions, including the level and volatility of interest rates and the extent and timing of investor participation in such markets, which may adversely affect the markets for interest rate sensitive securities, mortgages and equity securities. Unexpected volatility or illiquidity in the markets in which we directly or indirectly hold positions could adversely affect us.
Interest rate fluctuations could negatively affect the income we derive from the difference between the interest rates we earn on our investments and interest we pay under our reinsurance contracts.
Significant changes in interest rates expose reinsurance companies to the risk of reduced investment income or actual losses based on the difference between the interest rates earned on investments and the credited interest rates paid on outstanding reinsurance contracts. Both rising and declining interest rates can negatively affect the income we derive from these interest rate spreads. During periods of rising interest rates, we may be contractually obligated to reimburse our clients for the greater amounts they credit on certain interest-sensitive products. However, we may not have the ability to immediately acquire investments with interest rates sufficient to offset the increased crediting rates on our reinsurance contracts. During periods of falling interest rates, our investment earnings will be lower because new investments in fixed maturity securities will likely bear lower interest rates. We may not be able to fully offset the decline in investment earnings with lower crediting rates on underlying annuity products related to certain of our reinsurance contracts. Our asset/liability management programs and procedures may not reduce the volatility of our income when interest rates are rising or falling, and thus we cannot assure you that changes in interest rates will not affect our interest rate spreads.
Changes in interest rates may also affect our business in other ways. Higher interest rates may result in increased surrenders on interest-based products of our clients, which may affect our fees and earnings on those products. Lower interest rates may result in lower sales of certain insurance and investment products of our clients, which would reduce the demand for our reinsurance of these products. If interest rates remain low for an extended period, of time, it may adversely affect our cash flows, financial condition and results of operations.
The liquidity and value of some of our investments may become significantly diminished.
There may be illiquid markets for certain investments we hold in our investment portfolio. These include privately-placed fixed maturity securities, options and other derivative instruments, mortgage loans, policy loans, limited partnership interests, and real estate equity, such as real estate joint ventures and funds. Additionally, markets for certain of our investments that are currently liquid may experience reduced liquidity during periods of market volatility or disruption. If we were forced to sell certain of our investments into illiquid markets, prices may be lower than our carrying value in such investments. This could result in realized losses which could have a material adverse effect on our results of operations and financial condition, as well as our financial ratios, which could affect compliance with our credit instruments and rating agency capital adequacy measures.
We could be forced to sell investments at a loss to cover policyholder withdrawals, recaptures of reinsurance treaties or other events.
Some of the products offered by our insurance company customers allow policyholders and contract holders to withdraw their funds under defined circumstances. Our reinsurance subsidiaries manage their liabilities and configure their investment portfolios so as to provide and maintain sufficient liquidity to support anticipated withdrawal demands and contract benefits and maturities under reinsurance treaties with these customers. While our reinsurance subsidiaries own a significant amount of liquid assets, a portion of their assets are relatively illiquid. Unanticipated withdrawal or surrender activity could, under some circumstances, require our reinsurance subsidiaries to dispose of assets on unfavorable terms, which could have an adverse effect on us. Reinsurance agreements may provide for recapture rights on the part of our insurance company customers. Recapture rights permit these customers to reassume all or a portion of the risk formerly ceded to us after an agreed-upon time, usually ten years, subject to various conditions.
Recapture of business previously ceded does not affect premiums ceded prior to the recapture, but may result in immediate payments to our insurance company customers and a charge to income for costs that we deferred when we acquired the business but are unable to recover upon recapture. Under some circumstances, payments to our insurance company customers could require our reinsurance subsidiaries to dispose of assets on unfavorable terms.
Defaults, downgrades or other events impairing the value of our fixed maturity securities portfolio may reduce our earnings.
We are subject to the risk that the issuers, or guarantors, of fixed maturity securities we own may default on principal and interest payments they owe us. Fixed maturity securities represent a substantial portion of our total cash and invested assets.
The occurrence of a major or prolonged economic downturn, acts of corporate malfeasance, widening risk spreads, or other events that adversely affect the issuers or guarantors of these securities could cause the value of our fixed maturity securities portfolio and our net income to decline and the default rate of the fixed maturity securities in our investment portfolio to increase. A ratings downgrade affecting issuers or guarantors of particular securities, or similar trends that could worsen the credit quality of issuers, such as the corporate issuers of securities in our investment portfolio, could also have a similar effect. With economic uncertainty, credit quality of issuers or guarantors could be adversely affected. Any event reducing the value of these securities other than on a temporary basis could have a material adverse effect on our business, financial condition or results of operations.
With respect to unrealized losses, we establish deferred tax assets for the tax benefit we may receive in the event that losses are realized. The realization of significant realized losses could result in an inability to recover the tax benefits and may result in the establishment of valuation allowances against our deferred tax assets. Realized losses or impairments may have a material adverse impact on our results of operations and financial condition.
The defaults or deteriorating credit of other financial institutions could adversely affect us.
We have exposure to many different industries and counterparties, and routinely execute transactions with counterparties in the financial services industry, including brokers and dealers, insurance companies, commercial banks, investment banks, investment funds and other institutions. Many of these transactions expose us to credit risk upon default of our counterparty. In addition, with respect to secured and other transactions that provide for us to hold collateral posted by the counterparty, our credit risk may be exacerbated when the collateral we hold cannot be liquidated at prices sufficient to recover the full amount of our exposure. We also have exposure to these financial institutions in the form of unsecured debt instruments, derivative transactions and equity investments. There can be no assurance that losses or impairments to the carrying value of these assets would not materially and adversely affect our business, financial condition or results of operations.
Defaults on our mortgage loans or the mortgage loans underlying our investments in mortgage-backed securities and volatility in performance of our investments in real-estate related assets may adversely affect our profitability.
A portion of our investment portfolio consists of assets linked to real estate, including mortgage loans on commercial properties, lifetime mortgages, investments in commercial mortgage-backed securities (“CMBS”), and residential mortgage-backed securities (“RMBS”). Delinquency and defaults by third parties in the payment or performance of their obligations underlying these assets could reduce our investment income and realized investment gains or result in the recognition of investment losses. Mortgage loans are stated on our balance sheet at unpaid principal balance, adjusted for any unamortized premium or discount, deferred fees or expenses, and are net of valuation allowances. We establish valuation allowances for estimated impairmentsestablished as of the balance sheet date. Such valuation allowances are based on the excess carrying value of the loan over the present value of expected future cash flows discounted at the loan’s original effective interest rate, the value of the loan’s collateral if the loan is in the process of foreclosure or is otherwise collateral-dependent, or the loan’s market value if the loan is being sold. CMBS and RMBS are stated on our balance sheet at fair value. The performance of our mortgage loan investments and our investments in CMBS and RMBS, however, may fluctuate in the future. An increase in the default rate of our mortgage loan investments or the mortgage loans underlying our investments in CMBS and RMBS could have a material adverse effect on our financial condition or results of operations.
Further, any geographic or sector concentration of our mortgage loans or the mortgage loans underlying our investments in CMBS and RMBS may have adverse effects on our investment portfolios and consequently on our consolidated results of operations or financial condition. While we seek to mitigate this risk by having a broadly diversified portfolio, eventsEvents or developments that have a negative effect on any particular geographic region or sector may have a greater adverse effect on our investment portfolios to the extent that the portfolios are concentrated. Moreover, our ability to sell assets relating to such particular groups of related assets may be limited if other market participants are seeking to sell at the same time.
Our valuation of fixed maturity and equity securities and derivatives include methodologies, estimations and assumptions that are subject to differing interpretations and could result in changes to investment valuations that may have a material adverse effect on our financial condition or results of operations.
Fixed maturity, equity securities and short-term investments, which are primarily reported at fair value on the consolidated balance sheets, represent the majority of our total cash and invested assets. WeAs described in Item 8. “Financial Statements and Supplementary Data – Notes to Consolidated Financial Statements – Note 6 “Fair Value of Assets and Liabilities”, we have categorized these securities into a three-level hierarchy, based on the priority of the inputs to the respective valuation technique. The fair value hierarchy gives the highest priority to quoted prices in active markets for identical assets or liabilities (Level 1) and the lowest priority to unobservable inputs (Level 3). An asset or liability’s classification within the fair value hierarchy is based on the lowest level of significant input to its valuation. For example, a Level 3 fair value measurement may include inputs that are observable (Levels 1 and 2) and unobservable (Level 3). Therefore, gains and losses for such assets and liabilities categorized within Level 3 may include changes in fair value that are attributable to both observable market inputs (Levels 1 and 2) and unobservable market inputs (Level 3).
The determination of fair values in the absence of quoted market prices is based on: (i) valuation methodologies; (ii) securities we deem to be comparable; and (iii) assumptions deemed appropriate based on market conditions specific to the security. The fair value estimates are made at a specific point in time, based on available market information and judgments about assets and liabilities, including estimates of the timing and amounts of expected future cash flows and the credit standing of the issuer or counterparty. Factors considered in estimating fair value include: coupon rate, maturity, estimated duration, call provisions,
sinking fund requirements, credit rating, industry sector of the issuer, and quoted market prices of comparable securities. The use of different methodologies and assumptions may have a material effect on the estimated fair value amounts.
During periods of market disruption, including periods of significantly rising or high interest rates, rapidly widening credit spreads or illiquidity, it may be difficult to value certain of our securities if trading becomes less frequent or market data becomes less observable. There may be certain asset classes that were in active markets with significant observable data that become illiquid due to the financial environment. In such cases, more securities may fall to Level 3 and thus require more subjectivity and management judgment. As such, valuations may include inputs and assumptions that are less observable or require greater estimation as well as valuation methods that are more sophisticated or require greater estimation thereby resulting in values that may be different than the value at which the investments may be ultimately sold. Further, rapidly changing or disruptive credit and equity market conditions could materially impact the valuation of securities as reported within our consolidated financial statements and the period-to-period changes in value could vary significantly. Decreases in value may have a material adverse effect on our financial condition or results of operations.
The reported value of our investments, including our relatively illiquid types of investments, our investments in the asset classes described in the paragraph above and, at times, our high-quality, generally liquid asset classes, do not necessarily reflect the lowest current market price for the asset. If we were forced to sell
certain of our assets in disruptive or volatile market conditions, there can be no assurance that we will be able to sell them for the prices at which we have recorded them and we may be forced to sell them at significantly lower prices.
The determination of the amount of allowances and impairments taken on our investments is highly subjective and could materially affect our financial condition or results of operations.
The determination of the amount of allowances and impairments vary by investment type and is based upon our periodic evaluation and assessment of known and inherent risks associated with the respective asset class. Such evaluations and assessments are revised as conditions change and new information becomes available. Management updates its evaluations regularly and reflects changes in allowances and impairments in operations as such evaluations are revised.
For example, the cost of our fixed maturity securities is adjusted for impairments in value deemed to be other-than-temporaryimpaired in the period in which the determination is made. The assessment of whether impairments have occurred is based on management’s case-by-case evaluation of the underlying reasons for the decline in fair value. Our management considers a wide range of factors about the security issuer and uses their best judgment in evaluating the cause of the decline in the estimated fair value of the security and in assessing the prospects for near-term recovery. Inherent in management’s evaluation of the security are assumptions and estimates about the operations of the issuer and its future earnings potential. There can be no assurance that our management has accurately assessed the level of impairments taken, or allowances reflected in our financial statements and their potential impact on regulatory capital. Furthermore, additional impairments or additional allowances may be needed in the future.
Our investments are reflected within the consolidated financial statements utilizing different accounting bases and accordingly we may not have recognized differences, which may be significant, between cost and fair value in our consolidated financial statements.
Certain of our principal investments are in fixed maturity securities, short-term investments, mortgage loans, policy loans, funds withheld at interest and other invested assets. The carrying value of such investments is as follows:
Fixed maturity securities are classified as available-for-saledescribed in “Investments” in Note 2 – “Significant Accounting Polices and are reported at their estimated fair value. Unrealized investment gains and losses on these securities are recorded as a separate component of accumulated other comprehensive income or loss, net of related deferred acquisition costs and deferred income taxes.
Short-term investments include investments with remaining maturities of one year or less, but greater than three months, atPronouncements” in the time of acquisition and are stated at estimated fair value or amortized cost, which approximates estimated fair value.
Mortgage, policy loans and lifetime mortgages are stated at unpaid principal balance. Additionally, mortgage loans and lifetime mortgages are adjusted for any unamortized premium or discount, deferred fees or expenses, net of valuation allowances.
Funds withheld at interest represent amounts contractually withheld by ceding companies in accordance with reinsurance agreements. The value of the assets withheld and interest income are recorded in accordance with specific treaty terms.
We use the cost method of accounting for investments in real estate joint ventures and other limited partnership interests in which we have a minor equity investment and virtually no influence over the joint ventures or the partnership’s operations. The equity method of accounting is used for investments in real estate joint ventures and other limited partnership interests in which we have significant influence over the operating and financing decisions
but are not requiredNotes to be consolidated. These investments are reflected in other invested assets on the consolidated balance sheets.
Consolidated Financial Statements. Investments not carried at fair value in our consolidated financial statements —– principally, mortgage loans, policy loans, real estate joint ventures and other limited partnerships —– may have fair values that are substantially higher or lower than the carrying value reflected in our consolidated financial statements. Each of such asset classes is regularly evaluated for impairment under the accounting guidance appropriate to the respective asset class.
Uncertainty relating to the LIBOR calculation process and potential phasingPhasing out of LIBORLondon Interbank Offered Rate (“LIBOR”) after 20212023 may adversely affect the value of certain of our LIBOR-based assets and liabilities.
Actions by regulators or law enforcement agencies in the UK and elsewhere may result in changes to the manner in which the London Interbank Offered Rate (“LIBOR”) is determined or the establishment of alternative reference rates. For example, onOn July 27, 2017, the UK Financial Conduct Authority (the “FCA”) announced that it intends to stop persuading or compelling banks to submit London Interbank Offered Rates (“LIBOR”) after December 31, 2021. Subsequently, on March 5, 2021, the FCA announced that all LIBOR ratessettings will either cease to be provided or no longer be representative, with some being discontinued after 2021. At this time, it is not possible to predictDecember 31, 2021 and the effect of any such changes, any establishment of alternative reference rates or any other reforms to LIBOR that may beremaining being discontinued after June 30, 2023. The Adjustable Interest Rate (LIBOR) Act, enacted in the UK or elsewhere. The U.S. Federal Reserve, based on the recommendations of the New York Federal Reserve’s Alternative Reference Rate Committee (constituted of major derivative market participants and their regulators), began publishingMarch 2022, provides a Secured Overnight Funding Rate (SOFR) in April 2018 which is intendedframework to replace U.S. dollar LIBOR. PlansLIBOR with a benchmark rate based on the Secured Overnight Financing Rate (“SOFR”) for alternative reference rates for other currenciescontracts governed by U.S. law that have also been announced. At this time, it is not possibleno or ineffective fallbacks, and in December 2022, the Federal Reserve Board adopted related implementing rules. Although governmental authorities have endeavored to predict how markets will respond to these new rates, and the effect of any changes or reforms to LIBOR orfacilitate an orderly discontinuation of LIBOR, on new or existing financial instruments to which we have exposure. If LIBOR ceases to exist or if the methods of calculating LIBOR change from current methods for any reason, interest rates on our LIBOR-based and other floating-rate assets and liabilities may be adversely affected. Further, any uncertainty regarding the continued use and reliability ofreplacements for LIBOR as a benchmark interest rate could adversely affect the trading market for and value of LIBOR-based and other floating-rate securities, including certain of our LIBOR-based assets and liabilities. More generally, any of the above changes or any other consequential changes to LIBOR or any other “benchmark” as a result of international, national or other proposals for reform or other initiatives or investigations, or any further uncertainty in relation to the timing and manner of implementation of such changes, could have a material adverse effect on the value of and return on any securities based on or linked to a “benchmark,” such as certain of our LIBOR-based assets and liabilities. We aredo not able to predict what the impact ofanticipate such changes may beto have a material impact on our cash flows, financial condition and resultsresult of operations.
Risks Related to Ownership of Our Common Stock
We may not pay dividends on our common stock.
Our shareholders may not receive future dividends. Historically, we have paid quarterly dividends ranging from $0.027 per share in 1993 to $0.70 per share in 2019. All future payments of dividends however, are at the discretion of our board of directors and will depend on our earnings, capital requirements, insurance regulatory conditions, operating conditions and such other factors as our board of directors may deem relevant. The amount of dividends that we can pay will depend in part on the operations of our reinsurance subsidiaries. Under certain circumstances, we may be contractually prohibited from paying dividends on our common stock due to restrictions associated with certain of our debt securities.
Certain provisions in our articles of incorporation and bylaws, and in Missouri law and in applicable insurance laws, may delay or prevent a change in control, which could adversely affect the price of our common stock.
Certain provisions in our articles of incorporation and bylaws, as well as Missouri corporate law and state insurance laws, may delay or prevent a change of control of RGA, which could adversely affect the price of our common stock. Our articles of incorporation and bylaws contain some provisions that may make the acquisition of control of RGA without the approval of our board of directors more difficult, including provisions relating to the nomination, election and removal of directors and limitations on actions by our shareholders. In addition, Missouri law also imposes some restrictions on mergers
and other business combinations between RGA and holders of 20% or more of our outstanding common stock.
These provisions may have unintended anti-takeover effects, including to delay or prevent a change in control of RGA, which could adversely affect the price of our common stock.
Applicable insurance laws may make it difficult to effect a change of control of RGA.
Before a person can acquire control of a U.S. insurance company, prior written approval must be obtained from the insurance commission of the state where the domestic insurer is domiciled. Missouri insurance laws and regulations as well as the insurance laws and regulations of Arizona and California provide that no person may acquire control of us, and thus indirect control of our U.S. domiciled reinsurance subsidiaries, including RGA Reinsurance and Aurora National, unless:
such person has provided certain required information to the domiciliary state insurance department; and
such acquisition is approved by the domestic state Director of Insurance, to whom we refer as the Director of Insurance, after a public hearing.
Under U.S. state insurance laws and regulations, any person acquiring 10% or more of the outstanding voting securities of a corporation, such as our common stock, is presumed to have acquired control of that corporation and its subsidiaries.
Canadian federal insurance laws and regulations provide that no person may directly or indirectly acquire “control” of or a “significant interest” in our Canadian insurance subsidiary, RGA Canada, unless:
such person has provided information, material and evidence to the Canadian Superintendent of Financial Institutions as required by him; and
such acquisition is approved by the Canadian Minister of Finance.
For this purpose, “significant interest” means the direct or indirect beneficial ownership by a person, or group of persons acting in concert, of shares representing 10% or more of a given class, and “control” of an insurance company exists when:
a person, or group of persons acting in concert, beneficially owns or controls an entity that beneficially owns securities, such as our common stock, representing more than 50% of the votes entitled to be cast for the election of directors and such votes are sufficient to elect a majority of the directors of the insurance company, or
a person has any direct or indirect influence that would result in control in fact of an insurance company.
Similar laws in other countries where we operate limit our ability to effect changes of control for subsidiaries organized in such jurisdictions without the approval of local insurance regulatory officials. Prior to granting approval of an application to directly or indirectly acquire control of a domestic or foreign insurer, an insurance regulator in any jurisdiction may consider such factors as the financial strength of the applicant, the integrity of the applicant’s board of directors and executive officers, the applicant’s plans for the future operations of the domestic insurer and any anti-competitive results that may arise from the consummation of the acquisition of control.
Issuing additional shares may dilute the value or affect the price of our common stock.
Our board of directors has the authority, without action or vote of the shareholders, to issue any or all authorized but unissued shares of our common stock, including securities convertible into, or exchangeable for, our common stock and authorized but unissued shares under our equity compensation plans. In the future, we may issue such additional securities, through public or private offerings, in order to raise additional capital. Any such issuance will dilute the percentage ownership of shareholders and may dilute the per share projected earnings or book value of our common stock. In addition, option holders may exercise their options at any time when we would otherwise be able to obtain additional equity capital on more favorable terms.
The price of our common stock may fluctuate significantly.
The overall market and the price of our common stock may continue to fluctuate as a result of many factors in addition to those discussed in the preceding risk factors. These factors, some or all of which are beyond our control, include:
actual or anticipated fluctuations in our operating results;
changes in expectations as to our future financial performance or changes in financial estimates of securities analysts;
success of our operating and growth strategies;
investor anticipation of strategic and technological threats, whether or not warranted by actual events;
operating and stock price performance of other comparable companies; and
realization of any of the risks described in these risk factors or those set forth in any subsequent Annual Report on Form 10-K or Quarterly Reports on Form 10-Q.
In addition, the stock market has historically experienced volatility that often has been unrelated or disproportionate to the operating performance of particular companies. These broad market and industry fluctuations may adversely affect the trading price of our common stock, regardless of our actual operating performance.
The occurrence of various events may adversely affect the ability of RGA and its subsidiaries to fully utilize any net operating losses (“NOL”s)NOLs”) and other tax attributes.
RGA and its subsidiaries may, from time to time, have a substantial amount of NOLs and other tax attributes, for U.S. federal income tax purposes, to offset taxable income and gains. If a corporation experiences an ownership change, it is generally subject to an annual limitation, which limits its ability to use its NOLs and other tax attributes. Events outside of our control may cause RGA (and, consequently, its subsidiaries) to experience an “ownership change” under Sections 382 and 383 of the Internal Revenue Code and the related Treasury regulations, and limit the ability of RGA and its subsidiaries to utilize fully such NOLs and other tax attributes. If we were to experience an ownership change, we could potentially have higher U.S. federal
income tax liabilities than we would otherwise have had, which would negatively impact our financial condition and results of operations.
Item 1B. UNRESOLVED STAFF COMMENTS
The Company has no unresolved staff comments from the Securities and Exchange Commission.
Item 2. PROPERTIES
The Company’s corporate headquarters is located at an owned site in Chesterfield, Missouri. In addition, the Company leases office space in 5149 locations throughout the world. Most of the Company’s leases have terms of three to five years; while some leases have longer terms, none exceed 15 years.
The Company believes that its existing facilities, including both owned and leased, are in good operating condition and suitable for the conduct of its business.
Item 3. LEGAL PROCEEDINGS
The Company is subject to litigation in the normal course of its business. The Company currently has no material litigation. A legal reserve is established when the Company is notified of an arbitration demand or litigation or is notified that an arbitration demand or litigation is imminent, it is probable that the Company will incur a loss as a result and the amount of the probable loss is reasonably capable of being estimated.
Item 4. MINE SAFETY DISCLOSURES
Not applicable.
PART II
Item 5. MARKET FOR REGISTRANT’S COMMON EQUITY, RELATED STOCKHOLDER MATTERS, AND ISSUER PURCHASES OF EQUITY SECURITIES
Insurance companies are subject to statutory regulations that restrict the payment of dividends. See Item 1 under the caption Regulation – “Restrictions on Dividends and Distributions”.Distributions.” See Item 8, Note 17 – “Equity” in the Notes to Consolidated Financial Statements for information regarding board-approved stock repurchase plans. See Item 12 for information about the Company’s compensation plans.
Reinsurance Group of America, Incorporated common stock is traded on the New York Stock Exchange (NYSE) under the symbol “RGA”. On January 31, 2020,2023, there were 24,20121,353 stockholders of record of RGA’s common stock and 6367 million shares outstanding.
Issuer Purchases of Equity Securities
The following table summarizes RGA’s repurchase activity of its common stock during the quarter ended December 31, 2019:2022:
| | | | | | | | | | | | | | | | | | | | | | | | | | |
| | Total Number of Shares
Purchased (1) | | Average Price Paid per
Share | | Total Number of Shares
Purchased as Part of
Publicly Announced Plans
or Programs | | Maximum Number (or
Approximate Dollar
Value) of Shares that May
Yet Be Purchased Under
the Plan or Program |
| October 1, 2022 – October 31, 2022 | | 5,617 | | | $ | 140.43 | | | — | | | $ | 375,000,364 | |
| November 1, 2022 – November 30, 2022 | | 189,660 | | | $ | 135.35 | | | 184,904 | | | $ | 350,001,793 | |
| December 1, 2022 – December 31, 2022 | | 8,295 | | | $ | 142.20 | | | — | | | $ | 350,001,793 | |
|
| | | | | | | | | | | | | | |
| | | Total Number of Shares Purchased (1) | | Average Price Paid per Share | | Total Number of Shares Purchased as Part of Publicly Announced Plans or Programs | | Maximum Number (or Approximate Dollar Value) of Shares that May Yet Be Purchased Under the Plan or Program |
October 1, 2019 -
October 31, 2019 | | 823 |
| | $ | 161.41 |
| | — |
| | $ | 320,195,966 |
|
November 1, 2019 -
November 30, 2019 | | 13,094 |
| | $ | 166.14 |
| | — |
| | $ | 320,195,966 |
|
December 1, 2019 -
December 31, 2019 | | 1,234 |
| | $ | 166.70 |
| | — |
| | $ | 320,195,966 |
|
| |
(1) | RGA had no repurchases of common stock under its share repurchase program for October, November and December 2019. The Company net settled - issuing 2,478, 31,636 and 2,771 shares from treasury and repurchased from recipients 823, 13,094 and 1,234 shares in October, November and December 2019, respectively, in settlement of income tax withholding requirements incurred by the recipients of equity incentive awards. |
On January 24, 2019, RGA’s board of directors authorized a share repurchase program for up to $400 million of RGA’s outstanding common stock. During the year ended December 31, 2022, the Company repurchased 219,116 shares of common stock under this program for $25 million.
Comparison of 5-Year Cumulative Total Return
The graph below shows the performance of the Company’s common stock for the period beginning December 31, 20142017, and ending December 31, 2019,2022, assuming $100 was invested on December 31, 2014.2017. The graph compares the cumulative total return on the Company’s common stock, based on the market price of the common stock and assuming reinvestment of dividends, with the cumulative total return of companies in the Standard & Poor’s (“S&P”) 500 Stock Index and the S&P’s Insurance (Life/Health) Index. The indices are included for comparative purposes only. They do not necessarily reflect management’s opinion that such indices are an appropriate measure of the relative performance of the Company’s common stock and are not intended to forecast or be indicative of future performance of the common stock.
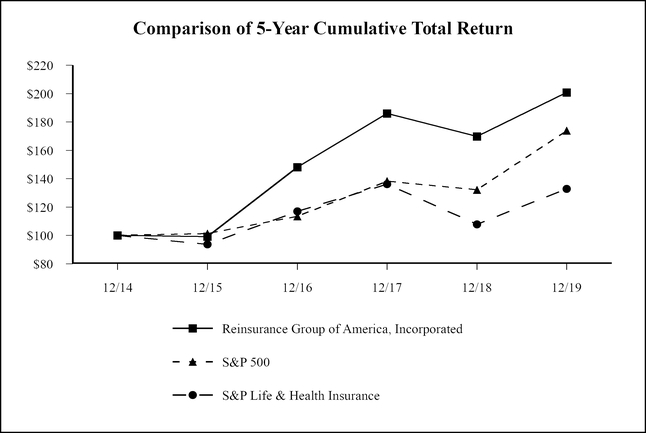
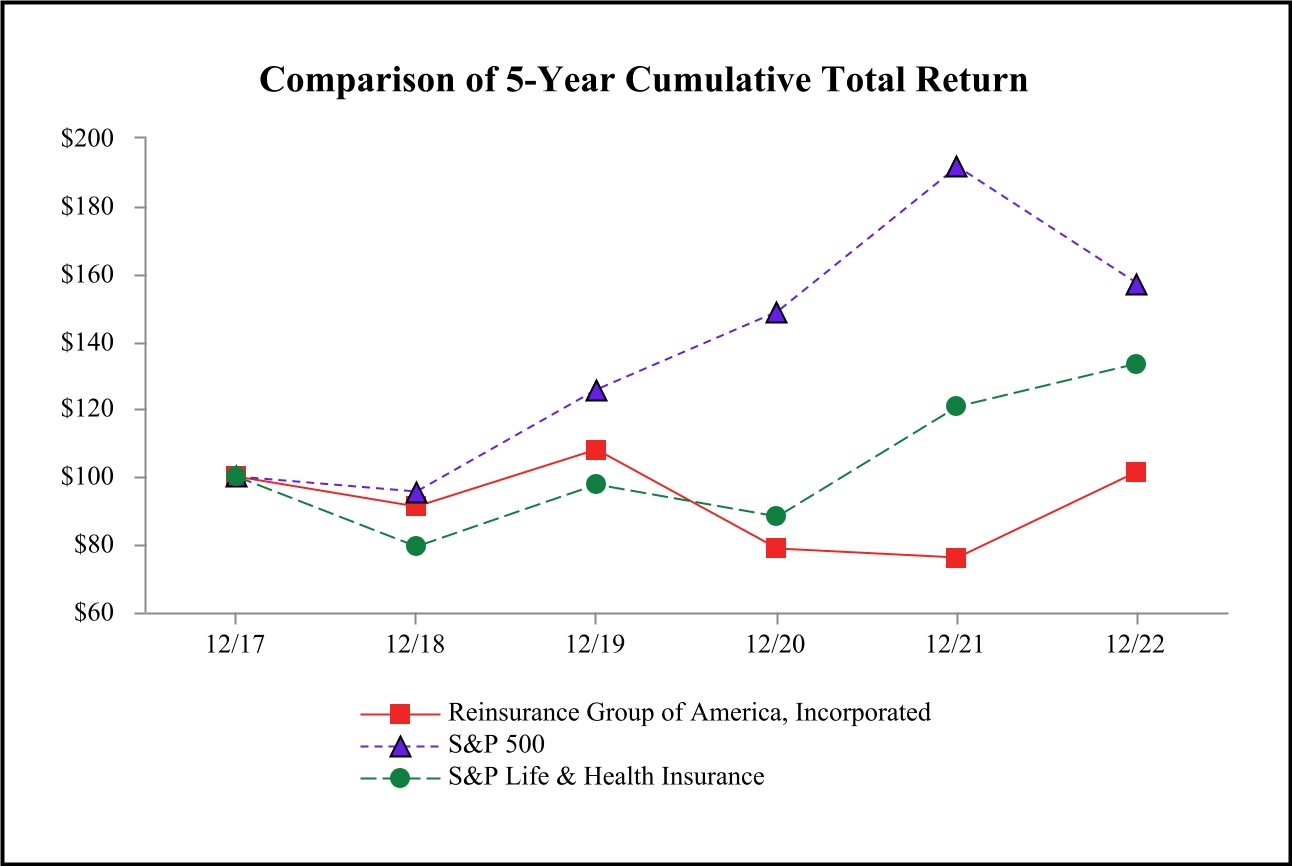
| | | | | | | | | | | | | | | | | | | | | | | | | | | | | | | | | | | | | | |
| | | Base Period | | Cumulative Total Return |
| | | 12/17 | | 12/18 | | 12/19 | | 12/20 | | 12/21 | | 12/22 |
| Reinsurance Group of America, Incorporated | | $ | 100.00 | | | $ | 91.28 | | | $ | 107.98 | | | $ | 78.76 | | | $ | 76.21 | | | $ | 101.38 | |
| S&P 500 | | 100.00 | | | 95.62 | | | 125.72 | | | 148.85 | | | 191.58 | | | 156.88 | |
| S&P Life & Health Insurance | | 100.00 | | | 79.23 | | | 97.60 | | | 88.35 | | | 120.76 | | | 133.25 | |
|
| | | | | | | | | | | | | | | | | | | | | | | | |
| | | Base Period | | Cumulative Total Return |
| | | 12/14 | | 12/15 | | 12/16 | | 12/17 | | 12/18 | | 12/19 |
| Reinsurance Group of America, Incorporated | | $ | 100.00 |
| | $ | 99.13 |
| | $ | 148.17 |
| | $ | 186.07 |
| | $ | 169.85 |
| | $ | 200.92 |
|
| S & P 500 | | 100.00 |
| | 101.38 |
| | 113.51 |
| | 138.29 |
| | 132.23 |
| | 173.86 |
|
| S & P Life & Health Insurance | | 100.00 |
| | 93.69 |
| | 116.98 |
| | 136.20 |
| | 107.91 |
| | 132.92 |
|
Item 6. SELECTED FINANCIAL DATA(RESERVED)
The following selected financial data has been derived from the Company’s audited consolidated financial statements. The consolidated statement of income data for the years ended December 31, 2019, 2018 and 2017, and the consolidated balance sheet data at December 31, 2019 and 2018 have been derived from the Company’s audited consolidated financial statements included elsewhere herein. The consolidated statement of income data for the years ended December 31, 2016 and 2015, and the consolidated balance sheet data at December 31, 2017, 2016 and 2015 have been derived from the Company’s audited consolidated financial statements not included herein. The selected financial data shown below should be read in conjunction with “Management’s Discussion and Analysis of Financial Condition and Results of Operations” and the consolidated financial statements and related notes included elsewhere herein.
Selected Consolidated Financial and Operating Data
(in millions, except per share and operating data)
|
| | | | | | | | | | | | | | | | | | | | |
| | | As of or For the Years Ended December 31, |
| Income Statement Data | | 2019 | | 2018 | | 2017 | | 2016 | | 2015 |
| Revenues: | | | | | | | | | | |
| Net premiums | | $ | 11,297 |
| | $ | 10,544 |
| | $ | 9,841 |
| | $ | 9,249 |
| | $ | 8,571 |
|
| Investment income, net of related expenses | | 2,520 |
| | 2,139 |
| | 2,155 |
| | 1,912 |
| | 1,734 |
|
| Investment related gains (losses), net: | | | | | | | | | | |
| Other-than-temporary impairments on fixed maturity securities | | (31 | ) | | (28 | ) | | (43 | ) | | (39 | ) | | (57 | ) |
| Other investment related gains (losses), net | | 122 |
| | (142 | ) | | 211 |
| | 133 |
| | (108 | ) |
| Total investment related gains (losses), net | | 91 |
| | (170 | ) | | 168 |
| | 94 |
| | (165 | ) |
| Other revenues | | 392 |
| | 363 |
| | 352 |
| | 267 |
| | 278 |
|
| Total revenues | | 14,300 |
| | 12,876 |
| | 12,516 |
| | 11,522 |
| | 10,418 |
|
| Benefits and expenses: | | | | | | | | | | |
| Claims and other policy benefits | | 10,197 |
| | 9,319 |
| | 8,519 |
| | 7,993 |
| | 7,489 |
|
| Interest credited | | 697 |
| | 425 |
| | 502 |
| | 365 |
| | 337 |
|
| Policy acquisition costs and other insurance expenses | | 1,204 |
| | 1,323 |
| | 1,467 |
| | 1,311 |
| | 1,127 |
|
| Other operating expenses | | 868 |
| | 786 |
| | 710 |
| | 645 |
| | 554 |
|
| Interest expense | | 173 |
| | 147 |
| | 146 |
| | 138 |
| | 143 |
|
| Collateral finance and securitization expense | | 29 |
| | 30 |
| | 29 |
| | 26 |
| | 23 |
|
| Total benefits and expenses | | 13,168 |
| | 12,030 |
| | 11,373 |
| | 10,478 |
| | 9,673 |
|
| Income before income taxes | | 1,132 |
| | 846 |
| | 1,143 |
| | 1,044 |
| | 745 |
|
Provision for income taxes(1) | | 262 |
| | 130 |
| | (679 | ) | | 343 |
| | 243 |
|
| Net income | | $ | 870 |
| | $ | 716 |
| | $ | 1,822 |
| | $ | 701 |
| | $ | 502 |
|
| Earnings Per Share | | | | | | | | | | |
| Basic earnings per share | | $ | 13.88 |
| | $ | 11.25 |
| | $ | 28.28 |
| | $ | 10.91 |
| | $ | 7.55 |
|
| Diluted earnings per share | | 13.62 |
| | 11.00 |
| | 27.71 |
| | 10.79 |
| | 7.46 |
|
| Weighted average diluted shares, in thousands | | 63,882 |
| | 65,094 |
| | 65,753 |
| | 64,989 |
| | 67,292 |
|
| Dividends per share on common stock | | $ | 2.60 |
| | $ | 2.20 |
| | $ | 1.82 |
| | $ | 1.56 |
| | $ | 1.40 |
|
| Balance Sheet Data | | | | | | | | | | |
| Total investments | | $ | 66,555 |
| | $ | 54,204 |
| | $ | 51,691 |
| | $ | 44,841 |
| | $ | 41,978 |
|
| Total assets | | 76,731 |
| | 64,535 |
| | 60,515 |
| | 53,098 |
| | 50,383 |
|
Policy liabilities(2) | | 57,094 |
| | 48,933 |
| | 43,583 |
| | 37,874 |
| | 37,371 |
|
| Long-term debt | | 2,981 |
| | 2,788 |
| | 2,788 |
| | 3,089 |
| | 2,298 |
|
| Collateral finance and securitization notes | | 598 |
| | 682 |
| | 784 |
| | 841 |
| | 899 |
|
| Total stockholders’ equity | | 11,601 |
| | 8,450 |
| | 9,570 |
| | 7,093 |
| | 6,135 |
|
| Total stockholders’ equity per share | | 185.17 |
| | 134.53 |
| | 148.48 |
| | 110.31 |
| | 94.09 |
|
| Operating Data (in billions) | | | | | | | | | | |
| Assumed ordinary life reinsurance in force | | $ | 3,480 |
| | $ | 3,329 |
| | $ | 3,297 |
| | $ | 3,063 |
| | $ | 2,995 |
|
| Assumed new business production | | 377 |
| | 407 |
| | 395 |
| | 405 |
| | 491 |
|
| |
(1) | 2017 reflects adjustments related to the initial adoption of U.S. Tax Reform. See Note 9 - “Income Tax” in the Notes to Consolidated Financial Statements for additional information. |
| |
(2) | Policy liabilities include future policy benefits, interest-sensitive contract liabilities, and other policy claims and benefits. |
Item 7. MANAGEMENT’S DISCUSSION AND ANALYSIS OF FINANCIAL CONDITION AND RESULTS OF OPERATIONS
Index to Management’s Discussion and Analysis of Financial Condition and Results of Operations
Cautionary Note Regarding Forward-Looking Statements
This reportdocument contains forward-looking statements within the meaning of the Private Securities Litigation Reform Act of 1995 and federal securities laws including, among others, statements relating to projections of the future operations, strategies, earnings, revenues, income or loss, ratios, financial performance and growth potential of the Company. Forward-looking statements often contain words and phrases such as “intend,“anticipate,” “assume,” “believe,” “continue,” “could,” “estimate,” “expect,” “project,“if,” “estimate,“intend,” “predict,“likely,” “anticipate,“may,” “plan,” “potential,” “pro forma,” “project,” “should,” “believe”“will,” “would,” and other words and terms of similar expressions.meaning or that are otherwise tied to future periods or future performance, in each case in all derivative forms. Forward-looking statements are based on management’s current expectations and beliefs concerning future developments and their potential effects on the Company. Forward-looking statements are not a guarantee of future performance and are subject to risks and uncertainties, some of which cannot be predicted or quantified. Future events and actual results, performance, and achievements could differ materially from those set forth in, contemplated by or underlying the forward-looking statements.
Numerous important factorsFactors that could also cause actual results andor events to differ, possibly materially, from those expressed or implied by forward-looking statements, including, without limitation:include, among others: (1) adverse changes in mortality (whether related to COVID-19 or otherwise), morbidity, lapsation or claims experience, (2) inadequate risk analysis and underwriting, (3) adverse capital and credit market conditions and their impact on the Company’s liquidity, access to capital and cost of capital, (4) changes in the Company’s financial strength and credit ratings and the effect of such changes on the Company’s future results of operations and financial condition, (5) the availability and cost of collateral necessary for regulatory reserves and capital, (6) requirements to post collateral or make payments due to declines in the market value of assets subject to the Company’s collateral arrangements, (7) action by regulators who have authority over the Company’s reinsurance operations in the jurisdictions in which it operates, (8) the effect of the Company parent’s status as an insurance holding company and regulatory restrictions on its ability to pay principal of and interest on its debt obligations, (9) general economic conditions or a prolonged economic downturn affecting the demand for insurance and reinsurance in the Company’s current and planned markets, (10) the impairment of other financial institutions and its effect on the Company’s business, (11) fluctuations in U.S. or foreign currency exchange rates, interest rates, or securities and real estate markets, (12) market or economic conditions that adversely affect the value of the Company’s investment securities or result in the impairment of all or a portion of the value of certain of the Company’s investment securities that in turn could affect regulatory capital, (13) market or economic conditions that adversely affect the Company’s ability to make timely sales of investment securities, (14) risks inherent in the Company’s risk management and investment strategy, including changes in investment portfolio yields due to interest rate or credit quality changes, (15) the fact that the determination of allowances and impairments taken on the Company’s investments is highly subjective, (16) the stability of and actions by governments and economies in the markets in which the Company operates, including ongoing uncertainties regarding the amount of U.S. sovereign debt and the credit ratings thereof, (17) the Company’s dependence on third parties, including those insurance companies and reinsurers to which the Company cedes some reinsurance, third-party investment managers and others, (18) financial performance of the Company’s clients, (19) the threat of natural disasters, catastrophes, terrorist attacks, pandemics, epidemics or pandemicsother major public health issues anywhere in the world where the Company or its clients do business, (20) competitive factors and competitors’ responses to the Company’s initiatives, (21) development and introduction of new products and distribution opportunities, (22) execution of the Company’s entry into new markets, (23) integration of acquired blocks of business and entities, (24) interruption or failure of the Company’s telecommunication, information technology or other operational systems, or the Company’s failure to maintain adequate security to protect the confidentiality or privacy of personal or sensitive data and intellectual property stored on such systems, (25) adverse developments with respect to litigation, arbitration or arbitration results,regulatory investigations or actions (26) the adequacy of reserves, resources and accurate information relating to settlements, awards and terminated and discontinued lines of business, (27) changes in laws, regulations, and accounting standards applicable to the Company or its business, (28) the effects of the Tax Cutsincluding Long Duration Targeted Improvement accounting changes and Jobs Act of 2017 may be different than expected and (29)(28) other risks and uncertainties described in this document and in the Company’s other filings with the Securities and Exchange Commission (“SEC”).
Forward-looking statements should be evaluated together with the many risks and uncertainties that affect the Company’s business, including those mentioned in this document and described in the periodic reports the Company files with the SEC. These forward-looking statements speak only as of the date on which they are made. The Company does not undertake any obligation to update these forward-looking statements, even though the Company’s situation may change in the future.future, except as required under applicable securities law. For a discussion of these risks and uncertainties that could cause actual results to differ materially from those contained in the forward-looking statements, you are advised to see Item 1A – “Risk Factors”. in this Annual Report on Form 10-K, as may be supplemented by Item 1A – “Risk Factors” in the Company’s subsequent Quarterly Reports on Form 10-Q and in our other periodic and current reports filed with the SEC.
Overview
The Company is among the leading global providers of life reinsurance and financial solutions, with $3.5$3.4 trillion of life reinsurance in force and assets of $76.7$84.7 billion as of December 31, 2019.2022. Traditional reinsurance includes individual and group life and health, disability, and critical illness reinsurance. Financial solutions includes longevity reinsurance, asset-intensive reinsurance, capital solutions, including financial reinsurance and stable value products. The Company derives revenues primarily from renewal premiums from existing reinsurance treaties, new business premiums from existing or new reinsurance treaties, fee income from financial solutions business and income earned on invested assets.
The Company’s underwriting expertise and industry knowledge has allowed it to expand into international markets and now has operations in over 25 countriesaround the world including locations in Canada, the Asia Pacific region, Europe, the Middle East, Africa and Latin America. The Company generally starts operations from the ground up in new markets as opposed to acquiring existing
operations, and it often enters new markets to support its clients as they expand internationally. Based on the compilation of information from competitors’ annual reports, the Company believes it is the second-largest global life and health reinsurer in the world based on 20182021 life and health reinsurance revenues. The Company conducts business with the majority of the largest U.S. and international life insurance companies. The Company has also developed its capacity and expertise in the reinsurance of longevity risks, asset-intensive products (primarily annuities and corporate-owned life insurance) and financial reinsurance. More recently, the Company has increased its investment and expenditures in client service and technology orientedtechnology-oriented initiatives to both support its clients and generate new future revenue streams.
Historically, theThe Company’s primary business has been traditional life reinsurance whichbusiness, involves reinsuring life insurance policies that are often in force for the remaining lifetime of the underlying individuals insured, with premiums earned typically over a period of 10 to 30 years or longer. To a lesser extent, the Company also reinsures certain health business typically reinsured for a shorter duration. Each year, however, a portion of the business under existing treaties terminates due to, among other things, lapses or voluntary surrenders of underlying policies, deaths of insureds,the insured, and the exercise of recapture options by ceding companies. The Company has expanded itsCompany’s financial solutions business, including significant asset-intensive and longevity risk transactions, which allow its clients to take advantage of growth opportunities and manage their capital, longevity and investment risk.
The Company’s long-term profitability largely depends on the volume and amount of death- and health-related claims incurred and the ability to adequately price the risks it assumes. While death claims are reasonably predictable over a period of many years, claims becomeare less predictable over shorter periods and are subject to significant fluctuation from quarter to quarter and year to year. For longevity business, the Company’s profitability depends on the lifespan of the underlying contract holders and the investment performance for certain contracts. Additionally, the Company generates profits on investment spreads associated with the reinsurance of investment type contracts and generates fees from financial reinsurance transactions, which are typically shorter duration than its traditional life reinsurance business. The Company believes its sources of liquidity are sufficient to cover potential claims payments on both a short-term and long-term basis.
Segment Presentation
The Company has geographic-based and business-based operational segments. Geographic-based operations are further segmented into traditional and financial solutions businesses. See “Business – Segments” in Item 1 for more information.
The Company allocates capital to its segments based on an internally developed economic capital model, the purpose of which is to measure the risk in the business and to provide a consistent basis upon which capital is deployed. The economic capital model considers the unique and specific nature of the risks inherent in RGA’s businesses. As a result of the economic capital allocation process, a portion of investment income is credited to the segments based on the level of allocated capital. In addition, the segments are charged for excess capital utilized above the allocated economic capital basis. This charge is included in policy acquisition costs and other insurance expenses. Segment investment performance varies with the composition of investments and the relative allocation of capital to the operating segments.
Segment revenue levels can be significantly influenced by currency fluctuations, large transactions, mix of business and reporting practices of ceding companies, and therefore may fluctuate from period to period. Although reasonably predictable over a period of years, segment claims experience can be volatile over shorter periods.
The following table sets forth the Company’s premiums attributable to each of its segments for the periods indicated on both a gross assumed basis and net of premiums ceded to third parties:
Gross and Net Premiums by Segment
(in millions)
| | | | | | | | | | | | | | | | | | | | | | | | | | | | | | | | | | | | | | |
| | | Year Ended December 31, |
| | | 2022 | | 2021 | | 2020 |
| | | Gross | | Net | | Gross | | Net | | Gross | | Net |
| | | | | | | | | | | | |
| U.S. and Latin America: | | | | | | | | | | | | |
| Traditional | | $ | 7,011 | | | $ | 6,590 | | | $ | 6,716 | | | $ | 6,244 | | | $ | 6,423 | | | $ | 5,838 | |
| Financial Solutions | | 66 | | | 66 | | | 55 | | | 55 | | | 53 | | | 53 | |
| Total U.S. and Latin America | | 7,077 | | | 6,656 | | | 6,771 | | | 6,299 | | | 6,476 | | | 5,891 | |
| | | | | | | | | | | | |
| Canada: | | | | | | | | | | | | |
| Traditional | | 1,282 | | | 1,219 | | | 1,244 | | | 1,194 | | | 1,106 | | | 1,052 | |
| Financial Solutions | | 95 | | | 95 | | | 90 | | | 90 | | | 83 | | | 83 | |
| Total Canada | | 1,377 | | | 1,314 | | | 1,334 | | | 1,284 | | | 1,189 | | | 1,135 | |
| | | | | | | | | | | | |
| Europe, Middle East and Africa: | | | | | | | | | | | | |
| Traditional | | 1,768 | | | 1,736 | | | 1,770 | | | 1,738 | | | 1,579 | | | 1,555 | |
| Financial Solutions | | 623 | | | 486 | | | 552 | | | 350 | | | 430 | | | 252 | |
| Total Europe, Middle East and Africa | | 2,391 | | | 2,222 | | | 2,322 | | | 2,088 | | | 2,009 | | | 1,807 | |
| | | | | | | | | | | | |
| Asia Pacific: | | | | | | | | | | | | |
| Traditional | | 2,767 | | | 2,650 | | | 2,736 | | | 2,624 | | | 2,787 | | | 2,681 | |
| Financial Solutions | | 236 | | | 236 | | | 218 | | | 218 | | | 180 | | | 180 | |
| Total Asia Pacific | | 3,003 | | | 2,886 | | | 2,954 | | | 2,842 | | | 2,967 | | | 2,861 | |
| | | | | | | | | | | | |
| Corporate and Other | | — | | | — | | | — | | | — | | | — | | | — | |
| Total | | $ | 13,848 | | | $ | 13,078 | | | $ | 13,381 | | | $ | 12,513 | | | $ | 12,641 | | | $ | 11,694 | |
|
| | | | | | | | | | | | | | | | | | | | | | | | |
| | | Year Ended December 31, |
| | | 2019 | | 2018 | | 2017 |
| | | Gross | | Net | | Gross | | Net | | Gross | | Net |
| | | | | | | | | | | | | |
| U.S. and Latin America: | | | | | | | | | | | | |
| Traditional | | $ | 6,320 |
| | $ | 5,729 |
| | $ | 6,127 |
| | $ | 5,534 |
| | $ | 5,967 |
| | $ | 5,356 |
|
| Financial Solutions | | 39 |
| | 39 |
| | 27 |
| | 27 |
| | 24 |
| | 24 |
|
| Total U.S. and Latin America | | 6,359 |
| | 5,768 |
| | 6,154 |
| | 5,561 |
| | 5,991 |
| | 5,380 |
|
| | | | | | | | | | | | | |
| Canada: | | | | | | | | | | | | |
| Traditional | | 1,332 |
| | 1,066 |
| | 1,071 |
| | 1,024 |
| | 940 |
| | 902 |
|
| Financial Solutions | | 89 |
| | 89 |
| | 43 |
| | 43 |
| | 38 |
| | 38 |
|
| Total Canada | | 1,421 |
| | 1,155 |
| | 1,114 |
| | 1,067 |
| | 978 |
| | 940 |
|
| | | | | | | | | | | | | |
| Europe, Middle East and Africa: | | | | | | | | | | | | |
| Traditional | | 1,494 |
| | 1,442 |
| | 1,449 |
| | 1,424 |
| | 1,337 |
| | 1,301 |
|
| Financial Solutions | | 366 |
| | 218 |
| | 339 |
| | 195 |
| | 289 |
| | 164 |
|
| Total Europe, Middle East and Africa | | 1,860 |
| | 1,660 |
| | 1,788 |
| | 1,619 |
| | 1,626 |
| | 1,465 |
|
| | | | | | | | | | | | | |
| Asia Pacific: | | | | | | | | | | | | |
| Traditional | | 2,652 |
| | 2,568 |
| | 2,346 |
| | 2,296 |
| | 2,108 |
| | 2,053 |
|
| Financial Solutions | | 146 |
| | 146 |
| | 1 |
| | 1 |
| | 2 |
| | 3 |
|
| Total Asia Pacific | | 2,798 |
| | 2,714 |
| | 2,347 |
| | 2,297 |
| | 2,110 |
| | 2,056 |
|
| | | | | | | | | | | | | |
| Corporate and Other | | — |
| | — |
| | — |
| | — |
| | — |
| | — |
|
| Total | | $ | 12,438 |
| | $ | 11,297 |
| | $ | 11,403 |
| | $ | 10,544 |
| | $ | 10,705 |
| | $ | 9,841 |
|
The following table sets forth selected information concerning assumed life reinsurance business in force and assumed new business volume by segment for the periods indicated. The terms “in force” and “new business” refer to insurance policy face amounts or net amounts at risk.
Reinsurance Business In Force and New Business by Segment
(in billions)
| | | | | | | | | | | | | | | | | | | | | | | | | | | | | | | | | | | | | | |
| | | As of December 31, |
| | | 2022 | | 2021 | | 2020 |
| | | In Force | | New Business | | In Force | | New Business | | In Force | | New Business |
| U.S. and Latin America: | | | | | | | | | | | | |
| Traditional | | $ | 1,672.2 | | | $ | 145.9 | | | $ | 1,628.4 | | | $ | 130.5 | | | $ | 1,611.6 | | | $ | 114.9 | |
| Financial Solutions | | 5.2 | | | — | | | 5.3 | | | — | | | 5.3 | | | — | |
| Total U.S. and Latin America | | 1,677.4 | | | 145.9 | | | 1,633.7 | | | 130.5 | | | 1,616.9 | | | 114.9 | |
| | | | | | | | | | | | |
| Canada: | | | | | | | | | | | | |
| Traditional | | 463.6 | | | 48.2 | | | 472.6 | | | 48.8 | | | 445.2 | | | 40.8 | |
| Financial Solutions | | — | | | — | | | — | | | — | | | — | | | — | |
| Total Canada | | 463.6 | | | 48.2 | | | 472.6 | | | 48.8 | | | 445.2 | | | 40.8 | |
| | | | | | | | | | | | |
| Europe, Middle East and Africa: | | | | | | | | | | | | |
| Traditional | | 735.4 | | | 169.4 | | | 861.6 | | | 198.4 | | | 864.4 | | | 184.3 | |
| Financial Solutions | | — | | | — | | | — | | | — | | | — | | | — | |
| Total Europe, Middle East and Africa | | 735.4 | | | 169.4 | | | 861.6 | | | 198.4 | | | 864.4 | | | 184.3 | |
| | | | | | | | | | | | |
| Asia Pacific: | | | | | | | | | | | | |
| Traditional | | 518.6 | | | 45.3 | | | 497.4 | | | 34.2 | | | 553.7 | | | 49.6 | |
| Financial Solutions | | 5.7 | | | 0.1 | | | 1.7 | | | 0.2 | | | 0.5 | | | — | |
| Total Asia Pacific | | 524.3 | | | 45.4 | | | 499.1 | | | 34.4 | | | 554.2 | | | 49.6 | |
| Total | | $ | 3,400.7 | | | $ | 408.9 | | | $ | 3,467.0 | | | $ | 412.1 | | | $ | 3,480.7 | | | $ | 389.6 | |
|
| | | | | | | | | | | | | | | | | | | | | | | | |
| | | As of December 31, |
| | | 2019 | | 2018 | | 2017 |
| | | In Force | | New Business | | In Force | | New Business | | In Force | | New Business |
| U.S. and Latin America: | | | | | | | | | | | | |
| Traditional | | $ | 1,619.6 |
| | $ | 115.8 |
| | $ | 1,610.1 |
| | $ | 106.5 |
| | $ | 1,609.8 |
| | $ | 99.4 |
|
| Financial Solutions | | 5.1 |
| | 3.2 |
| | 2.1 |
| | — |
| | 2.1 |
| | — |
|
| Total U.S. and Latin America | | 1,624.7 |
| | 119.0 |
| | 1,612.2 |
| | 106.5 |
| | 1,611.9 |
| | 99.4 |
|
| | | | | | | | | | | | | |
| Canada: | | | | | | | | | | | | |
| Traditional | | 417.1 |
| | 40.4 |
| | 383.5 |
| | 43.1 |
| | 393.9 |
| | 35.6 |
|
| Financial Solutions | | — |
| | — |
| | — |
| | — |
| | — |
| | — |
|
| Total Canada | | 417.1 |
| | 40.4 |
| | 383.5 |
| | 43.1 |
| | 393.9 |
| | 35.6 |
|
| | | | | | | | | | | | | |
| Europe, Middle East and Africa: | | | | | | | | | | | | |
| Traditional | | 776.4 |
| | 147.4 |
| | 716.3 |
| | 190.2 |
| | 739.0 |
| | 181.5 |
|
| Financial Solutions | | — |
| | — |
| | — |
| | — |
| | — |
| | — |
|
| Total Europe, Middle East and Africa | | 776.4 |
| | 147.4 |
| | 716.3 |
| | 190.2 |
| | 739.0 |
| | 181.5 |
|
| | | | | | | | | | | | | |
| Asia Pacific: | | | | | | | | | | | | |
| Traditional | | 662.0 |
| | 69.7 |
| | 616.9 |
| | 66.9 |
| | 552.3 |
| | 78.9 |
|
| Financial Solutions | | — |
| | — |
| | 0.3 |
| | — |
| | 0.2 |
| | — |
|
| Total Asia Pacific | | 662.0 |
| | 69.7 |
| | 617.2 |
| | 66.9 |
| | 552.5 |
| | 78.9 |
|
| Total | | $ | 3,480.2 |
| | $ | 376.5 |
| | $ | 3,329.2 |
| | $ | 406.7 |
| | $ | 3,297.3 |
| | $ | 395.4 |
|
Reinsurance business in force reflects the addition or acquisition of new life reinsurance business, offset by terminations (e.g., life and group contract terminations, lapses of underlying policies, deaths of insureds, and recapture), changes in foreign currency exchange and any other changes in the amount of insurance in force. As a result of terminations, fluctuations in foreign exchange rates and other changes, assumed in force amounts at risk of $225.5decreased by $475.2 billion, $374.8$425.8 billion and $160.6$389.1 billion were released in 2019, 20182022, 2021 and 2017,2020, respectively.
See “Results of Operations by Segment” below for further information about the Company’s segments.
Industry Trends
The Company believes life and health insurance companies will continue to partner with reinsurance companies to manage risk, achieve new growth, assist with capital efficiency, develop solutions across the value chain and to help navigate through changes in regulatory and accounting standards. The Company also believesCOVID-19 pandemic has highlighted the following trendsimportance of insurance products in general and the life and health insurance industry will continue to create demand for both traditionalvalue of reinsurance and financial solutions.
Traditional Reinsurance. The percentage of new life and health business being reinsured in North America has stabilized and recently began to increase followingas a period of decline, due to strong recurring production coupled with in-force opportunities and an aging population, which increases the need for living benefit morbidity products. Cession rates in the Company’s international markets are expected to continue increasing as middle-class growth and wealth creation drive additional insurance growth. New products and distribution channels, from accelerated underwriting and insurtech, are expected to contribute to the growth of the insurance market globally and provide opportunities for reinsurers.risk management tool. In addition, changing global capital requirements are leading to additional reinsurance opportunities. Thethe Company believes reinsurers will continue to be an integral part of the life and health insurance market due to their ability to efficiently aggregate a significant volume of life insurance in force, creating economies of scale and greater diversification of risk. As a result of having larger amounts of mortality and morbidity experience data at their disposal compared to primary life insurance companies, reinsurers tend to have more comprehensive insights into mortality and morbidity trends, creating more efficient pricing for mortality and morbidity risk.
Financial Solutions. Asset intensive The Company also believes the following trends in the life and longevity productshealth insurance industry will continue to growcreate demand for both traditional reinsurance and financial solutions.
Cession Rates. The percentage of new life and health business being reinsured in importanceNorth America has recently begun to increase following a period of decline, due to the growing middle classstrong recurring production coupled with in-force opportunities and thean aging population, and their concerns about peak income protection andwhich increases the need for living benefit morbidity products. Cession rates in the Company’s international markets are expected to continue increasing as middle-class growth and wealth creation drive additional insurance growth. The COVID-19 pandemic highlighted the insurance protection gap, and the strategic benefits of reinsurance, and thus may lead to increased cession rates as insurance companies address the gap.
Insured Populations. The aging population in North America and elsewhere, and the growth in the middle class in the Company’s international markets, are increasing demand for insurance products and for financial products among “baby boomers” who are concerned about protecting their peak income stream and are considering retirement and estate planning. This trend is likely to result in continuing demand for annuity products and life insurance policies, larger face amounts of life insurance policies and higher mortality and longevity risk taken by life insurers, all of which should fuel the need for insurers to seek reinsurance coverage. Additionally, in many countries, companies are increasingly interested in reducing their exposure to longevity risk related to employee retirement plans. The low interest rate environment puts pressure on new business opportunities for asset intensive blocks; however, the Company believes that theplans, resulting in a growing demand for reinsuring these blocks of business will continue. In addition,pension risk transfer solutions.
Economic, Regulatory and Accounting Changes. regulatory,Regulatory, accounting, and economic changes across the globe are creating opportunities for reinsurance and innovative capital solutions to:
•manage risk-based capital by shifting mortality and other risks to reinsurers, thereby reducing amounts of reserves and capital the life and health insurance companies need to maintain;
•release capital to pursue new business initiatives;
•unlock the capital supporting, and value embedded in, non-core product lines; and
•exit certain lines of business.
Trends that affect all of the Company’s lines of business include the following:
Consolidation and Reorganization within the Life Reinsurance and Life Insurance Industry. There are fewer competitors in the traditional life reinsurance industry as a result of consolidations in the industry. As a consequence, the Company believes there will be business opportunities for the remaining life reinsurers, particularly those with a significant market presence and strong ratings. However, competition from new entrants for large in-force blocks, particularly for asset-intensive blocks, has increased in recent years. Additionally, merger and acquisition and other restructuring transactions within the life insurance industry will likely continue to occur, which we believethe Company believes will increase the demand for reinsurance products to facilitate these transactions and manage risk.
Changing Demographics of Insured Populations. The aging population in North America and elsewhereCompany’s strategy is increasing demand for financial products among “baby boomers” who are concerned about protecting their peak income stream and are considering retirement and estate planning. This trend is likely to result in continuing demand for annuity products and life insurance policies, larger face amounts of life insurance policies and higher mortality and longevity risk taken by life insurers, all of which should fuel the need for insurers to seek reinsurance coverage.
The Company hopes to continue to capitalize on industry trends by ensuring it is well positioned to meet its clients’ needs through the following initiatives:
Leading with Expertise and Innovation
Continue Growth of Traditional Reinsurance. •The Company’s strategy includes continuingCombine product development, innovation, and new reinsurance structures to open or expand markets.
•Leverage underwriting, data, analytics, and digital expertise to grow each of the following components of its traditional operations:markets.
North America. Based on discussions with the Company’s clients, an industry survey•Deliver unique insights to gain competitive advantage and informal knowledge about the industry, the Company believes it is a leader in facultative underwriting in North America. The Company intendsleverage thought leadership to maintain that status by emphasizing its underwriting standards, prompt response on quotes, competitive pricing,drive growth.
capacity, value added services•Broaden and flexibility in meeting customer needs. The Company believes its facultative business has allowed it to develop close, long-standingdeepen global, regional, and local client relationships and generate additional business opportunities with its facultative clients. In addition,to be the Company intends to maintain its presence in the North American automaticpreferred reinsurance market by leveraging its mortality expertise and breadth of products and services to gain additional market share.
International Markets. International markets continue to offer opportunities for long-term growth, and the Company intends to capitalize on these opportunities by growing its presence in select markets. Many of the markets where the Company does business, or may enter in the future, are not utilizing life reinsurance at the same levels as the North American market. Therefore, the Company believes these markets represent opportunities for increasing reinsurance penetration. In particular, markets such as Japan, Southeast Asia and South Korea are beginning to realize the benefits that reinsurers bring to the life insurance market. Markets such as China and India represent longer-term opportunities for growth as the underlying direct life insurance markets grow to meet the needs of expanding middle-class populations. Additionally, the Company believes that regulatory changes in many of its markets may cause ceding companies to reduce counterparty exposure to their existing life reinsurers and reinsure more business, creating opportunities for the Company. More recently, the Company has experienced significant growth in health related product offerings, such as critical illness, most notably in select Asian markets.
In Force Block Reinsurance. Increasingly, there are opportunities to grow the business by reinsuring in force blocks, as insurers and reinsurers seek to exit various non-core businesses and increase financial flexibility to, among other things, redeploy capital and pursue merger and acquisition activity. The Company continually seeks these types of opportunities.partner.
•Continue Growth in Financial Solutions.Foster third-party partnerships to accelerate innovation, capabilities, and access to efficient capital.
Asset-intensive•Strengthen leadership in industry organizations to actively promote and Longevity Reinsurance. In recent years, the Company has experienced growth in asset-intensiveadvance industry purpose.
Prioritizing Agility, Impact and longevity reinsurance. The Company intendsScale
•Prioritize high-growth, capability-driven opportunities that best fit risk appetites.
•Prioritize opportunities that recognize competitive differentiators and value proposition.
•Capitalize on operating model to continue leveraging its existing client relationshipsincrease local markets responsiveness and reinsurance expertiseagility.
Building for Future Generations
•Pursue a balanced approach to create customized reinsurance products and other capital solutions. Industry trends, particularly the consolidation and reorganization that occurred among life insurance companies, changes in products and product distribution and new solvency requirements, are expected to enhance existing opportunities for asset-intensive and longevity reinsurance. To date, most of the Company’s asset-intensive reinsurance business has been written in the U.S., the UK and Japan; however, additional opportunities in other markets continue to develop. The Company also provides longevity reinsurance in the U.S., Canada and Europe.
Capital Solutions. The Company provides capital solutions customized for each client, country, and product. The Company’s culture of collaboration and innovation makes it well positioned to react to regulatory and accounting changes in all of its clients’ markets, which we believe may create demand for increased product development and more capital solutions.
Build on the Company’s History of Innovation.
The Company has a history of innovation, expertise and a relentless focus on its clients. As such, the Company continues to build a diverse and experienced team while partnering with insurance companies, data and technology providers and insurtech entrepreneurs to develop and market technology and provide consulting and outsourcing solutions. While this is currently a small, but growing, part of the Company’s operations, these initiatives may lead to new revenue streams, new opportunities across the industry value chainin-force management, portfolio optimization, and new business innovations that could havegeneration.
•Foster an engaging and inclusive culture to attract and retain diverse, world-class talent.
•Behave as a transformational impact on the insurance industryresponsible global citizen by taking action to address social and the Company.environmental issues.
Critical Accounting Policies
The Company’s accounting policies are described in Note 2 – “Significant Accounting Policies and Pronouncements” in the Notes to Consolidated Financial Statements. The Company believes its most critical accounting policies include the establishment of premiums receivable; amortization of deferred acquisition costs (“DAC”); the establishment of liabilities for future policy benefits and incurred but not reported claims; the valuation of investments and investment allowance for credit losses and impairments; the valuation of embedded derivatives; and accounting for income taxes. The balances of these accounts require extensive use of assumptions and estimates, particularly related to the future performance of the underlying business.
Differences in experience compared with the assumptions and estimates utilized in establishing premiums receivable, the justification of the recoverability of DAC, in establishing reserves for future policy benefits and claim liabilities, or in the determination of other-than-temporary impairments to investment securities can have a material effect on the Company’s results of operations and financial condition.
Premiums Receivable
Premiums are accrued when due and in accordance with information received from the ceding company. When the Company enters into a new reinsurance agreement, it records accruals based on the terms of the reinsurance treaty. Similarly, when a ceding company fails to report information on a timely basis, the Company records accruals based on the terms of the reinsurance treaty as well as historical experience. Other management estimates include adjustments for increased insurance in force on existing treaties, lapsed premiums given historical experience, the financial health of specific ceding companies, collateral value and the legal right of offset on related amounts (i.e., allowances and claims) owed to the ceding company. Under the legal right of offset provisions in its reinsurance treaties, the Company can withhold payments for allowances and claims from unpaid premiums.
Deferred Acquisition Costs
Costs of acquiring new business, which vary with and are directly related to the production of new business, have been deferred to the extent that such costs are deemed recoverable from future premiums or gross profits. Such costs include commissions and allowances as well as certain costs of policy issuance and underwriting. Non-commission costs related to the acquisition of new and renewal insurance contracts may be deferred only if they meet the following criteria:
•Incremental direct costs of a successful contract acquisition.
•Portions of employees’ salaries and benefits directly related to time spent performing specified acquisition activities for a contract that has been acquired or renewed.
•Other costs directly related to the specified acquisition or renewal activities that would not have been incurred had that acquisition contract transaction not occurred.
The Company tests the recoverability for each year of business at issue before establishing additional DAC. The Company also performs annual tests to establish that DAC remain recoverable at all times, and if financial performance significantly deteriorates to the point where a deficiency exists, a cumulative charge to current operations will be recorded. No such adjustments related to DAC recoverability were made in 2019, 20182022, 2021 and 2017.2020.
DAC related to traditional life insurance contracts are amortized with interest over the premium-paying period of the related policies in proportion to the ratio of individual period premium revenues to total anticipated premium revenues over the life of the policy. Such anticipated premium revenues are estimated using the same assumptions used for computing liabilities for future policy benefits.
DAC related to interest-sensitive life and investment-type contracts is amortized over the lives of the contracts, in relation to the present value of estimated gross profits (“EGP”) from mortality, investment income, and expense margins. The EGP for asset-intensive products include the following components: (1) estimates of fees charged to policyholders to cover mortality, surrenders and maintenance costs, less amount of risk upon death; (2) expected interest rate spreads between income earned and amounts credited to policyholder accounts; and (3) estimated costs of administration. EGP is also reduced by the Company’s estimate of future losses due to defaults in fixed maturity securities as well as the change in reserves for embedded derivatives. DAC is sensitive to changes in assumptions regarding these EGP components, and any change in such assumptions could have an effect on the Company’s profitability.
The Company periodically reviews the EGP valuation model and assumptions so that the assumptions reflect best estimates of future experience. Two assumptions are considered to be most significant: (1) estimated interest spread, and (2) estimated future policy lapses. As of December 31, 2019,2022, the Company had $313$528 million of DAC related to asset-intensive products, all within the U.S. and Latin America and Asia Pacific Financial Solutions segment.segments. The following table reflects the possible change, that would occur in a given year if assumptions, as a percentage of current DAC related to asset-intensive products, that would occur in a given year if assumptions are changed as illustrated:
| | | Quantitative Change in Significant Assumptions | | One-Time Increase in DAC | | One-Time Decrease in DAC | Quantitative Change in Significant Assumptions | | One-Time Increase in
DAC | | One-Time Decrease in
DAC |
| | | | |
| Estimated interest spread increasing (decreasing) 25 basis points from the current spread | | 4.66% | | (5.09)% | Estimated interest spread increasing (decreasing) 25 basis points from the current spread | | 9.12% | | (11.53)% |
| | | | |
| Estimated future policy lapse rates decreasing (increasing) 20% on a permanent basis (including surrender charges) | | 2.75% | | (2.48)% | Estimated future policy lapse rates decreasing (increasing) 20% on a permanent basis (including surrender charges) | | 5.77% | | (5.00)% |
In general, a change in assumption that improves the Company’s expectations regarding EGP is going to have the effect of deferring the amortization of DAC into the future, thus increasing earnings and the current DAC balance. DAC can be no greater than the initial DAC balance plus interest and would be subject to recoverability testing, which is ignored for purposes of this analysis. Conversely, a change in assumption that decreases EGP will have the effect of speeding up the amortization of DAC, thus reducing earnings and lowering the DAC balance. The Company also adjusts DAC to reflect changes in the unrealized gains and losses on available-for-sale fixed maturity securities since these changes affect EGP. This adjustment to DAC is reflected in accumulated other comprehensive income.
The DAC associated with the Company’s non-asset-intensive business is less sensitive to changes in estimates for investment yields, mortality and lapses. In accordance with generally accepted accounting principles, the estimates include
provisions for the risk of adverse deviation and are not adjusted unless experience significantly deteriorates to the point where a premium deficiency exists.
The following table displayssummarizes the DAC balances for the Traditional and Financial Solutions segments as of December 31, 2019:2022:
| | | (dollars in millions) | | Traditional | | Financial Solutions | | Total | (dollars in millions) | | Traditional | | Financial Solutions | | Other | | Total |
| | | | | | | | | | | | | | | |
| U.S. and Latin America | | $ | 1,806 |
| | $ | 313 |
| | $ | 2,119 |
| U.S. and Latin America | | $ | 2,000 | | | $ | 387 | | | $ | — | | | $ | 2,387 | |
| Canada | | 199 |
| | — |
| | 199 |
| Canada | | 171 | | | — | | | — | | | 171 | |
| Europe, Middle East and Africa | | 250 |
| | — |
| | 250 |
| Europe, Middle East and Africa | | 231 | | | — | | | — | | | 231 | |
| Asia Pacific | | 927 |
| | 17 |
| | 944 |
| Asia Pacific | | 1,039 | | | 141 | | | — | | | 1,180 | |
| Corporate | | Corporate | | — | | | — | | | 5 | | | 5 | |
| Total | | $ | 3,182 |
| | $ | 330 |
| | $ | 3,512 |
| Total | | $ | 3,441 | | | $ | 528 | | | $ | 5 | | | $ | 3,974 | |
As of December 31, 2019,2022, the Company estimates that all of its DAC balance is collateralized by surrender fees due to the Company and the reduction of policy liabilities, in excess of termination values, upon surrender or lapse of a policy.
Liabilities for Future Policy Benefits and Incurred but not Reported Claims
Liabilities for future policy benefits under long-duration life insurance policies (policy reserves) are computed based upon expected investment yields, mortality and withdrawal (lapse) rates, and other assumptions, including a provision for adverse deviation from expected claim levels. Liabilities for use policy claims and benefits for short-duration contracts are accounted for based on actuarial estimates of the amount of loss inherent in that period’s claims, including losses incurred for which claims have not been reported. Short-duration contract loss estimates rely on actuarial observations of ultimate loss
experience for similar historical events. The Company primarily relies on its own valuation and administration systems to establish policy reserves. The policy reserves the Company establishes may differ from those established by the ceding companies due to the use of different mortality and other assumptions. However, the Company relies upon its ceding company clients to provide accurate data, including policy-level information, premiums and claims, which is the primary information used to establish reserves. The Company’s administration departments work directly with clients to help ensure information is submitted in accordance with the reinsurance contracts. Additionally, the Company performs periodic audits of the information provided by clients. The Company establishes reserves for processing backlogs with a goal of clearing all backlogs within a ninety-day period. The backlogs are usually due to data errors the Company discovers or computer file compatibility issues, since much of the data reported to the Company is in electronic format and is uploaded to its computer systems.
The Company periodically reviews actual historical experience and relative anticipated experience compared to the assumptions used to establish aggregate policy reserves. Further, the Company establishes premium deficiency reserves if actual and anticipated experience indicates that existing aggregate policy reserves, together with the present value of future gross premiums, are not sufficient to cover the present value of future benefits, settlement and maintenance costs and to recover unamortized acquisition costs. The premium deficiency reserve is established through a charge to income, as well as a reduction to unamortized acquisition costs and, to the extent there are no unamortized acquisition costs, an increase to future policy benefits. Because of the many assumptions and estimates used in establishing reserves and the long-term nature of the Company’s reinsurance contracts, the reserving process, while based on actuarial science, is inherently uncertain. If the Company’s assumptions, particularly on mortality, are inaccurate, its reserves may be inadequate to pay claims and there could be a material adverse effect on its results of operations and financial condition.
Claims payable for incurred but not reported losses for long-duration life policies are determined using case-basis estimates and lag studies of past experience. The time lag from the date of the claim or death to the date when the ceding company reports the claim to the Company can be several months and can vary significantly by ceding company, business segment and product type. Incurred but not reported claims are estimates on an undiscounted basis, using actuarial estimates of historical claims expense, adjusted for current trends and conditions. These estimates are continually reviewed and the ultimate liability may vary significantly from the amount recognized, which are reflected in net income in the period in which they are determined.
Claims payable for incurred but not reported losses for disability, medical and other short-duration contracts are determined using actuarial methods based on historical claim patterns as well as estimated changes in cost trends. The Company also reviews and evaluates how prior periods’ estimates are developed when estimating the accrual for the current period. To the extent appropriate, changes in such development are recorded as a change to the current period expense. Historically, the amount of the claim development adjustment made in subsequent reporting periods for prior period estimates has been in a reasonable range given the Company’s normal claim fluctuations.
Valuation of Investments, Allowance for Credit Losses and Other-than-Temporary Impairments
The Company primarily invests in fixed maturity securities, mortgage loans, short-term investments, and other invested assets. For investments reported at fair value, the Company utilizes, when available, fair values based on quoted prices in active
markets that are regularly and readily obtainable. Generally, these are very liquid investments and the valuation does not require management judgment. When quoted prices in active markets are not available, fair value is based on market valuation techniques, market comparable pricing and the income approach. The Company may utilize information from third parties, such as pricing services and brokers, to assist in determining the fair value for certain investments; however, management is ultimately responsible for all fair values presented in the Company’s consolidated financial statements. This includes responsibility for monitoring the fair value process, ensuring objective and reliable valuation practices and pricing of assets and liabilities, and approving changes to valuation methodologies and pricing sources. The selection of the valuation technique(s) to apply considers the definition of an exit price and the nature of the investment being valued and significant expertise and judgment is required.
In addition, investments are subject to impairment reviews to identify when a decline in value necessitates the recording of an allowance for credit losses or an impairment for non-credit factors. Impairment losses for non-credit factors are recognized in AOCI whereas allowances for credit losses are recognized in investment related gains (losses), net. See “Allowance for Credit Losses and Impairments” in Note 2 – “Significant Accounting Policies and Pronouncements” in the Notes to Consolidated Financial Statements for a discussion of the policies regarding allowance for credit losses and impairments.
Fixed maturity securities are classified as available-for-sale and are carried at fair value. Unrealized gains and losses on fixed maturity securities classified as available-for-sale, less applicable deferred income taxes as well as related adjustments to deferred acquisition costs, if applicable, are reflected as a direct charge or credit to accumulated other comprehensive income (“AOCI”) in stockholders’ equity on the consolidated balance sheets.
See “Investments” in Note 2 – “Significant Accounting Policies and Pronouncements” and Note 6 – “Fair Value of Assets and Liabilities” in the Notes to the Consolidated Financial Statements for additional information regarding the valuation of the Company’s investments.
Mortgage loans on real estate are carried at unpaid principal balances, net of any unamortized premium or discount and valuation allowances. For a discussion regarding the valuation allowance for mortgage loans see “Mortgage Loans on Real Estate”“Allowance for Credit Losses and Impairments” in Note 2 – “Significant Accounting Policies and Pronouncements” in the Notes to the Consolidated Financial Statements.
In addition, investments are subject to impairment reviews to identify when a decline in value is other-than-temporary. Other-than-temporary impairment losses related to non-credit factors are recognized in AOCI whereas the credit loss portion is recognized in investment related gains (losses), net. See “Other-than-Temporary Impairment” in Note 2 – “Significant Accounting Policies and Pronouncements” in the Notes to the Consolidated Financial Statements for a discussion of the policies regarding other-than-temporary impairments.
Valuation of Embedded Derivatives
The Company reinsures certain annuity products that contain terms that are deemed to be embedded derivatives, primarily equity-indexed annuities and variable annuities with guaranteed minimum benefits. The Company assesses each identified embedded derivative to determine whether it is required to be bifurcated under the general accounting principles for Derivatives and Hedging. If the instrument would not be reported in its entirety at fair value and it is determined that the terms of the embedded derivative are not clearly and closely related to the economic characteristics of the host contract, and that a separate instrument with the same terms would qualify as a derivative instrument, the embedded derivative is bifurcated from the host contract and accounted for as a freestanding derivative. Such embedded derivatives are carried on the consolidated balance sheets at fair value with the host contract.
Additionally, reinsurance treaties written on a modified coinsurance or funds withheld basis are subject to the general accounting principles for Derivatives and Hedging related to embedded derivatives. The majority of the Company’s funds withheld at interest balances are associated with its reinsurance of annuity contracts, the majority of which are subject to the general accounting principles for Derivatives and Hedging related to embedded derivatives. Management believes the embedded derivative feature in each of these reinsurance treaties is similar to a total return swap on the assets held by the ceding companies.
The valuation of the various embedded derivatives requires complex calculations based on actuarial and capital markets inputs and assumptions related to estimates of future cash flows and interpretations of the primary accounting guidance continue to evolve in practice. The valuation of embedded derivatives is sensitive to the investment credit spread environment. Changes in investment credit spreads are also affected by the application of a credit valuation adjustment (“CVA”). The fair value calculation of an embedded derivative in an asset position utilizes a CVA based on the ceding company’s credit risk. Conversely, the fair value calculation of an embedded derivative in a liability position utilizes a CVA based on the Company’s credit risk. Generally, an increase in investment credit spreads, ignoring changes in the CVA, will have a negative impact on the fair value of the embedded derivative (decrease in income). See “Derivative Instruments” in Note 2 – “Significant Accounting Policies and Pronouncements” and Note 6 – “Fair Value of Assets and Liabilities” in the Notes to the Consolidated Financial Statements for additional information regarding the valuation of the Company’s embedded derivatives.
Income Taxes
The U.S. consolidated tax return includes the operations of RGA and all eligible subsidiaries. Certain RGA subsidiaries file separate U.S. income tax returns as these companies are currently ineligible for inclusion in the consolidated federal tax return. The Company’s foreign subsidiaries are taxed under applicable local statutes.
The Company provides for federal, state and foreign income taxes currently payable, as well as those deferred due to temporary differences between the tax basis of assets and liabilities and the reported amounts, and are recognized in net income or in certain cases in other comprehensive income. The Company’s accounting for income taxes represents management’s best
estimate of various events and transactions considering the laws enacted as of the reporting date. U.S. Tax Reform creates additional complexity due to various provisions that require management judgment and assumptions, which are subject to change.
Deferred tax assets and liabilities are measured by applying the relevant jurisdictions’ enacted tax rate to the temporary difference infor the period in which the temporary differences are expected to reverse.reverse to the temporary difference change for that period. The Company will establish a valuation allowance if management determines, based on available information, that it is more likely than not that deferred income tax assets will not be realized. The Company has deferred tax assets including those related to foreign tax credits, net operating and capital losses. The Company has projected its ability to utilize its deferred tax assets and established a valuation allowance on the portion of the deferred tax assets the Company believes more likely than not will not be realized.
Significant judgment is required in determining whether valuation allowances should be established as well as the amount of such allowances. When making such a determination, consideration is given to, among other things, the following:
| |
(i) | future taxable income exclusive of reversing temporary differences and carryforwards; |
| |
(ii) | future reversals of existing taxable temporary differences; |
| |
(iii) | taxable income in prior carryback years; and |
| |
(iv) | tax planning strategies. |
(ii)future reversals of existing taxable temporary differences;
(iii)future taxable income exclusive of reversing temporary differences and carryforwards; and
(iv)tax planning strategies.
Any such changes could significantly affect the amounts reported in the consolidated financial statements in the year these changes occur.
The Company made a policy election to account for global intangible low-taxed income (“GILTI”) as a period cost.
The Company reports uncertain tax positions in accordance with generally accepted accounting principles. In order to recognize the benefit of an uncertain tax position, the position must meet the more likely than not criteria of being sustained. Unrecognized tax benefits due to tax uncertainties that do not meet the more likely than not criteria are included within liabilities and are charged to earnings in the period that such determination is made. The Company classifies interest related to tax uncertainties as interest expense whereas penalties related to tax uncertainties are classified as a component of income tax.
See Note 9 -– “Income Tax” for further discussion including the impact of the December 22, 2017 enactment of U.S. Tax Reform.discussion.
Consolidated Results of Operations
Impacts of the COVID-19 Pandemic
Although global COVID-19 related deaths have declined, the Company continues to experience increased claim costs, primarily in the first quarter of 2022, as a result of the COVID-19 global pandemic. However, the Company cannot reliably predict the future impact COVID-19 will have on its business, results of operations and financial condition as the ultimate amount and timing of claims the Company will experience as a result of COVID-19 will depend on many variables and uncertainties. These variables and uncertainties will depend on, the severity of new variants of the virus, vaccination prevalence and effectiveness, country-specific circumstances, and COVID-19’s indirect impact on mortality and morbidity.
During 2022, general population COVID-19 deaths were heavily concentrated in individuals aged 70 and older and with pre-existing comorbidities; however, some populations experienced an increase in younger age deaths, particularly in areas where healthcare facilities were unable to provide adequate care. The Company’s insured population has lower exposure to older ages than the general population and covers a generally healthier population due to underwriting and socioeconomic factors of those purchasing insurance. In addition, the Company’s longevity business may act as a modest offset to excess life insurance claims at older ages.
The Company’s COVID-19 projection and financial impact models continue to be updated and refined based on the latest external data and the Company’s claim experience to date and are subject to the many variables and uncertainties noted above. During 2022, the U.S. continued to be the key driver of mortality claim costs followed by Asia and Canada. For the year ended December 31, 2022, the Company estimates it incurred approximately $451 million of COVID-19 related life and health claim costs, including amounts incurred but not reported, with approximately $336 million of that amount being associated with the U.S. and Latin America Traditional segment. During the second half of 2022, mortality claims related to COVID-19 continued to decline across all segments; however, the Company experienced an increase in medical hospitalization claims for at-home sickness benefits related to COVID-19 in Japan. Changes to the definition of qualifying at-home sickness benefits at the end of September 2022 is expected to reduce future at-home benefit expenses in future periods.
Results of Operations – 2022 compared to 2021
A discussion regarding our financial condition and results of operations for the year ended December 31, 2019,2022, compared to the year ended December 31, 2018,2021, is presented below. A discussion regarding our financial condition and results of operations for the year ended December 31, 20182021, compared to the year ended December 31, 2017,2020, can be found under Item 7 in our Annual Report on Form 10-K for the year ended December 31, 2018,2021, filed with the SEC on February 27, 2019,25, 2022, which is available free of charge on the SEC’s website at www.sec.gov and our Investor Relations website at www.rgare.com. Information provided on such websites does not constitute part of this Annual Report on Form 10-K.
The following table summarizes the changes in net income for the periods presented.
| | | | | | | | | | | | | | | | | | | | | |
| | | For the years ended December 31, |
| | | 2022 | | 2021 | | | 2022 vs 2021 |
| Revenues | | (Dollars in millions, except per share data) |
| Net premiums | | $ | 13,078 | | | $ | 12,513 | | | | $ | 565 | |
| Net investment income | | 3,161 | | | 3,138 | | | | 23 | |
| | | | | | | |
| | | | | | | |
| | | | | | | |
| | | | | | | |
| Investment related gains (losses), net | | (506) | | | 560 | | | | (1,066) | |
| Other revenues | | 525 | | | 447 | | | | 78 | |
| Total revenues | | 16,258 | | | 16,658 | | | | (400) | |
| Benefits and expenses | | | | | | | |
| Claims and other policy benefits | | 12,046 | | | 12,776 | | | | (730) | |
| Interest credited | | 682 | | | 700 | | | | (18) | |
| Policy acquisition costs and other insurance expenses | | 1,499 | | | 1,416 | | | | 83 | |
| Other operating expenses | | 1,009 | | | 936 | | | | 73 | |
| Interest expense | | 184 | | | 127 | | | | 57 | |
| Collateral finance and securitization expense | | 7 | | | 12 | | | | (5) | |
| Total benefits and expenses | | 15,427 | | | 15,967 | | | | (540) | |
| Income before income taxes | | 831 | | | 691 | | | | 140 | |
| Provision for income taxes | | 204 | | | 74 | | | | 130 | |
| Net income | | $ | 627 | | | $ | 617 | | | | $ | 10 | |
| Net income attributable to noncontrolling interest | | 4 | | | — | | | | 4 | |
| Net income available to RGA, Inc. shareholders | | $ | 623 | | | $ | 617 | | | | $ | 6 | |
| Earnings per share | | | | | | | |
| Basic earnings per share | | $ | 9.31 | | | $ | 9.10 | | | | |
| Diluted earnings per share | | 9.21 | | | 9.04 | | | | |
| | | | | | | |
|
| | | | | | | | | | | | |
| | | For the years ended December 31, |
| | | 2019 | | 2018 | | 2017 |
| Revenues | | (Dollars in millions, except per share data) |
| Net premiums | | $ | 11,297 |
| | $ | 10,544 |
| | $ | 9,841 |
|
| Investment income, net of related expenses | | 2,520 |
| | 2,139 |
| | 2,155 |
|
| Investment related gains (losses), net: | | | | | | |
| Other-than-temporary impairments on fixed maturity securities | | (31 | ) | | (28 | ) | | (43 | ) |
Other-than-temporary impairments on fixed maturity securities transferred to (from) accumulated other comprehensive income | | — |
| | — |
| | — |
|
| Other investment related gains (losses), net | | 122 |
| | (142 | ) | | 211 |
|
| Total investment related gains (losses), net | | 91 |
| | (170 | ) | | 168 |
|
| Other revenues | | 392 |
| | 363 |
| | 352 |
|
| Total revenues | | 14,300 |
| | 12,876 |
| | 12,516 |
|
| Benefits and expenses | | | | | | |
| Claims and other policy benefits | | 10,197 |
| | 9,319 |
| | 8,519 |
|
| Interest credited | | 697 |
| | 425 |
| | 502 |
|
| Policy acquisition costs and other insurance expenses | | 1,204 |
| | 1,323 |
| | 1,467 |
|
| Other operating expenses | | 868 |
| | 786 |
| | 710 |
|
| Interest expense | | 173 |
| | 147 |
| | 146 |
|
| Collateral finance and securitization expense | | 29 |
| | 30 |
| | 29 |
|
| Total benefits and expenses | | 13,168 |
| | 12,030 |
| | 11,373 |
|
| Income before income taxes | | 1,132 |
| | 846 |
| | 1,143 |
|
| Provision for income taxes | | 262 |
| | 130 |
| | (679 | ) |
| Net income | | $ | 870 |
| | $ | 716 |
| | $ | 1,822 |
|
| Earnings per share | | | | | | |
| Basic earnings per share | | $ | 13.88 |
| | $ | 11.25 |
| | $ | 28.28 |
|
| Diluted earnings per share | | 13.62 |
| | 11.00 |
| | 27.71 |
|
Consolidated income before income taxes increased $286 million, or 33.8% in 2019. Diluted earnings per share were $13.62 in 2019 compared to $11.00 in 2018. The increase in income in 2022 was primarily due to favorable experiencethe result of the following:
•An increase in the various Financial Solutions segments, improvednet premiums and decrease in mortality claims experience in the Canada and EMEA Traditional segments and increases in investment income. The favorable experience was partially offset by unfavorable results in the Asia Pacific Traditional segment, primarily in Australia, and the U.S. and Latin America, Traditional segment. In addition, 2019 income reflectsEMEA and Asia Pacific traditional segments. The decrease in mortality claims was a result of lower COVID-19 claims and favorable changesnon-COVID-19 experience.
The increase in premiums and decrease in mortality claims was offset by the following:
◦Changes in the fair value of derivative instruments, excluding embedded derivatives, included in investment related gaingains (losses) resulting from changes, net. For the year ended December 31, 2022, the fair value of these instruments decreased by $301 million, compared to an increase of $90 million in 2021.
◦$204 million, pre-tax, of net realized losses, included in investment related gains (losses), net associated with portfolio repositioning and higher interest rates compared to $234 million of net realized gains recognized in the prior year.
◦Changes in the fair value of embedded derivatives, on modified coinsurance (“modco”) or associated with modco/funds withheld treaties, withindecreased investment related gains by $173 million for the U.S. segment dueyear ended December 31, 2022, compared to changesan increase of $107 million in interest rates2021.
◦The prior year benefited from a one-time adjustment of $162 million, pretax, associated with prior periods that includes $92 million, pretax, to correct the accounting for equity method limited partnerships to reflect unrealized gains in net investment income that were previously included in accumulated other comprehensive income (loss), and credit spreads. The effectsa $70 million, pretax, correction reflected in other investment related gains (losses), net to adjust the carrying value of the change incertain limited partnerships from cost less impairments to a fair value approach, using the net asset value (“NAV”) per share or its equivalent.
Foreign currency fluctuations relative tocan result in variances in the prior yearfinancial statement line items. Foreign currency exchange fluctuation decreased income before income taxes by $15$14 million due to the weakening foreign currencies compared to the U.S. Dollar, primarily, the Great British Pound and the Canadian Dollar. Unless otherwise stated, all amounts discussed below are net of foreign currency fluctuations.
Premiums and business growth
The increase in 2019 and increased income before income taxes by $10 million in 2018.
Consolidated net premiums increased $753 million, or 7.1% in 2019,is primarily due to organic growth on existing treaties and new business production, measured by the face amount of reinsurance in force, of $408.9 billion during 2022 compared to $412.1 billion during 2021. Consolidated assumed life reinsurance in force. Consolidated assumed life insurance in force increaseddecreased to $3,480.2$3,400.7 billion as of December 31, 2019,2022, from $3,329.2$3,467.0 billion as of December 31, 20182021, due to new business productionlapses and mortality claims in the current year of $324.9 billion, primarily attributable to the COVID-19 pandemic, and changes in foreign exchange, which decreased assumed life reinsurance in force transactions. The Company added new business production, measured by face amount of insurance in force, of $376.5 billion, and $406.7 billion during 2019 and 2018, respectively. Foreign currency fluctuations relative to the prior year decreased net premium by $179 million in 2019 and increased net premiums by $43 million in 2018. Foreign currency fluctuations affected the increases in assumed life insurance in force favorably by $38.0 billion in 2019 and unfavorably by $101.5 billion in 2018.$150.3 billion.
ConsolidatedNet investment income net ofand investment related expenses, increased $381 million, or 17.8% in 2019.gains and losses
The increase in net investment income is primarily attributable to an increase in the average invested asset base and higher risk-free rates earned on new investments, partially offset by a decrease in variable investment income associated with joint venture and limited partnership investments. Investment income is affected by changes in the fair value of the Company’s funds withheld at interest assets associated with the reinsurance of certain equity-indexed annuity treaties (“EIAs”) products. The re-measurement of these funds withheld assets increased investment income by $11 million in 2019 compared to a decrease of $12 million in 2018. The effect on investment income of the EIAs’ market value changes is substantially offset by a corresponding change in interest credited to policyholder account balances resulting in an insignificant effect on net income.investments:
•The average invested assets at amortized cost, excluding spread related business, totaled $28.3$34.4 billion and $26.6$33.0 billion in 20192022 and 2018,2021, respectively.
•The average yield earned on investments, excluding spread related business, was 4.56%4.69% and 4.45%4.99% in 20192022 and 2018,2021, respectively. Investment yield decreased for the year ended December 31, 2022, in comparison to the prior year, primarily due to decreased variable income from limited partnerships and real estate joint ventures.
The average yield will vary from year to year depending on several variables, including the prevailing risk-fee interest rate and credit spread environment, prepayment fees and make-whole premiums, changes in the mix of the underlying investments and cash balances, and the timing of distributions on certain investments. Investment income in 2019 and 2018 benefited from higher variablecash equivalents balances. Variable investment income from joint ventures and limited partnerships which can be highly variablewill also vary from year to year. A continued low interest rate environmentyear and is expected to put downward pressurehighly dependent on this yield in future reporting periods.the timing of dividends and distributions on certain investments. Investment income is allocated to the operating segments based upon average assets and related capital levels deemed appropriate to support segment operations.
TotalThe decrease in investment related gains (losses), net increased by $261is attributable to the following:
•During 2022, the Company repositioned select portfolios generating net realized losses of $204 million compared to $234 million of net realized gains in 2019. A portion of the increase in investment related gains (losses) was includes changes in the value of embedded derivatives related to reinsurance treaties written on a modco or funds withheld basis, reflecting the impact of changes in interest rates and credit spreads on the calculation of fair value. 2021.
•Changes in the fair value of these embedded derivatives increased (decreased)associated with modco/funds withheld treaties, decreased investment related gains (losses) by $11$173 million in 2022, compared to an increase of $107 million in 2021.
•The Company incurred $(39) million and $(13)$17 million of impairments and change in 2019allowance for credit (losses) gains during the years ended December 31, 2022 and 2018,2021, respectively. In addition, 2019 included net realized
•Unrealized gains on investment salesof $38 million were recognized during 2022 compared to net realized losses$169 million, including the previously mentioned correction recorded in 2018. Net realized lossesthe first quarter of 2021 of $70 million, due to the change in 2018 are primarily related to repositioningfair value of fixed maturity securities portfolios in a changing interest rate environment.certain cost method limited partnerships recognized during 2021.
•See the Investment impairments on fixed maturity securities increased by $3 million in 2019 compared to 2018. Seesection within Management Discussion and Analysis, Note 4 -– “Investments” and Note 5 -– “Derivative Instruments” in the Notes to Consolidated Financial Statements for additional information on investment related gains (losses), net,the changes in allowance for credit losses, impairment losses and derivatives.
The effective tax rate on a consolidated basis was 23.1%24.6% and 15.4%10.6% for 20192022 and 2018,2021, respectively. The increaseeffective tax rate for 2022 was greater than the U.S. Statutory rate of 21.0% primarily as a result of income earned in jurisdictions with tax rates higher than the U.S., Subpart F income and GILTI which were partially offset with foreign tax credits. Furthermore, the Company established a valuation allowance on certain deferred taxes related to unrealized losses on the Company’s fixed maturity portfolio which, if reported in income tax expense would have increased the effective tax rate was primarilyby 3%. The Company considered the result ofneed for a valuation allowance increases in various jurisdictionson the remaining deferred tax asset associated with the fixed maturity securities. However, based on the ability to carryback and carryforward tax expense related to uncertain tax positions. The 2018 effective tax rate reflects refinements tocapital losses and the Company’s accountingability and intention to hold available for sale fixed maturity securities showing an unrealized loss until recovery, as described in Note 4 – “Investments” the effects of U.S. Tax Reform.Company determined it is more likely than not to realize the remaining deferred tax asset. See Note 4 “Investments” and Note 9 -– “Income Tax” in the Notes to the Consolidated Financial Statements for additional information on the Company’s consolidated effective tax rate.
Impact of certain derivatives
The Company recognizes in consolidated income, any changes in the fair value of embedded derivatives on modco or funds withheld treaties, EIAs and variable annuities with guaranteed minimum benefit riders. The Company utilizes
freestanding derivatives to minimize the income statement volatility due to changes in the fair value of embedded derivatives associated with guaranteed minimum benefit riders. The following table presents the effect of embedded derivatives and related freestanding derivatives on income before income taxes for the periods indicated (dollars in millions):
| | | | | | | | | | | | | | | | | | | |
| Twelve months ended December 31, |
| 2022 | | 2021 | | | | 2022 vs 2021 |
| Modco/Funds withheld: | | | | | | | |
| Unrealized gains (losses) | $ | (173) | | | $ | 107 | | | | | $ | (280) | |
| Deferred acquisition costs/retrocession | 93 | | | (36) | | | | | 129 | |
| Net effect | (80) | | | 71 | | | | | (151) | |
| EIAs: | | | | | | | |
| Unrealized gains (losses) | 53 | | | 45 | | | | | 8 | |
| Deferred acquisition costs/retrocession | (25) | | | (23) | | | | | (2) | |
| Net effect | 28 | | | 22 | | | | | 6 | |
| Guaranteed minimum benefit riders: | | | | | | | |
| Unrealized gains (losses) | 39 | | | (7) | | | | | 46 | |
| Related freestanding derivatives, net of deferred acquisition costs/retrocession | (72) | | | (47) | | | | | (25) | |
| Net effect | (33) | | | (54) | | | | | 21 | |
| Net effect after related freestanding derivatives | $ | (85) | | | $ | 39 | | | | | $ | (124) | |
|
| | | | | | | | | | | |
| | Twelve months ended December 31, |
| | 2019 | | 2018 | | 2017 |
| Modco/Funds withheld: | | | | | |
| Unrealized gains (losses) | $ | 11 |
| | $ | (13 | ) | | $ | 145 |
|
| Deferred acquisition costs/retrocession | (15 | ) | | 15 |
| | (70 | ) |
| Net effect | (4 | ) | | 2 |
| | 75 |
|
| EIAs: | | | | | |
| Unrealized gains (losses) | (46 | ) | | 17 |
| | 40 |
|
| Deferred acquisition costs/retrocession | 23 |
| | (11 | ) | | (26 | ) |
| Net effect | (23 | ) | | 6 |
| | 14 |
|
| Guaranteed minimum benefit riders: | | | | | |
| Unrealized gains (losses) | 5 |
| | (15 | ) | | 32 |
|
| Deferred acquisition costs/retrocession | (21 | ) | | 39 |
| | 50 |
|
| Net effect | (16 | ) | | 24 |
| | 82 |
|
| Related freestanding derivatives | 14 |
| | (29 | ) | | (96 | ) |
| Net effect after related freestanding derivatives | (2 | ) | | (5 | ) | | (14 | ) |
| | | | | | |
| Total net effect of embedded derivatives | (43 | ) | | 32 |
| | 171 |
|
| Related freestanding derivatives | 14 |
| | (29 | ) | | (96 | ) |
| Total net effect after freestanding derivatives | $ | (29 | ) | | $ | 3 |
| | $ | 75 |
|
Results of Operations by Segment
U.S. and Latin America Operations
In the fourth quarter of 2019, the Company changed the name of the Financial Reinsurance business within the U.S. and Latin America Financial Solutions segment to “Capital Solutions”. The name change better describes the product offerings for this part of the U.S. and Latin America's Financial Solutions segment. This change does not affect any previously or future reported results for the U.S. and Latin America Financial Solutions segment.
The U.S. and Latin America operations include business generated by its offices in the U.S., Mexico and Brazil. The offices in Mexico and Brazil provide services to clients in other Latin American countries. U.S. and Latin America operations consist of two major segments: Traditional and Financial Solutions. The Traditional segment primarily specializes in the reinsurance of individual mortality-risk, health and long-term care and to a lesser extent, group reinsurance. The Financial Solutions segment consists of Asset-Intensive and Capital Solutions. Asset-Intensive within the Financial Solutions segment includes coinsurance of annuities and corporate-owned life insurance policies and to a lesser extent, fee-based synthetic guaranteed investment contracts, which include investment-only, stable value contracts. Capital Solutions within the Financial Solutions segment primarily involves assisting ceding companies in meeting applicable regulatory requirements by enhancing the ceding companies’ financial strength and regulatory surplus position through relatively low risk reinsurance and other transactions. Typically, thesecapital solution transactions do not qualify as reinsurance under GAAP, due to the low-risk nature of the transactions, sotherefore only the related net fees are reflected in other revenues on the consolidated statements of income.
|
| | | | | | | | | | | | | | | | |
| For the year ended December 31, 2019 | | | | Financial Solutions | | |
| | | Traditional | | Asset-Intensive | | Capital Solutions | | Total U.S. and Latin America |
| (dollars in millions) | | | | | | | | |
| Revenues: | | | | | | | | |
| Net premiums | | $ | 5,729 |
| | $ | 39 |
| | $ | — |
| | $ | 5,768 |
|
| Investment income, net of related expenses | | 769 |
| | 927 |
| | 4 |
| | 1,700 |
|
| Investment related gains (losses), net | | (18 | ) | | 75 |
| | — |
| | 57 |
|
| Other revenues | | 20 |
| | 137 |
| | 97 |
| | 254 |
|
| Total revenues | | 6,500 |
| | 1,178 |
| | 101 |
| | 7,779 |
|
| Benefits and expenses: | | | | | | | | |
| Claims and other policy benefits | | 5,261 |
| | 197 |
| | — |
| | 5,458 |
|
| Interest credited | | 78 |
| | 540 |
| | — |
| | 618 |
|
| Policy acquisition costs and other insurance expenses | | 752 |
| | 93 |
| | 6 |
| | 851 |
|
| Other operating expenses | | 144 |
| | 33 |
| | 12 |
| | 189 |
|
| Total benefits and expenses | | 6,235 |
| | 863 |
| | 18 |
| | 7,116 |
|
| Income before income taxes | | $ | 265 |
| | $ | 315 |
| | $ | 83 |
| | $ | 663 |
|
|
| | | | | | | | | | | | | | | | |
| For the year ended December 31, 2018 | | | | Financial Solutions | | |
| | | Traditional | | Asset-Intensive | | Capital Solutions | | Total U.S. and
Latin America |
| (dollars in millions) | | | | | | | | |
| Revenues: | | | | | | | | |
| Net premiums | | $ | 5,534 |
| | $ | 27 |
| | $ | — |
| | $ | 5,561 |
|
| Investment income, net of related expenses | | 730 |
| | 700 |
| | 6 |
| | 1,436 |
|
| Investment related gains (losses), net | | 8 |
| | (57 | ) | | — |
| | (49 | ) |
| Other revenues | | 24 |
| | 128 |
| | 103 |
| | 255 |
|
| Total revenues | | 6,296 |
| | 798 |
| | 109 |
| | 7,203 |
|
| Benefits and expenses: | | | | | | | | |
| Claims and other policy benefits | | 5,049 |
| | 130 |
| | — |
| | 5,179 |
|
| Interest credited | | 82 |
| | 312 |
| | — |
| | 394 |
|
| Policy acquisition costs and other insurance expenses | | 739 |
| | 159 |
| | 16 |
| | 914 |
|
| Other operating expenses | | 140 |
| | 29 |
| | 10 |
| | 179 |
|
| Total benefits and expenses | | 6,010 |
| | 630 |
| | 26 |
| | 6,666 |
|
| Income before income taxes | | $ | 286 |
| | $ | 168 |
| | $ | 83 |
| | $ | 537 |
|
|
| | | | | | | | | | | | | | | | |
| For the year ended December 31, 2017 | | | | Financial Solutions | | |
| | | Traditional | | Asset-Intensive | | Capital Solutions | | Total U.S. and
Latin America |
| (dollars in millions) | | | | | | | | |
| Revenues: | | | | | | | | |
| Net premiums | | $ | 5,356 |
| | $ | 24 |
| | $ | — |
| | $ | 5,380 |
|
| Investment income, net of related expenses | | 728 |
| | 770 |
| | 9 |
| | 1,507 |
|
| Investment related gains (losses), net | | (2 | ) | | 145 |
| | — |
| | 143 |
|
| Other revenues | | 18 |
| | 98 |
| | 105 |
| | 221 |
|
| Total revenues | | 6,100 |
| | 1,037 |
| | 114 |
| | 7,251 |
|
| Benefits and expenses: | | | | | | | | |
| Claims and other policy benefits | | 4,761 |
| | 78 |
| | — |
| | 4,839 |
|
| Interest credited | | 82 |
| | 380 |
| | — |
| | 462 |
|
| Policy acquisition costs and other insurance expenses | | 753 |
| | 230 |
| | 23 |
| | 1,006 |
|
| Other operating expenses | | 131 |
| | 28 |
| | 10 |
| | 169 |
|
| Total benefits and expenses | | 5,727 |
| | 716 |
| | 33 |
| | 6,476 |
|
| Income before income taxes | | $ | 373 |
| | $ | 321 |
| | $ | 81 |
| | $ | 775 |
|
IncomeThe following table summarizes income before income taxes increased by $126 million, or 23.5% in 2019. for the Company’s U.S. and Latin America operations for the periods presented:
| | | | | | | | | | | | | | | | | | | | | | |
| For the year ended December 31, | | 2022 | | 2021 | | | | 2022 vs 2021 |
| (dollars in millions) | | | | | | | | |
| Revenues: | | | | | | | | |
| Net premiums | | $ | 6,656 | | | $ | 6,299 | | | | | $ | 357 | |
| Net investment income | | 2,043 | | | 2,019 | | | | | 24 | |
| Investment related gains (losses), net | | (261) | | | 78 | | | | | (339) | |
| Other revenues | | 291 | | | 294 | | | | | (3) | |
| Total revenues | | 8,729 | | | 8,690 | | | | | 39 | |
| Benefits and expenses: | | | | | | | | |
| Claims and other policy benefits | | 6,446 | | | 6,886 | | | | | (440) | |
| Interest credited | | 555 | | | 635 | | | | | (80) | |
| Policy acquisition costs and other insurance expenses | | 1,019 | | | 988 | | | | | 31 | |
| Other operating expenses | | 242 | | | 206 | | | | | 36 | |
| Total benefits and expenses | | 8,262 | | | 8,715 | | | | | (453) | |
| Income (loss) before income taxes | | $ | 467 | | | $ | (25) | | | | | $ | 492 | |
The increase in 2019income before income taxes in 2022 was primarily driven by an increase in premiums and favorable claims experience in the individual mortality line of business, as well as an increase of $42 million due to termination and utilization assumption updates related to individual health disabled life reserves and higher investment income. The increase in income from asset-intensive transactions executed since the third quarter of 2018, includingwas partially offset by higher investment related gains recognized during portfolio reposition.losses and a decrease in the fair value of the embedded derivatives associated with modco/funds withheld treaties within Financial Solutions.
Traditional Reinsurance
Income | | | | | | | | | | | | | | | | | | | | | | |
| For the year ended December 31, | | 2022 | | 2021 | | | | 2022 vs 2021 |
| (dollars in millions) | | | | | | | | |
| Revenues: | | | | | | | | |
| Net premiums | | $ | 6,590 | | | $ | 6,244 | | | | | $ | 346 | |
| Net investment income | | 965 | | | 930 | | | | | 35 | |
| Investment related gains, net | | 48 | | | 6 | | | | | 42 | |
| Other revenues | | 26 | | | 18 | | | | | 8 | |
| Total revenues | | 7,629 | | | 7,198 | | | | | 431 | |
| Benefits and expenses: | | | | | | | | |
| Claims and other policy benefits | | 6,265 | | | 6,720 | | | | | (455) | |
| Interest credited | | 70 | | | 70 | | | | | — | |
| Policy acquisition costs and other insurance expenses | | 842 | | | 792 | | | | | 50 | |
| Other operating expenses | | 184 | | | 156 | | | | | 28 | |
| Total benefits and expenses | | 7,361 | | | 7,738 | | | | | (377) | |
| Income (loss) before income taxes | | $ | 268 | | | $ | (540) | | | | | $ | 808 | |
| Key metrics: | | | | | | | | |
| Life reinsurance in force | | $1,672.2 billion | | $1,628.4 billion | | | | |
| Claims and other policy benefits as a percentage of net premiums (“loss ratios”) | | 95.1 | % | | 107.6 | % | | | | |
| Policy acquisition costs and other insurance expenses as a percentage of net premiums | | 12.8 | % | | 12.7 | % | | | | |
| Other operating expenses as a percentage of net premiums | | 2.8 | % | | 2.5 | % | | | | |
The increase in income before income taxes in 2022 for the U.S. and Latin America Traditional segment decreased by $21 million, or 7.3% in 2019. The decrease in 2019 was primarily due to unfavorablefavorable claims experience within the Individual Mortality business as well as changes in the value of embedded derivatives associated with reinsurance treaties structured on a modco or funds withheld basis. These were partially offset by an increase in variable investment income and improved claims experience within the Group and Individual Health linesindividual mortality line of business.
Net premiums increased $195 million, or 3.5%, in 2019. Revenues
•The increase in 2019net premiums was primarily due to organic growth on existing treaties as well as new sales.business treaties. The segment added new life business production, measured by face amount of insurancereinsurance in force, of $115.8$145.9 billion and $106.5$130.5 billion during 20192022 and 2018,2021, respectively. Total face amount of life business
•The increase in force was $1,619.6 billion, and $1,610.1 billion of December 31, 2019 and 2018, respectively.
Netnet investment income increased $39 million, or 5.3%was primarily the result of higher yields and asset bases in the current year partially offset by lower variable investment income.
•The increase in investment related gains (losses), in 2019, whichnet was due tothe result of an increase in variable investment income from real estate joint venturesthe fair value of the embedded derivatives associated with modco/funds withheld treaties.
Benefits and limited partnerships as well as a higher invested asset base.expenses
Claims and other policy benefits as a percentage of net premiums (“loss ratios”) were 91.8%, and 91.2% in 2019 and 2018, respectively. •The increasedecrease in the loss ratio for 20192022 was primarily due to unfavorablea reduction in COVID-19 claims, experience inmainly within the individual mortality line of business, specifically large claim experience. Largebusiness. While the cause of death is not yet available for all claims, ($1the Company estimates that approximately $336 million or more per claim) can be particularly volatile formof claims for the year ended December 31, 2022, were attributable to year.COVID-19.
Interest credited expense decreased by $4 million, or 4.9%,•The increase in 2019. Interest creditedother operating expenses is primarily attributable to an increase in this segment relates to amounts credited on cash value products, which also have a significant mortality component. Incomeincentive compensation expenses.
Financial Solutions
| | | | | | | | | | | | | | | | | | | | | | | | | | | | | | | | | | | | | | | | | | | | | | | | | | | | | | | | | | | |
| For the year ended December 31, | 2022 | | 2021 | | | | 2022 vs 2021 |
| (dollars in millions) | Asset-Intensive | | Capital Solutions | | Total | | Asset-Intensive | | Capital Solutions | | Total | | | | | | | | Asset-Intensive | | Capital Solutions | | Total |
| Revenues: | | | | | | | | | | | | | | | | | | | | | | | |
| Net premiums | $ | 66 | | | $ | — | | | $ | 66 | | | $ | 55 | | | $ | — | | | $ | 55 | | | | | | | | | $ | 11 | | | $ | — | | | $ | 11 | |
| Net investment income | 1,075 | | | 3 | | | 1,078 | | | 1,087 | | | 2 | | | 1,089 | | | | | | | | | (12) | | | 1 | | | (11) | |
| Investment related gains (losses), net | (309) | | | — | | | (309) | | | 72 | | | — | | | 72 | | | | | | | | | (381) | | | — | | | (381) | |
| Other revenues | 113 | | | 152 | | | 265 | | | 168 | | | 108 | | | 276 | | | | | | | | | (55) | | | 44 | | | (11) | |
| Total revenues | 945 | | | 155 | | | 1,100 | | | 1,382 | | | 110 | | | 1,492 | | | | | | | | | (437) | | | 45 | | | (392) | |
| Benefits and expenses: | | | | | | | | | | | | | | | | | | | | | | | |
| Claims and other policy benefits | 181 | | | — | | | 181 | | | 166 | | | — | | | 166 | | | | | | | | | 15 | | | — | | | 15 | |
| Interest credited | 485 | | | — | | | 485 | | | 565 | | | — | | | 565 | | | | | | | | | (80) | | | — | | | (80) | |
| Policy acquisition costs and other insurance expenses | 174 | | | 3 | | | 177 | | | 192 | | | 4 | | | 196 | | | | | | | | | (18) | | | (1) | | | (19) | |
| Other operating expenses | 46 | | | 12 | | | 58 | | | 37 | | | 13 | | | 50 | | | | | | | | | 9 | | | (1) | | | 8 | |
| Total benefits and expenses | 886 | | | 15 | | | 901 | | | 960 | | | 17 | | | 977 | | | | | | | | | (74) | | | (2) | | | (76) | |
| Income before income taxes | $ | 59 | | | $ | 140 | | | $ | 199 | | | $ | 422 | | | $ | 93 | | | $ | 515 | | | | | | | | | $ | (363) | | | $ | 47 | | | $ | (316) | |
The decrease in income before income taxes is affected by the spread between the investment income and the interest credited on the underlying products.
Policy acquisition costs and other insurance expenses as a percentage of net premiums were 13.1%, and 13.3% in 2019 and 2018, respectively. Overall, these ratios are expected to remain in a predictable range and may fluctuate from period to period due to varying allowance levels within coinsurance-type arrangements. The amortization pattern of previously capitalized amounts, which are subject to the form of the reinsurance agreement and the underlying insurance policies may vary. Also, the mix of first year coinsurance business versus yearly renewable term business can cause the percentage to fluctuate from period to period. In recent years, reinsurance treaties weighted toward yearly renewable term structures have contributed to relatively stable rates.
Other operating expenses increased $4 million, or 2.9%, in 2019. In addition to reflecting normal growth in employee related costs, the increase in operating expenses2022 for 2019 reflects expense growth associated with key business line initiatives focused on enhancing the services and reinsurance options for clients. Other operating expenses, as a percentage of net premiums, were 2.5%, in both 2019 and 2018. The expense ratio tends to fluctuate only slightly from period to period due to maturity and scale of this segment.
Financial Solutions - Asset-Intensive Reinsurance
Asset-Intensive within the U.S. and Latin America Financial Solutions segment was primarily assumesdue to lower investment risk within underlying annuities and other investment oriented products. Mostrelated gains (losses), net primarily due to a decrease in the fair value of these agreements are coinsurance, with some on a coinsurance with embedded derivatives related to modco/funds withheld or modco. treaties and higher net investment related losses in coinsurance portfolios.
The Company recognizes profits or lossesinvested asset base, at amortized cost, supporting this segment decreased to $23.8 billion as of December 31, 2022, from $24.1 billion as of December 31, 2021.
•The decrease in the asset base was primarily due to $1.1 billion of net run off in existing in force transactions, partially offset by $0.9 billion from new transactions.
•As of December 31, 2022 and 2021, $4.2 billion and $4.7 billion, respectively, of the spread between the investment income earned and amounts credited on the underlying deposit liabilities, incomeinvested assets were funds withheld at interest, of which greater than 90% is associated with longevity risk, and fees associated with variable annuity account values and guaranteed investment contracts.two clients.
Impact of certain derivatives
Income from the asset-intensive business tends to be volatile due to changes in the fair value of certain derivatives, including embedded derivatives associated with reinsurance treaties structured on a modco or funds withheld basis, as well as embedded derivatives associated with the Company’s reinsurance of EIAs and variable annuities with guaranteed minimum benefit riders. Fluctuations occur period to period primarily due to changing investment conditions including, but not limited to, interest rate movements (including risk-free rates and credit spreads), implied volatility, the Company’s own credit risk and equity market performance, all of which are factors in the calculations of fair value. Therefore, management believes it is helpful to distinguish between the effects of changes in these derivatives, net of related hedging activity, and the primary factors that drive profitability of the underlying treaties, namely investment income, fee income (included in other revenues), and interest credited. These fluctuations are considered unrealized by management and do not affect current cash flows, crediting rates or spread performance on the underlying treaties.
The following table summarizes the asset-intensive results and quantifies the impact of these embedded derivatives for the periods presented. Revenues before certain derivatives, benefits and expenses before certain derivatives, and income before income taxes and certain derivatives, should not be viewed as substitutes for GAAP revenues, GAAP benefits and expenses, and GAAP income before income taxes.
| | | For the year ended December 31, | | 2019 | | 2018 | | 2017 | For the year ended December 31, | | 2022 | | 2021 | | | 2022 vs 2021 | |
| (dollars in millions) | | | | | | | (dollars in millions) | | | | | | | | |
| Revenues: | | | | | | | Revenues: | | | | |
| Total revenues | | $ | 1,178 |
| | $ | 798 |
| | $ | 1,037 |
| Total revenues | | $ | 945 | | | $ | 1,382 | | | | $ | (437) | | |
| Less: | | | | | | | Less: | | | | |
| Embedded derivatives – modco/funds withheld treaties | | 29 |
| | (21 | ) | | 146 |
| Embedded derivatives – modco/funds withheld treaties | | (221) | | | 101 | | | | (322) | | |
| Guaranteed minimum benefit riders and related free standing derivatives | | (5 | ) | | 6 |
| | (18 | ) | Guaranteed minimum benefit riders and related free standing derivatives | | (29) | | | (78) | | | | 49 | | |
| Revenues before certain derivatives | | 1,154 |
| | 813 |
| | 909 |
| Revenues before certain derivatives | | 1,195 | | | 1,359 | | | | (164) | | |
| Benefits and expenses: | | | | | | | Benefits and expenses: | | | | | | | | |
| Total benefits and expenses | | 863 |
| | 630 |
| | 716 |
| Total benefits and expenses | | 886 | | | 960 | | | | (74) | | |
| Less: | | | | | | | Less: | | | | |
| Embedded derivatives – modco/funds withheld treaties | | 15 |
| | (15 | ) | | 70 |
| Embedded derivatives – modco/funds withheld treaties | | (93) | | | 36 | | | | (129) | | |
| Guaranteed minimum benefit riders and related free standing derivatives | | (3 | ) | | 11 |
| | (5 | ) | Guaranteed minimum benefit riders and related free standing derivatives | | 4 | | | (24) | | | | 28 | | |
| Equity-indexed annuities | | 23 |
| | (6 | ) | | (14 | ) | Equity-indexed annuities | | (28) | | | (22) | | | | (6) | | |
| Benefits and expenses before certain derivatives | | 828 |
| | 640 |
| | 665 |
| Benefits and expenses before certain derivatives | | 1,003 | | | 970 | | | | 33 | | |
| Income (loss) before income taxes: | | | | | | | Income (loss) before income taxes: | | | | | | | | |
| Income before income taxes | | 315 |
| | 168 |
| | 321 |
| Income before income taxes | | 59 | | | 422 | | | | (363) | | |
| Less: | | | | | | | Less: | | | | |
| Embedded derivatives – modco/funds withheld treaties | | 14 |
| | (6 | ) | | 76 |
| Embedded derivatives – modco/funds withheld treaties | | (128) | | | 65 | | | | (193) | | |
| Guaranteed minimum benefit riders and related free standing derivatives | | (2 | ) | | (5 | ) | | (13 | ) | Guaranteed minimum benefit riders and related free standing derivatives | | (33) | | | (54) | | | | 21 | | |
| Equity-indexed annuities | | (23 | ) | | 6 |
| | 14 |
| Equity-indexed annuities | | 28 | | | 22 | | | | 6 | | |
| Income before income taxes and certain derivatives | | $ | 326 |
| | $ | 173 |
| | $ | 244 |
| Income before income taxes and certain derivatives | | $ | 192 | | | $ | 389 | | | | $ | (197) | | |
Embedded Derivatives -– Modco/Funds Withheld Treaties -– Represents the change in the fair value of embedded derivatives on funds withheld at interest associated with treaties written on a modco or funds withheld basis. The fair value changes of embedded derivatives on funds withheld at interest associated with treaties written on a modco or funds withheld basis are reflected in revenues, while the related impact on deferred acquisition expenses is reflected in benefits and expenses. The Company’s utilization of a credit valuation adjustment did not have a material effect on the change in fair value of these embedded derivatives for the years ended December 31, 20192022 and 2018.2021.
The change in fair value of the embedded derivatives -related to modco/funds withheld treaties, increasednet of deferred acquisition costs decreased income before income taxes by $14$128 million in 2019.2022. The increasedecrease in 2019fair value in 2022 was primarily the result of repositioning in the funds withheld portfolio, partially offsetdriven by wideninghigher risk-free interest rates and wider credit spreads.
Guaranteed Minimum Benefit Riders -– Represents the impact related to guaranteed minimum benefits associated with the Company’s reinsurance of variable annuities. The fair value changes of the guaranteed minimum benefits along with the changes in fair value of the free standing derivatives (interest rate swaps, financial futures and equity options), purchased by the Company to substantially hedge the liability are reflected in revenues, while the related impact on deferred acquisition expenses is reflected in benefits and expenses. TheChanges in fair values of the embedded derivatives on guaranteed minimum benefits are net of an increase (decrease) in investment related gains (losses), net of $2 million and $(41) million for 2022 and 2021, respectively, associated with the Company’s utilization of a credit valuation adjustment did not have a material effect on the change in fair value of these embedded derivatives for the years ended December 31, 2019 and 2018.adjustment.
The change in fair value of the guaranteed minimum benefits, after allowing for changes in the associated free standing derivatives, decreaseddecrease income before income taxes by $2$33 million in 2019.2022. The decrease in income for 20192022 is primarily due to assumption updates of $19 million, which included a change in the annual updatebenchmark rate to the secured overnight financing rate, and capital market movements, net of best estimate actual policyholder assumptions, partially offset by favorable hedging results.changes in fair value of the free standing derivatives of $14 million.
Equity-Indexed Annuities -– Represents changes in the liability for equity-indexed annuities in excess of changes in account value, after adjustments for related deferred acquisition expenses. The change in fair value of embedded derivative liabilities associated with equity-indexed annuities increased (decreased) income before income taxes by $(23)$28 million in 2019 . The decrease in income in 2019 was2022, primarily due to an increase in interest rate movements.rates which has the impact of lowering the fair value of the liability.
Discussion and analysis before certain derivatives
•Income before income taxes and certain derivatives increaseddecreased by $153$197 million in 2019,2022, which was primarily due to income from new asset-intensive transactions, includinga decrease in investment related gains recognized during(losses), net of $148 million as a result of portfolio repositioning in coinsurance and funds withheld portfolios. Additionally, the repositioning of investment portfolios related to those new transactions.prior period included favorable prior year policyholder experience.
•Revenue before certain derivatives increaseddecreased by $341$164 million in 2019. The increase in 2019 was2022, primarily due to income from asset-intensive transactions, executed since the third quarter of 2018, includinglower investment related gains recognized during portfolio repositioning.(losses), net in coinsurance and funds withheld portfolios and a change in the fair value of equity options associated with the reinsurance of EIAs, partially offset by a $36 million increase in net investment income related to a funds withheld transaction with is retroceded to a third party. The effects on investment income related to the equity options
and the retroceded funds withheld transaction are substantially offset by a corresponding change in interest credited and other insurance expenses, respectively.
•Benefits and expenses before certain derivatives increased by $188$33 million in 2019. The increase in benefits and expenses in 2019 was2022, primarily due to benefits$34 million higher amortization of deferred acquisition costs associated with investment related gains (losses), net in coinsurance and expenses from asset-intensive transactions executed since the third quarter of 2018.
The invested asset base supporting this segment increased to $24.0 billion as of December 31, 2019 from $20.1 billion as of December 31, 2018. Thefunds withheld portfolios and a $49 million increase in the asset base was due primarilyother insurance expenses related to the coinsurance of $5.3 billion in new in force transactions in 2019. As of December 31, 2019 and 2018, $3.5 billion and $3.8 billion, respectively, of the invested assets werea funds withheld attransaction which is retroceded to a third party. Additionally, the prior period included favorable policyholder experience including impacts from COVID-19 of $13 million. These expense increases were offset by $92 million lower interest of which greater than 90% iscredited associated with one client.
Financial Solutions - Capital Solutionsreinsurance of EIAs. The effect on interest credited related to equity options is substantially offset by a corresponding increase in investment income.
Capital Solutions within the U.S. Financial Solutions segment income before income taxes consists primarily of net fees earned on financial reinsurance and other capital solutions transactions. Additionally, a portion of the business is brokered business in which the Company does not participate in the assumption of risk. The fees earned from financial reinsurance contracts and brokered business are reflected in other revenues, and the fees paid to retrocessionaires are reflected in policy acquisition costs and other insurance expenses.
Income before income taxes for the year ended December 31, 2019U.S. and Latin America Capital Solutions’ business increased $47 million in 2022. The increase was consistent with 2018 as the effect ofprimarily due to a new transaction that closed in the fourth quarter of 2019 was offset by terminations earlier in the year.
At December 31, 2019 and 2018, the amount of business assumed from client companies, as measured by pre-tax statutory surplus, risk based capital and other financial reinsurance structures, was $18.2 billion, and $14.2 billion, respectively. The increases in 2019 were primarily attributed to an increase in the number of new transactions and growthrecapture fee earned on existing transactions.a terminated transaction. Fees earned from this business can vary significantly depending on the size of the transactions and the timing of their completion and therefore can fluctuate from period to period.
Canada Operations
The Company conducts reinsurance business in Canada primarily through RGA Canada, which assists clients with capital management activity and mortality and morbidity risk management. The Canada operations are primarily engaged in Traditional reinsurance, which consists mainly of traditional individual life reinsurance, and to a lesser extent creditor, group life and health, critical illness and disability reinsurance. Creditor insurance covers the outstanding balance on personal, mortgage or commercial loans in the event of death, disability or critical illness and is generally shorter in duration than traditional individual life insurance. The Canada Financial Solutions segment consists of longevity and capital solutions.
| | | | | | | | | | | | | | | | | | | | | | |
| For the year ended December 31, | | 2022 | | 2021 | | | | 2022 vs 2021 |
| (dollars in millions) | | | | | | | | |
| Revenues: | | | | | | | | |
| Net premiums | | $ | 1,314 | | | $ | 1,284 | | | | | $ | 30 | |
| Net investment income | | 239 | | | 248 | | | | | (9) | |
| Investment related gains (losses), net | | 2 | | | 3 | | | | | (1) | |
| Other revenues | | 15 | | | 14 | | | | | 1 | |
| Total revenues | | 1,570 | | | 1,549 | | | | | 21 | |
| Benefits and expenses: | | | | | | | | |
| Claims and other policy benefits | | 1,226 | | | 1,175 | | | | | 51 | |
| Interest credited | | — | | | — | | | | | — | |
| Policy acquisition costs and other insurance expenses | | 182 | | | 190 | | | | | (8) | |
| Other operating expenses | | 44 | | | 41 | | | | | 3 | |
| Total benefits and expenses | | 1,452 | | | 1,406 | | | | | 46 | |
| Income before income taxes | | $ | 118 | | | $ | 143 | | | | | $ | (25) | |
|
| | | | | | | | | | | | |
| For the year ended December 31, 2019 | | Traditional | | Financial Solutions | | Total Canada |
| (dollars in millions) | | | | | | |
| Revenues: | | | | | | |
| Net premiums | | $ | 1,066 |
| | $ | 89 |
| | $ | 1,155 |
|
| Investment income, net of related expenses | | 205 |
| | 3 |
| | 208 |
|
| Investment related gains (losses), net | | 14 |
| | — |
| | 14 |
|
| Other revenues | | 1 |
| | 7 |
| | 8 |
|
| Total revenues | | 1,286 |
| | 99 |
| | 1,385 |
|
| Benefits and expenses: | | | | | | |
| Claims and other policy benefits | | 857 |
| | 80 |
| | 937 |
|
| Interest credited | | — |
| | — |
| | — |
|
| Policy acquisition costs and other insurance expenses | | 224 |
| | 2 |
| | 226 |
|
| Other operating expenses | | 37 |
| | 2 |
| | 39 |
|
| Total benefits and expenses | | 1,118 |
| | 84 |
| | 1,202 |
|
| Income before income taxes | | $ | 168 |
| | $ | 15 |
| | $ | 183 |
|
|
| | | | | | | | | | | | |
| For the year ended December 31, 2018 | | Traditional | | Financial Solutions | | Total Canada |
| (dollars in millions) | | | | | | |
| Revenues: | | | | | | |
| Net premiums | | $ | 1,024 |
| | $ | 43 |
| | $ | 1,067 |
|
| Investment income, net of related expenses | | 199 |
| | 2 |
| | 201 |
|
| Investment related gains (losses), net | | (1 | ) | | — |
| | (1 | ) |
| Other revenues | | 2 |
| | 4 |
| | 6 |
|
| Total revenues | | 1,224 |
| | 49 |
| | 1,273 |
|
| Benefits and expenses: | | | | | | |
| Claims and other policy benefits | | 848 |
| | 37 |
| | 885 |
|
| Interest credited | | — |
| | — |
| | — |
|
| Policy acquisition costs and other insurance expenses | | 231 |
| | 1 |
| | 232 |
|
| Other operating expenses | | 33 |
| | 1 |
| | 34 |
|
| Total benefits and expenses | | 1,112 |
| | 39 |
| | 1,151 |
|
| Income before income taxes | | $ | 112 |
| | $ | 10 |
| | $ | 122 |
|
|
| | | | | | | | | | | | |
| For the year ended December 31, 2017 | | Traditional | | Financial Solutions | | Total Canada |
| (dollars in millions) | | | | | | |
| Revenues: | | | | | | |
| Net premiums | | $ | 902 |
| | $ | 38 |
| | $ | 940 |
|
| Investment income, net of related expenses | | 189 |
| | 5 |
| | 194 |
|
| Investment related gains (losses), net | | 11 |
| | — |
| | 11 |
|
| Other revenues | | 1 |
| | 6 |
| | 7 |
|
| Total revenues | | 1,103 |
| | 49 |
| | 1,152 |
|
| Benefits and expenses: | | | | | | |
| Claims and other policy benefits | | 758 |
| | 30 |
| | 788 |
|
| Interest credited | | — |
| | — |
| | — |
|
| Policy acquisition costs and other insurance expenses | | 192 |
| | 1 |
| | 193 |
|
| Other operating expenses | | 33 |
| | 1 |
| | 34 |
|
| Total benefits and expenses | | 983 |
| | 32 |
| | 1,015 |
|
| Income before income taxes | | $ | 120 |
| | $ | 17 |
| | $ | 137 |
|
IncomeThe decrease in income before income taxes increased by $61 million, or 50.0%, in 2019, which was2022 is primarily due to unfavorable claims experience in the individual mortality and group lines of business and lower investment income, partially offset by favorable mortalitylongevity experience.
•Foreign currency exchange fluctuationfluctuations can result in variances in the financial statement line items. Foreign currency fluctuations in the Canadian dollar resulted in a $5 million decrease in income before income taxes in 2022. Unless otherwise stated, all amounts discussed below are net of $5 million in 2019.foreign currency fluctuations.
Traditional Reinsurance
Income before income taxes increased by $56 million, or 50.0%, in 2019. | | | | | | | | | | | | | | | | | | | | | | |
| For the year ended December 31, | | 2022 | | 2021 | | | | 2022 vs 2021 |
| (dollars in millions) | | | | | | | | |
| Revenues: | | | | | | | | |
| Net premiums | | $ | 1,219 | | | $ | 1,194 | | | | | $ | 25 | |
| Net investment income | | 238 | | | 248 | | | | | (10) | |
| Investment related gains (losses), net | | 2 | | | 3 | | | | | (1) | |
| Other revenues | | 6 | | | 3 | | | | | 3 | |
| Total revenues | | 1,465 | | | 1,448 | | | | | 17 | |
| Benefits and expenses: | | | | | | | | |
| Claims and other policy benefits | | 1,158 | | | 1,096 | | | | | 62 | |
| Interest credited | | — | | | — | | | | | — | |
| Policy acquisition costs and other insurance expenses | | 180 | | | 187 | | | | | (7) | |
| Other operating expenses | | 41 | | | 37 | | | | | 4 | |
| Total benefits and expenses | | 1,379 | | | 1,320 | | | | | 59 | |
| Income before income taxes | | $ | 86 | | | $ | 128 | | | | | $ | (42) | |
| Key metrics: | | | | | | | | |
| Life reinsurance in force | | $463.6 billion | | $472.6 billion | | | | |
| Loss ratios | | 95.0 | % | | 91.8 | % | | | | |
| Policy acquisition costs and other insurance expenses as a percentage of net premiums | | 14.8 | % | | 15.7 | % | | | | |
| Other operating expenses as a percentage of net premiums | | 3.4 | % | | 3.1 | % | | | | |
The increase in income for 2019 was primarily due to favorable individual mortality experience. Foreign currency exchange fluctuation in the Canadian dollar resulted in a decrease in income before income taxes in 2022 is primarily due to unfavorable claims experience in the individual mortality and group lines of $5 million in 2019.business and lower investment income.
Net premiums increased by $42 million, or 4.1%, in 2019. Revenues
•The increase in 2019 was primarily due to a newpremiums is the result of additional life insurance in force block transaction completed in the last quarter of 2018 as well as two non-recurring payments received relating to blocks of existing business totaling $22 million. Foreign currency exchange fluctuation in the Canadian dollar resulted in a decrease in net premiums of $25 million in 2019.force. The segment added new life business production, measured by face amount of insurancereinsurance in force, of $40.4$48.2 billion and $43.1$48.8 billion during 20192022 and 2018,2021, respectively.
Net investment income increased $6 million, or 3.0%, in 2019. •The increasedecrease in net investment income was primarily a result ofdue to decreased variable investment income, partially offset by an increase in the invested asset base due to growthbase.
Benefits and expenses
•The increase in the underlying business volume, partially offset by foreign currency exchange fluctuations of $5 million.
Loss ratios for the segment were 80.4% and 82.8% in 2019 and 2018, respectively. The decrease in the 2019 loss ratio was due to favorable individual mortality experience.
Policy acquisition costs and other insurance expenses as a percentage of net premiums for traditional individual life business were 21.0% and 22.6% in 2019 and 2018, respectively. Overall, while these ratios are expected to remain in a predictable range, and may fluctuate from period to period due to varying allowance levels and product mix. In addition, the amortization pattern of previously capitalized amounts, which are subject to the form of the reinsurance agreement and the underlying insurance policies, may vary.
Other operating expenses increased by $4 million, or 12.1%, in 20192022 was primarily due to higher incentive compensation accruals. Other operating expenses as a percentageunfavorable claims experience in the individual mortality and group lines of net premiumsbusiness. While the cause of death is not yet available for all claims, the Company estimates that approximately $30 million of claims for the year ended December 31, 2022, were 3.5% and 3.2% 2019 and 2018, respectively.attributable to COVID-19.
Financial Solutions
Income before income taxes increased by $5 million, or 50.0%, in 2019. | | | | | | | | | | | | | | | | | | | | | | |
| For the year ended December 31, | | 2022 | | 2021 | | | | 2022 vs 2021 |
| (dollars in millions) | | | | | | | | |
| Revenues: | | | | | | | | |
| Net premiums | | $ | 95 | | | $ | 90 | | | | | $ | 5 | |
| Net investment income | | 1 | | | — | | | | | 1 | |
| Investment related gains (losses), net | | — | | | — | | | | | — | |
| Other revenues | | 9 | | | 11 | | | | | (2) | |
| Total revenues | | 105 | | | 101 | | | | | 4 | |
| Benefits and expenses: | | | | | | | | |
| Claims and other policy benefits | | 68 | | | 79 | | | | | (11) | |
| Interest credited | | — | | | — | | | | | — | |
| Policy acquisition costs and other insurance expenses | | 2 | | | 3 | | | | | (1) | |
| Other operating expenses | | 3 | | | 4 | | | | | (1) | |
| Total benefits and expenses | | 73 | | | 86 | | | | | (13) | |
| Income before income taxes | | $ | 32 | | | $ | 15 | | | | | $ | 17 | |
The increase in income before income taxes in 20192022 was primarily a result of two new transactions and favorable investment income. Foreign currency exchange fluctuation in the Canadian dollar had an immaterial effect on income before income taxes.
Net premiums increased $46 million, or 107.0%, in 2019. The increase in net premiums in 2019 was primarily due to a new longevity transaction completed in 2019. Foreign currency exchange fluctuation in the Canadian dollar resulted in a decrease in net premiums of $2 million in 2019.
Net investment income increased by $1 million, or 50.0%, in 2019, which was primarily due to an increase in the invested asset base.
Claims and other policy benefits increased by $43 million, or 116.2%, in 2019. The increase in 2019 was primarilytermination experience as a result of the aforementioned newincreases in deaths on longevity transaction completedbusiness in 2019. Foreign currency exchange fluctuations in the Canadian dollar resulted in a decrease in claims and other policy benefits2022 as compared to 2021.
Europe, Middle East and Africa Operations
The Europe, Middle East and Africa (“EMEA”) operations includes business generated by its offices principally in France, Germany, Ireland, Italy, the Middle East, the Netherlands, Poland, South Africa, Spain and the United Kingdom (“UK”). EMEA consists of two major segments: Traditional and Financial Solutions. The Traditional segment primarily provides reinsurance through yearly renewable term and coinsurance agreements on a variety of life, health and critical illness products. Reinsurance agreements may be facultative or automatic agreements covering primarily individual risks and, in some markets, group risks. The Financial Solutions segment consists of reinsurance and other transactions associated with longevity closed blocks, payout annuities, capital management solutions and financial reinsurance.
| | | | | | | | | | | | | | | | | | | | | | |
| For the year ended December 31, | | 2022 | | 2021 | | | | 2022 vs 2021 |
| (dollars in millions) | | | | | | | | |
| Revenues: | | | | | | | | |
| Net premiums | | $ | 2,222 | | | $ | 2,088 | | | | | $ | 134 | |
| Net investment income | | 237 | | | 293 | | | | | (56) | |
| Investment related gains (losses), net | | (26) | | | 49 | | | | | (75) | |
| Other revenues | | 20 | | | 13 | | | | | 7 | |
| Total revenues | | 2,453 | | | 2,443 | | | | | 10 | |
| Benefits and expenses: | | | | | | | | |
| Claims and other policy benefits | | 1,965 | | | 2,083 | | | | | (118) | |
| Interest credited | | (24) | | | 4 | | | | | (28) | |
| Policy acquisition costs and other insurance expenses | | 128 | | | 135 | | | | | (7) | |
| Other operating expenses | | 178 | | | 157 | | | | | 21 | |
| Total benefits and expenses | | 2,247 | | | 2,379 | | | | | (132) | |
| Income before income taxes | | $ | 206 | | | $ | 64 | | | | | $ | 142 | |
|
| | | | | | | | | | | | |
| For the year ended December 31, 2019 | | Traditional | | Financial Solutions | | Total EMEA |
| (dollars in millions) | | | | | | |
| Revenues: | | | | | | |
| Net premiums | | $ | 1,442 |
| | $ | 218 |
| | $ | 1,660 |
|
| Investment income, net of related expenses | | 73 |
| | 195 |
| | 268 |
|
| Investment related gains (losses), net | | — |
| | 9 |
| | 9 |
|
| Other revenues | | 5 |
| | 28 |
| | 33 |
|
| Total revenues | | 1,520 |
| | 450 |
| | 1,970 |
|
| Benefits and expenses: | | | | | | |
| Claims and other policy benefits | | 1,205 |
| | 149 |
| | 1,354 |
|
| Interest credited | | — |
| | 26 |
| | 26 |
|
| Policy acquisition costs and other insurance expenses | | 114 |
| | 12 |
| | 126 |
|
| Other operating expenses | | 121 |
| | 40 |
| | 161 |
|
| Total benefits and expenses | | 1,440 |
| | 227 |
| | 1,667 |
|
| Income before income taxes | | $ | 80 |
| | $ | 223 |
| | $ | 303 |
|
|
| | | | | | | | | | | | |
| For the year ended December 31, 2018 | | Traditional | | Financial Solutions | | Total EMEA |
| (dollars in millions) | | | | | | |
| Revenues: | | | | | | |
| Net premiums | | $ | 1,424 |
| | $ | 195 |
| | $ | 1,619 |
|
| Investment income, net of related expenses | | 66 |
| | 134 |
| | 200 |
|
| Investment related gains (losses), net | | — |
| | 1 |
| | 1 |
|
| Other revenues | | 5 |
| | 20 |
| | 25 |
|
| Total revenues | | 1,495 |
| | 350 |
| | 1,845 |
|
| Benefits and expenses: | | | | | | |
| Claims and other policy benefits | | 1,233 |
| | 123 |
| | 1,356 |
|
| Interest credited | | — |
| | (7 | ) | | (7 | ) |
| Policy acquisition costs and other insurance expenses | | 99 |
| | 4 |
| | 103 |
|
| Other operating expenses | | 108 |
| | 33 |
| | 141 |
|
| Total benefits and expenses | | 1,440 |
| | 153 |
| | 1,593 |
|
| Income before income taxes | | $ | 55 |
| | $ | 197 |
| | $ | 252 |
|
|
| | | | | | | | | | | | |
| For the year ended December 31, 2017 | | Traditional | | Financial Solutions | | Total EMEA |
| (dollars in millions) | | | | | | |
| Revenues: | | | | | | |
| Net premiums | | $ | 1,301 |
| | $ | 164 |
| | $ | 1,465 |
|
| Investment income, net of related expenses | | 56 |
| | 123 |
| | 179 |
|
| Investment related gains (losses), net | | — |
| | 5 |
| | 5 |
|
| Other revenues | | 5 |
| | 19 |
| | 24 |
|
| Total revenues | | 1,362 |
| | 311 |
| | 1,673 |
|
| Benefits and expenses: | | | | | | |
| Claims and other policy benefits | | 1,096 |
| | 143 |
| | 1,239 |
|
| Interest credited | | — |
| | 11 |
| | 11 |
|
| Policy acquisition costs and other insurance expenses | | 92 |
| | 2 |
| | 94 |
|
| Other operating expenses | | 104 |
| | 31 |
| | 135 |
|
| Total benefits and expenses | | 1,292 |
| | 187 |
| | 1,479 |
|
| Income before income taxes | | $ | 70 |
| | $ | 124 |
| | $ | 194 |
|
Income before income taxes increased by $51 million, or 20.2%, in 2019. The increase in income before income taxes for 2019 was primarily due to favorable performance in the closed block longevity and payout annuity business, as well as favorable individual mortality and morbidity experience and increased business volumes. Foreign currency exchange fluctuations resulted in a decrease in income before income taxes of $13 million in 2019.
Traditional Reinsurance
Income before income taxes increased by $25 million, or 45.5%, in 2019. The increase in income before income taxes in 20192022 was primarily the result of increased net premiums and favorable claims experience, partially offset by decreases in net investment income and investment related gains (losses), net.
•Foreign currency fluctuations can result in variances in the financial statement line items. Foreign currency fluctuations resulted in a $19 million decrease in income before income taxes in 2022, the majority of which impacted the Financial Solutions segment. Unless otherwise stated, all amounts discussed below are net of foreign currency fluctuations.
•An earthquake with a 7.8 magnitude struck eastern Turkey in the early hours on February 6, 2023. The current death toll in Turkey is estimated to be in excess of 40,000, plus more than 100,000 were injured. Although the Company does not currently expect a material financial impact due to the earthquake it continues to monitor the situation.
Traditional Reinsurance
| | | | | | | | | | | | | | | | | | | | | | |
| For the year ended December 31, | | 2022 | | 2021 | | | | 2022 vs 2021 |
| (dollars in millions) | | | | | | | | |
| Revenues: | | | | | | | | |
| Net premiums | | $ | 1,736 | | | $ | 1,738 | | | | | $ | (2) | |
| Net investment income | | 89 | | | 88 | | | | | 1 | |
| Investment related gains (losses), net | | — | | | — | | | | | — | |
| Other revenues | | 5 | | | 1 | | | | | 4 | |
| Total revenues | | 1,830 | | | 1,827 | | | | | 3 | |
| Benefits and expenses: | | | | | | | | |
| Claims and other policy benefits | | 1,573 | | | 1,829 | | | | | (256) | |
| Interest credited | | — | | | — | | | | | — | |
| Policy acquisition costs and other insurance expenses | | 123 | | | 125 | | | | | (2) | |
| Other operating expenses | | 124 | | | 112 | | | | | 12 | |
| Total benefits and expenses | | 1,820 | | | 2,066 | | | | | (246) | |
| Income (loss) before income taxes | | $ | 10 | | | $ | (239) | | | | | $ | 249 | |
| Key metrics: | | | | | | | | |
| Life reinsurance in force | | $735.4 billion | | $861.6 billion | | | | |
| Loss ratios | | 90.6 | % | | 105.2 | % | | | | |
| Policy acquisition costs and other insurance expenses as a percentage of net premiums | | 7.1 | % | | 7.2 | % | | | | |
| Other operating expenses as a percentage of net premiums | | 7.1 | % | | 6.4 | % | | | | |
The increase in income before income taxes in 2022 is primarily due to an improvement in individual life mortality and morbidity experience. Foreign currency exchange fluctuations resulted in a decrease in income before income taxes
Net premiums increased by $18 million, or 1.3%, in 2019, which was primarily due to increased business volumes on existing treaties partially offset by treaty terminations.
Revenues
•The segment added new life business production, measured by face amount of insurancereinsurance in force, of $147.4$169.4 billion and $190.2$198.4 billion during 20192022 and 2018,2021, respectively. The face amount ofreduction in premiums and reinsurance in force totaled $776.4 billionwas negatively impacted by the strengthening of the U.S. Dollar compared to the British Pound, Euro and $716.3 billion, at December 31, 2019South African Rand.
Benefits and 2018, respectively. Foreign currency fluctuations unfavorably affectedexpenses
•The decrease in the face amount of reinsurance in force by $19.2 billion and $41.4 billion in 2019 and 2018, respectively. Foreign currency exchange fluctuations resulted inloss ratio was due to improved mortality experience due to a decrease in net premiums of $77 millionCOVID-19 claims, primarily in 2019. The segment’s primary currencies are the British pound, the EuroSouth Africa and the South African rand.UK. While the cause of death is not available for all claims, the Company estimates that approximately $17 million of claims were attributable to COVID-19.
A portion of the net premiums for the segment relates to reinsurance of critical illness coverage, primarily•The increase in the UK. This coverage provides a benefit in the event of the diagnosis of a pre-defined critical illness. Net premiums earned from this coverage totaled $178 million and $188 million in 2019 and 2018, respectively.
Net investment income increased by $7 million, or 10.6%, in 2019, whichother operating expenses was primarily due to an increase in the invested asset base resulting from business growth. Foreign currency exchange fluctuations resulted in a decrease in net investment income of $4 million in 2019.
Loss ratios for this segment were 83.6% and 86.7% in 2019 and 2018, respectively. The decrease in loss ratio in 2019 was due to normal claims variability associated with individual mortality and morbidity business and changes in business mix.
Policy acquisition costs and other insurance expenses as a percentage of net premiums were 7.9% and 7.0% for 2019 and 2018, respectively. The increase in the policy acquisition cost ratio in 2019 was due primarily to changes in the mix of business.
Other operating expenses increased by $13 million, or 12.0%, in 2019. The increase in 2019 was in line with expected expense levels required to support the business as well as higher incentive-based compensation. Foreign currency exchange fluctuations resulted in a decrease in other operating expenses of $6 million in 2019. Other operating expenses as a percentage of net premiums totaled 8.4% and 7.5% 2019 and 2018, respectively.incentive compensation expenses.
Financial Solutions
Income before income taxes increased by $26 million, or 13.2%, in 2019. | | | | | | | | | | | | | | | | | | | | | | |
| For the year ended December 31, | | 2022 | | 2021 | | | | 2022 vs 2021 |
| (dollars in millions) | | | | | | | | |
| Revenues: | | | | | | | | |
| Net premiums | | $ | 486 | | | $ | 350 | | | | | $ | 136 | |
| Net investment income | | 148 | | | 205 | | | | | (57) | |
| Investment related gains (losses), net | | (26) | | | 49 | | | | | (75) | |
| Other revenues | | 15 | | | 12 | | | | | 3 | |
| Total revenues | | 623 | | | 616 | | | | | 7 | |
| Benefits and expenses: | | | | | | | | |
| Claims and other policy benefits | | 392 | | | 254 | | | | | 138 | |
| Interest credited | | (24) | | | 4 | | | | | (28) | |
| Policy acquisition costs and other insurance expenses | | 5 | | | 10 | | | | | (5) | |
| Other operating expenses | | 54 | | | 45 | | | | | 9 | |
| Total benefits and expenses | | 427 | | | 313 | | | | | 114 | |
| Income before income taxes | | $ | 196 | | | $ | 303 | | | | | $ | (107) | |
The increase in 2019 was primarily due to favorable performance in the closed block longevity and payout annuity businesses. Foreign currency exchange fluctuations resulted in a decrease in income before income taxes in 2022 is primarily due to decreases in net investment income, investment related gains (losses), net and increased volume of $9 millionclaims, partially offset by increases in 2019.net premiums.
Net premiums increased by $23 million, or 11.8%, in 2019. Revenues
•The increase in net premiums was primarily due to higher new businessincreased volumes ofon closed longevity block business. Foreign currency exchange fluctuations resulted in a decrease
•The decreases in net premiums of $10 million in 2019.
Net investment income increased $61 million, or 45.5%, in 2019. The increase in investment income in 2019 was primarily due to an increased invested asset yield as a result of repositioning a portion of the portfolio to higher yielding assets such as lifetime mortgages, increased invested asset base resulting from business growth, and an increase in investmentlower income associated with unit-linked policies which fluctuate with market performance. The effect on investment income related to unit-linked products is substantiallyperformance and are offset by a corresponding changedecrease in interest credited. Foreign currency exchange fluctuations resulted in acredited related to the unit-linked liabilities.
•The decrease in investment income of $9 million in 2019.
Other revenues increased by $8 million, or 40.0% in 2019. The increase in 2019 in other revenuesrelated gains (losses), net was primarily due to a recapture fee associated withfluctuations in the early terminationfair market value of a transactionCPI swap derivatives due to changes in future inflation expectations and other feeslower investment related to new transactions. Fees earned from this business can vary significantly dependinggains on the size of the transactionsfixed-income securities.
Benefits and the timing of their completion and, therefore, can fluctuate from period to period.expenses
Claims•The increase in claims and other policy benefits was the result of increased $26 million, or 21.1%, in 2019, which was primarily due to business growthvolumes and a normalizationadverse experience of performance on the closed longevity block longevity business compared to favorable performance in 2018.business.
Interest credited expense increased by $33 million in 2019. Interest credited includes amounts credited to the contractholders of unit-linked products. This amount will fluctuate according to contractholder investment selections, equity returns and interest rates. The effect on interest credited related to unit-linked products is substantially offset by a corresponding change in investment income.
Other operating expenses increased by $7 million, or 21.2%, in 2019. •The increase in other operating expenses in 2019 was primarily due to normal growth in operations and an increase in acquisition related costs. Foreign currency exchange fluctuations resulted in a decrease in operating expensesincentive compensation expenses.
Asia Pacific Operations
The Asia Pacific operations include business generated by its offices principally in Australia, China, Hong Kong, India, Japan, Malaysia, New Zealand, Singapore, South Koreathroughout Asia and Taiwan.Australia. The Traditional segment’s principal types of reinsurance include individual and group life and health, critical illness, disability and superannuation. Reinsurance agreements may be facultative or automatic agreements covering primarily individual risks, and in some markets, group risks. Superannuation is the Australian government mandated compulsory retirement savings program. Superannuation funds accumulate retirement funds for employees, and, in addition, typically offer life and disability insurance coverage. The Financial Solutions segment includes financial reinsurance, asset-intensive and certain disability and life blocks.
| | | | | | | | | | | | | | | | | | | | | | |
| For the year ended December 31, | | 2022 | | 2021 | | | | 2022 vs 2021 |
| (dollars in millions) | | | | | | | | |
| Revenues: | | | | | | | | |
| Net premiums | | $ | 2,886 | | | $ | 2,842 | | | | | $ | 44 | |
| Net investment income | | 414 | | | 274 | | | | | 140 | |
| Investment related gains (losses), net | | (193) | | | 18 | | | | | (211) | |
| Other revenues | | 192 | | | 61 | | | | | 131 | |
| Total revenues | | 3,299 | | | 3,195 | | | | | 104 | |
| Benefits and expenses: | | | | | | | | |
| Claims and other policy benefits | | 2,409 | | | 2,632 | | | | | (223) | |
| Interest credited | | 119 | | | 57 | | | | | 62 | |
| Policy acquisition costs and other insurance expenses | | 269 | | | 215 | | | | | 54 | |
| Other operating expenses | | 226 | | | 203 | | | | | 23 | |
| Total benefits and expenses | | 3,023 | | | 3,107 | | | | | (84) | |
| Income before income taxes | | $ | 276 | | | $ | 88 | | | | | $ | 188 | |
|
| | | | | | | | | | | | |
| For the year ended December 31, 2019 | | Traditional | | Financial Solutions | | Total Asia Pacific |
| (dollars in millions) | | | | | | |
| Revenues: | | | | | | |
| Net premiums | | $ | 2,568 |
| | $ | 146 |
| | $ | 2,714 |
|
| Investment income, net of related expenses | | 104 |
| | 46 |
| | 150 |
|
| Investment related gains (losses), net | | — |
| | 9 |
| | 9 |
|
| Other revenues | | 9 |
| | 27 |
| | 36 |
|
| Total revenues | | 2,681 |
| | 228 |
| | 2,909 |
|
| Benefits and expenses: | | | | | | |
| Claims and other policy benefits | | 2,317 |
| | 131 |
| | 2,448 |
|
| Interest credited | | — |
| | 31 |
| | 31 |
|
| Policy acquisition costs and other insurance expenses | | 92 |
| | 25 |
| | 117 |
|
| Other operating expenses | | 167 |
| | 18 |
| | 185 |
|
| Total benefits and expenses | | 2,576 |
| | 205 |
| | 2,781 |
|
| Income before income taxes | | $ | 105 |
| | $ | 23 |
| | $ | 128 |
|
|
| | | | | | | | | | | | |
| For the year ended December 31, 2018 | | Traditional | | Financial Solutions | | Total Asia Pacific |
| (dollars in millions) | | | | | | |
| Revenues: | | | | | | |
| Net premiums | | $ | 2,296 |
| | $ | 1 |
| | $ | 2,297 |
|
| Investment income, net of related expenses | | 96 |
| | 40 |
| | 136 |
|
| Investment related gains (losses), net | | — |
| | (10 | ) | | (10 | ) |
| Other revenues | | 25 |
| | 23 |
| | 48 |
|
| Total revenues | | 2,417 |
| | 54 |
| | 2,471 |
|
| Benefits and expenses: | | | | | | |
| Claims and other policy benefits | | 1,885 |
| | 14 |
| | 1,899 |
|
| Interest credited | | — |
| | 26 |
| | 26 |
|
| Policy acquisition costs and other insurance expenses | | 195 |
| | 3 |
| | 198 |
|
| Other operating expenses | | 159 |
| | 17 |
| | 176 |
|
| Total benefits and expenses | | 2,239 |
| | 60 |
| | 2,299 |
|
| Income before income taxes | | $ | 178 |
| | $ | (6 | ) | | $ | 172 |
|
|
| | | | | | | | | | | | |
| For the year ended December 31, 2017 | | Traditional | | Financial Solutions | | Total Asia Pacific |
| (dollars in millions) | | | | | | |
| Revenues: | | | | | | |
| Net premiums | | $ | 2,053 |
| | $ | 3 |
| | $ | 2,056 |
|
| Investment income, net of related expenses | | 92 |
| | 34 |
| | 126 |
|
| Investment related gains (losses), net | | — |
| | 14 |
| | 14 |
|
| Other revenues | | 65 |
| | 23 |
| | 88 |
|
| Total revenues | | 2,210 |
| | 74 |
| | 2,284 |
|
| Benefits and expenses: | | | | | | |
| Claims and other policy benefits | | 1,636 |
| | 18 |
| | 1,654 |
|
| Interest credited | | — |
| | 22 |
| | 22 |
|
| Policy acquisition costs and other insurance expenses | | 278 |
| | 5 |
| | 283 |
|
| Other operating expenses | | 147 |
| | 16 |
| | 163 |
|
| Total benefits and expenses | | 2,061 |
| | 61 |
| | 2,122 |
|
| Income before income taxes | | $ | 149 |
| | $ | 13 |
| | $ | 162 |
|
IncomeThe increase in income before income taxes decreasedwas primarily due to favorable claims experience, increases in net premiums and net investment income, partially offset by $44unfavorable fluctuations in the fair value of derivatives within the Financial Solutions business.
•Foreign currency fluctuations can result in variances in the financial statement line items, foreign currency fluctuations resulted in a $12 million or 25.6%,increase in 2019. income before income taxes in 2022. Unless otherwise stated, all amounts discussed below are net of foreign currency fluctuations.
Traditional Reinsurance
| | | | | | | | | | | | | | | | | | | | | | |
| For the year ended December 31, | | 2022 | | 2021 | | | | 2022 vs 2021 |
| (dollars in millions) | | | | | | | | |
| Revenues: | | | | | | | | |
| Net premiums | | $ | 2,650 | | | $ | 2,624 | | | | | $ | 26 | |
| Net investment income | | 142 | | | 136 | | | | | 6 | |
| Investment related gains (losses), net | | 12 | | | (1) | | | | | 13 | |
| Other revenues | | 19 | | | 19 | | | | | — | |
| Total revenues | | 2,823 | | | 2,778 | | | | | 45 | |
| Benefits and expenses: | | | | | | | | |
| Claims and other policy benefits | | 2,152 | | | 2,445 | | | | | (293) | |
| Interest credited | | — | | | — | | | | | — | |
| Policy acquisition costs and other insurance expenses | | 171 | | | 159 | | | | | 12 | |
| Other operating expenses | | 206 | | | 184 | | | | | 22 | |
| Total benefits and expenses | | 2,529 | | | 2,788 | | | | | (259) | |
| Income before income taxes | | $ | 294 | | | $ | (10) | | | | | $ | 304 | |
| Key metrics: | | | | | | | | |
| Life reinsurance in force | | $518.6 billion | | $497.4 billion | | | | |
| Loss ratios | | 81.2 | % | | 93.2 | % | | | | |
| Policy acquisition costs and other insurance expenses as a percentage of net premiums | | 6.5 | % | | 6.1 | % | | | | |
| Other operating expenses as a percentage of net premiums | | 7.8 | % | | 7.0 | % | | | | |
The increase in income before income taxes in 2022 is primarily the result of favorable claims experience and an increase in net premiums.
Revenues
•The increase in net premiums was primarily due to continued business growth in the segment.
•The segment added new life business production, measured by face amount of reinsurance in force, of $45.3 billion and $34.2 billion during 2022 and 2021, respectively, due to new business production and in force transactions.
Benefits and expenses
•The decrease in the loss ratio for 2022 was primarily due to favorable claims experience across the segment due to improved COVID-19 experience, primarily in India, and favorable claims experience, primarily in Hong Kong. While the cause of death is not yet available for all claims, the Company estimates that approximately $37 million of claims for the year ended December 31, 2022, were attributable to COVID-19 which includes medical hospitalization claims in Japan for at-home sickness benefits related to COVID-19.
•The increase in other operating expenses was primarily due to an increase in incentive compensation expenses.
Financial Solutions
| | | | | | | | | | | | | | | | | | | | | | |
| For the year ended December 31, | | 2022 | | 2021 | | | | 2022 vs 2021 |
| (dollars in millions) | | | | | | | | |
| Revenues: | | | | | | | | |
| Net premiums | | $ | 236 | | | $ | 218 | | | | | $ | 18 | |
| Net investment income | | 272 | | | 138 | | | | | 134 | |
| Investment related gains (losses), net | | (205) | | | 19 | | | | | (224) | |
| Other revenues | | 173 | | | 42 | | | | | 131 | |
| Total revenues | | 476 | | | 417 | | | | | 59 | |
| Benefits and expenses: | | | | | | | | |
| Claims and other policy benefits | | 257 | | | 187 | | | | | 70 | |
| Interest credited | | 119 | | | 57 | | | | | 62 | |
| Policy acquisition costs and other insurance expenses | | 98 | | | 56 | | | | | 42 | |
| Other operating expenses | | 20 | | | 19 | | | | | 1 | |
| Total benefits and expenses | | 494 | | | 319 | | | | | 175 | |
| Income before income taxes | | $ | (18) | | | $ | 98 | | | | | $ | (116) | |
The decrease in income before income taxes in 2019 was the result of unfavorable claims experience as compared to the prior year across the segment, partially offset by income from new business growth within the Financial Solutions business. Foreign currency exchange fluctuations resulted in an increase in income before income taxes of $4 million in 2019.
Traditional Reinsurance
Income before income taxes decreased by $73 million, or 41.0%, in 2019. The decrease in income before income taxes in 2019 was2022 is primarily due to unfavorable claims experience as compared to prior year across the segment. Foreign currency exchange fluctuations resulted in an increase in income before income taxes of $3 million in 2019.
Net premiums increased by $272 million, or 11.8%, in 2019. The increase in net premiums for 2019 was primarily driven by new business as well as in force growth in Asian markets offset by reductions to Australian group business driven by new legislation that was effective July 2019. The segment added new business production, measured by face amount of insurance in force, of $69.7 billion and $66.9 billion during 2019 and 2018, respectively. The face amount of reinsurance in force totaled $662.0 billion and $616.9 billion at December 31, 2019 and 2018, respectively. Foreign currency fluctuations unfavorably affected the face amount of reinsurance in force by $1.0 billion in 2019. Foreign currency exchange fluctuations resulted in a decrease in net premiums of $65 million in 2019.
A portion of the net premiums for the segment relates to reinsurance of critical illness coverage. This coverage provides a benefit in the eventfair value of the diagnosis of a pre-defined critical illness. Reinsurance of critical illness in the Asia Pacific Traditional segment is offered primarily in South Korea, Australia, China and Hong Kong. Net premiums from this coverage totaled $1,055 million and $806 million in 2019 and 2018, respectively.
Net investment income increased $8 million, or 8.3%, in 2019.derivatives. The increase in 2019 was primarily due to an increase in invested asset base, partially offset by a lower investment yield and foreign currency fluctuations. Foreign currency exchange fluctuations resulted in a decrease in net investment incomeat amortized cost, supporting asset-intensive transactions increased to $12.2 billion as of $4 million in 2019.
Other revenues decreased by $16 million, or 64.0%, in 2019. The decrease in other revenues in 2019 wasDecember 31, 2021, primarily related to a $10 million recapture fee in 2018 associated with one transaction in Australia as well as as variances in foreign currency gains and losses. Foreign currency exchange fluctuations resulted in a decrease in other revenues of $1 million in 2019.
Loss ratios for this segment were 90.2% and 82.1% for 2019 and 2018, respectively. The increase in the loss ratio in 2019 was primarily due to unfavorable claims experience compared to the prior year across the segment.
Policy acquisition costs and other insurance expenses as a percentageresult of net premiums were 3.6%, and 8.5% for 2019 and 2018, respectively. These percentages fluctuate due to timing of client company reporting, premium refunds, variations in the mixture of business and the relative maturity of the business. In addition, as the segment grows, renewal premiums, which have lower allowances than first-year premiums, represent a greater percentage of the total net premiums. Experience adjustments in Asia resulted in reduced policy acquisition costs and other insurance expenses in 2019.
Other operating expenses increased $8 million, or 5.0%, in 2019, which was due to increased compensation costs, primarily in the growing Asian operations. Foreign currency exchange fluctuations resulted in a decrease in operating expenses of $5 million in 2019. Other operating expenses as a percentage of net premiums totaled 6.5%, and 6.9% in 2019 and 2018, respectively.
Financial Solutions
Income before income taxes increased by $29 million in 2019. The increase in income before income taxes in 2019 was primarily due to new business growth in Asia. Foreign currency exchange fluctuations resulted in an increase in income before income taxes of $1 million in 2019.
Net premiums increased by $145 million in 2019. The increase was primarily due to new asset-intensive transactions in Asia.
Net investment income increased $6 million, or 15.0%, in 2019. The increase in investment income in 2019 was primarily due to an increase in invested asset base from new asset-intensive transactions, partially offset by a lower investment yield and foreign currency fluctuations. Foreign currency exchange fluctuations resulted in a decrease in net investment income of $1 million.
Other revenues increased by $4 million, or 17.4%, in 2019, which was primarily due to higher income from new financial reinsurance transactions.executed during the year. The amount of reinsurance assumed from client companies, as measured by pre-tax statutory surplus, risk based capital and other financial reinsurance structures was $3.9$1.1 billion and $2.9$1.6 billion atfor the year ended December 31, 20192022 and 2018,2021, respectively. Fees earned from this business can vary significantly depending on the size, complexity and timing of the transactions and the timing of their completion and, therefore, can fluctuate from period to period.
Claims and other policy benefits increased by $117 millionRevenues
•The increase in 2019, which wasnet premiums is primarily due to new asset-intensive transactions executed during the year.
•The increase in Asia.
Other operating expenses increased by $1 million, or 5.9%, in 2019. The timing of premium flows andnet investment income is due to the level of costs associated with the entrance into and development of new marketsgrowth in the Asia Pacific Financial Solutions segment causesinvested asset base.
•The decrease in investment related gains (losses), net was primarily due to the decrease in fair value of derivatives of $144 million due to the weakening of the Japanese yen, higher interest rates, widening credit spreads and losses due to investment activity of $86 million.
•The increase in other operatingrevenues was primarily attributable to surrender and market value adjustment charges on a single premium annuity block of business of $134 million due to higher lapses, which was partially offset by an increase in policy acquisition costs of $36 million.
Benefits and expenses
•The increase in claims and other policy benefits was primarily attributable to fluctuate over periodsmedical hospitalization claims in Japan for at-home sickness benefits related to COVID-19 of time.$31 million.
Corporate and Other
Corporate and Other revenues primarily include investment income from unallocated invested assets, investment related gains and losses and service fees. Corporate and Other expenses consist of the offset to capital charges allocated to the operating segments within the policy acquisition costs and other insurance income line item, unallocated overhead and executive costs, interest expense related to debt, and the investment income and expense associated with the Company’s Funding Agreement Backed Notes (“FABN”) program, collateral finance and securitization transactions and service business expenses. Additionally, Corporate and Other includes results from certain wholly-owned subsidiaries, such as RGAx, and joint ventures that, among other activities, develop and market technology, and provide consulting and outsourcing solutions for the insurance and reinsurance industries. In the past two years, theThe Company has increased its investment and expendituresinvests in this area in an effort to both support its clients and accelerate the development of new solutions and services to increase consumer engagement within the life insurance industry and hence generate new future revenue streams.
| | | | | | | | | | | | | | | | | | | | | | |
| For the year ended December 31, | | 2022 | | 2021 | | | | 2022 vs 2021 |
| (dollars in millions) | | | | | | | | |
| Revenues: | | | | | | | | |
| Net premiums | | $ | — | | | $ | — | | | | | $ | — | |
| Net investment income | | 228 | | | 304 | | | | | (76) | |
| Investment related gains (losses), net | | (28) | | | 412 | | | | | (440) | |
| Other revenues | | 7 | | | 65 | | | | | (58) | |
| Total revenues | | 207 | | | 781 | | | | | (574) | |
| Benefits and expenses: | | | | | | | | |
| Claims and other policy benefits | | — | | | — | | | | | — | |
| Interest credited | | 32 | | | 4 | | | | | 28 | |
| Policy acquisition costs and other insurance income | | (99) | | | (112) | | | | | 13 | |
| Other operating expenses | | 319 | | | 329 | | | | | (10) | |
| Interest expense | | 184 | | | 127 | | | | | 57 | |
| Collateral finance and securitization expense | | 7 | | | 12 | | | | | (5) | |
| Total benefits and expenses | | 443 | | | 360 | | | | | 83 | |
| Income/(loss) before income taxes | | $ | (236) | | | $ | 421 | | | | | $ | (657) | |
|
| | | | | | | | | | | | |
| For the year ended December 31, | | 2019 | | 2018 | | 2017 |
| (dollars in millions) | | | | | | |
| Revenues: | | | | | | |
| Net premiums | | $ | — |
| | $ | — |
| | $ | — |
|
| Investment income, net of related expenses | | 194 |
| | 166 |
| | 149 |
|
| Investment related gains (losses), net | | 2 |
| | (111 | ) | | (5 | ) |
| Other revenues | | 61 |
| | 29 |
| | 12 |
|
| Total revenues | | 257 |
| | 84 |
| | 156 |
|
| Benefits and expenses: | | | | | | |
| Claims and other policy benefits | | — |
| | — |
| | (1 | ) |
| Interest credited | | 22 |
| | 12 |
| | 7 |
|
| Policy acquisition costs and other insurance income | | (116 | ) | | (124 | ) | | (109 | ) |
| Other operating expenses | | 294 |
| | 256 |
| | 209 |
|
| Interest expense | | 173 |
| | 147 |
| | 146 |
|
| Collateral finance and securitization expense | | 29 |
| | 30 |
| | 29 |
|
| Total benefits and expenses | | 402 |
| | 321 |
| | 281 |
|
| Loss before income taxes | | $ | (145 | ) | | $ | (237 | ) | | $ | (125 | ) |
LossThe decrease in income before income taxes decreased by $92 million in 2019. The decrease in loss before income taxes for 2019 was2022 is primarily due to increaseda decrease in total revenues and higher interest expense and interest credited.
•Net investment income for the year ended December 31, 2021, includes a one-time adjustment of $92 million of pre-tax unrealized gains on certain limited partnerships, for which the Company uses the equity method of accounting, from AOCI to net of related expenses, decreased investment related losses, and increased other revenuesincome. The unrealized gains should have been recognized directly in net investment income in the same prior periods they were reported as earnings by the investees. Excluding this adjustment, the increase in net investment income is attributable to higher investment income on Corporate invested assets due to a higher asset base. Higher investment income includes income earned on assets associated with the Company’s FABN program, which is partially offset by increased operating andhigher interest expense.credited related to the program.
Net•Investment related gains (losses), net for the year ended December 31, 2021, includes an adjustment to investments in limited partnerships considered to be investment income increased by $28companies, which should have been recognized in prior periods, of $70 million to adjust the carrying value from cost less impairments to the fair value approach, using the net asset value (“NAV”) per share or 16.9%its equivalent. The remaining decrease in investment related gains (losses), in 2019. The increase in 2019 wasnet is attributable to increased unallocated invested assets as result of the 2019 debt issuance.
Net investment related losses decreased by $113 million in 2019. The decrease in net investment related losses in 2019 was due to net gains on the salesales of fixed maturity securities of $25 millionin the current period compared to lossesgains in the prior year of $55 millionperiod, lower unrealized gains on limited partnerships, changes in allowances and an increaseimpairments on mortgage loans and available-for-sale securities and changes in the fair value of equity securities and derivatives as a result of $37 million comparedfluctuations in foreign exchange rates, interest rates and equity markets.
•The decrease in other revenues was primarily due to a decline in 2018 of $24 million, which were partially offset by a $3 millionthe cash surrender value on corporate-owned life insurance compared to an increase in investment impairments.value for the prior year, as well as gains on the sales of subsidiaries in the prior period of $11 million. Additionally, foreign currency losses reduced other revenues.
Other revenues increased by $32 million, or 110.3%, in 2019. •The increase in 2019 was mainly due to a recapture of a collateral finance transaction, which resulted in a $13 million fee paid to the Company. In addition, the Company’s RGAx operations contributed $46 million to other revenues compared to $30 million in 2018.
Policy acquisition costs and other insurance income increased by $8 million, or 6.5%, in 2019. Fluctuations period over period were attributable to the offset to capital charges allocated to the operating segments.
Other operating expenses increased by $38 million, or 14.8%, in 2019. The increasedecrease in other operating expenses during 2019 was dueattributable to growtha decrease in strategic initiatives, such as RGAx, andretirement benefit related costs partially offset by increased incentive-based compensation.incentive compensation expense.
Interest expense increased by $26 million, or 17.7%, in 2019. •The increase in interest expense resulted primarily fromis due to the issuance of $600the 7.125% fixed-rate reset subordinated debentures due October 15, 2052, with a face amount of $700 million in long-term debt in May 2019, which wasthe third quarter of 2022, partially offset by the repaymentredemption of $400the 2042 Debentures. In addition, 2021 interest expense included the reversal of approximately $32 million of long-term debt in November, andaccrued interest associated with the variability in tax-related interest expense.recognition of uncertain tax positions due to the expiration of the statute of limitations.
Liquidity and Capital Resources
Overview
The Company believes that cash flows from the source of funds available to it will provide sufficient cash flows for the next twelve months to satisfy the current liquidity requirements of the Company under various scenarios that include the potential risk of early recapture of reinsurance treaties, market events and higher than expected claims.claims associated with COVID-19 or otherwise. The Company performs periodic liquidity stress testing to ensure its asset portfolio includes sufficient high quality liquid assets that could be utilized to bolster its liquidity position under stress scenarios. These assets could be utilized as collateral for secured borrowing transactions with various third parties or by selling the securities in the open market if needed. The Company’s liquidity requirements have been and will continue to be funded through net cash flows from operations. However, in the event of significant unanticipated cash requirements beyond normal liquidity needs, the Company has multiple liquidity alternatives available based on market conditions and the amount and timing of the liquidity need. These alternatives include borrowings under committed credit facilities, secured borrowings, the ability to issue long-term debt, preferred securities or common equity and, if necessary, the sale of invested assets subject to market conditions.conditions, borrowings under committed credit facilities, secured borrowings, and if necessary issuing long-term debt, preferred securities or common equity.
Current Market Environment
The Company’s average investment yield, excluding spread related business, for 20192022 was at 4.56%4.69%, 1130 basis points abovebelow the comparable 2018 rate. However,2021 rate due to decreased variable income from limited partnership investments. The average yield will vary from year to year depending on several variables, including the currentprevailing risk-fee interest rate and credit spread environment, continuesprepayment fees and make-whole premiums, changes in the mix of the underlying investments and cash and cash equivalents balances. Variable investment income from joint ventures and limited partnerships will also vary from year to put downward pressureyear and is highly dependent on the Company’s investment yield.timing of dividends and distributions on certain investments. The Company’s insurance liabilities, in particular its annuity products, are sensitive to changing market factors. average investment yield, excluding variable investment income, was 4.00%, 3.81%, and 3.93% for 2022, 2021 and 2020, respectively.
Due to decreasesincreases in risk free interest rates, gross unrealized gains on fixed maturity securities available-for-sale increaseddecreased from $1.9$5.3 billion at December 31, 20182021, to $4.5$0.6 billion at December 31, 2019.2022. Gross unrealized losses decreasedincreased from $748 million$0.3 billion at December 31, 20182021 to $110 million$7.3 billion at December 31, 2019.
2022. The Company continues to be in a position to hold any investment security showing an unrealized loss until recovery, provided it remains comfortable with the credit of the issuer. As indicated above, gross unrealized gains on investment securities of $4.5 billion remain well in excess of gross unrealized losses of $110 million as of December 31, 2019. The Company does not rely on short-term funding or commercial paper and to date it has experienced no liquidity pressure, nor does it anticipate such pressure in the foreseeable future.
The Company projects its reserves to be sufficient and it would not expect to write down deferred acquisition costs or be required to take any actions to augment capital, even if interest rates remain at current levels for the next five years, assuming all other factors remain constant. To mitigate disintermediation risk, the Company purchased swaptions to protect it against a material increase in interest rates. While the Company has felt the pressures of sustained low interest rates, followed by the recent significant increase in risk-free rates, and volatile equity markets, and may continue to do so, its business and results of operations are not overly sensitive to these risks. Mortality and morbidity risks continue to be the most significant risk for the Company. Although management believes the Company’s current capital base is adequate to support its business at current operating levels, it continues to monitor new business opportunities and any associated new capital needs that could arise from the changing financial landscape.
The Holding Company
RGA is an insurance holding company whose primary uses of liquidity include, but are not limited to, the immediate capital needs of its operating companies, dividends paid to its shareholders, repurchase of common stock and interest payments on its indebtedness. The primary sources of RGA’s liquidity include proceeds from its capital-raising efforts, interest income on undeployed corporate investments, interest income received on surplus notes with RGA Reinsurance, RCMRGA Life and Annuity and Rockwood Re and dividends from operating subsidiaries. As the Company continues its expansiongrowth efforts, RGA will continue to be dependent upon these sources of liquidity. See “Part IV – Item 15(a)(2) Financial Statement Schedules – Schedule II – Condensed Financial Information of Registrant” for more information regarding RGA’s financial information.
RGA, through wholly-owned subsidiaries, has committed to provide statutory reserve support to third parties, in exchange for a fee, by funding loans if certain defined events occur. Such statutory reserves are required under the U.S. Valuation of Life Policies Model Regulation (commonly referred to as Regulation XXX for term life insurance policies and Regulation A-XXX for universal life secondary guarantees). The third-parties have recourse to RGA should the subsidiary fail to provide the required funding, however, as of December 31, 2019,2022, the Company does not believe that it will be required to provide any funding under these commitments as the occurrence of the defined events is considered remote. See Note 12 -– “Commitments, Contingencies and Guarantees” in the Notes to Consolidated Financial Statements for a table that presents these commitments by period and maximum obligation.
RGA established an intercompany revolving credit facility where certain subsidiaries can lend to or borrow from each other and from RGA in order to manage capital and liquidity more efficiently. The intercompany revolving credit facility, which is a series of demand loans among RGA and its affiliates, is permitted under applicable insurance laws. This facility reduces overall borrowing costs by allowing RGA and its operating companies to access internal cash resources instead of incurring third-party transaction costs. The statutory borrowing and lending limit for RGA’s Missouri-domiciled insurance subsidiaries is currently 3% of the insurance company’s admitted assets as of its most recent year-end. There were borrowings of $196$304 million and $21$192 million
outstanding under the intercompany revolving credit facility as of December 31, 20192022 and 2018,2021, respectively. In addition to loans associated with the intercompany revolving credit facility, RGA and its subsidiary,subsidiaries, RGA Capital LLC,Americas and RGA International Division Sydney Office Pty Limited, provided loans to RGA Australian Holdings Pty Limited with a total outstanding balance of $42$41 million and $44 million as of December 31, 20192022 and 2018.2021, respectively.
The Company believes that it has sufficient liquidity forDuring 2020, RGA established an intercompany derivative cash collateral pool where RGA and certain subsidiaries pool derivative cash collateral into a single concentration account. This derivative cash collateral pool allows RGA and its affiliates to lend or borrow cash from the next 12 monthsconcentration account in order to fundmore efficiently meet its cash needscollateral obligations under various scenarios that includetheir respective derivative transactions. Cash surplus in RGA or its affiliates accounts is transferred to the potential risk of early recapture of reinsurance treatiesconcentration account and higher than expected deathany deficit is funded by the concentration account, thereby creating a loan balance. RGA and morbidity claims. Historically, the Company has generated positive net cash flows from operations. However,its subsidiaries participating in the event of significant unanticipated cash requirements beyond normal liquidity, the Company has multiple liquidity alternatives availablepool are paid or charged an arm’s length interest rate based on market conditions and the amount and timing ofnet loan balance with the liquidity need. These options include borrowings under committed credit facilities, secured borrowings, the ability to issue long-term debt, preferred securities or common equity and, if necessary, the sale of invested assets, subject to market conditions.concentration account.
Undistributed earnings of the Company’s foreign subsidiaries are generally targeted for reinvestment outside of the U.S. As of December 31, 2019,2022, the amount of cash and cash equivalents and short-term investments held by the Company’s subsidiaries that are taxed in a foreign jurisdiction was $720$919 million. The Global Intangible Low-Taxed Income (“GILTI”) and Subpart F provisions of U.S. Tax Reform generally eliminate U.S. federal income tax deferral on earnings of foreign subsidiaries, while the dividend received deduction generally allows for tax-free repatriation of any untaxed earnings. Therefore, the Company does not expect to incur any material incremental U.S. federal income tax on repatriation of these earnings. Incremental foreign withholding taxes are not expected to be material.
RGA endeavors to maintain a capital structure that provides financial and operational flexibility to its subsidiaries, credit ratings that support its competitive position in the financial services marketplace, and shareholder returns. As part of the Company’s capital deployment strategy, it has in recent years repurchased shares of RGA common stock and paid dividends to RGA shareholders, as authorized by the board of directors. InOn January 2017,24, 2019, RGA’s board of directors authorized a share repurchase program with no expiration date, to repurchasefor up to $400 million of RGA’s outstanding common stock. During the year ended December 31, 2022, the Company repurchased 219,116 shares of common stock under this program for $25 million.
On January 24, 2019,February 25, 2022, RGA’s board of directors authorized a share repurchase program for up to $400 million of RGA’s outstanding common stock. The authorization was effective immediately and does not have an expiration date. In connection with this new authorization, the board of directors terminated the stock repurchase authority granted in 2017. 2019. During the year ended December 31, 2022, RGA repurchased 380,138 shares of common stock under this program for $50 million.
The pace of repurchase activity depends on various factors such as the level of available cash, an evaluation of the costs and benefits associated with alternative uses of excess capital, such as acquisitions and in force reinsurance transactions, and RGA’s stock price.
Details underlying dividend and share repurchase program activity were as follows (in millions, except share data):
| | | | | | | | | | | | | | | | | |
| 2022 | | 2021 | | 2020 |
| Dividends to shareholders | $ | 205 | | | $ | 194 | | | $ | 182 | |
Purchase of common stock (1) | 75 | | | 96 | | | 153 | |
| Total amount paid to shareholders | $ | 280 | | | $ | 290 | | | $ | 335 | |
| | | | | |
Number of common shares purchased (1) | 599,254 | | | 852,037 | | | 1,074,413 | |
| Average price per share | $ | 125.15 | | | $ | 112.67 | | | $ | 142.05 | |
|
| | | | | | | | | | | |
| | 2019 | | 2018 | | 2017 |
| Dividends to shareholders | $ | 163 |
| | $ | 140 |
| | $ | 117 |
|
Repurchases of treasury stock (1) | 80 |
| | 284 |
| | 27 |
|
| Total amount paid to shareholders | $ | 243 |
| | $ | 424 |
| | $ | 144 |
|
| | | | | | |
Number of shares repurchased (1) | 546,614 |
| | 1,932,055 |
| | 208,680 |
|
| Average price per share | $ | 146.00 |
| | $ | 146.75 |
| | $ | 128.89 |
|
(1)Excludes shares utilized to execute and settle certain stock incentive awards.
RGA declared dividends totaling $2.60$3.06 per share in 2019.2022. All future payments of dividends are at the discretion of RGA’s board of directors and will depend on the Company’s earnings, capital requirements, insurance regulatory conditions, operating conditions, and other such factors as the board of directors may deem relevant. The amount of dividends that RGA can pay will depend in part on the operations of its reinsurance subsidiaries.
See Note 13 -– “Debt” and Note 17 -– “Equity” in the Notes to Consolidated Financial Statements for additional information regarding the Company’s securities transactions.
Statutory Dividend Limitations
RCM, RGA Life and Annuity, RGA Reinsurance and Chesterfield Re are subject to Missouri statutory provisions that restrict the payment of dividends. They may not pay dividends in any 12-month period in excess of the greater of the prior year’s statutory net gain from operations or 10% of statutory capital and surplus at the preceding year-end, without regulatory approval. Aurora National is subject to California statutory provisions that are identical to those imposed by Missouri regarding the ability of Aurora National to pay dividends to RGA Reinsurance. The applicable statutory provisions only permit an insurer to pay a shareholder dividend from unassigned surplus. Any dividends paid by RGA Reinsurance would be paid to RCM,RGA Life and Annuity, its parent company, which in turn has restrictions related to its ability to pay dividends to RGA. Chesterfield Re would pay dividends to its immediate parent Chesterfield Financial, which would in turn pay dividends to RCM, subject to the terms of the indenture for the embedded value securitization transaction, in which Chesterfield Financial cannot declare or pay any dividends so long as any private placement notes are outstanding.RGA Life and Annuity. The MDCI allows RCMRGA Life and Annuity to pay a dividend to RGA to the extent RCMRGA Life and Annuity received the dividend from its subsidiaries,
without limitation related to the level of unassigned surplus. Dividend payments from other subsidiaries are subject to regulations in the jurisdiction of domicile, which are generally based on their earnings and/or capital level.
The dividend limitations for RCM,RGA Life and Annuity, RGA Reinsurance and Chesterfield Re are based on statutory financial results. Statutory accounting practices differ in certain respects from accounting principles used in financial statements prepared in conformity with GAAP. Significant differences include the treatment of deferred acquisition costs, deferred income taxes, required investment reserves, reserve calculation assumptions and surplus notes.
Dividend payments from non-U.S. operations are subject to similar restrictions established by local regulators. The non-U.S. regulatory regimes also commonly limit the dividend payments to the parent to a portion of the prior year’s statutory income, as determined by the local accounting principles. The regulators of the Company’s non-U.S. operations may also limit or prohibit profit repatriations or other transfers of funds to the U.S. if such transfers are deemed to be detrimental to the solvency or financial strength of the non-U.S. operations, or for other reasons. Most of the non-U.S. operating subsidiaries are second tier subsidiaries that are owned by various non-U.S. holding companies. The capital and rating considerations applicable to the first tier subsidiaries may also impact the dividend flowdividends paid to RGA.
Debt
Certain of the Company’s debt agreements contain financial covenant restrictions related to, among others, liens, the issuance and disposition of stock of restricted subsidiaries, minimum requirements of consolidated net worth, maximum ratios of debt to capitalization and change of control provisions. The Company is required to maintain a minimum consolidated net worth, as defined in the debt agreements, of $5.3 billion, calculated as of the last day of each fiscal quarter. Also, consolidated indebtedness, calculated as of the last day of each fiscal quarter, cannot exceed 35% of the sum of the Company’s consolidated indebtedness plus adjusted consolidated stockholders’ equity. A material ongoing covenant default could require immediate payment of the amount due, including principal, under the various agreements. Additionally, the Company’s debt agreements contain cross-defaultcross-acceleration covenants, which would make outstanding borrowings immediately payable in the event of a material uncured covenant default under any of the agreements, including, but not limited to, non-payment of indebtedness when due for an amount in excess of the amounts set forth in those agreements, bankruptcy proceedings, or any other event that results in the acceleration of the maturity of indebtedness.
As of December 31, 20192022 and 2018,2021, the Company had $3.0$4.0 billion and $2.8$3.7 billion, respectively, in outstanding borrowings under its debt agreements and was in compliance with all covenants under those agreements. As of December 31, 20192022 and 2018,2021, the average interest rate on long-term debt outstanding was 4.82%4.71% and 5.24%4.42%, respectively. The ability of the Company to make debt principal and interest payments depends on the earnings and surplus of its subsidiaries, investment earnings on undeployed capital proceeds, available liquidity at the holding company, and the Company’s ability to raise additional funds.
On September 23, 2022, RGA issued 7.125% fixed-rate reset subordinated debentures due October 15, 2052, with a face amount of $700 million. This security has been registered with the Securities and Exchange Commission. The net proceeds were approximately $690 million. Concurrent with the debt offering, on September 15, 2022, RGA announced a cash tender offer for any and all of its outstanding 6.20% Fixed-to-Floating Rate Subordinated Debentures due 2042 (the “2042 Debentures”) at a price of $25.20 for each $25 principal amount of 2042 Debentures. The tender offer expired on September 22, 2022, and a total of $151 million or approximately 38%, of the aggregate principal amount of the 2042 Debentures were tendered. The Company redeemed the remaining 2024 Debentures on December 15, 2022. The remaining proceeds from the debt offering will be used for general corporate purposes. Capitalized issue costs were approximately $10 million.
On December 13, 2021, RGA Reinsurance issued 4.00% Surplus Notes due in 2051, with a face amount of $500 million. The net proceeds were approximately $494 million and will be used for general corporate purposes.
The Company enters into derivative agreements with counterparties that reference either the Company’s debt rating or its financial strength rating. If either rating is downgraded in the future, it could trigger certain terms in the Company’s
derivative agreements, which could negatively affect overall liquidity. For the majority of the Company’s derivative agreements, there is a termination event, at the Company’s option, should the long-term senior debt ratings drop below either BBB+ (S&P) or Baa1 (Moody’s) or the financial strength ratings drop below either A- (S&P) or A3 (Moody’s).
The Company may borrow up to $850 million in cash and obtain letters of credit in multiple currencies on its syndicated revolving credit facility that matures in August 2023. As of December 31, 2019,2022, the Company had no cash borrowings outstanding and $20$1 million in issued, but undrawn, letters of credit under this facility.
On May 15, 2019, RGA issued 3.9% Senior Notes due May 15, 2029 with a face amount of $600 million. This security has been registered with the Securities and Exchange Commission. The net proceeds were approximately $594 million and were used in part to repay upon maturity the Company’s $400 million 6.45% Senior Notes that matured in November 2019. The remainder will be used for general corporate purposes. Capitalized issue costs were approximately $5 million.
Based on the historic cash flows and the current financial results of the Company, management believes RGA’s cash flows will be sufficient to enable RGA to meet its obligations for at least the next 12twelve months.
Letters of Credit
The Company has obtained bank letters of credit in favor of various affiliated and unaffiliated insurance companies from which the Company assumes business. These letters of credit represent guarantees of performance under the reinsurance agreements and allow ceding companies to take statutory reserve credits. Certain of these letters of credit contain financial covenant restrictions similar to those described in the “Debt” discussion above. At December 31, 2019,2022, there were approximately $62$128 million of outstanding bank letters of credit in favor of third parties. Additionally, in accordance with applicable regulations, the Company utilizes letters of credit to secure statutory reserve credits when it retrocedes business to its affiliated subsidiaries. The Company cedes business to its affiliates to help reduce the amount of regulatory capital required in certain jurisdictions, such as the U.S. and the UK. The Company believes the capital required to support the business in the affiliates reflects more realistic expectations
than the original jurisdiction of the business, where capital requirements are often considered to be quite conservative. As of December 31, 2019, $1.22022, $1.5 billion in letters of credit from various banks were outstanding, but undrawn, backing reinsurance between the various subsidiaries of the Company. See Note 13—“Debt”13 – “Debt” in the Notes to Consolidated Financial Statements for information regarding the Company’s letter of credit facilities.
Collateral Finance and Securitization Notes and Statutory Reserve Funding
The Company uses various internal and third-party reinsurance arrangements and funding sources to manage statutory reserve strain, including reserves associated with the U.S. Valuation of Life Policies Model Regulation (commonly referred to as Regulation XXX) and principles-based reserves (commonly referred to PBR), and the associated collateral requirements. Assets in trust and letters of credit are often used as collateral in these arrangements.
Regulation XXX, implemented in the U.S. for various types of life insurance business beginning January 1, 2000, significantly increased the level of reserves that U.S. life insurance and life reinsurance companies must hold on their statutory financial statements for various types of life insurance business, primarily certain level premium term life products. The reserve levels required under Regulation XXX increase over time and are normally in excess of reserves required under GAAP. In situations where primary insurers have reinsured business to reinsurers that are unlicensed and unaccredited in the U.S., the reinsurer must provide collateral equal to its reinsurance reserves in order for the ceding company to receive statutory financial statement credit. In order to manage the effect of Regulation XXX on its statutory financial statements, RGA Reinsurance has retroceded a majority of Regulation XXX reserves to unaffiliated and affiliated reinsurers, both licensed and unlicensed.
Effective in 2017, PBR is permitted in the U.S. During 2016, the NAIC amended the standard valuation law to adopt life PBR that was effective January 1, 2017, allowing a three-year adoption period. The Company adopted PBR in 2020. Under PBR, reserves are determined based on terms of the reinsurance agreement which may differ from those of the direct policies.
RGA Reinsurance’s statutory capital may be significantly reduced if the unlicensed unaffiliated or affiliated reinsurer is unable to provide the required collateral to support RGA Reinsurance’s statutory reserve credits and RGA Reinsurance cannot find an alternative source for collateral.
The Company has issued both collateral finance and securitization notes. The consolidated balance sheets include outstanding notes of $598 millionDuring 2021, the Company’s subsidiary, Chesterfield Financial Holdings, LLC, as issuer, called and $682 millionfully redeemed the securitization notes. During 2022, the Company’s subsidiary, Timberlake Financial L.L.C, as of December 31, 2019issuer, called and 2018, respectively.fully redeemed the collateral financing notes. See Note 14 -– “Collateral Finance and Securitization Notes” in the Notes to Consolidated Financial Statements for additional information regarding the Company’s collateral finance and securitization notes.
The demand for financing of the ceded reserve credits associated with the Company’s assumed term life business has grown at a slower rate in recent years. The Company has been able to utilize its certified reinsurer, RGA Americas, as a means of reducing the burden of financing PBR, Regulation XXX and other types of reserves. The Company’s PBR and Regulation XXX statutory reserve requirements associated with term life business and other statutory reserve requirements continues to require the Company to obtain additional letters of credit, put additional assets in trust, or utilize other funding mechanisms to support reserve credits. If the Company is unable to support the reserve credits, the regulatory capital levels of several of its subsidiaries may be significantly reduced, while the regulatory capital requirements for these subsidiaries would not change.
The reduction in regulatory capital would not directly affect the Company’s consolidated shareholders’ equity under GAAP; however, it could affect the Company’s ability to write new business and retain existing business.
Affiliated captives are commonly used in the insurance industry to help manage statutory reserve and collateral requirements. The NAIC has analyzed the insurance industry’s use of affiliated captive reinsurers to satisfy certain reserve requirements and hasin 2014 adopted measures to promote uniformity in both the approval and supervision of such reinsurers. New standardscaptives reinsuring business subject to address the use of captive reinsurers were implemented,Regulation XXX, allowing current captives to continue in accordance with their currently approved plans. State insurance regulators that regulateReinsuring business subject to the Company’s domestic insurance companies have placed additional restrictions on the useprovisions of newly established captive reinsurers, which may increaseActuarial Guideline 48 increases costs and addadds complexity. As
In the U.S., the introduction of the certified reinsurer has provided an alternative way to manage collateral requirements. In 2014, RGA Americas was designated as a result,certified reinsurer by the MDCI. In addition, the introduction of the reciprocal jurisdiction reinsurer has provided another alternative way to manage collateral requirements. In 2022, RGA Americas was designated as a reciprocal jurisdiction reinsurer by the MDCI. These designations allow the Company may need to alterretrocede business to RGA Americas in lieu of using captives for collateral requirements. Therefore, the type and volume of business it reinsures, increase prices on those products, raise additional capitalCompany has chosen not to support higher regulatory reserves or implement higher cost strategies, all of which could adversely affect the Company’s competitive position and its results of operations. establish captives subject to Actuarial Guideline 48.
It is also possible that the NAIC could place limits on the recognition of the Company’s capital held in related party captives when adopting its group capital calculation. Doing so would adversely impact the amount of capital that the group would otherwise be able to recognize and report as capital resident in the group.
In the U.S., the introduction of the certified reinsurer has provided an alternative way to manage collateral requirements. In 2014, RGA Americas was designated as a certified reinsurer by the MDCI. This designation allowsgroup, potentially requiring the Company to retrocede business to RGA Americas in lieurestructure or change the financing of using captives for collateral requirements. Effective in 2017, principles-based reserves are permitted in the U.S. During 2016, the NAIC amended the standard valuation law to adopt life principles-based reserving that was effective January 1, 2017, allowing a three-year adoption period. The Company has chosen not to establish new captives while it evaluates the impact of principles-based reserving upon its overall risk management and financing programs, but continues to evaluate the effectiveness of the certified reinsurer option for financing its reserve growth compared to the option of establishing captives under the U.S. post-2014 regulations.captives.
Assets in Trust
The Company enters into reinsurance treaties in the ordinary course of business. In some cases, if the credit rating and/or defined statutory measures of the Company declines to certain levels, the reinsurance treaty would require the Company to post collateral or additional collateral to secure the Company’s obligations under such reinsurance treaty, obtain guarantees, permit the ceding company to recapture such reinsurance treaty, or some other negotiated remedy. As of December 31, 2019,2022, neither the Company nor its subsidiaries have been required to post additional collateral or have had a reinsurance treaty recaptured as a result of a credit downgrade or a defined statutory measure decline.
In addition, certain reinsurance treaties require the Company to place assets in trust at the time of closing to collateralize its obligations to the ceding company. Assets placed in trust continue to be owned by the Company, but their beneficial ownership and use are restricted based on the terms of the trust agreement. Securities with an amortized cost of $2.8$3.7 billion were held in trust for the benefit of the Company’s subsidiaries to satisfy collateral requirements for reinsurance business at December 31, 2019.2022. Additionally, securities with an amortized cost of $27.3$31.5 billion as of December 31, 2019,2022, were held in trust to satisfy collateral requirements under certain third-party reinsurance treaties. Under certain conditions, the Company may be obligated to move reinsurance from one subsidiary to another subsidiary, post additional collateral or make payments under a given reinsurance treaty. These conditions include change in control or ratings of the subsidiary, insolvency, nonperformance under a reinsurance treaty, or loss of license or other regulatory authorization of such subsidiary. If the Company was ever required to move reinsurance from one subsidiary to another subsidiary, the risk to the Company on a consolidated basis under the reinsurance treaties would not change; however, additional collateral may need to be posted or additional capital may be required due to the change in jurisdiction of the subsidiary reinsuring the business, which could lead to a strain on liquidity.
Proceeds from the notes issued by Timberlake Financial and RGA’s direct investment in Timberlake Financial were deposited into a series of trust accounts as collateral and are not available to satisfy the general obligations of the Company. As of December 31, 2019 the Company held deposits in trust and in custody of $694 million for this purpose, which is not included in the figures above. A reserve account has been established to cover interest payments on notes issued by Chesterfield Financial that are not available to satisfy the general obligations of the Company. As of December 31, 2019 the Company held deposits in trust of $15 million for this purpose, which is not included in the figures above. See “Collateral Finance and Securitization Notes and Statutory Reserve Funding” above for additional information on the Timberlake Financial and Chesterfield Financial notes.
Reinsurance Operations
Reinsurance treaties, whether facultative or automatic, generally provide recapture provisions. Most U.S.-based reinsurance treaties include a recapture right for ceding companies, generally after 10 years. Outside of the U.S., treaties primarily include a mutually agreed-upon recapture provision. Recapture rights permit the ceding company to reassume all or a portion of the risk formerly ceded to the reinsurer. In some situations, the Company has the right to place assets in trust for the benefit of the ceding company in lieu of recapture. Additionally, certain treaties may grant recapture rights to ceding companies in the event of a significant decrease in RGA Reinsurance’s NAIC risk based capital ratio or financial strength rating. The RBC ratio trigger varies by treaty, with the majority between 125% and 225% of the NAIC’s company action level. Financial strength rating triggers vary by reinsurance treaty with the majority of the triggers reached if the Company’s financial strength rating falls five notches from its current rating of “AA-” to the “BBB” level on the S&P scale. Recapture of business previously ceded does not affect premiums ceded prior to the recapture of such business, but would reduce premiums in subsequent periods. Upon recapture, the Company would reflect a net gain or loss on the settlement of the assets and liabilities associated with the reinsurance treaty. In some cases, the ceding company is required to pay the Company a recapture fee.
Guarantees
The Company has issued guarantees to third parties on behalf of its subsidiaries for the payment of amounts due under certain reinsurance treaties, securities borrowing arrangements, financing arrangements and office lease obligations, whereby if a subsidiary fails to meet an obligation, the Company or one of its other subsidiaries will make a payment to fulfill the obligation. In limited circumstances, treaty guarantees are granted to ceding companies in order to provide additional security, particularly in cases where the Company’s subsidiary is relatively new, unrated, or not of significant size, relative to the ceding company. Potential guaranteed amounts of future payments will vary depending on production levels and underwriting results. Guarantees related to borrowed securities provide additional security to third parties should a subsidiary fail to return the borrowed securities when due. The Company has issued payment guarantees on behalf of two of its subsidiaries in the event the subsidiaries fail to make payment under their office lease obligations. See Note 12 -– “Commitments, Contingencies and Guarantees” in the Notes to Consolidated Financial Statements for a table that presents the amounts for guarantees, by type, issued by the Company.
In addition, the Company indemnifies its directors and officers pursuant to its charters and by-laws. Since this indemnity generally is not subject to limitation with respect to duration or amount, the Company does not believe that it is possible to determine the maximum potential amount due under this indemnity in the future.
Off-Balance Sheet Arrangements
The Company has commitments to fund investments in limited partnerships, joint ventures, commercial mortgage loans, lifetime mortgages, private placement investments and bank loans, including revolving credit agreements. See Note 12 -– “Commitments, Contingencies and Guarantees” in the Notes to Consolidated Financial Statements for additional information on the Company’s commitments to fund investments and other off-balance sheet arrangements.
The Company has not engaged in trading activities involving non-exchange-traded contracts reported at fair value, nor has it engaged in relationships or transactions with persons or entities that derive benefits from their non-independent relationship with the Company.
Cash Flows
The Company’s principal cash inflows from its reinsurance operations include premiums and deposit funds received from ceding companies. The primary liquidity concerns with respect to these cash flows are early recapture of the reinsurance contract by the ceding company and lapses of annuity products reinsured by the Company. The Company’s principal cash inflows from its invested assets result from investment income and the maturity and sales of invested assets. The primary liquidity concerns with respect to these cash inflows relates to the risk of default by debtors and interest rate volatility. The Company manages these risks very closely. See “Investments” and “Interest Rate Risk” below.
Additional sources of liquidity to meet unexpected cash outflows in excess of operating cash inflows and current cash and equivalents on hand include selling short-term investments or fixed maturity securities andalso includes drawing funds under a syndicated revolving credit facility, under which the Company had availability of $850$849 million as of December 31, 2019.2022. The Company also has $1.2$1.1 billion of funds available through collateralized borrowings from the Federal Home Loan Bank of Des Moines (“FHLB”) as of December 31, 2019.2022. As of December 31, 2019,2022, the Company could have borrowed these additional amounts without violating any of its existing debt covenants.
The Company’s principal cash outflows relate to the payment of claims liabilities, interest credited, operating expenses, income taxes, dividends to shareholders, purchases of treasury stock, and principal and interest under debt and other financing obligations. The Company seeks to limit its exposure to loss on any single insured and to recover a portion of benefits paid by ceding reinsurance to other insurance enterprises or reinsurers under excess coverage and coinsurance contracts (See Note 2 – “Significant Accounting Policies and Pronouncements” ofin the Notes to Consolidated Financial Statements). The Company performs annual financial reviews of its retrocessionaires to evaluate financial stability and performance. The Company has never experienced a material default in connection with retrocession arrangements, nor has it experienced any difficulty in collecting claims recoverable from retrocessionaires; however, no assurance can be given as to the future performance of such retrocessionaires nor to the recoverability of future claims. The Company’s management believes its cash and cash equivalents along with its current sources of liquidity are adequate to meet its cash requirements for the next 12 months.twelve months, despite the uncertainty associated with the pandemic.
Summary of Primary Sources and Uses of Liquidity and Capital
The Company’s primary sources and uses of liquidity and capital are summarized as follows (dollars in millions):
|
| | | | | | | | | | | | |
| | | For the years ended December 31, |
| | | 2019 | | 2018 | | 2017 |
| Sources: | | | | | |
| | Net cash provided by operating activities | $ | 2,307 |
| | $ | 1,581 |
| | $ | 1,983 |
|
| | Proceeds from long-term debt issuance | 599 |
| | — |
| | — |
|
| | Exercise of stock options, net | 6 |
| | 3 |
| | 7 |
|
| | Change in cash collateral for derivatives and other arrangements | — |
| | 44 |
| | — |
|
| | Cash provided by changes in universal life and other | | | | | |
| | investment type policies and contracts | 200 |
| | 170 |
| | 265 |
|
| | Effect of exchange rate changes on cash | 11 |
| | — |
| | 53 |
|
| | Total sources | 3,123 |
| | 1,798 |
| | 2,308 |
|
| | | | | | | |
| Uses: | | | | | |
| | Net cash used in investing activities | 2,638 |
| | 637 |
| | 1,608 |
|
| | Dividends to stockholders | 163 |
| | 140 |
| | 117 |
|
| | Repayment of collateral finance and securitization notes | 91 |
| | 96 |
| | 68 |
|
| | Debt issuance costs | 5 |
| | — |
| | — |
|
| | Principal payments of long-term debt | 403 |
| | 3 |
| | 303 |
|
| | Purchases of treasury stock | 101 |
| | 300 |
| | 44 |
|
| | Change in cash collateral for derivatives and other arrangements | 163 |
| | — |
| | 65 |
|
| | Effect of exchange rate changes on cash | — |
| | 36 |
| | — |
|
| | Total uses | 3,564 |
| | 1,212 |
| | 2,205 |
|
| Net change in cash and cash equivalents | $ | (441 | ) | | $ | 586 |
| | $ | 103 |
|
| | | | | | | | | | | | | | | | | | | | |
| | For the years ended December 31, |
| | 2022 | | 2021 | | 2020 |
| Sources: | | | | | |
| Net cash provided by operating activities | $ | 1,343 | | | $ | 4,182 | | | $ | 3,322 | |
| Proceeds from offering of common stock, net | — | | | — | | | 481 | |
| Proceeds from long-term debt issuance | 700 | | | 500 | | | 598 | |
| | | | | | |
| | | | | | |
| Exercise of stock options, net | — | | | — | | | 1 | |
| Change in cash collateral for derivative positions and other arrangements | 230 | | | 31 | | | — | |
| Change in deposit asset on reinsurance | — | | | 91 | | | — | |
| Net deposits from investment-type policies and contracts | 4,340 | | | 308 | | | 773 | |
| Net change in noncontrolling interest | 90 | | | — | | | — | |
| Effect of exchange rate changes on cash | — | | | — | | | 63 | |
| Total sources | 6,703 | | | 5,112 | | | 5,238 | |
| | | | | | |
| Uses: | | | | | |
| Net cash used in investing activities | 5,688 | | | 4,628 | | | 2,680 | |
| Dividends to stockholders | 205 | | | 194 | | | 182 | |
| Repayment of collateral finance and securitization notes | 181 | | | 208 | | | 214 | |
| Debt issuance costs | 10 | | | 6 | | | 5 | |
| Principal payments of long-term debt | 403 | | | 403 | | | 3 | |
| | | | | | |
| Purchases of treasury stock | 81 | | | 99 | | | 163 | |
| | | | | | |
| | | | | | |
| Change in cash collateral for derivative positions and other arrangements | — | | | — | | | 32 | |
| Change in deposit asset on reinsurance | 44 | | | — | | | — | |
| | | | | | |
| | | | | | |
| | | | | | |
| Effect of exchange rate changes on cash | 112 | | | 34 | | | — | |
| Total uses | 6,724 | | | 5,572 | | | 3,279 | |
| Net change in cash and cash equivalents | $ | (21) | | | $ | (460) | | | $ | 1,959 | |
Cash Flows from Operations -– The principal cash inflows from the Company’s reinsurance activities come from premiums, investment and fee income, annuity considerations and deposit funds. The principal cash outflows relate to the liabilities associated with various life and health insurance, annuity and disability products, operating expenses, income tax and interest on outstanding debt obligations. The primary liquidity concern with respect to these cash flows is the risk of shortfalls in premiums and investment income, particularly in periods with abnormally high claims levels.
Cash Flows from Investments -– The principal cash inflows from the Company’s investment activities come from repayments of principal on invested assets, proceeds from sales and maturities of invested assets, and settlements of freestanding derivatives. The principal cash outflows relate to purchases of investments, issuances of policy loans and settlements of freestanding derivatives. The Company typically has a net cash outflow from investing activities because cash inflows from insurance operations are reinvested in accordance with its asset/liability management discipline to fund insurance liabilities. The Company closely monitors and manages these risks through its credit risk management process. The primary liquidity concerns with respect to these cash flows are the risk of default by debtors and market disruption, which could make it difficult for the Company to sell investments.
Financing Cash Flows -– The principal cash inflows from the Company’s financing activities come from issuances of debt and equity securities, and deposit funds associated with universal life and other investment type policies and contracts. The principal financing cash outflows are the repayments of debt and securitization notes, payments of dividends to stockholders, purchases of treasury stock, and withdrawals associated with universal life and other investment type policies and contracts. A primary liquidity concern with respect to these cash flows is the risk of early contractholder and policyholder withdrawal.
Contractual Obligations
The following table displayssummarizes the Company’s contractual obligations, including obligations arising from its reinsurance business (in millions):
| | | | | | | | | | | | | | | | | | | | | | | | | | | | | | | | |
| | | Payment Due by Period |
| | Total | | Less than 1 Year | | 1-3 Years | | 4-5 Years | | After 5 Years |
Future policy benefits(1) | | $ | 28,868 | | | $ | (3) | | | $ | (359) | | | $ | (261) | | | $ | 29,491 | |
Interest-sensitive contract liabilities(2) | | 39,012 | | | 3,282 | | | 5,517 | | | 4,792 | | | 25,421 | |
| Long-term debt, including interest | | 8,189 | | | 780 | | | 359 | | | 727 | | | 6,323 | |
| | | | | | | | | | |
| Other policy claims and benefits | | 6,571 | | | 6,571 | | | — | | | — | | | — | |
| Operating leases | | 102 | | | 17 | | | 34 | | | 19 | | | 32 | |
| Limited partnership interests and joint ventures | | 937 | | | 937 | | | — | | | — | | | — | |
| Payables for collateral received under derivative transactions | | 209 | | | 209 | | | — | | | — | | | — | |
| Other investment related commitments | | 1,026 | | | 1,026 | | | — | | | — | | | — | |
| Total | | $ | 84,914 | | | $ | 12,819 | | | $ | 5,551 | | | $ | 5,277 | | | $ | 61,267 | |
|
| | | | | | | | | | | | | | | | | | | | |
| | | Payment Due by Period |
| | | Total | | Less than 1 Year | | 1-3 Years | | 4-5 Years | | After 5 Years |
Future policy benefits(1) | | $ | 11,638 |
| | $ | (510 | ) | | $ | (989 | ) | | $ | (819 | ) | | $ | 13,956 |
|
Interest-sensitive contract liabilities(2) | | 40,376 |
| | 3,225 |
| | 6,787 |
| | 5,788 |
| | 24,576 |
|
| Long-term debt, including interest | | 5,892 |
| | 154 |
| | 688 |
| | 649 |
| | 4,401 |
|
| Collateral finance and securitization notes, including interest | | 647 |
| | 250 |
| | 203 |
| | 115 |
| | 79 |
|
| Other policy claims and benefits | | 5,711 |
| | 5,711 |
| | — |
| | — |
| | — |
|
| Operating leases | | 70 |
| | 15 |
| | 24 |
| | 20 |
| | 11 |
|
| Limited partnership interests and joint ventures | | 685 |
| | 685 |
| | — |
| | — |
| | — |
|
| Payables for collateral received under derivative transactions | | 120 |
| | 120 |
| | — |
| | — |
| | — |
|
| Other investment related commitments | | 512 |
| | 512 |
| | — |
| | — |
| | — |
|
| Total | | $ | 65,651 |
| | $ | 10,162 |
| | $ | 6,713 |
| | $ | 5,753 |
| | $ | 43,023 |
|
| |
(1) | Future policy benefits are primarily related to the Company’s reinsurance of life and health insurance products. The amounts presented in the table above represent the estimated benefit obligations as they become due, and also include estimated future premiums on policies in force, allowances and other amounts due to or from the ceding companies as the result of the Company’s assumptions of mortality, morbidity, policy lapse and surrender risk as appropriate to the respective product. All estimated cash payments presented in the table above are undiscounted as to interest and gross of any reinsurance recoverable. The discounted liability amount of $28.7 billion included on the consolidated balance sheets exceeds the sum of the undiscounted estimated cash flows of $11.6 billion shown above. The difference is substantially due to net obligations including estimated future premiums exceeding estimated policy benefit payments and allowances due to the nature of certain reinsurance treaties, which generally have increasing premium rates that exceed the increasing benefit payments. In addition, differences will arise due to changes in the projection of future benefit payments compared with those developed when the reserve was established. Total payments may vary materially from prior years due to the assumption of new reinsurance treaties or as a result of changes in projections of future experience. |
| |
(2) | Interest-sensitive contract liabilities include amounts related to the Company’s reinsurance of asset-intensive products, primarily deferred annuities and corporate-owned life insurance. The amounts in the table above represent the estimated obligations as they become due both to and from ceding companies relating to activity of the underlying policyholders. All amounts presented above are undiscounted as to interest, and include assumptions related to surrenders, withdrawals, premium persistency, partial withdrawals, surrender charges, annuitizations, mortality, future interest credited rates and policy loan utilization. The sum of the obligations shown for all years in the table of $40.4 billion exceeds the liability amount of $22.7 billion included on the consolidated balance sheets, and the difference is primarily related to the lack of discounting and to liabilities related to accounting conventions, which are not contractually due and are therefore excluded. |
(2)Interest-sensitive contract liabilities include amounts related to the Company’s reinsurance of asset-intensive products, primarily deferred annuities and corporate-owned life insurance. The amounts in the table above represent the estimated obligations as they become due both to and from ceding companies relating to activity of the underlying policyholders. All amounts presented above are undiscounted as to interest, and include assumptions related to surrenders, withdrawals, premium persistency, partial withdrawals, surrender charges, annuitizations, mortality, future interest credited rates and policy loan utilization. The sum of the obligations shown for all years in the table of $39.0 billion exceeds the liability amount of $30.6 billion included on the consolidated balance sheets, and the difference is primarily related to the lack of discounting and to liabilities related to accounting conventions, which are not contractually due and are therefore excluded.
Excluded from the table above are net deferred income tax liabilities, unrecognized tax benefits, and accrued interest related to unrecognized tax benefits of $3.0$0.4 billion, for which the Company cannot reliably determine the timing of payment. Current income tax payable is also excluded from the table.
The net funded status of the Company’s qualified and nonqualified pension and other postretirement liabilities included within other liabilities has been excluded from the amounts presented in the table above. As of December 31, 2019,2022, the Company had a net unfunded balance of $174$116 million related to qualified and nonqualified pension and other postretirement liabilities. See
Note 10 – “Employee Benefit Plans” in the Notes to Consolidated Financial Statements for information related to the Company’s obligations and funding requirements for pension and other postretirement benefits.
Asset / Liability Management
The Company actively manages its cash and invested assets using an approach that is intended to balance quality, diversification, asset/liability matching, liquidity and investment return. The goals of the investment process are to optimize after-tax, risk-adjusted investment income and after-tax, risk-adjusted total return while managing the assets and liabilities on a cash flow and duration basis.
The Company has established target asset portfolios for its operating segments, which represent the investment strategies intended to profitably fund its liabilities within acceptable risk parameters. These strategies include objectives and limits for effective duration, yield curve sensitivity and convexity, liquidity, asset sector concentration and credit quality.
The Company’s asset-intensive products are primarily supported by investments in fixed maturity securities reflected on the Company’s consolidated balance sheets and under funds withheld arrangements with the ceding company. Investment guidelines are established to structure the investment portfolio based upon the type, duration and behavior of products in the liability portfolio so as to achieve targeted levels of profitability. The Company manages the asset-intensive business to provide a targeted spread between the interest rate earned on investments and the interest rate credited to the underlying interest-sensitive contract liabilities. The Company periodically reviews models projecting different interest rate scenarios and their effect on profitability. Certain of these asset-intensive agreements, primarily in the U.S. and Latin America Financial Solutions operating segment, are generally funded by fixed maturity securities that are withheld by the ceding company.
The Company’s liquidity position (cash and cash equivalents and short-term investments) was $1.5$3.1 billion and $2.0$3.0 billion at December 31, 20192022 and 2018,2021, respectively. Liquidity needs are determined from valuation analysis conducted by operational units and are driven by product portfolios. Periodic evaluations of demand liabilities and short-term liquid assets are designed to adjust specific portfolios, as well as their durations and maturities, in response to anticipated liquidity needs.
See “Securities Borrowing, Lending and Other” in Note 4 -– “Investments” in the Notes to Consolidated Financial Statements for information related to the Company’s securities borrowing, lending and repurchase/reverse repurchase programs. In addition to its security agreements with third parties, certain RGA subsidiaries have entered into intercompany securities lending agreements to more efficiently source securities for lending to third parties and to provide for more efficient regulatory capital management.
The Company is a member of the FHLB and holds $68$65 million of FHLB common stock, which is included in other invested assets on the Company’s consolidated balance sheets. The Company has entered into funding agreements with the FHLB under guaranteed investment contracts whereby the Company has issued the funding agreements in exchange for cash and for which the FHLB has been granted a blanket lien on the Company’s commercial and residential mortgage-backed securities and commercial mortgage loans used to collateralize the Company’s obligations under the funding agreements. The Company maintains control over these pledged assets, and may use, commingle, encumber or dispose of any portion of the collateral as long as there is no event of default and the remaining qualified collateral is sufficient to satisfy the collateral maintenance level. The funding agreements and the related security agreements represented by this blanket lien provide that upon any event of default by the Company, the FHLB’s recovery is limited to the amount of the Company’s liability under the outstanding funding agreements. The amount of the Company’s liability for the funding agreements with the FHLB under guaranteed investment contracts was $1.4$1.3 billion and $1.7$1.4 billion at December 31, 20192022 and 2018,2021, respectively, which is included in interest sensitive contract liabilities on the Company’s consolidated balance sheets. The advances on these agreements are collateralized primarily by commercial and residential mortgage-backed securities, commercial mortgage loans, and U.S. Treasury and government agency securities. The amount of collateral exceeds the liability and is dependent on the type of assets collateralizing the guaranteed investment contracts.
Investments
Management of Investments
The Company’s investment and derivative strategies involve matching the characteristics of its reinsurance products and other obligations and to seekobligations. The Company seeks to closely approximate the interest rate sensitivity of the assets with estimated interest rate sensitivity of the reinsurance liabilities. The Company achieves its income objectives through strategic and tactical asset allocations applying security and derivative strategies within an asset/liability management and disciplined risk management framework.frameworks. Derivative strategies are employed within the Company’s risk management framework to help manage duration, currency, and other risks in assets and/or liabilities and to replicate the credit characteristics of certain assets. For a discussion of the Company’s risk management process, see “Market and Credit Risk” in the “Enterprise Risk Management” section below.
The Company’s portfolio management groups work with the Enterprise Risk Management function to develop the investment policies for the assets of the Company’s domestic and international investment portfolios. All investments held by the Company, directly or in a funds withheld at interest reinsurance arrangement, are monitored for conformance with the Company’s stated investment policy limits as well as any limits prescribed by the applicable jurisdiction’s insurance laws and regulations. See Note 4 – “Investments” in the Notes to Consolidated Financial Statements for additional information regarding the Company’s investments.
Portfolio Composition
The Company had total cash and invested assets of $68.0$73.4 billion and $56.1$81.5 billion as of December 31, 20192022 and 2018,2021, respectively, as illustrated below (dollars in millions):
| | | | | 2019 | | % of Total | | 2018 | | % of Total | | 2022 | | % of Total | | 2021 | | % of Total |
| Fixed maturity securities, available-for-sale | | $ | 51,121 |
| | 75.3 | % | | $ | 39,992 |
| | 71.3 | % | Fixed maturity securities, available-for-sale | | $ | 52,901 | | | 72.0 | % | | $ | 60,749 | | | 74.6 | % |
| Equity securities | | 320 |
| | 0.5 |
| | 82 |
| | 0.1 |
| Equity securities | | 134 | | | 0.2 | | | 151 | | | 0.2 | |
| Mortgage loans on real estate | | 5,706 |
| | 8.3 |
| | 4,966 |
| | 8.8 |
| |
| Mortgage loans | | Mortgage loans | | 6,590 | | | 9.0 | | | 6,283 | | | 7.7 | |
| Policy loans | | 1,319 |
| | 1.9 |
| | 1,345 |
| | 2.4 |
| Policy loans | | 1,231 | | | 1.7 | | | 1,234 | | | 1.5 | |
| Funds withheld at interest | | 5,662 |
| | 8.3 |
| | 5,761 |
| | 10.3 |
| Funds withheld at interest | | 6,003 | | | 8.2 | | | 6,954 | | | 8.5 | |
| Limited partnerships and real estate joint ventures | | Limited partnerships and real estate joint ventures | | 2,327 | | | 3.2 | | | 1,996 | | | 2.5 | |
| Short-term investments | | 64 |
| | 0.1 |
| | 143 |
| | 0.3 |
| Short-term investments | | 154 | | | 0.2 | | | 87 | | | 0.1 | |
| Other invested assets | | 2,363 |
| | 3.5 |
| | 1,915 |
| | 3.4 |
| Other invested assets | | 1,140 | | | 1.5 | | | 1,074 | | | 1.3 | |
| Cash and cash equivalents | | 1,449 |
| | 2.1 |
| | 1,890 |
| | 3.4 |
| Cash and cash equivalents | | 2,927 | | | 4.0 | | | 2,948 | | | 3.6 | |
| Total cash and invested assets | | $ | 68,004 |
| | 100.0 | % | | $ | 56,094 |
| | 100.0 | % | Total cash and invested assets | | $ | 73,407 | | | 100.0 | % | | $ | 81,476 | | | 100.0 | % |
Investment Yield
The following table presents consolidated average invested assets at amortized cost, net investment income, investment yield, variable investment income (“VII”), and investment yield excluding VII, which can vary significantly from period to period (dollars in millions) for the years ended December 31, 2022, 2021 and 2020. The table excludes spread related business. Spread related business is primarily associated with contracts on which the Company earns an interest rate spread between assets and liabilities. To varying degrees, fluctuations in the yield on other spread related business is generally subject to corresponding adjustments to the interest credited on the liabilities (dollarsliabilities.
| | | | | | | | | | | | | | | | | | | | | | | | | | | | | | | | |
| | | 2022 | | 2021 | | 2020 | | 2022 vs 2021 | | 2021 vs 2020 |
| Average invested assets at amortized cost | | $ | 34,398 | | | $ | 33,040 | | | $ | 30,787 | | | $ | 1,358 | | | $ | 2,253 | |
| Net investment income | | $ | 1,614 | | | $ | 1,648 | | | $ | 1,231 | | | $ | (34) | | | $ | 417 | |
| Annualized investment yield (ratio of net investment income to average invested assets at amortized cost) | | 4.69 | % | | 4.99 | % | | 4.00 | % | | (30) bps | | 99 bps |
VII (included in net investment income)1 | | $ | 291 | | | $ | 433 | | | $ | 63 | | | $ | (142) | | | $ | 370 | |
| Annualized investment yield excluding VII (ratio of net investment income, excluding VII, to average invested assets, excluding assets with only VII, at amortized cost) | | 4.00 | % | | 3.81 | % | | 3.93 | % | | 19 bps | | (12) bps |
(1)VII for 2021 includes an accounting correction of $92 million related to prior periods recorded in millions).2021. See “Investment Income and Investment Related Gains (Losses), Net – Accounting Correction” in Note – 4 “Investments” in the Notes to the Consolidated Financial Statements for additional information regarding the correction recorded in 2021.
|
| | | | | | | | | | | | | | | | | | |
| | | | | | | | | Increase /(Decrease) |
| | | 2019 | | 2018 | | 2017 | | 2019 | | 2018 |
| Average invested assets at amortized cost | | $ | 28,300 |
| | $ | 26,641 |
| | $ | 25,225 |
| | 6.2 | % | | 5.6 | % |
| Net investment income | | 1,291 |
| | 1,185 |
| | 1,148 |
| | 8.9 | % | | 3.3 | % |
Investment yield (ratio of net investment income to average invested assets) | | 4.56 | % | | 4.45 | % | | 4.55 | % | | 11 bps |
| | (10) bps |
|
Investment yield decreased between 2021 and 2022 primarily due to decreased variable income from limited partnerships, partially offset by increased variable income from real estate joint ventures and increased yield from the recent increase in interest rates. Investment yield increased between 20182020 and 20192021 primarily due to increased variable income from limited partnerships and real estate joint ventures, and limited partnerships, which is included in other invested assets onpartially offset by decreased yield from the consolidated balance sheets. Investment yield decreased between 2017 and 2018 due to the effect of a lowerprevious low interest rate environment.
Fixed Maturity Securities Available-for-Sale
See “Fixed Maturity Securities Available-for-Sale” in Note 4 – “Investments” in the Notes to Consolidated Financial Statements for tables that provide the amortized cost, allowance for credit losses, unrealized gains and losses and estimated fair value of these securities and the other-than-temporary impairments in AOCI by sectortype as of December 31, 20192022 and 2018.2021.
The Company holds various types of fixed maturity securities available-for-sale and classifies them as corporate securities (“Corporate”), Canadian and Canadian provincial government securities (“Canadian government”), residential mortgage-backed securities (“RMBS”), asset-backed securities (“ABS”), commercial mortgage-backed securities (“CMBS”), U.S. government and agencies (“U.S. government”), state and political subdivisions, and other foreign government, supranational and foreign government-sponsored enterprises (“Other foreign government”). RMBS, ABS and CMBS are collectively “structured securities.” As of December 31, 20192022 and 2018,2021, approximately 95.5%94.3% and 95.6%94.0%, respectively, of the Company’s consolidated investment portfolio of fixed maturity securities were investment grade.
Important factors in the selection of investments include diversification, quality, yield, call protection and total rate of return potential. The relative importance of these factors is determined by market conditions and the underlying reinsurance liability and existing portfolio characteristics. The Company owns floating rate securities that represent approximately 6.3%7.4% and 6.2%5.3% of the total fixed maturity securities as of December 31, 20192022 and 2018,2021, respectively. These investments have a higher
degree of income variability than the other fixed income holdings in the portfolio due to fluctuations in interest payments. The Company holds floating rate investments to match specific floating rate liabilities primarily reflected in the consolidated balance sheets as collateral finance notes, as well as to enhance asset management strategies.
The largest asset class in which fixed maturity securities were invested was corporate securities, which represented approximately 61.4%64.2% and 62.8% of total fixed maturity securities as of December 31, 2019, compared to 59.9% as of December 31, 2018.2022 and 2021, respectively. See “Corporate Fixed Maturity Securities” in Note 4 – “Investments” in the Notes to Consolidated Financial Statements for tables showing the major industrysector types, which comprise the corporate fixed maturity holdings as of December 31, 20192022 and 2018.2021.
As of December 31, 2019,2022 and 2021, the Company’s investments in Canadian government securities represented 9.0%6.9% and 8.1%, respectively, of the fair value of total fixed maturity securities compared to 9.7% of the fair value of total fixed maturity securities as of December 31, 2018.securities. These assets are primarily high quality, long duration provincial strip bonds, the valuation of which is closely linked to the interest rate curve. These assets are longer in duration and held primarily for asset/liability management to meet Canadian regulatory requirements. See “Fixed Maturity Securities Available-for-Sale” in Note 4 – “Investments” in the Notes to Consolidated Financial Statements for tables showing the various sectors as of December 31, 2019 and 2018.
The Company references rating agency designations in some of its investments disclosures. These designations are based on the ratings from nationally recognized statistical rating organizations, primarily Moody’s, S&P and Fitch. Structured securities held by the Company’s insurance subsidiaries that maintain the NAIC statutory basis of accounting utilize the NAIC rating methodology. The NAIC assigns designations to publicly traded as well as privately placed securities. The designations assigned by the NAIC range from class 1 to class 6, with designations in classes 1 and 2 generally considered investment grade (BBB or higher rating agency designation). NAIC designations in classes 3 through 6 are generally considered below investment grade (BB or lower rating agency designation). If no rating is available from a rating agency or the NAIC, then an internally developed rating is used.
The quality of the Company’s available-for-sale fixed maturity securities portfolio, as measured at fair value and by the percentage of fixed maturity securities invested in various ratings categories, relative to the entire available-for-sale fixed maturity securitysecurities portfolio as of December 31, 20192022 and 20182021 was as follows (dollars in millions):
| | | | | | | 2019 | | 2018 | | | | | 2022 | | 2021 |
NAIC Designation | | Rating Agency Designation | | Amortized Cost | | Estimated Fair Value | | % of Total | | Amortized Cost | | Estimated Fair Value | | % of Total | NAIC
Designation | | Rating Agency
Designation | | Amortized Cost | | Estimated Fair Value | | % of Total | | Amortized Cost | | Estimated Fair Value | | % of Total |
| 1 | | AAA/AA/A | | $ | 30,100 |
| | $ | 33,284 |
| | 65.2 | % | | $ | 24,904 |
| | $ | 26,180 |
| | 65.5 | % | 1 | | AAA/AA/A | | $ | 36,217 | | | $ | 32,295 | | | 61.1 | % | | $ | 33,540 | | | $ | 36,725 | | | 60.5 | % |
| 2 | | BBB | | 14,366 |
| | 15,514 |
| | 30.3 |
| | 12,142 |
| | 12,023 |
| | 30.1 |
| 2 | | BBB | | 20,188 | | | 17,580 | | | 33.2 | | | 18,684 | | | 20,379 | | | 33.5 | |
| 3 | | BB | | 1,706 |
| | 1,748 |
| | 3.4 |
| | 1,409 |
| | 1,371 |
| | 3.4 |
| 3 | | BB | | 2,734 | | | 2,607 | | | 5.0 | | | 2,620 | | | 2,668 | | | 4.4 | |
| 4 | | B | | 514 |
| | 518 |
| | 1.0 |
| | 396 |
| | 386 |
| | 1.0 |
| 4 | | B | | 397 | | | 331 | | | 0.6 | | | 876 | | | 863 | | | 1.4 | |
| 5 | | CCC | | 36 |
| | 23 |
| | — |
| | 13 |
| | 13 |
| | — |
| 5 | | CCC and lower | | 103 | | | 71 | | | 0.1 | | | 96 | | | 79 | | | 0.1 | |
| 6 | | In or near default | | 31 |
| | 34 |
| | 0.1 |
| | 18 |
| | 19 |
| | — |
| 6 | | In or near default | | 24 | | | 17 | | | — | | | 57 | | | 35 | | | 0.1 | |
| | | Total | | $ | 46,753 |
| | $ | 51,121 |
| | 100.0 | % | | $ | 38,882 |
| | $ | 39,992 |
| | 100.0 | % | | Total | | $ | 59,663 | | | $ | 52,901 | | | 100.0 | % | | $ | 55,873 | | | $ | 60,749 | | | 100.0 | % |
|
The Company’s fixed maturity portfolio includes structured securities. The following table shows the types of structured securities the Company held as of December 31, 20192022 and 20182021 (dollars in millions):
| | | | | | | | | | | | | | | | | | | | | | | | | | | | | | | | | | | | | | |
| | | 2022 | | 2021 |
| | | | | Estimated
Fair Value | | % of Total | | | | Estimated
Fair Value | | % of Total |
| | | Amortized Cost | | | Amortized Cost | | |
| RMBS: | | | | | | | | | | | | |
| Agency | | $ | 476 | | | $ | 427 | | | 6.6 | % | | $ | 551 | | | $ | 582 | | | 8.4 | % |
| Non-agency | | 578 | | | 514 | | | 8.0 | | | 469 | | | 468 | | | 6.8 | |
| Total RMBS | | 1,054 | | | 941 | | | 14.6 | | | 1,020 | | | 1,050 | | | 15.2 | |
| ABS: | | | | | | | | | | | | |
| Collateralized loan obligations (“CLOs”) | | 1,825 | | | 1,702 | | | 26.4 | | | 1,761 | | | 1,752 | | | 25.4 | |
| ABS, excluding CLOs | | 2,499 | | | 2,176 | | | 33.8 | | | 2,263 | | | 2,253 | | | 32.6 | |
| Total ABS | | 4,324 | | | 3,878 | | | 60.2 | | | 4,024 | | | 4,005 | | | 58.0 | |
| CMBS | | 1,835 | | | 1,623 | | | 25.2 | | | 1,790 | | | 1,849 | | | 26.8 | |
| Total | | $ | 7,213 | | | $ | 6,442 | | | 100.0 | % | | $ | 6,834 | | | $ | 6,904 | | | 100.0 | % |
|
| | | | | | | | | | | | | | | | | | | | | | |
| | | 2019 | | 2018 |
| | | | | Estimated Fair Value | | % of Total | | | | Estimated Fair Value | | % of Total |
| | | Amortized Cost | | | Amortized Cost | | |
| RMBS: | | | | | | | | | | | | |
| Agency | | $ | 742 |
| | $ | 777 |
| | 10.6 | % | | $ | 811 |
| | $ | 814 |
| | 15.0 | % |
| Non-agency | | 1,597 |
| | 1,621 |
| | 22.3 |
| | 1,061 |
| | 1,055 |
| | 19.4 |
|
| Total RMBS | | 2,339 |
| | 2,398 |
| | 32.9 |
| | 1,872 |
| | 1,869 |
| | 34.4 |
|
| ABS: | | | | | | | | | | | | |
| Collateralized loan obligations (“CLOs”) | | 1,750 |
| | 1,743 |
| | 24.0 |
| | 1,212 |
| | 1,184 |
| | 21.8 |
|
| ABS, excluding CLOs | | 1,223 |
| | 1,235 |
| | 17.0 |
| | 960 |
| | 966 |
| | 17.7 |
|
| Total ABS | | 2,973 |
| | 2,978 |
| | 41.0 |
| | 2,172 |
| | 2,150 |
| | 39.5 |
|
| CMBS | | 1,841 |
| | 1,899 |
| | 26.1 |
| | 1,428 |
| | 1,419 |
| | 26.1 |
|
| Total | | $ | 7,153 |
| | $ | 7,275 |
| | 100.0 | % | | $ | 5,472 |
| | $ | 5,438 |
| | 100.0 | % |
The Company’s RMBS portfolio includeincludes agency-issued pass-through securities and collateralized mortgage obligations. A majority of the agency-issuedAgency-issued pass-through securities are guaranteed or otherwise supported by the Federal Home Loan Mortgage Corporation, Federal National Mortgage Association, or the Government National Mortgage Association. The principal risks inherent in holding mortgage-backed securitiesRMBS are prepayment and extension risks, which will affect the timing of when cash will be received and are dependent on the level of mortgage interest rates. Prepayment risk is the unexpected increase in principal payments from the expected, primarily as a result of owner refinancing. Extension risk relates to the unexpected slowdown in principal payments from the expected. In addition, non-agency mortgage-backed securitiesRMBS face credit risk should the borrower be unable to pay the contractual interest or principal on their obligation. The Company monitors its mortgage-backed securities to mitigate exposure to the cash flow uncertainties associated with these risks.
The Company’s ABS portfolio primarily consists of CLOs, single-family rentals, container leasing, railcar leasing, aircraft, and student loans.single-family rentals. The principal risks in holding asset-backed securitiesABS are structural, credit, capital market and interest rate risks. Structural risks include the securities’ cash flow priority in the capital structure and the inherent prepayment sensitivity of the underlying collateral. Credit risks include the adequacy and ability to realize proceeds from the collateral. Credit risks are mitigated by credit enhancements that include excess spread, over-collateralization and subordination. Capital market risks include general level of interest rates and the liquidity for these securities in the marketplace.
The Company’s CMBS portfolio primarily consists of large pool securitizations that are diverse by property type, borrower and geographic dispersion. The principal risks in holding CMBS are structural and credit risks. Structural risks include the securities’ cash flow priority in the capital structure and the inherent prepayment sensitivity of the underlying collateral. Credit risks include the adequacy and ability to realize proceeds from the collateral. The Company focuses on Investment Gradeinvestment grade rated tranches that provide additional credit support beyond the equity protection in the underlying loans. These assets are viewed as an attractive alternative to other fixed income asset classes.
As of December 31, 20192022 and 2018,2021, the Company had $110$7,319 million and $748$349 million, respectively, of gross unrealized losses related to its fixed maturity securities. The Company monitors its fixed maturity securities to determine impairments in value and evaluates factors such as financial condition of the issuer, payment performance, the length of time and the extent to which the market value has been below amortized cost, compliance with covenants, general market and industry sector conditions, current intent and ability to hold securities, and various other subjective factors. Based on management’s judgment, an allowance for credit losses in the amount that fair value is less than the amortized cost is recorded for securities determined to have an other-than-temporary impairmentexpected credit losses.
Mortgage Loans
The Company’s mortgage loan portfolio consists of U.S., Canada and UK based investments primarily in value are written downcommercial offices, light industrial properties and retail locations. The mortgage loan portfolio is diversified by geographic region and property type as discussed further under “Mortgage Loans” in Note 4 – “Investments” in the Notes to fair value.Consolidated Financial Statements. Most of the mortgage loans in the Company’s portfolio range in size up to $30 million, with the average mortgage loan investment as of December 31, 2022, totaling approximately $9 million.
As of December 31, 2022 and 2021, the Company’s recorded investment in mortgage loans, gross of unamortized deferred loan origination fees and expenses and allowance for credit losses, were distributed geographically as follows (dollars in millions):
| | | | | | | | | | | | | | | | | | | | | | | | | | |
| | | 2022 | | 2021 |
| | Recorded
Investment | | % of Total | | Recorded
Investment | | % of Total |
| U.S. Region: | | | | | | | | |
| West | | $ | 2,420 | | | 36.4 | % | | $ | 2,270 | | | 36.0 | % |
| South | | 2,215 | | | 33.3 | | | 2,135 | | | 33.7 | |
| Midwest | | 1,147 | | | 17.2 | | | 1,166 | | | 18.4 | |
| Northeast | | 474 | | | 7.1 | | | 419 | | | 6.6 | |
| Subtotal - U.S. | | 6,256 | | | 94.0 | | | 5,990 | | | 94.7 | |
| Canada | | 239 | | | 3.6 | | | 193 | | | 3.0 | |
| United Kingdom | | 158 | | | 2.4 | | | 144 | | | 2.3 | |
| Other | | — | | | — | | | 2 | | | — | |
| Total | | $ | 6,653 | | | 100.0 | % | | $ | 6,329 | | | 100.0 | % |
See “Allowance for Credit Losses and Impairments” in Note 2 – “Significant Accounting Policies and Pronouncements” and “Mortgage Loans” in Note 4 – “Investments” in the Notes to Consolidated Financial Statements for information regarding the Company’s policy for allowance for credit losses on mortgage loans.
Allowance for Credit Losses and Impairments
The Company’s determination of whether a decline in value is other-than-temporary includes analysis ofnecessitates the underlying credit and the extent and duration of a decline in value. The Company’s credit analysisrecording of an investmentallowance for credit losses includes determiningan analysis of whether the issuer is current on its contractual payments, evaluating whether it is probable that the Company will be able to collect all amounts due according to the contractual terms of the security and analyzing the overall ability of the Company to recover the amortized cost of the investment. See “Investments – Other-than-Temporary Impairment”“Allowance for Credit Losses and Impairments” in Note 2 – “Significant Accounting Policies and Pronouncements” in the Notes to Consolidated Financial Statements for additional information. The table below summarizes other-than-temporaryinvestment related gains (losses), net, related to allowances for credit losses and impairments for the years ended December 31, 2022, 2021 and changes in the mortgage loan provision for 2019, 2018 and 20172020 (dollars in millions):
|
| | | | | | | | | | | | |
| | | 2019 | | 2018 | | 2017 |
| Impairment losses on fixed maturity securities | | $ | 31 |
| | $ | 28 |
| | $ | 43 |
|
| Impairment losses on equity securities | | — |
| | — |
| | 1 |
|
| Other impairment losses | | 11 |
| | 10 |
| | 8 |
|
| Change in mortgage loan provision | | 1 |
| | 2 |
| | 1 |
|
| Total | | $ | 43 |
| | $ | 40 |
| | $ | 53 |
|
| | | | | | | | | | | | | | | | | | | | |
| | | 2022 | | 2021 | | 2020 |
| | | | | | |
| | | | | | |
| Change in allowance for credit losses on fixed maturity securities | | $ | (6) | | | $ | (11) | | | $ | (20) | |
| Impairments on fixed maturity securities | | (17) | | | (1) | | | (1) | |
| Change in mortgage loan allowance for credit losses | | (16) | | | 29 | | | (38) | |
| Limited partnerships and real estate joint ventures impairment losses | | — | | | — | | | (18) | |
| | | | | | |
| Total | | $ | (39) | | | $ | 17 | | | $ | (77) | |
The increases in allowance for credit losses and impairments on fixed maturity impairments in 2019 and 2018securities during 2022 were largelyprimarily related to high-yield and emerging market corporate securities. The equity impairmentsincrease in 2017mortgage loan allowance for credit losses during 2022 reflected the impact of market conditions including occupancy rates. The changes in allowance for credit losses on fixed maturity securities during 2021 and 2020 were primarily related to an equity position received as parthigh-yield securities reflecting the impact of a debt restructuring. In addition, otherthe COVID-19 pandemic. The increase in mortgage loan allowance for credit losses in 2020 and the decrease in 2021 were primarily due to the estimated impact from the COVID-19 pandemic in 2020 and subsequent update to estimates in 2021. The limited partnerships and real estate joint ventures impairment losses in 2019 and 20182020 were primarily due to impairments on real estate joint ventures and limited partnerships.
See “Unrealized Losses for Fixed Maturity Securities Available-for-Sale” in Note 4 – “Investments” in the Notes to Consolidated Financial Statements for tables that presents information on securities wherepresent the estimated fair value had declined and remained below amortized cost as of December 31, 2019 and 2018. This includes tables that present the estimated fair values and gross unrealized losses including other-than-temporary impairment losses reported in AOCI, for these securities that have estimated fair values below amortized cost by class and grade, security, as well as the length of time the related marketestimated fair value has remained below amortized cost as of December 31, 2022 and where the decline is less than 20% or more than 20%.2021.
As of December 31, 20192022 and 2018, respectively,2021, the Company classified approximately 6.1%10.8% and 5.0%8.5%, respectively, of its fixed maturity securities in the Level 3 category (refer to Note 6 – “Fair Value of Assets and Liabilities” in the Notes to Consolidated Financial Statements for additional information). These securities primarily consist of private placement corporate securities, bank loans and Canadian provincial strips with inactive trading markets.asset-backed securities.
See “Securities Borrowing, Lending and Other”Repurchase/Reverse Repurchase Agreements” in Note 4 – “Investments” in the Notes to Consolidated Financial Statements for information related to the Company’s securities borrowing, lending repurchase and repurchase/reverse repurchase programs.
Mortgage Loans on Real Estate
The Company’s mortgage loan portfolio consists of U.S., Canada and United Kingdom based investments primarily in commercial offices, light industrial properties and retail locations. The mortgage loan portfolio is diversified by geographic region and property type. Most of the mortgage loans in the Company’s portfolio range in size up to $30 million, with the average mortgage
loan investment as of December 31, 2019 totaling approximately $10 million. The mortgage loan portfolio is diversified by geographic region and property type as discussed further under “Mortgage Loans on Real Estate” in Note 4 - “Investments” in the Notes to Consolidated Financial Statements.
As of December 31, 2019 and 2018, the Company’s mortgage loans, gross of unamortized deferred loan origination fees and expenses and valuation allowances, were distributed geographically as follows (dollars in millions):
|
| | | | | | | | | | | | | | |
| | | 2019 | | 2018 |
| | | Recorded Investment | | % of Total | | Recorded Investment | | % of Total |
| U.S. Region: | | | | | | | | |
| Pacific | | $ | 1,488 |
| | 26.0 | % | | $ | 1,395 |
| | 28.0 | % |
| South Atlantic | | 1,055 |
| | 18.4 |
| | 964 |
| | 19.3 |
|
| Mountain | | 814 |
| | 14.2 |
| | 693 |
| | 13.9 |
|
| East North Central | | 720 |
| | 12.6 |
| | 606 |
| | 12.2 |
|
| West North Central | | 276 |
| | 4.8 |
| | 289 |
| | 5.8 |
|
| West South Central | | 741 |
| | 12.9 |
| | 568 |
| | 11.4 |
|
| Middle Atlantic | | 262 |
| | 4.6 |
| | 202 |
| | 4.1 |
|
| East South Central | | 133 |
| | 2.3 |
| | 118 |
| | 2.4 |
|
| New England | | — |
| | — |
| | 6 |
| | 0.1 |
|
| Subtotal - U.S. | | 5,489 |
| | 95.8 |
| | 4,841 |
| | 97.2 |
|
| Canada | | 182 |
| | 3.2 |
| | 135 |
| | 2.7 |
|
| UK | | 56 |
| | 1.0 |
| | 7 |
| | 0.1 |
|
| Total | | $ | 5,727 |
| | 100.0 | % | | $ | 4,983 |
| | 100.0 | % |
Valuation allowances on mortgage loans are established based upon inherent losses expected by management to be realized in connection with future dispositions or settlement of mortgage loans, including foreclosures. The valuation allowances are established after management considers, among other things, the value of underlying collateral and payment capabilities of debtors. Any subsequent adjustments to the valuation allowances will be treated as investment gains or losses.
See “Mortgage Loans on Real Estate” in Note 4 - “Investments” in the Notes to Consolidated Financial Statements for information regarding valuation allowances and impairments.
Policy Loans
The majority of policy loans are associated with one client. These policy loans present no credit risk because the amount of the loan cannot exceed the obligation due the ceding company upon the death of the insured or surrender of the underlying policy. The provisions of the treaties in force and the underlying policies determine the policy loan interest rates. The Company earns a spread between the interest rate earned on policy loans and the interest rate credited to corresponding liabilities.agreements.
Funds Withheld at Interest
For reinsurance agreements written on a modified coinsurance basis and certain agreements written on a coinsurance basis, assets equal to the net statutory reserves are withheld and legally owned and managed by the ceding company, and are reflected as funds withheld at interest on the Company’s consolidated balance sheets. In the event of a ceding company’s insolvency, the Company would need to assert a claim on the assets supporting its reserve liabilities. However, the risk of loss to the Company is mitigated by its ability to offset amounts it owes the ceding company for claims or allowances against amounts owed by the ceding company. Interest accrues to the total funds withheld at interest assets at rates defined by the treaty terms. The Company is subject to the investment performance on the withheld assets, although it does not directly control them. These assets are primarily fixed maturity investment securities and pose risks similar to the fixed maturity securities the Company owns. To mitigate this risk, the Company helps set the investment guidelines followed by the ceding company and monitors compliance. Ceding companies with funds withheld at interest had an average financial strength rating of “A” as of December 31, 20192022 and 2018.2021. Certain ceding companies maintain segregated portfolios for the benefit of the Company.
The majority of the Company’s funds withheld at interest balances are associated with its reinsurance of annuity contracts. The funds withheld receivable balance for segregated portfolios is subject to the general accounting principles for Derivatives and Hedging related to embedded derivatives.
Under these principles, the Company’s funds withheld receivable under certain reinsurance arrangements incorporate credit risk exposures that are unrelated or only partially related to the creditworthiness of the obligor and include an embedded derivative feature that is not clearly and closely related to the host contract. Therefore, the embedded derivative feature must be measured at fair value on the consolidated balance sheets and changes in fair value reported in income. See “Embedded Derivatives”
in Note 2 -– “Significant Accounting Policies and Pronouncements” in the Notes to Consolidated Financial Statements for further discussion.
Based on data provided by ceding companies as of December 31, 20192022 and 2018,2021, funds withheld at interest totaled (dollars in millions):
| | | | | | | | | | | | | | | | | | | | | | | | | | |
| | | 2022 | | 2021 |
| Underlying Security Type: | | Carrying Value | | Estimated
Fair Value | | Carrying Value | | Estimated
Fair Value |
| Segregated portfolios | | $ | 4,136 | | | $ | 3,701 | | | $ | 4,515 | | | $ | 4,843 | |
| Non-segregated portfolios | | 2,237 | | | 2,237 | | | 2,315 | | | 2,315 | |
Embedded derivatives(1) | | (370) | | | — | | | 124 | | | — | |
| Total funds withheld at interest | | $ | 6,003 | | | $ | 5,938 | | | $ | 6,954 | | | $ | 7,158 | |
|
| | | | | | | | | | | | | | | | |
| | | 2019 | | 2018 |
| Underlying Security Type: | | Carrying Value | | Estimated Fair Value | | Carrying Value | | Estimated Fair Value |
| Segregated portfolios | | $ | 3,455 |
| | $ | 3,799 |
| | $ | 3,682 |
| | $ | 3,830 |
|
| Non-segregated portfolios | | 2,071 |
| | 2,071 |
| | 1,973 |
| | 1,973 |
|
Embedded derivatives (1) | | 136 |
| | — |
| | 106 |
| | — |
|
| Total funds withheld at interest | | $ | 5,662 |
| | $ | 5,870 |
| | $ | 5,761 |
| | $ | 5,803 |
|
| |
(1) | Represents the fair value of embedded derivatives related to reinsurance written on a modco or funds withheld basis and subject to the general accounting principles for Derivatives and Hedging related to embedded derivatives for the segregated portfolios. When the segregated portfolios are presented on a fair value basis in the “Estimated Fair Value” column, the calculation of a separate embedded derivative is not applicable. |
Based on data provided by the ceding companies as of December 31, 20192022 and 2018,2021, segregated portfolios contained investments similar to those directly owned by the Company; primarily corporate, municipal, government and asset-backedfixed maturity securities as well as derivative securitiescommercial mortgage loans and reverse repurchase obligations.derivatives. These assets pose risks similar to the fixed maturity securitiesinvestments the Company directly owns. Derivatives consist primarily of S&P 500 options that are used to hedge liabilities and interest credited for EIAs reinsured by the Company. The securities held within the segregated portfolios are primarily investment-grade, with an average rating of “AA.“A.” The average maturity for investments held within the segregated portfolios of funds withheld at interest is ten years or more. Interest accrues to the total funds withheld at interest assets at rates defined by the treaty terms and the Company estimated the yields were approximately 5.59%4.55%, 5.43%6.34% and 7.78%5.40% for the years ended December 31, 2019, 20182022, 2021 and 2017,2020, respectively. Changes in these estimated yields are affected by changes in the fair value of equity options held in the funds withheld portfolio associated with EIAs. Additionally, under certain treaties the Company is subject to the investment performance on the withheld assets, although it does not directly control them. To mitigate this risk, the Company helps set the investment guidelines followed by the ceding companies and monitors compliance.
Other Invested Assets
Other invested assets include limited partnership interests, joint ventures (other than operating joint ventures), lifetime mortgages, derivative contracts, fair value option (“FVO”) contractholder-directed unit-linked investments and FHLB common stock.stock and unit-linked investments. See “Other Invested Assets” in Note 4 – “Investments” in the Notes to Consolidated Financial Statements for a table that presents the carrying value of the Company’s other invested assets by type as of December 31, 20192022 and 2018.2021.
The Company utilizes derivative financial instruments to protect the Company against possible changes in the fair value of its investment portfolio as a result of interest rate changes, to hedge against risk of changes in the purchase price of securities, to hedge liabilities associated with the reinsurance of variable annuities with guaranteed living benefits and to manage the portfolio’s effective yield, maturity and duration. In addition, the Company utilizes derivative financial instruments to reduce the risk associated with fluctuations in foreign currency exchange rates. The Company uses both exchange-traded, centrally cleared, and customized over-the-counter derivative financial instruments.
See Note 5 – “Derivative Instruments” in the Notes to Consolidated Financial Statements for a table that presents the notional amounts and fair value of investment related derivative instruments held as of December 31, 20192022 and 2018.2021.
The Company may be exposed to credit-related losses in the event of non-performance by counterparties to derivative financial instruments. Generally, the credit exposure of the Company’s derivative contracts is limited to the fair value and accrued interest of non-collateralized derivative contracts in an asset position at the reporting date plus or minus any collateral posted or held by the Company. The Company had no credit exposure related to its derivative contracts, excluding futures, asdate. As of December 31, 2019, as the net amount of collateral pledged to2022, the Company from counterparties exceeded the fair value of the derivative contracts. The Company had no credit exposure related to its derivative contracts, excluding futures and mortality swaps, as of December 31, 2018, as the net amount of collateral pledged to the Company from counterparties exceeded the fair value of the derivative contracts.$14 million.
The Company manages its credit risk related to over-the-counter derivatives by entering into transactions with creditworthy counterparties, maintaining collateral arrangements and through the use of master agreements that provide for a single net payment to be made by one counterparty to another at each due date and upon termination. As exchange-traded futures are affected through regulated exchanges, and positions are marked to market on a daily basis, the Company has minimal exposure to credit-related losses in the event of nonperformance by counterparties. See Note 5 – “Derivative Instruments” in the Notes to Consolidated Financial Statements for more information regarding the Company’s derivative instruments.
The Company holds $868 million and $758 million of beneficial interestsinterest in lifetime mortgages in the UK.UK, net of allowance for credit losses, as of December 31, 2022 and 2021, respectively. Investment income includes $38 million, $52 million and $44 million in interest income earned on lifetime mortgages for the years ended December 31, 2022, 2021 and 2020, respectively. Lifetime mortgages represent loans provided to individuals 55 years of age and older secured by the borrower’s residence. Lifetime mortgages are comparable to a home equity
loan by allowing the borrower to utilize the equity in their home as collateral. The amount of the loan is dependent on the appraised value of the home at the time of origination, the borrower's age and interest rate. Unlike a home equity loan, no payment of principal or interest is required until the death of
the borrower or sale of the home. Lifetime mortgages may also be either fully funded at origination, or the borrower can request periodic funding similar to a line of credit. Lifetime mortgages are subject to risks, including market, credit, interest rate, liquidity, operational, reputational and legal risks.
Other invested assets includes $775 million and $476 million of lifetime mortgages as of December 31, 2019 and 2018, respectively. Investment income includes $34 million, $19 million and $8 million in interest income earned on lifetime mortgages for the years ended December 31, 2019, 2018 and 2017, respectively.
Enterprise Risk Management
RGA maintains a dedicated Enterprise Risk Management (“ERM”) function that is responsible for analyzing and reporting the Company’s risks on an aggregated basis; facilitating monitoring to ensure the Company’s risks remain within its appetites and limits; and ensuring, on an ongoing basis, that RGA’s ERM objectives are met. This includes ensuring proper risk controls are in place; risks are effectively identified, assessed, and managed; and key risks to which the Company is exposed are disclosed to appropriate stakeholders. The ERM function plays an important role in fostering the Company’s risk management culture and practices.
Enterprise Risk Management Structure and Governance
The Boardboard of Directorsdirectors (“the Board”) oversees enterprise risk through its standing committees. The Finance, Investments, and Risk Management (“FIRM”) Committee, of the Boardwhich oversees the management of the Company’s ERM program and policies. The FIRMRisk Committee receives regular reports and assessments that describe the Company’s key risk exposures and include quantitative and qualitative assessments and information about breaches, exceptions, and waivers.
The Company’s Global Chief Risk Officer (“CRO”) leads the dedicated ERM function. The CRO reports to the Chief Executive Officer (“CEO”) and has direct access to the Board through the FIRMRisk Committee with formal reporting occurring quarterly. The CRO leads the dedicated ERM function and is supported by a dedicated risk management staff as well as a network of Business Unit Chief Risk Officers and Risk Management OfficersOwners throughout the business unit who are responsible for the analysis and management of risks within their scope. A Lead Risk Management OfficerOwner is assigned to each risk to take overall responsibility to monitor and assess the risk consistently across all markets.
In addition to leading the ERM function, the CRO also chairs the Company’s Risk Management Steering Committee (“RMSC”), which is made up ofincludes senior management executives, including the CEO, the Chief Financial Officer (“CFO”), and the Chief OperatingInvestment Officer, among others. The RMSC provides oversight for the Insurance, Market and Credit, Capital, and Operational risk committees and retains direct risk oversight responsibilities for the following:
•Company’s global ERM framework, activities, and issues.
•Identification, assessments, and management of all known, newestablished and emerging strategic risk exposures.
•Risk appetite statement, including the ongoing alignment of the risk appetite statement with the Company’s strategy and capital plans.
•Review, revise and approve RGA group-level strategic risk limits consistent with the risk appetite statement
The Insurance, Market and Credit, Capital, and Operational risk committees have direct oversight accountability for their respective risksrisk areas including the identification, assessments, and management of known, newestablished and emerging risk exposures and the review and approval of RGA group-level risk limits
To ensure appropriate oversight of enterprise-wide risk management issues without unnecessary duplication, as well as to foster cross-committee communication and coordination regarding risk issues, chairs of the risk committee chairscommittees attend the RMSC meetings. In addition to the risk committees, their sub-committees and working groups, some RGA operating entities have risk management committees that oversee relevant risks related to segment-level risk limits.
Enterprise Risk Management Framework
RGA’s ERM framework provides a platform to assess the risk / return profiles of risks throughout the organization to enable enhanced decision making by business leaders. The ERM framework also guides the development and implementation of mitigation strategies to reduce exposures to these risks to acceptable levels.
RGA’s ERM framework includes the following elements:
| |
1. | Risk Culture: Risk management is an integral part of the Company’s culture and is embedded in RGA’s business processes in accordance with RGA’s risk philosophy. As the cornerstone of the ERM framework, a culture of prudent risk management reinforced by senior management plays a preeminent role in the effective management of risks assumed by RGA. |
•Risk Appetite Statement: A general and high level overview of the risk profile RGA aims to achieve to meet its strategic objectives. This statement is then supported by more granular risk limits guiding the businesses to achieve this Risk Appetite Statement.
| |
2. | Risk Appetite Statement: A general and high level overview of the risk profile RGA aims to achieve to meet its strategic objectives. This statement is then supported by more granular risk limits guiding the businesses to achieve this Risk Appetite Statement. |
| |
3. | Risk Limits: Risk Limits establish the maximum amount of defined risk that the Company is willing to assume to remain within the Company’s overall risk appetite. These risks have been identified by the management of the Company as relevant to manage the overall risk profile of the Company while allowing achievement of strategic objectives. |
| |
4. | Risk Assessment Process: RGA uses qualitative and quantitative methods to assess key risks through a portfolio approach, which analyzes established and emerging risks in conjunction with other risks. |
| |
5. | Business Specific Limits/Controls: These limits/controls provide additional safeguards against undesired risk exposures and are embedded in business processes. Examples include maximum retention limits, pricing and underwriting reviews, per issuer limits, concentration limits, and standard treaty language. |
•Risk Assessment Process: RGA uses qualitative and quantitative methods to assess key risks through a portfolio approach, which analyzes established and emerging risks in conjunction with other risks.
•Business Specific Limits/Controls: These limits/controls provide additional safeguards against undesired risk exposures and are embedded in business processes. Examples include maximum retention limits, pricing and underwriting reviews, per issuer limits, concentration limits, and standard treaty language.
Proactive risk monitoring and reporting enable early detection and mitigation of emerging risks. The RMSC and its subcommittees monitor adherence to risk limits through the ERM function, which reports regularly to the RMSC and FIRMthe Risk Committee. The frequency of monitoring is tailored to the volatility assessment and relative priority of each risk. Risk escalation channels coupled with open communication lines enhance the mitigations explained above. The Company has devoted significant resources to developing its ERM program and expects to continue to do so in the future. Nonetheless, the Company’s policies and procedures to identify, manage, and monitor risks may not be fully effective. Many of the Company’s methods for managing risk are based on historical information, which may not be a good predictor of future risk exposures, such as the risk of a pandemic causing a large number of deaths. Management of operational, legal, and regulatory risk relies on policies and procedures that may not be fully effective under all scenarios.
Risk Categories
Categories –The Company groups its risks into the following categories: Insurance risk, Market and Credit risk, Capital risk, Operational risk and Strategic risk. Specific risk assessments and descriptions can be found below and in Item 1A -– “Risk Factors.”
Insurance Risk
Insurance risk is the risk of lower or negative earnings and potentially a reduction in enterprise value due to a greater amount of benefits and related expenses paid than expected, or from non-market related adverse policyholder or client behavior. The Company uses multiple approaches to managing insurance risk: active insurance risk assessment and pricing appropriately for the risks assumed, transferring undesired risks, and managing the retained exposure prudently. These strategies are explained below.
The global impact of the novel coronavirus (also referred to as COVID-19), first reported in Wuhan, China,COVID-19 pandemic and the response thereto has had a material adverse effect on the Company’s earnings and continues to develop rapidly. Although the Company is not aware of any material impact on its operations it continues to monitor the situation.develop. The extent to which the Company’s future results are affectedmay continue to be adversely impacted by COVID-19, with the novel coronavirus will largely depend on,extent influenced by new variants, measures by public and private institutions, and timing and adoption of effective vaccinations and treatments, among other factors, new information which may emerge concerningfactors. The Company continues to actively assess the impacts of COVID-19 on its severitybusiness and update and refine its COVID-19 projection and financial impact models to manage its insurance risk through the actions undertaken to contain or treat its symptoms.pandemic.
Insurance Risk Assessment and Pricing
The Company has developed extensive expertise in assessing insurance risks that ultimately forms an integral part of ensuring that it is compensated commensurately for the risks it assumes and that it does not overpay for the risks it transfers to third parties. This expertise includes a vast array of market and product knowledge supported by a large information database of historical experience that is closely monitored. Analysis and experience studies derived from this database help form the basis for the Company’s pricing assumptions that are used in developing rates for new risks. If actual mortality or morbidity experience is materially adverse, some reinsurance treaties allow for increases to future premium rates.
Mis-estimation Misestimation of any key risk can threaten the long term viability of the enterprise. Further, the pricing process is a key operational risk and significant effort is applied to ensuring the appropriateness of pricing assumptions. Some of the safeguards the Company uses to ensure proper pricing are: experience studies, strict underwriting, sensitivity and scenario testing, pricing guidelines and controls, authority limits and internal and external pricing reviews. In addition, the ERM function provides pricing oversight that includes periodic pricing audits.
Risk Transfer
To minimize volatility in financial results and reduce the impact of large losses, the Company transfers some of its insurance risk to third parties using vehicles such as retrocession and catastrophe coverage.
Individual Exposure Retrocession
In the normal course of business, the Company seeks to limit its exposure to loss on any single insured and to recover a portion of claims paid by ceding reinsurance to other insurance enterprises (or retrocessionaires) under excess coverage and coinsurance contracts. In individual life markets, the Company retains a maximum of $8 million of coverage per individual life. In certain limited situations the Company has retained more than $8 million per individual life. The Company enters into agreements with other reinsurers to mitigate the residual risk related to the over-retained policies. Additionally, due to some lower face amount reinsurance coverages provided by the Company in addition to individual life, such as group life, disability and health, under certain circumstances, the Company could potentially incur claims totaling more than $8 million per individual life.
Catastrophic Excess Loss Retrocession
The Company seeks to limit its exposure to loss on its assumed catastrophic excess of loss reinsurance agreements by ceding a portion of its exposure to multiple retrocessionaires through retrocession line slips or directly to retrocession markets. The Company’s policy is to retain a maximum of $20$30 million of catastrophic loss exposure per agreement and to retrocede up to $40$30 million additional loss exposures to the retrocession markets. The Company limits its exposure on a country-by-country (and state-by-state in the U.S.) basis by managing its total exposure to all catastrophic excess of loss agreements bound within a given country to established maximum aggregate exposures. The maximum exposures are established and managed both on gross amounts issued prior to including retrocession and for amounts net of exposures retroceded.
Catastrophe Coverage
The Company accesses the markets each year for annual catastrophic coverages and reviews current coverage and pricing of current and alternate designs. The coverage may vary from year to year based on the Company’s perceived value of such protection. The current policy covers events involving 5 or more insured deaths from a single occurrence and covers $100 million of claims in excess of the Company’s $25 million deductible.
Managing Retained Exposure
The Company retains most of the inbound insurance risk. The Company manages the retained exposure proactively using various mitigating factors such as diversification and limits. Diversification is the primary mitigating factor of short term volatility risk, but it also mitigates adverse impacts of changes in long term trends and catastrophic events. The Company’s insured populations are dispersed globally, diversifying the insurance exposure because factors that cause actual experience to deviate materially from expectations do not affect all areas uniformly and synchronously or in close sequence. A variety of limits mitigate retained insurance risk. Examples of these limits include geographic exposure limits, which set the maximum amount of business that can be written in a given country, and jumbo limits, which prevent excessive coverage on a given individual.
In the event that mortality or morbidity experience develops in excess of expectations, some reinsurance treaties allow for increases to future premium rates. Other treaties include experience refund provisions, which may also help reduce RGA’s mortality risk.
RGA has various methods to manage its insurance risks, including access to the capital and reinsurance markets.
Market and Credit Risk
Market and Credit risk is the risk of lower or negative earnings and potentially a reduction in enterprise value due to changes in the market prices of asset and liabilities.
Interest Rate Risk
Risk. Interest Rate risk is the risk that changes in the level and volatility of nominal interest rates affect the profitability, value or solvency position of the Company. This includes credit spread changes and inflation but excludes credit quality deterioration. This risk arises from many of the Company’s primary activities, as the Company invests substantial funds in interest-sensitive assets, primarily fixed maturity securities, and also has certain interest-sensitive contract liabilities. A prolonged period where market yields are significantly below the book yields of the Company’s asset portfolio puts downward pressure on portfolio book yields. The Company has been proactive in its investment strategies, reinsurance structures and overall asset-liability management practices to reduce the risk of unfavorable consequences in this type of environment.
The Company manages interest rate risk to optimize the return on the Company’s capital and to preserve the value created by its business operations within certain constraints. For example, certain management and monitoring processes are designed to minimize the effect of sudden and/or sustained changes in interest rates on fair value, cash flows, and net interestinvestment income. The Company manages its exposure to interest rates principally by managing the relative matching of the cash flows of its liabilities and assets.
The following table presents the account values, the weighted average interest-crediting rates and minimum guaranteed rate ranges for the contracts containing guaranteed rates by major class of interest-sensitive product as of December 31, 20192022 and 20182021 (dollars in millions):
| | | | | Account Value | | Current Weighted-Average Interest Crediting Rate | | Minimum Guaranteed Rate Ranges | | | Account Value | | Current Weighted-Average
Interest Crediting Rate | | Minimum Guaranteed
Rate Ranges |
| Interest Sensitive Contract Liability | | 2019 | | 2018 | | 2019 | | 2018 | | 2019 | | 2018 | Interest Sensitive Contract Liability | | 2022 | | 2021 | | 2022 | | 2021 | | 2022 | | 2021 |
| Traditional individual fixed annuities | | $ | 11,211 |
| | $ | 8,498 |
| | 3.27% | | 2.96% | | 0.50 – 5.50% | | 0.50 – 5.50% | Traditional individual fixed annuities | | $ | 16,503 | | | $ | 15,094 | | | 3.22% | | 3.22% | | 0.01 – 5.50% | | 0.01 – 5.50% |
| Equity-indexed annuities | | 3,523 |
| | 3,728 |
| | 3.47 | | 1.11 | | 0.10 – 3.00 | | 0.10 – 3.00 | Equity-indexed annuities | | 2,725 | | | 3,117 | | | (1.23) | | 2.10 | | 1.00 – 3.00 | | 0.10 – 3.00 |
| Individual variable annuity contracts | | 120 |
| | 131 |
| | 2.93 | | 2.97 | | 1.50 – 3.00 | | 1.50 – 3.04 | Individual variable annuity contracts | | 113 | | | 116 | | | 3.01 | | 2.98 | | 1.00 – 3.00 | | 1.50 – 3.00 |
| Guaranteed investment contracts | | 1,360 |
| | 1,744 |
| | 2.77 | | 2.45 | | 1.75 – 3.48 | | 1.47 – 3.61 | Guaranteed investment contracts | | 1,296 | | | 1,406 | | | 1.92 | | 0.76 | | 0.47 – 5.14 | | 0.31 – 3.32 |
| Universal life – type policies | | 4,387 |
| | 2,604 |
| | 3.76 | | 4.00 | | 2.00 – 6.00 | | 3.00 – 6.00 | Universal life – type policies | | 4,268 | | | 4,303 | | | 3.77 | | 3.76 | | 2.00 – 6.00 | | 2.00 – 6.00 |
| Funding agreement backed notes | | Funding agreement backed notes | | 906 | | | 500 | | | 1.03 | | 2.00 | | 2.00 – 2.70 | | 2.00 – 2.00 |
The following table presents the account values by each minimum guaranteed rate, rounded to the nearest percentage, by class of interest-sensitive product as of December 31, 20192022 and 20182021 (dollars in millions):
| | | | | Account Value as of December 31, 2019 | | | Account Value as of December 31, 2022 |
| Interest Sensitive Contract Liability | | 1% | | 2% | | 3% | | 4% | | 5% | | 6% | | Total | Interest Sensitive Contract Liability | | 1% | | 2% | | 3% | | 4% | | 5% | | 6% | | Total |
| Traditional individual fixed annuities | | $ | 937 |
| | $ | 763 |
| | $ | 5,065 |
| | $ | 2,149 |
| | $ | 2,277 |
| | $ | 20 |
| | $ | 11,211 |
| Traditional individual fixed annuities | | $ | 1,537 | | | $ | 1,204 | | | $ | 5,175 | | | $ | 6,036 | | | $ | 2,531 | | | $ | 19 | | | $ | 16,502 | |
| Equity-indexed annuities | | 789 |
| | 2,002 |
| | 732 |
| | — |
| | — |
| | — |
| | 3,523 |
| Equity-indexed annuities | | 892 | | | 1,354 | | | 479 | | | — | | | — | | | — | | | 2,725 | |
| Individual variable annuity contracts | | — |
| | 2 |
| | 118 |
| | — |
| | — |
| | — |
| | 120 |
| Individual variable annuity contracts | | — | | | 2 | | | 111 | | | — | | | — | | | — | | | 113 | |
| Guaranteed investment contracts | | — |
| | 1,192 |
| | 168 |
| | — |
| | — |
| | — |
| | 1,360 |
| Guaranteed investment contracts | | 50 | | | 119 | | | 77 | | | 105 | | | 945 | | | — | | | 1,296 | |
| Universal life – type policies | | — |
| | 714 |
| | 320 |
| | 3,278 |
| | 54 |
| | 21 |
| | 4,387 |
| Universal life – type policies | | — | | | 727 | | | 318 | | | 3,165 | | | 48 | | | 10 | | | 4,268 | |
| Funding agreement backed notes | | Funding agreement backed notes | | — | | | 501 | | | 405 | | | — | | | — | | | — | | | 906 | |
| | | | | | | | | | | | | | | | |
| | | Account Value as of December 31, 2018 | | | Account Value as of December 31, 2021 |
| Interest Sensitive Contract Liability | | 1% | | 2% | | 3% | | 4% | | 5% | | 6% | | Total | Interest Sensitive Contract Liability | | 1% | | 2% | | 3% | | 4% | | 5% | | 6% | | Total |
| Traditional individual fixed annuities | | $ | 938 |
| | $ | 760 |
| | $ | 4,697 |
| | $ | 2,071 |
| | $ | 11 |
| | $ | 21 |
| | $ | 8,498 |
| Traditional individual fixed annuities | | $ | 2,109 | | | $ | 1,057 | | | $ | 4,384 | | | $ | 5,106 | | | $ | 2,419 | | | $ | 19 | | | $ | 15,094 | |
| Equity-indexed annuities | | 685 |
| | 2,253 |
| | 790 |
| | — |
| | — |
| | — |
| | 3,728 |
| Equity-indexed annuities | | 943 | | | 1,614 | | | 560 | | | — | | | — | | | — | | | 3,117 | |
| Individual variable annuity contracts | | — |
| | 2 |
| | 129 |
| | — |
| | — |
| | — |
| | 131 |
| Individual variable annuity contracts | | — | | | 1 | | | 115 | | | — | | | — | | | — | | | 116 | |
| Guaranteed investment contracts | | 125 |
| | 635 |
| | 973 |
| | 11 |
| | — |
| | — |
| | 1,744 |
| Guaranteed investment contracts | | 1,202 | | | 138 | | | 66 | | | — | | | — | | | — | | | 1,406 | |
| Universal life – type policies | | — |
| | — |
| | — |
| | 2,527 |
| | 56 |
| | 21 |
| | 2,604 |
| Universal life – type policies | | — | | | 736 | | | 318 | | | 3,185 | | | 53 | | | 11 | | | 4,303 | |
| Funding agreement backed notes | | Funding agreement backed notes | | — | | | 500 | | | — | | | — | | | — | | | — | | | 500 | |
The spread profits on the Company’s fixed annuity and interest-sensitive whole life, universal life (“UL”) and fixed portion of variable universal life insurance policies are at risk if interest rates decline and remain relatively low for a period of time, which has generally been the case in recent years.time. Should interest rates remain at current levels, which are significantly lower than those existing prior to the declines of recent years, the average earned rate of return on the Company’s annuity and UL investment portfolios will continue to decline. Declining portfolio yields may causedecline, the spreads between investment portfolio yields and the interest rate credited to contract holders towould deteriorate as the Company’s ability to manage spreads can become limited by minimum guaranteed rates on annuity and UL policies. In 2019,2022, minimum guaranteed rates on non-variable annuity and UL policies generally ranged from 0.10%0.01% to 6.00%, with an average guaranteed rate of approximately 3.10%3.29%. In 2018,2021, minimum guaranteed rates on non-variable annuity and UL policies generally ranged from 0.10%0.01% to 6.00%, with an average guaranteed rate of approximately 2.86%3.05%.
Interest rate spreads are managed for near term income through a combination of crediting rate actions and portfolio management. Certain annuity products contain crediting rates that reset annually, of which $10.0$13.7 billion and $7.0$13.0 billion of account balances are not subject to surrender charges as of December 31, 20192022 and 2018, respectively,2021, respectively. with substantially all of these already at their minimum guaranteed rates. As such, certain management and monitoring processes are designed to minimize the effect of sudden and/or sustained changes in interest rates on fair value, cash flows, and net investment income. During 2022, the Company experienced a higher level of policyholder surrenders within the contracts with lower guaranteed minimum crediting rates due to the rising interest income.rate environment.
The Company’s exposure to interest rate price risk and interest rate cash flow risk is reviewed on a quarterly basis. Interest rate price risk exposure is measured using interest rate sensitivity analysis to determine the change in fair value of the Company’s financial instruments in the event of a hypothetical change in interest rates. Interest rate cash flow risk exposure is measured using interest rate sensitivity analysis to determine the Company’s variability in cash flows in the event of a hypothetical change in interest rates.
Interest rate sensitivity analysis is used to measure the Company’s interest rate price risk by computing estimated changes in fair value of fixed rate assets and liabilities in the event of a hypothetical 100 basis point change (increase or decrease) in market interest rates. The Company does not have fixed rate instruments classified as trading securities. The
Company’s projected net decrease in fair value of financial instruments in the event of a 100 basis point increase in market interest rates at its fiscal years ended December 31, 20192022 and 20182021 was $1.2$2.0 billion and $1.5$1.4 billion, respectively.
The calculation of fair value is based on the net present value of estimated discounted cash flows expected over the life of the market risk sensitive instruments, using market prepayment assumptions and market rates of interest provided by independent broker quotations and other public sources, with adjustments made to reflect the shift in the treasury yield curve as appropriate.
The interest rate sensitivity relating to the Company’s fixed maturity securities is assessed using hypothetical scenarios that assume positive and negative 50 and 100 basis point parallel shifts in the yield curves. This analysis assumes that the U.S., Canada and other pertinent countries’ yield curve shifts are of equal direction and magnitude. Change in value of individual securities is estimated consistently under each scenario using a commercial valuation tool. The Company’s actual experience may differ from the results noted below particularly due to assumptions utilized or if events differ from those included in the methodology. The following tables summarize the results of this analysis for fixed maturity securities in the Company’s investment portfolio as of the dates indicated (dollars in millions):
| | | | | | | | | | | | | | | | | | | | | | | | | | | | | | | | |
| Interest Rate Analysis of Estimated Fair Value of Fixed Maturity Securities |
| December 31, 2022: | | -100 bps | | -50 bps | | – | | +50 bps | | +100 bps |
| Total estimated fair value | | $ | 57,578 | | | $ | 55,152 | | | $ | 52,901 | | | $ | 50,826 | | | $ | 48,928 | |
| % Change in estimated fair value from base | | 8.8 | % | | 4.3 | % | | — | % | | (3.9) | % | | (7.5) | % |
| $ Change in estimated fair value from base | | $ | 4,677 | | | $ | 2,251 | | | $ | — | | | $ | (2,075) | | | $ | (3,973) | |
| | | Interest Rate Analysis of Estimated Fair Value of Fixed Maturity Securities | |
| December 31, 2019: | | -100 bps | | -50 bps | | - | | 50 bps | | 100 bps | |
| December 31, 2021: | | December 31, 2021: | | -100 bps | | -50 bps | | – | | +50 bps | | +100 bps |
| Total estimated fair value | | $ | 55,702 |
| | $ | 53,332 |
| | $ | 51,121 |
| | $ | 49,071 |
| | $ | 47,180 |
| Total estimated fair value | | $ | 66,926 | | | $ | 63,711 | | | $ | 60,749 | | | $ | 58,042 | | | $ | 55,588 | |
| % Change in estimated fair value from base | | 9.0 | % | | 4.3 | % | | — | % | | (4.0 | )% | | (7.7 | )% | % Change in estimated fair value from base | | 10.2 | % | | 4.9 | % | | — | % | | (4.5) | % | | (8.5) | % |
| $ Change in estimated fair value from base | | $ | 4,581 |
| | $ | 2,211 |
| | $ | — |
| | $ | (2,050 | ) | | $ | (3,941 | ) | $ Change in estimated fair value from base | | $ | 6,177 | | | $ | 2,962 | | | $ | — | | | $ | (2,707) | | | $ | (5,161) | |
|
| | | | | | | | | | | | | | | | | | | | |
| December 31, 2018: | | -100 bps | | -50 bps | | - | | 50 bps | | 100 bps |
| Total estimated fair value | | $ | 43,073 |
| | $ | 41,494 |
| | $ | 39,992 |
| | $ | 38,570 |
| | $ | 37,248 |
|
| % Change in estimated fair value from base | | 7.7 | % | | 3.8 | % | | — | % | | (3.6 | )% | | (6.9 | )% |
| $ Change in estimated fair value from base | | $ | 3,081 |
| | $ | 1,502 |
| | $ | — |
| | $ | (1,422 | ) | | $ | (2,744 | ) |
Interest rate sensitivity analysis is also used to measure the Company’s interest rate cash flow risk by computing estimated changes in the expected cash flows for floating rate assets and liabilities over a one year period following an instantaneous, parallel, hypothetical 100 basis point change (increase or decrease) in market interest rates. The Company does not have variable rate instruments classified as trading securities. The Company’s projected decrease in cash flows associated with floating rate instruments in the event of an instantaneous 100 basis point decrease in market interest rates for its fiscal years ended December 31, 20192022 and 20182021 was $32$43 million and $71$34 million, respectively.
Computations of prospective effects of hypothetical interest rate changes are based on numerous assumptions, and should not be relied on as indicative of future results. Further, the computations do not contemplate any actions management could undertake in response to changes in interest rates. Certain shortcomings are inherent in the method of analysis presented in the computation of the estimated fair value of fixed maturity securities and the estimated cash flows of floating rate instruments, which constitute forward-looking statements. Actual values may differ materially from those projections presented due to a number of factors, including, without limitation, market conditions varying from assumptions used in the calculation of the fair value.
In order to reduce the exposure to changes in fair values from interest rate fluctuations, the Company has developed strategies to manage the net interest rate sensitivity of its assets and liabilities. In addition, from time to time, the Company has utilized the swap market to manage the sensitivity of fair values to interest rate fluctuations.
Inflation can also have direct effects on the Company’s assets and liabilities. The primary direct effect of inflation is the increase in operating expenses. A large portion of the Company’s operating expenses consists of salaries, which are subject to wage increases at least partly affected by the rate of inflation.
The Company reinsures annuities with benefits indexed to the cost of living. Some of these benefits are hedged with a combination of CPI swaps and indexed bonds when material.
Long-term care products have an inflation component linked to the future cost of such services. If health care costs increase at a much larger rate than what is prevalent in the nominal interest rates available in the markets, the Company may not earn enough investment yield to pay future claims on such products.
On July 27, 2017, the Financial Conduct Authority (the “FCA”) announced that it intends to stop persuading or compelling banks to submit London Interbank Offered Rates (“LIBOR”) after December 31, 2021. In addition, separate workstreams are underway in EuropeSubsequently, on March 5, 2021, the FCA announced that all LIBOR settings will either cease to be provided or no longer be representative, with some being discontinued after December 31, 2021, and the U.S.remaining being discontinued after June 30, 2023. Workstreams have been established in several markets to reform existing reference rates and provide a fall back rate upon discontinuation of LIBOR. During 2019, theThe Alternative Rates Committee of the Federal Reserve Board proposed the Secured Overnight Financing Rate
(“SOFR”) as an alternative rate to replace U.S. Dollar LIBOR, and the European Central Bank recommended the Euro Short-term Rate (“ESTER”) as the new risk-free rate. Other jurisdictions are conducting similar exercises and have proposed potential replacement rates, as well. The Company is currently assessing the effects ofnecessary. Based on actions taken to date, the discontinuation of LIBOR, and the transition to replacement rates, has not had a material impact on existing contracts that extend beyond 2021, by analyzing contractual fallback provisions, evaluating alternative rate ramifications, and assessing the effects on current hedging strategies.Company’s consolidated financial statements.
Real Estate Risk
Risk. Real estate risk is the risk that changes in the level and volatility of real estate market valuations may impact the profitability, value or solvency position of the Company. The Company has investments in direct real estate equity and debt instruments collateralized by real estate (“real estate loans”). Real estate equity risks include significant reduction in valuations, which could be caused by downturns in the broad economy or in specific geographic regions or sectors. In addition, real estate loan risks include defaults, borrower or tenant bankruptcy and reduced liquidity. Real estate loan risks are partially mitigated by the excess of the value of the property over the loan principle, which provides a buffer should the value of the real estate decrease. The Company manages its real estate loan risk by diversifying by property type and geography and through exposure limits.
Equity Risk
Risk. Equity risk is the risk that changes in the level and volatility of equity market valuations affect the profitability, value or solvency position of the Company. This risk includes variable annuity and other equity linked exposures and asset related equity exposure. The Company assumes equity risk from alternative investments, fixed indexed annuities and variable annuities. The Company uses derivatives to hedge its exposure to movements in equity markets that have a direct correlation with certain of its reinsurance products.
Alternative Investments
Alternative investments are investments in non-traditional asset classes that primarily back the Company’s capital and surplus as well as certain long-term illiquid liability portfolios. Alternative investments generally encompass:include hedge funds, emerging markets debt, distressed debt, commodities, infrastructure, tax credits, and equities, both public and private. The Company mitigates its exposure to alternative investments by limiting the size of the alternative investments holding and using per-issuer investment limits.
Fixed Indexed Annuities
The Company reinsures fixed indexed annuities (“FIAs”). Credits for FIAsto FIA contracts are affected by changes in equity markets. Thus the fair value of the benefit is primarily a function of index returns and volatility. The Company hedges most of the underlying FIA equity exposure with derivatives.
Variable Annuities
The Company reinsures variable annuities including those with guaranteed minimum death benefits (“GMDB”), guaranteed minimum income benefits (“GMIB”), guaranteed minimum accumulation benefits (“GMAB”) and guaranteed minimum withdrawal benefits (“GMWB”). Strong equity markets, increases in interest rates and decreases in equity market volatility will generally decrease the fair value of the liabilities underlying the benefits. Conversely, a decrease in the equity markets along with a decrease in interest rates and an increase in equity market volatility will generally result in an increase in the fair value of the liabilities underlying the benefits, which has the effect of increasing reserves and lowering earnings. The Company maintains a customized dynamic hedging program that is designed to substantially mitigate the risks associated with income volatility around the change in reserves on guaranteed benefits, ignoring the Company’s own credit risk assessment. However, the hedge positions may not fully offset the changes in the carrying value of the guarantees due to, among other things, time lags, high levels of volatility in the equity and derivative markets, extreme changes in interest rates, unexpected contract holder behavior, and divergence between the performance of the underlying funds and hedging indices. These factors, individually or collectively, may have a material adverse effect on the Company’s net income, financial condition or liquidity. The table below provides a summary of variable annuity account values and the fair value of the guaranteed benefits as of December 31, 20192022 and 2018.2021.
| | | | | | | | | | | | | | |
| | | December 31, |
| (dollars in millions) | | 2022 | | 2021 |
| No guaranteed minimum benefits | | $ | 672 | | | $ | 844 | |
| GMDB only | | 771 | | | 960 | |
| GMIB only | | 20 | | | 25 | |
| GMAB only | | 2 | | | 3 | |
| GMWB only | | 863 | | | 1,130 | |
| GMDB / WB | | 165 | | | 264 | |
| Other | | 15 | | | 19 | |
| Total variable annuity account values | | $ | 2,508 | | | $ | 3,245 | |
| Fair value of liabilities associated with living benefit riders | | $ | 124 | | | $ | 162 | |
|
| | | | | | | | |
| | | December 31, |
| (dollars in millions) | | 2019 | | 2018 |
| No guaranteed minimum benefits | | $ | 711 |
| | $ | 797 |
|
| GMDB only | | 837 |
| | 159 |
|
| GMIB only | | 23 |
| | 21 |
|
| GMAB only | | 4 |
| | 7 |
|
| GMWB only | | 1,123 |
| | 1,090 |
|
| GMDB / WB | | 278 |
| | 272 |
|
| Other | | 18 |
| | 19 |
|
| Total variable annuity account values | | $ | 2,994 |
| | $ | 2,365 |
|
| Fair value of liabilities associated with living benefit riders | | $ | 163 |
| | $ | 168 |
|
Credit Risk
Credit risk, which includes default risk, is risk of loss due to credit quality deterioration of an individual financial asset, derivative or non-derivative contract or instrument. Credit quality deterioration may or may not be accompanied by a ratings downgrade. Generally, the credit exposure for an asset is limited to the fair value, net of any collateral received, at the reporting date.
Investment Credit Risk
Investment credit risk is credit risk related to invested assets. The Company manages investment credit risk using per-issuer investment limits. In addition to per-issuer limits, the Company also limits the total amounts of investments per rating category. An automated compliance system checks for compliance for all investment positions and sends warning messages when there is a breach. The Company manages its credit risk related to over-the-counter derivatives by entering into transactions with creditworthy counterparties, maintaining collateral arrangements and through the use of master agreements that provide for a single net payment to be made by one counterparty to another at each due date and upon termination. BecauseAs futures are transacted through regulated exchanges, and positions are marked to market on a daily basis, the Company has minimal exposure to credit-related losses in the event of nonperformance by counterparties to such derivative instruments.
The Company enters into various collateral arrangements, which require both the posting and accepting of collateral in connection with its derivative instruments. Collateral agreements contain attachment thresholds that vary depending on the posting party’s financial strength ratings. Additionally, a decrease in the Company’s financial strength rating to a specified level results in potential settlement of the derivative positions under the Company’s agreements with its counterparties. A committee is responsible for setting rules and approving and overseeing all transactions requiring collateral. See “Credit Risk” in Note 5 -– “Derivative Instruments” in the Notes to Consolidated Financial Statements for additional information on credit risk related to derivatives.
Counterparty Risk
Counterparty risk is the potential for the Company to incur losses due to a client, retrocessionaire, or partner becoming distressed or insolvent. This includes run-on-the-bank risk and collection risk.
Run-on-the-Bank
The is the potential risk that a client’s in force block incurs substantial surrenders and/or lapses due to credit impairment, reputation damage or other market changes affecting the counterparty. SubstantiallyPolicyholder surrenders and/or lapses substantially higher than expected surrenders and/or lapses could result in inadequate in force business to recover cash paid out for acquisition costs.
Collection Risk
For clients and retrocessionaires, thiscollection risk includes their inability to satisfy a reinsurance agreement because the right of offset is disallowed by the receivership court; the reinsurance contract is rejected by the receiver, resulting in a premature termination of the contract; and/or the security supporting the transaction becomes unavailable to the Company.
The Company manages counterparty risk by limiting the total exposure to a single counterparty and by only initiating contracts with creditworthy counterparties. In addition, some of the counterparties have set up trusts and letters of credit, reducing the Company’s exposure to these counterparties.
Generally, the Company’s insurance subsidiaries retrocede amounts in excess of their retention to certain of the Company’s other insurance subsidiaries. External retrocessions are arranged through the Company’s retrocession pools for amounts in excess of its retention. As of December 31, 2019,2022, all retrocession pool members in this excess retention pool rated by the A.M. Best Company were rated “A-” or better. A rating of “A-” is the fourth highest rating out of sixteen possible ratings. For a majority of the retrocessionaires that were not rated, letters of credit or trust assets have been givenreceived by the Company as additional security. In addition, the Company performs annual financial and in force reviews of its retrocessionaires to evaluate financial stability and performance.
The Company has never experienced a material default in connection with retrocession arrangements, nor has it experienced any material difficulty in collecting claims recoverable from retrocessionaires; however, no assurance can be given as to the future performance of such retrocessionaires or as to the recoverability of any such claims.
Aggregate Counterparty Limits
In addition to investment credit limits and counterparty limits, there arethe Company maintains aggregate counterparty risk limits that include counterparty exposures from reinsurance, financing and investment activities at an aggregated level to control total exposure to a single counterparty. Counterparty risk aggregation is important because it enables the Company to capture risk exposures at a comprehensive level and under more extreme circumstances compared to analyzing the components individually.
All counterparty exposures are calculated on a quarterly basis, reviewed by management and monitored by the ERM function.
Capital Risk
Capital risk is the risk of lower/negative earnings, potential reduction in enterprise value, and/or the loss of ability to conduct business due to insufficient financial capacity, including not having the appropriate amount of group or entity-level capital to conduct business today or in the future. The Company monitors capital risk exposure using relevant bases of measurement including but not limited to economic, rating agency, and local regulatory methodologies. Additionally, the Company regularly assesses risk related to collateral, foreign currency, financing, liquidity and tax.
Collateral Risk
Risk. Collateral risk is the risk that collateral will not be available at expected costs or in the capacity required to meet current and future needs. The Company monitors risks related to interest rate movement, collateral requirements and position and capital markets environment. Collateral demands and resources continue to be actively managed with available collateral sources being more than sufficient to cover stress level collateral demands.
Foreign Currency Risk
Risk. Foreign currency risk is the risk of changes in level and volatility of currency exchange rates affect the profitability, value or solvency position of the Company. The Company manages its exposure to foreign currency risk principally by currency matching invested assets with the underlying liabilities to the extent practical. The Company has in place net investment hedges for a portion of its investments in its Canadian operations to reduce excess exposure to these currencies.that currency. Translation differences resulting from translating foreign subsidiary balances to U.S. dollars are reflected in stockholders’ equity on the consolidated balance sheets.
The Company generally does not hedge the foreign currency exposure of its subsidiaries transacting business in currencies other than their functional currency (transaction exposure). However, the Company has entered into cross currency swaps to manage exposure to specific currencies. The majority of the Company’s foreign currency transactions are denominated in Australian dollars, British pounds, Canadian dollars, Euros, Japanese yen, Korean won, and the South African rand. The maximum amount of assets held in a specific currency (with the exception of the U.S. dollar) is measured relative to risk targets and is monitored regularly.
The Company does not hedge the income statement risk associated with translating foreign currencies. The foreign exchange risk sensitivity of the Company’s consolidated pre-tax income is assessed using hypothetical test scenarios. Actual results may differ from the results noted below particularly due to assumptions utilized or if events occur that were not included in the methodology. For more information on this risk, see “Item 1A -– Risk Factors -– Risks Related to Our Business.” In general, a weaker U.S. dollar relative to foreign currencies has a favorable impact on the Company’s income before income taxes. Conversely, the recent strength of the U.S. Dollar relative to certain foreign currencies has had a negative impact on the Company’s income before income taxes. The following tables summarize the impact on the Company’s reported income before income taxes of an immediate favorable or unfavorable change in each of the foreign exchange rates to which the Company has exposure (dollars in millions):
| | | | | | | | | | | | | | | | | | | | | | | | | | | | | | | | |
| | Unfavorable | | | | Favorable |
| Year Ended December 31, 2022 | | -10% | | -5% | | – | | +5% | | +10% |
| Income before income taxes | | $ | 773 | | | $ | 796 | | | 820 | | | $ | 843 | | | $ | 866 | |
| % change of income before income taxes from base | | (5.6) | % | | (2.8) | % | | — | % | | 2.8 | % | | 5.6 | % |
| $ change of income before income taxes from base | | $ | (46) | | | $ | (23) | | | $ | — | | | $ | 23 | | | $ | 46 | |
| | | | | | | | | | | | | | Unfavorable | | Favorable |
| | | Unfavorable | | | | Favorable | |
| Year Ended December 31, 2019 | | -10% | | -5% | | - | | +5% | | +10% | |
| Year Ended December 31, 2021 | | Year Ended December 31, 2021 | | -10% | | -5% | | – | | +5% | | +10% |
| Income before income taxes | | $ | 1,072 |
| | $ | 1,102 |
| | $ | 1,132 |
| | $ | 1,162 |
| | $ | 1,191 |
| Income before income taxes | | $ | 645 | | | $ | 668 | | | 691 | | | $ | 713 | | | $ | 736 | |
| % change of income before income taxes from base | | 5.3 | % | | 2.6 | % | | — | % | | 2.6 | % | | 5.3 | % | % change of income before income taxes from base | | (6.6) | % | | (3.3) | % | | — | % | | 3.3 | % | | 6.6 | % |
| $ change of income before income taxes from base | | $ | (60 | ) | | $ | (30 | ) | | $ | — |
| | $ | 30 |
| | $ | 60 |
| $ change of income before income taxes from base | | $ | (45) | | | $ | (23) | | | $ | — | | | $ | 23 | | | $ | 45 | |
|
| | | | | | | | | | | | | | | | | | | | |
| | | Unfavorable | | | | Favorable |
| Year Ended December 31, 2018 | | -10% | | -5% | | - | | +5% | | +10% |
| Income before income taxes | | $ | 796 |
| | $ | 821 |
| | $ | 846 |
| | $ | 871 |
| | $ | 896 |
|
| % change of income before income taxes from base | | (5.9 | )% | | (3.0 | )% | | — | % | | 3.0 | % | | 5.9 | % |
| $ change of income before income taxes from base | | $ | (50 | ) | | $ | (25 | ) | | $ | — |
| | $ | 25 |
| | $ | 50 |
|
Financing Risk
Risk. Financing risk is the risk that capital will not be available at expected costs or in the capacity required. The Company continues to monitor financing risks related to regulatory financing, contingency financing, and debt capital and sees no immediate issues with its current structures, capacity and plans.
Liquidity Risk
Risk. Liquidity risk is the risk that the Company is unable to meet payment obligations at expected costs or in the capacity required. The Company’s traditional liquidity demands include items such as claims, expenses, debt financing and investment
purchases, which are largely known or can be reasonably forecasted. The Company regularly performs liquidity risk modeling, including both market and Company specific stresses, to assess the sufficiency of available resources.
Tax Risk
Risk. Tax risk is the risk that current and future tax positions are different than expected. The Company monitors tax risks related to the evolving tax and regulatory environment, business transactions, legal entity reorganizations, tax compliance obligations, and financial reporting.
Operational Risk
Operational risk is the risk of lower/negative earnings and a potential reduction in enterprise value caused by unexpected losses associated with inadequacy or failure on the part of internal processes, people and systems, or from external events. The Company regularly monitors and assesses the risks related to business conduct and governance, fraud, privacy, and security,cybersecurity, business disruption, and business operations. Various insurance, market and credit, capital, and strategy risk obligations and concerns often intersect with the Company’s core operational process risk areas. Given the scope of the Company’s business and the number of countries in which it operates, this set of risks has the potential to affect the business
locally, regionally, or globally. Operational risks are core to managing the Company’s brand and market confidence as well as maintaining its ability to acquire and retain the appropriate expertise to execute and operate the business.
Business Conduct and Governance Risk
Risk. Business conduct and governance is the risk related to management oversight, compliance, market conduct, and legal matters. The Company’s Compliance Risk Management Program facilitates a proactive evaluation of present and potential compliance risks associated with both local and enterprise-wide regulatory requirements as well as compliance with Company policies and procedures.
Fraud Risk
Risk. Fraud risk is the risk related to the deliberate abuse of and/or taking of Company assets in order to secure gain for the perpetrator or inflict harm on the Company or other victim. Ongoing monitoring and an annual fraud risk assessment enables the Company to continually evaluate potential fraud risks within the organization.
Privacy Risk. Privacy risk is the risk of non-compliance with privacy regulations and Security Risklaws. The Company’s privacy program, processes, and procedures are designed to protect personal information related to its customers, insured individuals or its employees. The Company’s privacy program facilitates a proactive evaluation of present and potential privacy risks associated with both local and enterprise-wide regulatory requirements as well as compliance with Company policies and procedures.
Privacy and securityCybersecurity Risk. Cybersecurity risk is the risk of theft, loss, unauthorized disclosure, or unauthorized disclosureuse of physical or electronic assets resulting in a loss of asset value, confidentiality, loss of revenue, poor reputational exposure, or intellectual property.regulatory fines. The Company’s privacy and security programs,cybersecurity program, processes, and procedures are designed to prevent unauthorized physical and electronic theft and the disclosure of confidential and personal data related to its customers, insured individuals or its employees. The Company employs technology, administrative related processes and procedural controls, security measures and other preventative actions to reduce the risk of such incidents.
Business Disruption Risk
Risk. Business disruption risk is the risk of impairment to operational capabilities due to the unavailability of people, systems, and/or facilities. The Company’s global business continuity process enables associates to identify potential impacts that threaten operations by providing the framework, policies and procedures and required recurring training for how the Company will recover and restore interrupted critical functions, within a predetermined time, after a disaster or extended disruption, until its normal facilities are restored.
Business Operations Risk
Risk. Business operations risk is the risk related to business processes and procedures. Business operations risk includes risk associated with the processing of transactions, data use and management, monitoring and reporting, the integrity and accuracy of models, the use of third parties, and the delivery of advisory services.
Human Capital Risk
Risk. Human capital risk is related to workforce management, including talent acquisition, development, retention, and employment relations/regulations. The Company actively monitors human capital risks using multiple practices that include but are not limited to human resource and compliance policies and procedures, regularly reviewing key risk indicators, performance evaluations, compensation and benefits benchmarking, succession planning, employee engagement surveys and associate exit interviews.
Strategic Risk
Strategic risk relates to the planning, implementation, and management of the Company’s business plans and strategies, including the risks associated with: the global environment in which it operates; future law and regulation changes; political risks; and relationships with key external parties.
Strategy Risk
Risk. Strategy risk is the risk related to the design and execution of the Company’s strategic plan, including risks associated with merger and acquisition activity. Strategy risks are addressed by a robust multi-year planning process, regular business unit level assessments of strategy execution and active benchmarking of key performance and risk indicators across the Company’s portfolios of businesses. The Company’s risk appetites and limits are set to be consistent with strategic objectives.
External Environment Risk
Risk. External environment risk relates to external competition, macro trends, and client needs. Macro characteristics that drive market opportunities, risk and growth potential, the competitive landscape and client feedback are closely monitored.
Key Relationships Risk
Risk. Key relationships risk relates to areas of important interactions with parties external to the Company. The Company’s reputation is a critical asset in successfully conducting business and therefore relationships with its primary stakeholders (including but not limited to business partners, shareholders, clients, rating agencies, and regulators) are all carefully monitored.
Political and Regulatory Risk
Risk. Political and regulatory risk relates to future law and regulation changes and the impact of political changes or instability on the Company’s ability to achieve its objectives. Regulatory and political developments and related risks that may affect the Company are identified, assessed and monitored as part of regular oversight activities.
New Accounting Standards
See “New Accounting Pronouncements” in Note 2 —– “Significant Accounting Policies and Pronouncements” in the Notes to Consolidated Financial Statements.Statements for additional information on new accounting pronouncements and their impact, if any, on the Company’s results of operations and financial position.
Item 7A. QUANTITATIVE AND QUALITATIVE DISCLOSURES ABOUT MARKET RISK
Information required by Item 7A is contained in Item 7 under the caption “Management’s Discussion and Analysis of Financial Condition and Results of Operations—Operations – Market and Credit Risk”.
Item 8. FINANCIAL STATEMENTS AND SUPPLEMENTARY DATA
REINSURANCE GROUP OF AMERICA, INCORPORATED AND SUBSIDIARIES
Index to Consolidated Financial Statements
| | | | | | | | |
| | |
| | |
| Annual Financial Statements: | Page |
| | |
Financial Statements as of December 31, 20192022 and 20182021 and for the years ended December 31, 2019, 20182022, 2021 and 2017:2020: | |
| | |
| | |
| | |
| | |
| | |
| | |
| Notes to Consolidated Financial Statements: | |
| | |
| | |
| | |
| | |
| | |
| | |
| | |
| | |
| | |
| | |
| | |
| | |
| | |
| | |
| | |
| | |
| | |
| | |
| | |
| |
| | |
REINSURANCE GROUP OF AMERICA, INCORPORATED AND SUBSIDIARIES
CONSOLIDATED BALANCE SHEETS
(in millions, except share data)
| | | | | December 31,
2019 | | December 31,
2018 | | December 31,
2022 | | December 31,
2021 |
| Assets | | | | | Assets | | | | |
| Fixed maturity securities: | | | | | |
| Available-for-sale at fair value (amortized cost of $46,753 and $38,882) | | $ | 51,121 |
| | $ | 39,992 |
| |
| Fixed maturity securities available-for-sale at fair value (amortized cost of $59,663 and $55,873; allowance for credit losses of $37 and $31) | | Fixed maturity securities available-for-sale at fair value (amortized cost of $59,663 and $55,873; allowance for credit losses of $37 and $31) | | $ | 52,901 | | | $ | 60,749 | |
| Equity securities, at fair value | | 320 |
| | 82 |
| Equity securities, at fair value | | 134 | | | 151 | |
| Mortgage loans on real estate (net of allowances of $12 and $11) | | 5,706 |
| | 4,966 |
| |
| Mortgage loans (net of allowance for credit losses of $51 and $35) | | Mortgage loans (net of allowance for credit losses of $51 and $35) | | 6,590 | | | 6,283 | |
| Policy loans | | 1,319 |
| | 1,345 |
| Policy loans | | 1,231 | | | 1,234 | |
| Funds withheld at interest | | 5,662 |
| | 5,761 |
| Funds withheld at interest | | 6,003 | | | 6,954 | |
| Limited partnerships and real estate joint ventures | | Limited partnerships and real estate joint ventures | | 2,327 | | | 1,996 | |
| Short-term investments | | 64 |
| | 143 |
| Short-term investments | | 154 | | | 87 | |
| Other invested assets | | 2,363 |
| | 1,915 |
| Other invested assets | | 1,140 | | | 1,074 | |
| Total investments | | 66,555 |
| | 54,204 |
| Total investments | | 70,480 | | | 78,528 | |
| Cash and cash equivalents | | 1,449 |
| | 1,890 |
| Cash and cash equivalents | | 2,927 | | | 2,948 | |
| Accrued investment income | | 493 |
| | 428 |
| Accrued investment income | | 630 | | | 533 | |
| Premiums receivable and other reinsurance balances | | 2,940 |
| | 3,018 |
| Premiums receivable and other reinsurance balances | | 3,013 | | | 2,888 | |
| Reinsurance ceded receivables | | 904 |
| | 758 |
| |
| Reinsurance ceded receivables and other | | Reinsurance ceded receivables and other | | 2,462 | | | 2,580 | |
| Deferred policy acquisition costs | | 3,512 |
| | 3,398 |
| Deferred policy acquisition costs | | 3,974 | | | 3,690 | |
| Other assets | | 878 |
| | 839 |
| Other assets | | 1,220 | | | 1,008 | |
| Total assets | | $ | 76,731 |
| | $ | 64,535 |
| Total assets | | $ | 84,706 | | | $ | 92,175 | |
| Liabilities and Stockholders’ Equity | | | | | |
| Liabilities and Equity | | Liabilities and Equity | | | | |
| Future policy benefits | | $ | 28,672 |
| | $ | 25,285 |
| Future policy benefits | | $ | 35,220 | | | $ | 35,782 | |
| Interest-sensitive contract liabilities | | 22,711 |
| | 18,005 |
| Interest-sensitive contract liabilities | | 30,572 | | | 26,377 | |
| Other policy claims and benefits | | 5,711 |
| | 5,643 |
| Other policy claims and benefits | | 6,571 | | | 6,993 | |
| Other reinsurance balances | | 557 |
| | 487 |
| Other reinsurance balances | | 756 | | | 613 | |
| Deferred income taxes | | 2,712 |
| | 1,799 |
| Deferred income taxes | | 736 | | | 2,886 | |
| Other liabilities | | 1,188 |
| | 1,396 |
| Other liabilities | | 2,655 | | | 2,663 | |
| | Long-term debt | | 2,981 |
| | 2,788 |
| Long-term debt | | 3,961 | | | 3,667 | |
| Collateral finance and securitization notes | | 598 |
| | 682 |
| Collateral finance and securitization notes | | — | | | 180 | |
| Total liabilities | | 65,130 |
| | 56,085 |
| Total liabilities | | 80,471 | | | 79,161 | |
| Commitments and contingent liabilities (See Note 12) | |
| |
| Commitments and contingent liabilities (See Note 12) | |
| Stockholders’ Equity: | | | | | |
| Equity: | | Equity: | |
| Preferred stock (par value $.01 per share; 10,000,000 shares authorized; no shares issued or outstanding) | | — |
| | — |
| Preferred stock (par value $.01 per share; 10,000,000 shares authorized; no shares issued or outstanding) | | — | | | — | |
Common stock (par value $.01 per share; 140,000,000 shares authorized; shares issued: 79,137,758 at December 31, 2019 and 2018) | | 1 |
| | 1 |
| |
Common stock (par value $0.01 per share; 140,000,000 shares authorized; shares issued: 85,310,598 at both December 31, 2022 and December 31, 2021) | | Common stock (par value $0.01 per share; 140,000,000 shares authorized; shares issued: 85,310,598 at both December 31, 2022 and December 31, 2021) | | 1 | | | 1 | |
| Additional paid-in-capital | | 1,937 |
| | 1,899 |
| Additional paid-in-capital | | 2,502 | | | 2,461 | |
| Retained earnings | | 7,952 |
| | 7,285 |
| Retained earnings | | 8,967 | | | 8,563 | |
| Treasury stock, at cost - 16,481,656 and 16,323,390 shares | | (1,426 | ) | | (1,371 | ) | |
| Treasury stock, at cost – 18,634,390 and 18,139,868 shares | | Treasury stock, at cost – 18,634,390 and 18,139,868 shares | | (1,720) | | | (1,653) | |
| Accumulated other comprehensive income | | 3,137 |
| | 636 |
| Accumulated other comprehensive income | | (5,605) | | | 3,642 | |
| Total stockholders’ equity | | 11,601 |
| | 8,450 |
| |
| Total Reinsurance Group of America, Inc. stockholders’ equity | | Total Reinsurance Group of America, Inc. stockholders’ equity | | 4,145 | | | 13,014 | |
| Noncontrolling interest | | Noncontrolling interest | | 90 | | | — | |
| Total equity | | Total equity | | 4,235 | | | 13,014 | |
| Total liabilities and stockholders’ equity | | $ | 76,731 |
| | $ | 64,535 |
| Total liabilities and stockholders’ equity | | $ | 84,706 | | | $ | 92,175 | |
See accompanying notes to consolidated financial statements.
REINSURANCE GROUP OF AMERICA, INCORPORATED AND SUBSIDIARIES
CONSOLIDATED STATEMENTS OF INCOME
(in millions, except per share amounts)
| | | | | For the years ended December 31, | | | For the years ended December 31, |
| | | 2019 | | 2018 | | 2017 | | | 2022 | | 2021 | | 2020 |
| Revenues | | | Revenues | | |
| Net premiums | | $ | 11,297 |
| | $ | 10,544 |
| | $ | 9,841 |
| Net premiums | | $ | 13,078 | | | $ | 12,513 | | | $ | 11,694 | |
| Investment income, net of related expenses | | 2,520 |
| | 2,139 |
| | 2,155 |
| |
| Investment related gains (losses), net: | | | | | | | |
| Other-than-temporary impairments on fixed maturity securities | | (31 | ) | | (28 | ) | | (43 | ) | |
Other-than-temporary impairments on fixed maturity securities transferred to other comprehensive income | | — |
| | — |
| | — |
| |
| Other investment related gains (losses), net | | 122 |
| | (142 | ) | | 211 |
| |
| Total investment related gains (losses), net | | 91 |
| | (170 | ) | | 168 |
| |
| Net investment income | | Net investment income | | 3,161 | | | 3,138 | | | 2,575 | |
| | Investment related gains (losses), net | | Investment related gains (losses), net | | (506) | | | 560 | | | (33) | |
| Other revenues | | 392 |
| | 363 |
| | 352 |
| Other revenues | | 525 | | | 447 | | | 360 | |
| Total revenues | | 14,300 |
| | 12,876 |
| | 12,516 |
| Total revenues | | 16,258 | | | 16,658 | | | 14,596 | |
| Benefits and expenses | | | | | | | Benefits and expenses | | | | | | |
| Claims and other policy benefits | | 10,197 |
| | 9,319 |
| | 8,519 |
| Claims and other policy benefits | | 12,046 | | | 12,776 | | | 11,075 | |
| Interest credited | | 697 |
| | 425 |
| | 502 |
| Interest credited | | 682 | | | 700 | | | 704 | |
| Policy acquisition costs and other insurance expenses | | 1,204 |
| | 1,323 |
| | 1,467 |
| Policy acquisition costs and other insurance expenses | | 1,499 | | | 1,416 | | | 1,261 | |
| Other operating expenses | | 868 |
| | 786 |
| | 710 |
| Other operating expenses | | 1,009 | | | 936 | | | 816 | |
| Interest expense | | 173 |
| | 147 |
| | 146 |
| Interest expense | | 184 | | | 127 | | | 170 | |
| Collateral finance and securitization expense | | 29 |
| | 30 |
| | 29 |
| Collateral finance and securitization expense | | 7 | | | 12 | | | 17 | |
| Total benefits and expenses | | 13,168 |
| | 12,030 |
| | 11,373 |
| Total benefits and expenses | | 15,427 | | | 15,967 | | | 14,043 | |
| Income before income taxes | | 1,132 |
| | 846 |
| | 1,143 |
| Income before income taxes | | 831 | | | 691 | | | 553 | |
| Provision for income taxes | | 262 |
| | 130 |
| | (679 | ) | Provision for income taxes | | 204 | | | 74 | | | 138 | |
| Net income | | $ | 870 |
| | $ | 716 |
| | $ | 1,822 |
| Net income | | 627 | | | 617 | | | 415 | |
| Net income attributable to noncontrolling interest | | Net income attributable to noncontrolling interest | | 4 | | | — | | | — | |
| Net income available to RGA, Inc. shareholders | | Net income available to RGA, Inc. shareholders | | $ | 623 | | | $ | 617 | | | $ | 415 | |
| | Earnings per share | | | | | | | Earnings per share | |
| Basic earnings per share | | $ | 13.88 |
| | $ | 11.25 |
| | $ | 28.28 |
| Basic earnings per share | | $ | 9.31 | | | $ | 9.10 | | | $ | 6.35 | |
| Diluted earnings per share | | 13.62 |
| | 11.00 |
| | 27.71 |
| Diluted earnings per share | | 9.21 | | | 9.04 | | | 6.31 | |
|
See accompanying notes to consolidated financial statements.
REINSURANCE GROUP OF AMERICA, INCORPORATED AND SUBSIDIARIES
CONSOLIDATED STATEMENTS OF COMPREHENSIVE INCOME
(in millions)
| | | | | For the years ended December 31, | | For the years ended December 31, |
| | | 2019 | | 2018 | | 2017 | | 2022 | | 2021 | | 2020 |
| Comprehensive income (loss) | | | | | | | Comprehensive income (loss) | | | | | | |
| Net Income | | $ | 870 |
| | $ | 716 |
| | $ | 1,822 |
| Net Income | | $ | 627 | | | $ | 617 | | | $ | 415 | |
| Other comprehensive income (loss), net of tax: | | | | | | | |
| Other comprehensive income, net of tax: | | Other comprehensive income, net of tax: | |
| Foreign currency translation adjustments | | 77 |
| | (80 | ) | | 69 |
| Foreign currency translation adjustments | | (162) | | | 60 | | | 23 | |
| Net unrealized investment gains (losses) | | 2,443 |
| | (1,344 | ) | | 698 |
| Net unrealized investment gains (losses) | | (9,108) | | | (1,799) | | | 2,201 | |
| | Defined benefit pension and postretirement plan adjustments | | (19 | ) | | — |
| | 1 |
| Defined benefit pension and postretirement plan adjustments | | 23 | | | 22 | | | (2) | |
| Total other comprehensive income (loss), net of tax | | 2,501 |
| | (1,424 | ) | | 768 |
| Total other comprehensive income (loss), net of tax | | (9,247) | | | (1,717) | | | 2,222 | |
| Total comprehensive income (loss) | | $ | 3,371 |
| | $ | (708 | ) | | $ | 2,590 |
| Total comprehensive income (loss) | | (8,620) | | | (1,100) | | | 2,637 | |
| Comprehensive income (loss), net of tax attributable to noncontrolling interest | | Comprehensive income (loss), net of tax attributable to noncontrolling interest | | 4 | | | — | | | — | |
| Total comprehensive income (loss) available to Reinsurance Group of America, Inc. | | Total comprehensive income (loss) available to Reinsurance Group of America, Inc. | | $ | (8,624) | | | $ | (1,100) | | | $ | 2,637 | |
See accompanying notes to consolidated financial statements.
REINSURANCE GROUP OF AMERICA, INCORPORATED AND SUBSIDIARIES
CONSOLIDATED STATEMENTS OF STOCKHOLDERS’ EQUITY
(in millions except per share amounts)
|
| | | | | | | | | | | | | | | | | | | | | | | |
| | Common Stock | | Additional Paid In Capital | | Retained Earnings | | Treasury Stock | | Accumulated Other Comprehensive Income | | Total |
| Balance, December 31, 2016 | $ | 1 |
| | $ | 1,849 |
| | $ | 5,199 |
| | $ | (1,095 | ) | | $ | 1,139 |
| | $ | 7,093 |
|
| Adoption of new accounting standards | | | | | (139 | ) | | | | 157 |
| | 18 |
|
| Net income | | | | | 1,822 |
| | | | | | 1,822 |
|
| Total other comprehensive income (loss) | | | | | | | | | 768 |
| | 768 |
|
| Dividends to stockholders, $1.82 per share | | | | | (117 | ) | | | | | | (117 | ) |
| Purchase of treasury stock | | | | | | | (43 | ) | | | | (43 | ) |
| Reissuance of treasury stock | | | 22 |
| | (29 | ) | | 36 |
| | | | 29 |
|
| Balance, December 31, 2017 | 1 |
| | 1,871 |
| | 6,736 |
| | (1,102 | ) | | 2,064 |
| | 9,570 |
|
| Adoption of new accounting standards | | | | | 1 |
| | | | (4 | ) | | (3 | ) |
| Net income | | | | | 716 |
| | | | | | 716 |
|
| Total other comprehensive income (loss) | | | | | | | | | (1,424 | ) | | (1,424 | ) |
| Dividends to stockholders, $2.20 per share | | | | | (140 | ) | | | | | | (140 | ) |
| Purchase of treasury stock | | | | | | | (300 | ) | | | | (300 | ) |
| Reissuance of treasury stock | | | 28 |
| | (28 | ) | | 31 |
| | | | 31 |
|
| Balance, December 31, 2018 | 1 |
| | 1,899 |
| | 7,285 |
| | (1,371 | ) | | 636 |
| | 8,450 |
|
| Adoption of new accounting standards | | | | | — |
| | | |
|
| | — |
|
| Net income | | | | | 870 |
| | | | | | 870 |
|
| Total other comprehensive income (loss) | | | | | | | | | 2,501 |
| | 2,501 |
|
| Dividends to stockholders, $2.60 per share | | | | | (163 | ) | | | | | | (163 | ) |
| Purchase of treasury stock | | | | | | | (101 | ) | | | | (101 | ) |
| Reissuance of treasury stock | | | 38 |
| | (40 | ) | | 46 |
| | | | 44 |
|
| Balance, December 31, 2019 | $ | 1 |
| | $ | 1,937 |
| | $ | 7,952 |
| | $ | (1,426 | ) | | $ | 3,137 |
| | $ | 11,601 |
|
| | | | | | | | | | | | | | | | | | | | | | | | | | | | | | | | | | | | | | | | | | | | | | | | | |
| Common
Stock | | | | Additional Paid In
Capital | | Retained
Earnings | | Treasury
Stock | | Accumulated Other Comprehensive
Income | | Total RGA, Inc. Stockholders’ Equity | | Noncontrolling Interest | | Total Equity |
| Balance, December 31, 2019 | $ | 1 | | | | | $ | 1,937 | | | $ | 7,952 | | | $ | (1,426) | | | $ | 3,137 | | | $ | 11,601 | | | $ | — | | | $ | 11,601 | |
| Adoption of new accounting standards | | | | | | | (12) | | | | | | | (12) | | | | | (12) | |
| Net income | | | | | | | 415 | | | | | | | 415 | | | | | 415 | |
| Total other comprehensive income (loss) | | | | | | | | | | | 2,222 | | | 2,222 | | | | | 2,222 | |
| Dividends to stockholders, $2.80 per share | | | | | | | (182) | | | | | | | (182) | | | | | (182) | |
| Issuance of common stock, net of expenses | | | | | 481 | | | | | | | | | 481 | | | | | 481 | |
| Purchase of treasury stock | | | | | | | | | (163) | | | | | (163) | | | | | (163) | |
| Reissuance of treasury stock | | | | | (12) | | | (25) | | | 27 | | | | | (10) | | | | | (10) | |
| Balance, December 31, 2020 | 1 | | | | | 2,406 | | | 8,148 | | | (1,562) | | | 5,359 | | | 14,352 | | | — | | | 14,352 | |
| Adoption of new accounting standards | | | | | | | | | | | | | — | | | | | — | |
| Net income | | | | | | | 617 | | | | | | | 617 | | | | | 617 | |
| Total other comprehensive income (loss) | | | | | | | | | | | (1,717) | | | (1,717) | | | | | (1,717) | |
| Dividends to stockholders, $2.86 per share | | | | | | | (194) | | | | | | | (194) | | | | | (194) | |
| Issuance of common stock, net of expenses | | | | | | | | | | | | | — | | | | | — | |
| Purchase of treasury stock | | | | | | | | | (99) | | | | | (99) | | | | | (99) | |
| Reissuance of treasury stock | | | | | 55 | | | (8) | | | 8 | | | | | 55 | | | | | 55 | |
| Balance, December 31, 2021 | 1 | | | | | 2,461 | | | 8,563 | | | (1,653) | | | 3,642 | | | 13,014 | | | — | | | 13,014 | |
| Adoption of new accounting standards | | | | | | | | | | | | | | | | | — | |
| Issuance of preferred interests by subsidiary | | | | | | | | | | | | | | | 90 | | | 90 | |
| Change in equity of noncontrolling interests | | | | | | | | | | | | | | | (4) | | | (4) | |
| Net income | | | | | | | 623 | | | | | | | 623 | | | 4 | | | 627 | |
| Total other comprehensive income (loss) | | | | | | | | | | | (9,247) | | | (9,247) | | | | | (9,247) | |
| Dividends to stockholders, $3.06 per share | | | | | | | (205) | | | | | | | (205) | | | | | (205) | |
| Issuance of common stock, net of expenses | | | | | | | | | | | | | — | | | | | — | |
| Purchase of treasury stock | | | | | | | | | (81) | | | | | (81) | | | | | (81) | |
| Reissuance of treasury stock | | | | | 41 | | | (14) | | | 14 | | | | | 41 | | | | | 41 | |
| Balance, December 31, 2022 | $ | 1 | | | | | $ | 2,502 | | | $ | 8,967 | | | $ | (1,720) | | | $ | (5,605) | | | $ | 4,145 | | | $ | 90 | | | $ | 4,235 | |
See accompanying notes to consolidated financial statements.
REINSURANCE GROUP OF AMERICA, INCORPORATED AND SUBSIDIARIES
CONSOLIDATED STATEMENTS OF CASH FLOWFLOWS
(in millions) | | | | | | | | | | | | | | | | | | | | |
| | | For the years ended December 31, |
| | | 2022 | | 2021 | | 2020 |
| Cash flows from operating activities | | | | | | |
| Net income | | $ | 627 | | | $ | 617 | | | $ | 415 | |
| Adjustments to reconcile net income to net cash provided by operating activities: | | | | | | |
| Change in operating assets and liabilities: | | | | | | |
| Accrued investment income | | (111) | | | (15) | | | (11) | |
| Premiums receivable and other reinsurance balances | | (233) | | | (100) | | | 162 | |
| Deferred policy acquisition costs | | (156) | | | (71) | | | (95) | |
| Reinsurance ceded receivable balances | | 91 | | | (107) | | | (115) | |
| Future policy benefits, other policy claims and benefits and other reinsurance balances | | 1,129 | | | 5,062 | | | 2,819 | |
| Deferred income taxes | | 75 | | | (89) | | | (16) | |
| Other assets and other liabilities, net | | (2) | | | (97) | | | 225 | |
| Amortization of net investment premiums, discounts and other | | (71) | | | (54) | | | (46) | |
| (Income) loss from limited partnerships and real estate joint ventures | | (331) | | | (419) | | | (50) | |
| Investment related (gains) losses, net | | 506 | | | (560) | | | 33 | |
| Depreciation and amortization expense | | 38 | | | 43 | | | 49 | |
| Gain on sale of businesses | | (2) | | | (11) | | | — | |
| Other, net | | (217) | | | (17) | | | (48) | |
| Net cash provided by operating activities | | 1,343 | | | 4,182 | | | 3,322 | |
| Cash flows from investing activities | | | | | | |
| Sales of fixed maturity securities available-for-sale | | 10,558 | | | 12,142 | | | 6,514 | |
| Purchases of fixed maturity securities available-for-sale | | (16,531) | | | (18,071) | | | (9,619) | |
| Maturities of fixed maturity securities available-for-sale | | 906 | | | 887 | | | 973 | |
| Sales of equity securities | | 7 | | | 30 | | | 181 | |
| Purchases of equity securities | | (15) | | | (22) | | | (22) | |
| Principal payments on mortgage loans | | 963 | | | 991 | | | 661 | |
| Cash invested in mortgage loans | | (1,314) | | | (1,155) | | | (780) | |
| Net change in policy loans | | 2 | | | 25 | | | 61 | |
| Cash invested in funds withheld at interest | | (36) | | | (67) | | | (131) | |
| Sales of limited partnerships and real estate joint ventures | | 710 | | | 498 | | | 142 | |
| Purchases of limited partnerships and real estate joint ventures | | (700) | | | (648) | | | (315) | |
| Change in short-term investments | | (80) | | | 371 | | | (155) | |
| Change in other invested assets | | (140) | | | 547 | | | (162) | |
| Proceeds from sale of businesses, net of cash transferred of $1 and $43 | | 7 | | | 19 | | | — | |
| Purchase of businesses, net of cash acquired of $53 | | — | | | (156) | | | — | |
| Purchases of property and equipment | | (25) | | | (19) | | | (28) | |
| Net cash used in investing activities | | (5,688) | | | (4,628) | | | (2,680) | |
| Cash flows from financing activities | | | | | | |
| Dividends to stockholders | | (205) | | | (194) | | | (182) | |
| Proceeds from issuance of common stock, net | | — | | | — | | | 481 | |
| Repayment of collateral finance and securitization notes | | (181) | | | (208) | | | (214) | |
| Proceeds from long-term debt issuance | | 700 | | | 500 | | | 598 | |
| Debt issuance costs | | (10) | | | (6) | | | (5) | |
| Principal payments of long-term debt | | (403) | | | (403) | | | (3) | |
| Purchases of treasury stock | | (81) | | | (99) | | | (163) | |
| Exercise of stock options, net | | — | | | — | | | 1 | |
| Change in cash collateral for derivative positions and other arrangements | | 230 | | | 31 | | | (32) | |
| Change in deposit asset on reinsurance | | (44) | | | 91 | | | — | |
| Deposits on investment-type policies and contracts | | 5,705 | | | 1,729 | | | 1,576 | |
| Withdrawals on investment-type policies and contracts | | (1,365) | | | (1,421) | | | (803) | |
| Net change in noncontrolling interest | | 90 | | | — | | | — | |
| Net cash provided by (used in) financing activities | | 4,436 | | | 20 | | | 1,254 | |
| Effect of exchange rate changes on cash | | (112) | | | (34) | | | 63 | |
| Change in cash and cash equivalents | | (21) | | | (460) | | | 1,959 | |
| Cash and cash equivalents, beginning of period | | 2,948 | | | 3,408 | | | 1,449 | |
| Cash and cash equivalents, end of period | | $ | 2,927 | | | $ | 2,948 | | | $ | 3,408 | |
REINSURANCE GROUP OF AMERICA, INCORPORATED AND SUBSIDIARIES
CONSOLIDATED STATEMENTS OF CASH FLOWS
(in millions)
|
| | | | | | | | | | | | |
| | | For the years ended December 31, |
| | | 2019 | | 2018 | | 2017 |
| Cash flows from operating activities | | | | | | |
| Net income | | $ | 870 |
| | $ | 716 |
| | $ | 1,822 |
|
| Adjustments to reconcile net income to net cash provided by operating activities: | | | | | | |
| Change in operating assets and liabilities: | | | | | | |
| Accrued investment income | | (4 | ) | | 7 |
| | (43 | ) |
| Premiums receivable and other reinsurance balances | | 110 |
| | (764 | ) | | (347 | ) |
| Deferred policy acquisition costs | | (198 | ) | | (107 | ) | | 154 |
|
| Reinsurance ceded receivable balances | | (178 | ) | | 66 |
| | (124 | ) |
Future policy benefits, other policy claims and benefits, and other reinsurance balances | | 1,537 |
| | 1,593 |
| | 1,321 |
|
| Deferred income taxes | | 211 |
| | 77 |
| | (847 | ) |
| Other assets and other liabilities, net | | 113 |
| | (163 | ) | | 242 |
|
| Amortization of net investment premiums, discounts and other | | (55 | ) | | (57 | ) | | (105 | ) |
| Depreciation and amortization expense | | 49 |
| | 45 |
| | 53 |
|
| Investment related (gains) losses, net | | (91 | ) | | 170 |
| | (168 | ) |
| Other, net | | (57 | ) | | (2 | ) | | 24 |
|
| Net cash provided by operating activities | | 2,307 |
| | 1,581 |
| | 1,982 |
|
| Cash flows from investing activities | | | | | | |
| Sales of fixed maturity securities available-for-sale | | 13,214 |
| | 9,340 |
| | 7,309 |
|
| Maturities of fixed maturity securities available-for-sale | | 907 |
| | 627 |
| | 589 |
|
| Sales of equity securities | | 98 |
| | 46 |
| | 207 |
|
| Principal payments on mortgage loans on real estate | | 490 |
| | 445 |
| | 340 |
|
| Principal payments on policy loans | | 82 |
| | 57 |
| | 115 |
|
| Purchases of fixed maturity securities available-for-sale | | (15,664 | ) | | (9,724 | ) | | (8,941 | ) |
| Purchases of equity securities | | (312 | ) | | (13 | ) | | (81 | ) |
| Cash invested in mortgage loans on real estate | | (1,216 | ) | | (1,019 | ) | | (964 | ) |
| Cash invested in policy loans | | (42 | ) | | (45 | ) | | (45 | ) |
| Cash invested in funds withheld at interest | | (60 | ) | | (54 | ) | | (23 | ) |
| Purchase of businesses, net of cash acquired of $27 and $5 | | 4 |
| | (32 | ) | | — |
|
| Purchases of property and equipment | | (34 | ) | | (29 | ) | | (44 | ) |
| Change in short-term investments | | 199 |
| | 129 |
| | 52 |
|
| Change in other invested assets | | (304 | ) | | (365 | ) | | (122 | ) |
| Net cash used in investing activities | | (2,638 | ) | | (637 | ) | | (1,608 | ) |
| Cash flows from financing activities | | | | | | |
| Dividends to stockholders | | (163 | ) | | (140 | ) | | (117 | ) |
| Repayment of collateral finance and securitization notes | | (91 | ) | | (96 | ) | | (68 | ) |
| Proceeds from long-term debt issuance | | 599 |
| | — |
| | — |
|
| Debt issuance costs | | (5 | ) | | — |
| | — |
|
| Principal payments of long-term debt | | (403 | ) | | (3 | ) | | (303 | ) |
| Purchases of treasury stock | | (101 | ) | | (300 | ) | | (44 | ) |
| Exercise of stock options, net | | 6 |
| | 3 |
| | 7 |
|
| Change in cash collateral for derivative positions and other arrangements | | (163 | ) | | 44 |
| | (65 | ) |
| Deposits on universal life and other investment type policies and contracts | | 1,309 |
| | 864 |
| | 1,018 |
|
| Withdrawals on universal life and other investment type policies and contracts | | (1,109 | ) | | (694 | ) | | (752 | ) |
| Net cash used in financing activities | | (121 | ) | | (322 | ) | | (324 | ) |
| Effect of exchange rate changes on cash | | 11 |
| | (36 | ) | | 53 |
|
| Change in cash and cash equivalents | | (441 | ) | | 586 |
| | 103 |
|
| Cash and cash equivalents, beginning of period | | 1,890 |
| | 1,304 |
| | 1,201 |
|
| Cash and cash equivalents, end of period | | $ | 1,449 |
| | $ | 1,890 |
| | $ | 1,304 |
|
| | | | | | | |
| Supplemental disclosures of cash flow information: | | | | | | |
| Interest paid | | $ | 180 |
| | $ | 170 |
| | $ | 173 |
|
| Income taxes paid, net of refunds | | $ | 44 |
| | $ | 142 |
| | $ | 37 |
|
| Non-cash investing activities: | | | | | | |
| Transfer of invested assets | | $ | 6,275 |
| | $ | 4,636 |
| | $ | 3,286 |
|
| Right-of-use assets acquired through operating leases | | $ | 1 |
| | $ | — |
| | $ | — |
|
| Purchase of a business: | | | | | | |
| Assets acquired, excluding cash acquired | | $ | 8 |
| | $ | 70 |
| | $ | — |
|
| Liabilities assumed | | (12 | ) | | (38 | ) | | — |
|
| Net cash (received) paid on purchase | | $ | (4 | ) | | $ | 32 |
| | $ | — |
|
| | | | | | | | | | | | | | | | | | | | |
| | | For the years ended December 31, |
| | | 2022 | | 2021 | | 2020 |
| Supplemental disclosures of cash flow information: | | | | | | |
| Interest paid | | $ | 163 | | | $ | 160 | | | $ | 166 | |
| Income taxes paid, net of refunds | | 129 | | | 368 | | | 108 | |
| Non-cash investing activities: | | | | | | |
| Transfer of invested assets | | 618 | | | 1,798 | | | 93 | |
| | | | | | |
| Right-of-use assets acquired through operating leases | | — | | | — | | | 23 | |
| Non-cash financing activities: | | | | | | |
| Non-cash deposits on reinsurance | | — | | | 1,581 | | | — | |
| Purchase of a business: | | | | | | |
| Assets acquired, excluding cash acquired | | — | | | 847 | | | — | |
| Liabilities assumed | | — | | | (691) | | | — | |
| Sale of businesses: | | | | | | |
| Assets disposed, net of cash transferred | | (6) | | | (512) | | | — | |
| Liabilities disposed | | 1 | | | 504 | | | — | |
See accompanying notes to consolidated financial statements.
Reinsurance Group of America, Incorporated
Notes to consolidated financial statements
For the years ended December 31, 2019, 20182022, 2021 and 20172020
Note 1 BUSINESS AND BASIS OF PRESENTATION
Business
Reinsurance Group of America, Incorporated (“RGA”) is an insurance holding company that was formed on December 31, 1992. The consolidated financial statements herein include the assets, liabilities, and results of operations of RGA and its subsidiaries all of which are wholly owned (collectively, the “Company”).
The Company is engaged engage in providing traditional reinsurance, which includes individual and group life and health, disability, and critical illness reinsurance. The Company also provides financial solutions, which includes longevity reinsurance, asset-intensive products, primarily annuities, financial reinsurance, capital solutions and stable value products.
Reinsurance is an arrangement under which an insurance company, the reinsurer, agrees to indemnify another insurance company, the ceding company, for all or a portion of the insurance risks underwritten by the ceding company. Reinsurance is designed to to:
(i)reduce the net amount at risk on individual risks, thereby enabling the ceding company to increase the volume of business it can underwrite, as well as increase the maximum risk it can underwrite on a single risk;
(ii)enhance the ceding company’s financial strength and surplus position;
(iii)stabilize operating results by leveling fluctuations in the ceding company’s loss experience; and
(iv)assist the ceding company in meeting applicable regulatory requirements.
Basis of Presentation
The consolidated financial statements of the Company have been prepared in accordance with U.S. generally accepted accounting principles (“GAAP”). The preparation of financial statements in conformity with GAAP requires management to make estimates and assumptions that affect the reported amounts of assets and liabilities and the disclosures of contingent assets and liabilities as of the date of the financial statements and the reported amounts of revenues and expenses during the reporting period. The most significant estimates include those used in determining deferred policy acquisition costs, premiums receivable, future policy benefits, incurred but not reported claims, income taxes, valuation of investments and investment impairments, and valuation of embedded derivatives. Actual results could differ materially from the estimates and assumptions used by management.
The accompanying consolidated financial statements include the accounts of RGA and its subsidiaries, all of which are wholly owned, and any variable interest entities where the Company is the primary beneficiary. The Company evaluates variable interest entities in accordance with the general accounting principles for Consolidation. Entities in which the Company has significant influence over the operating and financing decisions but are not required to be consolidated are reported under the equity method of accounting. The Company evaluates variable interest entities in accordance with the general accounting principles for Consolidation. Intercompany balances and transactions have been eliminated.
There were no subsequent events that would require disclosure or adjustments to the accompanying consolidated financial statements through the date the consolidated financial statements were issued.
Note 2 SIGNIFICANT ACCOUNTING POLICIES AND PRONOUNCEMENTS
Investments
Fixed Maturity Securities
Fixed maturity securities classified as available-for-sale are reported at fair value and are so classified based upon the possibility that such securities could be sold prior to maturity if that action enables the Company to execute its investment philosophy and appropriately match investment results to operating and liquidity needs.
Unrealized gains and losses on fixed maturity securities classified as available-for-sale, less applicable deferred income taxes as well as related adjustments to deferred acquisition costs, if applicable, are reflected as a direct charge or credit to accumulatedrecorded in other comprehensive income (“AOCI”OCI”) in stockholders’ equity on the consolidated balance sheets..
Investment income is recognized as it accrues or is legally due. Realized gains and losses on sales of investments are included in investment related gains (losses), net, as are change in allowance for credit impairments that are other-than-temporary in nature.losses and impairments. The cost of investments sold is primarily determined based upon the specific identification method.
Equity Securities
Equity securities are carried at fair value and realized and unrealized gains and losses are included in investment related gains (losses), net.
Mortgage Loans on Real Estate
Mortgage loans on real estate are carried at unpaid principal balances, net of any unamortized premium or discount, unamortized balance of loan origination fees and valuation allowances.expenses, and allowance for credit losses. Interest income is accrued on the principal amount of the mortgage loan based on its contractual interest rate. Amortization of premiums, discounts, and discounts isloan origination fees are recorded using the effective yield method. The Company accrues interest on loans until it is probable the Company will not receive interest or the loan is 90 days past due. Interest income, amortization of premiums, accretion of discounts, amortization of loan origination fees and prepayment fees are reported in net investment income, net of related expenses in the consolidated statements of income.
A mortgage loan is considered to be impaired when, based on the current information and events, it is probable that the Company will be unable to collect all amounts due according to the contractual terms of the mortgage agreement. Although all available and applicable factors are considered in the Company’s analysis, loan-to-value and debt service coverage ratios are the most critical factors in determining impairment.
Valuation allowances on mortgage loans are established based upon inherent losses expected by management to be realized in connection with future dispositions or settlement of mortgage loans, including foreclosures. The Company establishes valuation allowances for estimated impairments on an individual loan basis as of the balance sheet date. Such valuation allowances are based on the excess carrying value of the loan over the present value of expected future cash flows discounted at the loan’s original effective interest rate, the value of the loan’s collateral if the loan is in the process of foreclosure or is otherwise collateral-dependent, or the loan’s market value if the loan is being sold. Non-specific valuation allowances are established for mortgage loans based upon several loan factors, including the Company’s historical experience for loan losses, defaults and loss severity, loss expectations for loans with similar risk characteristics and industry statistics. These evaluations are revised as conditions change and new information becomes available. In addition to historical experience, management considers qualitative factors that include the impact of changing macro-economic conditions, which may not be currently reflected in the loan portfolio performance, and the quality of the loan portfolio.
Any interest accrued or received on the net carrying amount of the impaired loan will be included in investment income or applied to the principal of the loan, depending on the assessment of the collectability of the loan. Mortgage loans deemed to be uncollectible or that have been foreclosed are charged off against the valuation allowances and subsequent recoveries, if any, are credited to the valuation allowances. Changes in valuation allowances are reported in investment related gains (losses), net on the consolidated statements of income.
The Company evaluates whether a mortgage loan modification represents a troubled debt restructuring. In a troubled debt restructuring, the Company grants concessions related to the borrower’s financial difficulties. Generally, the types of concessions include: reduction of the contractual interest rate, extension of the maturity date at an interest rate lower than current market interest rates and/or a reduction of accrued interest. The Company considers the amount, timing and extent of the concession granted in determining any impairment or changes in the specific valuation allowance recorded in connection with the troubled debt restructuring. Through the continuous monitoring process, the Company may have recorded a specific valuation allowance prior to when the mortgage loan is modified in a troubled debt restructuring. Accordingly, the carrying value (after specific valuation allowance) before and after modification through a troubled debt restructuring may not change significantly, or may increase if the expected recovery is higher than the pre-modification recovery assessment.
Policy Loans
Policy loans are reported at the unpaid principal balance. Interest income on such loans is recorded as earned using the contractually agreed-upon interest rate. These policy loans present no credit risk because the amount of the loan cannot exceed the obligation due the ceding company upon the death of the insured or surrender of the underlying policy.
Funds Withheld at Interest
Funds withheld at interest represent amounts contractually withheld by ceding companies in accordance with reinsurance agreements. For agreements written on a modified coinsurance (“modco”) basis and agreements written on a coinsurance funds withheld basis, assets that support the net statutory reserves or as defined in the treaty, are withheld and legally owned by the ceding company. Interest, recorded in investment income, net of related expenses in the consolidated statements ofinvestment income, accrues to these assets at calculated rates as defined by the treaty terms. Changes in the value of the equity options held within the funds withheld portfolio associated with equity-indexed annuity treaties are reflected in net investment income.
Limited Partnerships and Real Estate Joint Ventures
Limited partnerships and real estate joint ventures, in which the Company has more than a minor influence over the investee’s operations, are reported using the equity method of accounting. The Company generally recognizes its share of the investee’s earnings in net investment income on a three-month lag in instances where the investee’s financial information is not sufficiently timely or when the investee’s reporting period differs from the Company’s reporting period.
Limited partnerships, in which the Company has a minor ownership interest in or virtually no influence over the investee’s operations, are primarily carried at estimated fair value. If a readily determinable fair value is not available, the Company uses the net ofasset value ("NAV") per share. Changes in estimated fair value are included in investment related expenses.gains (losses), net. Certain other limited partnerships are carried at cost less impairment.
Short-term Investments
Short-term investments represent investments with remaining maturities of one year or less, but greater than three months, at the time of acquisition and are stated at estimated fair value or amortized cost, which approximates estimated fair value. Interest on short-term investments is recorded in net investment income, net of related expenses in the consolidated statements of income.
Other Invested Assets
In addition to derivative contracts discussed below, other invested assets include Federal Home Loan Bank of Des Moines (“FHLB”) common stock, limited partnership interests, joint ventures (other than operating joint ventures),unit-linked investments and lifetime mortgages and contractholder-directed investments.mortgages. FHLB common stock are carried at cost as required by GAAP. Limited partnership interests are primarilyis carried at cost. Based on the nature and structure of these investments, they do not meet the characteristics of an equity security in accordance with applicable accounting standards. Joint ventures and certain limited partnerships are reported using the equity method of accounting.
Lifetime mortgages are carried at unpaid principal balances, net of any unamortized premium or discount, fees and valuation allowance. Interest income is accrued on the principal amount of the lifetime mortgage based on its contractual interest rate.
The fair value option (“FVO”) was elected for contractholder-directed investments supporting unit-linked variable annuity type liabilities that do not qualify for presentation and reporting as separate accounts. Changes in estimated fair value of these securitiesunit-linked investments are included in net investment income,income.
Lifetime mortgages are carried at unpaid principal balances, net of related expenses.any unamortized premium or discount, unamortized balance of loan origination fees and expenses, and allowance for credit losses. Interest income is accrued on the principal amount of the lifetime mortgage based on its contractual interest rate.
Securities Borrowing, Lending and Repurchase/Reverse Repurchase Agreements
The Company participates in securities borrowing programs whereby securities, which are not reflected on the Company’s consolidated balance sheets, are borrowed from third parties. The borrowed securities are used to provide collateral under affiliated reinsurance transactions. The Company is generally required to maintain a minimum of 100% to 105%110% of the fair value, or par value under certain programs, of the borrowed securities as collateral. The collateral generally consists of securities pledged to the third parties or rights to reinsurance treaty cash flows. If cash flows from the reinsurance treaties are
insufficient to maintain the minimum collateral requirement, the Company may substitute cash or securities to meet the requirement.
The Company participates in a securities lending program whereby securities, reflected as investments on the Company’s consolidated balance sheets, are loaned to a third party. TheIn return, the Company receives securities as collateral,from the third party, with an estimated fair value generally in an amount equal to a minimum of 100% to 105% of the fair value of the securities lent. The securities received as collateral are not reflected on the Company’s consolidated balance sheets.
The Company participates in repurchase/reverse repurchase programs in whichwhereby securities, reflected as investments on the Company’s consolidated balance sheets, are pledgedsold to third parties. In return, the Company receivespurchases securities from the third parties with an estimated fairparties. Under the agreements the Company’s value of the securities sold is generally equal to a minimum of 100% to 105% of the estimated fair value of the securities pledged.purchased. The securities receivedpurchased under reverse repurchase agreements are not reflected on the Company’s consolidated balance sheets. Securities sold under such transactions may be sold or re-pledged by the transferee.
Other-than-Temporary ImpairmentThe Company participates in repurchase agreements, whereby securities, reflected as investments on the Company’s consolidated balance sheets are sold to a third party. Under these agreements, the Company receives cash in an amount generally equal to 72% to 100% of the estimated fair value of the securities sold at the inception of the transaction, with a simultaneous agreement to repurchase such securities at a future date or on demand in an amount equal to the cash initially received plus interest. The Company monitors the ratio of the cash held to the estimated fair value of the securities sold throughout the duration of the transaction and additional cash or securities are provided or obtained as necessary. Securities sold under such transactions may be sold or re-pledged by the transferee. The obligation to repurchase bonds is reflected in other liabilities.
Allowance for Credit Losses and Impairments
Fixed Maturity Securities
The Company identifies fixed maturity securities that could potentially haveresult in a credit impairments that are other-than-temporaryloss by monitoring market events that could impact issuers’ credit ratings, business climates, management changes, litigation, government actions and other similar factors. The Company also monitors late payments, pricing levels, rating agency actions, key financial ratios, financial statements, revenue forecasts and cash flow projections as indicators of credit issues.
The Company reviews all securities on a case-by-case basis to determine whether an other-than-temporarya decline in fair value existsbelow amortized cost has resulted from a credit loss and whether lossesan allowance for credit loss should be recognized. TheIn making this determination, the Company considers relevant facts and circumstances in evaluating whether a credit or interest rate-related impairment of a security is other-than-temporary. Relevant facts and circumstances considered include:including: (1) the extent and length of time the fair value has been below cost or amortized cost; (2) the reasons for the decline in fair value; (3)(2) the issuer’s financial position and access to capital; and (4)(3) the Company’s intent to sell a security or whether it is more likely than not it will be required to sell the security before the recovery of its amortized cost that, in some cases, may extend to maturity. To the extent the Company determines that a security is deemed to be other-than-temporarily impaired, an impairment loss is recognized.
Impairment losses on fixed maturity securities recognized in the financial statements are dependent on the facts and circumstances related to the specific security. If the Company intends to sell a security or it is more likely than not that it would be required to sell a security before the recovery of its amortized cost, less any recorded credit loss, it recognizes an other-than-temporary impairment (“OTTI”)loss in investment related gains (losses), net on the consolidated statements of income for the difference between amortized cost and fair value. If neither of these two conditions exists then
Credit impairments and changes in the recognition of the OTTI is bifurcated and the Company recognizes theallowance for credit loss portionlosses on fixed maturity securities are reflected in investment related gains (losses), net, and thewhile non-credit loss portionimpairment losses are recognized in AOCI.accumulated other comprehensive income (“AOCI”).
The Company estimates the amount of the credit loss component of a fixed maturity security impairment as the difference between amortized cost and the present value of the expected cash flows of the security. The Company excludes accrued interest from the amortized cost and the present value of the expected cash flows of the security. The present value is determined using the best estimate cash flows discounted at the effective interest rate implicit to the security at the date of purchase or the current yield to accrete an asset-backed or floating rate security. The techniques and assumptions for establishing the best estimate cash flows vary depending on the type of security. The asset-backed securities’ cash flow estimates are based on security-specific facts and circumstances that may include collateral characteristics, expectations of delinquency and default rates, loss severity and prepayment speeds and structural support, including subordination and guarantees.
The corporateCompany writes off uncollectible fixed maturity securities when (1) it has sufficient information to determine that the issuer of the security cashis insolvent or (2) it has received notice that the issuer of the security has filed for bankruptcy, and the collectability of the asset is expected to be adversely impacted by the bankruptcy.
Allowance for credit losses on mortgage loans are computed on an expected loss basis using a model that utilizes probability of default and loss given default methods over the lifetime of the loan. Within the reasonable and supportable forecast period (i.e., typically two years), the allowance for credit losses for mortgage loans is established based on several pool-level loan
flow estimatesassumptions, defaults and loss severity, loss expectations for loans with similar risk characteristics and industry statistics. These evaluations are derived from scenario-based outcomesrevised as conditions change and new information becomes available. The evaluation also includes the impact of expected corporate restructuringschanges in future macro-economic conditions. The Company reverts to historical loss information for periods beyond which it believes it is able to develop or obtain reasonable and supportable forecasts of future economic conditions. When individual loans no longer have similar credit risk characteristics of the dispositioncommercial mortgage loan pool, they are removed from the pool and are evaluated individually for an allowance.
Any interest accrued or received on the net carrying amount of assets using security specific facts and circumstances including timing, security interests and loss severity.
In periods after an OTTI is recognized on a fixed maturity security, the Company will report the impaired security as if it had been purchased on the date it was impaired and will continue to estimate the present value of the estimated cash flows of the security. Accordingly, the discount (or reduced premium) based on the new cost basisloan is accreted intoincluded in net investment income overor applied to the remaining termprincipal of the fixedloan, depending on the assessment of the collectability of the loan. Mortgage loans deemed to be uncollectible or that have been foreclosed are charged off against the allowance for credit losses and subsequent recoveries, if any, are credited to the allowance for credit losses. Changes in allowance for credit losses are reported in investment related gains (losses), net.
The Company evaluates whether a mortgage loan modification represents a troubled debt restructuring and does not meet the criteria established in the Coronavirus Aid, Relief, and Economic Security Act (the “CARES Act”). In a troubled debt restructuring, the Company grants concessions related to the borrower’s financial difficulties. Generally, the types of concessions include reduction of the contractual interest rate, extension of the maturity securitydate at an interest rate lower than current market interest rates and/or a reduction of accrued interest. The Company considers the amount, timing and extent of the concession granted in determining any changes in allowance for credit losses recorded in connection with the troubled debt restructuring. Through the continuous monitoring process, the Company may have recorded a specific allowance for credit loss prior to when the mortgage loan is modified in a prospective manner based ontroubled debt restructuring. Accordingly, the amountcarrying value (after specific allowance for credit loss) before and timing of estimated future cash flows.after modification through a troubled debt restructuring may not change significantly or may increase if the expected recovery is higher than the pre-modification recovery assessment.
Limited Partnerships and Real Estate Joint Ventures
The Company considers its limited partnership investments that are carried at cost method investments for OTTIimpairment when the carrying value of these investments exceeds the net assetfair value. The Company takes into consideration the severity and duration of this excess when deciding if the cost method investment is other-than-temporarily impaired. For equity method investments (including real estate joint ventures), the Company considers financial and other information provided by the investee, other known information and inherent risks in the underlying investments, as well as future capital commitments, in determining whether an impairment has occurred.
Derivative Instruments
Overview
The Company utilizes a variety of derivative instruments including swaps, options, forwards and futures, primarily to manage or hedge interest rate risk, credit risk, inflation risk, foreign currency risk, market volatility and various other market risks associated with its business. The Company does not invest in derivatives for speculative purposes. It is the Company’s policy to enter into derivative contracts primarily with highly rated parties. See Note 5 -– “Derivative Instruments” for additional detail on the Company’s derivative positions.
Accounting and Financial Statement Presentation of Derivatives
Derivatives are carried on the Company’s consolidated balance sheets primarily in other invested assets or other liabilities, at fair value. Certain derivatives are subject to master netting provisions and reported as a net asset or liability. On the date a derivative contract is executed, the Company designates the derivative as (1) a fair value hedge, (2) a cash flow hedge, (3) a net investment hedge in a foreign operation or (4) free-standing derivatives held for other risk management purposes, which primarily involve managing asset or liability risks associated with the Company’s reinsurance treaties that do not qualify for hedge accounting.
Changes in the fair value of free-standing derivative instruments, which do not receive accounting hedge treatment, are primarily reflected in investment related gains (losses), net.
Changes in the fair value of non-investment free-standing derivative instruments (e.g. mortality and longevity swaps), which do not receive accounting hedge treatment, are reflected in other revenues.
Hedge Documentation and Hedge Effectiveness
To qualify for hedge accounting, at the inception of the hedging relationship, the Company formally documents its risk management objective and strategy for undertaking the hedging transaction, as well as its designation of the hedge as either (i) a fair value hedge; (ii) a cash flow hedge; or (iii) a hedge of a net investment in a foreign operation. In this documentation, the Company sets forth how the hedging instrument is expected to hedge the designated risks related to the hedged item and sets forth the method that will be used to retrospectively and prospectively assess the hedging instrument’s effectiveness and the method that will be used to measure ineffectiveness.effectiveness. A derivative designated as a hedging instrument must be assessed as being highly effective in offsetting the designated risk of the hedged item. Hedge effectiveness is formally assessed at inception and periodically throughout the life of the designated hedging relationship.
Under a fair value hedge, changes in the fair value of the hedging derivative including amounts measured as ineffective, and changes in the fair value of the hedged item related to the designated risk being hedged, are reported within investment related gains (losses), net. The fair values of the hedging derivatives are exclusive of any accruals that are separately reported in the consolidated statements of income within interestinvestment income or interest expense to match the location of the hedged item.
Under a cash flow hedge, changes in the fair value of the hedging derivative measured as effective are reported within AOCI and the deferred gains or losses on the derivative are reclassified into the consolidated statements of income when the Company’s earnings are affected by the variability in cash flows of the hedged item. The fair values of the hedging derivatives are exclusive of any accruals that are separately reported in the consolidated statements of income within interestinvestment income or interest expense to match the location of the hedged item.
In a hedge of a net investment in a foreign operation, changes in the fair value of the hedging derivative that are measured as effective are reported within AOCI consistent with the translation adjustment for the hedged net investment in the foreign operation. Changes in the fair value of the hedging instrument measured as ineffective are reported within investment related gains (losses), net.
The Company discontinues hedge accounting prospectively when: (i) it is determined that the derivative is no longer highly effective in offsetting changes in the estimated fair value or cash flows of a hedged item; (ii) the derivative expires, is sold, terminated, or exercised; (iii) it is no longer probable that the hedged forecasted transaction will occur; or (iv) the derivative is de-designated as a hedging instrument.
When hedge accounting is discontinued because it is determined that the derivative is not highly effective, the derivative continues to be carried in the consolidated balance sheets at fair value, with changes in fair value recognized in investment related gains (losses), net. The carrying value of the hedged asset or liability under a fair value hedge is no longer adjusted for changes in its estimated fair value due to the hedged risk, and the cumulative adjustment to its carrying value is amortized into income over the remaining life of the hedged item. Provided the hedged forecasted transaction occurrence is still probable, the changes in estimated fair value of derivatives recorded in other comprehensive income (loss) (“OCI”)OCI related to discontinued cash flow hedges are released into the consolidated statements of income when the Company’s earnings are affected by the variability in cash flows of the hedged item.
When hedge accounting is discontinued because it is no longer probable that the forecasted transactions will occur on the anticipated date or within two months of that date, the derivative continues to be carried in the consolidated balance sheets at its estimated fair value, with changes in estimated fair value recognized currently in investment related gains (losses), net. Deferred gains and losses of a derivative recorded in OCI pursuant to the discontinued cash flow hedge of a forecasted transaction that is no longer probable are recognized immediately in investment related gains (losses), net.
In all other situations in which hedge accounting is discontinued, the derivative is carried at its estimated fair value in the consolidated balance sheets, with changes in its estimated fair value recognized in the current period as investment related gains (losses), net.
Embedded Derivatives
The Company reinsures certain annuity products that contain terms that are deemed to be embedded derivatives, primarily equity-indexed annuities and variable annuities with guaranteed minimum benefits. The Company assesses reinsurance contract terms to identify embedded derivatives, which are required to be bifurcated under the general accounting principles for Derivatives and Hedging. If the contract is not reported for in its entirety at fair value and it is determined that the terms of the embedded derivative are not clearly and closely related to the economic characteristics of the host contract, and that a separate instrument with the same terms would qualify as a derivative instrument, the embedded derivative is bifurcated from the host contract and accounted for separately.
Such embeddedEmbedded derivatives are carried on the consolidated balance sheets at fair value in the same line item as the host contract. Changes in the fair value of embedded derivatives associated with equity-indexed annuities are reflected in interest credited on the consolidated statements of income and changes in the fair value of embedded derivatives associated with variable annuity guaranteed minimum benefits are reflected in investment related gains (losses), net on the consolidated statements of income.net. See “Interest-Sensitive Contract Liabilities” below for additional information on embedded derivatives related to equity-indexed and variable annuities. The Company has implemented an economic hedging strategy to mitigate the volatility associated with its reinsurance of variable annuity guaranteed minimum benefits. The hedging strategy is designed such that changes in the fair value of the hedge contracts, primarily futures, swap contracts and options, move in the opposite direction of changes in the fair value of the embedded derivatives. While the Company actively manages its hedging program, the hedges that are in place may not be totally effective in offsetting the embedded derivative changes due to the many variables that must be managed and the Company may see a corresponding increase or decrease in the net liability. The Company has elected not to assess this hedging strategy for hedge accounting treatment.
Additionally, reinsurance treaties written on a modco or funds withheld basis are subject to the general accounting principles for Derivatives and Hedging related to embedded derivatives. The Company’s funds withheld at interest balances are primarily
associated with its reinsurance treaties structured on a modco or funds withheld basis, the majority of which were subject to the general accounting principles for Derivatives and Hedging related to embedded derivatives. Management believes the embedded derivative feature in each of these reinsurance treaties is similar to a total return swap on the assets held by the ceding companies. The valuation of embedded derivatives is sensitive to the investment credit spread environment. Changes in investment credit spreads are also affected by the application of a credit valuation adjustment (“CVA”). The fair value calculation of an embedded derivative in an asset position utilizes a CVA based on the ceding company’s credit risk. Conversely, the fair value calculation of an embedded derivative in a liability position utilizes a CVA based on the Company’s credit risk. Generally, an increase in investment credit spreads, ignoring changes in the CVA, will have a negative impact on the fair value of the embedded derivative (decrease in income). The fair value of the embedded derivatives isderivative assets and liabilities are included in the funds withheld at interest line item on the consolidated balance sheets.and other liabilities, respectively. The change in the fair value of the embedded derivatives is recorded in investment related gains (losses), net on the consolidated statements of income.net.
The Company has entered into various financial reinsurance treaties on a funds withheld and modco basis. These treaties do not transfer significant insurance risk and are recorded on a deposit method of accounting with the Company earning a net fee. As a result of the experience refund provisions contained in these treaties, the value of the embedded derivatives in these contracts is
currently considered immaterial. The Company monitors the performance of these treaties on a quarterly basis. Significant adverse performance or losses on these treaties may result in a loss associated with the embedded derivative.
Fair Value Measurements
General accounting principles for Fair Value Measurements and Disclosures define fair value, establish a framework for measuring fair value, establish a fair value hierarchy based on the inputs used to measure fair value and enhance disclosure requirements for fair value measurements. In compliance with these principles, the Company has categorized its assets and liabilities, based on the priority of the inputs to the valuation technique, into a three level hierarchy or separately for assets measured using the net asset value (“NAV”). The fair value hierarchy gives the highest priority to quoted prices in active markets for identical assets or liabilities (Level 1), the second highest priority to quoted prices in markets that are not active or inputs that are observable either directly or indirectly (Level 2) and the lowest priority to unobservable inputs (Level 3).
If the inputs used to measure fair value fall within different levels of the hierarchy, the category level is based on the lowest priority level input that is significant to the fair value measurement of the asset or liability.
See Note 6 -– “Fair Value of Assets and Liabilities” for further details on the Company’s assets and liabilities recorded at fair value.
Cash and Cash Equivalents
Cash and cash equivalents include cash on deposit and highly liquid debt instruments purchased with an original maturity of three months or less.
Premiums Receivable
Premiums are accrued when due and in accordance with information received from the ceding company. When the Company enters into a new reinsurance agreement, it records accruals based on the terms of the reinsurance treaty. Similarly, when a ceding company fails to report information on a timely basis, the Company records accruals based on the terms of the reinsurance treaty as well as historical experience. Other management estimates include adjustments for increased in force on existing treaties, lapsed premiums given historical experience, the financial health of specific ceding companies, collateral value and the legal right of offset on related amounts (i.e. allowances and claims) owed to the ceding company. Under the legal right of offset provisions in its reinsurance treaties, the Company can withhold payments for allowances and claims from unpaid premiums. Based on its review of these factors and historical experience, the Company did not believe a provision for doubtful accounts was necessary as of December 31, 20192022 or 2018.2021.
Reinsurance Ceded Receivables and Other
The Company generally reports retrocession activity on a gross basis. Amounts paid or deemed to have been paid for reinsurance are reflected in reinsurance ceded receivables. The cost of reinsurance related to long-duration contracts is recognized over the terms of the reinsured policies on a basis consistent with the reporting of those policies.
Deferred Policy Acquisition Costs
Costs of acquiring new business, which vary with and are directly related to the production of new business, have been deferred to the extent that such costs are deemed recoverable from future premiums or gross profits. Such costs include commissions and allowances as well as certain costs of policy issuance and underwriting. Non-commission costs related to the acquisition of new and renewal insurance contracts may be deferred only if they meet the following criteria:
•Incremental direct costs of a successful contract acquisition
•Portions of employees’ salaries and benefits directly related to time spent performing specified acquisition activities for a contract that has been acquired or renewed
•Other costs directly related to the specified acquisition or renewal activities that would not have been incurred had that acquisition contract transaction not occurred
The Company tests the recoverability for each year of business at issue before establishing additional deferred acquisition costs (“DAC”). The Company also performs annual tests to establish that DAC are expected to remain recoverable, and if financial performance significantly deteriorates to the point where a deficiency exists, a cumulative charge to current operations will be recorded. No such adjustments related to DAC recoverability were made in 2019, 20182022, 2021 and 2017.2020.
DAC related to traditional life insurance contracts are amortized with interest over the premium-paying period of the related policies in proportion to the ratio of individual period premium revenues to total anticipated premium revenues over the expected life of the policy. Such anticipated premium revenues are estimated using the same assumptions used for computing liabilities for future policy benefits.
DAC related to interest-sensitive life and investment-type policies are amortized over the expected lives of the policies, in proportion to the gross profits realized from mortality, investment income less interest credited, and expense margins.
Other Reinsurance Balances
The Company assumes and retrocedes financial reinsurance contracts that do not expose it to a reasonable possibility of loss from insurance risk. These contracts are reported as deposits and are included in other reinsurance assets/liabilities. The amount of revenue reported in other revenues on these contracts represents fees and the cost of insurance under the terms of the reinsurance agreement. Assets and liabilities are reported on a net or gross basis, depending on the specific details within each treaty. Reinsurance agreements reported on a net basis, where a legal right of offset exists, are generally included in other reinsurance balances on the consolidated balance sheets. Balances resulting from the assumption and/or subsequent transfer of benefits and obligations resulting from cash flows related to variable annuities have also been classified as other reinsurance balance assets and/or liabilities. Other reinsurance assets are included in premiums receivable and other reinsurance balances while other reinsurance liabilities are included in other reinsurance balances.
Acquired Intangibles
Goodwill and Value of Business Acquired
Goodwill, reported in other assets, is not amortized into results of operations, but instead is reviewed at least annually for impairment and written down only in the periods in which the recorded value of goodwill exceeds its fair value. Goodwill as of December 31, 20192022 and 20182021, totaled $7 million. TheAs of December 31, 2022, the carrying value of business acquired (“VOBA”) is amortized in proportion to the ratio of annual premium revenues to total anticipated premium revenues or in relation to the present value of estimated profits. Anticipated premium revenues have been estimated using assumptions consistent with those used in estimating reserves for future policy benefits. The carrying value is reviewed at least annually for indicators of impairment in value. Carrying value of VOBA, net of accumulated amortization, was approximately $5 million as of both December 31, 2019 and 2018, and is reported in other assets. Amortization expense for the years ended December 31, 2019, 2018 and 2017 was $0.7 million, $0.4 million, and $0.3 million, respectively. Future amortization of VOBA is not material.fully amortized.
Value of Distribution Agreements and Customer Relationships Acquired
Value of distribution agreements (“VODA”) is reported in other assets and represents the present value of future profits associated with the expected future business derived from the distribution agreements. Value of customer relationships acquired (“VOCRA”) is also reported in other assets and represents the present value of the expected future profits associated with the expected future business acquired through existing customers of the acquired company or business. VODA is amortized over a useful life of 15 years and the VOCRA is also amortized over a 15 year period in proportion to expected revenues generated, with amortization included in policy acquisition costs and other insurance expenses. Each year the Company reviews VODA and VOCRA to determine the recoverability of these balances. VODA and VOCRA totaled approximately $33$12 million and $41$19 million, including accumulated amortization of $88$109 million and $80$102 million, as of December 31, 20192022 and 2018,2021, respectively. VODA and VOCRA amortization expense for the years ended December 31, 2019, 20182022, 2021 and 20172020 was $8$6 million, $8$7 million and $9$8 million, respectively. Amortization of the VODA and VOCRA is estimated to be $8 million, $7 million, $6 million, $6 million and $6 million during 2020, 2021, 2022, 2023 and 2024, respectively.respectively, with the VODA and VOCRA expected to be fully amortized by the end of 2024.
Other acquired intangible assetsAcquired Intangible Assets
Other acquired intangibles are reported in other assets and primarily represent intangibles and licenses acquired through the Company’s acquisition of service and technology oriented companies in an effort to both support its clients and generate new future revenue streams. Other acquired intangible assets are amortized using the straight-line method over the estimated useful life of 10 to 15 years, with amortization included in other operating expenses. Each year the Company reviews other acquired intangibles to determine the recoverability of these balances. Other acquired intangibles totaled approximately $34$14 million and $37$22 million, including accumulated amortization of $8$20 million and $4$17 million, as of December 31, 20192022 and 2018,2021, respectively. Other acquired intangibles amortization expense for the years ended December 31, 2019, 20182022, 2021 and 20172020, was $4$3 million, $4 million and $1$4 million, respectively. During 2021, the Company wrote off $4 million of acquired intangible assets
deemed to be impaired. Amortization of other acquired intangibles is estimated to be $4$3 million during 2020, 2021, 2022, 2023, 2024, 2025, 2026 and 2024,2027, respectively.
Property, Equipment, Leasehold Improvements and Computer Software
Property, equipment and leasehold improvements, which are included in other assets, are stated at cost, less accumulated depreciation. Depreciation is determined using the straight-line method over the estimated useful lives of the assets, as appropriate. The estimated life is generally 40 years for company occupied real estate property, from one to seven years for leasehold improvements, and from three to seven years for all other property and equipment. The cost basis of property, equipment and leasehold improvements was $244 million and $249$270 million at both December 31, 20192022 and 2018,2021, respectively. Accumulated depreciation of property, equipment and leasehold improvements was $99$136 million and $97$131 million at December 31, 20192022 and 2018,2021, respectively. Related depreciation expense was $18$15 million, $18$16 million and $17 million for the years ended December 31, 2019, 20182022, 2021 and 2017,2020, respectively.
Computer software, which is included in other assets, is stated at cost, less accumulated amortization. Purchased software costs, as well as certain internal and external costs incurred to develop internal-use computer software during the application development stage, are capitalized. Amortization of software costs is recorded on a straight-line basis over periods ranging from three to ten years. Carrying values are reviewed at least annually for indicators of impairment in value. Unamortized computer software costs were $151$138 million and $150$145 million at December 31, 20192022 and 2018,2021, respectively. Amortization expense was $31$24 million, $27 million, and $36$32 million for the years ended December 31, 2019, 20182022, 2021 and 2017,2020, respectively. The Company did not impair any capital projects during 2022 or 2021. The Company recognized capital project write-offsimpairments of $4 million, $5 million and $25 million in 2019, 2018 and 2017, respectively.2020.
Operating Joint Ventures
The Company has made investments in certain joint ventures that are strategic in nature and made other than for the sole purpose of generating investment income. These investments are reported under the equity method of accounting and are included in other assets on the consolidated balance sheets.assets. The Company’s share of earnings from these joint ventures is reported in other revenues on the consolidated statements of income. The Company’s investments in operating joint ventures do not have a material effect on the Company’s results of operations and financial condition, and as a result no additional disclosures have been presented.
Future Policy Benefits
Liabilities for future benefits on life and health policies are established in an amount adequate to meet the estimated future obligations on policies in force. Liabilities for future policy benefits under long-duration life and health insurance policies have been computed based upon expected investment yields, mortality and withdrawal (lapse) rates, and other assumptions. These assumptions include a margin for adverse deviation and vary with the characteristics of the plan of insurance, year of issue, age of insured, and other appropriate factors. Interest rates range from 3.0% to 6.0%. The mortality and withdrawal assumptions are based on the Company’s experience as well as industry experience and standards. In establishing reserves for future policy benefits, the Company assigns policy liability assumptions to particular timeframes (eras) in such a manner as to be consistent with the underlying assumptions and economic conditions at the time the risks are assumed. The Company maintains a consistent approach to setting the provision for adverse deviation between eras.
Liabilities for future benefits on longevity business, including annuities in the payout phase, are established in an amount adequate to meet the estimated future obligations on policies in force. Liabilities for future benefits related to the longevity business, including annuities in the payout phase have been calculated using expected mortality, investment yields, and other assumptions. These assumptions include a margin for adverse deviation and vary with the characteristics of the plan of insurance, year of issue, age of insured, and other appropriate factors. The mortality assumptions are based on the Company’s experience as well as industry experience and standards. A deferred profit liability is established when the gross premium exceeds the net premium.
The Company periodically reviews actual and anticipated experience compared to the assumptions used to establish policy benefits. The Company establishes premium deficiency reserves if actual and anticipated experience indicates that existing policy liabilities together with the present value of future gross premiums will not be sufficient to cover the present value of future benefits, settlement and maintenance costs and to recover unamortized acquisition costs. Anticipated investment income is considered in the calculation of premium deficiency losses for short-duration contracts. The premium deficiency reserve is established by a charge to income, as well as a reduction in unamortized acquisition costs and, to the extent there are no unamortized acquisition costs, an increase in future policy benefits.
The reserving process includes normal periodic reviews of assumptions used and adjustments of reserves to incorporate the refinement of the assumptions. Any such adjustments relate only to policies assumed in recent periods and the adjustments are reflected by a cumulative charge or credit to current operations.
The Company reinsures disability and long-term care products in various markets. Liabilities for future benefits on disability and long-term care policies’ active lives are established in an amount adequate to meet the estimated future obligations on
policies in force. These reserves are the amounts that, with the additional premiums to be received and interest thereon compounded annually at certain assumed rates, are calculated to be sufficient to meet the various policy and contract obligations as they mature.
The Company establishes future policy benefits for guaranteed minimum death benefits (“GMDB”) relating to the reinsurance of certain variable annuity contracts by estimating the expected value of death benefits in excess of the projected account balance and recognizing the excess proportionally over the accumulation period based on total expected assessments. The Company regularly evaluates estimates used and adjusts the additional liability balance, with a related charge or credit to claims and other policy benefits, if actual experience or other evidence suggests that earlier assumptions should be revised. The assumptions used in estimating the GMDB liabilities are consistent with those used for amortizing DAC, and are thus subject to the same variability and risk. The Company’s GMDB liabilities at December 31, 20192022 and 20182021, were not material.
Interest-Sensitive Contract Liabilities
Liabilities for future benefits on interest-sensitive life and investment-type contract liabilities are carried at the accumulated contract holder values without reduction for potential surrender or withdrawal charges. The Company reinsures asset-intensive products, including annuities and corporate-owned life insurance. The investment portfolios for these products are segregated for management purposes within the general account of the respective legal entity. The liabilities under asset-intensive insurance contracts or reinsurance contracts reinsured on a coinsurance basis are included in interest-sensitive contract liabilities on the consolidated balance sheets. Asset-intensive contracts principally include individual fixed annuities in the accumulation phase, single premium immediate annuities, equity-indexed annuities, individual variable annuities, corporate-owned life and interest-sensitive whole life insurance contracts. Interest-sensitive contract liabilities are equal to (i) policy account values, which consist of an accumulation of gross premium payments; (ii) credited interest less expenses, mortality charges, and withdrawals; and (iii) fair value adjustments relating to business combinations. Liabilities for immediate annuities are calculated as the present value of the expected cash flows, with the locked-in discount rate determined such that there is no gain or loss at inception. Additionally, certain annuity contracts the Company reinsures contain terms, such as guaranteed minimum benefits and equity participation options, which are deemed to be embedded derivatives and are accounted for based on the general accounting principles for Derivatives and Hedging.
The Company establishes liabilities for guaranteed minimum living benefits relating to certain variable annuity products as follows:
•Guaranteed minimum income benefits (“GMIB”) provide the contract holder, after a specified period of time determined at the time of issuance of the variable annuity contract, with a minimum level of income (annuity) payments. Under the reinsurance treaty, the Company makes a payment to the ceding company equal to the GMIB net amount-at-risk at the time of annuitization and thus these contracts meet the net settlement criteria of the general accounting principles for Derivatives and Hedging and the Company assumes no mortality risk. Accordingly, the GMIB is considered an embedded derivative, which is measured at fair value separately from the host variable annuity product.
•Guaranteed minimum withdrawal benefits (“GMWB”) guarantee the contract holder a return of their purchase payment via partial withdrawals, even if the account value is reduced to zero, provided that the contract holder’s cumulative withdrawals in a contract year do not exceed a certain limit. The initial guaranteed withdrawal amount is equal to the initial benefit base as defined in the contract (typically, the initial purchase payments plus applicable bonus amounts). The GMWB is also an embedded derivative, which is measured at fair value separately from the host variable annuity product.
•Guaranteed minimum accumulation benefits (“GMAB”) provide the contract holder, after a specified period of time determined at the time of issuance of the variable annuity contract, with a minimum accumulation of their purchase payments even if the account value is reduced to zero. The initial guaranteed accumulation amount is equal to the initial benefit base as defined in the contract (typically, the initial purchase payments plus applicable bonus amounts). The GMAB is also an embedded derivative, which is measured at fair value separately from the host variable annuity product.
For GMIB, GMWB and GMAB, the initial benefit base is increased by additional purchase payments made within a certain time period and decreased by benefits paid and/or withdrawal amounts. After a specified period of time, the benefit base may also increase as a result of an optional reset as defined in the contract.
The fair values of the GMIB, GMWB and GMAB embedded derivative liabilities are reflected in interest-sensitive contract liabilities on the consolidated balance sheets and are calculated based on actuarial and capital market assumptions related to the projected cash flows, including benefits and related contract charges over the lives of the contracts. These projected cash flows incorporate expectations concerning policyholder behavior, such as lapses, withdrawals and benefit selections, and capital market assumptions such as interest rates and equity market volatilities. In measuring the fair value of GMIBs, GMWBs and
GMABs, the Company attributes a portion of the fees collected from the policyholder equal to the present value of expected future guaranteed minimum income, withdrawal and accumulation benefits (at inception). The changes in fair value are reported in investment related gains (losses), net. Any additional fees represent “excess” fees and are reported in other revenues on the consolidated statements of income. These variable annuity guaranteed living benefits may be more costly than expected in volatile or declining equity markets or falling interest rate markets, causing an increase in interest-sensitive contract liabilities, negatively affecting net income.
The Company reinsures equity-indexed annuity contracts. These contracts allow the contract holder to elect an interest rate return or an equity market component where interest credited is based on the performance of common stock market indices, such as the S&P 500 Index®, the Dow Jones Industrial Average, or the NASDAQ. The equity market option is considered an embedded derivative, similar to a call option, which is reflected at fair value on the consolidated balance sheets in interest-sensitive contract liabilities. The fair value of embedded derivatives is computed based on a projection of future equity option costs using a budget methodology, discounted back to the balance sheet date using current market indicators of volatility and interest rates. Changes in the fair value of the embedded derivatives are included as a component of interest credited on the consolidated statements of income.
The Company reviews its estimates of actuarial liabilities for interest-sensitive contract liabilities and compares them with its actual experience. Differences between actual experience and the assumptions used in pricing these guarantees and benefits and
in the establishment of the related liabilities result in variances in profit and could result in losses. The effects of changes in such estimated liabilities are included in the results of operations in the period in which the changes occur.
Other Policy Claims and Benefits
Claims payable for incurred but not reported losses are determined using case-basis estimates and lag studies of past experience. The time lag from the date of the claim or death to when the ceding company reports the claim to the Company can vary significantly by ceding company, business segment and product type, but generally averages around 3.93.4 months. Incurred but not reported claims are estimates on an undiscounted basis, using actuarial estimates of historical claims expense, adjusted for current trends and conditions. These estimates are continually reviewed and the ultimate liability may vary significantly from the amount recognized, which are reflected in claims and other policy benefits in the consolidated statements of income in the period in which they are determined.
Other Liabilities
Other liabilities primarily include liabilities associated with amounts ceded on a funds withheld basis, investments in transit, separate accounts, employee benefits, cash collateral received on derivative positions and current federal income taxes payable.
Income Taxes
The U.S. consolidated tax return includes the operations of RGA and all eligible subsidiaries. Certain RGA subsidiaries file separate U.S. income tax returns as these companies are currently ineligible for inclusion in the consolidated federal tax return. The Company’s foreign subsidiaries are taxed under applicable local statutes.
The Company provides for federal, state and foreign income taxes currently payable, as well as those deferred due to temporary differences between the tax basis of assets and liabilities and the reported amounts, and are recognized in net income or in certain cases in OCI.other comprehensive income. The Company’s accounting for income taxes represents management’s best estimate of various events and transactions considering the laws enacted as of the reporting date. The Tax Cuts and Jobs Act of 2017 (“U.S. Tax Reform”) creates additional complexity due to various provisions that require management judgment and assumptions, which are subject to change.
Deferred tax assets and liabilities are measured by applying the relevant jurisdictions’ enacted tax rate to the temporary difference infor the period in which the temporary differences are expected to reverse.reverse to the temporary difference change for that period. The Company will establish a valuation allowance if management determines, based on available information, that it is more likely than not that deferred income tax assets will not be realized. The Company has deferred tax assets including those related to foreign tax credits, net operating, and capital losses. The Company has projected its ability to utilize its deferred tax assets and established a valuation allowance on the portion of the deferred tax assets the Company believes more likely than not will not be realized.
Significant judgment is required in determining whether valuation allowances should be established as well as the amount of such allowances. When making such a determination, consideration is given to, among other things, the following:
| |
(i) | future taxable income exclusive of reversing temporary differences and carryforwards; |
| |
(ii) | future reversals of existing taxable temporary differences; |
| |
(iii) | taxable income in prior carryback years; and |
| |
(iv) | tax planning strategies. |
(ii)future reversals of existing taxable temporary differences;
(iii)future taxable income exclusive of reversing temporary differences and carryforwards; and
(iv)tax planning strategies.
Any such changes could significantly affect the amounts reported in the consolidated financial statements in the year these changes occur.
The Company made a policy election to account for global intangible low-taxed income (“GILTI”) as a period cost.
The Company reports uncertain tax positions in accordance with generally accepted accounting principles. In order to recognize the benefit of an uncertain tax position, the position must meet the more likely than not criteria of being sustained. Unrecognized tax benefits due to tax uncertainties that do not meet the more likely than not criteria are included within income tax laibilitesliabilities and are charged to earnings in the period that such determination is made. The Company classifies interest related to tax uncertainties as interest expense whereas penalties related to tax uncertainties are classified as a component of income tax.
See Note 9 -– “Income Tax” for further discussion including the impact of the December 22, 2017 enactment of U.S. Tax Reform.
Collateral Finance and Securitization Notes
Collateral finance and securitization notes represent private placement asset-backed structured financing transactions. Collateral finance notes are issued on specified insurance policies reinsured by the Company’s regulated subsidiaries. Transaction costs, primarily interest expense, are reflected in collateral finance and securitization expense. See Note 14 -– “Collateral Finance and Securitization Notes” for additional information.
Foreign Currency Translation
Assets, liabilities and results of foreign operations are recorded based on the functional currency of each foreign operation. The determination of the functional currency is based on economic facts and circumstances pertaining to each foreign operation. The Company’s material functional currencies are the U.S. dollar, Canadian dollar, British pound, Australian dollar, Japanese yen, Korean won, Euro and South African rand. The translation of the functional currency into U.S. dollars is performed for balance sheet accounts using current exchange rates in effect at the balance sheet date and for revenue and expense accounts using weighted-average exchange rates during each year. Gains or losses, net of applicable deferred income taxes, resulting from such translation are included in accumulated currency translation adjustments, in AOCI on the consolidated balance sheets until the underlying functional currency operation is sold or substantially liquidated.
Recognition of Revenues and Related Expenses– Long-Duration Products
Life and health premiums are recognized as revenue when due from the insured, and are reported net of amounts retroceded. Benefits and expenses are reported net of amounts retroceded and are associated with earned premiums so that profits are recognized over the life of the related contract. This association is accomplished through the provision for future policy benefits and the amortization of deferred policy acquisition costs. Other revenue includes items such as treaty recapture fees, fees associated with financial reinsurance and policy changes on interest-sensitive and investment-type products that the Company reinsures. Any fees that are collected in advance of the period benefited are deferred and recognized over the period benefited.
For certain reinsurance transactions involving in force blocks of business, the ceding company pays a premium equal to the initial required reserve (future policy benefit). In such transactions, for income statement presentation, the Company nets the expense associated with the establishment of the reserve on the consolidated balance sheets against the premiums from the transaction.
Revenues for interest-sensitive and investment-type products consist of investment income, policy charges for the cost of insurance, policy administration, and surrenders that have been assessed against policy account balances during the period. Interest-sensitive contract liabilities for these products represent policy account balances before applicable surrender charges. Policy benefits and claims that are charged to expenses include claims incurred in the period in excess of related policy account balances and interest credited to policy account balances. Interest is credited to policyholder account balances according to terms of the policies or contracts.
For each of its reinsurance contracts, the Company must determine if the contract provides indemnification against loss or liability relating to insurance risk, in accordance with GAAP. The Company must review all contractual features, particularly those that may limit the amount of insurance risk to which the Company is subject or features that delay the timely reimbursement of claims. If the Company determines that a contract does not expose it to a reasonable possibility of a significant loss from insurance risk, the Company records the contract on a deposit method of accounting with any net amount receivable reflected as an asset within premiums receivable and other reinsurance balances, and any net amount payable reflected as a liability within other reinsurance balances on the consolidated balance sheets.balances. Fees earned on the contracts are reflected as other revenues, rather than premiums,premiums.
Recognition of Revenues and Related Expenses – Short-Duration Products
The Company provides reinsurance of medical, disability, life and other products for a fixed period of short-duration, typically one to three years. Under the short-duration insurance accounting model:
•Premiums are recognized over the coverage period in proportion to the amount of insurance protection provided.
•Claims or benefits are recognized when insured events occur, based on the consolidated statementsultimate cost to settle the claim, and are adjusted to reflect changes in estimates during the life of income.the contract. The estimated cost to settle the claim is based on
actuarial assumptions for similar claims. The Company also establishes an incurred but not reported (“IBNR”) liability based on historical reporting patterns.
•Eligible deferred acquisition costs are capitalized and amortized in proportion to premium.
Equity Based Compensation
The Company expenses the fair value of stock awards included in its incentive compensation plans. As of the date stock awards are approved, the fair value of stock options is determined using a Black-Scholes options valuation methodology, and the fair value of other stock awards is based upon the market value of the stock on the grant date. The fair value of the awards is expensed over the performance or service period, which generally corresponds to the vesting period, and is recognized as an increase to additional paid-in-capital in stockholders’ equity, and stock-based compensation expense is reflected in other operating expenses in the consolidated statements of income.expenses.
Earnings Per Share
Basic earnings per share exclude any dilutive effectsis calculated based on the weighted average number of anycommon shares outstanding options.during the period. Diluted earnings per share include the dilutive effects assuming outstandingthe exercise or issuance of stock options were exercised.
New Accounting Pronouncements
Changes to the general accounting principles are established by the Financial Accounting Standards Board (“FASB”) in the form of accounting standards updates to the FASB Accounting Standards CodificationTM. Accounting standards updates not listed below were assessed and determined to be either not applicable or are expected to have minimal impact on the Company’s consolidated financial statements.
|
| | |
Description | Date of Adoption | EffectThere were no new accounting standards or updated accounting guidance adopted by the Company that had a material impact on the Company’s results of operations and financial position.Standards Not Yet Adopted In the first quarter of 2023, the Financial Statements or Other Significant Matters |
Standards adopted: | | |
Financial Instruments - Recognition and Measurement
This guidance requires equity investments that are not accounted for under the equity method of accounting to be measured at fair value with changes recognized in net income and also updates certain presentation and disclosure requirements.
|
January 1, 2018
|
This guidance required a cumulative-effect adjustment for certain items upon adoption. The adoption of the new guidance was not material to the Company's financial position.
|
Compensation - Retirement Benefits - Defined Benefit Plans - General
This guidance is part of the FASB’s disclosure framework project and eliminates certain disclosure requirements for defined benefit pension and other postretirement plans. Early adoption is permitted.
|
December 31, 2018
|
This guidance was applied retrospectively to all periods presented in the year of adoption. The adoption of the new guidance was not material to the Company’s financial position.
|
Leases
This new standard, based on the principle that entities should recognize assets and liabilities arising from leases, does not significantly change the lessees’ recognition, measurement and presentation of expenses and cash flows from the previous accounting standard. Leases are classified as finance or operating. The new standard’s primary change is the requirement for entities to recognize a lease liability for payments and a right of use asset representing the right to use the leased asset during the term of operating lease arrangements. Lessees are permitted to make an accounting policy election to not recognize the asset and liability for leases with a term of twelve months or less. Lessors’ accounting is largely unchanged from the previous accounting standard. In addition, the new standard expands the disclosure requirements of lease arrangements. Early adoption is permitted.
|
January 1, 2019
|
This guidance was adopted by applying the optional transition method. The adoption of the standard did not have a material impact on the Company’s results of operations or financial position. The adoption of the updated guidance resulted in the Company recognizing a right-to-use asset and lease liability of $55.2 million included in other assets and other liabilities, respectively, in the consolidated balance sheets.
|
Derivatives and Hedging
This updated guidance improves the financial reporting of hedging relationships to better portray the economic results of an entity’s risk management activities in its financial statements and make certain targeted improvements to simplify the application of the hedge accounting in current GAAP related to the assessment of hedge effectiveness. Early adoption is permitted.
|
January 1, 2019
|
This guidance was adopted by applying a modified retrospective approach to existing hedging relationships as of the date of adoption. The adoption of the new standard did not have a material impact on the Company’s results of operations or financial position. Upon adoption of the guidance, the Company recorded an immaterial adjustment to retained earnings as of the beginning of the first reporting period in which the guidance was effective and modified some disclosures.
|
|
| | |
Description | Anticipated Date of Adoption | Effect on the Financial Statements or Other Significant Matters |
Standards not yet adopted: | | |
Financial Services - Insurance
This guidance significantly changes how insurers account for long-duration insurance contracts. The new guidance also significantly expands the disclosure requirements of long-duration insurance contracts. The new guidance will be effective for annual and interim reporting periods beginning January 1, 2022. Below are the most significant areas of change:
|
January 1, 2022
|
See each significant area of change below for the method of adoption and expected impact to the Company’s results of operations and financial position.
|
Cash flow assumptions for measuring liability for future policy benefits The new guidance requires insurers to review, and if necessary, update the cash flow assumptions used to measure liabilities for future policy benefits periodically. The change in the liability estimate as a result of updating cash flow assumptions will be recognized in net income.
| | Cash flow assumptions for measuring liability for future policy benefits The Company will likely adopt this guidance on a modified retrospective basis as of the earliest period presented in the year of adoption. The Company is currently evaluating the impact of this amendment on its results of operations and financial position but anticipates the updated guidance will likely have a material impact.
|
Discount rate assumption for measuring liability for future policy benefits The new guidance requires insurers to update the discount rate assumption used to measure liabilities for future policy benefits at each reporting period, and the discount rate utilized must be based on an upper-medium grade fixed income instrument yield. The change in the liability estimate as a result of updating the discount rate assumption will be recognized in other comprehensive income.
| | Discount rate assumption for measuring liability for future policy benefits The Company will likely adopt this guidance on a modified retrospective basis as of the earliest period presented in the year of adoption. The Company is currently evaluating the impact of this amendment on its results of operations and financial position but anticipates the updated guidance will likely have a material impact.
|
Market risk benefits The new guidance created a new category of benefit features called market risk benefits that will be measured at fair value with changes in fair value attributable to a change in the instrument-specific credit risk recognized in other comprehensive income.
| | Market risk benefits The Company will adopt this guidance on a retrospective basis as of the earliest period presented in the year of adoption. The Company is currently evaluating the impact of this amendment on its results of operations and financial position but anticipates the updated guidance will likely have a material impact.
|
Amortization of deferred acquisition costs (“DAC”) and other balances The new guidance requires DAC and other balances to be amortized on a constant level basis over the expected term of the related contracts.
| | Amortization of deferred acquisition costs (“DAC”) and other balances The Company will likely adopt this guidance on a modified retrospective basis as of the earliest period presented in the year of adoption. The Company is currently evaluating the impact of this amendment on its results of operations and financial position but anticipates the updated guidance will likely have a material impact.
|
Financial Instruments - Credit Losses
This guidance adds to U.S. GAAP an impairment model, known as current expected credit loss (“CECL”) model that is based on expected losses rather than incurred losses. For traditional and other receivables, held-to-maturity debt securities, loans and other instruments entities will be required to use the new forward-looking “expected loss” model that generally will result in earlier recognition of allowance for losses. For available-for-sale debt securities with unrealized losses, entities will measure credit losses similar to what they do today, except the losses will be recognized through an allowance for credit losses and adjusted each period for changes in credit risks. Early adoption is permitted.
|
January 1, 2020
|
For asset classes within the scope of the CECL model, this guidance will be adopted through a cumulative-effect adjustment to retained earnings as of the beginning of the first reporting period in which the guidance is effective (that is, a modified-retrospective approach). For available-for-sale debt securities, this guidance will be applied prospectively. The allowance for credit losses will increase when this guidance is adopted to include expected losses over the lifetime of commercial mortgages and other loans, including reasonable and supportable forecasts and expected changes in future economic conditions. The overall impact is estimated to be an approximate $15 million increase in the allowance for credit losses. This increase will be reflected as a decrease to opening retained earnings, net of income taxes, as of January 1, 2020.
|
Fair Value Measurement
This guidance is part of the FASB’s disclosure framework project and eliminates certain disclosure requirements for fair value measurement, requires entities to disclose new information and modifies existing disclosure requirements. Early adoption is permitted.
|
January 1, 2020
|
Certain disclosure changes in the new guidance will be applied prospectively in the year of adoption. The remaining changes in the new guidance will be applied retrospectively to all periods presented in the year of adoption.
As of December 31, 2019, the Company early adopted the guidance that removed the requirements relating to transfers between fair value hierarchy levels and certain disclosures about valuation processes for Level 3 fair value measurements. The Company will adopt the remainder of the guidance on January 1, 2020. The adoption of the new guidance will not be material to the Company’s financial position.
|
Other
On July 27, 2017, the Financial Conduct Authority (the “FCA”) announced that it intends to stop persuading or compelling banks to submit London Interbank Offered Rates (“LIBOR”) after December 31, 2021. In addition, separate workstreams are underway in Europe and the U.S. to reform existing reference rates and provide a fall back rate upon discontinuation of LIBOR. During 2019, the Alternative Rates Committee of the Federal Reserve Board proposed the Secured Overnight Financing Rate (“SOFR”) as an alternative rate to replace U.S. Dollar LIBOR, and the European Central Bank recommended the Euro Short-term Rate (“ESTER”) as the new risk-free rate. Other jurisdictions are conducting similar exercises as well. The Company is currently assessing the effects of the discontinuation of LIBOR on existing contracts that extend beyond 2021, by analyzing contractual fallback provisions, evaluating alternative rate ramifications, and assessing the effects on current hedging strategies.
During 2019, the FASB issued a proposed Accounting Standards Update (“ASU”): ASU 2018-12, Financial Services – Insurance (Topic 944): Targeted Improvements to ease the potential burden inAccounting for Long-Duration Contracts (“ASU 2018-12”). ASU 2018-12 updates certain requirements for the accounting for or recognizinglong-duration insurance contracts.
•Cash flow assumptions and measuring liability for future policy benefits – ASU 2018-12 requires the effectsCompany to review its cash flow assumptions at least annually and update, when necessary, with the impact recognized in net income in the period of referencethe change.
Upon adoption, there will be an adjustment to retained earnings as a result of capping the net premium ratio at 100% and eliminating negative reserves on certain issue year cohorts.
•Discount rate – The discount rate reform on financial reporting.assumption is prescribed by ASU 2018-12 as an upper-medium (low credit risk) fixed-income yield and is required to be updated every quarter. The proposed ASU will provide optional expedients and exceptions for applying GAAP modification to contracts and hedge accounting relationships affected by reference rate reform on financial reporting. Under the proposed standard, a change in the referenceliability as a result of updating the discount rate for a contract that meets certain criteriaassumption is recognized in OCI.
Upon adoption, there will be accounted foran adjustment to accumulated other comprehensive income (loss) as a continuationresult of thatremeasuring in force contract rather thanliabilities using current upper-medium grade fixed income instrument yields. The adjustment will largely reflect the creation of a new contract. The proposed ASU will apply to debt, insurance contracts, leases, derivative contracts,difference between discount rates locked-in at contract inception versus current discount rates at transition.
•Deferred policy acquisition costs and similar balances – Deferred policy acquisition costs (“DAC”) and other arrangements.capitalized costs such as unearned revenue are amortized on a constant level or straight-line basis over the expected term of the contracts.
Upon adoption, the Company expects an adjustment to accumulated other comprehensive income (loss) for the removal of cumulative adjustments to DAC associated with unrealized gains and losses previously recorded in accumulated other comprehensive income (loss).
•Market risk benefits – Market risk benefits, which are contracts or contract features that provide protection to the policyholder from capital market risk and expose the Company to other-than-nominal capital market risk, are measured at fair value. The FASBperiodic change in fair value is expectedrecognized in net income with the exception of the periodic change in fair value related to the instrument-specific credit risk, which is recognized in OCI.
Upon adoption, the Company expects an impact to (1) accumulated other comprehensive income (loss) for the cumulative effect of changes in the instrument-specific credit risk between contract issue date and transition date and (2) retained earnings for the difference between fair value and carrying value at the transition date, excluding the changes in the instrument-specific credit risk.
The updated guidance for the cash flow assumptions, discount rate and deferred policy acquisition costs will be applied on a final ASUmodified retrospective method as of the earliest period included in early 2020.the financial statements; that is, to contracts in force as of January 1, 2021. The guidance for market risk benefits will be applied retrospectively as of January 1, 2021. The following summarizes the estimated impact the adoption will have on previously reported amounts:
•Stockholders’ equity as of December 31, 2021: The Company estimates the adoption of the new guidance will decrease previously reported retained earnings by approximately $0.5 billion to $0.8 billion, net of tax, and accumulated other comprehensive income (loss) by approximately $3.2 billion to $5.2 billion, net of tax, as of December 31, 2021.
•Stockholders’ equity as of December 31, 2022: The Company estimates the adoption of the new guidance will decrease reported retained earnings by approximately $0.6 billion to $0.9 billion, net of tax, and increase accumulated other comprehensive income (loss) by approximately $2.9 billion to $4.9 billion, net of tax, as of December 31, 2022.
The above estimates assume an effective tax rate of 20%. While the Company has substantially completed the necessary updates to its valuation models and other systems to implement the standard, the Company’s implementation of the new guidance is continuing to be refined and reviewed. The actual impact of adoption, including the actual tax rates, will be finalized upon completion the Company’s disclosure and controls procedures regarding the adoption of the new guidance. Therefore, the Company’s estimates are subject to change.
Note 3 EARNINGS PER SHARE
The following table sets forth the computation of basic and diluted earnings per share on net income (in millions, except per share information):
|
| | | | | | | | | | | | |
| | | 2019 | | 2018 | | 2017 |
| Earnings: | | | | | | |
| Net income (numerator for basic and diluted calculations) | | $ | 870 |
| | $ | 716 |
| | $ | 1,822 |
|
| Shares: | | | | | | |
| Weighted average outstanding shares (denominator for basic calculations) | | 62,684 |
| | 63,658 |
| | 64,427 |
|
| Equivalent shares from outstanding stock options | | 1,198 |
| | 1,436 |
| | 1,326 |
|
| Diluted shares (denominator for diluted calculations) | | 63,882 |
| | 65,094 |
| | 65,753 |
|
| Earnings per share: | | | | | | |
| Basic | | $ | 13.88 |
| | $ | 11.25 |
| | $ | 28.28 |
|
| Diluted | | 13.62 |
| | 11.00 |
| | 27.71 |
|
| | | | | | | | | | | | | | | | | | | | |
| | 2022 | | 2021 | | 2020 |
| Earnings: | | | | | | |
| Net income (numerator for basic and diluted calculations) | | $ | 627 | | | $ | 617 | | | $ | 415 | |
| Less: Net income attributable to noncontrolling interest | | 4 | | | — | | | — | |
| Net income available to RGA, Inc. shareholders | | $ | 623 | | | $ | 617 | | | $ | 415 | |
| Shares: | | | | | | |
| Weighted average outstanding shares (denominator for basic calculations) | | 66.9 | | | 67.8 | | | 65.4 | |
| Equivalent shares from outstanding stock awards | | 0.8 | | | 0.5 | | | 0.4 | |
| Diluted shares (denominator for diluted calculations) | | 67.7 | | | 68.3 | | | 65.8 | |
| Earnings per share: | | | | | | |
| Basic | | $ | 9.31 | | | $ | 9.10 | | | $ | 6.35 | |
| Diluted | | 9.21 | | | 9.04 | | | 6.31 | |
The calculation of common equivalent shares does not include the impact of options havingstock awards with a strike or conversion price that exceeds the average stock price for the earnings period, as the result would be antidilutive. The calculation of common equivalent shares also excludes the impact of outstanding performance contingent shares,awards, as the conditions necessary for their issuance have not been satisfied as of the end of the reporting period. Approximately 0.2 million, 0.1 million, and 0.2 million outstanding stock options and approximately 0.3 million, 0.4 million and 0.3 million performance contingent shares were excluded from the calculation of common equivalent shares during 2019, 2018 and 2017, respectively.
Note 4 INVESTMENTS
Fixed Maturity Securities Available-for-Sale
The Company holds various types of fixed maturity securities available-for-sale and classifies them as corporate securities (“Corporate”), Canadian and Canadian provincial government securities (“Canadian government”), residential mortgage-backed securities (“RMBS”), asset-backed securities (“ABS”), commercial mortgage-backed securities (“CMBS”), U.S. government and agencies (“U.S. government”), state and political subdivisions, and other foreign government, supranational and foreign government-sponsored enterprises (“Other foreign government”). RMBS, ABS and CMBS are collectively “structured securities.”
The following tables provide information relating to investments in fixed maturity securities by type as of December 31, 20192022 and 20182021 (dollars in millions):
|
| | | | | | | | | | | | | | | | | | | | | | | |
| December 31, 2019: | | Amortized Cost | | Unrealized Gains | | Unrealized Losses | | Estimated Fair Value | | % of Total | | Other-than- temporary impairments in AOCI |
| Available-for-sale: | | | | | | | | | | | | |
| Corporate | | $ | 29,205 |
| | $ | 2,269 |
| | $ | 81 |
| | $ | 31,393 |
| | 61.4 | % | | $ | — |
|
| Canadian government | | 3,016 |
| | 1,596 |
| | — |
| | 4,612 |
| | 9.0 |
| | — |
|
| RMBS | | 2,339 |
| | 62 |
| | 3 |
| | 2,398 |
| | 4.7 |
| | — |
|
| ABS | | 2,973 |
| | 19 |
| | 14 |
| | 2,978 |
| | 5.8 |
| | — |
|
| CMBS | | 1,841 |
| | 61 |
| | 3 |
| | 1,899 |
| | 3.7 |
| | — |
|
| U.S. government | | 2,096 |
| | 57 |
| | 1 |
| | 2,152 |
| | 4.2 |
| | — |
|
| State and political subdivisions | | 1,074 |
| | 93 |
| | 3 |
| | 1,164 |
| | 2.3 |
| | — |
|
| Other foreign government | | 4,209 |
| | 321 |
| | 5 |
| | 4,525 |
| | 8.9 |
| | — |
|
| Total fixed maturity securities | | $ | 46,753 |
| | $ | 4,478 |
| | $ | 110 |
| | $ | 51,121 |
| | 100.0 | % | | $ | — |
|
| | | | | | | | | | | | | | | | | | | | | | | | | | | | | | | | | | | | | | |
| December 31, 2022: | | Amortized
Cost | | Allowance for Credit Losses | | Unrealized
Gains | | Unrealized
Losses | | Estimated
Fair Value | | % of Total |
| Available-for-sale: | | | | | | | | | | | | |
| Corporate | | $ | 38,963 | | | $ | 27 | | | $ | 168 | | | $ | 5,135 | | | $ | 33,969 | | | 64.2 | % |
| Canadian government | | 3,311 | | | — | | | 381 | | | 66 | | | 3,626 | | | 6.9 | |
| RMBS | | 1,054 | | | — | | | 1 | | | 114 | | | 941 | | | 1.8 | |
| ABS | | 4,324 | | | 10 | | | 4 | | | 440 | | | 3,878 | | | 7.3 | |
| CMBS | | 1,835 | | | — | | | — | | | 212 | | | 1,623 | | | 3.1 | |
| U.S. government | | 1,690 | | | — | | | 4 | | | 212 | | | 1,482 | | | 2.8 | |
| State and political subdivisions | | 1,282 | | | — | | | 10 | | | 173 | | | 1,119 | | | 2.1 | |
| Other foreign government | | 7,204 | | | — | | | 26 | | | 967 | | | 6,263 | | | 11.8 | |
| Total fixed maturity securities | | $ | 59,663 | | | $ | 37 | | | $ | 594 | | | $ | 7,319 | | | $ | 52,901 | | | 100.0 | % |
|
| | | | | | | | | | | | | | | | | | | | | | | |
| December 31, 2018: | | Amortized
Cost | | Unrealized
Gains | | Unrealized
Losses | | Estimated
Fair Value | | % of Total | | Other-than-
temporary
impairments
in AOCI |
| Available-for-sale: | | | | | | | | | | | | |
| Corporate | | $ | 24,006 |
| | $ | 531 |
| | $ | 555 |
| | $ | 23,982 |
| | 59.9 | % | | $ | — |
|
| Canadian government | | 2,768 |
| | 1,126 |
| | 2 |
| | 3,892 |
| | 9.7 |
| | — |
|
| RMBS | | 1,872 |
| | 22 |
| | 25 |
| | 1,869 |
| | 4.7 |
| | — |
|
| ABS | | 2,172 |
| | 11 |
| | 33 |
| | 2,150 |
| | 5.4 |
| | — |
|
| CMBS | | 1,428 |
| | 9 |
| | 18 |
| | 1,419 |
| | 3.5 |
| | — |
|
| U.S. government | | 2,234 |
| | 10 |
| | 58 |
| | 2,186 |
| | 5.5 |
| | — |
|
| State and political subdivisions | | 721 |
| | 40 |
| | 9 |
| | 752 |
| | 1.9 |
| | — |
|
| Other foreign government | | 3,681 |
| | 109 |
| | 48 |
| | 3,742 |
| | 9.4 |
| | — |
|
| Total fixed maturity securities | | $ | 38,882 |
| | $ | 1,858 |
| | $ | 748 |
| | $ | 39,992 |
| | 100.0 | % | | $ | — |
|
| | | | | | | | | | | | | | | | | | | | | | | | | | | | | | | | | | | | | | | | |
| December 31, 2021: | | Amortized
Cost | | Allowance for Credit Losses | | Unrealized
Gains | | Unrealized
Losses | | Estimated
Fair Value | | % of Total | | |
| Available-for-sale: | | | | | | | | | | | | | | |
| Corporate | | $ | 35,239 | | | $ | 26 | | | $ | 3,084 | | | $ | 194 | | | $ | 38,103 | | | 62.8 | % | | |
| Canadian government | | 3,339 | | | — | | | 1,606 | | | 1 | | | 4,944 | | | 8.1 | | | |
| RMBS | | 1,020 | | | — | | | 37 | | | 7 | | | 1,050 | | | 1.7 | | | |
| ABS | | 4,024 | | | — | | | 22 | | | 41 | | | 4,005 | | | 6.6 | | | |
| CMBS | | 1,790 | | | 1 | | | 66 | | | 6 | | | 1,849 | | | 3.0 | | | |
| U.S. government | | 2,082 | | | — | | | 31 | | | 8 | | | 2,105 | | | 3.5 | | | |
| State and political subdivisions | | 1,191 | | | — | | | 137 | | | 5 | | | 1,323 | | | 2.2 | | | |
| Other foreign government | | 7,188 | | | 4 | | | 273 | | | 87 | | | 7,370 | | | 12.1 | | | |
| Total fixed maturity securities | | $ | 55,873 | | | $ | 31 | | | $ | 5,256 | | | $ | 349 | | | $ | 60,749 | | | 100.0 | % | | |
The Company enters into various collateral arrangements with counterparties that require both the pledging and acceptance of fixed maturity securities as collateral. Pledged fixed maturity securities are included in fixed maturity securities, available-for-sale in the consolidated balance sheets. Fixed maturity securities received as collateral are held in separate custodial accounts and are not recorded on the Company’s consolidated balance sheets. Subject to certain constraints, the Company is permitted by contract to sell or repledge collateral it receives; however, as of December 31, 20192022 and 2018,2021, none of the collateral received had been sold or repledged. The Company also holds assets in trust to satisfy collateral requirements under derivative transactions and certain third-party reinsurance treaties. The following table includes fixed maturity securities pledged and received as collateral and assets in trust held to satisfy collateral requirements under derivative transactions and certain third-party reinsurance treaties as of December 31, 20192022 and 20182021 (dollars in millions):
|
| | | | | | | | | | | | | | | |
| | 2019 | | 2018 |
| | Amortized Cost | | Estimated Fair Value | | Amortized Cost | | Estimated Fair Value |
| Fixed maturity securities pledged as collateral | $ | 113 |
| | $ | 116 |
| | $ | 81 |
| | $ | 84 |
|
| Fixed maturity securities received as collateral | n/a |
| | 727 |
| | n/a |
| | 617 |
|
| Assets in trust held to satisfy collateral requirements | 27,290 |
| | 29,239 |
| | 20,073 |
| | 20,366 |
|
| | | | | | | | | | | | | | | | | | | | | | | |
| 2022 | | 2021 |
| Amortized
Cost | | Estimated
Fair Value | | Amortized
Cost | | Estimated
Fair Value |
| Fixed maturity securities pledged as collateral | $ | 355 | | | $ | 292 | | | $ | 100 | | | $ | 103 | |
| Fixed maturity securities received as collateral | n/a | | 1,428 | | | n/a | | 1,922 | |
| Assets in trust held to satisfy collateral requirements | 31,510 | | | 27,817 | | | 28,671 | | | 31,173 | |
The Company monitors its concentrations of financial instruments on an ongoing basis and mitigates credit risk by maintaining a diversified investment portfolio that limits exposure to any one issuer. The Company’s exposure to concentrations of credit risk from single issuers greater than 10% of the Company’s stockholders’ equity included securities of the U.S. government and its agencies, as well as the securities disclosed below, as of December 31, 20192022 and 20182021 (dollars in millions):
|
| | | | | | | | | | | | | | | |
| | 2019 | | 2018 |
| | Amortized Cost | | Estimated Fair Value | | Amortized Cost | | Estimated Fair Value |
| Fixed maturity securities guaranteed or issued by: | | | | | | | |
| Canadian province of Quebec | $ | 1,205 |
| | $ | 2,163 |
| | $ | 1,091 |
| | $ | 1,757 |
|
| Canadian province of Ontario | 1,014 |
| | 1,379 |
| | 914 |
| | 1,188 |
|
| | | | | | | | | | | | | | | | | | | | | | | |
| 2022 | | 2021 |
| Amortized
Cost | | Estimated
Fair Value | | Amortized
Cost | | Estimated
Fair Value |
| Fixed maturity securities guaranteed or issued by: | | | | | | | |
| Government of Japan | $ | 2,988 | | | $ | 2,516 | | | $ | 3,080 | | | $ | 3,063 | |
| Canadian province of Quebec | 1,436 | | | 1,649 | | | 1,377 | | | 2,347 | |
| Canadian province of Ontario | 982 | | | 1,068 | | | 1,092 | | | 1,451 | |
The amortized cost and estimated fair value of fixed maturity securities classified as available-for-sale as of December 31, 20192022, are shown by contractual maturity in the table below (dollars in millions). Actual maturities can differ from contractual maturities because borrowers may have the right to call or prepay obligations with or without call or prepayment penalties. Asset and mortgage-backedStructured securities are shown separately in the table below as they are not due at a single maturity date.
|
| | | | | | | | |
| | | Amortized Cost | | Estimated Fair Value |
| Available-for-sale: | | | | |
| Due in one year or less | | $ | 1,267 |
| | $ | 1,281 |
|
| Due after one year through five years | | 9,056 |
| | 9,387 |
|
| Due after five years through ten years | | 9,641 |
| | 10,416 |
|
| Due after ten years | | 19,636 |
| | 22,762 |
|
| Asset and mortgage-backed securities | | 7,153 |
| | 7,275 |
|
| Total | | $ | 46,753 |
| | $ | 51,121 |
|
| | | | | | | | | | | | | | |
| | Amortized Cost | | Estimated Fair Value |
| Available-for-sale: | | | | |
| Due in one year or less | | $ | 1,231 | | | $ | 1,223 | |
| Due after one year through five years | | 10,397 | | | 10,076 | |
| Due after five years through ten years | | 11,293 | | | 10,231 | |
| Due after ten years | | 29,529 | | | 24,929 | |
| Structured securities | | 7,213 | | | 6,442 | |
| Total | | $ | 59,663 | | | $ | 52,901 | |
Corporate Fixed Maturity Securities
The tables below show the major sectors of the Company’s corporate fixed maturity holdings as of December 31, 20192022 and 20182021 (dollars in millions):
|
| | | | | | | | | | | |
| December 31, 2019: | | Amortized Cost | | Estimated Fair Value | | % of Total |
| Finance | | $ | 10,896 |
| | $ | 11,653 |
| | 37.2 | % |
| Industrial | | 14,692 |
| | 15,803 |
| | 50.3 |
|
| Utility | | 3,617 |
| | 3,937 |
| | 12.5 |
|
| Total | | $ | 29,205 |
| | $ | 31,393 |
| | 100.0 | % |
| | | | | | | |
| December 31, 2018: | | Amortized Cost | | Estimated Fair Value | | % of Total |
| Finance | | $ | 8,794 |
| | $ | 8,731 |
| | 36.3 | % |
| Industrial | | 12,337 |
| | 12,342 |
| | 51.6 |
|
| Utility | | 2,875 |
| | 2,909 |
| | 12.1 |
|
| Total | | $ | 24,006 |
| | $ | 23,982 |
| | 100.0 | % |
| | | | | | | | | | | | | | | | | | | | |
| December 31, 2022: | | Amortized Cost | | Estimated
Fair Value | | % of Total |
| Finance | | $ | 14,551 | | | $ | 12,680 | | | 37.3 | % |
| Industrial | | 19,624 | | | 17,257 | | | 50.8 | |
| Utility | | 4,788 | | | 4,032 | | | 11.9 | |
| Total | | $ | 38,963 | | | $ | 33,969 | | | 100.0 | % |
| | | | | | |
| December 31, 2021: | | Amortized Cost | | Estimated
Fair Value | | % of Total |
| Finance | | $ | 13,101 | | | $ | 14,045 | | | 36.9 | % |
| Industrial | | 17,857 | | | 19,375 | | | 50.8 | |
| Utility | | 4,281 | | | 4,683 | | | 12.3 | |
| Total | | $ | 35,239 | | | $ | 38,103 | | | 100.0 | % |
Other-Than-TemporaryAllowance for Credit Losses and Impairments -– Fixed Maturity Securities Available-for-Sale
As discussed in Note 2 – “Significant Accounting Policies and Pronouncements,” a portion of certain OTTIallowances for credit losses on fixed maturity securities isare recognized in AOCI. For these securities, the netinvestment related gains (losses), net. The amount recognized in the consolidated statements of income (“credit loss impairments”) represents the difference between the amortized cost of the security and the net present value of its projected future cash flows discounted at the effective interest rate implicit in the debtfixed maturity security prior to impairment.the allowance for credit losses. Any remaining difference between the fair value and amortized cost is recognized in AOCI. OCI.
The following table sets forthtables present the amountrollforward of pre-taxthe allowance for credit loss impairments onlosses in fixed maturity securities held by type for the Company as of the dates indicated, for which a portion of the OTTI was recognized in AOCI,years ended December 31, 2022 and the corresponding changes in such amounts (dollars2021 (dollars in millions):
| | | | | | | | | | | | | | | | | | | | | | | | | | | | | | | | |
| For the year ended December 31, 2022: | | Corporate | | ABS | | CMBS | | Other Foreign Government | | Total |
| Balance, beginning of period | | $ | 26 | | | $ | — | | | $ | 1 | | | $ | 4 | | | $ | 31 | |
| Credit losses recognized on securities for which credit losses were not previously recorded | | 31 | | | 10 | | | — | | | 1 | | | 42 | |
| Reductions for securities sold during the period | | (32) | | | — | | | — | | | (7) | | | (39) | |
| Reductions for securities the Company intends to sell or more likely than not will be required to sell before recovery of its amortized cost | | (4) | | | — | | | — | | | — | | | (4) | |
| Additional increases or decreases for credit losses on securities that had an allowance recorded in a previous period | | 6 | | | — | | | (1) | | | 2 | | | 7 | |
| Balance, end of period | | $ | 27 | | | $ | 10 | | | $ | — | | | $ | — | | | $ | 37 | |
|
| | | | | | | | | | | | |
| | | 2019 | | 2018 | | 2017 |
| Balance, beginning of period | | $ | 4 |
| | $ | 4 |
| | $ | 6 |
|
| Credit loss impairments previously recognized on securities impaired to fair value during the period | | — |
| | — |
| | (2 | ) |
| Credit loss previously recognized on securities that matured, paid down, prepaid or were sold during the period | | (2 | ) | | — |
| | — |
|
| Balance, end of period | | $ | 2 |
| | $ | 4 |
| | $ | 4 |
|
| | | | | | | | | | | | | | | | | | | | | | | | | | | | | | | | |
| For the year ended December 31, 2021: | | Corporate | | ABS | | CMBS | | Other Foreign Government | | Total |
| Balance, beginning of period | | $ | 17 | | | $ | — | | | $ | 3 | | | $ | — | | | $ | 20 | |
| Credit losses recognized on securities for which credit losses were not previously recorded | | 21 | | | — | | | 1 | | | 5 | | | 27 | |
| Reductions for securities sold during the period | | (10) | | | — | | | (2) | | | (1) | | | (13) | |
| Reductions for securities the Company intends to sell or more likely than not will be required to sell before recovery of its amortized cost | | — | | | — | | | — | | | — | | | — | |
| Additional increases or decreases for credit losses on securities that had an allowance recorded in a previous period | | (2) | | | — | | | (1) | | | — | | | (3) | |
| Balance, end of period | | $ | 26 | | | $ | — | | | $ | 1 | | | $ | 4 | | | $ | 31 | |
Unrealized Losses for Fixed Maturity Securities Available-for-Sale
The following table presents the total gross unrealized losses for the 1,072 and 3,109 fixed maturity securities as of December 31, 2019 and 2018, where the estimated fair value had declined and remained below amortized cost by the indicated amount (dollars in millions):
|
| | | | | | | | | | | | | | |
| | | 2019 | | 2018 |
| | | Gross Unrealized Losses | | % of Total | | Gross
Unrealized
Losses | | % of Total |
| Less than 20% | | $ | 76 |
| | 69.1 | % | | $ | 721 |
| | 96.4 | % |
| 20% or more for less than six months | | 20 |
| | 18.2 |
| | 21 |
| | 2.8 |
|
| 20% or more for six months or greater | | 14 |
| | 12.7 |
| | 6 |
| | 0.8 |
|
| Total | | $ | 110 |
| | 100.0 | % | | $ | 748 |
| | 100.0 | % |
The Company’s determination of whether a decline in value is other-than-temporarynecessitates the recording of an allowance for credit losses includes an analysis of the underlying credit and the extent and duration of a decline in value. The Company’s credit analysis of an investment includes determining whether the issuer is current on its contractual payments, evaluating whether it is probable that the Company will be able to collect all amounts due according to the contractual terms of the security and analyzing the overall ability of the Company to recover the amortized cost of the investment.
The following tables presenttable presents the estimated fair values and gross unrealized losses including OTTI reported in AOCI, for the 6,441 and 1,862 fixed maturity securities that have estimated fair values below amortized costfor which an allowance for credit loss has not been recorded as of December 31, 20192022 and 2018December 31, 2021, and the estimated fair value had declined and remained below amortized cost (dollars in millions). These investments are presented by class and grade of security, as well as the length of time the related fair value has continuously remained below amortized cost.
|
| | | | | | | | | | | | | | | | | | | | | | | | |
| | | Less than 12 months | | 12 months or greater | | Total |
| December 31, 2019: | | Estimated Fair Value | | Gross Unrealized Losses | | Estimated
Fair Value | | Gross
Unrealized
Losses | | Estimated
Fair Value | | Gross
Unrealized
Losses |
| Investment grade securities: | | | | | | | | | | | | |
| Corporate | | $ | 1,936 |
| | $ | 29 |
| | $ | 293 |
| | $ | 7 |
| | $ | 2,229 |
| | $ | 36 |
|
| Canadian government | | — |
| | — |
| | — |
| | — |
| | — |
| | — |
|
| RMBS | | 367 |
| | 2 |
| | 84 |
| | 1 |
| | 451 |
| | 3 |
|
| ABS | | 773 |
| | 5 |
| | 739 |
| | 9 |
| | 1,512 |
| | 14 |
|
| CMBS | | 253 |
| | 3 |
| | — |
| | — |
| | 253 |
| | 3 |
|
| U.S. government | | 49 |
| | 1 |
| | — |
| | — |
| | 49 |
| | 1 |
|
| State and political subdivisions | | 103 |
| | 2 |
| | 12 |
| | 1 |
| | 115 |
| | 3 |
|
| Other foreign government | | 278 |
| | 4 |
| | — |
| | — |
| | 278 |
| | 4 |
|
| Total investment grade securities | | 3,759 |
| | 46 |
| | 1,128 |
| | 18 |
| | 4,887 |
| | 64 |
|
| Below investment grade securities: | | | | | | | | | | | | |
| Corporate | | 220 |
| | 38 |
| | 100 |
| | 7 |
| | 320 |
| | 45 |
|
| Other foreign government | | — |
| | — |
| | 10 |
| | 1 |
| | 10 |
| | 1 |
|
| Total below investment grade securities | | 220 |
| | 38 |
| | 110 |
| | 8 |
| | 330 |
| | 46 |
|
| Total fixed maturity securities | | $ | 3,979 |
| | $ | 84 |
| | $ | 1,238 |
| | $ | 26 |
| | $ | 5,217 |
| | $ | 110 |
|
| | | | | | | | | | | | | | | | | | | | | | | | | | | | | | | | | | | | | | |
| | | Less than 12 months | | 12 months or greater | | Total |
| December 31, 2022: | | Estimated
Fair Value | | Gross
Unrealized
Losses | | Estimated
Fair Value | | Gross
Unrealized
Losses | | Estimated
Fair Value | | Gross
Unrealized
Losses |
| Investment grade securities: | | | | | | | | | | | | |
| Corporate | | $ | 21,867 | | | $ | 2,756 | | | $ | 6,840 | | | $ | 2,225 | | | $ | 28,707 | | | $ | 4,981 | |
| Canadian government | | 554 | | | 42 | | | 71 | | | 23 | | | 625 | | | 65 | |
| RMBS | | 664 | | | 62 | | | 181 | | | 53 | | | 845 | | | 115 | |
| ABS | | 1,596 | | | 153 | | | 1,931 | | | 269 | | | 3,527 | | | 422 | |
| CMBS | | 1,314 | | | 144 | | | 281 | | | 65 | | | 1,595 | | | 209 | |
| U.S. government | | 1,202 | | | 64 | | | 253 | | | 148 | | | 1,455 | | | 212 | |
| State and political subdivisions | | 819 | | | 124 | | | 131 | | | 50 | | | 950 | | | 174 | |
| Other foreign government | | 2,757 | | | 253 | | | 2,720 | | | 652 | | | 5,477 | | | 905 | |
| Total investment grade securities | | 30,773 | | | 3,598 | | | 12,408 | | | 3,485 | | | 43,181 | | | 7,083 | |
| Below investment grade securities: | | | | | | | | | | | | |
| Corporate | | 767 | | | 87 | | | 305 | | | 61 | | | 1,072 | | | 148 | |
| | | | | | | | | | | | |
| | | | | | | | | | | | |
| ABS | | 52 | | | 6 | | | 38 | | | 9 | | | 90 | | | 15 | |
| | | | | | | | | | | | |
| | | | | | | | | | | | |
| Other foreign government | | 39 | | | 2 | | | 164 | | | 60 | | | 203 | | | 62 | |
| Total below investment grade securities | | 858 | | | 95 | | | 507 | | | 130 | | | 1,365 | | | 225 | |
| Total fixed maturity securities | | $ | 31,631 | | | $ | 3,693 | | | $ | 12,915 | | | $ | 3,615 | | | $ | 44,546 | | | $ | 7,308 | |
|
| | | | | | | | | | | | | | | | | | | | | | | | |
| | | Less than 12 months | | 12 months or greater | | Total |
| December 31, 2018: | | Estimated
Fair Value | | Gross
Unrealized
Losses | | Estimated
Fair Value | | Gross
Unrealized
Losses | | Estimated
Fair Value | | Gross
Unrealized
Losses |
| Investment grade securities: | | | | | | | | | | | | |
| Corporate | | $ | 8,505 |
| | $ | 302 |
| | $ | 3,612 |
| | $ | 195 |
| | $ | 12,117 |
| | $ | 497 |
|
| Canadian government | | — |
| | — |
| | 132 |
| | 2 |
| | 132 |
| | 2 |
|
| RMBS | | 270 |
| | 2 |
| | 836 |
| | 23 |
| | 1,106 |
| | 25 |
|
| ABS | | 1,102 |
| | 24 |
| | 382 |
| | 9 |
| | 1,484 |
| | 33 |
|
| CMBS | | 384 |
| | 4 |
| | 415 |
| | 14 |
| | 799 |
| | 18 |
|
| U.S. government | | — |
| | — |
| | 1,086 |
| | 58 |
| | 1,086 |
| | 58 |
|
| State and political subdivisions | | 104 |
| | 2 |
| | 157 |
| | 7 |
| | 261 |
| | 9 |
|
| Other foreign government | | 790 |
| | 25 |
| | 473 |
| | 17 |
| | 1,263 |
| | 42 |
|
| Total investment grade securities | | 11,155 |
| | 359 |
| | 7,093 |
| | 325 |
| | 18,248 |
| | 684 |
|
| Below investment grade securities: | | | | | | | | | | | | |
| Corporate | | 756 |
| | 43 |
| | 123 |
| | 15 |
| | 879 |
| | 58 |
|
| Other foreign government | | 129 |
| | 6 |
| | — |
| | — |
| | 129 |
| | 6 |
|
| Total below investment grade securities | | 885 |
| | 49 |
| | 123 |
| | 15 |
| | 1,008 |
| | 64 |
|
| Total fixed maturity securities | | $ | 12,040 |
| | $ | 408 |
| | $ | 7,216 |
| | $ | 340 |
| | $ | 19,256 |
| | $ | 748 |
|
| | | | | | | | | | | | | | | | | | | | | | | | | | | | | | | | | | | | | | |
| | | Less than 12 months | | 12 months or greater | | Total |
| December 31, 2021: | | Estimated
Fair Value | | Gross
Unrealized
Losses | | Estimated
Fair Value | | Gross
Unrealized
Losses | | Estimated
Fair Value | | Gross
Unrealized
Losses |
| Investment grade securities: | | | | | | | | | | | | |
| Corporate | | $ | 4,135 | | | $ | 86 | | | $ | 946 | | | $ | 51 | | | $ | 5,081 | | | $ | 137 | |
| Canadian government | | 20 | | | 1 | | | — | | | — | | | 20 | | | 1 | |
| RMBS | | 132 | | | 3 | | | 102 | | | 4 | | | 234 | | | 7 | |
| ABS | | 1,747 | | | 22 | | | 589 | | | 6 | | | 2,336 | | | 28 | |
| CMBS | | 152 | | | 2 | | | 35 | | | 2 | | | 187 | | | 4 | |
| U.S. government | | 1,513 | | | 6 | | | 31 | | | 2 | | | 1,544 | | | 8 | |
| State and political subdivisions | | 109 | | | 3 | | | 28 | | | 2 | | | 137 | | | 5 | |
| Other foreign government | | 2,237 | | | 33 | | | 724 | | | 37 | | | 2,961 | | | 70 | |
| Total investment grade securities | | 10,045 | | | 156 | | | 2,455 | | | 104 | | | 12,500 | | | 260 | |
| Below investment grade securities: | | | | | | | | | | | | |
| Corporate | | 463 | | | 13 | | | 97 | | | 44 | | | 560 | | | 57 | |
| | | | | | | | | | | | |
| | | | | | | | | | | | |
| ABS | | — | | | — | | | 13 | | | 13 | | | 13 | | | 13 | |
| | | | | | | | | | | | |
| | | | | | | | | | | | |
| Other foreign government | | 136 | | | 7 | | | 75 | | | 10 | | | 211 | | | 17 | |
| Total below investment grade securities | | 599 | | | 20 | | | 185 | | | 67 | | | 784 | | | 87 | |
| Total fixed maturity securities | | $ | 10,644 | | | $ | 176 | | | $ | 2,640 | | | $ | 171 | | | $ | 13,284 | | | $ | 347 | |
The Company has no intention to sell, nor does it expect to be required to sell, the securities outlined in the tabletables above, as of the dates indicated. However, unforeseen facts and circumstances may cause the Company to sell fixed maturity securities in the ordinary course of managing its portfolio to meet certain diversification, credit quality and liquidity guidelines. Changes in unrealized losses are primarily driven by changes in risk-free interest rates.rates and credit spreads.
In 2021, the Company reclassified approximately $92 million of pre-tax unrealized gains from AOCI to net investment income associated with investments in limited partnerships and private equity funds for which it utilizes the equity method of accounting. The unrealized gains should have been recognized directly in investment income in the same prior periods they were reported by the investees. In addition, the Company recorded approximately $70 million of pre-tax gains in investment related gains (losses), net, associated with investments in limited partnerships considered to be investment companies in order
Net Investment Income Net of Related Expenses
Major categories of net investment income net of related expenses, consist of the following (dollars in millions):
|
| | | | | | | | | | | | |
| | | 2019 | | 2018 | | 2017 |
| Fixed maturity securities available-for-sale | | $ | 1,786 |
| | $ | 1,529 |
| | $ | 1,402 |
|
| Equity securities | | 8 |
| | 4 |
| | 4 |
|
| Mortgage loans on real estate | | 255 |
| | 214 |
| | 198 |
|
| Policy loans | | 58 |
| | 59 |
| | 61 |
|
| Funds withheld at interest | | 297 |
| | 310 |
| | 458 |
|
| Short-term investments and cash and cash equivalents | | 28 |
| | 14 |
| | 7 |
|
| Other invested assets | | 184 |
| | 99 |
| | 106 |
|
| Investment income | | 2,616 |
| | 2,229 |
| | 2,236 |
|
| Investment expense | | (96 | ) | | (90 | ) | | (81 | ) |
| Investment income, net of related expenses | | $ | 2,520 |
| | $ | 2,139 |
| | $ | 2,155 |
|
| | | | | | | | | | | | | | | | | | | | |
| | For the years ended December 31, |
| | 2022 | | 2021 | | 2020 |
| Fixed maturity securities available-for-sale | | $ | 2,305 | | | $ | 2,059 | | | $ | 1,928 | |
| Equity securities | | 6 | | | 5 | | | 6 | |
| Mortgage loans | | 298 | | | 293 | | | 282 | |
| Policy loans | | 54 | | | 55 | | | 56 | |
| Funds withheld at interest | | 253 | | | 351 | | | 279 | |
| Limited partnerships and real estate joint ventures | | 331 | | | 419 | | | 50 | |
| Short-term investments and cash and cash equivalents | | 29 | | | 3 | | | 7 | |
| Other invested assets | | 12 | | | 61 | | | 59 | |
| Investment income | | 3,288 | | | 3,246 | | | 2,667 | |
| Investment expense | | (127) | | | (108) | | | (92) | |
| Net investment income | | $ | 3,161 | | | $ | 3,138 | | | $ | 2,575 | |
Investment Related Gains (Losses), Net
Investment related gains (losses), net, consist of the following (dollars in millions):
|
| | | | | | | | | | | | |
| | | 2019 | | 2018 | | 2017 |
| Fixed maturity securities available for sale: | | | | | | |
| OTTI | | $ | (31 | ) | | $ | (28 | ) | | $ | (43 | ) |
| Gain on investment activity | | 151 |
| | 65 |
| | 111 |
|
| Loss on investment activity | | (50 | ) | | (159 | ) | | (37 | ) |
| Net gains (losses) on equity securities | | 16 |
| | (20 | ) | | (5 | ) |
| Other impairment losses and change in mortgage loan provision | | (12 | ) | | (12 | ) | | (10 | ) |
| Derivatives and other, net | | 17 |
| | (16 | ) | | 152 |
|
| Total investment related gains (losses), net | | $ | 91 |
| | $ | (170 | ) | | $ | 168 |
|
The OTTI on fixed maturity securities for 2019, 2018 and 2017 are primarily due to emerging market and high-yield debt exposures. The fluctuations in investment related gains (losses) for derivatives and other are primarily due to changes in the fair value of embedded derivatives related to modified coinsurance and funds withheld treaties, as a result of changes in interest rates, driven primarily by credit spreads. | | | | | | | | | | | | | | | | | | | | |
| | For the years ended December 31, |
| | 2022 | | 2021 | | 2020 |
| Fixed maturity securities available-for-sale: | | | | | | |
| Change in allowance for credit losses | | $ | (6) | | | $ | (11) | | | $ | (20) | |
| Impairments on fixed maturity securities | | (17) | | | (1) | | | (1) | |
| Realized gains on investment activity | | 192 | | | 299 | | | 114 | |
| Realized losses on investment activity | | (396) | | | (65) | | | (82) | |
| Net gains (losses) on equity securities | | (21) | | | 25 | | | (15) | |
| Change in mortgage loan allowance for credit losses | | (16) | | | 29 | | | (38) | |
| Change in fair value of certain limited partnership investments | | 38 | | | 169 | | | — | |
| Limited partnerships and real estate joint ventures impairment losses | | — | | | — | | | (18) | |
| Other, net | | 21 | | | 25 | | | 24 | |
| Net gains (losses) on derivatives | | (301) | | | 90 | | | 3 | |
| Total investment related gains (losses), net | | $ | (506) | | | $ | 560 | | | $ | (33) | |
As of December 31, 2019 and 2018,2022, the Company held non-income producing securities with amortized costs, net of $47 million and $41allowances, of $87 million and estimated fair values of $51$45 million. As of December 31, 2021, the Company held non-income producing securities with amortized costs, net of allowances, of $26 million and $43 million, respectively.estimated fair values of $26 million. Generally, securities are non-income producing when principal or interest is not paid primarily as a result of bankruptcies or credit defaults, but also include securities where amortization has been discontinued.defaults.
Securities Borrowing, Lending and Repurchase/Reverse Repurchase Agreements
The following table includes the amount of borrowedprovides information relating to securities securities lentborrowing, lending, and securities collateral received as part of the securities lending program, repurchased/repurchase/reverse repurchased securities pledged and received and cash receivedrepurchase agreements as of December 31, 20192022 and 20182021 (dollars in millions):
|
| | | | | | | | | | | | | | | |
| | 2019 | | 2018 |
| | Amortized Cost | | Estimated Fair Value | | Amortized Cost | | Estimated Fair Value |
| Borrowed securities | $ | 339 |
| | $ | 369 |
| | $ | 336 |
| | $ | 367 |
|
| Securities lending: |
|
| |
|
| |
|
| | |
| Securities loaned | 98 |
| | 104 |
| | 102 |
| | 103 |
|
| Securities received | n/a |
| | 107 |
| | n/a |
| | 112 |
|
| Repurchase program/reverse repurchase program: | | | | | | | |
| Securities pledged | 356 |
| | 384 |
| | 554 |
| | 554 |
|
| Securities received | n/a |
| | 370 |
| | n/a |
| | 531 |
|
| | | | | | | | | | | | | | | | | | | | | | | |
| 2022 | | 2021 |
| Amortized
Cost | | Estimated
Fair Value | | Amortized
Cost | | Estimated
Fair Value |
| Securities borrowing agreements: | | | | | | | |
Securities borrowed (1) | n/a | | $ | 852 | | | n/a | | $ | 420 | |
Securities pledged as collateral (2) | 859 | | | 693 | | | 279 | | | 290 | |
| Securities lending agreements: | | | | | | | |
Securities loaned (2) | 59 | | | 55 | | | 94 | | | 102 | |
Securities received as collateral (3) | n/a | | 66 | | | n/a | | 102 | |
| Repurchase/reverse repurchase agreements: | | | | | | | |
Securities sold (2) | 898 | | | 779 | | | 704 | | | 736 | |
Cash (4) | — | | | — | | | 10 | | | 10 | |
Securities purchased (3) | n/a | | 619 | | | n/a | | 728 | |
Cash received (5) | 149 | | | 149 | | | — | | | — | |
| | | | | | | |
The Company also held cash collateral for securities lending and the repurchase program/reverse repurchase programs of $1 million and $29 million as of December 31, 2019 and 2018, respectively. No cash or securities have been pledged by the Company for its securities borrowing program as of December 31, 2019 and 2018.
The following tables present informationSecurities borrowed are not reflected on the Company’s securities lending and repurchase transactions as of December 31, 2019 and 2018, respectively (dollars in millions).condensed consolidated balance sheets. Collateral associated with certain borrowed securities is not included within the tablesthis table as the collateral pledged to eachthe counterparty is the right to reinsurance treaty cash flows.
|
| | | | | | | | | | | | | | | | | | | |
| | December 31, 2019 |
| | Remaining Contractual Maturity of the Agreements |
| | Overnight and Continuous | | Up to 30 Days | | 30-90 Days | | Greater than 90 Days | | Total |
| Securities lending transaction: | | | | | | | | | |
| Corporate | $ | — |
| | $ | — |
| | $ | — |
| | $ | 104 |
| | $ | 104 |
|
| Total | — |
| | — |
| | — |
| | 104 |
| | 104 |
|
| Repurchase transactions: | | | | | | | | | |
| Corporate | — |
| | — |
| | — |
| | 286 |
| | 286 |
|
| U.S. government | — |
| | — |
| | — |
| | — |
| | — |
|
| Foreign government | — |
| | — |
| | — |
| | 98 |
| | 98 |
|
| Total | — |
| | — |
| | — |
| | 384 |
| | 384 |
|
| Total transactions | $ | — |
| | $ | — |
| | $ | — |
| | $ | 488 |
| | $ | 488 |
|
| | | | | | | | | | |
| Gross amount of recognized liabilities for securities lending and repurchase transactions in preceding table | | $ | 478 |
|
| Amounts related to agreements not included in offsetting disclosure | | $ | 10 |
|
(2)Securities loaned, pledged or sold to counterparties are included within fixed maturity securities.
|
| | | | | | | | | | | | | | | | | | | |
| | December 31, 2018 |
| | Remaining Contractual Maturity of the Agreements |
| | Overnight and Continuous | | Up to 30 Days | | 30-90 Days | | Greater than 90 Days | | Total |
| Securities lending transaction: | | | | | | | | | |
| Corporate | $ | — |
| | $ | — |
| | $ | — |
| | $ | 103 |
| | $ | 103 |
|
| Total | — |
| | — |
| | — |
| | 103 |
| | 103 |
|
| Repurchase transactions: | | | | | | | | | |
| Corporate | — |
| | — |
| | — |
| | 254 |
| | $ | 254 |
|
| U.S. government | — |
| | — |
| | — |
| | 221 |
| | 221 |
|
| Foreign government | — |
| | — |
| | — |
| | 79 |
| | 79 |
|
| Total | — |
| | — |
| | — |
| | 554 |
| | 554 |
|
| Total transactions | $ | — |
| | $ | — |
| | $ | — |
| | $ | 657 |
| | $ | 657 |
|
| | | | | | | | | | |
| Gross amount of recognized liabilities for securities lending and repurchase transactions in preceding table | | $ | 671 |
|
| Amounts related to agreements not included in offsetting disclosure | | $ | 14 |
|
(5)A payable for the cash received by the Company is included within other liabilities.
The Company has elected to offset amounts recognized as receivables and payables resulting from the repurchase/reverse repurchase programs. After the effect of offsetting, the net amount presentedfollowing tables present information on the consolidated balance sheets was a liabilityremaining contractual maturity of $1 millionthe Company’s securities lending and $0 millionrepurchase agreements as of December 31, 20192022 and 2018, respectively. As2021, respectively (dollars in millions).
| | | | | | | | | | | | | | | | | | | | | | | | | | | | | |
| December 31, 2022 |
| Remaining Contractual Maturity of the Agreements |
| Overnight and Continuous | | Up to 30 Days | | 30 – 90 Days | | Greater than 90 Days | | Total |
| Securities lending transactions: | | | | | | | | | |
| Corporate | $ | — | | | $ | — | | | $ | — | | | $ | 42 | | | $ | 42 | |
| State and political subdivisions | — | | | — | | | — | | | 3 | | | 3 | |
| Other foreign government | — | | | — | | | — | | | 10 | | | 10 | |
| Total | — | | | — | | | — | | | 55 | | | 55 | |
| Repurchase/reverse repurchase transactions: | | | | | | | | | |
| Corporate | — | | | — | | | — | | | 279 | | | 279 | |
| RMBS | — | | | — | | | — | | | 10 | | | 10 | |
| ABS | — | | | — | | | — | | | 54 | | | 54 | |
| CMBS | — | | | — | | | — | | | 63 | | | 63 | |
| | | | | | | | | |
| | | | | | | | | |
| Other foreign government | — | | | — | | | — | | | 373 | | | 373 | |
| | | | | | | | | |
| | | | | | | | | |
| | | | | | | | | |
| | | | | | | | | |
| Total | — | | | — | | | — | | | 779 | | | 779 | |
| Total transactions | $ | — | | | $ | — | | | $ | — | | | $ | 834 | | | $ | 834 | |
| | | | | | | | | | | | | | | | | | | | | | | | | | | | | |
| December 31, 2021 |
| Remaining Contractual Maturity of the Agreements |
| Overnight and Continuous | | Up to 30 Days | | 30 – 90 Days | | Greater than 90 Days | | Total |
| Securities lending transactions: | | | | | | | | | |
| Corporate | $ | — | | | $ | — | | | $ | — | | | $ | 94 | | | $ | 94 | |
| State and political subdivisions | — | | | — | | | — | | | 3 | | | 3 | |
| Other foreign government | — | | | — | | | — | | | 5 | | | 5 | |
| Total | — | | | — | | | — | | | 102 | | | 102 | |
| Repurchase/reverse repurchase transactions: | | | | | | | | | |
| Corporate | — | | | — | | | — | | | 366 | | | 366 | |
| RMBS | — | | | — | | | — | | | — | | | — | |
| ABS | — | | | — | | | — | | | — | | | — | |
| CMBS | — | | | — | | | — | | | — | | | — | |
| Other foreign government | — | | | — | | | — | | | 370 | | | 370 | |
| | | | | | | | | |
| | | | | | | | | |
| | | | | | | | | |
| | | | | | | | | |
| | | | | | | | | |
| | | | | | | | | |
| Total | — | | | — | | | — | | | 736 | | | 736 | |
| Total transactions | $ | — | | | $ | — | | | $ | — | | | $ | 838 | | | $ | 838 | |
Mortgage Loans on Real Estate
As of December 31, 2019,2022, mortgage loans were geographically dispersed throughout the U.S. with the largest concentrations in California (15.5%(13.3%), Texas (12.5%(11.2%) and Washington (8.4%(7.8%) and include, in addition to loans secured by properties in Canada (3.2%(3.6%) and United Kingdom (1.0%(2.4%). The recorded investment in mortgage loans on real estate presented below is gross of unamortized deferred loan origination fees and expenses, and valuation allowances.
The following table presents the distribution of the Company’s recorded investment in mortgage loans by property type is as follows as of December 31, 20192022 and 20182021 (dollars in millions):
|
| | | | | | | | | | | | | | |
| | | 2019 | | 2018 |
| | | Carrying Value | | Percentage of Total | | Carrying Value | | Percentage of Total |
| Property type: | | | | | | | | |
| Office building | | $ | 1,771 |
| | 31.0 | % | | $ | 1,726 |
| | 34.6 | % |
| Retail | | 1,686 |
| | 29.4 |
| | 1,432 |
| | 28.7 |
|
| Industrial | | 1,169 |
| | 20.4 |
| | 962 |
| | 19.3 |
|
| Apartment | | 766 |
| | 13.4 |
| | 571 |
| | 11.5 |
|
| Other commercial | | 335 |
| | 5.8 |
| | 292 |
| | 5.9 |
|
| Recorded investment | | 5,727 |
| | 100.0 | % | | 4,983 |
| | 100.0 | % |
| Unamortized balance of loan origination fees and expenses | | (9 | ) | | | | (6 | ) | | |
| Valuation allowances | | (12 | ) | | | | (11 | ) | | |
| Total mortgage loans on real estate | | $ | 5,706 |
| |
|
| | $ | 4,966 |
| |
|
|
| | | | | | | | | | | | | | | | | | | | | | | | | | |
| | | 2022 | | 2021 |
| | | Carrying Value | | Percentage of
Total | | Carrying Value | | Percentage of
Total |
| Property type: | | | | | | | | |
| Office | | $ | 1,706 | | | 25.6 | % | | $ | 1,683 | | | 26.6 | % |
| Retail | | 2,290 | | | 34.4 | | | 2,090 | | | 33.0 | |
| Industrial | | 1,518 | | | 22.8 | | | 1,249 | | | 19.7 | |
| Apartment | | 763 | | | 11.5 | | | 801 | | | 12.7 | |
| Other commercial | | 376 | | | 5.7 | | | 506 | | | 8.0 | |
| Recorded investment | | 6,653 | | | 100.0 | % | | 6,329 | | | 100.0 | % |
| Unamortized balance of loan origination fees and expenses | | (12) | | | | | (11) | | | |
| Allowance for credit losses | | (51) | | | | | (35) | | | |
| Total mortgage loans | | $ | 6,590 | | | | | $ | 6,283 | | | |
The following table presents the maturities of the Company’s recorded investment in mortgage loans as of December 31, 20192022 and 2018 are as follows2021 (dollars in millions):
| | | | | | | | | | | | | | | | | | | | | | | | | | |
| | 2022 | | 2021 |
| | Recorded
Investment | | % of Total | | Recorded
Investment | | % of Total |
| Due within five years | | $ | 2,652 | | | 39.9 | % | | $ | 2,660 | | | 42.0 | % |
| Due after five years through ten years | | 2,930 | | | 44.0 | | | 2,593 | | | 41.0 | |
| Due after ten years | | 1,071 | | | 16.1 | | | 1,076 | | | 17.0 | |
| Total | | $ | 6,653 | | | 100.0 | % | | $ | 6,329 | | | 100.0 | % |
|
| | | | | | | | | | | | | | |
| | | 2019 | | 2018 |
| | | Recorded Investment | | % of Total | | Recorded Investment | | % of Total |
| Due within five years | | $ | 1,841 |
| | 32.2 | % | | $ | 1,426 |
| | 28.6 | % |
| Due after five years through ten years | | 2,944 |
| | 51.4 |
| | 2,686 |
| | 53.9 |
|
| Due after ten years | | 942 |
| | 16.4 |
| | 871 |
| | 17.5 |
|
| Total | | $ | 5,727 |
| | 100.0 | % | | $ | 4,983 |
| | 100.0 | % |
The following tables set forth certain key credit quality indicators of the Company’s recorded investment in mortgage loans as of December 31, 20192022 and 20182021 (dollars in millions):
| | | | | | | | | | | | | | | | | | | | | | | | | | | | | | | | | | | |
| Recorded Investment |
| Debt Service Ratios | | Construction loans | | | | |
| >1.20x | | 1.00x – 1.20x | | <1.00x | | | Total | | % of Total |
| December 31, 2022: | | | | | | | | | | | |
| Loan-to-Value Ratio | | | | | | | | | | | |
| 0% – 59.99% | $ | 3,466 | | | $ | 215 | | | $ | 56 | | | $ | 18 | | | $ | 3,755 | | | 56.4 | % |
| 60% – 69.99% | 1,894 | | | 119 | | | 71 | | | — | | | 2,084 | | | 31.3 | |
| 70% – 79.99% | 475 | | | 49 | | | 91 | | | — | | | 615 | | | 9.3 | |
| 80% or greater | 81 | | | — | | | 118 | | | — | | | 199 | | | 3.0 | |
| Total | $ | 5,916 | | | $ | 383 | | | $ | 336 | | | $ | 18 | | | $ | 6,653 | | | 100.0 | % |
|
| | | | | | | | | | | | | | | | | | | | | | |
| | Recorded Investment |
| | Debt Service Ratios | | Construction loans | | | | |
| | >1.20x | | 1.00x - 1.20x | | <1.00x | | | Total | | % of Total |
| December 31, 2019: | | | | | | | | | | |
|
| Loan-to-Value Ratio | | | | | | | | | | |
|
| 0% - 59.99% | $ | 3,025 |
| | $ | 52 |
| | $ | 7 |
| | $ | — |
| | $ | 3,084 |
| | 53.8 | % |
| 60% - 69.99% | 1,841 |
| | 53 |
| | 11 |
| | — |
| | 1,905 |
| | 33.3 |
|
| 70% - 79.99% | 492 |
| | 13 |
| | 39 |
| | — |
| | 544 |
| | 9.5 |
|
| Greater than 80% | 96 |
| | 61 |
| | 37 |
| | — |
| | 194 |
| | 3.4 |
|
| Total | $ | 5,454 |
| | $ | 179 |
| | $ | 94 |
| | $ | — |
| | $ | 5,727 |
| | 100.0 | % |
| | | | | | | | | | | | | | | | | | | | | | | | | | | | | | | | | | | |
| Recorded Investment |
| Debt Service Ratios | | Construction loans | | | | |
| >1.20x | | 1.00x – 1.20x | | <1.00x | | | Total | | % of Total |
| December 31, 2021: | | | | | | | | | | | |
| Loan-to-Value Ratio | | | | | | | | | | | |
| 0% – 59.99% | $ | 3,111 | | | $ | 238 | | | $ | 51 | | | $ | 6 | | | $ | 3,406 | | | 53.8 | % |
| 60% – 69.99% | 1,906 | | | 190 | | | 46 | | | — | | | 2,142 | | | 33.8 | |
| 70% – 79.99% | 520 | | | 41 | | | 12 | | | — | | | 573 | | | 9.1 | |
| 80% or greater | 148 | | | — | | | 60 | | | — | | | 208 | | | 3.3 | |
| Total | $ | 5,685 | | | $ | 469 | | | $ | 169 | | | $ | 6 | | | $ | 6,329 | | | 100.0 | % |
|
| | | | | | | | | | | | | | | | | | | | | | |
| | Recorded Investment |
| | Debt Service Ratios | | Construction loans | | | | |
| | >1.20x | | 1.00x - 1.20x | | <1.00x | | | Total | | % of Total |
| December 31, 2018: | | | | | | | | | | | |
| Loan-to-Value Ratio | | | | | | | | | | |
|
| 0% - 59.99% | $ | 2,411 |
| | $ | 61 |
| | $ | 38 |
| | $ | 14 |
| | $ | 2,524 |
| | 50.6 | % |
| 60% - 69.99% | 1,618 |
| | 74 |
| | 38 |
| | 19 |
| | 1,749 |
| | 35.1 |
|
| 70% - 79.99% | 414 |
| | 48 |
| | 54 |
| | — |
| | 516 |
| | 10.4 |
|
| Greater than 80% | 118 |
| | 50 |
| | 26 |
| | — |
| | 194 |
| | 3.9 |
|
| Total | $ | 4,561 |
| | $ | 233 |
| | $ | 156 |
| | $ | 33 |
| | $ | 4,983 |
| | 100.0 | % |
NoneThe following table sets forth credit quality grades by year of origination of the payments due to the Company on itsCompany’s recorded investment in mortgage loans were delinquent as of December 31, 20192022 and 2018.2021 (dollars in millions):
| | | | | | | | | | | | | | | | | | | | | | | | | | | | | | | | | | | | | | | | | |
| Recorded Investment |
| Year of Origination | | |
| December 31, 2022: | 2022 | | 2021 | | 2020 | | 2019 | | 2018 | | Prior | | Total |
| Internal credit quality grade: | | | | | | | | | | | | | |
| High investment grade | $ | 698 | | | $ | 684 | | | $ | 327 | | | $ | 561 | | | $ | 422 | | | $ | 1,565 | | | $ | 4,257 | |
| Investment grade | 586 | | | 284 | | | 248 | | | 279 | | | 252 | | | 531 | | | 2,180 | |
| Average | — | | | 6 | | | — | | | 39 | | | 52 | | | 83 | | | 180 | |
| Watch list | — | | | — | | | — | | | — | | | — | | | — | | | — | |
| In or near default | — | | | — | | | — | | | — | | | — | | | 36 | | | 36 | |
| Total | $ | 1,284 | | | $ | 974 | | | $ | 575 | | | $ | 879 | | | $ | 726 | | | $ | 2,215 | | | $ | 6,653 | |
| | | | | | | | | | | | | | | | | | | | | | | | | | | | | | | | | | | | | | | | | |
| Recorded Investment |
| Year of Origination | | |
| December 31, 2021: | 2021 | | 2020 | | 2019 | | 2018 | | 2017 | | Prior | | Total |
| Internal credit quality grade: | | | | | | | | | | | | | |
| High investment grade | $ | 725 | | | $ | 402 | | | $ | 645 | | | $ | 461 | | | $ | 344 | | | $ | 1,534 | | | $ | 4,111 | |
| Investment grade | 367 | | | 272 | | | 331 | | | 301 | | | 296 | | | 502 | | | 2,069 | |
| Average | 6 | | | — | | | 27 | | | 39 | | | 5 | | | 32 | | | 109 | |
| Watch list | — | | | — | | | — | | | — | | | — | | | 4 | | | 4 | |
| In or near default | — | | | — | | | — | | | — | | | — | | | 36 | | | 36 | |
| Total | $ | 1,098 | | | $ | 674 | | | $ | 1,003 | | | $ | 801 | | | $ | 645 | | | $ | 2,108 | | | $ | 6,329 | |
The following table presents the current and past due composition of the Company’s recorded investment in mortgage loans by method of measuring impairment, and the related valuation allowances, as of December 31, 20192022 and 20182021 (dollars in millions):
|
| | | | | | | | |
| | | 2019 | | 2018 |
| Mortgage loans: | | | | |
| Individually measured for impairment | | $ | 17 |
| | $ | 31 |
|
| Collectively measured for impairment | | 5,710 |
| | 4,952 |
|
| Recorded investment | | $ | 5,727 |
| | $ | 4,983 |
|
| Valuation allowances: | | | | |
| Individually measured for impairment | | $ | — |
| | $ | — |
|
| Collectively measured for impairment | | 12 |
| | 11 |
|
| Total valuation allowances | | $ | 12 |
| | $ | 11 |
|
| | | | | | | | | | | | | | |
| | | 2022 | | 2021 |
| Current | | $ | 6,617 | | | $ | 6,329 | |
| | | | |
| | | | |
| Greater than 90 days | | 36 | | | — | |
| | | | |
| Total | | $ | 6,653 | | | $ | 6,329 | |
InformationThe following table presents information regarding the Company’s loan valuation allowancesallowance for credit losses for mortgage loans as of December 31, 2019, 20182022, 2021 and 2017 are as follows2020 (dollars in millions):
|
| | | | | | | | | | | | |
| | | 2019 | | 2018 | | 2017 |
| Balance, beginning of period | | $ | 11 |
| | $ | 9 |
| | $ | 8 |
|
| Provision | | 1 |
| | 2 |
| | 1 |
|
| Balance, end of period | | $ | 12 |
| | $ | 11 |
| | $ | 9 |
|
| | | | | | | | | | | | | | | | | | | | |
| | 2022 | | 2021 | | 2020 |
| Balance, beginning of period | | $ | 35 | | | $ | 64 | | | $ | 12 | |
| Adoption of new accounting standard | | — | | | — | | | 14 | |
| Change in allowance for credit losses | | 16 | | | (29) | | | 38 | |
| | | | | | |
| Balance, end of period | | $ | 51 | | | $ | 35 | | | $ | 64 | |
Information regardingDuring the portion ofyear ended December 31, 2022, the Company’sCompany restructured three mortgage loans that were impairedto interest only payments as a result of lower occupancy levels, one of which was paid in full as of December 31, 2019 and 2018 is as follows (dollars in millions):
|
| | | | | | | | | | | | | | | | |
| | | Unpaid Principal Balance | | Recorded Investment | | Related Allowance | | Carrying Value |
| December 31, 2019: | | | | | | |
| Impaired mortgage loans with no valuation allowance recorded | | $ | 17 |
| | $ | 17 |
| | $ | — |
| | $ | 17 |
|
| Impaired mortgage loans with valuation allowance recorded | | — |
| | — |
| | — |
| | — |
|
| Total impaired mortgage loans | | $ | 17 |
| | $ | 17 |
| | $ | — |
| | $ | 17 |
|
| December 31, 2018: | | | | | | | | |
| Impaired mortgage loans with no valuation allowance recorded | | $ | 31 |
| | $ | 31 |
| | $ | — |
| | $ | 31 |
|
| Impaired mortgage loans with valuation allowance recorded | | — |
| | — |
| | — |
| | — |
|
| Total impaired mortgage loans | | $ | 31 |
| | $ | 31 |
| | $ | — |
| | $ | 31 |
|
2022. The Company’s averagetotal recorded investment balance of impairedbefore allowance for credit losses for mortgage loans, which were modified and met the related interest income are reflected incriteria of Troubled Debt Restructuring (“TDR”), is $67 million as of December 31, 2022. During the table below for the yearsyear ended December 31, 2019, 2018 and 2017 (dollars in millions):
|
| | | | | | | | | | | | | | | | | | | | | | | | |
| | | 2019 | | 2018 | | 2017 |
| | | Average Investment(1) | | Interest Income | | Average Investment(1) | | Interest Income | | Average Investment(1) | | Interest Income |
| Impaired mortgage loans with no valuation allowance recorded | | $ | 20 |
| | $ | 1 |
| | $ | 24 |
| | $ | 1 |
| | $ | 4 |
| | $ | — |
|
| Impaired mortgage loans with valuation allowance recorded | | — |
| | — |
| | — |
| | — |
| | — |
| | — |
|
| Total | | $ | 20 |
| | $ | 1 |
| | $ | 24 |
| | $ | 1 |
| | $ | 4 |
| | $ | — |
|
| |
(1) | Average recorded investment represents2021, the average loan balances as of the beginning of period and all subsequent quarterly end of period balances. |
The Company did not acquirehave any impairedsignificant loans that were modified and met the criteria of a TDR. The Company has two mortgage loans duringin the years endedaggregate amount of $36 million that were on a nonaccrual status as of December 31, 2019 and 2018.2022. The Company had no mortgage loans that were on a nonaccrual status as of December 31, 20192021. The Company did not acquire any impaired mortgage loans during the years ended December 31, 2022 and 2018.2021.
Policy Loans
The majority of policy loans are associated with one client. These policy loans present no credit risk as the amount of the loan cannot exceed the obligation due to the ceding company upon the death of the insured or surrender of the underlying policy. The provisions of the treaties in force and the underlying policies determine the policy loan interest rates. The Company earns a spread between the interest rate earned on policy loans and the interest rate credited to corresponding liabilities.
Funds Withheld at Interest
As of December 31, 2019, $3.52022, $3.8 billion of the funds withheld at interest balance is primarily associated with one client.two clients. For reinsurance agreements written on a modco basis and certain agreements written on a coinsurance funds withheld basis, assets equal to the
net statutory reserves are withheld and legally owned and managed by the ceding company and are reflected as funds withheld at interest on the Company’s consolidated balance sheets.interest. In the event of a ceding company’s insolvency, the Company would need to assert a claim on the assets supporting its reserve liabilities. However, the risk of loss to the Company is mitigated by its ability to offset amounts it owes the ceding company for claims or allowances against amounts owed to the Company from the ceding company.
Limited Partnerships and Real Estate Joint Ventures
The carrying values of limited partnerships and real estate joint ventures as of December 31, 2022 and 2021 are as follows (dollars in millions):
| | | | | | | | | | | | | | |
| | | 2022 | | 2021 |
| Limited partnerships - equity method | | $ | 934 | | | $ | 780 | |
| Limited partnerships - fair value | | 683 | | | 581 | |
| Limited partnerships - cost method | | 49 | | | 63 | |
| Real estate joint ventures | | 661 | | | 572 | |
| Total limited partnerships and real estate joint ventures | | $ | 2,327 | | | $ | 1,996 | |
Other Invested Assets
Other invested assets include limited partnership interests, joint ventures (other than operating joint ventures), lifetime mortgages and derivative contracts and fair value option (“FVO”) contractholder-directed unit-linked investments.contracts. Other invested assets also includeincludes FHLB common stock and unit-linked investments, which isare included in Other“Other” in the table below. CarryingAs of December 31, 2022 and 2021, the allowance for credit losses for lifetime mortgages was not material. The carrying values of theseother invested assets as of December 31, 20192022 and 20182021 are as follows (dollars in millions):
|
| | | | | | | | |
| | | 2019 | | 2018 |
| Limited partnership interests and real estate joint ventures | | $ | 1,134 |
| | $ | 965 |
|
| Lifetime mortgages | | 775 |
| | 476 |
|
| Derivatives | | 117 |
| | 180 |
|
| FVO contractholder-directed unit-linked investments | | 260 |
| | 198 |
|
| Other | | 77 |
| | 96 |
|
| Total other invested assets | | $ | 2,363 |
| | $ | 1,915 |
|
114
| | | | | | | | | | | | | | |
| | | 2022 | | 2021 |
| Lifetime mortgages | | 868 | | | 758 | |
| Derivatives | | 170 | | | 175 | |
| Other | | 102 | | | 141 | |
| Total other invested assets | | $ | 1,140 | | | $ | 1,074 | |
Note 5 DERIVATIVE INSTRUMENTS
Accounting for Derivative Instruments and Hedging Activities
See Note 2 – “Significant Accounting Policies and Pronouncements” for a detailed discussion of the accounting treatment for derivative instruments, including embedded derivatives andderivatives. See Note 6 – “Fair Value of Assets and Liabilities” for additional disclosures related to the fair value hierarchy for derivative instruments, including embedded derivatives.
Types of Derivatives Used by the Company
Credit Derivatives
The Company sells protection under single name credit default swaps and credit default swap index tranches, as well as other credit derivatives, to diversify its credit risk exposure in certain portfolios and, in combination with purchasing securities, to replicate characteristics of similar investments based on the credit quality and term of the credit default swap. Credit default triggers for indexed reference entities and single name reference entities are defined in the contracts. The Company’s maximum exposure to credit loss equals the notional value for credit default swaps. In the event of default of a referencing entity, the Company is typically required to pay the protection holder the full notional value less a recovery amount determined at auction.
The Company also purchasesuses credit default swaps to reduce its risk against a drop in bond prices due to credit concerns of certain bond issuers. If a credit event, as defined by the contract, occurs, the Company is able to put the bond back to the counterparty at par.which do not qualify for hedge accounting treatment.
Equity Derivatives
Exchange-traded equity futures are used primarily to economically hedge liabilities embedded in certain variable annuity products. With exchange-traded equity futures transactions, the Company agrees to purchase or sell a specified number of contracts, the value of which is determined by the relevant stock indices, and to postindices. The Company posts variation margin on a daily basis in an amount equal to the difference between the daily estimated fair values of those contracts. The Company enters into exchange-traded equity futures with regulated futures commission merchants that are members of the exchange. The Company uses exchange-traded futures which do not qualify for hedge accounting treatment.
Equity index options are used by the Company primarily to hedge minimum guarantees embedded in certain variable annuity products. To hedge against adverse changes in equity indices, volatility, the Company buys put options. The contracts are net settled in cash based on differentials in the indices at the time of exercise and the strike price. The Company uses equity index options which do not qualify for hedge accounting treatment.
Foreign Currency Derivatives
Foreign currency swaps are used by the Company to reduce the risk from fluctuations in foreign currency exchange rates associated with its assets and liabilities denominated in foreign currencies. With a foreign currency swap transaction, the Company agrees with another party to exchange, at specified intervals, the difference between one currency and another at a forward exchange rate calculated by reference to an agreed upon principal amount. The principal amount of each currency is exchanged at the termination of the currency swap by each party. The Company uses foreign currency swaps in hedges of net investments in foreign operations, andcash flow hedges, fair value hedges.
Foreign currency forwards are used by the Company to reduce the risk from fluctuations in foreign currency exchange rates associated with its assets and liabilities denominated in foreign currencies. With a foreign currency forward transaction, the Company agrees with another party to deliver a specified amount of an identified currency at a specified future date. The price is agreed upon at the time of the contract and payment for such a contract is made in a different currency at the specified future date. The Company uses foreign currency forwards in hedges of net investments in foreign operations and non-qualifying hedgehedging relationships.
Interest Rate Derivatives
Interest rate swaps are used by the Company primarily to reduce market risks from changes in interest rates, to alter interest rate exposure arising from mismatches between assets and liabilities (duration mismatches) and to manage the risk of cash flows of liabilities that are variable based on a benchmark rate. With an interest rate swap, the Company agrees with another party to exchange, at specified intervals, the difference between two rates, which can be either fixed-rate or floating-rate interest amounts, tied to an agreed-upon notional principal amount. These transactions are executed pursuant to master agreements that provide for a single net payment or individual gross payments at each due date. The Company utilizesuses interest rate swaps in cash flow and non-qualifying hedging relationships.
Interest rate options include swaptions that are used by the Company to hedge interest rate risk associated with the Company’s long-term liabilities and invested assets. A swaption is an option to enter a swap with a forward starting effective date. The Company pays a premium for purchased swaptions. The Company uses swaptions which do not qualify for hedge accounting treatment.
Total return swaps are used by the Company to exchange, at specified intervals, the difference between the economic risk and calculated rate of return of an asset or a market index and a benchmark interest rate, calculated by reference to an agreed notional amount. No cash is exchanged at the outset of the contract. Cash is paid and received over the life of the contract based on the terms of the swap. These transactions are entered into pursuant to master agreements that provide for a single net payment to be made by the counterparty at each due date. Total return swaps are used by the Company to reduce market risks from changes in interest rates and to alter interest rate exposure arising from mismatches between assets and liabilities (duration mismatches). The Company uses total return swaps which do not qualify for hedge accounting treatment.
Forward bond purchase commitments are used by the Company to hedge against the variability in the anticipated cash flows required to purchase securities. With forward bond purchase commitments, the forward price is agreed upon at the time of the contract and payment for such contract is made at the future specified settlement date of the securities. The Company uses forward bond purchase commitments in cash flow hedges.
Other Derivatives
Consumer price index (“CPI”) swaps are used by the Company primarily to economically hedge liabilities embedded in certain insurance products where value is directly affected by changes in a designated benchmark consumer price index. With a CPI swap transaction, the Company agrees with another party to exchange the actual amount of inflation realized over a specified period of time for a fixed amount of inflation determined at inception. These transactions are executed pursuant to master agreements that provide for a single net payment or individual gross payments to be made by the counterparty at each due date. Most of these swaps will require a single payment to be made by one counterparty at the maturity date of the swap.
The Company has entered into longevity swaps in the form of out-of-the-money options, which provide protection against changes in mortality improvement to retirement plans and insurers of such plans. With a longevity swap transaction, the Company agrees with another party to exchange a proportion of a notional value. The proportion is determined by the difference between a predefined benefit, and the realized benefit plus the future expected benefit, calculated by reference to a population index for a fixed premium.
Mortality swaps have been used by the Company to hedge risk from changes in mortality experience associated with its reinsurance of life insurance risk. The Company agrees with another party to exchange, at specified intervals, a proportion of a notional value determined by the difference between a predefined expected and realized claim amount on a designated index of reinsured lives, for a fixed percentage (premium) each term.
The Company sells fee-based synthetic guaranteed investment contracts (“GICs”) to retirement plans that include investment-only, stable value contracts. The assets are owned by the trustees of such plans, who invest the assets under the terms of investment guidelines to which the Company agrees. The contracts contain a guarantee of a minimum rate of return on participant balances supported by the underlying assets, and a guarantee of liquidity to meet certain participant-initiated plan cash flow requirements. These contracts are reported as derivatives and recorded at fair value.
The Company has certain embedded derivatives that are required to be separated from their host contracts and reported as derivatives. Host contracts include reinsurance treaties structured on a modco or funds withheld basis. Additionally, the Company reinsures equity-indexed annuity and variable annuity contracts with benefits that are considered embedded derivatives, including guaranteed minimum withdrawal benefits, guaranteed minimum accumulation benefits, and guaranteed minimum income benefits. The changes in fair values of embedded derivatives on equity-indexed annuities described below relate to changes in the fair value associated with capital market and other related assumptions. The Company’s utilization of a credit valuation adjustment did not have a material effect on the change in fair value of its embedded derivatives for the years ended December 31, 2019, 2018 and 2017.
Summary of Derivative Positions
Derivatives, except for embedded derivatives, and longevity and mortality swaps, are carried on the Company’s consolidated balance sheetsincluded in other invested assets or other liabilities, at fair value. Longevity and mortality swaps are included on the consolidated balance sheets in other assets or other liabilities, at fair value. Embedded derivative assets and liabilities on modco or funds withheld arrangements are included on the consolidated balance sheets with the host contract in funds withheld at interest or other liabilities, at fair value. Embedded derivative liabilities on indexed annuity and variable annuity products are included on the consolidated balance sheets with the host contract in interest-sensitive contract liabilities, at fair value. The following table presents the notional amounts and gross fair value of derivative instruments prior to taking into account the netting effects of master netting agreements as of December 31, 20192022 and 20182021 (dollars in millions):
| | | | | | | | | | | | | | | | | | | | | | | | | | | | | | | | | | | | | | | | | | | | |
| | | | | December 31, 2022 | | December 31, 2021 |
| | | Primary Underlying Risk | | Notional | | Carrying Value/Fair Value | | Notional | | Carrying Value/Fair Value |
| | | | Amount | | Assets | | Liabilities | | Amount | | Assets | | Liabilities |
| Derivatives not designated as hedging instruments: | | | | | | | | | | | | | | |
| Interest rate swaps | | Interest rate | | $ | 1,271 | | | $ | 2 | | | $ | 2 | | | $ | 1,273 | | | $ | 66 | | | $ | 1 | |
| Interest rate options | | Interest rate | | 7,756 | | | 34 | | | — | | | — | | | — | | | — | |
| Total return swaps | | Interest rate | | 500 | | | 18 | | | — | | | — | | | — | | | — | |
| Financial futures | | Equity | | 260 | | | — | | | — | | | 240 | | | — | | | — | |
| Foreign currency swaps | | Foreign currency | | 150 | | | 18 | | | — | | | 150 | | | 1 | | | — | |
| Foreign currency forwards | | Foreign currency | | 766 | | | 50 | | | — | | | 395 | | | 2 | | | 4 | |
| CPI swaps | | CPI | | 496 | | | 20 | | | 3 | | | 563 | | | 34 | | | 7 | |
| Credit default swaps | | Credit | | 1,523 | | | 2 | | | 21 | | | 1,321 | | | 29 | | | 1 | |
| Equity options | | Equity | | 358 | | | 38 | | | — | | | 472 | | | 29 | | | — | |
| Synthetic GICs | | Interest rate | | 17,411 | | | — | | | — | | | 16,143 | | | — | | | — | |
| Embedded derivatives in: | | | | | | | | | | | | | | |
| Modco or funds withheld arrangements | | | | — | | | 363 | | | 371 | | | — | | | 227 | | | 62 | |
| Indexed annuity products | | | | — | | | — | | | 530 | | | — | | | — | | | 693 | |
| Variable annuity products | | | | — | | | — | | | 124 | | | — | | | — | | | 162 | |
| Total non-hedging derivatives | | | | 30,491 | | | 545 | | | 1,051 | | | 20,557 | | | 388 | | | 930 | |
| Derivatives designated as hedging instruments: | | | | | | | | | | | | | | |
| Interest rate swaps | | Foreign currency/interest rate | | 1,310 | | | 3 | | | 113 | | | 941 | | | 4 | | | 33 | |
| Foreign currency swaps | | Foreign currency | | 114 | | | — | | | — | | | 153 | | | 1 | | | — | |
| Foreign currency forwards | | Foreign currency | | 1,019 | | | 38 | | | 1 | | | 1,320 | | | 14 | | | 11 | |
| Forward bond purchase commitments | | Interest rate | | 407 | | | — | | | 96 | | | 545 | | | 14 | | | 1 | |
| Total hedging derivatives | | | | 2,850 | | | 41 | | | 210 | | | 2,959 | | | 33 | | | 45 | |
| Total derivatives | | | | $ | 33,341 | | | $ | 586 | | | $ | 1,261 | | | $ | 23,516 | | | $ | 421 | | | $ | 975 | |
|
| | | | | | | | | | | | | | | | | | | | | | | | | | |
| | | | | December 31, 2019 | | December 31, 2018 |
| | | Primary Underlying Risk | | Notional | | Carrying Value/Fair Value | | Notional | | Carrying Value/Fair Value |
| | | | Amount | | Assets | | Liabilities | | Amount | | Assets | | Liabilities |
| Derivatives not designated as hedging instruments: | | | | | | | | | | | | | | |
| Interest rate swaps | | Interest rate | | $ | 909 |
| | $ | 70 |
| | $ | 3 |
| | $ | 1,041 |
| | $ | 47 |
| | $ | 1 |
|
| Financial futures | | Equity | | 307 |
| | — |
| | — |
| | 326 |
| | — |
| | — |
|
| Foreign currency swaps | | Foreign currency | | 150 |
| | — |
| | 9 |
| | 150 |
| | 1 |
| | 5 |
|
| Foreign currency forwards | | Foreign currency | | 175 |
| | 1 |
| | — |
| | 25 |
| | — |
| | — |
|
| CPI swaps | | CPI | | 441 |
| | — |
| | 28 |
| | 386 |
| | — |
| | 11 |
|
| Credit default swaps | | Credit | | 1,306 |
| | 5 |
| | — |
| | 1,338 |
| | 6 |
| | 1 |
|
| Equity options | | Equity | | 364 |
| | 15 |
| | — |
| | 439 |
| | 43 |
| | — |
|
| Longevity swaps | | Longevity | | — |
| | — |
| | — |
| | 917 |
| | 48 |
| | — |
|
| Mortality swaps | | Mortality | | — |
| | — |
| | — |
| | 25 |
| | — |
| | — |
|
| Synthetic GICs | | Interest rate | | 13,823 |
| | — |
| | — |
| | 13,397 |
| | — |
| | — |
|
| Embedded derivatives in: | | | | | | | | | | | | | | |
| Modco or funds withheld arrangements | | | | — |
| | 121 |
| | — |
| | — |
| | 110 |
| | — |
|
| Indexed annuity products | | | | — |
| | — |
| | 767 |
| | — |
| | — |
| | 777 |
|
| Variable annuity products | | | | — |
| | — |
| | 163 |
| | — |
| | — |
| | 168 |
|
| Total non-hedging derivatives | | | | 17,475 |
| | 212 |
| | 970 |
| | 18,044 |
| | 255 |
| | 963 |
|
| Derivatives designated as hedging instruments: | | | | | | | | | | | | | | |
| Interest rate swaps | | Foreign currency/Interest rate | | 535 |
| | 1 |
| | 29 |
| | 435 |
| | — |
| | 27 |
|
| Foreign currency swaps | | Foreign currency | | 342 |
| | 17 |
| | 2 |
| | 495 |
| | 51 |
| | — |
|
| Foreign currency forwards | | Foreign currency | | 1,094 |
| | 28 |
| | 2 |
| | 911 |
| | 51 |
| | — |
|
| Total hedging derivatives | | | | 1,971 |
| | 46 |
| | 33 |
| | 1,841 |
| | 102 |
| | 27 |
|
| Total derivatives | | | | $ | 19,446 |
| | $ | 258 |
| | $ | 1,003 |
| | $ | 19,885 |
| | $ | 357 |
| | $ | 990 |
|
Fair Value Hedges
The Company designates and reports certain foreign currency swaps to hedge the foreign currency fair value exposure of foreign currency denominated assets as fair value hedges when they meet the requirements of the general accounting principles for Derivatives and Hedging. The gain or loss on the hedged item attributable to a change in foreign currency and the offsetting gain or loss on the related foreign currency swaps as offor the years ended December 31, 2019, 20182022, 2021 and 20172020 were as follows (dollars in millions):
|
| | | | | | | | | | |
| Type of Fair Value Hedge | | Hedged Item | | Gains (Losses) Recognized for Derivatives | | Gains (Losses) Recognized for Hedged Items |
| | | | | Investment Related Gains (Losses) |
| For the Year Ended December 31, 2019: |
| Foreign currency swaps | | Foreign-denominated fixed maturity securities | | $ | (4 | ) | | $ | — |
|
| For the Year Ended December 31, 2018: |
| Foreign currency swaps | | Foreign-denominated fixed maturity securities | | $ | (11 | ) | | $ | 12 |
|
| For the Year Ended December 31, 2017: |
| Foreign currency swaps | | Foreign-denominated fixed maturity securities | | $ | 9 |
| | $ | (9 | ) |
| | | | | | | | | | | | | | | | | | | | |
| Type of Fair Value Hedge | | Hedged Item | | Gains (Losses) Recognized for Derivatives | | Gains (Losses) Recognized for Hedged Items |
| | | | Investment Related Gains (Losses) |
| For the Year Ended December 31, 2022: |
| Foreign currency swaps | | Foreign-denominated fixed maturity securities | | $ | (1) | | | $ | 7 | |
| For the Year Ended December 31, 2021: |
| Foreign currency swaps | | Foreign-denominated fixed maturity securities | | $ | (4) | | | $ | 6 | |
| For the Year Ended December 31, 2020: |
| Foreign currency swaps | | Foreign-denominated fixed maturity securities | | $ | 8 | | | $ | (10) | |
Cash Flow Hedges
Certain derivative instruments are designated as cash flow hedges when they meet the requirements of the general accounting principles for Derivatives and Hedging. The Company designates and accounts for the following as cash flows:flow hedges: (i) certain interest rate swaps, in which the cash flows of assets and liabilities are variable based on a benchmark rate; (ii) certain interest rate swaps, in which the cash flows of assets are denominated in different currencies, commonly referred to as cross-currency swaps; and (iii) forward bond purchase commitments.
The following table presents the components of AOCI, before income tax, and the consolidated income statement classification where the gain or loss is recognized related to cash flow hedges for the years ended December 31, 2019, 20182022, 2021 and 20172020 (dollars in millions):
|
| | | | |
| | | Amounts Included in AOCI |
| Balance December 31, 2016 | | $ | (2 | ) |
| Gains (losses) deferred in other comprehensive income (loss) | | 6 |
|
| Amounts reclassified to investment related (gains) losses, net | | (1 | ) |
| Amounts reclassified to investment income | | — |
|
| Amounts reclassified to interest expense | | — |
|
| Balance December 31, 2017 | | 3 |
|
| Gains (losses) deferred in other comprehensive income (loss) | | 6 |
|
| Amounts reclassified to investment income | | — |
|
| Amounts reclassified to interest expense | | — |
|
| Balance December 31, 2018 | | 9 |
|
| Gains (losses) deferred in other comprehensive income (loss) | | (34 | ) |
| Amounts reclassified to investment income | | — |
|
| Amounts reclassified to interest expense | | (1 | ) |
| Balance December 31, 2019 | | $ | (26 | ) |
| | | | | | | | |
| | Amounts Included in AOCI |
| Balance December 31, 2019 | | $ | (26) | |
| Gains (losses), net deferred in other comprehensive income (loss) | | (27) | |
| | |
| Amounts reclassified to net investment income | | — | |
| Amounts reclassified to interest expense | | 4 | |
| Balance December 31, 2020 | | (49) | |
| Gains (losses), net deferred in other comprehensive income (loss) | | 20 | |
| | |
| Amounts reclassified to net investment income | | — | |
| Amounts reclassified to interest expense | | 7 | |
| Balance December 31, 2021 | | (22) | |
| Gains (losses), net deferred in other comprehensive income (loss) | | (192) | |
| | |
| Amounts reclassified to net investment income | | 8 | |
| Amounts reclassified to interest expense | | 1 | |
| Balance December 31, 2022 | | $ | (205) | |
As of December 31, 2019, there are no material amounts2022, approximately $10 million of before-tax deferred net gains on derivative instruments recorded in AOCI that are expected to be reclassified to earningsinterest income during the next twelve months. As of December 31, 2022, approximately $1 million of before-tax deferred net losses on derivative instruments recorded in AOCI are expected to be reclassified to interest expense during the next twelve months.
The following table presents the effect of derivatives in cash flow hedging relationships on the consolidated statements of income and the consolidated statements of stockholders’ equity for the years ended December 31, 2019, 20182022, 2021 and 20172020 (dollars in millions):
|
| | | | | | | | | | | | | | | | |
| Derivative Type | | Gains (Losses) Deferred in OCI | | Gains (Losses) Reclassified into Income from OCI |
| For the year ended December 31, 2019: | | | | Investment Related Gains (Losses) | | Investment Income | | Interest Expense |
| Interest rate | | $ | (32 | ) | | $ | — |
| | $ | — |
| | $ | 1 |
|
| Foreign currency/Interest rate | | (2 | ) | | — |
| | — |
| | — |
|
| Forward bond purchase commitments | | — |
| | — |
| | — |
| | — |
|
| Total | | $ | (34 | ) | | $ | — |
| | $ | — |
| | $ | 1 |
|
| | | | | | | | | |
| For the year ended December 31, 2018: | | | | | | | | |
| Interest rate | | $ | 12 |
| | $ | — |
| | $ | — |
| | $ | — |
|
| Foreign currency/Interest rate | | (6 | ) | | — |
| | — |
| | — |
|
| Forward bond purchase commitments | | — |
| | — |
| | — |
| | — |
|
| Total | | $ | 6 |
| | $ | — |
| | $ | — |
| | $ | — |
|
| | | | | | | | | |
| For the year ended December 31, 2017: | | | | | | | | |
| Interest rate | | $ | (6 | ) | | $ | — |
| | $ | — |
| | $ | — |
|
| Foreign currency/Interest rate | | 12 |
| | — |
| | — |
| | — |
|
| Forward bond purchase commitments | | — |
| | 1 |
| | — |
| | — |
|
| Total | | $ | 6 |
| | $ | 1 |
| | $ | — |
| | $ | — |
|
| | | | | | | | | | | | | | | | | | | | | | | | | | |
| Derivative Type | | Gains (Losses) Deferred in OCI | | Gains (Losses) Reclassified into Income from AOCI |
| For the year ended December 31, 2022: | | | | Investment Related Gains (Losses) | | Investment Income | | Interest Expense |
| Interest rate | | $ | (187) | | | $ | — | | | $ | — | | | $ | (1) | |
| Foreign currency/interest rate | | (5) | | | — | | | (8) | | | — | |
| | | | | | | | |
| Total | | $ | (192) | | | $ | — | | | $ | (8) | | | $ | (1) | |
| | | | | | | | |
| For the year ended December 31, 2021: | | | | | | | | |
| Interest rate | | $ | 28 | | | $ | — | | | $ | — | | | $ | (7) | |
| Foreign currency/interest rate | | (8) | | | — | | | — | | | — | |
| | | | | | | | |
| Total | | $ | 20 | | | $ | — | | | $ | — | | | $ | (7) | |
| | | | | | | | |
| For the year ended December 31, 2020: | | | | | | | | |
| Interest rate | | $ | (33) | | | $ | — | | | $ | — | | | $ | (4) | |
| Foreign currency/interest rate | | 6 | | | — | | | — | | | — | |
| | | | | | | | |
| Total | | $ | (27) | | | $ | — | | | $ | — | | | $ | (4) | |
For the years ended December 31, 2019, 20182022, 2021 and 2017,2020, there were no material amounts reclassified into earnings relating to instances in which the Company discontinued cash flow hedge accounting because the forecasted transaction did not occur by the anticipated date or within the additional time period permitted by the authoritative guidance for the accounting for derivatives and hedging.
Hedges of Net Investments in Foreign Operations
The Company uses foreign currency swaps and foreign currency forwards to hedge a portion of its net investment in certain foreign operations against adverse movements in exchange rates. The following table illustrates the Company’s net investments in foreign operations (“NIFO”) hedges and the gains (losses) deferred in OCI for the years ended December 31, 2019, 20182022, 2021 and 20172020 (dollars in millions):
| | | | | | | | | | | | | | | | | | | | |
| | | Derivative Gains (Losses) Deferred in OCI |
| | | For the years ended December 31, |
| Type of NIFO Hedge | | 2022 | | 2021 | | 2020 |
| Foreign currency swaps | | $ | — | | | $ | (2) | | | $ | 1 | |
| Foreign currency forwards | | 73 | | | — | | | (30) | |
| Total | | $ | 73 | | | $ | (2) | | | $ | (29) | |
|
| | | | | | | | | | | | |
| | | Derivative Gains (Losses) Deferred in AOCI |
| | | For the year ended |
Type of NIFO Hedge (1) | | 2019 | | 2018 | | 2017 |
| Foreign currency swaps | | $ | (9 | ) | | $ | 31 |
| | $ | (38 | ) |
| Foreign currency forwards | | (24 | ) | | 56 |
| | (10 | ) |
| |
(1) | There were no sales or substantial liquidations of net investments in foreign operations that would have required the reclassification of gains or losses from accumulated other comprehensive income (loss) into investment income during the periods presented. |
The cumulative foreign currency translation gain recorded in AOCI related to these hedges was $168$210 million and $201$137 million as of December 31, 20192022 and 2018,2021, respectively. If a hedged foreign operation was sold or substantially liquidated, the amounts in AOCI would be reclassified to the consolidated statements of income. A pro rata portion would be reclassified upon partial sale of a hedged foreign operation. There were no sales or substantial liquidations of net investments in foreign operations that would have required the reclassification of gains or losses from AOCI into investment income during the periods presented.
Non-qualifying Derivatives and Derivatives for Purposes Other Than Hedging
The Company uses various other derivative instruments for risk management purposes that either do not qualify or have not been qualifiedelected for hedge accounting treatment. The gain or loss related to the change in fair value for these derivative instruments is recognized in investment related gains (losses), net, in the consolidated statements of income, except where otherwise noted.
A summary of the effect of non-hedging derivatives, including embedded derivatives, on the Company’s consolidated statements of income for the years ended December 31, 2019, 20182022, 2021 and 20172020 is as follows (dollars in millions):
|
| | | | | | | | | | | | | | |
| | | | Gains (Losses) for the Years Ended December 31, |
| Type of Non-hedging Derivative | | Income Statement Location of Gains (Losses) | | 2019 | | 2018 | | 2017 |
| Interest rate swaps | | Investment related gains (losses), net | | $ | 65 |
| | $ | (21 | ) | | $ | 11 |
|
| Financial futures | | Investment related gains (losses), net | | (46 | ) | | 21 |
| | (36 | ) |
| Foreign currency swaps | | Investment related gains (losses), net | | — |
| | (4 | ) | | — |
|
| Foreign currency forwards | | Investment related gains (losses), net | | 1 |
| | — |
| | 1 |
|
| Consumer price index swaps | | Investment related gains (losses), net | | (18 | ) | | (10 | ) | | (2 | ) |
| Credit default swaps | | Investment related gains (losses), net | | 30 |
| | (2 | ) | | 18 |
|
| Equity options | | Investment related gains (losses), net | | (40 | ) | | 7 |
| | (43 | ) |
| Longevity swaps | | Other revenues | | 13 |
| | 9 |
| | 9 |
|
| Mortality swaps | | Other revenues | | (1 | ) | | — |
| | (1 | ) |
| Subtotal | | | | 4 |
| | — |
| | (43 | ) |
| Embedded derivatives in: | | | | | | | | |
| Modco or funds withheld arrangements | | Investment related gains (losses), net | | 11 |
| | (13 | ) | | 145 |
|
| Indexed annuity products | | Interest credited | | (57 | ) | | 27 |
| | (80 | ) |
| Variable annuity products | | Investment related gains (losses), net | | 5 |
| | (15 | ) | | 32 |
|
| Total non-hedging derivatives | | | | $ | (37 | ) | | $ | (1 | ) | | $ | 54 |
|
| | | | | | | | | | | | | | | | | | | | | | | | | | |
| | | | Gains (Losses) for the years ended December 31, |
| Type of Non-hedging Derivative | | Income Statement
Location of Gains (Losses) | | 2022 | | 2021 | | 2020 |
| Interest rate swaps | | Investment related gains (losses), net | | $ | (131) | | | $ | (34) | | | $ | 76 | |
| Interest rate options | | Investment related gains (losses), net | | 3 | | | — | | | — | |
| Total return swaps | | Investment related gains (losses), net | | 21 | | | — | | | — | |
| Financial futures | | Investment related gains (losses), net | | 28 | | | (24) | | | (47) | |
| Foreign currency swaps | | Investment related gains (losses), net | | 21 | | | 20 | | | (7) | |
| Foreign currency forwards | | Investment related gains (losses), net | | (93) | | | (20) | | | 5 | |
| CPI swaps | | Investment related gains (losses), net | | 31 | | | 46 | | | 16 | |
| Credit default swaps | | Investment related gains (losses), net | | (66) | | | 33 | | | 16 | |
| Equity options | | Investment related gains (losses), net | | 14 | | | (33) | | | — | |
| | | | | | | | |
| | | | | | | | |
| Subtotal | | | | (172) | | | (12) | | | 59 | |
| Embedded derivatives in: | | | | | | | | |
| Modco or funds withheld arrangements | | Investment related gains (losses), net | | (173) | | | 107 | | | (62) | |
| | | | | | | | |
| Indexed annuity products | | Interest credited | | 98 | | | 10 | | | (30) | |
| Variable annuity products | | Investment related gains (losses), net | | 38 | | | (7) | | | 8 | |
| Total non-hedging derivatives | | | | $ | (209) | | | $ | 98 | | | $ | (25) | |
Credit Derivatives
The following table presents the estimated fair value, maximum amount of future payments and weighted average years to maturity of credit default swaps sold by the Company as of December 31, 20192022 and 20182021 (dollars in millions):
| | | | | | | | | | | | | | | | | | | | | | | | | | | | | | | | | | | | | | |
| | | 2022 | | 2021 |
Rating Agency Designation of Referenced Credit Obligations(1) | | Estimated Fair
Value of Credit
Default Swaps | | Maximum Amount of Future Payments under Credit Default Swaps(2) | | Weighted Average Years to Maturity(3) | | Estimated Fair
Value of Credit
Default Swaps | | Maximum
Amount of Future
Payments under
Credit Default
Swaps(2) | | Weighted
Average
Years to
Maturity(3) |
| AAA/AA+/AA/AA-/A+/A/A- | | | | | | | | | | | | |
| Single name credit default swaps | | $ | (18) | | | $ | 428 | | | 18.7 | | $ | 28 | | | $ | 600 | | | 14.2 |
| | | | | | | | | | | | |
| | | | | | | | | | | | |
| BBB+/BBB/BBB- | | | | | | | | | | | | |
| Single name credit default swaps | | 1 | | | 155 | | | 3.3 | | 1 | | | 141 | | | 2.4 |
| Credit default swaps referencing indices | | — | | | 915 | | | 6.2 | | — | | | 565 | | | 5.1 |
| Subtotal | | 1 | | | 1,070 | | | 5.8 | | 1 | | | 706 | | | 4.6 |
| BB+/BB/BB- | | | | | | | | | | | | |
| Single name credit default swaps | | (2) | | | 25 | | | 3.2 | | (1) | | | 15 | | | 3.5 |
| | | | | | | | | | | | |
| Total | | $ | (19) | | | $ | 1,523 | | | 9.4 | | $ | 28 | | | $ | 1,321 | | | 9.0 |
|
| | | | | | | | | | | | | | | | | | | | |
| | | 2019 | | 2018 |
Rating Agency Designation of Referenced Credit Obligations(1) | | Estimated Fair Value of Credit Default Swaps | | Maximum Amount of Future Payments under Credit Default Swaps(2) | | Weighted Average Years to Maturity(3) | | Estimated Fair
Value of Credit
Default Swaps | | Maximum
Amount of Future
Payments under
Credit Default
Swaps(2) | | Weighted
Average
Years to
Maturity(3) |
| AAA/AA+/AA/AA-/A+/A/A- | | | | | | | | | | | | |
| Single name credit default swaps | | $ | 2 |
| | $ | 142 |
| | 1.7 | | $ | 2 |
| | $ | 152 |
| | 2.2 |
| Subtotal | | 2 |
| | 142 |
| | 1.7 | | 2 |
| | 152 |
| | 2.2 |
| BBB+/BBB/BBB- | | | | | | | | | | | | |
| Single name credit default swaps | | 3 |
| | 291 |
| | 1.9 | | 3 |
| | 354 |
| | 2.2 |
| Credit default swaps referencing indices | | — |
| | 873 |
| | 4.7 | | — |
| | 817 |
| | 6.4 |
| Subtotal | | 3 |
| | 1,164 |
| | 4.0 | | 3 |
| | 1,171 |
| | 5.1 |
| BB+/BB/BB- | | | | | | | | | | | | |
| Single name credit default swaps | | — |
| | — |
| | 0.0 | | — |
| | 15 |
| | 0.7 |
| Subtotal | | — |
| | — |
| | 0.0 | | — |
| | 15 |
| | 0.7 |
| Total | | $ | 5 |
| | $ | 1,306 |
| | 3.7 | | $ | 5 |
| | $ | 1,338 |
| | 4.7 |
| |
(1) | The rating agency designations are based on ratings from Standard and Poor’s (“S&P”). |
| |
(2) | Assumes the value of the referenced credit obligations is zero. |
| |
(3) | The weighted average years to maturity of the credit default swaps is calculated based on weighted average notional amounts. |
(2)Assumes the value of the referenced credit obligations is zero.
(3)The weighted average years to maturity of the credit default swaps is calculated based on weighted average notional amounts.
Netting Arrangements and Credit Risk
Certain of the Company’s derivatives are subject to enforceable master netting arrangements and reported as a net asset or liability in the consolidated balance sheets. The Company nets all derivatives that are subject to such arrangements.
The Company has elected to include all derivatives, except embedded derivatives, in the tablestable below, irrespective of whether they are subject to an enforceable master netting arrangement or a similar agreement. See Note 4 – “Investments” for information regarding the Company’s securities borrowing, lending, repurchase and repurchase/reverse repurchase programs.agreements. See “Embedded Derivatives” above for information regarding the Company’s bifurcated embedded derivatives.
The following table provides information relating to the netting of the Company’s derivative instruments as of December 31, 20192022 and December 31, 20182021 (dollars in millions):
| | | | | | | | | | | | | | | | | | | | | | | | | | | | | | | | |
| | Gross Amounts Recognized | | Gross Amounts
Offset in the
Balance Sheet | | Net Amounts
Presented in the
Balance Sheet | | Financial Instruments/Collateral (1) | | Net Amount |
| December 31, 2022: | | | | | | | | | | |
| Derivative assets | | $ | 223 | | | $ | (53) | | | $ | 170 | | | $ | (170) | | | $ | — | |
| Derivative liabilities | | 236 | | | (53) | | | 183 | | | (183) | | | $ | — | |
| December 31, 2021: | | | | | | | | | | |
| Derivative assets | | $ | 194 | | | $ | (19) | | | $ | 175 | | | $ | (175) | | | $ | — | |
| Derivative liabilities | | 58 | | | (19) | | | 39 | | | (39) | | | $ | — | |
|
| | | | | | | | | | | | | | | | | | | | | | | | |
| | | | | | | | | Gross Amounts Not Offset in the Balance Sheet | | |
| | | Gross Amounts Recognized | | Gross Amounts Offset in the Balance Sheet | | Net Amounts Presented in the Balance Sheet | | Financial Instruments(1) | | Cash Collateral Pledged/ Received | | Net Amount |
| December 31, 2019: | | | | | | | | | | | | |
| Derivative assets | | $ | 137 |
| | $ | (20 | ) | | $ | 117 |
| | $ | — |
| | $ | (119 | ) | | $ | (2 | ) |
| Derivative liabilities | | 73 |
| | (20 | ) | | 53 |
| | (92 | ) | | (52 | ) | | (91 | ) |
| December 31, 2018: | | | | | | | | | | | | |
| Derivative assets | | $ | 247 |
| | $ | (19 | ) | | $ | 228 |
| | $ | — |
| | $ | (235 | ) | | $ | (7 | ) |
| Derivative liabilities | | 45 |
| | (19 | ) | | 26 |
| | (71 | ) | | (24 | ) | | (69 | ) |
| |
(1) | Includes initial margin posted to a central clearing partner. |
The Company had no credit exposure related to its derivative contracts, as of December 31, 2019a central clearing partner for financial instruments and 2018, asexcludes the net amountexcess of collateral received/pledged from/to the Company from counterparties exceeded the fair value of the derivative contracts. counterparty.
The Company may be exposed to credit-related losses in the event of non-performance by counterparties to derivative financial instruments with a positive fair value.instruments. Generally, the credit exposure of the Company’s derivative contracts is limited to the fair value and accrued interest of non-collateralized derivative contracts in an asset position at the reporting date plus or minus any collateral posted or held bydate. As of December 31, 2022, the Company.Company had credit exposure of $14 million.
Derivatives may be exchange-traded or they may be privately negotiated contracts, which are referred to as over-the-counter (“OTC”) derivatives. Certain of the Company’s OTC derivatives are cleared and settled through central clearing counterparties (“OTC cleared”) and others are bilateral contracts between two counterparties. The Company manages its credit risk related to OTC derivatives by entering into transactions with creditworthy counterparties, maintaining collateral arrangements and through
the use of master netting agreements that provide for a single net payment to be made by one counterparty to another at each due date and upon termination. The Company is only exposed to the default of the central clearing counterparties for OTC cleared derivatives, and these transactions require initial and daily variation margin collateral postings. Exchange-traded derivatives are settled on a daily basis, thereby reducing the credit risk exposure in the event of non-performance by counterparties to such financial instruments.
Note 6 FAIR VALUE OF ASSETS AND LIABILITIES
Fair Value Measurement
General accounting principles for Fair Value Measurements and Disclosures define fair value as the exchange price that would be received for an asset or paid to transfer a liability (an exit price) in the principal or most advantageous market for the asset or liability in an orderly transaction between market participants on the measurement date. These principles also establish a three-level fair value hierarchy that requires an entity to maximize the use of observable inputs and to minimize the use of unobservable inputs when measuring fair value and describes three levels of inputs that may be used to measure fair value:
Level 1 -– Unadjusted quoted prices in active markets for identical assets or liabilities. Active markets are defined as having the followingthrough various characteristics for the measured asset/liability: (i)liability, such as having many transactions (ii) current prices, (iii) price quotes not varying substantially among market makers, (iv)and narrow bid/ask spreads and (v) most information publicly available. The Company’s Level 1 assets and liabilities are traded in active exchange markets.spreads.
Level 2 -– Observable inputs other than Level 1 prices such as quoted prices for similar assets or liabilities; quoted prices in markets that are not active; or market standard valuation techniques and assumptions that use significant inputs that are observable or can be corroborated by observable market data for substantially the full term of the assets or liabilities. Such observable inputs include benchmarking prices for similar assets in active, liquid markets, quoted prices in markets that are not active and observable yields and spreads in the market. The Company’s Level 2 assets and liabilities include investment securities with quoted prices that are traded less frequently than exchange-traded instruments and derivative contracts whose values are determined using market standard valuation techniques. Level 2 valuations are generally obtained from third party pricing services for identical or comparable assets or liabilities or through the use of valuation methodologies using observable market inputs. Prices from servicers are validated through analytical reviews and assessment of current market activity.
Level 3 -– Unobservable inputs that are supported by little or no market activity and that are significant to the fair value of the related assets or liabilities. Level 3 assetsliabilities and liabilities include those whose value is determined using market standard valuation techniques described above. When observable inputs are not available, the market standard techniques for determining the estimated fair value of certain securities that trade infrequently, and therefore have little transparency, rely on inputs that are significant to the estimated fair value and that are not observable in the market or cannot be derived principally from or corroborated by observable market data. These unobservable inputs can be based in large part on management judgment or estimation and cannot be supported by reference to market activity. Even though unobservable, management believes these inputs are based on assumptions deemed appropriate given the circumstances and consistent with what other market participants would use when pricing similar assets and liabilities. Prices are determined using valuation methodologies such as discounted cash flow models and other similar techniques that require management’s judgment or estimation in developing inputs that are consistent with those other market participants would use when pricing similar assets and liabilities. Non-binding broker quotes, which are utilized when pricing service information is not available, are reviewed for reasonableness based on the Company’s understanding of the market, and are generally considered Level 3. Under certain circumstances, based on its observations of transactions in active markets, the Company may conclude the prices received from independent third party pricing services or brokers are not reasonable or reflective of market activity. In those instances, the Company would apply internally developed valuation techniques to the related assets or liabilities. Additionally, the Company’s embedded derivatives, all of which are associated with reinsurance treaties, and longevity and mortality swaps are classified in Level 3 since their values include significant unobservable inputs.
When inputs used to measure the fair value of an asset or liability fall within different levels of the hierarchy, the level within which the fair value measurement is categorized is based on the lowest level input that is significant to the fair value measurement in its entirety, except for fair value measurements using NAV. For example, a Level 3 fair value measurement may include inputs that are observable (Levels 1 and 2) and unobservable (Level 3). Therefore, gains and losses for such assets and liabilities categorized within Level 3 may include changes in fair value that are attributable to both observable inputs (Levels 1 and 2) and unobservable inputs (Level 3).
Assets and Liabilities by Hierarchy Level
Assets and liabilities measured at fair value on a recurring basis as of December 31, 20192022 and 20182021 are summarized below (dollars in millions):
| | | | | | | | | | | | | | | | | | | | | | | | | | |
| December 31, 2022: | | | | Fair Value Measurements Using: |
| | | Total | | Level 1 | | Level 2 | | Level 3 |
Assets: (1) | | | | | | | | |
| Fixed maturity securities – available-for-sale: | | | | | | | | |
| Corporate | | $ | 33,969 | | | $ | — | | | $ | 29,670 | | | $ | 4,299 | |
| Canadian government | | 3,626 | | | — | | | 3,626 | | | — | |
| RMBS | | 941 | | | — | | | 931 | | | 10 | |
| ABS | | 3,878 | | | — | | | 2,603 | | | 1,275 | |
| CMBS | | 1,623 | | | — | | | 1,555 | | | 68 | |
| U.S. government | | 1,482 | | | 1,388 | | | 85 | | | 9 | |
| State and political subdivisions | | 1,119 | | | — | | | 1,093 | | | 26 | |
| Other foreign government | | 6,263 | | | — | | | 6,228 | | | 35 | |
| Total fixed maturity securities – available-for-sale | | 52,901 | | | 1,388 | | | 45,791 | | | 5,722 | |
| Equity securities | | 134 | | | 68 | | | — | | | 66 | |
| Funds withheld at interest – embedded derivatives | | (370) | | | — | | | — | | | (370) | |
| Funds withheld at interest | | 54 | | | — | | | — | | | 54 | |
| Cash equivalents | | 1,535 | | | 1,535 | | | — | | | — | |
| Short-term investments | | 121 | | | 54 | | | 54 | | | 13 | |
| Other invested assets: | | | | | | | | |
| Derivatives | | 170 | | | — | | | 170 | | | — | |
| | | | | | | | |
| | | | | | | | |
| Other | | 23 | | | — | | | 23 | | | — | |
| Total other invested assets | | 193 | | | — | | | 193 | | | — | |
| Total | | $ | 54,568 | | | $ | 3,045 | | | $ | 46,038 | | | $ | 5,485 | |
| Liabilities: | | | | | | | | |
| Interest-sensitive contract liabilities – embedded derivatives | | $ | 653 | | | $ | — | | | $ | — | | | $ | 653 | |
| Other liabilities: | | | | | | | | |
| Funds withheld at interest – embedded derivatives | | (361) | | | — | | | — | | | (361) | |
| Derivatives | | 183 | | | — | | | 183 | | | — | |
| Total | | $ | 475 | | | $ | — | | | $ | 183 | | | $ | 292 | |
|
| | | | | | | | | | | | | | | | |
| December 31, 2019: | | | | Fair Value Measurements Using: |
| | | Total | | Level 1 | | Level 2 | | Level 3 |
| Assets: | | | | | | | | |
| Fixed maturity securities – available-for-sale: | | | | | | | | |
| Corporate | | $ | 31,393 |
| | $ | — |
| | $ | 29,207 |
| | $ | 2,186 |
|
| Canadian government | | 4,612 |
| | — |
| | 3,908 |
| | 704 |
|
| RMBS | | 2,398 |
| | — |
| | 2,349 |
| | 49 |
|
| ABS | | 2,978 |
| | — |
| | 2,865 |
| | 113 |
|
| CMBS | | 1,899 |
| | — |
| | 1,853 |
| | 46 |
|
| U.S. government | | 2,152 |
| | 2,030 |
| | 106 |
| | 16 |
|
| State and political subdivisions | | 1,164 |
| | — |
| | 1,155 |
| | 9 |
|
| Other foreign government | | 4,525 |
| | — |
| | 4,509 |
| | 16 |
|
| Total fixed maturity securities – available-for-sale | | 51,121 |
| | 2,030 |
| | 45,952 |
| | 3,139 |
|
| Equity securities | | 320 |
| | 243 |
| | — |
| | 77 |
|
| Funds withheld at interest – embedded derivatives | | 121 |
| | — |
| | — |
| | 121 |
|
| Cash equivalents | | 274 |
| | 274 |
| | — |
| | — |
|
| Short-term investments | | 32 |
| | 4 |
| | 26 |
| | 2 |
|
| Other invested assets: | | | | | | | | |
| Derivatives | | 117 |
| | — |
| | 117 |
| | — |
|
| FVO contractholder-directed unit-linked investments | | 260 |
| | 207 |
| | 53 |
| | — |
|
| Total other invested assets | | 377 |
| | 207 |
| | 170 |
| | — |
|
| Total | | $ | 52,245 |
| | $ | 2,758 |
| | $ | 46,148 |
| | $ | 3,339 |
|
| Liabilities: | | | | | | | | |
| Interest-sensitive contract liabilities – embedded derivatives | | $ | 930 |
| | $ | — |
| | $ | — |
| | $ | 930 |
|
| Other liabilities: | | | | | | | | |
| Derivatives | | 53 |
| | — |
| | 53 |
| | — |
|
| Total | | $ | 983 |
| | $ | — |
| | $ | 53 |
| | $ | 930 |
|
| | | | | | | | | | | | | | | | | | | | | | | | | | |
| December 31, 2021: | | | | Fair Value Measurements Using: |
| | | Total | | Level 1 | | Level 2 | | Level 3 |
Assets: (1) | | | | | | | | |
| Fixed maturity securities – available-for-sale: | | | | | | | | |
| Corporate | | $ | 38,103 | | | $ | — | | | $ | 34,215 | | | $ | 3,888 | |
| Canadian government | | 4,944 | | | — | | | 4,944 | | | — | |
| RMBS | | 1,050 | | | — | | | 1,049 | | | 1 | |
| ABS | | 4,005 | | | — | | | 2,908 | | | 1,097 | |
| CMBS | | 1,849 | | | — | | | 1,768 | | | 81 | |
| U.S. government | | 2,105 | | | 1,993 | | | 100 | | | 12 | |
| State and political subdivisions | | 1,323 | | | — | | | 1,290 | | | 33 | |
| Other foreign government | | 7,370 | | | — | | | 7,337 | | | 33 | |
| Total fixed maturity securities – available-for-sale | | 60,749 | | | 1,993 | | | 53,611 | | | 5,145 | |
| Equity securities | | 151 | | | 101 | | | — | | | 50 | |
| Funds withheld at interest – embedded derivatives | | 104 | | | — | | | — | | | 104 | |
| Funds withheld at interest | | 83 | | | — | | | — | | | 83 | |
| Cash equivalents | | 1,138 | | | 1,138 | | | — | | | — | |
| Short-term investments | | 64 | | | — | | | 36 | | | 28 | |
| Other invested assets: | | | | | | | | |
| Derivatives | | 175 | | | — | | | 175 | | | — | |
| Other | | 52 | | | — | | | 52 | | | — | |
| | | | | | | | |
| | | | | | | | |
| Total other invested assets | | 227 | | | — | | | 227 | | | — | |
| Total | | $ | 62,516 | | | $ | 3,232 | | | $ | 53,874 | | | $ | 5,410 | |
| Liabilities: | | | | | | | | |
| Interest-sensitive contract liabilities – embedded derivatives | | $ | 855 | | | $ | — | | | $ | — | | | $ | 855 | |
| Other liabilities: | | | | | | | | |
| Funds withheld at interest – embedded derivatives | | (61) | | | — | | | — | | | (61) | |
| Derivatives | | 39 | | | — | | | 39 | | | — | |
| Total | | $ | 833 | | | $ | — | | | $ | 39 | | | $ | 794 | |
|
| | | | | | | | | | | | | | | | |
| December 31, 2018: | | | | Fair Value Measurements Using: |
| | | Total | | Level 1 | | Level 2 | | Level 3 |
| Assets: | | | | | | | | |
| Fixed maturity securities – available-for-sale: | | | | | | | | |
| Corporate | | $ | 23,982 |
| | $ | — |
| | $ | 22,651 |
| | $ | 1,331 |
|
| Canadian government | | 3,892 |
| | — |
| | 3,364 |
| | 528 |
|
| RMBS | | 1,869 |
| | — |
| | 1,862 |
| | 7 |
|
| ABS | | 2,150 |
| | — |
| | 2,054 |
| | 96 |
|
| CMBS | | 1,419 |
| | — |
| | 1,419 |
| | — |
|
| U.S. government | | 2,186 |
| | 2,068 |
| | 100 |
| | 18 |
|
| State and political subdivisions | | 752 |
| | — |
| | 742 |
| | 10 |
|
| Other foreign government | | 3,742 |
| | — |
| | 3,737 |
| | 5 |
|
| Total fixed maturity securities – available-for-sale | | 39,992 |
| | 2,068 |
| | 35,929 |
| | 1,995 |
|
| Equity securities | | 82 |
| | 49 |
| | — |
| | 33 |
|
| Funds withheld at interest – embedded derivatives | | 110 |
| | — |
| | — |
| | 110 |
|
| Cash equivalents | | 485 |
| | 473 |
| | 12 |
| | — |
|
| Short-term investments | | 106 |
| | 5 |
| | 99 |
| | 2 |
|
| Other invested assets: | |
|
| | | | | | |
| Derivatives | | 180 |
| | — |
| | 180 |
| | — |
|
| FVO contractholder-directed unit-linked investments | | 198 |
| | 197 |
| | 1 |
| | — |
|
| Total other invested assets | | 378 |
| | 197 |
| | 181 |
| | — |
|
| Other assets - longevity swaps | | 48 |
| | — |
| | — |
| | 48 |
|
| Total | | $ | 41,201 |
| | $ | 2,792 |
| | $ | 36,221 |
| | $ | 2,188 |
|
| Liabilities: | | | | | | | | |
| Interest-sensitive contract liabilities – embedded derivatives | | $ | 945 |
| | $ | — |
| | $ | — |
| | $ | 945 |
|
| Other liabilities: | | | | | | | | |
| Derivatives | | 27 |
| | — |
| | 27 |
| | — |
|
| Total | | $ | 972 |
| | $ | — |
| | $ | 27 |
| | $ | 945 |
|
The Company may utilize information from third parties, such as pricing services and brokers, to assist in determining the fair value for certain assets and liabilities; however, management is ultimately responsible for all fair values presented in the Company’s financial statements. This includes responsibility for monitoring the fair value process, ensuring objective and reliable valuation practices and pricing of assets and liabilities, and approving changes to valuation methodologies and pricing sources. The selection of the valuation technique(s) to apply considers the definition of an exit price and the nature of the asset or liability being valued and significant expertise and judgment is required.
The Company performs initial and ongoing analysis and review of the various techniques utilized in determining fair value to ensure that they are appropriate and consistently applied, and that the various assumptions are reasonable. The Company analyzes and reviews the information and prices received from third parties to ensure that the prices represent a reasonable estimate of the fair value and to monitor controls around pricing, which includes quantitative and qualitative analysis and is overseen by the Company’s investment and accounting personnel. Examples of procedures performed include, but are not limited to, review of pricing trends, comparison of a sample of executed prices of securities sold to the fair value estimates, comparison of fair value estimates to management’s knowledge of the current market, and ongoing confirmation that third party pricing services use, wherever possible, market-based parameters for valuation. In addition, the Company utilizes both internal and external cash flow models to analyze the reasonableness of fair values utilizing credit spread and other market assumptions, where appropriate. As a result of the analysis, if the Company determines there is a more appropriate fair value based upon the available market data, the price received from the third party is adjusted accordingly. The Company also determines if the inputs used in estimated fair values received from pricing services are observable by assessing whether these inputs can be corroborated by observable market data.
For assets and liabilities reported at fair value, the Company utilizes, when available, fair values based on quoted prices in active markets that are regularly and readily obtainable. Generally, these are very liquid investments and the valuation does not require management judgment. When quoted prices in active markets are not available, fair value is based on market valuation techniques, market comparable pricing and the income approach. The use of different techniques, assumptions and inputs may have a material effect on the estimated fair values of the Company’s securities holdings. For the periods presented, the application of market standard valuation techniques applied to similar assets and liabilities has been consistent.
The methods and assumptions the Company uses to estimate the fair value of assets and liabilities measured at fair value on a recurring basis are summarized below.
Fixed Maturity Securities – The fair values of the Company’s publicly-traded fixed maturity securities are generally based on prices obtained from independent pricing services. Prices from pricing services are sourced from multiple vendors, and a vendor hierarchy is maintained by asset type based on historical pricing experience and vendor expertise. The Company generally receives prices from multiple pricing services for each security, but ultimately uses the price from the vendor that is highest in the hierarchy for the respective asset type. To validate reasonableness, prices are periodically reviewed as explained above. Consistent with the fair value hierarchy described above, securities with quotes from pricing services are generally reflected within Level 2, as they are primarily based on observable pricing for similar assets and/or other market observable inputs. If the pricing information received from third party pricing services is not reflective of market activity or other inputs observable in the market, the Company may challenge the price through a formal process with the pricing service.
If the Company ultimately concludes that pricing information received from the independent pricing service is not reflective of fair value, non-binding broker quotes are used, if available. If the Company concludes that the values from both pricing services and brokers are not reflective of fair value, an internally developed valuation may be prepared; however, this occurs infrequently. Internally developed valuations or non-binding broker quotes are also used to determine fair value in circumstances where vendor pricing is not available. These valuations may use significant unobservable inputs, which reflect the Company’s assumptions about the inputs that market participants would use in pricing the asset. Observable market data may not be available in certain circumstances such as market illiquidity and credit events related to the security. Pricing service overrides, internally developed valuations and non-binding broker quotes are generally based on significant unobservable inputs and are reflected as Level 3 in the valuation hierarchy.
The inputs used in the valuation of corporate and government securities include, but are not limited to standard market observable inputs that are derived from, or corroborated by, market observable data including market yield curve, duration, call provisions, observable prices and spreads for similar publicly traded or privately placed issues that incorporate the credit quality and industry sector of the issuer. For internal pricing of private placements and structured securities, valuation is based primarily on matrix pricing or other similar techniques using standard market inputs including spreads for actively traded securities, spreads off benchmark yields, expected prepayment speeds and volumes, current and forecasted loss severity, rating, weighted average coupon, weighted average maturity, average delinquency rates, geographic region, debt service coverage ratios and issuance-specific information including, but not limited to: collateral type, payment terms of the underlying assets, payment priority within the tranche, structure of the security, deal performance and vintage of loans.
When observable inputs are not available, the market standard valuation techniques for determining the estimated fair value of certain types of securities that trade infrequently, and therefore have little or no price transparency, rely on inputs that are significant to the estimated fair value that are not observable in the market or cannot be derived principally from or corroborated by observable market data, such as market illiquidity. Other significant unobservable inputs used in the fair value measurement of the Company’s private debt investments include a multiple of earnings before interest, taxes, depreciation and amortization (“EBITDA”). These unobservable inputs can be based in large part on management judgment or estimation, and cannot be supported by reference to market activity. Even though unobservable, these inputs are based on assumptions deemed appropriate given the circumstances and are believed to be consistent with what other market participants would use when pricing such securities.
Equity Securities – Equity securities consist principally of common and preferred stock of publicly and privately traded companies. The fair values of publicly traded equity securities are primarily based on quoted market prices in active markets and are classified within Level 1 in the fair value hierarchy. Non-binding broker quotes and internally developed evaluations for equity securities are generally based on significant unobservable inputs and are reflected as Level 3 in the fair value hierarchy.
Embedded Derivatives– The fair value of embedded derivative liabilities, including those calculated by third parties, are monitored through the use of attribution reports to quantify the effect of underlying sources of fair value change, including capital market inputs based on policyholder account values, interest rates and short-term and long-term implied volatilities, from period to period. Actuarial assumptions are based on experience studies performed internally in combination with available industry information and are reviewed on a periodic basis, at least annually.
For embedded derivative liabilities associated with the underlying products in reinsurance treaties, primarily equity-indexed and variable annuity treaties, the Company utilizes a discounted cash flow model, which includes an estimate of future equity option purchases and an adjustment for a CVA. The variable annuity embedded derivative calculations are performed by third parties based on methodology and input assumptions provided by the Company. To validate the reasonableness of the resulting fair value, the Company’s internal actuaries perform reviews and analytical procedures on the results. The capital market inputs to the model, such as equity indexes, short-term equity volatility and interest rates, are generally observable. The valuation also requires certain significant inputs, which are generally not observable and accordingly, the valuation is considered Level 3 in the fair value hierarchy,
The fair value of embedded derivatives associated with funds withheld reinsurance treaties is determined based upon a total return swap technique with reference to the fair value of the investments held by the ceding company that support the Company’s funds withheld at interest asset with an adjustment for a CVA. The fair value of the underlying assets is generally based on market observable inputs using industry standard valuation techniques. The valuationa variety of sources and pricing methodologies chosen by the ceding company, which are not transparent to the Company and may include significant unobservable inputs. Additionally, some of the valuations also requiresrequire certain significant inputs, which are generally not observable and accordingly,observable. Therefore, the valuation isof the embedded derivative assets and liabilities associated with these funds withheld reinsurance treaties are considered Level 3 in the fair value hierarchy.
Equity Securities – Equity securities consist principally of exchange-traded Where those funds and common and preferred stock of publicly and privately traded companies. The fair values of publicly traded equity securitieswithheld reinsurance agreements are primarily based on quoted market prices in active markets and are classified within Level 1 inceded by the fair value hierarchy. Non-binding broker quotes and internally developed
evaluations for equity securities are generally based on significant unobservable inputs and are reflected as Level 3 inCompany, the fair value hierarchy.same approach is taken to valuing the embedded derivatives associated with the funds withheld at interest liability.
Credit Valuation Adjustment – The Company uses a structural default risk model to estimate a CVA.bases its CVA on corporate Option-adjusted spread (“OAS”) indexes and market conditions adjusted for the Company’s specific factors. The input assumptions are a combination of externally derived and published values (default threshold and uncertainty),publicly available information, corporate OAS indexes, market inputs, (interest rate, equity price per share, debt per share, equity price volatility) and insurance industryinternally developed data (Loss Given Default), adjusted forbased on Company specific investments by rating category.
Funds Withheld at Interest –Funds withheld at interest, elected at fair value on a limited basis, include assets where inputs are not observable in the market recoverability.and are considered Level 3 in the fair value hierarchy.
Cash Equivalents and Short-Term Investments – Cash equivalents and short-term investments include money market instruments and other highly liquid debt instruments. Money market instruments are generally valued using unadjusted quoted prices in active markets that are accessible for identical assets and are primarily classified as Level 1. The fair value of certain other cash equivalents and short-term investments, such as bonds with original maturities twelve months or less, are based upon other market observable data and are typically classified as Level 2. However, certain short-term investments may incorporate significant unobservable inputs resulting in a Level 3 classification. Various time deposits, certificates of deposit and sweeps carried as cash equivalents or short-term investments are not measured at estimated fair value and therefore are excluded from the tables presented.
FVO Contractholder-Directed Unit-Linked InvestmentsOther – – FVO contractholder-directed investments supporting unit-linked variable annuity type liabilities primarily consist of exchange-traded funds and, to a lesser extent, fixed maturity securities and cash and cash equivalents. The fair values of the exchange-traded securities are primarily based on quoted market prices in active markets and are classified within Level 1 of the hierarchy.securities. The fair value of the fixed maturity contractholder-directed securities is determined on a basis consistent with the methodologies described above for fixed maturity securities and are classified within Level 2 of the hierarchy.
Derivative Assets and Derivative Liabilities – All of the derivative instruments utilized by the Company except for longevity and mortality swaps, are classified within Level 2 on the fair value hierarchy. These derivatives are principally valued using an income approach. Valuations of interest rate contracts are based on present value techniques, which utilize significant inputs that may include the swap yield curve, London Interbank Offered Rate (“LIBOR”) basis curves, Secured Overnight Financing Rate (“SOFR”) basis curves, Overnight Index Swaps (“OIS”) curves, and repurchase rates. Valuations of foreign currency contracts are based on present value techniques, which utilize significant inputs that may include the swap yield curve, LIBOR basis curves, currency spot rates, and cross currency basis curves. Valuations of credit contracts, are based on present value techniques, which utilize significant inputs that may include the swap yield curve, credit curves, and recovery rates. Valuations of equity market contracts, are based on present value techniques, which utilize significant inputs that may include the swap yield curve, spot equity index levels, and dividend yield curves. Valuations of equity market contracts, option-based, are based on option pricing models, which utilize significant inputs that may include the swap yield curve, spot equity index levels, dividend yield curves, and equity volatility.
Longevity and Mortality Swaps – The Company utilizes a discounted cash flow model to estimate the fair value of longevity and mortality swaps. The fair value of these swaps includes an accrual for premiums payable and receivable. Some inputs to the valuation model are generally observable, such as interest rates and actual population mortality experience. The valuation also requires significant inputs that are generally not observable and, accordingly, the valuation is considered Level 3 in the fair value hierarchy.
Quantitative Information Regarding Internally-Priced Assets and Liabilities
The following table presents quantitative information about significant unobservable inputs used in Level 3 fair value measurements that are developed internally by the Company as of December 31, 20192022 and 20182021 (dollars in millions):
| | | | | | | | | | | | | | | | | | | | | | | | | | | | | | | | | | | | | | |
| | | Estimated Fair Value | | Valuation | | Unobservable | | Range (Weighted Average) |
| Assets: | | 2022 | | 2021 | | Technique | | Input | | 2022 | | 2021 |
| Corporate | | $ | 25 | | | $ | 49 | | | Market comparable securities | | Liquidity premium | | 1% | | 0-1% (1%) |
| | | | | | | | EBITDA Multiple | | 5.3x | | 5.2x-7.0x (6.4x) |
| ABS | | 274 | | | 205 | | | Market comparable securities | | Liquidity premium | | 0-18% (2%) | | 2-18% (4%) |
| U.S. government | | 9 | | | 12 | | | Market comparable
securities | | Liquidity premium | | 0-1% (1%) | | 0-1% (1%) |
| | | | | | | | | | | | |
| | | | | | | | | | | | |
| Equity securities | | 9 | | | 5 | | | Market comparable
securities | | EBITDA Multiple | | 8.4x-11.2x (9.6x) | | 6.9x-10.6x (8.0x) |
| | | | | | | | | | | | |
| Funds withheld at interest – embedded derivatives | | (34) | | | 182 | | | Total return swap | | Mortality | | 0-100% (3%) | | 0-100% (3%) |
| | | | | | | | Lapse | | 0-35% (17%) | | 0-35% (18%) |
| | | | | | | | Withdrawal | | 0-5% (4%) | | 0-5% (4%) |
| | | | | | | | CVA | | 0-5% (0%) | | 0-5% (0%) |
| | | | | | | | Crediting rate | | 1-4% (2%) | | 1-4% (2%) |
| | | | | | | | | | | | |
| | | | | | | | | | | | |
| Liabilities: | | | | | | | | | | | | |
| Interest-sensitive contract liabilities – embedded derivatives – indexed annuities | | 530 | | | 693 | | | Discounted cash flow | | Mortality | | 0-100% (3%) | | 0-100% (2%) |
| | | | | | | | Lapse | | 0-35% (16%) | | 0-35% (16%) |
| | | | | | | | Withdrawal | | 0-5% (3%) | | 0-5% (3%) |
| | | | | | | | Option budget
projection | | 1-4% (2%) | | 1-4% (2%) |
| Interest-sensitive contract liabilities – embedded derivatives – variable annuities | | 124 | | | 162 | | | Discounted cash flow | | Mortality | | 0-100% (2%) | | 0-100% (2%) |
| | | | | | | | Lapse | | 0-25% (3%) | | 0-25% (4%) |
| | | | | | | | Withdrawal | | 0-7% (6%) | | 0-7% (5%) |
| | | | | | | | CVA | | 0-5% (1%) | | 0-5% (1%) |
| | | | | | | | Long-term volatility | | 0-27% (13%) | | 0-27% (14%) |
| | | | | | | | | | | | |
| | | | | | | | | | | | |
|
| | | | | | | | | | | | | | | | | | |
| | | Estimated Fair Value | | Valuation | | Unobservable | | Range (Weighted Average) |
| Assets: | | 2019 | | 2018 | | Technique | | Input | | 2019 | | 2018 |
| Corporate | | $ | 1,070 |
| | $ | 643 |
| | Market comparable securities | | Liquidity premium | | 0-2% (1%) |
| | 0-5% (1%) |
|
| | | | | | | | | EBITDA Multiple | | 5.2x-7.1x (6.7x) |
| | 5.9x-7.5x (6.5x) |
|
| ABS | | 101 |
| | 78 |
| | Market comparable securities | | Liquidity premium | | 0-4% (1%) |
| | 0-1% (1%) |
|
| U.S. government | | 16 |
| | 18 |
| | Market comparable securities | | Liquidity premium | | 0-1% (1%) |
| | 0-1% (1%) |
|
| Other foreign government | | 16 |
| | 5 |
| | Market comparable securities | | Liquidity premium | | 0-1% (1%) |
| | 1 | % |
| Equity securities | | 32 |
| | 25 |
| | Market comparable securities | | Liquidity premium | | 4 | % | | 4 | % |
| | | | | | | | | EBITDA Multiple | | 6.9x-9.3x (7.8x) |
| | 6.9x-12.3x (7.9x) |
|
| Funds withheld at interest- embedded derivatives | | 121 |
| | 110 |
| | Total return swap | | Mortality | | 0-100% (2%) |
| | 0-100% (2%) |
|
| | | | | | | | | Lapse | | 0-35% (13%) |
| | 0-35% (10%) |
|
| | | | | | | | | Withdrawal | | 0-5% (3%) |
| | 0-5% (3%) |
|
| | | | | | | | | CVA | | 0-5% (1%) |
| | 0-5% (1%) |
|
| | | | | | | | | Crediting rate | | 2-4% (2%) |
| | 2-4% (2%) |
|
| Longevity swaps | | — |
| | 48 |
| | Discounted cash flow | | Mortality | | — |
| | 0-100% (2%) |
|
| | | | | | | | | Mortality improvement | | — |
| | (10%)-10% (3%) |
|
| Liabilities: | | | | | | | | | | | | |
| Interest-sensitive contract liabilities- embedded derivatives- indexed annuities | | 768 |
| | 777 |
| | Discounted cash flow | | Mortality | | 0-100% (2%) |
| | 0-100% (2%) |
|
| | | | | | | | | Lapse | | 0-35% (13%) |
| | 0-35% (10%) |
|
| | | | | | | | | Withdrawal | | 0-5% (3%) |
| | 0-5% (3%) |
|
| | | | | | | | | Option budget projection | | 2-4% (2%) |
| | 2-4% (2%) |
|
| Interest-sensitive contract liabilities- embedded derivatives- variable annuities | | 163 |
| | 168 |
| | Discounted cash flow | | Mortality | | 0-100% (1%) |
| | 0-100% (1%) |
|
| | | | | | | | | Lapse | | 0-25% (5%) |
| | 0-25% (5%) |
|
| | | | | | | | | Withdrawal | | 0-7% (5%) |
| | 0-7% (5%) |
|
| | | | | | | | | CVA | | 0-5% (1%) |
| | 0-5% (1%) |
|
| | | | | | | | | Long-term volatility | | 0-27% (12%) |
| | 0-27% (13%) |
|
| Mortality swaps | | — |
| | — |
| | Discounted cash flow | | Mortality | | — |
| | 0-100% (1%) |
|
Changes in Level 3 Assets and Liabilities
Assets and liabilities transferred into Level 3 are due to a lack of observable market transactions and price information. Transfers out of Level 3 are primarily the result of the Company obtaining observable pricing information or a third party pricing quotation that appropriately reflects the fair value of those assets and liabilities. In 2018, the Company transferred equity securities with a fair value of approximately $39 million into Level 3 as a result of the adoption of the accounting guidance for the recognition and measurement of equity securities.
The reconciliations for all assets and liabilities measured at fair value on a recurring basis using significant unobservable inputs (Level 3) are as follows (dollars in millions):
| | | | | | | | | | | | | | | | | | | | | | | | | | | | | | | | | | | | | | | | | | | | | | | | | | | | | | | | |
| For the year ended December 31, 2022: | | Fixed maturity securities – available-for-sale | | | | | | Funds withheld at interest –embedded derivatives, net(1) | | Funds
withheld at interest | | Interest-sensitive contract
liabilities – embedded derivatives |
| | | Corporate | | Foreign govt | | Structured securities | | U.S. and local govt | | Equity securities | | Short-term investments | | | |
| Fair value, beginning of period | | $ | 3,888 | | | $ | 33 | | | $ | 1,179 | | | $ | 45 | | | $ | 50 | | | $ | 28 | | | $ | 165 | | | $ | 83 | | | $ | (855) | |
| Total gains/losses (realized/unrealized) | | | | | | | | | | | | | | | | | | |
| Included in earnings, net: | | | | | | | | | | | | | | | | | | |
| Net investment income | | 6 | | | — | | | — | | | — | | | — | | | — | | | — | | | (14) | | | — | |
| Investment related gains (losses), net | | (8) | | | — | | | (11) | | | (1) | | | 6 | | | 1 | | | (173) | | | — | | | 38 | |
| | | | | | | | | | | | | | | | | | |
| Interest credited | | — | | | — | | | — | | | — | | | — | | | — | | | — | | | — | | | 98 | |
| | | | | | | | | | | | | | | | | | |
| Included in other comprehensive income (loss) | | (474) | | | (11) | | | (194) | | | (4) | | | — | | | (1) | | | — | | | (8) | | | — | |
| | | | | | | | | | | | | | | | | | |
Purchases(2) | | 1,669 | | | — | | | 521 | | | — | | | 14 | | | 33 | | | — | | | 3 | | | 1 | |
Sales(2) | | (182) | | | — | | | (58) | | | (6) | | | (4) | | | — | | | — | | | — | | | — | |
Settlements(2) | | (577) | | | — | | | (140) | | | (5) | | | — | | | (28) | | | — | | | (10) | | | 65 | |
| Transfers into Level 3 | | 88 | | | 13 | | | 130 | | | 10 | | | — | | | — | | | — | | | — | | | — | |
| Transfers out of Level 3 | | (111) | | | — | | | (74) | | | (4) | | | — | | | (20) | | | — | | | — | | | — | |
| Fair value, end of period | | $ | 4,299 | | | $ | 35 | | | $ | 1,353 | | | $ | 35 | | | $ | 66 | | | $ | 13 | | | $ | (8) | | | $ | 54 | | | $ | (653) | |
| Total gains/losses (realized/unrealized) recorded for the period relating to those Level 3 assets and liabilities that were still held at the end of the period |
| Included in earnings, net: | | | | | | | | | | | | | | | | | | |
| Net investment income | | $ | 4 | | | $ | — | | | $ | — | | | $ | — | | | $ | — | | | $ | — | | | $ | — | | | $ | (14) | | | $ | — | |
| Investment related gains (losses), net | | (18) | | | — | | | (10) | | | — | | | 4 | | | — | | | (173) | | | — | | | 33 | |
| | | | | | | | | | | | | | | | | | |
| | | | | | | | | | | | | | | | | | |
| Interest credited | | — | | | — | | | — | | | — | | | — | | | — | | | — | | | — | | | 33 | |
| Included in other comprehensive income (loss) | | (467) | | | (11) | | | (195) | | | (4) | | | — | | | — | | | — | | | (8) | | | — | |
| | | | | | | | | | | | | | | | | | |
|
| | | | | | | | | | | | | | | | | | | | | | | | | | | | | | | | | | | | |
| For the year ended December 31, 2019: | | Fixed maturity securities - available-for-sale | | | | | | Funds withheld at interest-embedded derivatives | | Other assets - longevity and mortality swaps | | Interest-sensitive contract
liabilities embedded derivatives |
| | | Corporate | | Foreign govt | | Structured securities | | U.S. and local govt | | Equity securities | | Short-term investments | | | |
| Fair value, beginning of period | | $ | 1,331 |
| | $ | 533 |
| | $ | 103 |
| | $ | 28 |
| | $ | 33 |
| | $ | 2 |
| | $ | 110 |
| | $ | 48 |
| | $ | (945 | ) |
| Total gains/losses (realized/unrealized) | | | | | | | | | | | | | | | | | | |
| Included in earnings, net: | | | | | | | | | | | | | | | | | | |
| Investment income, net of related expenses | | 1 |
| | 15 |
| | — |
| | — |
| | — |
| | — |
| | — |
| | — |
| | — |
|
| Investment related gains (losses), net | | (11 | ) | | — |
| | — |
| | — |
| | 12 |
| | — |
| | 11 |
| | — |
| | 5 |
|
| Interest credited | | — |
| | — |
| | — |
| | — |
| | — |
| | — |
| | — |
| | — |
| | (57 | ) |
| Included in other comprehensive income | | 48 |
| | 162 |
| | 4 |
| | 1 |
| | — |
| | (1 | ) | | — |
| | (2 | ) | | — |
|
| Other revenue | | — |
| | — |
| | — |
| | — |
| | — |
| | — |
| | — |
| | 12 |
| | — |
|
Purchases(1) | | 1,050 |
| | 10 |
| | 85 |
| | — |
| | 33 |
| | 30 |
| | — |
| | — |
| | (17 | ) |
Sales(1) | | (81 | ) | | — |
| | (1 | ) | | — |
| | (1 | ) | | (1 | ) | | — |
| | — |
| | — |
|
Settlements(1) | | (194 | ) | | — |
| | (63 | ) | | (4 | ) | | — |
| | (1 | ) | | — |
| | (58 | ) | | 84 |
|
| Transfers into Level 3 | | 43 |
| | — |
| | 86 |
| | — |
| | — |
| | — |
| | — |
| | — |
| | — |
|
| Transfers out of Level 3 | | (1 | ) | | — |
| | (6 | ) | | — |
| | — |
| | (27 | ) | | — |
| | — |
| | — |
|
| Fair value, end of period | | $ | 2,186 |
| | $ | 720 |
| | $ | 208 |
| | $ | 25 |
| | $ | 77 |
| | $ | 2 |
| | $ | 121 |
| | $ | — |
| | $ | (930 | ) |
| Unrealized gains and losses recorded in earnings for the period relating to those Level 3 assets and liabilities that were still held at the end of the period |
| Included in earnings, net: | | | | | | | | | | | | | | | | | | |
| Investment income, net of related expenses | | $ | 2 |
| | $ | 15 |
| | $ | — |
| | $ | — |
| | $ | — |
| | $ | — |
| | $ | — |
| | $ | — |
| | $ | — |
|
| Investment related gains (losses), net | | (11 | ) | | — |
| | — |
| | — |
| | 12 |
| | — |
| | 11 |
| | — |
| | (3 | ) |
| Other revenues | | — |
| | — |
| | — |
| | — |
| | — |
| | — |
| | — |
| | — |
| | — |
|
| Interest credited | | — |
| | — |
| | — |
| | — |
| | — |
| | — |
| | — |
| | — |
| | (140 | ) |
| | | | | | | | | | | | | | | | | | | | | | | | | | | | | | | | | | | | | | | | | | | | | | | | | | | | | | | | |
| For the year ended December 31, 2021: | | Fixed maturity securities – available-for-sale | | | | | | Funds withheld at interest –embedded derivatives, net(1) | | Funds
withheld at interest | | Interest-sensitive contract
liabilities – embedded derivatives |
| | | Corporate | | Foreign govt | | Structured securities | | U.S. and local govt | | Equity securities | | Short-term investments | | | |
| Fair value, beginning of period | | $ | 3,029 | | | $ | 17 | | | $ | 254 | | | $ | 23 | | | $ | 53 | | | $ | 15 | | | $ | 58 | | | $ | 56 | | | $ | (907) | |
| Total gains/losses (realized/unrealized) | | | | | | | | | | | | | | | | | | |
| Included in earnings, net: | | | | | | | | | | | | | | | | | | |
| Net investment income | | 5 | | | — | | | 1 | | | — | | | — | | | — | | | — | | | (4) | | | — | |
| Investment related gains (losses), net | | (5) | | | — | | | — | | | — | | | 13 | | | — | | | 107 | | | — | | | (7) | |
| | | | | | | | | | | | | | | | | | |
| Interest credited | | — | | | — | | | — | | | — | | | — | | | — | | | — | | | — | | | 10 | |
| | | | | | | | | | | | | | | | | | |
| Included in other comprehensive income (loss) | | (28) | | | (4) | | | (6) | | | — | | | — | | | — | | | — | | | (1) | | | — | |
| | | | | | | | | | | | | | | | | | |
Purchases(2) | | 1,506 | | | 25 | | | 1,038 | | | — | | | 9 | | | 31 | | | — | | | 36 | | | (34) | |
Sales(2) | | (53) | | | — | | | (6) | | | — | | | (25) | | | (3) | | | — | | | — | | | — | |
Settlements(2) | | (587) | | | (5) | | | (186) | | | (3) | | | — | | | (10) | | | — | | | (4) | | | 83 | |
| Transfers into Level 3 | | 29 | | | — | | | 84 | | | 25 | | | — | | | — | | | — | | | — | | | — | |
| Transfers out of Level 3 | | (8) | | | — | | | — | | | — | | | — | | | (5) | | | — | | | — | | | — | |
| Fair value, end of period | | $ | 3,888 | | | $ | 33 | | | $ | 1,179 | | | $ | 45 | | | $ | 50 | | | $ | 28 | | | $ | 165 | | | $ | 83 | | | $ | (855) | |
| Total gains/losses (realized/unrealized) recorded for the period relating to those Level 3 assets and liabilities that were still held at the end of the period |
| Included in earnings, net: | | | | | | | | | | | | | | | | | | |
| Net investment income | | $ | 4 | | | $ | — | | | $ | 1 | | | $ | — | | | $ | — | | | $ | — | | | $ | — | | | $ | (4) | | | $ | — | |
| Investment related gains (losses), net | | (7) | | | — | | | — | | | — | | | 7 | | | — | | | 107 | | | — | | | (15) | |
| | | | | | | | | | | | | | | | | | |
| | | | | | | | | | | | | | | | | | |
| Interest credited | | — | | | — | | | — | | | — | | | — | | | — | | | — | | | — | | | (72) | |
| Included in other comprehensive income (loss) | | (24) | | | (4) | | | (6) | | | — | | | — | | | — | | | — | | | (1) | | | — | |
| | | | | | | | | | | | | | | | | | |
(1)Funds withheld at interest – embedded derivative assets and liabilities are presented net for purposes of the rollforward.
(2)The amount reported within purchases, sales and settlements is the purchase price (for purchases) and the sales/settlement proceeds (for sales and settlements) based upon the actual date purchased or sold/settled. Items purchased and sold/settled in the same period are excluded from the rollforward. The Company had no issuances during the period.
|
| | | | | | | | | | | | | | | | | | | | | | | | | | | | | | | | | | | | |
| For the year ended December 31, 2018: | | Fixed maturity securities - available-for-sale | | | | | | Funds withheld at interest-embedded derivatives | | Other assets - longevity and mortality swaps | | Interest-sensitive contract
liabilities embedded derivatives |
| | | Corporate | | Foreign govt | | Structured securities | | U.S. and local govt | | Equity securities | | Short-term investments | | | |
| Fair value, beginning of period | | $ | 1,337 |
| | $ | 599 |
| | $ | 235 |
| | $ | 64 |
| | $ | — |
| | $ | 3 |
| | $ | 122 |
| | $ | 39 |
| | $ | (1,014 | ) |
| Total gains/losses (realized/unrealized) | | | | | | | | | | | | | | | | | | |
| Included in earnings, net: | | | | | | | | | | | | | | | | | | |
| Investment income, net of related expenses | | (1 | ) | | 14 |
| | — |
| | — |
| | — |
| | — |
| | — |
| | — |
| | — |
|
| Investment related gains (losses), net | | (5 | ) | | — |
| | 2 |
| | — |
| | (13 | ) | | — |
| | (12 | ) | | — |
| | (15 | ) |
| Interest credited | | — |
| | — |
| | — |
| | — |
| | — |
| | — |
| | — |
| | — |
| | 27 |
|
| Included in other comprehensive income | | (33 | ) | | (80 | ) | | (3 | ) | | — |
| | — |
| | — |
| | — |
| | (2 | ) | | — |
|
| Other revenue | | — |
| | — |
| | — |
| | — |
| | — |
| | — |
| | — |
| | 9 |
| | — |
|
Purchases(1) | | 509 |
| | — |
| | 94 |
| | — |
| | 14 |
| | 3 |
| | — |
| | — |
| | (19 | ) |
Sales(1) | | (106 | ) | | — |
| | (7 | ) | | — |
| | (7 | ) | | — |
| | — |
| | — |
| | — |
|
Settlements(1) | | (273 | ) | | — |
| | (62 | ) | | (5 | ) | | — |
| | (1 | ) | | — |
| | 2 |
| | 76 |
|
| Transfers into Level 3 | | 10 |
| | — |
| | 78 |
| | 10 |
| | 39 |
| | — |
| | — |
| | — |
| | — |
|
| Transfers out of Level 3 | | (107 | ) | | — |
| | (234 | ) | | (41 | ) | | — |
| | (3 | ) | | — |
| | — |
| | — |
|
| Fair value, end of period | | $ | 1,331 |
| | $ | 533 |
| | $ | 103 |
| | $ | 28 |
| | $ | 33 |
| | $ | 2 |
| | $ | 110 |
| | $ | 48 |
| | $ | (945 | ) |
| Unrealized gains and losses recorded in earnings for the period relating to those Level 3 assets and liabilities that were still held at the end of the period |
| Included in earnings, net: | | | | | | | | | | | | | | | | | | |
| Investment income, net of related expenses | | $ | (1 | ) | | $ | 14 |
| | $ | — |
| | $ | — |
| | $ | — |
| | $ | — |
| | $ | — |
| | $ | — |
| | $ | — |
|
| Investment related gains (losses), net | | (6 | ) | | — |
| | — |
| | — |
| | (16 | ) | | — |
| | (12 | ) | | — |
| | (22 | ) |
| Other revenues | | — |
| | — |
| | — |
| | — |
| | — |
| | — |
| | — |
| | 9 |
| | — |
|
| Interest credited | | — |
| | — |
| | — |
| | — |
| | — |
| | — |
| | — |
| | — |
| | (49 | ) |
|
| | | | | | | | | | | | | | | | | | | | | | | | | | | | | | | | |
| For the year ended December 31, 2017: | | Fixed maturity securities - available-for-sale | | | | Funds withheld at interest-embedded derivatives | | Other assets - longevity and mortality swaps | | Interest-sensitive contract
liabilities embedded derivatives |
| | | Corporate | | Foreign govt | | Structured securities | | U.S. and local govt | | Short-term investments | | | |
| Fair value, beginning of period | | $ | 1,272 |
| | $ | 489 |
| | $ | 401 |
| | $ | 66 |
| | $ | 3 |
| | $ | (23 | ) | | $ | 25 |
| | $ | (990 | ) |
| Total gains/losses (realized/unrealized) | | | | | | | | | | | | | | | | |
| Included in earnings, net: | | | | | | | | | | | | | | | | |
| Investment income, net of related expenses | | (1 | ) | | 13 |
| | 2 |
| | — |
| | — |
| | — |
| | — |
| | — |
|
| Investment related gains (losses), net | | 5 |
| | — |
| | — |
| | — |
| | — |
| | 145 |
| | — |
| | 32 |
|
| Interest credited | | — |
| | — |
| | — |
| | — |
| | — |
| | — |
| | — |
| | (80 | ) |
| Included in other comprehensive income | | (7 | ) | | 105 |
| | 9 |
| | — |
| | — |
| | — |
| | 4 |
| | — |
|
| Other revenue | | — |
| | — |
| | — |
| | — |
| | — |
| | — |
| | 8 |
| | — |
|
Purchases(1) | | 409 |
| | — |
| | 123 |
| | — |
| | 4 |
| | — |
| | — |
| | (55 | ) |
Sales(1) | | (89 | ) | | — |
| | (32 | ) | | — |
| | — |
| | — |
| | — |
| | — |
|
Settlements(1) | | (286 | ) | | (1 | ) | | (112 | ) | | (2 | ) | | — |
| | — |
| | 2 |
| | 79 |
|
| Transfers into Level 3 | �� | 47 |
| | — |
| | 96 |
| | 7 |
| | — |
| | — |
| | — |
| | — |
|
| Transfers out of Level 3 | | (13 | ) | | (7 | ) | | (252 | ) | | (7 | ) | | (4 | ) | | — |
| | — |
| | — |
|
| Fair value, end of period | | $ | 1,337 |
| | $ | 599 |
| | $ | 235 |
| | $ | 64 |
| | $ | 3 |
| | $ | 122 |
| | $ | 39 |
| | $ | (1,014 | ) |
| Unrealized gains and losses recorded in earnings for the period relating to those Level 3 assets and liabilities that were still held at the end of the period |
| Included in earnings, net: | | | | | | | | | | | | | | | | |
| Investment income, net of related expenses | | $ | (1 | ) | | $ | 13 |
| | $ | — |
| | $ | — |
| | $ | — |
| | $ | — |
| | $ | — |
| | $ | — |
|
| Investment related gains (losses), net | | (5 | ) | | — |
| | — |
| | — |
| | — |
| | 145 |
| | — |
| | 23 |
|
| Other revenues | | — |
| | — |
| | — |
| | — |
| | — |
| | — |
| | 8 |
| | — |
|
| Interest credited | | — |
| | — |
| | — |
| | — |
| | — |
| | — |
| | — |
| | (159 | ) |
| |
(1) | The amount reported within purchases, sales and settlements is the purchase price (for purchases) and the sales/settlement proceeds (for sales and settlements) based upon the actual date purchased or sold/settled. Items purchased and sold/settled in the same period are excluded from the rollforward. The Company had no issuances during the period. |
| | | | | | | | | | | | | | | | | | | | | | | | | | | | | | | | | | | | | | | | | | | | | | | | | | | | | | | | |
| For the year ended December 31, 2020: | | Fixed maturity securities – available-for-sale | | | | | | Funds
withheld at interest –embedded derivatives | | Funds
withheld at interest | | Interest-sensitive contract
liabilities – embedded derivatives |
| | | Corporate | | Foreign govt | | Structured securities | | U.S. and local govt | | Equity securities | | Short-term investments | | | |
| Fair value, beginning of period | | $ | 2,186 | | | $ | 720 | | | $ | 208 | | | $ | 25 | | | $ | 77 | | | $ | 2 | | | $ | 121 | | | $ | — | | | $ | (930) | |
| Total gains/losses (realized/unrealized) | | | | | | | | | | | | | | | | | | |
| Included in earnings, net: | | | | | | | | | | | | | | | | | | |
| Net investment income | | 2 | | | — | | | — | | | — | | | — | | | — | | | — | | | (4) | | | — | |
| Investment related gains (losses), net | | (22) | | | — | | | — | | | — | | | (13) | | | — | | | (63) | | | — | | | 8 | |
| | | | | | | | | | | | | | | | | | |
| Interest credited | | — | | | — | | | — | | | — | | | — | | | — | | | — | | | — | | | (30) | |
| | | | | | | | | | | | | | | | | | |
| Included in other comprehensive income (loss) | | 28 | | | 1 | | | (7) | | | 1 | | | — | | | — | | | — | | | — | | | — | |
| | | | | | | | | | | | | | | | | | |
Purchases(1) | | 1,193 | | | — | | | 149 | | | — | | | 3 | | | 17 | | | — | | | 60 | | | (32) | |
Sales(1) | | (182) | | | — | | | (5) | | | — | | | — | | | — | | | — | | | — | | | — | |
Settlements(1) | | (229) | | | — | | | (59) | | | (3) | | | — | | | (3) | | | — | | | — | | | 77 | |
| Transfers into Level 3 | | 57 | | | — | | | 38 | | | — | | | — | | | — | | | — | | | — | | | — | |
| Transfers out of Level 3 | | (4) | | | (704) | | | (70) | | | — | | | (14) | | | (1) | | | — | | | — | | | — | |
| Fair value, end of period | | $ | 3,029 | | | $ | 17 | | | $ | 254 | | | $ | 23 | | | $ | 53 | | | $ | 15 | | | $ | 58 | | | $ | 56 | | | $ | (907) | |
| Total gains/losses (realized/unrealized) recorded for the period relating to those Level 3 assets and liabilities that were still held at the end of the period |
| Included in earnings, net: | | | | | | | | | | | | | | | | | | |
| Net investment income | | $ | — | | | $ | — | | | $ | — | | | $ | — | | | $ | — | | | $ | — | | | $ | — | | | $ | (4) | | | $ | — | |
| Investment related gains (losses), net | | (23) | | | — | | | — | | | — | | | (13) | | | — | | | (63) | | | — | | | (2) | |
| | | | | | | | | | | | | | | | | | |
| | | | | | | | | | | | | | | | | | |
| Interest credited | | — | | | — | | | — | | | — | | | — | | | — | | | — | | | — | | | (107) | |
| Included in other comprehensive income (loss) | | (34) | | | 1 | | | (8) | | | 1 | | | — | | | — | | | — | | | — | | | — | |
| | | | | | | | | | | | | | | | | | |
(1)The amount reported within purchases, sales and settlements is the purchase price (for purchases) and the sales/settlement proceeds (for sales and settlements) based upon the actual date purchased or sold/settled. Items purchased and sold/settled in the same period are excluded from the rollforward. The Company had no issuances during the period.
Nonrecurring Fair Value Measurements
The following table presents information forCompany has certain assets measuredsubject to measurement at an estimated fair value on a nonrecurring basis, duringin periods subsequent to their initial recognition if they are determined to be impaired. For the periods presentedyears ended December 31, 2022 and still held2021, the Company did not have any material assets that were measured at the reporting date (for example, when there is evidencefair value due to impairment.
|
| | | | | | | | | | | | | | | | |
| | | Carrying Value After Measurement | | Net Investment Gains (Losses) |
| | | At December 31, | | Years ended December 31, |
| (dollars in millions) | | 2019 | | 2018 | | 2019 | | 2018 |
Limited partnership interests and real estate joint ventures(1) | | $ | 18 |
| | $ | 5 |
| | $ | (11 | ) | | $ | (3 | ) |
| |
(1)Contents
| Impairments on these investments were recognized at estimated fair value determined using the net asset values of the Company’s ownership interest as provided in the financial statements of the investees. Real estate joint ventures were recognized at estimated fair value determined using historical and forecasted information for specific properties, including net operating income, occupancy, and sales levels. The market for these investments has limited activity and price transparency. |
Fair Value of Financial Instruments Carried at Other Than Fair Value
The following table presents the carrying amountsvalues and estimated fair values of the Company’s financial instruments, which were not measured at fair value on a recurring basis, as of December 31, 20192022 and 20182021 (dollars in millions). This table excludes any payables or receivables for collateral under repurchase/reverse repurchase agreements and other transactions. The estimated fair value of the excluded amount approximates carrying value as they equal the amount of cash collateral received/paid.
| | | | | | | | | | | | | | | | | | | | | | | | | | | | | | | | |
| | | | Estimated Fair | | Fair Value Measurement Using: |
| December 31, 2022: | | Carrying Value (1) | | Value | | Level 1 | | Level 2 | | Level 3 |
| Assets: | | | | | | | | | | |
| Mortgage loans | | $ | 6,590 | | | $ | 6,109 | | | $ | — | | | $ | — | | | $ | 6,109 | |
| Policy loans | | 1,231 | | | 1,231 | | | — | | | 1,231 | | | — | |
| Funds withheld at interest | | 6,319 | | | 5,884 | | | — | | | — | | | 5,884 | |
| Limited partnerships – cost method | | 49 | | | 52 | | | — | | | — | | | 52 | |
| Cash and cash equivalents | | 1,392 | | | 1,392 | | | 1,392 | | | — | | | — | |
| Short-term investments | | 33 | | | 33 | | | 33 | | | — | | | — | |
| Other invested assets | | 947 | | | 758 | | | 4 | | | 65 | | | 689 | |
| Accrued investment income | | 630 | | | 630 | | | — | | | 630 | | | — | |
| Liabilities: | | | | | | | | | | |
| Interest-sensitive contract liabilities | | $ | 23,493 | | | $ | 23,065 | | | $ | — | | | $ | — | | | $ | 23,065 | |
| Other liabilities – funds withheld at interest | | 1,596 | | | 1,321 | | | — | | | — | | | 1,321 | |
| Long-term debt | | 3,961 | | | 3,670 | | | — | | | — | | | 3,670 | |
| | | | | | | | | | |
| | | | | | | | | | |
| December 31, 2021: | | | | | | | | | | |
| Assets: | | | | | | | | | | |
| Mortgage loans | | $ | 6,283 | | | $ | 6,580 | | | $ | — | | | $ | — | | | $ | 6,580 | |
| Policy loans | | 1,234 | | | 1,234 | | | — | | | 1,234 | | | — | |
| Funds withheld at interest | | 6,747 | | | 7,075 | | | — | | | — | | | 7,075 | |
| Limited partnerships – cost method | | 63 | | | 81 | | | — | | | — | | | 81 | |
| Cash and cash equivalents | | 1,810 | | | 1,810 | | | 1,810 | | | — | | | — | |
| Short-term investments | | 23 | | | 23 | | | 23 | | | — | | | — | |
| Other invested assets | | 847 | | | 826 | | | 6 | | | 70 | | | 750 | |
| Accrued investment income | | 533 | | | 533 | | | — | | | 533 | | | — | |
| Liabilities: | | | | | | | | | | |
| Interest-sensitive contract liabilities | | $ | 18,625 | | | $ | 19,540 | | | $ | — | | | $ | — | | | $ | 19,540 | |
| Other liabilities – funds withheld at interest | | 1,658 | | | 1,657 | | | — | | | — | | | 1,657 | |
| Long-term debt | | 3,667 | | | 3,886 | | | — | | | — | | | 3,886 | |
| Collateral finance and securitization notes | | 180 | | | 153 | | | — | | | — | | | 153 | |
|
| | | | | | | | | | | | | | | | | | | | | | | | |
| | | | | Estimated Fair | | Fair Value Measurement Using: |
| December 31, 2019: | | Carrying Value (1) | | Value | | Level 1 | | Level 2 | | Level 3 | | NAV |
| Assets: | | | | | | | | | | | | |
| Mortgage loans on real estate | | $ | 5,706 |
| | $ | 5,935 |
| | $ | — |
| | $ | — |
| | $ | 5,935 |
| | $ | — |
|
| Policy loans | | 1,319 |
| | 1,319 |
| | — |
| | 1,319 |
| | — |
| | — |
|
| Funds withheld at interest | | 5,526 |
| | 5,870 |
| | — |
| | — |
| | 5,870 |
| | — |
|
| Cash and cash equivalents | | 1,175 |
| | 1,175 |
| | 1,175 |
| | — |
| | — |
| | — |
|
| Short-term investments | | 32 |
| | 32 |
| | 32 |
| | — |
| | — |
| | — |
|
| Other invested assets | | 1,259 |
| | 1,278 |
| | 5 |
| | 68 |
| | 803 |
| | 402 |
|
| Accrued investment income | | 493 |
| | 493 |
| | — |
| | 493 |
| | ��� |
| | — |
|
| Liabilities: | | | |
| | | | | | | | |
| Interest-sensitive contract liabilities | | $ | 19,163 |
| | $ | 21,542 |
| | $ | — |
| | $ | — |
| | $ | 21,542 |
| | $ | — |
|
| Long-term debt | | 2,981 |
| | 3,179 |
| | — |
| | — |
| | 3,179 |
| | — |
|
| Collateral finance and securitization notes | | 598 |
| | 551 |
| | — |
| | — |
| | 551 |
| | — |
|
| | | | | | | | | | | | | |
| December 31, 2018: | | | | | | | | | | | | |
| Assets: | | | | | | | | | | | | |
| Mortgage loans on real estate | | $ | 4,966 |
| | $ | 4,917 |
| | $ | — |
| | $ | — |
| | $ | 4,917 |
| | $ | — |
|
| Policy loans | | 1,345 |
| | 1,345 |
| | — |
| | 1,345 |
| | — |
| | — |
|
| Funds withheld at interest | | 5,655 |
| | 5,803 |
| | — |
| | — |
| | 5,803 |
| | — |
|
| Cash and cash equivalents | | 1,405 |
| | 1,405 |
| | 1,405 |
| | — |
| | — |
| | — |
|
| Short-term investments | | 37 |
| | 37 |
| | 37 |
| | — |
| | — |
| | — |
|
| Other invested assets | | 946 |
| | 941 |
| | 5 |
| | 83 |
| | 477 |
| | 376 |
|
| Accrued investment income | | 428 |
| | 428 |
| | — |
| | 428 |
| | — |
| | — |
|
| Liabilities: | | | | | | | | | | | | |
| Interest-sensitive contract liabilities | | $ | 14,547 |
| | $ | 14,611 |
| | $ | — |
| | $ | — |
| | $ | 14,611 |
| | $ | — |
|
| Long-term debt | | 2,788 |
| | 2,752 |
| | — |
| | — |
| | 2,752 |
| | — |
|
| Collateral finance and securitization notes | | 682 |
| | 627 |
| | — |
| | — |
| | 627 |
| | — |
|
| |
(1) | Carrying values presented herein may differ from those in the Company’s consolidated balance sheets because certain items within the respective financial statement captions may be measured at fair value on a recurring basis. |
Mortgage Loans on Real Estate – The fair value of mortgage loans on real estate is estimated by discounting cash flows, both principal and interest, using current interest rates for mortgage loans with similar credit ratings and similar remaining maturities. As such, inputs include current treasury yields and spreads, which are based on the credit rating and average life of the loan, corresponding to the market spreads. The valuation of mortgage loans on real estate is considered Level 3 in the fair value hierarchy.
Policy Loans – Policy loans typically carry an interest rate that is adjusted annually based on an observable market index and therefore carrying value approximates fair value. The valuation of policy loans is considered Level 2 in the fair value hierarchy.
Funds Withheld at Interest – The carrying value of funds withheld at interest approximates fair value except where the funds withheld are specifically identified in the agreement. When funds withheld are specifically identified in the agreement, the fair value is based on the fair value of the underlying assets that are held by the ceding company. Ceding companies use aA variety of sources and pricing methodologies, which are not transparent to the Company and may include significant unobservable inputs, are used to value the securities that are held in distinct portfolios, therefore the valuation of these funds withheld assets and liabilities are considered Level 3 in the fair value hierarchy.
Limited Partnerships – The fair value of limited partnerships accounted for using the cost method, considered Level 3 in the fair value hierarchy, is estimated by internally developed valuation techniques.
Cash and Cash Equivalents and Short-term Investments – The carrying values of cash and cash equivalents and short-term investments approximatesapproximate fair values due to the short-term maturities of these instruments and are considered Level 1 in the fair value hierarchy.
Other Invested Assets – This primarily includes limited partnership interests accounted for using the cost method,lifetime mortgages, FHLB common stock, and cash collateral and lifetime mortgages.collateral. The fair value of limited partnership interests and other investments accounted for using the cost method is determined using the NAV of the Company’s ownership interest as providedlifetime mortgage loan portfolio, considered Level 3 in the financial statementsfair value hierarchy, is estimated by discounting cash flows, both principal and interest, using a risk-free rate plus an illiquidity premium. The cash flow analysis considers future expenses, changes in property prices, and actuarial analysis of the investees.borrower behavior, mortality and morbidity. The fair value of the Company’s common stock investment in the FHLB is considered to be the carrying value and it is considered Level 2 in the fair value hierarchy. The fair value of the Company’s cash collateral is considered to be the carrying value and considered to be Level 1 in the fair value hierarchy. The fair value of the Company’s lifetime mortgage loan portfolio, considered Level 3 in the fair value hierarchy, is estimated by discounting cash flows, both principal and interest, using a risk-free rate plus an illiquidity premium. The cash flow analysis considers future expenses, changes in property prices, and actuarial analysis of borrower behavior, mortality and morbidity.
Accrued Investment Income – The carrying value for accrued investment income approximates fair value as there are no adjustments made to the carrying value. This is considered Level 2 in the fair value hierarchy.
Interest-Sensitive Contract Liabilities – The carrying and fair values of interest-sensitive contract liabilities reflected in the table above exclude contracts with significant mortality risk. The fair value of the Company’s interest-sensitive contract liabilities utilizes a market standard technique with both capital market inputs and policyholder behavior assumptions, as well as cash values adjusted for recapture fees. The capital market inputs to the model, such as interest rates, are generally observable. Policyholder behavior assumptions are generally not observable and may require use of significant management judgment. The valuation of interest-sensitive contract liabilities is considered Level 3 in the fair value hierarchy.
Long-term Debt/Collateral Finance and Securitization Notes – The fair value of the Company’s long-term debt, and collateral finance and securitization notes is generally estimated by discounting future cash flows using market rates currently available for debt with similar remaining maturities and reflecting the credit risk of the Company, including inputs when available, from actively traded debt of the Company or other companies with similar credit quality. The valuation of long-term debt, and collateral finance and securitization notes is generally obtained from brokers and is considered Level 3 in the fair value hierarchy.
Note 7 REINSURANCE CEDED RECEIVABLES AND OTHER
In the normal course of business, the Company seeks to limit its exposure to loss on any single insured and to recover a portion of benefits paid by ceding reinsurance to other insurance or reinsurance companies under excess coverage and coinsurance contracts. In the individual life markets, the Company retains a maximum of $8$8 million of coverage per individual life. Claims in excess of this retention amount are retroceded to retrocessionaires; however, the Company remains fully liable to the ceding company for the entire amount of risk it assumes. In certain limited situations the Company has retained more than $8 million per individual policy. The Company enters into agreements with other reinsurers to mitigate the residual risk related to the over-retained policies. Additionally, due to some lower face amount reinsurance coverage provided by the Company in addition to individual life, such as group life, disability and health, under certain circumstances, the Company could potentially incur net claims totaling more than $8 million per individual life.
Retrocession reinsurance treaties do not relieve the Company from its obligations to direct writing companies. Failure of retrocessionaires to honor their obligations could result in losses to the Company. The Company regularly evaluates the financial condition of the insurance and reinsurance companies from which it assumes and to which it cedes reinsurance. Consequently, allowances would be established for amounts deemed uncollectible. At December 31, 20192022 and 2018,2021, no allowances were deemed necessary.
Retrocessions are arranged through the Company’s retrocession pools for amounts in excess of the Company’s retention limit. As of December 31, 2019,2022, all rated retrocession pool participants followed by the A.M. Best Company were rated “A- (excellent)” or better. The Company verifies retrocession pool participants’ ratings on a quarterly basis. For a majority of the retrocessionaires that were not rated, security in the form of letters of credit or trust assets has been posted. In addition, the Company performs annual financial reviews of its retrocessionaires to evaluate financial stability and performance. In addition to its third party retrocessionaires, various RGA reinsurance subsidiaries retrocede amounts in excess of their retention to affiliated subsidiaries.
The following table presents information for the Company’s reinsurance ceded reinsurance receivable assets,receivables and other, including the respective amount and A.M. Best rating for each reinsurer representing in excess of five percent of the total as of December 31, 2019 or 20182022 and 2021 (dollars in millions):
|
| | | | | | | | | | | | | | | | |
| | | | | 2019 | | 2018 |
| Reinsurer | | A.M. Best Rating | | Amount | | % of Total | | Amount | | % of Total |
| Reinsurer A | | A+ | | $ | 367 |
| | 40.6 | % | | $ | 303 |
| | 40.0 | % |
| Reinsurer B | | A+ | | 208 |
| | 23.0 |
| | 193 |
| | 25.5 |
|
| Reinsurer C | | A | | 84 |
| | 9.3 |
| | 70 |
| | 9.2 |
|
| Reinsurer D | | A++ | | 53 |
| | 5.9 |
| | 37 |
| | 4.8 |
|
| Reinsurer E | | A+ | | 43 |
| | 4.8 |
| | 40 |
| | 5.3 |
|
| Other reinsurers | | | | 149 |
| | 16.4 |
| | 115 |
| | 15.2 |
|
| Total | | | | $ | 904 |
| | 100.0 | % | | $ | 758 |
| | 100.0 | % |
| | | | | | | | | | | | | | | | | | | | | | | | | | | | | | | | |
| | | | 2022 | | 2021 |
| Reinsurer | | A.M. Best Rating | | Amount | | % of Total | | Amount | | % of Total |
| Reinsurer A | | A- | | $ | 1,605 | | | 65.2 | % | | $ | 1,626 | | | 63.0 | % |
| Reinsurer B | | A+ | | 401 | | | 16.3 | | | 423 | | | 16.4 | |
| Reinsurer C | | A+ | | 200 | | | 8.1 | | | 212 | | | 8.2 | |
| Reinsurer D | | A | | 52 | | | 2.1 | | | 59 | | | 2.3 | |
| Reinsurer E | | A+ | | 41 | | | 1.7 | | | 44 | | | 1.7 | |
| Reinsurer F | | A++ | | 35 | | | 1.4 | | | 42 | | | 1.6 | |
| Other reinsurers | | | | 128 | | | 5.2 | | | 174 | | | 6.8 | |
| Total | | | | $ | 2,462 | | | 100.0 | % | | $ | 2,580 | | | 100.0 | % |
Included in the total ceded reinsurance receivables balance were $223$183 million and $243$203 million of claims recoverable, of which $15$16 million and $17$10 million were in excess of 90 days past due, as of December 31, 20192022 and 2018,2021, respectively. Also included in the total reinsurance ceded receivable and other is a deposit asset on reinsurance of $1,605 million and $1,626 million as of December 31, 2022 and 2021, respectively.
The effect of reinsurance on net premiums is as follows (dollars in millions):
| | | Years ended December 31, | | 2019 | | 2018 | | 2017 | Years ended December 31, | | 2022 | | 2021 | | 2020 |
| Direct insurance | | $ | 76 |
| | $ | 63 |
| | $ | 62 |
| Direct insurance | | $ | 26 | | | $ | 33 | | | $ | 58 | |
| Reinsurance assumed | | 12,150 |
| | 11,341 |
| | 10,642 |
| Reinsurance assumed | | 13,823 | | | 13,348 | | | 12,583 | |
| Reinsurance ceded | | (929 | ) | | (860 | ) | | (863 | ) | Reinsurance ceded | | (771) | | | (868) | | | (947) | |
| Net premiums | | $ | 11,297 |
| | $ | 10,544 |
| | $ | 9,841 |
| Net premiums | | $ | 13,078 | | | $ | 12,513 | | | $ | 11,694 | |
The effect of reinsurance on claims and other policy benefits as follows (dollars in millions):
|
| | | | | | | | | | | | |
| Years ended December 31, | | 2019 | | 2018 | | 2017 |
| Direct insurance | | $ | 113 |
| | $ | 107 |
| | $ | 104 |
|
| Reinsurance assumed | | 11,404 |
| | 9,997 |
| | 9,282 |
|
| Reinsurance ceded | | (1,320 | ) | | (785 | ) | | (867 | ) |
| Net claims and other policy benefits | | $ | 10,197 |
| | $ | 9,319 |
| | $ | 8,519 |
|
| | | | | | | | | | | | | | | | | | | | |
| Years ended December 31, | | 2022 | | 2021 | | 2020 |
| Direct insurance | | $ | 56 | | | $ | 37 | | | $ | 97 | |
| Reinsurance assumed | | 12,736 | | | 13,725 | | | 11,931 | |
| Reinsurance ceded | | (746) | | | (986) | | | (953) | |
| Net claims and other policy benefits | | $ | 12,046 | | | $ | 12,776 | | | $ | 11,075 | |
The effect of reinsurance on life insurancereinsurance in force is shown in the following schedule (dollars in millions):
|
| | | | | | | | | | | | | | | | | | | |
| | | Direct | | Assumed | | Ceded | | Net | | Assumed/Net % |
| December 31, 2019 | | $ | 1,316 |
| | $ | 3,480,206 |
| | $ | 192,864 |
| | $ | 3,288,658 |
| | 105.8 | % |
| December 31, 2018 | | 1,363 |
| | 3,329,181 |
| | 186,172 |
| | 3,144,372 |
| | 105.9 |
|
| December 31, 2017 | | 1,462 |
| | 3,297,275 |
| | 205,529 |
| | 3,093,208 |
| | 106.6 |
|
| | | | | | | | | | | | | | | | | | | | | | | | | | | | | | | | |
| | Direct | | Assumed | | Ceded | | Net | | Assumed/Net % |
| December 31, 2022 | | $ | 1,027 | | | $ | 3,400,735 | | | $ | 151,569 | | | $ | 3,250,193 | | | 104.6 | % |
| December 31, 2021 | | 1,117 | | | 3,467,054 | | | 166,842 | | | 3,301,329 | | | 105.0 | |
| December 31, 2020 | | 1,990 | | | 3,480,692 | | | 184,625 | | | 3,298,057 | | | 105.5 | |
At December 31, 20192022 and 2018,2021, respectively, the Company provided approximately $22.7$28.7 billion and $18.1$25.9 billion of financial reinsurance, as measured by pre-tax statutory surplus, risk based capital and other financial reinsurance structures, to other insurance companies under financial reinsurance or capital solutions transactions to assist ceding companies in meeting applicable regulatory requirements. Generally, such financial reinsurance is provided by the Company committing cash or assuming insurance liabilities, which are collateralized by future profits on the reinsured business. The Company earns a fee based on the amount of net outstanding financial reinsurance.
Reinsurance treaties, whether facultative or automatic, may provide for recapture rights on the part of the ceding company. Recapture rights permit the ceding company to reassume all or a portion of the risk formerly ceded to the reinsurer after an agreed-upon period of time, generally 10 years, or in some cases due to changes in the financial condition or ratings of the reinsurer. Recapture of business previously ceded does not affect premiums ceded prior to the recapture of such business but would reduce premiums in subsequent periods. Additionally, some reinsurance treaties give the ceding company the right to require the Company to place assets in trust for their benefit to support the ceding company’s statutory reserve credits, in the event of a downgrade of the Company’s credit ratings and or other statutory measure to specified levels, generally non-investment grade levels, or if minimum levels of financial condition are not maintained. As of December 31, 2019,2022, neither the Company nor its subsidiaries have been required to post additional collateral or have had a reinsurance treaty recaptured as a result of credit downgrade or defined statutory measure decline.
Certain reinsurance treaties require the reinsurer to place assets in trust to collateralize the reinsurer’s obligation to the ceding company. Assets placed in trust continue to be owned by the Company, but their use is restricted based on the terms of the trust agreement. Securities with an amortized cost of $3.3$3.7 billion and $2.9$4.1 billion were held in trust for the benefit of the Company’s
subsidiaries to satisfy collateral requirements for reinsurance business at December 31, 20192022 and 2018,2021, respectively. Additionally, securities with an amortized cost of $27.3$31.5 billion and $20.1$28.7 billion as of December 31, 20192022 and 2018,2021, respectively, were held in trust to satisfy collateral requirements under certain third-party reinsurance treaties. Under certain conditions, the Company may be obligated to move reinsurance from one subsidiary to another subsidiary, post additional collateral or make payments under a given reinsurance treaty. These conditions include change in control or ratings of the subsidiary, insolvency, nonperformance under a reinsurance treaty, or loss of license or other regulatory authorization of such subsidiary. If the Company was ever required to move reinsurance from one subsidiary to another subsidiary, the risk to the Company on a consolidated basis under the reinsurance treaties would not change; however, additional collateral may need to be posted or additional capital may be required due to the change in jurisdiction of the subsidiary reinsuring the business, which could lead to a strain on liquidity.
Note 8 DEFERRED POLICY ACQUISITION COSTS
The following reflects the amounts of policy acquisition costs deferred and amortized (dollars in millions):
|
| | | | | | | | | | | | |
| Years ended December 31, | | 2019 | | 2018 | | 2017 |
| Balance, beginning of year | | $ | 3,398 |
| | $ | 3,240 |
| | $ | 3,339 |
|
| Capitalization | | 526 |
| | 608 |
| | 348 |
|
| Amortization (including interest) | | (315 | ) | | (438 | ) | | (433 | ) |
| Change in value of embedded derivatives | | (15 | ) | | 14 |
| | (70 | ) |
| Attributed to unrealized investment gains (losses) | | (97 | ) | | 27 |
| | (8 | ) |
| Foreign currency translation | | 15 |
| | (53 | ) | | 64 |
|
| Balance, end of year | | $ | 3,512 |
| | $ | 3,398 |
| | $ | 3,240 |
|
| | | | | | | | | | | | | | | | | | | | |
| Years ended December 31, | | 2022 | | 2021 | | 2020 |
| Balance, beginning of year | | $ | 3,690 | | | $ | 3,616 | | | $ | 3,512 | |
| Capitalization | | 632 | | | 541 | | | 478 | |
| Amortization (including interest) | | (547) | | | (496) | | | (405) | |
| Change in value of embedded derivatives | | 93 | | | (36) | | | 22 | |
| Attributed to unrealized investment gains (losses) | | 171 | | | 33 | | | (26) | |
| Foreign currency translation | | (65) | | | 32 | | | 35 | |
| Balance, end of year | | $ | 3,974 | | | $ | 3,690 | | | $ | 3,616 | |
Some reinsurance agreements involve reimbursing the ceding company for allowances and commissions in excess of first-year premiums. These amounts represent acquisition costs and are capitalized to the extent deemed recoverable from the future premiums and amortized against future profits of the business. This type of agreement presents a risk to the extent that the business lapses faster than originally anticipated, resulting in future profits being insufficient to recover the Company’s investment.
Note 9 INCOME TAX
The effective tax rate for 2019On August 16, 2022, the Inflation Reduction Act of 2022 (“the Act”) was higher thanenacted in the U.S. Statutory rate of 21.0% primarily asThe Act includes law changes relating to tax, climate change, energy and health care. In particular, for tax years ending after December 31, 2022, the Act imposes a result of valuation allowance increases15% minimum tax on adjusted financial statement income for applicable corporations with average financial statement income over $1 billion for the previous 3-year period ending in various jurisdictions and2022 or after. The Act also imposes a 1% excise tax expense related to uncertain tax positions, which were partially offset by foreign bases differences, excess tax benefit of equity compensation and tax benefit from foreign tax credits. The effective tax rate for 2018 was lower than the U.S. Statutory rate of 21% primarily as a result of the releaseon stock buybacks of a valuation allowancepublicly traded corporation. The tax provisions are not expected to have a material impact on foreignthe Company’s tax credits and foreign bases differences, which was partially offset by tax expense related to GILTI and valuation allowance increases. The 2017 effective tax rate includes the tax effects of U.S. Tax Reform. See the table below for additional information.expense.
Pre-tax income for the years ended December 31, 2019, 20182022, 2021 and 20172020 consists of the following (dollars in millions):
| | | | | | | | | | | | | | | | | | | | |
| | 2022 | | 2021 | | 2020 |
| Pre-tax income – U.S. | | $ | 399 | | | $ | 327 | | | $ | 79 | |
| Pre-tax income – foreign | | 432 | | | 364 | | | 474 | |
| Total pre-tax income | | $ | 831 | | | $ | 691 | | | $ | 553 | |
|
| | | | | | | | | | | | |
| | | 2019 | | 2018 | | 2017 |
| Pre-tax income - U.S. | | $ | 871 |
| | $ | 626 |
| | $ | 871 |
|
| Pre-tax income - foreign | | 261 |
| | 220 |
| | 272 |
|
| Total pre-tax income | | $ | 1,132 |
| | $ | 846 |
| | $ | 1,143 |
|
The provision for income tax expense for the years ended December 31, 2019, 20182022, 2021 and 20172020 consists of the following (dollars in millions):
|
| | | | | | | | | | | | |
| | | 2019 | | 2018 | | 2017 |
| Current income tax expense (benefit): | | | | | | |
| U.S. | | $ | (9 | ) | | $ | 78 |
| | $ | 131 |
|
| U.S. Tax Reform | | — |
| | (68 | ) | | — |
|
| Foreign | | 60 |
| | 43 |
| | 37 |
|
| Total current | | 51 |
| | 53 |
| | 168 |
|
| Deferred income tax expense (benefit): | | | | | | |
| U.S. | | 182 |
| | 63 |
| | 160 |
|
| U.S. Tax Reform | | — |
| | 6 |
| | (1,034 | ) |
| Foreign | | 29 |
| | 8 |
| | 27 |
|
| Total deferred | | 211 |
| | 77 |
| | (847 | ) |
| Total provision for income taxes | | $ | 262 |
| | $ | 130 |
| | $ | (679 | ) |
| | | | | | | | | | | | | | | | | | | | |
| | | 2022 | | 2021 | | 2020 |
| Current income tax expense (benefit): | | | | | | |
| U.S. | | $ | 9 | | | $ | 91 | | | $ | 75 | |
| Foreign | | 120 | | | 72 | | | 79 | |
| Total current | | 129 | | | 163 | | | 154 | |
| Deferred income tax expense (benefit): | | | | | | |
| U.S. | | 68 | | | (127) | | | (60) | |
| Foreign | | 7 | | | 38 | | | 44 | |
| Total deferred | | 75 | | | (89) | | | (16) | |
| Total provision for income taxes | | $ | 204 | | | $ | 74 | | | $ | 138 | |
The Company’s effective tax rate differed from the U.S. federal income tax statutory rate of 21%, 21%, and 35% as a result of the following for the years ended December 31, 2019, 20182022, 2021 and 20172020 (dollars in millions):
| | | | | | | | | | | | | | | | | | | | |
| | | 2022 | | 2021 | | 2020 |
| Tax provision at U.S. statutory rate | | $ | 175 | | | $ | 145 | | | $ | 116 | |
| Increase (decrease) in income taxes resulting from: | | | | | | |
| Tax rate differences on income in other jurisdictions | | 21 | | | 51 | | | 21 | |
| Differences in tax basis in foreign jurisdictions | | 10 | | | (4) | | | (32) | |
| | | | | | |
| Deferred tax valuation allowance | | (6) | | | (18) | | | 10 | |
| Amounts related to uncertain tax positions | | 3 | | | (119) | | | 10 | |
| | | | | | |
| Equity based compensation | | (2) | | | (1) | | | (1) | |
| Corporate rate changes | | 2 | | | 29 | | | 13 | |
| GILTI, net of credits | | 21 | | | 11 | | | 13 | |
| Subpart F for non-full inclusion companies | | 60 | | | 2 | | | — | |
| Foreign tax credits | | (67) | | | (10) | | | (7) | |
| Return to provision adjustments | | (13) | | | (17) | | | (4) | |
| Other, net | | — | | | 5 | | | (1) | |
| Total provision for income taxes | | $ | 204 | | | $ | 74 | | | $ | 138 | |
Effective tax rate (1) | | 24.6 | % | | 10.6 | % | | 24.9 | % |
|
| | | | | | | | | | | | |
| | | 2019 | | 2018 | | 2017 |
| Tax provision at U.S. statutory rate | | $ | 238 |
| | $ | 178 |
| | $ | 400 |
|
| Increase (decrease) in income taxes resulting from: | | | | | | |
| U.S. Tax Reform | | — |
| | (62 | ) | | (1,034 | ) |
| Foreign tax rate differing from U.S. tax rate | | 2 |
| | 4 |
| | (22 | ) |
| Differences in tax basis in foreign jurisdictions | | (23 | ) | | (23 | ) | | (23 | ) |
| Deferred tax valuation allowance | | 56 |
| | 23 |
| | 29 |
|
| Amounts related to audit contingencies | | 8 |
| | 1 |
| | (7 | ) |
| Equity compensation excess benefit | | (8 | ) | | (6 | ) | | (10 | ) |
| Corporate rate changes | | (1 | ) | | 1 |
| | (6 | ) |
| GILTI, net of credits | | — |
| | 10 |
| | — |
|
| Subpart F for non-full inclusion companies | | 1 |
| | 1 |
| | 2 |
|
| Foreign tax credits | | (6 | ) | | (3 | ) | | (2 | ) |
| Return to provision adjustments | | (6 | ) | | (1 | ) | | (5 | ) |
| Other, net | | 1 |
| | 7 |
| | (1 | ) |
| Total provision for income taxes | | $ | 262 |
| | $ | 130 |
| | $ | (679 | ) |
| Effective tax rate | | 23.1 | % | | 15.4 | % | | (59.4 | )% |
The effective tax rate for 2022 was higher than the U.S. Statutory rate of 21.0% primarily as a result of income in jurisdictions with tax rates differing from the U.S., Subpart F income, generated primarily in RGA Canada, and GILTI generated in Australia, Ireland, Hodge Life Assurance Company Limited, and Omnilife Insurance Company Limited. These expenses were offset with benefits from foreign tax credits and return to provision adjustments. The effective tax rate for 2021 was lower than the U.S. Statutory rate of 21.0% primarily as a result of the release of uncertain tax positions due to the expiration of the statute of limitations, and the release of valuation allowances primarily due to income earned in RGA Australia. This benefit was partially offset by income earned in jurisdictions with tax rates higher than the U.S. and GILTI, primarily Canada and Australia. Furthermore, the UK enacted an increase to the statutory tax rate resulting in a tax expense from the remeasurement of the deferred tax liabilities.
Total income taxes for the years ended December 31, 2019, 20182022, 2021 and 20172020 were as follows (dollars in millions):
|
| | | | | | | | | | | | |
| | | 2019 | | 2018 | | 2017 |
| Provision for income taxes | | $ | 262 |
| | $ | 130 |
| | $ | (679 | ) |
| Income tax from OCI and additional paid-in-capital: | | | | | | |
| Net unrealized holding gain (loss) on debt and equity securities recognized for financial reporting purposes | | 681 |
| | (368 | ) | | 307 |
|
| Foreign currency translation | | 3 |
| | 19 |
| | (42 | ) |
| Unrealized pension and post retirement | | (5 | ) | | — |
| | — |
|
| Total income taxes provided | | $ | 941 |
| | $ | (219 | ) | | $ | (414 | ) |
| | | | | | | | | | | | | | | | | | | | |
| | 2022 | | 2021 | | 2020 |
| Provision for income taxes | | $ | 204 | | | $ | 74 | | | $ | 138 | |
| Income tax from OCI and additional paid-in-capital: | | | | | | |
| Net unrealized holding gain (loss) on debt and equity securities recognized for financial reporting purposes | | (2,495) | | | (520) | | | 611 | |
| Foreign currency translation | | 21 | | | 23 | | | (9) | |
| Unrealized pension and post retirement | | 7 | | | 7 | | | (1) | |
| Total income taxes provided | | $ | (2,263) | | | $ | (416) | | | $ | 739 | |
The tax effects of temporary differences that give rise to significant portions of the deferred income tax assets and liabilities at December 31, 20192022 and 2018,2021, are presented in the following tables (dollars in millions):
|
| | | | | | | | |
| | | 2019 | | 2018 |
| Deferred income tax assets: | | | | |
| Nondeductible accruals | | $ | 100 |
| | $ | 86 |
|
| Differences between tax and financial reporting amounts concerning certain reinsurance transactions | | 105 |
| | 102 |
|
| Differences in the tax basis of cash and invested assets | | — |
| | 28 |
|
| Investment income differences | | 7 |
| | 80 |
|
| Deferred acquisition costs capitalized for tax | | 127 |
| | 125 |
|
| Net operating loss carryforward | | 330 |
| | 406 |
|
| Capital loss and tax credit carryforwards | | 38 |
| | 33 |
|
| Subtotal | | 707 |
| | 860 |
|
| Valuation allowance | | (236 | ) | | (181 | ) |
| Total deferred income tax assets | | 471 |
| | 679 |
|
| Deferred income tax liabilities: | | | | |
| Deferred acquisition costs capitalized for financial reporting | | 797 |
| | 843 |
|
| Differences between tax and financial reporting amounts concerning certain reinsurance transactions | | 1,293 |
| | 1,152 |
|
| Differences in the tax basis of cash and invested assets | | 991 |
| | 346 |
|
| Investment income differences | | — |
| | 9 |
|
| Differences in foreign currency translation | | 52 |
| | 53 |
|
| Anticipated future tax credit reduction | | 26 |
| | 25 |
|
| Total deferred income tax liabilities | | 3,159 |
| | 2,428 |
|
| Net deferred income tax liabilities | | $ | 2,688 |
| | $ | 1,749 |
|
| Balance sheet presentation of net deferred income tax liabilities: | | | | |
| Included in other assets | | $ | 24 |
| | $ | 50 |
|
| Included in deferred income taxes | | 2,712 |
| | 1,799 |
|
| Net deferred income tax liabilities | | $ | 2,688 |
| | $ | 1,749 |
|
| | | | | | | | | | | | | | |
| | | 2022 | | 2021 |
| Deferred income tax assets: | | | | |
| Nondeductible accruals | | $ | 90 | | | $ | 85 | |
| Net operating loss carryforward | | 295 | | | 251 | |
| | | | |
| | | | |
| Tax Credit Carryforward | | 80 | | | 50 | |
| Invested assets | | 1,309 | | | — | |
| Other | | 11 | | | 3 | |
| Subtotal | | 1,785 | | | 389 | |
| Valuation allowance | | (221) | | | (218) | |
| Total deferred income tax assets | | 1,564 | | | 171 | |
| Deferred income tax liabilities: | | | | |
| Deferred acquisition costs | | 756 | | | 754 | |
| Policy reserves and other reinsurance liabilities | | 820 | | | 1,085 | |
| Invested assets | | — | | | 793 | |
| Outside basis difference foreign subsidiaries | | 268 | | | 260 | |
| Foreign currency translation | | 90 | | | 66 | |
| Anticipated future tax credit reduction | | 85 | | | 58 | |
| | | | |
| Total deferred income tax liabilities | | 2,019 | | | 3,016 | |
| Net deferred income tax liabilities | | $ | 455 | | | $ | 2,845 | |
| Balance sheet presentation of net deferred income tax liabilities: | | | | |
| Included in other assets | | $ | 281 | | | $ | 41 | |
| Included in deferred income taxes | | 736 | | | 2,886 | |
| Net deferred income tax liabilities | | $ | 455 | | | $ | 2,845 | |
As of December 31, 2019,2022, the valuation allowance against deferred tax assets was $236$221 million. During 20192022, the Company established a $25 million valuation allowance on certain unrealized losses in the Company’s fixed maturity portfolio due to limitations on the utilization of the deferred tax asset. Additionally, there was a $44 million increasewere increases to the valuation allowance related to the tax losses of RGA Reinsurance Company of Australia Limited ("RGA Australia"). RGA Australia's tax loss primarily relates to income on internal retrocession that is not taxable in RGA Australia. The RGA Australia deferred tax asset has been reduced to the amount more likely than not to be realized considering the projected future earnings. The valuation allowance also increased due to losses in jurisdictions where the company doesforeign subsidiaries that do not have a recent history of earnings including China and Spain.income. These increases were partially offset by a release of apretax earnings in certain subsidiaries with valuation allowance in New Zealand due to taxable income in recent years.allowances and foreign currency translation.
As of December 31, 2018,2021, the valuation allowance against deferred tax assets was $181$218 million. During 2018, a valuation allowance on the U.S. Foreign tax credit carryforwards of $65 million was released. This release partially offset a $25 million increase to the valuation allowance related to the net operating losses of RGA Australia and increases and2021 there were decreases to the valuation allowance due to pretax earnings in jurisdictions wherecertain subsidiaries with valuation allowances. These decreases were partially offset by increases in the Company doesvaluation allowance due to losses in subsidiaries that do not have a history of earnings. Further decreases to theincome. The valuation allowance includewas further impacted by changes in foreign currency translation and reclassifications with other deferred tax assets of $13 million.during the year.
The earnings of substantially all of the Company's foreign subsidiaries have been permanently reinvested in foreign operations. No provisionThe Company has been madeprovided a deferred tax liability for U.S.the future expected tax oron foreign withholding taxes that may be applicable upon any repatriation or sale.subsidiaries where the Company cannot assert permanent reinvestment. At December 31, 20192022 and 2018,2021, the financial reporting basis in excess of the tax basis for which no deferred taxes have been recognized was approximately $1,642 million$1.6 billion and $1,364 million,$1.8 billion, respectively. As U.S. Tax Reform generally eliminates U.S. federal income taxes on dividends from foreign subsidiaries, the Company does not expect to incur material income taxes if these funds were repatriated.
During 2019, 2018,2022, 2021, and 2017,2020, the Company received federal and foreign income tax refunds of approximately $22$3 million, $2$20 million, and $12$59 million, respectively. The Company made cash income tax payments of approximately $66$131 million, $144$388 million, and $49$167 million, in 2019, 2018,2022, 2021, and 2017,2020, respectively.
The following table presents consolidated net operating losses (“NOL”) as of December 31, 20192022 (dollars in millions):
|
| | | |
| | 2019 |
| NOL with no expiration and with no valuation allowance | $ | 129 |
|
| NOL with a full valuation allowance | 140 |
|
| NOL with no expiration and a partial valuation allowance | 513 |
|
| NOL with expiration dates between 2029 & 2038 with no valuation allowance | 530 |
|
| Total net operating loss carryforwards | $ | 1,312 |
|
| | | | | |
| 2022 |
| NOL with no expiration and with no valuation allowance | $ | 472 | |
| NOL with a full valuation allowance | 161 | |
| NOL with no expiration and a partial valuation allowance | 527 | |
| Total net operating loss carryforwards | $ | 1,160 | |
These net operating losses, other than the net operating losses for which there is a valuation allowance, are expected to be utilized in the normal course of business during the period allowed for carryforwards and in any event, are not expected to be lost, due to the application of tax planning strategies that management would utilize.
As of December 31, 20192022, the Company had foreign tax credit carryforwards of $28$56 million inrelated to the U.S. and Ireland. The Ireland for which there isforeign tax credit of $24 million has a full valuation allowance.
The Company files income tax returns in the U.S. federal jurisdiction and various state and foreign jurisdictions. The Company is under continuous examination by the Internal Revenue Service and is subject to audit by taxing authorities in other foreign jurisdictions in which the Company has significant business operations. The income tax years under examination vary by jurisdiction. The Company is no longer subject to U.S. federal income tax examinations by tax authorities for years prior to 2016,2019, Canadian tax authorities for years prior to 20152017 and with a few exceptions, the Company is no longer subject to state and foreign income tax examinations by tax authorities for years prior to 2014.2018.
As of December 31, 2019,2022, the Company’s total amount of unrecognized tax benefits was $333is $35 million and the total amountall of unrecognized tax benefits thatwhich would affect the effective tax rate, if recognized, was $21 million.recognized. Management believes there will be no material impact toit is reasonably possible that the Company’s effective tax rate related to unrecognized tax benefitsbenefit could decrease by up to $14 million over the next 12 months.months if statutes expire.
A reconciliation of the beginning and ending amount of unrecognized tax benefits for the years ended December 31, 2019, 20182022, 2021 and 2017,2020, is as follows (dollars in millions):
|
| | | | | | | | | | | | |
| | Total Unrecognized Tax Benefits |
| | | 2019 | | 2018 | | 2017 |
| Beginning balance, January 1 | | $ | 325 |
| | $ | 321 |
| | $ | 297 |
|
| Acquisition Accounting | | — |
| | 1 |
| | — |
|
| Additions for tax positions of prior years | | 264 |
| | 256 |
| | 248 |
|
| Reductions for tax positions of prior years | | (262 | ) | | (257 | ) | | (247 | ) |
| Additions for tax positions of current year | | 6 |
| | 4 |
| | 36 |
|
| Settlements with tax authorities | | — |
| | — |
| | (13 | ) |
| Ending balance, December 31 | | $ | 333 |
| | $ | 325 |
| | $ | 321 |
|
| | | | | | | | | | | | | | | | | | | | |
| | Total Unrecognized Tax Benefits |
| | | 2022 | | 2021 | | 2020 |
| Beginning balance, January 1 | | $ | 34 | | | $ | 342 | | | $ | 333 | |
| | | | | | |
| Additions for tax positions of prior years | | 2 | | | 2 | | | 281 | |
| Reductions for tax positions of prior years | | (4) | | | (312) | | | (278) | |
| Additions for tax positions of current year | | 3 | | | 2 | | | 6 | |
| | | | | | |
| | | | | | |
| Ending balance, December 31 | | $ | 35 | | | $ | 34 | | | $ | 342 | |
The Company recognized minimal interest expense (benefit) associated with uncertain tax positions in 2019, 20182022, $(31) million in 2021 and 2017 of $12$11 million $(3) million, and $(5) million, respectively.in 2020. As of December 31, 20192022 and 2018,2021 the Company had $23$3 million and $12$3 million respectively, of accrued interest related to unrecognized tax benefits. There are no penalties accrued as of December 31, 20192022 or December 31, 2018.2021.
Note 10 EMPLOYEE BENEFIT PLANS
Certain subsidiaries of the Company are sponsors or administrators of both qualified and non-qualified defined benefit pension plans (“Pension Plans”). The largest of these plans is a non-contributory qualified defined benefit pension plan sponsored by RGA Reinsurance Company (“RGA Reinsurance”) that covers U.S. employees. The benefits under the Pension Plans are generally based on years of service and compensation levels. Effective January 1, 2020, the qualified defined benefit pension plan and some of the non-qualified defined benefit pension plans were closed to new employees.
The Company also provides select health care and life insurance benefits for certain retired employees. The health care benefits are provided through a self-insured welfare benefit plan. Employees become eligible for these benefits if they meet minimum age and service requirements. The retiree’s cost for health care benefits varies depending upon the credited years of service. Effective January 1, 2017, employees hired in the U.S. are not eligible for retiree health care benefits. The effect of the amendment was recorded in 2016 in AOCI and is being amortized through prior service cost. Virtually all retirees, or their beneficiaries, contribute a portion of the total cost of postretirement health benefits. Prepaid benefit costsOverfunded and accrued benefit liabilitiesunderfunded plans are includedrecognized in other assets and other liabilities, respectively, in the Company’s consolidated balance sheets.
A December 31 measurement date is used for all of the defined benefit and postretirement plans. The status of these plans as of December 31, 20192022 and 20182021 is summarized below (dollars in millions):
| | | | | | | | | | | | | | | | | | | | | | | | | | |
| | | December 31, |
| | | Pension Benefits | | Other Benefits |
| | | 2022 | | 2021 | | 2022 | | 2021 |
| Change in benefit obligation: | | | | | | | | |
| Benefit obligation at beginning of year | | $ | 256 | | | $ | 254 | | | $ | 75 | | | $ | 81 | |
| Service cost | | 17 | | | 18 | | | 3 | | | 3 | |
| Interest cost | | 6 | | | 4 | | | 2 | | | 2 | |
| Participant contributions | | — | | | — | | | — | | | — | |
| Amendments | | — | | | — | | | 2 | | | (3) | |
| Actuarial (gains) losses | | (50) | | | (8) | | | (20) | | | (6) | |
| Benefits paid | | (12) | | | (12) | | | (2) | | | (2) | |
| Foreign exchange translations and other adjustments | | (3) | | | — | | | — | | | — | |
| Benefit obligation at end of year | | $ | 214 | | | $ | 256 | | | $ | 60 | | | $ | 75 | |
|
| | | | | | | | | | | | | | | | |
| | | December 31, |
| | | Pension Benefits | | Other Benefits |
| | | 2019 | | 2018 | | 2019 | | 2018 |
| Change in benefit obligation: | | | | | | | | |
| Benefit obligation at beginning of year | | $ | 179 |
| | $ | 172 |
| | $ | 67 |
| | $ | 70 |
|
| Service cost | | 13 |
| | 13 |
| | 3 |
| | 3 |
|
| Interest cost | | 7 |
| | 5 |
| | 3 |
| | 2 |
|
| Participant contributions | | — |
| | — |
| | — |
| | — |
|
| Actuarial (gains) losses | | 28 |
| | (1 | ) | | 15 |
| | (7 | ) |
| Benefits paid | | (8 | ) | | (8 | ) | | (1 | ) | | (1 | ) |
| Foreign exchange translations and other adjustments | | 1 |
| | (2 | ) | | — |
| | — |
|
| Benefit obligation at end of year | | $ | 220 |
| | $ | 179 |
| | $ | 87 |
| | $ | 67 |
|
| | | | | | | | | | | | | | | | | | | | | | | | | | |
| | | December 31, |
| | | Pension Benefits | | Other Benefits |
| | | 2022 | | 2021 | | 2022 | | 2021 |
| Change in plan assets: | | | | | | | | |
| Fair value of plan assets at beginning of year | | $ | 179 | | | $ | 157 | | | $ | — | | | $ | — | |
| Actual return on plan assets | | (30) | | | 15 | | | — | | | — | |
| Employer contributions | | 21 | | | 19 | | | 2 | | | 2 | |
| Participant contributions | | — | | | — | | | — | | | — | |
| Benefits paid | | (12) | | | (12) | | | (2) | | | (2) | |
| | | | | | | | |
| Fair value of plan assets at end of year | | $ | 158 | | | $ | 179 | | | $ | — | | | $ | — | |
| Funded status at end of year | | $ | (56) | | | $ | (77) | | | $ | (60) | | | $ | (75) | |
| | | | | | | | | | | | | | | | | | | | | | | | | | | | | | | | | | | | | | |
| | | December 31, |
| | | Qualified Plans | | Non-Qualified Plans(1) | | Total |
| | | 2022 | | 2021 | | 2022 | | 2021 | | 2022 | | 2021 |
| Aggregate fair value of plan assets | | $ | 158 | | | $ | 179 | | | $ | — | | | $ | — | | | $ | 158 | | | $ | 179 | |
| Aggregate projected benefit obligations | | 142 | | | 166 | | | 72 | | | 90 | | | 214 | | | 256 | |
| Over (under) funded | | $ | 16 | | | $ | 13 | | | $ | (72) | | | $ | (90) | | | $ | (56) | | | $ | (77) | |
(1)For non-qualified plans, there are no required funding levels.
|
| | | | | | | | | | | | | | | | |
| | | December 31, |
| | | Pension Benefits | | Other Benefits |
| | | 2019 | | 2018 | | 2019 | | 2018 |
| Change in plan assets: | | | | | | | | |
| Fair value of plan assets at beginning of year | | $ | 103 |
| | $ | 103 |
| | $ | — |
| | $ | — |
|
| Actual return on plan assets | | 21 |
| | (6 | ) | | — |
| | — |
|
| Employer contributions | | 17 |
| | 14 |
| | 1 |
| | 1 |
|
| Participant contributions | | — |
| | — |
| | — |
| | — |
|
| Benefits paid and expenses | | (8 | ) | | (8 | ) | | (1 | ) | | (1 | ) |
| Fair value of plan assets at end of year | | $ | 133 |
| | $ | 103 |
| | $ | — |
| | $ | — |
|
| Funded status at end of year | | $ | (87 | ) | | $ | (76 | ) | | $ | (87 | ) | | $ | (67 | ) |
|
| | | | | | | | | | | | | | | | | | | | | | | | |
| | | December 31, |
| | | Qualified Plans | | Non-Qualified Plans(1) | | Total |
| | | 2019 | | 2018 | | 2019 | | 2018 | | 2019 | | 2018 |
| Aggregate fair value of plan assets | | $ | 133 |
| | $ | 103 |
| | $ | — |
| | $ | — |
| | $ | 133 |
| | $ | 103 |
|
| Aggregate projected benefit obligations | | 139 |
| | 112 |
| | 81 |
| | 67 |
| | 220 |
| | 179 |
|
| Under funded | | $ | (6 | ) | | $ | (9 | ) | | $ | (81 | ) | | $ | (67 | ) | | $ | (87 | ) | | $ | (76 | ) |
| |
(1) | For non-qualified plans, there are no required funding levels. |
|
| | | | | | | | | | | | | | | |
| | December 31, |
| | Pension Benefits | | Other Benefits |
| | 2019 | | 2018 | | 2019 | | 2018 |
| Amounts recognized in accumulated other comprehensive income: | | | | | | | |
| Net actuarial loss | $ | 59 |
| | $ | 49 |
| | $ | 39 |
| | $ | 26 |
|
| Net prior service cost (credit) | — |
| | — |
| | (9 | ) | | (10 | ) |
| Total | $ | 59 |
| | $ | 49 |
|
| $ | 30 |
| | $ | 16 |
|
| | | | | | | | | | | | | | | | | | | | | | | |
| | December 31, |
| | Pension Benefits | | Other Benefits |
| | 2022 | | 2021 | | 2022 | | 2021 |
| Amounts recognized in accumulated other comprehensive income (loss): | | | | | | | |
| Net actuarial (gain) loss | $ | 40 | | | $ | 52 | | | $ | (1) | | | $ | 20 | |
| Net prior service cost (credit) | — | | | — | | | (6) | | | (9) | |
| Total | $ | 40 | | | $ | 52 | | | $ | (7) | | | $ | 11 | |
The following table presents information for qualified and non-qualified pension plans with a projected benefit obligation in excess of plan assets as of December 31, 20192022 and 20182021 (dollars in millions):
|
| | | | | | | | |
| | | 2019 | | 2018 |
| Projected benefit obligation | | $ | 220 |
| | $ | 179 |
|
| Fair value of plan assets | | 133 |
| | 103 |
|
| | | | | | | | | | | | | | |
| | | 2022 | | 2021 |
| Projected benefit obligation | | $ | 73 | | | $ | 256 | |
| Fair value of plan assets | | — | | | 179 | |
The following table presents information for pension plans with an accumulated benefit obligation in excess of plan assets as of December 31, 20192022 and 20182021 (dollars in millions):
| | | | | | | | | | | | | | |
| | 2022 | | 2021 |
| Accumulated benefit obligation | | $ | 66 | | | $ | 248 | |
| Fair value of plan assets | | — | | | 179 | |
|
| | | | | | | | |
| | | 2019 | | 2018 |
| Accumulated benefit obligation | | $ | 212 |
| | $ | 174 |
|
| Fair value of plan assets | | 133 |
| | 103 |
|
The components of net periodic benefit cost, included in other operating expenses on the consolidated statements of income, and other changes in plan assets and benefit obligations recognized in other comprehensive income were as follows (dollars in millions):
|
| | | | | | | | | | | | | | | | | | | | | | | | |
| | Pension Benefits | | Other Benefits |
| | | 2019 | | 2018 | | 2017 | | 2019 | | 2018 | | 2017 |
| Net periodic benefit cost: | | | | | | | | | | | | |
| Service cost | | $ | 13 |
| | $ | 13 |
| | $ | 11 |
| | $ | 3 |
| | $ | 3 |
| | $ | 2 |
|
| Interest cost | | 7 |
| | 5 |
| | 5 |
| | 3 |
| | 2 |
| | 2 |
|
| Expected return on plan assets | | (7 | ) | | (8 | ) | | (6 | ) | | — |
| | — |
| | — |
|
| Amortization of net actuarial losses | | 4 |
| | 4 |
| | 4 |
| | 1 |
| | 2 |
| | 2 |
|
| Amortization of prior service cost (credit) | | — |
| | — |
| | — |
| | (1 | ) | | (1 | ) | | (1 | ) |
| Settlements | | — |
| | — |
| | 5 |
| | — |
| | — |
| | — |
|
| Net periodic benefit cost | | 17 |
| | 14 |
| | 19 |
| | 6 |
| | 6 |
| | 5 |
|
| | | | | | | | | | | | | |
| | | | | | | | | | | | | |
| Other changes in plan assets and benefit obligations recognized in other comprehensive income: | | | | | | | | | | | | |
| Net actuarial (gains) losses | | 14 |
| | 13 |
| | 2 |
| | 14 |
| | (7 | ) | | 6 |
|
| Amortization of net actuarial (losses) | | (4 | ) | | (4 | ) | | (4 | ) | | (1 | ) | | (2 | ) | | (2 | ) |
| Amortization of prior service (cost) credit | | — |
| | — |
| | — |
| | 1 |
| | 1 |
| | 1 |
|
| Settlements | | — |
| | — |
| | (5 | ) | | — |
| | — |
| | — |
|
| Foreign exchange translations and other adjustments | | — |
| | — |
| | 1 |
| | — |
| | — |
| | — |
|
| Total recognized in other comprehensive income | | 10 |
| | 9 |
| | (6 | ) | | 14 |
| | (8 | ) | | 5 |
|
| Total recognized in net periodic benefit cost and other comprehensive income | | $ | 27 |
|
| $ | 23 |
| | $ | 13 |
| | $ | 20 |
| | $ | (2 | ) | | $ | 10 |
|
| | | | | | | | | | | | | | | | | | | | | | | | | | | | | | | | | | | | | | |
| | Pension Benefits | | Other Benefits |
| | | 2022 | | 2021 | | 2020 | | 2022 | | 2021 | | 2020 |
| Net periodic benefit cost: | | | | | | | | | | | | |
| Service cost | | $ | 17 | | | $ | 18 | | | $ | 14 | | | $ | 3 | | | $ | 3 | | | $ | 3 | |
| Interest cost | | 6 | | | 4 | | | 6 | | | 2 | | | 2 | | | 2 | |
| Expected return on plan assets | | (12) | | | (10) | | | (9) | | | — | | | — | | | — | |
| Amortization of net actuarial losses | | 3 | | | 6 | | | 5 | | | 1 | | | 2 | | | 2 | |
| Amortization of prior service cost (credit) | | — | | | — | | | — | | | (2) | | | (1) | | | (1) | |
| Settlements | | — | | | — | | | — | | | — | | | — | | | — | |
| Net periodic benefit cost | | 14 | | | 18 | | | 16 | | | 4 | | | 6 | | | 6 | |
| | | | | | | | | | | | |
| | | | | | | | | | | | |
| Other changes in plan assets and benefit obligations recognized in other comprehensive income (loss): | | | | | | | | | | | | |
| Net actuarial (gains) losses | | (9) | | | (13) | | | 17 | | | (20) | | | (6) | | | (8) | |
| | | | | | | | | | | | |
| Amortization of net actuarial (losses) | | (3) | | | (6) | | | (5) | | | (1) | | | (2) | | | (2) | |
| Amortization of prior service (cost) credit | | — | | | — | | | — | | | 2 | | | 1 | | | 1 | |
| Settlements | | — | | | — | | | — | | | — | | | — | | | — | |
| Prior service cost (credit) | | — | | | — | | | — | | | 1 | | | (3) | | | — | |
| Foreign exchange translations and other adjustments | | — | | | — | | | — | | | — | | | — | | | — | |
| Total recognized in other comprehensive income (loss) | | (12) | | | (19) | | | 12 | | | (18) | | | (10) | | | (9) | |
| Total recognized in net periodic benefit cost and other comprehensive income (loss) | | $ | 2 | | | $ | (1) | | | $ | 28 | | | $ | (14) | | | $ | (4) | | | $ | (3) | |
The Company has met the minimum funding requirements for its qualified pension plans and is not required to contribute to the qualified pension plans during 2023. The Company has not determined whether, and to what extent, contributions may be made to the qualified pension plans in 2023. During 2020,2023, the Company expects to contribute $18$4 million and $2 million to theits non-qualified pension plans and other benefit plans, respectively.
The following benefit payments, which reflect expected future service as appropriate, are expected to be paid (dollars in millions):
|
| | | | | | | | |
| | | Pension Benefits | | Other Benefits |
| 2020 | | $ | 11 |
| | $ | 2 |
|
| 2021 | | 11 |
| | 2 |
|
| 2022 | | 13 |
| | 2 |
|
| 2023 | | 13 |
| | 3 |
|
| 2024 | | 14 |
| | 3 |
|
| 2025-2029 | | 83 |
| | 21 |
|
| | | | | | | | | | | | | | |
| | Pension Benefits | | Other Benefits |
| 2023 | | $ | 12 | | | $ | 2 | |
| 2024 | | 15 | | | 3 | |
| 2025 | | 16 | | | 3 | |
| 2026 | | 17 | | | 3 | |
| 2027 | | 17 | | | 4 | |
| 2028 – 2032 | | 99 | | | 21 | |
Assumptions
WeightedThe weighted average assumptions used to determine the accumulated benefit obligation and net periodic benefit cost or income were as follows:
| | | | | | | | | | | | | | | | | | | | | | | | | | | | | | | | | | | | | | |
| | | Pension Benefits | | Other Benefits |
| | | 2022 | | 2021 | | 2020 | | 2022 | | 2021 | | 2020 |
| Benefit obligation | | | | | | | | | | | | |
| Discount rate | | 5.00 | % | | 2.64 | % | | 2.22 | % | | 4.99 | % | | 2.76 | % | | 2.41 | % |
| Rate of compensation increase | | 4.96 | % | | 4.74 | % | | 4.69 | % | | n/a | | n/a | | n/a |
| Net periodic benefit cost | | | | | | | | | | | | |
| Discount rate | | 2.65 | % | | 2.21 | % | | 3.03 | % | | 2.76 | % | | 2.41 | % | | 3.17 | % |
| Expected long-term rate of return on plan assets | | 6.50 | % | | 6.50 | % | | 7.00 | % | | n/a | | n/a | | n/a |
| Rate of compensation increase | | 4.75 | % | | 4.71 | % | | 4.60 | % | | n/a | | n/a | | n/a |
|
| | | | | | | | | | | | | | | | | | |
| | | Pension Benefits | | Other Benefits |
| | | 2019 | | 2018 | | 2017 | | 2019 | | 2018 | | 2017 |
| Discount rate used to determine benefit obligation | | 3.05 | % | | 4.02 | % | | 3.40 | % | | 3.17 | % | | 4.17 | % | | 3.56 | % |
| Discount rate used to determine net benefit cost or income | | 4.03 | % | | 3.41 | % | | 3.81 | % | | 4.17 | % | | 3.56 | % | | 4.10 | % |
| Expected long-term rate of return on plan assets | | 7.00 | % | | 7.35 | % | | 7.35 | % | | — | % | | — | % | | — | % |
| Rate of compensation increases | | 4.61 | % | | 4.17 | % | | 4.16 | % | | — | % | | — | % | | — | % |
The expected rate of return on plan assets is based on anticipated performance of the various asset sectors in which the plan invests, weighted by target allocation percentages. Anticipated future performance is based on long-term historical returns of the plan assets by sector, adjusted for the long-term expectations on the performance of the markets. While the precise expected return derived using this approach may fluctuate from year to year, the policy is to hold this long-term assumption constant as long as it remains within reasonable tolerance from the derived rate. This process is consistent for all plan assets as all the assets are invested in mutual funds.
The assumed health care cost trend rates used in measuring the accumulated non-pension post-retirement benefit obligation were as follows:
|
| | | | |
| | | December 31, |
| | | 2019 | | 2018 |
| Pre-Medicare eligible claims | | 8% down to 4.5% in 2026 | | 8% down to 5% in 2024 |
| Medicare eligible claims | | 8% down to 4.5% in 2026 | | 8% down to 5% in 2024 |
| | | | | | | | | | | | | | |
| | | As of December 31, |
| | | 2022 | | 2021 |
| Health care cost trend rates assumed for next year | | 7.00 | % | | 6.50 | % |
| Ultimate cost trend rate | | 4.50 | % | | 4.50 | % |
| Year ultimate trend is reached | | 2028 | | 2026 |
Plan Assets
Target allocations of U.S. qualified pension plan assets are determined with the objective of maximizing returns and minimizing volatility of net assets through adequate asset diversification and partial liability immunization. Adjustments are made to target allocations based on the Company’s assessment of the effect of economic factors and market conditions. The target allocations for plan assets are 60% equity securities and 40% debt securities as of December 31, 20192022 and 2018.2021. The Company’s plan assets are primarily invested in mutual funds. The mutual funds include holdings of S&P 500 securities, large-cap securities, mid-cap securities, small-cap securities, international securities, corporate debt securities, U.S. and other government securities, mortgage-related securities and cash.
Equity and debt securities are exposed to various risks, such as interest rate risk, credit risk and overall market volatility. Due to the level of risk associated with certain investment securities, changes in the values of investment securities will occur and any change would affect the amounts reported in the financial statements.
The fair values of the Company’s qualified pension plan assets as of December 31, 20192022 and 20182021 are summarized below (dollars in millions):
| | | | | | | | | | | | | | | | | | | | | | | | | | |
| | December 31, 2022 |
| | | | | Fair Value Measurement Using: |
| | | Total | | Level 1 | | Level 2 | | Level 3 |
Mutual Funds(1) | | $ | 158 | | | $ | 158 | | | $ | — | | | $ | — | |
| Cash | | — | | | — | | | — | | | — | |
| Total | | $ | 158 | | | $ | 158 | | | $ | — | | | $ | — | |
|
| | | | | | | | | | | | | | | | |
| | December 31, 2019 |
| | | | | Fair Value Measurement Using: |
| | | Total | | Level 1 | | Level 2 | | Level 3 |
Mutual Funds(1) | | $ | 133 |
| | $ | 133 |
| | $ | — |
| | $ | — |
|
| Cash | | — |
| | — |
| | — |
| | — |
|
| Total | | $ | 133 |
| | $ | 133 |
| | $ | — |
| | $ | — |
|
| |
(1) | Mutual funds were invested 27% in U.S. equity funds, 39% in U.S. fixed income funds, 18% in non-U.S. equity funds and 16% in other. |
(1)Mutual funds were invested 25% in U.S. equity funds, 40% in U.S. fixed income funds, 16% in non-U.S. equity funds and 19% in other. | | | | December 31, 2018 | | | December 31, 2021 |
| | | | | Fair Value Measurement Using: | | | | | Fair Value Measurement Using: |
| | | Total | | Level 1 | | Level 2 | | Level 3 | | | Total | | Level 1 | | Level 2 | | Level 3 |
Mutual Funds(2) | | $ | 103 |
| | $ | 103 |
| | $ | — |
| | $ | — |
| Mutual Funds(2) | | $ | 179 | | | $ | 179 | | | $ | — | | | $ | — | |
| Cash | | — |
| | — |
| | — |
| | — |
| Cash | | — | | | — | | | — | | | — | |
| Total | | $ | 103 |
| | $ | 103 |
| | $ | — |
| | $ | — |
| Total | | $ | 179 | | | $ | 179 | | | $ | — | | | $ | — | |
| |
(2) | Mutual funds were invested 25% in U.S. equity funds, 42% in U.S. fixed income funds, 17% in non-U.S. equity funds and 16% in other. |
(2)Mutual funds were invested 27% in U.S. equity funds, 38% in U.S. fixed income funds, 18% in non-U.S. equity funds and 17% in other.
As of December 31, 20192022 and 2018,2021, the Company classified all of its qualified pension plan assets in the Level 1 category as quoted prices in active markets are available for these assets. See Note 6 – “Fair Value of Asset and Liabilities” for additional detail on the fair value hierarchy.
Savings and Investment Plans
Certain subsidiaries of RGA also sponsor savings and investment plans under which a portion of employee contributions are matched. Subsidiary contributions to these plans were $16$23 million, $15$21 million and $14$19 million in 2019, 20182022, 2021 and 2017,2020, respectively.
Note 11 FINANCIAL CONDITION AND NET INCOME ON A STATUTORY BASIS – SIGNIFICANT SUBSIDIARIES
The domestic and foreign insurance subsidiaries of RGA prepare their statutory financial statements in conformity with statutory accounting practices prescribed or permitted by the applicable state insurance department or local regulatory authority, which may vary materially from statements prepared in accordance with GAAP. Prescribed statutory accounting practices in the U.S. include publications of the National Association of Insurance Commissioners (“NAIC”), as well as state laws, local regulations and general administrative rules. The differences between statutory financial statements and financial statements prepared in accordance with GAAP vary between jurisdictions. The principal differences between GAAP and NAIC are that statutory financial statements do not reflect deferred policy acquisition costs and limit deferred tax assets, life benefit reserves predominately use interest rate and mortality assumptions prescribed by the NAIC and local regulatory agencies, bonds are generally carried at amortized cost and reinsurance assets and liabilities are presented net of reinsurance.
Statutory net income and capital and surplus of the Company’s primary operating insurance subsidiaries, determined in accordance with statutory accounting practices prescribed by the applicable state insurance department or local regulatory authority are as follows (dollars in millions):
|
| | | | | | | | | | | | | | | | | | | | |
| | Statutory Capital & Surplus | | Statutory Net Income (Loss) |
| | | 2019 | | 2018 | | 2019 | | 2018 | | 2017 |
| RGA Americas Reinsurance Company, Ltd. | | $ | 6,283 |
| | $ | 4,298 |
| | $ | 1,049 |
| | $ | 209 |
| | $ | 624 |
|
| RGA Reinsurance (U.S.) | | 2,150 |
| | 2,079 |
| | 280 |
| | 660 |
| | 138 |
|
| Reinsurance Company of Missouri | | 2,125 |
| | 2,053 |
| | 75 |
| | (25 | ) | | (183 | ) |
| RGA Reinsurance Company (Barbados) Ltd. | | 1,553 |
| | 1,170 |
| | 234 |
| | 49 |
| | 309 |
|
| RGA Atlantic Reinsurance Company Ltd. | | 1,511 |
| | 1,083 |
| | 243 |
| | 256 |
| | 214 |
|
| RGA International Reinsurance Company dac | | 1,087 |
| | 691 |
| | 37 |
| | 21 |
| | 23 |
|
| RGA Life Reinsurance Company of Canada | | 713 |
| | 897 |
| | (225 | ) | | (38 | ) | | 26 |
|
| RGA Australia | | 447 |
| | 433 |
| | 15 |
| | (37 | ) | | 78 |
|
| Other insurance subsidiaries | | 2,233 |
| | 1,881 |
| | 291 |
| | 324 |
| | 43 |
|
| | | | | | | | | | | | | | | | | | | | | | | | | | | | | | | | |
| | Statutory Capital and Surplus | | Statutory Net Income (Loss) |
| | | 2022 | | 2021 | | 2022 | | 2021 | | 2020 |
| RGA Life and Annuity Insurance Company | | $ | 2,516 | | | $ | 2,362 | | | $ | 5 | | | $ | (13) | | | $ | 4 | |
| RGA Reinsurance Company | | 2,262 | | | 2,368 | | | (332) | | | (98) | | | (133) | |
| RGA Americas Reinsurance Company, Ltd. | | 1,607 | | | 6,812 | | | (441) | | | (241) | | | 879 | |
| RGA Reinsurance Company (Barbados) Ltd. | | 1,074 | | | 1,781 | | | (353) | | | 52 | | | 268 | |
| RGA Life Reinsurance Company Of Canada | | 938 | | | 903 | | | 108 | | | 25 | | | 152 | |
| RGA Atlantic Reinsurance Company Ltd. | | 759 | | | 1,137 | | | 36 | | | (226) | | | 175 | |
| RGA Worldwide Reinsurance Company, Ltd. | | 639 | | | 702 | | | 8 | | | 10 | | | 104 | |
| RGA Global Reinsurance Company, Ltd. | | 382 | | | 565 | | | — | | | 93 | | | 59 | |
| RGA Reinsurance Company Of Australia Limited | | 387 | | | 485 | | | (68) | | | (22) | | | 42 | |
| RGA International Reinsurance Company Dac | | 214 | | | 1,121 | | | 31 | | | 43 | | | 52 | |
| Other | | 1,038 | | | 1,015 | | | 300 | | | (152) | | | 194 | |
Each U.S. domestic insurance subsidiary’s state of domicile imposes minimum risk-based capital (“RBC”) requirements that were developed by the NAIC. The formulas for determining the amount of RBC specify various weighting factors that are applied to financial balances or various levels of activity based on the perceived degree of risk. Regulatory compliance is determined by a ratio of total adjusted capital, as defined by the NAIC, to authorized control level RBC, as defined by the NAIC. Companies below specific trigger points or ratios are classified within certain levels, each of which requires specified corrective action. Each of RGA’s U.S. domestic insurance subsidiaries exceeded the minimum RBC requirements for all periods presented herein. These requirements do not represent a significant constraint for the payment of dividends by RGA’s U.S. domestic insurance companies.
The licensing orders of the Company’s special purpose companies stipulate a minimum amount of capital required based on the purpose of the entity and the underlying business. These companies are subject to enhanced oversight by the regulator which includes filing detailed plans of operations before commencing operations or making material changes to existing agreements or entering into new agreements. Each of the Company’s Special Purpose Life Reinsurance Captives (“SPLRC”) exceeded the minimum capital requirements for all periods presented herein.
The Company’s foreign insurance subsidiaries prepare financial statements in accordance with local regulatory requirements. The regulatory authorities in these foreign jurisdictions establish some form of minimum regulatory capital and surplus requirements. All of the Company’s foreign insurance subsidiaries have regulatory capital and surplus that exceed the local minimum requirements. These requirements do not represent a significant constraint for the payment of dividends by the Company’s foreign insurance companies.
The state of domicile of certain of the Company’s SPLRCs follow prescribed accounting practices differing from NAIC statutory accounting practices (“NAIC SAP”) applicable to their statutory financial statements. Specifically, these prescribed practices require that surplus note interest accrued but not approved for payment be reported as a direct reduction of surplus and an addition to the surplus note balance. Under NAIC SAP, surplus note interest is not to be reported until approved for payment and is reported as a reduction of net investment income in the Summary of Operations. In addition, these prescribed practices allow the SPLRC to reflect letters of credit issued for its benefit as an admitted asset and a direct credit to unassigned surplus. Under NAIC SAP, letters of credit issued on behalf of the reporting company are not reported on the balance sheet.
A reconciliation of the Company’s surplus between NAIC SAP and practices prescribed by the state of domicile is shown below (dollars in millions):
|
| | | | | | | | |
| | | December 31, |
| | | 2019 | | 2018 |
| Prescribed practice – surplus note | | $ | 652 |
| | $ | 624 |
|
| Prescribed practice – letters of credit | | (576 | ) | | (976 | ) |
| Surplus (deficit) – NAIC SAP | | $ | 76 |
| | $ | (352 | ) |
| | | | | | | | | | | | | | |
| | | December 31, |
| | | 2022 | | 2021 |
| Prescribed practice – surplus | | $ | 527 | | | $ | 403 | |
| Prescribed practice – letters of credit | | (301) | | | (461) | |
| Surplus (deficit) – NAIC SAP | | $ | 226 | | | $ | (58) | |
Reinsurance Company of Missouri (“RCM”),RGA Life and Annuity and RGA Reinsurance and Chesterfield Reinsurance Company (“Chesterfield Re”) are subject to Missouri statutory provisions that restrict the payment of dividends. They may not pay dividends in any 12-month period in excess of the greater of the prior year’s statutory net gain from operations or 10% of statutory capital and surplus at the preceding year-end, without regulatory approval. Aurora National Life Assurance Company (“Aurora National”) is subject to California statutory provisions that are identical to those imposed by Missouri regarding the ability of Aurora National to pay dividends to RGA Reinsurance. The applicable statutory provisions only permit an insurer to pay a shareholder dividend from unassigned surplus. As of January 1, 2020,2023, RGA Reinsurance could pay maximum dividends, without prior approval, of approximately $315$226 million. Any dividends paid by RGA Reinsurance would be paid to RCM,RGA Life and Annuity, its parent company, which in turn has restrictions related to its ability to pay dividends to RGA.
Chesterfield Re would pay dividends to its immediate parent Chesterfield Financial Holdings LLC, (“Chesterfield Financial”), which would in turn pay dividends to RCM, subject to the terms of the indenture for the embedded value securitization transaction, in which Chesterfield Financial cannot declare or pay any dividends so long as any private placement notes are outstanding. The Missouri Department of Commerce and Insurance allows RCMRGA Life and Annuity to pay a dividend to RGA to the extent RCMRGA Life and Annuity received the dividend from its subsidiaries, without limitation related to the level of unassigned surplus. Dividend payments from other subsidiaries are subject to regulations in the jurisdiction of domicile, which are generally based on their earnings and/or capital level.
Dividend payments from non-U.S. operations are subject to similar restrictions established by local regulators. The non-U.S. regulatory regimes also commonly limit the dividend payments to the parent to a portion of the prior year’s statutory income, as determined by the local accounting principles. The regulators of the Company’s non-U.S. operations may also limit or prohibit profit repatriations or other transfers of funds to the U.S. if such transfers are deemed to be detrimental to the solvency or financial strength of the non-U.S. operations, or for other reasons. Most of the non-U.S. operating subsidiaries are second tier subsidiaries that are owned by various non-U.S. holding companies. The capital and rating considerations applicable to the first tier subsidiaries may also impact the dividend flowdividends paid to RGA.
There are no regulatory restrictions that limit the payment of dividends by RGA, except those generally applicable to Missouri corporations. Dividends are payable by Missouri corporations only under the circumstances specified in The General and Business Corporation Law of Missouri. RGA would not be permitted to pay common stock dividends if there is any accrued and unpaid interest on its subordinated debentures and its junior subordinated debentures. Furthermore, the ability of RGA to pay dividends is dependent on business conditions, income, cash requirements of the Company, receipt of dividends from its subsidiaries, financial covenant provisions and other relevant factors.
Note 12 COMMITMENTS, CONTINGENCIES AND GUARANTEES
Commitments
Funding of Investments
The Company’s commitments to fund investments as of December 31, 20192022 and 20182021 are presented in the following table (dollars in millions):
|
| | | | | | | |
| | 2019 | | 2018 |
| Limited partnership interests and joint ventures | $ | 685 |
| | $ | 524 |
|
| Commercial mortgage loans | 243 |
| | 23 |
|
| Bank loans and private placements | 181 |
| | 137 |
|
| Lifetime mortgages | 87 |
| | 265 |
|
| | | | | | | | | | | |
| 2022 | | 2021 |
| Limited partnerships and real estate joint ventures | $ | 937 | | | $ | 1,031 | |
| Mortgage loans | 137 | | | 152 | |
| | | |
| Bank loans and private placements | 682 | | | 768 | |
| Lifetime mortgages | 59 | | | 41 | |
The Company anticipates that the majority of its current commitments will be invested over the next five years; however, these commitments could become due any time at the request of the counterparties. Bank loans and private placements are included in fixed maturity securities available-for-sale.
The Company has an immaterial liability, included in other liabilities, for current expected credit losses associated with unfunded commitments as of December 31, 2022 and 2021.
Off-Balance Sheet Arrangements
In 2013, the Company executed a series of incentive agreements with the County of St. Louis, Missouri (the “County”). Under these agreements, the Company transferred ownership in its newly constructed world headquarters to the County in exchange
for taxable industrial revenue bonds (the “bonds”), in a series of bond issuances during 2013 and 2014, with a maximum amount of $150 million. As a result, the Company was able to reduce the cost of constructing and operating its world headquarters by reducing certain state and local tax expenditures. The Company simultaneously leased the world headquarters from the County and has an option to purchase the world headquarters for a nominal fee upon tendering the bonds back to the County. The payments due to the Company under the terms of the bonds and the amounts owed by the Company under the terms of the lease agreement qualify for the right of offset under GAAP. As such, neither the bonds nor the lease obligation is recorded on the consolidated balance sheets as an asset or liability, respectively. The world headquarters is recorded as an asset of the Company in “Other assets” on the consolidated balance sheets.
Funding Agreements
Federal Home Loan Bank (“FHLB”) of Des Moines
The Company is a member of the FHLB and, through membership, has issued funding agreements to the FHLB in exchange for cash advances. As of December 31, 2022 and 2021, the Company had $1.3 billion and $1.4 billion, respectively, of FHLB funding agreements outstanding. The Company is required to provide collateral in excess of the funding agreement amounts outstanding, considering any discounts to the securities posted and prepayment penalties.
Funding Agreement Backed Notes
The Company’s Funding Agreement Backed Notes (“FABN”) program allows RGA Global Funding, a special-purpose, unaffiliated statutory trust, to offer its senior secured medium-term notes to investors. RGA Global Funding uses the net proceeds from each sale to purchase one or more funding agreements from the Company. As of December 31, 2022 and 2021, the Company had $900 million and $500 million of FABN agreements outstanding and are included within interest-sensitive contract liabilities.
Contingencies
Litigation
The Company is subject to litigation and regulatory investigations or actions from time to time. Based on current knowledge, management does not believe that loss contingencies arising from pending legal, regulatory and governmental matters will have a material adverse effect on the financial condition, results of operations or cash flows of the Company. However, in light of the normal courseinherent uncertainties involved in future or pending legal, regulatory and governmental matters, some of its business; however,which are beyond the Company currently has noCompany’s control, and indeterminate or potentially substantial amount of damages sought in any such matters, an adverse outcome could be material litigation.to the Company’s financial condition, results of operations or cash flows for any particular reporting period. A legal reserve is established when the Company is notified of an arbitration demand, litigation or litigationregulatory action or is notified that an arbitration demand, litigation or litigationregulatory action is imminent, it is probable that the Company will incur a loss as a result and the amount of the probable loss is reasonably capable of being estimated.
Other Contingencies
The Company indemnifies its directors and officers as provided in its charters and by-laws. Since this indemnity generally is not subject to limitation with respect to duration or amount, the Company does not believe that it is possible to determine the maximum potential amount due under this indemnity in the future.
Guarantees
Statutory Reserve and Solvency Support
The Company hasCertain RGA subsidiaries have committed to provide statutory reserve support to third-parties, in exchange for a fee, by funding loans if certain defined events occur. Such statutory reserves are required under the U.S. Valuation of Life Policies Model Regulation (commonly referred to as Regulation XXX for term life insurance policies and Regulation A-XXX for universal life secondary guarantees). In addition, RGA hascertain subsidiaries have also committed to provide capital support to a third-party, in exchange for a fee, by agreeing to assume real estate leases in the event of a severe and prolonged decline in the commercial lease market. Upon assumption of a lease, RGAthe Company would recognize a right to use asset and lease obligation. As of December 31, 2019,2022, the Company does not believe that it will be required to provide any funding under these commitments as the occurrence of the defined events is considered remote. The following table presents the maximum potential obligation for these commitments as of December 31, 20192022 (dollars in millions):
|
| | | | |
| Commitment Period | | Maximum Potential Obligation |
| 2035 | | $ | 2,654 |
|
| 2036 | | 3,408 |
|
| 2037 | | 5,750 |
|
| 2038 | | 1,800 |
|
| 2039 | | 5,750 |
|
142
| | | | | | | | |
| Commitment Period | | Maximum Potential Obligation |
| 2034 | | $ | 1,243 | |
| 2035 | | 2,628 | |
| 2036 | | 3,599 | |
| 2037 | | 6,850 | |
| 2038 | | 800 | |
| 2039 | | 8,751 | |
| 2046 | | 3,000 | |
Other Guarantees
RGA has issued guarantees to third parties on behalf of its subsidiaries for the payment of amounts due under certain reinsurance treaties, securities borrowing and repurchase arrangements, financing arrangements and office lease obligations, whereby if a subsidiary fails to meet an obligation, RGA or one of its other subsidiaries will make a payment to fulfill the obligation. InAdditionally, in limited circumstances, treaty guarantees are granted to ceding companies in order to provide them additional security, particularly in cases where RGA’s subsidiary is relatively new, unrated, or not of a significant size, relative to the ceding company. Liabilities supported by the treaty guarantees, before consideration forof any legally offsetting amounts due from the guaranteed party are reflected on the Company’s consolidated balance sheets in afuture policy related liability.benefits. Potential guaranteed amounts of future payments will vary depending on production levels and underwriting results. Guarantees related to securities borrowing and repurchase arrangements provide additional security to third parties should a subsidiary fail to provide securities when due. RGA’s guarantees issued as of December 31, 20192022 and 20182021 are reflected in the following table (dollars in millions):
| | | | | | | | | | | |
| 2022 | | 2021 |
| Treaty guarantees | $ | 1,851 | | | $ | 2,208 | |
| Treaty guarantees, net of assets in trust | 1,081 | | | 1,281 | |
| Securities borrowing and repurchase arrangements | 170 | | | 134 | |
|
| | | | | | | |
| | 2019 | | 2018 |
| Treaty guarantees | $ | 1,821 |
| | $ | 1,392 |
|
| Treaty guarantees, net of assets in trust | 891 |
| | 1,291 |
|
| Securities borrowing and repurchase arrangements | 275 |
| | 270 |
|
| Financing arrangements | 42 |
| | 61 |
|
Note 13 DEBT
Long-Term Debt
The Company’s long-term debt consists of the following as of December 31, 20192022 and 20182021 (dollars in millions):
|
| | | | | | | | |
| | | 2019 | | 2018 |
| $400 million 6.45% Senior Notes due 2019 | | $ | — |
| | $ | 400 |
|
| $400 million 5.00% Senior Notes due 2021 | | 400 |
| | 400 |
|
| $400 million 4.70% Senior Notes due 2023 | | 399 |
| | 399 |
|
| $400 million 3.95% Senior Notes due 2026 | | 400 |
| | 400 |
|
| $600 million 3.90% Senior Notes due 2029 | | 599 |
| | — |
|
| $100 million 4.09% Promissory Note due 2039 | | 86 |
| | 89 |
|
| $400 million 6.20% Subordinated Debentures due 2042 | | 400 |
| | 400 |
|
| $400 million 5.75% Subordinated Debentures due 2056 | | 400 |
| | 400 |
|
| $400 million Variable Rate Junior Subordinated Debentures due 2065 | | 319 |
| | 319 |
|
| Sub-total | | 3,003 |
| | 2,807 |
|
| Unamortized issuance costs | | (22 | ) | | (19 | ) |
| Long-term Debt | | $ | 2,981 |
| | $ | 2,788 |
|
| | | | | | | | | | | | | | |
| | 2022 | | 2021 |
| $400 million 4.70% Senior Notes due 2023 | | $ | 400 | | | $ | 400 | |
| $400 million 3.95% Senior Notes due 2026 | | 400 | | | 400 | |
| $600 million 3.90% Senior Notes due 2029 | | 599 | | | 599 | |
| $600 million 3.15% Senior Notes due 2030 | | 598 | | | 597 | |
| $100 million 4.09% Promissory Note due 2039 | | 77 | | | 80 | |
| $400 million 6.20% Subordinated Debentures due 2042 | | — | | | 400 | |
| $500 million 4.00% Surplus Notes due 2051 | | 500 | | | 500 | |
| $700 million 7.125% Subordinated Debentures due 2052 | | 700 | | | — | |
| $400 million 5.75% Subordinated Debentures due 2056 | | 400 | | | 400 | |
| $400 million Variable Rate Junior Subordinated Debentures due 2065 | | 319 | | | 319 | |
| Sub-total | | 3,993 | | | 3,695 | |
| Unamortized issuance costs | | (32) | | | (28) | |
| Long-term Debt | | $ | 3,961 | | | $ | 3,667 | |
RGA has entered into an interest rate swap on its Variable Rate Junior Subordinated Debentures that effectively fixes the interest rate on these securities at 4.82% until December 2037.
On MaySeptember 15, 20192022, RGA announced a cash tender offer for any and all of its outstanding 6.20% Fixed-to-Floating Rate Subordinated Debentures due 2042 (the “2042 Debentures”) at a price of $25.20 for each $25 principal amount. The tender offer expired on September 22, 2022, and a total of $151 million or approximately 38%, of the aggregate principal amount of the 2042 Debentures were tendered. The Company redeemed the remaining debentures in accordance with the indenture governing the 2042 Debentures on December 15, 2022.
On September 23, 2022, RGA issued 3.9% Senior Notes7.125% fixed-rate reset subordinated debentures due MayOctober 15, 20292052, with a face amount of $600$700 million. This security has been registered with the Securities and Exchange Commission. The net proceeds were approximately $594$690 million and a portion was used in part to repay upon maturitypay for the Company’s $400 million 6.45% Senior Notes that matured in November 2019.tender offer and redemption of the 2042 Debentures. The remainderremaining proceeds will be used for general corporate purposes. Capitalized issue costs were approximately $5$10 million.
On December 13, 2021, RGA Reinsurance, a subsidiary of RGA issued to unaffiliated financial institutions 4.00% Surplus Notes due 2051 (the “Surplus Notes”). The proceeds of the Surplus Notes was $500 million. RGA Reinsurance will use the proceeds of the Surplus Notes for general corporate purposes. Capitalized issue costs were approximately $6 million.
Certain of the Company’s debt agreements contain financial covenant restrictions related to, among others, liens, the issuance and disposition of stock of restricted subsidiaries, minimum requirements of consolidated net worth, maximum ratios of debt to capitalization and change of control provisions. A material ongoing covenant default could require immediate payment of the amount due, including principal, under the various agreements. Additionally, the Company’s debt agreements contain cross-default covenants, which would make outstanding borrowings immediately payable in the event of a material uncured covenant default under any of the agreements, including, but not limited to, non-payment of indebtedness when due for an amount in excess of the amounts set forth in those agreements, bankruptcy proceedings, or any other event that results in the acceleration of the maturity of indebtedness. As of December 31, 20192022 and 2018,2021, the Company had $3,003$3,993 million and $2,807$3,695 million, respectively, in outstanding borrowings under its debt agreements and was in compliance with all covenants under those agreements. As of December 31, 20192022 and 2018,2021, the average interest rate on long-term debt outstanding was 4.82%4.71% and 5.24%4.42%, respectively.
The ability of the Company to make debt principal and interest payments depends on the earnings and surplus of subsidiaries, investment earnings on undeployed capital proceeds, and the Company’s ability to raise additional funds. Future principal payments due on long-term debt, excluding discounts, as of December 31, 2019,2022, were as follows (dollars in millions):
|
| | | | | | | | | | | | | | | | | | | | | | | |
| | Calendar Year |
| | 2020 | | 2021 | | 2022 | | 2023 | | 2024 | | Thereafter |
| Long-term debt | $ | 3 |
| | $ | 403 |
| | $ | 3 |
| | $ | 403 |
| | $ | 3 |
| | $ | 2,190 |
|
| | | | | | | | | | | | | | | | | | | | | | | | | | | | | | | | | | | |
| Calendar Year |
| 2023 | | 2024 | | 2025 | | 2026 | | 2027 | | Thereafter |
| Long-term debt | $ | 403 | | | $ | 3 | | | $ | 4 | | | $ | 404 | | | $ | 4 | | | $ | 3,179 | |
Credit and Committed Facilities
The Company has obtained bank letters of credit in favor of various affiliated and unaffiliated insurance companies from which the Company assumes business. These letters of credit represent guarantees of performance under the reinsurance agreements and allow ceding companies to take statutory reserve credits. Certain of these letters of credit contain financial covenant restrictions. At December 31, 20192022 and 2018,2021, there were approximately $62$128 million and $106$53 million, respectively, of undrawn outstanding bank letters of credit in favor of third parties. Additionally, the Company utilizes letters of credit primarily to secure reserve credits when it retrocedes business to its affiliated subsidiaries. The Company cedes business to its affiliates to help reduce the amount of regulatory capital required in certain jurisdictions such as the U.S. and the United Kingdom.UK. As of December 31, 20192022 and 2018, $1,2242021, $1,462 million and $1,357$1,440 million, respectively, in undrawn letters of credit from various banks were outstanding, primarily backing reinsurance between the various subsidiaries of the Company. The banks providing letters of credit to the Company are included on the NAIC list of approved banks.
The Company maintains sixseven committed credit facilities, a syndicated revolving credit facility withand six letter of credit facilities. The committed credit facilities have a combined capacity of $928 million while the syndicated revolving credit facility is for $850 million and fivethe remaining letter of credit facilities withhave a combined capacity of $880$1,250 million. The Company may borrow cash and obtain letters of credit in multiple currencies under its syndicated revolving credit facility. The following table provides additional information on the Company’s existing committed credit facilities as of December 31, 20192022 and 20182021 (dollars in millions):
| | | | | | | | | | | | | | | | | | | | | | | | | | | | | |
| | | | | | Amount Utilized(1) December 31, | | |
| Current Capacity | | | Maturity Date | | 2022 | | 2021 | | Basis of Fees |
| $ | 850 | | | | August 2023 | | $ | 1 | | | $ | 21 | | | Senior unsecured long-term debt rating |
| 500 | | | | November 2023 | | 346 | | | 376 | | | Debt rating and utilization % |
| 3 | | (2) | | December 2023 | | 3 | | | 80 | | | Fixed |
| 100 | | | | February 2024 | | 97 | | | 51 | | | Fixed |
| 125 | | | March 2024 | | 103 | | | 108 | | | Fixed |
| 100 | | | August 2024 | | 30 | | | 40 | | | Fixed |
| 100 | | | | May 2025 | | 70 | | | 70 | | | Fixed |
|
| | | | | | | | | | | | | | |
| | | | | Amount Utilized(1) December 31, | | |
| Current Capacity | | Maturity Date | | 2019 | | 2018 | | Basis of Fees |
| $ | 75 |
| | June 2021 | | $ | 15 |
| | $ | 34 |
| | Fixed |
105 (2) |
| | December 2021 | | 105 |
| | 106 |
| | Fixed |
| 100 |
| | March 2022 | | 99 |
| | — |
| | Fixed |
| 500 |
| | May 2022 | | 375 |
| | 395 |
| | Debt rating and utilization % |
| 100 |
| | May 2023 | | 61 |
| | 61 |
| | Fixed |
| 850 |
| | August 2023 | | 20 |
| | 18 |
| | Senior unsecured long-term debt rating |
| |
(1) | Represents issued but undrawn letters of credit. There was no cash borrowed for the periods presented. |
| |
(2) | Foreign currency denominated facility, amounts presented are in U.S. dollars. |
(2)Foreign currency denominated facility, amounts presented are in U.S. dollars.
Fees associated with the Company’s other letters of credit are not fixed for periods in excess of one year and are based on the Company’s ratings and the general availability of these instruments in the marketplace. Total fees expensed associated with the Company’s letters of credit were $8$11 million, $10$11 million and $11$10 million for the years ended December 31, 2019, 20182022, 2021 and 2017,2020, respectively, and are included in policy acquisition costs and other insurance expenses.
Note 14 COLLATERAL FINANCE AND SECURITIZATION NOTES
Collateral Finance Notes
In 2006, RGA’s subsidiary, Timberlake Financial L.L.C. (“Timberlake Financial”), issued $850 million of Series A Floating Rate Insured Notes, due June 2036, in a private placement. The notes were issued to fund the collateral requirements for statutory reserves required by Regulation XXX on specified term life insurance policies reinsured by RGA Reinsurance and retroceded to Timberlake Re. Proceeds from the notes, along with a $113 million direct investment by RGA, were deposited into a series of accounts that collateralize the notes and are not available to satisfy the general obligations of the Company. As of December 31, 20192022 and 2018,2021, respectively, the Company held assets in trust and in custody of $694$0 million and $768$465 million, of which $58$0 million and $57$39 million were held in a Debt Service Coverage account to cover interest payments on the notes. Interest on the notes accruesaccrued at an annual rate of 1-month LIBOR plus a base rate margin, payable monthly, and totaled $9$2 million, $9$1 million and $6$3 million in 2019, 20182022, 2021 and 2017,2020, respectively.
In 2015, RGA’s subsidiary, RGA Reinsurance Company (Barbados) Ltd. (“RGA Barbados”) obtained CAD$200.0 million of collateral financing from a third party through 2020, enabling RGA Barbados to support collateral requirements for Canadian reinsurance transactions. The obligation is reflected on the consolidated balance sheets in collateral finance and securitization notes. Interest on the collateral financing is payable quarterly and accrues at 3-month Canadian Dealer Offered Rate plus a margin and totaled $5 million, $5 million and $4 million in 2019, 2018 and 2017, respectively.
In 2015, RGA’s subsidiary, RGA Americas Reinsurance Company, Ltd. (“RGA Americas”), entered into a collateral financing transaction pursuant to which it issued a CAD$150 million note and, in return, obtained a CAD$150 million demand note issued by a designated series of a Delaware master trusts. The demand note matures in October 2020 and is used to support collateral requirements for Canadian reinsurance transactions.
The demand note is secured by a portfolio of specified assets that have an aggregate market value at least equal to the principal amount of the demand note and a payment obligation pledged by a third party financial institution. The principal amount of the demand note is payable upon demand by the holder, which creates a corresponding payment under the note issued by RGA Americas. The note issued by RGA Americas bears interest at a rate equal to the rate on the corresponding demand note, plus an amount representing fees payable to the applicable third party financial institution. Through December 31, 2019, no principal payments have been received or are currently due on the demand note and, as a result, there was no payment obligation under the note issued by RGA Americas. Accordingly, the notes are not reflected in the Company’s consolidated balance sheet or the table below, as of that date.
Securitization Notes
In 2014, RGA’s subsidiary, Chesterfield Financial Holdings LLC, (“Chesterfield Financial”), issued $300 million of asset-backed notes due December 2024 in a private placement. The notes were issued as part of an embedded value securitization transaction covering a closed block of policies assumed by RGA Reinsurancecalled and retroceded to Chesterfield Re. Proceeds from the notes, along with a direct investment by the Company, were applied by Chesterfield Financial to (i) pay certain transaction-related expenses, (ii) establish a reserve account owned by Chesterfield Financial and pledged to the indenture trustee for the benefit offully redeemed on August 29, 2022.
the holders of the notes (primarily to cover interest payments on the notes), and (iii) to fund an initial stock purchase from and capital contribution to Chesterfield Re to capitalize Chesterfield Re and to finance the payment of a ceding commission by Chesterfield Re to RGA Reinsurance under the retrocession agreement. As of December 31, 2019 and 2018, the Company held deposits in trust of $15 million and $14 million, respectively, to cover interest payments on the notes, which are not available to satisfy the general obligations of the Company. Interest on the notes accrues at an annual rate of 4.50%, payable quarterly, and totaled $8 million, $10 million and $11 million in 2019, 2018 and 2017, respectively. The notes represent senior, secured indebtedness of Chesterfield Financial. Limited support is provided by RGA for temporary potential liquidity events at Chesterfield Financial and for temporary potential statutory capital and surplus events at Chesterfield Re. Otherwise, there is no legal recourse to RGA or its other subsidiaries. The notes are not insured or guaranteed by any other person or entity.Securitization Notes
The Company’s collateral finance and securitization notes consist of the following as of December 31, 20192022 and 20182021 (dollars in millions):
|
| | | | | | | |
| | 2019 | | 2018 |
| Timberlake Financial | $ | 313 |
| | $ | 368 |
|
| RGA Barbados | 127 |
| | 132 |
|
| Chesterfield Financial | 161 |
| | 186 |
|
| Unamortized issuance costs | (3 | ) | | (4 | ) |
| Total | $ | 598 |
| | $ | 682 |
|
| | | | | | | | | | | |
| | 2022 | | 2021 |
| Timberlake Financial | $ | — | | | $ | 181 | |
| | | |
| | | |
| Unamortized issuance costs | — | | | (1) | |
| Total | $ | — | | | $ | 180 | |
Note 15 SEGMENT INFORMATION
The Company has geographic-based and business-based operational segments. Geographic-based operations are further segmented into traditional and financial solutions businesses.
The U.S. and Latin America Traditional segment provides individual and group life and health reinsurance to domestic clients for a variety of products through yearly renewable term agreements, coinsurance, and modified coinsurance. The U.S. and Latin America Financial Solutions segment includes asset-intensive products that concentrate on the investment risk within underlying annuities and corporate-owned life insurance policies, financial reinsurance, and capital solutions that assists ceding companies in meeting applicable regulatory requirements while enhancing their financial strength and regulatory surplus position.
The Canada Traditional segment is primarily engaged in individual life reinsurance, and to a lesser extent creditor, group life and health, critical illness and disability reinsurance, through yearly renewable term and coinsurance agreements. The Canada Financial Solutions segment concentrates on assisting clients with longevity risk transfer structures within underlying annuities and pension benefit obligations and provides capital solutions to assist clients in meeting applicable regulatory requirements while enhancing their financial strength and regulatory surplus position through financial reinsurance and other capital solutions structures.
The Europe, Middle East and Africa Traditional segment provides individual and group life and health products through yearly renewable term and coinsurance agreements, reinsurance of critical illness coverage that provides a benefit in the event of the diagnosis of a pre-defined critical illness and underwritten annuities. The Europe, Middle East and Africa Financial Solutions segment provides longevity, asset-intensive and financial reinsurance. Longevity reinsurance takes the form of closed block annuity reinsurance and longevity swap structures.
The Asia Pacific Traditional segment provides individual and group life and health reinsurance, critical illness coverage, disability and superannuation through yearly renewable term and coinsurance agreements. The Asia Pacific Financial Solutions segment provides financial reinsurance, asset-intensive and certain disability and life blocks.
Corporate and Other revenues primarily include investment income from unallocated invested assets, investment related gains and losses and service fees. Corporate and Other expenses consist of the offset to capital charges allocated to the operating segments within the policy acquisition costs and other insurance income line item, unallocated overhead and executive costs, interest expense related to debt, and the investment income and expense associated with the Company’s collateral finance and securitization transactions and service business expenses. Additionally, Corporate and Other includes results from certain wholly-owned subsidiaries, such as RGAx, and joint ventures that, among other activities, develop and market technology, and provide consulting and outsourcing solutions for the insurance and reinsurance industries. In the past two years, theThe Company has increased its investment and expendituresinvests in this area in an effort to both support its clients and generateaccelerate the development of new future revenue streams.solutions and services to increase consumer engagement within the life industry.
The accounting policies of the segments are the same as those described in Note 2 – “Significant Accounting Policies and Pronouncements.” The Company measures segment performance primarily based on profit or loss from operations before
income taxes. There are no intersegment reinsurance transactions and the Company does not have any material long-lived assets.
The Company allocates capital to its segments based on an internally developed economic capital model, the purpose of which is to measure the risk in the business and to provide a basis upon which capital is deployed. The economic capital model considers the unique and specific nature of the risks inherent in the Company’s businesses. As a result of the economic capital allocation process, a portion of investment income is attributed to the segments based on the level of allocated capital. In addition, the
segments are charged for excess capital utilized above the allocated economic capital basis. This charge is included in policy acquisition costs and other insurance expenses.
Information related to revenues, income (loss) before income taxes, interest expense, depreciation and amortization, and assets of the Company’s operations are summarized below (dollars in millions):
| | | | | | | | | | | | | | | | | | | | |
| For the years ended December 31, | | 2022 | | 2021 | | 2020 |
| Revenues: | | | | | | |
| U.S. and Latin America: | | | | | | |
| Traditional | | $ | 7,629 | | | $ | 7,198 | | | $ | 6,560 | |
| Financial Solutions | | 1,100 | | | 1,492 | | | 1,220 | |
| Total | | 8,729 | | | 8,690 | | | 7,780 | |
| Canada: | | | | | | |
| Traditional | | 1,465 | | | 1,448 | | | 1,260 | |
| Financial Solutions | | 105 | | | 101 | | | 92 | |
| Total | | 1,570 | | | 1,549 | | | 1,352 | |
| Europe, Middle East and Africa: | | | | | | |
| Traditional | | 1,830 | | | 1,827 | | | 1,633 | |
| Financial Solutions | | 623 | | | 616 | | | 471 | |
| Total | | 2,453 | | | 2,443 | | | 2,104 | |
| Asia Pacific: | | | | | | |
| Traditional | | 2,823 | | | 2,778 | | | 2,806 | |
| Financial Solutions | | 476 | | | 417 | | | 309 | |
| Total | | 3,299 | | | 3,195 | | | 3,115 | |
| Corporate and Other | | 207 | | | 781 | | | 245 | |
| Total | | $ | 16,258 | | | $ | 16,658 | | | $ | 14,596 | |
| | | For the years ended December 31, | | 2019 | | 2018 | | 2017 | For the years ended December 31, | | 2022 | | 2021 | | 2020 |
| Revenues: | | | | | | | |
| Income (loss) before income taxes: | | Income (loss) before income taxes: | | | | | | |
| U.S. and Latin America: | | | | | | | U.S. and Latin America: | |
| Traditional | | $ | 6,500 |
| | $ | 6,296 |
| | $ | 6,100 |
| Traditional | | $ | 268 | | | $ | (540) | | | $ | (298) | |
| Financial Solutions | | 1,279 |
| | 907 |
| | 1,151 |
| Financial Solutions | | 199 | | | 515 | | | 295 | |
| Total | | 7,779 |
| | 7,203 |
| | 7,251 |
| Total | | 467 | | | (25) | | | (3) | |
| Canada: | | | |
|
| |
|
| Canada: | | | | | | |
| Traditional | | 1,286 |
| | 1,224 |
| | 1,103 |
| Traditional | | 86 | | | 128 | | | 134 | |
| Financial Solutions | | 99 |
| | 49 |
| | 49 |
| Financial Solutions | | 32 | | | 15 | | | 21 | |
| Total | | 1,385 |
| | 1,273 |
| | 1,152 |
| Total | | 118 | | | 143 | | | 155 | |
| Europe, Middle East and Africa: | | | |
|
| | | Europe, Middle East and Africa: | | | | | | |
| Traditional | | 1,520 |
| | 1,495 |
| | 1,362 |
| Traditional | | 10 | | | (239) | | | 27 | |
| Financial Solutions | | 450 |
| | 350 |
| | 311 |
| Financial Solutions | | 196 | | | 303 | | | 258 | |
| Total | | 1,970 |
| | 1,845 |
| | 1,673 |
| Total | | 206 | | | 64 | | | 285 | |
| Asia Pacific: | | | |
|
| |
|
| Asia Pacific: | | | | | | |
| Traditional | | 2,681 |
| | 2,417 |
| | 2,210 |
| Traditional | | 294 | | | (10) | | | 174 | |
| Financial Solutions | | 228 |
| | 54 |
| | 74 |
| Financial Solutions | | (18) | | | 98 | | | 59 | |
| Total | | 2,909 |
| | 2,471 |
| | 2,284 |
| Total | | 276 | | | 88 | | | 233 | |
| Corporate and Other | | 257 |
| | 84 |
| | 156 |
| Corporate and Other | | (236) | | | 421 | | | (117) | |
| Total | | $ | 14,300 |
| | $ | 12,876 |
| | $ | 12,516 |
| Total | | $ | 831 | | | $ | 691 | | | $ | 553 | |
| | | | | | | | | | | | | | | | | | | | |
| For the years ended December 31, | | 2022 | | 2021 | | 2020 |
| Interest expense: | | | | | | |
| Corporate and Other | | $ | 184 | | | $ | 127 | | | $ | 170 | |
| Total | | $ | 184 | | | $ | 127 | | | $ | 170 | |
|
| | | | | | | | | | | | |
| For the years ended December 31, | | 2019 | | 2018 | | 2017 |
| Income (loss) before income taxes: | | | | | | |
| U.S. and Latin America: | | | | | | |
| Traditional | | $ | 265 |
| | $ | 286 |
| | $ | 373 |
|
| Financial Solutions | | 398 |
| | 251 |
| | 402 |
|
| Total | | 663 |
| | 537 |
| | 775 |
|
| Canada: | | | | | | |
| Traditional | | 168 |
| | 112 |
| | 120 |
|
| Financial Solutions | | 15 |
| | 10 |
| | 17 |
|
| Total | | 183 |
| | 122 |
| | 137 |
|
| Europe, Middle East and Africa: | | | | | | |
| Traditional | | 80 |
| | 55 |
| | 70 |
|
| Financial Solutions | | 223 |
| | 197 |
| | 124 |
|
| Total | | 303 |
| | 252 |
| | 194 |
|
| Asia Pacific: | | | | | | |
| Traditional | | 105 |
| | 178 |
| | 149 |
|
| Financial Solutions | | 23 |
| | (6 | ) | | 13 |
|
| Total | | 128 |
| | 172 |
| | 162 |
|
| Corporate and Other | | (145 | ) | | (237 | ) | | (125 | ) |
| Total | | $ | 1,132 |
| | $ | 846 |
| | $ | 1,143 |
|
146
|
| | | | | | | | | | | | |
| For the years ended December 31, | | 2019 | | 2018 | | 2017 |
| Interest expense: | | | | | | |
| Corporate and Other | | $ | 173 |
| | $ | 147 |
| | $ | 146 |
|
| Total | | $ | 173 |
| | $ | 147 |
| | $ | 146 |
|
|
| | | | | | | | | | | | |
| For the years ended December 31, | | 2019 | | 2018 | | 2017 |
| Depreciation and amortization: | | | | | | |
| U.S. and Latin America: | | | | | | |
| Traditional | | $ | 291 |
| | $ | 273 |
| | $ | 285 |
|
| Financial Solutions | | 143 |
| | 95 |
| | 209 |
|
| Total | | 434 |
| | 368 |
| | 494 |
|
| Canada: | | | | | | |
| Traditional | | 20 |
| | 22 |
| | 24 |
|
| Financial Solutions | | — |
| | — |
| | — |
|
| Total | | 20 |
| | 22 |
| | 24 |
|
| Europe, Middle East and Africa: | | | | | | |
| Traditional | | 56 |
| | 45 |
| | 35 |
|
| Financial Solutions | | 1 |
| | — |
| | — |
|
| Total | | 57 |
| | 45 |
| | 35 |
|
| Asia Pacific: | | | | | | |
| Traditional | | 60 |
| | 115 |
| | 114 |
|
| Financial Solutions | | 16 |
| | 2 |
| | 1 |
|
| Total | | 76 |
| | 117 |
| | 115 |
|
| Corporate and Other | | 22 |
| | 22 |
| | 38 |
|
| Total | | $ | 609 |
| | $ | 574 |
| | $ | 706 |
|
| | | | | | | | | | | | | | | | | | | | |
| For the years ended December 31, | | 2022 | | 2021 | | 2020 |
| Depreciation and amortization: | | | | | | |
| U.S. and Latin America: | | | | | | |
| Traditional | | $ | 314 | | | $ | 360 | | | $ | 291 | |
| Financial Solutions | | (111) | | | 80 | | | 90 | |
| Total | | 203 | | | 440 | | | 381 | |
| Canada: | | | | | | |
| Traditional | | 22 | | | 21 | | | 24 | |
| Financial Solutions | | — | | | — | | | — | |
| Total | | 22 | | | 21 | | | 24 | |
| Europe, Middle East and Africa: | | | | | | |
| Traditional | | 60 | | | 66 | | | 46 | |
| Financial Solutions | | 1 | | | 1 | | | 1 | |
| Total | | 61 | | | 67 | | | 47 | |
| Asia Pacific: | | | | | | |
| Traditional | | 82 | | | 87 | | | 94 | |
| Financial Solutions | | 68 | | | 43 | | | 20 | |
| Total | | 150 | | | 130 | | | 114 | |
| Corporate and Other | | 18 | | | 22 | | | 23 | |
| Total | | $ | 454 | | | $ | 680 | | | $ | 589 | |
The table above includes amortization of DAC, including the effect from investment related gains and losses.
|
| | | | | | | | |
| For the years ended December 31, | | 2019 | | 2018 |
| Assets: | | | | |
| U.S. and Latin America: | | | | |
| Traditional | | $ | 19,353 |
| | $ | 19,236 |
|
| Financial Solutions | | 25,117 |
| | 19,870 |
|
| Total | | 44,470 |
| | 39,106 |
|
| Canada: | | | | |
| Traditional | | 4,361 |
| | 4,201 |
|
| Financial Solutions | | 64 |
| | 154 |
|
| Total | | 4,425 |
| | 4,355 |
|
| Europe, Middle East and Africa: | | | | |
| Traditional | | 4,032 |
| | 3,643 |
|
| Financial Solutions | | 6,502 |
| | 4,738 |
|
| Total | | 10,534 |
| | 8,381 |
|
| Asia Pacific: | | | | |
| Traditional | | 6,800 |
| | 5,681 |
|
| Financial Solutions | | 2,557 |
| | 1,181 |
|
| Total | | 9,357 |
| | 6,862 |
|
| Corporate and Other | | 7,945 |
| | 5,831 |
|
| Total | | $ | 76,731 |
| | $ | 64,535 |
|
| | | | | | | | | | | | | | |
| For the years ended December 31, | | 2022 | | 2021 |
| Assets: | | | | |
| U.S. and Latin America: | | | | |
| Traditional | | $ | 20,567 | | | $ | 20,572 | |
| Financial Solutions | | 25,228 | | | 29,028 | |
| Total | | 45,795 | | | 49,600 | |
| Canada: | | | | |
| Traditional | | 4,912 | | | 5,091 | |
| Financial Solutions | | 52 | | | 18 | |
| Total | | 4,964 | | | 5,109 | |
| Europe, Middle East and Africa: | | | | |
| Traditional | | 4,723 | | | 4,670 | |
| Financial Solutions | | 4,998 | | | 7,165 | |
| Total | | 9,721 | | | 11,835 | |
| Asia Pacific: | | | | |
| Traditional | | 9,510 | | | 10,048 | |
| Financial Solutions | | 10,628 | | | 7,678 | |
| Total | | 20,138 | | | 17,726 | |
| Corporate and Other | | 4,088 | | | 7,905 | |
| Total | | $ | 84,706 | | | $ | 92,175 | |
Companies in which the Company has significant influence over the operating and financing decisions but are not required to be consolidated are reported on the equity basis of accounting. The equity in the net income of such investments is not material to the results of operations or financial position of individual segments or the Company taken as a whole. Capital expenditures of each reporting segment were immaterial in the periods noted.
No individual client generated 10% or more of the Company’s total gross premiums and other revenues on a consolidated basis in 2019, 20182022, 2021 and 2017.2020. For the purpose of this disclosure, companies that are within the same insurance holding company structure are combined.
Note 16 POLICY CLAIMS AND BENEFITS
Liabilities for Unpaid Claims and Claim Expense
The Company uses several actuarial methods to compute incurred-but-not reported liabilities. These methods use historical claim reporting patterns to develop a triangle of reported claim amounts. The claim triangle is then used to develop the ultimate claims amount and the incurred-but-not reported liabilities. Expected claim methods use exposure data such as premiums to develop the ultimate claim amount. The final method blends the estimates from the development and the expected claim methods. There were no significant changes in methodologies during 2019.2022.
The following tables provide information on incurred and paid claims development, net of retrocession, for short-duration reinsurance contracts for the Company’s U.S. and Latin America and Asia Pacific Traditional segments, which primarily relate to group life and health (including disability) business. The short-duration business for the Company’s other segments is immaterial. Liabilities for claims and claims adjustment expenses, net of reinsurance equals total incurred claims less cumulative paid claims plus outstanding liabilities prior to 2012.
The Company provides reinsurance on large quota share transactions. It is common industry practice for cedants to provide loss information on a bulk basis without comprehensive claim details. Additionally, a claim under aggregate stop loss coverage may be the result of thousands of claims, but the Company only pays the excess amount. Therefore, it is impractical to provide meaningful claim count detail by accident year in the tables shown below.
| | | | | | | | | | | | | | | | | | | | | | | | | | | | | | | | | | | | | | | | | | | | | | | | | | | | | | | | | | | | | | | | | | | | |
| U.S. and Latin America | | | | | | | | | | | | | | | | | | As of |
| (dollars in millions) | | | | | | | | | | | | | | | | | | December 31, 2022 |
Incurred Claims and Allocated Claim Adjustments, Net of Reinsurance (1) | | Total of Incurred-but-Not-Reported Liabilities Plus Expected Development on Reported Claims |
| Accident Year | | For the Years Ended December 31, | |
| 2013 | | 2014 | | 2015 | | 2016 | | 2017 | | 2018 | | 2019 | | 2020 | | 2021 | | 2022 | |
| 2013 | | $ | 349 | | | $ | 333 | | | $ | 339 | | | $ | 337 | | | $ | 336 | | | $ | 336 | | | $ | 337 | | | $ | 335 | | | $ | 336 | | | $ | 336 | | | — | |
| 2014 | | | | 408 | | | 411 | | | 396 | | | 397 | | | 396 | | | 399 | | | 399 | | | 401 | | | 401 | | | — | |
| 2015 | | | | | | 460 | | | 461 | | | 465 | | | 462 | | | 462 | | | 463 | | | 463 | | | 464 | | | — | |
| 2016 | | | | | | | | 501 | | | 500 | | | 501 | | | 497 | | | 497 | | | 498 | | | 499 | | | — | |
| 2017 | | | | | | | | | | 485 | | | 514 | | | 509 | | | 504 | | | 503 | | | 504 | | | — | |
| 2018 | | | | | | | | | | | | 538 | | | 538 | | | 524 | | | 517 | | | 520 | | | 1 | |
| 2019 | | | | | | | | | | | | | | 491 | | | 473 | | | 456 | | | 453 | | | 2 | |
| 2020 | | | | | | | | | | | | | | | | 469 | | | 426 | | | 415 | | | 5 | |
| 2021 | | | | | | | | | | | | | | | | | | 509 | | | 492 | | | 27 | |
| 2022 | | | | | | | | | | | | | | | | | | | | 519 | | | 227 |
| | | | | | | | | | | | | | | | | | Total | | $ | 4,603 | | | |
| | | U.S. and Latin America | | | | | | | | | | | | | | As of | |
| (dollars in millions) | | | | | | | | | | | | | | December 31, 2019 | |
Incurred Claims and Allocated Claim Adjustments, Net of Reinsurance (1) | | Total of Incurred-but-Not-Reported Liabilities Plus Expected Development on Reported Claims | |
Cumulative Paid Claims and Allocated Claim Adjustment Expense, Net of Reinsurance (1) | | Cumulative Paid Claims and Allocated Claim Adjustment Expense, Net of Reinsurance (1) | |
| Accident Year | | For the Years Ended December 31, | | Accident Year | | For the Years Ended December 31, | |
| | 2012 | | 2013 | | 2014 | | 2015 | | 2016 | | 2017 | | 2018 | | 2019 | | Total of Incurred-but-Not-Reported Liabilities Plus Expected Development on Reported Claims | | 2013 | | 2014 | | 2015 | | 2016 | | 2017 | | 2018 | | 2019 | | 2020 | | 2021 | | 2022 | |
| 2012 | | $ | 323 |
| | $ | 309 |
| | $ | 297 |
| | $ | 298 |
| | $ | 299 |
| | $ | 298 |
| | $ | 297 |
| | $ | 297 |
| | |
| 2013 | | | | 349 |
| | 333 |
| | 339 |
| | 337 |
| | 336 |
| | 336 |
| | 337 |
| | 2013 | | $ | 114 | | | $ | 249 | | | $ | 277 | | | $ | 286 | | | $ | 292 | | | $ | 297 | | | $ | 302 | | | $ | 305 | | | $ | 309 | | | $ | 311 | | |
| 2014 | | | | | | 408 |
| | 411 |
| | 396 |
| | 397 |
| | 396 |
| | 399 |
| | — |
| 2014 | | 129 | | | 305 | | | 337 | | | 349 | | | 356 | | | 364 | | | 368 | | | 374 | | | 378 | | |
| 2015 | | | | | | | | 460 |
| | 461 |
| | 465 |
| | 462 |
| | 462 |
| | — |
| 2015 | | 146 | | | 361 | | | 407 | | | 422 | | | 431 | | | 437 | | | 441 | | | 446 | | |
| 2016 | | | | | | | | | | 501 |
| | 500 |
| | 501 |
| | 497 |
| | 1 |
| 2016 | | 185 | | | 393 | | | 437 | | | 451 | | | 460 | | | 467 | | | 472 | | |
| 2017 | | | | | | | | | | | | 485 |
| | 514 |
| | 509 |
| | 6 |
| 2017 | | 190 | | | 403 | | | 448 | | | 462 | | | 468 | | | 474 | | |
| 2018 | | | | | | | | | | | | | | 538 |
| | 538 |
| | 28 |
| 2018 | | 183 | | | 415 | | | 465 | | | 479 | | | 489 | | |
| 2019 | | | | | | | | | | | | | | | | 491 |
| | 213 |
| 2019 | | 180 | | | 372 | | | 418 | | | 428 | | |
| 2020 | | 2020 | | 159 | | | 356 | | | 388 | | |
| 2021 | | 2021 | | 177 | | | 414 | | |
| 2022 | | 2022 | | 182 | | |
| | | | | | | | | | | | | | | Total |
| | $ | 3,530 |
| | | | Total | | 3,982 | | |
| | | All outstanding claims prior to 2013, net of reinsurance | | 108 | | |
| | | Liabilities for claims and claim adjustment expense, net of reinsurance | | $ | 729 | | |
(1)2013 –2021 unaudited.
|
| | | | | | | | | | | | | | | | | | | | | | | | | | | | | | | | | | |
Cumulative Paid Claims and Allocated Claim Adjustment Expense, Net of Reinsurance (1) | | |
| Accident Year | | For the Years Ended December 31, | | |
| | 2012 | | 2013 | | 2014 | | 2015 | | 2016 | | 2017 | | 2018 | | 2019 | | |
| 2012 | | $ | 109 |
| | $ | 222 |
| | $ | 244 |
| | $ | 252 |
| | $ | 258 |
| | $ | 264 |
| | $ | 268 |
| | $ | 272 |
| | |
| 2013 | | | | 114 |
| | 249 |
| | 277 |
| | 286 |
| | 292 |
| | 297 |
| | 302 |
| | |
| 2014 | | | | | | 129 |
| | 305 |
| | 337 |
| | 349 |
| | 356 |
| | 364 |
| | |
| 2015 | | | | | | | | 146 |
| | 361 |
| | 407 |
| | 422 |
| | 431 |
| | |
| 2016 | | | | | | | | | | 185 |
| | 393 |
| | 437 |
| | 451 |
| | |
| 2017 | | | | | | | | | | | | 190 |
| | 403 |
| | 448 |
| | |
| 2018 | | | | | | | | | | | | | | 183 |
| | 415 |
| | |
| 2019 | | | | | | | | | | | | | | | | 180 |
| | |
| | | | | | | | | | | | | | | Total |
| | $ | 2,863 |
| | |
| | | | | | | All outstanding claims prior to 2012, net of reinsurance | | | 152 |
| | |
| | | | | Liabilities for claims and claim adjustment expense, net of reinsurance | | | $ | 819 |
| | |
| | | | | | | | | | | | | | | | | | | | | | | | | | | | | | | | | | | | | | | | | | | | | | | | | | | | | | | | | | | | | | | | | | | | |
| Asia Pacific | | | | | | | | | | | | | | | | | | As of |
| (dollars in millions) | | | | | | | | | | | | | | | | | | | | December 31, 2022 |
Incurred Claims and Allocated Claim Adjustments, Net of Reinsurance (1) | | Total of Incurred-but-Not-Reported Liabilities Plus Expected Development on Reported Claims |
| Accident Year | | For the Years Ended December 31, | |
| 2013 | | 2014 | | 2015 | | 2016 | | 2017 | | 2018 | | 2019 | | 2020 | | 2021 | | 2022 | |
| 2013 | | $ | 282 | | | $ | 302 | | | $ | 293 | | | $ | 291 | | | $ | 303 | | | $ | 317 | | | $ | 319 | | | $ | 318 | | | $ | 319 | | | $ | 323 | | | 4 | |
| 2014 | | | | 267 | | | 290 | | | 257 | | | 262 | | | 275 | | | 277 | | | 277 | | | 276 | | | 275 | | | 4 | |
| 2015 | | | | | | 269 | | | 249 | | | 242 | | | 258 | | | 258 | | | 259 | | | 258 | | | 258 | | | 6 | |
| 2016 | | | | | | | | 220 | | | 199 | | | 206 | | | 213 | | | 212 | | | 209 | | | 210 | | | 5 | |
| 2017 | | | | | | | | | | 205 | | | 208 | | | 207 | | | 210 | | | 198 | | | 196 | | | 3 | |
| 2018 | | | | | | | | | | | | 245 | | | 262 | | | 256 | | | 245 | | | 239 | | | 9 | |
| 2019 | | | | | | | | | | | | | | 245 | | | 253 | | | 260 | | | 251 | | | 19 | |
| 2020 | | | | | | | | | | | | | | | | 145 | | | 141 | | | 142 | | | 23 | |
| 2021 | | | | | | | | | | | | | | | | | | 67 | | | 61 | | | 12 | |
| 2022 | | | | | | | | | | | | | | | | | | | | 93 | | | 57 | |
| | | | | | | | | | | | | | | | | | Total | | $ | 2,048 | | | |
| | | | | | | | | | | | | | | | | | | | | | | | | | | | | | | | | | | | | | | | | | | | | | | | | | | | | | | | | | | | | | | | | | | | |
Cumulative Paid Claims and Allocated Claim Adjustment Expense, Net of Reinsurance (1) | | |
| Accident Year | | For the Years Ended December 31, | | |
| 2013 | | 2014 | | 2015 | | 2016 | | 2017 | | 2018 | | 2019 | | 2020 | | 2021 | | 2022 | | |
| 2013 | | $ | 48 | | | $ | 139 | | | $ | 202 | | | $ | 228 | | | $ | 253 | | | $ | 273 | | | $ | 285 | | | $ | 294 | | | $ | 300 | | | $ | 306 | | | |
| 2014 | | | | 33 | | | 131 | | | 171 | | | 199 | | | 221 | | | 234 | | | 244 | | | 251 | | | 255 | | | |
| 2015 | | | | | | 47 | | | 115 | | | 162 | | | 196 | | | 214 | | | 226 | | | 235 | | | 240 | | | |
| 2016 | | | | | | | | 37 | | | 94 | | | 129 | | | 148 | | | 161 | | | 172 | | | 180 | | | |
| 2017 | | | | | | | | | | 34 | | | 84 | | | 111 | | | 132 | | | 147 | | | 160 | | | |
| 2018 | | | | | | | | | | | | 31 | | | 103 | | | 142 | | | 171 | | | 191 | | | |
| 2019 | | | | | | | | | | | | | | 37 | | | 99 | | | 136 | | | 174 | | | |
| 2020 | | | | | | | | | | | | | | | | 22 | | | 53 | | | 80 | | | |
| 2021 | | | | | | | | | | | | | | | | | | 8 | | | 23 | | | |
| 2022 | | | | | | | | | | | | | | | | | | | | 11 | | | |
| | | | | | | | | | | | | | | | Total | | 1,620 | | | |
| | | | | | All outstanding claims prior to 2013, net of reinsurance | | 79 | | | |
| | | | | | Liabilities for claims and claim adjustment expense, net of reinsurance | | $ | 507 | | | |
|
| | | | | | | | | | | | | | | | | | | | | | | | | | | | | | | | | | | | |
| Asia Pacific | | | | | | | | | | | | | | As of |
| (dollars in millions) | | | | | | | | | | | | | | | | December 31, 2019 |
Incurred Claims and Allocated Claim Adjustments, Net of Reinsurance (1) | | Total of Incurred-but-Not-Reported Liabilities Plus Expected Development on Reported Claims |
| Accident Year | | For the Years Ended December 31, | |
| | 2012 | | 2013 | | 2014 | | 2015 | | 2016 | | 2017 | | 2018 | | 2019 | |
| 2012 | | $ | 207 |
| | $ | 278 |
| | $ | 282 |
| | $ | 285 |
| | $ | 293 |
| | $ | 303 |
| | $ | 308 |
| | $ | 313 |
| | $ | 7 |
|
| 2013 | | | | 292 |
| | 312 |
| | 303 |
| | 300 |
| | 313 |
| | 327 |
| | 329 |
| | 11 |
|
| 2014 | | | | | | 276 |
| | 299 |
| | 264 |
| | 270 |
| | 283 |
| | 285 |
| | 13 |
|
| 2015 | | | | | | | | 277 |
| | 256 |
| | 249 |
| | 266 |
| | 266 |
| | 21 |
|
| 2016 | | | | | | | | | | 227 |
| | 205 |
| | 212 |
| | 219 |
| | 24 |
|
| 2017 | | | | | | | | | | | | 211 |
| | 214 |
| | 214 |
| | 34 |
|
| 2018 | | | | | | | | | | | | | | 253 |
| | 270 |
| | 76 |
|
| 2019 | | | | | | | | | | | | | | | | 253 |
| | 141 |
|
| | | | | | | | | | |
|
| | | | Total |
| | $ | 2,149 |
| | |
|
| | | | | | | | | | | | | | | | | | | | | | | | | | | | | | | | | | |
Cumulative Paid Claims and Allocated Claim Adjustment Expense, Net of Reinsurance (1) | | |
| Accident Year | | For the Years Ended December 31, | | |
| | 2012 | | 2013 | | 2014 | | 2015 | | 2016 | | 2017 | | 2018 | | 2019 | | |
| 2012 | | $ | 49 |
| | $ | 135 |
| | $ | 185 |
| | $ | 222 |
| | $ | 243 |
| | $ | 259 |
| | $ | 274 |
| | $ | 283 |
| | |
| 2013 | | | | 50 |
| | 144 |
| | 209 |
| | 235 |
| | 260 |
| | 282 |
| | 294 |
| | |
| 2014 | | | | | | 34 |
| | 135 |
| | 177 |
| | 205 |
| | 228 |
| | 241 |
| | |
| 2015 | | | | | | | | 49 |
| | 118 |
| | 167 |
| | 201 |
| | 221 |
| | |
| 2016 | | | | | | | | | | 38 |
| | 97 |
| | 133 |
| | 152 |
| | |
| 2017 | | | | | | | | | | | | 35 |
| | 87 |
| | 115 |
| | |
| 2018 | | | | | | | | | | | | | | 32 |
| | 106 |
| | |
| 2019 | | | | | | | | | | | | | | | | 38 |
| | |
| | | | | | | | | | |
|
| | | | Total |
|
| $ | 1,450 |
| | |
| | | | | | | All outstanding claims prior to 2012, net of reinsurance | | | 98 |
| | |
| | | | | Liabilities for claims and claim adjustment expense, net of reinsurance | | | $ | 797 |
| | |
The following is unaudited supplementary information about average historical claims duration as of December 31, 2019:2022:
| | | | | | | | | | | | | | | | | | | | | | | | | | | | | | | | | | | | | | | | | | | | | | | | | | | | | | | | | | | | | | |
| Average Annual Payout of Incurred Claims by Age, Net of Reinsurance |
| Years | | 1 | | 2 | | 3 | | 4 | | 5 | | 6 | | 7 | | 8 | | 9 | | 10 |
| U.S. and Latin America | | 35.7 | % | | 44.1 | % | | 9.0 | % | | 2.7 | % | | 1.7 | % | | 1.4 | % | | 1.1 | % | | 1.3 | % | | 1.1 | % | | 0.8 | % |
| Asia Pacific | | 14.8 | % | | 27.1 | % | | 16.6 | % | | 11.1 | % | | 7.6 | % | | 5.4 | % | | 3.7 | % | | 2.5 | % | | 2.0 | % | | 1.7 | % |
|
| | | | | | | | | | | | | | | | | | | | | | | | |
| Average Annual Payout of Incurred Claims by Age, Net of Reinsurance |
| Years | | 1 | | 2 | | 3 | | 4 | | 5 | | 6 | | 7 | | 8 |
| U.S. and Latin America | | 35.0 | % | | 42.2 | % | | 8.6 | % | | 2.9 | % | | 1.9 | % | | 1.7 | % | | 1.4 | % | | 1.3 | % |
| Asia Pacific | | 15.2 | % | | 28.0 | % | | 16.3 | % | | 10.4 | % | | 7.4 | % | | 5.5 | % | | 4.2 | % | | 3.0 | % |
149
Reconciliation of the Disclosure of Incurred and Paid Claims Development to the Liability for Unpaid Claims and Claims Adjustment Expenses
The reconciliation of the net incurred and paid claims development tables to the liability for claims and claim adjustment expense in the consolidated balance sheet as of December 31, 20192022 is as follows (dollars in millions):
|
| | | |
| | 2019 |
| Liabilities for claims and claim adjustment expense, net of reinsurance: | |
| U.S. and Latin America | $ | 819 |
|
| Asia Pacific | 797 |
|
| Liabilities for claims and claim adjustment expense, net of reinsurance | 1,616 |
|
| Adjustments to reconcile to total policy claims and future policy benefits: | |
| Reinsurance recoverable | 14 |
|
| Effect of discounting | (134 | ) |
| Unallocated claims adjustment expense | 6 |
|
| Total adjustments | (114 | ) |
| Other short-duration contracts: | |
| Canada | 131 |
|
| Europe, Middle East and Africa | 438 |
|
| Other | 224 |
|
| Liability for unpaid claims and claim adjustment expense - short-duration | 2,295 |
|
| Liability for unpaid claims and claim adjustment expense - long-duration | 4,491 |
|
| Total liability for unpaid claims and claim adjustment expense (included in future policy benefits and other policy-related balances) | $ | 6,786 |
|
| | | | | |
| 2022 |
| Liabilities for claims and claim adjustment expense, net of reinsurance: | |
| U.S. and Latin America | $ | 729 | |
| Asia Pacific | 507 | |
| Liabilities for claims and claim adjustment expense, net of reinsurance | 1,236 | |
| Adjustments to reconcile to total policy claims and future policy benefits: | |
| Reinsurance recoverable | 10 | |
| Effect of discounting | (97) | |
| Unallocated claims adjustment expense | 7 | |
| Total adjustments | (80) | |
| Other short-duration contracts: | |
| Canada | 309 |
| Europe, Middle East and Africa | 768 | |
| Other | 259 | |
| Liability for unpaid claims and claim adjustment expense – short-duration | 2,492 | |
| Liability for unpaid claims and claim adjustment expense – long-duration | 5,152 | |
| Total liability for unpaid claims and claim adjustment expense (included in future policy benefits and other policy-related balances) | $ | 7,644 | |
Rollforward of Claims and Claim Adjustment Expenses
The liability for unpaid claims is reported in future policy benefits and other policy-related balances within the Company’s consolidated balance sheet.sheets. Activity associated with unpaid claims is summarized below (dollars in millions):
|
| | | | | | | | | | | | |
| | | 2019 | | 2018 | | 2017 |
| Balance at beginning of year | | $ | 6,585 |
| | $ | 5,896 |
| | $ | 5,181 |
|
| Less: reinsurance recoverable | | (433 | ) | | (456 | ) | | (395 | ) |
| Net balance at beginning of year | | 6,152 |
| | 5,440 |
| | 4,786 |
|
| Incurred: | | | | | | |
| Current year | | 10,307 |
| | 10,049 |
| | 8,912 |
|
| Prior years | | 154 |
| | 131 |
| | 14 |
|
| Total incurred | | 10,461 |
| | 10,180 |
| | 8,926 |
|
| Payments: | | | | | | |
| Current year | | (5,140 | ) | | (4,602 | ) | | (4,514 | ) |
| Prior years | | (5,305 | ) | | (4,692 | ) | | (4,004 | ) |
| Total payments | | (10,445 | ) | | (9,294 | ) | | (8,518 | ) |
| Other changes: | | | | | | |
| Interest accretion | | 33 |
| | 25 |
| | 19 |
|
| Foreign exchange adjustments | | 21 |
| | (199 | ) | | 227 |
|
| Total other changes | | 54 |
| | (174 | ) | | 246 |
|
| | | | | | | |
| Net balance at end of year | | 6,222 |
| | 6,152 |
| | 5,440 |
|
| Plus: reinsurance recoverable | | 564 |
| | 433 |
| | 456 |
|
| Balance at end of year | | $ | 6,786 |
| | $ | 6,585 |
| | $ | 5,896 |
|
| | | | | | | | | | | | | | | | | | | | |
| | 2022 | | 2021 | | 2020 |
| Balance, beginning of period | | $ | 8,053 | | | $ | 7,556 | | | $ | 6,786 | |
| Less: reinsurance recoverable | | (556) | | | (641) | | | (564) | |
| Net balance, beginning of period | | 7,497 | | | 6,915 | | | 6,222 | |
| Incurred: | | | | | | |
| Current year | | 11,018 | | | 13,181 | | | 11,195 | |
| Prior years | | (143) | | | (377) | | | 123 | |
| Total incurred | | 10,875 | | | 12,804 | | | 11,318 | |
| Payments: | | | | | | |
| Current year | | (4,282) | | | (6,284) | | | (5,617) | |
| Prior years | | (6,634) | | | (5,810) | | | (5,204) | |
| Total payments | | (10,916) | | | (12,094) | | | (10,821) | |
| Other changes: | | | | | | |
| Interest accretion | | 34 | | | 31 | | | 36 | |
| Foreign exchange adjustments | | (285) | | | (159) | | | 160 | |
| Total other changes | | (251) | | | (128) | | | 196 | |
| | | | | | |
| Net balance, end of period | | 7,205 | | | 7,497 | | | 6,915 | |
| Plus: reinsurance recoverable | | 439 | | | 556 | | | 641 | |
| Balance, end of period | | $ | 7,644 | | | $ | 8,053 | | | $ | 7,556 | |
Incurred claims associated with prior periods are primarily due to events, related to long-duration business, which were incurred in prior years reflectedperiods but were reported in the table above, resulted in part from developedcurrent period, and to a lesser extent, the development of short-duration business claims for prior years being different than were anticipated when the liabilities for unpaid claims were originally estimated. These trends have been considered in establishing the current year liability for unpaid claims.
Note 17 EQUITY
On June 5, 2020, the Company completed a public offering of 6,172,840 shares of common stock, $0.01 par value per share, at a public offering price of $81.00 per share. The Company received net proceeds of approximately $481 million. The Company granted the underwriters an option to purchase from the Company, within 30 days after the Underwriting Agreement dated June 2, 2020, up to an additional 925,926 shares of common stock at the offering price of $81.00 per share. The underwriters’ option was not exercised and expired on July 2, 2020. The Company used the net proceeds of the offering for general corporate purposes.
Common stockStock
The changes in number of common stock shares, issued, held in treasury and outstanding are as follows for the periods indicated:
| | | | | | | | | | | | | | | | | | | | |
| | Issued | | Held In Treasury | | Outstanding |
| Balance, December 31, 2019 | | 79,137,758 | | | 16,481,656 | | | 62,656,102 | |
| Equity offering | | 6,172,840 | | | — | | | 6,172,840 | |
| Common Stock acquired | | — | | | 1,074,413 | | | (1,074,413) | |
Stock-based compensation (1) | | — | | | (202,372) | | | 202,372 | |
| Balance, December 31, 2020 | | 85,310,598 | | | 17,353,697 | | | 67,956,901 | |
| | | | | | |
| Common Stock acquired | | — | | | 852,037 | | | (852,037) | |
Stock-based compensation (1) | | — | | | (65,866) | | | 65,866 | |
| Balance, December 31, 2021 | | 85,310,598 | | | 18,139,868 | | | 67,170,730 | |
| Common Stock acquired | | — | | | 599,254 | | | (599,254) | |
Stock-based compensation (1) | | — | | | (104,732) | | | 104,732 | |
| Balance, December 31, 2022 | | 85,310,598 | | | 18,634,390 | | | 66,676,208 | |
|
| | | | | | | | | |
| | | Issued | | Held In Treasury | | Outstanding |
| Balance, December 31, 2016 | | 79,137,758 |
| | 14,835,256 |
| | 64,302,502 |
|
| Common Stock acquired | | — |
| | 208,680 |
| | (208,680 | ) |
Stock-based compensation (1) | | — |
| | (358,273 | ) | | 358,273 |
|
| Balance, December 31, 2017 | | 79,137,758 |
| | 14,685,663 |
| | 64,452,095 |
|
| Common Stock acquired | | — |
| | 1,932,055 |
| | (1,932,055 | ) |
Stock-based compensation (1) | | — |
| | (294,328 | ) | | 294,328 |
|
| Balance, December 31, 2018 | | 79,137,758 |
| | 16,323,390 |
| | 62,814,368 |
|
| Common Stock acquired | | — |
| | 546,614 |
| | (546,614 | ) |
Stock-based compensation (1) | | — |
| | (388,348 | ) | | 388,348 |
|
| Balance, December 31, 2019 | | 79,137,758 |
| | 16,481,656 |
| | 62,656,102 |
|
| |
(1) | Represents net shares issued from treasury pursuant to the Company’s stock-based compensation programs. |
Common stock heldStock Held in treasuryTreasury
Common stock held in treasury is accounted for at average cost. Gains resulting from the reissuance of “Common stock held in treasury” are credited to “Additional paid-in capital.” Losses resulting from the reissuance of “Common stock held in treasury” are charged first to “Additional paid-in capital” to the extent the Company has previously recorded gains on treasury share transactions, then to “Retained earnings.”
On January 24, 2019, RGA’s board of directors authorized a share repurchase program for up to $400 million of RGA’s outstanding common stock. During the year ended December 31, 2022, the Company repurchased 219,116 shares of common stock under this program for $25 million.
On February 25, 2022, RGA’s board of directors authorized a share repurchase program for up to $400 million of RGA’s outstanding common stock. The authorization was effective immediately and does not have an expiration date. In connection with this authorization, the board of directors terminated the stock repurchase authority granted in 2017. 2019. During the year ended December 31, 2022, RGA repurchased 380,138 shares of common stock under this program for $50 million.
The following table summarizes the Company’s current share repurchase program activity under the 2019 and 2022 share repurchase programs for the yearyears ended 2019December 31, 2022 and 2021 (dollar amounts in millions, except for the number of shares and per share amounts):
|
| | | | | | | | | | | |
| Year of Repurchase | | Shares Repurchased | | Amount Paid | | Average Per Share |
| 2019 | | 546,614 |
| | $ | 80 |
| | $ | 146.00 |
|
| | | | | | | | | | | | | | | | | | | | |
| Year of Repurchase | | Shares Repurchased | | Amount Paid | | Average Per Share |
| 2022 | | 599,254 | | | $ | 75 | | | $ | 125.15 | |
| 2021 | | 852,037 | | | $ | 96 | | | $ | 112.64 | |
Noncontrolling Interest
In 2022, Papara Financing LLC (“Papara”), a subsidiary of RGA Reinsurance, issued nonconvertible preferred interests to an unaffiliated third party. Papara holds investments in mortgage loans. The timingmembership interests in Papara consist of (1) common interests, which are held by RGA Reinsurance and amount(2) preferred interests. The preferred interests total $90 million and pay an initial preferred distribution at an annual rate of share repurchases2.375% plus three month LIBOR. The applicable rate of interest is reset every five years. Distributions are determinedpaid quarterly, if declared by management basedPapara. RGA can call the Papara preferred interests at the issue price beginning five years from the issuance date or upon market conditions and other considerations. Factors could affecting the timing and amountreceipt of any future repurchases underproceeds from the share repurchase authorization, include increased capital needssale of the Company dueunderlying assets. The holders of the Papara preferred interests have the option to changesrequire redemption upon the occurrence of certain contingent events, such as the failure of Papara to pay the preferred distribution for two or more periods or to meet certain other requirements, including a minimum credit rating. If notice is given upon such an event, all other holders of equal or more subordinate classes of
membership interests in regulatory capital requirements, opportunitiesPapara are entitled to receive the same form of consideration payable to the holders of the preferred interests, resulting in a deemed liquidation for growthaccounting purposes. The preferred interests are included in noncontrolling interest, and acquisitions, andnet income attributable to noncontrolling interest was $4 million for the effect of adverse market conditions on the segments.year ended December 31, 2022.
Accumulated other comprehensive income (loss)Other Comprehensive Income (Loss)
The following table presents the components of the Company’s other comprehensive income (loss) for the years ended December 31, 2019, 20182022, 2021 and 20172020 (dollars in millions):
For the year ended December 31, 2019:2022:
|
| | | | | | | | | | | | |
| | | Before-Tax Amount | | Tax (Expense) Benefit | | After-Tax Amount |
| Foreign currency translation adjustments: | | | | | | |
| Change arising during year | | $ | 113 |
| | $ | (10 | ) | | $ | 103 |
|
| Foreign currency swap | | (33 | ) | | 7 |
| | (26 | ) |
| Net foreign currency translation adjustments | | 80 |
| | (3 | ) | | 77 |
|
Unrealized gains on investments:(1) | | | | | | |
| Unrealized net holding gains arising during the year | | 3,208 |
| | (698 | ) | | 2,510 |
|
| Less: Reclassification adjustment for net gains realized in net income | | 84 |
| | (17 | ) | | 67 |
|
| Net unrealized gains | | 3,124 |
| | (681 | ) | | 2,443 |
|
| Change in unrealized OTTI on fixed maturity securities | | — |
| | — |
| | — |
|
| Unrealized pension and postretirement benefits: | | | | | | |
| Net prior service cost arising during the year | | (1 | ) | | — |
| | (1 | ) |
| Net gain (loss) arising during the period | | (23 | ) | | 5 |
| | (18 | ) |
| Unrealized pension and postretirement benefits, net | | (24 | ) | | 5 |
| | (19 | ) |
| Other comprehensive income (loss) | | $ | 3,180 |
| | $ | (679 | ) | | $ | 2,501 |
|
| | | | | | | | | | | | | | | | | | | | |
| | Before-Tax Amount | | Tax (Expense) Benefit | | After-Tax Amount |
| Foreign currency translation adjustments: | | | | | | |
| Change arising during year | | $ | (205) | | | $ | (8) | | | $ | (213) | |
| Foreign currency swap | | 64 | | | (13) | | | 51 | |
| Net foreign currency translation adjustments | | (141) | | | (21) | | | (162) | |
Unrealized gains on investments:(1) | | | | | | |
| Unrealized net holding losses arising during the year | | (11,821) | | | 2,536 | | | (9,285) | |
| Less: Reclassification adjustment for net gains realized in net income | | (218) | | | 41 | | | (177) | |
| Net unrealized gains | | (11,603) | | | 2,495 | | | (9,108) | |
| Change in impairments on fixed maturity securities | | — | | | — | | | — | |
| Unrealized pension and postretirement benefits: | | | | | | |
| Net prior service cost arising during the year | | (3) | | | 1 | | | (2) | |
| Net gain (loss) arising during the period | | 33 | | | (8) | | | 25 | |
| Unrealized pension and postretirement benefits, net | | 30 | | | (7) | | | 23 | |
| Other comprehensive income (loss) | | $ | (11,714) | | | $ | 2,467 | | | $ | (9,247) | |
For the year ended December 31, 2018:2021: | | | | | Before-Tax Amount | | Tax (Expense) Benefit | | After-Tax Amount | | Before-Tax Amount | | Tax (Expense) Benefit | | After-Tax Amount |
| Foreign currency translation adjustments: | | | | | | | Foreign currency translation adjustments: | | | | | | |
| Change arising during year | | $ | (148 | ) | | $ | (1 | ) | | $ | (149 | ) | Change arising during year | | $ | 85 | | | $ | (24) | | | $ | 61 | |
| Foreign currency swap | | 87 |
| | (18 | ) | | 69 |
| Foreign currency swap | | (2) | | | 1 | | | (1) | |
| Net foreign currency translation adjustments | | (61 | ) | | (19 | ) | | (80 | ) | Net foreign currency translation adjustments | | 83 | | | (23) | | | 60 | |
Unrealized gains on investments:(1) | | | | | | | Unrealized gains on investments:(1) | | | | | | |
| Unrealized net holding gains arising during the year | | (1,834 | ) | | 394 |
| | (1,440 | ) | Unrealized net holding gains arising during the year | | (2,093) | | | 471 | | | (1,622) | |
| Less: Reclassification adjustment for net gains realized in net income | | (122 | ) | | 26 |
| | (96 | ) | Less: Reclassification adjustment for net gains realized in net income | | 226 | | | (49) | | | 177 | |
| Net unrealized gains | | (1,712 | ) | | 368 |
| | (1,344 | ) | Net unrealized gains | | (2,319) | | | 520 | | | (1,799) | |
| Change in unrealized OTTI on fixed maturity securities | | — |
| | — |
| | — |
| |
| Change in impairments on fixed maturity securities | | Change in impairments on fixed maturity securities | | — | | | — | | | — | |
| Unrealized pension and postretirement benefits: | | | | | | | Unrealized pension and postretirement benefits: | |
| Net prior service cost arising during the year | | (1 | ) | | — |
| | (1 | ) | Net prior service cost arising during the year | | 2 | | | — | | | 2 | |
| Net gain arising during the period | | 1 |
| | — |
| | 1 |
| |
| Net gain (loss) arising during the period | | Net gain (loss) arising during the period | | 27 | | | (7) | | | 20 | |
| Unrealized pension and postretirement benefits, net | | — |
| | — |
| | — |
| Unrealized pension and postretirement benefits, net | | 29 | | | (7) | | | 22 | |
| Other comprehensive income (loss) | | $ | (1,773 | ) | | $ | 349 |
| | $ | (1,424 | ) | Other comprehensive income (loss) | | $ | (2,207) | | | $ | 490 | | | $ | (1,717) | |
For the year ended December 31, 2017:2020:
| | | | | | | | | | | | | | | | | | | | |
| | Before-Tax Amount | | Tax (Expense) Benefit | | After-Tax Amount |
| Foreign currency translation adjustments: | | | | | | |
| Change arising during year | | $ | 43 | | | $ | 3 | | | $ | 46 | |
| Foreign currency swap | | (29) | | | 6 | | | (23) | |
| Net foreign currency translation adjustments | | 14 | | | 9 | | | 23 | |
Unrealized gains on investments:(1) | | | | | | |
| Unrealized net holding gains arising during the year | | 2,812 | | | (614) | | | 2,198 | |
| Less: Reclassification adjustment for net gains realized in net income | | (8) | | | (1) | | | (9) | |
| Net unrealized gains | | 2,820 | | | (613) | | | 2,207 | |
| Change in impairments on fixed maturity securities | | (8) | | | 2 | | | (6) | |
| Unrealized pension and postretirement benefits: | | | | | | |
| Net prior service cost arising during the year | | (1) | | | — | | | (1) | |
| Net gain arising during the period | | (2) | | | 1 | | | (1) | |
| Unrealized pension and postretirement benefits, net | | (3) | | | 1 | | | (2) | |
| Other comprehensive income (loss) | | $ | 2,823 | | | $ | (601) | | | $ | 2,222 | |
(1)Includes cash flow hedges. See Note 5 for additional information on cash flow hedges.
|
| | | | | | | | | | | | |
| | | Before-Tax Amount | | Tax (Expense) Benefit | | After-Tax Amount |
| Foreign currency translation adjustments: | | | | | | |
| Change arising during year | | $ | 75 |
| | $ | 25 |
| | $ | 100 |
|
| Foreign currency swap | | (48 | ) | | 17 |
| | (31 | ) |
| Net foreign currency translation adjustments | | 27 |
| | 42 |
| | 69 |
|
Unrealized gains on investments:(1) | | | | | | |
| Unrealized net holding gains arising during the year | | 1,030 |
| | (314 | ) | | 716 |
|
| Less: Reclassification adjustment for net gains realized in net income | | 25 |
| | (7 | ) | | 18 |
|
| Net unrealized gains | | 1,005 |
| | (307 | ) | | 698 |
|
| Change in unrealized OTTI on fixed maturity securities | | — |
| | — |
| | — |
|
| Unrealized pension and postretirement benefits: | | | | | | |
| Net prior service cost arising during the year | | 12 |
| | (4 | ) | | 8 |
|
| Net gain arising during the period | | (11 | ) | | 4 |
| | (7 | ) |
| Unrealized pension and postretirement benefits, net | | 1 |
| | — |
| | 1 |
|
| Other comprehensive income (loss) | | $ | 1,033 |
| | $ | (265 | ) | | $ | 768 |
|
| |
(1) | Includes cash flow hedges. See Note 5 for additional information on cash flow hedges. |
A summary of the components of net unrealized appreciation (depreciation) of balances carried at fair value is as follows (dollars in millions):
| | | | | | | | | | | | | | | | | | | | |
| For the years ended December 31, | | 2022 | | 2021 | | 2020 |
| Change in net unrealized appreciation (depreciation) on: | | | | | | |
| Fixed maturity securities available-for-sale | | $ | (11,632) | | | $ | (2,299) | | | $ | 2,837 | |
Other investments(1) | | (186) | | | (64) | | | 29 | |
| Effect on unrealized appreciation on: | | | | | | |
| Deferred policy acquisition costs | | 215 | | | 44 | | | (54) | |
| Net unrealized appreciation (depreciation) | | $ | (11,603) | | | $ | (2,319) | | | $ | 2,812 | |
|
| | | | | | | | | | | | |
| For the years ended December 31, | | 2019 | | 2018 | | 2017 |
| Change in net unrealized appreciation (depreciation) on: | | | | | | |
| Fixed maturity securities available-for-sale | | $ | 3,258 |
| | $ | (1,759 | ) | | $ | 988 |
|
Other investments(1) | | (37 | ) | | 20 |
| | 25 |
|
| Effect on unrealized appreciation on: | | | | | | |
| Deferred policy acquisition costs | | (98 | ) | | 27 |
| | (8 | ) |
| Net unrealized appreciation (depreciation) | | $ | 3,123 |
| | $ | (1,712 | ) | | $ | 1,005 |
|
| |
(1) | Includes cash flow hedges. See Note 5 for additional information on cash flow hedges. |
The balance of and changes in each component of AOCI were as follows (dollars in millions):
| | | | | | | | | | | | | | | | | | | | | | | | | | |
| | Accumulated
Currency
Translation
Adjustments | | Unrealized Appreciation (Depreciation) of Investments (1) | | Pension and
Postretirement
Benefits | | Accumulated
Other
Comprehensive
Income (Loss) |
| Balance, December 31, 2019 | | $ | (92) | | | $ | 3,299 | | | $ | (70) | | | $ | 3,137 | |
| OCI before reclassifications | | 14 | | | 2,854 | | | (9) | | | 2,859 | |
| Amounts reclassified from AOCI | | — | | | (42) | | | 6 | | | (36) | |
| Deferred income tax benefit (expense) | | 9 | | | (611) | | | 1 | | | (601) | |
| Balance, December 31, 2020 | | (69) | | | 5,500 | | | (72) | | | 5,359 | |
| OCI before reclassifications | | 83 | | | (2,144) | | | 22 | | | (2,039) | |
| Amounts reclassified from AOCI | | — | | | (175) | | | 7 | | | (168) | |
| Deferred income tax benefit (expense) | | (23) | | | 520 | | | (7) | | | 490 | |
| Balance, December 31, 2021 | | (9) | | | 3,701 | | | (50) | | | 3,642 | |
| OCI before reclassifications | | (141) | | | (12,045) | | | 28 | | | (12,158) | |
| Amounts reclassified from AOCI | | — | | | 442 | | | 2 | | | 444 | |
| Deferred income tax benefit (expense) | | (21) | | | 2,495 | | | (7) | | | 2,467 | |
| Balance, December 31, 2022 | | $ | (171) | | | $ | (5,407) | | | $ | (27) | | | $ | (5,605) | |
|
| | | | | | | | | | | | | | | | |
| | | Accumulated Currency Translation Adjustments | | Unrealized Appreciation (Depreciation) of Investments (1) | | Pension and Postretirement Benefits | | Accumulated Other Comprehensive Income (Loss) |
| Balance, December 31, 2016 | | $ | (172 | ) | | $ | 1,355 |
| | $ | (44 | ) | | $ | 1,139 |
|
| OCI before reclassifications | | 27 |
| | 1,039 |
| | (4 | ) | | 1,062 |
|
| Amounts reclassified from AOCI | | — |
| | (34 | ) | | 5 |
| | (29 | ) |
| Deferred income tax benefit (expense) | | 42 |
| | (307 | ) | | — |
| | (265 | ) |
| Adoption of new accounting standard | | 17 |
| | 148 |
| | (8 | ) | | 157 |
|
| Balance, December 31, 2017 | | (86 | ) | | 2,201 |
|
| (51 | ) | | 2,064 |
|
| OCI before reclassifications | | (60 | ) | | (1,861 | ) | | (5 | ) | | (1,926 | ) |
| Amounts reclassified from AOCI | | — |
| | 148 |
| | 5 |
| | 153 |
|
| Deferred income tax benefit (expense) | | (19 | ) | | 368 |
| | — |
| | 349 |
|
| Adoption of new accounting standard | | (4 | ) | | — |
| | — |
| | (4 | ) |
| Balance, December 31, 2018 | | (169 | ) | | 856 |
| | (51 | ) | | 636 |
|
| OCI before reclassifications | | 80 |
| | 3,306 |
| | (28 | ) | | 3,358 |
|
| Amounts reclassified from AOCI | | — |
| | (182 | ) | | 4 |
| | (178 | ) |
| Deferred income tax benefit (expense) | | (3 | ) | | (681 | ) | | 5 |
| | (679 | ) |
| Balance, December 31, 2019 | | $ | (92 | ) | | $ | 3,299 |
| | $ | (70 | ) | | $ | 3,137 |
|
| |
(1) | Includes cash flow hedges of $(26), $9 and $3 as of December 31, 2019, 2018 and 2017, respectively. See Note 5 for additional information on cash flow hedges. |
The following table presents the amounts of AOCI reclassifications for the years ended December 31, 20192022 and 20182021 (dollars in millions):
| | | | | | | | | | | | | | | | | | | | |
| | Amount Reclassified from AOCI | | |
| Details about AOCI Components | | 2022 | | 2021 | | Affected Line Item in
Statement of Income |
| Net unrealized investment gains (losses): | | | | | | |
| Net unrealized gains and losses on available-for-sale securities | | $ | (218) | | | $ | 226 | | | Investment related gains (losses), net |
| | | | | | |
| Cash flow hedges – Interest rate | | (1) | | | (7) | | | (1) |
| Cash flow hedges – Currency/Interest rate | | (8) | | | — | | | (1) |
| Cash flow hedges – Forward bond purchase commitments | | — | | | — | | | (1) |
| Deferred policy acquisition costs attributed to unrealized gains and losses | | (215) | | | (44) | | | (2) |
| Total | | (442) | | | 175 | | | |
| Provision for income taxes | | 335 | | | (38) | | | |
| Net unrealized gains (losses), net of tax | | $ | (107) | | | $ | 137 | | | |
| | | | | | |
| Amortization of defined benefit plan items: | | | | | | |
| Prior service cost (credit) | | $ | 2 | | | $ | 1 | | | (3) |
| Actuarial gains (losses) | | (4) | | | (8) | | | (3) |
| Total | | (2) | | | (7) | | | |
| Provision for income taxes | | — | | | 1 | | | |
| Amortization of defined benefit plans, net of tax | | $ | (2) | | | $ | (6) | | | |
| | | | | | |
| Total reclassifications for the period | | $ | (109) | | | $ | 131 | | | |
(1)See Note 5 for information on cash flow hedges.
(2)See Note 8 for information on deferred policy acquisition costs.
(3)See Note 10 for information on employee benefit plans.
|
| | | | | | | | | | |
| | | Amount Reclassified from AOCI | | |
| Details about AOCI Components | | 2019 | | 2018 | | Affected Line Item in Statement of Income |
| Net unrealized investment gains (losses): | | | | | | |
| Net unrealized gains and losses on available-for-sale securities | | $ | 84 |
| | $ | (122 | ) | | Investment related gains (losses), net |
| Cash flow hedges - Interest rate | | 1 |
| | — |
| | (1) |
| Cash flow hedges - Currency/Interest rate | | — |
| | — |
| | (1) |
| Cash flow hedges - Forward bond purchase commitments | | — |
| | — |
| | (1) |
| Deferred policy acquisition costs attributed to unrealized gains and losses | | 97 |
| | (27 | ) | | (2) |
| Total | | 182 |
| | (149 | ) | | |
| Provision for income taxes | | (38 | ) | | 31 |
| | |
| Net unrealized gains (losses), net of tax | | $ | 144 |
| | $ | (118 | ) | | |
| | | | | | | |
| Amortization of defined benefit plan items: | | | | | | |
| Prior service cost (credit) | | $ | 1 |
| | $ | 1 |
| | (3) |
| Actuarial gains/(losses) | | (5 | ) | | (6 | ) | | (3) |
| Total | | (4 | ) | | (5 | ) | | |
| Provision for income taxes | | 1 |
| | 1 |
| | |
| Amortization of defined benefit plans, net of tax | | $ | (3 | ) | | $ | (4 | ) | | |
| | | | | | | |
| Total reclassifications for the period | | $ | 141 |
| | $ | (122 | ) | | |
| |
| See Note 5 for information on cash flow hedges. |
| |
(2) | See Note 8 for information on deferred policy acquisition costs. |
| |
(3) | See Note 10 for information on employee benefit plans. |
Equity Based Compensation
The Company adopted the RGA Flexible Stock Plan (the “Plan”) in February 1993, as amended, and the Flexible Stock Plan for Directors (the “Directors Plan”) in January 1997, as amended, (collectively, the “Stock Plans”). The Stock Plans provide for the award of benefits (collectively “Benefits”) of various types, including stock options, stock appreciation rights (“SARs”), restricted stock, performance shares, cash awards, and other stock-based awards, to key employees, officers, directors and others performing significant services for the benefit of the Company or its subsidiaries. As of December 31, 2019,2022, shares authorized for the granting of Benefits under the Plan and the Directors Plan totaled 14,960,07716,460,077 and 412,500462,500 respectively. The Company uses treasury shares
or shares made available from authorized but unissued shares to support the future exercise of options or settlement of awards granted under its stock plans.
Equity-based compensation expense of $39$45 million,, $30 $55 million,, and $22$(12) million related to grants or awards under the Stock Plans was recognized in 2019, 20182022, 2021 and 2017,2020, respectively. The equity compensation credit for the year ended December 31, 2020, is attributable to the reduction in the estimated financial performance measures associated with performance-based stock awards, primarily due to the adverse impact of COVID-19 on the Company’s financial results. Equity-based compensation expense is principally related to the issuance of performance contingent restricted units, stock appreciation rights and restricted stock.
In general, optionsstock awards granted under the Plan become exercisable over vesting periods ranging from one to fivefour years. OptionsSARs are generally granted with an exercisea conversion price equal to the stock’s fair value at the date of grant and expire 10 years after the date of grant. There are no stock options outstanding under the Directors Plan during the periods presented. Information with respect to grants under the Stock Plans are as follows.
Stock Options and Stock Appreciation Rights
The following table presents a summary of stock optionoptions and SARs activity:
|
| | | | | | | | | | | |
| | Number of Options | | Weighted-Average Exercise Price | | Aggregate Intrinsic Value (in millions) |
| Outstanding December 31, 2018 | | 2,170,443 |
| | $ | 82.65 |
| | |
| Granted | | 192,845 |
| | $ | 145.25 |
| | |
| Exercised | | (322,673 | ) | | $ | 56.52 |
| | |
| Forfeited | | (8,818 | ) | | $ | 108.47 |
| | |
| Outstanding December 31, 2019 | | 2,031,797 |
| | $ | 92.63 |
| | $ | 143.1 |
|
| Options exercisable | | 1,514,959 |
| | $ | 83.58 |
| | $ | 120.4 |
|
| | | | | | | | | | | | | | | | | | | | |
| | Number of Options and SARs | | Weighted-Average Exercise/Conversion Price | | Aggregate Intrinsic Value (in millions) |
| Outstanding at December 31, 2021 | | 2,222,714 | | | $ | 107.39 | | | |
| Granted | | 258,327 | | | $ | 106.53 | | | |
| Exercised | | (251,305) | | | $ | 64.79 | | | |
| Forfeited | | (8,449) | | | $ | 124.29 | | | |
| Outstanding at December 31, 2022 | | 2,221,287 | | | $ | 112.05 | | | $ | 68.7 | |
| Awards exercisable | | 1,818,128 | | | $ | 111.35 | | | $ | 57.8 | |
The intrinsic value of optionsawards exercised was $31$16 million,, $26 $8 million,, and $42$15 million for 2019, 20182022, 2021 and 2017,2020, respectively.
|
| | | | | | | | | | | | | | | | |
| | | Options Outstanding | | Options Exercisable |
| Range of Exercise Prices | | Number Outstanding as of 12/31/2019 | | Weighted-Average Remaining Contractual Life (years) | | Weighted- Average Exercise Price | | Number Exercisable as of 12/31/2019 | | Weighted-Average Exercise Price |
| $0.00 - $49.99 | | 23,764 |
| | 0.1 | | $ | 47.10 |
| | 23,764 |
| | $ | 47.10 |
|
| $50.00 - $59.99 | | 634,157 |
| | 2.5 | | $ | 58.28 |
| | 634,157 |
| | $ | 58.28 |
|
| $60.00 - $69.99 | | 839 |
| | 3.2 | | $ | 60.24 |
| | 839 |
| | $ | 60.24 |
|
| $70.00 - $79.99 | | 149,248 |
| | 4.2 | | $ | 78.48 |
| | 149,248 |
| | $ | 78.48 |
|
| $90.00 + | | 1,223,789 |
| | 6.8 | | $ | 113.05 |
| | 706,951 |
| | $ | 108.61 |
|
| Totals | | 2,031,797 |
| | 5.2 | | $ | 92.63 |
| | 1,514,959 |
| | $ | 83.58 |
|
| | | | | | | | | | | | | | | | | | | | | | | | | | | | | | | | |
| | | Awards Outstanding | | Awards Exercisable |
| Range of Exercise Prices | | Number Outstanding as
of 12/31/2022 | | Weighted-Average
Remaining
Contractual Life (years) | | Weighted-
Average Exercise
Price | | Number
Exercisable as of
12/31/2022 | | Weighted-Average
Exercise Price |
| | | | | | | | | | |
| $50.00 – $89.99 | | 145,026 | | | 0.8 | | $ | 70.87 | | | 145,026 | | | $ | 70.87 | |
| $90.00 – $99.99 | | 688,154 | | | 2.8 | | $ | 92.56 | | | 688,154 | | | $ | 92.56 | |
| $100.00 – $139.99 | | 1,045,417 | | | 7.4 | | $ | 118.87 | | | 642,258 | | | $ | 121.18 | |
| $140.00 + | | 342,690 | | | 5.7 | | $ | 147.80 | | | 342,690 | | | $ | 147.80 | |
| Totals | | 2,221,287 | | | 5.3 | | $ | 112.05 | | | 1,818,128 | | | $ | 111.35 | |
The following table presents the weighted average assumptions used to determine the fair value of stock optionsSARs issued:
|
| | | | | | | | | | | | |
| For the years ended December 31, | | 2019 | | 2018 | | 2017 |
| Dividend yield | | 1.65 | % | | 1.33 | % | | 1.26 | % |
| Risk-free rate of return | | 2.67 | % | | 2.79 | % | | 2.32 | % |
| Expected volatility | | 18.2 | % | | 21.4 | % | | 22.8 | % |
| Expected life (years) | | 6.0 |
| | 7.0 |
| | 7.0 |
|
| Weighted average exercise price of stock options granted | | $ | 145.25 |
| | $ | 150.87 |
| | $ | 129.72 |
|
| Weighted average fair value of stock options granted | | $ | 26.59 |
| | $ | 36.31 |
| | $ | 31.57 |
|
| | | | | | | | | | | | | | | | | | | | |
| For the years ended December 31, | | 2022 | | 2021 | | 2020 |
| Dividend yield | | 2.74 | % | | 2.17 | % | | 2.37 | % |
| Risk-free rate of return | | 2.41 | % | | 1.04 | % | | 0.69 | % |
| Expected volatility | | 36.0 | % | | 34.5 | % | | 18.8 | % |
| | | | | | |
| | | | | | |
| Expected life (years) | | 6.3 | | 6.3 | | 7.0 |
| Weighted average exercise price of stock options granted | | $ | 106.53 | | | $ | 129.01 | | | $ | 117.85 | |
| Weighted average fair value of stock options granted | | $ | 30.55 | | | $ | 34.93 | | | $ | 15.14 | |
The Black-Scholes model was used to determine the fair value recognized in the financial statements of stock optionsSARs that have been granted. The Company used daily historical volatility when calculating stock option values.a SAR’s value. The benchmark rate is based on observed interest rates for instruments with maturities similar to the expected term of the stock options. Dividend yield is determined based on historical dividend distributions compared to the price of the underlying common stock as of the valuation
date and held constant over the life of the stock options. The Company estimated expected life using the historical average years to exercise or cancellation.
Performance SharesContingent Awards
Performance shares, also referred to as performance contingent unitsawards include both Performance Contingent Shares (“PCUs”PCS”), and Performance Share Units (“PSU”).
•Performance Contingent Shares, are units that, if they vest, are multiplied by a performance factor to produce a number of final PCUsunits that are paid in the Company’s common stock. Each PCUPCS represents the right to receive up to two shares of Company’s common stock, depending on the results of certain performance measures.
•Performance Share Units, are units that, if they vest, are paid in the Company’s common stock. Each PSU represents the right to receive one share of Company common stock, depending on the results of certain performance measures over a three-year period. measures.
The compensation expense related to the PCUseach type of performance continent award is recognized ratably over the requisite performance period. Performance sharescontingent awards are accounted for as equity awards, but are not credited with dividend-equivalents for actual dividends paid on the Company’s common stock during the performance period.
Restricted Stock Units
In general, restricted stock units (“RSUs”) become payable at the end of a three- or ten-yearthree-year vesting period. Each RSU, if they vest, represents the right to receive one share of Company common stock. RSUs awarded under the plan generally have no strike price and are included in the Company’s shares outstanding.
The following table presents a summary of Performance Share and Restricted Stock Unit activity:
| | | | | | | | | | | | | |
| Performance Contingent Awards | | Restricted Stock Units | | |
| Outstanding at December 31, 2021 | 340,405 | | | 379,888 | | | |
| Granted | 78,687 | | | 219,553 | | | |
| Change in units based on performance factor | (172,601) | | | — | | | |
| Paid | — | | | (21,552) | | | |
| Forfeited | (1,511) | | | (11,454) | | | |
Outstanding at December 31, 2022 (1) | 244,980 | | | 566,435 | | | |
|
| | | | | |
| Performance Contingent Units | | Restricted Stock Units |
| Outstanding December 31, 2018 | 395,871 |
| | 66,999 |
|
| Granted | 120,403 |
| | 23,322 |
|
| Change in units based on performance factor | 64,773 |
| | — |
|
| Paid | (248,789 | ) | | (26,442 | ) |
| Forfeited | (6,407 | ) | | (1,685 | ) |
| Outstanding December 31, 2019 | 325,851 |
| | 62,194 |
|
During 2019,2022, the Company issued 120,403 PCUs to key employees78,687 performance contingent awards at a weighted average fair value per unit of $145.25. In May 2019 and May 2018, RGA’s board of directors approved a 1.35 and 1.07 share payout for each PCU granted in 2017 and 2016, resulting in the issuance of 248,789 and 170,080 shares of common stock from treasury, respectively.$106.53.
As of December 31, 2019,2022, the total compensation cost of non-vested awards not yet recognized in the financial statements was $16.6 million.$20.0 million. It is estimated that these costs will vest over a weighted average period of 0.90.8 years.
The majority of the awards granted each year under the board-approved incentive compensation package and Directors Plan are made in the first quarter of each year.
Note 18 QUARTERLY RESULTS OF OPERATIONS (UNAUDITED)
|
| | | | | | | | | | | | | | | | |
| Years Ended December 31, | | | | | | | | |
| (in millions, except per share data) | | | | | | | | |
| 2019 | | First | | Second | | Third | | Fourth |
| Total Revenues | | $ | 3,420 |
| | $ | 3,467 |
| | $ | 3,628 |
| | $ | 3,785 |
|
| Total benefits and expenses | | 3,203 |
| | 3,207 |
| | 3,281 |
| | 3,477 |
|
| Income before income taxes | | 217 |
| | 260 |
| | 347 |
| | 308 |
|
| Net Income | | 170 |
| | 202 |
| | 263 |
| | 235 |
|
| Earnings Per Share: | | | | | | | | |
| Basic earnings per share | | $ | 2.70 |
| | $ | 3.23 |
| | $ | 4.19 |
| | $ | 3.75 |
|
| Diluted earnings per share | | 2.65 |
| | 3.18 |
| | 4.12 |
| | 3.68 |
|
| 2018 | | First | | Second | | Third | | Fourth |
| Total Revenues | | $ | 3,174 |
| | $ | 3,196 |
| | $ | 3,227 |
| | $ | 3,279 |
|
| Total benefits and expenses | | 3,036 |
| | 2,949 |
| | 2,904 |
| | 3,141 |
|
| Income before income taxes | | 138 |
| | 247 |
| | 323 |
| | 138 |
|
| Net Income | | 100 |
| | 205 |
| | 301 |
| | 110 |
|
| Earnings Per Share: | | | | | | | | |
| Basic earnings per share | | $ | 1.55 |
| | $ | 3.19 |
| | $ | 4.76 |
| | $ | 1.75 |
|
| Diluted earnings per share | | 1.52 |
| | 3.13 |
| | 4.68 |
| | 1.72 |
|
REPORT OF INDEPENDENT REGISTERED PUBLIC ACCOUNTING FIRM
To the Board of Directors and Stockholders of
Reinsurance Group of America, Incorporated
Chesterfield, Missouri
Opinion on the Consolidated Financial Statements
We have audited the accompanying consolidated balance sheets of Reinsurance Group of America, Incorporated and subsidiaries (the "Company") as of December 31, 20192022 and 2018,2021, and the related consolidated statements of income, comprehensive income, stockholders' equity, and cash flows for each of the three years in the period ended December 31, 2019,2022, and the related notes, and the schedules listed in the Index at Item 15 (collectively referred to as the “financial statements”). In our opinion, the financial statements present fairly, in all material respects, the consolidated financial position of the Company as of December 31, 20192022 and 2018,2021, and the results of its operations and its cash flows for each of the three years in the period ended December 31, 2019,2022, in conformity with accounting principles generally accepted in the United States of America.
We have also audited, in accordance with the standards of the Public Company Accounting Oversight Board (United States) (PCAOB), the Company's internal control over financial reporting as of December 31, 2019,2022, based on the criteria established in Internal Control -– Integrated Framework (2013) issued by the Committee of Sponsoring Organizations of the Treadway Commission and our report dated February 27, 202024, 2023, expressed an unqualified opinion on the Company's internal control over financial reporting.
Basis for Opinion
These financial statements are the responsibility of the Company's management. Our responsibility is to express an opinion on the financial statements based on our audits. We are a public accounting firm registered with the PCAOB and are required to be independent with respect to the Company in accordance with the U.S. federal securities laws and the applicable rules and regulations of the Securities and Exchange Commission and the PCAOB.
We conducted our audits in accordance with the standards of the PCAOB. Those standards require that we plan and perform the audits to obtain reasonable assurance about whether the financial statements are free of material misstatement, whether due to error or fraud. Our audits included performing procedures to assess the risks of material misstatement of the financial statements, whether due to error or fraud, and performing procedures that respond to those risks. Such procedures included examining, on a test basis, evidence supporting the amounts and disclosures in the financial statements. Our audits also included evaluating the accounting principles used and significant estimates made by management, as well as evaluating the overall presentation of the financial statements. We believe that our audits provide a reasonable basis for our opinion.
Critical Audit Matters
The critical audit matters communicated below are matters arising from the current-period audit of the financial statements that were communicated or required to be communicated to the audit committee and that (1) relate to accounts or disclosures that are material to the financial statements and (2) involved our especially challenging, subjective, or complex judgments. The communication of critical audit matters does not alter in any way our opinion on the financial statements, taken as a whole, and we are not, by communicating the critical audit matters below, providing separate opinions on the critical audit matters or on the accounts or disclosures to which they relate.
Fair Value -– Level 3 Fixed Maturity Securities -– Refer to Note 6 to the financial statements
Critical Audit Matter Description
The Company has certain fixed maturity securities that are not actively traded and classified as Level 3 assets. Since such securities trade infrequently and have little or no price transparency, the Company’s market standard valuation techniques for determining the estimated fair value of such securities rely on inputs that are significant to the estimated fair value that are not observable in the market or cannot be derived principally from or corroborated by observable market data. The determination of these unobservable inputs involve significant management judgment and estimation and typically cannot be supported by reference to market activity.
Auditing of unobservable inputs used by management to estimate the fair value of Level 3 securities required a high degree of auditor judgement and an increased extent of effort, including the involvement of our fair value specialists.
How the Critical Audit Matter Was Addressed in the Audit
Our audit procedures related to the proprietary models and unobservable inputs used by management to estimate the fair value of Level 3 securities included the following, among others:
•We tested the effectiveness of controls, including those surrounding the valuation of Level 3 securities.
•We obtained an understanding and evaluated the appropriateness of the Company’s pricing sources.
•For a selection of securities, we compared the accuracy of the Company’s estimated fair value price to a price independently developed by our fair value specialists.
Actuarial Assumptions - Refer to Notes 1,2, 6, and 8 to the financial statements
Critical Audit Matter Description
The estimated valuation of future policy benefits, embedded derivatives, and the amortization of deferred acquisition costs are measured based on actuarial methodologies and underlying economic and future policyholder behavior assumptions.
Significant judgment was involved in the setting of the future policyholder behavior assumptions used to determine the estimated valuation of future policy benefits, embedded derivatives and the amortization of deferred acquisition costs. These assumptions include mortality, longevity, and withdrawal (lapse).
Given the significant estimation uncertainty and complexity of the Company’s actuarial assumptions, auditing these estimates required a high degree of auditor judgment and an increased extent of effort, including the involvement of our actuarial specialists.
How the Critical Audit Matter Was Addressed in the Audit
Our audit procedures related to the assumptions used by management to estimate the valuation of future policy benefits and embedded derivatives and the amortization of deferred policy acquisition costs included the following, among others:
•We tested the effectiveness of controls, including those related to the performance of experience studies and the setting of best estimate assumptions.
•We tested the accuracy and completeness of the underlying data that served as the basis for the estimated assumptions.
•With the assistance of our actuarial specialists, we assessed the reasonableness of assumptions used in developing the estimates by comparing conclusions reached by management to the related experience study results and industry experience, as applicable.
Premiums receivable and other reinsurance balances - Refer to Note 12 to the financial statements
Critical Audit Matter Description
Premiums are accrued when due and in accordance with information received from the ceding company. When the Company enters into a new reinsurance agreement, the methodology to record estimated premiums receivables is based on the terms of the reinsurance treaty. Similarly, when a ceding company fails to report information on a timely basis, the methodology used by the Company to record estimated premiums receivables is based on the terms of the reinsurance treaty and historical experience. Other management estimates include adjustments to the premiums receivable for increased in force in existing treaties and lapsed premiums based on historical experience. Given the significant judgment used in determining estimated premium receivable, auditing the actual methodologies and estimates required a high degree of auditor judgment and an increased extent of effort.
How the Critical Audit Matter Was Addressed in the Audit
Our audit procedures related to management’s estimation of premiums receivable included the following, among others:
•We tested the effectiveness of controls that address management’s estimation of accrued premiums receivable.
•We tested management’s historical accuracy of estimation by comparing a selection of premiums received during the year to previously-reported premiums receivable.
•For a selection of management’s premiums receivable estimates, we compared our independently-developed expectation to management’s estimate.
•We utilized statistical analysis to identify outliers in the population for further testing.
ASU 2018-12 Implementation – Refer to Note 2 to the financial statements
Critical Audit Matter Description
On January 1, 2023, the Company adopted Accounting Standards Update (“ASU”) 2018-12, Financial Services – Insurance (Topic 944): Targeted Improvements to the Accounting for Long-Duration Contracts (“ASU 2018-12”). ASU 2018-12 modifies certain requirements in accounting for long-duration insurance contracts as outlined and disclosed in Note 2 to the financial statements, which has been applied on a modified retrospective basis. Accounting for market risk benefits has been applied retrospectively.
The adoption of ASU 2018-12 significantly modifies the Company’s accounting for and disclosure of long duration insurance contracts, including the application of new accounting policies that requires subjective judgments and modified complex valuation models. Audit procedures to evaluate the modified retrospective adoption of ASU 2018-12 involved a high degree of auditor judgment and required significant effort, including the need to involve our actuarial specialists.
How the Critical Audit Matter Was Addressed in the Audit
Our audit procedures related to the disclosures over the adoption of ASU 2018-12 included the following, among others:
•We tested the effectiveness of controls, including those related to the application of new accounting policies, new subjective judgments, changes made to measurement models, and disclosure of the impact of adoption discussed in Note 2 to the financial statements.
•We evaluated the appropriateness of the Company’s accounting policies, methodologies, and elections involved in the adoption of the ASU.
•We involved our actuarial specialists, to assist us in evaluating the reasonableness and conceptual soundness of the methodology and changes made to the measurement models.
/s/ DELOITTE & TOUCHE LLP
St. Louis, Missouri
February 27, 202024, 2023
We have served as the Company’s auditor since 2000.
|
| |
Item 9. CHANGES IN AND DISAGREEMENTS WITH ACCOUNTANTS ON ACCOUNTING AND FINANCIAL DISCLOSURE |
None.
|
| |
| Item 9A. CONTROLS AND PROCEDURES |
The Chief Executive Officer and the Chief Financial Officer have evaluated the effectiveness of the design and operation of the Company’s disclosure controls and procedures as defined in Exchange Act Rule 13a-15(e) as of the end of the period covered by this report. Based on that evaluation, the Chief Executive Officer and the Chief Financial Officer concluded that these disclosure controls and procedures were effective.
There was no change in the Company’s internal control over financial reporting as defined in Exchange Act Rule 13a-15(f) during the quarter ended December 31, 2019,2022, that has materially affected, or is reasonably likely to materially affect, the Company’s internal control over financial reporting.
Management’s Annual Report on Internal Control Over Financial Reporting
Management of the Company is responsible for establishing and maintaining adequate internal control over financial reporting. In fulfilling this responsibility, estimates and judgments by management are required to assess the expected benefits and related costs of control procedures. The objectives of internal control include providing management with reasonable, but not absolute, assurance that assets are safeguarded against loss from unauthorized use or disposition, and that transactions are executed in accordance with management’s authorization and recorded properly to permit the preparation of consolidated financial statements in conformity with accounting principles generally accepted in the United States of America.
Financial management has documented and evaluated the effectiveness of the internal control of the Company as of December 31, 20192022 pertaining to financial reporting in accordance with the criteria established in “Internal Control – Integrated Framework (2013)” by the Committee of Sponsoring Organizations of the Treadway Commission.
In the opinion of management, the Company maintained effective internal control over financial reporting as of December 31, 2019.2022.
Deloitte & Touche LLP, an independent registered public accounting firm, has issued an attestation report on the effectiveness of the Company’s internal control over financial reporting.
REPORT OF INDEPENDENT REGISTERED PUBLIC ACCOUNTING FIRM
To the Board of Directors and Stockholders of
Reinsurance Group of America, Incorporated
Chesterfield, Missouri
Opinion on Internal Control over Financial Reporting
We have audited the internal control over financial reporting of Reinsurance Group of Americas Incorporated and subsidiaries (the “Company”) as of December 31, 2019,2022, based on criteria established in Internal Control -– Integrated Framework (2013) issued by the Committee of Sponsoring Organizations of the Treadway Commission (COSO). In our opinion, the Company maintained, in all material respects, effective internal control over financial reporting as of December 31, 2019,2022, based on criteria established in Internal Control -– Integrated Framework (2013) issued by COSO.
We have also audited, in accordance with the standards of the Public Company Accounting Oversight Board (United States) (PCAOB), the consolidated financial statements as of and for the year ended December 31, 2019,2022, of the Company and our report dated February 27, 2020,24, 2023, expressed an unqualified opinion on those consolidated financial statements and financial statement schedules.
Basis of Opinion
The Company’s management is responsible for maintaining effective internal control over financial reporting and for its assessment of the effectiveness of internal control over financial reporting, included in the accompanying Management’s Annual Report on Internal Control over Financial Reporting. Our responsibility is to express an opinion on the Company’s internal control over financial reporting based on our audit. We are a public accounting firm registered with the PCAOB and are required to be independent with respect to the Company in accordance with the U.S. federal securities laws and the applicable rules and regulations of the Securities and Exchange Commission and the PCAOB.
We conducted our audit in accordance with the standards of the PCAOB. Those standards require that we plan and perform the audit to obtain reasonable assurance about whether effective internal control over financial reporting was maintained in all material respects. Our audit included obtaining an understanding of internal control over financial reporting, assessing the risk that a material weakness exists, testing and evaluating the design and operating effectiveness of internal control based on the assessed risk, and performing such other procedures as we considered necessary in the circumstances. We believe that our audit provides a reasonable basis for our opinion.
Definition and Limitations of Internal Control over Financial Reporting
A company’s internal control over financial reporting is a process designed to provide reasonable assurance regarding the reliability of financial reporting and the preparation of financial statements for external purposes in accordance with generally accepted accounting principles. A company’s internal control over financial reporting includes those policies and procedures that (1) pertain to the maintenance of records that, in reasonable detail, accurately and fairly reflect the transactions and dispositions of the assets of the company; (2) provide reasonable assurance that transactions are recorded as necessary to permit preparation of financial statements in accordance with generally accepted accounting principles, and that receipts and expenditures of the company are being made only in accordance with authorizations of management and directors of the company; and (3) provide reasonable assurance regarding prevention or timely detection of unauthorized acquisition, use, or disposition of the company’s assets that could have a material effect on the financial statements.
Because of its inherent limitations, internal control over financial reporting may not prevent or detect misstatements. Also, projections of any evaluation of effectiveness to future periods are subject to the risk that controls may become inadequate because of changes in conditions, or that the degree of compliance with the policies or procedures may deteriorate.
/s/ DELOITTE & TOUCHE LLP
St. Louis, Missouri
February 27, 2020
Item 9B. OTHER INFORMATION
None.
Part III
Item 10. DIRECTORS, EXECUTIVE OFFICERS, AND CORPORATE GOVERNANCE
Information with respect to Directors of the Company is incorporated by reference tofound in the Proxy Statement under the captions “Board of Directors -– Item 1 -– Election of Directors,” - “Continuing Directors,” and “-“– Director Qualifications and Nomination,” “Stock Ownership -– Delinquent Section 16(a) Reports” andReports,” “Corporate Governance -– Overview,” and “-“– Board Committees”. and is incorporated herein by reference.
Executive Officers
The following is certain additional information concerning each individual who is an executive officer of the Company or its primary U.S.-based operating subsidiary, RGA Reinsurance Company.
Leslie Barbi, 53,56, is Executive Vice President, Chief Investment Officer of the Company. She is also a member of the Company’s Executive Committee. Prior to joining RGA in 2020, Ms. Barbi served as Executive Officer -– Senior Vice President, Head of Public Investments for Northwestern Mutual Life Insurance Company. Prior to that, she was the Senior Managing Director, Head of Public Fixed Income at The Guardian Life Insurance Company of America. Earlier in her career, Ms. Barbi held senior positions at Goldman Sachs Asset Management and at Pacific Investment Management Company (PIMCO).
Dennis Barnes, Jr., 51, is Chief Executive Officer of RGAX, the Company’s innovation accelerator. He is also a member of the Company’s Executive Committee. Prior to joining RGA, he founded Marketing Direct, Inc. (“MDI”) in 1997. In 2010, MDI was acquired by WPP, the world’s largest provider of marketing and communication services. At WPP, Mr. Barnes served as President of Wunderman St. Louis and Chief Client Officer of Wunderman Health.
Gay Burns, 53, is Executive Vice President, Chief Human Resources Officer for the Company. She is also Chairperson of the RGA Foundation and a member of the Company’s Executive Committee. Prior to joining RGA in 2011, she served as Managing Director, Talent Development and Managing Director, Global HR Operations for Swiss Re. Prior to that, Ms. Burns was a human resources executive with Employer’s Reinsurance Corporation, a General Electric subsidiary.
Lawrence S. Carson, 48,51, is Executive Vice President, Global Financial Solutions (“GFS”) unit, which is responsible for all of RGA’s financial reinsurance, asset-intensive reinsurance and bulk longevity business worldwide. He is also a member of the Company’s Executive Committee. Most recently, Mr. Carson was Executive Vice President and Chief Actuary of GFS. Prior to joining RGA in 1999, he was with the actuarial firm of Milliman and Robertson (now Milliman Inc.), where he worked on demutualizations, mergers and acquisitions valuations, and market conduct class-action settlements. Previously, he was with Equitable Life Assurance Society. Mr. Carson is a Fellow of the Society of Actuaries.
Tony Cheng, 46,48, is President of the Company and is a member of RGA’s Executive Committee. Prior to his current role, he served as Executive Vice President, Head of Asia, for RGA Reinsurance Company. He is also a member of RGA’s Executive Committee.Australia and EMEA. He joined RGA in 1997 as Chief Actuary of Malaysian Life Reinsurance Group Berhad, the Company’s joint venture with the Life Insurance Association of Malaysia. In 2004, Mr. Cheng was named Chief Executive Officer of the Hong Kong office, responsible for all business activity in Hong Kong and Southeast Asia, and in 2011, was appointed Senior Vice President, Asia, an expanded role incorporating overall management of RGA Asia.RGA’s Asia operations. In 2021 Mr. Cheng assumed responsibility for the Company’s Australia and EMEA operations.
Olav Cuiper, 62,65, is Executive Vice President, and Head of EMEA.Chief Client Officer. He is also a member of the Executive Committee. Prior to joining RGA in 2009, he was Managing (statutory) Director Europe for Fortis Insurance International. Before then, Mr. Cuiper was Managing (statutory) Director of Group Life/Institutional Clients for Delta Lloyd Insurance NV. His work experience also includes business development positions with Sedgwick/Mercer and with Goudse Verzekeringen in the Netherlands. Mr. Cuiper also serves as a director and officer of several RGA subsidiaries.
Michael L. Emerson, 58, is Executive Vice President for the Company and President, Head of U.S. and Latin American Markets and Chief Executive Officer for RGA Reinsurance Company. He is also a member of the Executive Committee. Prior to joining the Company in 2010, Mr. Emerson led ING Reinsurance’s group reinsurance business from 2002 and its individual business from 2003 until its 2004 sale to Scottish Re. Previously, he was Senior Vice President and Chief Actuary for MidAmerica Mutual Life Insurance Company and before then spent several years with Deloitte, providing actuarial and financial consulting to life insurance companies. Mr. Emerson also serves as a director and officer of several RGA subsidiaries and is a Fellow of the Society of Actuaries.
Alka Gautam, 52,55, is Executive Vice President of the Company and President and Chief Executive Officer of RGA Life Reinsurance Company of Canada (“RGA Canada”). She is responsible for RGA’s Global Technology, Data and Analytics, Underwriting, Claims, Medical, Administration Operations and Operational Effectiveness divisionsfunctions and leads all business activities for RGA Canada. She is also a member of the Executive Committee. Prior to joining RGA Canada in 2000, Ms. Gautam was at KPMG for 10 years. She became RGA Canada’s Chief Financial Officer and Chief
Risk Officer in 2006, was named its Chief Operating Officer in 2014, and in 2015 was named RGA Canada’s President and Chief Executive Officer.
John W. Hayden, 53,56, is Executive Vice President, Controller. Mr. Hayden joined the Company in March 2000 and held the position of Vice President, SEC Reporting and Investor Relations prior to his current role. Before coming to RGA, Mr. Hayden served in a finance position at General American Life Insurance Company and prior to that position, he was a senior manager at KPMG LLP, in the financial services audit practice, specializing in the insurance industry. Mr. Hayden also serves as a director and officer of several RGA subsidiaries.
Ron Herrmann, 58, is Executive Vice President, Head of U.S. & Latin American Markets of RGA Reinsurance Company. He joined the Company in December 2020 and is a member of RGA’s Executive Committee. Prior to joining RGA, Mr. Herrmann served as Head of both Individual Life and Employee Benefits at Equitable. Prior to that he held senior positions at Prudential and The Hartford, as well as senior sales and sales management roles at Chubb Corporation, John Hancock Life Insurance Company, and Metropolitan Life. Mr. Herrmann is a Certified Financial Planner and a member of Leadership for
Advanced Life Underwriting. He sits on the American Council of Life Insurers' Life Insurance Committee as well as the Group Executive Insurance Council.
William L. Hutton, 60,63, is Executive Vice President, General Counsel and Secretary of the Company. He is responsible for legal services provided throughout the RGA enterprise. Mr. Hutton joined the Company in 2001has been advising RGA on legal matters since 1998 and held several positions in the legal function before becomingbecame General Counsel in 2011. In addition, prior to becoming General Counsel, he served as the company’s lead securities, finance and corporate governance counsel and had significant roles in RGA’s successful separation from MetLife in 2008 and the acquisition of ING’s Group Reinsurance in 2009. Prior to joining the Company, he served as counsel at General American Life Insurance Company andRGA, Mr. Hutton was in private practice with two law firms in St. Louis, Missouri. He holds a Juris Doctor (J.D.) from Southern Illinois University School of Law and a Bachelor of Science (B.S.) degree in finance from Eastern Illinois University. He is a member of the bar in both Missouri and Illinois.
Ray Kleeman, 50, is Executive Vice President, Chief Human Resources Officer, responsible for all of RGA’s global human resource strategies, including organization design, workforce and succession planning, talent acquisition and development, compensation and benefits, diversity and inclusion, and change management. He is also a member of the Company’s Executive Committee. He joined RGA in April 2022 and was previously Senior Vice President, Human Resources at Centene Corporation. Previously, Mr. Hutton also serves as an officerKleeman held several global positions with Monsanto Company, Express Scripts, Amgen, and Pfizer. He has a Master of several RGA subsidiaries.Science (M.S.) and a Ph.D. in organizational psychology, both from Saint Louis University.
Todd C. Larson, 56,59, is Senior Executive Vice President, Chief Financial Officer of the Company. He is also a member of the Company’s Executive Committee. Mr. Larson joined the Company in May 1995 as Controller and held several positions in the finance function, including the position of Executive Vice President, Corporate Finance and Treasurer, before becoming Global Chief Risk Officer in July 2014. Mr. Larson assumed the role of Chief Financial Officer in May 2016. Mr. Larson previously was Assistant Controller at Northwestern Mutual Life Insurance Company from 1994 through 1995 and prior to that position was an accountant for KPMG LLP from 1985 through 1993. Mr. Larson also serves as a director and officer of several RGA subsidiaries.
John P. Laughlin, 65, is Executive Vice President of the Company. He is also a member of the Company’s Executive Committee. Prior to his current role, he served for more than a decade as Executive Vice President of GFS. Mr. Laughlin joined the Company in 1995 through a joint venture acquisition that ultimately became RGA Financial Group, L.L.C. Prior to joining the Company, Mr. Laughlin worked at ITT Financial Corporation and Liberty Financial Management. Mr. Laughlin also serves as a director and officer of several RGA subsidiaries.
Anna Manning, 61,64, is President and Chief Executive Officer of the Company. She is also a member of the Company’s Executive Committee. Prior to her current role, Ms. Manning held the position of Senior Executive Vice President, Structured Solutions, which includes the Company’s Global Financial Solutions and Global Acquisitions businesses. Ms. Manning joined the Company in 2007 as Executive Vice President and Chief Operating Officer for RGA International Corporation, followed by four years as Executive Vice President of U.S. Markets. Prior to joining the Company, Ms. Manning spent 19 years in actuarial consulting at Tillinghast Towers Perrin, following an actuarial career in the Canadian marketplace at Manulife Financial from 1981 through 1988. She holds a B.Sc. in Actuarial Science from the University of Toronto, is a Fellow of the Canadian Institute of Actuaries (“FCIA”), and a Fellow of the Society of Actuaries.
Alain Néemeh, 52, is Senior Executive Vice President, Chief Operating Officer. He is also a member of the Company’s Executive Committee. Prior to his current role, Mr. Néemeh was Senior Executive Vice President, Global Life and Health, a position he held since 2015. From 2006 to 2014, Mr. Néemeh was President and Chief Executive Officer of RGA Life Reinsurance Company of Canada (“RGA Canada”). In addition, from 2012, Mr. Néemeh had executive responsibility for the Company’s Australia and New Zealand operations. Prior to 2006, he served as Executive Vice President, Operations, and Chief Financial Officer of RGA Canada from 2001, having joined the finance area in 1997 from KPMG LLP, where he provided audit and other services to a variety of clients in the financial services, manufacturing and retail sectors. Mr. Néemeh also serves as a director and officer of several RGA subsidiaries.
Jonathan Porter, 49,52, is Executive Vice President and Global Chief Risk Officer. He is also a member of the Company’s Executive Committee. Mr. Porter is responsible for the Company’s global enterprise risk management and corporate pricing oversight. Prior to his current role, Mr. Porter previously served in positions of Senior Vice President, Global Analytics and In-Force Management and Chief Pricing Actuary of International Markets. Before joining the Company in 2008, Mr. Porter worked for Manulife Financial as Chief Financial Officer, U.S. Life Insurance. Mr. Porter holds FSA and FCIA designations. Mr. Porter also serves as a director and officer of several RGA subsidiaries.
Corporate Governance
The Company has adopted a Code of Conduct (the “Code”), a Directors’ Code of Business Conduct and Ethics (the “Directors’ Code”), and a Financial Management Code of Professional Conduct (the “Financial Management Code”). The Code applies to all employees and officers of the Company and its subsidiaries. The Directors’ Code applies to directors of the Company and its subsidiaries. The Financial Management Code applies to the Company’s chief executive officer, chief financial officer, corporate controller, primary financial officers in each business unit, and all professionals in finance and finance-related departments. The Company intends to satisfy its disclosure obligations under Item 5.05 of Form 8-K by posting on its website information about amendments to, or waivers from a provision of the Financial Management Code that applies to the Company’s
chief executive officer, chief financial officer, and corporate controller. Each of the three Codes described above is available on the Company’s website at www.rgare.com.
Also available on the Company’s website are the following other items: Corporate Governance Guidelines, Audit Committee Charter, Compensation Committee Charter, Investment Committee Charter, Nominating and Governance Committee Charter and Finance, Investment and Risk Management Committee Charter (collectively “Governance Documents”).
The Company will provide without charge upon written or oral request, a copy of any of the Codes of Conduct or Governance Documents. Requests should be directed to Investor Relations, Reinsurance Group of America, Incorporated, 16600 Swingley Ridge Road, Chesterfield, MO 63017, by electronic mail (investrelations@rgare.com) or by telephone (636-736-2068).
In accordance with the Securities Exchange Act of 1934, the Company’s board of directors has established a standing audit committee. The board of directors has determined, in its judgment, that all of the members of the audit committee are independent within the meaning of SEC regulations and the listing standards of the New York Stock Exchange (“NYSE”). The board of directors has determined, in its judgment, that all membermembers of the Audit Committee (Ms. Guinn (chair), Mr. Gauthier, Ms. McNeilageMr. Tran and Mr. Van Wyk) are qualified as audit committee financial experts within the meaning of SEC regulations and the board has determined that each of them has accounting and related financial management expertise within the meaning of the listing standards of the NYSE. The audit committee charter provides that members of the audit committee may not simultaneously serve on the audit committee of more than two other public companies unless such member demonstrates that he or she has the ability to devote the time and attention that are required to serve on multiple audit committees.
Item 11. EXECUTIVE COMPENSATION
Information on this subject is found in the Proxy Statement under the captions “Compensation Discussion and Analysis”,Analysis,” “Compensation Tables and Other Matters”,Matters,” “Compensation Committee Report”,Report,” “Board of Directors -– Director Compensation” and “Corporate Governance -– Board Committees” and is incorporated herein by reference.
Item 12. SECURITY OWNERSHIP OF CERTAIN BENEFICIAL OWNERS AND MANAGEMENT AND RELATED STOCKHOLDERS MATTERS
Information ofon this subject is found in the Proxy Statement under the captionscaption “Stock Ownership -– Securities Ownership of Directors, Management and Certain Beneficial Owners”, and is incorporated herein by reference.
The following table summarizes information regarding securities authorized for issuance under equity compensation plans:
|
| | | | | | | | | | |
| Plan Category | Number of securities to be issued
upon exercise of outstanding
options, warrants and rights
| Weighted-average exercise
price of outstanding options,
warrants and rights
| Number of securities remaining
available for future issuance
under equity compensation plans
(excluding securities reflected in
column (a))
|
| (a) | (b) | (c) |
| Equity compensation plans approved by security holders | 2,461,454 3,094,352(1)
|
| $92.63 (2) (3)
| 1,725,333 $112.05(4)(2)(3)
|
1,729,396(4) |
| Equity compensation plans not approved by security holders | — |
| — |
| — |
|
| Total | 2,461,454 3,094,352(1)
|
| $92.63 (2) (3)
| 1,725,333 $112.05(4)(2)(3)
|
1,729,396(4) |
| |
(1) | Includes the number of securities to be issued upon exercises under the following plans: Flexible Stock Plan - 2,419,829; and Phantom Stock Plan for Directors – 41,625. |
| |
(2) | Does not include 325,851 performance contingent units outstanding under the Flexible Stock Plan or 41,625 phantom units outstanding under the Phantom Stock Plan for Directors because those securities do not have an exercise price (i.e. a unit is a hypothetical share of Company common stock with a value equal to the fair market value of the common stock). |
| |
(3) | Reflects the blended weighted-average exercise price of outstanding options under the Flexible Stock Plan $92.63. |
| |
(4) | Includes the number of securities remaining available for future issuance under the following plans: Flexible Stock Plan– 1,637,713; Flexible Stock Plan for Directors – 58,643; and Phantom Stock Plan for Directors – 28,977. |
(1)Includes the number of securities to be issued upon exercises or settlement of stock appreciation rights, restricted units, performance contingent shares, and performance share units under the following plans: Flexible Stock Plan – 3,032,804; Director Flexible Stock Plan – 0; and Phantom Stock Plan for Directors – 61,548. The number of performance contingent shares represents the number of shares that would be issued based on target performance, reduced for cancellations and adjustments through December 31, 2022. The actual number of shares issued at the end of each performance period will range between 0% and 200% of the target number of units granted, based on a measure of the actual performance of the Company relative to stated goals.
(2)Does not include 244,980 performance contingent shares and performance share units outstanding under the Flexible Stock Plan; 0 outstanding under the Flexible Stock Plan for Directors or 61,548 phantom units outstanding under the Phantom Stock Plan for Directors because those securities do not have an exercise price (i.e. a unit is a hypothetical share of Company common stock with a value equal to the fair market value of the common stock).
(3)Reflects the blended weighted-average exercise price of outstanding options under the Flexible Stock Plan $112.05.
(4)Includes the number of securities remaining available for future issuance under the following plans: Flexible Stock Plan – 1,655,139; Flexible Stock Plan for Directors – 46,629; and Phantom Stock Plan for Directors – 27,628.
On January 24, 2019, RGA’s board of directors authorized a share repurchase program for up to $400 million of RGA’s outstanding common stock. During the year ended December 31, 2022, the Company repurchased 219,116 shares of common stock under this program for $25 million.
On February 25, 2022, RGA’s board of directors authorized a share repurchase program for up to $400 million of RGA’s outstanding common stock. The authorization was effective immediately and does not have an expiration date. In connection with this authorization, the board of directors terminated the stock repurchase authority granted in 2019. During the year ended December 31, 2022, RGA repurchased 380,138 shares of common stock under this program for $50 million.
The pace of repurchase activity depends on various factors such as the level of available cash, an evaluation of the costs and benefits associated with alternative uses of excess capital, such as acquisitions and in force reinsurance transactions, and RGA’s stock price.
Item 13. CERTAIN RELATIONSHIPS AND RELATED TRANSACTIONS, AND DIRECTOR INDEPENDENCE
Information on this subject is found in the Proxy Statement under the captions “Corporate Governance -– Certain Relationships and Related Person Transactions,” and -– “Overview” and is incorporated herein by reference.
Item 14. PRINCIPAL ACCOUNTANT FEES AND SERVICES
Information on this subject is found in the Proxy Statement under the caption “Item 4 -5 – Ratification of Appointment of Independent Auditor” and is incorporated herein by reference.
Item 15. EXHIBITS, FINANCIAL STATEMENT SCHEDULES
| |
(a) | 1. Financial Statements |
(a)1. Financial Statements
The following consolidated statements are included within Item 8 under the following captions:
2. Schedules, Reinsurance Group of America, Incorporated and Subsidiaries
| | | | | | | | |
| | |
| Schedule | | Page |
Schedule | | Page |
| I | | |
| II | | |
| III | | |
| IV | | |
| V | | |
All other schedules specified in Regulation S-X are omitted for the reason that they are not required, are not applicable, or that equivalent information has been included in the consolidated financial statements, and notes thereto, appearing in Item 8.
3. Exhibits
|
| |
See the Index to Exhibits on page 169178. |
Item 16. FORM 10-K SUMMARY
None.
REINSURANCE GROUP OF AMERICA, INCORPORATED
SCHEDULE I-SUMMARY OF INVESTMENTS-OTHER THAN
INVESTMENTS IN RELATED PARTIES
December 31, 20192022
(in millions)
| | | | | | | | | | | | | | | | | | | | | | | |
| Type of Investment | | Amortized Cost | | Estimated Fair Value | | Amount at Which Shown in the Balance Sheets(1) | |
| Fixed maturity securities: | | | | | | | |
| United States government and government agencies and authorities | | $ | 1,690 | | | $ | 1,482 | | | $ | 1,482 | | |
| State and political subdivisions | | 1,282 | | | 1,119 | | | 1,119 | | |
Foreign governments(2) | | 10,515 | | | 9,889 | | | 9,889 | | |
| Public utilities | | 4,788 | | | 4,032 | | | 4,032 | | |
| Mortgage-backed and asset-backed securities | | 7,213 | | | 6,442 | | | 6,442 | | |
| All other corporate bonds | | 34,175 | | | 29,937 | | | 29,937 | | |
| Total fixed maturity securities | | $ | 59,663 | | | $ | 52,901 | | | $ | 52,901 | | |
| | | | | | | |
| Equity securities | | $ | 175 | | | $ | 134 | | | $ | 134 | | |
| Mortgage loans | | 6,590 | | | | | 6,590 | | |
| Policy loans | | 1,231 | | | | | 1,231 | | |
| Funds withheld at interest | | 6,003 | | | | | 6,003 | | |
| Limited partnerships and real estate joint ventures | | 2,327 | | | | | 2,327 | | |
| Short-term investments | | 154 | | | | | 154 | | |
| Other invested assets | | 1,140 | | | | | 1,140 | | |
| Total investments | | $ | 77,283 | | | | | $ | 70,480 | | |
(1)Fixed maturity securities are classified as available-for-sale and carried at fair value.
(2)Includes fixed maturities directly issued by foreign governments, supranational and foreign government-sponsored enterprises.
|
| | | | | | | | | | | | |
| Type of Investment | | Amortized Cost | | Estimated Fair Value | | Amount at Which Shown in the Balance Sheets(1) |
| Fixed maturity securities: | | | | | | |
| United States government and government agencies and authorities | | $ | 2,096 |
| | $ | 2,152 |
| | $ | 2,152 |
|
| State and political subdivisions | | 1,074 |
| | 1,164 |
| | 1,164 |
|
Foreign governments(2) | | 7,225 |
| | 9,137 |
| | 9,137 |
|
| Public utilities | | 3,617 |
| | 3,937 |
| | 3,937 |
|
| Mortgage-backed and asset-backed securities | | 7,153 |
| | 7,275 |
| | 7,275 |
|
| All other corporate bonds | | 25,588 |
| | 27,456 |
| | 27,456 |
|
| Total fixed maturity securities | | $ | 46,753 |
| | $ | 51,121 |
| | $ | 51,121 |
|
| | | | | | | |
| Equity securities | | $ | 332 |
| | $ | 320 |
| | $ | 320 |
|
| Mortgage loans on real estate | | 5,706 |
| | | | 5,706 |
|
| Policy loans | | 1,319 |
| | | | 1,319 |
|
| Funds withheld at interest | | 5,662 |
| | | | 5,662 |
|
| Short-term investments | | 64 |
| | | | 64 |
|
| Other invested assets | | 2,363 |
| | | | 2,363 |
|
| Total investments | | $ | 62,199 |
| | | | $ | 66,555 |
|
| |
(1) | Fixed maturity securities are classified as available-for-sale and carried at fair value. |
| |
(2) | Includes fixed maturities directly issued by foreign governments, supranational and foreign government-sponsored enterprises. |
REINSURANCE GROUP OF AMERICA, INCORPORATED
SCHEDULE II—CONDENSED FINANCIAL INFORMATION OF THE REGISTRANT
December 31,
(in millions)
|
| | | | | | | | | | | | |
| | | 2019 | | 2018 | | 2017 |
| CONDENSED BALANCE SHEETS | | | | | | |
| Assets: | | | | | | |
| Fixed maturity securities available-for-sale, at fair value | | $ | 525 |
| | $ | 595 |
| | |
| Short-term and other investments | | 19 |
| | 43 |
| | |
| Cash and cash equivalents | | 10 |
| | 21 |
| | |
| Investment in subsidiaries | | 14,486 |
| | 11,033 |
| | |
| Loans to subsidiaries | | 1,010 |
| | 1,010 |
| | |
| Other assets | | 270 |
| | 240 |
| | |
| Total assets | | $ | 16,320 |
| | $ | 12,942 |
| | |
| Liabilities and stockholders’ equity: | | | | | | |
Long-term debt - unaffiliated(1) | | $ | 2,974 |
| | $ | 2,778 |
| | |
Long-term debt - affiliated(2) | | 500 |
| | 500 |
| | |
| Other liabilities | | 1,244 |
| | 1,213 |
| | |
| Stockholders’ equity | | 11,602 |
| | 8,451 |
| | |
| Total liabilities and stockholders’ equity | | $ | 16,320 |
| | $ | 12,942 |
| | |
| CONDENSED STATEMENTS OF INCOME | | | | | | |
Interest / dividend income(3) | | $ | 308 |
| | $ | 576 |
| | $ | 131 |
|
| Investment related gains (losses), net | | 4 |
| | (5 | ) | | (5 | ) |
| Operating expenses | | (55 | ) | | (36 | ) | | (21 | ) |
| Interest expense | | (206 | ) | | (181 | ) | | (177 | ) |
| Income (loss) before income tax and undistributed earnings of subsidiaries | | 51 |
| | 354 |
| | (72 | ) |
| Income tax expense (benefit) | | (33 | ) | | (37 | ) | | 66 |
|
| Net income (loss) before undistributed earnings of subsidiaries | | 84 |
| | 391 |
| | (138 | ) |
| Equity in undistributed earnings of subsidiaries | | 786 |
| | 325 |
| | 1,960 |
|
| Net income | | 870 |
| | 716 |
| | 1,822 |
|
| Other comprehensive income (loss) | | (33 | ) | | 21 |
| | (8 | ) |
| Total comprehensive income | | $ | 837 |
| | $ | 737 |
| | $ | 1,814 |
|
| | | | | | | | | | | | | | | | | | | | |
| | 2022 | | 2021 | | 2020 |
| CONDENSED BALANCE SHEETS | | | | | | |
| Assets: | | | | | | |
| Fixed maturity securities available-for-sale, at fair value | | $ | 598 | | | $ | 523 | | | |
| Short-term and other investments | | 7 | | | 7 | | | |
| Cash and cash equivalents | | 298 | | | 92 | | | |
| Investment in subsidiaries | | 7,082 | | | 15,737 | | | |
| Loans to subsidiaries | | 1,060 | | | 1,020 | | | |
| Other assets | | 386 | | | 382 | | | |
| Total assets | | $ | 9,431 | | | $ | 17,761 | | | |
| Liabilities and stockholders’ equity: | | | | | | |
Long-term debt – unaffiliated(1) | | $ | 3,468 | | | $ | 3,172 | | | |
Long-term debt – affiliated(2) | | 600 | | | 600 | | | |
| Other liabilities | | 1,218 | | | 975 | | | |
| Stockholders’ equity | | 4,145 | | | 13,014 | | | |
| Total liabilities and stockholders’ equity | | $ | 9,431 | | | $ | 17,761 | | | |
| CONDENSED STATEMENTS OF INCOME | | | | | | |
Interest / dividend income(3) | | $ | 325 | | | $ | 399 | | | $ | 472 | |
| Investment related gains (losses), net | | 2 | | | 5 | | | 14 | |
| Operating expenses | | (53) | | | (66) | | | (59) | |
| Interest expense | | (183) | | | (152) | | | (202) | |
| Income (loss) before income tax and undistributed earnings of subsidiaries | | 91 | | | 186 | | | 225 | |
| Income tax expense (benefit) | | (22) | | | (21) | | | (21) | |
| Net income (loss) before undistributed earnings of subsidiaries | | 113 | | | 207 | | | 246 | |
| Equity in undistributed earnings of subsidiaries | | 510 | | | 410 | | | 169 | |
| Net income | | 623 | | | 617 | | | 415 | |
| Other comprehensive income (loss) | | 19 | | | 14 | | | (29) | |
| Total comprehensive income | | $ | 642 | | | $ | 631 | | | $ | 386 | |
The condensed financial information of RGA (the “Parent Company”) should be read in conjunction with the consolidated financial statements of RGA and its subsidiaries and the notes thereto (the “Consolidated Financial Statements”). These condensed unconsolidated financial statements reflect the results of operations, financial position and cash flows for RGA. Investments in subsidiaries are accounted for using the equity method of accounting.
| |
(1) | Long-term debt - unaffiliated consists of the following: |
(1)Long-term debt – unaffiliated consists of the following:
| | | | | | | | | | | | | | |
| | 2022 | | 2021 |
| $400 million 4.70% Senior Notes due 2023 | | $ | 400 | | | $ | 400 | |
| $400 million 3.95% Senior Notes due 2026 | | 400 | | | 400 | |
| $600 million 3.90% Senior Notes due 2029 | | 599 | | | 599 | |
| $600 million 3.15% Senior Notes due 2030 | | 598 | | | 597 | |
| $400 million 6.20% Subordinated Debentures due 2042 | | — | | | 400 | |
| $700 million 7.12% Subordinated Debentures due 2052 | | 700 | | | — | |
| $400 million 5.75% Subordinated Debentures due 2056 | | 400 | | | 400 | |
| $400 million Variable Rate Junior Subordinated Debentures due 2065 | | 399 | | | 399 | |
| Subtotal | | 3,496 | | | 3,195 | |
| Unamortized debt issuance costs | | (28) | | | (23) | |
| Total | | $ | 3,468 | | | $ | 3,172 | |
(2)Long-term debt includes $600 million of affiliated subordinated debt in 2022 and 2021, respectively. The affiliated subordinated debt was issued to various operating subsidiaries.
(3)Interest/dividend income includes $188 million and $270 million of cash dividends received from consolidated subsidiaries in 2022 and 2021, respectively.
|
| | | | | | | | |
| | | 2019 | | 2018 |
| $400 million 6.45% Senior Notes due 2019 | | $ | — |
| | $ | 400 |
|
| $400 million 5.00% Senior Notes due 2021 | | 400 |
| | 399 |
|
| $400 million 4.70% Senior Notes due 2023 | | 399 |
| | 399 |
|
| $400 million 3.95% Senior Notes due 2026 | | 400 |
| | 400 |
|
| $600 million 3.90% Senior Notes due 2029 | | 599 |
| | — |
|
| $400 million 6.20% Subordinated Debentures due 2042 | | 400 |
| | 400 |
|
| $400 million 5.75% Subordinated Debentures due 2056 | | 400 |
| | 400 |
|
| $400 million Variable Rate Junior Subordinated Debentures due 2065 | | 398 |
| | 399 |
|
| Subtotal | | 2,996 |
| | 2,797 |
|
| Unamortized debt issue costs | | (22 | ) | | (19 | ) |
| Total | | $ | 2,974 |
| | $ | 2,778 |
|
| |
(2) | Long-term debt—affiliated in 2019 and 2018 consists of $500 million of subordinated debt issued to various operating subsidiaries. |
| |
(3) | Interest/dividend income includes $175 million and $450 million of cash dividends received from consolidated subsidiaries in 2019 and 2018, respectively. |
REINSURANCE GROUP OF AMERICA, INCORPORATED
SCHEDULE II—CONDENSED FINANCIAL INFORMATION OF THE REGISTRANT (continued)
December 31,
(in millions)
| | | | | | | | | | | | | | | | | | | | |
| | 2022 | | 2021 | | 2020 |
| CONDENSED STATEMENTS OF CASH FLOWS | | | | | | |
| Operating activities: | | |
| Net income | | $ | 623 | | | $ | 617 | | | $ | 415 | |
| Equity in earnings of subsidiaries | | (510) | | | (410) | | | (169) | |
| Other, net | | 316 | | | (227) | | | (170) | |
| Net cash provided by (used in) operating activities | | 429 | | | (20) | | | 76 | |
| Investing activities: | | | | | | |
| Sales of fixed maturity securities available-for-sale | | 177 | | | 268 | | | 358 | |
| Purchases of fixed maturity securities available-for-sale | | (315) | | | (150) | | | (400) | |
| Repayments/issuances of loans to subsidiaries | | (40) | | | (10) | | | — | |
| | | | | | |
| Change in short-term investments | | — | | | 165 | | | (165) | |
| Change in other invested assets | | (1) | | | (1) | | | (26) | |
| Capital contributions to subsidiaries | | (53) | | | (43) | | | (78) | |
| Net cash provided by (used in) investing activities | | (232) | | | 229 | | | (311) | |
| Financing activities: | | | | | | |
| Dividends to stockholders | | (205) | | | (194) | | | (182) | |
| Proceeds from issuance of common stock, net | | — | | | — | | | 481 | |
| Purchases of treasury stock | | (81) | | | (99) | | | (163) | |
| | | | | | |
| Exercise of stock options, net | | — | | | — | | | 1 | |
| Change in cash collateral for derivative positions and other arrangements | | 5 | | | (19) | | | (11) | |
| Principal payments on debt | | (400) | | | (399) | | | — | |
| Principal payments on affiliated debt | | — | | | (500) | | | — | |
| Proceeds from unaffiliated long-term debt issuance | | 700 | | | — | | | 598 | |
| Proceeds from affiliated long-term debt issuance | | — | | | 600 | | | — | |
| Debt issuance costs | | (10) | | | — | | | (5) | |
| Net cash provided by (used in) financing activities | | 9 | | | (611) | | | 719 | |
| Change in cash and cash equivalents | | 206 | | | (402) | | | 484 | |
| Cash and cash equivalents, beginning of period | | 92 | | | 494 | | | 10 | |
| Cash and cash equivalents, end of period | | $ | 298 | | | $ | 92 | | | $ | 494 | |
| Supplementary information: | | | | | | |
| Interest paid | | $ | 156 | | | $ | 173 | | | $ | 187 | |
| Income taxes paid, net of refunds | | $ | — | | | $ | 323 | | | $ | 23 | |
|
| | | | | | | | | | | | |
| | | 2019 | | 2018 | | 2017 |
| CONDENSED STATEMENTS OF CASH FLOWS | | | | | | |
| Operating activities: | | |
| Net income | | $ | 870 |
| | $ | 716 |
| | $ | 1,822 |
|
| Equity in earnings of subsidiaries | | (786 | ) | | (325 | ) | | (1,960 | ) |
| Other, net | | 72 |
| | 37 |
| | 58 |
|
| Net cash (used in) provided by operating activities | | 156 |
| | 428 |
| | (80 | ) |
| Investing activities: | | | | | | |
| Sales of fixed maturity securities available-for-sale | | 576 |
| | 482 |
| | 515 |
|
| Purchases of fixed maturity securities available-for-sale | | (494 | ) | | (383 | ) | | (75 | ) |
| Repayments/issuances of loans to subsidiaries | | — |
| | — |
| | 40 |
|
| Change in short-term investments | | — |
| | — |
| | — |
|
| Change in other invested assets | | — |
| | — |
| | 125 |
|
| Capital contributions to subsidiaries | | (96 | ) | | (82 | ) | | (63 | ) |
| Net cash (used in) provided by investing activities | | (14 | ) | | 17 |
| | 542 |
|
| Financing activities: | | | | | | |
| Dividends to stockholders | | (163 | ) | | (140 | ) | | (117 | ) |
| Purchases of treasury stock | | (101 | ) | | (300 | ) | | (44 | ) |
| Exercise of stock options, net | | 6 |
| | 3 |
| | 7 |
|
| Net change in cash collateral for loaned securities | | (92 | ) | | (2 | ) | | (37 | ) |
| Principal payments on debt | | (397 | ) | | — |
| | (300 | ) |
| Proceeds from unaffiliated long-term debt issuance | | 599 |
| | — |
| | — |
|
| Debt issuance costs | | (5 | ) | | — |
| | — |
|
| Net cash (used in) provided by financing activities | | (153 | ) | | (439 | ) | | (491 | ) |
| Net change in cash and cash equivalents | | (11 | ) | | 6 |
| | (29 | ) |
| Cash and cash equivalents at beginning of year | | 21 |
| | 15 |
| | 44 |
|
| Cash and cash equivalents at end of year | | $ | 10 |
| | $ | 21 |
| | $ | 15 |
|
| Supplementary information: | | | | | | |
| Cash paid for interest | | $ | 192 |
| | $ | 176 |
| | $ | 186 |
|
| Cash paid for income taxes, net of refunds | | $ | 9 |
| | $ | 93 |
| | $ | 8 |
|
REINSURANCE GROUP OF AMERICA, INCORPORATED
SCHEDULE III—SUPPLEMENTARY INSURANCE INFORMATION
(in millions)
| | | | | | | | | | | | | | | | | | | | | | | | | | |
| | | As of December 31, |
| | | Deferred Policy
Acquisition Costs | | Future Policy Benefits and
Interest-Sensitive Contract
Liabilities | | Other Policy Claims and
Benefits Payable |
| | | | | | | | | | | | |
| 2022 | | | | | | | | | | | | |
| U.S. and Latin America: | | | | | | | | | | | | |
| Traditional | | $ | 2,000 | | | | | $ | 13,122 | | | | | $ | 2,495 | | | |
| Financial Solutions | | 387 | | | | | 24,662 | | | | | 34 | | | |
| Canada: | | | | | | | | | | | | |
| Traditional | | 171 | | | | | 3,600 | | | | | 341 | | | |
| Financial Solutions | | — | | | | | 2 | | | | | 6 | | | |
| Europe, Middle East and Africa: | | | | | | | | | | | | |
| Traditional | | 231 | | | | | 1,358 | | | | | 1,631 | | | |
| Financial Solutions | | — | | | | | 5,306 | | | | | 104 | | | |
| Asia Pacific: | | | | | | | | | | | | |
| Traditional | | 1,039 | | | | | 3,933 | | | | | 1,933 | | | |
| Financial Solutions | | 141 | | | | | 12,218 | | | | | 24 | | | |
| Corporate and Other | | 5 | | | | | 1,591 | | | | | 3 | | | |
| Total | | $ | 3,974 | | | | | $ | 65,792 | | | | | $ | 6,571 | | | |
| | | | | | | | | | | | |
| 2021 | | | | | | | | | | | | |
| U.S. and Latin America: | | | | | | | | | | | | |
| Traditional | | $ | 1,926 | | | | | $ | 12,757 | | | | | $ | 2,806 | | | |
| Financial Solutions | | 190 | | | | | 25,107 | | | | | 24 | | | |
| Canada: | | | | | | | | | | | | |
| Traditional | | 192 | | | | | 3,668 | | | | | 330 | | | |
| Financial Solutions | | — | | | | | 16 | | | | | 5 | | | |
| Europe, Middle East and Africa: | | | | | | | | | | | | |
| Traditional | | 253 | | | | | 1,366 | | | | | 1,612 | | | |
| Financial Solutions | | — | | | | | 5,999 | | | | | 89 | | | |
| Asia Pacific: | | | | | | | | | | | | |
| Traditional | | 1,052 | | | | | 3,792 | | | | | 2,116 | | | |
| Financial Solutions | | 74 | | | | | 8,202 | | | | | 6 | | | |
| Corporate and Other | | 3 | | | | | 1,252 | | | | | 5 | | | |
| Total | | $ | 3,690 | | | | | $ | 62,159 | | | | | $ | 6,993 | | | |
|
| | | | | | | | | | | | |
| | | As of December 31, |
| | | Deferred Policy Acquisition Costs | | Future Policy Benefits and Interest-Sensitive Contract Liabilities | | Other Policy Claims and Benefits Payable |
| 2019 | | | | | | |
| U.S. and Latin America: | | | | | | |
| Traditional | | $ | 1,806 |
| | $ | 11,969 |
| | $ | 2,143 |
|
| Financial Solutions | | 313 |
| | 23,728 |
| | 18 |
|
| Canada: | |
|
| |
|
| |
|
|
| Traditional | | 200 |
| | 3,260 |
| | 219 |
|
| Financial Solutions | | — |
| | 23 |
| | 42 |
|
| Europe, Middle East and Africa: | |
|
| |
|
| |
|
|
| Traditional | | 250 |
| | 1,197 |
| | 1,109 |
|
| Financial Solutions | | — |
| | 5,703 |
| | 51 |
|
| Asia Pacific: | |
|
| |
|
| |
|
|
| Traditional | | 927 |
| | 2,837 |
| | 2,121 |
|
| Financial Solutions | | 16 |
| | 2,215 |
| | 2 |
|
| Corporate and Other | | — |
| | 451 |
| | 6 |
|
| Total | | $ | 3,512 |
| | $ | 51,383 |
| | $ | 5,711 |
|
| | | | | | | |
| 2018 | | | | | | |
| U.S. and Latin America: | | | | | | |
| Traditional | | $ | 1,825 |
| | $ | 11,728 |
| | $ | 1,948 |
|
| Financial Solutions | | 420 |
| | 19,421 |
| | 21 |
|
| Canada: | | | | | | |
| Traditional | | 193 |
| | 2,930 |
| | 182 |
|
| Financial Solutions | | — |
| | 26 |
| | 34 |
|
| Europe, Middle East and Africa: | | | | | | |
| Traditional | | 239 |
| | 1,110 |
| | 978 |
|
| Financial Solutions | | — |
| | 4,541 |
| | 35 |
|
| Asia Pacific: | | | | | | |
| Traditional | | 702 |
| | 1,738 |
| | 2,436 |
|
| Financial Solutions | | 18 |
| | 1,043 |
| | 2 |
|
| Corporate and Other | | — |
| | 754 |
| | 6 |
|
| Total | | $ | 3,397 |
| | $ | 43,291 |
| | $ | 5,642 |
|
REINSURANCE GROUP OF AMERICA, INCORPORATED
SCHEDULE III—SUPPLEMENTARY INSURANCE INFORMATION (continued)
(in millions)
| | | | | | | | | | | | | | | | | | | | | | | | | | | | | | | | |
| | | Year ended December 31, |
| | Premium Income | | Net Investment
Income | | Policyholder
Benefits and
Interest Credited | | Amortization of DAC (1) | | Other Expenses (2) |
| 2022 | | | | | | | | | | |
| U.S. and Latin America: | | | | | | | | | | |
| Traditional | | $ | 6,590 | | | $ | 965 | | | $ | 6,335 | | | $ | 220 | | | $ | 806 | |
| Financial Solutions | | 66 | | | 1,078 | | | 666 | | | 51 | | | 184 | |
| Canada: | | | | | | | | | | |
| Traditional | | 1,219 | | | 238 | | | 1,158 | | | 14 | | | 207 | |
| Financial Solutions | | 95 | | | 1 | | | 68 | | | — | | | 5 | |
| Europe, Middle East and Africa: | | | | | | | | | | |
| Traditional | | 1,736 | | | 89 | | | 1,573 | | | 44 | | | 203 | |
| Financial Solutions | | 486 | | | 148 | | | 368 | | | — | | | 59 | |
| Asia Pacific: | | | | | | | | | | |
| Traditional | | 2,650 | | | 142 | | | 2,152 | | | 57 | | | 321 | |
| Financial Solutions | | 236 | | | 272 | | | 376 | | | 68 | | | 50 | |
| Corporate and Other | | — | | | 228 | | | 32 | | | — | | | 410 | |
| Total | | $ | 13,078 | | | $ | 3,161 | | | $ | 12,728 | | | $ | 454 | | | $ | 2,245 | |
| 2021 | | | | | | | | | | |
| U.S. and Latin America: | | | | | | | | | | |
| Traditional | | $ | 6,244 | | | $ | 930 | | | $ | 6,790 | | | $ | 269 | | | $ | 679 | |
| Financial Solutions | | 55 | | | 1,089 | | | 731 | | | 101 | | | 145 | |
| Canada: | | | | | | | | | | |
| Traditional | | 1,194 | | | 248 | | | 1,096 | | | 13 | | | 211 | |
| Financial Solutions | | 90 | | | — | | | 79 | | | — | | | 7 | |
| Europe, Middle East and Africa: | | | | | | | | | | |
| Traditional | | 1,738 | | | 88 | | | 1,829 | | | 48 | | | 189 | |
| Financial Solutions | | 350 | | | 205 | | | 258 | | | — | | | 55 | |
| Asia Pacific: | | | | | | | | | | |
| Traditional | | 2,624 | | | 136 | | | 2,445 | | | 60 | | | 283 | |
| Financial Solutions | | 218 | | | 138 | | | 244 | | | 41 | | | 34 | |
| Corporate and Other | | — | | | 304 | | | 4 | | | — | | | 356 | |
| Total | | $ | 12,513 | | | $ | 3,138 | | | $ | 13,476 | | | $ | 532 | | | $ | 1,959 | |
| 2020 | | | | | | | | | | |
| U.S. and Latin America: | | | | | | | | | | |
| Traditional | | $ | 5,838 | | | $ | 714 | | | $ | 5,979 | | | $ | 200 | | | $ | 679 | |
| Financial Solutions | | 53 | | | 999 | | | 764 | | | 52 | | | 109 | |
| Canada: | | | | | | | | | | |
| Traditional | | 1,052 | | | 207 | | | 909 | | | 16 | | | 201 | |
| Financial Solutions | | 83 | | | 1 | | | 68 | | | — | | | 3 | |
| Europe, Middle East and Africa: | | | | | | | | | | |
| Traditional | | 1,555 | | | 72 | | | 1,389 | | | 31 | | | 186 | |
| Financial Solutions | | 252 | | | 193 | | | 163 | | | — | | | 50 | |
| Asia Pacific: | | | | | | | | | | |
| Traditional | | 2,681 | | | 107 | | | 2,293 | | | 65 | | | 274 | |
| Financial Solutions | | 180 | | | 85 | | | 206 | | | 19 | | | 25 | |
| Corporate and Other | | — | | | 197 | | | 8 | | | — | | | 354 | |
| Total | | $ | 11,694 | | | $ | 2,575 | | | $ | 11,779 | | | $ | 383 | | | $ | 1,881 | |
|
| | | | | | | | | | | | | | | | | | | | |
| | | Year ended December 31, |
| | | Premium Income | | Net Investment Income | | Policyholder Benefits and Interest Credited | | Amortization of DAC | | Other Expenses (1) |
| 2019 | | | | | | | | | | |
| U.S. and Latin America: | | | | | | | | | | |
| Traditional | | $ | 5,729 |
| | $ | 769 |
| | $ | 5,339 |
| | $ | 199 |
| | $ | 697 |
|
| Financial Solutions | | 39 |
| | 931 |
| | 737 |
| | 31 |
| | 113 |
|
| Canada: | | | | | |
|
| |
|
| |
|
|
| Traditional | | 1,066 |
| | 205 |
| | 857 |
| | 12 |
| | 249 |
|
| Financial Solutions | | 89 |
| | 3 |
| | 80 |
| | — |
| | 4 |
|
| Europe, Middle East and Africa: | | | | | |
|
| |
|
| |
|
|
| Traditional | | 1,442 |
| | 73 |
| | 1,205 |
| | 36 |
| | 199 |
|
| Financial Solutions | | 218 |
| | 195 |
| | 175 |
| | — |
| | 52 |
|
| Asia Pacific: | | | | | |
|
| |
|
| |
|
|
| Traditional | | 2,568 |
| | 104 |
| | 2,317 |
| | 36 |
| | 223 |
|
| Financial Solutions | | 146 |
| | 46 |
| | 162 |
| | 16 |
| | 27 |
|
| Corporate and Other | | — |
| | 194 |
| | 22 |
| | — |
| | 380 |
|
| Total | | $ | 11,297 |
| | $ | 2,520 |
| | $ | 10,894 |
| | $ | 330 |
| | $ | 1,944 |
|
| 2018 | | | | | | | | | | |
| U.S. and Latin America: | | | | | | | | | | |
| Traditional | | $ | 5,534 |
| | $ | 730 |
| | $ | 5,131 |
| | $ | 180 |
| | $ | 698 |
|
| Financial Solutions | | 27 |
| | 706 |
| | 442 |
| | 109 |
| | 106 |
|
| Canada: | | | | | | | | | | |
| Traditional | | 1,024 |
| | 199 |
| | 848 |
| | 13 |
| | 251 |
|
| Financial Solutions | | 43 |
| | 2 |
| | 37 |
| | — |
| | 2 |
|
| Europe, Middle East and Africa: | | | | | | | | | | |
| Traditional | | 1,424 |
| | 66 |
| | 1,233 |
| | 27 |
| | 179 |
|
| Financial Solutions | | 195 |
| | 134 |
| | 116 |
| | — |
| | 37 |
|
| Asia Pacific: | | | | | | | | | | |
| Traditional | | 2,296 |
| | 96 |
| | 1,885 |
| | 92 |
| | 262 |
|
| Financial Solutions | | 1 |
| | 40 |
| | 40 |
| | 2 |
| | 19 |
|
| Corporate and Other | | — |
| | 166 |
| | 12 |
| | — |
| | 308 |
|
| Total | | $ | 10,544 |
| | $ | 2,139 |
| | $ | 9,744 |
| | $ | 423 |
| | $ | 1,862 |
|
| 2017 | | | | | | | | | | |
| U.S. and Latin America: | | | | | | | | | | |
| Traditional | | $ | 5,356 |
| | $ | 728 |
| | $ | 4,842 |
| | $ | 192 |
| | $ | 693 |
|
| Financial Solutions | | 24 |
| | 779 |
| | 458 |
| | 185 |
| | 105 |
|
| Canada: | | | | | | | | | | |
| Traditional | | 902 |
| | 189 |
| | 758 |
| | 12 |
| | 213 |
|
| Financial Solutions | | 38 |
| | 5 |
| | 30 |
| | — |
| | 3 |
|
| Europe, Middle East and Africa: | | | | | | | | | | |
| Traditional | | 1,301 |
| | 56 |
| | 1,096 |
| | 21 |
| | 175 |
|
| Financial Solutions | | 164 |
| | 123 |
| | 154 |
| | — |
| | 34 |
|
| Asia Pacific: | | | | | | | | | | |
| Traditional | | 2,053 |
| | 92 |
| | 1,636 |
| | 91 |
| | 335 |
|
| Financial Solutions | | 3 |
| | 34 |
| | 40 |
| | 1 |
| | 19 |
|
| Corporate and Other | | — |
| | 149 |
| | 6 |
| | — |
| | 274 |
|
| Total | | $ | 9,841 |
| | $ | 2,155 |
| | $ | 9,020 |
| | $ | 502 |
| | $ | 1,851 |
|
| |
(1) | Includes policy acquisition costs and other insurance expenses, excluding amortization of DAC. Also includes other operating expenses, interest expense, and collateral finance and securitization expense. |
REINSURANCE GROUP OF AMERICA, INCORPORATED
SCHEDULE IV—REINSURANCE
(in millions)
| | | | | | | | | | | | | | | As of or for the Year ended December 31, |
| | | As of or for the Year ended December 31, | | Gross Amount | | Ceded to Other
Companies | | Assumed from
Other Companies | | Net Amounts | | Percentage of
Amount Assumed
to Net |
| | | Gross Amount | | Ceded to Other Companies | | Assumed from Other Companies | | Net Amounts | | Percentage of Amount Assumed to Net | |
| 2019 | | | | | | | | | | | |
| Life insurance in force | | $ | 1,316 |
| | $ | 192,864 |
| | $ | 3,480,206 |
| | $ | 3,288,658 |
| | 105.8 | % | |
| 2022 | | 2022 | | | | | | | | | | |
| Life reinsurance in force | | Life reinsurance in force | | $ | 1,027 | | | $ | 151,569 | | | $ | 3,400,735 | | | $ | 3,250,193 | | | 104.6 | % |
| Premiums | | | | | | | | | | | Premiums | |
| U.S. and Latin America: | | | | | | | | | | | U.S. and Latin America: | |
| Traditional | | $ | 29.4 |
| | $ | 590.8 |
| | $ | 6,291.0 |
| | 5,729.6 |
| | 109.8 | % | Traditional | | $ | 25 | | | $ | 421 | | | $ | 6,986 | | | $ | 6,590 | | | 106.0 | % |
| Financial Solutions | | 1.8 |
| | — |
| | 37.0 |
| | 38.8 |
| | 95.4 |
| Financial Solutions | | 1 | | | — | | | 65 | | | 66 | | | 98.5 | |
| Canada: | |
|
| |
|
| |
|
| |
|
| |
|
| Canada: | |
| Traditional | | — |
| | 53.8 |
| | 1,119.5 |
| | 1,065.7 |
| | 105.0 |
| Traditional | | — | | | 64 | | | 1,283 | | | 1,219 | | | 105.3 | |
| Financial Solutions | | — |
| | — |
| | 88.9 |
| | 88.9 |
| | 100.0 |
| Financial Solutions | | — | | | — | | | 95 | | | 95 | | | 100.0 | |
| Europe, Middle East and Africa: | |
|
| |
|
| |
|
| |
|
| |
|
| Europe, Middle East and Africa: | |
| Traditional | | 44.7 |
| | 52.7 |
| | 1,449.4 |
| | 1,441.4 |
| | 100.6 |
| Traditional | | — | | | 32 | | | 1,768 | | | 1,736 | | | 101.8 | |
| Financial Solutions | | 0.2 |
| | 148.4 |
| | 366.4 |
| | 218.2 |
| | 167.9 |
| Financial Solutions | | — | | | 137 | | | 623 | | | 486 | | | 128.2 | |
| Asia Pacific: | |
|
| |
|
| |
|
| |
|
| |
|
| Asia Pacific: | |
| Traditional | | — |
| | 82.9 |
| | 2,651.5 |
| | 2,568.6 |
| | 103.2 |
| Traditional | | — | | | 117 | | | 2,767 | | | 2,650 | | | 104.4 | |
| Financial Solutions | | — |
| | — |
| | 146.0 |
| | 146.0 |
| | 100.0 |
| Financial Solutions | | — | | | — | | | 236 | | | 236 | | | 100.0 | |
| Total | | $ | 76.1 |
| | $ | 928.6 |
| | $ | 12,149.7 |
| | $ | 11,297.2 |
| | 107.5 |
| Total | | $ | 26 | | | $ | 771 | | | $ | 13,823 | | | $ | 13,078 | | | 105.7 | |
| 2018 | | | | | | | | | | | |
| Life insurance in force | | $ | 1,363 |
| | $ | 186,172 |
| | $ | 3,329,181 |
| | $ | 3,144,372 |
| | 105.9 | % | |
| 2021 | | 2021 | | | | | | | | | |
| Life reinsurance in force | | Life reinsurance in force | | $ | 1,117 | | | $ | 166,842 | | | $ | 3,467,054 | | | $ | 3,301,329 | | | 105.0 | % |
| Premiums | | | | | | | | | | | Premiums | |
| U.S. and Latin America: | | | | | | | | | | | U.S. and Latin America: | |
| Traditional | | $ | 31.6 |
| | $ | 593.7 |
| | $ | 6,095.4 |
| | $ | 5,533.3 |
| | 110.2 | % | Traditional | | $ | 26 | | | $ | 472 | | | $ | 6,690 | | | $ | 6,244 | | | 107.1 | % |
| Financial Solutions | | 4.7 |
| | — |
| | 22.5 |
| | 27.2 |
| | 82.7 |
| Financial Solutions | | 2 | | | — | | | 53 | | | 55 | | | 96.4 | |
| Canada: | |
|
| |
|
| |
|
| |
|
| |
|
| Canada: | |
| Traditional | | — |
| | 46.9 |
| | 1,070.9 |
| | 1,024.0 |
| | 104.6 |
| Traditional | | — | | | 50 | | | 1,244 | | | 1,194 | | | 104.2 | |
| Financial Solutions | | — |
| | — |
| | 43.4 |
| | 43.4 |
| | 100.0 |
| Financial Solutions | | — | | | — | | | 90 | | | 90 | | | 100.0 | |
| Europe, Middle East and Africa: | |
|
| |
|
| |
|
| |
|
| |
|
| Europe, Middle East and Africa: | |
| Traditional | | 26.0 |
| | 25.9 |
| | 1,423.1 |
| | 1,423.2 |
| | 100.0 |
| Traditional | | 5 | | | 32 | | | 1,765 | | | 1,738 | | | 101.6 | |
| Financial Solutions | | 0.2 |
| | 143.7 |
| | 338.8 |
| | 195.3 |
| | 173.5 |
| Financial Solutions | | — | | | 202 | | | 552 | | | 350 | | | 157.7 | |
| Asia Pacific: | |
|
| |
|
| |
|
| |
|
| |
|
| Asia Pacific: | |
| Traditional | | — |
| | 49.8 |
| | 2,346.2 |
| | 2,296.4 |
| | 102.2 |
| Traditional | | — | | | 112 | | | 2,736 | | | 2,624 | | | 104.3 | |
| Financial Solutions | | — |
| | — |
| | 0.9 |
| | 0.9 |
| | 100.0 |
| Financial Solutions | | — | | | — | | | 218 | | | 218 | | | 100.0 | |
| Corporate and Other | | — |
| | — |
| | 0.1 |
| | 0.1 |
| | 100.0 |
| |
| Total | | $ | 62.5 |
| | $ | 860.0 |
| | $ | 11,341.3 |
| | $ | 10,543.8 |
| | 107.6 |
| Total | | $ | 33 | | | $ | 868 | | | $ | 13,348 | | | $ | 12,513 | | | 106.7 | |
| 2017 | | | | | | | | | | | |
| Life insurance in force | | $ | 1,462 |
| | $ | 205,529 |
| | $ | 3,297,275 |
| | $ | 3,093,208 |
| | 106.6 | % | |
| 2020 | | 2020 | | | | | | | | | |
| Life reinsurance in force | | Life reinsurance in force | | $ | 1,990 | | | $ | 184,625 | | | $ | 3,480,692 | | | $ | 3,298,057 | | | 105.5 | % |
| Premiums | | | | | | | | | | | Premiums | |
| U.S. and Latin America: | | | | | | | | | | | U.S. and Latin America: | |
| Traditional | | $ | 30.5 |
| | $ | 610.4 |
| | $ | 5,936.2 |
| | $ | 5,356.3 |
| | 110.8 | % | Traditional | | $ | 23 | | | $ | 585 | | | $ | 6,399 | | | 5,837 | | | 109.6 | % |
| Financial Solutions | | 4.3 |
| | — |
| | 19.4 |
| | 23.7 |
| | 81.9 |
| Financial Solutions | | 3 | | | — | | | 50 | | | 53 | | | 94.3 | |
| Canada: | |
|
| |
|
| |
|
| |
|
| |
|
| Canada: | |
| Traditional | | — |
| | 38.1 |
| | 940.1 |
| | 902.0 |
| | 104.2 |
| Traditional | | — | | | 54 | | | 1,106 | | | 1,052 | | | 105.1 | |
| Financial Solutions | | — |
| | — |
| | 38.2 |
| | 38.2 |
| | 100.0 |
| Financial Solutions | | — | | | — | | | 83 | | | 83 | | | 100.0 | |
| Europe, Middle East and Africa: | |
|
| |
|
| |
|
| |
|
| |
|
| Europe, Middle East and Africa: | |
| Traditional | | 26.6 |
| | 34.9 |
| | 1,310.0 |
| | 1,301.7 |
| | 100.6 |
| Traditional | | 32 | | | 24 | | | 1,548 | | | 1,556 | | | 99.5 | |
| Financial Solutions | | 0.2 |
| | 125.0 |
| | 288.5 |
| | 163.7 |
| | 176.2 |
| Financial Solutions | | — | | | 178 | | | 430 | | | 252 | | | 170.6 | |
| Asia Pacific: | |
|
| |
|
| |
|
| |
|
| |
|
| Asia Pacific: | |
| Traditional | | — |
| | 54.5 |
| | 2,107.5 |
| | 2,053.0 |
| | 102.7 |
| Traditional | | — | | | 106 | | | 2,787 | | | 2,681 | | | 104.0 | |
| Financial Solutions | | — |
| | — |
| | 2.4 |
| | 2.4 |
| | 100.0 |
| Financial Solutions | | — | | | — | | | 180 | | | 180 | | | 100.0 | |
| Corporate and Other | | — |
| | — |
| | 0.1 |
| | 0.1 |
| | 100.0 |
| |
| Total | | $ | 61.6 |
| | $ | 862.9 |
| | $ | 10,642.4 |
| | $ | 9,841.1 |
| | 108.1 |
| Total | | $ | 58 | | | $ | 947 | | | $ | 12,583 | | | $ | 11,694 | | | 107.6 | |
REINSURANCE GROUP OF AMERICA, INCORPORATED
SCHEDULE V—VALUATION AND QUALIFYING ACCOUNTS
(in millions)
| | | | | | | | | | | | | | | | | | | | | | | | | | | | | | | | |
| | | | Additions | | | | |
| Description | | Balance at
Beginning of
Period | | Charged to Costs and Expenses | | Charged to Other
Accounts | | Deductions | | Balance at End of Period |
| 2022 | | | | | | | | | | |
| Valuation allowance for deferred income taxes | | $ | 218 | | | $ | (6) | | | $ | 9 | | | $ | — | | | $ | 221 | |
| Allowance for credit losses for mortgage loans | | 35 | | | 16 | | | — | | | — | | | 51 | |
| Allowance for credit losses for fixed maturity securities available-for-sale | | 31 | | | 42 | | | — | | | 36 | | | 37 | |
| 2021 | | | | | | | | | | |
| Valuation allowance for deferred income taxes | | $ | 251 | | | $ | (18) | | | $ | (15) | | | $ | — | | | $ | 218 | |
| Allowance for credit losses for mortgage loans | | 64 | | | — | | | — | | | 29 | | | 35 | |
| Allowance for credit losses for fixed maturity securities available-for-sale | | 20 | | | 27 | | | — | | | 16 | | | 31 | |
| 2020 | | | | | | | | | | |
| Valuation allowance for deferred income taxes | | $ | 236 | | | $ | (4) | | | $ | 19 | | | $ | — | | | $ | 251 | |
Allowance for credit losses for mortgage loans (1) | | 12 | | | 38 | | | 14 | | | — | | | 64 | |
| Allowance for credit losses for fixed maturity securities available-for-sale | | — | | | 41 | | | — | | | 21 | | | 20 | |
|
| | | | | | | | | | | | | | | | | | | | |
| | | | | Additions | | | | |
| Description | | Balance at Beginning of Period | | Charged to Costs and Expenses | | Charged to Other Accounts | | Deductions | | Balance at End of Period |
| 2019 | | | | | | | | | | |
| Valuation allowance for deferred income taxes | | $ | 181 |
| | $ | 56 |
| | $ | (1 | ) | | $ | — |
| | $ | 236 |
|
| Valuation allowance for mortgage loans | | 11 |
| | 1 |
| | — |
| | — |
| | 12 |
|
| 2018 | | | | | | | | | | |
| Valuation allowance for deferred income taxes | | $ | 227 |
| | $ | (34 | ) | | $ | (12 | ) | | $ | — |
| | $ | 181 |
|
| Valuation allowance for mortgage loans | | 9 |
| | 2 |
| | — |
| | — |
| | 11 |
|
| 2017 | | | | | | | | | | |
| Valuation allowance for deferred income taxes | | $ | 133 |
| | $ | 89 |
| | $ | 11 |
| | $ | 6 |
| | $ | 227 |
|
| Valuation allowance for mortgage loans | | 8 |
| | 1 |
| | — |
| | — |
| | 9 |
|
GLOSSARY OF SELECTED TERMS
Throughout this Annual Report on Form 10-K, the Company may use certain abbreviations, acronyms and terms which are defined below.
Entities
| | | | | | | | |
| Term or Acronym | | Definition |
| RGA Reinsurance | | RGA Reinsurance Company |
| Parkway Re | | Parkway Reinsurance Company |
| Rockwood Re | | Rockwood Reinsurance Company |
| Castlewood Re | | Castlewood Reinsurance Company |
| Chesterfield Re | | Chesterfield Reinsurance Company |
| Chesterfield Financial | | Chesterfield Financial Holdings LLC |
| RGA Life and Annuity | | RGA Life and Annuity Insurance Company |
| Timberlake Re | | Timberlake Reinsurance Company II |
| Timberlake Financial | | Timberlake Financial L.L.C. |
| RGA Canada | | RGA Life Reinsurance Company of Canada |
| RGA Barbados | | RGA Reinsurance Company (Barbados) Ltd. |
| RGA Americas | | RGA Americas Reinsurance Company, Ltd. |
| Manor Re | | Manor Reinsurance, Ltd. |
| RGA Atlantic | | RGA Atlantic Reinsurance Company Ltd. |
| RGA Worldwide | | RGA Worldwide Reinsurance Company, Ltd. |
| RGA Global | | RGA Global Reinsurance Company, Ltd. |
| RGA Australia | | RGA Reinsurance Company of Australia Limited |
| RGA International | | RGA International Reinsurance Company dac |
| RGA South Africa | | RGA Reinsurance Company of South Africa, Limited |
| Aurora National | | Aurora National Life Assurance Company |
| Omnilife | | Omnilife Insurance Company, Limited |
| Papara | | Papara Financing LLC |
Certain Terms and Acronyms
| | | | | | | | |
| Term or Acronym | | Definition |
| A.M. Best | | A.M. Best Company |
| ABS | | Asset-backed securities |
| Actuary | | A specialist in the mathematics of risk, especially as it relates to insurance calculations such as premiums, reserves, dividends, insurance rates and annuity rates. |
| Allowance | | An amount paid by the reinsurer to the ceding company to help cover the ceding company's acquisition and other costs, especially commissions. Allowances are usually calculated as a large percentage (often 100%) of first-year premiums reinsured and smaller percentages of renewal premiums reinsured. |
| AOCI | | Accumulated other comprehensive income (loss) |
| Asset-Intensive Reinsurance | | A transaction (usually coinsurance or funds withheld and often involving reinsurance of annuities) where performance of the underlying assets, more so than any mortality risk, is a key element. |
| Assumed reinsurance | | Insurance risk that a reinsurer accepts (assumes) from a ceding company. |
| ASU | | Accounting Standards Update |
| ASU 2018-12 | | Accounting Standards Update Financial Services – Insurance (Topic 944):Targeted Improvements to the Accounting for Long-Duration Contracts |
| Automatic Reinsurance | | Reinsurance arrangement whereby the ceding company and reinsurer agree that all business of a certain description will be ceded to the reinsurer. Under this arrangement, the ceding company performs underwriting decision-making within agreed-upon parameters for all business reinsured. |
| Bermuda Insurance Act | | Bermuda's Insurance Act 1978 which distinguishes between insurers carrying on long-term business, insurers carrying on special purpose business and insurers carrying on general business. |
| BMA | | Bermuda Monetary Authority |
| BSCR | | Bermuda Solvency Capital Requirement |
| CCPA | | California Consumer Privacy Act of 2018 |
| Capital-motivated reinsurance | | Reinsurance, including financial reinsurance, whose primary purpose is to enhance the cedant's capital position. |
| Captive insurer | | An insurance or reinsurance entity designed to provide insurance or reinsurance coverage for risks of the entity or entities by which it is owned or to which it is affiliated. |
| CECL | | Accounting for current expected credit losses using the model based on expected losses rather than incurred losses. |
| | | | | | | | |
| Ceding company (also known as cedant) | | An insurer that transfers, or cedes, risk to a reinsurer |
| CEO | | RGA’s Chief Executive Officer |
| Cession | | The insurance risk associated with a policy that is reinsured from an insurer to a reinsurer. |
| CFO | | RGA’s Chief Financial Officer |
| CLOs | | Collateralized loan obligations |
| CMBS | | Commercial mortgage-backed securities, a part of our investment portfolio that consists of securities made up of commercial mortgages. Stated on our balance sheet at fair value. |
| Coinsurance (also known as original terms reinsurance) | | A form of reinsurance under which the ceding company shares its premiums, death claims, surrender benefits, dividends and policy loans with the reinsurer, and the reinsurer pays expense allowances to reimburse the ceding company for a share of its expenses. |
| Coinsurance funds-withheld | | A variant on coinsurance, in which the ceding company withholds assets equal to reserves and shares investment income on those assets with the reinsurer. |
| Counterparty | | A party to a contract requiring or offering the exchange of risk. |
| Counterparty risk | | The risk that a party to an agreement will be unable to fulfill its contractual obligations |
| CPI | | Consumer price index |
| Critical illness (CI) insurance (also known as dread disease insurance) | | Insurance that provides a guaranteed fixed sum upon diagnosis of a specified illness or condition such as cancer, heart disease, or permanent total disability. The coverage can be offered on a stand-alone basis or as an add-on to a life insurance policy. |
| CRO | | RGA’s Chief Risk Officer |
| CVA | | Credit valuation adjustment |
| DAC | | Deferred acquisition costs: Costs of acquiring new business, which vary with and are directly related to the production of new business, have been deferred to the extent that such costs are deemed recoverable from future premiums or gross profits. |
| "Directors Plan" | | Flexible Stock Plan for Directors |
| EBITDA | | Earnings before interest, taxes, depreciation and amortization |
| EBS | | Economic balance sheet framework as part of the Bermuda Solvency Capital Requirement that forms the basis for an insurer's enhanced capital requirements. |
| ECR | | Enhanced capital requirement in accordance with the provisions of the Bermuda Insurance Act. |
| EEA | | European Economic Area |
| EGP | | Estimated gross profits. |
| EIA | | Equity-Indexed Annuities |
| EMEA | | Europe, Middle East and Africa geographic segment |
| Enterprise Risk Management (ERM) | | An enterprise-wide framework used by a firm to assess all risks facing the organization, manage mitigation strategies, monitor ongoing risks and report to interested audiences. |
| ESG | | Environmental, social, and governance |
| ESTER | | Euro Short-term Rate, an alternative to LIBOR being recommended by the European Central Bank |
| EU | | European Union |
| Expected mortality | | Number of deaths predicted to occur in a defined group of people. |
| FABN | | Funding Agreement Backed Notes |
| Face amount | | Amount payable at the death of the insured or at the maturity of the policy. |
| Facultative reinsurance | | A type of reinsurance in which the reinsurer underwrites an individual risk submitted by the ceding company for a risk that is unusual, large, highly substandard or not covered by an automatic reinsurance treaty. Such risks are typically submitted to multiple reinsurers for competitive offers. |
| FASB | | Financial Accounting Standards Board |
| FCA | | Financial Conduct Authority |
| FHLB | | Federal Home Loan Bank |
| FIA’s | | Fixed indexed annuities |
| Financial reinsurance (also known as financially-motivated reinsurance) | | A form of capital-motivated reinsurance that satisfies all regulatory requirements for risk transfer and is often designed to produce very predictable reinsurer profits as a percentage of the capital provided. |
| FSB | | Financial Stability Board which consists of representatives of national financial authorities of the G20 nations. |
| FVO | | Fair value option |
| GAAP | | U.S. generally accepted accounting principles |
| GDPR | | General Data Protection Regulation which establishes uniform data privacy laws across the European Union. |
| GICs | | Guaranteed investment contracts |
| GILTI | | Global intangible low-taxed income; a provision of U.S. Tax Reform that generally eliminates U.S. Federal income tax deferral on earnings of foreign subsidiaries. |
| GMAB | | Guaranteed minimum accumulation benefits; a feature of some variable annuities that the Company reinsures |
| GMDB | | Guaranteed minimum death benefits; a feature of some variable annuities that the Company reinsures |
| GMIB | | Guaranteed minimum income benefits; a feature of some variable annuities that the Company reinsures |
| GMWB | | Guaranteed minimum withdrawal benefits; a feature of some variable annuities that the Company reinsures |
| Group life insurance | | Insurance policy under which the lives of a group of people, most commonly employees of a single company, are insured in accordance with the terms of one master contract. |
| Guaranteed issue life insurance | | Insurance products that are guaranteed upon application, regardless of past health conditions. |
| | | | | | | | |
| IAIG | | Internationally Active Insurance Group |
| IAIS | | International Association of Insurance Supervisors |
| IBNR | | Incurred but not reported; a liability on claims that are based on historical reporting patterns, but have not yet been reported. |
| IFRS (International Financial Reporting Standards) | | Standards and interpretations adopted by the International Accounting Standards Board (IASB). |
| Individual life insurance | | An insurance policy that insures the life of usually one and sometimes two or more related individuals, rather than a group of people. |
| In-force sum insured | | A measure of insurance in effect at a specific date. |
| Initial public offering (IPO) | | The first sale to the public of shares of common stock issued by a private company. IPOs often are issued by smaller companies seeking the capital to expand, but they also can be used by large mutual or privately owned companies seeking to become publicly traded. |
| LIBOR | | London Interbank Offered Rate |
| Liquidity position | | Combination of the company's cash, cash equivalents, and short-term investments |
| Longevity product | | An insurance product that mitigates longevity risk by providing a stream of income for the duration of the policyholder's life. |
| Loss ratio | | Claims and other policy benefits as a percentage of net premiums |
| Market risk benefits | | Contracts or contract features that provide protection to the policyholder from capital market risk and expose the Company to other-than-nominal capital market risk and are measured at fair value |
| MDCI | | Missouri Department of Commerce and Insurance |
| MMS | | Minimum margin of solvency required to be maintained by the Company's Bermuda subsidiaries. |
| Modco | | Modified coinsurance |
| Modified coinsurance | | A variant on coinsurance in which the ceding company retains all the reserves, as well as assets backing reserves, and pays the reinsurer interest on the reinsurer's share of the reserves. |
| Moody’s | | Moody’s Investors Service |
| Morbidity | | A measure of the incidence of sickness or disease within a specific population group. |
| Mortality experience | | Actual number of deaths occurring in a defined group of people. |
| Mortality risk reinsurance | | Reinsurance that focuses primarily on transfer of mortality risk through coinsurance of term products or YRT. |
| NAIC | | National Association of Insurance Commissioners |
| NAIC SAP | | NAIC statutory accounting practices |
| NAV | | Net asset value |
| NIFO | | Net investments in foreign operations |
| NOL | | Net operating loss |
| Non-traditional reinsurance | | Usually synonymous with capital-motivated reinsurance, but includes any reinsurance of non-biometrical risks |
| Novation | | The act of replacing one participating member of a contract with another, with all rights, duties and terms being transferred to the new party upon consent of all parties affected. |
| NYSE | | New York Stock Exchange: the exchange where RGA is traded under the symbol "RGA" |
| OCI | | Other comprehensive income |
| OTC | | Derivatives that are privately negotiated contracts, which are known as over-the-counter derivatives |
| OTC Cleared | | OTC derivatives that are cleared and settled through central clearing counterparties. |
| PBR | | Principles-based reserves |
| PCAOB | | Public Company Accounting Oversight Board (United States) |
| PCS | | Performance Contingent Shares |
| Pension Plans | | The Company's sponsored or administrated both qualified and non-qualified defined benefit pension plans |
| Portfolio | | The totality of risks assumed by an insurer or reinsurer. |
| Preferred risk coverage | | Coverage designed for applicants who represent a better-than-average risk to an insurer. |
| Premium | | Amount paid to insure a risk. |
| Primary insurance (also known as direct insurance) | | Insurance business relating to contracts directly between insurers and policyholders. The insurance company is directly responsible to the policyholder. |
| Production | | New business produced during a specified period. |
| PSU | | Performance Share Units |
| Quota share (also known as 'first dollar' quota share) | | A reinsurance arrangement in which the reinsurer receives a certain percentage of each risk reinsured. |
| RBC | | Risk-Based Capital, which are guidelines promulgated by the NAIC and identify minimum capital requirements based upon business levels and asset mix. |
| Recapture | | The right of the ceding company to cancel reinsurance under certain conditions. |
| Regulation XXX/Regulation A-XXX | | U.S. Valuation of Life Policies Model Regulation implemented beginning in 2002 for various types of life insurance business, significantly increased the level of reserves that U.S. life insurance and life reinsurance companies must hold on their statutory financial statements for various types of life insurance business, primarily certain level premium term life products. |
| Reinsurance | | The transfer of insurance risk from an insurer, referred to as the ceding company, to a reinsurer, in conjunction with the payment of a reinsurance premium. Through reinsurance, a reinsurer 'insures' an insurer. |
| | | | | | | | |
| Reserves | | The amount required to be carried as a liability in the financial statement of an insurer or reinsurer to provide for future commitments under outstanding policies and contracts. |
| Retakaful | | A form of reinsurance that is acceptable within Islamic law. See Takaful. |
| Retention limit | | The maximum amount of risk a company will insure on one life. |
| Retrocession | | A transfer of reinsurance risk from a reinsurer to another reinsurer, referred to as the retrocessionaire, in conjunction with the payment of a retrocession premium. Through retrocession, a retrocessionaire reinsures a reinsurer. |
| Retrocessionaire | | A reinsurer that reinsures another reinsurer; see Retrocession. |
| RMBS | | Residential mortgage-backed securities, a part of our investment portfolio that consists of securities made up of residential mortgages. Stated on our balance sheet at fair value. |
| RMSC | | The Company's Risk Management Steering Committee |
| RSUs | | Restricted Stock Units |
| S&P | | Standard & Poor's |
| SARs | | Stock Appreciation Rights |
| SEC | | Securities and Exchange Commission |
| Securitization | | The structuring of financial assets as collateral against which securities can be issued to investors. |
| Simplified issue life insurance | | Insurance products with limited face amounts that require no or minimal underwriting. |
| SOFR | | Secured Overnight Financing Rate, an alternative to LIBOR being proposed by the Federal Reserve Board |
| SPLRC | | Special Purpose Life Reinsurance Captives |
| Statutory capital | | The excess of statutory assets over statutory reserves, both of which are calculated in accordance with standards established by insurance regulators. |
| "Stock Plans" | | The RGA flexible stock plan and the Flexible Stock Plan for Directors, collectively |
| Takaful | | A form of insurance that is acceptable within Islamic law, and that is devised upon the principles of mutual advantage and group security. |
| TDR | | Troubled Debt Restructuring |
| Tele-underwriting | | A telephone interview process, during which an applicant's qualifications to be insured are assessed. |
| The "County" | | The County of St. Louis, Missouri |
| The "Plan" | | RGA Flexible Stock Plan |
| The Board | | RGA's board of directors |
| The CARES Act | | The Coronavirus Aid, Relief, and Economic Security Act |
| The Companies Act | | The Bermuda's Companies Act of 1981 |
| The Company | | Reinsurance Group of America, Incorporated and its subsidiaries, all of which are wholly owned, collectively |
| Treaty (also known as a contract) | | A reinsurance agreement between a reinsurer and a ceding company. The three most common types of reinsurance treaties are YRT (yearly renewable term), coinsurance and modified coinsurance. The three most common methods of accepting reinsurance are automatic, facultative and facultative-obligatory. |
| TVaR | | Tail Value-at-Risk used for calculated capital requirement for Bermuda subsidiaries. |
| U.S. Tax Reform | | The U.S. Tax Cuts and Jobs Act of 2017 |
| UAE | | United Arab Emirates |
| UK | | United Kingdom |
| UL | | Universal life insurance |
| Underwriting | | The process that assesses the risk inherent in an application for insurance prior to acceptance of the policy. |
| Valuation | | The periodic calculation of reserves, the funds that insurance companies are required to hold in order satisfy all future insurance obligations. |
| Variable life insurance | | A form of whole life insurance under which the death benefit and the cash value of the policy fluctuate according to the performance of an investment fund. Most variable life insurance policies guarantee that the death benefit will not fall below a specified minimum. |
| VII | | Variable investment income |
| VOCRA | | Value of customer relationships acquired which represents the present value of the expected future profits associated with the expected future business acquired through existing customers of the acquired company or business. |
| VODA | | Value of distribution agreements which represents the present value of future profits associated with the expected future business derived from distribution agreements. |
| Webcasts | | Presentation of information broadcast over the Internet. |
| WorkWise | | The Company's hybrid approach to flexible work arrangements. |
| Yearly Renewable Term (YRT) | | A type of reinsurance which covers only mortality risk, with each year's premium based on the current amount of risk. |
SIGNATURES
Pursuant to the requirements of Section 13 or 15 (d) of the Securities Exchange Act of 1934, the registrant has duly caused this report to be signed on its behalf by the undersigned, thereunto duly authorized.
|
| | | | | | | | | | |
| Reinsurance Group of America, Incorporated. |
| | |
| By: | | /s/ Anna Manning |
| | | Anna Manning |
| | | President and Chief Executive Officer |
| | |
| | | Date: February 27, 202024, 2023 |
Pursuant to the requirements of the Securities Exchange Act of 1934, this report has been signed by the following persons on behalf of the registrant and in the capacities indicated on February 27, 2020.
|
| | | | | | | | | | | | | | | | | | | | | | | | | |
Signatures | | | | Title |
| | | | |
| | /s/ J. Cliff Eason Stephen T. O’Hearn* | | February 27, 2020* | | | | ChairmanChair of the Board and Director |
| | J. Cliff EasonStephen T. O’Hearn | | | | | | |
| | | | |
| | /s/ Anna Manning | | February 27, 2020 | | | | President, Chief Executive Officer and |
| | Anna Manning | | | | | | Director |
| | | | | | | | (Principal Executive Officer) |
| | | | |
| | /s/ Pina AlboAlbo* | | February 27, 2020* | | | | Director |
| | Pina Albo | | | | | | |
| | | | |
| | /s/ Christine R. DetrickTony Cheng* | | February 27, 2020* | | | | President and Director |
| | Christine R. DetrickTony Cheng | | | | | | |
| | | | |
| | /s/ John J. GauthierGauthier* | | February 27, 2020* | | | | Director |
| | John J. Gauthier | | | | | | |
| | | | | | | | |
| | /s/ Patricia L. GuinnGuinn* | | February 27, 2020* | | | | Director |
| | Patricia L. Guinn | | | | | | |
| | | | |
| | /s/ Hazel M. McNeilageMcNeilage* | | February 27, 2020* | | | | Director |
| | Hazel M. McNeilage | | | | | | |
| | | | | | | | |
| | /s/ Frederick J. SievertNg Keng Hooi* | | February 27, 2020* | | | | Director |
| | Frederick J. SievertNg Keng Hooi | | | | | | |
| | | | |
| | /s/ Stanley B. TulinGeorge Nichols III* | | February 27, 2020* | | | | Director |
| | Stanley B. TulinGeorge Nichols III | | | | | | |
| | | | | | | | |
| | /s/ Shundrawn Thomas* | | | | | | Director |
| | Shundrawn Thomas | | | | | | |
| | | | |
| | /s/ Khanh T. Tran* | | | | | | Director |
| | Khanh T. Tran | | | | | | |
| | | | | | | | |
| | /s/ Steven C. Van WykWyk* | | February 27, 2020* | | | | Director |
| | Steven C. Van Wyk | | | | | | |
| | | | |
| | /s/ Todd C. Larson | | February 27, 2020 | | | | Senior Executive Vice President and Chief |
| | Todd C. Larson | | | | | | Financial Officer (Principal Financial |
| | | | | | | | and Accounting Officer) |
| | | | |
| * | | By: /s/ Todd C. Larson | | February 27, 2020 | | | | |
| | Todd C. Larson, Attorney-in-fact | | | | |
Index to Exhibits
| | | | | | | | |
| | Credit Agreement, dated as of August 21, 2018, by and among RGA, the lenders named therein, U.S. Bank National Association, as Administrative Agent, Swing Line Lender and L/C Issuer, Bank of America, N.A.; JPMorgan Chase Bank, N.A.; and Wells Fargo Bank, National Association as Joint Syndication Agents and Barclays Bank PLC; HSBC Bank USA, National Association; KeyBank National Association; Mizuho Bank, Ltd.; MUFG Bank, Ltd.; Royal Bank of Canada; and Sumitomo Mitsui Banking Corporation as Co-Documentation Agents, incorporated by reference to Exhibit 10.1 to Current Report on Form 8-K filed on August 22, 2018 (File No. 1-11848) |
| |
| | |
| | |
| | |
| | |
| | |
| |
| | RGA Flexible Stock Plan as amended and restated effective July 1, 1998 and as further amended by Amendment on March 16, 2000, Second Amendment onto Letter of Credit Reimbursement Agreement, dated May 28, 2003, Third Amendment on May 26, 2004, Fourth Amendment on May 23, 2007, Fifth Amendment on May 21, 2008, Sixth Amendment on May 8, 2011, Seventh Amendment on May 18, 2011,13, 2022, by and Eighth Amendment on May 15, 2013, incorporated by reference to Exhibit 10.1 to Quarterly Report on Form 10-Q for the period ended June 30, 2013, filed on August 5, 2013 (File No. 1-11848)* |
| |
| | |
| |
| | |
| |
| | |
| | |
| | |
| | |
| | |
| |
| | |
| | |
|
| | | | | | | |
| 101.INS | | XBRL Instance Document - the instance document does not appear in the Interactive Data File because its XBRL tags are embedded within the Inline XBRL document |
| |
| | |
| |
| | |
| |
| | |
| | |
| | |
| |
| | |
| | |
| 104 | | Cover Page Interactive Data File (formatted as Inline XBRL and contained in Exhibits 101). |
* Represents a management contract or compensatory plan or arrangement required to be filed as an exhibit to this form pursuant to Item 15 of this Report.