UNITED STATES
SECURITIES AND EXCHANGE COMMISSION
WASHINGTON,Washington, D.C. 20549
FORM 10-K
[X] ANNUAL REPORT PURSUANT TO SECTION 13 OR 15(d) OF THE SECURITIES EXCHANGE ACT OF 1934(Mark One)
| x | ANNUAL REPORT PURSUANT TO SECTION 13 OR 15 (d) OF THE SECURITIES EXCHANGE ACT OF 1934 |
For the fiscal year ended December 31, 2002
[ ] TRANSITION REPORT PURSUANT TO SECTION 13 2008
OR 15(d) OF THE SECURITIES
EXCHANGE ACT OF 1934
| ¨ | TRANSITION REPORT PURSUANT TO SECTION 13 OR 15 (d) OF THE SECURITIES EXCHANGE ACT OF 1934 |
For the transition period from _______________ to __________________
Commission File Number: 333-61547
001-32886
CONTINENTAL RESOURCES, INC.
(Exact
(Exact name of registrant as specified in its charter)
Oklahoma 73-0767549
(State or other jurisdiction of (I.R.S. Employer
incorporation or organization) Identification No.)
302 N. Independence, Enid, Oklahoma 73701
(Address of principal executive offices) (Zip Code)
Registrant's
| Oklahoma | 73-0767549 | |
(State or other jurisdiction of incorporation or organization) | (I.R.S. Employer Identification No.) | |
| 302 N. Independence, Suite 1500, Enid, Oklahoma | 73701 | |
| (Address of principal executive offices) | (Zip Code) | |
Registrant’s telephone number, including area code: (580) 233-8955
Securities registered under Section 12(b) of the Exchange Act:
| Title of Class | Name of Exchange on Which Registered | |
| Common Stock, $0.01 par value | New York Stock Exchange |
Securities registered under Section 12(g) of the Exchange Act: None
Indicate by check mark if registrant is a well-known seasoned issuer, as defined in Rule 405 of the Securities Act. Yes x No ¨
Indicate by check mark if registrant is not required to file reports pursuant to Section 12 (b)13 or Section 15(d) of the Act: None
Securities registered pursuant to Section 12 (g) of the Act: None
Act. Yes ¨ No x
Indicate by check mark whether the registrant (1) has filed all reports required to be filed by Section 13 or 15 (d) of the Securities Exchange Act of 1934 during the preceding 12 months (or for such shorter period that the registrant was required to file such reports), and (2) has been subject to such filing requirements for the past 90 days. Yes [ ]x No [X]
The Registrant is not subject to the filing requirements of Section 13 and 15(d)
of the Securities Exchange Act of 1934, but files reports required by those
sections pursuant to contractual obligation requirements.
¨
Indicate by check mark if disclosure of delinquent filers pursuant to Item 405 of Regulation S-K (229.405 of this chapter) is not contained herein, and will not be contained, to the best of registrant'sregistrant’s knowledge, in definitive proxy or information statements incorporated by reference in Part III of this Form 10-K or any amendment to this Form 10-K.[X]
¨
Indicate by check mark whether the registrant is a large accelerated filer, an accelerated filer, a non-accelerated filer or a smaller reporting company. See definition of “accelerated filer”, “large accelerated filer” and “smaller reporting company” in Rule 12b-2 of the Exchange Act.
| Large accelerated filer x | Accelerated filer ¨ | Non-accelerated filer ¨ | Smaller reporting company ¨ |
Indicate by check mark whether the registrant is a shell company (as defined in Rule 12b-2 of the Act.)Exchange Act). Yes [ ]¨ No [X]x
State the aggregate market value of the voting and non-voting common equity held by non-affiliates computed by reference to the price at which the common equity was last sold, or the average bid and asked prices of such common equity, as of the last business day of the registrant’s most recently completed second fiscal quarter. As of March 28, 2003, there were 14,368,919June 30, 2008 aggregate market value was $3,138,228,490.
As of February 23, 2009, the registrant had 169,556,833 shares of the registrant's common stock paroutstanding.
DOCUMENTS INCORPORATED BY REFERENCE
Portions of the definitive Proxy Statement of Continental Resources, Inc. for the Annual Meeting of Stockholders to be held May 28, 2009, which will be filed with the Commission no later than April 30, 2009 are incorporated by reference into Part III of this Form 10-K.
Glossary of Oil and Natural Gas Terms
The terms defined in this section are used throughout this report:
“AMI.” Area of mutual interest.
“Bbl.” One stock tank barrel, of 42 U.S. gallons liquid volume, used herein in reference to crude oil, condensate or natural gas liquids.
“Bcf.” One billion cubic feet of natural gas.
“Bcfe.” One billion cubic feet of natural gas equivalent with one barrel of oil converted to six thousand cubic feet of natural gas.
“Boe.” Barrels of oil equivalent, with six thousand cubic feet of natural gas being equivalent to one barrel of oil.
“Basin.” A large natural depression on the earth’s surface in which sediments generally brought by water accumulate.
“Completion.” The process of treating a drilled well followed by the installation of permanent equipment for the production of natural gas or oil, or in the case of a dry hole, the reporting of abandonment to the appropriate agency.
“DD&A.” Depreciation, depletion, amortization and accretion.
“Developed acreage.” The number of acres that are allocated or assignable to productive wells or wells capable of production.
“Development well.” A well drilled within the proved area of an oil or natural gas reservoir to the depth of a stratigraphic horizon known to be productive.
“Dry hole.” A well found to be incapable of producing hydrocarbons in sufficient quantities such that proceeds from the sale of such production exceed production expenses and taxes.
“Enhanced recovery.” The recovery of oil and natural gas through the injection of liquids or gases into the reservoir, supplementing its natural energy. Enhanced recovery methods are often applied when production slows due to depletion of the natural pressure.
“Exploratory well.” A well drilled to find and produce natural gas or oil reserves not classified as proved, to find a new reservoir in a field previously found to be productive of natural gas or oil in another reservoir or to extend a known reservoir.
“Field.” An area consisting of a single reservoir or multiple reservoirs all grouped on, or related to, the same individual geological structural feature or stratigraphic condition. The field name refers to the surface area, although it may refer to both the surface and the underground productive formations.
“Formation.” A layer of rock which has distinct characteristics that differs from nearby rock.
“Horizontal drilling.” A drilling technique used in certain formations where a well is drilled vertically to a certain depth and then drilled at a right angle within a specified interval.
“HPAI.” High pressure air injection.
“Infill wells.” Wells drilled into the same pool as known producing wells so that oil or natural gas does not have to travel as far through the formation.
i
“MBbl.” One thousand barrels of crude oil, condensate or natural gas liquids.
“Mcf.” One thousand cubic feet of natural gas.
“MBoe.” One thousand Boe.
“MMBoe.” One million Boe.
“MMBtu.” One million British thermal units.
“MMcf.” One million cubic feet of natural gas.
“NYMEX.” The New York Mercantile Exchange.
“Net acres.” The percentage of total acres an owner has out of a particular number of acres, or a specified tract. An owner who has 50% interest in 100 acres owns 50 net acres.
“PUD.” Proved undeveloped.
“PV-10.” When used with respect to oil and natural gas reserves, PV-10 means the estimated future gross revenue to be generated from the production of proved reserves, net of estimated production and future development and abandonment costs, using prices and costs in effect at the determination date, before income taxes, and without giving effect to non-property-related expenses, discounted to a present value $.01 per share, outstanding. The common stockusing an annual discount rate of 10% in accordance with the guidelines of the SEC. PV-10 is privatelynot a financial measure calculated in accordance with generally accepted accounting principles (“GAAP”) and generally differs from Standardized Measure, the most directly comparable GAAP financial measure, because it does not include the effects of income taxes on future net revenues. Neither PV-10 nor Standardized Measure represents an estimate of the fair market value of our oil and gas properties. We and others in the industry use PV-10 as a measure to compare the relative size and value of proved reserves held by affiliatescompanies without regard to the specific tax characteristics of such entities.
“Productive well.” A well that is found to be capable of producing hydrocarbons in sufficient quantities such that proceeds from the sale of the registrant.
Document incorporatedproduction exceed production expenses and taxes.
“Proved developed reserves.” Reserves that can be expected to be recovered through existing wells with existing equipment and operating methods.
“Proved reserves.” The estimated quantities of oil, natural gas and natural gas liquids which geological and engineering data demonstrate with reasonable certainty to be commercially recoverable in future years from known reservoirs under existing economic and operating conditions.
“Proved undeveloped reserves (“PUD”).” Proved reserves that are expected to be recovered from new wells on undrilled acreage or from existing wells where a relatively major expenditure is required for recompletion.
“Reservoir.” A porous and permeable underground formation containing a natural accumulation of producible oil and/or natural gas that is confined by reference: None
CONTINENTAL RESOURCES, INC.
Annual Reportimpermeable rock or water barriers and is separate from other reservoirs.
“Simul-Frac.” Simultaneously fracture treating two or more wells within the same fracture plane in order to create pressure interference between the wells and thereby increasing the stimulated reservoir volume.
“Spacing.” The distance between wells producing from the same reservoir. Spacing is often expressed in terms of acres, e.g., 40-acre spacing, and is often established by regulatory agencies.
ii
“Standardized Measure.” Discounted future net cash flows estimated by applying year-end prices to the estimated future production of year-end proved reserves. Future cash inflows are reduced by estimated future production and development costs based on Form 10-Kperiod-end costs to determine pre-tax cash inflows. Future income taxes, if applicable, are computed by applying the statutory tax rate to the excess of pre-tax cash inflows over our tax basis in the oil and gas properties. Future net cash inflows after income taxes are discounted using a 10% annual discount rate.
“Unit.” The joining of all or substantially all interests in a reservoir or field, rather than a single tract, to provide for development and operation without regard to separate property interests. Also, the Year Ended December 31, 2002
TABLE OF CONTENTS
PART I
ITEM 1. BUSIESS ..........................................................3
ITEM 2. PROPERTIES ......................................................14
ITEM 3. LEGAL PROCEEDINGS ...............................................22
ITEM 4. SUBMISSION OF MATTERS TO A VOTE OF SECURITY HOLDERS .............22
PART II
ITEM 5. MARKET FOR REGISTRANT'S COMMON EQUITY AND RELATED STOCKHOLDER
MATTERS..........................................................22
ITEM 6. SELECTED FINANCIAL AND OPERATING DATA ...........................22
ITEM 7. MANAGEMENT'S DISCUSSION AND ANALYSIS OF FINANCIAL CONDITION
AND RESULTS OF OPERATIONS .......................................24
ITEM 7A. QUANTITATIVE AND QUALITATIVE DISCLOSURES ABOUT MARKET RISK ......30
ITEM 8. FINANCIAL STATEMENTS AND SUPPLEMENTARY DATA .....................32
ITEM 9. CHANGES IN AND DISAGREEMENTS WITH ACCOUNTANTS ON ACCOUNTING
AND FINANCIAL DISCLOSURE ........................................32
PART III
ITEM 10. DIRECTORS AND EXECUTIVE OFFICERS OF THE REGISTRANT ..............32
ITEM 11. EXECUTIVE COMPENSATION ..........................................34
ITEM 12. SECURITY OWNERSHIP OF CERTAIN BENEFICIAL OWNERS AND MANAGEMENT...35
ITEM 13. CERTAIN RELATIONSHIPS AND RELATED TRANSACTIONS ..................36
PART IV
ITEM 14. EXHIBITS, FINANCIAL STATEMENT SCHEDULES, AND REPORTS ON FORM 8-K.37
PART I
SPECIAL NOTE REGARDING FORWARD-LOOKING STATEMENTS
Certainarea covered by a unitization agreement.
“Waterflood.” The injection of water into an oil reservoir to “push” additional oil out of the statements under this Itemreservoir rock and elsewhere in this Form 10-K
are "forward-looking statements"into the wellbores of producing wells. Typically an enhanced recovery process.
“Wellbore.” The hole drilled by the bit that is equipped for oil or gas production on a completed well. Also called well or borehole.
“Working interest.” The right granted to the lessee of a property to explore for and to produce and own oil, gas, or other minerals. The working interest owners bear the exploration, development, and operating costs on either a cash, penalty, or carried basis.
Cautionary Statement Regarding Forward-Looking Statements
This report contains “forward-looking statements” within the meaning of Section 27A of the Securities Act of 1933 and Section 21E of the Securities Exchange Act of 1934, as amended (the "Exchange Act").amended. These forward-looking statements are subject to a number of risks and uncertainties, many of which are beyond our control. All statements, other than statements of historical factsfact included in this Form 10-K, including without limitationreport, regarding our strategy, future operations, financial position, estimated revenues and losses, projected costs, prospects, plans and objectives of management are forward-looking statements. When used in this report, the words “could,” “believe,” “anticipate,” “intend,” “estimate,” “expect,” “project” and similar expressions are intended to identify forward-looking statements, although not all forward-looking statements contain such identifying words. Except as otherwise specifically indicated, these statements assume no significant changes will occur in the operating environment for oil and natural gas properties and that there will be no material acquisitions, divestitures or financings except as otherwise described.
Forward-looking statements may include statements about our:
business strategy;
reserves;
technology;
financial strategy;
oil and natural gas realized prices;
timing and amount of future production of oil and natural gas;
the amount, nature and timing of capital expenditures;
drilling of wells;
competition and government regulations;
marketing of oil and natural gas;
exploitation or property acquisitions;
iii
costs of exploiting and developing our properties and conducting other operations;
general economic conditions;
credit markets;
liquidity and access to capital;
uncertainty regarding our future operating results; and
plans, objectives, expectations and intentions contained in this report that are not historical.
All forward-looking statements speak only as of the date of this report. You should not place undue reliance on these forward-looking statements. Although we believe that our plans, intentions and expectations reflected in or suggested by the forward-looking statements we make in this report are reasonable, we can give no assurance that these plans, intentions or expectations will be achieved. We disclose important factors that could cause our actual results to differ materially from our expectations under "Item 1. Business," "Item 2. Properties"“Item 1A.—Risk Factors” and "Item“Item 7.
Management's—Management’s Discussion and Analysis of Financial Condition and Results of Operations" regarding budgeted capital expenditures, increasesOperation” and elsewhere in oil and
gas production, the Company's financial position, oil and gas reserve
estimates, business strategy and other plans and objectives for future
operations, are forward-looking statements. Although the Company believes
that the expectations reflected in suchthis report. These cautionary statements qualify all forward-looking statements attributable to us or persons acting on our behalf.
iv
You should read this entire report carefully, including “Risk Factors” and our historical consolidated financial statements and the notes to those historical consolidated financial statements included elsewhere in this report. Unless the context otherwise requires, references in this report to “Continental Resources,” “we,” us,” “our,” or “ours” refer to Continental Resources, Inc., and its subsidiary.
| Item 1. | Business |
We are reasonable, it can give no assurance that such expectations will prove to
have been correct. There are numerous uncertainties inherent in estimating
quantities of provedan independent oil and natural gas reserves and in projecting future
rates of production and timing of development expenditures, including many
factors beyond the control of the Company. Reserve engineering is a
subjective process of estimating underground accumulation of oil and
natural gas that cannot be measured in an exact way, and the accuracy of
any reserve estimate is a function of the quality of available data and of
engineering and geological interpretation and judgment. As a result,
estimates made by different engineers often vary from one another. In
addition, results of drilling, testingexploration and production subsequent to the
date of an estimate may justify revisions of such estimates and such
revisions, if significant, would change the schedule of any further
production and development drilling. Accordingly, reserve estimates are
generally different from the quantities of oil and natural gas that are
ultimately recovered. Additional important factors that could cause actual
results to differ materially from the Company's expectations are disclosed
under "Risk Factors" and elsewhere in this Form 10-K. Should one or more of
these risks or uncertainties occur, or should underlying assumptions prove
incorrect, the Company's actual results and plan for 2003 and beyond could
differ materially from those expressed in forward-looking statements. All
subsequent written and oral forward-looking statements to the Company or
persons acting on its behalf are expressly qualified in their entirety by
such factors.
ITEM 1. BUSINESS
OVERVIEW
Continental Resources, Inc. and its subsidiaries, Continental Gas, Inc.
("CGI"), Continental Resources of Illinois, Inc. ("CRII") and Continental Crude
Co. ("CCC") (collectively "Continental" or the "Company"), are engaged in the
exploration, exploitation, development and acquisition of oil and gas reserves,
primarilycompany with operations in the Rocky Mountain, Mid-Continent and Mid-ContinentGulf Coast regions of the United States,
and to a lesser but growing extent, in the Gulf Coast region of Texas and
Louisiana. In addition to its exploration, development, exploitation and
acquisition activities, the Company currently owns and operates 700 miles of
natural gas pipelines, eight gas gathering systems and three gas processing
plants in its operating areas. The Company also engages in natural gas
marketing, gas pipeline construction and saltwater disposal. Capitalizing on its
growth through the drill-bit and its acquisition strategy, the Company has
increased its estimated proved reserves from 26.6 million barrels of oil
equivalent ("MMBoe") in 1995 to 74.9 MMBoe at year-end 2002, and has increased
its annual production from 2.2 MMBoe in 1995 to 5.4 MMBoe in 2002. As of
December 31, 2002, the Company's reserves had a present value of estimated
future net revenues, discounted at 10% ("PV-10") of $633.4 million calculated in
accordance with the Securities and Exchange Commission (the "Commission" or
"SEC") guidelines. At that date, approximately 84% of the Company's estimated
proved reservesStates. We were oil and approximately 60% of its total estimated reserves
were classified as proved developed. At December 31, 2002, the Company had
interests in 2,385 producing wells of which it operated 1,823. The Company was originally formed in 1967 to explore, develop and produce oil and natural gas in
Oklahoma.properties. Through 1993, the Company'sour activities and growth remained focused primarily in Oklahoma. In 1993, the Companywe expanded itsour activity into the Rocky Mountain and Gulf Coast regions. Through drilling success and strategic
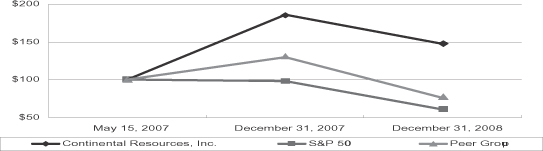
acquisitions, 83%Approximately 70% of the Company'sour estimated proved reserves as of December 31, 20022008 are now foundlocated in the Rocky Mountain region. The Company'sWe completed an initial public offering of our common stock on May 14, 2007, and our common stock began trading on the New York Stock Exchange on May 15, 2007 under the ticker symbol “CLR”.
We focus our exploration activities in large new or developing plays that provide us the opportunity to acquire undeveloped acreage positions for future drilling operations. We have been successful in targeting large repeatable resource plays where horizontal drilling, advanced fracture stimulation and enhanced recovery technologies provide the means to economically develop and produce oil and natural gas reserves from unconventional formations. As a result of these efforts, we have grown substantially through the drillbit, adding 121.7 MMBoe of proved oil and natural gas reserves through extensions and discoveries from January 1, 2004 through December 31, 2008 compared to 3.1 MMBoe added through proved reserve purchases during that same period.
As of December 31, 2008, our estimated proved reserves were 159.3 MMBoe, with estimated proved developed reserves of 106.0 MMBoe, or 67% of our total estimated proved reserves. Crude oil comprised 67% of our total estimated proved reserves. For the year ended December 31, 2008, we generated revenues of $960.5 million and operating cash flows of $719.9 million. For the year and quarter ended December 31, 2008, daily production averaged 32,803 and 36,018 Boe per day, respectively. This represents growth in the
Gulf Coast region during the mid-1990's was slowed dueof 13% and 19% as compared to the rapid growthyear and quarter ended December 31, 2007, when daily production averaged 29,099 Boe and 30,369 Boe, respectively.
The following table summarizes our total estimated proved reserves, PV-10 and net producing wells as of the Rocky Mountain region. Since 1999, drilling activity has increased in the
Gulf Coast region and it is expected to be another core operating areaDecember 31, 2008, average daily production for the Company. To further expandthree months ended December 31, 2008 and the reserve-to-production index in our principal regions. Our reserve estimates as of December 31, 2008 are based primarily on a reserve report prepared by Ryder Scott Company, L.P., our independent reserve engineers. In preparing its Mid-Continent operations,report, Ryder Scott Company, L.P. evaluated properties representing approximately 83% of our PV-10. Our technical staff evaluated properties representing the Company acquired
Mt. Vernon, Illinois-based Farrar Oil Company in 2001. Farrar has been a long
time partner with the Companyremaining 17% of our PV-10.
| At December 31, 2008 | Average daily production fourth quarter 2008 (Boe per day) | Percent of Total | Annualized reserve/ production index(2) | ||||||||||||||
| Proved reserves (MBoe) | Percent of total | PV-10(1) (in millions) | Net producing wells | ||||||||||||||
Rockies: | |||||||||||||||||
Red River units | 59,386 | 37.3 | % | $ | 697 | 242 | 14,058 | 39.0 | % | 11.5 | |||||||
Bakken field | |||||||||||||||||
Montana Bakken | 28,228 | 17.7 | % | 240 | 100 | 6,410 | 17.8 | % | 12.0 | ||||||||
North Dakota Bakken | 17,507 | 11.0 | % | 160 | 48 | 4,401 | 12.2 | % | 10.9 | ||||||||
Other | 6,900 | 4.3 | % | 62 | 272 | 2,508 | 7.0 | % | 7.5 | ||||||||
Mid-Continent: | |||||||||||||||||
Arkoma Woodford | 30,749 | 19.3 | % | 184 | 42 | 3,276 | 9.1 | % | 25.6 | ||||||||
Other | 16,062 | 10.1 | % | 170 | 752 | 4,750 | 13.2 | % | 9.2 | ||||||||
Gulf Coast | 430 | 0.3 | % | 10 | 17 | 615 | 1.7 | % | 1.9 | ||||||||
Total | 159,262 | 100.0 | % | $ | 1,523 | 1,473 | 36,018 | 100.0 | % | 12.1 | |||||||
| (1) | PV-10 is a non GAAP financial measure and generally differs from Standardized Measure, the most directly comparable GAAP financial measure, because it does not include the effects of income taxes on future net revenues. The Standardized Measure at December 31, 2008 is $1.3 billion, a $0.2 billion difference from PV-10 because of the tax effect. Neither PV-10 nor Standardized Measure represents an estimate of the fair market value of our oil and gas properties. We and others in the industry use PV-10 as a measure to compare the relative size and value of proved reserves held by companies without regard to the specific tax characteristics of such entities. |
| (2) | The Annualized Reserve/Production Index is the number of years proved reserves would last assuming current production continued at the same rate. This index is calculated by dividing annualized fourth quarter 2008 production into the proved reserve quantity at December 31, 2008. |
The following table provides the assets and experienced personnel
from which the Company can expand its operations into the Illinois and
Appalachian basins of the eastern United States.
BUSINESS STRATEGY
The Company's business strategyadditional information regarding our key development areas:
| Developed acres | Undeveloped acres | Gross wells planned for drilling | Capital expenditures (in millions)(1) | ||||||||||
| Gross | Net | Gross | Net | ||||||||||
Rockies: | |||||||||||||
Red River units | 147,235 | 131,320 | — | — | 4 | $ | 46 | ||||||
Bakken field | |||||||||||||
Montana Bakken | 82,182 | 64,438 | 131,422 | 101,010 | — | 7 | |||||||
North Dakota Bakken | 76,337 | 37,135 | 865,116 | 378,425 | 86 | 72 | |||||||
Other | 61,963 | 46,818 | 309,741 | 189,818 | 2 | 2 | |||||||
Mid-Continent: | |||||||||||||
Arkoma Woodford | 61,461 | 13,288 | 99,158 | 33,568 | 63 | 56 | |||||||
Other | 138,437 | 95,093 | 584,215 | 382,377 | 19 | 27 | |||||||
Gulf Coast | 40,748 | 11,733 | 36,304 | 29,247 | — | 1 | |||||||
Total | 608,363 | 399,825 | 2,025,956 | 1,114,445 | 174 | $ | 211 | ||||||
| (1) | Capital expenditures budgeted for 2009 includes amounts for drilling, capital workovers and facilities and excludes amounts for land of $54 million, seismic of $4 million, and $6 million for vehicles, computers and other equipment. While the above capital expenditures budget reflects our current intentions, we intend to manage our 2009 capital expenditures to be inline with our cash flow from operations. Continued weakness in oil and natural gas prices could cause us to curtail our actual capital expenditures. Conversely, an increase in commodity prices could result in increased capital expenditures. |
Our goal is to increase production, cash flowshareholder value by finding and reserves through the exploration, development, exploitation and acquisition of
properties in the Company's core operating areas. The Company seeks to increase
production and cash flow, and develop additional reserves by drilling new wells
(including horizontal wells), secondary recovery operations, workovers,
recompletions of existing wells and the application of other techniques designed
to increase production. The Company's acquisition strategy includes seeking
properties that have an established production history, have undeveloped reserve
potential, and through use of the Company's technical expertise in horizontal
drilling and secondary recovery, allow the Company to maximize the utilization
of its infrastructure in core operating areas. The Company's exploration
strategy is designed to combine the knowledge of its professional staff with the
competitive and technical strengths of the Company to pursue new field
discoveries in areas that may be out of favor or overlooked. This strategy
enables the Company to build a controlling lease position in targeted projects
and to realize the full benefit of any project success. The Company tries to
maintain an inventory of three or four new exploratory projects at all times for
future growth and development. On an ongoing basis, the Company evaluates and
considers divesting ofdeveloping crude oil and natural gas properties consideredreserves at costs that provide an attractive rate of return on our investment. The principal elements of our business strategy are:
Focus on Oil. During the late 1980’s we began to be non-corebelieve that the valuation potential for crude oil exceeded that of natural gas. Accordingly, we began to the
Company'sshift our reserve growth plans with the goal that all Company assets are
contributing to its long-term strategic plan.
PROPERTY OVERVIEW
Rocky Mountain Region. The Company's Rocky Mountain properties are
concentrated in the North Dakota, South Dakota and Montana portionsproduction profiles towards crude oil. As of the
Williston Basin, and in the Big Horn Basin in Wyoming. These properties
represented 83%December 31, 2008, crude oil comprises 67% of the Company's estimatedour total proved reserves and 76% of the PV-10our 2008 annual production. Although we do pursue natural gas opportunities, we continue to believe that crude oil valuations will be superior to natural gas valuations on a relative Btu basis.
Growth Through Low-Cost Drilling. Substantially all of our annual capital expenditures are invested in drilling projects and acreage and seismic acquisitions. From January 1, 2004 through December 31, 2008, proved oil and natural gas reserve additions through extensions and discoveries were 121.7 MMBoe compared to 3.1 MMBoe of proved reserve purchases.
Internally Generate Prospects. Our technical staff has internally generated substantially all of the Company's proved reservesopportunities for the investment of our capital. As an early entrant in new or emerging plays, we expect to acquire undeveloped acreage at a lower cost than those of later entrants into a developing play.
Focus on Unconventional Oil and Natural Gas Resource Plays. Our experience with horizontal drilling, advanced fracture stimulation and enhanced recovery technologies allows us to commercially develop unconventional oil and natural gas resource plays, such as the Red River B dolomite, Bakken Shale and Arkoma Woodford formations. Production rates in the Red River units also have been increased through the use of enhanced recovery technology. Our production from the Red River units, the Bakken field, and the Arkoma Woodford comprised approximately 9,302 MBoe, or 77% of our total oil and natural gas production during the year ended December 31, 2008.
Acquire Significant Acreage Positions in New or Developing Plays. In addition to the 513,003 net undeveloped acres held in the Montana and North Dakota Bakken shale and Arkoma Woodford fields, we held 359,120 net undeveloped acres in other oil and natural gas shale plays as of December 31, 2002.2008. Our technical staff is focused on identifying and testing new unconventional oil and natural gas resource plays where significant reserves could be developed if commercial production rates can be achieved through advanced drilling, fracture stimulation and enhanced recovery techniques.
We have a number of strengths that we believe will help us successfully execute our strategies:
Large Acreage Inventory. We own 1,114,445 net undeveloped and 399,825 net developed acres as of December 31, 2008. Approximately 78% of the undeveloped acres are located within unconventional shale resource plays including the Bakken shale in North Dakota and Montana, the Woodford shale in southeast and western Oklahoma, the Atoka shale in western Oklahoma and the Texas Panhandle, the New Albany shale in Indiana and Kentucky and the Lower Huron, Rhinestreet and Marcellus shales in West Virginia, Pennsylvania, New York and Ohio. The Company owns
approximately 465,000 net leasehold acres, has interestsbalance of the undeveloped acreage is located primarily in 710 gross (615 net)
producingconventional plays
including 3D defined locations for the Trenton-Black River of Michigan, Red River of Montana and North Dakota, Morrow-Springer of western Oklahoma and Frio in South Texas.
Horizontal Drilling and Enhanced Recovery Experience. In 1992, we drilled our initial horizontal well, and we have drilled over 600 horizontal wells issince that time. We also have substantial experience with enhanced recovery methods and currently serve as the operator of 93%48 waterflood units. Additionally, we operate eight high pressure air injection (“HPAI”) floods.
Control Operations Over a Substantial Portion of these wells,Our Assets and has identified 86
potential drilling locations in the Rocky Mountain region.
The Williston Basin properties represented 74% of the Company's estimated
proved reserves and 70% of the PV-10 of its proved reserves at December 31,
2002. In the Williston Basin, the Company owns approximately 369,000 net
leasehold acres, has interests in 381 gross (328 net) producing wells and has
identified 86 potential drilling locations. The Company's principal properties
in the Williston Basin include eight high-pressure air injections, or HPAI,
secondary recovery units located in the Cedar Hills, Medicine Pole Hills and
Buffalo Fields. The Company's extensive experience has demonstrated that its
secondary recovery methods have increased the reserves recovered from existing
fields by 200% to 300% through the injection and withdrawal of fluids or gases.
The combination of injection and withdrawal recovers additional oil from the
reservoir that cannot be recovered by primary recovery methods. The Buffalo
Field units are the oldest of the Company's secondary recovery projects and have
been in operations since 1978. The Cedar Hills Field units are the most recent
and largest of the Company's secondary recovery units representing approximately
59% of the proved reserves and 58% of the PV-10 attributable to the Company's
proved reserves at December 31, 2002. Combined, the Company's eight HPAI
secondary recovery projects represent 80% of the HPAI projects in North America.
In the Big Horn Basin, the Company's properties are focused in and around
the Worland Field. The Worland Field represents 9% of the Company's estimated
proved reserves and 6% of the PV-10 of the Company's proved reserves at December
31, 2002. In the Worland Field, the Company owns approximately 96,000 net
leasehold acres and has interests in 329 gross (287 net) producing wells, of
which the Company operates 303. In the Worland Field, the Company has identified
70 potential workovers or recompletions and has initiated three pilot secondary
recovery projects to increase recovery of known oil in the field.
Mid-Continent Region. The Company's Mid-Continent properties are located
primarily in the Anadarko Basin of western Oklahoma, southwestern Kansas,
Illinois, and in the Texas Panhandle. At December 31, 2002, the Company's
estimated proved reserves in the Mid-Continent region represented 16% of the
Company's total estimated proved reserves, 66% of the Company's natural gas
reserves and 22% of the Company's PV-10. In the Mid-Continent region, the
Company owns approximately 162,000 net leasehold acres, has interests in 1,574
gross (956 net) producing wells and has identified 32 potential drilling
locations. The Company operates 68% of the gross wells in which it has
interests.
Gulf Coast Region. The Company's Gulf Coast properties are located
primarily onshore, along the Texas and Louisiana coasts, and include the Pebble
Beach and Luby projects in Nueces County, Texas and the Jefferson Island project
in Iberia Parish, Louisiana. The Company also participates in Gulf of Mexico
drilling ventures as part of the Company's ongoing expansion in the Gulf Coast
region. During 2002, the Company's Gulf Coast producing wells represented only
4% of the Company's total producing well count, but produced 21% of the
Company's total gas production for the year.Investments. As of December 31, 2002,2008, we operated properties comprising 91% of our PV-10. By controlling operations, we are able to more effectively manage the Company's Gulf Coast properties represented 1% of the Company's total estimated
proved reserves, 4% of its estimated proved gas reserves and 2% PV-10 of the
Company's proved reserves. In the Gulf Coast, the Company owns approximately
24,000 net leasehold acres; has interests in 101 gross (83 net) producing wells
and has identified 53 potential drilling locations from 95 square miles of
proprietary 3-D data and several hundred miles of non-proprietary 2-D and 3-D
seismic data. The Company operates 79% of the gross wells in which it has
interests.
OTHER INFORMATION
The Company's subsidiary, Continental Gas, Inc., was formed as a gas
marketing company in April 1990. Currently, Continental Gas, Inc. specializes in
gas marketing, pipeline construction, gas gathering systems and gas plant
operations. On June 19, 2001, the Company formed a new subsidiary, Continental
Resources of Illinois, Inc., or CRII. On July 9, 2001, the Company, through
CRII, purchased the assets of Farrar Oil Company and Har-Ken Oil Company, oil
and gas operating companies in Illinois and Kentucky, respectively. The
Company's remaining subsidiary, Continental Crude Co., has been inactive since
its formation in 1998.
Continental Resources, Inc. and its subsidiaries are headquartered in Enid,
Oklahoma, and Mt. Vernon, Illinois, with additional offices in Baker, Montana;
Buffalo, South Dakota; and field offices located within its various operating
areas.
BUSINESS STRENGTHS
The Company believes that it has certain strengths that provide it with
competitive advantages and provide it with diversified growth opportunities,
including the following:
PROVEN GROWTH RECORD. The Company has demonstrated consistent growth
through a balanced program of development, exploitation and exploratory drilling
and acquisitions. The Company has increased its proved reserves 182% from 26.6
MMBoe in 1995 to 74.9 MMBoe as of December 31, 2002.
SUBSTANTIAL AND DIVERSIFIED DRILLING INVENTORY. The Company is active in
seven different geologic basins in 11 states and has identified more than 171
potential drilling locations based on geological and geophysical evaluations. As
of December 31, 2002, the Company held approximately 651,000 net acres, of which
approximately 57% were classified as undeveloped. Management believes that its
current inventory and acreage holdings could support three to five years of
drilling activities depending upon oil and gas prices.
LONG-LIFE NATURE OF RESERVES. The Company's producing reserves are
primarily characterized by relatively stable, mature production that is subject
to gradual decline rates. As a result of the long-lived nature of its
properties, the Company has relatively low reinvestment requirements to maintain
reserve quantities and primary and secondary production levels. The Company's
properties have an average reserve life of approximately 14 years.
SUCCESSFUL DRILLING AND ACQUISITION RECORD. The Company has maintained a
successful drilling record. During the five years ended December 31, 2002, the
Company participated in 239 gross wells of which 83% were completed as
producers. During this time, reserves added from drilling, workovers and related
activities totaled 34.4 MMBoe of proved developed reserves at an average finding
cost of $7.36 per barrel of oil equivalent ("Boe"). During 2002, the Company
spent $57.0 million on the development of the Cedar Hills field. $32.4 million
was spent drilling injection wells and $24.6 million was spent on
infrastructure, including compressors and pipelines, which resulted in no
additional reserves in 2002. Excluding these costs, our 5year average finding
cost would be $5.71. During the same period, the Company acquired 21.2 MMBoe at
an average cost of $4.60 per Boe. Including major revisions of 12.0 MMBoe due
primarily to fluctuating prices, the Company added a total of 67.7 MMBoe at an
average cost of $5.19 per Boe during the last five years.
SIGNIFICANT OPERATIONAL CONTROL. Approximately 97.4% of the Company's PV-10
at December 31, 2002, was attributable to wells operated by the Company, giving
Continental significant control over the amount and timing of capital
expendituresexploration and production, operating and marketing activities.
TECHNOLOGICAL LEADERSHIP. The Company has demonstrated significant
expertise indevelopment of our properties, including the continually evolving technologies of 3-D seismic, directional drilling and precision horizontal drilling, and is among the few companies in
North America to successfully utilize high pressure air injection enhanced
recovery technology on a large scale. Through the use of precision horizontal
drilling the Company has experienced a 400% to 700% increase in initial flow
rates. From inception, the Company has drilled 243 horizontal wells in the Rocky
Mountains and Mid-Continent regions. Through the combination of precision
horizontal drilling and secondary recovery technology, the Company has
significantly enhanced the recoverable reserves underlying its oil and gas
properties. Since its inception, Continental has experienced a 300% to 400%
increase in recoverable reserves through use of these technologies.
EXPERIENCED AND COMMITTED MANAGEMENT. Continental'sfracture stimulation methods used.
Experienced Management Team. Our senior management team has extensive expertise in the oil and gas industry. The Company'sOur Chief Executive Officer, Harold G. Hamm, began his career in the oil and gas industry in 1967. EightOur seven senior officers have an average of 2428 years of oil and gas industry experience. Additionally, the Company'sour technical staff, which includes 1427 petroleum engineers, 17 geoscientists and 11 geoscientists, havelandmen, has an average of more than 2520 years experience in the industry.
DEVELOPMENT, EXPLORATION AND EXPLOITATION ACTIVITIES
CAPITAL EXPENDITURES. The Company's projected
Strong Financial Position. As of February 23, 2009, we had outstanding borrowings under our revolving credit facility of approximately $474.4 million and available borrowing capacity under our selected commitment level of $198.1 million. We have elected to set the commitment level at $672.5 million, which is below the revolving credit facility note amount of $750.0 million and the established borrowing base of $850.0 million. We believe that our planned exploration and development activities will be funded substantially from our operating cash flows and borrowings under our revolving credit facility. Our 2009 capital expenditures for
development, exploitation and exploration activities in 2003 total $105.9
million. Approximately $74.0 million (69%) is targeted for drilling, $8.3
million (8%) for lease acquisitions and seismic, $4.0 million (4%) for workovers
and recompletions, $3.3 million (3%) for acquisitions, and $16.4 million (16%)
for secondary recovery projects and facilities. Funding for these expenditures
will come from a combinationbudget has been established based on our current expectation of available cash flow and the Company'sfrom operations. Should expected available cash flow from operations materially vary from expectations, we believe our credit facility.
Top priority will be givenfacility has sufficient availability to completing installation of secondary recovery
facilities at the Cedar Hills Field by year-end 2003. This will account for
$52.6 millionfund any deficit or 50% of the Company's projectedthat we can further reduce our capital expenditures for 2003.
This includes $40.2 million for drilling injector wells and $12.4 million for
compressors, equipment and facilities. Approximately $33.8 million willto be spent
on development and exploration drilling outside of the Cedar Hills unit.
Expenditures on projects outside of Cedar Hills are discretionary and may vary
from projections in response to commodity prices and available cash flow.
DEVELOPMENT AND EXPLOITATION. The Company's development and exploitation
activities are designed to maximize the value of existing properties. Activities
include the drilling of vertical, directional and horizontal development wells,
workover and recompletions in existing wellbores, and secondary recovery water
flood and HPAI projects. During 2003, the Company expects to invest $52.0
million drilling 59 development-drilling projects, representing 70% of the
Company's total 2003 drilling budget. Within the development drilling budget,
77% will be spent drilling injector wells within the Cedar Hills units, 5% on
other projects in the Williston and Big Horn Basins, 10% in the Gulf Coast
region and 8% in the Mid-Continent region. The Company also expects to invest
$4.0 million during 2003 on workovers and recompletions, $3.3 million for
acquisitions, and $16.4 million on secondary recovery projects and related
facilities.
EXPLORATION ACTIVITIES. The Company's exploration projects are designed to
locate new reserves and fields for future growth and development. The Company's
exploration projects vary in risk and reward based on their depth, location and
geology. The Company routinely uses the latest in technology, including 3-D
seismic, horizontal drilling and new completion technologies to enhance its
projects. The Company will continue to build exploratory inventory throughout
the year for future drilling.
The Company will initiate, on a priority basis, as many projects asline with cash flow prudently justifies. The Company anticipates investing $21.9 million
drilling 36 exploratory projects during 2003, representing 30% of the Company's
total 2003 drilling budget with 14% to be spent in the Mid-Continent region, 50%
in the Rocky Mountain regionfrom operations.
Oil and 36% in the Gulf Coast region.
Gas Operations
The following table summarizes the number of projects Continental expects
to complete in 2003.
| December 31, 2008 | |||||||||
| Oil (MBbls) | Gas (MMcf) | Total (MBoe) | PV-10(1) (in millions) | ||||||
Proved developed producing | 79,845 | 153,038 | 105,351 | $ | 1,267 | ||||
Proved developed non-producing | 542 | 498 | 625 | 5 | |||||
Proved undeveloped | 25,852 | 164,602 | 53,286 | 251 | |||||
Total proved reserves | 106,239 | 318,138 | 159,262 | $ | 1,523 | ||||
Standardized measure | $ | 1,277 | |||||||
Rockies: Red River units Bakken field Montana Bakken North Dakota Bakken Other Mid-Continent: Arkoma Woodford Other Gulf Coast Total Oil
(MBbls) Gas
(MMcf) Total
(MBoe) % Proved
developed PV-10(1)
(in millions) 54,917 26,812 59,386 85 % $ 697 24,154 24,443 28,228 64 % 240 14,832 16,047 17,507 52 % 160 5,524 8,255 6,900 99 % 62 62 184,120 30,749 24 % 184 6,657 56,439 16,062 86 % 170 93 2,022 430 100 % 10 106,239 318,138 159,262 67 % $ 1,523
| (1) | PV-10 is a non GAAP financial measure and generally differs from Standardized Measure, the most directly comparable GAAP financial measure, because it does not include the effects of income taxes on future net revenues. The Standardized Measure at December 31, 2008 is $1.3 billion, a $0.2 billion difference from PV-10 because of the tax effect. Neither PV-10 nor Standardized Measure represents an estimate of the fair market value of our oil and gas properties. We and others in the industry use PV-10 as a measure to compare the relative size and value of proved reserves held by companies without regard to the specific tax characteristics of such entities. |
Developed and Undeveloped Acreage
The following table presents the total gross and net developed and undeveloped acreage by region as of December 31, 2008:
| Developed acres | Undeveloped acres | Total | ||||||||||
| Gross | Net | Gross | Net | Gross | Net | |||||||
Rockies: | ||||||||||||
Red River units | 147,235 | 131,320 | — | — | 147,235 | 131,320 | ||||||
Bakken field | ||||||||||||
Montana Bakken | 82,182 | 64,438 | 131,422 | 101,010 | 213,604 | 165,448 | ||||||
North Dakota Bakken | 76,337 | 37,135 | 865,116 | 378,425 | 941,453 | 415,560 | ||||||
Other | 61,963 | 46,818 | 309,741 | 189,818 | 371,704 | 236,636 | ||||||
Mid-Continent: | ||||||||||||
Arkoma Woodford | 61,461 | 13,288 | 99,158 | 33,568 | 160,619 | 46,856 | ||||||
Other | 138,437 | 95,093 | 584,215 | 382,377 | 722,652 | 477,470 | ||||||
Gulf Coast | 40,748 | 11,733 | 36,304 | 29,247 | 77,052 | 40,980 | ||||||
Total | 608,363 | 399,825 | 2,025,956 | 1,114,445 | 2,634,319 | 1,514,270 | ||||||
The following table sets forth the Commissionnumber of gross and net undeveloped acres as of December 31, 2008 that will expire over the next three years by region unless production is established within the spacing units covering the acreage prior to constant oilthe expiration dates:
| 2009 | 2010 | 2011 | ||||||||||
| Gross | Net | Gross | Net | Gross | Net | |||||||
Rockies: | ||||||||||||
Red River units | — | — | — | — | — | — | ||||||
Bakken field | ||||||||||||
Montana Bakken | 18,037 | 10,920 | 24,557 | 19,510 | 57,527 | 48,367 | ||||||
North Dakota Bakken | 156,404 | 83,394 | 137,899 | 59,424 | 224,552 | 79,934 | ||||||
Other | 49,311 | 20,334 | 37,656 | 20,141 | 56,662 | 41,995 | ||||||
Mid-Continent: | ||||||||||||
Arkoma Woodford | 49,015 | 17,005 | 23,808 | 8,801 | 15,225 | 6,811 | ||||||
Other | 24,848 | 18,009 | 207,604 | 113,643 | 236,500 | 157,324 | ||||||
Gulf Coast | 3,200 | 2,443 | 5 | 3 | 29,586 | 25,692 | ||||||
Total | 300,815 | 152,105 | 431,529 | 221,522 | 620,052 | 360,123 | ||||||
During the three years ended December 31, 2008, we drilled exploratory and gas prices, drilling and
operating expenses, capital expenditures, taxes and availability of funds. The
process of estimating oil and gas reserves in complex, requiring significant
decisions and assumptions in the evaluation of available geological,
geophysical, engineering and economic data for each reservoir. As a result, such
estimates are inherently imprecise. Actual future production, oil and gas
prices, revenues, taxes, development expenditures, operating expenses and
quantities of recoverable oil and gas reserves may vary substantially from those
estimated in the report. Any significant variance in these assumptions could
materially affect the estimated quantity and value of reserveswells as set forth in this
annual reportthe table below:
| 2008 | 2007 | 2006 | ||||||||||
| Gross | Net | Gross | Net | Gross | Net | |||||||
Exploratory wells: | ||||||||||||
Oil | 41 | 18.2 | 33 | 15.6 | 17 | 8.4 | ||||||
Natural gas | 73 | 19.5 | 79 | 13.1 | 25 | 4.9 | ||||||
Dry | 12 | 8.9 | 4 | 2.5 | 17 | 9.4 | ||||||
Total exploratory wells | 126 | 46.6 | 116 | 31.2 | 59 | 22.7 | ||||||
Development wells: | ||||||||||||
Oil | 153 | 89.3 | 92 | 69.5 | 83 | 57.0 | ||||||
Natural gas | 72 | 13.4 | 49 | 10.3 | 34 | 14.5 | ||||||
Dry | 8 | 3.2 | 5 | 1.1 | 7 | 4.3 | ||||||
Total development wells | 233 | 105.9 | 146 | 80.9 | 124 | 75.8 | ||||||
Total wells | 359 | 152.5 | 262 | 112.1 | 183 | 98.5 | ||||||
As of December 31, 2008, there were 117 gross (40 net) wells in the process of drilling, completing or waiting on Form 10-K. In addition, the Company's reserves maycompletion.
As of February 23, 2009, we operated 7 rigs on our properties. Our rig activity during 2009 will be subject
to downward or upward revision, based upon production history, results of future
explorationhighly dependent on oil and development, prevailing oil andnatural gas prices and other factors,
many of which are beyond the Company's control. The PV-10 of the Company's
proved oil and gas reserves does not necessarily represent theaccordingly our rig count may increase or decrease from current or fair
market value of such proved reserves, and the 10% discount rate required by the
Commission may not reflect current interest rates, the Company's cost of capital
or any risks associated with the development and production of the Company's
proved oil and gas reserves. At December 31, 2002, the estimated future net cash
flow of $1,304 million and PV-10 of $633.4 million attributable to the Company's
proved oil and gas reserves are based on prices in effect at the date ($29.04
per barrel ("Bbl") of oil and $3.33 per thousand cubic feet ("Mcf") of natural
gas), which may be materially different from actual future prices.
PROPERTY ACQUISITION RISKS
The Company's growth strategy includes the acquisition of oil and gas
properties.levels. There can be no assurance, however, that the Companyadditional rigs will be ableavailable to identifyus at an attractive acquisition opportunities, obtain financing for acquisitionscost. See “Risk Factors—The unavailability or high cost of additional drilling rigs, equipment, supplies, personnel and oilfield services could adversely affect our ability to execute our exploration and development plans within our budget and on satisfactory terms or successfully acquire identified targets. In addition,
no assurance cana timely basis.”
Summary of Oil and Natural Gas Properties and Projects
Throughout the following discussion, we discuss our budgeted number of wells and capital expenditures. While the discussion reflects our current intentions, we intend to manage 2009 capital expenditures to be given that the Company will be successfulinline with our cash flow from operations. Continued weakness in integration
acquired business into its existing operations,oil and such integration maynatural gas prices could cause us to curtail our actual capital expenditures. Conversely, an increase in commodity prices could result in unforeseen operational difficulties or require a disproportionate amountincreased capital expenditures.
Rocky Mountain Region
Our properties in the Rocky Mountain region represented 76% of management's attention. Future acquisitions may be financed throughour PV-10 as of December 31, 2008. During the incurrence of additional indebtedness to the extent permitted under the
Indenture or through the issuance of capital stock. Furthermore, there can be no
assurance that competition for acquisition opportunities in these industries
will not escalate, thereby increasing the cost to the Company or making further
acquisitions or causing the Company to refrain from making additional
acquisitions.
The Company is subject to risks that properties acquired by it will not
perform as expected and that the returnsthree months ended December 31, 2008, our average daily production from such properties was 24,536 net Bbls of oil and 17,041 net Mcf of natural gas. Our principal producing properties in this region are in the Red River units, the Bakken field and the Big Horn Basin.
Red River Units
Our Red River units represented 59.6% of our PV-10 in the Rocky Mountain region as of December 31, 2008 and 51% of our average daily Rocky Mountain region Boe production for the three months ended December 31, 2008. The eight units comprising the Red River units are located along the Cedar Creek Anticline in North Dakota, South Dakota and Montana and produce oil and natural gas from the Red River “B” formation, a thin, continuous, dolomite formation at depths of 8,000 to 9,500 feet. Our Red River units comprise a portion of the Cedar Hills field, listed by the Energy Information Administration in 2007 as the 6 th largest onshore, lower 48 field in the United States ranked by liquid proved reserves.
Cedar Hills Units. The Cedar Hills North unit (“CHNU”) is located in Bowman and Slope Counties, North Dakota. We drilled the initial horizontal well in the CHNU, the Ponderosa 1-15, in April 1995. As of December 31, 2008, we had drilled 225 horizontal wells within this 49,700-acre unit, with 128 producing wellbores and the remainder serving as injection wellbores. We operate and own a 98% working interest in the CHNU.
The Cedar Hills West unit (“CHWU”), in Fallon County, Montana, is contiguous to the northern portion of CHNU. As of December 31, 2008, this 7,800-acre unit contained eleven horizontal producing wells and six horizontal injection wells. We operate and own a 100% working interest in the CHWU.
In January 2003, we commenced enhanced recovery in the two Cedar Hills units, with HPAI used throughout most of the area and water injected generally along the boundary of the CHNU. Under HPAI, compressed air injected into a reservoir oxidizes residual oil and produces flue gases (primarily carbon dioxide and nitrogen) that mobilize and sweep the crude oil into producing wellbores. In response to the HPAI, water injection and increased density drilling operations, production from the Cedar Hills units increased to 11,451 net Boe per day in December 2008 from 2,185 net Boe per day in November 2003. As of December 31, 2008, the average density in the Cedar Hill units was approximately one producing wellbore per 420 acres. We currently plan to drill 4 new horizontal wellbores and 2 horizontal extensions of existing wellbores in the Cedar Hills units during 2009, increasing the density of both the producing and injection wellbores. The reduced distance between wells allows part of the field to be converted from air injection to water injection. This conversion began in 2008 and is forecast to lower operating expenses, as water is less costly to inject than air. In 2009, we plan to invest approximately $41.3 million drilling and improving facilities in the Cedar Hills units. This expenditure is lower than previously forecast due to the elimination of 25 gross wells from the increased density development program. This adjustment to the plan is a result of reduced commodity prices. The peak rate for the field will be reduced but we expect no reduction in ultimate reserves.
On August 22, 2007 the Hiland Partners, LP (“Hiland”) Badlands gas plant became operational for the processing and treatment of gas produced from the CHNU, CHWU and Medicine Pole Hills Unit. Under the terms of the November 8, 2005 contract we deliver low pressure gas to Hiland for compression, treatment and processing. Nitrogen and carbon dioxide must be removed from the gas production associated with oil production from the units for the gas production to be marketable. We pay $0.60 per Mcf in gathering and treating fees, and 50% of the electrical costs attributable to compression and plant operation and receive 50% of the proceeds from residue gas and plant product sales. After we deliver 36 Bcf of gas, the $0.60 per Mcf gathering and treating fee is eliminated. During December 2008, we sold 7,800 net Mcf of natural gas per day from the Cedar Hills Units.
Medicine Pole Hills Units. The Medicine Pole Hills units (“MPHU”) are approximately five miles east of the southern portion of the CHNU. We acquired the Medicine Pole Hills unit in 1995. At that time, the 9,600-
acre unit consisted of 18 vertical producing wellbores and four injection wellbores under HPAI producing 525 net Bbls of oil per day. We have since drilled 47 horizontal wellbores extending production to the west with the formation of the 15,000-acre Medicine Pole Hills West unit and to the south, with the 11,500-acre Medicine Pole Hills South unit. All three units are under HPAI. We operate and own an average 77% working interest in the three units. Production from the units averaged 1,391 net Bbls of oil and 178 net Mcf of natural gas per day during December 2008. During 2008 we drilled 7 new horizontal wellbores, 2 horizontal extensions of existing wellbores, and 2 horizontal re-entries of vertical wellbores, increasing the density of both producing and injection wellbores. We believe these operations will increase production and sweep efficiency. In 2009, we plan to invest approximately $3.4 million for capital workover and facilities in MPHU.
Buffalo Red River Units. Three contiguous Buffalo Red River units (Buffalo, West Buffalo and South Buffalo) are located in Harding County, South Dakota, approximately 21 miles south of the MPHU. When we purchased the units in 1995, there were 73 vertical producing wellbores and 38 injection wellbores under HPAI producing approximately 1,906 net Bbls of oil per day. We operate and own an average working interest of 95% in the 32,900 acres comprising the three units. From 2005 through 2008, we re-entered 48 existing vertical wells and drilled horizontal laterals to increase production and sweep efficiency from the three units. Production for the month of December 2008 was 1,670 net Bbls of oil per day compared to an average of 1,162 net Bbls of oil per day for the first half of 2005. In 2009, we plan to invest $0.7 million for capital workover and facilities in the Buffalo Red River units.
Bakken Field
We control one of the largest acreage positions in the Bakken field of Montana and North Dakota with approximately 1,155,000 gross (581,000 net) acres as of December 31, 2008. Approximately 17% of the net acreage is producing and 83% of the net acreage is undeveloped as of December 31, 2008. Our properties within the Bakken field in Montana and North Dakota represented 35% of our PV-10 in the Rocky Mountain region as of December 31, 2008 and 39% of our average daily Rocky Mountain region Boe production for the three months ended December 31, 2008. As of December 31, 2008 we had completed 308 gross (148.5 net) wells in the Bakken field.
The Bakken formation or “Bakken Shale”, as it is often called, is one of the most actively drilled unconventional oil resource plays in the United States with approximately 83 rigs drilling in the play as of December 31, 2008, including 76 in North Dakota and seven in Montana. A report issued by the United States Geologic Survey (“USGS”) in April 2008 estimates that the Bakken Shale contains up to 4.3 billion barrels of recoverable oil using today’s technology and classifies it as the largest continuous oil accumulation ever assessed by the USGS.
The Bakken formation is a Devonian-age shale found within the Williston Basin underlying portions of North Dakota and Montana that contains three lithologic members including the upper shale, middle member and lower shale that combined range up to 130 feet thick. The upper and lower shales are highly organic, thermally mature and over pressured and act as both a source and reservoir for the oil. The middle member, which varies in composition from a silty dolomite to shalely limestone or sand, also serves as a reservoir and is thought to be a critical component for commercial production. The Three Forks/Sanish formation found immediately under the Lower Bakken Shale has also proven to contain productive reservoir rock that may add incremental reserves to the play. The Three Forks/Sanish typically consists of interbedded dolomites and shale with local development of a discontinuous sandy member at the top, known as the Sanish sand. All of these reservoir rocks have low porosity and permeability and depend on natural fracturing and artificial fracture stimulation to produce economically. Horizontal drilling and multi-stage fracture stimulation technology has enabled commercial production from this historically non-commercial reservoir. Generally, the Bakken formation is found at vertical depths of 9,000 to 10,500 feet and drilled horizontally on 320, 640 or 1,280-acre spacing with single, dual or triple leg horizontal laterals extending 4,500 to 9,000 feet into the formation. These wells are fracture stimulated to maximize recovery and economic returns. The fracture stimulation techniques vary but most commonly utilize multi-stage mechanically diverted stimulations using un-cemented liners and packers.
Montana Bakken. Our Montana Bakken production is located in the Elm Coulee field in Richland County, Montana. The Elm Coulee field is listed by the Energy Information Administration as the 16th largest onshore, lower 48 field in the United States ranked by liquid proved reserves. Since drilling our first well in August 2003, we have completed a total of 156 gross (100.2 net) wells in the field as of December 31, 2008. Our daily average production from these wells was approximately 5,727 net Bbls of oil and 3,944 net Mcf of natural gas during the month of December 2008. The field has been developed exclusively with horizontal drilling and has been substantially drilled on 640-acre spacing. During 2008, we began to further develop our acreage in the field on 320 acre spacing and have identified 57 undrilled 320 acre infield locations on our acreage as of December 31, 2008. Out of the 22 gross (16.2 net) wells we drilled in the field during 2008, 12 gross (10.3 net) were 320 acre infield wells. These wells are performing in line with our expected reserve model of 279 MBoe per well.
In December 2008 we also began operations on a one well secondary recovery pilot project to evaluate the potential to increase oil recovery from the Bakken reservoir utilizing CO2 injection. Laboratory tests indicate this technique is feasible and could increase oil recovery from the Bakken reservoir. Using a technique known as the huff and puff method, we began injecting CO2 in January 2009 and expect to complete the injection phase by March 2009. After allowing the CO2 to soak into the reservoir for approximately 30 days, we will flow the CO2 and associated fluids back from the well. Production from the well will be measured and the performance will be analyzed to assess the incremental recovery and economics of the technique.
As of December 31, 2008, we held 131,422 gross (101,010 net) undeveloped acres in the Montana Bakken play within and adjacent to the Elm Coulee field. We have recently suspended drilling in the Montana Bakken due to weakness in oil and natural gas prices and will resume drilling as prices improve.
North Dakota Bakken.Our 2008 drilling program significantly expanded the proven extents of our North Dakota Bakken acreage along the Nesson anticline. During the year we completed 98 gross (27.2 net) wells and exited 2008 producing at an average daily rate of 5,081net Bbls of oil during the month of December 31, 2008, a 276% increase over the same period in 2007 and 1,744 net Mcf of natural gas during the month of December 2008, an increase of 113% over the same period in 2007.
During the year we drilled almost exclusively 1,280-acre spaced, long single leg laterals, up to 9,000 feet long and fracture stimulated these wells with up to 14 mechanically diverted stages using un-cemented liners and packers. We found this technique provided better wellbore integrity and on average delivered higher initial flow rates. Of significance, we completed 27 gross (10.3 net) Three Forks/Sanish wells during 2008. The Three Forks/Sanish formation which lies immediately below the lower Bakken shale is known to be productive locally throughout the Williston Basin and may add incremental reserves to the Bakken play. Our Three Forks/Sanish completions were strategically located throughout our acreage along the Nesson anticline over a distance of approximately 100 miles north to south. The success of these Three Forks/Sanish wells demonstrates the widespread productive potential of the Three Forks/Sanish reservoir underlying our acreage. Although the results in themselves do not supportdemonstrate the indebtedness incurredThree Forks/Sanish formation adds incremental reserves to the Bakken play, it is notable that the 20 gross (8.9 net) Three Forks/Sanish completions we operated in 2008 had an average initial production rate of 640 gross Boe per day which is 17% higher than our average operated Middle Bakken completion in 2008.
As of December 31, 2008, we held 865,000 gross (378,000 net) undeveloped acres in the North Dakota Bakken field. As of February 23, 2009, we had 10 rigs drilling in the North Dakota Bakken field, including 4 operated by Continental Resources, Inc, and 6 operated by ConocoPhillips through a joint-venture. We plan to invest $71 million drilling 86 gross (20.2 net) wells in the North Dakota Bakken field during 2009.
Big Horn Basin and Other Rockies
Our wells within the Big Horn Basin in northern Wyoming and other areas within the Rocky Mountain region represented 5% of our PV-10 in the Rocky Mountain Region as of December 31, 2008 and 9% of our average daily Rocky Mountain Region Boe production for the three months ended December 31, 2008. During the three months ended December 31, 2008, we produced an average of 1,794 net Bbls of oil and 4,280 net Mcf of natural gas per day from our wells in the Big Horn Basin and other areas within the Rocky Mountain region.
Our principal property in the Big Horn Basin, the Worland field, produces primarily from the Phosphoria formation. We also have several other ongoing projects in the Rockies including conventional 3D defined Red River and Lodgepole structures in North Dakota and Montana, horizontal Fryburg opportunities in North Dakota and the Lewis Shale and Fort Union in Wyoming.
Conventional Red River.The Red River is a well known conventional producing oil and gas reservoir throughout the Williston Basin of North Dakota and Montana. The production can be quite prolific with individual Red River wells producing up to 1.5 million barrels of oil but the productive reservoir is generally confined to structural closures and structural-stratigraphic traps of 320 acres to 640 acres in size. The potential exists to find this type of conventional Red River production underlying any portion of our Bakken acreage in North Dakota and Montana. To identify these Red River traps generally requires 3D seismic. We own or have under license 964 square miles of 3D seismic over portions of our acreage in Montana and North Dakota. As of December 31, 2008 we had interpreted approximately 8% of this data using our proprietary processing techniques and have identified 9 undrilled potential locations. In 2008, we drilled and completed 6 gross (3.1 net) vertical Red River wells with 4 gross (2.2 net) wells completed as producers for a 71% success rate. During 2009, we plan to continue re-processing and evaluating our 3D seismic to identify new potential drilling locations.
Mid-Continent and Gulf Coast Region
Our properties in the other consideration usedMid-Continent and Gulf Coast region represented 24% of our PV-10 as of December 31, 2008. During the three months ended December 31, 2008, our average daily production from such properties was 2,321 net Bbls of oil and 37,922 net Mcf of natural gas. Our principal producing properties in this region are located in the Anadarko and Arkoma Basins of Oklahoma, the Michigan Basin and the Illinois Basin.
Arkoma Woodford
The Arkoma Woodford play in Atoka, Coal, Hughes and Pittsburg Counties, Oklahoma has matured into one of the more active unconventional gas resource plays in the United States with 36 rigs drilling in the play industry wide as of December 31, 2008. We owned approximately 161,000 gross (47,000 net) acres in the Woodford play as of December 31, 2008. Since drilling our first well in February, 2006, we have completed a total of 259 gross (41.4 net) horizontal Woodford wells through December 31, 2008. These Arkoma Woodford wells represent 52% of the PV-10 in the Mid-Continent Region as of December 31, 2008 and 41% of our average daily Mid-Continent Region equivalent production for the three months ended December 31, 2008. During 2008, production from our Arkoma Woodford wells grew 213% from an average of 8,428 Mcf of natural gas equivalent per day during December 2007 to acquire, or26,380 Mcf of natural gas equivalent per day in December 2008.
We completed 115 gross (23.3 net) Woodford wells during 2008. This drilling consisted of a combination of exploratory, step-out and development drilling designed to secure acreage and delineate areas of economic production for further development. Of significance, we expanded the capital expenditures neededknown extents of commercial production to the western extents of our Ashland AMI and south into our Big Mac Prospect. We also completed our first well in the East McAlester area. As of December 31, 2008, approximately 72% of our net acreage remained undeveloped.
During the year ended December 31, 2008, we began to develop the properties.field on various densities including 320, 160 and 80-acre spacing, to determine the optimum spacing for development. Results indicated that 80-acre development is economically feasible on much of our acreage. We also began simul-fracing wells when possible to more effectively stimulate and produce the Woodford shale while causing minimal disruption to existing production. We also reduced our average cost per lateral foot drilled by 20% compared to 2007 through improved mud systems, bit selections and operational efficiencies. We also successfully demonstrated that we can drill and complete wells across faults that previously limited the length of lateral drilled. To guide our drilling we acquired 49 square miles of 3-D seismic data during the year bringing the total of 3D seismic we own or have under license to 93 square miles.
We plan to invest approximately $56.0 million drilling 63 gross (8.0 net) horizontal wells in the Arkoma Woodford during 2009. We currently have one operated rig drilling in the play and are in the process of acquiring 53 square miles of 3-D seismic to guide future drilling on our East McAlester acreage.
Anadarko Basin
Our properties within the Anadarko Basin represented 27% of our PV-10 in the Mid-Continent Region as of December 31, 2008 and 40% of our average daily Mid-Continent Region equivalent production for the three months ended December 31, 2008. Our wells within the Anadarko Basin produce from a variety of sands and carbonates in both stratigraphic and structural traps. During the year we drilled 19 gross (11.5 net) wells with a 90% gross (84% net) success rate. In addition, expansion2009, we plan to invest approximately $23.0 million in the drilling of 18 gross (5.0 net) wells in the Anadarko Basin.
Anadarko Woodford. We owned 189,246 gross (117,665 net) acres in the emerging Anadarko Woodford shale play of western Oklahoma as of December 31, 2008. This includes 144,000 gross (93,000 net) undeveloped acres acquired in 2008 and 44,923 gross (24,586 net) acres held by production. Our acreage is strategically positioned within the window of thermal maturation for natural gas along the eastern flank of the Company's operations may placeAnadarko basin extending across portions of Grady, Canadian, Blaine, Custer and Dewey Counties of Oklahoma. The Woodford shale underlying this acreage ranges from 75 to 250 feet thick and occurs at depth ranging from 10,000 to 15,000 feet. Industry peers began drilling and completing horizontal Woodford shale wells in Canadian County, Oklahoma in August of 2007 and as of December 31, 2008 there were 17 rigs drilling in the play. Results announced by various operators in the play have been encouraging, with initial daily production rates of up to 8,300 Mcf of natural gas equivalent per well. Based on our economic model, we expect to recover approximately 5 Bcf to 7 Bcf per well. During 2008 we drilled 2 gross (1.9 net) horizontal Woodford wells and both are currently in the process of being completed.
Anadarko Atoka.We owned 44,938 gross (27,566 net) acres in the emerging Anadarko Atoka Shale play of Western Oklahoma and the Panhandle of Texas as of December 31, 2008. Our acreage is focused in Ellis County, Oklahoma and Lipscomb County, Texas and strategically located along trend with the development of the Novi Lime formation. The Novi Lime formation is important as it serves as both reservoir and drilling conduit for the horizontal wellbore through which the surrounding natural gas charged Atoka shales can be fracture stimulated and produced. The Atoka shales range from 75 feet to 125 feet thick and are present throughout our properties. Public records show as of February 23, 2009, 37 horizontal Atoka wells have been completed by industry peers with initial production rates of up to 7,500 Mcf of natural gas per day. During 2008, we drilled 2 gross (2 net) horizontal Atoka wells. The first well, the Shrewder 1-22H (100% WI) completed flowing 1,297 Mcf of natural gas per day from a significant strainshort, 1,300 foot, horizontal lateral. The second well, the Jones Trust 1-168H (100% WI) was recently fracture stimulated and currently flow testing at a rate of approximately 700 Mcf of natural gas per day.
Illinois Basin
Our properties within the Illinois Basin represented 20.6% of the PV-10 in the Mid-Continent Region as of December 31, 2008 and 4.9% of our average daily Mid-Continent Region Boe production for the three months ended December 31, 2008. We drilled 19 gross (17 net) wells during 2008 developing fields and expanding our reserve base in the Illinois Basin. Our production within the Illinois Basin is primarily crude oil from units comprised of shallow sand formations under water injection.
Michigan Trenton-Black River
Our Trenton-Black River project in and around Hillsdale County, Michigan continues to produce excellent results guided by our proprietary 3-D seismic techniques. As of December 31, 2008, we had completed 7 gross (5.8 net) operated wells in the play with 6 gross (4.9 net) of the wells completed as Trenton-Black River producers and 1 gross (1 net) well temporarily abandoned. These 6 producing wells were assigned average estimated recoverable reserves of 490 MBoe per well. Combined, these wells were producing an average of 550 gross barrels of oil per day during the month of December 31, 2008. Three of the wells are capable of flowing in excess of the 200 barrels of oil per day allowable set by the Michigan Department of Environmental Quality and 3 are restricted by natural gas flaring restrictions which will be removed once the wells are connected to a natural gas pipeline. A natural gas gathering pipeline has been installed and processing facilities are under construction to enable these flare restricted wells to produce up to the 200 barrels of oil per day allowable rate.
We owned approximately 65,418 gross (52,110 net) acres in the play and have shot, processed and interpreted approximately 40 square mile of 3-D seismic on the Company's
management, financialacreage as of December 31, 2008. During 2008, we completed the acquisition of 20 square miles of 3-D seismic on our Chicago/Norad project. Interpretation of the seismic data identified up to 14 potential drilling locations. Four of these locations have been selected and permitted for drilling. We plan to acquire another 6.5 square miles of additional 3D seismic data during 2009.
Gulf Coast
During the three months ended December 31, 2008, our average daily production from our Gulf Coast properties was 225 net Bbls of oil and 2,341 net Mcf of natural gas. Our principal producing properties in this region are located in South Texas and Louisiana.
The following table sets forth summary information concerning our production results, average sales prices and production costs for the years ended December 31, 2008, 2007 and 2006:
| Year Ended December 31, | |||||||||
| 2008 | 2007 | 2006 | |||||||
Net production volumes: | |||||||||
Oil (MBbls)(1) | 9,147 | 8,699 | 7,480 | ||||||
Natural gas (MMcf) | 17,151 | 11,534 | 9,225 | ||||||
Oil equivalents (MBoe) | 12,006 | 10,621 | 9,018 | ||||||
Average prices(1): | |||||||||
Oil ($/Bbl) | $ | 88.87 | $ | 63.55 | $ | 55.30 | |||
Natural gas ($/Mcf) | 6.90 | 5.87 | 6.08 | ||||||
Oil equivalents ($/Boe) | 77.66 | 58.31 | 52.09 | ||||||
Costs and expenses(1): | |||||||||
Production expense ($/Boe) | $ | 8.40 | $ | 7.35 | $ | 6.99 | |||
Production tax ($/Boe) | 4.84 | 3.13 | 2.48 | ||||||
General and administrative expense ($/Boe) | 2.95 | 3.15 | 3.45 | ||||||
DD&A expense ($/Boe) | 12.30 | 9.00 | 7.27 | ||||||
| (1) | Oil sales volumes were 97 MBbls more than production volumes for the year ended December 31, 2008 due to the sale of temporarily stored barrels. Oil sales volumes were 221 MBbls and 21 MBbls less than oil production volumes for the years ended December 31, 2007 and 2006, respectively, due to temporary storage and pipeline line fill. Average prices and per unit costs have been calculated using sales volumes. |
The following table sets forth information regarding our average daily production during the fourth quarter of 2008:
| Fourth Quarter 2008 | ||||||
| Oil (Bbls) | Gas (Mcf) | Total (Boe) | ||||
Rockies: | ||||||
Red River units | 12,860 | 7,187 | 14,058 | |||
Bakken field | ||||||
Montana Bakken | 5,697 | 4,278 | 6,410 | |||
North Dakota Bakken | 4,185 | 1,296 | 4,401 | |||
Other | 1,794 | 4,280 | 2,507 | |||
Mid-Continent: | ||||||
Arkoma Woodford | 50 | 19,353 | 3,276 | |||
Other | 2,046 | 16,228 | 4,751 | |||
Gulf Coast | 225 | 2,341 | 615 | |||
Total | 26,857 | 54,963 | 36,018 | |||
The following table presents the total gross and net productive wells by region and by oil or gas completion as of December 31, 2008:
| Oil Wells | Natural Gas Wells | Total Wells | ||||||||||
| Gross | Net | Gross | Net | Gross | Net | |||||||
Rockies: | ||||||||||||
Red River units | 265 | 240 | 2 | 2 | 267 | 242 | ||||||
Bakken field | ||||||||||||
Montana Bakken | 151 | 98 | 3 | 2 | 154 | 100 | ||||||
North Dakota Bakken | 144 | 46 | 5 | 1 | 149 | 47 | ||||||
Other | 305 | 271 | 6 | 2 | 311 | 273 | ||||||
Mid-Continent: | ||||||||||||
Arkoma Woodford | — | — | 259 | 41 | 259 | 41 | ||||||
Other | 777 | 622 | 243 | 131 | 1,020 | 753 | ||||||
Gulf Coast | 5 | 4 | 27 | 13 | 32 | 17 | ||||||
Total | 1,647 | 1,281 | 545 | 192 | 2,192 | 1,473 | ||||||
Gross wells are the number of wells in which a working interest is owned and net wells are the total of our fractional working interests owned in gross wells. As of December 31, 2008, we owned interests in no wells containing multiple completions.
As is customary in the oil and gas industry, we initially conduct only a cursory review of the title to our properties on which we do not have proved reserves. Prior to the commencement of drilling operations on those properties, we endeavor to conduct a thorough title examination and perform curative work with respect to significant defects. To the extent title opinions or other investigations reflect title defects on those properties; we are typically responsible for curing any title defects at our expense. We generally will not commence drilling operations on a property until we have cured any material title defects on such property. We have obtained title opinions on substantially all of our producing properties and believe that we have satisfactory title to our producing properties in accordance with standards generally accepted in the oil and gas industry. Prior to completing an acquisition of producing oil and natural gas leases, we perform title reviews on the most significant leases and, depending on the materiality of properties, we may obtain a title opinion or review previously obtained title opinions. Our oil and natural gas properties are subject to customary royalty and other resources. The Company's abilityinterests, liens to manage
future growth will depend upon its ability to monitor operations, maintain
effective costsecure borrowings under our revolving credit facility, liens for current taxes and other controlsburdens which we believe do not materially interfere with the use or affect our carrying value of the properties.
Marketing and significantly expandMajor Customers
We primarily sell our oil production to end users at major market centers. Other production is sold to select midstream marketing companies or oil refining companies at the Company's
internal management, technicallease. We have significant production directly connected to a pipeline gathering system, although the balance of our production is transported by truck. Where the oil that is directly marketed is transported by truck, the oil is delivered to the most practical point on a pipeline system for delivery to a sales point “downstream” on another connecting pipeline. Oil that is sold at the lease is delivered directly onto the purchasers’ truck and accounting systems, allthe sale is complete at that point.
During the fourth quarter of 2007 and various periods in 2008, we were unable to market some of our Rocky Mountain area crude at a price acceptable to us. This resulted in increases in our crude oil inventory at various times throughout the year. The prices we were offered were adversely affected by seasonal demand and by pipeline constraints. At various times during 2007 and 2008, we shipped some of our Rocky Mountain crude by railcar to help alleviate this situation and obtain more favorable prices. Our marketing of oil and natural gas can be affected by factors beyond our control, the effects of which will result
in higher operating expenses. Any failurecannot be accurately predicted. For a description of some of these factors, see “Risk factors—Market conditions or operational impediments may hinder our access to expendoil and natural gas markets or delay our production.”
For the year ended December 31, 2008, oil sales to Marathon Oil Company accounted for 44% of our total revenue. No other purchasers accounted for more than 10% of our total oil and gas sales. We believe that the loss of any of these areas and to implement
and improve such systems, procedures and controls in an efficient manner at a
pace consistent with the growth of the Company's business couldpurchasers would not have a material adverse effect on our operations, as there are a number of alternative crude oil purchasers in our producing regions.
We operate in a highly competitive environment for acquiring properties, marketing oil and natural gas and securing trained personnel. Our competitors vary within the Company's business,regions in which we operate, and some of our competitors may possess and employ financial, conditiontechnical and results of
operations. In addition, the integration of acquired properties with existing
operations will entail considerable expenses in advance of anticipated revenues
and may cause substantial fluctuationspersonnel resources substantially greater than ours, which can be particularly important in the Company's operating results. There
can be no assurance that the Company willareas in which we operate. Those companies may be able to successfully integrate the
properties acquired and to be acquired or any other businesses it may acquire.
SUBSTANTIAL CAPITAL REQUIREMENTS
The Company has made, and will continue to make, substantial capital
expenditures in connection with the acquisition, development, exploitation,
exploration and production of its oil and gas properties. Historically, the
Company has funded its capital expenditures through borrowings from banks and
from its principal stockholder, and cash flow from operations. Future cash flows
and the availability of credit are subject to a number of variables, such as the
level of production from existing wells, borrowing base determinations, prices
of oil and gas and the Company's success in locating and producing new oil and
gas reserves. If revenues were to decrease as a result of lower oil and gas
prices, decreased production or otherwise, and the Company had not availability
under its bank credit facility (the "Credit Facility") or other sources of
borrowings, the Company could have limited ability to replace its oil and gas
reserves or to maintain production at current levels, resulting in a decrease in
production and revenues over time. If the Company's cash flow from operations
and availability under the Credit Facility are not sufficient to satisfy its
capital expenditure requirements, there can be no assurance that additional debt
or equity financing will be available.
EFFECTS OF LEVERAGE
At December 31, 2002, on a consolidated basis, the Company and the
Subsidiary Guarantors (defined below) had $247.1 million in indebtedness
(including short-term indebtedness and current maturities of long-term
indebtedness) compared to the Company's stockholder's equity of $115.0 million.
Although the Company's cash flow from operations has been sufficient to meet its
debt service obligations in the past, there can be no assurance that the
Company's operating results will continue to be sufficientpay more for the Company to
meet its obligations. See "Selected Financial and Operating Data" and
"Management's Discussion and Analysis of Financial Condition and Results of
Operations--Liquidity and Capital Resources."
The degree to which the Company is leveraged could have important
consequences to the holders of the Notes. The potential consequences could
include:
o The Company's ability to obtain additional financing for acquisitions,
capital expenditures, working capital or general corporate purposes
may be impaired in the future;
o A substantial portion of the Company's cash flow from operations must
be dedicated to the payment of principal of and interest on the Notes
and the borrowings under the Credit Facility, thereby reducing funds
available to the Company for its operations and other purposes;
o Certain of the Company's borrowings are and will continue to be at
variable rates of interest, which expose the Company to the risk
increased interest rates;
o Indebtedness outstanding under the Credit Facility is senior in right
of payment to the Notes, is secured by substantially all of the
Company's proved reserves and certain other assets, and will mature
prior to the Notes; and
o The Company may be substantially more leveraged than certain of its
competitors, which may place it a relative competitive disadvantage
and make it more vulnerable to change market conditions and
regulations.
The Company's ability to make scheduled payments or to refinance its
obligations with respect to its indebtedness will depend on its financial and
operating performance, which, in turn, is subject to the volatility of oil and
gas prices, production levels, prevailing economic conditions and to certain
financial, business and other factors beyond its control. If the Company's cash
flow and capital resources are insufficient to fund its debt service
obligations, the Company may be forced to sell assets, obtain additional debt or
equity financing or restructure its debt. Even if additional financing could be
obtained, there can be no assurance that it would be on terms that are favorable
or acceptable to the Company. There can be no assurance that the Company's cash
flow and capital resources will be sufficient to pay its indebtedness in the
future. In the absence of such operating results and resources, the Company
could face substantial liquidity problems and might be required to dispose of
material assets or operations to meet debt service and other obligations, and
there can be no assurance as to the timing of such sales or the adequacy of the
proceeds that the Company could realize there from. See "Management's Discussion
and Analysis of Financial Condition and Results of Operations--Liquidity and
Capital Resources."
RESTRICTIVE COVENANTS
The Credit Facility and the Indenture governing the Notes include certain
covenants that, among other things restrict:
o The making of investments, loans and advances and the paying of
dividends and other restricted payments;
o The incurrence of additional indebtedness;
o The granting of liens, other that liens created pursuant to the Credit
Facility and certain permitted liens;
o Mergers, consolidations and sales of all or substantial part of the
Company's business or property;
o The hedging, forward sale or swap of crude oil or natural gas or other
commodities;
o The sale of assets; and
o The making of capital expenditures.
The Credit Facility requires the Company to maintain certain financial
ratios, including interest coverage and leverage ratios. All of these
restrictive covenants may restrict the Company's ability to expand or pursue its
business strategies. The ability of the Company to comply with these and other
provisions of the Credit Facility may be affected by changes in economic or
business conditions, results of operations or other events beyond the Company's
control. The breach of any of these covenants could result in a default under
the Credit Facility, in which case, depending on the actions taken by the
lenders there under or their successors or assignees, such lenders could elect
to declare all amounts borrowed under the Credit Facility, together with accrued
interest, to be due and payable, and the Company could be prohibited from making
payments with respect to the Notes until the default is cured or all senior debt
is paid or satisfied in full. If the Company were unable to repay such
borrowings, such lenders could proceed against their collateral. If the
indebtedness under the Credit Facility were to be accelerated, there can be no
assurance that the assets of the Company would be sufficient to repay in full
such indebtedness and the other indebtedness of the Company, including the
Notes.
OPERATING HAZARDS AND UNINSURED RISKS; PRODUCTION CURTAILMENTS
Oil and gas drilling activities are subject to numerous risks, many of
which are beyond the Company's control, including the risk that no commercially productive oil and natural gas reservoirs will be encountered. Theproperties and exploratory prospects and to evaluate, bid for and purchase a greater number of properties and prospects than our financial or personnel resources permit. In addition, shortages or the high cost of drilling completingrigs could delay or adversely affect our development and operating wells is often uncertain, and drilling operations may
be curtailed, delayed or canceled as a result of a variety of factors, including
unexpected drilling conditions, pressure irregularities in formations, equipment
failure or accidents, adverse weather conditions, title problems and shortages
or delays in the delivery of equipment. The Company's future drilling activities
may not be successful and, if unsuccessful, such failure will have an adverse
effect on future results of operations and financial condition.
The Company's properties may be susceptible to hydrocarbon drainage from
production by other operators on adjacent properties. Industry operating risks
include the risk of fire, explosions, blow-outs, pipe failure, abnormally
pressured formations and environmental hazards such as oil spills, gas leaks,
ruptures or discharges of toxic gases, the occurrence of any of which could
result in substantial losses to the Company due to injury or loss of life,
severe damage to or destruction of property, natural resources and equipment,
pollution or other environmental damage, clean-up responsibilities, regulatory
investigation and penalties and suspension ofexploration operations. In accordance with
customary industry practice, the Company maintains insurance against the risks
described above. There can be no assurance that any insurance will be adequate
to cover losses or liabilities. The Company cannot predict the continued
availability of insurance, or its availability at premium levels that justify
its purchase.
GAS GATHERING MARKETING
The Company's gas gathering and marketing operations depend in large part
on the ability of the Company to contract with third party producers to purchase
their gas, to obtain sufficient volumes of committed natural gas reserves, to
replace production from declining wells, to assess and respond to changing
market conditions in negotiating gas purchase and sale agreements and to obtain
satisfactory margins between the purchase price of its natural gas supply and
the sales price for such natural gas. In addition, the Company's operations are
subject to changes in regulations relating to gathering and marketing of oil and
gas. The inability of the Company to attract new sources of third party natural
gas or to promptly respond to changing market conditions or regulations in
connection with its gathering and marketing operations could have a material
adverse effect on the Company's financial condition and results of operations.
SUBORDINATION OF NOTES AND GUARANTEES
The Notes are subordinated in right of payment to all existing and future
senior debt (consisting of commitments under the Credit Facility) of the Company
and the Company's subsidiaries that have guaranteed payment of the Notes (the
"Subsidiary Guarantors") including borrowings under the Credit Facility. In the
event of bankruptcy, liquidation or reorganization of the Company or a
subsidiary Guarantor, the assets of the Company, or the Subsidiary Guarantors as
the case may be, will be available to pay obligations on the Notes only after
all Senior debt has been paid in full, and there may not be sufficient assets
remaining to pay amounts due on any or all of the Notes outstanding. The
aggregate principal amount of senior debt of the Company and the Subsidiary
Guarantors, on a consolidated basis, as of March 28, 2003, was $126.5 million.
The Subsidiary Guarantees are subordinated to the guarantor's senior debt to the
same extent and in the same manner as the Notes are subordinated to senior debt.
The Company or the Subsidiary Guarantors may incur additional senior debt from
time to time, subject to certain restrictions. In addition to being subordinated
to all existing and future senior debt of the Company, the Notes are not secured
by any of the Company's assets, unlike the borrowings under the Credit Facility.
POSSIBLE UNENFORCEABILITY OF SUBSIDIARY GUARANTEES; DEPENDENCE ON DISTRIBUTIONS
BY SUBSIDIARIES
The Company has derived approximately 29% of its operating cash flows from
its subsidiaries, Continental Gas and Continental Resources of Illinois, Inc.
The holders of the Notes have no direct claim against the Company's subsidiaries
other that a claim created by one or more of the Subsidiary Guarantees, which
may themselves be subject to legal challenge in a bankruptcy or reorganization
case or a lawsuit by or on behalf of creditors of a Subsidiary Guarantor. If
such a challenge were upheld, such Subsidiary Guarantees would be invalid and
unenforceable. To the extent that any of such Subsidiary Guarantees are not
enforceable, the rights of the holder of the Notes to participate in any
distribution of assets of any Subsidiary Guarantor upon liquidation, bankruptcy,
reorganization or otherwise will, as is that case with other unsecured creditors
of the Company, be subject to prior claims of creditors of that Subsidiary
Guarantor. The Company relies in part upon distributions from its subsidiaries
to generate the funds necessary to meet its obligations, including the payment
of principal and interest on the Notes. The Indenture contains covenants that
restrict the ability of the Company's subsidiaries to enter into any agreement
limiting distributions and transfers to the Company, including dividends.
However, the ability of the Company's subsidiaries to make distributions may be
restricted by among other things, applicable state corporate laws and other laws
and regulations or by terms of agreements of which they are or may become a
party. In addition, there can be no assurance that such distributions will be
adequate to fund the interest and principal payments on the Credit Facility and
the Notes when due.
REPURCHASE OF NOTES UPON A CHANGE OF CONTROL AND CERTAIN OTHER EVENTS
Upon a Change of Control (as defined in the Indenture), holders of the
Notes may have the right to require the Company to repurchase all Notes then
outstanding at a purchase price equal to 101% of the principal amount thereof,
plus accrued interest to the dates of repurchase. In the event of certain asset
dispositions, the Company will be required under certain circumstances to use
the Excess Cash (as defined in the Indenture) to offer to repurchase the Notes
at 100% of the principal amount thereof, plus accrued interest to the date of
repurchase (an "Excess Cash Offer").
The events that constitute a Change of Control or require an Excess Cash
Offer under the Indenture may also be events of default under the Credit
Facility or other senior debt of the Company until the Company's indebtedness
under the Credit Facility or other senior debt is paid in full. In addition,
such events may permit the lenders under such debt instruments to accelerate the
debt and, if the debt is not paid, to enforce security interests on
substantially all the assets of the Company and the Subsidiary Guarantors,
thereby limiting the Company's ability to raise cash to repurchase the Notes and
reducing the practical benefit of the offer to repurchase provisions to the
holders of the Notes. See "Management's Discussion and Analysis of Financial
Condition and Results of Operations--Liquidity and Capital Resources." There can
be no assurance that the Company will have sufficient funds available at the
time of any Change of Control or Excess Cash Offer to make any debt payment
(including repurchases of Notes) as described above. Any failure by the Company
to repurchase Notes tendered pursuant to a Change of Control offer or an Excess
Cash Offer will constitute an event of default under the Indenture.
RISK OF HEDGING
From time to time the Company may use energy swap and forward sale
arrangements to reduce its sensitivity to oil and gas price volatility. If the
Company's reserves are not produced at the rates estimated by the Company due to
inaccuracies in the reserve estimation process, operational difficulties or
regulatory limitations, or otherwise, the Company would be required to satisfy
its obligations under potentially unfavorable terms. Beginning January 1, 2001,
all derivatives must be marked to market under the provisions of statement of
Financial Accounting Standards No. 133, "Accounting for Derivatives" ("SFAS No.
133"). If the Company enters into qualifying derivative instruments for the
purpose of hedging prices and the derivative instruments are not perfectly
effective in hedging the underlying risk, all ineffectiveness will be recognized
currently in earnings. The effective portion of the gain or loss on qualifying
derivative instruments will be reported as other comprehensive income and
reclassified to earnings in the same period as the hedged production takes
place. Physical delivery contracts, which are deemed to be normal purchases or
normal sales, are not accounted for as derivatives. Further, under financial
instrument contracts, the Company may be at risk for basis differential, which
is the difference in the quoted financial price for contract settlement and the
actual physical point of delivery price. The Company will from time to time
attempt to mitigate basis differential risk by entering into physical basis swap
contracts. Substantial variations between the assumptions and estimates used by
the Company in the hedging activities and actual results, experienced could
materially adversely effect the Company's anticipated profit margins and its
ability to manage risk associated with fluctuations in oil and gas prices.
Furthermore, the fixed price sales and hedging contracts limit the benefits the
Company will realize if actual prices rise above the contract prices.
WRITE DOWN OF CARRYING VALUES
The Company periodically reviews the carrying value of its oil and gas
properties in accordance with SFAS No. 144 "Accounting for the Impairment or
Disposal of Long-Lived Assets". SFAS No. 144 requires that long-lived assets,
including proved oil and gas properties, and certain identifiable intangibles to
be held and used by the Company be reviewed for impairment whenever events or
changes in circumstances indicate that the carrying amount of the assets may not
be recoverable. In performing the review for recoverability, the Company
estimates the future cash flows expected to result from the use of the asset and
its eventual disposition. If the sum of the expected future cash flows
(undiscounted and without interest changes) is less that the carrying value of
the asset, an impairment loss is recognized in the form of additional
depreciation, depletion and amortization expense. Measurement of an impairment
loss for proved oil and gas properties is calculated on a property-by-property
basis as the excess of the net book value of the property over the projected
discounted future net cash flows of the impaired property, considering expected
reserve additions and price and cost escalations. The Company may be required to
write down the carrying value of its oil and gas properties when oil and gas
prices are depressed or unusually volatile, which would result in a charge to
earnings. Once incurred, a write down of oil and gas properties is not
reversible at a later date.
LAWS AND REGULATIONS; ENVIRONMENTAL RISK
Oil and gas operations are subject to various federal, state and local
governmental regulations that may be changed from time to time in response to
economic or political conditions. From time to time, regulatory agencies have
imposed price controls and limitations on production in order to conserve
supplies of oil and gas. In addition, the production, handling, storage,
transportation and disposal of oil and gas, by-products thereof and other
substances and materials produced or used in connection with oil and gas
operations are subject to regulation under federal, state and local laws and
regulations. See "Business--Regulations."
The Company is subject to a variety of federal, state and local
governmental regulations related to the storage, use, discharge and disposal of
toxic, volatile of otherwise hazardous materials. These regulations subject the
Company to increased operating costs and potential liability associated with the
use and disposal of hazardous materials. Although these laws and regulations
have not had a material adverse effect on the Company's financial condition or
results of operations, there can be no assurance that the Company will not be
required to make material expenditures in the future. If such laws and
regulations become increasingly stringent in the future, it could lead to
additional material costs for environmental compliance and remediation by the
Company.
The Company's twenty years of experience with the use of HPAI technology
has not resulted in any known environmental claims. The Company's saltwater
injection operations will pose certain risks of environmental liability to the
Company. Although the Company will monitor the injection process, any leakage
from the subsurface portions of the wells could cause degradation of fresh
ground water resources, potentially resulting in suspension of operation of the
wells, fine and penalties from governmental agencies, expenditures for
remediation of the affected resource, and liability to third parties for
property damages and personal injuries. In addition, the sale by the Company of
residual crude oil collected as part of the saltwater injection process could
impose a liability on the Company in the event the entity to which the oil was
transferred fails to manage the material in accordance with applicable
environmental health and safety laws.
Any failure by the Company to obtain required permits for, control the use
of, or adequately restrict the discharge of, hazardous substances under present
or future regulations could subject the Company to substantial liability or
could cause its operations to be suspended. Such liability or suspension of
operations could have a material adverse effect on the Company's business,
financial condition and results of operations.
COMPETITION
The oil and gas industry is highly competitive. The Company competes for
the acquisition of oil and gas properties, primarily on the basis of the price
to be paid for such properties, with numerous entities including major oil
companies, other independent oil and gas concerns and individual producers and
operators. Many of these competitors are large, well-established companies and
have financial and other resources substantially greater that those of the
Company. The Company'sOur ability to acquire additional oil and gas propertiesprospects and to discoverfind and develop reserves in the future will depend upon itson our ability to evaluate and select suitable properties and to consummate transactions in a highly competitive environment. CONTROLLING STOCKHOLDER
At March 28, 2003, Harold Hamm, the Company's principal stockholder,
President and Chief Executive Officer and a Director, beneficially owned
13,037,328 shares of Common Stock representing,Also, there is substantial competition for capital available for investment in the aggregate, approximately
91% of the outstanding common stock of the Company. The Harold Hamm DST Trust
and Harold Hamm HJ Trust together own the remaining 9.3% of Common Stock. An
independent third party is the trustee for both of these trusts and Harold Hamm
has no beneficial ownership in them. As a result, Mr. Hamm is in a position to
control the Company. The Company is provided oilfield services by several
affiliated companies controlled by the principal stockholder. Such transactions
will continue in the future and may result in conflicts of interest between the
Company and such affiliated companies. There can be no assurance that such
conflicts will be resolved in favor of the Company. If the principal stockholder
ceases to be an executive officer of the Company, such would constitute an event
of default under the Credit Facility, unless waived by the requisite percentage
of banks. See "ITEM 12. SECURITY OWNERSHIP OF CERTAIN BENEFICIAL OWNERS AND
MANAGEMENT" and "ITEM 13. CERTAIN RELATIONSHIPS AND RELATED TRANSACTIONS".
REGULATIONS
GENERAL. Various aspects of the Company's oil and gas operations are
subject to extensive and continually changing regulation, as legislation
affecting the oil and natural gas industryindustry.
Regulation of the Oil and Natural Gas Industry
Regulation of Transportation of Oil
Sales of crude oil, condensate and natural gas liquids are not currently regulated and are made at negotiated prices. Nevertheless, Congress could reenact price controls in the future.
Our sales of crude oil are affected by the availability, terms and cost of transportation. The transportation of oil in common carrier pipelines is under constant review for amendment or
expansion. Numerous departmentsalso subject to rate and agencies, both federal and state, are
authorized to statue to issue, and have issued, rules and regulations binding
upon the oil and gas industry and its individual members.
REGULATIONS OF SALES AND TRANSPORTATION OF NATURAL GAS.access regulation. The Federal Energy Regulatory Commission, (the "FERC")or the FERC, regulates interstate oil pipeline transportation rates under the Interstate Commerce Act. In general, interstate oil pipeline rates must be cost-based, although settlement rates agreed to by all shippers are permitted and market-based rates may be permitted in certain circumstances. Effective January 1, 1995, the FERC implemented regulations establishing an indexing system (based on inflation) for transportation rates for oil that allowed for an increase or decrease in the cost of transporting oil to the purchaser. Intrastate oil pipeline transportation rates are subject to regulation by state regulatory commissions. The basis for intrastate oil pipeline regulation, and the degree of regulatory oversight and scrutiny given to intrastate oil pipeline rates, varies from state to state. Insofar as effective interstate and intrastate rates are equally applicable to all comparable shippers, we believe that the regulation of oil transportation rates will not affect our operations in any way that is of material difference from those of our competitors who are similarly situated.
Further, interstate and intrastate common carrier oil pipelines must provide service on a non-discriminatory basis. Under this open access standard, common carriers must offer service to all similarly situated shippers requesting service on the same terms and under the same rates. When oil pipelines operate at full capacity, access is governed by prorating provisions set forth in the pipelines’ published tariffs. Accordingly, we believe that access to oil pipeline transportation services generally will be available to us to the same extent as to our similarly situated competitors.
Regulation of Transportation and Sales of Natural Gas
Historically, the transportation and sale offor resale of natural gas in interstate commerce pursuant tohave been regulated by agencies of the Natural Gas Act of
1938 andU.S. federal government, primarily the Natural Gas Policy Act of 1978.FERC. In the past, the federal government has regulated the prices at which oil andnatural gas could be sold. While sales by producers of natural gas and all sales of crude oil, condensate and natural gas
liquids can currently be made at uncontrolled market prices, Congress could reenact price controls in the future. The Company'sDeregulation of wellhead natural gas sales began with the enactment of the Natural Gas Policy Act and culminated in adoption of the Natural Gas Wellhead Decontrol Act which removed controls affecting wellhead sales of natural gas effective January 1, 1993.
FERC regulates interstate natural gas transportation rates and service conditions, which affects the marketing of natural gas that we produce, as well as the revenues we receive for sales of our natural gas. Since 1985, the FERC has endeavored to make natural gas transportation more accessible to natural gas buyers and sellers on an open and non-discriminatory basis. The FERC has stated that open access policies are affectednecessary to improve the competitive structure of the interstate natural gas pipeline industry and to create a regulatory framework that will put natural gas sellers into more direct contractual relations with natural gas buyers by, among other things, unbundling the availability, termssale of natural gas from the sale of transportation and coststorage services. Beginning in 1992, the FERC issued a series of transportation. The priceorders to implement its open access policies. As a result, the interstate pipelines’ traditional role as wholesalers of natural gas has been eliminated and terms forreplaced by a structure under which pipelines provide transportation and storage service on an open access basis to pipeline transportationothers who buy and sell natural gas. Although the FERC’s orders do not directly regulate natural gas producers, they are subjectintended to extensive regulation
and proposed regulation designed to increasefoster increased competition within all phases of the natural gas industry.
We cannot accurately predict whether the FERC’s actions will achieve the goal of increasing competition in markets in which our natural gas is sold. Additional proposals and proceedings that might affect the natural gas industry to remove various barriersare pending before the FERC and practices that historically limited
non-pipelinethe courts. The natural gas sellers, including producers, from effectively
competing with interstate pipelines for sales to local distribution companies
and large industrial and commercial customers and to establishindustry historically has been very heavily
regulated. Therefore, we cannot provide any assurance that the rates
interstate pipelines may charge for their services. Similarly, the Oklahoma
Corporation Commission and the Texas Railroad Commission have been reviewing
changes to their regulations governing transportation and gathering services
providedless stringent regulatory approach recently established by intrastate pipelines and gatherers. While the changes being
considered by these federal and state regulators would affect us only
indirectly, they are intended to further enhance competition in natural gas
markets. The Company cannot predict what further action the FERC or state
regulators will take on these matters; however, the Company doescontinue. However, we do not believe that any actionsaction taken will have an effectaffect us in a way that materially differentdiffers from the effect
onway it affects other natural gas producers.
The price at which we sell natural gas is not currently subject to federal rate regulation and, for the most part, is not subject to state regulation. However, with regard to our physical sales of these energy commodities, we are required to observe anti-market manipulation laws and related regulations enforced by the FERC and/or the Commodity Futures Trading Commission (“CFTC”). See below the discussion of “Other Federal Laws and Regulations Affecting Our Industry—Energy Policy Act of 2005.” Should we violate the anti-market manipulation laws and regulations, we could also be subject to related third party damage claims by, among others, sellers, royalty owners and taxing authorities. In addition, pursuant to Order 704, some of our operations may be required to annually report to FERC, starting May 1, 2009, information regarding natural gas sale transactions depending on the volume of natural gas transacted during the prior calendar year. See below the discussion of “Other Federal Laws and Regulations Affecting Our Industry—FERC Market Transparency Rules.”
Gathering service, which occurs upstream of jurisdictional transmission services, is regulated by the states onshore and in state waters. Although its policy is still in flux, FERC has reclassified certain jurisdictional transmission facilities as non-jurisdictional gathering facilities, which has the tendency to increase our costs of getting gas to point of sale locations. State regulation of natural gas gathering facilities generally include various safety, environmental and, in some circumstances, nondiscriminatory take requirements. Although such regulation has not generally been affirmatively applied by state agencies, natural gas gathering may receive greater regulatory scrutiny in the future.
Intrastate natural gas transportation is also subject to regulation by state regulatory agencies. The basis for intrastate regulation of natural gas transportation and the degree of regulatory oversight and scrutiny given to intrastate natural gas pipeline rates and services varies from state to state. Insofar as such regulation within a particular state will generally affect all intrastate natural gas shippers within the state on a comparable basis, we believe that the regulation of similarly situated intrastate natural gas transportation in any states in which we operate and ship natural gas on an intrastate basis will not affect our operations in any way that is of material difference from those of our competitors. Like the regulation of interstate transportation rates, the regulation of intrastate transportation rates affects the marketing of natural gas that we produce, as well as the revenues we receive for sales of our natural gas.
Regulation of Production
The production of oil and natural gas is subject to regulation under a wide range of local, state and federal statutes, rules, orders and regulations. Federal, state and local statutes and regulations require permits for drilling operations, drilling bonds and reports concerning operations. All of the states in which we own and operate properties have regulations governing conservation matters, including provisions for the unitization or pooling of oil and natural gas properties, the establishment of maximum allowable rates of production from oil and natural gas wells, the regulation of well spacing, and plugging and abandonment of wells. The effect of these regulations is to limit the amount of oil and natural gas that we can produce from our wells and to limit the number of wells or the locations at which we can drill, although we can apply for exceptions to such regulations or to have reductions in well spacing. Moreover, each state generally imposes a production or severance tax with respect to the production and sale of oil, natural gas and natural gas liquids within its jurisdiction.
The failure to comply with these rules and regulations can result in substantial penalties. Our competitors in the oil and natural gas industry are subject to the same regulatory requirements and restrictions that affect our operations.
Other Federal Laws and Regulations Affecting Our Industry
Energy Policy Act of 2005.On August 8, 2005, President Bush signed into law the Domenici-Barton Energy Policy Act of 2005 (“EP Act 2005”). The EP Act 2005 is a comprehensive compilation of tax incentives, authorized appropriations for grants and guaranteed loans, and significant changes to the statutory policy that affects all segments of the energy industry. Among other matters, EP Act 2005 amends the NGA to add an anti- market manipulation provision which makes it unlawful for any entity to engage in prohibited behavior to be prescribed by FERC, and furthermore provides FERC with additional civil penalty authority. The EP Act 2005 provides the FERC with the power to assess civil penalties of up to $1,000,000 per day for violations of the NGA and increases the FERC’s civil penalty authority under the NGPA from $5,000 per violation per day to $1,000,000 per violation per day. The civil penalty provisions are applicable to entities that engage in the sale of natural gas for resale in interstate commerce. On January 19, 2006, FERC issued Order No. 670, a rule implementing the anti-market manipulation provision of EP Act 2005, and subsequently denied rehearing. The rules make it unlawful to: (1) in connection with the purchase or sale of natural gas subject to the jurisdiction of FERC, or the purchase or sale of transportation services subject to the jurisdiction of FERC, for any entity, directly or indirectly, to use or employ any device, scheme or artifice to defraud; (2) to make any untrue statement of material fact or omit to make any such statement necessary to make the statements made not misleading; or (3) to engage in any act or practice that operates as a fraud or deceit upon any person. The new anti-market manipulation rule does not apply to activities that relate only to intrastate or other non-jurisdictional sales or gathering, but does apply to activities of gas pipelines and storage companies that provide interstate services, as well as otherwise non-jurisdictional entities to the extent the activities are conducted “in connection with” gas sales, purchases or transportation subject to FERC jurisdiction, which now includes the annual reporting requirements under Order 704. The anti-market manipulation rule and enhanced civil penalty authority reflect an expansion of FERC’s NGA enforcement authority.
FERC Market Transparency Rules.On December 26, 2007, FERC issued a final rule on the annual natural gas transaction reporting requirements, as amended by subsequent orders on rehearing (“Order 704”). Under Order 704, wholesale buyers and sellers of more than 2.2 million MMBtu of physical natural gas in the previous calendar year, including interstate and intrastate natural gas pipelines, natural gas gatherers, natural gas processors, natural gas marketers, and natural gas producers, are now required to report, on May 1 of each year beginning in 2009, aggregate volumes of natural gas purchased or sold at wholesale in the prior calendar year to the extent such transactions utilize, contribute to, or may contribute to the formation of price indices. It is the responsibility of the reporting entity to determine which individual transactions should be reported based on the guidance of Order 704. Order 704 also requires market participants to indicate whether they report prices to any index publishers, and if so, whether their reporting complies with whom the Company competes.
FERC’s policy statement on price reporting.
Additional proposals and proceedings that might affect the natural gas industry are pending before Congress, the FERC state commissions and the courts. TheWe cannot predict the ultimate impact of these or the above regulatory changes to our natural gas industry historically has been very heavily regulated;
therefore, there is no assuranceoperations. We do not believe that the less stringent regulatory approach
recently pursued by the FERC and Congress will continue.
OIL PRICE CONTROLS AND TRANSPORTATION RATES. The Company's sales of crude
oil, condensate and gas liquids are not currently regulated and are made at
market prices. The price the Company receives from the sale of these products
maywe would be affected by the cost of transporting the products to market.
ENVIRONMENTAL. The Company's oilany such FERC action materially differently than similarly situated competitors.
Environmental, Health and gasSafety Regulation
General. Our operations are subject to pervasivestringent and complex federal, state, local and localprovincial laws and regulations concerninggoverning environmental protection, health and safety, including the protection and preservationdischarge of materials into the environment (e.g., ambient air, and surface
and subsurface soils and waters), human health, worker safety, natural
resources, and wildlife.environment. These laws and regulations affect virtually every
aspectmay, among other things:
require the acquisition of various permits before drilling commences;
restrict the Company's oiltypes, quantities and gas operations, including its exploration for,
and production, storage, treatment, and transportationconcentration of hydrocarbons andvarious substances that can be released into the disposal of wastes generated in connection with those activities. These laws and
regulations increase the Company's costs of planning, designing, drilling,
installing, operating, and abandoning oil and gas wells and appurtenant
properties, such as gathering systems, pipelines, and storage, treatment and
salt water disposal facilities.
The Company has expended and will continue to expend significant financial
and managerial resources to comply with applicable environmental laws and
regulations, including permitting requirements. The Company's failure to comply
with these laws and regulations can subject it to substantial civil and criminal
penalties, claims for injury to persons and damage to properties and natural
resources, and clean up and other remedial obligations. Although the Company
believes that the operation of its properties generally complies with applicable
environmental laws and regulations, the risk of incurring substantial costs and
liabilities are inherent in the operation of oil and gas wells and appurtenant
properties. The Company could also be subject to liabilities related to the past
operations conducted by others at properties now owned by it, without regard to
any wrongful or negligent conduct by the Company.
The Company cannot predict what effect future environmental legislation and
regulation will have upon its oil and gas operations. The possible legislative
reclassification of certain wastes generatedenvironment in connection with oil and natural gas drilling, production and transportation activities;
limit or prohibit drilling activities on certain lands lying within wilderness, wetlands and other protected areas including areas containing endangered specie of plants and animals; and
require remedial measures to mitigate pollution from former and ongoing operations, such as "hazardous wastes"requirements to close pits and plug abandoned wells.
These laws and regulations may also restrict the rate of oil and natural gas production below the rate that would otherwise be possible. The regulatory burden on the oil and gas industry increases the cost of doing business in the industry and consequently affects profitability. Additionally, Congress and federal and state agencies frequently revise environmental, health and safety laws and regulations, and any changes that result in more stringent and costly waste handling, disposal, cleanup and remediation requirements for the oil and gas industry could have a significant impact on our operating costs.
Some of the Company's operating costs, as well as the oilexisting environmental, health and gas industry in general. The
cost of compliance with more stringent environmentalsafety laws and regulations to which our business operations are subject include, among others, (i) regulations by the EPA and various state agencies regarding approved methods of disposal for certain hazardous and nonhazardous wastes; (ii) the Comprehensive Environmental Response, Compensation, and Liability Act and analogous state laws that may require the removal of previously disposed wastes (including wastes disposed of or released by prior owners or operators), property contamination (including groundwater contamination), and remedial plugging operations to prevent future contamination; (iii) the Clean Air Act and comparable state and local requirements, which establish pollution control requirements with respect to air emissions from our operations; (iv) the Oil Pollution Act of 1990, which contains numerous requirements relating to the prevention of and response to oil spills into waters of the United States; (v) the Federal Water Pollution Control Act, or the more vigorous administrationClean Water Act, and enforcementanalogous state laws which impose restrictions and strict controls with respect to the discharge of thosepollutants, including oil and other substances generated by our operations, into waters of the United States or state waters; (vi) the Resource Conservation and Recovery Act, which is the principal federal statute governing the treatment, storage and disposal of hazardous wastes and comparable state law pertaining to the handling of solid and hazardous wastes; (vii) the Safe Drinking Water Act and analogous state laws which impose requirements relating to our underground injection activities; (viii) the National Environmental Policy Act, which requires federal agencies, including the Department of Interior, to evaluate major agency actions that have the potential to significantly impact the environment; (ix) the federal Occupational Safety and Health Act and comparable state statutes which require that we organize and/or disclose information about hazardous materials stored, used or produced in our operations and; (x) state regulations could resultand statutes governing the handling, treatment, storage and disposal of naturally occurring radioactive material.
We have incurred in materialthe past, and expect to incur in the future, capital and other expenditures by the Companyrelated to remove, acquire, modify,environmental compliance. Such expenditures, however, are included within our overall capital and install equipment, storeoperating budgets and dispose of waters, remediate facilities, employ
additional personnel, and implement systems to ensureare not separately itemized. Although we believe that our continued compliance with those laws
and regulations. These accumulative expenditures couldexisting requirements will not have a material adverse effect uponimpact on our financial condition and results of operations, we cannot assure you that the Company's profitability andpassage of more stringent laws or regulations in the future capital expenditures.
REGULATION OF OIL AND GAS EXPLORATION AND PRODUCTION. The Company's
explorationwill not have a negative impact on our financial position or results of operations.
As of December 31, 2008, we employed 394 people, including 209 employees in drilling and production, operations are subject to various types of regulation
at the federal, state58 in financial and local levels. Such regulations include requiring
permitsaccounting, 36 in land, 28 in exploration, 13 in reservoir engineering, 39 in administrative and drilling bonds for the drilling of wells, regulating the location of
wells, the method of drilling and casing wells, and the surface use and
restoration of properties upon which wells are drilled. Many states also have
statutes or regulations addressing conservation matters, including provisions
for the unitization or pooling of oil and gas properties, the establishment of
maximum rates of production from oil and gas wells and the regulation of
spacing, plugging and abandonment of such wells. Some state statutes limit the
rate at which oil and gas can be produced from the Company's properties.
EMPLOYEES
As of March 28, 2003, the Company employed 288 people, including 97
administrative personnel, 11 geoscientists, 14 engineers and 166 field
personnel. The Company'sin information technology. Our future success will depend partially on itsour ability to attract, retain and motivate qualified personnel. The Company isWe are not a party to any collective bargaining agreements and hashave not experienced any strikes or work stoppages. The Company considers itsWe consider our relations with its employeeour employees to be satisfactory. From time to time the Company utilizesWe utilize the services of independent contractors to perform various field and other services.
ITEM 2. PROPERTIES
On May 14, 2007, we completed our initial public offering. In conjunction therewith, we effected an 11 for 1 stock split by means of a stock dividend. All prior period share and per share information contained in this report have been retroactively restated to give effect to the stock split. On May 14, 2007, we amended our
certificate of incorporation to, among other things, increase the number of authorized preferred shares to 25 million and common shares to 500 million. Prior to completion of our initial public offering, we were a subchapter S corporation and income taxes were payable by our shareholders. In connection with the public offering, we converted to a subchapter C corporation and recorded a charge to earnings in the second quarter of 2007 of $198.4 million to recognize deferred taxes at May 14, 2007. Thereafter, we have provided for income taxes on income. SeeNotes to Consolidated Financial Statements—Note 1. Organization and Summary ofSignificant Accounting Policies—Pro forma information (unaudited) and Income taxes and Note 12. Shareholders’ Equity for a complete discussion of the accounting for the various transactions resulting from our initial public offering and of the pro forma information presented.
Our corporate internet web site is www.contres.com. Through the investor relations section of our website, we make available our annual report on Form 10-K, quarterly reports on Form 10-Q, current reports on Form 8-K, and all amendments to those reports as soon as reasonably practicable after the report is filed with or furnished to the Securities and Exchange Commission. For a current version of various corporate governance documents, including our Code of Ethics (as updated February 25, 2009), please see our website. Information contained at our website is not incorporated by reference into this report and you should not consider information contained at our website as part of this report.
We file periodic reports and proxy statements with the Securities and Exchange Commission (“SEC”). The Company'spublic may read and copy any materials we file with the SEC at the SEC’s Public Reference Room at 100 F Street N.E., Washington, D.C. 20549. The public may obtain information about the operation of the Public Reference Room by calling the SEC at 1-800-SEC-0330. We file our reports with the SEC electronically. The SEC maintains an Internet site that contains reports, proxy and information statements, and other information regarding issuers that file electronically with the SEC. The address of this site is http://www.sec.gov.
Our principal executive offices are located at 302 N. Independence, Enid, Oklahoma 73701, and our telephone number at that address is (580) 233-8955.
| Item 1A. | Risk Factors |
You should carefully consider each of the risks described below, together with all of the other information contained in this report, before deciding to invest in shares of our common stock. If any of the following risks develop into actual events, our business, financial condition or results of operations could be materially adversely affected, the trading price of your shares could decline and you may lose all or part of your investment.
Risks Relating to the Oil and Natural Gas Industry and Our Business
A substantial or extended decline in oil and natural gas prices may adversely affect our business, financial condition or results of operations and our ability to meet our capital expenditure obligations and financial commitments.
The price we receive for our oil and natural gas production heavily influences our revenue, profitability, access to capital and future rate of growth. Oil and natural gas are commodities and, therefore, their prices are subject to wide fluctuations in response to relatively minor changes in supply and demand. Historically, the markets for oil and natural gas have been volatile. These markets will likely continue to be volatile in the future. The prices we receive for our production, and the levels of our production, depend on numerous factors beyond our control. These factors include the following:
worldwide and regional economic conditions impacting the global supply and demand for oil and natural gas;
the actions of the Organization of Petroleum Exporting Countries, or OPEC;
the price and quantity of imports of foreign oil and natural gas;
political conditions in or affecting other oil-producing and natural gas-producing countries, including the current conflicts in the Middle East and conditions in South America and Russia;
the level of global oil and natural gas exploration and production;
the level of global oil and natural gas inventories;
localized supply and demand fundamentals and transportation availability;
weather conditions;
technological advances affecting energy consumption; and
the price and availability of alternative fuels.
Furthermore, the current worldwide financial and credit crisis has reduced the availability of liquidity and credit to fund the continuation and expansion of industrial business operations worldwide. The shortage of liquidity and credit combined with recent substantial losses in worldwide equity markets has lead to a worldwide economic recession. The slowdown in economic activity caused by such recession has reduced worldwide demand for energy and resulted in lower oil and natural gas prices. Oil prices declined from record high levels in early July 2008 of over $140 per Bbl to below $35 per Bbl in February 2009, while natural gas prices declined from over $13 per Mcf to approximately $4 per Mcf over the same period.
Lower oil and natural gas prices will reduce our cash flows and borrowing ability. For example, although our average realized price received for oil and natural gas was $77.66 per Boe for the year ended December 31, 2008, it was bolstered by record oil prices for the first half of the year. In the fourth quarter of 2008, our average realized price received for oil and natural gas declined to $38.80 per Boe. See -”Our exploration, development and exploitation projects require substantial capital expenditures. We may be unable to obtain needed capital or financing on satisfactory terms, which could lead to a decline in our oil and natural gas reserves.” Lower oil and natural gas prices may also reduce the amount of oil and natural gas that we can produce economically.
Substantial decreases in oil and natural gas prices would render uneconomic a significant portion of our exploration, development and exploitation projects. This may result in our having to make significant downward adjustments to our estimated proved reserves. As a result, a substantial or extended decline in oil or natural gas prices may materially and adversely affect our future business, financial condition, results of operations, liquidity or ability to finance planned capital expenditures.
In addition, because our producing properties are located in selected portions of
the Mid-Continent, Rocky Mountains and Gulf Coast regions. Through 1993, most of
the Company's activity and growth was focused in the Mid-Continent region. In
1993 the Company expanded its drilling and acquisition activities into the Rocky
Mountain and Gulf Coast regions seeking added opportunity for production and
reserve growth. The Rocky Mountain region was targeted for oil reserves with
good secondary recovery potential and therefore, long life reserves. The Gulf
Coast region was targeted for natural gas reserves with shorter reserve life but
high current cash flow. As of December 31, 2002, the Company's estimated net
proved reserves from all properties totaled 74.9 MMBoe with 83% of the reserves
located in the Rocky Mountains, 16% in the Mid-Continent and 1% in the Gulf
Coast regions. At December 31, 2002, 84% of the Company's net proved reserves
were oil and 16% were natural gas. The Company's oil reserves are confined
primarily to the Rocky Mountain region and its natural gas reserves are
primarily from the Mid-Continent and Gulf Coast regions. Approximately $66.8
million, or 63%, of the Company's projected $105.9 million capital expenditures
for 2003 are focused on expansion and development of its oil propertiesgeographically concentrated in the Rocky Mountain region, whilewe are vulnerable to fluctuations in pricing in that area. In particular, 76% of our production during the remaining $39.1 million,fourth quarter of 2008 was from the Rocky Mountain region. As a result of this concentration, we may be disproportionately exposed to the impact of regional supply and demand factors, transportation capacity constraints, curtailment of production or 37%, is focused
primarily oninterruption of transportation of oil produced from the wells in these areas. Such factors can cause significant fluctuation in our realized oil and natural gas prices. For example, the difference between the average NYMEX oil price and our average realized oil price for the year ended December 31, 2008 was $9.50 per Bbl, whereas the difference between the NYMEX oil price and our realized oil price for the year ended December 31, 2007 was $8.85 per Bbl.
Our exploration, development and exploitation projects require substantial capital expenditures. We may be unable to obtain needed capital or financing on satisfactory terms, which could lead to a decline in our oil and natural gas reserves.
The oil and natural gas industry is capital intensive. We make and expect to continue to make substantial capital expenditures in our business for the development, exploitation, production and acquisition of oil and natural gas reserves. Our cash flow used in investing activities was $930.8 million related to capital and exploration expenditures in 2008. Our budgeted capital expenditures for 2009 are expected to be approximately $275.0 million with $211.0 million allocated for drilling and completion operations. To date, these capital expenditures have been financed with cash generated by operations and through borrowings under our revolving credit facility. The actual amount and timing of our future capital expenditures may differ materially from our estimates as a result of, among other things, commodity prices, actual drilling results, the availability of drilling rigs and other services and equipment, and regulatory, technological and competitive developments. We expect to manage capital expenditures for 2009 to be inline with our cash flows from operations, and expect our capital expenditures during 2009 to be significantly lower than our 2008 capital expenditures due to our desire to cut back on spending due to the current economic crisis and steep drop in oil and natural gas prices. Continued weakness in commodity prices may result in a decrease in our actual capital expenditures. Conversely, a significant improvement in product prices could result in an increase in our capital expenditures. We intend to finance our future capital expenditures primarily through cash flow from operations and through borrowings under our revolving credit facility; however, our financing needs may require us to alter or increase our capitalization substantially through the issuance of debt or equity securities or the sale of assets. The issuance of additional debt may require that a portion of our cash flow from operations be used for the payment of interest and principal on our debt, thereby reducing our ability to use cash flow to fund working capital, capital expenditures and acquisitions. The issuance of additional equity securities could have a dilutive effect on the value of your common stock.
Our cash flow from operations and access to capital are subject to a number of variables, including:
our proved reserves;
the level of oil and natural gas we are able to produce from existing wells;
the prices at which our oil and natural gas are sold;
our ability to acquire, locate and produce new reserves; and
the ability of our banks to lend.
If our revenues or the borrowing base under our revolving credit facility decrease as a result of lower oil or natural gas prices, operating difficulties, declines in reserves or for any other reason, we may have limited ability
to obtain the capital necessary to sustain our operations at current levels. If additional capital is needed, we may not be able to obtain debt or equity financing. If cash generated by operations or cash available under our revolving credit facility is not sufficient to meet our capital requirements, the failure to obtain additional financing could result in a curtailment of our operations relating to development of our prospects, which in turn could lead to a decline in our oil and natural gas reserves, and could adversely affect our business, financial condition and results of operations.
Drilling for and producing oil and natural gas are high risk activities with many uncertainties that could adversely affect our business, financial condition or results of operations.
Our future financial condition and results of operations will depend on the success of our exploitation, exploration, development and production activities. Our oil and natural gas exploration and production activities are subject to numerous risks beyond our control, including the risk that drilling will not result in commercially viable oil or natural gas production. Our decisions to purchase, explore, develop or otherwise exploit prospects or properties will depend in part on the evaluation of data obtained through geophysical and geological analyses, production data and engineering studies, the results of which are often inconclusive or subject to varying interpretations. For a discussion of the uncertainty involved in these processes, see “—Reserve estimates depend on many assumptions that may turn out to be inaccurate. Any material inaccuracies in these reserve estimates or underlying assumptions will materially affect the quantities and present value of our reserves.” Our cost of drilling, completing and operating wells is often uncertain before drilling commences.
Further, many factors may curtail, delay or cancel our scheduled drilling projects, including the following:
delays imposed by or resulting from compliance with regulatory requirements;
pressure or irregularities in geological formations;
shortages of or delays in obtaining equipment and qualified personnel;
equipment failures or accidents;
adverse weather conditions, such as blizzards and ice storms;
reductions in oil and natural gas prices;
limited availability of financing at acceptable rates;
title problems; and
limitations in the Mid-Continent and Gulf Coast regions.
The following table provides information with respect to the Company's
net proved reservesmarket for its principal oil and natural gas.
Reserve estimates depend on many assumptions that may turn out to be inaccurate. Any material inaccuracies in these reserve estimates or underlying assumptions will materially affect the quantities and present value of our reserves.
The process of estimating oil and natural gas propertiesreserves is complex. It requires interpretations of available technical data and many assumptions, including assumptions relating to current and future economic conditions and commodity prices. Any significant inaccuracies in these interpretations or assumptions could materially affect our estimated quantities and present value of our reserves. See “Item 1. Business—Proved Reserves” for information about our estimated oil and natural gas reserves and the PV-10 and standardized measure of discounted future net cash flows as of December 31, 2002:
In order to prepare our estimates, we must project production rates and timing of development expenditures. We must also analyze available geological, geophysical, production and engineering data. The Company's Rocky Mountain propertiesextent, quality and reliability of this data can vary. The process also requires economic assumptions about matters such as oil and natural gas prices, drilling and operating expenses, capital expenditures, taxes and availability of funds.
Actual future production, oil and natural gas prices, revenues, taxes, development expenditures, operating expenses and quantities of recoverable oil and natural gas reserves will vary from our estimates. Any significant
variance could materially affect the estimated quantities and present value of our reserves. In addition, we may adjust estimates of proved reserves to reflect production history, results of exploration and development, prevailing oil and natural gas prices and other factors, many of which are located primarilybeyond our control.
You should not assume that the present value of future net revenues from our proved reserves is the current market value of our estimated oil and natural gas reserves. In accordance with SEC requirements, we generally base the estimated discounted future net cash flows from our proved reserves on prices and costs on the date of the estimate. Actual future prices and costs may differ materially from those used in the Williston Basinpresent value estimate. If oil prices decline by $1.00 per Bbl, then our PV-10 as of December 31, 2008 would decrease approximately $47 million. If natural gas prices decline by $0.10 per Mcf, then our PV-10 as of December 31, 2008 would decrease approximately $8 million.
Our use of enhanced recovery methods creates uncertainties that could adversely affect our results of operations and financial condition.
One of our business strategies is to commercially develop unconventional oil and natural gas resource plays using enhanced recovery technologies. For example, we inject water and high-pressure air into formations on some of our properties to increase the production of oil and natural gas. The additional production and reserves attributable to the use of these enhanced recovery methods are inherently difficult to predict. If our enhanced recovery programs do not allow for the extraction of oil and natural gas in the manner or to the extent that we anticipate, our future results of operations and financial condition could be materially adversely affected.
If oil and natural gas prices decrease, we may be required to take write-downs of the carrying values of our oil and natural gas properties.
Accounting rules require that we periodically review the carrying value of our oil and natural gas properties for possible impairment. Based on specific market factors and circumstances at the time of prospective impairment reviews, and the continuing evaluation of development plans, production data, economics and other factors, we may be required to write down the carrying value of our oil and natural gas properties. A write-down constitutes a non-cash charge to earnings. We may incur impairment charges in the future, which could have a material adverse effect on our results of operations for the periods in which such charges are taken.
Unless we replace our oil and natural gas reserves, our reserves and production will decline, which would adversely affect our cash flows and results of operations.
Unless we conduct successful development, exploitation and exploration activities or acquire properties containing proved reserves, our proved reserves will decline as those reserves are produced. Producing oil and natural gas reservoirs generally are characterized by declining production rates that vary depending upon reservoir characteristics and other factors. Our future oil and natural gas reserves and production, and therefore our cash flow and results of operations, are highly dependent on our success in efficiently developing and exploiting our current reserves and economically finding or acquiring additional recoverable reserves. We may not be able to develop, exploit, find or acquire sufficient additional reserves to replace our current and future production. If we are unable to replace our current and future production, the value of our reserves will decrease, and our business, financial condition and results of operations would be adversely affected.
The unavailability or high cost of additional drilling rigs, equipment, supplies, personnel and oilfield services could adversely affect our ability to execute our exploration and development plans within our budget and on a timely basis.
Shortages or the high cost of drilling rigs, equipment, supplies, personnel or oilfield services could delay or cause us to incur significant expenditures that are not provided for in our capital budget, which could have a material adverse effect on our business, financial condition or results of operations.
We may incur substantial losses and be subject to substantial liability claims as a result of our oil and natural gas operations. Additionally we may not be insured for, or our insurance may be inadequate to protect us against, these risks.
We are not insured against all risks. Losses and liabilities arising from uninsured and underinsured events could materially and adversely affect our business, financial condition or results of operations. Our oil and natural gas exploration and production activities are subject to all of the operating risks associated with drilling for and producing oil and natural gas, including the possibility of:
environmental hazards, such as uncontrollable flows of oil, natural gas, brine, well fluids, toxic gas or other pollution into the environment, including groundwater and shoreline contamination;
abnormally pressured formations;
mechanical difficulties, such as stuck oilfield drilling and service tools and casing collapse;
fires, explosions and ruptures of pipelines in connection with our high-pressure air injection operations;
personal injuries and death; and
natural disasters.
Any of these risks could adversely affect our ability to conduct operations or result in substantial losses to us as a result of:
injury or loss of life;
damage to and destruction of property, natural resources and equipment;
pollution and other environmental damage;
regulatory investigations and penalties;
suspension of our operations; and
repair and remediation costs.
We may elect not to obtain insurance if we believe that the cost of available insurance is excessive relative to the risks presented. In addition, pollution and environmental risks generally are not fully insurable. The occurrence of an event that is not fully covered by insurance could have a material adverse effect on our business, financial condition and results of operations.
Prospects that we decide to drill may not yield oil or natural gas in commercially viable quantities.
Prospects that we decide to drill that do not yield oil or natural gas in commercially viable quantities will adversely affect our results of operations and financial condition. In this report, we describe some of our current prospects and our plans to explore those prospects. Our prospects are in various stages of evaluation, ranging from a prospect which is ready to drill to a prospect that will require substantial additional seismic data processing and interpretation. There is no way to predict in advance of drilling and testing whether any particular prospect will yield oil or natural gas in sufficient quantities to recover drilling or completion costs or to be economically viable. The use of seismic data and other technologies and the study of producing fields in the same area will not enable us to know conclusively prior to drilling whether oil or natural gas will be present or, if present, whether oil or natural gas will be present in commercial quantities. We cannot assure you that the analogies we draw from available data from other wells, more fully explored prospects or producing fields will be applicable to our drilling prospects.
Our identified drilling locations are scheduled out over several years, making them susceptible to uncertainties that could materially alter the occurrence or timing of their drilling.
Our management has specifically identified and scheduled drilling locations as an estimation of our future multi-year drilling activities on our existing acreage. These drilling locations represent a significant part of our growth strategy. Our ability to drill and develop these locations depends on a number of uncertainties, including oil and natural gas prices, the availability of capital, costs, drilling results, regulatory approvals and other factors. The North Dakota Bakken Shale and Arkoma Woodford projects comprise the majority of these drilling locations. Due to limited production history on the relatively few number of wells drilled in these projects, we are unable to predict with certainty the quantity of future production from wells to be drilled in these projects. If future drilling results in these projects do not establish sufficient reserves to achieve an economic return, we may curtail drilling in these projects. Because of these uncertainties, we do not know if the numerous potential drilling locations we have identified will ever be drilled or if we will be able to produce oil or natural gas from these or any other potential drilling locations. In addition, unless production is established within the spacing units covering the undeveloped acres on which some of the locations are identified, the leases for such acreage will expire. As of December 31, 2008, we had leases representing 152,105 net acres expiring in 2009, 221,522 net acres expiring in 2010, and 360,123 net acres expiring in 2011. As such, our actual drilling activities may materially differ from those presently identified, which could adversely affect our business.
Market conditions or operational impediments may hinder our access to oil and natural gas markets or delay our production.
Market conditions or the unavailability of satisfactory oil and natural gas transportation arrangements may hinder our access to oil and natural gas markets or delay our production. The availability of a ready market for our oil and natural gas production depends on a number of factors, including the demand for and supply of oil and natural gas and the proximity of reserves to pipelines and terminal facilities. Our ability to market our production depends in substantial part on the availability and capacity of gathering systems, pipelines and processing facilities owned and operated by third parties. Our failure to obtain such services on acceptable terms could materially harm our business. We may be required to shut in wells due to lack of a market or inadequacy or unavailability of crude oil or natural gas pipeline or gathering system capacity. In addition, if gas quality specifications for the third party natural gas pipelines with which we connect change so as to restrict our ability to transport natural gas, our access to natural gas markets could be impeded. If our production becomes shut in for any of these or other reasons, we would be unable to realize revenue from those wells until other arrangements were made to deliver the products to market.
We have been an early entrant into new or emerging plays. As a result, our drilling results in these areas are uncertain, and the value of our undeveloped acreage will decline if drilling results are unsuccessful.
While our costs to acquire undeveloped acreage in new or emerging plays have generally been less than those of later entrants into a developing play, our drilling results in these areas are more uncertain than drilling results in areas that are developed and producing. Since new or emerging plays have limited or no production history, we are unable to use past drilling results in those areas to help predict our future drilling results. As a result, our cost of drilling, completing and operating wells in these areas may be higher than initially expected, and the value of our undeveloped acreage will decline if drilling results are unsuccessful.
We are subject to complex federal, state, local, provincial and other laws and regulations that could adversely affect the cost, manner or feasibility of conducting our operations or expose us to significant liabilities.
Our oil and natural gas exploration, production and transportation operations are subject to complex and stringent laws and regulations. In order to conduct our operations in compliance with these laws and regulations, we must obtain and maintain numerous permits, approvals and certificates from various federal, state, local and provincial governmental authorities. We may incur substantial costs in order to maintain compliance with these
existing laws and regulations. In addition, our costs of compliance may increase if existing laws and regulations are revised or reinterpreted, or if new laws and regulations become applicable to our operations. Such costs could have a material adverse effect on our business, financial condition and results of operations.
Our business is subject to federal, state, local and provincial laws and regulations as interpreted and enforced by governmental authorities possessing jurisdiction over various aspects of the exploration for, and the production and transportation of, oil and natural gas. Failure to comply with such laws and regulations, as interpreted and enforced, could have a material adverse effect on our business, financial condition and results of operations. See “Regulation of the Oil and Natural Gas Industry” for a description of the laws and regulations that affect us.
Strict, joint and several liabilities may be imposed under certain environmental laws, which could cause us to become liable for the conduct of others or for consequences of our own actions that were in compliance with all applicable laws at the time those actions were taken. In addition, claims for damages to persons or property, including natural resources, may result from our operations.
New laws, regulations or enforcement policies could be more stringent and impose unforeseen liabilities or significantly increase compliance costs. If we were not able to recover the resulting costs through insurance or increased revenues, our business, financial condition or results of operations could be adversely affected.
Should we fail to comply with all applicable FERC administered statutes, rules, regulations and orders, we could be subject to substantial penalties and fines.
Under the EP Act 2005, FERC has civil penalty authority under the NGA to impose penalties for current violations of up to $1 million per day for each violation and disgorgement of profits associated with any violation. While our systems have not been regulated by FERC as a natural gas company under the NGA, FERC has adopted regulations that may subject certain of our otherwise non-FERC jurisdictional facilities to FERC annual reporting and daily scheduled flow and capacity posting requirements. Additional rules and legislation pertaining to those and other matters may be considered or adopted by FERC from time to time. Failure to comply with those regulations in the future could subject Continental to civil penalty liability.
Our operations may incur substantial liabilities in connection with climate change legislation and regulatory initiatives.
Recent scientific studies have suggested that emissions of certain gases, commonly referred to as “greenhouse gases” and including carbon dioxide and methane, may be contributing to warming of the Earth’s atmosphere. In response to such studies, the U.S. Congress is considering legislation to reduce emissions of greenhouse gases and more than one-third of the states, either individually or through multi-state initiatives, already have begun implementing legal measures to reduce emissions of greenhouse gases. Also, the U.S. Supreme Court’s holding in its 2007 decision,Massachusetts, et al. v. EPA, that carbon dioxide may be regulated as an “air pollutant” under the federal Clean Air Act could result in future regulation of greenhouse gas emissions from stationary sources, even if Congress does not adopt new legislation specifically addressing emissions of greenhouse gases. In July 2008, EPA released an “Advance Notice of Proposed Rulemaking” regarding possible future regulation of greenhouse gas emissions under the Clean Air Act. Although the notice did not propose any specific, new regulatory requirements for greenhouse gases, it indicates that federal regulation of greenhouse gas emissions could occur in the near future. Although it is not possible at this time to predict how legislation or new regulations that may be adopted to address greenhouse gas emissions would impact our business, any such future laws and regulations could result in increased compliance costs or additional operating restrictions, and could have an adverse effect on our business or demand for the oil and natural gas we produce.
Competition in the oil and natural gas industry is intense, making it more difficult for us to acquire properties, market oil and natural gas and secure trained personnel.
Our ability to acquire additional prospects and to find and develop reserves in the future will depend on our ability to evaluate and select suitable properties and to consummate transactions in a highly competitive environment for acquiring properties, marketing oil and natural gas and securing trained personnel. Also, there is substantial competition for capital available for investment in the oil and natural gas industry. Many of our competitors possess and employ financial, technical and personnel resources substantially greater than ours. Those companies may be able to pay more for productive oil and natural gas properties and exploratory prospects and to evaluate, bid for and purchase a greater number of properties and prospects than our financial or personnel resources permit. In addition, companies may be able to offer better compensation packages to attract and retain qualified personnel than we are able to offer. The cost to attract and retain qualified personnel has increased over the past three years due to competition and may increase substantially in the future. We may not be able to compete successfully in the future in acquiring prospective reserves, developing reserves, marketing hydrocarbons, attracting and retaining quality personnel and raising additional capital, which could have a material adverse effect on our business.
The loss of senior management or technical personnel could adversely affect operations.
We depend on the services of our senior management and technical personnel. The loss of the services of our senior management or technical personnel, including Harold G. Hamm, our Chairman, President and Chief Executive Officer, could have a material adverse effect on our operations. We do not maintain, nor do we plan to obtain, any insurance against the loss of any of these individuals.
Seasonal weather conditions and lease stipulations adversely affect our ability to conduct drilling activities in some of the areas where we operate.
Oil and natural gas operations in the Rocky Mountains are adversely affected by seasonal weather conditions and lease stipulations designed to protect various wildlife. In certain areas, including parts of Montana, North Dakota, South Dakota, and MontanaWyoming, drilling and other oil and natural gas activities can only be conducted during the spring and summer months. This limits our ability to operate in those areas and can intensify competition during those months for drilling rigs, oilfield equipment, services, supplies and qualified personnel, which may lead to periodic shortages. These constraints and the resulting shortages or high costs could delay our operations and materially increase our operating and capital costs.
Our revolving credit facility contains certain covenants that may inhibit our ability to make certain investments, incur additional indebtedness and engage in certain other transactions, which could adversely affect our ability to meet our future goals.
Our revolving credit facility includes certain covenants that, among other things, restrict:
our investments, loans and advances and the paying of dividends and other restricted payments;
our incurrence of additional indebtedness;
the granting of liens, other than liens created pursuant to the revolving credit facility and certain permitted liens;
mergers, consolidations and sales of all or substantial part of our business or properties;
the hedging, forward sale or swap of our production of crude oil or natural gas or other commodities;
the sale of assets; and
our capital expenditures.
Our revolving credit facility requires us to maintain certain financial ratios, such as leverage ratios. All of these restrictive covenants may restrict our ability to expand or pursue our business strategies. Our ability to
comply with these and other provisions of our revolving credit facility may be impacted by changes in economic or business conditions, results of operations or events beyond our control. The breach of any of these covenants could result in a default under our revolving credit facility, in which case, depending on the actions taken by the lenders thereunder or their successors or assignees, such lenders could elect to declare all amounts borrowed under our revolving credit facility, together with accrued interest, to be due and payable. If we were unable to repay such borrowings or interest, our lenders could proceed against their collateral. If the indebtedness under our revolving credit facility were to be accelerated, our assets may not be sufficient to repay in full such indebtedness.
Increases in interest rates could adversely affect our business.
Our business and operating results can be harmed by factors such as the availability, terms of and cost of capital, increases in interest rates or a reduction in credit rating. These changes could cause our cost of doing business to increase, limit our ability to pursue acquisition opportunities, reduce cash flow used for drilling and place us at a competitive disadvantage. For example, as of February 23, 2009, outstanding borrowings under our revolving credit facility were $474.4 million and the impact of a 1% increase in interest rates on this amount of debt would result in increased interest expense of approximately $4.7 million and a $2.9 million decrease in our net income. Recent and continuing disruptions and volatility in the global financial markets may lead to a contraction in credit availability impacting our ability to finance our operations. We require continued access to capital. A significant reduction in cash flows from operations or the availability of credit could materially and adversely affect our ability to achieve our planned growth and operating results.
The continuing financial crisis may impact our business and financial condition. We may not be able to obtain funding in the capital markets on terms we find acceptable, or obtain funding under our current revolving credit facility because of the deterioration of the capital and credit markets and our borrowing base.
The current credit crisis and related turmoil in the global financial systems have had an impact on our business and our financial condition, and we may face challenges if economic and financial market conditions do not improve. Historically, we have used our cash flow from operations and borrowings under our revolving credit facility to fund our capital expenditures and have relied on the capital markets and asset monetization transactions to provide us with additional capital for large or exceptional transactions. A continuation of the economic crisis could further reduce the demand for oil and natural gas and continue to put downward pressure on the prices for oil and natural gas, which have declined significantly since reaching historic highs in July 2008. These price declines have negatively impacted our revenues and cash flows.
We have an existing revolving credit facility with lender commitments totaling $672.5 million. In the future, we may not be able to access adequate funding under our bank credit facilities as a result of (i) a decrease in our borrowing base due to the outcome of a subsequent borrowing base redetermination, or (ii) an unwillingness or inability on the part of our lending counterparties to meet their funding obligations. The recent declines in commodity prices, or a continuing decline in those prices, could result in a determination to lower the borrowing base in the future and, in such case, we could be required to repay any indebtedness in excess of the Big Horn
Basinborrowing base. The turmoil in the financial markets has adversely impacted the stability and solvency of Wyoming. Estimated proveda number of large global financial institutions.
The current credit crisis makes it difficult to obtain funding in the public and private capital markets. In particular, the cost of raising money in the debt and equity capital markets has increased substantially while the availability of funds from those markets generally has diminished significantly. Also, as a result of concerns about the general stability of financial markets and the solvency of specific counterparties, the cost of obtaining money from the credit markets has increased as many lenders and institutional investors have increased interest rates, imposed tighter lending standards, refused to refinance existing debt at maturity at all or on terms similar to existing debt or at all, and reduced and, in some cases, ceased to provide any new funding.
The credit crisis also has impacted the level of activity in the oil and natural gas property sales market. The lack of available credit and access to capital has limited and will likely continue to limit the parties interested in any proposed asset transactions and will likely reduce the values we could realize in those transactions.
Due to these factors, we cannot be certain that funding, if needed, will be available to the extent required and on acceptable terms. If we are unable to access funding when needed on acceptable terms, we may not be able to fully implement our business plans, complete new property acquisitions to replace our reserves, for its Rocky Mountains propertiestake advantage of business opportunities, respond to competitive pressures, or refinance our debt obligations as they come due, any of which could have a material adverse effect on our operations and financial results.
The inability of our significant customers to meet their obligations to us may adversely affect our financial results.
Our principal exposures to credit risk are through joint interest receivables ($156.6 million at December 31, 2002, totaled 62.3 MMBoe2008) and represented 76%the sale of the Company's
PV-10. Approximately 52% of these estimated proved reserves are proved
developed. During the twelve months endedour oil and natural gas production ($72.4 million in receivables at December 31, 2002, the average net
daily production was 8,121 Bbls of oil2008), which we market to energy marketing companies, refineries and 4,891 Mcf of natural gas, or 8,943
Boe per dayaffiliates. Joint interest receivables arise from the Rocky Mountain properties. The Company's leasehold
interests include 173,000 net developed and 292,000 net undeveloped acres, which
represent 27% and 45% of the Company's total leasehold, respectively. This
leasehold is expected to be developed utilizing 3-D seismic, precision
horizontal drilling and secondary recovery technologies, where applicable. As of
December 31, 2002, the Company's Rocky Mountain properties included an inventory
of 65 development and 21 exploratory drilling locations.
WILLISTON BASIN
CEDAR HILLS FIELD. The Cedar Hills Field was discovered in November 1994.
During the twelve months ended December 31, 2002, the Cedar Hills Field
properties produced 3,813 net Boe per day to the Company's interests. The Cedar
Hills Field produces oil from the Red River "B" formation, a thin (eight feet),
non-fractured, blanket-type, dolomite reservoir found at depths of 8,000 to
9,500 feet. All wells drilled by the Company in the Red River "B" formation were
drilled exclusively with precision horizontal drilling technology. The Cedar
Hills Field covers approximately 200 square miles and has a known oil column of
1,000 feet. Through December 31, 2002, the Company drilled or participated in
199 gross (139 net) horizontal wells, of which 192 were successfully completed,
for a 96% net success rate. The Company believes that the Red River "B"
formation in the Cedar Hills Field is well suited for enhanced secondary
recovery using either HPAI and/or traditional water flooding technology. Both
technologies have been applied successfully in adjacent secondary recovery units
for over 30 years and have proven to increase oil recoveries from the Red River
"B" formation by 200% to 300% over primary recovery. The Company is proficient
using either technology and is in the process of implementing both as part of
its secondary recovery operations in the Cedar Hills Field. Effective March 1,
2001, the Company obtained approval for two secondary recovery units in the
Cedar Hills Field; the Cedar Hills North-Red River "B" Unit ("CHNRRU") located
in Bowman and Slope Counties, North Dakota and the West Cedar Hills Unit
("WCHU") located in Fallon County, Montana. The Company owns 95% of the workingbilling entities who own partial interest in the CHNRRUwells we operate. These entities participate in our wells primarily based on their ownership in leases on which we wish to drill. We can do very little to choose who participates in our wells. We are also subject to credit risk due to concentration of our oil and is the operatornatural gas receivables with several significant customers. The largest purchaser of the unit. The CHNRRU contains 79
wellsour oil and 50,000 acres. The Company owns 100% of the working interest in the
WCHU and is the unit operator. The WCHU contains 10 wells and 8,000 acres. An
estimated $52.5 million will need to be invested during 2003 to fully implement
the Company's secondary recovery operations in the Cedar Hills Field. The
components of the $52.5 million invested are $40.2 million for infill drilling
and $12.3 million for infrastructure. By year-end 2003, the Company expects to
have completed 56 of the 65 required injectors and installed facilities to begin
injection in 100% of the units. The Cedar Hills Field represents 59% of the
Company's estimated proved reserves and $367.4 million, or 58%, of the PV-10 of
the Company's proved reserves at December 31, 2002.
MEDICINE POLE HILLS, MEDICINE POLE HILLS WEST, MEDICINE POLE HILLS SOUTH,
BUFFALO, WEST BUFFALO AND SOUTH BUFFALO UNITS. In 1995, the Company acquired the
following interests in four production units in the Williston Basin: Medicine
Pole Hills (63%), Buffalo (86%), West Buffalo (82%), and South Buffalo (85%).
During the twelve months ended December 31, 2002, these units produced 1,034 Boe
per day, net to the Company's interests, and represented 5.3 MMBoe and $36.4
million, or 6%, of the PV-10 attributable to the Company's estimated proved
reserves as of December 31, 2002. These units are HPAI enhanced recovery
projects that produce from the Red River "B" formation and are operated by the
Company. All were discovered and developed with conventional vertical drilling.
The oldest vertical well in these units has been producing for 47 years,
demonstrating the long-lived production characteristic of the Red River "B"
formation. There are 156 producing wells in these units and current estimates of
remaining reserve life range from four to 13 years. The Company subsequently
expanded the Medicine Pole Hills Unit through horizontal drilling into the
Medicine Pole Hills West Unit ("MPHWU"), which became effective April 1, 2000.
The MPHWU produces from 25 wells and encompasses an additional 22 square miles
of productive Red River "B" reservoir. The Company owns approximately 80% of the
MPHWU and began secondary injection November 22, 2000. The MPHWU was the first
in a scheduled two-phase expansion of the Medicine Pole Hills Unit. Phase two of
the expansion plan was successfully completed during 2001 delineating another 20
square miles of productive Red River B reservoir through horizontal drilling.
The Medicine Pole Hills South Unit ("MPHSU") became effective October 1, 2002,
with injection expected to begin by mid-year 2003.
LUSTRE AND MIDFORK FIELDS. In January 1992, the Company acquired the Lustre
and Midfork Fields which,natural gas, during the twelve months ended December 31, 2002,
produced 357 Bbls2008, accounted for 44% of our total revenues. We do not require our customers to post collateral. The inability or failure of our significant customers to meet their obligations to us or their insolvency or liquidation may adversely affect our financial results.
Our derivative activities could result in financial losses or could reduce our earnings.
To achieve a more predictable cash flow and to reduce our exposure to adverse fluctuations in the prices of oil and natural gas, we on occasion, enter into derivative instruments for a portion of our oil and/or natural gas production, including collars and price-fix swaps. In July 2007, we entered into fixed price swaps covering 10,000 barrels of oil per day netfor August 2007 through April 2008 at a price of $72.90 per barrel. We did not designate any of our derivative instruments as hedges for accounting purposes and did record all derivative instruments on our balance sheet at fair value. Changes in the fair value of our derivative instruments were recognized in current earnings. Accordingly, our earnings may fluctuate significantly as a result of changes in fair value of our derivative instruments.
Derivative instruments also expose us to the Company's interests. Wellsrisk of financial loss in bothsome circumstances, including when:
production is less than the Lustre and Midfork Fields produce fromvolume covered by the Charles "C" dolomite, at depths of
5,500derivative instruments;
the counter-party to 6,000 feet. Historically, production from the Charles "C" has a low
daily production rate andderivative instrument defaults on its contract obligations; or
there is long lived. There are currently 43 wells producingan increase in the two fields. No secondary recovery operations are underway in either field
at this time but are under consideration. The Company currently owns 99,000 net
acresdifferential between the underlying price in the Lustrederivative instrument and Midfork Field area.
The Company believes significant upside existsactual prices received.
In addition, these types of derivative arrangements limit the benefit we would receive from increases in the reservoirsprices for oil and natural gas.
We may be subject to risks in connection with acquisitions.
The successful acquisition of producing properties requires an assessment of several factors, including:
recoverable reserves;
future oil and natural gas prices and their appropriate differentials;
operating costs; and
potential environmental and other liabilities.
The accuracy of these assessments is inherently uncertain. In connection with these assessments, we perform a review of the subject properties that underliewe believe to be generally consistent with industry practices. Our review will not reveal all existing or potential problems nor will it permit us to become sufficiently familiar with the Charles "C" dolomite includingproperties to fully assess their deficiencies and capabilities. Inspections may not always be performed on every well, and environmental problems are not necessarily observable even when an inspection is undertaken. Even when problems are identified, the Mission Canyon, Lodgepole, and
Nisku formations. Historically production from these reservoirs is more
difficultseller may be unwilling or unable to locate but prolific when found. 3-D seismic is being utilized to
locate reserves in these reservoirs. During 2002, the Company made a modest
discovery in the Lodgepole formation utilizing 60 square miles of proprietary
3-D data acquired in late 2001. The discovery is significant in that it
established production 200 miles from the nearest Lodgepole production near
Dickinson, North Dakota, which was quite prolific. The Company controls
approximately 70,000 net undeveloped acres in this particularprovide effective contractual protection against all or part of the playproblems. We often are not entitled to contractual indemnification for environmental liabilities and has identified 12 drilling locations from its 3-D seismic. During 2003, the
Company plans to drill 1 development and 2 exploratory wells.
BIG HORN BASIN
On May 14, 1998, the Company consummated the purchase, for $86.5 million,
of producing and non-producingacquire properties on an “as is” basis.
Our business depends on oil and natural gas properties and certain other related
assets in the Worland Field, effective as of June 1, 1998. Subsequently, and
effective as of June 1, 1998, the Company sold an undivided 50% interest in the
Worland Field properties (excluding inventory and certain equipment) to the
Company's principal stockholder, for $42.6 million. On December 31, 1999, the
Company's principal stockholder contributed the undivided 50% interest in the
Worland Properties along with debt of $18,600,000. The stockholder contributed
$22,461,096 of the properties as additional paid-in-capital and the Company
assumed his outstanding debt for the balance of the purchase price.
During the twelve months ended December 31, 2002, the Worland Field
properties produced 1,763 Boe per day, net to the Company's interests. These
properties cover 96,000 net leasehold acres in the Worland Field of the Big Horn
Basin in northern Wyoming, of which 29,000 net acres are held by production and
67,000 net acres are non-producing or prospective. Approximately two-thirds of
the Company's producing leases in the Worland Field are within five federal
units, the largest of which, the Cottonwood Creek Unit, has been producing for
more than 40 years. All of the units produce principally from the Phosphoria
formation, which is thetransportation facilities, most prolific oil producing formation in the Worland
Field. Four of the units are unitized as to all depths, with the Cottonwood
Creek Field Extension (Phosphoria) Unit being unitized only as to the Phosphoria
formation. The Company is the operator of all five of the federal units. The
Company also operates 38 producing wells located on non-unitized acreage. The
Company's Worland Field properties include interests in 329 producing wells, 303 of which are operatedowned by third parties.
The marketability of our oil and natural gas production depends in part on the Company.
Asavailability, proximity and capacity of December 31, 2002, the estimated net proved reserves attributable to
the Company's Worland Field properties were approximately 6.4 MMBoe, with an
estimated PV-10pipeline systems owned by third parties. The unavailability of, $35.5 million. Approximately 74%, by volume,or lack of, available capacity on these proved
reserves consist of oil, principallysystems and facilities could result in the Phosphoria formation. Oil produced
fromshut-in of producing wells or the Company's Worland Field properties is low gravity, sour (high sulphur
content) crude, resultingdelay, or discontinuance of, development plans for properties. Although we have some contractual control over the transportation of our product, material changes in a lower sales price per barrel than non-sour crude,these business relationships could materially affect our operations. We generally do not purchase firm transportation on third party facilities and is sold into a Marathon pipeline or is trucked from the lease. Gas produced
from the Worland Field properties is also sour, resulting in a sale price that
is less per Mcf than non-sour natural gas. From the effective date of the
Worland Field Acquisition through September 30, 1998, the average price of crude
oil produced by the Worland Field properties was $5.19 per Bbl less than the
NYMEX price of crude oil. The Company entered into a contract effective December
1, 2001, through December 31, 2001, to sell crude oil produced from its Worland
Field properties at an average price of $6.00 per Bbl less than the NYMEX price.
Subsequent to these contracts, and effective January 1, 2002, the Company
entered into a contract to sell the Worland Fieldtherefore, our production at a
gravity-adjusted price of $4.21 per barrel less than the monthly NYMEX average
price. This contract was renegotiated January 2003 at a price that will average
$4.00 to $5.00 less than the monthly NYMEX average price.
The Company believes that secondary and tertiary recovery projects have
significant potential for the addition of reserves in the Worland Field area
fields. The Company continues to seek the best method for increasing recovery
from the producing reservoirs. Currently the Company has one Tensleep waterflood
project and one pilot imbibition flood underway. The Company implemented water
injection into five wells in late 2002 to evaluate secondary and pressure
recovery techniques that will best process the Phosphoria dolomite oil reserves.
Production should be enhanced in as many as 20 offset wells. The Company has
installed the system for expansion if the results meet expectations. In addition
to the secondary and pressure recovery projects, the Company is evaluating
infill drilling opportunities based on neural network analysis techniques and
has identified 70 wells for acid fracturing treatments. The infill drilling and
acid frac procedures will be evaluated as each well is completed to ensure that
the techniques are viable. As evidenced by past infill drilling and acid
fracturing stimulations, reserve growthtransportation can be significant.
MID-CONTINENT
The Company's Mid-Continent properties are located primarily in the
Anadarko Basin of western Oklahomainterrupted by those having firm arrangements. Federal and the Texas Panhandle. During 2001, the
Company expanded its operations in the Mid-Continent through successful
exploration in the Black Warrior Basin in Mississippi and the acquisition of
Farrar Oil Company's assets in the Anadarko and Illinois Basins. At December 31,
2002, the Company's estimated proved reserves in the Mid-Continent totaled 12.1
MMBoe and represented 22% of the Company's PV-10. At December 31, 2002,
approximately 64% of the Company's estimated proved reserves in the
Mid-Continent were natural gas. Net daily production from these properties
during 2002 averaged 2,129 Bblsstate regulation of oil and 15,150 Mcf of natural gas production and transportation, tax and energy policies, changes in supply and demand, pipeline pressures, damage to or 4,658
Boedestruction of pipelines and general economic conditions could adversely affect our ability to the Company's interests. produce, gather and transport oil and natural gas.
The Company's Mid-Continent leasehold position
includes 100,000 net developeddisruption of third-party facilities due to maintenance and/or weather could negatively impact our ability to market and 62,000 net undeveloped acres, representing
15%deliver our products. We have no control over when or if such facilities are restored or what prices will be charged. A total shut-in of production could materially affect us due to a lack of cash flow, and 10%if a substantial portion of the Company's total leasehold, respectively,production is hedged at lower than market prices, those financial hedges would have to be paid from borrowings absent sufficient cash flow.
Our Chairman and Chief Executive Officer owns approximately 72.8% of our outstanding common stock, giving him influence and control in corporate transactions and other matters, including a sale of our company.
As of February 23, 2009, Harold G. Hamm, our Chairman, President and Chief Executive Officer, beneficially owns 123,458,708 shares of our outstanding common stock representing approximately 72.8% of our outstanding common shares. As a result, Mr. Hamm will continue to be our controlling shareholder and will continue to be able to control the election of our directors, determine our corporate and management policies and determine, without the consent of our other shareholders, the outcome of certain corporate transactions or other matters submitted to our shareholders for approval, including potential mergers or acquisitions, asset sales and other significant corporate transactions. As controlling shareholder, Mr. Hamm could cause, delay or prevent a change of control of our Company. The interests of Mr. Hamm may not coincide with the interests of other holders of our common stock.
Several affiliated companies controlled by Mr. Hamm provide oilfield, gathering and processing, marketing and other services to us. We expect these transactions will continue in the future and may result in conflicts of interest between Mr. Hamm’s affiliated companies and us. We can provide no assurance that any such conflicts will be resolved in our favor.
| Item 1B. | Unresolved Staff Comments |
There were no unresolved Securities and Exchange Commission staff comments at December 31, 2002. As of December 31, 2002, the Company's Mid-Continent properties included
an inventory of 15 development and 17 exploratory drilling locations.
ANADARKO BASIN. 2008.
| Item 2. | Properties |
The Anadarko Basin properties contained 74% of the
Company's estimated proved reserves for the Mid-Continent and 17% of the
Company's total PV-10 at December 31, 2002, and represented 61% of the Company's
estimated proved reserves of natural gas. During the twelve months ended
December 31, 2002, net daily production from its Anadarko Basin properties
averaged 799 Bbls of oil and 13,167 Mcf of natural gas, or 2,993 Boe to the
Company's interests from 655 gross (289 net) producing wells, 330 of which are
operatedinformation required by the Company. The Anadarko Basin wells produce from a variety of
sands and carbonates in both stratigraphic and structural traps in the Arbuckle,
Oil Creek, Viola, Mississippian, Springer, Morrow, Red Fork, Oswego, Skinner and
Tonkawa formations, at depths ranging from 6,000 to 12,000 feet. These
properties have been a steady source of cash flow for the Company and are
continually being developed by infill drilling, recompletions and workovers. As
of December 31, 2002, the Company had identified 12 development and one
exploratory drilling location on its properties in the Anadarko Basin.
ILLINOIS BASIN. On July 9, 2001, the Company purchased the assets of Farrar
Oil Company and its subsidiary, Har-Ken Oil Company, for $33.7 million under its
newly formed subsidiary, Continental Resources of Illinois, Inc. ("CRII"). The
Illinois Basin properties contained 22% of the Company's estimated proved
reserves for the Mid-Continent and 4% of the Company's total PV-10 at December
31, 2002. Net daily production during the twelve months ended December 31, 2002,
averaged 1,244 Bbls of oil and 189 Mcf of natural gas, or 1,275 Boe to the
Company's interests from 880 gross (646 net) producing wells, 714 of which are
operated by the Company. Approximately 70% of the Company's net oil production
in this basin comes from 31 active secondary recovery projects. Company
expertise resulting in very efficient operations combined with low decline rates
makes most of the properties very long lived. Many of the projects have been
active for over 15 years with many years of economic life remaining. At year-end
the Company was evaluating a production acquisition possessing significant
secondary recovery potential. Three new secondary recovery projects are planned
for implementation during 2003. All properties are constantly being evaluated
and we are continually performing numerous workovers and making injection
enhancements. As of December 31, 2002, the Company had 3 development and 10
exploratory drilling locations in inventory and scheduled for drilling during
2003. All of the exploratory drill sites were selected from interpretations
utilizing detailed geological studies and computer mapping with all but one
defined by seismic programs shot by the Company. In addition, the Company has 6
active exploration project areas with seismic programs to cover all the areas to
be shot during 2003. Included in this seismic program are three projects where
the use of 3-D seismic will be employed.
BLACK WARRIOR BASIN. In April 2000, the Company began a grass roots effort
to expand its exploration program into the Black Warrior Basin located in
eastern Mississippi and western Alabama. The Company believes the Black Warrior
Basin offers opportunity for growth and adds a component of low cost, high rate
of return, shallow gas reserves to the Company's overall drilling program.
Reservoirs are Pennsylvanian and Mississippian age sands found at depths of
2,500 feet to 4,500 feet with reserves of .75 Bcf per well on average. Net daily
production during the ten months ended December 31, 2002, averaged 766 Mcf of
natural gas or 128 Boe to the Company's interests. Competition in the basinItem 2 is
low which has enabled the Company to readily acquire leases on new projects and
keep costs low. As of December 31, 2002, the Company had acquired 25,000 net
acres on selected projects. The Company has also augmented its geological
expertise by acquiring licenses to approximately 1,500 miles of 2-D seismic data
across the basin. During 2002, the Company drilled 12 wells and established four
producers for a 33% success rate. Although this success rate is in line with
historical averages for the basin, the production and reserves found have not
met expectations. During 2003, the Company plans to drill 5 wells and the
results of these wells will dictate the Company's continued commitment to the
basin.
GULF COAST
The Company's Gulf Coast activities are located primarily in the Pebble
Beach and Luby Projects in Nueces County, Texas and the Jefferson Island Project
in Iberia Parish, Louisiana. The Company is also a partner in a joint venture
arrangement with Challenger Minerals, Inc. to locate and participate in drilling
opportunities on the shallow shelf of the Gulf of Mexico. At December 31, 2002,
the Company's estimated proved reserves in the Gulf Coast totaled .5 MMBoe (85%
gas) representing 2% of the Company's total PV-10 and 4% of the Company's
estimated proved reserves of natural gas. During 2002, the Company's Gulf Coast
producing wells represented only 4% of the Company's total producing well count,
but produced 21% of the Company's total gas production for the year. Net daily
production from these properties is 187 Bbls of oil and 5,245 Mcf of natural gas
or 1,061 Boe to the Company's interests from 5wells. The Company's leasehold
position includes 6,000 net developed and 18,000 net undeveloped acres
representing 1% and 3% of the Company's total leasehold respectively. From a
combined total of 95 square miles of proprietary 3-D data, 22 development and 21
exploratory locations have been identified for drilling on these projects.
PEBBLE BEACH/LUBY. The Pebble Beach/Luby projects target the prolific Frio
and Vicksburg sands underlying and surrounding the Clara Driscoll and Luby
fields in Nueces County, Texas. These sandstone reservoirs produce on structures
readily defined by seismic and remain largely untested below the existing
producing reservoirs in the fields at depths ranging from 6,000 feet to 13,000
feet. At December 31, 2002, the Company's estimated proved reserves in the
Pebble Beach/Luby fields totaled 2,064 MMcf or 3% of the Company's estimated
proved reserves of natural gas. Net daily production during the twelve months
ended December 31, 2002, averages 65 Bbls of oil and 2,723 Mcf of gas, or 519
Boe to the Company's interests. The Company owns 23,000 gross and 19,000 net
acres and has acquired 95 square miles of proprietary 3-D seismic data in these
two projects. From the proprietary 3-D data, the Company has identified 22
development and 13 exploratory locations for drilling.
During 2002, the Company drilled 9 wells with 8 being completed as
producing wells and 1 dry hole. In 2003, the Company will continue its
development and expects to drill 13 additional wells in the Pebble Beach/Luby
projects. The Company also expects to acquire additional leasehold and
approximately 60 square miles of new proprietary 3-D data in selected projects
as part of its ongoing expansion in South Texas.
JEFFERSON ISLAND. The Jefferson Island project is an underdeveloped salt
dome that produces from a series of prolific Miocene sands. To date the field
has produced 111.1 MMBoe from approximately one quarter of the total dome. The
remaining three quarters of the faulted dome complex are essentially unexplored
or underdeveloped. The Company controls 2,000 gross and 1,000 net acres in the
project and owns 35 square miles of proprietary 3-D seismic covering the
property through an agreement with a third party. Under the agreement, the third
party had to pay 100% of costs for acquiring 3-D seismic and drill five wells,
carrying the Company for 16% working interest at no cost, to earn 50% interest
in the Jefferson Island project. During 2000, the third party completed its 3-D
seismic and drilling obligation and earned 50% of the project. Out of the five
wells drilled by the third party, two are commercial wells, two non-commercials
and one was a dry hole. With the third party's seismic and drilling obligations
fulfilled, the Company regained control of drilling operations and drilled one
exploratory well in 2001 seeking higher reserve potential. The exploratory well
was successful and penetrated 180 feet of pay in multiple sands underlying a 3-D
imaged salt overhang along the flank of the salt dome complex. The discovery is
quite significant in that it confirmed our ability to image the salt and
encounter pay in sand reservoirs not previously known to produce in the field.
The Company has identified 5 additional exploratory drilling locations and plans
to drill at least one in 2003.
GULF OF MEXICO. In July 1999 the Company elected to expand its drilling
program into the shallow waters of the Gulf of Mexico ("GOM") though a joint
venture arrangement with Challenger Minerals, Inc. This was part of the
Company's ongoing strategy to build its opportunity base of high rate of return,
natural gas reserves in the Gulf Coast region. The expansion into the GOM has
proven successful and as of December 31, 2002, the Company has participated in
15 wells that have resulted in seven producers, seven dry holes, and one well
has been plugged. The Company plans to continue its activity in the GOM as a
non-operator, restricting its risked investments to approximately $750,000 per
project. The Company currently has 2 potential wells in inventory for 2003.
NET PRODUCTION, UNIT PRICES AND COSTS
The following table presents certain information with respect to oil and
gas production, prices and costs attributable to all oil and gas property
interests owned by the Company for the periods shown:
| Item 3. | Legal Proceedings |
We are not believe that the loss of any
crude oil or gas customer would have a material effect on the Company's results
of operations.
Periodically the Company utilizes various price risk management strategies
to fix the price of a portion of its future oil and gas production. The Company
does not establish hedges in excess of its expected production. These strategies
customarily emphasize forward-sale, fixed-price contracts for physical delivery
of a specified quantity of production or swap arrangements that establish an
index-related price above which the Company pays the hedging partner and below
which the hedging partner pays the Company. These contracts allow the Company to
predict with greater certainty the effective oil and gas prices to be received
for its hedged production and benefit the Company when market prices are less
than the fixed prices provided in its forward-sale contracts. However, the
Company does not benefit from market prices that are higher than the fixed
prices in such contracts for its hedged production. In August 1998, the Company
began engaging in oil trading arrangements as part of its oil marketing
activities. Under these arrangements, the Company contracts to purchase oil from
one source and to sell oil to an unrelated purchaser, usually at disparate
prices. During the second quarter of 2002, the Company discontinued crude oil
trading contracts.
ITEM 3. LEGAL PROCEEDINGS
From time to time, the Company is party to litigation or other legal
proceedings that it considers to be a part of the ordinary course of its
business. The Company is not involved in any legal proceedings nor is it party to any material pending or threatened claimslegal proceedings, other than ordinary course litigation incidental to our business. While the ultimate outcome and impact of any proceeding cannot be predicted with certainty, our management believes that could reasonably be expected tothe resolution of any proceeding will not have a material adverse effect on itsour financial condition or results of operations.
ITEM 4. SUBMISSION OF MATTERS TO A VOTE OF SECURITY HOLDERS
None.
PART
| Item 4. | Submission of Matters to a Vote of Security Holders |
There were no matters submitted to a vote of security holders during the fourth quarter of 2008.
Part II
ITEM 5. MARKET FOR REGISTRANT?S COMMON EQUITY AND RELATED STOCKHOLDER MATTERS
There
| Item 5. | Market for Registrant’s Common Equity and Related Shareholder Matters |
Our common stock is no established trading market forlisted on the Company's common stock. The
Company authorized an approximate 293:1 stock split during 2000. As a result all
amounts are presented retroactive to account forNew York Stock Exchange and trades under the split. As of March 28,
2003, there were three record holders of the Company's common stock. The Company
issued no equity securities during 2002. During 2000, the Company established a
Stock Option Plan with 1,020,000 shares available, of which options to purchase
an aggregate of 172,000 shares have been granted.
ITEM 6. SELECTED FINANCIAL AND OPERATING DATA
SELECTED CONSOLIDATED FINANCIAL DATAsymbol “CLR.” The following table sets forth quarterly high and low sales prices since May 14, 2007, when we became a publicly traded company, and cash dividends declared for each quarter of the previous two years.
| 2008 | 2007 | |||||||||||||||||||||||
| First Quarter | Second Quarter | Third Quarter | Fourth Quarter | First Quarter | Second Quarter | Third Quarter | Fourth Quarter | |||||||||||||||||
High | $ | 32.06 | $ | 76.10 | $ | 83.81 | $ | 39.74 | $ | — | $ | 16.40 | $ | 18.97 | $ | 27.62 | ||||||||
Low | 20.55 | 30.55 | 31.44 | 12.01 | — | 14.00 | 14.11 | 18.05 | ||||||||||||||||
Cash Dividend | — | — | — | — | 0.12 | 0.21 | — | — | ||||||||||||||||
We declared cash dividends to our shareholders of record for tax purposes and, subject to forfeiture, to holders of unvested restricted stock during such time as we were a subchapter S corporation. On January 10, 2007, we declared a cash dividend of approximately $18.8 million to our shareholders for tax purposes and, subject to forfeiture, to holders of unvested restricted stock. On January 31, 2007, we paid $18.7 million of the dividend declared. On March 6, 2007, we declared a cash dividend of approximately $33.3 million payable in April 2007 to our shareholders of record as of March 15, 2007, for tax purposes and, subject to forfeiture, to holders of unvested restricted stock. In connection with the completion of our offering on May 14, 2007, we converted from a subchapter S corporation to a subchapter C corporation, and we do not anticipate paying any additional cash dividends on our common stock in the foreseeable future. As of February 23, 2009, the number of record holders of our common stock was 54. Management believes, after inquiry, that the number of beneficial owners of our common stock is approximately 28,000. On February 23, 2009, the last reported sales price of our Common Stock, as reported on the NYSE, was $15.18 per share.
The following table summarizes our purchases of our common stock during the fourth quarter of 2008:
Period | (a) Total number of shares purchased | (b) Average price paid per share | (c) Total number of shares purchased as part of publicly announced plans or programs | (d) Maximum number of shares that may yet be purchased under the plans or program | |||||
October 1, 2008 to October 31, 2008 | 60,295 | $ | 29.28 | — | — | ||||
November 1, 2008 to November 30, 2008 | 14,214 | $ | 26.37 | — | — | ||||
December 1, 2008 to December 31, 2008 | 14,722 | $ | 17.94 | — | — | ||||
Total | 89,231 | $ | 26.94 | — | — | ||||
All shares purchased above represent shares issued pursuant to stock option exercises or restricted stock grants that were surrendered to cover taxes required to be withheld. We paid the amounts above to the Internal Revenue Service for the required withholding. See Notes to Consolidated Financial Statements—Note 13. Stock Compensation.
Performance Graph
The information provided in this section is being furnished to, and not filed with, the SEC. As such, this information is neither subject to Regulation 14A or 14C nor to the liabilities of Section 18 of the Securities Exchange Act of 1934, as amended. As required by these rules, the performance graph was prepared based upon the following assumptions:
$100 was invested in our common stock at its initial public offering price of $15 per share and invested in the S&P 500 Index and our “peer group” on May 14, 2007, our initial public offering date, at the closing price on such date;
investment in our peer group was weighted based on the stock price of each individual company within the peer group at the beginning of the period; and
dividends were reinvested on the relevant payment dates.
Our peer group is comprised of Bill Barrett Corporation, Denbury Resources, Inc., Encore Acquisition Company, Quicksilver Resources, Inc., Range Resources Corp., Southwestern Energy Company and St. Mary Land and Exploration Company. We selected these companies because they are publicly traded exploration and production companies similar in size and operations to us.
| Item 6. | Selected Financial Data |
This section presents our selected historical and pro forma consolidated financial data. The selected historical consolidated financial data for the periods ended andpresented below is not intended to replace our historical consolidated financial statements.
The following historical consolidated financial data, as it relates to each of the dates indicated. The statements of
operations and other financial data for thefiscal years ended December 31, 1998, 1999,
2000, 2001 and 2002, and the balance sheet data as of December 31, 1998, 1999,
2000, 2001 and 2002, have2004 through 2008, has been derived from and should be reviewed in
conjunction with, theour audited historical consolidated financial statements offor such periods. You should read the Company, and the
notes thereto. Ernst and Young LLP audited ourfollowing selected historical consolidated financial statements for 2002 and
Arthur Andersen LLP audited the remaining years. The balance sheets as of
December 31, 2001, and 2002, and the statements of operations for the years
ended December 31, 2000, 2001 and 2002, are included elsewheredata in this annual
report on Form 10-K. The data should be read in conjunctionconnection with "Management's“Management’s Discussion and Analysis of Financial Condition and Results of Operations"Operation” and theour historical consolidated financial statements and the related notes thereto included elsewhere in this Report.
Certain amounts applicablereport. The selected historical consolidated results are not necessarily indicative of results to the prior periods have been reclassified to
conform to the classifications currently followed. Such reclassifications do not
affect earnings.
be expected in future periods.
| YEAR ENDED DECEMBER 31, | ||||||||||||||||||||
| 2008 | 2007 | 2006 | 2005 | 2004 | ||||||||||||||||
Statement of Income: | ||||||||||||||||||||
(in thousands, except per share data) | ||||||||||||||||||||
Oil and natural gas sales(1) | $ | 939,906 | $ | 606,514 | $ | 468,602 | $ | 361,833 | $ | 181,435 | ||||||||||
Derivative losses(1) | (7,966 | ) | (44,869 | ) | — | — | — | |||||||||||||
Total revenues | 960,490 | 582,215 | 483,652 | 375,764 | 418,910 | |||||||||||||||
Income from continuing operations | 320,950 | 28,580 | 253,088 | 194,307 | 26,816 | |||||||||||||||
Net Income | 320,950 | 28,580 | 253,088 | 194,307 | 27,864 | |||||||||||||||
Basic earnings per share: | ||||||||||||||||||||
From continuing operations | $ | 1.91 | $ | 0.17 | $ | 1.60 | $ | 1.23 | $ | 0.18 | ||||||||||
Net income per share | $ | 1.91 | $ | 0.17 | $ | 1.60 | $ | 1.23 | $ | 0.18 | ||||||||||
Shares used in basic earnings per share | 168,087 | 164,059 | 158,114 | 158,059 | 158,059 | |||||||||||||||
Diluted earnings per share: | ||||||||||||||||||||
From continuing operations | $ | 1.89 | $ | 0.17 | $ | 1.59 | $ | 1.22 | $ | 0.18 | ||||||||||
Net income per share | $ | 1.89 | $ | 0.17 | $ | 1.59 | $ | 1.22 | $ | 0.18 | ||||||||||
Shares used in diluted earnings per share | 169,392 | 165,422 | 159,665 | 159,307 | 159,236 | |||||||||||||||
Pro forma C-corporation(2) | ||||||||||||||||||||
Pro forma income from continuing operations | $ | 184,002 | $ | 156,833 | $ | 121,177 | $ | 16,626 | ||||||||||||
Pro forma net income | 184,002 | 156,833 | 121,177 | 17,276 | ||||||||||||||||
Pro forma basic earnings per share | 1.12 | 0.97 | 0.77 | 0.11 | ||||||||||||||||
Pro forma diluted earnings per share | 1.11 | 0.96 | 0.76 | 0.11 | ||||||||||||||||
Production(3) | ||||||||||||||||||||
Oil (MBbl) | 9,147 | 8,699 | 7,480 | 5,708 | 3,688 | |||||||||||||||
Gas (MMcf) | 17,151 | 11,534 | 9,225 | 9,006 | 8,794 | |||||||||||||||
Oil equivalent (MBoe) | 12,006 | 10,621 | 9,018 | 7,209 | 5,154 | |||||||||||||||
Average sales prices(4) | ||||||||||||||||||||
Oil ($/Bbl) | $ | 88.87 | $ | 63.55 | $ | 55.30 | $ | 52.45 | $ | 37.12 | ||||||||||
Gas ($/Mcf) | 6.90 | 5.87 | 6.08 | 6.93 | 5.06 | |||||||||||||||
Oil equivalent ($/Boe) | 77.66 | 58.31 | 52.09 | 50.19 | 35.20 | |||||||||||||||
Average costs per Boe($/Bbl)(5) | ||||||||||||||||||||
Production expense | $ | 8.40 | $ | 7.35 | $ | 6.99 | $ | 7.32 | $ | 8.49 | ||||||||||
Production tax | 4.84 | 3.13 | 2.48 | 2.22 | 2.39 | |||||||||||||||
Depreciation, depletion, amortization and accretion | 12.30 | 9.00 | 7.27 | 6.91 | 7.49 | |||||||||||||||
General and administrative | 2.95 | 3.15 | 3.45 | 4.34 | 2.41 | |||||||||||||||
Proved reserves at December 31 | ||||||||||||||||||||
Oil (MBbl) | 106,239 | 104,145 | 98,038 | 98,645 | 80,602 | |||||||||||||||
Gas (MMcf) | 318,138 | 182,819 | 121,865 | 108,118 | 60,620 | |||||||||||||||
Oil equivalent (MBoe) | 159,262 | 134,615 | 118,349 | 116,665 | 90,705 | |||||||||||||||
Other financial data (in thousands): | ||||||||||||||||||||
Cash dividends per share | $ | — | $ | 0.33 | $ | 0.55 | $ | 0.01 | $ | 0.09 | ||||||||||
EBITDAX(6) | 757,708 | 469,885 | 372,115 | 285,344 | 116,498 | |||||||||||||||
Net cash provided by operations | 719,915 | 390,648 | 417,041 | 265,265 | 93,854 | |||||||||||||||
Net cash used in investing | (927,617 | ) | (483,498 | ) | (324,523 | ) | (133,716 | ) | (72,992 | ) | ||||||||||
Net cash provided by (used in) financing | 204,170 | 94,568 | (91,451 | ) | (141,467 | ) | (7,245 | ) | ||||||||||||
Capital expenditures | 988,593 | 525,677 | 326,579 | 144,800 | 94,307 | |||||||||||||||
Balance sheet data at December 31 (in thousands): | ||||||||||||||||||||
Total assets | $ | 2,215,879 | $ | 1,365,173 | $ | 858,929 | $ | 600,234 | $ | 504,951 | ||||||||||
Long-term debt, including current maturities | 376,400 | 165,000 | 140,000 | 143,000 | 290,522 | |||||||||||||||
Shareholders’ equity | 948,708 | 623,132 | 490,461 | 324,730 | 130,385 | |||||||||||||||
| (1) | Oil and |
| (2) | Prior to our initial public offering, we were a subchapter S corporation and income taxes were payable by our shareholders and as a result, there was a minimal provision for income taxes for the periods ended December 31, 2006 and prior. See Notes to Consolidated Financial Statements—Note 1. Organization and Summary of Significant Accounting Policies—Income |
| (3) | For the year 2008, oil sales volumes were 97 MBbls more than oil production volumes. For the years 2007, and |
| (4) | Average sales prices for 2004 are net of hedges. The price without hedges for 2004 was $38.85 per barrel of oil and |
| (5) | Average costs per Boe have been computed using sales volumes. |
| (6) | EBITDAX represents earnings before interest expense, income taxes, depreciation, depletion, amortization |
| Year ended December 31, | ||||||||||||||||
| 2008 | 2007 | 2006 | 2005 | 2004 | ||||||||||||
| (in thousands) | ||||||||||||||||
Net income | $ | 320,950 | $ | 28,580 | $ | 253,088 | $ | 194,307 | $ | 27,864 | ||||||
Unrealized derivative loss | — | 26,703 | — | — | — | |||||||||||
Interest expense | 12,188 | 12,939 | 11,310 | 14,220 | 23,617 | |||||||||||
Provision (benefit) for income taxes | 197,580 | 268,197 | (132 | ) | 1,139 | — | ||||||||||
Depreciation, depletion, amortization and accretion | 148,902 | 93,632 | 65,428 | 49,802 | 38,627 | |||||||||||
Property impairments | 28,847 | 17,879 | 11,751 | 6,930 | 11,747 | |||||||||||
Exploration expense | 40,160 | 9,163 | 19,738 | 5,231 | 12,633 | |||||||||||
Equity compensation | 9,081 | 12,792 | 10,932 | 13,715 | 2,010 | |||||||||||
EBITDAX | $ | 757,708 | $ | 469,885 | $ | 372,115 | $ | 285,344 | $ | 116,498 | ||||||
The following discussion should be read in conjunction with the Company'sour historical consolidated financial statements and notes, thereto andas well as the selected historical consolidated financial data, included elsewhere herein.
OVERVIEW
The Company's revenue, profitabilityin this report.
Overview
We are engaged in oil and cash flownatural gas exploration, exploitation and production activities in the Rocky Mountain, Mid-Continent and Gulf Coast regions of the United States. Crude oil comprised 67% of our 159.3 MMBoe of estimated proved reserves as of December 31, 2008 and 76% of our 12,006 MBoe of production for the year then ended. We seek to operate wells in which we own an interest, and we operated wells that accounted for 91% of our PV-10 and 76% of our 2,192 gross wells as of December 31, 2008. By controlling operations, we are substantially
dependent upon prevailing prices forable to more effectively manage the cost and timing of exploration and development of our properties, including the drilling and fracture stimulation methods used.
Our business strategy has focused on reserve and production growth through exploration and development. For the three-year period ended December 31, 2008, we added 81,306 MBoe of proved reserves through extensions and discoveries, compared to 2,649 MBoe added through purchases. During this period, our production increased from 9,018 MBoe in 2006 to 12,006 MBoe in 2008. An aspect of our business strategy has been to acquire large undeveloped acreage positions in new or developing resource plays. As of December 31, 2008, we held approximately 2,025,956 gross (1,114,445 net) undeveloped acres, including 479,435 net acres in the Bakken field in Montana and North Dakota and 59,697 net acres in the Arkoma Woodford and Lewis Shale projects. As an early entrant in new or emerging plays, we expect to acquire undeveloped acreage at a lower cost than those of later entrants into a developing play.
In the year ended December 31, 2008, our oil and gas production increased to 12,006 MBoe (32,803 Boe per day), up 13% from the year ended December 31, 2007. The increase in 2008 production primarily resulted from an increase in production from our Red River units, Bakken field and Arkoma Woodford. Oil and natural gas revenues for the year 2008 increased by 55% to $939.9 million due to increases in volumes and commodity prices. Our realized price per Boe increased $19.35 to $77.66 for the year 2008 compared to the year 2007. While we experienced increases in production expense and production tax of a combined total of $51.2 million, or 47%, our increase in combined per unit cost was only 26%, or $2.76 per Boe, due to the increase in sales volumes of 1,702 MBoe, or 16%. Oil sales volumes were 97 MBbls more than oil production for the year ended December 31, 2008 due to temporarily stored barrels being sold during the year and gas
it produces. The Company produced more oil sales volumes were 221 MBbls less for the same period in 2007 due to an increase in crude oil inventory for pipeline line fill and gas in 2002 than in 2001. Average
wellhead prices during 2002 were $22.90 per Bbl of oil and $2.46 per Mcf of
natural gas compared to $24.05 per Bbl of oil and $3.41 per Mcf of natural gas
during 2001
The Company uses the successful efforts method of accounting for its
investment in oil and gas properties. Under the successful efforts method of
accounting, costs to acquire mineral interests in oil and gas properties, to
drill and provide equipment for exploratory wells that find proved reserves and
to drill and equip development wells are capitalized. These costs are amortized
to operations on a unit-of-production method based on petroleum engineering
estimates. Geological and geophysical costs, lease rentals and costs associated
with unsuccessful exploratory wells are expensed as incurred. Maintenance and
repairs are expensed as incurred, except that the cost of replacements or
renewals that expand capacity or improve production are capitalized. Significant
downward revisions of quantity estimates or declines in oil and gas prices that
are not offset by other factors could result in a writedown for impairment of
the carrying value of oil and gas properties. Once incurred, a writedown of an
oil and gas property is not reversible at a later date, even if oil or gas
prices increase.
The Company is an S-Corporation for federal income tax purposes. The
Company currently anticipates it will pay periodic dividends in amounts
sufficient to enable the Company's stockholders to pay their income tax
obligations with respect to the Company's taxable earnings. Based upon funds
available to the Company under its credit facility and the Company's anticipatedstored barrels. Our cash flow from operating activities for the Company does not currentlyyear ended December 31, 2008, was $719.9 million, an increase of $329.3 million from $390.6 million provided by our operating activities during the comparable 2007 period. The increase in operating cash flows was mainly due to increases in sales prices and volumes partially offset by increased production expenses and production taxes. During the year ended December 31, 2008, we invested $988.6 million (inclusive of non-cash accruals of $41.1 million) in our capital program concentrating mainly in the Red River units, the Bakken field and the Arkoma Woodford play.
As a response to significantly lower oil and natural gas prices during the fourth quarter of 2008 and continuing into 2009 and the resulting decrease in cash flows, we have significantly reduced our capital expenditures budget for 2009. We have reduced our rig count from 32 operated rigs in October 2008 to 8 operated rigs in early February 2009. While we have an approved capital expenditures budget for 2009 of $275 million, we expect to manage our capital expenditures for the year to be inline with our cash flows from operations. Continued weakness in commodity prices may result in a decrease in our actual capital expenditures during 2009. Conversely, a significant improvement in product prices could result in an increase in our capital expenditures. See—“Liquidity and Capital Resources.”
How We Evaluate Our Operations
We use a variety of financial and operational measures to assess our performance. Among these distributions to materially impact the Company's liquidity.
RESULTS OF OPERATIONSmeasures are (1) volumes of oil and natural gas produced, (2) oil and natural gas prices realized, (3) per unit operating and administrative costs and (4) EBITDAX. The following tables set forthtable contains financial and operational highlights for each of the three years ended December 31, 2008.
| Year ended December 31, | |||||||||
| 2008 | 2007 | 2006 | |||||||
Average daily production: | |||||||||
Oil (Bopd) | 24,993 | 23,832 | 20,494 | ||||||
Natural gas (Mcfd) | 46,861 | 31,599 | 25,274 | ||||||
Oil equivalents (Boepd) | 32,803 | 29,099 | 24,706 | ||||||
Average prices:(1) | |||||||||
Oil ($/Bbl) | $ | 88.87 | $ | 63.55 | $ | 55.30 | |||
Natural gas ($/Mcf) | 6.90 | 5.87 | 6.08 | ||||||
Oil equivalents ($/Boe) | 77.66 | 58.31 | 52.09 | ||||||
Production expense ($/Boe)(1) | 8.40 | 7.35 | 6.99 | ||||||
General and administrative expense ($/Boe)(1) | 2.95 | 3.15 | 3.45 | ||||||
EBITDAX (in thousands)(2) | 757,708 | 469,885 | 372,115 | ||||||
Net income (in thousands)(3) | 320,950 | 28,580 | 253,088 | ||||||
Pro forma net income (in thousands)(4) | 184,002 | 156,833 | |||||||
Diluted net income per share | 1.89 | 0.17 | 1.59 | ||||||
Pro forma diluted net income per share(4) | 1.11 | 0.96 | |||||||
| (1) | Oil sales volumes were 97 MBbls more than oil production for the year ended December 31, 2008 due to the sale of temporarily stored barrels. Oil sales volumes were 221 MBbls less than oil production for the year ended December 31, 2007 and 21 MBbls less than oil production for the year ended December 31, 2006 due to temporary storage and pipeline line fill. Average prices and per unit expenses have been calculated using sales volumes and excluding any effect of derivative transactions. |
| (2) | EBITDAX represents earnings before interest expense, income taxes (when applicable), depreciation, depletion, amortization and accretion, property impairments, exploration expense, unrealized derivative gains and losses and non-cash compensation expense. EBITDAX is not a measure of net income or cash flow as determined by GAAP. A reconciliation of net income to EBITDAX is provided in “Item 6. Selected Financial Data.” |
| (3) | Prior to our initial public offering, we were a subchapter S corporation and income taxes were payable by our shareholders and as a result, there was a minimal provision for income taxes for the periods ended December 31, 2006. See Notes to Consolidated Financial Statements—Note 1. Organization and Summary of Significant Accounting Policies—Income taxes. In connection with our initial public offering, we converted to a subchapter C corporation and recorded a charge to earnings in the second quarter of 2007 of $198.4 million to recognize deferred taxes relating to the temporary differences that existed at May 14, 2007, the date we converted to a subchapter C corporation. |
| (4) | Pro forma adjustments are reflected to provide for income taxes in accordance with SFAS No. 109 as if we had been a subchapter C corporation for all periods presented. A statutory Federal tax rate of 35% and effective state tax rate of 3% (net of Federal income tax effects) were used for the pro forma enacted tax rate for all pro forma periods presented. |
Results of Operation
The following table presents selected financial and operating information for each of the three years ended December 31, 2008:
| Year Ended December 31, | ||||||||||||
(in thousands, except price data) | 2008 | 2007 | 2006 | |||||||||
Oil and natural gas sales | $ | 939,906 | $ | 606,514 | $ | 468,602 | ||||||
Derivatives | (7,966 | ) | (44,869 | ) | — | |||||||
Total revenues | 960,490 | 582,215 | 483,652 | |||||||||
Operating costs and expenses | 431,167 | 274,248 | 221,128 | |||||||||
Other expense | 10,793 | 11,190 | 9,568 | |||||||||
Net income, before income taxes | 518,530 | 296,777 | 252,956 | |||||||||
Provision (benefit) for income taxes(1) | 197,580 | 268,197 | (132 | ) | ||||||||
Net income | $ | 320,950 | $ | 28,580 | $ | 253,088 | ||||||
Production Volumes: | ||||||||||||
Oil (MBbl) | 9,147 | 8,699 | 7,480 | |||||||||
Natural gas (MMcf) | 17,151 | 11,534 | 9,225 | |||||||||
Oil equivalents (MBoe) | 12,006 | 10,621 | 9,018 | |||||||||
Sales Volumes: | ||||||||||||
Oil (MBbl) | 9,244 | 8,478 | 7,459 | |||||||||
Natural gas (MMcf) | 17,151 | 11,534 | 9,225 | |||||||||
Oil equivalents (MBoe) | 12,103 | 10,400 | 8,997 | |||||||||
Average Prices:(2) | ||||||||||||
Oil ($/Bbl) | $ | 88.87 | $ | 63.55 | $ | 55.30 | ||||||
Natural gas ($/Mcf) | $ | 6.90 | $ | 5.87 | $ | 6.08 | ||||||
| (1) | Prior to the public offering, we were a subchapter S corporation and income taxes were payable by our shareholders and as a result, there was a minimal provision for income taxes for the periods ended December 31, 2006. See Notes to Consolidated Financial Statements—Note 1. Organization and Summary of Significant Accounting Policies—Income taxes. In connection with the public offering, we converted to a subchapter C corporation and recorded a charge to earnings in the second quarter of 2007 of $198.4 million to recognize deferred taxes relating to the temporary differences that existed at May 14, 2007, the date we converted to a subchapter C corporation. |
| (2) | Oil sales volumes were 97 MBbls more than oil production for the year ended December 31, 2008 due to the sale of temporarily stored barrels. Oil sales volumes were 221 MBbls less than oil production for the year ended December 31, 2007 and 21 MBbls less than oil production for the year ended December 31, 2006 due to temporary storage and pipeline line fill. Average prices and per unit expenses have been calculated using sales volumes and excluding any effect of derivative transactions. |
Year ended December 31, 2008 compared to the year ended December 31, 2007
Production
The following tables reflect our production by product and region for the periods presented.
| Year Ended December 31, | Volume Increase | Percent Increase | |||||||||||||
| 2008 | 2007 | ||||||||||||||
| Volume | Percent | Volume | Percent | ||||||||||||
Oil (MBbl) | 9,147 | 76 | % | 8,699 | 82 | % | 448 | 5 | % | ||||||
Natural Gas (MMcf) | 17,151 | 24 | % | 11,534 | 18 | % | 5,617 | 49 | % | ||||||
Total (MBoe) | 12,006 | 100 | % | 10,621 | 100 | % | 1,385 | 13 | % | ||||||
| Year Ended December 31, | Volume Increase | Percent Increase | |||||||||||||
| 2008 | 2007 | ||||||||||||||
| MBoe | Percent | MBoe | Percent | ||||||||||||
Rocky Mountain | 9,246 | 77 | % | 8,619 | 81 | % | 627 | 7 | % | ||||||
Mid-Continent | 2,547 | 21 | % | 1,794 | 17 | % | 753 | 42 | % | ||||||
Gulf Coast | 213 | 2 | % | 208 | 2 | % | 5 | 2 | % | ||||||
Total (MBoe) | 12,006 | 100 | % | 10,621 | 100 | % | 1,385 | 13 | % | ||||||
Oil production volumes increased 5% during the year ended December 31, 2008 in comparison to the year ended December 31, 2007. Production increases in the periods indicated:
Revenues
Oil and Natural Gas Sales. Oil and natural gas sales for the year ended December 31, 2008 were $939.9 million, a 55% increase from sales of $606.5 million for 2007. Our sales volumes increased 1,703 MBoe or 16% over the 2007 volumes due to the classifications currently followed. Such reclassifications docontinuing success of our enhanced oil recovery and drilling programs. Our realized price per Boe increased $19.35 to $77.66 for the year ended December 31, 2008 from $58.31 for the year ended December 31, 2007. During 2008, the differential between NYMEX calendar month average crude oil prices and our realized crude oil prices widened. The differential per barrel for the year ended December 31, 2008 was $9.50 compared to $8.85 for 2007. Factors contributing to the higher differentials in 2008 included Canadian oil imports, increases in production in the Rocky Mountain region, coupled with downstream transportation capacity constraints, refinery downtime in the Rocky Mountain region, and reduced seasonal demand for gasoline.
Derivatives. In July 2007, we entered into fixed-price swap contracts covering 10,000 barrels of oil per day for the period from August 2007 through April 2008. During each month of the contract, we received a fixed-price of $72.90 per barrel and paid to the counterparties the average of the prompt NYMEX crude oil futures contract settlement prices for such month. SFAS No. 133,“Accounting for Derivative Instruments and Hedging Activities” requires recognition of all derivative instruments on the balance sheet as either assets or liabilities measured at fair value. We elected not affect earnings.
REVENUES
OIL AND GAS SALESto designate our derivatives as cash flow hedges under the provisions of SFAS No. 133. As a result, we marked our derivative instruments to fair value in accordance with the provisions
of SFAS No. 133 and recognized the realized and unrealized change in fair value as a gain (loss) on derivative instruments in the statements of income. These contracts expired in April 2008 and during the year ended December 31, 2008, we had recognized losses on derivatives of $8.0 million. We did not have any open derivative positions at December 31, 2008.
Oil and Natural Gas Service Operations. Our oil and natural gas service operations consist primarily of sales of high-pressure air and the treatment and sale of lower quality crude oil, or reclaimed oil. We sold high-pressure air from our Red River units to a third party and recorded revenues of $3.0 million for the year ended December 31, 2008 and revenues of $3.1 million for the year ended December 31, 2007. Prices for reclaimed oil sold from our central treating unit were higher for the year ended December 31, 2008 than the comparable 2007 period. The price increased $27.45 per barrel which increased reclaimed oil income by $6.5 million contributing to an overall increase in oil and gas service operations revenue of $8.0 million for the year ended December 31, 2008. Associated oil and natural gas service operations expenses increased $5.5 million to $18.2 million during the year ended December 31, 2008 from $12.7 million during the year ended December 31, 2007 due mainly to an increase in the costs of purchasing and treating oil for resale compared to the same period in 2007.
Operating Costs and Expenses
Production Expense and Tax. Production expense increased $25.1 million, or 33%, during the year ended December 31, 2008 to $101.6 million from $76.5 million during the year ended December 31, 2007. The increase in production expense is partially attributable to our increase in sales volumes of 16% which is a direct result of new wells being drilled and escalating field service costs. During the year ended December 31, 2008, we participated in the completion of 359 gross (152.5 net) wells. Production expense per Boe increased to $8.40 for the year ended December 31, 2008 from $7.35 per Boe for the year ended December 31, 2007.
Production taxes increased $26.0 million, or 80%, during the year ended December 31, 2008 compared to the year ended December 31, 2007 as a result of higher revenues resulting from increased sales prices and volumes and the expiration of various tax incentives. The majority of the production tax increase was in the Mid-Continent and Rocky Mountain regions due to an increase of 1,697 MBoe sold in the year ended December 31, 2008 compared to the year ended December 31, 2007. Production tax as a percentage of oil and natural gas sales revenuewas 6.2% for 2002 decreased $3.4 million,the year ended December 31, 2008 compared to 5.4% for the year ended December 31, 2007. Production taxes are based on the wellhead values of production and vary by state. Additionally, some states offer exemptions or 3%,reduced production tax rates for wells that produce less than a certain quantity of oil or gas and to $108.8 million from $112.2encourage certain activities, such as horizontal drilling and enhanced recovery projects. In Montana, North Dakota and Oklahoma new horizontal wells qualify for a tax incentive and are taxed at a lower rate during their initial months of production. After the incentive period expires, the tax rate increases to the statutory rates. Our overall rate is expected to increase as production tax incentives we currently receive for horizontal wells reach the end of their incentive period.
On a unit of sales basis, production expense and production taxes were as follows:
| Year Ended December 31, | Percent Increase | ||||||||
($/Boe) | 2008 | 2007 | |||||||
Production expense | $ | 8.40 | $ | 7.35 | 14 | % | |||
Production tax | 4.84 | 3.13 | 55 | % | |||||
Production expense and tax | $ | 13.24 | $ | 10.48 | 26 | % | |||
Exploration Expense. Exploration expense consists primarily of dry hole costs and exploratory geological and geophysical costs that are expensed as incurred. Exploration expense increased $31.0 million in 2001the year ended December 31, 2008 to $40.2 million due primarily to a loss on hedging
activityan increase in dry hole expense of $4.9$16.5 million to $20.0 million and an increase in 2002 and a decreaseseismic expense of $14.0 million to $16.9 million. The majority of the dry hole costs were in gas prices. Gas prices
decreased $0.95/Mcf, or 28%, from an average of $3.41/Mcf in 2001 to $2.46/Mcf
in 2002.
CRUDE OIL MARKETING
We discontinued our crude oil trading activities effective May 2002. Prior
to May 2002, we entered into third party contracts to purchase and resell crude
oil. Although we no longer enter into third party contracts, we did continue to
repurchase our physical production from the Rockies and resell equivalent
barrels at Cushing to take advantage of better pricing and to reduce our credit
exposure from sales to our first purchaser. We present sales and purchases of
our production fromRocky Mountain region for the Rockies as crude oil marketing income and crude oil
marketing expense, respectively. For the year to date periodyears ended December 31, 2002, we recognized revenue2008 and 2007.
Depreciation, Depletion, Amortization and Accretion (DD&A). Total DD&A increased $55.3 million in 2008 primarily due to an increase in oil and gas DD&A of $153.5$54.4 million on crudeas a result of increased production and additional properties being added through our drilling program and acquisitions. Additionally, DD&A increased as a result of the decrease in commodity prices used to calculate year end reserves volumes. Lower prices have the effect of decreasing the economic life of oil marketing activities
from January 2002 thru May 2002,and gas properties, which lowers future reserve volumes and increases DD&A. The following table shows the components of our DD&A rate.
| Year Ended December 31, | ||||||
($/Boe) | 2008 | 2007 | ||||
Oil and gas | $ | 11.91 | $ | 8.63 | ||
Other equipment | 0.22 | 0.19 | ||||
Asset retirement obligation accretion | 0.17 | 0.18 | ||||
Depreciation, depletion, amortization and accretion | $ | 12.30 | $ | 9.00 | ||
Property Impairments. Property impairments, both non-producing and developed, increased in the year ended December 31, 2008 by $10.9 million to $28.8 million compared to income$17.9 million during the year ended December 31, 2007. Impairment of $245.9non-producing properties increased $3.3 million during the year ended December 31, 2008 to $16.5 million compared to $13.2 million for 2007 reflecting higher amortization of lease costs in our existing fields resulting from further defining likely drilling locations and amortization of new fields. Non-producing properties consist of undeveloped leasehold costs and costs associated with the purchase of certain proved undeveloped reserves. Non-producing properties are amortized on a composite method based on our estimated experience of successful drilling and the average holding period.
Impairment provisions for developed oil and gas properties were approximately $12.3 million for the year ended December 31, 2008 compared to approximately $4.7 million for the year ended December 31, 2007, an increase of $7.6 million, or 161%. We evaluate our developed oil and gas properties for impairment by comparing their cost basis to the estimated future cash flows on a field basis. If the cost basis is in excess of estimated future cash flows, then we impair it based on an estimate of fair market value based on discounted cash flows. Impairments in 2008 reflect uneconomic drilling results in certain small fields primarily in our Mid-Continent region and our Rockies Other area which resulted in impairments of $8.8 million in 2008. The significant decrease in oil and gas prices at December 31, 2008 resulted in 2008 impairments of $3.5 million. Impairments in 2007 were primarily related to uneconomic wells in our Gulf region and certain small fields primarily in our Mid-Continent region.
General and Administrative Expense. General and administrative expense increased $2.9 million to $35.7 million during the year ended December 31, 2008 from $32.8 million during the comparable period of 2007. General and administrative expense includes non-cash charges for stock-based compensation of $9.1 million and $12.8 million for the years ended December 31, 2008 and 2007, respectively. Stock compensation expense was higher in 2007 due to an increase in the value of our stock as we approached our initial public offering. Until our initial public offering in May 2007, the outstanding options and restricted stock were accounted for as liability awards and their value fluctuated with the value of the underlying stock. General and administrative expense excluding equity compensation increased $7.2 million for the twelve months ended December 31, 2001
GATHERING, MARKETING AND PROCESSING
Our 2002 gathering, marketing and processing revenues decreased $11.3
million, or 25%, to $33.7 million2008 compared to $45.0 million for 2001. Of this
decrease, $10.3 million was attributable to operations from the Eagle Chief
Plant in Oklahoma, $1.1 million from the south Texas gathering systems, Driscoll
and Arend, $0.8 million was from the Matli, Badlands and Worland gas gathering
systems. These decreases were offset by increases in the remaining gas gathering
systems, including an increase from the North Enid Plant in Oklahoma of $1.9
million. The decreases were due to lower natural gas and natural gas liquids
prices in 2002.
OIL AND GAS SERVICE OPERATIONS
Our oil and gas service operations revenues decreased $0.3 million, or 5%,
to $5.7 million in 2002 from $6.0 million in 2001 due primarily to lower volumes
of reclaimed oil sales from our central treating unit.
COSTS AND EXPENSES
PRODUCTION EXPENSES AND TAXES
Our production expenses and taxes were $36.1 million for 2002, a decrease
of $0.7 million, or 2%, over the 2001 expenses of $36.8 million, primarily as a
result of decreased energy costs and taxes of $1.8 million offset by increases
in all other areas of direct costs associated with the Company's operations.
EXPLORATION EXPENSE
Our exploration expenses decreased $5.6 million, or 35%, to $10.2 million
in 2002 from $15.8 million in 2001. The decrease was attributable to a $6.9
million decrease in dry hole expenses, offset by a $1.3 million increase in
seismic and geological and geophysical expenses along with a $0.9 million
increase in other expenses.
CRUDE OIL MARKETING EXPENSE
We discontinued our crude oil trading activities effective May 2002. Prior
to May 2002, we entered into third party contracts to purchase and resell crude
oil. Although we no longer enter into third party contracts, we did continue to
repurchase our physical production from the Rockies and resell equivalent
barrels at Cushing to take advantage of better pricing and to reduce our credit
exposure from sales to our first purchaser. We present sales and purchases of
our production from the Rockies as crude oil marketing income and crude oil
marketing expense, respectively. For the year ended December 31, 2002, we
recognized an expense of $152.7 million on crude oil marketing activities from
January 2002 thru May 2002, compared to an expense of $245.0 million for the twelve months ended December 31, 2001
GATHERING, MARKETING AND PROCESSING
Our gathering, marketing and processing expense for 2002 was $29.8 million,
a decrease of $6.6 million, or 18%, from the $36.4 million incurred in 2001. Of
this decrease, $8.3 million was attributable to the Eagle Chief Plant in
Oklahoma which was offset by increases of $1.8 million from the North Enid Plant
in Oklahoma and $0.8 million from the Arend gathering system in Texas. The
decrease is a result of lower natural gas and natural gas liquids prices in
2002.
OIL AND GAS SERVICE OPERATIONS
Our oil and gas service operations expenses increased by $1.2 million, or
22%, to $6.5 million in 2002 from $5.3 million in 2001.2007. The increase was primarily related to a $6.6 million increase in personnel costs due to the cost of purchasingadditional employees and treating reclaimed oilhigher wages and increased benefits. On a volumetric basis, general and administrative expense was $2.95 per Boe for resale by $0.4 million,
salaries increased $0.3 million and general repairs and maintenance made up the
difference of $0.4 million.
DEPRECIATION, DEPLETION AND AMORTIZATION ("DD&A")
For the year ended December 31, 2002, total DD&A expense was $31.3 million,
a $3.6 million, or 13%, increase over the 2001 expense of $27.7 million. The
increase was due to the DD&A associated with the Farrar assets acquired in July
2001, which were depreciated for a full year in 2002 and increased depreciation
by $0.7 million. Depreciable and depletable assets increased $86.2 million from
2001 to 2002, which also increased DD&A expense.
PROPERTY IMPAIRMENTS
During 2002, we recorded property impairments of $25.7 million,2008 compared to $10.1 million in 2001, a $15.6 million, or 154%, increase from last year. The
majority of this impairment was related to our Bepco acquisition in the Worland
Field. The Bepco acquisition included 466 proved undeveloped ("PUD") locations
with a PV-10 value of $145.5 million. We allocated $26.7 million to these
potential locations as part of the acquisition price. We have not developed any
of the identified PUD locations during the past 4-1/2 years due to capital
constraints imposed by our development of the Cedar Hills Field. A recent review
of the PUD valuation made by our reservoir-engineering department of the
original Ryder Scott report indicates that their analysis of reserve potential
was accurate$3.15 per Boe for the up-dip portion of the field, but potentially not applicable
to all identified PUD locations. We have initiated a detailed review of the PUD
locations by a consulting firm and expect to have a report during the third
quarter of 2003. This review will involve geostatistical analysis of all
available data and development of a neural network correlation to predict well
performance. Economic analysis of specific locations and subsequent
recommendation for drilling will follow this study.
We may be required to write-down the carrying value of our oil and gas
properties when oil and gas prices are depressed or unusually volatile, which
would result in a charge to earnings. Once incurred, a write-down of oil and gas
properties is not reversible at a later date. We recorded a $5.3 million FASB
121 write-down in 2001 and a $2.3 million FASB 121 write-down in 2002.
GENERAL AND ADMINISTRATIVE ("G&A")
Our G & A expense for 2002 was $10.7 million, an increase of $1.9 million,
or 22%, from G&A expenses for 2001 of $8.8 million, primarily attributable to
increased salaries and employment expenses due to an increased number of
employees in 2002.
INTEREST INCOME
Our interest income for 2002 was $0.3 million compared to $0.6 million for
2001, a decrease of $0.3 million or 50%. The decrease in the 2002 period is
attributable to lower interest rates and levels of cash invested during 2002.
INTEREST EXPENSE
Our interest expense for 2002 was $18.4 million, an increase of $2.7
million or 17% from $15.7 million in 2002. The increase in the 2002 expense was
the additional interest paid on our credit facilityyear ended December 31, 2007 due to higher average debt
balances outstanding.
OTHER INCOME
Our other incomesales volumes.
Interest Expense. Interest expense decreased $2.6 million6%, or 75%, to $0.9$0.8 million, for the year ended December 31, 2002, from $3.5 million for 2001. Other income in 2001
reflects a gain on our sale of 62 uneconomical wells for $3.4 million, an
extraordinary gain of $0.1 million on the repurchase of $3.0 million of our
senior notes in 2001, and a gain of $0.3 million on the sale of miscellaneous
assets in 2002.
NET INCOME
Our net loss for 2002 was $20.0 million, a decrease of $31.7 million,2008 compared to net income of $11.7 million in 2001. This decrease reflects, among
other items, the lower gas prices, which created a decrease in gas revenues of
$8.0 million, an increase in DD&A expense and property impairments of $18.6
million, a $4.5 million decrease in gathering, marketing and processing margins,
an increase in interest expense of $2.1 million, and a decrease in other income
of $2.6 million.
YEAR ENDED DECEMBER 31, 2001 COMPARED TO YEAR ENDED DECEMBER 31, 2000
Certain amounts applicable to the prior periods have been reclassified to
conform to the classifications currently followed. These reclassifications do
not affect our net income.
OIL AND GAS SALES
Our oil and gas sales revenues for 2001 decreased $3.3 million, or 3%, to
$112.2 million from $115.5 million in 2000 due primarily to a decrease of $3.54
per barrel or 13% in oil prices from an average of $27.41 per barrel in 2000 to
$23.87 per barrel in 2001. This decrease in oil prices was offset by an increase
of $0.50 per Mcf or 17%, in average gas sales price from an average of $2.91 per
Mcf in 2000 to $3.41 per Mcf in 2001.
CRUDE OIL MARKETING
We recognized a decrease in revenues on crude oil purchased for resale for
2001 of $34.0 million, or 12%, to $245.8 million from $279.8 million for 2000.
Total volumes decreased approximately 1.1 million barrels along with the
decrease in oil prices resulted in the decrease in crude oil marketing revenues.
GATHERING, MARKETING AND PROCESSING
Our 2001 gathering, marketing and processing revenues increased $12.2
million, or 37%, to $45.0 million compared to $32.8 for 2000. Of this increase,
$5.3 million was attributable to operations from our south Texas gathering
systems, $2.2 million was attributable to our Eagle Chief Plant in Oklahoma, and
$1.5 million was attributable to our Matli gas gathering system in Oklahoma. The
balance of the increase was due to an increase in gas prices. These increases
were offset by our sale of the Rattlesnake and Enterprise gathering systems in
January 2000.
OIL AND GAS SERVICE OPERATIONS
Our oil and gas service operations revenues increased 5% to $6.0 million in
2001 from $5.8 million in 2000.
COSTS AND EXPENSES
PRODUCTION EXPENSES AND TAXES
Our production expenses and taxes were $36.8 million for 2001, a $7.0
million or 23% increase over the 2000 expenses of $29.8 million, primarily as a
result of increased production volumes and energy costs. The increase was seen
in all areas of direct costs associated with our operations, except taxes. Taxes
decreased by approximately $1.0 million due to lower oil prices.
EXPLORATION EXPENSE
Our exploration expenses increased $5.9 million, or 59%, to $15.9 million
in 2001 from $10.0 million in 2000. The increase was attributable to a $6.2
million increase in dry hole expenses and a $0.3 million decrease in seismic and
geological/geophysical expenses.
CRUDE OIL MARKETING
Our expense for crude oil purchased for resale decreased $33.8 million, or
12%, to $245.0 million in 2001 from $278.8 million in 2000. This decrease was
caused by decreased crude oil prices and reduced volumes of crude oil purchased.
GATHERING, MARKETING AND PROCESSING
Our gathering, marketing and processing expense for 2001 was $36.4 million,
an increase of $8.1 million or 29% from the $28.3 million we incurred in 2000,
due to increased system volumes resulting from the expansion of our existing
facilities, the construction and operation of our new gathering and compression
facilities in Texas, and higher natural gas and liquid prices.
OIL AND GAS SERVICE OPERATIONS
Our oil and gas service operations expenses decreased by $0.3 million or
5%, to $5.3 million in 2001 from $5.6 million in 2000. The decrease was
primarily due to salt water disposal operating expenses.
DEPRECIATION, DEPLETION AND AMORTIZATION ("DD&A")
For the year ended December 31, 2001, our total DD&A expense was $27.7
million, an $8.1 million or 42% increase over the 2000 expense of $19.6 million.
In 2001, our lease and well DD&A was $24.0 million, an increase of $6.6 million
from $17.4 million in 2000. The increase was primarily attributable to DD&A
associated with the assets of Farrar Oil Company that we acquired in July 2001,
and an increased FASB 121 write-down. We may be required to write-down the
carrying value of our oil and gas properties when oil and gas prices are
depressed or unusually volatile, which would result in a charge to earnings.
Once incurred, a write-down of oil and gas properties is not reversible at a
later date. We recorded a $1.7 million FASB 121 write-down in 2000 and a $5.3
million FASB 121 write-down in 2001. For 2001, DD&A expense on oil and gas
properties amounted to $4.90 per Boe compared to $3.71 per Boe in 2000.
GENERAL AND ADMINISTRATIVE ("G&A")
Our G & A expense for 2001 was $8.8 million, an increase of $1.7 million,
or 23%, from G&A expenses for 2000 of $7.1 million. The increase is primarily
attributable to an increase in our employment expenses, legal costs, and our
acquisition of the assets of Farrar Oil Company in July 2001.
INTEREST INCOME
Our interest income for 2001 was $0.6 million compared to $0.8 million for
2000, a decrease of $0.2 million or 25%. The decrease in the 2001 period was
attributable2007, due to lower levels of cash invested during 2001.
INTEREST EXPENSE
Our interest expense for 2001 was $15.7 million, a decrease of $0.8
million, or 5%, from $16.5 million in 2000. The decrease in the 2001 expense was
attributable primarily to the reduction in interest rates on borrowings under
our credit facility in 2001 and the purchase and retirement of $3.0 million of
our outstanding senior notes.
OTHER INCOMEduring 2008 partially offset by higher debt balances. Our other income decreased $1.0 million or 21%,average debt balance increased to $3.5$248.7 million for the year ended December 31, 2001, from $4.52008 compared to $182.2 million for 2000. This decrease reflectsthe year ended December 31, 2007, but the weighted average interest rate on our
revolving credit facility was 1.93% lower at 4.54% for the year ended December 31, 2008 compared to 6.47% for the same period in 2007. At December 31, 2008 our outstanding debt balance was $376.4 million with a $2.4weighted average interest rate of 4.11%.
Income Taxes. Income taxes for the year ended December 31, 2008 were $197.6 million gaincompared to $268.2 million for the year ended December 31, 2007. The 2007 taxes included $198.4 million recorded to recognize deferred taxes upon the conversion from a subchapter S corporation to a subchapter C corporation on our saleMay 14, 2007 for temporary differences that existed at that date primarily as a result of Arkoma Basin propertiesdeducting intangible drilling costs for tax purposes. We provide taxes at a combined federal and an extraordinary
gainstate tax rate of $0.7 million on our repurchase of senior notes during the 2000 period,approximately 38% after taking into account permanent taxable differences. See Notes to Consolidated Financial Statements –Note 7 for more information.
Year ended December 31, 2007 compared to the year ended December 31, 2006
Production
The following tables reflect our production by product and region for the periods presented.
| Year Ended December 31, | Volume increase | Percent increase | ||||||||||||||
| 2007 | 2006 | |||||||||||||||
| Volume | Percent | Volume | Percent | |||||||||||||
Oil (MBbl)(1) | 8,699 | 82 | % | 7,480 | 83 | % | 1,219 | 16 | % | |||||||
Natural Gas (MMcf) | 11,534 | 18 | % | 9,225 | 17 | % | 2,309 | 25 | % | |||||||
Total (MBoe) | 10,621 | 100 | % | 9,018 | 100 | % | 1,603 | 18 | % | |||||||
| Year Ended December 31, | Volume increase (decrease) | Percent increase (decrease) | ||||||||||||||
| 2007 | 2006 | |||||||||||||||
| MBoe | Percent | MBoe | Percent | |||||||||||||
Rocky Mountain(1) | 8,619 | 81 | % | 7,159 | 79 | % | 1,460 | 20 | % | |||||||
Mid-Continent | 1,794 | 17 | % | 1,497 | 17 | % | 297 | 20 | % | |||||||
Gulf Coast | 208 | 2 | % | 362 | 4 | % | (154 | ) | (43 | )% | ||||||
Total (MBoe) | 10,621 | 100 | % | 9,018 | 100 | % | 1,603 | 18 | % | |||||||
| (1) | Oil sales volumes are 221 MBbls and 21 MBbls less than oil production volumes for the years ended 2007 and 2006, respectively, due to temporary storage and pipeline linefill. |
Oil production volumes increased 16% during the year ended December 31, 2007 in comparison to the year ended December 31, 2006. Production increases in the Red River units contributed incremental volumes in excess of 2006 levels of 849 MBbls, and the Bakken field contributed 426 MBbls of incremental production. Initial production commenced in the Bakken field in August 2003 and has increased thereafter, as we have continued exploration and development activities within the Montana and North Dakota portions of the field. Favorable results from our enhanced recovery program and increased density drilling have been the primary contributors to production growth in the Red River units. Gas volumes increased 2,309 MMcf, or 25%, during the year ended December 31, 2007 compared to 2006. The majority of the increase, 1,833 MMcf, was from the Mid-Continent region due to the results of our exploration efforts in the Arkoma Woodford. The Rocky Mountain gas production was up 1,227 MMcf for the year ended December 31, 2007 compared to 2006. The new Hiland Partners Badlands Plant became operational in late August 2007. Through December 31, 2007, we sold 672 MMcf of gas from the Red River units through the new plant. We have invested a minimal amount of capital in our Gulf Coast region resulting in a decline in production in this area of 751 MMcf for the year ended December 31, 2007 compared to 2006.
Revenues
Oil and Natural Gas Sales. Oil and natural gas sales for the year ended December 31, 2007 were $606.5 million, a 29% increase from sales of $468.6 million for 2006. Our sales volumes increased 1,403 MBoe, or 16%, over the 2006 volumes due to the continuing success of our enhanced oil recovery and drilling programs. Our realized price per Boe increased $6.22 to $58.32 for the year ended December 31, 2007 from $52.09 for the year ended December 31, 2006. During 2007, the differential between NYMEX calendar month average crude oil prices and our realized crude oil prices narrowed. The differential per barrel for the year ended December 31, 2007 was $8.85 compared to $11.04 for 2006. Factors contributing to the higher differentials in 2006 included Canadian oil imports, increases in production in the Rocky Mountain region, coupled with downstream transportation capacity constraints, refinery downtime in the Rocky Mountain region, and reduced seasonal demand for gasoline. Crude oil differentials were better during 2007 due to additional transportation capacity and efforts by us to move crude oil to more favorable markets.
During the fourth quarter of 2007, we elected not to sell some of our Rocky Mountain area crude oil as price differentials were unacceptable to us and we expected the differentials to improve in early 2008. This resulted in an increase in our crude oil inventory of 125,000 barrels. The price we were offered was adversely affected by seasonal demand. In the fourth quarter of 2007, we shipped some of our Rocky Mountain area crude by railcar to help alleviate this situation. We were able to sell the majority of this oil at improved differentials during January and February 2008.
Derivatives. In July 2007, we entered into fixed-price swap contracts covering 10,000 barrels of oil per day for the period from August 2007 through April 2008. During each month of the contract, we will receive a fixed-price of $72.90 per barrel and will pay to the counterparties the average of the prompt NYMEX crude oil futures contract settlement prices for such month. SFAS No. 133, “Accounting for Derivative Instruments and Hedging Activities” requires recognition of all derivative instruments on the balance sheet as either assets or liabilities measured at fair value. We elected not to designate our derivatives as cash flow hedges under the provisions of SFAS No. 133. As a result, we mark our derivative instruments to fair value in accordance with the provisions of SFAS No. 133 and recognize the realized and unrealized change in fair value as a gain (loss) on derivative instruments in the statements of income. During the year ended December 31, 2007, we had realized losses on derivatives of $18.2 million and unrealized losses on derivatives of $26.7 million.
Oil and Natural Gas Service Operations. Our oil and natural gas service operations consist primarily of sales of high-pressure air and the treatment and sale of 62 uneconomicallower quality crude oil, or reclaimed oil. We sold high-pressure air from our Red River units to a third party and recorded revenues of $3.1 million for the years ended December 31, 2007 and 2006. Prices for reclaimed oil sold from our central treating unit were higher for the year ended December 31, 2007 than the comparable 2006 period, and the number of barrels sold increased approximately 68,000 barrels which increased reclaimed oil income by $5.5 million contributing to an overall increase in oil and gas service operations revenue of $5.5 million for the year ended December 31, 2007. Associated oil and natural gas service operations expenses increased $4.5 million to $12.7 million during the year ended December 31, 2007 from $8.2 million during the year ended December 31, 2006 due mainly to an increase in additional barrels treated in 2007 and to an increase of $5.71 per barrel in the costs of purchasing and treating oil for resale compared to the same period in 2006.
Operating Costs and Expenses
Production Expense and Tax. Production expense increased $13.6 million, or 22%, during the year ended December 31, 2007 to $76.5 million from $62.9 million during the year ended December 31, 2006. The increase in production expense is commensurate with our increase in production of 18% which is a direct result of new wells being drilled. Additionally, we have experienced a slight increase in service and energy costs. During the year ended December 31, 2007, we participated in the completion of 262 gross (112.1 net) wells. Production expense per Boe increased to $7.35 per Boe for the year ended December 31, 2007 from $6.99 per Boe for the year ended December 31, 2006.
Production taxes increased $10.2 million, or 46% during the year ended December 31, 2007 compared to the year ended December 31, 2006 primarily as a result of higher revenues resulting from increased sales volumes and prices. The majority of the production tax increase was in the Rocky Mountain region due to an increase of 1,261 MBoe sold in the year ended December 31, 2007 compared to the year ended December 31, 2006. Production tax as a percentage of oil and natural gas sales was 5.4% for the year ended December 31, 2007 compared to 4.8% for the year ended December 31, 2006. Production taxes are based on the wellhead values of production and vary by state. Additionally, some states offer exemptions or reduced production tax rates for wells that produce less than a certain quantity of oil or gas and to encourage certain activities, such as horizontal drilling and enhanced recovery projects. In Montana, new horizontal wells qualify for a tax incentive and are taxed at 0.76% during the first 18 months of production. After the 18 month incentive period expires, the tax rate increases to 9.26%. During the year ended December 31, 2007, 32 wells had reached the end of the 18 month incentive period and the tax rate increased from 0.76% to 9.26%. Our overall rate is expected to increase as production tax incentives received for horizontal wells in 2001, which resultedMontana reach the end of the 18 month incentive period. We are also receiving a 6% tax incentive on horizontal wells drilled in the Arkoma Woodford play in Oklahoma that continues for up to four years or until the revenue from such well exceeds the cost to drill and complete. In North Dakota, we are receiving a gain4.5% tax credit on horizontal Bakken wells spud after July 1, 2007 and completed before June 30, 2008. The incentive expires on the earliest to occur of approximately $2.075,000 barrels of production or eighteen months.
On a unit of sales basis, production expense and production taxes were as follows:
| Year Ended December 31, | Percent Increase | ||||||||
($/Boe) | 2007 | 2006 | |||||||
Production expense | $ | 7.35 | $ | 6.99 | 5 | % | |||
Production tax | 3.13 | 2.48 | 26 | % | |||||
Production expense and tax | $ | 10.48 | $ | 9.47 | 11 | % | |||
Exploration Expense. Exploration expense consists primarily of dry hole costs and exploratory geological and geophysical costs that are expensed as incurred. Exploration expenses decreased $10.6 million in the year ended December 31, 2007 to $9.2 million due primarily to a decrease in dry hole expense of $9.8 million and an extraordinary gain of $0.1 million on the
repurchase of our senior notes in 2001.
NET INCOME
Our net income for 2001 was $11.7 million, a decrease in seismic expense of $26.1$0.9 million. The majority of the dry hole costs were in the Mid-Continent region in the 2006 period and in the Mid-Continent and Rocky Mountain regions in the same period in 2007. Dry hole costs were down in 2007 even though exploratory capital expenditures increased by approximately 144% as a result of more successful exploration activities.
Depreciation, Depletion, Amortization and Accretion (DD&A.). Total DD&A increased $28.2 million in 2007 primarily due to an increase in oil and gas DD&A of $27.9 million as a result of increased production and additional properties being added through our drilling program. The DD&A rate for the year ended December 31, 2007 was $9.00 per Boe, including $8.63 per Boe on oil and gas properties and $0.37 per Boe for other equipment and asset retirement obligation accretion, compared to $7.27 per Boe, including $6.91 per Boe for oil and gas properties and $0.36 per Boe for other equipment and asset retirement obligation accretion, for the same period in 2006. The increase in the oil and gas DD&A rate reflects the additional costs incurred to develop proved undeveloped reserves and the higher costs of drilling and completing wells.
Property Impairments. Property impairments increased in the year ended December 31, 2007 by $6.1 million to $17.9 million compared to $37.8$11.8 million during the year ended December 31, 2006. Impairment of non-producing properties increased $7.7 million during the year ended December 31, 2007 to $13.2 million compared to $5.5 million for 2006 reflecting higher amortization of lease costs in 2000. This decrease reflects among other items,
lowerour existing fields resulting from further defining likely drilling locations and amortization of new fields. Non-producing properties consist of undeveloped leasehold costs and costs associated with the purchase of certain proved undeveloped reserves. Individually significant non-producing properties are periodically assessed for impairment of value and a loss is
recognized at the time of impairment by providing an impairment allowance. Other non-producing properties are amortized on a composite method based on our estimated experience of successful drilling and the average holding period.
Impairment provisions for developed oil prices which created a decrease in oil revenuesand gas properties were approximately $4.7 million for the year ended December 31, 2007 compared to approximately $6.3 million for the year ended December 31, 2006.
General and Administrative Expense. General and administrative expense increased $1.7 million to $32.8 million during the year ended December 31, 2007 from $31.1 million during the comparable period of $8.8 million, an
increase in DD&A2006. General and property impairmentsadministrative expense includes non-cash charges for stock-based compensation of $14.3 million, an increase in
production expenses and taxes of $7.0$12.8 million and an$10.9 million for the years ended December 31, 2007 and 2006, respectively. The increase was due to new grants under the Continental Resources, Inc. 2005 Long-Term Incentive Plan (“2005 Plan”) during the year ended December 31, 2007. On a volumetric basis, general and administrative expense was $3.15 per Boe for the year ended December 31, 2007 compared to $3.45 per Boe for the year ended December 31, 2006. We have granted stock options and restricted stock to our employees and directors. While we were a private company, the terms of the grants required us to purchase vested options and restricted stock at each employee’s request. The obligation to purchase the options was eliminated when we became a reporting company under Section 12 of the Securities Exchange Act of 1934, as amended, on May 14, 2007.
Interest Expense. Interest expense increased 14%, or $1.6 million, for the year ended December 31, 2007 compared to the year ended December 31, 2006, due to a higher average outstanding debt balance on our revolving credit facility. Our average debt balance was $182.2 million for the year ended December 31, 2007 compared to $156.6 million for the year ended December 31, 2006. The weighted average interest rate on our revolving credit facility was slightly higher at 6.47% for the year ended December 31, 2007 compared to 6.36% for the same period in exploration
expense2006. At December 31, 2007 our outstanding debt balance was $165.0 million.
Income Taxes. Income taxes for the year ended December 31, 2007 were $268.2 million and included $198.4 million recorded to recognize deferred taxes upon the conversion from a subchapter S corporation to a subchapter C corporation on May 14, 2007 for temporary differences that existed at that date primarily as a result of $4.1 million.
LIQUIDITY AND CAPITAL ASSETS
deducting intangible drilling costs for tax purposes. We provide taxes at a combined federal and state tax rate of approximately 38% after taking into account permanent taxable differences. See Notes to Consolidated Financial Statements—Note 8 for more information.
Liquidity and Capital Resources
Our primary sources of liquidity have been cash flowflows generated from operating activities and financing provided by our revolving credit facility. As we exited the fourth quarter of 2008, oil and natural gas prices had declined significantly from their recent record levels which reduced our operational cash flows. In response, we began reducing capital expenditures during the last quarter of 2008 and have prepared our capital expenditure budget for 2009 assuming lower commodity prices. However, realigning capital expenditures to reflect lower cash flows is not an instantaneous process; accordingly our debt has increased and will continue to increase as operating activities and expenses are matched with the reduced level of cash flow. Additionally, as in the past, we will consider selling non-strategic assets in order for us to focus on our core projects if and when appropriate.
The recent problems in the credit markets, steep stock market declines, financial institution failures and government bail-outs are evidence of a weakening global economy. If the unsettled conditions, including sustained declines in commodity prices, continue long term it may impact our ability to develop all of our projects. Our current revolving credit facility is backed by a syndicate of 14 banks and bywe believe that all of the syndicate banks have the capability to fund up to our principal
stockholder,current commitment. If one or more banks should not be able to do so, we may not have the full availability of $672.5 million commitment.
We believe that funds from operating cash flows and a private debt offering. Ourthe revolving credit facility should be sufficient to meet our cash requirements other thaninclusive of, but not limited to, normal operating needs, debt service obligations, planned capital expenditures, and commitments and contingencies for the next 12 months.
We currently anticipate that we will be able to generate or obtain funds sufficient to meet our long-term cash requirements. We intend to finance our future capital expenditures primarily through cash flow from operations are for acquisition, exploration, exploitation and developmentthrough borrowings under our revolving credit facility; however, our financing needs may require us to alter or increase our capitalization substantially through the issuance of debt or equity securities or the sale of assets. Please see “Risk Factors.” Lower oil and natural gas propertiesprices will reduce our cash flows and borrowing ability. For example, although our average realized price received for oil and natural gas was $77.66 per Boe for the year ended December 31, 2008, it was bolstered by record oil prices for the first half of the year. In the fourth quarter of 2008, our average realized price received for oil and natural gas declined to $38.80 per Boe. Furthermore, the issuance of additional debt service payments.
CASH FLOW FROM OPERATIONS
may require that a portion of our cash flow from operations be used for the payment of interest and principal on our debt, thereby reducing our ability to use cash flow to fund working capital, capital expenditures and acquisitions. The issuance of additional equity securities could have a dilutive effect on the value of your common stock.
In the future, we may not be able to access adequate funding under our bank credit facilities as a result of (i) a decrease in our borrowing base due to the outcome of a subsequent borrowing base redetermination, or (ii) an unwillingness or inability on the part of our lending counterparties to meet their funding obligations. The recent declines in commodity prices, or a continuing decline in those prices, could result in a determination to lower the borrowing base in the future and, in such case, we could be required to repay any indebtedness in excess of the borrowing base. The turmoil in the financial markets has adversely impacted the stability and solvency of a number of large global financial institutions.
The current credit crisis makes it difficult to obtain funding in the public and private capital markets. In particular, the cost of raising money in the debt and equity capital markets has increased substantially while the availability of funds from those markets generally has diminished significantly. Also, as a result of concerns about the general stability of financial markets and the solvency of specific counterparties, the cost of obtaining money from the credit markets has increased as many lenders and institutional investors have increased interest rates, imposed tighter lending standards, refused to refinance existing debt at maturity at all or on terms similar to existing debt or at all, and reduced and, in some cases, ceased to provide any new funding.
The credit crisis also has impacted the level of activity in the oil and natural gas property sales market. The lack of available credit and access to capital has limited and will likely continue to limit the parties interested in any proposed asset transactions and will likely reduce the values we could realize in those transactions.
Due to these factors, we cannot be certain that funding, if needed, will be available to the extent required and on acceptable terms. If we are unable to access funding when needed on acceptable terms, we may not be able to fully implement our business plans, complete new property acquisitions to replace our reserves, take advantage of business opportunities, respond to competitive pressures, or refinance our debt obligations as they come due, any of which could have a material adverse effect on our operations and financial results.
Cash Flow from Operating Activities
Our net cash provided by operating activities was $47.0$719.9 million, $390.6 million and $417.0 million for 2002, a
decrease of 24% from the $62.1 millionyears ended December 31, 2008, 2007 and 2006, respectively. The increase in 2001. The decreaseoperating cash flows for the year ended December 31, 2008 was primarilymainly due to increases in revenues reflecting increased production volumes and product prices partially offset by higher operating costs.
Cash Flow from Investing Activities
During the decrease in net income from operations, which was primarily attributable
to the decreased gas prices and crude oil hedging loss.
RESERVES AND EXPENDITURES
We spent $111.0 million in 2001 and $113.4 million in 2002 on acquisitions,
exploration, exploitation and development of oil and gas properties. Our total
estimated proved reserves of natural gas increased from 52.3 Bcf at year-end
2001 to 69.9 Bcf atyears ended December 31, 2002,2008, 2007 and 2006 we had cash flows used in investing activities (excluding asset sales) of $930.8 million, $486.4 million and $326.6 million, respectively, in our estimated total proved oil
reserves increased from 59.7 million barrels at year-end 2001 to 63.3 million
barrels at December 31, 2002. In 2002, we sold reserves estimated to contain
approximately 12,000 barrels.
FINANCING
Our long-term debt, including current portion, was $183.4 million at
December 31, 2001,capital program, inclusive of dry hole and $247.1 million at December 31, 2002.seismic costs. The $63.7 million,
or 35%, increase was primarily attributable to a $51.8 million increase in our bank debt. We usedcapital program for the majorityyear ended December 31, 2008 was mainly due to increased drilling in our Rocky Mountain region and in our Arkoma Woodford shale play.
Cash Flow from Financing Activities
Net cash provided by financing activities of $204.2 million for the year ended December 31, 2008, was mainly the result of amounts borrowed under our revolving credit facility to fund capital expenditures, including acquisitions. Net cash provided by financing activities of $94.6 million for the year ended December 31, 2007 was mainly the results of proceeds of our 2002 borrowingsinitial public offering net of amounts used to pay cash dividends. Net cash used in financing activities during 2006 of $91.5 million was used mainly for exploration and developmentthe payment of the Cedar Hills Field.
CREDIT FACILITY
cash dividends.
Credit Facility
We had $108.0$376.4 million and $165.0 million outstanding debt balance under our revolving credit facility at December 31, 2002. The effective rate2008 and 2007, respectively. As of interestFebruary 23, 2009, the amount outstanding under theour credit facility has increased by $98.0 million to $474.4 million. The increase was 4.8% at December 31, 2001largely due to borrowings to cover capital expenditures incurred in the fourth quarter of 2008 that could not be funded from cash flow from operations due to the continued deterioration in oil and 4.37% at December 31, 2002. Ournatural gas prices in the second half of 2008 and into 2009.
The revolving credit facility which matures March 28, 2005, chargeson April 12, 2011, and borrowings under our revolving credit facility bear interest, based onpayable quarterly, at (a) a rate per annum equal to the rate at which eurodollar depositsLondon Interbank Offered Rate for one, two, three or six months areas offered by the lead bank plus an applicable margin ranging from 150175 to 250 basis points, depending on the percentage of our borrowing base utilized or (b) the lead bank'sbank’s reference rate plus an applicable margin ranging from
25 to 50 basis points.rate. At December 31, 2002,2008 and 2007, we had cash and cash equivalents of $5.2 million and $8.8 million, respectively, and available borrowing capacity on our revolving credit facility of $176.1 million and $135.0 million, respectively. At February 23, 2009, we had available borrowing capacity on our revolving credit facility of $198.1 million.
The revolving credit facility was amended in December 2008 to change the borrowing base to $850.0 million, subject to semi-annual redetermination, increase the applicable London Interbank Offered Rate margins by 75 basis points to a range of 175 to 250 basis points and increase the commitment level to $552.5 million. Subsequently, in February 2009, the commitment level was increased to $672.5 million. The note amount remains at $750.0 million. Borrowings under the revolving credit facility are secured by liens on substantially all of our oil and gas properties and associated assets. Our next semi-annual redetermination will occur in April 2009. The terms of the revolving credit facility was $140.0 million. Thecommitment level can be increased up to the lesser of the borrowing base is re-determined semi-annually.
Betweenor note amount subject to bank agreement.
The revolving credit facility contains restrictive covenants that may limit our ability to, among other things, incur additional indebtedness, sell assets, make loans to others, make investments, enter into mergers, change material contracts, incur liens and engage in certain other transactions without the prior consent of the lenders. The facility also requires us to maintain certain ratios as defined and further described in our revolving credit facility: a Current Ratio of not less than 1.0 to 1.0 (adjusted for available borrowing capacity), a Total Funded Debt to EBITDAX, as defined therein, of no greater than 3.75 to 1.0. As of December 31, 20022008, we were in compliance with all covenants.
Capital Expenditures and March 28, 2003,Commitments
We evaluate opportunities to purchase or sell oil and natural gas properties in the marketplace and could participate as a buyer or seller of properties at various times. We seek acquisitions that utilize our technical expertise or offer opportunities to expand our existing core areas. Acquisition expenditures are not budgeted.
We invested approximately $988.6 million (inclusive of non-cash accruals of $41.1 million) for capital and exploration expenditures in 2008 as follows (in millions):
| Amount | |||
Exploration and development drilling | $ | 634.3 | |
Acquisition of producing properties | 74.7 | ||
Capital facilities, workovers and re-completions | 42.1 | ||
Land costs | 206.2 | ||
Seismic | 16.9 | ||
Vehicles, computers and other equipment | 14.4 | ||
Total | $ | 988.6 | |
Expenditures for exploration and development of oil and natural gas properties are the primary use of our capital resources. In November 2008, our Board of Directors approved budgeted capital expenditures of approximately $609.0 million. However, as a response to significantly lower oil and natural gas prices during the fourth quarter of 2008 and continuing into 2009 and the resulting decrease in expected cash flows, we have drawn $18.5significantly reduced our capital expenditures budgeted for 2009. In addition, we have reduced our rig count from 32 operated rigs in October 2008 to 7 operated rigs on February 23, 2009. We expect to manage our capital expenditures for the year to be inline with our cash flows from operations. Continued weakness in commodity prices may result in a further decrease in our actual capital expenditures during 2009. Conversely, a significant improvement in commodity prices could result in an increase in our actual capital expenditures during 2009. In February 2009, our Board of Directors approved a decrease in our budgeted capital expenditures to $275.0 million as follows (in millions):
| Amount | |||
Exploration and development drilling | $ | 164.6 | |
Capital facilities, workovers and re-completions | 46.4 | ||
Land costs | 54.0 | ||
Seismic | 4.0 | ||
Vehicles, computers and other equipment | 6.0 | ||
Total | $ | 275.0 | |
Our budgeted capital expenditures are expected to decrease approximately 72% from the $988.6 million invested during 2008. We plan to invest approximately $71.4 million in development drilling. In the Red River units, we plan to invest approximately $46.0 million to drill infill wells and extend horizontal laterals on existing wells to increase production and sweep efficiency of the enhanced recovery projects. Most of the remaining development drilling budget is expected to be invested in the drilling of development wells in the Montana Bakken field. We have budgeted approximately $93.2 million for exploratory drilling with approximately $51.0 million and $18.0 million allocated to drilling exploratory wells in the North Dakota Bakken field and the Arkoma Woodford project, respectively.
Although we cannot provide any assurance, assuming successful implementation of our strategy, including the future development of our proved reserves and realization of our cash flows as anticipated, we believe that our remaining cash balance, cash flows from operations and borrowings available under our revolving credit facility will be sufficient to satisfy our 2009 capital budget. The actual amount and timing of our capital expenditures may differ materially from our estimates as a result of, among other things, available cash flow, actual drilling results, the availability of drilling rigs and other services and equipment, and regulatory, technological and competitive developments.
Shareholder Distribution
On January 10, 2007, we declared a cash dividend of approximately $18.8 million to our shareholders and, subject to forfeiture, to holders of unvested restricted stock. On January 31, 2007, we paid $18.7 million of the dividend declared, of which $16.9 million was paid to our principal shareholder. On March 6, 2007, we declared a cash dividend of approximately $33.3 million to our shareholders of record and, subject to forfeiture, to holders of unvested restricted stock. On April 12, 2007, we paid $33.1 million of the dividend declared, of which $30.0 million was paid to our principal shareholder. We converted from a subchapter S corporation to a subchapter C corporation on May 14, 2007 when we became a publicly traded company, and we do not anticipate paying any additional cash dividends on our linecommon stock in the foreseeable future.
Obligations and Commitments
We have the following contractual obligations and commitments as of December 31, 2008:
| Payments due by period | |||||||||||||||
| Total | Less than 1 year | 1 - 3 years | 3 - 5 years | More than 5 years | |||||||||||
| (in thousands) | |||||||||||||||
Revolving credit facility | $ | 376,400 | $ | — | $ | 376,400 | $ | — | $ | — | |||||
Interest expense(1) | 35,221 | 15,470 | 19,751 | — | — | ||||||||||
Operating leases | 1,758 | 1,489 | 265 | 4 | — | ||||||||||
Drilling rig commitments(2) | 35,045 | 20,516 | 14,529 | — | — | ||||||||||
Asset retirement obligations(3) | 44,630 | 4,747 | 7,573 | 2,818 | 29,492 | ||||||||||
Total contractual cash obligations | $ | 493,054 | $ | 42,222 | $ | 418,518 | $ | 2,822 | $ | 29,492 | |||||
| (1) | Interest expense assumes that the year-end interest rate of 4.11% continues for the life of the revolving credit facility. |
| (2) | See Notes to Consolidated Financial Statements—Note 10. Commitments and Contingencies—Drilling Commitments for a description of drilling contract commitments. |
| (3) | Amounts represent expected asset retirements by period. |
Critical Accounting Policies and currently have $126.5 millionPractices
Our historical consolidated financial statements and notes to our historical consolidated financial statements contain information that is pertinent to our management’s discussion and analysis of outstanding debtfinancial condition and results of operations. Preparation of financial statements in conformity with accounting principles generally accepted in the United States requires that our management make estimates, judgments and assumptions that affect the reported amounts of assets, liabilities, revenues and expenses, and the disclosure of contingent assets and liabilities. However, the accounting principles used by us generally do not change our reported cash flows or liquidity. Interpretation of the existing rules must be done and judgments made on our linehow the specifics of credit.
SENIOR NOTES
On July 24, 1998, we issued $150.0 milliona given rule apply to us.
In management’s opinion, the more significant reporting areas impacted by management’s judgments and estimates are oil and natural gas reserve estimation , revenue recognition, the choice of accounting method for oil and natural gas activities, asset retirement obligations, impairment of assets and income taxes. Management’s judgments and estimates in these areas are based on information available from both internal and external sources, including engineers, geologists and historical experience in similar matters. Actual results could differ from the estimates, as additional information becomes known.
Oil and Natural Gas Reserves and Standardized Measure of Future Cash Flows
Our independent engineers and technical staff prepare the estimates of our 10 1/4% Senior
Subordinated Notes due August 1, 2008,oil and natural gas reserves and associated future net cash flows. Current accounting guidance allows only proved oil and natural gas reserves to be included in our financial statement disclosures. The SEC has defined proved reserves as the estimated quantities of crude oil and natural gas which geological and engineering data demonstrate with reasonable certainty to be recoverable in future years from known reservoirs under existing economic and operating conditions. Even though our independent engineers and technical staff are knowledgeable and follow authoritative guidelines for estimating reserves, they must make a private placement. Interestnumber of subjective assumptions based on professional judgments in developing the reserve estimates. Reserve estimates are updated at least annually and consider recent production levels and other technical information about each field. Oil and natural gas reserve engineering is a subjective process of estimating underground accumulations of oil and natural gas that cannot be precisely measured. The accuracy of any reserve estimate is a function of the quality of available data and of engineering and geological interpretation and judgment. Periodic revisions to the estimated reserves and future cash flows may be necessary as a result of a number of factors, including reservoir performance, new drilling, oil and natural gas prices, cost changes, technological advances, new geological or geophysical data, or other economic factors. Accordingly, reserve estimates are often different from the quantities of oil and gas that are ultimately recovered. We cannot predict the amounts or timing of future reserve revisions. If such revisions are significant, they could significantly alter future DD&A and result in impairment of assets that may be material.
Revenue Recognition
We derive substantially all of our revenues from the sale of oil and natural gas. Oil and gas revenues are recorded in the month the product is delivered to the purchaser and title transfers. We generally receive payment from one to three months after the sale has occurred. Each month we estimate the volumes sold and the price at which they were sold to record revenue. Variances between estimated revenue and actual amounts are recorded in the month payment is received.
Successful Efforts Method of Accounting
We utilize the successful efforts method of accounting for our oil and natural gas exploration and development activities. Exploration expenses, including geological and geophysical costs, rentals and exploratory dry holes, are charged against income as incurred. Costs of successful wells and related production equipment and developmental dry holes are capitalized and amortized on a field basis using the unit-of-production method as oil and natural gas is produced. This accounting method may yield significantly different results than the full cost method of accounting.
Depreciation, depletion and amortization, or DD&A, of capitalized drilling and development costs of oil and natural gas properties are generally computed using the unit of production method on a field basis based on total estimated proved developed oil and natural gas reserves. Amortization of producing leasehold is based on the senior notesunit-of-production method using total estimated proved reserves. In arriving at rates under the unit-of-production method, the quantities of recoverable oil and natural gas are established based on estimates made by our geologists and engineers and independent engineers. Service properties, equipment and other assets are depreciated using the straight-line method over estimated useful lives of 5 to 40 years. Upon sale or retirement of depreciable or depletable property, the cost and related accumulated DD&A are eliminated from the accounts and the resulting gain or loss is payable semi annuallyrecognized.
Unproved oil and natural gas properties, the majority of the costs of which relates to the acquisition of leasehold interests, are assessed for impairment on each February 1a property-by-property basis for individually significant balances and August 1. In
connectionon an aggregate basis for individually insignificant balances. If the assessment indicates an impairment, a loss is recognized by providing a valuation allowance at the level consistent with the issuancelevel at which impairment was assessed. The impairment assessment is affected by economic factors such as the results of exploration activities, commodity price outlooks, remaining lease terms, and potential shifts in business
strategy employed by management. In the case of individually insignificant balances, the amount of the senior notes, we incurred debt issuanceimpairment loss recognized is determined by amortizing the portion of the unproved properties’ costs of approximately $4.7 million, which we have capitalized as other assets
and amortize on a straight-line basisfeel will not be transferred to proved properties over the life of the senior notes. In May
1998 we entered into a forward interest rate swap contractlease.
Asset Retirement Obligations
We are required to hedge exposure to
changes in prevailing interest rates on our senior notes. Due to changes in
Treasury note rates, we paid $3.9 million to settle the forward interest rate
swap contract. This payment resulted inrecognize an increase of approximately 0.5% to our
effective interest rate, or an increase of approximately $0.4 million per year,
over the term of the senior notes.
During 2000, we repurchased $19.9 million principal amount of our senior
notes at a cost of $18.3 million. We wrote off $0.9 million of the issuanceestimated liability for future costs associated with the repurchased senior notes.
During 2001, we repurchased $3.0 million principalabandonment of our oil and gas properties. We base our estimate of the liability on our historical experience in abandoning oil and gas wells projected into the future based on our current understanding of federal and state regulatory requirements. Our present value calculations require us to estimate the economic lives of our properties, assume what future inflation rates apply to external estimates, and determine what credit adjusted risk-free rate to use. The impact to the consolidated statement of income from these estimates is reflected in our depreciation, depletion, and amortization calculations and occurs over the remaining life of our oil and gas properties.
Impairment of Assets
All of our long-lived assets are monitored for potential impairment when circumstances indicate that the carrying value of an asset may be greater than its future net cash flows, including cash flows from risk adjusted proved reserves. The evaluations involve a significant amount of our senior
notes atjudgment since the results are based on estimated future events, such as future sales prices for oil and natural gas, future costs to produce these products, estimates of future oil and natural gas reserves to be recovered and the timing thereof, the economic and regulatory climates and other factors. The need to test a costfield for impairment may result from significant declines in sales prices or downward revisions to oil and natural gas reserves. Any assets held for sale are reviewed for impairment when we approve the plan to sell. Estimates of $2.7 million. We wrote off $0.1 millionanticipated sales prices are highly judgmental and subject to material revision in future periods. Because of the issuance costs
associated withuncertainty inherent in these factors, we cannot predict when or if future impairment charges will be recorded.
Income Taxes
We make certain estimates and judgments in determining our income tax expense for financial reporting purposes. These estimates and judgments occur in the repurchased senior notes.
CAPITAL EXPENDITURES
In 2002,calculation of certain tax assets and liabilities that arise from differences in the timing and recognition of revenue and expense for tax and financial reporting purposes. Our federal and state income tax returns are generally not prepared or filed before the consolidated financial statements are prepared; therefore, we incurred $113.4 millionestimate the tax basis of capital expenditures, exclusiveour assets and liabilities at the end of acquisitions. We will initiate, on a priority basis,each period as many projectswell as cash
flow allows. We anticipatethe effects of tax rate changes, tax credits and net operating loss carryforwards. Adjustments related to these estimates are recorded in our tax provision in the period in which we file our income tax returns. Further, we must assess the likelihood that we will initiate approximately 194 projects in
2003be able to recover or utilize our deferred tax assets. If recovery is not likely, we must record a valuation allowance against such deferred tax assets for projected capital expenditures of $105.9 million. Wethe amount we would not expect to fund our
2003 capital budget of $105.9 million through cash flow from operations and our
credit facility.
STOCKHOLDER DISTRIBUTION
During 2002, we paid no dividendsrecover, which would result in an increase to our stockholders. The termsincome tax expense. As of December 31, 2008, we believe that all of our deferred tax assets recorded on our Consolidated Balance Sheet will ultimately be recovered. We consider future taxable income in making such assessments. Numerous judgments and assumptions are inherent in the indenturedetermination of future taxable income, including factors such as future operating conditions (particularly as related to prevailing oil and natural gas prices). If our credit facility restrictestimates and judgments change regarding our ability to pay dividends.
However,utilize our deferred tax assets, our tax provision would increase in the period it is determined that recovery is not probable.
Our effective tax rate is subject to variability from period to period as a result of factors other than changes in federal and state tax rates and/or changes in tax laws which can affect tax paying companies. Our effective tax rate is affected by changes in the allocation of property, payroll, and revenues between states in which we own property as rates vary from state to state. As the mix of property, payroll, and revenues varies by state, our estimated tax rate changes. Due to the size of our gross deferred tax balances, a small change in our estimated future tax rate can have a material effect on current period earnings.
Off-Balance Sheet Arrangements
Currently, we do not have any off-balance sheet arrangements.
Recent Accounting Pronouncements
In December 2007, the FASB issued SFAS No. 141 (revised 2007), “Business Combinations” (SFAS 141(R)) and SFAS No. 160, “Noncontrolling Interests in Consolidated Financial Statements, an amendment of ARB No. 51” (SFAS 160). SFAS 141(R) will change how business acquisitions are permitted to pay dividends to our stockholders in an amount
sufficient to cover the taxesaccounted for and will impact financial statements both on the taxable income passed throughacquisition date and in subsequent periods. SFAS 160 will change the accounting and reporting for minority interests, which will be re-characterized as noncontrolling interests and classified as a component of equity. SFAS 141(R) and SFAS 160 are effective for fiscal years beginning on or after December 15, 2008. SFAS 141(R) will be applied prospectively. SFAS 160 requires retroactive adoption of the presentation and disclosure requirements for existing minority interests. All other requirements of SFAS 160 will be applied prospectively. Early adoption is prohibited for both standards. The adoption of SFAS 141(R) and SFAS 160 is not expected to have a material impact on the stockholders.
HEDGING
From time to time, we and our subsidiaries utilize energy derivative
contracts to hedgeCompany’s consolidated financial position or results of operations.
In February 2008, the price or basis risk associated withFASB issued FASB Staff Position FAS 157-2,Effective Date of FASB Statement No. 157, which provides a one year delay of the specifically
identified purchase or sales contracts, oil and gas production or operational
needs. Prioreffective date of FAS 157 to January 1, 2001, we accounted2009 for changesnon-financial assets and non-financial liabilities, except those that are recognized or disclosed at fair value in the market valuefinancial statements on a recurring basis (at least annually). The impact of derivative instruments used for hedging as a deferred gain or loss untiladoption related to the production month ofnon-financial assets and liabilities will depend on our assets and liabilities at the hedged transaction,time they are required to be measured at which timefair value.
In March 2008, the gain or loss on
the derivative instruments was recognized in earnings. Effective January 1,
2001, we account for derivative instruments in accordance withFASB issued SFAS No. 133
"Accounting for161,Disclosures about Derivative Instruments and Hedging Activities."Activities an amendment of FASB Statement No. 133, which amends and expands the disclosure requirements of FAS 133 to require qualitative disclosure about objectives and strategies for using derivatives, quantitative disclosures about fair value amounts of gains and losses on derivative instruments, and disclosures about credit-risk-related contingent features in derivative agreements. This statement will be effective beginning in fiscal 2009. The specificadoption of this statement will change the disclosures related to our derivative instruments, if any.
In May 2008, the FASB issued SFAS No. 162,The Hierarchy of Generally Accepted Accounting Principles(SFAS 162), which identifies the sources of accounting treatmentprinciples and the framework for changesselecting the principles to be used in preparation of financial statements of nongovernmental entities that are presented in conformity with generally accepted accounting principles in the market valueUnited States of America. SFAS 162 was adopted by the derivative
instruments usedCompany effective November 15, 2008. SFAS 162 did not have a material impact on our consolidated financial position or results of operations.
On December 29, 2008, the Securities and Exchange Commission announced final approval of new requirements, effective for annual reports on Form 10-K for fiscal years ending on or after December 31, 2009, to provide investors with a more meaningful and comprehensive understanding of oil and natural gas reserves. The new disclosure requirements include:
Consideration of new technologies in hedging activities is determinedevaluating oil and natural gas reserves,
Disclosure of probable and possible oil and natural gas reserves,
Use of an average price based on the designationprior twelve month period rather than year-end prices, and
Revisions of the derivative instruments as either a cash flow, fair value, or foreign
currency exposure hedge,oil and effectivenessnatural gas disclosure requirements for operations.
We have not yet evaluated the effects of the derivative instruments.
Additionally,above on our financial statements and disclosures.
Inflation
Historically, general inflationary trends have not had a material effect on our operating results. However, we have experienced inflationary pressure on technical staff compensation and the cost of oilfield services and equipment due to the increase in the normal course of business, we will enter into fixed
price forward sales contracts related to ourdrilling activity and competitive pressures resulting from higher oil and natural gas production to reduce
our sensitivity to oil and gas price volatility. We deem forward sales contracts
that will resultprices in physical delivery of our production to be in the normal
course of our business and we do not account for them as derivatives.
In connection with our offering of senior notes, we entered into an
interest rate hedge on which we experienced a $3.9 million loss. This loss will
result in an effective increase of approximately 0.5% in our interest costs on
the senior notes.
OTHER
We follow the "sales method" of accounting for our gas revenue, whereby we
recognize sales revenue on gas sold, regardless of whether the sales are
proportionate to our ownership in the gas produced. We recognize a liability to
the extent that we have a net imbalance in excess of our share of the reserves
in the underlying properties. Historically, our aggregate imbalance positions
have been immaterial. We believe that any future periodic settlements of gas
imbalances will have little impact on our liquidity.
We sold a number of our non-strategic oil and gas properties and other
properties over the past three years, recognizing pretax gains of approximately
$3.7 million in 2000, $3.5 million in 2001, and $0.2million in 2002
respectively. The aggregate amount of oil and gas reserves associated with these
dispositions was 290 MBbls of oil and 4,913 MMcf of natural gas.
ITEM 7A. QUANTITATIVE AND QUALITATIVE DISCLOSURES ABOUT MARKET RISK
recent years.
| Item 7A. | Quantitative and Qualitative Disclosures About Market Risk |
We are exposed to a variety of market risks including credit risk, commodity price risk and interest rate risk. We address these risks through a program of risk management which may include the use of derivative instruments.
Credit Risk. We monitor our risk of loss due to non-performance by counterparties of their contractual obligations. Our principal exposure to credit risk is through joint interest receivables ($156.6 million at December 31, 2008) and the sale of our oil and natural gas production, which we market to energy marketing companies, refineries and affiliates ($72.4 million in receivables at December 31, 2008). See Notes to Consolidated Financial Statements.—Note 1. Organization and Summary of Significant Accounting Policies.Joint interest receivables arise from billing entities who own partial interest in the normal course ofwells we operate. These entities participate in our business
operations. Duewells primarily based on their ownership in leases on which we wish to the volatility of oil and gas prices, we, from timedrill. We can do very little to time,
have entered into financial contractschoose who participates in our wells. In order to hedge oil and gas prices and may do so
in the future as a means of controllingminimize our exposure to credit risk we request prepayment of drilling costs where it is allowed by contract or state law. For such prepayments, a liability is recorded and subsequently reduced as the associated work is performed. In this manner, we reduce credit risk. We also have the right to place a lien on our co-owners production proceeds in order to secure payment. Historically, our credit losses on joint interest receivables have been immaterial.
We monitor our exposure to counterparties on oil and natural gas sales primarily by reviewing credit ratings, financial statements and payment history. We extend credit terms based on our evaluation of each counterparty’s credit worthiness. We have not generally required our counterparties to provide collateral to support oil and natural gas receivables owed to us.
Commodity Price Risk. Our primary market risk exposure is in the pricing applicable to our natural gas and oil production. Realized pricing is primarily driven by the prevailing worldwide price changes. Mostfor crude oil and spot market prices applicable to our U.S. natural gas production. Pricing for natural gas and oil production has been volatile and unpredictable for several years, and we expect this volatility to continue in the future. The prices we receive for production depend on many factors outside of our financial contracts settle against either a NYMEX based price or a fixedcontrol including volatility in the differences between product prices at sales points and the applicable index price. DERIVATIVES
The risk management process we established is designed to measure both
quantitative and qualitative risks inBased on our businesses. We are exposed to market
risk, including changes in interest rates and certain commodity prices.
To manageaverage daily production for the volatility relating to these exposures, periodically we enter
into various derivative transactions pursuant to our policies on hedging
practices. Derivative positions are monitored using techniques such as
mark-to-market valuation and value-at-risk and sensitivity analysis.
We had a derivative contract in place atyear ended December 31, 2002, which is being
marked to market under SFAS No. 133 with changes in fair value being recorded in
earnings as such contract does not qualify2008, our annual revenue would increase or decrease by approximately $9.1 million for special hedge accounting nor does
such contract meet the criteria to be considered in the normal course of
business. Such contract provides for a fixed price of $24.25each $1.00 per barrel on
360,000 barrels of crude oil through December 2003 when market prices exceed
$19.00 per barrel. However, if the average NYMEX spot crude oil price is $19.00
per barrel or less, no payment is required of the counterparty. If NYMEX spotchange in crude oil prices during the month average more than $24.25and $1.7 million for each $0.10 per barrel, we pay
the excess to the counterparty. As of December 31, 2002, we have recorded a net
unrealized loss of $2.1 million.
COMMODITY PRICE EXPOSURE
The market risk inherentMMBtu change in our market risk sensitive instruments and
positions is the potential loss in value arising from adverse changes in our
commodity prices.
The prices of crude oil, natural gas and natural gas liquids are subject
to fluctuations resulting from changes in supply and demand. prices.
To partially reduce price risk caused by these market fluctuations, we may hedge (throughhave occasionally hedged crude oil and natural gas prices in the past, through the utilization of derivatives) a portion of our productionderivatives, including zero-cost collars and salefixed price contracts. Because the commodities covered by these derivatives are substantially the same
commodities that we buy and sellMost recently, in the physical market, no special studies
other than monitoring the degree of correlation between the derivative and cash
markets are deemed necessary.
A sensitivity analysis has been prepared to estimate the price exposure to
the market risk of our crude oil, natural gas and natural gas liquids commodity
positions. Our daily net commodity position consists of crude inventories,
commodity purchase and sales contracts and derivative commodity instruments. The
fair value of such position is a summation of the fair values calculated for
each commodity by valuing each net position at quoted futures prices. Market
risk is estimated as the potential loss in fair value resulting from a
hypothetical 10 percent adverse change in such prices over the next 12 months.
Based on this analysis, we have no significant market risk related to our crude
trading or hedging portfolios. During the fourth quarter of 2002,July 2007, we entered into forward fixed price salesfixed-price swap contracts in accordance with our hedging policy,
to mitigate its exposure tocovering 10,000 barrels of oil per day for the price volatility associated with its crude oil
production. As of December 31, 2002,period from August 2007 through April 2008. During 2008 and 2007, we had entered into financialrecognized losses on derivatives of $8.0 million and $44.9 million, respectively. These contracts covering the notational volumes set forthexpired in the following tables for the
periods indicated:
Time Period Barrels per Month Price per Barrel
----------- ----------------- ----------------
01/03-03/03 60,000 $21.98
01/03-06/03 30,000 $24.01
01/03-01/04 30,000 $24.01
01/03-12/03 30,000 $25.08
01/03-12/03 30,000 $24.85
Each month the contractual price per barrel is compared to average NYMEX
spot crude oil price. When the contractual price is greater than the NYMEX
price,April 2008 and we receive an amount equal to the difference multiplied by the notational
volume. When the contractual price is less than the NYMEX price, we pay an
amount equal to the difference multiplied by the notational volume.
In June 1998, the Financial Accounting Standards Board ("FASB") issued
statement of Financial Accounting Standards ("SFAS") No. 133, "Accounting for
Derivative Instruments and for Hedging Activities", with an effective date for
periods beginning after June 15, 1999. In July 1999 the FASB issued SFAS No.
137, "Accounting for Derivative Instruments and Hedging Activities - Deferral of
the Effective Date of FASB Statement No. 133". As a result of SFAS No. 137,
adoption of SFAS No. 133 was required for financial statements for periods
beginning after June 15, 2000. In June 2000, the FASB issued SFAS No. 138,
"Accounting for Certain Derivative Instruments and Certain Hedging Activities",
which amends the accounting and reporting standards of SFAS No. 133 for certain
derivative instruments and hedging activities. SFAS No. 133 sweepscurrently have no hedges in a broad
population of transactions and changes the previous accounting definition of a
derivative instrument. Under SFAS No. 133 every derivative instrument is
recorded on the balance sheet as either an asset or liability measured at its
fair value. SFAS No. 133 requires that changes in the derivative's fair value be
recognized currently in earnings unless specific hedge accounting criteria are
met. During 2000, we reviewed all our contracts to identify both freestanding
and embedded derivatives that meet the criteria set forth in SFAS No. 133 and
SFAS No. 138. We adopted the new standards effective January 1, 2001. We had no
outstanding hedges or derivatives which had not been previously marked to market
through its accounting for trading activity. As a result, the adoption of SFAS
No. 133 and SFAS No. 138 had no significant impact.
INTEREST RATE RISKplace.
Interest Rate Risk. Our exposure to changes in interest rates relates primarily to long-term debt obligations. We manage our interest rate exposure by limiting our variable-rate debt to a certain percentage of total capitalization and by monitoring the effects of market changes in interest rates. We mightmay utilize interest rate derivatives to alter interest rate exposure in an attempt to reduce interest rate expense related to existing debt issues. Interest rate derivatives are used solely to modify interest rate exposure and not to modify the overall
leverage of the debt portfolio. We are exposed to changes in interest rates as a result of our revolving credit facility. We had total indebtedness of $474.4 million outstanding under our revolving credit facility at February 23, 2009. The impact of a 1% increase in interest rates on this amount of debt would result in increased interest expense of approximately $4.7 million and a $2.9 million decrease in net income. Our weighted average interest rate at December 31, 2008 was 4.11%. Our weighted average interest rate at February 23, 2009 was 3.57%. The fair value of long-term debt is estimated based on quoted market prices and management'smanagement’s estimate of current rates available for similar issues. The following table itemizes our long-term debt maturities and the weighted-average interest rates by maturity date.
date:
| 2009 | 2010 | 2011 | 2012 | 2013 | Total | |||||||||||||||
| (in thousands) | ||||||||||||||||||||
Variable rate debt: | ||||||||||||||||||||
Revolving credit facility: | ||||||||||||||||||||
Principal amount | $ | — | $ | — | $ | 376.4 | $ | — | $ | — | $ | 376.4 | ||||||||
Weighted-average interest rate | 4.11 | % | 4.11 | % | ||||||||||||||||
| Item 8. | Financial Statements and Supplemental Data |
Index to Consolidated Financial Statements
| Page | ||
Continental Resources, Inc. and Subsidiary Consolidated Financial Statements: | ||
| 55 | ||
Consolidated Balance Sheets as of December 31, 2008 and 2007 | 56 | |
| 57 | ||
Consolidated Statements of Shareholders’ Equity for the Years Ended December 31, 2008, 2007 and 2006 | 58 | |
Consolidated Statements of Cash Flows for the Years Ended December 31, 2008, 2007 and 2006 | 59 | |
| 60 |
REPORT OF INDEPENDENT REGISTERED PUBLIC ACCOUNTING AND
FINANCIAL DISCLOSURE
Arthur Andersen LLP audited our financial statements for 2000 and 2001. As
a result of Andersen's liquidation, we changed our auditors to Ernst and Young
LLP on July 12, 2002. This change was reported in a current report on Form 8-K
dated July 16, 2002.
PART III
ITEM 10. DIRECTORS AND EXECUTIVE OFFICERS OF THE REGISTRANT
The following table sets forth names, ages and titles of the directors and
executive officers of the Company.
NAME AGE POSITION
- --------------------------- --- -------------------------------------------
Harold Hamm (1)(3)......... 57 Chairman of the FIRM
Board of Directors President, Chief Executive Officer
and Director
Jack Stark (1)(3).......... 48 Senior Vice President--Exploration and
Director
Jeff Hume (1)(3)........... 52 Senior Vice President-Resource Development
Randy Moeder (1)(3)........ 42 President - Continental Gas, Inc.
Roger Clement (1)(2)(4).... 58 Senior Vice President, Chief Financial
Officer, Treasurer and Director
Mark Monroe (2)(3)......... 48 Director
Robert Kelley (2)(5)....... 57 Director
H. R. Sanders (2)(4)....... 70 Director
- -----------------
(1) Member of the Executive Committee
(2) Member of the Audit Committee
(3) Term expires in 2003
(4) Term expires in 2004
(5) Resigned as of 2/2003
HAROLD HAMM, L.L.M., has been President and Chief Executive Officer and a
Director of the Company since its inception in 1967 and currently serves as
Chairman of the Board. Mr. Hamm is a long-time Oklahoma Independent Petroleum
Association board member and currently its Vice President of the Western Region.
He is the founder and served as the Chairman of Save Domestic Oil, Inc.
Currently, Mr. Hamm is the President of the National Stripper Well Association,
serves on the Executive Boards of the Oklahoma Independent Petroleum Association
and the Oklahoma Energy Explorers.
JACK STARK joined the Company as Vice President of Exploration in June 1992
and was promoted to Senior Vice President and Director in May 1998. He holds a
Masters degree in Geology from Colorado State University and has 24 years of
exploration experience in the Mid-Continent, Gulf Coast and Rocky Mountain
regions. Prior to joining the Company, Mr. Stark was the exploration manager for
the Western Mid-Continent Region for Pacific Enterprises from August 1988 to
June 1992. From 1978 to 1988, he held various staff and middle management
positions with Cities Service Co. and TXO Production Corp. Mr. Stark is a member
of the American Association of Petroleum Geologists, Oklahoma Independent
Petroleum Association, Rocky Mountain Association of Geologists, Houston
Geological Society and Oklahoma Geological Society.
JEFF HUME became Senior Vice President of Resource Development of the
Company in July 2002. He had been Vice President of Drilling Operations of the
Company since September 1996 and was promoted to Senior Vice President in May
1998. From May 1983 to September 1996, Mr. Hume was Vice President of
Engineering and Operations. Prior to joining the Company, Mr. Hume held various
engineering positions with Sun Oil Company, Monsanto Company and FCD Oil
Corporation. Mr. Hume is a Registered Professional Engineer and member of the
Society of Petroleum Engineers, Oklahoma Independent Petroleum Association, and
the Oklahoma and National Professional Engineering Societies.
RANDY MOEDER has been President of Continental Gas, Inc. since January 1995
and was Vice President of Continental Gas, Inc. from November 1990 to January
1995. Mr. Moeder was Senior Vice President and General Counsel of the Company
from May 1998 to August 2000 and was Vice President and General Counsel from
November 1990 to April 1998. From January 1988 to summer 1990, Mr. Moeder was in
private law practice. From 1982 to 1988, Mr. Moeder held various positions with
Amoco Corporation. Mr. Moeder is a member of the Oklahoma Independent Petroleum
Association and the Oklahoma and American Bar Associations. Mr. Moeder is also a
Certified Public Accountant.
ROGER CLEMENT became Vice President, Chief Financial Officer, Treasurer and
a Director of the Company in March 1989 and was promoted to Senior Vice
President in May 1998. He holds a Bachelor of Business Administration degree
from the University of Oklahoma and is a Certified Public Accountant. Prior to
joining the Company, Mr. Clement was a partner in the accounting firm of Hunter
and Clement in Oklahoma City for 17 years. The firm provided accounting, tax,
audit and consulting services for various industries. Mr. Clement's clients were
primarily involved in oil and gas and real estate. He was also a 50% partner in
a construction company from 1973 to 1984 that constructed residential real
estate and small commercial properties. He is a member of the Oklahoma
Independent Petroleum Association, the American Institute of Certified Public
Accountants and the Oklahoma Society of Certified Public Accountants.
MARK MONROE was the Chief Executive Officer and President of Louis Dreyfus
Natural Gas prior to its merger with Dominion Resources in October 2001. Prior
to the formation of Louis Dreyfus Natural Gas in 1990, he was the Chief
Financial Officer of Bogert Oil Company. He currently serves as the President of
the Oklahoma Independent Petroleum Association and is a Board member of the
Oklahoma Energy Explorers. Previously Mr. Monroe served on the Domestic
Petroleum Council and the Board of the Independent Petroleum Association of
America. Mr. Monroe is a Certified Public Accountant and received his Bachelor
of Business Administration degree from the University of Texas at Austin.
ROBERT KELLEY served as Chairman of the Board of Noble Affiliates, Inc.,
from 1992 until he retired in 2000. Noble Affiliates, Inc. is an independent
energy company with exploration and production operations throughout the United
States, the Gulf of Mexico, and international operations in Argentina, China,
Ecuador, Equatorial Guinea, the Mediterranean Sea, the North Sea, and Vietnam.
Prior to October 2000 he also served as President and Chief Executive Officer of
Noble Affiliates, Inc. and its three subsidiaries, Samedan Oil Corporation,
Noble Gas Marketing, Inc., and Noble Trading, Inc. He is a Director of OG&E
Energy Corporation, a public utility headquartered in Oklahoma; and Lone Star
Technologies, Inc., a leading manufacturer of oilfield tubular goods also
located in Texas. Mr. Kelley attended the University of Oklahoma and received a
Bachelor of Business Administration degree and he is a Certified Public
Accountant. Mr. Kelley resigned from the Board effective February 10, 2003, due
to conflicts of interest with other exploration and production companies.
H. R. SANDERS, JR. served as a Director of Devon Energy Corporation from
1981 through 2000. In addition, he held the position of Executive Vice President
of Devon from 1981 until his retirement in 1997. Prior to joining Devon, Mr.
Sanders served Republic Bank of Dallas, N.A. from 1970 to 1981 as the bank's
Senior Vice President with direct responsibility for independent oil, gas and
mining loans. Mr. Sanders is a former member of the Independent Petroleum
Association of America, Texas Independent Producers and Royalty owners
Association and Oklahoma Independent Petroleum Association. He currently is a
Director on the Board of Torreador Resources Corporation and is also a past
Director of Triton Energy Corporation.
ITEM 11. EXECUTIVE COMPENSATION
Continental Resources, Inc.
dated October 1, 2000. [2.1](4)
3.1 Amended and Restated Certificate of Incorporation of Continental
Resources, Inc. [3.1](1)
3.2 Amended and Restated Bylaws of Continental Resources, Inc. [3.2] (1)
3.3 Certificate of Incorporation of Continental Gas, Inc. [3.3] (1)
3.4 Bylaws of Continental Gas, Inc., as amended and restated. [3.4] (1)
3.5 Certificate of Incorporation of Continental Crude Co. [3.5] (1)
3.6 Bylaws of Continental Crude Co. [3.6] (1)
4.1 Restated Credit Agreement dated April 21, 2000 between Continental
Resources, Inc. and Continental Gas, Inc., as Borrowers and MidFirst
Bank as Agent (the "Credit Agreement") [4.4] (3)
4.1.1 Form of Consolidated Revolving Note under the Credit Agreement [4.4]
(3)
4.1.2 Second Amended and Restated Credit Agreement among Continental
Resources, Inc., Continental Gas, Inc. and Continental Resources of
Illinois, Inc., as Borrowers, and MidFirst Bank, dated July 9,
2001.[10.1](5)
4.1.3 Third Amended and Restated Credit Agreement among Continental
Resources, Inc., Continental Gas, Inc. and Continental Resources of
Illinois, Inc., as Borrowers, and MidFirst Bank, dated January 17,
2002. [4.13] (7)
4.1.4 Fourth Amended and Restated Credit Agreement dated March 28, 2002,
among the Registrant, Union Bank of California, N. A., Guaranty Bank,
FSB and Fortis Capital Corp. [10.1] (8)
4.2 Indenture dated as of July 24, 1998 between Continental Resources,
Inc., as Issuer, the Subsidiary Guarantors named therein and the
United States Trust Company of New York, as Trustee [4.3] (1)
10.1 Unlimited Guaranty Agreement dated March 28, 2002 [10.2] (8)
10.2 Security Agreement dated March 28, 2002, between Registrant and
Guaranty Bank, FSB, as Agent. [10.3] (8)
10.3 Stock Pledge Agreement dated March 28, 2002, between Registrant and
Guaranty Bank, FSB, as Agent [10.4] (8)
10.4 Conveyance Agreement of Worland Area Properties from Harold G. Hamm,
Trustee of the Harold G. Hamm Revocable Intervivos Trust dated April
23, 1984, to Continental Resources, Inc. [10.4](2)
10.5 Purchase Agreement signed January 2000, effective October 1, 1999, by
and between Patrick Energy Corporation as Buyer and Continental
Resources, Inc. as Seller [10.5](2)
10.6+ Continental Resources, Inc. 2000 Stock Option Plan. [10.6](4)
10.7+ Form of Incentive Stock Option Agreement. [10.7](4)
10.8+ Form of Non-Qualified Stock Option Agreement. [10.8](4)
10.9 Purchase and Sales Agreement between Farrar Oil Company and Har-Ken
Oil Company, as Sellers, and Continental Resources of Illinois, Inc.
as Purchaser, dated May 14, 2001.[2.1](5)
10.10 Collateral Assignment of Contracts dated March 28, 2002, between
Registrant and Guaranty Bank, FSB, as Agent. [10.5] (8)
12.1 Statement re computation of ratio of debt to Adjusted EBITDA [12.1]
(*)
12.2 Statement re computation of ratio of earning to fixed charges [12.2]
(*)
12.3 Statement re computation of ratio of Adjusted EBITDA to interest
expense [12.3] (*)
21.0 Subsidiaries of Registrant.[21](6)
99.1 Letter to the Securities and Exchange Commission dated March 28, 2002,
regarding the audit of the Registrant's financial statements by Arthur
Andersen LLP. [99.1] (7)
- ---------------
+ Represents management compensatory plans or agreements.
* Filed herewith
(1) Filed as an exhibit to the Company's Registration Statement on Form S-4, as
amended (No. 333-61547) which was filed with the Securities and Exchange
Commission. The exhibit number is indicated in brackets and is incorporated
herein by reference.
(2) Filed as an exhibit to the Company's Annual Report on Form 10-K for the
fiscal year ended December 31, 1999. The exhibit number is indicated in
brackets and is incorporated herein by reference.
(3) Filed as an exhibit to the Company's Quarterly Report on Form 10-Q for the
fiscal quarter ended March 31, 2000. The exhibit number is indicated in
brackets and is incorporated herein by reference.
(4) Filed as an exhibit to the Company's Annual Report on Form 10-K for the
fiscal quarter ended December 31, 2000. The exhibit number is indicated in
brackets and is incorporated herein by reference.
(5) Filed as an exhibit to current report on Form 8-K dated July 18, 2001. The
exhibit number is indicated in brackets and is incorporated herein by
reference.
(6) Filed as an exhibit to the Company's Quarterly Report on Form 10-Q for the
fiscal quarter ended June 30, 2001. The exhibit number is indicated in
brackets and is incorporated herein by reference.
(7) Filed as an exhibit to the Company's Annual Report on Form 10-K for the
fiscal year ended December 31, 2001. The exhibit number is indicated in
brackets and is incorporated herein by reference.
(8) Filed as an exhibit to current report on Form 8-K dated April 11,2002. The
exhibit number is indicated in brackets and is incorporated herein by
reference.
(b) REPORTS ON FORM 8-K
None
SIGNATURES
Pursuant to the requirements of Section 13 and 15 (d) of the Securities
Exchange Act of 1934, the registrant has duly caused this report to be signed on
its behalf by the undersigned thereunto duly authorized.
March 28, 2003 CONTINENTAL RESOURCES, INC.
By HAROLD HAMM
Harold Hamm
Chairman of the Board, President
And Chief Executive Officer
Pursuant to the requirements of the Securities Exchange Act of 1934, this
report has been signed below by the following persons on behalf of the
registrant and in capacities and on the dates indicated.
Signatures Title Date
---------- ----- ----
HAROLD HAMM
Harold Hamm Chairman of the Board, March 28, 2003
President, Chief Executive
Officer (principal executive
officer) and Director
ROGER V. CLEMENT
Roger V. Clement Senior Vice President and March 28, 2003
Chief Financial Officer
(principal financial officer
and principal accounting
officer), Treasurer,
and Director
JACK STARK
Jack Stark Senior Vice President of Exploration March 28, 2003
and Director
H. R. SANDERS, JR.
H. R. Sanders, Jr. Director March 28, 2003
MARK MONROE
Mark Monroe Director March 28, 2003
Supplemental Information to be Furnished With Reports Pursuant to Section
15(d) of the Act by Registrants Which Have Not Registered Securities Pursuant to
Section 12 of the Act.
The Company has not sent, and does not intend to send, an annual report to
security holders covering its last fiscal year, nor has the Company sent a proxy
statement, form of proxy or other proxy soliciting material to its security
holders with respect to any annual meeting of security holders.
CERTIFICATIONS FOR FORM 10-K
I, Harold Hamm, Chief Executive Officer, certify that:
(1) I have reviewed this annual report on Form 10-K of Continental Resources,
Inc. ("Registrant");
(2) Based on my knowledge, this annual report does not contain any untrue
statement of a material fact or omit to state a material fact necessary to
make the statements made, in light of the circumstances under which such
statements were made, not misleading with respect to the period covered by
this annual report;
(3) Based on my knowledge, the financial statements, and other financial
information included in this annual report, fairly present in all material
respects the financial condition, results of operations and cash flows of
the registrant as of, and for, the periods presented in this annual
report;
(4) The registrant's other certifying officers and I are responsible for
establishing and maintaining disclosure controls and procedures (as defined
in Exchange Act Rules 13a-14 and 15d-14) for the registrant and we have:
(a) designed such disclosure controls and procedures to ensure that
material information relating to the registrant, including its
consolidated subsidiaries, is made known to us by others within those
entities, particularly during the period in which this annual report
is being prepared;
(b) evaluated the effectiveness of the registrant's disclosure controls
and procedures as of a date within 90 days prior to the filing date of
this quarterly report (the "Evaluation Date"); and
(c) presented in this annual report our conclusions about the
effectiveness of the disclosure controls and procedures based on our
evaluations as of the Evaluation Date;
(5) The registrant's other certifying officers and I have disclosed, based on
our most recent evaluation, to the registrant's auditors and the audit
committee of registrant's board of directors (or persons performing the
equivalent function):
(a) all significant deficiencies in the design or operation of internal
controls which could adversely affect the registrant's ability to
record, process, summarize and report financial data and have
identified for the registrant's auditors any material weaknesses in
internal controls; and
(b) any fraud, whether or not material, that involves management or other
employees who have a significant role in the registrant's internal
controls: and
(6) The registrant's other certifying officers and I have indicated in this
annual report whether or not there were significant changes in internal
controls or in other factors that could significantly affect internal
controls subsequent to the date of our most recent evaluation, including
any corrective actions with regard to significant deficiencies and material
weaknesses.
CONTINENTAL RESOURCES, INC.
Date: March 28, 2003 By: HAROLD HAMM
Harold Hamm
Chief Executive Officer
CERTIFICATIONS FOR FORM 10-K
I, Roger V. Clement, Vice President and Chief Financial Officer, certify that:
(1) I have reviewed this annual report on Form 10-K of Continental Resources,
Inc. ("Registrant");
(2) Based on my knowledge, this annual report does not contain any untrue
statement of a material fact or omit to state a material fact necessary to
make the statements made, in light of the circumstances under which such
statements were made, not misleading with respect to the period covered by
this annual report;
(3) Based on my knowledge, the financial statements, and other financial
information included in this annual report, fairly present in all material
respects the financial condition, results of operations and cash flows of
the registrant as of, and for, the periods presented in this annual report;
(4) The registrant's other certifying officers and I are responsible for
establishing and maintaining disclosure controls and procedures (as defined
in Exchange Act Rules 13a-14 and 15d-14) for the registrant and we have:
(a) designed such disclosure controls and procedures to ensure that
material information relating to the registrant, including its
consolidated subsidiaries, is made known to us by others within those
entities, particularly during the period in which this annual report
is being prepared;
(b) evaluated the effectiveness of the registrant's disclosure controls
and procedures as of a date within 90 days prior to the filing date of
this quarterly report (the "Evaluation Date"); and
(c) presented in this annual report our conclusions about the
effectiveness of the disclosure controls and procedures based on our
evaluations as of the Evaluation Date;
(5) The registrant's other certifying officers and I have disclosed, based on
our most recent evaluation, to the registrant's auditors and the audit
committee of registrant's board of directors (or persons performing the
equivalent function):
(a) all significant deficiencies in the design or operation of internal
controls which could adversely affect the registrant's ability to
record, process, summarize and report financial data and have
identified for the registrant's auditors any material weaknesses in
internal controls; and
(b) any fraud, whether or not material, that involves management or other
employees who have a significant role in the registrant's internal
controls: and
(6) The registrant's other certifying officers and I have indicated in this
annual report whether or not there were significant changes in internal
controls or in other factors that could significantly affect internal
controls subsequent to the date of our most recent evaluation, including
any corrective actions with regard to significant deficiencies and material
weaknesses.
CONTINENTAL RESOURCES, INC.
Date: March 28, 2003 By: ROGER V. CLEMENT
Roger V. Clement
Vice President and Chief Financial Officer
INDEX OF FINANCIAL STATEMENTS
Report of Independent Auditors.............................................F - 3
Copy of Report of Independent Public Accountants (Arthur Andersen LLP).....F - 3
Consolidated Balance Sheets as of December 31, 2001 and 2002...............F - 3
Consolidated Statements of Operations for the Years Ended December 31,
2000, 2001 and 2002...................................................F - 5
Consolidated Statements of Stockholders' Equity
for the Years Ended December 31, 2000, 2001 and 2002..................F - 6
Consolidated Statements of Cash Flows for the Years Ended December 31,
2000, 2001 and 2002...................................................F - 7
Notes to Consolidated Financial Statements.................................F - 8
REPORT OF INDEPENDENT AUDITORS
To the Board of Directors
of Continental Resources, Inc.:
We have audited the accompanying consolidated balance sheet of Continental
Resources, Inc. (an Oklahoma corporation) and subsidiaries as of December 31,
2002, and the related consolidated statements of operations, stockholders'
equity and cash flows for the year then ended. These consolidated financial
statements are the responsibility of the Company's management. Our
responsibility is to express an opinion on these consolidated financial
statements based on our audit. The consolidated financial statements of
Continental Resources, Inc. (an Oklahoma corporation) and subsidiaries as of
December 31, 2001 and for each of the two years in the period then ended were
audited by other auditors who ceased operations. Those auditors expressed an
unqualified opinion on those financial statements in their report dated February
15, 2002.
We conducted our audit in accordance with auditing standards generally accepted
in the United States. Those standards require that we plan and perform the audit
to obtain reasonable assurance about whether the financial statements are free
of material misstatement. An audit includes examining, on a test basis, evidence
supporting the amounts and disclosures in the financial statements. An audit
also includes assessing the accounting principles used and significant estimates
made by management, as well as evaluating the overall financial statement
presentation. We believe that our audit provided a reasonable basis for our
opinion.
In our opinion, the consolidated financial statements referred to above present
fairly, in all material respects, the consolidated financial position of
Continental Resources, Inc. and subsidiaries at December 31, 2002, and the
consolidated results of their operations and their cash flows for the year then
ended in conformity with accounting principles generally accepted in the United
States.
ERNST & YOUNG LLP
Oklahoma City, Oklahoma,
March 14, 2003
INFORMATION REGARDING PREDECESSOR INDEPENDENT PUBLIC ACCOUNTANTS' REPORT
The following report is a copy of a previously issued report by Arthur Andersen
LLP ("Andersen"). The report has not been reissued by Andersen nor has Andersen
consented to its inclusion in this annual report on Form 10-K. The Andersen
report refers to the consolidated balance sheet as of December 31, 2000 and the
consolidated statements of operations, stockholders' equity, and cash flows for
the year ended December 31, 1999, which are no longer included in the
accompanying financial statements.
REPORT OF INDEPENDENT PUBLIC ACCOUNTANTS
To the Board of Directors of Continental Resources, Inc.:
We have audited the accompanying consolidated balance sheets of Continental Resources, Inc. (an Oklahoma corporation) and subsidiariesSubsidiary (the Company) as of December 31, 20002008 and 2001,2007, and the related consolidated statements of income, stockholders'shareholders’ equity and cash flows for each of the three years in the period ended December 31, 2001.2008. These consolidated financial statements are the responsibility of the Company'sCompany’s management. Our responsibility is to express an opinion on these consolidated financial statements based on our audits.
We conducted our audits in accordance with auditingthe standards generally accepted
inof the United States.Public Company Accounting Oversight Board (United States). Those standards require that we plan and perform the audit to obtain reasonable assurance about whether the financial statements are free of material misstatement. An audit includes examining, on a test basis, evidence supporting the amounts and disclosures in the financial statements. An audit also includes assessing the accounting principles used and significant estimates made by management, as well as evaluating the overall financial statement presentation. We believe that our audits provide a reasonable basis for our opinion.
In our opinion, the consolidated financial statements referred to above present fairly, in all material respects, the financial position of Continental Resources, Inc. and subsidiariesSubsidiary as of December 31, 20002008 and 2001,2007, and the results of their operations and their cash flows for each of the three years in the period ended December 31, 2001,2008 in conformity with accounting principles generally accepted in the United States.
States of America.
We also have audited, in accordance with the standards of the Public Company Accounting Oversight Board (United States), Continental Resources, Inc. and Subsidiary’s internal control over financial reporting as of December 31, 2008, based on criteria established inInternal Control—Integrated Framework issued by the Committee of Sponsoring Organizations of the Treadway Commission (COSO) and our report dated February 26, 2009 expressed an unqualified opinion.
/s/ GRANT THORNTON LLP
Oklahoma City, Oklahoma ARTHUR ANDERSEN LLP
February 15, 2002
CONTINENTAL RESOURCES, INC. AND SUBSIDIARIES
CONSOLIDATED BALANCE SHEETS
(dollars in thousands, except share data)
December 31,
------------------------------------
CURRENT ASSETS: 2001 2002
------------------ ----------------
Cash $ 7,225 $ 2,520
Accounts receivable -
Oil and gas sales 7,731 14,756
Joint interest and other, net 10,526 7,884
Inventories 6,321 6,700
Prepaid expenses 487 482
Fair value of derivative contracts - 628
------------------ ----------------
Total current assets 32,290 32,970
PROPERTY AND EQUIPMENT, AT COST:
Oil and gas properties, based on
successful efforts accounting
Producing properties 395,559 488,432
Nonproducing leaseholds 50,889 33,781
Gas gathering and processing facilities 28,176 33,113
Service properties, equipment and other 17,427 18,430
------------------ ----------------
Total property and equipment 492,051 573,756
Less - Accumulated depreciation,
depletion and amortization (174,720) (205,853)
------------------ ----------------
Net property and equipment 317,331 367,903
OTHER ASSETS:
Debt issuance costs 4,851 5,796
Other assets 13 8
------------------ ----------------
Total other assets 4,864 5,804
------------------ ----------------
Total assets $ 354,485 $ 406,677
================== ================
The accompanying notes are an integral part of these consolidated balance
sheets.
CONTINENTAL RESOURCES, INC. AND SUBSIDIARIES
CONSOLIDATED BALANCE SHEETS
(dollars in thousands, except share data)
December 31,
---------------------------
CURRENT LIABILITIES: 2001 2002
------------- ------------
Accounts payable $ 22,576 $ 26,665
Current debt 5,400 2,400
Revenues and royalties payable 3,404 5,299
Accrued liabilities and other 9,906 10,320
Fair Value of derivative contracts - 2,082
------------- ------------
Total current liabilities 41,286 46,766
LONG-TERM DEBT, net of current portion 177,995 244,705
OTHER NONCURRENT LIABILITIES 91 125
STOCKHOLDERS' EQUITY:
Preferred stock, $0.01 par value, 1,000,000 shares
authorized, 0 shares issued and outstanding - -
Common stock, $0.01 par value, 20,000,000 shares
authorized, 14,368,919 shares issued and outstanding 144 144
Additional paid-in-capital 25,087 25,087
Retained earnings 109,882 89,850
------------- ------------
Total stockholders' equity 135,113 115,081
------------- ------------
Total liabilities and stockholders' equity $ 354,485 $ 406,677
============= ============
The accompanying notes are an integral part of these consolidated balance
sheets.
26, 2009
CONTINENTAL RESOURCES, INC. AND SUBSIDIARIES
CONSOLIDATED STATEMENTS OF OPERATIONS
(dollars in thousands, except share data)
December 31,
----------------------------------------------
REVENUES: 2000 2001 2002
-------------- -------------- --------------
Oil and gas sales $ 115,478 $ 112,170 $ 108,752
Crude oil marketing income 279,834 245,872 153,547
Change in derivative fair value - - (1,455)
Gathering, marketing and processing 32,758 44,988 33,708
Oil and gas service operations 5,760 6,047 5,739
-------------- -------------- --------------
Total revenues 433,830 409,077 300,291
OPERATING COSTS AND EXPENSES:
Production expenses 20,301 28,406 28,383
Production taxes 9,506 8,385 7,729
Exploration expenses 9,965 15,863 10,229
Crude oil marketing expenses 278,809 245,003 152,718
Gathering, marketing and processing 28,303 36,367 29,783
Oil and gas service operations 5,582 5,294 6,462
Depreciation, depletion and amortization 19,552 27,731 31,380
Property impairments 5,631 10,113 25,686
General and administrative 7,142 8,753 10,713
-------------- -------------- --------------
Total operating costs and expenses 384,791 385,915 303,083
OPERATING INCOME (LOSS) 49,039 23,162 (2,792)
OTHER INCOME (EXPENSES):
Interest income 756 630 285
Interest expense (16,514) (15,674) (18,401)
Other income, net 4,499 3,549 876
-------------- -------------- --------------
Total other income (expense) (11,259) (11,495) (17,240)
-------------- -------------- --------------
NET INCOME (LOSS) $ 37,780 $ 11,667 $ (20,032)
============== ============== ==============
EARNINGS PER COMMON SHARE:
Basic $ 2.63 $ 0.81 $ (1.39)
============== ============== ==============
Diluted $ 2.62 $ 0.81 $ (1.39)
============== ============== ==============
Continental Resources, Inc. and Subsidiary
Consolidated Balance Sheets
| December 31, | ||||||
| 2008 | 2007 | |||||
| (In thousands, except par values and share data) | ||||||
Assets | ||||||
Current assets: | ||||||
Cash and cash equivalents | $ | 5,229 | $ | 8,761 | ||
Receivables: | ||||||
Oil and natural gas sales | 63,659 | 95,165 | ||||
Affiliated parties | 14,914 | 17,146 | ||||
Joint interest and other, net | 150,506 | 50,779 | ||||
Inventories | 22,210 | 19,119 | ||||
Deferred and prepaid taxes | 18,810 | 12,159 | ||||
Prepaid expenses and other | 2,367 | 2,435 | ||||
Total current assets | 277,695 | 205,564 | ||||
Net property and equipment, based on successful efforts method of accounting | 1,935,143 | 1,157,926 | ||||
Debt issuance costs, net | 3,041 | 1,683 | ||||
Total assets | $ | 2,215,879 | $ | 1,365,173 | ||
Liabilities and shareholders’ equity | ||||||
Current liabilities: | ||||||
Accounts payable trade | $ | 260,188 | $ | 127,730 | ||
Accounts payable trade to affiliated parties | 25,730 | 15,090 | ||||
Accrued liabilities and other | 34,769 | 25,295 | ||||
Revenues and royalties payable | 78,160 | 67,349 | ||||
Unrealized derivative losses | — | 26,703 | ||||
Current portion of asset retirement obligation | 4,747 | 3,939 | ||||
Total current liabilities | 403,594 | 266,106 | ||||
Long-term debt | 376,400 | 165,000 | ||||
Other noncurrent liabilities: | ||||||
Deferred tax liability | 445,752 | 271,424 | ||||
Asset retirement obligation, net of current portion | 39,883 | 38,153 | ||||
Other noncurrent liabilities | 1,542 | 1,358 | ||||
Total other noncurrent liabilities | 487,177 | 310,935 | ||||
Commitments and contingencies (Note 10) | ||||||
Shareholders’ equity: | ||||||
Preferred stock, $0.01 par value: 25,000,000 shares authorized; no shares issued and outstanding | — | — | ||||
Common stock, $0.01 par value; 500,000,000 shares authorized, 169,558,129 shares issued and outstanding at December 31, 2008; 168,864,015 shares issued and outstanding at December 31, 2007 | 1,696 | 1,689 | ||||
Additional paid-in capital | 420,054 | 415,435 | ||||
Retained earnings | 526,958 | 206,008 | ||||
Total shareholders’ equity | 948,708 | 623,132 | ||||
Total liabilities and shareholders’ equity | $ | 2,215,879 | $ | 1,365,173 | ||
The accompanying notes are an integral part of these consolidated financial statements.
CONTINENTAL RESOURCES, INC. AND SUBSIDIARIES
CONSOLIDATED STATEMENTS OF STOCKHOLDERS' EQUITY
FOR THE YEARS ENDED DECEMBER 31, 2000, 2001 AND 2002
(dollars in thousands)
Additional Total
Shares Common Paid-In Retained Stockholders'
Outstanding Stock Capital Earning Equity
------------- ------------ ------------ ------------- --------------
BALANCE, December 31, 1999 14,368,919 $ 144 $ 25,087 $ 61,435 $ 86,666
Net Income - - - 37,780 37,780
Dividends paid - - - (1,000) (1,000)
------------- ------------ ------------ ------------- --------------
BALANCE, December 31, 2000 14,368,919 $ 144 $ 25,087 $ 98,215 $ 123,446
------------- ------------ ------------ ------------- --------------
Net Income - - - 11,667 11,667
------------- ------------ ------------ ------------- --------------
BALANCE, December 31, 2001 14,368,919 $ 144 $ 25,087 $ 109,882 $ 135,113
------------- ------------ ------------ ------------- --------------
Net Loss - - - (20,032) (20,032)
------------- ------------ ------------ ------------- --------------
BALANCE, December 31, 2002 14,368,919 $ 144 $ 25,087 $ 89,850 $ 115,081
============= ============ ============ ============= ==============
Continental Resources, Inc. and Subsidiary
Consolidated Statements of Income
| Year Ended December 31, | ||||||||||||
| 2008 | 2007 | 2006 | ||||||||||
| (In thousands, except per share data) | ||||||||||||
Revenues: | ||||||||||||
Oil and natural gas sales | $ | 875,213 | $ | 572,610 | $ | 374,304 | ||||||
Oil and natural gas sales to affiliates | 64,693 | 33,904 | 94,298 | |||||||||
Loss on mark-to-market derivative instruments | (7,966 | ) | (44,869 | ) | — | |||||||
Oil and natural gas service operations | 28,550 | 20,570 | 15,050 | |||||||||
Total revenues | 960,490 | 582,215 | 483,652 | |||||||||
Operating costs and expenses: | ||||||||||||
Production expenses | 80,935 | 57,562 | 45,694 | |||||||||
Production expense to affiliates | 20,700 | 18,927 | 17,171 | |||||||||
Production tax | 58,610 | 32,562 | 22,331 | |||||||||
Exploration expense | 40,160 | 9,163 | 19,738 | |||||||||
Oil and natural gas service operations | 18,188 | 12,709 | 8,231 | |||||||||
Depreciation, depletion, amortization and accretion | 148,902 | 93,632 | 65,428 | |||||||||
Property impairments | 28,847 | 17,879 | 11,751 | |||||||||
General and administrative | 35,719 | 32,802 | 31,074 | |||||||||
Gain on sale of assets | (894 | ) | (988 | ) | (290 | ) | ||||||
Total operating costs and expenses | 431,167 | 274,248 | 221,128 | |||||||||
Income from operations | 529,323 | 307,967 | 262,524 | |||||||||
Other income (expense): | ||||||||||||
Interest expense | (12,188 | ) | (12,939 | ) | (11,310 | ) | ||||||
Other | 1,395 | 1,749 | 1,742 | |||||||||
| (10,793 | ) | (11,190 | ) | (9,568 | ) | |||||||
Income before income taxes | 518,530 | 296,777 | 252,956 | |||||||||
Provision (benefit) for income taxes | 197,580 | 268,197 | (132 | ) | ||||||||
Net income | $ | 320,950 | $ | 28,580 | $ | 253,088 | ||||||
Basic net income per share | $ | 1.91 | $ | 0.17 | $ | 1.60 | ||||||
Diluted net income per share | $ | 1.89 | $ | 0.17 | $ | 1.59 | ||||||
Dividends per share | $ | — | $ | 0.33 | $ | 0.55 | ||||||
Pro forma (unaudited, Note 1): | ||||||||||||
Income before income taxes | $ | 296,777 | $ | 252,956 | ||||||||
Provision for income taxes | 112,775 | 96,123 | ||||||||||
Net income | $ | 184,002 | $ | 156,833 | ||||||||
Basic net income per share | $ | 1.12 | $ | 0.97 | ||||||||
Diluted net income per share | $ | 1.11 | $ | 0.96 | ||||||||
The accompanying notes are an integral part of these consolidated financial statements.
CONTINENTAL RESORUCES, INC. AND SUBSIDIARIES
CONSOLIDATED STATEMETNS OF CASH FLOW
FOR THE YEARS ENDED DECEMBER 31, 2000, 2001 AND 2002
2000 2001 2002
--------------- -------------- --------------
CASH FLOWS FROM OPERATING ACTIVITIES:
Net income (loss) $ 37,780 $ 11,667 $ (20,032)
Adjustments to reconcile net income (loss) to net cash
provided by operating activities-
Depreciation, depletion and amortization 19,552 27,731 31,380
Impairment of properties 4,786 6,595 25,686
Change in derivative fair value - - 1,455
Amortization of debt issuance costs 728 534 1,171
Gain on sale of assets (3,719) (3,460) (223)
Dry hole costs and impairment of undeveloped leases 7,119 12,996 5,880
Cash provided by (used in) changes in assets and liabilities-
Accounts receivable (5,591) 7,360 (4,383)
Inventories (876) (1,333) (379)
Prepaid expenses 1,481 (278) 5
Accounts payable 8,716 5,411 4,089
Revenues and royalties payable 315 (3,776) 1,895
Accrued liabilities and other 599 (469) 414
Other noncurrent assets 1,373 435 5
Other noncurrent liabilities - - 34
--------------- -------------- --------------
Net cash provided by operating activities 72,263 63,413 46,997
CASH FLOWS FROM INVESTING ACTIVITIES:
Exploration and development (50,711) (68,123) (106,532)
Gas gathering and processing facilities and service
properties, equipment and other (1,200) (6,645) (6,260)
Purchase of oil and gas properties - (36,535) (655)
Proceeds from sale of assets 7,665 4,639 152
--------------- -------------- --------------
Net cash used in investing activities (44,246) (106,384) (113,295)
CASH FLOWS FROM FINANCING ACTIVITIES:
Proceeds from line of credit and other 37,000 52,245 138,830
Repayment of Senior Subordinated Notes (19,850) (3,000)
Repayment of line of credit and other (47,436) (6,200) (75,120)
Debt issuance costs - - (2,117)
Repayment of short-term debt due to stockholder - - -
Payment of cash dividend (1,000) - -
--------------- -------------- --------------
Net cash provided by (used in) financing activities (31,286) 43,045 61,593
NET INCREASE (DECREASE) IN CASH (3,269) 74 (4,705)
CASH, beginning of year 10,421 7,151 7,225
--------------- -------------- --------------
CASH, end of year $ 7,152 $ 7,225 $ 2,520
=============== ============== ==============
SUPPLEMENTAL CASH FLOW INFORMATION:
Interest paid $ 16,615 $ 15,269 $ 16,386
Continental Resources, Inc. and Subsidiary
Consolidated Statements of Shareholders’ Equity
| Shares outstanding | Common stock | Additional paid-in capital | Retained earnings | Accumulated other comprehensive income (loss) | Total shareholders’ equity | ||||||||||||||||||
| (in thousands, except share data) | |||||||||||||||||||||||
Balance, January 1, 2006 | 159,048,626 | $ | 144 | $ | 27,087 | $ | 297,461 | $ | 38 | $ | 324,730 | ||||||||||||
Comprehensive income: | |||||||||||||||||||||||
Net income | — | — | — | 253,088 | — | 253,088 | |||||||||||||||||
Other comprehensive income, net of tax | — | — | — | — | (63 | ) | (63 | ) | |||||||||||||||
Total comprehensive income | 253,025 | ||||||||||||||||||||||
Stock options: | |||||||||||||||||||||||
Exercised | 22,660 | — | — | — | — | — | |||||||||||||||||
Restricted stock: | |||||||||||||||||||||||
Issued | 200,772 | — | — | — | — | — | |||||||||||||||||
Repurchased and canceled | (60,665 | ) | — | — | — | — | — | ||||||||||||||||
Forfeited | (105,149 | ) | — | — | — | — | — | ||||||||||||||||
Dividends | — | — | — | (87,294 | ) | — | (87,294 | ) | |||||||||||||||
Balance, December 31, 2006 | 159,106,244 | $ | 144 | $ | 27,087 | $ | 463,255 | $ | (25 | ) | $ | 490,461 | |||||||||||
Comprehensive income: | |||||||||||||||||||||||
Net income | — | — | — | 28,580 | — | 28,580 | |||||||||||||||||
Other comprehensive income, net of tax | — | — | — | — | 25 | 25 | |||||||||||||||||
Total comprehensive income | 28,605 | ||||||||||||||||||||||
Public offering of common stock | 8,850,000 | 89 | 124,406 | — | — | 124,495 | |||||||||||||||||
Reclass for stock split | — | 1,447 | (1,447 | ) | — | — | — | ||||||||||||||||
Adjust for undistributed earnings from conversion to subchapter C corporation | — | — | 234,099 | (234,099 | ) | — | — | ||||||||||||||||
Reclass stock compensation liability to equity | — | — | 29,828 | — | — | 29,828 | |||||||||||||||||
Stock-based compensation | — | — | 3,874 | — | — | 3,874 | |||||||||||||||||
Tax benefit on share-based compensation plan | — | — | 1,630 | — | — | 1,630 | |||||||||||||||||
Stock options: | |||||||||||||||||||||||
Exercised | 689,476 | 7 | 619 | — | — | 626 | |||||||||||||||||
Repurchased and canceled | (292,313 | ) | (3 | ) | (3,079 | ) | — | — | (3,082 | ) | |||||||||||||
Restricted stock: | |||||||||||||||||||||||
Issued | 629,684 | 6 | — | — | — | 6 | |||||||||||||||||
Repurchased and canceled | (77,441 | ) | (1 | ) | (1,476 | ) | — | — | (1,477 | ) | |||||||||||||
Forfeited | (41,635 | ) | — | (106 | ) | — | — | (106 | ) | ||||||||||||||
Dividends | — | — | — | (51,728 | ) | — | (51,728 | ) | |||||||||||||||
Balance, December 31, 2007 | 168,864,015 | $ | 1,689 | $ | 415,435 | $ | 206,008 | $ | — | $ | 623,132 | ||||||||||||
Net income | — | — | — | 320,950 | — | 320,950 | |||||||||||||||||
Stock-based compensation | — | — | 9,927 | — | — | 9,927 | |||||||||||||||||
Stock options: | |||||||||||||||||||||||
Exercised | 436,327 | 4 | 1,438 | — | — | 1,442 | |||||||||||||||||
Repurchased and canceled | (82,922 | ) | (1 | ) | (4,017 | ) | — | — | (4,018 | ) | |||||||||||||
Restricted stock: | |||||||||||||||||||||||
Issued | 461,120 | 5 | — | — | — | 5 | |||||||||||||||||
Repurchased and canceled | (91,568 | ) | (1 | ) | (2,729 | ) | — | — | (2,730 | ) | |||||||||||||
Forfeited | (28,843 | ) | — | — | — | — | — | ||||||||||||||||
Balance, December 31, 2008 | 169,558,129 | $ | 1,696 | $ | 420,054 | $ | 526,958 | $ | — | $ | 948,708 | ||||||||||||
The accompanying notes are an integral part of these consolidated financial statements.
CONTINENTAL RESOURCES, INC. AND SUBSIDIARIES
NOTES TO CONSOLIDATED FINANCIAL STATEMENTS
1. SUMMARY OF SIGNIFICANT ACCOUNTING POLICIES:
ORGANIZATION
Continental Resources, Inc. ("CRI") was incorporated in Oklahoma on
November 16, 1967, as Shelly Dean Oil Company. On September 23, 1976, the name
was changed to Hamm Production Company. In January 1987, the Company acquired
alland Subsidiary
Consolidated Statements of the assets and assumed the debtCash Flows
| Year ended December 31, | ||||||||||||
| 2008 | 2007 | 2006 | ||||||||||
| (In thousands) | ||||||||||||
Cash flows from operating activities: | ||||||||||||
Net income | $ | 320,950 | $ | 28,580 | $ | 253,088 | ||||||
Adjustments to reconcile net income to net cash provided by operating activities: | ||||||||||||
Depreciation, depletion, amortization and accretion | 148,573 | 95,604 | 65,540 | |||||||||
Property impairments | 28,847 | 17,879 | 11,751 | |||||||||
Change in derivative fair value | (26,703 | ) | 26,703 | — | ||||||||
Equity compensation | 9,081 | 12,791 | 10,932 | |||||||||
Tax benefit of excess non qualified stock compensation deduction | — | (1,630 | ) | — | ||||||||
Provision for deferred income taxes | 184,115 | 262,412 | — | |||||||||
Dry hole costs | 20,002 | 3,549 | 13,344 | |||||||||
Other, net | (114 | ) | (331 | ) | 610 | |||||||
Changes in assets and liabilities: | ||||||||||||
Accounts receivable | (65,989 | ) | (74,004 | ) | (11,739 | ) | ||||||
Inventories | (3,834 | ) | (11,288 | ) | (3,005 | ) | ||||||
Prepaid expenses and other | (16,520 | ) | (2,837 | ) | (386 | ) | ||||||
Accounts payable | 101,967 | (7,760 | ) | 77,422 | ||||||||
Revenues and royalties payable | 10,811 | 38,611 | (2,917 | ) | ||||||||
Accrued liabilities and other | 8,545 | 2,009 | 2,297 | |||||||||
Other noncurrent liabilities | 184 | 360 | 104 | |||||||||
Net cash provided by operating activities | 719,915 | 390,648 | 417,041 | |||||||||
Cash flows from investing activities: | ||||||||||||
Exploration and development | (841,479 | ) | (477,663 | ) | (313,071 | ) | ||||||
Purchase of oil and gas properties | (74,662 | ) | (4,166 | ) | (6,564 | ) | ||||||
Purchase of other property and equipment | (14,651 | ) | (4,610 | ) | (6,944 | ) | ||||||
Proceeds from sale of assets | 3,175 | 2,941 | 2,056 | |||||||||
Net cash used in investing activities | (927,617 | ) | (483,498 | ) | (324,523 | ) | ||||||
Cash flows from financing activities: | ||||||||||||
Revolving credit facility | 443,000 | 288,500 | 286,000 | |||||||||
Repayment of revolving credit facility | (231,600 | ) | (263,500 | ) | (289,000 | ) | ||||||
Proceeds from initial public offering, net | — | 124,495 | — | |||||||||
Dividends to shareholders | (207 | ) | (52,036 | ) | (87,373 | ) | ||||||
Repurchase of equity grants | (6,748 | ) | (5,075 | ) | — | |||||||
Exercise of options | 1,442 | 644 | 29 | |||||||||
Tax benefit of excess non qualified stock compensation deduction | — | 1,630 | — | |||||||||
Debt issuance costs | (1,717 | ) | (90 | ) | (1,107 | ) | ||||||
Net cash (used in) provided by financing activities | 204,170 | 94,568 | (91,451 | ) | ||||||||
Effect of exchange rate changes on cash and cash equivalents | — | 25 | (63 | ) | ||||||||
Net change in cash and cash equivalents | (3,532 | ) | 1,743 | 1,004 | ||||||||
Cash and cash equivalents at beginning of period | 8,761 | 7,018 | 6,014 | |||||||||
Cash and cash equivalents at end of period | $ | 5,229 | $ | 8,761 | $ | 7,018 | ||||||
The accompanying notes are an integral part of Continental Trend Resources, Inc.
Affiliated entities, J.S. Aviation and Wheatland Oil Co. were merged into Hamm
Production Company, and the corporate name was changed to Continental Trend
Resources, Inc. at that time. In 1991, the Company's name was changed to
these consolidated financial statements.
Continental Resources, Inc. CRIand Subsidiary
Notes to Consolidated Financial Statements
1. Organization and Summary of Significant Accounting Policies
Description of Company
Continental Resources, Inc. is incorporated under the laws of the State of Oklahoma. It was originally formed in 1967 to explore, develop and produce oil and natural gas properties in Oklahoma. Through 1993, its activities and growth remained focused primarily in Oklahoma. In 1993, the Company expanded its activity into the Rocky Mountain and Gulf Coast regions. Approximately 70% of its estimated proved reserves as of December 31, 2008 are located in the Rocky Mountain region. As of December 31, 2008, the Company had interests in 2,192 wells and serves as the operator of 1,657 of these wells.
On May 14, 2007, the Company completed its initial public offering. In conjunction therewith, the Company effected an 11 for 1 stock split by means of a stock dividend. All prior period share and per share information contained in this report has threebeen retroactively restated to give effect to the stock split. On May 14, 2007, the Company amended its certificate of incorporation to, among other things, increase the number of authorized preferred shares to 25 million and common shares to 500 million. Prior to completion of the public offering, the Company was a subchapter S corporation and income taxes were payable by its shareholders. In connection with the public offering, the Company converted to a subchapter C corporation.
Basis of presentation
Continental had one wholly owned subsidiaries, Continental Gas, Inc. ("CGI"),subsidiary, Continental Resources of Illinois, Inc. ("CRII"(“CRII”) and Continental Crude Co.
("CCC"). CGI was incorporated in April 1990,at December 31, 2005. CRII was incorporated in June 2001 for the purpose of acquiring the assets of Farrar Oil Company and Har-Ken Oil Company. Continental acquired Banner Pipeline Company, and CCC was incorporated in May 1998. Since its incorporation, CCC has
had no operations, has acquired no assets and has incurred no liabilities.
CRI and CRII's principal business is oil and natural gas exploration,
development and production. CRI and CRII have interests inL.L.C. (“Banner”) on March 30, 2006 for approximately 2,460
wells and serve as$8.8 million, which represented the operator in the majoritybook value of these wells. CRI and CRII's
operations are primarily in Oklahoma, North Dakota, South Dakota, Montana,
Wyoming, Texas, Illinois, Mississippi and Louisiana. In July 1998, CRI began
entering into third party contracts to purchase and resellworking capital, principally cash, accounts receivable, crude oil inventory and accounts payable. CRII was merged into Continental on October 12, 2006. Banner was Continental’s only subsidiary at prices
based on current month NYMEX prices, current posting prices or at a stated
contract price.
CGI is engaged principally in natural gas marketing, gatheringDecember 31, 2007 and processing activities and currently operates eight gas gathering systems and
three gas processing plants in its operating areas. In addition, CGI
participates with CRI in certain oil and natural gas wells.
Basis of Presentation
The accompanying consolidated financial statements include the accounts and
operations of CRI, CRII, CGI and CCC (collectively the "Company"). 2008.
All significant intercompanyinter-company accounts and transactions have been eliminated in the consolidated financial statements. Certain reclassifications
The preparation of financial statements in conformity with accounting principles generally accepted in the United States of America requires management to make estimates and assumptions that affect the reported amounts of assets and liabilities, the disclosure of contingent assets and liabilities at the date of the financial statements, and the reported amounts of revenues and expenses during the reporting period. Actual results could differ from those estimates. The estimate of the Company’s oil and natural gas reserves, which is used to compute depreciation, depletion, amortization and impairment on producing oil and gas properties, is the most significant of the estimates and assumptions that affect reported results.
Pro forma information (unaudited)
Pro forma adjustments are reflected on the consolidated statements of income to provide for income taxes in accordance with Statement of Financial Accounting Standards (“SFAS”) No. 109 “Accounting for Income Taxes” as if the Company had been a subchapter C corporation for all pro forma periods presented. For unaudited pro forma income tax calculations, deferred tax assets and liabilities were recognized for the future tax consequences attributable to differences between the financial statement carrying amounts of existing assets and liabilities and their respective tax basis. Deferred tax assets and liabilities were measured using enacted tax rates expected to apply to taxable income in the years in which the Company expects to recover or settle those temporary differences. A statutory Federal tax rate of 35% and effective state tax rate of 3% (net of Federal
Continental Resources, Inc. and Subsidiary
Notes to Consolidated Financial Statements—(continued)
income tax effects) were used for the pro forma enacted tax rate for all periods. The pro forma tax effects are based upon currently available information. Management believes that these assumptions provide a reasonable basis for representing the pro forma tax effects.
The pro forma information should be read in conjunction with the related historical information and is not necessarily indicative of the results that would have been made to
prior year amounts to conformattained had the transactions actually taken place.
Revenue recognition
Oil and natural gas sales result from interests owned by the Company in oil and natural gas properties. Sales of oil and natural gas produced from oil and natural gas operations are recognized when the product is delivered to the currentpurchaser and title transfers to the purchaser. The Company uses the sales method of accounting for natural gas imbalances in those circumstances where it has under-produced or over-produced its ownership percentage in a property. Under this method, a receivable or liability is recognized only to the extent that an imbalance cannot be recouped from the reserves in the underlying properties. The Company’s aggregate imbalance positions at December 31, 2008 and 2007 were not material. Charges for gathering and transportation are included in production expenses.
Cash and cash equivalents
The Company considers all highly liquid investments with original maturities of three months or less to be cash equivalents. The Company maintains its cash and cash equivalents in accounts that may not be federally insured. The Company has not experienced any losses in such accounts and believes it is not exposed to significant credit risk.
Accounts receivable
The Company operates exclusively in oil and natural gas exploration and production related activities. Oil and natural gas sales and joint interest receivables are generally unsecured. Accounts receivable are due within 30 days and considered delinquent after 60 days. The Company determines its allowance for doubtful accounts by considering a number of factors, including the length of time accounts are past due, the Company’s loss history, and the customer or working interest owner’s ability to pay. The Company writes off specific accounts when they become uncollectible and any payments subsequently received on these receivables are credited to the allowance for doubtful accounts. The following table presents the allowance for doubtful accounts at December 31, 2008, 2007 and 2006 and changes in the allowance for these years:
| Balance at beginning of period | Additions charged to costs and expenses | Deductions | Balance at end of period | ||||||||||
Year ended December 31, 2008 | $ | 193,326 | $ | — | $ | (200 | ) | $ | 193,126 | ||||
Year ended December 31, 2007 | 193,326 | — | — | 193,326 | |||||||||
Year ended December 31, 2006 | 171,451 | 68,178 | (46,303 | ) | 193,326 | ||||||||
Concentration of credit risk
The Company is subject to credit risk resulting from the concentration of its crude oil and natural gas receivables with several significant customers. The largest purchasers of the Company’s oil and gas production accounted for 44% (one purchaser), 44% (three purchasers) and 33% (two purchasers) of total revenues for 2008, 2007 and 2006, respectively. These purchasers constituted all purchasers with sales in excess of 10% of total
Continental Resources, Inc. and Subsidiary
Notes to Consolidated Financial Statements—(continued)
revenues. The Company does not require collateral and does not believe the loss of any single purchaser would materially impact its operating results, as oil and natural gas are fungible products with well-established markets and numerous purchasers.
Inventories
Inventories are stated at the lower of cost or market. Inventory consists primarily of tubular goods and production equipment, which totaled approximately $14.9 million and $4.7 million at December 31, 2008 and 2007, respectively, and crude oil line fill and temporary storage of approximately $7.3 million, representing 275,000 barrels of crude oil, and $14.4 million, representing 384,000 barrels of crude oil, at December 31, 2008 and 2007, respectively.
Property and equipment
Property and equipment are capitalized and stated at cost, while maintenance and repairs are expensed as incurred.
Depreciation and amortization are provided in amounts sufficient to expense the cost of depreciable assets to operations over their estimated useful lives using the straight-line method. Estimated useful lives are as follows:
Property and Equipment | Useful Lives in Years | |
Furniture and fixtures | 10 | |
Automobiles | 5 | |
Machinery and equipment | 10-20 | |
Office and computer equipment | 5 | |
Building and improvements | 10-40 |
Oil and gas properties
The Company uses the successful efforts method of accounting for oil and gas properties whereby costs to acquire mineral interests in oil and gas properties, drill and equip exploratory wells that find proved reserves and to drill and equip development wells are capitalized. Geological and geophysical costs, seismic costs, lease rentals and costs associated with unsuccessful exploratory wells are expensed as incurred. Maintenance and repairs are expensed as incurred, except that the cost of replacements or renewals that expand capacity or improve production are capitalized.
The Company reports capitalized exploratory drilling costs on the balance sheet according to SFAS No. 19, “Financial Accounting and Reporting by Oil and Gas Producing Companies”. On a monthly basis, the Company capitalizes the costs of drilling exploratory wells pending determination of whether the well has found proved reserves. The Company capitalizes costs associated with the acquisition or construction of support equipment and facilities with the drilling and development costs to which they relate. If proved reserves are found by an exploratory well, associated capitalized costs become part of well equipment and facilities. However, if proved reserves are not found, the capitalized costs associated with the well are expensed, net of any salvage value. Total capitalized exploratory drilling costs, as of December 31, 2008 and 2007, pending the determination of proved reserves were $46.3 million and $32.9 million, respectively. As of December 31, 2008, exploratory drilling costs of $0.2 million representing three wells were suspended beyond one year presentation.
Recently Issued Accounting Pronouncements
In August 2001,and are expected to be fully evaluated in 2009. Of the FASB issuedsuspended costs, $0.1 million was incurred in 2007 and the balance in 2008. All three projects were drilled in 2007.
Continental Resources, Inc. and Subsidiary
Notes to Consolidated Financial Statements—(continued)
Production expenses are those costs incurred by the Company to operate and maintain its oil and natural gas properties and associated equipment and facilities. Production expenses include labor costs to operate the Company’s properties, repairs and maintenance, and materials and supplies utilized in the Company’s operations.
The Company accounts for its asset retirement obligations pursuant to SFAS No. 143, Accounting“Accounting for Asset Retirement Obligations (SFAS No. 143). SFAS No. 143Obligations” which requires entities to record the fair value of a liability for an asset retirement obligation in the period in which it is incurred and a corresponding increase in the carrying amount of the related long-lived asset. Subsequently, the asset retirement cost should be
allocatedcosts are charged to expense using a systematicthrough the depreciation, depletion and rational methodamortization of oil and gas properties and the liability should beis accreted to the expected abandonment amount over the asset’s life.
The Company’s primary asset retirement obligations relate to future plugging and abandonment expenses on its face amount.oil and natural gas properties and related facilities disposal. The Company adopted SFAS No. 143 onfollowing table summarizes the changes in the Company’s future abandonment liability from January 1, 2003. The primary impact2006 through December 31, 2008 (in thousands):
| 2008 | 2007 | 2006 | ||||||||||
Asset retirement obligation liability at January 1, | $ | 42,092 | $ | 41,273 | $ | 34,353 | ||||||
Asset retirement obligation accretion expense | 2,053 | 1,962 | 1,680 | |||||||||
Plus: Revisions | (117 | ) | (1,817 | ) | 4,391 | |||||||
Additions for new assets | 3,900 | 2,453 | 2,480 | |||||||||
Less: Plugging costs and sold assets | (3,298 | ) | (1,779 | ) | (1,631 | ) | ||||||
Asset retirement obligation liability at December 31, | $ | 44,630 | $ | 42,092 | $ | 41,273 | ||||||
As of this standard relates toDecember 31, 2008 and 2007, property and equipment included $30.5 million and $27.5 million, respectively, of net asset retirement costs.
Depreciation, depletion, amortization and accretion
Depreciation, depletion, and amortization (DD&A) of capitalized drilling and development costs, including related support equipment and facilities, of producing oil and gas wellsproperties are computed using the units of production method on whicha field basis based on total estimated proved developed oil and gas reserves. Amortization of producing leasehold is based on the Company has a legal obligation to plugunit-of-production method using total estimated proved reserves. In arriving at rates under the unit-of-production method, the quantities of recoverable oil and abandonnatural gas are established based on estimates made by the wells.
Prior to SFAS No. 143, the Company had not recorded an obligation for these
pluggingCompany’s geologists, engineers and abandonment costs due to its assumption that the salvage valueindependent reserve engineers. Upon sale or retirement of the surface equipment would substantially offsetproperties, the cost and related accumulated DD&A are eliminated from the accounts and the resulting gain or loss is recognized. Unit of dismantlingproduction rates are revised whenever there is an indication of a need, but at least in conjunction with semi-annual reserve reports. Revisions are accounted for prospectively as changes in accounting estimates.
Impairment
Non-producing properties consist of undeveloped leasehold costs and costs associated with the facilitiespurchase of proved undeveloped reserves. Individually significant non-producing properties are periodically assessed for impairment of value and carrying outa loss is recognized at the necessary clean-uptime of impairment. Other non-producing properties are amortized on a composite method based on the Company’s estimated experience of successful drilling and reclamation activities.
The adoptionthe average holding period. Impairment of non-producing properties was $16.6 million, $13.2 million and $5.4 million for 2008, 2007, and 2006 respectively.
Continental Resources, Inc. and Subsidiary
Notes to Consolidated Financial Statements—(continued)
In accordance with the provisions of SFAS No. 143 on January 1, 2003, resulted in a net increase to
Property and Equipment and Asset Retirement Obligations of approximately $39.3
million and $35.2 million, respectively, as a result of the Company separately
accounting for salvage values and recording the estimated fair value of its
plugging and abandonment obligations on the balance sheet. The impact of
adopting SFAS No. 143 has been accounted for through a cumulative effect
adjustment that amounted to $4.1 million increase to net income recorded on
January 1, 2003. The increase in expense resulting from the accretion of the
asset retirement obligation and the depreciation of the additional capitalized
well costs is expected to be substantially offset by the decrease in
depreciation from the Company's consideration of the estimated salvage values in
the calculation.
In August 2001, the FASB issued SFAS No. 144, Accounting“Accounting for the Impairment or Disposal of Long-Lived Assets. SFAS No. 144 requires (a) that anAssets”, the Company recognizes impairment loss be recognized only ifexpenses for developed oil and gas properties and other long-lived assets when indicators of impairment are present and the carrying amount of a long-lived asset is not
recoverable from its undiscounted cash flows from proved and (b) thatrisk-adjusted probable reserves are not sufficient to recover the measurement of anyassets’ carrying amount. The impairment loss be the difference between the carrying amount andis measured by comparing the fair value of the long-lived asset. SFAS No. 144 also requires companiesasset to separately
report discontinued operations and extends that reporting to a component of an
entity that either has been disposed of (by sale, abandonment, or in a
distribution to owners) or is classified as held for sale.
Assets to be disposed ofits carrying amount. Fair values are reported at the lower of the carrying amount
or fair value less costs to sell.based on discounted future cash flows. The Company adopted SFAS No. 144 effective
January 1, 2002. The adoption of this new standard did not have a material
impact on the Company's consolidated financial position or results of
operations.
As of May 15, 2002, the Company adopted SFAS No. 145, Rescission of FASB
Statements No. 4, 44, and 64, Amendment of FASB Statement No. 13, and Technical
Corrections. SFAS 145 rescinds the automatic treatment of gains and losses from
extinguishments of debt as extraordinary unless they meet the criteria for
extraordinary items as outlined in Accounting Principles Board Opinion No. 30,
Reporting the Results of Operations, Reporting the Effects of Disposal of a
Segment of a Business, and Extraordinary, Unusual and Infrequently Occurring
Events and Transactions. SFAS 145 also requires sale-leaseback accounting for
certain lease modifications that have economic effects similar to a
sale-leaseback transaction and makes various corrections to existing
pronouncements. The adoption of SFAS 145 did not have a material effect on the
Company's consolidated financial position or results of operations.
In July 2002, the FASB issued SFAS No. 146, Accounting for Costs Associated
with Exit or Disposal Activities. SFAS No. 146 addresses financial accounting
and reporting for costs associated with exit and disposal activities and
supersedes Emerging Issues Task Force (EITF) Issue No. 94-3, Liability
Recognition for Certain Employee Termination Benefits and Other Costs to Exit an
Activity (including Certain Costs Incurred in a Restructuring). SFAS No. 146
requires recognition of a liability for a cost associated with an exit or
disposal activity when the liability is incurred, as opposed to when the entity
commits to an exit plan under EITF 94-3. SFAS No. 146 also establishes that the
liability should initially be measured and recorded at fair value. Adoption of
SFAS No. 146 is required for exit and disposal activities initiated after
December 31, 2002. The Company adopted this new standard effective January 1,
2003. The impact on the financial position and results of operations of adopting
this new standard was not material.
In October 2002, the Emerging Issues Task Force (EITF) reached a consensus
on Issue No. 02-3, Issues Related to Accounting for Contracts Involved in Energy
Trading and Risk Management Activities. The consensus rescinded EITF Issue No.
98-10, Accounting for Contracts Involved in Energy Trading and Risk Management
Activities. The October 2002 consensus precludes mark-to-market accounting for
all energy trading contracts not within the scope of SFAS No. 133, Accounting
for Derivative and Hedging Activities. The consensus to rescind EITF 98-10 is
applicable for fiscal periods beginning after December 15, 2002 (early adoption
allowed), except that energy trading contracts not within the scope of SFAS No.
133 and executed after October 25, 2002, but prior to the implementation of the
consensus, are not permitted to apply mark-to-market accounting. The EITF also
reached a consensus that gains and losses (whether realized or unrealized) on
derivative instruments within the scope of SFAS No. 133 should be shown net in
the income statement if the derivative instruments are purchased for trading
purposes with the exception of derivative contracts that culminate in the
physical delivery of a commodity and meet the criteria of EITF 99-19, Reporting
Revenue Gross as a Principal versus Net as an Agent. The Company elected to
early adopt this consensus on October 1, 2002. As the Company has no contracts
outside the scope of SFAS No.133 that are being marked to market and as the
Company's prior policy related to the presentation of gains and losses on
derivative contracts entered into for trading purposes is consistent with the
requirements of EITF 02-3, the adoption of EITF 02-3 had no material impact on
the Company. As further discussed in Derivatives below, the Company has
discontinued its trading activities as of May 2002.
Accounts Receivable
The Company operates exclusively in the oil and natural gas exploration and
production, gas gathering and processing and gas marketing industries. Joint
interest and oil and gas sales receivables are generally unsecured. The
Company's joint interest receivables at December 31, 2001 and 2002, are recorded
net of an allowance for doubtful accounts of approximately $359,000 and
$544,000, respectively, in the accompanying consolidated balance sheets.
Inventories
Inventories consist primarily of tubular goods, production equipment and
crude oil in tanks, which are stated at the lower of average cost or market. At
December 31, 2001 and 2002, tubular goods and production equipment totaled
approximately $5,071,000 and $5,572,000, respectively and crude oil in tanks
totaled approximately $1,250,000 and $1,128,000, respectively.
Property and Equipment
The Company utilizes the successful efforts method of accounting for oil
and gas activities whereby costs to acquire mineral interests inCompany’s oil and gas properties are reviewed for indicators of impairment on a field-by-field basis, resulting in the recognition of impairment provisions of $12.3 million, $4.7 million and $6.3 million, respectively, for 2008, 2007 and 2006. The majority of the impairment recognized in these years relates to drillfields comprised of a small number of properties or single wells on which the Company does not expect sufficient future net cash flows to recover its carrying cost.
Debt issuance costs
Costs incurred in connection with the issuance of long-term debt are capitalized and equip exploratory wells that find proved reservesamortized over the term of the related debt. The Company had capitalized costs of $2.8 million and $1.7 million (net of accumulated amortization of $5.6 million and $5.0 million) relating to drillthe issuance of its long-term debt at December 31, 2008 and equip development wells are capitalized. These2007, respectively. During the years ended December 31, 2008, 2007 and 2006, the Company recognized associated amortization expense of $0.6 million, $0.6 million and $0.9 million, respectively. Debt issuance costs are capitalized and amortized
to operations on a unit-of-production method based on proved developed oil and
gas reserves, allocated property by property, as estimated by petroleum
engineers. Geological and geophysical costs, lease rentals and costs associated
with unsuccessful exploratory wells are expensed as incurred. Nonproducing
leaseholds are periodically assessed for impairment, based on exploration
results and planned drilling activity. Maintenance and repairs are expensed as
incurred, except thatstraight-line basis, the costuse of replacements or renewals that expand capacity
or improve production are capitalized. Gas gathering systems and gas processing
plants are depreciated usingwhich approximates the straight-lineeffective interest method, over an estimated usefulthe life of 14 years. Service properties and equipment and other are depreciated
using the straight-line method over estimated useful lives of 5 to 40 years.
Income Taxes
revolving credit facility.
Derivatives
The Company filed a consolidated income tax return based on a May 31 fiscal
tax year-end through May 31, 1997, and deferred income taxes were provided for
temporary differences between financial reporting and income tax bases of assets
and liabilities. Effective June 1, 1997, the Company converted to an
S-Corporation under Subchapter S of the Internal Revenue Code. As a result,
income taxes attributable to Federal taxable income of the Company after May 31,
1997, if any, will be payable by the stockholders of the Company.
Earnings per Common Share
Basic earnings per common share is computed by dividing income available to
common stockholders by the weighted-average number of shares outstanding for the
period. Diluted earnings per share reflects the potential dilution that could
occur if diluted stock options were exercised calculated using the treasury
stock method. The weighted-average number of shares used to compute basic
earnings per common share was 14,368,919 in 2000, 2001 and 2002. The
weighted-average number of shares used to compute diluted earnings per share for
2000 and 2001 was 14,393,132. The outstanding stock options (see Note 7) were
not considered in the diluted earnings per share calculation for 2002, as the
effect would be antidilutive. There were no common stock equivalents or
securities outstanding during 1999 that would result in material dilution.
Accounting for Derivatives
Non-Trading Activity
The Company periodically utilizes derivative contracts to hedge the price
or basis risk associated with specifically identified purchase or sales
contracts, oil and gas production or operational needs. As of January 1, 2001,
the Company accounts for its non-trading derivative activities under the guidance provided by SFAS No. 133, Accounting“Accounting for Derivative Instruments and Hedging Activities. Prior to January 1, 2001, the Company accounted for changes
in the market value of derivative instruments used for hedgingActivities”, as a deferred
gain or loss until the production month of the hedged transactions, at which
time the gain or loss on the derivative instrument was recognized in earnings.
Under SFAS No. 133, the Companyamended, and recognizes all of its derivative instruments as assets or liabilities in the balance sheet at fair value with such amounts classified as current or long-term based on their anticipated settlement. The accounting for the changes in fair value of a derivative depends on the intended use of the derivative and resulting designation. For derivative instruments that
are designated and qualify as a fair value hedge, the gain or loss on the
derivative instrument as well as the offsetting loss or gain on the hedged item
attributable to the hedged risk are recognized in the same line item associated
with the hedged item in current earnings during the period of the change in fair
values. For derivatives that are designated and qualify as a cash flow hedge,
the effective portion of the change in fair
Fair value of the derivative instrument
is reported as a component of accumulated other comprehensive income and
recognized into earnings in the same period during which the hedged transaction
affects earnings. financial instruments
The ineffective portion of a derivative's change in fair value
is recognized currently in earnings. Hedge effectiveness is measured at least
quarterly based on relative changes in fair value between the derivative
contract and hedged item during the period of hedge designation. Forecasted
transactions designated as the hedged item in a cash flow hedge are regularly
evaluated to assess whether they continue to be probable of occurring. If the
forecasted transaction is no longer probable of occurring, any gain or loss
deferred in accumulated other comprehensive income is recognized in earnings
currently.
On January 1, 2001, the Company had no outstanding derivatives that had not
been previously marked to market through its accounting for trading activity
(see Crude Oil Marketing below). As a result, the initial adoption of SFAS No.
133 had no significant impact on the Company's financial position or results of
operations.
Crude Oil Marketing
During 1998, the Company began trading crude oil, exclusive of its own
production, with third parties, under fixed and variable priced physical
delivery contracts with terms extending out less than one year. Crude oil
marketing activities are accounted for in accordance with SFAS No. 133 and EITF
98-10, Accounting for Energy Trading and Risk Management Activities. The
adoption of SFAS No. 133 as of January 1, 2001, had no impact on the Company's
accounting for derivative contracts used in its crude oil marketing activities
as such contracts were recorded at fair value under EITF 98-10 which was issued
prior to SFAS No. 133. Under the guidance provided by SFAS No. 133 and EITF
98-10, all energy and energy related contracts are valued at fair value and
recorded as assets or liabilities in the consolidated balance sheet, classified
as current or long-term based on their anticipated settlement. Unrealized gains
and losses from changes in the fair value of open contracts are included in oil
and gas sales in the consolidated income statement. Crude oil marketing
contracts that result in delivery of a commodity and meet the requirements of
EITF 99-19, Reporting Revenues Gross as a Principal or Net as an Agent, are
included as crude oil marketing income or expense in the consolidated income
statement depending on whether the contract relates to the sale or purchase of
the commodity. Effective May 2002, the Company no longer enters into third party
contracts to purchase and resell crude oil, however we did continue to
repurchase our physical production from the Rockies and resell equivalent
barrels at Cushing to take advantage of better pricing and to reduce our credit
exposure from sales to our first purchaser. We have stated these purchases and
sales at gross in crude oil marketing. Also see Recently Issued Accounting
Pronouncements for further discussion of the accounting for the Company's energy
trading activities.
Oil and Gas Sales and Gas Balancing Arrangements
The Company sells oil and natural gas to various customers, recognizing
revenues as oil and gas is produced and sold. The Company uses the sales method
of accounting for gas imbalances in those circumstances were it has
underproduced or overproduced its ownership percentage in a property. Under this
method, a receivable or liability is recognized only to the extent that an
imbalance cannot be recouped from the reserves in the underlying properties. The
Company's aggregate imbalance positions at December 31, 2001 and 2002, were not
material. Changes for gathering and transportation are included in production
expenses.
Significant Customer
During 2000, 2001 and 2002, approximately 22.8%, 17.8% and 42.4%,
respectively, of the Company's total revenues were derived from sales made to a
single customer.
Fair Value of Financial Instruments
The Company'sCompany’s financial instruments consist primarily of cash, trade receivables, trade payables and banklong-term debt. The carrying value of cash, trade receivables and trade payables are considered to be representative of their respective fair values due to the short maturity of these instruments.
The fair value of long-term debt less the senior subordinated notes discussed in Note 4, approximates its carrying value based on the borrowing rates currently available to the Company for bank loans with similar terms and maturities. Business Segments
The estimated fair value of long-term debt is $376.4 million and $165.0 million at December 31, 2008 and 2007, respectively.
Income taxes
On May 14, 2007, the Company operatescompleted its initial public offering. Prior to completion of the public offering, the Company was a subchapter S corporation and income taxes were payable by its shareholders. In connection with the public offering, the Company converted to a subchapter C corporation and recorded a charge to income in one business segment pursuantthe second quarter of 2007 of $198.4 million to initially recognize deferred taxes at May 14, 2007. Thereafter, the Company has provided for income taxes on income. In 2005, the Company recorded federal income tax expense of $1.1 million attributable to gains on sales of properties where the fair market value at the date of conversion into a subchapter S corporation exceeded their tax basis and the properties were sold within 10 years of the conversion in accordance with section 1374 of the Internal Revenue Code. The benefit recorded during 2006 reflects a change in estimate of the original provision recorded.
Continental Resources, Inc. and Subsidiary
Notes to Consolidated Financial Statements—(continued)
Income taxes are accounted for using the liability method under which deferred income taxes are recognized for the future tax effects of temporary differences between the financial statement carrying amounts and the tax basis of existing assets and liabilities using the enacted statutory tax rates in effect at year-end. The effect on deferred taxes for a change in tax rates is recognized in income in the period that includes the enactment date. A valuation allowance for deferred tax assets is recorded when it is more likely than not that the benefit from the deferred tax asset will not be realized.
In June 2006, the FASB issued Interpretation No. 48,Accounting for Uncertainty in Income Taxes(“FIN 48”). The interpretation clarifies the accounting for uncertainty in income taxes recognized in a company’s financial statements in accordance with Statement of Financial Accounting Standards (SFAS) No. 131, "Disclosure About Segments109,Accounting for Income Taxes.The interpretation is effective for fiscal years beginning after December 15, 2006. The adoption of FIN 48 did not have a material impact on the Company’s consolidated financial position or results of operations. The Company’s policy is to recognize penalties and interest, if any, in income tax expense.
Equity compensation
The Company accounts for employee stock option grants and restricted stock grants in accordance with SFAS 123(R). The terms of the restricted stock and stock option grants stipulated that, prior to its initial public offering, the Company was required to purchase vested restricted stock and stock acquired from stock option exercises at each employee’s request based upon the purchase price as determined by a formula specified in each award agreement. Additionally, the Company had the right to purchase vested restricted stock and stock acquired from stock option exercises at the same price upon termination of employment for any reason and for a period of two years subsequent to leaving the employment of the Company. Therefore, the awards were accounted for as liability awards in accordance with SFAS 123(R). The Company measured compensation cost for the awards based upon fair value. Restricted stock and stock option values represent intrinsic value prior to 2006 and fair value after March 6, 2006, when the Company became a public entity under SFAS 123(R). Fair value of stock options is determined using the Black-Scholes option valuation model.
The right to sell and requirement to purchase lapsed when the Company became a reporting company under Section 12 of the Exchange Act. Therefore, the liability for equity compensation was reclassified to additional paid in capital in May 2007.
Continental Resources, Inc. and Subsidiary
Notes to Consolidated Financial Statements—(continued)
Earnings per common share
Basic earnings per common share is computed by dividing net income by the weighted-average number of shares outstanding for the period. Diluted earnings per share reflects the potential dilution of non-vested restricted stock awards and dilutive stock options, which are calculated using the treasury stock method as if these options were exercised. The following is the calculation of basic and diluted weighted average shares outstanding and earning per share computations for the years ended December 31, 2008, 2007 and 2006:
| 2008 | 2007 | 2006 | |||||||
| (in thousands, except per share data) | |||||||||
Income (numerator): | |||||||||
Net income—basic and diluted | $ | 320,950 | $ | 28,580 | $ | 253,088 | |||
Weighted average shares (denominator): | |||||||||
Weighted average shares—basic | 168,087 | 164,059 | 158,114 | ||||||
Restricted stock | 686 | 211 | 300 | ||||||
Employee stock options | 619 | 1,152 | 1,251 | ||||||
Weighted average shares—diluted | 169,392 | 165,422 | 159,665 | ||||||
Earnings per share: | |||||||||
Basic | $ | 1.91 | $ | 0.17 | $ | 1.60 | |||
Diluted | $ | 1.89 | $ | 0.17 | $ | 1.59 | |||
Comprehensive income
The Company classifies other comprehensive income (loss) items by their nature in the consolidated financial statements and displays the accumulated balance of other comprehensive income (loss) separately in the shareholders’ equity section of the balance sheet.
Recent accounting pronouncements
In December 2007, the FASB issued SFAS No. 141 (revised 2007), “Business Combinations” (SFAS 141(R)) and SFAS No. 160, “Noncontrolling Interests in Consolidated Financial Statements, an Enterpriseamendment of ARB No. 51” (SFAS 160). SFAS 141(R) will change how business acquisitions are accounted for and Related Information."
Usewill impact financial statements both on the acquisition date and in subsequent periods. SFAS 160 will change the accounting and reporting for minority interests, which will be re-characterized as noncontrolling interests and classified as a component of Estimatesequity. SFAS 141(R) and SFAS 160 are effective for the Company for fiscal years beginning on or after December 15, 2008. SFAS 141(R) will be applied prospectively. SFAS 160 requires retroactive adoption of the presentation and disclosure requirements for existing minority interests. All other requirements of SFAS 160 will be applied prospectively. Early adoption is prohibited for both standards. The adoption of SFAS 141(R) and SFAS 160 is not expected to have a material impact on the Company’s consolidated financial position or results of operations.
In February 2008, the FASB issued FASB Staff Position FAS 157-2,Effective Date of FASB Statement No. 157, which provides a one year delay of the effective date of FAS 157 to January 1, 2009 for the Company for non-financial assets and non-financial liabilities, except those that are recognized or disclosed at fair value in the financial statements on a recurring basis (at least annually). The impact of adoption related to the non-financial assets and liabilities will depend on the Company’s assets and liabilities at the time they are required to be measured at fair value.
In March 2008, the FASB issued SFAS No. 161,Disclosures about Derivative Instruments and Hedging Activities an amendment of FASB Statement No. 133, which amends and expands the disclosure requirements of
Continental Resources, Inc. and Subsidiary
Notes to Consolidated Financial Statements—(continued)
FAS 133 to require qualitative disclosure about objectives and strategies for using derivatives, quantitative disclosures about fair value amounts of gains and losses on derivative instruments, and disclosures about credit-risk-related contingent features in derivative agreements. This statement will be effective for the Company beginning in fiscal 2009. The adoption of this statement will change the disclosures related to derivative instruments held by the Company, if any.
In May 2008, the FASB issued SFAS No. 162,The Hierarchy of Generally Accepted Accounting Principles(SFAS 162), which identifies the sources of accounting principles and the framework for selecting the principles to be used in preparation of financial statements of nongovernmental entities that are presented in conformity with generally accepted accounting principles generally accepted in the United States of America. SFAS 162 was adopted by the Company effective November 15, 2008. SFAS 162 did not have a material impact on the Company’s consolidated financial position or results of operations.
On December 29, 2008, the Securities and Exchange Commission announced final approval of new requirements, effective for annual reports on Form 10-K for fiscal years ending on or after December 31, 2009, to provide investors with a more meaningful and comprehensive understanding of oil and natural gas reserves. The new disclosure requirements include:
Consideration of new technologies in evaluating oil and natural gas reserves,
Disclosure of probable and possible oil and natural gas reserves,
Use of an average price based on the prior twelve month period rather than year-end prices, and
Revisions of the oil and natural gas disclosure requirements for operations.
The Company has not yet evaluated the effects of the above on its financial statements and disclosures.
2. Cash Flow Information
Net cash provided by operating activities reflects cash payments as follows (in thousands):
| Year Ended December 31, | |||||||||
| 2008 | 2007 | 2006 | |||||||
Interest paid | $ | 10,224 | $ | 11,499 | $ | 10,875 | |||
Income taxes paid | 31,560 | 6,988 | 1,007 | ||||||
Noncash investing and financing activities are as follows (in thousands):
| Year Ended December 31, | |||||||||
| 2008 | 2007 | 2006 | |||||||
Asset retirement obligations | $ | 3,783 | $ | 636 | $ | 6,871 | |||
Continental Resources, Inc. and Subsidiary
Notes to Consolidated Financial Statements—(continued)
3. Property, Plant, and Equipment
Property, plant and equipment includes the following at December 31, 2008 and 2007 (in thousands):
| December 31, | ||||||||
| 2008 | 2007 | |||||||
Proved oil and natural gas properties | $ | 2,250,757 | $ | 1,518,981 | ||||
Unproved oil and natural gas properties | 248,689 | 65,830 | ||||||
Service properties, equipment and other | 42,720 | 29,000 | ||||||
Total property and equipment | 2,542,166 | 1,613,811 | ||||||
Accumulated depreciation, depletion and amortization | (607,023 | ) | (455,885 | ) | ||||
Net property and equipment | $ | 1,935,143 | $ | 1,157,926 | ||||
4. Accrued Liabilities and Other
Accrued liabilities and other includes the following at December 31, 2008 and 2007 (in thousands):
| December 31, | ||||||
| 2008 | 2007 | |||||
Prepaid drilling costs | $ | 14,742 | $ | 4,002 | ||
Accrued compensation | 6,057 | 5,604 | ||||
Accrued production and advalorem taxes | 10,532 | 10,805 | ||||
Other | 3,438 | 4,884 | ||||
| $ | 34,769 | $ | 25,295 | |||
5. Derivative Contracts
In July 2007, the Company entered into fixed-price swap contracts covering 10,000 barrels of oil per day for the period from August 2007 through April 2008 to partially reduce price risk. During each month of the contract, the Company received a fixed-price of $72.90 per barrel and paid to the counterparties the average of the prompt NYMEX crude oil futures contract settlement prices for such month. SFAS No. 133,“Accounting for Derivative Instruments and Hedging Activities”requires managementrecognition of all derivative instruments on the balance sheet as either assets or liabilities measured at fair value. The Company elected not to make
estimatesdesignate its derivatives as cash flow hedges under the provisions of SFAS No. 133. As a result, the Company marked its derivative instruments to fair value in accordance with the provisions of SFAS No. 133 and assumptionsrecognized the realized and unrealized change in fair value on derivative instruments in the statements of income. As of December 31, 2007 the Company had recorded a liability for unrealized losses on derivatives of $26.7 million. For the year ended December 31, 2008, the statement of income contains recognized losses of $8.0 million for the contracts that expired in April 2008. For the year ended December 31, 2007, the statement of income contains realized losses of $18.2 million and unrealized losses of $26.7 million on derivatives. The Company did not have any derivative contracts in 2006 or at December 31, 2008.
Continental Resources, Inc. and Subsidiary
Notes to Consolidated Financial Statements—(continued)
6. Fair Value Measures
The Company adopted SFAS No. 157, “Fair Value Measurements,” effective January 1, 2008 for financial assets and liabilities measured on a recurring basis. SFAS No. 157 applies to all financial assets and financial liabilities that are being measured and reported on a fair value basis. In February 2008, the FASB issued FASB Staff Position FAS 157-2, which delayed the effective date of SFAS No. 157 by one year for non-financial assets and liabilities. As defined in SFAS No. 157, fair value is the price that would be received to sell an asset or paid to transfer a liability in an orderly transaction between market participants at the measurement date. SFAS No. 157 requires disclosure that establishes a framework for measuring fair value and expands disclosure about fair value measurements. The statement requires fair value measurements be classified and disclosed in one of the following categories:
Level 1: Unadjusted quoted prices in active markets that are accessible at the measurement date for identical, unrestricted assets or liabilities. We consider active markets as those in which transactions for the assets or liabilities occur in sufficient frequency and volume to provide pricing information on an ongoing basis.
Level 2: Quoted prices in markets that are not active, or inputs which are observable, either directly or indirectly, for substantially the full term of the asset or liability. This category includes those derivative instruments that we value using observable market data. Substantially all of these inputs are observable in the marketplace throughout the full term of the derivative instrument, can be derived from observable data, or supported by observable levels at which transactions are executed in the marketplace. Instruments in this category include non-exchange traded derivatives such as over-the-counter commodity price swaps.
Level 3: Measures based on prices or valuation models that require inputs that are both significant to the fair value measurement and less observable from objective sources (i.e., supported by little or no market activity).
As required by SFAS No. 157, financial assets and liabilities are classified based on the lowest level of input that is significant to the fair value measurement. Our assessment of the significance of a particular input to the fair value measurement requires judgment, and may affect the reported amountsvaluation of the fair value of assets and liabilities and disclosuretheir placement within the fair value hierarchy levels.
During the year ended December 31, 2008, the Company valued its derivative instruments according to SFAS No. 157 pricing levels. These contracts expired during the second quarter of contingent2008 and the Company currently does not have any financial assets or financial liabilities that are measured on a fair value basis.
7. Long-term Debt
The Company had $376.4 million and liabilities$165.0 million in long-term debt outstanding at December 31, 2008 and 2007, respectively, on its revolving credit facility due April 11, 2011. At the Company’s election, the maturity date can be extended for up to two one-year periods. The Company amended its revolving credit facility in the fourth quarter of 2008 to increase the associated commitment level to $552.5 million and to revise the London Interbank Offered Rate margins to a range of 175 to 250 basis points. Additionally, the Company elected to set the revolving credit facility borrowing base at $850.0 million. Borrowings under the facility bear interest, payable quarterly, at a rate per annum equal to the London Interbank Offered Rate for one, two, three or six months, as elected by the Company, plus a margin ranging from 175 to 250 basis points, depending on the percentage of its borrowing base utilized, or the lead bank’s reference rate. The revolving credit facility has a maximum facility amount of $750.0 million, a borrowing base of $850.0 million, subject to semi-annual re-determination, and a commitment level of $552.5 million at December 31, 2008. Under the terms of the financial statements andrevolving credit facility, the reported amounts of revenues and expenses
duringcommitment level can be increased up to the reporting period. Actual results could differ from those estimates.
Of the estimates and assumptions that affect reported results, the estimatelesser of the Company's oilborrowing base or the note
Continental Resources, Inc. and natural gas reserves, which is usedSubsidiary
Notes to compute
depreciation, depletion, amortization and impairmentConsolidated Financial Statements—(continued)
amount subject to bank agreement. Borrowings under the revolving credit facility are secured by liens on producingsubstantially all oil and gas properties isand associated assets of the most significant.
Stock Based Compensation
Company. In February 2009, the Company amended the revolving credit facility to add additional banks and increase the commitments to $672.5 million.
The Company applies APB Opinion No. 25 in accounting for its fixed price
stock options. Under APB 25, no compensation expense is recognized relatinghad $176.1 million of unused commitments under the Credit Agreement at December 31, 2008 and incurs commitment fees of 0.25% to stock options issued under a fixed price plan with a strike price at or above
the fair market value0.375% of the underlying shares of common stock at the date of
grant. For stock options issued with a strike price below the fair market valuedaily average excess of the underlying shares of common stock, compensation expense is recognizedcommitment amount over the vesting period equal to the fair market value of the common stock at
the date of grant less the strike price. During 2001 and 2002, compensation
expenses related to in the money options were immaterial.
Hadoutstanding credit balance. The revolving credit facility contains certain covenants including that the Company determined compensation expense based on the fair value at
the grant date for its stock options under SFAS No. 123, the Company's net
income (loss) would have been adjusted as indicated below.
The annual maturities of long-term debt subsequent toCompany’s weighted average interest rate was 4.11% and 6.26% at December 31, 2002,
are as follows (in thousands):
2003 $ 2,400
2004 2,400
2005 110,400
2006 2,4002008 and 2007, and thereafter 129,505
------------------------------ -----------
Total maturities $247,105
===========respectively. At December 31, 2002,2008, the Company had $1.6$0.8 million of outstanding letters of credit that expire during 2003.
2009.
8. Income Taxes
The estimated fair valuefollowing is an analysis of long-term debt is approximately $236,933,000the Company’s income tax provision in conjunction with and $164,323,000subsequent to the conversion to a subchapter C corporation on May 14, 2007. Prior to this date, the Company was a subchapter S corporation and income taxes were payable by its shareholders.
| Year ended December 31, | ||||||
| 2008 | 2007 | |||||
| ( in thousands) | ||||||
Current: | ||||||
Federal | $ | 13,465 | $ | 5,785 | ||
State | — | — | ||||
Total current tax provision | 13,465 | 5,785 | ||||
Deferred: | ||||||
Federal | 164,929 | 233,801 | ||||
State | 19,186 | 28,611 | ||||
Total deferred tax provision | 184,115 | 262,412 | ||||
Income tax provision | $ | 197,580 | $ | 268,197 | ||
The following table reconciles the income tax provision with income tax at the Federal statutory rate for the years ended December 31, 20022008 and 2001, respectively. The fair value2007.
| Year ended December 31, | ||||||||
| 2008 | 2007 | |||||||
| ( in thousands) | ||||||||
Federal tax at statutory rate | $ | 181,486 | $ | 103,872 | ||||
State income taxes, net of federal benefit | 17,146 | 7,716 | ||||||
Eliminate taxes on earnings prior to subchapter C corporation conversion(1) | — | (32,380 | ) | |||||
Non-deductible stock-based compensation | 15 | 1,090 | ||||||
Other, net | (1,067 | ) | 1,770 | |||||
Earnings transferred to subchapter S corporation through election of pro-rata allocation method(2) | — | (12,275 | ) | |||||
Deferred taxes recorded upon conversion to a subchapter C corporation | — | 198,404 | ||||||
Income tax provision | $ | 197,580 | $ | 268,197 | ||||
Continental Resources, Inc. and Subsidiary
Notes to Consolidated Financial Statements—(continued)
| (1) | Federal tax at the statutory rate and state income taxes have been calculated based upon the net income before tax for the year. However, the Company converted from a subchapter S corporation to a subchapter C corporation on May 14, 2007 and deferred taxes were provided for temporary differences that existed on that date. This adjustment eliminates the taxes related to the net income before tax from the beginning of the year presented through May 14, 2007, which tax effects are already included in deferred taxes recorded upon conversion to a subchapter C corporation. |
| (2) | The Company calculated its estimate of income allocation to the subchapter S corporation period assuming the use of the pro-rata income allocation method for tax purposes instead of the specific identification method used for financial reporting purposes. Using the pro-rata income allocation method, the Company’s income for the year is allocated to the subchapter S corporation and the subchapter C corporation based on number of days without regard to when the income was actually earned. |
Significant components of long-term debtthe Company’s deferred tax assets and liabilities as of December 31, 2008 are as follows:
| December 31, | ||||||
| 2008 | 2007 | |||||
| ( in thousands) | ||||||
Current: | ||||||
Deferred tax assets(1) | ||||||
Unrealized losses on derivatives | $ | — | $ | 10,040 | ||
Other expenses | 715 | 602 | ||||
Total current deferred tax assets | 715 | 10,642 | ||||
Noncurrent: | ||||||
Deferred tax assets | ||||||
Net operating loss carryforward | 8,087 | 4,553 | ||||
Alternative minimum tax carryforward | 19,858 | 6,537 | ||||
Deferred compensation | — | 1,952 | ||||
Other | 958 | 438 | ||||
Total noncurrent deferred tax assets | 28,903 | 13,480 | ||||
Deferred tax liabilities | ||||||
Property and equipment | 473,387 | 284,904 | ||||
Deferred compensation | 1,268 | — | ||||
Total noncurrent deferred tax liabilites | 474,655 | 284,904 | ||||
Net noncurrent deferred tax liabilities | 445,752 | 271,424 | ||||
Net deferred tax liabilities | $ | 445,037 | $ | 260,782 | ||
| (1) | Deferred and prepaid taxes on the accompanying consolidated balance sheet at December 31, 2008 contains a receivable of $18.1 million for overpaid taxes and at December 31, 2007 contained prepaid taxes of $1.2 million. |
As of December 31, 2008, the Company had a net operating loss carryforward of $34.6 million which will expire beginning in 2027. Included in the net operating loss carryforward is estimated based on quoted market prices and managements
estimateexcess tax benefit related to stock compensation of current rates available$13.3 million ($5.0 million tax effected) for similar issues.
5. INCOME TAXES:
The Company follows Statement of Financial Accounting Standards ("SFAS")
No. 109, "Accounting for Income Taxes." As mentioned in Note 1,which the deferred tax asset cannot be recorded until the Company is an S-Corporation resulting inpaying regular federal income taxes. When recorded, the taxable income or loss of the Company being
reported to the stockholders and included in their respective Federal and state
income tax returns. The difference in the taxable income of the stockholders
versus the net income of the Company is due primarily to intangible drilling
costs which are capitalized for book purposes but charged to expense for tax
purposes and accelerated depreciation and depletion methods utilized for tax
purposes.
6. STOCKHOLDER'S EQUITY:
On October 1, 2000, the Company's Board of Directors and shareholders
approved an Agreement and Plan of Recapitalization (the "Recapitalization Plan")
and the Amended and Restated Certificate of Incorporation tooffsetting account will be filed with the
Oklahoma Secretary of State. As outlined in the Recapitalization Plan, the
authorized number of shares of capital stock was increased from 75,000 shares of
common stock to 21 million shares consisting of 20 million shares of common
stock and one million shares of $0.01 par value Preferred Stock.additional paid-in capital. In addition, the par value of common stock was adjusted from $1 per share to $0.01 per share
and 1.02 million shares of the common stock were reserved for issuance under the
2000 incentive Stock Option Plan discussed in Note 7.
Concurrent with the approval of the Recapitalization Plan, the Company
affected an approximate 293: 1 stock split whereby the Company issued new
certificates for 14,368,919 shares of the newly authorized common stock in
exchange for the 49,041 previously outstanding shares of common stock. As a
result of the stock split, additional paid-in capital was reduced by
approximately $95,000, offset by an increase in the common stock at par.
7. STOCK OPTIONS:
The Company has an alternative minimum tax credit carryforward of $19.9 million and a stock option plan, the statutory depletion carryforward, which will be recognized when realized, of $4.4 million, neither
Continental Resources, Inc. 2000
Stock Option Plan (the "Plan"),and Subsidiary
Notes to Consolidated Financial Statements—(continued)
of which became effective October 1, 2000.
Underexpires. The Company’s major tax jurisdictions are the Plan,U. S. Federal, Oklahoma, North Dakota and Montana. The earliest year subject to examination in each is 2003. However, prior to May 15, 2007, the Company may, from timewas an S corporation and any taxes for periods prior to time, grant options to
directors and eligible employees. These options maythat would be Incentive Stock Options
or Nonqualified Stock Options, or a combination of both. The earliestpayable by the granted options may be exercised is over a five year vesting period atthen existing shareholders.
9. Lease Commitments
Lease expense associated with the rate
of 20% each yearCompany’s operating leases for the Incentive Stock Optionsyears ended December 31, 2008, 2007 and over2006, was $6.0 million, $6.0 million and $5.9 million, respectively. At December 31, 2008, including leases renewed and entered into subsequent to December 31, 2008, the minimum future rental commitments under operating leases having non-cancelable lease terms in excess of one year, including leases from related parties, are as follows (in thousands):
Year | Leases with related parties | Leases with unrelated parties | Total amount | ||||||
2009 | $ | 1,324 | $ | 165 | $ | 1,489 | |||
2010 | 156 | 84 | 240 | ||||||
2011 | — | 25 | 25 | ||||||
2012 | — | 4 | 4 | ||||||
2013 | — | — | — | ||||||
Total obligations | $ | 1,480 | $ | 278 | $ | 1,758 | |||
The Company leases compressors from a three year period at
the rate of 33 1/3%related party for the Nonqualified Stock Options, both commencing on the
first anniversaryapproximately $400,000 per month under an operating lease. The term of the grant date. The maximum shares covered by options shall
consist of 1,020,000 shares of the Company's common stock, par value $.01 per
share.operating lease was through January 28, 2009 and is continuing on a month to month basis while a new agreement is being negotiated. The Company granted 144,000 shares during 2000. No options were granted
in 2001leases office space under operating leases from the principal shareholder (see Note 11).
10. Commitments and 28,000 shares were granted during 2002.
Stock options outstanding under the Plan are presented for the periods
indicated.
NumberContingencies
Drilling Commitments.As of Shares Option Price Range
- ---------------------------------------------------- ---------------------
Outstanding December 31, 2000 - $ -
Granted 144,000 $7.00 - $14.00
Exercised - $ -
Canceled - $ -
Outstanding2008, the Company had contracts with various drilling contractors to use six drilling rigs with terms that expire through April 2011. These commitments are not recorded in the accompanying consolidated balance sheets. Future commitments as of December 31, 2001 144,000 $7.00 - $14.00
Granted 28,000 $7.77 - $14.00
Exercised - $ -
Canceled - $ -
Outstanding December 31, 2002 172,000 $7.00 - $14.00
8. COMMITMENTS AND CONTINGENCIES:
2008 are $11.5 million for contracts that expire in 2009 and $23.5 million for contracts that expire in 2011.
Employee retirement plan.The Company maintains a defined contribution pensionretirement plan for its employees under which itand makes discretionary contributions to the plan based on a percentage of each eligible employeesemployee’s compensation. During 2000, 20012008, 2007 and 2002,2006, contributions to the plan were 5% of eligible employees' compensation. Pension
expenseemployees’ compensation, excluding bonuses. Expense for the years ended December 31, 2000, 20012008, 2007 and 2002,2006, was approximately
$390,000, $392,000$1.1 million, $0.9 million and $353,590,$0.8 million, respectively.
Employee health claims.The Company and other affiliated companies participate jointly in a
self-insurance pool (the "Pool") coveringself insures employee health and workers' compensation
claims made by employees up to the first $150,000 and $500,000, respectively,$125,000 per claim.employee. The Company self insures employee workers’ compensation claims up to the first $250,000 per employee. Any amounts paid above these are reinsured through third-party providers. Premiums charged to theThe Company areaccrues for claims that have been incurred but not yet reported based on estimated costs per
employeea review of the Pool. No additional premium assessments are anticipated for
periods prior toclaims filed versus expected claims based on claims history. At December 31, 2002. Property2008 and general2007, the accrued liability insurance is
maintained through third-party providers with a $50,000 deductible on each
policy.
for health and worker’s compensation claims was $873,000 and $758,000, respectively.
Litigation.The Company is involved in various legal proceedings in the normal course of business, none of which, in the opinion of management, will have a material adverse effect on the financial position or results of
Continental Resources, Inc. and Subsidiary
Notes to Consolidated Financial Statements—(continued)
operations of the Company. As of December 31, 2008 and 2007, the Company has provided a reserve of $1.2 million and $1.0 million, respectively, for various matters none of which are believed to be individually significant.
Environmental Risk.Due to the nature of the oil and gas business, the Company is exposed to possible environmental risks. The Company has implemented various policies and
procedures to avoid environmental contamination and risks from environmental
contamination. The Company is not aware of any material potential environmental issues or claims.
9. RELATED PARTY TRANSACTIONS:
11. Related Party Transactions
The Company acting as operator on certain properties, utilizes affiliated
companiescurrently markets a portion of its natural gas sales to provide oilfieldan affiliate. Prior to February 2006, the Company marketed a portion of its oil sales to an affiliate. During the years ended December 31, 2008, 2007, and 2006, these sales were approximately $64.7 million, $33.9 million, and $94.3 million. The Company also contracts for field services such as compression and drilling rig services and trucking.purchases residue fuel gas and reclaimed oil from certain affiliates. Production expense attributable to these affiliates was $20.7 million, $18.9 million and $17.2 million for the years ended December 31, 2008, 2007 and 2006, respectively. The total amount paid to these companies, a portion of which was billed to other interest owners, was approximately $8,713,000, $10,942,000$104.1 million, $76.3 million and $11,679,000$52.9 million during the years ended December 31, 2000, 20012008, 2007 and 2002,2006, respectively. These services were
provided at amountsThe Company operated crude oil gathering lines in North Dakota and Wyoming on behalf of an affiliated company for which management believes approximatethey paid the costs that would
have been paid to an unrelated party for the same services.Company approximately $332,000 and $346,000 during 2008 and 2007, respectively. At December 31, 20012008 and 2002,2007, approximately $14.9 million and $17.1 million was due from affiliates and approximately $25.7 million and $15.1 million was due to affiliates, respectively.
Certain officers of the Company owed approximately $266,000own or control entities that own working and $919,000, respectively, to
these companies, which are included in accounts, payable and accrued liabilities
in the accompanying consolidated balance sheets. These companies and other
companies, owned by the Company's principal stockholder, also own interestsroyalty interest in wells operated by the Company. The Company paid revenues, including royalties, of approximately $16.7 million, $10.4 million, and provide oilfield related services to$7.9 million and billed expenses of $14.2 million, $9.1 million, and $5.2 million during the Company. Atyears ended December 31, 20012008, 2007, and 2002, approximately $344,0002006, respectively, to these affiliates. The Company also paid them $157,000 in 2008 and $481,000,
respectively, from affiliated companies is included$199,000 in accounts receivable in
the accompanying consolidated balance sheets.
2007 for their share of undeveloped leasehold sales.
The Company leases office space under an operating leases directly or
indirectlylease from a company owned by the Company’s principal stockholder.shareholder. Rents paid associated with these
leasesthis lease totaled approximately $313,000, $334,000$804,000, $707,000 and $421,000$638,000 for the years ended December 31, 2000, 20012008, 2007 and 2002,2006, respectively. See Note 4The term of the lease is through February 2010 at an annual rate of approximately $937,000.
Under a contract for discussion of
related party capital lease transaction.
During 2001,gas sales to an affiliate the Company acting as operatorpays for gathering and treating fees which amounted to $1.0 million in 2008 and $1.1 million in 2007.
12. Shareholders’ Equity
On May 14, 2007, the Company completed its initial public offering of 29,500,000 shares of its common stock at $15.00 per share. The shares are listed on certain properties began
selling natural gas to a related party. During 2002,the New York Stock Exchange under the symbol CLR. The Company sold 8,850,000 shares of common stock in the offering and Harold G. Hamm, the Chairman and Chief Executive Officer and principal shareholder of the Company, sold $1.2420,650,000 shares of common stock in the offering. The offering generated gross proceeds of $132.8 million to the Company. The Company incurred underwriters’ discounts of natural gasapproximately $8.0 million and other expenses of approximately $2.3 million. The Company netted an additional $290,000, representing 30% of the legal, accounting and other costs incurred by the Company after the Company decided to thisparticipate in the offering, against the proceeds of the offering. The balance of the offering costs were expensed as incurred. After the payment of offering expenses, the net proceeds were used to repay a portion of the outstanding indebtedness under the revolving credit facility.
Continental Resources, Inc. and Subsidiary
Notes to Consolidated Financial Statements—(continued)
On May 14, 2007, the Company effected an 11 for 1 stock split by means of a stock dividend. All prior period share and per share information contained in these consolidated financial statements has been retroactively restated to give effect to the stock split. On May 14, 2007, the Company amended its certificate of incorporation to, among other things, increase the number of authorized preferred shares to 25 million and common shares to 500 million.
On May 14, 2007 the Company converted from a subchapter S corporation to a subchapter C corporation. As a result, the Company recorded an adjustment in the amount of $234.1 million to reduce retained earnings to $65.1 million as of the conversion date, which represents the retained earnings balance of the Company when it originally converted from a subchapter C corporation to a subchapter S corporation in May 1997. The amount of the adjustment represents undistributed earnings of $432.5 million, net of the related party.
10. IMPAIRMENT OF LONG-LIVED ASSETS:
provision for deferred income taxes of $198.4 million which was included in the determination of net income for the year ended December 31, 2007.
The Company accounts for impairment of long-lived assetsstock option grants and restricted stock grants in accordance with SFAS No. 144, "Accounting123(R). The terms of the restricted stock grants and stock option grants stipulated that prior to the Company’s initial public offering, it was required to purchase the vested restricted stock and stock acquired from stock option exercises at each employee’s request. Therefore, the awards were accounted for as liability awards in accordance with SFAS 123(R). The right to sell and requirement to purchase lapsed when the Company completed its initial public offering. Therefore, the liability for equity compensation of approximately $29.8 million was reclassified to additional paid-in capital on May 14, 2007.
During 2008, the Company paid cash dividends of $207,000 upon vesting of restricted stock granted prior to dividend declaration in 2007.
On January 10, 2007 and March 6, 2007, the Company declared cash dividends of approximately $18.8 million and $33.3 million to its shareholders for tax purposes and, subject to forfeiture, to holders of unvested restricted stock. During 2007, the Company paid cash dividends of $52.0 million.
During 2006, the Company declared cash dividends totaling $87.6 million to existing shareholders and, subject to forfeiture, to holders of unvested restricted stock. During 2006, the Company paid cash dividends of $87.4 million.
13. Stock Compensation
The Company has granted stock options and restricted stock to employees and directors pursuant to the Continental Resources, Inc. 2000 Stock Option Plan (“2000 Plan”) and the Continental Resources, Inc. 2005 Long-Term Incentive Plan (“2005 Plan”) as discussed below. Pursuant to the award agreements, the Company had the right to purchase vested restricted shares and shares acquired by option exercise at all times the employee remained in the employment of the Company and for a period of two years subsequent to leaving the employment of the Company and grantees had the right to require the Company to purchase vested restricted shares and shares acquired by option exercise, each at a purchase price as determined by a formula specified in each award agreement, prior to completion of its initial public offering in May 2007. All grants of stock options were issued with an exercise price equal to the then estimated fair value of the Company’s stock determined according to the plans. Before becoming a public reporting entity, the awards were accounted for as liability awards. The associated liability was transferred to additional paid in capital in May 2007 when the purchase rights lapsed. The Company’s associated compensation expense included in general and administrative expense was $9.1 million, $12.8 million and $10.9 million during 2008, 2007 and 2006, respectively.
Continental Resources, Inc. and Subsidiary
Notes to Consolidated Financial Statements—(continued)
Stock Options
Effective October 1, 2000, the Company adopted the 2000 Plan and granted options to eligible employees. These grants consisted of either incentive stock options, nonqualified stock options or a combination of both. The granted stock options vest ratably over either a three or five-year period commencing on the first anniversary of the grant date and expire ten years from date of grant. On November 10, 2005, the 2000 Plan was terminated. As of December 31, 2008, options covering 1,863,463 shares had been exercised and 448,572 had been cancelled.
The Company’s stock option activity under the 2000 Plan from December 31, 2005 to December 31, 2008 was as follows:
| Outstanding | Exercisable | ||||||||||
| Number of options | Weighted average exercise price | Number of options | Weighted average exercise price | ||||||||
Outstanding December 31, 2005 | 1,672,000 | $ | 2.13 | 1,206,337 | $ | 1.14 | |||||
Exercised | (22,660 | ) | 1.26 | ||||||||
Canceled | (73,337 | ) | 3.97 | ||||||||
Outstanding December 31, 2006 | 1,576,003 | 2.06 | 1,370,666 | 1.59 | |||||||
Exercised | (689,476 | ) | 1.66 | ||||||||
Outstanding December 31, 2007 | 886,527 | 2.28 | 794,853 | 1.88 | |||||||
Exercised | (436,327 | ) | 3.31 | ||||||||
Outstanding December 31, 2008 | 450,200 | 1.28 | 450,200 | 1.28 | |||||||
The total intrinsic value of options exercised during the years ended December 31, 2008, 2007 and 2006 was $15.1 million, $11.1 million and $0.1 million, respectively. The intrinsic value of a stock option is the amount by which the value of the underlying stock exceeds the exercise price of the option at its exercise date. At December 31, 2008, all options were exercisable and had a weighted average life of 3.78 years with an aggregate intrinsic value of $8.7 million.
Effective January 1, 2006, the Company adopted SFAS 123(R), using the modified-prospective transition method. The adoption did not have a material effect on the Company’s consolidated financial position or results of operations. In connection with the filing of a registration statement with the Securities and Exchange Commission on March 7, 2006, for the Impairment or Disposalpublic offering of Long-Lived Assets."
During 2000, 2001 and 2002,common stock, the Company reviewedbecame a public entity for purposes of SFAS 123(R). For public entities, stock option liability awards are required to be valued using the Black-Scholes or similar option valuation model. In connection therewith, the Company changed from the intrinsic value method to the fair value method of accounting for its stock options and restricted stock. In determining the fair value of the vested stock options and compensation expense as of and for the years ended December 31, 2007 and 2006, the Company utilized the Black-Sholes option pricing value model based on a fair value for stock option grants of $11.96 per share, weighted average expected life of 2.38 years, expected volatility of 38%, weighted average risk-free interest rate of 4.75% and a dividend yield of zero. The expected life is based on management’s expectations of option exercises. The volatility is based on the average volatility of our peer group for a period approximating the expected life of the options. The risk-free interest rate is based on treasury rates in effect at December 31, 2006 commensurate with the expected life of the stock options.
Continental Resources, Inc. and Subsidiary
Notes to Consolidated Financial Statements—(continued)
The following table summarizes information about stock options outstanding at December 31, 2008:
Options Outstanding | Options Exercisable | |||||||||||
Exercise Prices | Number Outstanding | Weighted Average Remaining Contractual Life | Weighted Average Exercise Price | Number Exercisable | Weighted- Average Exercise Price | |||||||
$0.71 | 131,440 | 3.25 years | $ | 0.71 | 131,440 | $ | 0.71 | |||||
1.27 | 301,250 | 1.75 years | 1.27 | 301,250 | 1.27 | |||||||
5.71 | 17,510 | 6.33 years | 5.71 | 17,510 | 5.71 | |||||||
| 450,200 | 1.28 | 450,200 | 1.28 | |||||||||
Restricted Stock
On October 3, 2005, the Company adopted the 2005 Plan and reserved a maximum of 5,500,000 shares of common stock that may be issued pursuant to the 2005 Plan. As of December 31, 2008, the Company had 3,593,442 shares of restricted stock available to grant to directors, officers and key employees under the 2005 Plan. All grants were made on or after October 3, 2005. Restricted stock is awarded in the name of the recipient and except for the right of disposal, constitutes issued and outstanding shares of the Company’s common stock for all corporate purposes during the period of restriction including the right to receive dividends, subject to forfeiture. Restricted stock grants vest over periods ranging from one to three years.
The Company issued 990,517 shares of restricted stock during 2005. A summary of changes in the non-vested restricted shares for the period of December 31, 2005 to December 31, 2008, is presented below:
| Number of non-vested shares | Weighted average grant-date fair value | |||||
Non-vested restricted shares at December 31, 2005 | 990,517 | $ | 13.40 | |||
Granted | 200,772 | 13.27 | ||||
Vested | (304,733 | ) | 13.40 | |||
Forfeited | (105,149 | ) | 13.45 | |||
Non-vested restricted shares at December 31, 2006 | 781,407 | $ | 13.36 | |||
Granted | 629,684 | 22.12 | ||||
Vested | (321,750 | ) | 13.27 | |||
Forfeited | (41,635 | ) | 14.15 | |||
Non-vested restricted shares at December 31, 2007 | 1,047,706 | $ | 18.36 | |||
Granted | 461,120 | 28.93 | ||||
Vested | (369,091 | ) | 13.93 | |||
Forfeited | (28,843 | ) | 25.05 | |||
Non-vested restricted shares at December 31, 2008 | 1,110,892 | $ | 24.05 | |||
The fair value of the restricted shares that vested during 2008 at their vesting date was $11.1 million. As of December 31, 2008, there was $17.1 million of unrecognized compensation expense related to non-vested restricted shares. The expense is expected to be recognized over a weighted average period of 1.7 years.
Continental Resources, Inc. and Subsidiary
Notes to Consolidated Financial Statements—(continued)
14. Oil and Gas Property Information
The following table sets forth the Company’s results of operations from oil and natural gas producing activities for the years ended December 31, 2008, 2007 and 2006 (in thousands):
| Year Ended December 31, | ||||||||||||
| 2008 | 2007 | 2006 | ||||||||||
Oil and natural gas sales | $ | 939,906 | $ | 606,514 | $ | 468,602 | ||||||
Production expense and tax | (160,245 | ) | (109,051 | ) | (85,196 | ) | ||||||
Exploration expense | (40,160 | ) | (9,163 | ) | (19,738 | ) | ||||||
Depreciation, depletion, amortization and accretion | (146,208 | ) | (91,678 | ) | (63,810 | ) | ||||||
Property impairments | (28,847 | ) | (17,879 | ) | (11,751 | ) | ||||||
Income taxes | (214,489 | ) | (102,676 | ) | — | |||||||
Results from oil and natural gas producing activities | $ | 349,957 | $ | 276,067 | $ | 288,107 | ||||||
(The below information is unaudited) | ||||||||||||
Pro forma presentation for income tax: | ||||||||||||
Results from oil and natural gas producing activities before pro forma income tax | $ | 378,743 | $ | 288,107 | ||||||||
Pro forma income tax | (143,922 | ) | (109,481 | ) | ||||||||
Results from pro forma oil and natural gas producing activities | $ | 234,821 | $ | 178,626 | ||||||||
Prior to the completion of the Company’s initial public offering, the Company was a subchapter S corporation and its taxes were payable by its shareholders. The table above shows taxes from May 14, 2007 to the end of the year at statutory rates and pro forma for the remaining periods.
Costs incurred in oil and gas properties,
whichactivities
Costs incurred, both capitalized and expensed, in connection with the Company’s oil and gas acquisition, exploration and development activities for the three years ended December 31, 2008, 2007 and 2006 are maintained undershown below (in thousands).
| Year Ended December 31, | |||||||||
| 2008 | 2007 | 2006 | |||||||
Property Acquisition Costs: | |||||||||
Proved | $ | 74,663 | $ | 4,166 | $ | 6,564 | |||
Unproved | 199,621 | 21,729 | 29,970 | ||||||
Total property acquisition costs | 274,284 | 25,895 | 36,534 | ||||||
Exploration Costs | 235,263 | 181,883 | 68,686 | ||||||
Development Costs | 471,820 | 316,741 | 221,286 | ||||||
Total | $ | 981,367 | $ | 524,519 | $ | 326,506 | |||
Exploration costs above include asset retirement costs of $687,000, $236,000 and $214,000 and development costs above include asset retirement costs of $3,252,000, $401,000 and $6,658,000 for the years 2008, 2007 and 2006, respectively.
Continental Resources, Inc. and Subsidiary
Notes to Consolidated Financial Statements—(continued)
Aggregate capitalized costs
Aggregate capitalized costs relating to the Company’s oil and gas producing activities, and related accumulated depreciation, depletion and amortization as of December 31, 2008 and 2007 are as follows (in thousands):
| December 31, | ||||||||
| 2008 | 2007 | |||||||
Proved oil and gas properties | $ | 2,250,757 | $ | 1,518,981 | ||||
Unproved oil and gas properties | 248,689 | 65,830 | ||||||
Total | 2,499,446 | 1,584,811 | ||||||
Less-accumulated depreciation, depletion and amortization | (589,513 | ) | (440,700 | ) | ||||
Net capitalized costs | $ | 1,909,933 | $ | 1,144,111 | ||||
Under the successful efforts method of accounting, the costs of drilling an exploratory well are capitalized pending determination of whether proved reserves can be attributed to identify properties with excess of net book value over projected future net
revenue of such properties. Any such excess net book values identified were
evaluated further considering such factors as future price escalation,
probability of additionalthe discovery. When initial drilling operations are complete, management determines whether the well has discovered oil and gas reserves and, a discountif so, whether those reserves can be classified as proved. Often, the determination of whether proved reserves can be recorded under Securities and Exchange Commission (“SEC”) guidelines cannot be made when drilling is completed. In those situations where management believes that commercial hydrocarbons have not been discovered, the exploratory drilling costs are reflected in the Consolidated Statement of Income as dry hole costs (a component of exploration expense). Where sufficient hydrocarbons have been discovered to present value.justify further exploration or appraisal activities, exploratory drilling costs are deferred on the Consolidated Balance Sheet pending the outcome of those activities.
Operating and financial management review quarterly the status of all deferred exploratory drilling costs in light of ongoing exploration activities—in particular, whether the Company is making sufficient progress in its ongoing exploration and appraisal efforts. If an impairment was deemed appropriate, an additional charge was addedmanagement determines that future appraisal drilling or development activities are not likely to property impairment expense. occur, any associated exploratory well costs are expensed in that period.
The Company recognized $1,665,000 additional
property impairmentfollowing table presents the amount of capitalized exploratory drilling costs pending evaluation at December 31 for each of the last three years and changes in 2000, $5,303,000 was recognized additional property
impairment in 2001, and $2,300,000 was recognized additional property impairment
in 2002.
11. GUARANTOR SUBSIDIARIES:
The Company's wholly owned subsidiaries, Continental Gas, Inc. ("CGI"),
those amounts during the years then ended (in thousands):
| 2008 | 2007 | 2006 | ||||||||||
Balance, January 1, | $ | 32,936 | $ | 10,049 | $ | 1,874 | ||||||
Additions to capitalized exploratory well costs pending determination of proved reserves | 151,301 | 139,765 | 65,721 | |||||||||
Reclassification to proved oil and natural gas properties based on the determination of proved reserves | (117,958 | ) | (113,329 | ) | (44,203 | ) | ||||||
Capitalized exploratory well costs charged to expense | (20,005 | ) | (3,549 | ) | (13,343 | ) | ||||||
Balance, December 31, | $ | 46,274 | $ | 32,936 | $ | 10,049 | ||||||
Number of projects at year-end | 56 | 45 | 26 | |||||||||
Continental Resources, of Illinois, Inc. ("CRII"), and Continental Crude Co.
("CCC") have guaranteed the Company's outstanding Senior Subordinated Subsidiary
Notes to Consolidated Financial Statements—(continued)
15. Supplemental Oil and its bank credit facility. Gas Information (Unaudited)
The following is a summarytable shows estimates of proved reserves prepared by the Company’s technical staff and independent external reserve engineers in accordance with SEC definitions. Ryder Scott Company, L. P. prepared reserve estimates for properties comprising approximately 83% of the condensed
consolidating financial informationCompany’s standardized measure of CGI and CRIIdiscounted future net cash flows as of December 31, 2000,
20012008, 2007 and 2002:
Proved reserves are estimated quantities of crude oil natural gas and natural gas liquids which geological and engineering data demonstrate with reasonable certainty to be recoverable in future years from known reservoirs under existing economic and operating conditions.
There are numerous uncertainties inherent in estimating quantities of proved oil and natural gas reserves. Oil and natural gas reserve engineering is a subjective process of estimating underground accumulations of oil and natural gas that cannot be precisely measured, and estimates of engineers other than the Company'sCompany’s might differ materially from the estimates set forth herein. The accuracy of any reserve estimate is a function of the quality of available data and of engineering and geological interpretation and judgment. Results of drilling, testing and production subsequent to the date of the estimate may justify revision of such estimate. Accordingly, reserve estimates are often different from the quantities of oil and gas that are ultimately recovered.
The year-end weighted average oil and gas prices utilized in the
computation of future cash inflows were $10.37 per Bbl and $1.37 per Mcf,
respectively, higher in 2002 than in 2001. This price increase accounts for the
majority of the revisions of previous estimates for 2002.
Gas imbalance receivables and liabilities for each of the three years ended December 31, 2000, 20012008, 2007 and 2002,2006, were not material and have not been included in the reserve estimates.
Proved Developed Oiloil and Gas Reserves
gas reserves
| Natural Gas (MMcf) | Crude Oil (MBbls) | |||||
Proved reserves as of December 31, 2005 | 108,118 | 98,645 | ||||
Revisions of previous estimates | (307 | ) | 416 | |||
Extensions, discoveries and other additions | 23,235 | 6,111 | ||||
Production | (9,225 | ) | (7,480 | ) | ||
Sale of minerals in place | — | — | ||||
Purchase of minerals in place | 44 | 346 | ||||
Proved reserves as of December 31, 2006 | 121,865 | 98,038 | ||||
Revisions of previous estimates | 7,434 | 2,134 | ||||
Extensions, discoveries and other additions | 64,988 | 12,845 | ||||
Production | (11,534 | ) | (8,699 | ) | ||
Sale of minerals in place | — | (228 | ) | |||
Purchase of minerals in place | 66 | 55 | ||||
Proved reserves as of December 31, 2007 | 182,819 | 104,145 | ||||
Revisions of previous estimates | (16,179 | ) | (10,527 | ) | ||
Extensions, discoveries and other additions | 167,288 | 19,765 | ||||
Production | (17,151 | ) | (9,147 | ) | ||
Sale of minerals in place | — | — | ||||
Purchase of minerals in place | 1,361 | 2,003 | ||||
Proved reserves as of December 31, 2008 | 318,138 | 106,239 |
The increases in oil and natural gas reserve volumes attributable to extensions, discoveries and other additions are a result of the Company’s exploration and development activity.
Continental Resources, Inc. and Subsidiary
Notes to Consolidated Financial Statements—(continued)
The following reserve information was developed by the Company and sets forth the estimated quantities of proved developed and proved undeveloped oil and natural gas reserves of the Company as of the beginning of each year.
| December 31, | Natural Gas (MMcf) | Crude Oil (MBbls) | Oil Equivalent (MBoe) | |||||
Proved Developed Reserves | 2006 | 70,420 | 75,336 | 87,073 | ||||
| 2007 | 128,831 | 79,756 | 101,228 | |||||
| 2008 | 153,536 | 80,387 | 105,976 | |||||
Proved Undeveloped Reserves | 2006 | 51,445 | 22,702 | 31,276 | ||||
| 2007 | 53,988 | 24,389 | 33,387 | |||||
| 2008 | 164,602 | 25,852 | 53,286 | |||||
Proved developed reserves are proved reserves that are expected to be recovered through existing wells with existing equipment and operating methods. Costs IncurredProved undeveloped reserves are proved reserves that require incremental capital expenditures to recover. Natural gas is converted to barrels of oil equivalent using a conversion factor of six thousand cubic feet per barrel.
Standardized measure of discounted future net cash flows relating to proved oil and gas reserves
The standardized measure of discounted future net cash flows presented in Oilthe following table was computed using year-end prices and Gas Activities
Costscosts and a 10% discount factor. However, the Company cautions that actual future net cash flows may vary considerably from these estimates. Although the Company’s estimates of total proved reserves, development costs and production rates were based on the best available information, the development and production of the oil and gas reserves may not occur in the periods assumed. Actual prices realized, costs incurred inand production quantities may vary significantly from those used. Therefore, such estimated future net cash flows computations should not be considered to represent the Company’s estimate of the expected revenues or the current value of existing proved reserves.
Continental Resources, Inc. and Subsidiary
Notes to Consolidated Financial Statements—(continued)
Prior to the completion of the Company’s initial public offering on May 14, 2007, the Company was a subchapter S corporation where taxes were paid by its shareholders. In connection with the Company's oil and gas acquisition,
exploration and development activities duringcompletion of its initial public offering, the yearsCompany converted to a subchapter C corporation, a taxable entity. As such we are shown below (in
thousands of dollars). Amounts are presentedshowing taxes in accordance with SFAS No. 19, and
may not agree with amounts determined using traditional industry definitions.
| December 31, | ||||||||||||
| 2008 | 2007 | 2006 | ||||||||||
| (In thousands) | ||||||||||||
Historical: | ||||||||||||
Future cash inflows | $ | 5,777,441 | $ | 9,754,787 | $ | 5,244,078 | ||||||
Future production costs | (1,993,888 | ) | (2,427,862 | ) | (1,763,573 | ) | ||||||
Future development and abandonment costs | (663,497 | ) | (461,811 | ) | (466,057 | ) | ||||||
Future income taxes | (703,329 | ) | (2,008,293 | ) | — | |||||||
Future net cash flows | 2,416,727 | 4,856,821 | 3,014,448 | |||||||||
10% annual discount for estimated timing of cash flows | (1,139,626 | ) | (2,274,482 | ) | (1,429,976 | ) | ||||||
Standardized measure of discounted future net cash flows | $ | 1,277,101 | $ | 2,582,339 | $ | 1,584,472 | ||||||
Pro forma for income tax: | ||||||||||||
Future cash inflows | $ | 5,244,078 | ||||||||||
Future production costs | (1,763,573 | ) | ||||||||||
Future development and abandonment costs | (466,057 | ) | ||||||||||
Future income taxes | (1,061,163 | ) | ||||||||||
Future net cash flows pro forma for income taxes | 1,953,285 | |||||||||||
10% annual discount for estimated timing of cash flows | (926,588 | ) | ||||||||||
Standardized measure of discounted future net cash flows | $ | 1,026,697 | ||||||||||
The year-end weighted average oil price utilized in the computation of future cash inflows was approximately $26.80, $18.67,$39.69, $82.86, and $29.04$47.85 per BBLbarrel at December 31, 2000, 20012008, 2007 and 2002,2006, respectively. The year-end weighted average natural gas price utilized in the computation of future cash inflows was approximately
$9.78, $1.96,$4.90, $6.16, and $3.33$4.54 per MCFMcf at December 31, 2000, 20012008, 2007 and 2002,2006, respectively. Such prices do not includeFuture cash flows are reduced by estimated future costs to develop and to produce the effect of the Company's fixed price
contracts designatedproved reserves, as hedges.
Future production and developmentwell as certain abandonment costs, which include dismantlement and
restoration expense, are computed by estimating the expenditures to be incurred
in developing and producing the Company's proved oil and gas reserves at the end
of the year, based on year-end costs, andcost estimates assuming continuation of existing economic conditions.
Income taxes were not computed at December 31, 2000, 2001 or 2002, as the
Company elected S-Corporation status effective June 1, 1997.
Principal
Continental Resources, Inc. and Subsidiary
Notes to Consolidated Financial Statements—(continued)
The changes in the aggregate standardized measure of discounted future net cash flows attributable to the Company'sCompany’s proved oil and gas reserves at year-end are shownpresented below for each of the past three years (in thousandsthousands):
| December 31, | ||||||||||||
| 2008 | 2007 | 2006 | ||||||||||
Standardized measure of discounted future net cash flows at the beginning of the year | $ | 2,582,339 | $ | 1,584,472 | $ | 2,204,375 | ||||||
Extensions, discoveries and improved recovery, less related costs | 276,774 | 643,016 | 138,119 | |||||||||
Revisions of previous quantity estimates | (169,605 | ) | 90,188 | 5,455 | ||||||||
Changes in estimated future development and abandonment costs | (55,793 | ) | (14,597 | ) | (139,623 | ) | ||||||
Net purchase (sale) of minerals in place | 115,711 | 2,050 | 5,953 | |||||||||
Net change in prices and production costs | (1,981,977 | ) | 1,313,657 | (520,756 | ) | |||||||
Accretion of discount | 258,234 | 158,447 | 220,438 | |||||||||
Sales of oil and natural gas produced, net of production costs | (779,661 | ) | (497,463 | ) | (383,405 | ) | ||||||
Development costs incurred during the period | 305,028 | 232,356 | 123,971 | |||||||||
Change in timing of estimated future production and other | 26,732 | 15,677 | (70,055 | ) | ||||||||
Change in income taxes | 699,319 | (945,464 | ) | — | ||||||||
Net Change | (1,305,238 | ) | 997,867 | (619,903 | ) | |||||||
Standardized measure of discounted future net cash flows at the end of the year | $ | 1,277,101 | $ | 2,582,339 | $ | 1,584,472 | ||||||
16. Quarterly Financial Data (Unaudited)
Our quarterly financial data for 2008 and 2007 is summarized below.
| Quarter | |||||||||||||
| First | Second | Third | Fourth | ||||||||||
| (In thousands, except per share data) | |||||||||||||
2008 | |||||||||||||
Revenues | $ | 227,651 | $ | 303,434 | $ | 293,609 | $ | 135,796 | |||||
Operating income | $ | 141,693 | $ | 205,229 | $ | 171,159 | $ | 11,242 | |||||
Net income | $ | 87,971 | $ | 127,307 | $ | 105,256 | $ | 416 | |||||
Net income per share: | |||||||||||||
Basic | $ | 0.52 | $ | 0.76 | $ | 0.63 | $ | 0.00 | |||||
Diluted | $ | 0.52 | $ | 0.75 | $ | 0.62 | $ | 0.00 | |||||
2007 | |||||||||||||
Revenues | $ | 121,123 | $ | 145,326 | $ | 156,772 | $ | 158,994 | |||||
Operating income | $ | 57,162 | $ | 74,134 | $ | 88,368 | $ | 88,303 | |||||
Net income (loss) | $ | 53,814 | $ | (142,498 | ) | $ | 56,372 | $ | 60,892 | ||||
Net income (loss) per share: | |||||||||||||
Basic | $ | 0.34 | $ | (0.87 | ) | $ | 0.34 | $ | 0.36 | ||||
Diluted | $ | 0.34 | $ | (0.87 | ) | $ | 0.33 | $ | 0.36 | ||||
| Item 9. | Changes in and Disagreements with Accountants on Accounting and Financial Disclosure |
There have been no changes in accountants or any disagreements with accountants.
| Item 9A. | Controls and Procedures |
Disclosure Controls and Procedures
Our Chief Executive Officer and Chief Financial Officer have reviewed and evaluated the effectiveness of dollars)
our disclosure controls and procedures (as defined in Exchange Act Rule 240.13a-15(e) and 15d-15(e)) as of the end of the period covered by this report. Disclosure controls and procedures include, without limitation, controls and procedures designed to ensure that information required to be disclosed by an issuer in reports that it files or submits with this report accumulated and communicated to the issuer’s management, including its Chief Executive Officer and Chief Financial Officer, or persons performing similar functions, as appropriate to make timely decisions regarding required disclosures. Based on that evaluation, our Chief Executive Officer and our Chief Financial Officer have concluded that our current disclosure controls and procedures are effective to ensure that information required to be disclosed by us in this report are recorded, processed, summarized and reported, within the time periods specified.
Management’s Report on Internal Control Over Financial Reporting
MANAGEMENT’S REPORT ON INTERNAL CONTROL OVER FINANCIAL REPORTING
Our Company’s management is responsible for establishing and maintaining adequate internal control over financial reporting, as such term is defined in Exchange Act Rule 13a-15(f). Internal control over financial reporting is a process designed to provide reasonable assurance regarding the reliability of financial reporting and the preparation of our financial statements for external purposes in accordance with generally accepted accounting principles. Under the supervision and with the participation of our Company’s management, including the Chief Executive Officer and the Chief Financial Officer, we conducted an evaluation of the effectiveness of our internal control over financial reporting based on the framework inInternal Control—Integrated Frameworkissued by the Committee of Sponsoring Organizations of the Treadway Commission.
Our internal control over financial reporting includes those policies and procedures that: (1) pertain to the maintenance of records that, in reasonable detail, accurately and fairly reflect the transactions and dispositions of our assets; (2) provide reasonable assurance that transactions are recorded as necessary to permit preparation of our financial statements in accordance with generally accepted accounting principles, and that our receipts and expenditures are being made only in accordance with authorizations of our management and directors; and (3) provide reasonable assurance regarding prevention or timely detection of unauthorized acquisition, use or disposition of our assets that could have a material effect on our financial statements.
Because of its inherent limitations, internal control over financial reporting may not prevent or detect misstatements. Also, projections of any evaluation of effectiveness to future periods are subject to the risk that controls may become inadequate because of changes in conditions, or that the degree of compliance with the policies or procedures may deteriorate.
Based on our evaluation under the framework inInternal Control—Integrated Framework,the management of our Company concluded that our internal control over financial reporting was effective as of December 31, 2008.
The effectiveness of our internal control over financial reporting as of December 31, 2008 has been audited by Grant Thornton LLP, an independent registered public accounting firm, as stated in their report that follows.
Harold Hamm
President and Chief Executive Officer
John D. Hart
Vice President, Chief Financial Officer and Treasurer
REPORT OF INDEPENDENT REGISTERED PUBLIC ACCOUNTING FIRM
Board of Directors and Shareholders
Continental Resources, Inc.
We have audited Continental Resources, Inc. (an Oklahoma corporation) and Subsidiary’s (the Company) internal control over financial reporting as of December 31, 2008, based on criteria established inInternal Control—Integrated Framework issued by the Committee of Sponsoring Organizations of the Treadway Commission (COSO). The Company’s management is responsible for maintaining effective internal control over financial reporting and for its assessment of the effectiveness of internal control over financial reporting, included in the accompanyingManagement’s Report on Internal Control Over Financial Reporting. Our responsibility is to express an opinion on the Company’s internal control over financial reporting based on our audit.
We conducted our audit in accordance with the standards of the Public Company Accounting Oversight Board (United States). Those standards require that we plan and perform the audit to obtain reasonable assurance about whether effective internal control over financial reporting was maintained in all material respects. Our audit included obtaining an understanding of internal control over financial reporting, assessing the risk that a material weakness exists, testing and evaluating the design and operating effectiveness of internal control based on the assessed risk, and performing such other procedures as we considered necessary in the circumstances. We believe that our audit provides a reasonable basis for our opinion.
A company’s internal control over financial reporting is a process designed to provide reasonable assurance regarding the reliability of financial reporting and the preparation of financial statements for external purposes in accordance with generally accepted accounting principles. A company’s internal control over financial reporting includes those policies and procedures that (1) pertain to the maintenance of records that, in reasonable detail, accurately and fairly reflect the transactions and dispositions of the assets of the company; (2) provide reasonable assurance that transactions are recorded as necessary to permit preparation of financial statements in accordance with generally accepted accounting principles, and that receipts and expenditures of the company are being made only in accordance with authorizations of management and directors of the company; and (3) provide reasonable assurance regarding prevention or timely detection of unauthorized acquisition, use, or disposition of the company’s assets that could have a material effect on the financial statements.
Because of its inherent limitations, internal control over financial reporting may not prevent or detect misstatements. Also, projections of any evaluation of effectiveness to future periods are subject to the risk that controls may become inadequate because of changes in conditions, or that the degree of compliance with the policies or procedures may deteriorate.
In our opinion, Continental Resources, Inc. and Subsidiary maintained, in all material respects, effective internal control over financial reporting as of December 31, 2008, based on criteria established inInternal Control—Integrated Framework issued by COSO.
We also have audited, in accordance with the standards of the Public Company Accounting Oversight Board (United States), the consolidated balance sheets of Continental Resources, Inc. and Subsidiary as of December 31, 2008 and 2007, and the related consolidated statements of income, shareholders’ equity and cash flows for each of the three years in the period ended December 31, 2008 and our report dated February 26, 2009, expressed an unqualified opinion.
/s/ GRANT THORNTON LLP
Oklahoma City, Oklahoma
February 26, 2009
Changes in Internal Control over Financial Reporting
As of the end of the period covered by this report, we carried out an evaluation, under the supervision and with the participation of our Chief Executive Officer and Chief Financial Officer, of our internal control over financial reporting to determine whether any changes occurred during the fourth quarter of 2008 that have materially affected, or are reasonably likely to materially affect, our internal control over financial reporting. Based on that evaluation, there were no changes in our internal control over financial reporting or in other factors that have materially affected or are reasonably likely to materially affect our internal control over financial reporting.
| Item 9B. | Other Information |
None.
| Item 10. | Directors, Executive Officers and Corporate Governance |
Information as to Item 10 will be set forth in the Proxy Statement for the Annual Meeting of Shareholders to be held on May 28, 2009, (the “Annual Meeting”) and is incorporated herein by reference.
| Item 11. | Executive Compensation |
Information as to Item 11 will be set forth in the Proxy Statement for the Annual Meeting and is incorporated herein by reference.
| Item 12. | Security Ownership of |
Information as to Item 12 will be set forth in the Proxy Statement for the Annual Meeting and is incorporated herein by reference.
| Item 13. | Certain Relationships and Related Transactions |
The information as to Item 13 will be set forth in the Proxy Statement for the Annual Meeting and is incorporated herein by reference.
| Item 14. | Principal Accountant Fees and Services |
The information as to Item 14 will be set forth in the Proxy Statement for the Annual Meeting and is incorporated herein by reference.
| Item 15. | Exhibits and Financial Statement Schedules |
(1)Financial Statements
The Consolidated Financial Statements of Continental Resources, Inc. and the Report of the Independent Registered Public Accounting Firm are included in Item 8 of this report beginning on page 54.
(2)Financial Statement Schedules
None.
(3)Index to Exhibits
The exhibits marked with the asterisk symbol (*) are filed or furnished (in the case of Exhibit 32) with this Form 10-K. The exhibits marked with the cross symbol (†) are management contracts or compensatory plans or arrangements filed pursuant to Item 601(b)(10)(iii) of Regulation S-K.
| 3.1 | Third Amended and Restated Certificate of Incorporation of Continental Resources, Inc. filed as Exhibit 3.1 to the | |
| 3.2 | Second Amended and Restated Bylaws of Continental Resources, Inc. filed as Exhibit 3.2 to the Company’s Current Report on Form 8-K (Commission File No. 001-328861) filed May 22, 2007 and incorporated herein by reference. | |
| 4.1 | Registration Rights Agreement filed as Exhibit 10.1 to the Company’s Current Report on Form 8-K (Commission File No. 001-328861) filed May 22, 2007 and incorporated herein by reference. | |
| 4.2 | Specimen Common Stock Certificate filed as Exhibit 4.1 to the Company’s registration statement on Form S-1 (Commission File No. 333-132257) filed April 14, 2006 and incorporated herein by reference. | |
| 10.1 | Sixth Amended and Restated Credit Agreement among Union Bank of California, N.A., Guaranty Bank, FSB, Fortis Capital Corp., The Royal Bank of Scotland plc, other financial institutions and banks and Continental Resources, Inc. dated April 12, 2006 filed as Exhibit 10.1 to the Company’s registration statement on Form S-1 (Commission File No. 333-132257) filed April 14, 2006 and incorporated herein by reference. | |
| 10.2 | Omnibus Agreement among Continental Resources, Inc., Hiland Partners, LLC, Harold Hamm, Hiland Partners GP, LLC, Continental Gas Holdings, Inc. and Hiland Partners, LP effective as of the | |
| 10.3 | Compression Services Agreement among Hiland Partners, LP and Continental Resources, Inc. effective as of January 28, 2005 (incorporated by reference to Exhibit 10.3 to the Annual Report on Form 10-K of Hiland Partners, LP filed on March 30, 2005, Commission File No. 000-51120). | |
| 10.4 | Gas Purchase Contract between Continental Resources, Inc. and Hiland Partners, LP dated November 8, 2005 (incorporated by reference to Exhibit 10.1 to the Current Report on Form 8-K of Hiland Partners, LP filed on November 10, 2005, Commission File No. 000-51120). | |
| 10.5 | Strategic Customer Relationship Agreement among Complete Energy Services, Inc., CES Mid-Continent Hamm, Inc. and Continental Resources, Inc. dated October | |
| 10.6† | Continental Resources, Inc. 2000 Stock Option Plan filed as Exhibit 10.6 to the Company’s registration statement on Form S-1 (Commission File No. 333-132257) filed April 14, 2006 and incorporated herein by reference. | |
| 10.7† | First Amendment to Continental Resources, Inc. 2000 Stock Option Plan filed as Exhibit 10.7 to the Company’s registration statement on Form S-1 (Commission File No. 333-132257) filed April 14, 2006 and incorporated herein by reference. | |
| 10.8† | Form of Incentive Stock Option Agreement filed as Exhibit 10.8 to the Company’s registration statement on Form S-1 (Commission File No. 333-132257) filed April 14, 2006 and incorporated herein by reference. | |
| 10.9† | Amended and Restated | |
| 10.10† | Form of Restricted Stock Award Agreement filed as Exhibit 10.10 to the Company’s registration statement on Form S-1 (Commission File No. 333-132257) filed April 14, 2006 and incorporated herein by reference. | |
| 10.11† | Amended and Restated | |
| 10.12† | Form of Indemnification Agreement between Continental | |
| 10.13† | Membership Interest Assignment Agreement by and between Continental Resources, Inc., the Harold Hamm Revocable Inter Vivos Trust, the Harold Hamm HJ Trust and the Harold Hamm DST Trust dated March 30, 2006 filed as | |
| 10.14 | Crude oil gathering agreement between Banner Pipeline Company, L.L.C., a wholly owned subsidiary of Continental Resources, Inc. and Banner Transportation Company dated July 11, 2007 filed as Exhibit 99.1 to the | |
| 10.15* | Amendment No. 1 Dated as of April 17, 2007 to the Sixth Amended and Restated Credit | |
| 10.16* | Commitment Increase Agreement | |
| 10.17* | Amendment No. 3 Dated as of | |
| 10.18* | Commitment Increase Agreement | |
| 10.19†* | Summary of Non-Employee Director Compensation. | |
| 21.1* | Subsidiaries of Continental Resources, Inc. | |
| 23.1* | Consent of Grant Thornton LLP. | |
| 23.2* | Consent of Ryder Scott Company, L.P. | |
| 31.1* | Certification of the | |
| 31.2* | Certification of the Company’s Chief Financial Officer Pursuant to Section 302 of the Sarbanes-Oxley Act of 2002 (18 U.S.C. Section 7241) | |
| 32* | Certification of the Company’s Chief Executive Officer and Chief Financial Officer Pursuant to Section 906 of the | |
Signatures
Pursuant to the requirements Section 13 or 15 (d) of the Securities Exchange Act of 1934, Continental Resources, Inc. has duly caused this report to be signed on its behalf by the undersigned, thereunto duly authorized.
| CONTINENTAL RESOURCES, INC. | ||
| By: | /s/ HAROLD G. HAMM | |
| Name: | Harold G. Hamm | |
| Title: | President and Chief Executive Officer | |
| Date: | February 27, 2009 | |
Pursuant to the requirements of the Securities Exchange Act of 1934, this report has been signed by the following persons on behalf of Continental Resources, Inc. in the capacities and on the dates indicated.
Signature | Title | Date | ||
/s/ HAROLD G. HAMM Harold G. Hamm | President, Chief Executive Officer and (principal executive officer) | February 27, 2009 | ||
/s/ JOHN D. HART John D. Hart | Vice President, Chief Financial Officer and officer) | February 27, 2009 | ||
/s/ ROBERT J. GRANT Robert J. Grant | Director | February 27, 2009 | ||
/s/ GEORGE S. LITTELL George S. Littell | Director | February 27, 2009 | ||
/s/ LON MCCAIN Lon McCain | Director | February 27, 2009 | ||
/s/ MARK E. MONROE Mark E. Monroe | Director | February 27, 2009 | ||
/s/ H. R. SANDERS, JR. H. R. Sanders, Jr. | Director | February 27, 2009 | ||
89