UNITED STATES
SECURITIES AND EXCHANGE COMMISSION
Washington, D.C. 20549
FORM 10-K
þANNUAL REPORT PURSUANT TO SECTION 13 OR 15(d) OF THE SECURITIES EXCHANGE ACT OF 1934
For the fiscal year ended December 31, 20222023
OR
¨TRANSITION REPORT PURSUANT TO SECTION 13 OR 15(d) OF THE SECURITIES EXCHANGE ACT OF 1934
For the transition period from ___________ to ___________
Commission file number 0-22900
CENTURY CASINOS, INC.
(Exact name of registrant as specified in its charter)
|
|
DELAWARE | 84-1271317 |
(State or other jurisdiction of incorporation | (I.R.S. Employer |
or organization) | Identification No.) |
455 E. Pikes Peak Ave, Suite 210, Colorado Springs, Colorado 80903
(Address of principal executive offices) (Zip Code)
(719) 527-8300
(Registrant’s telephone number, including area code)
Securities Registered Pursuant to Section 12(b) of the Act:
|
|
|
Title of each class | Trading Symbol(s) | Name of exchange on which registered |
Common Stock, $0.01 Per Share Par Value | CNTY | Nasdaq Capital Market, Inc. |
Securities Registered Pursuant to Section 12(g) of the Act:
None
Indicate by check mark if the registrant is a well-known seasoned issuer, as defined in Rule 405 of the Securities Act. Yes ¨ No þ
Indicate by check mark if the registrant is not required to file reports pursuant to Section 13 or Section 15(d) of the Act.
Yes ¨ No þ
Indicate by check mark whether the registrant (1) has filed all reports required to be filed by Section 13 or 15(d) of the Securities Exchange Act of 1934 during the preceding 12 months (or for such shorter period that the registrant was required to file such reports), and (2) has been subject to such filing requirements for the past 90 days. Yes þ No ¨
Indicate by check mark whether the registrant has submitted electronically every Interactive Data File required to be submitted pursuant to Rule 405 of Regulation S-T (§232.405 of this chapter) during the preceding 12 months (or for such shorter period that the registrant was required to submit such files).Yes þ No ¨
Indicate by check mark whether the registrant is a large accelerated filer, an accelerated filer, a non-accelerated filer, a smaller reporting company, or an emerging growth company. See the definitions of “large accelerated filer,” “accelerated filer,” “smaller reporting company,” and “emerging growth company” in Rule 12b-2 of the Exchange Act.
|
|
|
|
|
|
|
|
|
|
| Large accelerated filer ¨ |
| Accelerated filer þ |
|
| Non-accelerated filer ¨ |
| Smaller reporting company þ |
|
|
|
| Emerging growth company ¨ |
|
If an emerging growth company, indicate by check mark if the registrant has elected not to use the extended transition period for complying with any new or revised financial accounting standards provided pursuant to Section 13(a) of the Exchange Act. ¨
Indicate by check mark whether the registrant has filed a report on and attestation to its management’s assessment of the effectiveness of its internal control over financial reporting under Section 404(b) of the Sarbanes-Oxley Act (15 U.S.C. 7262(b)) by the registered public accounting firm that prepared or issued its audit report. þ
If securities are registered pursuant to Section 12(b) of the Act, indicate by check mark whether the financial statements of the registrant included in the filing reflect the correction of an error to previously issued financial statements. ¨
Indicate by check mark whether any of those error corrections are restatements that required a recovery analysis of incentive-based compensation received by any of the registrant's executive officers during the relevant recovery period pursuant to §240.10D-1(b). ¨
Indicate by check mark whether the registrant is a shell company (as defined in Rule 12b-2 of the Exchange Act). Yes ¨ No þ
The aggregate market value of the voting and non-voting common equity held by non-affiliates of the registrant as of June 30, 2022,2023, based upon the closing price of $7.20$7.10 for the Common Stock on the Nasdaq Capital Market on that date, was $186,250,356.$185,126,316. For purposes of this calculation only, executive officers and directors of the registrant are considered affiliates.
As of March 3, 2023,8, 2024, the registrant had 29,870,54730,359,931 shares of Common Stock outstanding.
DOCUMENTS INCORPORATED BY REFERENCE: Part III incorporates by reference the registrant’s definitive Proxy Statement for its 20232024 Annual Meeting of Stockholders to be filed with the Securities and Exchange Commission within 120 days after December 31, 2022.2023.
CAUTIONARY STATEMENT REGARDING FORWARD-LOOKING INFORMATION
This Annual Report on Form 10-K and certain information incorporated herein by reference contain forward-looking statements within the meaning of Section 21E of the Securities Exchange Act of 1934, as amended (the “Exchange Act”), Section 27A of the Securities Act of 1933, as amended (the “Securities Act”), and the Private Securities Litigation Reform Act of 1995 and, as such, may involve risks and uncertainties. All statements included or incorporated by reference in this report, other than statements that are purely historical, are forward-looking statements. Forward-looking statements generally can be identified by the use of forward-looking terminology such as “may,” “will,” “expect,” “intend,” “estimate,” “anticipate,” “believe,” “could,” “potential,” “continue” or similar terminology. These statements are based on the beliefs and assumptions of the management of the Company based on information currently available to management. Forward-looking statements are not guarantees of future performance and are subject to risks and uncertainties that could cause actual results to differ materially from the results contemplated by the forward-looking statements.
The forward-looking statements included or incorporated by reference in this report are subject to additional risks and uncertainties further discussed under Item 1A. “Risk Factors” and are based on information available to us on the filing date of this report. Readers are cautioned not to place undue reliance on forward-looking statements, which speak only as of the date of this report. New risks and uncertainties arise from time to time, and we cannot predict those events or how they may affect us. We assume no obligation to update any forward-looking statements.
PART I
Item 1. Business.
As used in this report, the terms “Company,” “we,” “our,” or “us” refer to Century Casinos, Inc. and its consolidated subsidiaries, taken as a whole, unless the context otherwise requires.
This report includes amounts translated into US dollars from certain foreign currencies. For a description of the currency conversion methodology and exchange rates used for certain transactions, see Note 2 to the Consolidated Financial Statements included in Part II, Item 8, “Financial Statements and Supplementary Data” of this report. The following information should be read in conjunction with the Consolidated Financial Statements and notes thereto included in Part II, Item 8, “Financial Statements and Supplementary Data” of this report.
Overview
Century Casinos, Inc., a Delaware corporation founded in 1992, is a casino entertainment company that develops and operates gaming establishments as well as related lodging, restaurant, horse racing (including off-track betting) and entertainment facilities primarily in North America. Our main goal is to grow our business by actively pursuing the development or acquisition of new gaming opportunities and growing and reinvesting in our existing operations.
We began operating land-based casinos in 1996 with the acquisition of our casino in Cripple Creek, Colorado. In 2006, we opened casinos in Central City, Colorado and Alberta, Canada. In 2007, we purchased a 33.3% ownership interest in Casinos Poland, Ltd. (“CPL”), the owner and operator of eight casinos throughout Poland, and in 2013 we purchased an additional 33.3% ownership interest in CPL, resulting in a majority 66.6% ownership interest. Between 2015 and 2019, we acquired an additional casino and developed two Racingracing and Entertainment Centersentertainment centers (“RECs”) in Alberta, Canada. In December 2019, we completed our largest acquisition to date, addingadded three properties to our United States (“US”) portfolio, (the “2019 Acquired Casinos”), two in Missouri and one in West Virginia (the “2019 Acquisition”). In connection with the 2019 Acquisition,this acquisition, we entered into a triple net lease agreement (the “Master Lease”) with subsidiaries of VICI Properties Inc. (“VICI PropCo”). In 2022, we acquired 50% of Smooth Bourbon LLC (“Smooth Bourbon” or “PropCo”), which leases the land and building for the Nugget Casino Resort (“Nugget”) in Sparks, Nevada in which it operates. We currently have a pending acquisition ofReno-Sparks, Nevada. In 2023, we acquired the operations of the Nugget and Rocky Gap Casino, Resort and another pending acquisition of casino operations& Golf (“Rocky Gap”) in Flintstone, Maryland. See “2022 Business Developments”“Business Developments – Nugget Casino Resort” and “– Rocky Gap Casino Resort” below.
Operations
We view each jurisdictionregion in which our casinos are locatedwe operate as a separate operating segmentssegment and each casino or other operation within those jurisdictionsmarkets as a reporting units. Except as described below, weunit. We aggregate ourall operating segments into three reportable segments based on the geographical locations in which our casinos operate.operate: United States, Canada and Poland. We have additional business activities including our cruise ship concession agreement and certain other corporate and management operations whichthat we report as Corporate and Other. The following are our reportable segments:
United States
Canada
Poland
Corporate and Other
The general characteristics of our properties, including machine and table counts and the number of hotel rooms at our casinos, are provided in Part I, Item 2. “Properties”.
United States
Colorado –
Century Casino & Hotel – Central City, Colorado (“CTL” or “Central City”). Central City is located approximately 35 miles west of Denver. CTL is located at the end of the Central City Parkway, an eight mile four-lane highway that connects I-70, the main east/west interstate highway in Colorado, to Central City. In addition to the casino, the facility has 26 hotel rooms, a bar, two restaurants and a 500-space on-site covered parking garage. Sports betting is available through a mobile sports betting app.
Century Casino & Hotel – Cripple Creek, Colorado (“CRC” or “Cripple Creek”). The town of Cripple Creek is located approximately 45 miles southwest of Colorado Springs, the second largest city in the state of Colorado. In addition to the casino, the facility has 21 hotel rooms, two bars, a restaurant and 271 surface parking spaces neighboring the casino. Sports betting is available through two mobile sports betting apps.
West VirginiaEast –
Mountaineer Casino, RacetrackResort & ResortRaces – New Cumberland, West Virginia (“MTR” or “Mountaineer”). Mountaineer is located on the Ohio River bank at the northern tip of West Virginia’s northwestern panhandle approximately 30 miles from Pittsburgh International Airport and a one hour drive from downtown Pittsburgh. In addition to the casino and hotel, Mountaineer has a golf course and a racetrack that holds live thoroughbred races from April to December. The facility also has on-site pari-mutuel wagering, a sports book, 357 hotel rooms, five dining venues, a bar a golf course and 5,248 surface parking spaces neighboring the casino. Sports betting and online gaming (“iGaming”) are also available through mobile apps.
MissouriRocky Gap Casino, Resort & Golf – Flintstone, Maryland (“ROK” or “Rocky Gap”). Rocky Gap is located in Rocky Gap State Park. In addition to the casino and hotel, the facility has five food and beverage venues, an 18-hole golf course, a 5,000 square foot events center, several meeting spaces, a spa, several outdoor activities and approximately 750 surface parking spaces neighboring the casino.
Midwest –
Century Casino Caruthersville – Caruthersville, Missouri (“CCV” or “Caruthersville”). Caruthersville isand our neighboring hotel, The Farmstead, are located in southeast Missouri along the Mississippi River approximately 95 miles north of Memphis, Tennessee. In December 2022, we movedrelocated the casino from a riverboat into a 40,000 square foot land-based pavilion following record low water levels in the Mississippi River that made access to the riverboat dangerous.difficult. Caruthersville also has a food and beverage outlet,venue, 27 space RV park and 1,343 surface parking spaces neighboring the casino. Also neighboringWe are currently building a new land-based casino with a small hotel near the casino is our newly renovated hotel, The Farmstead, which has 36 hotel rooms.pavilion site. See “2022 Business“Business Developments – Recent Developments Related to Century Casino Caruthersville”, “— Caruthersville Land-Based Casino and Hotel” and “—Caruthersville Hotel” below.
Century Casino Cape Girardeau – Cape Girardeau, Missouri (“CCG” or “Cape Girardeau”). Cape Girardeau is located along the Mississippi River three and a half miles from Interstate 55 in southeast Missouri, approximately 120 miles south of St. Louis, Missouri. In addition to the casino, the facility has two dining venues, a conference and entertainment center and 1,058 surface parking spaces neighboring the casino. We are currently building a hotel connected to the casino. See “2022 Business“Business Developments – Cape Girardeau Hotel” below.
CanadaCentury Casino & Hotel – Central City, Colorado (“CTL” or “Central City”). Central City is located approximately 35 miles west of Denver. CTL is located at the end of the Central City Parkway, an eight mile four-lane highway that connects I-70, the main east/west interstate highway in Colorado, to Central City. In addition to the casino and hotel, the facility has a bar, two restaurants and a 500-space on-site covered parking garage. Sports betting is available through a mobile sports betting app.
Edmonton
Century Casino & Hotel – Cripple Creek, Colorado (“CRC” or “Cripple Creek”). The town of Cripple Creek is located approximately 45 miles southwest of Colorado Springs, the second largest city in the state of Colorado. In addition to the casino and hotel, the facility has two bars, a restaurant and 271 surface parking spaces neighboring the casino. Sports betting is available through two mobile sports betting apps.
West –
Nugget Casino Resort – Reno-Sparks, Nevada (“NUG” or “Nugget”). Nugget is located in Reno-Sparks, Nevada on Interstate 80 approximately three miles from the Reno-Tahoe International Airport. In addition to the casino and hotel, the full-service resort includes 110,000 square feet of convention space, an 8,555 seat outdoor amphitheater, seven food and beverage venues, a 5-story 1,200 space parking garage and 1,272 additional parking spaces. Sports betting is available in the casino’s sports book.
Canada
Century Casino & Hotel – Edmonton, Alberta, Canada (“CRA” or “Edmonton”). CRA is located in Edmonton, the capital of the province of Alberta. In addition to the casino and hotel, the facility has an off-track betting parlor, 26 hotel rooms, a 10,700 square foot showroom that can seat approximately 500 customers, a 3,000 square foot showroom that can seat approximately 200 customers where we host Yuk Yuks Comedy Club comedic performances, two restaurants, threea sports bar and lounge and two additional bars, 600 surface parking spaces and a complimentary underground heated parking garage with 300 additional spaces.
Century Casino St. Albert – Edmonton, Alberta, Canada (“CSA” or “St. Albert”). CSA is located in St. Albert, is located 13 miles from CRA,Alberta northwest of Edmonton. In addition to the casino, the facility has an off-track betting parlor, a restaurant, a bar, a lounge, a banquet facility and 585 surface parking spaces.
Century Mile Racetrack and Casino – Edmonton, Alberta, Canada (“CMR” or “Century Mile”). Century MileCMR is a one-mile horse racetrack and a multi-level REC located on Edmonton International Airport land close to the city of Leduc, south of Edmonton. CMR is a multi-level REC with a one mile horse racetrack. In addition to the casino, the REC has two restaurants, two bars and an off-track betting parlor. CMR operates the majority of the Alberta pari-mutuel network under which CMR provides pari-mutuel content and live video to 25 off-track
betting parlors throughout Alberta and has agreements with over 90 racetracks world-wide to broadcast races through the off-track betting network. Through August 2021, we operated the southern Alberta pari-mutuel off-track betting network through Century Bets! Inc. (“CBS” or “Century Bets”). In September 2021, we transferred these contracts to Century Mile. Century Bets was reported in the Canada reportable segment in the Calgary operating segment.
Calgary –
Century Downs Racetrack and Casino – Calgary, Alberta, Canada (“CDR” or “Century Downs”). CDR is located in Calgary, Alberta, seven miles from the Calgary International Airport. Our subsidiary Century Resorts Management GmbH (“CRM”) owns 75% of United Horsemen of Alberta Inc. dba Century Downs Racetrack and Casino, which in turn owns and operates a REC. The REC is in metropolitan Calgary, the largest city in the province of Alberta, seven miles from the Calgary International Airport.and horse racetrack. In addition to the casino and racetrack, the REC has a bar, a lounge, a restaurant facility, an off-track betting parlor, an entertainment area and 700 surface parking spaces. We have a 75% ownership interest in CDR is consolidatedand consolidate CDR as a majority-owned subsidiary for which we have a controlling financial interest.
Poland
Casinos Poland – Poland (“CPL” or “Casinos Poland”). CPL has been in operation since 1989 and currently is the owner and operator ofhas eight casinoscasino licenses throughout Poland. Our subsidiary CRM owns 66.6% of Casinos Poland and we consolidate CPL as a majority-owned subsidiary for which we have a controlling financial interest. See Part II, Item 7 “Management’s Discussion and Analysis of Financial Condition and Results of Operations – Poland” for more information about the casinos operated by CPL.
Corporate and Other
Cruise Ship. We have adecreased our operation of ship-based casinos on cruise ships over the past few years, and mutually agreed with cruise lines with which we had concession agreement with TUI Cruisesagreements not to extend certain agreements at their termination dates.Our final concession agreements to operate one ship-based casino. Our agreement to operate that ship-based casino endscasinos ended in the second quarter of 2023. We no longer operate onboard ship-based casinos.
2022 Business Developments
Nugget Casino Resort in Sparks,Reno-Sparks, Nevada
OnIn February 22, 2022, we entered into a definitive agreement with Marnell Gaming, LLC (“Marnell”), pursuant to which we through a newly formed subsidiary, (i) purchasedagreed to purchase from Marnell (i) 50% of the membership interests in Smooth Bourbon, LLC (“Smooth Bourbon”), and (ii) will purchase 100% of the membership interests in Nugget. Nugget Sparks, LLC (“OpCo”). OpCo owns and operates the Nugget Casino Resort in Sparks,Reno-Sparks, Nevada, and PropCoSmooth Bourbon owns the real property on which the casino is located.
We purchased 50% of the membership interests in PropCoSmooth Bourbon for approximately $95.0 million at the first closing on April 1, 2022 (the “First Closing”). We used approximately $29.3 million of cash on hand in connection with the First Closing. On April 1, 2022 (the “Closing Date”), we entered into a Credit Agreement (the “Goldman Credit Agreement”) by and among the Company, as borrower, the subsidiary guarantors party thereto, Goldman Sachs Bank USA, as administrative agent (the “Administrative Agent”) and collateral agent, Goldman Sachs Bank USA and BOFA Securities, Inc., as joint lead arrangers and joint bookrunners, and the Lenders and L/C Lenders party thereto. The Goldman Credit Agreement replaced a credit agreement (the “Macquarie Credit Agreement”) with Macquarie Capital (USA) Inc. (“Macquarie”). The Goldman Credit Agreement provides for a $350.0 million term loan (the “Term Loan”) and a $30.0 million revolving credit facility (the “Revolving Facility”). The Company drew $350.0 million under the Term Loan to fund the PropCo acquisition, for the repayment of approximately $166.2 million outstanding under the Macquarie Credit Agreement, to fund the Acquisition Escrow (as defined below) and for related fees and expenses. The Company did not draw on the Revolving Facility on the Closing Date. For additional information regarding the Goldman Credit Agreement, see Note 6 to the Consolidated Financial Statements included in Item 8, “Financial Statements and Supplementary Data” of this report.
Subject to approval from the Nevada Gaming Commission, our purchase ofpurchased 100% of the membership interests in OpCoNugget (the “Nugget Acquisition”) for approximately $100.0$104.7 million (subject to certain adjustments) is expected to close inat the second quarter of 2023closing (the “Second Closing”). The purchase price for the OpCo Acquisition will be on April 3, 2023. In August 2023, we paid from $100.0cash on hand an additional $0.8 million of the proceeds of the Term Loan that were borrowed and deposited in escrow (the “Acquisition Escrow”) on the Closing Date.related to working capital adjustments. Following the Second Closing, we will own the operating assets of Nugget Casino Resort and 50% of the membership interests in PropCo.Smooth Bourbon. We also have a five-year option through April 1, 2027 to acquire the remaining 50% of the membership interests in PropCoSmooth Bourbon for $105.0 million plus 2% per annum. At the First Closing, PropCo alsoSmooth Bourbon entered into a lease with OpCoNugget for an annual rent of $15.0 million.million plus an annual escalator.
Rocky Gap Casino Resort in Flintstone, Maryland
OnIn August 24, 2022, we entered into a definitive agreement with Lakes Maryland Development LLC (“Lakes Maryland”), Golden Entertainment, Inc. (“Golden”), Lakes Maryland Development LLC, a subsidiary of Golden, and VICI PropCo, pursuant to which we agreed to acquire the operations of Rocky Gap Casino Resort (“Rocky Gap”) for approximately $56.1 million, subject to the conditions and terms set forth therein. We plan to finance the cost of this acquisition with cash on hand.Gap. Pursuant to a real estate purchase agreement dated August 24, 2022, by and between Evitts Resort, LLC, (“Evitts”)a subsidiary of Golden and an affiliate of VICI PropCo (“VICI PropCo Buyer”), VICI PropCo Buyer agreed to acquire a related interest in the real estate assets relatingland and building associated with Rocky Gap.
On July 25, 2023, we acquired the operations of Rocky Gap (the “Rocky Gap Acquisition”) for approximately $59.1 million (subject to certain adjustments), and VICI PropCo Buyer purchased a related interest in the land and building associated with Rocky Gap for approximately $203.9 million. In December 2023, we paid an additional $0.1 million subjectrelated to the conditions and terms set forth therein.working capital adjustments. In connection with the closing of this transaction, one of our subsidiaries and a subsidiary of VICI PropCo will enterentered into an amendment to the Master Lease to (i) add Rocky Gap toLease. See Part I, Item 2. “Properties – Master Lease” for a discussion of the Master Lease (ii) provide for an initial annual rent for Rocky Gap of approximately $15.5 million, and (iii) extend the initial Master Lease term for 15 years from the date of the amendment (subjectas amended to the existing four five-year renewal options). We expect this transaction to close in the second quarter of 2023.date.
On May 16, 2023, we entered into definitive agreements for subsidiaries of VICI PropCo to acquire the real estate assets of Century Casino & Hotel Edmonton in Edmonton, Alberta, Century Casino St. Albert in Edmonton, Alberta, Century Mile Racetrack and Casino in Edmonton, Alberta and Century Downs Racetrack and Casino in Calgary, Alberta (collectively, the “Century Canadian Portfolio”). The sale was completed on September 6, 2023 for an aggregate purchase price of CAD 221.7 million ($162.6 million based on the exchange rate on September 6, 2023). Additional information about the expected funds retained from the sale and uses of the funds is in Part I, Item 7 “Management Discussion and Analysis of Financial Condition and Results of Operations – Liquidity and Capital Resources”. The CDR land lease ended on September 6, 2023 in conjunction with the Canada Real Estate Sale.
Simultaneous with the closing of the transaction, our existing Master Lease was amended. See Part I, Item 2. “Properties – Master Lease” for a discussion of the Master Lease as amended to date. We recorded a loss on debt extinguishment related to the CDR land lease of CAD 9.9 million ($7.3 million based on the exchange rate on September 6, 2023) in interest expense in our consolidated statements of (loss) earnings for the year ended December 31, 2023.
Recent Developments Related to Century Casino Caruthersville
The Caruthersville casino had been operating on a riverboat and barge since 1994. On October 13, 2022, the riverboat had to be closed as it was no longer accessible from the barge because of the record low water levels in the Mississippi River. On October 26, 2022, the Missouri Gaming Commission (“MGC”) approved the relocation of the casino at Century Casino Caruthersville from the riverboat and the barge to a land-based pavilion until the new land-based casino and hotel discussed below(discussed below) are completed. On October 13, 2022, the riverboat, which had operated since 1994, had to be closed as it was no longer accessible from the barge because of record low water levels in the Mississippi River. Prior to its closure, the riverboat casino had 519 slot machines and seven table games. From October to December 2022, Caruthersville operated the casino from the barge with 299 slot machines and four table games. The move to the pavilion, which has 425 slot machines and six table games, was completed in late December 2022. The pavilion building will not be affected by water levels, and is protected by a flood wall. The pavilionwall and provides for easier access to the casino for customers andthan the riverboat. Although we anticipate it will bringare operating efficiencies and cost savings. Wefewer slot machines from the pavilion than we were from the riverboat, we have not experienced a negative impact on results following the move to the pavilion and have had a positive reaction from customers. The riverboat and barge were removed in February 2023.
Caruthersville Land-Based Casino and Hotel
In July 2021, the Missouri law requiring each casino to be a floating facility was amended to allow casino facilities to be built as a standardWe are building with a container with at least 2,000 gallons of water beneath the facility. A lawsuit was filed by the City of St. Louis that sought to block the implementation of the omnibus bill that included the amendment to the definition of a floating facility. In June 2022, the Missouri governor signed a standalone bill to amend the definition of a floating facility. This change provides an opportunity for Century Casino Caruthersville to move to a non-floating facility. In November 2022, the court ruled in our favor in the lawsuit brought by the City of St. Louis. We plan to build a new land-based casino with a 38-room38 room hotel in Caruthersville adjacent to and broke ground on this development in December 2022. The casino at Century Casino Caruthersville will offer over 600 slot machines (with the possibility of an expansion of up to 140 additional slot machines), table games, a restaurant, and a bar. The hotel will be located in a hotel tower betweenconnected with the existing casino pavilion and the new casino. The new casino and hotel are expected to open in late 2024, subject to final regulatory approval from the MGC as well as other state and local approvals.building. We estimate the project will cost $51.9 million. To financeConstruction started in December 2022 with completion expected in the Caruthersvillefourth quarter of 2024. We are funding this project we entered into an amendment to the Master Lease withthrough financing provided by VICI PropCo. Following completion, VICI PropCo will own the real estate improvements associated with the Caruthersville project, which will become part of the Master Lease. See Part I, Item 2. “Properties – Master Lease” for a discussion of the Master Lease as amended to date. As of December 31, 2023, we have received $40.1 million from VICI PropCo and have spent approximately $20.7 million of those funds on this project. As of December 31, 2022, we have spent $2.2 million on this project and received $5.0 million from VICI PropCo.
Caruthersville Hotel
In July 2021, we announced that2023, we had purchased land and a small two-story hotel near Century Casino Caruthersville with plans to refurbish the existing hotel’s 36 rooms. The completely renovated hotel called The Farmstead openedapproximately $19.4 million of cash on October 30, 2022 with a grand opening held in December 2022. The total cost ofhand that was previously funded by VICI PropCo but has not yet been spent on the project was $3.6 million.on our consolidated balance sheet.
Cape Girardeau Hotel
We plan to buildare building a 69-room69 room hotel at our Cape Girardeau location.location called The hotelRiverview. The Riverview is planned as a six-story building with 68,000 square feet that will be adjacent to and connected with the existing casino building. The hotel project has been approved by the City of Cape Girardeau. Construction on this project began in September 2022 and is expected to be completed in the first half ofApril 2024. We estimate the project will cost $30.5 million, and we plan to finance this costare financing the project with cash on hand. As of December 31, 2022,2023, we have spent $2.8approximately $22.8 million on this project. We expect the remaining $7.7 million will be spent in the first half of 2024.
Additional Projects
We currently are exploringcontinue to explore additional potential gaming projects and acquisition opportunities. Along with the capital needs of potential projects or acquisitions, there are various other risks which, if they materialize, could affect our ability to complete a proposed project or acquisition or could eliminate its feasibility altogether. For more information on these and other risks related to our business, see Item 1A, “Risk Factors” below.
Terminated Projects
Cruise Ship Concession Agreements
We previously operated several ship-based casinos. Our last concession agreement to operate ship-based casinos ended on April 16, 2023. The table below illustrates the ships operating during the years ended December 31, 2023, 2022 and 2021.
|
|
|
Ship | Operated From | Operated To |
Mein Schiff Herz | April 5, 2022 | April 16, 2023 |
Mein Schiff 6 | June 11, 2021 | April 18, 2022 |
Century Casino Calgary and Century Sports
In August 2020,We owned land and a building in Calgary in which we announced that weoperated Century Sports, a sports bar, bowling and entertainment facility. We had entered into an agreement to sellpreviously sold the casino operations of Century Casino Calgary for CAD 10.0 million ($7.5 million based on the exchange rate on August 5, 2020) plus a three year quarterly earn out as specifiedat this location in the agreement. The transaction closed on December 1, 2020. During the first quarter of 2021, we paid CAD 0.1 million ($0.1 million based on the exchange rate on February 12, 2021) in working capital adjustments under the purchase agreement. Upon closing of the transaction, we2020 and entered into a three year lease agreement with the purchaser of the casino operations for annual net rent for the land and building of CAD 0.5 million ($0.4 million based on the exchange rate on December 31, 2022)2023).
After the sale, we continued to operate Century Sports, and to own the underlying real estate. On February 10, 2022, we sold the land and building in Calgary for CAD 8.0 million ($6.3 million based on the exchange rate on February 10, 2022) at which time we transferred the lease agreement for the casino premises to the buyer and ceased operating Century Sports.
The definitive agreement to sell the casino operations of Century Sports was includedCasino Calgary provided for a three year quarterly earn out that ended on August 4, 2023. We received earn out payments of CAD 2.2 million ($1.7 million based on the exchange rate on December 31, 2023) and CAD 0.1 million ($0.1 million based on the exchange rate on December 31, 2021) for the years ended December 31, 2023 and 2021, respectively, that are recorded to gain on sale of casino operations in the Canada reportable segment.our consolidated statement of (loss) earnings. There were no earn out payments in 2022.
Mendoza Central Entretenimientos S.A. (“MCE”)
In November 2021, our subsidiary CRM sold its ownership of 7.5% of MCE for nominal consideration. In addition, the consulting services agreement between CRM and MCE, under which CRM provided advice on casino matters and received a service fee from MCE, has beenwas terminated. See Note 1 to the Consolidated Financial Statements included in Part II, Item 8, “Financial Statements and Supplementary Data” of this report for additional information about MCE.
Bermuda
In August 2017, we announced that we had entered into a long-term casino management agreement with the owner of the Hamilton Princess Hotel & Beach Club in Hamilton, Bermuda. We would also provide a $5.0 million loan for the purchase of casino equipment if the gaming license was awarded. In January 2023, the management and funding agreements were mutually terminated because the project was not going forward.
Century Casino Bath (“CCB”)
In March 2020, CCB was closed due to COVID-19. Due to challenging conditions that included historical and forecasted losses due to changes in the regulatory environment for casinos in England requiring enhanced due diligence of customers, CCB’s board of directors determined that it would enter into creditors voluntary liquidation and control of CCB was relinquished. We deconsolidated CCB effective as of May 6, 2020. The process of voluntary liquidation was completed in October 2022 and CCB was dissolved. See Note 1 to the Consolidated Financial Statements included in Part II, Item 8, “Financial Statements and Supplementary Data” of this report for further discussion of CCB.
Capital Needs, Uses and Cash Flow
As a gaming company, our operating results are highly dependent on the volume of customers at our casinos and customer spending. Most of our revenue is essentially cash-based, through customers wagering with cash or paying for non-gaming services with cash or credit cards. Our industry is capital intensive, and we rely heavily on the ability of our casinos to generate operating cash flow to maintain operations, fund reinvestment in existing properties for both refurbishment and expansion projects, repay third party debt, and pursue additional growth via new development and acquisition opportunities. When necessary and available, we supplement the cash flows generated by our operations with either cash on hand or funds provided by bank borrowings or other debt or equity financing.
Marketing and Competition
We face intense competition from other casinos within the jurisdictions in which we operate. Many of our competitors are larger and have substantially greater name recognition and financial and marketing resources than we do. We seek to compete through promotion of our players’ clubs, enhancement of social networking initiatives and other marketing efforts. In addition to our players’ clubs, we also have various cash and prize promotions and market our casinos through a variety of media outlets including internet, television, radio, print and billboard advertising.promotions. Our marketing focuses on competition and other facts and circumstances of each market area in which we operate. Our primary marketing strategy centers on attracting new customers and rewarding repeat customers through our players’ club programs. All visitors to our properties are offered the opportunity to join our players’ club. We maintain a proprietary database that consists primarily of slot machine customers that allows us to create effective targeted marketing and promotional programs, point incentives, cash and merchandise giveaways, coupons, downloadable promotional credits, preferred parking, food, lodging, game tournaments and other special events. In the United States, our players’ club cards allow us to update our database and track member gaming preferences, including, but not limited to, maximum, minimum, and total amounts wagered and frequency of visits. We have designed reward programs based on total amount wagered and frequency of visits to reward customer loyalty and attract new customers to our properties. Those who qualify for VIP status receive additional benefits compared to regular club membership, such as invitations to exclusive VIP events.
United States
ColoradoEast – Cripple Creek, Central City and Black Hawk are the only three cities in Colorado that allow gaming, exclusive of two Native American gaming operations in southwestern Colorado, and are located in historic mining towns dating back to the late 1800’s that have developed into tourist attractions. The casino operations in Black Hawk constitute a significant portion of the overall casino gaming market in Colorado (exclusive of the Native American gaming operations), with approximately 58% of the total gaming devices in Colorado and approximately 78% of total gaming revenue in Colorado in 2022. Central City and Black Hawk are located approximately one mile apart and compete with one another for market share. As a result, we view the two cities as one combined market servicing the Denver area. Black Hawk, which we believe does not maintain the same rigorous historical preservation standards as Central City, has been able to successfully attract major casino industry leaders with the ability to offer larger hotels, upscale dining facilities, performance centers and spa facilities.
No limit single bets at casinos and new casino games were approved and began on May 1, 2021. Some of our competitors may offer larger betting limits or certain games not offered by us, which could attract customers to those competitors. Sports wagering in Colorado became legal in May 2020. We have partnered with sports betting operators that are conducting sports wagering under each of the three Colorado master licenses for sports wagering held by our Colorado subsidiaries.
Our marketing objective for the casinos in Colorado is to create public awareness by positioning our casinos as the premier provider of personal service, convenient parking, the latest gaming products and superior food. In addition to our players’ clubs, we also have various cash and prize promotions and market our casinos through a variety of channels including radio, billboard, print and social media. Cripple Creek, Central City and Black Hawk currently have 12, six and 15 casinos operating, respectively. There are competitors in each city that offer covered parking and more hotel rooms, which may negatively impact our Colorado casinos, particularly during inclement weather and the peak tourist season. In Cripple Creek, a casino across the street from ours is undergoing an expansion. The expanded property could have a negative effect on CRC unless it stimulates increased revenue in the Cripple Creek market.
West Virginia – Mountaineer is located on the Ohio River bank at the northern tip of West Virginia’s northwestern panhandle approximately 30 miles from Pittsburgh International Airport and a one hour drive from downtown Pittsburgh. Mountaineer has four competitors within 50 miles;miles, two in Pennsylvania, one in West Virginia and one in Ohio. Sports betting in Ohio also impacts Mountaineer. Mountaineer is the area’s only full-service casino resort located on the Ohio River in the northern panhandle of West Virginia. We market this casino as a destination for year-round entertainment. Mountaineer primarily attracts customers from neighboring Ohio and from the greater Pittsburgh area. We market this casino as a destination for year-round entertainment. Mountaineer also hosts the annual West Virginia Derby horse racing event. We have partnered with two sports betting operators and two iGaming partners in West Virginia.
MissouriRocky Gap has five competitors within 80 miles; four in Pennsylvania and one in West Virginia. Rocky Gap is the only AAA 4-Diamond Award® casino resort in western Maryland and operates the only Jack Nicklaus Signature Golf Course in the state of Maryland. Rocky Gap attracts customers from southwest Pennsylvania including Pittsburgh, Maryland including Baltimore, eastern West Virginia, and northern Virginia.
Midwest –
Cape Girardeau and Caruthersville have competitors in Missouri, Arkansas and Illinois. The distance between our Cape Girardeau and Caruthersville properties is 85 miles. While our two properties share a small portion of our customer database, we do not believe that our properties compete against one another for customers. We market our casinos as the premier providers of personal service. In addition to our players’ clubs, our casinos motivate customers by offering various cash and prize promotions, point incentives, and tournaments in addition to other incentives. Our casinos are marketed through a variety of channels including but not limited to radio, billboard, print and social media. Cape Girardeau includes an event center and draws customers mostly from within a 50-mile radius from the property.any material way. The closest competitor to Cape Girardeau is located 60approximately 56 miles away in southern Illinois. A potential casinoThis new competitor opened in southern Illinois approximately 56 miles from Cape Girardeau, whichAugust 2023. While we expectsaw a small decline in revenue and customer visits in the first few weeks of the competitor’s operations, we believe that our marketing efforts have been effective in offsetting this competition to open in mid-2023, could increase competition at our Cape Girardeau casino. Caruthersville includes a 27-space RV park.date. The majority of Caruthersville’s customers reside in Tennessee. The closest competitor to Caruthersville with the exception of our Cape Girardeau casino, is located in Arkansas and is 90 miles away. A casinoWe believe that our expansion projects at both Missouri locations will allow us to continue to compete for individuals or groups that location in Arkansas, which was completed at the end of 2022, could increase competition with our Caruthersville casino. In addition, theredesire a multi-day visit to Cape Girardeau or Caruthersville.
There is a proposal to build a casino near Lake of the Ozarks, which requires approval by the US Department of the Interior; however, that project is not expected to directly compete with our casinos asbecause it is over 200 miles from our properties.
Cripple Creek and Central City are located in historic mining towns each about an hour from a major metropolitan city. CRC has 11 competitors located within a half mile of the casino. CTL has 21 competitors within a mile of the casino, including competitors in Black Hawk that have larger hotels, upscale dining, performance centers and spa facilities. There are competitors in each city that offer covered parking and more hotel rooms, which may negatively impact our Colorado casinos, particularly during inclement weather and the peak tourist season. In addition, some of our competitors may offer larger betting limits or certain games not offered by us, which could attract customers to those competitors. We believehave partnered with sports betting operators that conduct sports wagering under each of the three Colorado master licenses for sports wagering held by our Colorado subsidiaries.
In Cripple Creek, a casino across the street from ours completed an expansion projects at both Missouri locations will allow usthe end of 2023. The expanded property could have a negative effect on CRC unless it stimulates increased revenue in the Cripple Creek market. There are two potential competing casinos that may open in the Central City, Colorado market in 2024. An increase in competitors could lead to competea decrease in visitors at our casino and have a negative impact on our results of operations in Central City.
West –
Nugget is located in the Reno-Sparks area of Nevada. There are eight other casinos within four miles of the Nugget. We market the casino through its amenities such as its high-end steak house and popular oyster bar. The property has over 1,300 hotel rooms for individuals or groupscasino guests as well as convention customers. In addition, the property has an outdoor arena that desire a multi-day visit to Cape Girardeau or Caruthersville.holds concerts, an annual Rib Cook-Off and other events, such as Hot August Nights.
Canada
Edmonton – CRA, St. Albert and Century Mile have five competitors, allOur casinos in the Edmonton market. The distance between CRA and CSA is approximately 13 miles, and CMR is approximatelymarket have five competitors. Our casinos within the Edmonton market are within 30 miles fromof each of CRA and CSA. Weother; however, we do not believe that our properties compete against one another for customers. Our main marketing activities for these properties focus on casino branding, promoting the racetrack, the player’s club program and promotions made through various marketing channels such as print, television, billboard, mail and social media. CRA is one of two casinos in the city of Edmonton that have both a hotel and showrooms. The property’s showrooms allow us to attract customers to the casino through live music concerts, private concerts, comedic performances, catering and banquet events. In addition, the property is the only casino in the Edmonton market to offer a heated and complimentary parking garage. CRA’s closestUnique to CMR is its horse racetrack. CRA and CSA each have a competitor is located approximately five miles away. St. Albert includes a small concertaway, and event venue. St. Albert’s closest competitor is located approximately five miles away. Century Mile is the only REC in the Edmonton area. Unique to this property is an 8.0 furlong (1.0 mile) horse racetrack. Century Mile’sCMR’s closest competitor is located approximately 17 miles away. CDR is located in the Calgary market and has seven competitors (two of which have a combination of hotel and casino). Unique to this property is its horse racetrack, and it is one of two casinos in the market with an off-track betting parlor. A casino recently relocated approximately eight miles from CDR, and the increased competition has had a negative impact on financial results at this location. In January 2022, the Alberta Gaming, Liquor and Cannabis Commission (“AGLC”) removed its moratorium on approving additional gaming facilities. Additional gaming facilities under consideration will be subject to market analysis done by the AGLC and, if approved by the AGLC, could increase competition with our properties.
Calgary - Century Downs has seven competitors (two of which have a combination of hotelOur main marketing activities for these properties focus on casino branding, promoting the racetracks, the player’s club program and casino) in the Calgary market. Unique to this property is a 5.5 furlong (0.7 mile) horse racetrack. Our casino is one of two casinos in the market with an off-track betting parlor. Using numerous forms of media, such as radio, television and billboards, we concentrate ourpromotions made through various marketing on the casino floor, the players’ club and racetrack. This property is located one mile north of the city limits of Calgary, one mile from the CrossIron Mills Mall and seven miles from Calgary International Airport. A casino recently relocated approximately eight miles from Century Downs, which could present significant competition. In addition, due to the AGLC’s removal of its moratorium on approving additional gaming facilities, new gaming facilities may be approved by the AGLC, which could increase competition with our property.
Pari-mutuel networks – Century Mile is the exclusive operator of the Alberta pari-mutuel network. In addition to permitting customers to place wagers at off-track betting locations, the network offers advance deposit wagering for online wagering.
Loyalty program – channels. Our casinos in Alberta participate in the Winner’s Edge, an Alberta-wide casino loyalty program implemented by the AGLC. Players who sign up for the program can earn points that can be redeemed for free play, take part in monthly contests and receive discounts on food in casino restaurants. Our casinos offer Winner’s Edge in addition to our own loyalty program.
Online gaming – Beginning in April 2024, Alberta casinos will be sharing in an AGLC Winner’s Edge Marketing Fund based on Winner’s Edge player card usage. In October 2020, the AGLC launched an online gaming website, “Play Alberta” offering online slot and table games. In September 2021, the AGLC added online sports wagering, including single event sports wagering, to its “Play Alberta” website. The website competes primarily with unregulated online gaming websites that are currently available to Alberta residents. We have not experienced a negative impact to our results of operations in Canada from online gaming; however, increased competition from online gaming could occur and adversely affect our results of operations in Alberta in the future.
CMR operates the majority of the Alberta pari-mutuel network and is the exclusive operator for its home market area covering Edmonton, Calgary and their respective surrounding areas. In addition to permitting customers to place wagers at off-track betting locations, the network offers advance deposit wagering for online wagering.
Poland
There are 5251 casino licenses available throughout Poland. The Polish government generally forbids the marketing of gaming activities outside of a casino, but the marketing of entertainment is permissible. CPL relies on the locations of its casinos, which are primarily in hotels in major cities throughout Poland, to attract customers. The Polish government issues casino licenses in Poland by district, and there are additional casinos in each district in which CPL operates. For example, five other casinos in the Warsaw district compete with our three casinos operating in Warsaw. The Polish Minister of Finance does not disclose individual casino data. Poland also has slot arcades and online gaming that operate through a state-run company. We have not experienced a negative impact to our results of operations in Poland from slot arcades or online gaming; however, increased competition from slot arcades that are located in the cities in which our casinos are located as well as online gaming could occur and adversely affect our results of operations in the future.
Seasonality
United States – Our casinos in Colorado attract more customers during the warmer months from May through September. We expect to attract fewer customers from October through April because weather conditions during this period are variable and can have a significant impact on daily business levels. In West Virginia, we attract more customers from March to August during the racing season. Our casinos in Missouri attract customers throughout the year with the highest business volumes in February and March. In Nevada, we attract more customers in the summer months because of outdoor concerts and events that take place in immediate proximity to the casino. In Maryland, we also attract more customers in the summer months due to the golf course and the location of the casino adjacent to Lake Habeeb and the outdoor activities surrounding it. At all of our United States properties, winter weather conditions may have an adverse impact on daily business levels.
Canada – Prior toCanada generally attracts a steady influx of customers throughout the COVID-19 closures, our casinos in Alberta, Canada attracted more customers from September through April. During the late spring and summer months there is more competition with outdoor activities. Conversely,calendar year. However, both Century Downs and Century Mile attract additional customers during the summer months of the racing season.season as Alberta residents partake in more outdoor activities. Our off-track betting parlors attract more customers during the peak racing season from May through August. However, we have seen less seasonality since our properties reopened in mid-2021.
Poland – CPL generally attracts more customers from October through March because domestic customers generally vacation during the summer months.
Governmental Regulation and Licensing
The ownership and operation of casino gaming facilities are subject to extensive state, local, foreign, provincial or federal regulations. We are required to obtain and maintain gaming licenses in each of the jurisdictions in which we conduct gaming operations. The limitation, conditioning, suspension, revocation or non-renewal of gaming licenses, or the failure to reauthorize gaming in certain jurisdictions, would materially adversely affect our gaming operations in that jurisdiction. In addition, changes in laws that restrict, prohibit or permit gaming operations in any jurisdiction, including the removal of the AGLC’s moratorium on approving additional gaming facilities, could have a material adverse effect on our financial position, results of operations and cash flows. On February 28, 2023, the AGLC approved a temporary increase from the current 15% of slot machines net sales retained by casinos to 17% effective from April 1, 2023 through March 31, 2025. The increase in the slot machine net sales is expected to havepercentage had a positive impact on net operating revenue and results of operations at our Canadian properties.
Statutes and regulations can require us to meet various standards relating to, among other matters, business licenses, registration of employees, floor plans, background investigations of licensees and employees, historic preservation, building, fire and accessibility requirements, payment of gaming taxes, and regulations concerning equipment, machines, chips, gaming participants, and ownership interests. Civil and criminal penalties, including shutdowns or the loss of our ability to operate gaming facilities in a particular jurisdiction, can be assessed against us and/or our officers to the extent of their individual participation in, or association with, a violation of any of the state or local gaming statutes or regulations. Such laws and regulations apply in all jurisdictions in which we may do business. Management believes that we are in compliance with all applicable gaming and non-gaming regulations. A detailed description of the regulations to which we are subject is contained in Exhibit 99.1 to this report, which is incorporated herein by reference.
Other Regulations
We are subject to certain foreign, federal, state, provincial and local safety and health, employment and environmental laws, regulations and ordinances that apply to our non-gaming operations. We have not made, and do not anticipate making, material expenditures with respect to these laws, regulations and ordinances. However, the coverage of, and attendant compliance costs associated with, such laws, regulations and ordinances may result in future additional costs to our operations.
Rules and regulations regarding the service of alcoholic beverages are strict. The loss or suspension of a liquor license could significantly impair our operations. Local building, parking and fire codes and similar regulations also could impact our operations and any proposed development of our properties.
We also deal with significant amounts of cash in our operations and are subject to various reporting and anti-money laundering laws and regulations. Any violations of anti-money laundering laws or regulations by any of our properties could have an adverse effect on our business.
Employees and Human Capital
Employees – As of December 31, 2022,2023, we had approximately 2,2923,243 full-time employees and 512910 part-time employees. During busier months, a casino may supplement its permanent staff with seasonal employees. We reduced our staffing during 2020 and 2021 in response to the COVID-19 pandemic closures and related issues. We have experienced difficulties attracting and retaining staff at some locations in the US and Canada. As a result, we have had to adjust hours of some food and beverage outlets, the number of table games open and the number of rooms available at some of our hotels. While our employee counts remain below pre-COVID-19 levels and we have open positions throughout North America, weWe consider our current staffing levels as normal due to a combination of increased efficiencies and the changes discussed above.normal. Approximately 250252 employees at our CPL casinos in Poland, and 4442 employees at Mountaineer and 217 employees at Rocky Gap belong to trade unions. The trade unions in Poland do not currently have any collective bargaining agreements with CPL, but changes in pay of union employees at CPL require approval of the unions. The trade unions at Mountaineer and Rocky Gap have collective bargaining agreements with Mountaineer.each casino.
Human Capital – Our company is led by two gaming industry professionals with a combined industry experience of more than 75 years. Due to extensive industry experience, the team’s diversity of experience gives us the ability to tailor our gaming-based entertainment developments and operations to the unique needs and circumstances of each specific location. We are aware that much of our success is based on our employees’ combined talents, skills and ideas. As an international casino entertainment company, we cater to very different markets with different customer expectations. In order to meet these expectations, we strive to build a workforce that is as diversified as our customers. As of December 31, 2022, 50%2023, 49% of our workforce and 37%41% of our leadership roles were held by women.
Focusing on employee development and creating a positive work environment is one of our main priorities. We have training and development programs to provide our employees with the opportunity to succeed and thrive at our company. We seek to provide upward and lateral movement to employees at all locations. In Missouri, for example, we have an Upward Mobility Program to provide front-line employees with information on how they can develop their leadership skills and be prepared to step into a leadership role. This program makes training and educational opportunities available to enhance qualification and permit progress into other career fields through mentorships.
As a company, we strive to be community leaders and to add value through our products, services, social responsibility and sharing of our financial and human resources to achieve a positive impact on our employees, their families and our fellow citizens. We have committed to supporting the local communities with their requests and needs in an effort to improve the lives of people in these communities. We seek to disburse contributions fairly among several charitable and non-profit organizations. Our management is confident that through working with charitable and non-profit organizations we are able to make a positive difference to the lives of people living in the communities in which we have operations. Our initiatives include donation boxes on the casino floors, volunteer events, fundraising drives, event sponsorships and charity events. Unique to Alberta, Canada is the charitable gaming model in which charitable organizations are licensed to conduct and manage casino events at our casinos.
Information about our Executive Officers
|
|
|
Name
| Age
| Position Held
|
Erwin Haitzmann
| 69
| Chairman of the Board and Co-Chief Executive Officer
|
Peter Hoetzinger
| 60
| Vice Chairman of the Board, Co-Chief Executive Officer and President
|
Margaret Stapleton
| 61
| Chief Financial Officer and Corporate Secretary
|
Timothy Wright
| 52
| Chief Accounting Officer and Corporate Controller
|
Andreas Terler
| 53
| Managing Director of Century Resorts Management GmbH and
Executive Vice President
|
Nikolaus Strohriegel
| 53
| Managing Director of Century Resorts Management GmbH and
Executive Vice President
|
Geoff Smith
| 52
| Senior Vice President, Operations - Canada
|
Erwin Haitzmann holds a Doctorate and a Masters degree in Social and Economic Sciences from the University of Linz, Austria (1980), and has extensive casino gaming experience ranging from dealer through various casino management positions. Dr. Haitzmann has been employed full-time by us since 1993 and has been employed as either Chief Executive Officer or Co-Chief Executive Officer since March 1994.
Peter Hoetzinger received a Masters degree from the University of Linz, Austria (1986). He thereafter was employed in several managerial positions in the gaming industry with Austrian casino companies. Mr. Hoetzinger has been employed full-time by us since 1993 and has been Co-Chief Executive Officer since March 2005.
Margaret Stapleton was appointed Chief Financial Officer, effective October 2019, and Corporate Secretary, effective May 2010. She holds a Bachelor of Science degree in Accounting from Regis University, Denver, Colorado (2004) and has over 30 years of experience in corporate accounting and internal audit. Mrs. Stapleton previously served as our Director of Internal Audit and Compliance from 2005 until May 2010 and as our Executive Vice President, Principal Financial/Accounting Officer from May 2010 to October 2019.
Timothy Wright was appointed Chief Accounting Officer effective October 2019 and Corporate Controller effective May 2010. Mr. Wright holds a Bachelor of Science degree in Accounting from the University of Colorado, Colorado Springs, Colorado (1995) and has over 30 years of experience in corporate accounting and finance. Mr. Wright has been employed by us since 2007, including previously serving as our Vice President of Accounting from May 2010 to October 2019.
Andreas Terler is a Graduate Engineer in Applied Mathematics from the University of Graz, Austria (1994). Mr. Terler has been employed by us since 2006. He has served as Managing Director of CRM since February 2007 and Executive Vice President since February 2022. Mr. Terler previously served as Vice President of Operations from May 2011 to October 2019, Chief Information Officer from February 2006 to January 2022 and Senior Vice President, Operations – Missouri and West Virginia from October 2019 to February 2022.
Nikolaus Strohriegel received a Masters degree from the University of Vienna, Austria (1996). Mr. Strohriegel has been employed by us since 2007. He has served as Managing Director of CRM since January 2009 and Executive Vice President since February 2022. Mr. Strohriegel previously served as Vice President of Operations from March 2017 to October 2019 and Senior Vice President, Operations – Europe from October 2019 to February 2022.
Geoff Smith holds an Honours Bachelor of Commerce degree from the University of Windsor, Ontario, Canada (1994). Mr. Smith has over 28 years of direct casino management experience across a variety of regulated gaming jurisdictions and operating models, including commercial casinos, charity casinos and horse racetrack casino establishments. Mr. Smith has been employed by us since 2006. He was appointed Senior Vice President, Operations – Canada in October 2019. He previously served as the General Manager of Century Casino & Hotel in Edmonton from 2006 to 2008 and Managing Director of Century Casino & Hotel in Edmonton from 2008 to 2019.
Available Information
Our internet address is www.cnty.com.www.cnty.com. Our annual reports on Form 10-K, quarterly reports on Form 10-Q, current reports on Form 8-K and amendments to these reports filed or furnished pursuant to Section 13(a) or 15(d) of the Exchange Act are made available free of charge on our website at www.cnty.com/investor/financials/sec-filings as soon as reasonably practicable after such report has been filed with, or furnished to, the SEC. None of the information posted to our website is incorporated by reference into this report.
Item 1A. Risk Factors.
Our short and long-term success is subject to many factors beyond our control. If any of the following risks, or any risks described elsewhere in or incorporated by reference in this report, actually occur, our business, financial condition or results of operations could suffer. Additional risks not presently known to us or which we currently consider immaterial may also adversely affect our business, financial condition or results of operations.
Business Environment and Competition Risks
GeneralWe are particularly sensitive to general economic conditions, downturns or recessions as well as other issues affecting discretionary consumer spending, including geopolitical tensions, pandemics or other public health emergencies, any of which may have an adverse impact on our business, financial condition or results of operations.
Our success depends to a large extent on discretionary consumer spending, which is heavily influenced by general economic conditions and the availability of discretionary income. Adverse changes in the economic climate,macroeconomic conditions, including inflation, higher unemployment rates, declineseconomic contraction, economic uncertainty or the perception by our customers of weak or weakening economic conditions may cause a decline in income levels and loss of personal wealth resulting from business shutdowns and associated mass layoffs by businesses, and the adoption of social distancingdemand for casino resorts and other policies to slowamenities we offer. Changes in discretionary consumer spending or control the spreadconsumer preferences could be driven by factors such as an unstable job market, perceived or actual disposable consumer income and wealth, increased cost of futuretravel, outbreaks of coronavirus, COVID-19contagious diseases or fears or war and acts of terrorism or other health-affecting outbreaks, have had and are likely to continue to have a negative impact on demand for casinos, including ours, and these impacts could exist for an extensive periodacts of time. In addition, the Russia-Ukraine war could negatively impact our results of operations in Poland, which neighbors Ukraine, due to the potential impacts on tourism and other economic disruptions.violence. Difficult economic conditions and recessionary periods may have an adverse impact on our business and our financial condition. Negative economic conditions, coupled with high volatility and uncertainty as to the future economic landscape, have at times had a negative effect on consumers’ discretionary income and consumer confidence, and similar impacts can be expected should such conditions recur. A decrease in discretionary spending due to decreases in consumer confidence in the economy or us, or a continued economic slowdown or deterioration in the economy, could adversely affect the frequency with which customers choose to visit our properties and the amount that our customers spend when they visit. The actual or perceived weakness in the economy could also lead to decreased spending by our customers. Both customer visits and customer spending at our casinos are key drivers of our revenue and profitability, and reductions in either could materially adversely affect our business, financial condition and results of operations.
We face significant competition, and if we are not able to compete successfully, our results of operations will be harmed.
We face intense competition from other casinos in jurisdictions in which we operate and from casinos in neighboring jurisdictions. Many of our competitors are larger and have substantially greater name recognition and financial and marketing resources than we do. We seek to compete through promotion of our players’ clubs and other marketing efforts. For example, for CRA, we emphasize the casino’s showroom, complimentary heated parking, players’ club program, and superior service. These marketing efforts may not be successful, which could hurt our competitive position.
The markets in which we operate generally rely on a local customer base as well as tourists during peak seasons. The number of casinos in some of our markets may exceed demand, which could make it difficult for us to sustain profitability. We are particularly vulnerable to competition in our markets due to the large number of competitors in those markets. New or expanded operations by other entities in any of the markets in which we operate will increase competition for our gaming operations and could have a material adverse impact on us. For example, there are new casinos and expansions of existing casinos that could increase competition for our Central City and Cripple Creek properties. In January 2022, the AGLC removed the moratorium on gaming facilities. Consideration for additional gaming facilities will be based on a market analysis done by the AGLC. We anticipate the AGLC may award gaming facility licenses in underserved rural areas outside of the urban Calgary and Edmonton markets in which we are located, but any additional competition could adversely impact our results of operations in Alberta.
Changes to gaming laws in countries or states in which we have operations and in states near our operations could increase competition and could adversely affect our operations. For example, we have seen a decrease in gaming revenue in West Virginia, particularly in table games, since sports betting in Ohio began at the beginning of 2023. Any such expansion of legalized gaming could adversely impact our properties.
There have been several bills filed in Missouri to legalize sports betting in the state by gaming licensees and for daily fantasy sports licensees to conduct sports wagering including on mobile devices as long as such devices are located within the state. There have also been several bills filed in Missouri to allow the state lottery to operate video gaming terminals. Similar bills introduced in the past have not passed the state legislature. In addition to these legislative efforts, a coalition of six major sports teams and two online sports wagering companies have launched an initiative petition campaign to put sports wagering on the 2024 ballot. If the petition drive is successful, voters across the state would then determine whether to amend the state constitution to allow sports wagering. Under the proposed constitutional amendment, each of the six sports franchises that play in arenas that seat 11,500 or more would be eligible for a license to receive bets on games, player performance and other elements of a contest with a variable outcome. Companies that operate Missouri’s 13 casinos, including us, would also be eligible for a license, along with two online platforms with no physical presence in the state. It is unclear what impact these changes would have on our casinos in Missouri if enacted, but they could be material.
Capital expenditures, such as those for new gaming equipment, room refurbishments and amenity upgrades may be necessary from time to time to preserve the competitiveness of our properties. If we are unable to make these improvements due to capital constraints or other factors, our facilities may be less attractive to our visitors than those of our competitors, which could have a negative impact on our business.
We may experience construction delays and increased costs during our expansion or development projects, including the development and construction costs associated with the projects in Missouri, which could adversely affect our operations.
From time to time we may commence construction projects at our properties. Construction on the projects in Missouri began in 2022 and is expected to be completed in mid to late 2024. We may engage in additional construction projects in the future. Construction projects entail significant risks, which can substantially increase costs or delay completion of a project. Most of these factors are beyond our control.
Our current and future projects could also experience:
failure to obtain necessary licenses, permits, entitlements or other governmental approvals;
changes to plans and specifications, some of which may require the approval of regulatory agencies;
delays and significant cost increases;
shortages of materials;
shortages of skilled labor, labor disputes, or work stoppages for contractors and subcontractors;
labor disputes or work stoppages;
disputes with and defaults by contractors and subcontractors;
health and safety incidents and site accidents;
engineering problems, including defective plans and specifications;
poor performance or nonperformance by our partners or other third parties on whom we place reliance;
changes in laws and regulations, or in the interpretation and enforcement of laws and regulations, applicable to gaming and other facilities, real estate development or construction projects;
unforeseen construction scheduling, engineering, environmental, permitting, construction or geological problems;
environmental issues, including the discovery of unknown environmental contamination;
weather interference, floods, fires or other casualty losses; and
other unanticipated circumstances or cost increases.
The occurrence of any of these development and construction risks could increase the total costs of our construction projects or delay or prevent the construction or opening or otherwise affect the design and features of our construction projects. This could
materially adversely affect our plan of operations, financial condition and ability to satisfy our debt obligations. In addition, construction at our operating casinos may disrupt our customers’ experience and cause a decline in our revenue.
Actual costs and construction periods for any of our projects can differ significantly from initial expectations. We can provide no assurance that we will complete any project on time, if at all, or within established budgets, or that any project will result in increased earnings to us. If our initial budgets are not accurate, we may need to pursue additional financing to complete a proposed project, which may not be available on favorable terms or at all. Cost overruns on any construction projects we undertake may adversely impact our results of operations.
We may seek to expand through investments in other businesses and properties or through alliances or acquisitions, and we may also seek to divest some of our properties and other assets, any of which may be unsuccessful.
As part of our business strategy, we regularly evaluate opportunities for growth and expansion through development of gaming operations in existing or new markets, through acquiring other gaming facilities, through redeveloping our existing gaming facilities, and through joint ventures in new markets. We cannot be sure that we will be able to identify attractive acquisition opportunities or that we will experience the return on investment that we expect. Acquisitions require significant management attention and resources to integrate new properties, businesses and operations. There can be no assurance that we will be able to identify, acquire, develop or profitably manage additional companies or operations or successfully integrate such companies or operations, into our existing operations without substantial costs, delays or other problems. The pending Nugget Acquisition and Rocky Gap Acquisition and newNew developments may not generate revenue that will be sufficient to pay related expenses, or, even if such revenue is sufficient to pay related expenses, the acquisitions and new developments may not yield an adequate return or any return on our significant investments. In addition, generating returns on acquisitions including the Nugget Acquisition and the Rocky Gap Acquisition, and new investments may take significantly longer than we expect and may negatively impact our operating results and financial condition. Furthermore, we may pursue any of these opportunities in alliance with third parties.
We may not be successful in obtaining the rights to develop new casino properties, and as a result, we may incur significant costs for which we will receive no return. Even if we are successful in obtaining the rights to develop such casino properties, commencing operations at new casino projects may require substantial development capital. Additional risks before commencing operations include the time and expense incurred and unforeseen difficulties from construction delays and cost overruns, in obtaining liquor licenses, building permits, materials, competent and able contractors, supplies, employees, gaming devices and related matters.
In addition, acquisitionsAcquisitions require significant management attention and resources to integrate new properties, businesses and operations. There can be no assurance that we will be able to identify, acquire, develop or profitably manage additional companies or operations or successfully integrate such companies or operations into our existing operations without substantial costs, delays or other problems. Potential difficulties we may encounter as part of the integration process include:
the inability to successfully integrate acquired assets in a manner that permits us to achieve the full revenue and other benefits anticipated to result from the acquired operations;
complexities associated with managing the combined business, including difficulties addressing possible differences in cultures and management philosophies and the challenge of integrating complex systems, technology, networks and other assets of the company in a seamless manner that minimizes any adverse impact on customers, suppliers, employees and other constituencies;
potential unknown liabilities and unforeseen increased expenses associated with acquired operations;
diversion of the attention of our management;
the disruption of, or the loss of momentum in, our ongoing businesses; and
inconsistencies in standards, controls, procedures and policies;
any of which could adversely affect our ability to maintain relationships with customers, suppliers, employees and other constituencies or our ability to achieve the anticipated benefits, or could reduce our earnings or otherwise adversely affect our business and financial results.
We may pursue gaming opportunities that would require us to obtain a gaming license, such as the Nugget Acquisition and the Rocky Gap Acquisition.license. While our management believes that we are licensable in any jurisdiction that allows gaming operations, each licensing process is unique and requires a significant amount of funds and management time. The licensing process in any particular jurisdiction can take significant time and expense through licensing fees, background investigation costs, legal fees and other associated preparation costs. Moreover, if we proceed with a licensing approval process with industry partners, such industry partners would be subject to regulatory review as well. We seek to find industry partners that are licensable, but cannot assure that such partners will, in fact, be licensable. Certain licenses include competitive situations where, even if we and our industry partners are licensable, other factors such as the economic impact of gaming, financial and operational capabilities of competitors must be analyzed by regulatory authorities. In addition, political factors may make the licensing process more difficult. If any of our gaming license applications are denied or we are otherwise unable to complete a project, we may have to write off costs related to our investment in such application processes, which could be significant. In addition, our ability to attract and retain competent management and employees for any new location is critical to our success. One or more of these risks may result in any new gaming opportunity not being successful. If we are not able to successfully commence operations at these properties, our results of operations may be adversely affected.
In addition, we periodically review our business to identify properties or other assets that we believe no longer complement our business, are in markets that may not benefit us or could be sold at significant premiums. From time to time, we may attempt to sell these identified properties and assets. There can be no assurance, however, that we will be able to complete dispositions on profitable, commercially reasonable terms or at all.
We have certain properties that generate a significant percentage of our revenue and operating income, and our ability to meet our operating and debt service requirements is dependent, in part, upon the continued success of these properties.
We derived 52% of our net operating revenue and 68% of our earnings from operations from our properties in Missouri and West Virginia during the year ended December 31, 2022. Because our revenue and operating income are concentrated in two states, we are subject to greater risks from regional conditions than a gaming company with operating properties in a greater number of different geographic regions. Therefore, a decrease in revenue from, or an increase in costs for, one of these locations is likely to have a greater impact on our business and operations than it would for a gaming company with more geographically diverse operating properties. The cash flow from these properties services our Master Lease entered into with subsidiaries of VICI PropCo in connection with the 2019 Acquisition and our other debt service requirements, and our ability to meet our operating and debt service requirements is dependent, in part, upon the continued success of these properties.
We face significant competition, and if we are not able to compete successfully, our results of operations will be harmed.
We face intense competition from other casinos in jurisdictions in which we operate and from casinos in neighboring jurisdictions. Many of our competitors are larger and have substantially greater name recognition and financial and marketing resources than we do. We seek to compete through promotion of our players’ clubs and other marketing efforts. For example, for CRA, we emphasize the casino’s showroom, complimentary heated parking, players’ club program, and superior service. These marketing efforts may not be successful, which could hurt our competitive position.
The markets in which we operate are generally not destination resort areas and rely on a local customer base as well as tourists during peak seasons. The number of casinos in our markets may exceed demand, which could make it difficult for us to sustain profitability. We are particularly vulnerable to competition in our markets due to the large number of competitors in those markets. New or expanded operations by other entities in any of the markets in which we operate will increase competition for our gaming operations and could have a material adverse impact on us. For example, there are new casinos and expansions of existing casinos that could increase competition for our Cape Girardeau and Cripple Creek properties. A casino recently relocated closer to Century Downs that could present significant competition. In addition, in January 2023, sports betting began in Ohio, which will present additional competition for our Mountaineer casino. In January 2022, the AGLC removed the moratorium on gaming facilities. Consideration for additional gaming facilities will be based on a market analysis done by the AGLC. We anticipate the AGLC may award gaming facility licenses in underserved rural areas outside of the urban Calgary and Edmonton markets in which we are located, but any additional competition could adversely impact our results of operations in Alberta.
Changes to gaming laws in countries or states in which we have operations and in states near our operations could increase competition and could adversely affect our operations. Any such expansion of legalized gaming could adversely impact our properties. In Canada, a sports betting bill passed in August 2021 that removed the national prohibition on single-game sports betting and allows the Canadian provinces to regulate the industry. It is unclear what impact these changes will have on our Canadian casinos.
Potential changes in gaming laws in jurisdictions in which we have operations include:
In Missouri, several bills have been filed that would allow Class B gaming licensees and daily fantasy sports licensees to conduct sports wagering including on mobile devices so long as such devices are located within the state of Missouri. These bills are in the early stages of the law-making process and subject to significant changes in proposed statutory language prior to enactment.
In Missouri, a video lottery terminal bill would allow the state lottery to operate video gaming terminals, similar to slot machines, at various locations distributed across the state including bars, veterans and fraternal organizations and convenience stores throughout the state. This bill is in the early stages of the law-making process and subject to significant changes in proposed statutory language prior to enactment.
It is unclear what impact these changes will have on our casinos in these markets, but they could be material.
Capital expenditures, such as those for new gaming equipment, room refurbishments and amenity upgrades may be necessary from time to time to preserve the competitiveness of our properties. If we are not successful in making these improvements, our facilities may be less attractive to our visitors than those of our competitors, which could have a negative impact on our business.
Operational Risks
Our financial condition and results of operations may be adversely affected by climate change, the occurrence of severe weather, natural or man-made disasters and other catastrophic events, including war, terrorism and other acts of violence, and disease, such as the COVID-19 pandemic.
The operations of our facilities are subject to disruptions or reductions in the number of customers who visit our properties because of severe weather conditions. If weather conditions limit access to our casino properties or otherwise adversely impact our ability to operate our casinos at full capacity, our revenue will suffer, which will negatively impact our operating results. Extreme weather conditions, potentially exacerbated by climate change, may cause property damage or interrupt business, which could harm our business and results of operations. High winds, flooding, blizzards and sub-zero temperatures, such as those experienced in Colorado, Missouri and Alberta from time to time, can limit access to our properties. Extreme weather conditions may also interrupt the operations of critical suppliers, and may result in reduced availability or increased price volatility of certain critical supplies.
Events such as terrorist and war activities in the countries in which we are located and other acts of violence, such as the mass shooting in Las Vegas in 2017, could have a negative impact on travel and leisure expenditures, including gaming, lodging and tourism, especially if these events occur in a region in which we operate. The Russia-Ukraine war could have an adverse impact on our results of operations in Poland, which borders Ukraine, and the collateral global impacts of that situation could adversely impact our results of operations at all of our properties. We cannot predict the extent to which terrorism, security alerts or war, or other acts of violence in the countries that we operate will directly or indirectly affect our business and operating results, but the impact could be material.
An outbreak of a contagious disease, such as the COVID-19 pandemic or any similar illness, could have a negative impact on travel and leisure expenditures, including gaming, lodging and tourism, especially if an outbreak were to occur in or near the areas in which we operate. Negative impacts on the economy, travel restrictions and other restrictions by local or federal governments in the areas in which we operate could result in consumers reducing travel and leisure expenditures, including visits to our casinos. Actions taken to contain outbreaks in response to a public health epidemic pose the risk that we or our employees, suppliers, and other business partners may be prevented from conducting business activities for an unknown period of time. Our operating costs may increase due to additional health and safety requirements, and we may experience disruptions due to employee illness. Travel restrictions imposed by the US, European or other foreign governments may make it difficult or impossible for our management located in Europe to travel to the US or other countries where we have operations. We cannot predict the extent to which future outbreaks of a contagious disease will directly or indirectly affect our business and operating results, but the impact could be material.
The future impact of the COVID-19 pandemic, including its effect on the ability and desire of people to visit our properties, could impact our results, operations, outlooks, plans, goals, growth cash flows and liquidity. The extent of the effects of the outbreak on our business and the casino industry at large is highly uncertain and will ultimately depend on future developments, including, but not limited to, future recurrences of the outbreak, the continued availability and effectiveness of COVID-19 vaccines, and the length of time it takes for normal economic and operating conditions to resume, if at all. Even after the COVID-19 pandemic subsides, we could experience a longer-term impact on our costs, such as, for example, the need for enhanced health and hygiene requirements in one or more regions in attempts to counteract future outbreaks. Further, COVID-19 may also affect our operating and financial results in ways that are not presently known to us or that we currently do not consider present significant risks to our operations. Any of the foregoing could have a material adverse effect on our business, financial condition, results of operations and liquidity.
Difficulties in managing our worldwide operations may have an adverse impact on our business.
We derive our revenue principally from operations located on two continents. Our management is located in North America and Europe, and our worldwide operations pose risks to our business. Risks associated with international operations include:
fluctuations in foreign currency exchange rates;
changes in laws and policies that govern our foreign operations;
possible failure to comply with anti-bribery laws such as the US Foreign Corrupt Practices Act (“FCPA”) and similar anti-bribery laws in other jurisdictions;
difficulty in establishing staffing and managing non-United States operations;
different labor regulations;
changes in environmental, health and safety laws;
potentially negative consequences from changes in or interpretations of tax laws;
political instability and actual or anticipated military or political conflicts;
economic instability and inflation, recession or interest rate fluctuations;
uncertainties regarding judicial systems and procedures;
different time zones; and
culture, management and language differences.
These factors make it more challenging to manage and administer a globally-dispersed business and, as a result, we must devote greater resources to operating under several regulatory and legislative regimes (See “Governmental Regulation and Licensing” in Item 1, “Business” of this report). This business model also increases our costs.
Our insurance coverage may not be adequate to cover all possible losses that our properties could suffer, our insurance costs may increase and we may not be able to obtain the same insurance coverage in the future.
We may suffer damage to our property caused by a casualty loss (such as fire, natural disasters, acts of war, terrorism or other acts of violence) that could severely disrupt our business or subject us to claims by third parties who are injured or harmed. Although we maintain insurance customary in our industry, including property, casualty, terrorism, cybersecurity and business interruption insurance, that insurance is subject to deductibles and limits on maximum benefits, including limitations on the coverage period for business interruption. Due to these variables, we may not be able to fully insure such losses, or fully collect, if at all, on claims resulting from severe weather conditions. The lack of sufficient insurance for these types of acts could expose us to heavy losses if any damages occur, directly or indirectly, that could have a significant adverse impact on our operations.
We renew our insurance policies on an annual basis. The cost of coverage may become so high that we may need to further reduce our policy limits or agree to certain exclusions from our coverage or self-insure. Among other factors, regional political tensions, homeland security concerns, other catastrophic events or any change in government legislation governing insurance coverage for acts of terrorism could materially adversely affect available insurance coverage and result in increased premiums on available coverage (which may cause us to elect to reduce our policy limits), additional exclusions from coverage or higher deductibles. Among other potential future adverse changes, in the future we may elect to not, or may not be able to, obtain any coverage for losses due to acts of terrorism.
We are dependent upon technology services and electrical power to operate our business, and if we experience damage or service interruptions, we may have to cease some or all of our operations, resulting in a decrease in revenue.
Our gaming operations rely heavily on technology services and an uninterrupted supply of electrical power. Our security system and all of our slot machines are controlled by computers and reliant on electrical power to operate. A loss of electrical power or a failure of the technology services needed to run the computers would make us unable to run all or parts of our gaming operations. Any unscheduled interruption in our technology services or interruption in the supply of electrical power is likely to result in an immediate, and possibly substantial, loss of revenue due to a shutdown of our gaming operations. Although we have designed our systems around industry-standard architectures to reduce downtime in the event of outages or catastrophic occurrences, they remain vulnerable to damage or interruption from floods, fires, power loss, telecommunication failures, terrorist attacks, computer viruses, computer denial-of-service attacks and similar events. Additionally, substantial increases in the cost of electricity and natural gas could negatively affect our results of operations.
Our reputation and business may be harmed by cybersecurity breaches, and we may be subject to legal claims if there is loss, disclosure or misappropriation of or access to our customers', our business partners' or our own information or other breaches of our information security.
We make use of online services and centralized data processing, including through third party service providers. The secure maintenance and transmission of customer information, including credit card numbers and other personally identifiable information for marketing and promotional purposes, is a critical element of our operations. Our collection and use of personal data are governed by state and federal privacy laws as well as the applicable laws of the countries in which we operate. Various federal, state and foreign legislative or regulatory bodies may enact or adopt new or additional laws and regulations concerning privacy, data retention, data transfer, and data protection. For example, the European Union adopted the General Data Protection Regulation, which became effective in May 2018, that changed companies’ operational and compliance requirements and included significant penalties for non-compliance. Compliance with applicable privacy regulations may increase our operating costs or adversely impact our ability to market our products, properties and services to our guests.
Our information technology and other systems that maintain and transmit customer information, or those of service providers, or our employee or business information may be compromised by a malicious third party penetration of our network security, or that of a third party service provider or business partner, or by actions or inactions by our employees. As a result, information of our customers, third party service providers or business partners or our employee or business information may be lost, disclosed, accessed or taken without their or our consent. Non-compliance with applicable privacy regulations by us (or in some circumstances non-compliance by third parties engaged by us) or a breach of security on systems storing our data may result in a loss of customers and subject us to fines, payment of damages, lawsuits or restrictions on our use or transfer of data. The loss, disclosure or misappropriation of our business information may adversely affect our businesses, operating results and financial condition.
We face the risk of fraud, theft, and cheating.
We face the risk that gaming customers may attempt or commit fraud or theft or cheat in order to increase winnings. Such acts of fraud, theft or cheating could involve the use of counterfeit chips or other tactics, possibly in collusion with our employees. Internal acts of cheating could also be conducted by employees through collusion with dealers, surveillance staff, floor managers, or other casino or gaming area staff. Additionally, we also face the risk that customers may attempt or commit fraud or theft with respect to our non-gaming offerings or against other customers. Such risks include stolen credit or charge cards or cash, falsified checks, theft of retail inventory and purchased goods, and unpaid or counterfeit receipts. Failure to discover such acts or schemes in a timely manner could result in losses in our operations. Negative publicity related to such acts or schemes could have an adverse effect on our reputation, potentially causing a material adverse effect on our business, financial condition, results of operations, and cash flows.
We are subject to risks related to corporate social responsibility and reputation.
Many factors influence our reputation and the value of our brand, including the perceptions held by our customers, business partners, other key stakeholders and the communities in which we do business. Our business faces increasing scrutiny related to environmental, social and governance factors, and we risk damage to our reputation and the value of our brand if we fail to act responsibly in a number of areas including diversity and inclusion, community engagement and philanthropy, environmental sustainability, climate change, responsible gaming, supply chain management, workplace conduct, human rights and many others, some of which may be unforeseen. Any harm to our reputation could impact employee engagement and retention and the willingness of customers and our partners to do business with us, which could have a material adverse effect on our business, results of operations and cash flows.
Credit and Liquidity Risks
Our obligations under our indebtedness and our Master Lease are significant. We may not be able to generate sufficient cash to service all of our indebtedness and pay rent under the Master Lease and may be forced to take other actions to satisfy our obligations under our indebtedness and Master Lease, which may not be successful.
We have a significant amount of indebtedness. As of December 31, 2022,2023, our long-termoutstanding debt net of current portion and deferred financing costs excluding unamortized debt issuance costs, was approximately $366.4$346.8 million. The majority of our long-term debt outstanding as of December 31, 20222023 is variable rate debt. Each one percentage point change associated with the variable rate debt would result in an estimated $3.5 million change to our annual cash interest expenses. In connection with the 2019 Acquisition,addition, we entered into the Master Lease to lease the real estate assets of the 2019 Acquired Casinos.majority of our North American casinos under a Master Lease with VICI PropCo The long-term financing obligation to VICI Properties, Inc.PropCo subsidiaries was $284.9$658.0 million as of December 31, 2022.2023. Our scheduled 20232024 rent payments under the Master Lease, including a Consumer Price Index (“CPI”) increase, are approximately $27.5$52.2 million. Our rent payments are subject to annual escalation. See Notes 6 and 7 to the Consolidated Financial Statements included in Item 8, “Financial Statements and Supplementary Data” of this report for more information on our long-term debt and Master Lease. These
The significance of the above financial obligations could:
limit our ability to satisfy our obligations;
limit our ability to obtain additional indebtedness or financing to fund working capital requirements, capital expenditures, debt service, acquisitions, general corporate or other obligations;
limit our ability to use operating cash flow in other areas of our business because we must dedicate a significant portion of these funds to make principal and/or interest payments on our outstanding debt;
expose us to interest rate risk due to the variable interest rate on borrowings under our credit agreements;
place us at a competitive disadvantage compared to competitors that have less debt;
subject us to restrictive covenants that, among other things, limit our ability to pay dividends and distributions, make acquisitions and dispositions, borrow additional funds, and make capital expenditures and other investments;
cause our failure to comply with financial and restrictive covenants contained in our current or future indebtedness, which could cause a default under such indebtedness and which, if not cured or waived, could have a material adverse effect on us;
increase our vulnerability to general adverse economic and industry changes;
limit our flexibility in planning for, or reacting to, changes in our businesses, changing market conditions, changes in our industry and economic downturns; and
affect our ability to renew gaming and other licenses necessary to conduct our business.
We were required to make rent payments under the Master Lease during the temporary closures in 2020 of the casinos covered by the Master Lease. We also were required to make scheduled payments of interest and principal under our debt obligations during these closures. We could be required to make rent payments under the Master Lease and scheduled debt payments if such closures of our properties, similar to those that occurred in 2020, occur in the future. In addition, the Master Lease requires us to make specific minimum investments in capital expenditures and, subject to certain caps, the rent escalations under the Master Lease will continue to apply regardless of the cash flows generated by the properties subject to the Master Lease and the obligations guaranteed by us. Further, if our properties subject to the Master Lease are impacted by a casualty event, the Master Lease requires us to repair or restore the affected properties even if the cost of such repair or restoration exceeds the insurance proceeds that we receive. Under such circumstances, the rent under the Master Lease is required to be paid during the period of repair or restoration even if all or a portion of the affected property is not operating. We cannot assure that we will maintain a level of cash flows from operating activities sufficient to permit us to pay rent under the Master Lease and the principal, premium, if any, and interest on our indebtedness.
If our cash flows and capital resources are insufficient to fund our debt service and rent obligations, we may be forced to reduce or delay investments and capital expenditures, or to sell assets, seek additional capital or restructure or refinance our indebtedness. These alternative measures may not be successful and may not permit us to meet our scheduled debt service or rent obligations. If we are not able to meet our scheduled obligations, we could face substantial liquidity problems and might be required to dispose of material assets or operations to meet our debt service and other obligations. We may not be able to consummate those dispositions or to obtain the proceeds that we could realize from them, and these proceeds may not be adequate to meet any debt service obligations then due. Additionally, the agreements governing our existing debt restrict sale of assets and limit the use of the proceeds from any disposition and our Master Lease limits our ability to dispose of leased properties; as a result, we may not be allowed,
under these documents, to dispose of certain of our properties and use proceeds from such dispositions to satisfy all current debt service obligations.
We may be unable to obtain the capital necessary to fund our operations or potential acquisitions.
Our industry is capital intensive, and we rely heavily on the ability of our casinos to generate operating cash flow to repay debt financing, fund maintenance capital expenditures and provide excess cash for future development. While we have a significant amount of cash currently on hand, we may not be able to obtain funding when we need it on favorable terms or at all. If we are unable to finance our current or future expansion projects, we will have to adopt one or more alternatives, such as reducing or delaying planned expansion, development and renovation projects and capital expenditures, selling assets, restructuring debt, obtaining additional equity financing or joint venture partners, or modifying our bank credit facilities. The amount of capital that we are able to raise often depends on variables that are beyond our control, such as the share price of our stock and its trading volume. The availability of financing may be impacted by local, regional and global economic, credit and stock market conditions, all of which have been volatile. As a result, we may not be able to secure financing on terms attractive to us, in a timely manner or at all. If we are able to consummate a financing arrangement, the amount raised may not be sufficient to meet all of our future needs and, if it involves equity, may be highly dilutive to our stockholders. If we cannot raise adequate funds to satisfy our capital requirements, we may have to reduce, dispose of or eliminate certain operations.
SomeA majority of our casinos are located on leased property. If we default on one or more leases or if we are unable to secure renewals of those leases, the applicable lessors could terminate the affected leases and we could lose possession of the affected casino.
We lease the land and buildingsreal estate assets for our casinos in Missouri, and West Virginia, Maryland and Canada under a “triple-net” Master Lease. The real estate assets relating to Rocky Gap also will be owned by VICI PropCo and will be subject to the Master Lease. Accordingly, in addition to rent, we are required to pay, among other things, the following: (1) facility maintenance costs; (2) all insurance premiums for insurance with respect to the leased properties and the business conducted on the leased properties; (3) taxes levied on or with respect to the leased properties (other than taxes on the income of the lessor); and (4) all utilities and other services necessary or appropriate for the leased properties and the business conducted on the leased properties. We are responsible for incurring these costs notwithstanding the fact thateven though many of the benefits received in exchange for such costs shall in part accrue to the lessor as the owner of the associated facilities. In addition, we remain obligated for lease payments and other obligations under the Master Lease even if one or more of such leased facilities is not operating or is unprofitable or if we decide to withdraw from those locations. We could incur special charges relating to the closing of such facilities, including lease termination costs, impairment charges and other charges that would reduce our net income and could have a material adverse effect on our business, financial condition and results of operations.
Our RECs and racetracks in Calgary and Edmonton are located on leased parcels of land, and our casinos in Poland are located within leased building spaces. If we were to default on any one or more of the leases or if we are unable to secure renewal terms for these locations, the lessors could terminate the affected leases and we could lose possession of the land or building and any improvements on the land and buildings, including the RECs that we have built in Canada.buildings. This would have a significant adversecould adversely effect on our business, financial condition and results of operations as we would then be unable to operate the affected facilities.
We may not be fully compensated to relocate the Nugget Casino and may be required to seek additional funding if the Nevada Department of Transportation (“NDOT”) project moves forward.
A majority of the casino floor at the Nugget Casino is located beneath Interstate 80 (“I-80”) in Sparks, Nevada. NDOT has discussed the possibility of expanding I-80, which would require us to rebuild the Nugget Casino on existing land owned by Smooth Bourbon and leased to Nugget. We anticipate that NDOT would compensate us to move the casino to a new location; however, the value that is determined by NDOT for purposes of compensating us may not cover the full construction costs. If we are unable to get fully compensated for building a new casino, or if the timing of compensation payments does not match our timing for construction, we may be required to use cash on hand or seek financing, which may not be available on favorable terms or at all.
Operational Risks
Our financial condition and results of operations may be adversely affected by climate change, the occurrence of severe weather, natural or man-made disasters and other catastrophic events, including war, terrorism and other acts of violence, and outbreaks of disease.
The operations of our facilities are subject to disruptions or reductions in the number of customers who visit our properties because of severe weather conditions. If weather conditions limit access to our casino properties or otherwise adversely impact our ability to operate our casinos at full capacity, our revenue will suffer, which will negatively impact our operating results. Extreme weather conditions, potentially exacerbated by climate change, may cause property damage or interrupt business, which could harm our business and results of operations. High winds, flooding, blizzards and sub-zero temperatures, such as those experienced in
Colorado, Missouri and Alberta from time to time, can limit access to our properties. Extreme weather conditions may also interrupt the operations of critical suppliers, and may result in reduced availability or increased price volatility of certain critical supplies.
Events such as terrorist and war activities in the countries in which we are located and other acts of violence, such as the mass shooting that occurred at a Las Vegas casino, could have a negative impact on travel and leisure expenditures, including gaming, lodging and tourism, especially if these events occur in a region in which we operate. The Russia-Ukraine war could have an adverse impact on our results of operations in Poland, which borders Ukraine, and the collateral global impacts of that situation could adversely impact our results of operations at all of our properties. We cannot predict the extent to which terrorism, security alerts or war, or other acts of violence in the countries that we operate will directly or indirectly affect our business and operating results, but the impact could be material.
An outbreak of a contagious disease, such as the COVID-19 pandemic or any similar illness, could have a negative impact on travel and leisure expenditures, including gaming, lodging and tourism, especially if an outbreak were to occur in or near the areas in which we operate. Negative impacts on the economy, travel restrictions and other restrictions by local or federal governments in the areas in which we operate could result in consumers reducing travel and leisure expenditures, including visits to our casinos. Actions taken to contain outbreaks in response to a public health epidemic pose the risk that we or our employees, suppliers, and other business partners may be prevented from conducting business activities for an unknown period of time. Our operating costs may increase due to additional health and safety requirements, and we may experience disruptions due to employee illness. Travel restrictions imposed by the US, European or other foreign governments may make it difficult or impossible for our management located in Europe to travel to the US or other countries where we have operations. We cannot predict the extent to which future outbreaks of a contagious disease will directly or indirectly affect our business and operating results, but the impact could be material. The extent of the effects of the disease outbreaks on our business and the casino industry at large is highly uncertain and will ultimately depend on future developments, including, but not limited to, future recurrences of outbreaks, the availability and effectiveness of vaccines, and the length of time it takes for normal economic and operating conditions to resume, if at all. We could experience a longer-term impact on our costs, such as, for example, the need for enhanced health and hygiene requirements in one or more regions in attempts to counteract future outbreaks. Further, outbreaks of disease may also affect our operating and financial results in ways that are not presently known to us or that we currently do not consider present significant risks to our operations. Any of the foregoing could have a material adverse effect on our business, financial condition, results of operations and liquidity.
Our insurance coverage may not be adequate to cover all possible losses that our properties could suffer, our insurance costs may increase, and we may not be able to obtain the same insurance coverage in the future.
We may suffer damage to our property caused by a casualty loss (such as fire, natural disasters, acts of war, terrorism or other acts of violence) that could severely disrupt our business or subject us to claims by third parties who are injured or harmed. Although we maintain insurance customary in our industry, including property, casualty, terrorism, cybersecurity and business interruption insurance, that insurance is subject to deductibles and limits on maximum benefits, including limitations on the coverage period for business interruption. Due to these variables, we may not be able to fully insure such losses, or fully collect, if at all, on claims resulting from severe weather conditions. The lack of sufficient insurance for these types of acts could expose us to heavy losses if any damages occur, directly or indirectly, that could have a significant adverse impact on our operations.
We renew our insurance policies on an annual basis. The cost of coverage may become so high that we may need to further reduce our policy limits, agree to certain exclusions from our coverage, or self-insure. Among other factors, regional political tensions, homeland security concerns, other catastrophic events or any change in government legislation governing insurance coverage for acts of terrorism could materially adversely affect available insurance coverage and result in increased premiums on available coverage (which may cause us to elect to reduce our policy limits), additional exclusions from coverage or higher deductibles. Among other potential future adverse changes, in the future we may elect to not, or may not be able to, obtain any coverage for losses due to acts of terrorism.
Our reputation and business may be harmed by interruptions or cybersecurity breaches of our information systems, and we may be subject to legal claims if there is loss, disclosure or misappropriation of or access to our customers', our business partners' or our own information or other breaches of our information security.
We make use of online services and centralized data processing, including through third party service providers. Issues with performance by these third parties may disrupt our operations, and as a result our operating expenses could increase, which could negatively affect our results of operations. Moreover, the secure maintenance and transmission of customer information, including credit card numbers and other personally identifiable information for marketing and promotional purposes, is a critical element of our operations. Our collection and use of personal data are governed by state and federal privacy laws as well as the applicable laws of the countries in which we operate. Various federal, state and foreign legislative or regulatory bodies may enact or adopt new or additional laws and regulations concerning privacy, data retention, data transfer, and data protection. Compliance with applicable
privacy regulations may increase our operating costs or adversely impact our ability to market our products, properties and services to our guests.
Our information technology systems, and those of our third party service providers, that maintain and transmit customer information, or those of service providers, or our employee or business information may be compromised by a malicious third party penetration of our network security, or that of a third party service provider or business partner, or by actions or inactions by our employees. As a result, information of our customers, third party service providers or business partners or our employee or business information may be lost, disclosed, accessed or taken without their or our consent. Cybersecurity attacks have become increasingly common, and we have experienced immaterial business disruption, monetary loss and data loss as a result of phishing, business email compromise and other types of attacks on our or our third party service provider’s systems. In addition, the rapid evolution and increased adoption of new technologies, such as artificial intelligence, may intensify our cybersecurity risks. Any disruption or failure of these systems or services could cause substantial errors, data loss, processing inefficiencies, security breaches, inability to use the systems or process transactions, loss of customers or other business disruptions, any of which could negatively affect our business and results of operations, subject us to penalties or result in reputational harm. Additionally, non-compliance with applicable privacy regulations by us (or in some circumstances non-compliance by third parties engaged by us) or a breach of security on systems storing our data may result in a loss of customers and subject us to fines, payment of damages, lawsuits or restrictions on our use or transfer of data.
We are subject to risks related to corporate social responsibility, environmental, social and governance (“ESG”) matters and our business reputation and may negatively affect our business and operations.
Many factors influence our reputation and the value of our brand, including the perceptions held by our customers, business partners, other key stakeholders and the communities in which we do business. Regulatory developments and stakeholder expectations relating to ESG matters are rapidly changing, and our business faces increasing scrutiny related to our ESG practices, disclosures and goals, and we risk damage to our reputation and the value of our brand if we fail to act responsibly in a number of areas including diversity and inclusion, community engagement and philanthropy, environmental sustainability, climate change, responsible gaming, supply chain management, workplace conduct, human rights and many others, some of which may be unforeseen. If we are unable to recognize and respond to such developments, or if our existing practices and procedures are not adequate to meet new regulatory requirements, we may miss corporate opportunities, become subject to regulatory scrutiny or third-party claims, or incur costs to revise operations to meet new standards. Moreover, any harm to our reputation could impact employee engagement and retention and the willingness of customers and our partners to do business with us, which could have a material adverse effect on our business, results of operations and cash flows.
Difficulties in managing our worldwide operations may have an adverse impact on our business.
We derive our revenue from operations located on two continents. Our management is located in North America and Europe, and our worldwide operations pose risks to our business. Risks associated with international operations include:
fluctuations in foreign currency exchange rates;
changes in laws and policies that govern our foreign operations;
possible failure to comply with anti-bribery laws such as the US Foreign Corrupt Practices Act (“FCPA”) and similar anti-bribery laws in other jurisdictions;
difficulty in establishing staffing and managing non-United States operations;
different labor regulations;
changes in environmental, health and safety laws;
potentially negative consequences from changes in or interpretations of tax laws;
political instability and actual or anticipated military or political conflicts;
economic instability and inflation, recession or interest rate fluctuations;
uncertainties regarding judicial systems and procedures;
different time zones; and
culture, management and language differences.
These factors make it more challenging to manage and administer a globally-dispersed business and, as a result, we must devote greater resources to operating under several regulatory and legislative regimes. See “Governmental Regulation and Licensing” in Item 1, “Business” of this report and Exhibit 99.1 to this report, which is incorporated herein by reference. This business model also increases our costs.
We are dependent upon technology services and electrical power to operate our business, and if we experience damage or service interruptions, we may have to cease some or all of our operations, resulting in a decrease in revenue.
Our gaming operations rely heavily on technology services and an uninterrupted supply of electrical power. Our security system and all of our slot machines are controlled by computers and reliant on electrical power to operate. A loss of electrical power or a failure of the technology services needed to run the computers would make us unable to run all or parts of our gaming operations. Any unscheduled interruption in our technology services or interruption in the supply of electrical power is likely to result in an immediate, and possibly substantial, loss of revenue due to a shutdown of our gaming operations. Although we have designed our systems around industry-standard architectures to reduce downtime in the event of outages or catastrophic occurrences, they remain vulnerable to damage or interruption from floods, fires, power loss, telecommunication failures, terrorist attacks, computer viruses, computer denial-of-service attacks and similar events. Additionally, substantial increases in the cost of electricity and natural gas could negatively affect our results of operations.
We face the risk of fraud, theft, and cheating.
We face the risk that gaming customers may attempt or commit fraud or theft or cheat in order to increase winnings. Such acts of fraud, theft or cheating could involve the use of counterfeit chips or other tactics, possibly in collusion with our employees. Internal acts of cheating could also be conducted by employees through collusion with dealers, surveillance staff, floor managers, or other casino or gaming area staff. Additionally, we also face the risk that customers may attempt or commit fraud or theft with respect to our non-gaming offerings or against other customers. Such risks include stolen credit or charge cards or cash, falsified checks, theft of retail inventory and purchased goods, and unpaid or counterfeit receipts. Failure to discover such acts or schemes in a timely manner could result in losses in our operations. Negative publicity related to such acts or schemes could have an adverse effect on our reputation, potentially causing a material adverse effect on our business, financial condition, results of operations, and cash flows.
Legal, Regulatory and Compliance Risks
We face extensive regulation from gaming and other regulatory authorities, which involve considerable expense and could adversely impact our business, and potential changes in the regulatory environment also may adversely impact us.
As owners and operators of gaming facilities, we are subject to extensive state, local, and international provincial regulation. State, local and provincial authorities require us and our subsidiaries to demonstrate suitability to obtain and retain various licenses and require that we have registrations, permits and approvals to conduct gaming operations. Various regulatory authorities may, for any reason set forth in applicable legislation, rules and regulations, limit, condition, suspend or revoke a license or registration to conduct gaming operations or prevent us from owning the securities of our gaming subsidiaries. Like all gaming operators in the jurisdictions in which we operate or plan to operate, we must periodically apply to renew our gaming licenses or registrations and in North America we must have the suitability of certain of our directors, officers and employees approved. We are scheduled for renewals for our casino licenseslicense at Cripple Creek, Central City and Mountaineer in 2023.2024. The casino licenses for our casinos at the Dwor Kosciuszko Hotel President in Krakow, the Manufaktura Entertainment Complex in Lodz and the LIM Center in Warsaw, Poland expire in 2024. In October 2023, we closed the casinos in Katowice and Bielsko-Biala, Poland atand in November 2023, we closed the Park Inn by Radisson in Katowice, Poland and at the DoubleTree by Hilton Hotelcasino in Wroclaw, Poland expiredue to the expiration of the gaming licenses as we awaited the licensing decision from the Polish Minister of Finance. We were awarded a new license for Wroclaw in 2023.December 2023 and Katowice and Bielsko-Biala in February 2024. At the time of filing, we have reopened the Bielsko-Biala casino, the casino in Katowice is scheduled to reopen in mid-March and the casino in Wroclaw is expected to reopen in a new location in the third quarter of 2024. There can be no assurance that we will be successful in receiving licenses to operate our new or existing casinos in Poland or that we will receive them prior to the expiration of the current license, as was the case with Bielsko-Biala, Katowice and Wroclaw. Delays in licensing in Poland could cause us to close casinos temporarily. A detailed description of the regulations to which we are subject, including the timing of license renewals for our properties, is contained in Exhibit 99.1 to this report, which is incorporated herein by reference. Failure to obtain license renewals would have an adverse effect on us.
In addition to gaming regulations, we are also subject to various federal, state, provincial, local and foreign laws and regulations affecting businesses in general. These laws and regulations include, but are not limited to, restrictions and conditions concerning alcoholic beverages, environmental matters, smoking, employees, currency transactions, taxation, zoning and building codes, and marketing and advertising. Rules and regulations regarding the service of alcoholic beverages are strict. The loss or suspension of a liquor license could significantly impair our operations.
We also deal with significant amounts of cash in our operations and are subject to various reporting and anti-money laundering regulations. Any violations of anti-money laundering laws or regulations by any of our properties could have an adverse effect on our financial condition, results of operations or cash flows. Regulations adopted by the Financial Crimes Enforcement Network require us to report currency transactions at our US locations in excess of $10,000 occurring within a gaming day, including
identification of the patron by name and social security number. US Treasury Department regulations also require us to report certain suspicious activity, including any transaction that exceeds $5,000, if we know, suspect or have reason to believe that the transaction involves funds from illegal activity or is designed to evade federal regulations or reporting requirements. Substantial penalties can be imposed if we fail to comply with these regulations. Such laws and regulations could change or could be interpreted differently in the future, or new laws and regulations could be enacted.
From time to time, legislators and special interest groups have proposed legislation that would expand, restrict or prevent gaming operations or that may otherwise adversely impact our operations in the jurisdictions in which we operate. Any new gaming laws or regulations in the jurisdictions in which we operate could have an adverse impact on our financial position and results of operations. Any expansion of the gaming industry that results in increased competition and any restriction on or prohibition of our gaming operations could have a material adverse effect on our operating results or cause us to record an impairment of our assets.
We depend on agreements with our horsemenhorsepersons and pari-mutuel clerks. Failure to renew or modify agreements on satisfactory terms could materially adversely affect our financial position and results of operations.us.
In the US, the Federal Interstate Horseracing Act of 1978, as amended (“FIHA”), and state law in West Virginia require that, in order to simulcast races, we have certain agreements with the horse owners and trainers at our racetrack. In addition, West Virginia requires applicants seeking to renew their gaming license to demonstrate they have an agreement regarding the proceeds of the gaming machines with a representative of a majority of (i) the horse owners and trainers, (ii) the pari-mutuel clerks, and (iii) the horse breeders. If we fail to present evidence of an agreement with horsemen at a track, we may not be permitted to conduct live racing and to export and import simulcasting at that track and through off-track wagering, and our video lottery license may not be renewed. In addition, our annual simulcast export agreements are subject to horsemen’s approval under the FIHA. Simulcast import and export agreements require horsemen approval per West Virginia law.
In Canada, the Pari-Mutuel Betting Supervision Regulations require that in order to conduct pari-mutuel betting we have certain agreements with approved horsepersons addressing the sharing of revenue. If we fail to present evidence of an agreement with
approved horsepersons, we may not be permitted to conduct live racing, export simulcasting and teletheatre wagering. If we are unable to conduct live racing, our license to operate a REC may not be renewed.
If we failFailure to renew or modify existing agreements on satisfactory terms this failure could have a material adverse effect on our financial position, results of operations and cash flows.
The enactment of legislation implementing changes in the US taxation of international business activities or the adoption of other tax reform laws or policies could materially affect our financial position and results of operations.
We are subject to taxation at the federal, state, provincial and local levels in the US and various other countries and jurisdictions. Our future effective tax rate could be affected by changes in the composition of earnings in jurisdictions with differing tax rates, changes in statutory rates and other legislative changes, changes in the valuation of our deferred tax assets and liabilities, or changes in determinations regarding the jurisdictions in which we are subject to tax. From time to time, the US federal, state and local and foreign governments make substantive changes to tax rules and their application, which could result in materially higher corporate taxes than would be incurred under existing tax law and could adversely affect our financial condition or results of operations.
We face extensive taxation from gaming and regulatory authorities. Potential changes to the tax laws in the jurisdictions in which we operate may adversely affect the results of our operations.
We believe that the prospect of significant revenue to a jurisdiction through taxation and fees is one of the primary reasons jurisdictions permit legalized gaming. As a result, gaming companies are typically subject to significant taxes and fees in addition to normal federal, state, provincial and local income taxes, and such taxes and fees are subject to increase at any time. We pay substantial taxes and fees with respect to our operations. A detailed description of the gaming taxes and fees to which we are subject is contained in Exhibit 99.1 to this report, which is incorporated herein by reference. In addition, negative economic conditions could intensify the efforts of federal, state, provincial and local governments to raise revenue through increases in gaming taxes or introduction of additional gaming opportunities, which could adversely affect our results of operations and cash flows.
Our effective tax rate or cash tax payment requirements may change in the future, which could adversely impact our future results of operations.
A number of factors may adversely impact our future effective tax rate or cash tax payment requirements, which may impact our future results and cash flows from operations. See Note 13 to the Consolidated Financial Statements included in Part II, Item 8, “Financial Statements and Supplementary Data” of this report. These factors include, but are not limited to: changes to income tax rates, to tax laws or the interpretation of such tax laws (including additional proposals for fundamental international tax reform
globally); the jurisdictions in which our profits are determined to be earned and taxed; changes in the valuation of our deferred tax assets and liabilities; adjustments to estimated taxes upon finalization of various tax returns; adjustments to our interpretation of transfer pricing standards; treatment or characterization of intercompany transactions; changes in available tax credits, grants and other incentives; changes in stock-based compensation expense; changes in U.S. generally accepted accounting principles; and expiration or the inability to renew tax rulings or tax holiday incentives.
Additionally, evaluating the need for, and amount of, a valuation allowance for deferred tax assets often requires significant judgment and extensive analysis of all the positive and negative evidence available to determine whether all or some portion of deferred tax assets will not be realized. Because management believes it is more likely than not that the benefit from certain deferred tax assets will not be realized, a valuation allowance of $11.4 million in foreign jurisdictions has been provided in recognition of these risks. If our assumptions change and it is determined that we will be able to realize tax benefits related to these foreign deferred tax assets, we will realize a reduction in income tax expense in the year such valuation allowances are reversed. Further, management currently believes it is more likely than not that the $21.5 million of net deferred tax assets in the US will be realized. Unless sufficient taxable income is generated in the US, a valuation allowance to reduce deferred tax assets may be required, which would materially increase the tax expense in the period the allowance is recognized.
Any violation of the Foreign Corrupt Practices Act or any other similar anti-corruption laws could have a negative impact on us.
A portion of our revenue is derived from operations outside the United States, which exposes us to complex foreign and US regulations inherent in doing cross-border business and in each of the countries in which we transact business. We are subject to compliance with the US FCPA and other similar anti-corruption laws, which generally prohibit companies and their intermediaries from making improper payments to foreign government officials for the purpose of obtaining or retaining business. While our employees and agents are required to comply with these laws, we cannot be sure that our internal policies and procedures will always protect us from violations of these laws, despite our commitment to legal compliance and corporate ethics. Violations of these laws may result in severe criminal and civil sanctions as well as other penalties, and the SEC and US Department of Justice have increased their enforcement activities with respect to the FCPA. The occurrence or allegation of these types of risks may adversely affect our business, performance, prospects, value, financial condition, and results of operations.
Any failure to protect our trademarks could have a negative impact on the value of our brand names and adversely affect our business.
The development of intellectual property is part of our overall business strategy. WhileAlthough our business as a whole is not dependent on either of our trademarks or other intellectual property, we seek to establish and maintain our proprietary rights in our business operation through the use of trademarks. We file applications for, and obtain trademarks in, the United States and in foreign countries where we believe filing for such protection is appropriate. Despite our efforts to protect our proprietary rights, parties may infringe our trademarks and our rights may be invalidated or unenforceable. The laws of some foreign countries do not protect proprietary rights to as great an extent as the laws of the United States. Monitoring the unauthorized use of our intellectual property is difficult. Litigation may be necessary to enforce our intellectual property rights or to determine the validity and scope of the proprietary rights of others. Litigation of this type could result in substantial costs and diversion of resources. We cannot assure you that all of the steps we have taken to protect our trademarks in the United States and foreign countries will be adequate to prevent imitation of our trademarks by others. The unauthorized use or reproduction of our trademarks could diminish the value of our brand and its market acceptance, competitive advantages or goodwill, which could adversely affect our business.
Human Capital Risks
The loss of key personnel could have a material adverse effect on us.
We are highly dependent on the services of Erwin Haitzmann and Peter Hoetzinger, our founders and Co-Chief Executive Officers, and other members of our senior management team. The employment agreements with Erwin Haitzmann and Peter Hoetzinger provide that, under some circumstances, the departure of one executive could allow the other to leave for cause. Our ability to retain key personnel is affected by the competitiveness of our compensation packages and the other terms and conditions of employment, our continued ability to compete effectively against other gaming companies and our growth prospects. The loss of the services of any of these individuals could have a material adverse effect on our business, financial condition and results of operations.
Our business, financial condition, and results of operations may be harmed by staff shortages, work stoppages and other labor issues.
Our ability to attract and retain employees may cause us to reduce casino operating hours or close certain amenities at our properties which could negatively impact guest loyalty and operating results. The COVID-19 pandemic caused staffing issues to be more significant. We have adjusted, and if required we plan to continue to adjust,
operating hours for food and beverage outlets, and hotel and convention spaces where we are impacted by staffing challenges. There are 250We have employees at our CPL casinos in Poland who belong to trade unions. The trade unions do not currentlythat have any collective bargaining agreements with CPL butthe right to approve changes in pay for union employees at CPL require approval from the trade unions.CPL. In the United States, there are 44 employees at our West Virginia casinoand Maryland casinos who belong to unions.unions and have collective bargaining agreements with the casinos. A lengthy strike or other work stoppage at our casino properties with unions could have an adverse effect on our business and results of operations. Our other employees in the US and Canada and in our Corporate and Other segment are not covered by collective bargaining agreements. From time to time, we have experienced attempts to unionize certain of our non-union employees. If a union seeks to organize any of our employees, we could experience disruption in our business and incur significant costs, both of which could have a material adverse effect on our results of operation and financial condition. If a union were successful in organizing any of our employees, we could experience significant increases in our labor costs which could also have a material adverse effect on our business, financial condition, and results of operations. In addition, changes to labor laws or prevailing market conditions could lead to increased labor costs that could have an adverse impact on our profitability.
Common Stock and Stockholder Risks
Certain anti-takeover measures we have adopted may limit our ability to consummate transactions that some of our security holders might otherwise support.
We have a fair price business combination provision in our certificate of incorporation, which requires approval of certain business combinations and other transactions by holders of 80% of our outstanding shares of voting stock. In addition, our certificate of incorporation allows our board of directors to issue shares of preferred stock without stockholder approval. These provisions generally have the effect of requiring that any party seeking to acquire us negotiate with our board of directors in order to structure a business combination with us. This may have the effect of depressing the price of our common stock due to the possibility that certain transactions that our stockholders might favor could be precluded by these provisions.
Stockholders may be required to dispose of their shares of our common stock if they are found unsuitable by gaming authorities.
Gaming authorities in the US and Canada generally can require that any beneficial owner of our common stock and other securities file an application for a finding of suitability. If a gaming authority requires a record or beneficial owner of our securities to file a suitability application, the owner must apply for a finding of suitability within 30 days or at an earlier time prescribed by the gaming authority. The gaming authority has the power to investigate an owner's suitability, and the owner must pay all costs of the investigation. If the owner is found unsuitable, then the owner may be required by law to dispose of our securities. Our certificate of incorporation also provides us with the right to repurchase shares of our common stock from certain beneficial owners declared by gaming regulators to be unsuitable holders of our equity securities, and the price we pay to any such beneficial owner may be below the price such beneficial owner would otherwise accept for his or her shares of our common stock.
General Risk Factors
We are or may become involved in legal proceedings that, if adversely adjudicated or settled, could impact our financial condition.
From time to time, we are defendants in various lawsuits and gaming regulatory proceedings relating to matters incidental to our business. As with all litigation, no assurance can be provided as to the outcome of these matters and, in general, litigation can be expensive and time consuming. We may not be successful in the defense or prosecution of our current or future legal proceedings, which could result in settlements or damages that could significantly impact our business, financial condition and results of operations.
We may be required in the future to record impairment losses related to assets we currently carry on our balance sheet.
Accounting rules require that we make certain estimates and assumptions related to our determinations as to the future recoverability of a significant portion of our assets. If we were to determine that the values of these assets carried on our balance sheet are impaired due to adverse changes in our business or otherwise, we may be required to record an impairment charge to write down the value of these assets, which would adversely affect our results during the period in which we recorded the impairment charge. See Note 5 to the Consolidated Financial Statements included in Item 8, “Financial Statements and Supplementary Data” of this report for more information on our goodwill and other intangible assets.
Fluctuations in currency exchange rates and currency controls in foreign countries could adversely affect our business.
The revenue generated and expenses incurred at our casinos in Canada and Poland are generally denominated in Canadian dollars and Polish zloty, respectively. Decreases in the value of these currencies in relation to the value of the US dollar have decreased the operating profit from our foreign operations when translated into US dollars, which has adversely affected our consolidated results
of operations, and such decreases may occur in the future. In addition, we may expand our operations into other countries and, accordingly, we could face similar exchange rate risk with respect to the costs of doing business in such countries as a result of any increases in the value of the US dollar in relation to the currencies of such countries. We do not currently hedge our exposure to fluctuations of these foreign currencies, and there is no guarantee that we will be able to successfully hedge any future foreign currency exposure.
We may be required in the future to record impairment losses related to assets we currently carry on our balance sheet.
We have $10 million of goodwill, $30 million in casino licenses, $3 million in trademarks and $465 million in property and equipment as of December 31, 2022. Accounting rules require that we make certain estimates and assumptions related to our determinations as to the future recoverability of these assets. If we were to determine that the values of these assets carried on our balance sheet are impaired due to adverse changes in our business or otherwise, we may be required to record an impairment charge to write down the value of these assets, which would adversely affect our results during the period in which we recorded the impairment charge. In 2020, we impaired $35.1 million related to goodwill and other intangible assets, including our MCE cost investment, due to the impact from COVID-19. See Notes 1 and 5 to the Consolidated Financial Statements included in Item 8, “Financial Statements and Supplementary Data” of this report for more information on our goodwill and other intangible assets.
Item 1B. Unresolved Staff Comments.
None.
Item 1C. Cybersecurity.
Cybersecurity is an important part of our risk management program and an area of increasing focus for our Board and management. We maintain a robust cybersecurity infrastructure to safeguard our operations, networks, and data through comprehensive security measures including our technology tools, internal management, and external service providers.
Our Chief Information Officer (“CIO”) is responsible for assessing, identifying, and managing the risks from cybersecurity threats. Our CIO has over 14 years of experience in information technology and security positions. The CIO leads a team which includes our Corporate Director of Information Security and Senior Systems Engineer, with a combined 28 years of information technology and cybersecurity related experience. Both of these individuals hold Certified Information System Security Professional (“CISSP”) certifications.
Our Board of Directors, primarily through the Audit Committee, oversees management's approach to managing cybersecurity risks. The Audit Committee, comprised solely of independent directors, is charged with overseeing the Company’s risk management, including information technology and cybersecurity. The Audit Committee routinely engages with relevant management on a range of cybersecurity-related topics, including the threat of environment and vulnerability assessments, policies and practices, technology trends, and regulatory developments from the CIO.
We use a risk-based approach to identify, assess, protect, detect, respond to, and recover from cybersecurity threats, utilizing industry standard frameworks such as the National Institute of Standards and Technology Cybersecurity Framework, internal controls, and robust technological toolsets. Our information security program includes, among other aspects, penetration and vulnerability assessments and management, intrusion detection systems, antivirus and malware protection, encryption, access control, high availability and redundancy, and employee training. Risks identified by the CIO and other cybersecurity personnel are analyzed to determine the potential impact on us and the likelihood of occurrence. Such risks are continuously monitored to ensure that the circumstances and severity of such risks have not changed. The CIO also routinely discusses trends in cyber risks and our strategy with our Audit Committee and management on a regular basis, in addition to an annual review and discussion with the full board.
In addition, we engage independent third-party cybersecurity providers for vulnerability assessments and penetration testing. We regularly engage these providers to aid in the identification and remediation of potential threats. We also endeavor to apprise employees of emerging risks and require them to undergo annual security awareness training, and supplemental training as needed. Additionally, we conduct periodic internal exercises to gauge the effectiveness of the training and assess the need for additional controls and/or training.
Material cybersecurity incidents are required to be reported to the Board of Directors. As of the date of this report, we are not aware of any incidents from cybersecurity threats that have materially affected or are reasonably likely to materially affect our business strategy, results of operations, or financial condition.
Item 2. Properties.
The following table sets forth the location, applicable reportable segment, size and description of certain types of gaming facilities at each of our casinos as of December 31, 2022:2023:
Summary of Property Information
|
|
|
|
|
|
|
|
|
|
|
|
|
|
|
|
|
|
|
|
|
|
|
|
|
|
|
|
|
|
|
|
|
|
|
|
|
|
|
|
|
|
Segment/Property | Year Opened / Acquired |
| Approximate Casino Square Footage |
| Acreage |
| Slot / Electronic Gaming Machines (#) (1) |
| Video Lottery Terminals (#) (1) |
| Tables (#) (1) |
| Racetrack
(#) | Year Opened / Acquired |
| Approximate Casino Square Footage |
| Acreage |
| Slot / Electronic Gaming Machines (#) (1) |
| Tables (#) (1) |
| Hotel Rooms (#) |
| Racetrack
(#) |
United States |
|
|
|
|
|
|
|
|
|
|
|
|
|
|
|
|
|
|
|
|
|
|
|
|
|
|
Colorado |
|
|
|
|
|
|
|
|
|
|
|
|
| |
East | |
|
|
|
|
|
|
|
|
|
|
|
|
|
Mountaineer Casino, Resort & Races (2) | | 2019 |
| 72,380 |
| 1,528.1 |
| 1,052 |
| 26 |
| 357 |
| 1 |
Rocky Gap Casino, Resort & Golf (2) | | 2023 |
| 25,447 |
| 270.0 |
| 630 |
| 16 |
| 198 |
| — |
Midwest | |
|
|
|
|
|
|
|
|
|
|
|
|
|
Century Casino Cape Girardeau (2) | | 2019 |
| 41,530 |
| 19.1 |
| 832 |
| 23 |
| — |
| — |
Century Casino Caruthersville (2)(3) | | 2019 |
| 12,000 |
| 38.2 |
| 418 |
| 6 |
| 36 |
| — |
Century Casino & Hotel - Central City | 2006 |
| 22,640 |
| 1.3 |
| 413 |
| — |
| 8 |
| — | 2006 |
| 22,640 |
| 1.3 |
| 400 |
| 8 |
| 26 |
| — |
Century Casino & Hotel - Cripple Creek | 1996 |
| 19,610 |
| 3.5 |
| 372 |
| — |
| 6 |
| — | 1996 |
| 19,610 |
| 3.5 |
| 367 |
| 6 |
| 21 |
| — |
West Virginia |
|
|
|
|
|
|
|
|
|
|
|
|
| |
Mountaineer Casino, Racetrack & Resort (2) | 2019 |
| 72,380 |
| 1,528.1 |
| 1,032 |
| — |
| 27 |
| 1 | |
Missouri |
|
|
|
|
|
|
|
|
|
|
|
|
| |
Century Casino Cape Girardeau (2) | 2019 |
| 41,530 |
| 19.1 |
| 843 |
| — |
| 23 |
| — | |
Century Casino Caruthersville (2) | 2019 |
| 12,000 |
| 38.2 |
| 425 |
| — |
| 6 |
| — | |
The Farmstead | 2022 |
| — |
| — |
| — |
| — |
| — |
| — | |
West | |
|
|
|
|
|
|
|
|
|
|
|
|
|
Nugget Casino Resort (4) | | 2023 |
| 71,200 |
| 25.1 |
| 931 |
| 24 |
| 1,382 |
| — |
Subtotal |
|
| 168,160 |
| 1,590.2 |
| 3,085 |
| — |
| 70 |
| 1 |
|
| 264,807 |
| 1,885.3 |
| 4,630 |
| 109 |
| 2,020 |
| 1 |
Canada |
|
|
|
|
|
|
|
|
|
|
|
|
|
|
|
|
|
|
|
|
|
|
|
|
|
|
Edmonton |
|
|
|
|
|
|
|
|
|
|
|
|
| |
Century Casino & Hotel - Edmonton | 2006 |
| 29,225 |
| 6.0 |
| 800 |
| 30 |
| 23 |
| — | 2006 |
| 29,225 |
| 6.0 |
| 800 |
| 23 |
| 26 |
| — |
Century Casino St. Albert | 2016 |
| 13,269 |
| 7.1 |
| 410 |
| 24 |
| 10 |
| — | 2016 |
| 13,269 |
| 7.1 |
| 432 |
| 10 |
| — |
| — |
Century Mile Racetrack and Casino (3)(2) | 2019 |
| 19,407 |
| 100.0 |
| 570 |
| 14 |
| — |
| 1 | 2019 |
| 19,407 |
| 100.1 |
| 580 |
| — |
| — |
| 1 |
Calgary |
|
|
|
|
|
|
|
|
|
|
|
|
| |
Century Downs Racetrack and Casino (4) | 2015 |
| 17,459 |
| 57.3 |
| 663 |
| 10 |
| — |
| 1 | |
Century Downs Racetrack and Casino (2) | | 2015 |
| 17,459 |
| 57.3 |
| 662 |
| — |
| — |
| 1 |
Subtotal |
|
| 79,360 |
| 170.4 |
| 2,443 |
| 78 |
| 33 |
| 2 |
|
| 79,360 |
| 170.5 |
| 2,474 |
| 33 |
| 26 |
| 2 |
Poland |
|
|
|
|
|
|
|
|
|
|
|
|
|
|
|
|
|
|
|
|
|
|
|
|
|
|
Casinos Poland (5) | 2007 |
| 85,560 |
| — |
| 535 |
| — |
| 117 |
| — | 2007 |
| 60,025 |
| — |
| 347 |
| 79 |
| — |
| — |
Corporate Other |
|
|
|
|
|
|
|
|
|
|
|
|
| |
Cruise Ships (total of 1) (6) | N/A |
| 2,300 |
| — |
| 17 |
| — |
| 1 |
| — | |
Total |
|
| 335,380 |
| 1,760.6 |
| 6,080 |
| 78 |
| 221 |
| 3 |
|
| 404,192 |
| 2,055.8 |
| 7,451 |
| 221 |
| 2,046 |
| 3 |
(1)Machine and table counts are reported as the total number of machines as of December 31, 2022.2023. In Canada, slot/electronic gaming machines include video lottery terminals.
(2)The land buildings and riverboatbuildings (as applicable) at these properties are leased under the Master Lease. For more information see “Master Lease” below.
(3)Century Mile runs the pari-mutuel network in Alberta.Includes The off-track betting parlors are located throughout Alberta and include the parlors at Century Mile, Century Casino & Hotel – Edmonton and Century Casino St. Albert. The land on which the REC and racetrack are located is leased.Farmstead.
(4)The land on which the REC and racetrack are located was soldbuilding is owned by CDR to 1685258 Alberta Ltd. (“Rosebridge”) prior to our acquisitionSmooth Bourbon. We own 50% of our ownership interest in CDR. CDR leases from Rosebridge the 57.3 acres on which the REC and racetrack are located.Smooth Bourbon.
(5)As of December 31, 2022,2023, Casinos Poland owned eightoperated five separate casinos in leased building spaces, including hotels, throughout Poland. For the locations of these casinos, see “Additional Property Information” below.
(6)Operated under a concession agreement. We do not own the ship on which our casino operates. For additional information about the ship, see “Additional Property Information” below.
Additional Property Information
As of December 31, 2022,2023, our subsidiaries were pledged as collateral for our obligations under our credit facilityagreement (“Goldman Credit Agreement”) with Goldman Sachs Bank USA (“Goldman”). As of December 31, 2022,2023, a parcel of land in Kolbaskowo, Poland owned by Casinos Poland secured a bank guarantee with mBank. See Note 6 to the Consolidated Financial Statements included in Item 8, “Financial Statements and Supplementary Data” of this report.
Corporate Offices – We lease approximately 13,200 square feet of office space in Colorado Springs, Colorado and approximately 2,500 square feet of office space in Vienna, Austria for corporate and administrative purposes.
Poland – The following table summarizes information about CPL’s casinos as of December 31, 20222023(1).
|
|
|
|
|
|
|
|
|
City | Location | License Expiration | Number of Slots | Number of Tables | Location | License Expiration | Number of Slots | Number of Tables |
Warsaw | Marriott Hotel | September 2028(2) | 70 | 37 | Marriott Hotel | September 2028 | 70 | 37 |
Warsaw | Hilton Hotel | July 2024(2) | 70 | 24 | Hilton Hotel (2) | June 2025 | 70 | 24 |
Warsaw | LIM Center | June 2025 | 65 | 4 | LIM Center (2) | July 2024 | 67 | 4 |
Bielsko-Biala | Hotel President | October 2023 | 51 | 5 | |
Katowice | Park Inn by Radisson | October 2023 | 70 | 14 | |
Wroclaw | DoubleTree by Hilton Hotel | November 2023 | 70 | 18 | |
Krakow | Dwor Kosciuszko Hotel | May 2024 | 70 | 5 | Dwor Kosciuszko Hotel | May 2024 | 70 | 5 |
Lodz | Manufaktura Entertainment Complex | June 2024 | 69 | 10 | Manufaktura Entertainment Complex | June 2024 | 70 | 9 |
(1)A detailed description of the regulations applicable to CPL licenses and our ability to obtain new licenses for our locations on their expiration is contained in Exhibit 99.1 to this report, which is incorporated herein by reference.
(2)In September 2022, CPL transferredOctober 2023, with approval from the Polish Minister of Finance, we exchanged the casino licenses for the LIM Center in Warsaw and the Hilton Hotel in Warsaw. The exchange of licenses extended the license for the Hilton Hotel in Warsaw Marriott Hotel expiring infrom July 2024 to the Warsaw Hilton Hotel, and CPL was granted a new license for the Warsaw Marriott Hotel expiring in September 2028.June 2025.
Cruise Ship – The following table summarizes information about the ship-based casino for which we had a concession agreement as of December 31, 2022.
Cruise Line | Ship | Concession Agreement End Date | Number of Slots | Number of Tables |
TUI Cruises | Mein Schiff Herz | April 2023(1) | 17 | 1 |
(1)Estimated - The concession agreement for the casino onboard Mein Schiff Herz is scheduled to endWe operated casinos in Katowice, Bielsko-Biala and Wroclaw during 2023, but closed these locations in the secondfourth quarter of 2023.
In April 2022,2023 due to the expiration of the gaming licenses. We were awarded licenses at Wroclaw in December 2023 and Katowice and Bielsko-Biala in February 2024. The Bielsko-Biala casino reopened in February 2024 and we anticipate that the Katowice casino will reopen in mid-March 2024 and that the Wroclaw casino will reopen in a concession agreement with TUI Cruises for one other ship-based casino ended andnew location in May 2021, a concession agreement with TUI Cruises for two other ship-based casinos ended.the third quarter of 2024.
Master Lease
In December 2019, certain subsidiaries of the Company and certain subsidiaries of VICI PropCo entered into a sale and leaseback transaction in connection with the 2019 Acquisition and entered into the Master Lease to lease the real estate assets.
The Master Lease has been amended since 2019 as follows:
•On December 1, 2022, an amendment provided for (i) modifications with respect to certain project work to be done by the Company related to Century Casino Caruthersville, (ii) modifications to rent under the Master Lease to provide for an increase in initial annualized rent by approximately $4.2 million after completion of the Caruthersville casino project and (iii) other related modifications.
•On July 25, 2023, an amendment (i) added Rocky Gap to the Master Lease, (ii) increased initial annualized rent by approximately $15.5 million and (iii) extended the initial Master Lease term for 15 years from the date of the amendment (subject to the existing four five-year renewal options).
•On September 6, 2023, an amendment (i) added the Century Canadian Portfolio to the Master Lease, (ii) increased initial annualized rent by approximately CAD 17.3 million ($13.1 million based on the exchange rate on December 31, 2023) and (iii) extended the initial Master Lease term for 15 years from the date of the amendment (subject to the existing four five year renewal options). In addition the portion of the Master Lease attributable to the Century Canadian Portfolio has a maximum 2.5% annual escalator increase.
Mountaineer, Cape Girardeau, Caruthersville, Rocky Gap and Caruthersvilleour Canadian subsidiaries are currently subject to the Master Lease.
The Master Lease provides for the lease of land, buildings, structures and other improvements on the land, (including barges and riverboats), easements and similar appurtenances to the land and improvements relating to the operations of the leased properties. The scheduled 20232024 rent payments under the Master Lease, including a CPI increase, are approximately $27.5$52.2 million. The rent payments are subject to annual escalations during the lease term. The Master Lease has an initial term of 15 years with no purchase option. In the December 2022 we amendedamendment of the Master Lease andwe exercised our first five year renewal term. At our option, the Master Lease may be extended for up to three additional five year renewal terms beyond the 20 year term. The renewal terms are effective as to all, but not less than all, of the properties then subject to the Master Lease. We do not have the ability to terminate our obligations under the Master Lease prior to its expiration without the lessor’s consent.
The Master Lease has a triple-net structure, which requires us to pay substantially all costs associated with the 2019 Acquired Casino properties, including real estate taxes, insurance, utilities, maintenance and operational costs. The Master Lease contains certain covenants, including minimum capital improvement expenditures. Century Casinos, Inc. has provided a guarantee of our subsidiaries’ obligations under the Master Lease. We account for the sale-leaseback transactions involving the Master Lease as failed sale-leasebacks, and therefore the Master Lease is accounted for as a financing obligation. For additional information regarding the Master Lease, see Note 7 to the Consolidated Financial Statements included in Item 8, “Financial Statements and Supplementary Data” of this report.
Nugget Casino Lease
The land, building, structures and other improvements of the Nugget Casino are leased from Smooth Bourbon (the “Nugget Lease”). We own 50% of Smooth Bourbon and consolidate it as a subsidiary for which we have a controlling interest. As such the finance lease asset, finance lease liability, revenue and expense are eliminated upon consolidation and the 50% of net rental income attributable to Marnell is recorded as non-controlling interest. The rent owed to Marnell is paid through dividends to noncontrolling partners. The scheduled 2024 rent payments under the Nugget Lease attributable to Marnell are $7.0 million. The rent payments are subject to annual escalations during the lease term. The Nugget Lease has an initial term of 35 years and a purchase option if Century purchases the remaining 50% of Smooth Bourbon. At our option, the Nugget Lease may be extended for up to four additional five year renewal terms. The Nugget Lease has a triple-net structure, which requires us to pay substantially all costs associated with the property, including real estate taxes, insurance, utilities, maintenance and operational costs. The Nugget Lease contains certain covenants, including minimum capital improvement expenditure requirements. Century Casinos, Inc. has provided a guarantee of the Nugget’s obligations under the Master Lease.
Item 3. Legal Proceedings.
We are not a party to any pending litigation that, in management’s opinion, could have a material effect on our financial position or results of operations except as disclosed in Note 16 to the Consolidated Financial Statements included in Item 8, “Financial Statements and Supplementary Data” of this report.
Item 4. Mine Safety Disclosures.
Not applicable.
PART IIInformation about our Executive Officers
|
|
|
Name | Age | Position Held |
Erwin Haitzmann | 70 | Chairman of the Board and Co-Chief Executive Officer |
Peter Hoetzinger | 61 | Vice Chairman of the Board, Co-Chief Executive Officer and President |
Margaret Stapleton | 62 | Chief Financial Officer and Corporate Secretary |
Timothy Wright | 53 | Chief Accounting Officer and Corporate Controller |
Andreas Terler | 54 | Managing Director of Century Resorts Management GmbH and
Executive Vice President |
Nikolaus Strohriegel | 54 | Managing Director of Century Resorts Management GmbH and Executive Vice President |
Erwin Haitzmann holds a Doctorate and a Masters degree in Social and Economic Sciences from the University of Linz, Austria (1980), and has extensive casino gaming experience ranging from dealer through various casino management positions. Dr. Haitzmann has been employed full-time by us since 1993 and has been employed as either Chief Executive Officer or Co-Chief Executive Officer since March 1994.
Peter Hoetzinger received a Masters degree from the University of Linz, Austria (1986). He thereafter was employed in several managerial positions in the gaming industry with Austrian casino companies. Mr. Hoetzinger has been employed full-time by us since 1993 and has been Co-Chief Executive Officer since March 2005.
Margaret Stapleton was appointed Chief Financial Officer, effective October 2019, and Corporate Secretary, effective May 2010. She holds a Bachelor of Science degree in Accounting from Regis University, Denver, Colorado (2004) and has over 30 years of experience in corporate accounting and internal audit. Mrs. Stapleton previously served as our Director of Internal Audit and Compliance from 2005 until May 2010 and as our Executive Vice President, Principal Financial/Accounting Officer from May 2010 to October 2019.
Timothy Wright was appointed Chief Accounting Officer effective October 2019 and Corporate Controller effective May 2010. Mr. Wright holds a Bachelor of Science degree in Accounting from the University of Colorado, Colorado Springs, Colorado (1995) and has over 30 years of experience in corporate accounting and finance. Mr. Wright has been employed by us since 2007, including previously serving as our Vice President of Accounting from May 2010 to October 2019.
Andreas Terler is a Graduate Engineer in Applied Mathematics from the University of Graz, Austria (1994). Mr. Terler has been employed by us since 2006. He has served as Managing Director of CRM since February 2007 and Executive Vice President since February 2022. Mr. Terler previously served as Vice President of Operations from May 2011 to October 2019, Chief Information
Officer from February 2006 to January 2022 and Senior Vice President, Operations – Missouri and West Virginia from October 2019 to February 2022.
Nikolaus Strohriegel received a Masters degree from the University of Vienna, Austria (1996). Mr. Strohriegel has been employed by us since 2007. He has served as Managing Director of CRM since January 2009 and Executive Vice President since February 2022. Mr. Strohriegel previously served as Vice President of Operations from March 2017 to October 2019 and Senior Vice President, Operations – Europe from October 2019 to February 2022.
PART II
Item 5. Market For Registrant’s Common Equity, Related Stockholder Matters and Issuer Purchases of Equity Securities.
Our common stock is traded in the United States on the Nasdaq Capital Market under the symbol “CNTY”.
The following graph illustrates the cumulative shareholder return of our common stock during the period beginning December 31, 20172018 through December 31, 2022,2023, and compares it to the cumulative total return on the Nasdaq and the Dow Jones US Gambling Index. The comparison assumes a $100 investment on December 31, 2017,2018, in our common stock and in each of the foregoing indices, and assumes reinvestment of dividends, if any. This table is not intended to forecast future performance of our common stock.
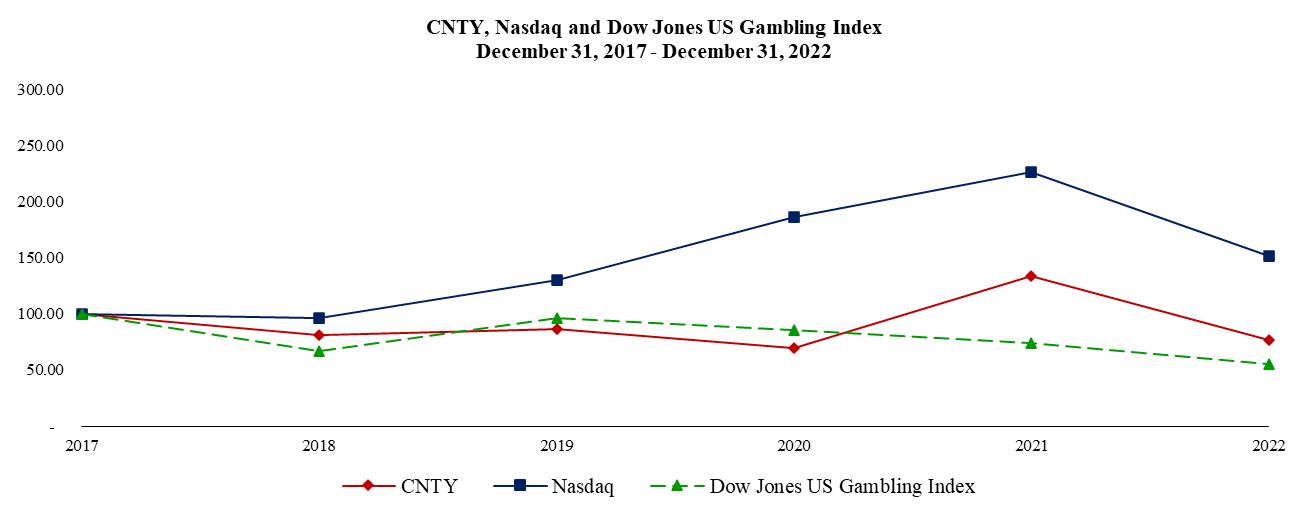

|
|
|
|
|
|
|
|
|
|
|
|
|
|
|
|
|
|
|
|
|
|
|
|
|
|
| 12/17 |
| 12/18 |
| 12/19 |
| 12/20 |
| 12/21 |
| 12/22 |
| 12/18 |
| 12/19 |
| 12/20 |
| 12/21 |
| 12/22 |
| 12/23 |
CNTY |
| 100.00 |
| 80.94 |
| 86.75 |
| 69.99 |
| 133.41 |
| 77.00 |
| 100.00 |
| 107.17 |
| 86.47 |
| 164.82 |
| 95.13 |
| 66.04 |
Nasdaq |
| 100.00 |
| 96.12 |
| 129.97 |
| 186.69 |
| 226.63 |
| 151.61 |
| 100.00 |
| 135.23 |
| 194.24 |
| 235.78 |
| 157.74 |
| 226.24 |
Dow Jones US Gambling Index |
| 100.00 |
| 67.36 |
| 96.55 |
| 85.49 |
| 74.51 |
| 55.50 |
| 100.00 |
| 143.34 |
| 126.92 |
| 110.62 |
| 82.39 |
| 107.03 |
No dividends have been declared or paid by us. Declaration and payment of dividends, if any, in the future will be at the discretion of the board of directors.
At March 3, 2023,8, 2024, we had 124144 holders of record of our common stock.
In March 2000, our board of directors approved and announced a discretionary program to repurchase up to $5.0 million of our outstanding common stock. In November 2009, our board of directors approved an increase of the amount available to be repurchased under the program to $15.0 million. The amount available for repurchase as of December 31, 20222023 is $14.7 million. The repurchase program has no set expiration or termination date. No repurchases were made during the year ended December 31, 2022.2023.
Item 6. Removed and Reserved.
Item 7. Management’s Discussion and Analysis of Financial Condition and Results of Operations.
Forward-Looking Statements, Business Environment and Risk Factors
The following discussion should be read in conjunction with Part II, Item 8, “Financial Statements and Supplementary Data” of this report. Information contained in the following discussion of our results of operations and financial condition contains forward-looking statements within the meaning of Section 27A of the Securities Act of 1933, as amended, Section 21E of the Exchange Act of 1934, as amended, and the Private Securities Litigation Reform Act of 1995, and, as such, is based on current expectations and is subject to certain risks and uncertainties. The reader should not place undue reliance on these forward-looking statements for many reasons, including those risks discussed under Item 1A, “Risk Factors,” and elsewhere in this document.report. See “Cautionary Statement Regarding Forward-Looking Information” that precedes Part I of this report. We undertake no obligation to publicly update or revise any forward-looking statements as a result of new information, future events or otherwise.
References in this item to “we,” “our,” or “us” are to the Company and its subsidiaries on a consolidated basis unless the context otherwise requires. The term “USD” refers to US dollars, the term “CAD” refers to Canadian dollars, the term “PLN” refers to Polish zloty and the term “GBP” refers to British pounds. Certain terms used in this Item 7 without definition are defined in Item 1, “Business” of this report.
Amounts presented in this Item 7 are rounded. As such, there may be rounding differences in period over period changes and percentages reported throughout this Item 7.
EXECUTIVE OVERVIEW
Overview
Since our inception in 1992, we have been primarily engaged in developing and operating gaming establishments and related lodging, restaurant and entertainment facilities. Our primary source of revenue is from the net proceeds of our gaming machines and tables, with ancillary revenue generated from hotel, restaurant, horse racing (including off-track betting), sports betting, iGaming bowling and entertainment facilities that are in most instances a part of the casinos.
We view each market in which we operate as a separate operating segment and each casino within those markets as a reporting unit. We aggregate all operating segments into three reportable segments based on the geographical locations in which our casinos operate: United States, Canada and Poland. We have additional business activities including concession agreements, management agreements, consulting agreements and certain other corporate and management operations that we report as Corporate and Other.
The table below provides information about After the aggregation ofNugget Acquisition in April 2023, we evaluated our operating segments and reporting units into reportableconcluded that as a result of the growth in the United States we would begin viewing our operating segments as of December 31, 2022.East, Midwest and West. We view each casino or other operation within those markets as a reporting unit. The reporting units, except for Century Downs Racetrack and Casino and Casinos Poland, are owned, operated and managed through wholly-owned subsidiaries. Our ownership and operation of Century Downs Racetrack and Casino and Casinos Poland are discussed below.
The real estate assets attable below provides information about the aggregation of our West Virginia and Missouri operating segments are owned by VICI PropCo and leased to us under the Master Lease. The land on which the REC and racetracks at Century Downs and Century Mile are located is leased.
reporting units into reportable segments as of December 31, 2023.
|
|
|
Reportable Segment | Operating Segment | Reporting Unit |
United States | ColoradoEast
| Mountaineer Casino, Resort & Races (1) |
|
| Rocky Gap Casino, Resort & Golf (1) |
| Midwest | Century Casino & Hotel - Central City |
|
| Century Casino & Hotel - Cripple Creek |
| West Virginia
| Mountaineer Casino, Racetrack & Resort
|
| Missouri
| Century Casino Cape Girardeau(1) |
|
| Century Casino Caruthersville (1) and The Farmstead |
| West | Nugget Casino Resort and Smooth Bourbon, LLC |
Canada | EdmontonCanada (2)
| Century Casino & Hotel - Edmonton(1) |
|
| Century Casino St. Albert(1) |
|
| Century Mile Racetrack and Casino(1) |
| Calgary (2)
| Century Downs Racetrack and Casino(1) |
Poland | Poland | Casinos Poland |
Corporate and Other | Corporate and Other | Cruise Ships & Other(3) |
|
| Corporate Other (3)(4) |
(1)Includes The Farmstead.real estate assets are owned by VICI PropCo and leased to us under the Master Lease.
(2)We operated Century Sports through February 10, 2022. We operated Century Bets through August 2021, when operations were transferred to Century Mile. For more information about Century Sports and Century Bets see Item 1, “Business” above.
(3)OurWe operated ship-based casinos through April 16, 2023.
(4)Prior to the Nugget Acquisition, our equity investment in Smooth Bourbon iswas included in the Corporate and Other reporting unit. See Item 1, “Business – 2022 Business Developments – Nugget Casino Resort in Sparks, Nevada” above.
We have controlling financial interests through our subsidiary CRM in the following reporting units:
We have a 66.6% ownership interest in CPL and we consolidate CPL as a majority-owned subsidiary for which we have a controlling financial interest. Polish Airports owns the remaining 33.3% in CPL. We account for and report the 33.3% Polish Airports ownership interest as a non-controlling financial interest. CPL has been in operation since 1989 and owns and operates casinos throughout Poland. See Item 2, “Properties”, above for a list of casinos operating as of December 31, 2022, owned and operated eight casinos throughout Poland.2023.
We have a 75% ownership interest in CDR and we consolidate CDR as a majority-owned subsidiary for which we have a controlling financial interest. We account for and report the remaining 25% ownership interest in CDR as a non-controlling financial interest. CDR operates Century Downs Racetrack and Casino, a REC in Balzac, a north metropolitan area of Calgary, Alberta, Canada.
We also have ahad concession agreementagreements for one ship-based casinocasinos and had ownership in and a consulting agreement with MCE, all of which are terminated and are detailed further under “Corporate and Other” below.
Recent Developments Related to Economic Uncertainty and COVID-19
TheCurrent macroeconomic conditions remain very dynamic, including impacts from rising inflation and interest rates, volatile changes in foreign currency exchange rates, political unrest and armed conflicts, COVID-19 and other factors. Any worsening in economic conditions, or the perception that conditions may worsen, could reduce consumer discretionary spending or increase our costs and erode our net income and cash flows.
While the effects of the COVID-19 pandemic had an adverse effect on our 2020 results ofbusiness have largely normalized, and currently our operations and financial condition, andhave no COVID-19 restrictions, we were negatively impacted our results of operations in the first half of 2021 because of closures of our Canada and Poland properties during this period. Our casinos varied their operations based on the governmental health and safety requirements in the jurisdictions in which they are located. Currently our operations have no health and safety requirements for entry and few COVID-19 restrictions.
We estimate that, for the years ended December 31, 2021 and 2020, net operating revenue was adversely impacted by approximately $35.9 million and $100.5 million, respectively, and Adjusted EBITDA was adversely impacted by approximately $13.1 million and $36.0 million, respectively, due to the closures.properties. See “Discussion of Results” below for a discussion of the impact of the 2021 closures in each operatingimpacted reportable segment.
The duration and impact of the COVID-19 pandemic otherwise remains uncertain. We cannot predict the negative impacts that additional variants of COVID-19 willmay have on our consumer demand, workforce, suppliers, contractors and other partners and whether future closures will be required. Such closures havepreviously had a material impactimpacts on us. The effects of COVID-19, ongoing governmental health and safety requirementsus and any future closures or safety requirements could have a material impact on us. WeIf future government mandates or closures are required that would have an adverse impact on us, we will continue to monitor our liquidity and make reductions to marketing and operating expenditures, where possible, if future government mandates or closures duesimilar to our response to COVID-19 or other health-related issues are required that would have an adverse impact on us.in 2021.
Other AcquisitionsProjects and Development ProjectsDevelopments
As detailed further in Item 1, “Business – 2022 Business Developments”, we havecompleted two pending acquisitions. The acquisitionacquisitions in 2023 and sold the real estate assets of the operationsCentury Canadian Portfolio to subsidiaries of the Nugget Casino ResortVICI PropCo through a sale and leaseback which is accounted for as a financing obligation from a failed sale leaseback. We also continued our construction projects in Sparks, Nevada for approximately $100.0 million is expected to close in the second quarter of 2023. The acquisition of the operations of Rocky Gap Casino Resort in Flintstone, Maryland for approximately $56.1 million is expected to close in the second quarter of 2023. In addition to the acquisitions, we have moved the casino at Century Casino Caruthersville from the riverboat and barge to a temporary land-based facility while we construct a new casino with an adjoining hotel and we have opened a small hotel neighboring Century Casino Caruthersville. We are also constructing a hotel at Century Casino Cape Girardeau.
Additional Gaming Projects
We currently are exploringcontinue to explore additional potential gaming projects and acquisition opportunities. Along with the capital needs of potential projects, there are various other risks which, if they materialize, could affect our ability to complete a proposed project or acquisition or could eliminate its feasibility altogether.
Terminated Projects
As detailed further in Item 1, “Business – 2022 Business Developments”Developments – Terminated Projects”, we sold the casino operations of Century Casino Calgary as well as the land and building in which we operated Century Sports. We also terminated our ownership interest in and consulting services agreement with MCE as well as our management and funding agreements related to a potential casino in Bermuda. In 2020, we closed Century Casino Bath.
Presentation of Foreign Currency Amounts
The average exchange rates to the US dollar used to translate balances during each reported period are as follows:
|
|
|
|
|
|
|
|
|
|
|
|
|
|
|
|
|
|
|
|
|
|
|
|
|
|
|
|
|
|
|
|
|
|
|
|
|
|
|
|
|
|
|
| For the year |
|
|
|
|
| For the year |
|
|
|
|
|
| ended December 31, |
| % Change |
| ended December 31, |
| % Change |
Average Rates |
| 2022 |
| 2021 |
| 2020 |
| 2022/2021 |
| 2021/2020 |
| 2023 |
| 2022 |
| 2021 |
| 2023/2022 |
| 2022/2021 |
Canadian dollar (CAD) |
| 1.3011 |
| 1.2537 |
| 1.3412 |
| (3.8%) |
| 6.5% |
| 1.3496 |
| 1.3011 |
| 1.2537 |
| (3.7%) |
| (3.8%) |
Euros (EUR) |
| 0.9506 |
| 0.8456 |
| 0.8776 |
| (12.4%) |
| 3.6% |
| 0.9248 |
| 0.9506 |
| 0.8456 |
| 2.7% |
| (12.4%) |
Polish zloty (PLN) |
| 4.4559 |
| 3.8608 |
| 3.8989 |
| (15.4%) |
| 1.0% |
| 4.2034 |
| 4.4559 |
| 3.8608 |
| 5.7% |
| (15.4%) |
British pound (GBP) |
| N/A |
| 0.7270 |
| 0.7798 |
| N/A |
| 6.8% | |
Source: 2022 Xe Currency Converter, 2021 and 2020 Pacific Exchange Rate Service |
|
| |
Source: 2023 and 2022 Xe Currency Converter, 2021 Pacific Exchange Rate Service | | Source: 2023 and 2022 Xe Currency Converter, 2021 Pacific Exchange Rate Service |
|
|
|
|
|
|
|
|
|
|
|
|
|
|
|
|
|
|
|
|
|
|
|
We recognize in our statement of (loss) earnings, (loss), foreign currency transaction gains or losses resulting from the translation of casino operations and other transactions that are denominated in a currency other than US dollars. Our casinos in Canada and Poland represent a significant portion of our business, and theThe revenue generated and expenses incurred by these operationsour casinos in Canada and Poland are generally denominated in Canadian dollars and Polish zloty.zloty, respectively. A decrease in the value of these currencies in relation to the value of the US dollar would decrease the earnings from our foreign operations when translated into US dollars. An increase in the value of these currencies in relation to the value of the US dollar would increase the earnings from our foreign operations when translated into US dollars. See Note 2 to the Consolidated Financial Statements included in Part II, Item 8, “Financial Statements and Supplementary Data” of this report.
DISCUSSION OF RESULTS
Years ended December 31, 2023, 2022 2021 and 20202021
Century Casinos, Inc. and Subsidiaries
|
|
|
|
|
|
|
|
|
|
|
|
|
|
|
|
|
|
|
|
|
|
|
|
|
|
|
|
|
|
| For the year |
|
|
|
|
|
|
|
|
|
| For the year |
|
|
|
|
|
|
|
|
|
|
| ended December 31, |
| 2022/2021 |
|
| 2021/2020 |
| ended December 31, |
| 2023/2022 |
|
| 2022/2021 |
Amounts in thousands |
| 2022 |
| 2021 |
|
| 2020 |
|
| $ Change |
| % Change |
|
| $ Change |
| % Change |
| 2023 |
| 2022 |
|
| 2021 |
|
| $ Change |
| % Change |
|
| $ Change |
| % Change |
Gaming Revenue |
| $ | 365,986 |
| $ | 331,877 |
| $ | 253,281 |
| $ | 34,109 |
| 10.3% |
| $ | 78,596 |
| 31.0% |
| $ | 412,388 |
| $ | 365,986 |
| $ | 331,877 |
| $ | 46,402 |
| 12.7% |
| $ | 34,109 |
| 10.3% |
Pari-mutuel, Sports Betting and iGaming Revenue |
| 19,607 |
| 18,848 |
| 17,660 |
|
| 759 |
| 4.0% |
|
| 1,188 |
| 6.7% |
| 20,165 |
| 19,607 |
| 18,848 |
|
| 558 |
| 2.8% |
|
| 759 |
| 4.0% |
Hotel Revenue |
| 9,628 |
| 8,286 |
| 5,910 |
|
| 1,342 |
| 16.2% |
|
| 2,376 |
| 40.2% |
| 42,269 |
| 9,628 |
| 8,286 |
|
| 32,641 |
| 339.0% |
|
| 1,342 |
| 16.2% |
Food and Beverage Revenue |
| 24,097 |
| 17,788 |
| 16,194 |
|
| 6,309 |
| 35.5% |
|
| 1,594 |
| 9.8% |
| 50,262 |
| 24,097 |
| 17,788 |
|
| 26,165 |
| 108.6% |
|
| 6,309 |
| 35.5% |
Other Revenue |
|
| 11,211 |
|
| 11,707 |
|
| 11,223 |
|
| (496) |
| (4.2%) |
|
| 484 |
| 4.3% |
|
| 25,122 |
|
| 11,211 |
|
| 11,707 |
|
| 13,911 |
| 124.1% |
|
| (496) |
| (4.2%) |
Net Operating Revenue |
|
| 430,529 |
|
| 388,506 |
|
| 304,268 |
|
| 42,023 |
| 10.8% |
|
| 84,238 |
| 27.7% |
|
| 550,206 |
|
| 430,529 |
|
| 388,506 |
|
| 119,677 |
| 27.8% |
|
| 42,023 |
| 10.8% |
Gaming Expenses |
|
| (183,841) |
|
| (161,119) |
|
| (131,563) |
|
| 22,722 |
| 14.1% |
|
| 29,556 |
| 22.5% |
|
| (216,475) |
|
| (183,841) |
|
| (161,119) |
|
| 32,634 |
| 17.8% |
|
| 22,722 |
| 14.1% |
Pari-mutuel, Sports Betting and iGaming Expenses |
| (22,149) |
| (19,735) |
| (19,301) |
|
| 2,414 |
| 12.2% |
|
| 434 |
| 2.2% |
| (21,752) |
| (22,149) |
| (19,735) |
|
| (397) |
| (1.8%) |
|
| 2,414 |
| 12.2% |
Hotel Expenses |
| (2,815) |
| (2,360) |
| (2,125) |
|
| 455 |
| 19.3% |
|
| 235 |
| 11.1% |
| (14,379) |
| (2,815) |
| (2,360) |
|
| 11,564 |
| 410.8% |
|
| 455 |
| 19.3% |
Food and Beverage Expenses |
| (22,631) |
| (16,523) |
| (15,962) |
|
| 6,108 |
| 37.0% |
|
| 561 |
| 3.5% |
| (45,065) |
| (22,631) |
| (16,523) |
|
| 22,434 |
| 99.1% |
|
| 6,108 |
| 37.0% |
Other Expenses | |
| (9,722) |
| (1,205) |
| (1,300) |
|
| 8,517 |
| 706.8% |
|
| (95) |
| (7.3%) |
General and Administrative Expenses |
| (105,467) |
| (93,489) |
| (80,246) |
|
| 11,978 |
| 12.8% |
|
| 13,243 |
| 16.5% |
| (140,505) |
| (104,262) |
| (92,189) |
|
| 36,243 |
| 34.8% |
|
| 12,073 |
| 13.1% |
Depreciation and Amortization |
| (27,109) |
| (26,762) |
| (26,534) |
|
| 347 |
| 1.3% |
|
| 228 |
| 0.9% |
| (41,043) |
| (27,109) |
| (26,762) |
|
| 13,934 |
| 51.4% |
|
| 347 |
| 1.3% |
Impairment - Intangible and Tangible Assets |
| — |
| — |
| (35,121) |
|
| — |
| — |
|
| (35,121) |
| (100.0%) | |
Gain on Sale of Casino Operations |
| — |
| — |
| 6,457 |
|
| — |
| — |
|
| (6,457) |
| (100.0%) |
| 1,660 |
| — |
| — |
|
| (1,660) |
| (100.0%) |
|
| — |
| — |
(Loss) on Sale of Assets |
|
| (2,154) |
|
| — |
|
| — |
|
| (2,154) |
| (100.0%) |
|
| — |
| — |
|
| — |
|
| (2,154) |
|
| — |
|
| (2,154) |
| (100.0%) |
|
| 2,154 |
| 100.0% |
Total Operating Costs and Expenses |
|
| (366,166) |
|
| (319,988) |
|
| (304,395) |
|
| 46,178 |
| 14.4% |
|
| 15,593 |
| 5.1% |
|
| (487,281) |
|
| (366,166) |
|
| (319,988) |
|
| 121,115 |
| 33.1% |
|
| 46,178 |
| 14.4% |
Earnings from Equity Investment |
|
| 3,249 |
|
| — |
|
| — |
|
| 3,249 |
| 100.0% |
|
| — |
| — |
|
| 1,121 |
|
| 3,249 |
|
| — |
|
| (2,128) |
| (65.5%) |
|
| 3,249 |
| 100.0% |
Earnings (Loss) from Operations |
|
| 67,612 |
|
| 68,518 |
|
| (127) |
|
| (906) |
| (1.3%) |
|
| 68,645 |
| 54051.2% | |
Earnings from Operations | |
|
| 64,046 |
|
| 67,612 |
|
| 68,518 |
|
| (3,566) |
| (5.3%) |
|
| (906) |
| (1.3%) |
|
|
|
|
|
|
|
|
|
|
|
|
|
|
|
|
|
|
|
|
|
|
|
|
|
|
|
|
|
|
|
|
|
|
|
|
|
|
|
Income Tax Benefit (Expense) |
| 7,660 |
| (6,371) |
| (4,848) |
|
| (14,031) |
| (220.2%) |
|
| 1,523 |
| 31.4% |
| 5,343 |
| 7,660 |
| (6,371) |
|
| (2,317) |
| (30.2%) |
|
| 14,031 |
| 220.2% |
Net (Earnings) Loss Attributable to Non-controlling Interests |
| (5,694) |
| (1,156) |
| 134 |
|
| 4,538 |
| 392.6% |
|
| 1,290 |
| 962.7% | |
Net Earnings (Loss) Attributable to Century Casinos, Inc. Shareholders |
| 7,976 |
| 20,622 |
| (48,002) |
|
| (12,646) |
| (61.3%) |
|
| 68,624 |
| 143.0% | |
Adjusted EBITDA (1) |
| $ | 103,340 |
| $ | 97,926 |
| $ | 48,398 |
| $ | 5,414 |
| 5.5% |
| $ | 49,528 |
| 102.3% | |
Net Earnings Attributable to Non-controlling Interests | |
| (9,709) |
| (5,694) |
| (1,156) |
|
| 4,015 |
| 70.5% |
|
| 4,538 |
| 392.6% |
Net (Loss) Earnings Attributable to Century Casinos, Inc. Shareholders | |
| (28,198) |
| 7,976 |
| 20,622 |
|
| (36,174) |
| (453.5%) |
|
| (12,646) |
| (61.3%) |
Adjusted EBITDAR (1) | |
| $ | 114,047 |
| $ | 103,340 |
| $ | 97,926 |
| $ | 10,707 |
| 10.4% |
| $ | 5,414 |
| 5.5% |
|
|
|
|
|
|
|
|
|
|
|
|
|
|
|
|
|
|
|
|
|
|
|
|
|
|
|
|
|
|
|
|
|
Earnings (Loss) Per Share Attributable to Century Casinos, Inc. Shareholders | |
Basic Earnings (Loss) Per Share |
| $ | 0.27 |
| $ | 0.70 |
| $ | (1.62) |
| $ | (0.43) |
| (61.4%) |
| $ | 2.32 |
| 143.2% | |
Diluted Earnings (Loss) Per Share |
| $ | 0.25 |
| $ | 0.66 |
| $ | (1.62) |
| $ | (0.41) |
| (62.1%) |
| $ | 2.28 |
| 140.7% | |
(Loss) Earnings Per Share Attributable to Century Casinos, Inc. Shareholders | | (Loss) Earnings Per Share Attributable to Century Casinos, Inc. Shareholders |
Basic | |
| $ | (0.93) |
| $ | 0.27 |
| $ | 0.70 |
| $ | (1.20) |
| (444.4%) |
| $ | (0.43) |
| (61.4%) |
Diluted | |
| $ | (0.93) |
| $ | 0.25 |
| $ | 0.66 |
| $ | (1.18) |
| (472.0%) |
| $ | (0.41) |
| (62.1%) |
|
|
|
|
|
|
|
|
|
|
|
|
|
|
|
|
|
|
|
|
|
|
|
|
|
|
|
|
|
|
|
|
|
(1)For a discussion of Adjusted EBITDAEBITDAR and reconciliation of Adjusted EBITDAEBITDAR to net (loss) earnings (loss) attributable to Century Casinos, Inc. shareholders, see “Non-GAAP Measures Definitions and Calculations – Adjusted EBITDA”EBITDAR” below in this Item 7.
Comparability Impacts
Items impacting year-over-year comparability of the results include the following:
COVID-19United States (Nugget and Rocky Gap) – ClosuresWe acquired the operations of all or a portionthe Nugget on April 3, 2023 and Rocky Gap on July 25, 2023. The Nugget and Rocky Gap are reported in the United States reportable segment. Both properties are located in gaming jurisdictions that are new to us and we incurred additional general and administrative expenses related to the acquisitions. The Nugget and Rocky Gap provided $80.8 million and $31.7 million in net operating revenue, respectively, $75.4 million and $27.7 million of our facilities dueoperating costs and expenses, respectively, and $1.3 million and ($2.5) million in net (loss) earnings attributable to COVID-19 had a significant negative impact on our resultsCentury Casinos, Inc. shareholders, respectively, for the year ended December 31, 2020 and, to a lesser extent, in 2021. See “Executive Overview-Recent Developments Related to COVID-19” above for details regarding the closures. In addition to the impacts on our revenue, expenses and results of operations, COVID-19 had the following impacts:2023.
Calgary
Canada (Real Estate Sale) – In February 2022,September 2023, we soldcompleted the Canada Real Estate Sale. As part of the sale, we purchased the land and building that we ownedat CDR prior to its sale to VICI PropCo. The purchase of the land at CDR resulted in Calgary fora loss on debt extinguishment of CAD 8.09.9 million ($6.37.3 million based on the exchange rate on February 10, 2022). Weas of September 6, 2023) that is recorded a loss on the saleas interest expense in our consolidated statement of the land and building of CAD 2.7 million ($2.2 million based on the average exchange rate for the month ended February 28, 2022).
Corporate and Other
We began operating CCB in May 2018. CCB was closed in March 2020 due to COVID-19 and CCB’s board of directors determined that CCB would enter into creditors voluntary liquidation, which occurred in May 2020. CCB was deconsolidated as a subsidiary in May 2020. We recorded a $7.4 million gain related to the deconsolidation to general and administrative expenses for the year ended December 31, 2020. CCB contributed a total of $0.5 million in net operating revenue and $6.9 million in net(loss) earnings for the year ended December 31, 2020, primarily related to the gain on deconsolidation.
We wrote-down $0.7 million related to the portion of the liability that we had sought to collect from LOT Polish Airlines (“LOT”) and a $0.3 million receivable related to MCE in the year ended December 31, 2020.
Our cruise ship operations were impacted by COVID-19 related closures in 2020 and 2021. See “Corporate and Other” below for additional information on the closures.
Deferred Financing – We wrote-off approximately $7.3 million of deferred financing costs to interest expense in the second quarter of 2022 in connection with the prepayment of the $170.0 million term loan (the “Macquarie Term Loan”) issued under the Macquarie Credit Agreement.2023.
Inflation and Staffing– We have seen material increases in our operating expenses such asat our properties, including payroll wages and benefits, insurance and utilities, maintenance costs and food and beverage costs, increase at our properties but the increasescosts. We have not been material to date.
Staffing – We havealso experienced difficulties attracting and retaining staff at some locations in the US and Canada. As a result, we have had to adjust hours of some food and beverage outlets, the number of table games open and the number of rooms available at some of our hotels. We have been able to make adjustments during non-peak times and have not seen a materialto mitigate some of the impact to our operating results.
Poland Casino Closures – We closed three casinos in the fourth quarter of 2023 due to delays in obtaining new licenses. See “Reportable Segments – Poland” below in this Item 7 for additional information about our Polish casino licenses.
Canada (Calgary) – In February 2022, we sold the land and building that we owned in Calgary. We recorded a loss on the sale of the land and building of CAD 2.7 million ($2.2 million based on the average exchange rate for the month ended February 28, 2022). We received earn out payments of CAD 2.1 million ($1.7 million based on the exchange rate of December 31, 2023) for the year ended December 31, 2023 that are recorded to gain on sale of casino operations on our consolidated statements of (loss) earnings.
COVID-19 (Canada) – Through early February 2022 we required customers to provide proof of vaccination, a negative rapid test result or an original medical exemption letter for entry to comply with a government mandate. In accordance with a government mandate, all customers and employees were required to wear masks while indoors through early March 2022. As the spread of COVID-19 slowed and these measures were lifted, we saw increased guest numbers and increased revenue in the remainder of 2022 and in 2023 as compared to 2021.
COVID Closures (2021) – We estimate that for the year ended December 31, 2021 net operating revenue was adversely impacted by approximately $35.9 million and Adjusted EBITDAR was adversely impacted by approximately $13.1 million due to the closures in Canada and Poland during the year.
Increased Interest Expense – Increased interest expense negatively impacted net loss attributable to Century Casinos, Inc. shareholders in 2023. Interest expense increased $13.0 million due to additional properties added to the Master Lease, approximately $14.6 million due to increased borrowings under our Goldman Credit Agreement in April 2022 in connection with the Nugget Acquisition, increased interest rates on the term loan and borrowing on the revolving facility under our Goldman Credit Agreement, and $7.3 million related to the CDR land lease debt extinguishment in connection with the Canada Real Estate Sale. In 2022, we wrote-off approximately $7.3 million of deferred financing costs to interest expense in connection with the prepayment of the $170.0 million term loan (the “Macquarie Term Loan”) issued under a credit agreement with Macquarie Capital (the “Macquarie Credit Agreement”).
Valuation Allowance – We released a $10.2 million US valuation allowance which contributed toagainst deferred tax assets, resulting in an income tax benefit of $7.7 million for the year ended December 31, 2022.2022 in the Corporate and Other reportable segment.
Summary of Changes by Reportable Segment
Net operating revenue increased by $119.7 million, or 27.8%, and by $42.0 million, or 10.8%, for the year ended December 31, 2023 compared to the year ended December 31, 2022 and by $84.2 million, or 27.7%, for the year ended December 31, 2022 compared to the year ended December 31, 2021, and for the year ended December 31, 2021 compared to the year ended December 31, 2020, respectively. Following is a breakout of net operating revenue by reportable segment for the year ended December 31, 2023 compared to the year ended December 31, 2022 and for the year ended December 31, 2022 compared to the year ended December 31, 2021 and for the year ended December 31, 2021 compared to the year ended December 31, 2020.2021.
United States increased by $112.0 million, or 41.7%, and decreased by ($14.7) million, or (5.2%), and increased by $84.9 million, or 42.8%.
Canada increased by $3.9 million, or 5.4%, and by $25.1 million, or 54.2%, and decreased by ($3.8) million, or (7.6%).
Poland increased by $3.9 million, or 4.4%, and by $31.9 million, or 54.9%, and by $4.0 million, or 7.3%.
Corporate and Other decreased by ($0.1) million, or (70.4%), and by ($0.4) million, or (63.7%), and by ($0.8) million, or (59.9%).
Operating costs and expenses increased by $121.1 million, or 33.1%, and by $46.2 million, or 14.4%, for the year ended December 31, 2023 compared to the year ended December 31, 2022 and by $15.6 million, or 5.1%, for the year ended December 31, 2022 compared to the year ended December 31, 2021, and for the year ended December 31, 2021 compared to the year ended December 31, 2020, respectively. Following is a breakout of operating costs and expenses by reportable segment for the year ended December 31, 2023 compared to the year ended December 31, 2022 and for the year ended December 31, 2022 compared to the year ended December 31, 2021.
United States increased by $108.9 million, or 52.4%, and by $1.4 million, or 0.7%.
Canada increased by $0.3 million, or 0.4%, and by $18.2 million, or 43.5%.
Poland increased by $7.6 million, or 9.4%, and by $22.3 million, or 38.0%.
Corporate and Other increased by $4.4 million, or 25.1%, and by $4.2 million, or 32.2%.
Earnings from operations decreased by ($3.6) million, or (5.3%), and by ($0.9) million, or (1.3%), for the year ended December 31, 2023 compared to the year ended December 31, 2022 and for the year ended December 31, 2022 compared to the year ended December 31, 2021, respectively. Following is a breakout of earnings from operations by reportable segment for the year ended December 31, 2023 compared to the year ended December 31, 2022 and for the year ended December 31, 20212022 compared to the year ended December 31, 2020.2021.
United States increased by $1.4$3.1 million, or 0.7%5.1%, and decreased by $6.7($16.1) million, or 3.4%(21.0%).
Canada increased by $18.2$3.6 million, or 43.5%31.5%, and by $1.0$6.9 million, or 2.5%152.8%.
Poland decreased by ($3.7) million, or (39.7%), and increased by $22.3$9.6 million, or 38.0%, and by $1.6 million, or 2.8%2177.9%.
Corporate and Other increaseddecreased by $4.2($6.6) million, or 32.2%(47.6%), and by $6.2($1.3) million, or 90.3%(10.7%).
Earnings from operationsNet earnings decreased by ($0.9)36.2) million, or (1.3%(453.5%), and increased by $68.6($12.6) million, or 54051.2%(61.3%), for the year ended December 31, 2023 compared to the year ended December 31, 2022 and for the year ended December 31, 2022 compared to the year ended December 31, 2021, and for the year ended December 31, 2021 compared to the year ended December 31, 2020, respectively. Following is a breakout of earnings (loss) from operations by segment for the year ended December 31, 2022 compared to the year ended December 31, 2021 and for the year ended December 31, 2021 compared to the year ended December 31, 2020.
United States decreased by ($16.1) million, or (21.0%), and increased by $78.2 million, or 6566.9%.
Canada increased by $6.9 million, or 152.8%, and decreased by ($4.8) million, or (51.5%).
Poland increased by $9.6 million, or 2177.9%, and by $2.3 million, or 84.1%.
Corporate Other decreased by ($1.3) million, or (10.7%), and by ($7.1) million, or (128.9%).
Net earnings decreased by ($12.6) million, or (61.3%), and increased by $68.6 million, or 143.0%, for the year ended December 31, 2022 compared to the year ended December 31, 2021 and for the year ended December 31, 2021 compared to the year ended December 31, 2020, respectively. Items deducted from or added to earnings from operations to arrive at net (loss) earnings include interest income, interest expense, gains (losses) on foreign currency transactions and other, income tax expense and non-controlling interests. Items that impacted the comparability of the results are discussed above. For a discussion of these items, see “Non-Operating Income (Expense)” and “Taxes” below in this Item 7.
Other
Pari-Mutuel
Pari-mutuel revenue includes live racing, export, advanced deposit wagering and off-track betting. Pari-mutuel expenses relate to pari-mutuel revenue and the operation of our racetracks.
Other
Other revenue and other expenses include gift shops, entertainment, golf and spa. Other revenue also includes revenue from ATM and credit card commissions.
Non-GAAP Measures – Adjusted EBITDADefinitions and Calculations
Adjusted EBITDAR
Adjusted EBITDAR is used outside of our financial statements as a valuation metric. We define Adjusted EBITDAEBITDAR as net (loss) earnings (loss) attributable to Century Casinos, Inc. shareholders before interest expense (income), net, including interest expense related to the Master Lease as discussed below, income taxes (benefit), depreciation, amortization, non-controlling interests net earnings (losses) and transactions, pre-opening expenses, acquisition costs, non-cash stock-based compensation charges, asset impairment costs, loss (gain) on disposition of fixed assets, discontinued operations, (gain) loss on foreign currency transactions, cost recovery income and other, gain on business combination and certain other one-time transactions. Expense related to the Master Lease is included in the interest expense (income), net line item. Intercompany transactions consisting primarily of management and royalty fees and interest, along with their related tax effects, are excluded from the presentation of net earnings (loss) attributable to Century Casinos, Inc. shareholders and Adjusted EBITDAEBITDAR reported for each reportable segment. Not all of the aforementioned items occur in each reporting period, but have been included in the definition based on historical activity. These adjustments have no effect on the consolidated results as reported under US generally accepted accounting principles (“US GAAP”). Adjusted EBITDA is not considered a measure of performance recognized under US GAAP.
Management believes that The Master Lease is accounted for as a financing obligation. As such, a portion of the periodic payment under the Master Lease is recognized as interest expense with the remainder of the payment impacting the financing obligation using the effective interest method.
Adjusted EBITDAEBITDAR information is a valuablenon-GAAP measure of the relative performance of the Companythat is a valuation metric, should not be used as an operating metric, and its properties. The gaming industry commonly uses Adjusted EBITDAis presented solely as a methodsupplemental disclosure to reported US GAAP measures because we believe this measure is widely used by analysts, lenders, financial institutions, and investors as a principal basis for the valuation of arriving at the economic value of a casino operation. Management uses Adjusted EBITDA to evaluate and forecast the operating performance of the Company and its properties as well as to compare results of current periods to prior periods.gaming companies. Management believes that presenting Adjusted EBITDAEBITDAR to investors provides them with information used by management for financial and operational decision makingdecision-making in order to understand the Company’s operating performance and evaluate the methodology used by management to evaluate and measure such performance. Management believes that using excluding rent expense related to the Master Lease provides useful information to analysts, lenders, financial institutions, and investors when valuing us, as well as comparing our results to other gaming companies, without regard to differences in capital structure and leasing arrangements since the operations of other gaming companies may or may not include triple-net operating leases.
Adjusted EBITDA isEBITDAR should not be viewed as a useful way to compare the relativemeasure of overall operating performance as an indicator of separate reportable segmentsour performance, considered in isolation, or construed as an alternative to operating income or net income, the most directly comparable GAAP measure, or as an alternative to cash flows from operating activities, as a measure of liquidity, or as an alternative to any other measure determined in accordance with generally accepted accounting principles because this measure is not presented on a US GAAP basis and excludes certain expenses, including the rent expense related to our Master Lease, and is provided for the limited purposes discussed herein. In addition, Adjusted EBITDAR as used by eliminatingus may not be defined in the above-mentioned items associated with the varying levels of capital expenditures for infrastructure required to generate revenue,same manner as other companies in our industry, and, the often high cost of acquiring existing operations. Our computation of Adjusted EBITDA may be different from, and thereforeas a result, may not be comparable to similarsimilarly titled non-GAAP financial measures used byof other companies withincompanies. Consolidated Adjusted EBITDAR should not be viewed as a measure of overall operating performance or considered in isolation or as an alternative to net income, because it excludes the gaming industry.rent expense associated with our Master Lease and certain other items.
The reconciliation of Adjusted EBITDAEBITDAR to net (loss) earnings (loss) attributable to Century Casinos, Inc. shareholders is presented below.
|
|
|
|
|
|
|
|
|
|
|
|
|
|
|
|
|
|
|
|
|
| For the year ended December 31, 2022 | For the year ended December 31, 2023 |
Amounts in thousands |
|
| United States |
|
| Canada |
|
| Poland |
|
| Corporate and Other |
|
| Total |
|
| United States |
|
| Canada |
|
| Poland |
|
| Corporate and Other |
|
| Total |
Net earnings (loss) attributable to Century Casinos, Inc. shareholders |
| $ | 24,759 |
| $ | 6,070 |
| $ | 5,811 |
| $ | (28,664) |
| $ | 7,976 |
| $ | 18,036 |
| $ | 8,626 |
| $ | 3,446 |
| $ | (58,306) |
| $ | (28,198) |
Interest expense (income), net (1) |
| 28,531 |
| 2,281 |
| (686) |
| 34,854 |
|
| 64,980 |
| 38,024 |
| 11,527 |
| (345) |
| 42,605 |
|
| 91,811 |
Income taxes (benefit) |
| 7,595 |
| 2,354 |
| 2,326 |
| (19,935) |
|
| (7,660) | |
Income tax expense (benefit) | |
| 2,654 |
| (4,256) |
| 1,534 |
| (5,275) |
|
| (5,343) |
Depreciation and amortization |
| 19,364 |
| 4,754 |
| 2,606 |
| 385 |
|
| 27,109 |
| 33,739 |
| 4,590 |
| 2,482 |
| 232 |
|
| 41,043 |
Net earnings attributable to non-controlling interests |
| — |
| 2,787 |
| 2,907 |
| — |
|
| 5,694 |
| 5,284 |
| 2,701 |
| 1,724 |
| — |
|
| 9,709 |
Non-cash stock-based compensation |
| — |
| — |
| — |
| 3,335 |
|
| 3,335 |
| — |
| — |
| — |
| 3,610 |
|
| 3,610 |
(Gain) loss on foreign currency transactions, cost recovery income and other (2) |
| (1) |
| 123 |
| (1,153) |
| (205) |
|
| (1,236) |
| (84) |
| (3,195) |
| (810) |
| 401 |
|
| (3,688) |
Loss (gain) on disposition of fixed assets |
| 49 |
| 27 |
| 63 |
| (121) |
|
| 18 | |
Loss on disposition of fixed assets | |
| 537 |
| 10 |
| 31 |
| 113 |
|
| 691 |
Acquisition costs |
| — |
| — |
| — |
| 3,124 |
|
| 3,124 |
| — |
| — |
| — |
| 4,412 |
|
| 4,412 |
Adjusted EBITDA |
| $ | 80,297 |
| $ | 18,396 |
| $ | 11,874 |
| $ | (7,227) |
| $ | 103,340 | |
Adjusted EBITDAR | |
| $ | 98,190 |
| $ | 20,003 |
| $ | 8,062 |
| $ | (12,208) |
| $ | 114,047 |
|
|
|
|
|
|
|
|
|
|
|
|
|
|
|
|
|
|
|
|
|
|
|
|
|
|
|
|
|
|
|
(1)ExpenseSee “Non-Operating Income (Expense) – Interest” below for a breakdown of $28.5 million related to our Master Lease is included in interest expense (income), net and “Liquidity and Capital Resources” below for more information on the rent payments related to the Master Lease.
(2)Included in the United States segment. Expense of $2.3Canada segment is $1.7 million gain related to our CDR land lease is includedthe earn out payment from the sale of casino operations in Calgary in 2020 and $3.5 million cost recovery income for CDR.
|
|
|
|
|
|
|
|
|
|
|
|
|
|
|
|
| For the year ended December 31, 2022 |
Amounts in thousands |
|
| United States |
|
| Canada |
|
| Poland |
|
| Corporate and Other |
|
| Total |
Net earnings (loss) attributable to Century Casinos, Inc. shareholders |
| $ | 24,759 |
| $ | 6,070 |
| $ | 5,811 |
| $ | (28,664) |
| $ | 7,976 |
Interest expense (income), net (1) |
|
| 28,531 |
|
| 2,281 |
|
| (686) |
|
| 34,854 |
|
| 64,980 |
Income tax expense (benefit) |
|
| 7,595 |
|
| 2,354 |
|
| 2,326 |
|
| (19,935) |
|
| (7,660) |
Depreciation and amortization |
|
| 19,364 |
|
| 4,754 |
|
| 2,606 |
|
| 385 |
|
| 27,109 |
Net earnings attributable to non-controlling interests |
|
| — |
|
| 2,787 |
|
| 2,907 |
|
| — |
|
| 5,694 |
Non-cash stock-based compensation |
|
| — |
|
| — |
|
| — |
|
| 3,335 |
|
| 3,335 |
(Gain) loss on foreign currency transactions, cost recovery income and other (2) |
|
| (1) |
|
| 123 |
|
| (1,153) |
|
| (205) |
|
| (1,236) |
Loss (gain) on disposition of fixed assets |
|
| 49 |
|
| 27 |
|
| 63 |
|
| (121) |
|
| 18 |
Acquisition costs |
|
| — |
|
| — |
|
| — |
|
| 3,124 |
|
| 3,124 |
Adjusted EBITDAR |
| $ | 80,297 |
| $ | 18,396 |
| $ | 11,874 |
| $ | (7,227) |
| $ | 103,340 |
|
|
|
|
|
|
|
|
|
|
|
|
|
|
|
|
(1)See “Non-Operating Income (Expense) – Interest” below for a breakdown of interest expense (income), net inand “Liquidity and Capital Resources” below for more information on the Canada segment. Cashrent payments related to ourthe Master Lease and CDR land lease were $25.7 million and $2.1 million, respectively, for the period presented. Expense of $7.3 related to the write-off of deferred financing costs in connection with the prepayment of the Macquarie Term Loan is included in interest expense (income), net in the Corporate and Other segment.Lease.
(2)Loss of $2.2 million related to the sale of the land and building in Calgary in February 2022 is included in the Canada segment. The loss from the sale was offset by $1.9 million cost recovery income for CDR.
|
|
|
|
|
|
|
|
|
|
|
|
|
|
|
|
| For the year ended December 31, 2021 |
Amounts in thousands |
|
| United States |
|
| Canada |
|
| Poland |
|
| Corporate and Other |
|
| Total |
Net earnings (loss) attributable to Century Casinos, Inc. shareholders |
| $ | 49,628 |
| $ | 1,124 |
| $ | 440 |
| $ | (30,570) |
| $ | 20,622 |
Interest expense (income), net (1) |
|
| 28,229 |
|
| 1,796 |
|
| (477) |
|
| 13,110 |
|
| 42,658 |
Income taxes |
|
| — |
|
| 1,256 |
|
| 257 |
|
| 4,858 |
|
| 6,371 |
Depreciation and amortization |
|
| 18,398 |
|
| 4,904 |
|
| 3,028 |
|
| 432 |
|
| 26,762 |
Net earnings attributable to non-controlling interests |
|
| — |
|
| 932 |
|
| 224 |
|
| — |
|
| 1,156 |
Non-cash stock-based compensation |
|
| — |
|
| — |
|
| — |
|
| 2,652 |
|
| 2,652 |
Gain on foreign currency transactions, cost recovery income and other (2) |
|
| (836) |
|
| (545) |
|
| (887) |
|
| (418) |
|
| (2,686) |
Loss (gain) on disposition of fixed assets |
|
| 341 |
|
| 43 |
|
| 44 |
|
| (37) |
|
| 391 |
Adjusted EBITDA |
| $ | 95,760 |
| $ | 9,510 |
| $ | 2,629 |
| $ | (9,973) |
| $ | 97,926 |
|
|
|
|
|
|
|
|
|
|
|
|
|
|
|
|
|
|
|
|
|
|
|
|
|
|
|
|
|
|
|
|
| For the year ended December 31, 2021 |
Amounts in thousands |
| United States |
| Canada |
| Poland |
| Corporate and Other |
| Total |
Net earnings (loss) attributable to Century Casinos, Inc. shareholders |
| $ | 49,628 |
| $ | 1,124 |
| $ | 440 |
| $ | (30,570) |
| $ | 20,622 |
Interest expense (income), net (1) |
|
| 28,229 |
|
| 1,796 |
|
| (477) |
|
| 13,110 |
|
| 42,658 |
Income tax expense |
|
| — |
|
| 1,256 |
|
| 257 |
|
| 4,858 |
|
| 6,371 |
Depreciation and amortization |
|
| 18,398 |
|
| 4,904 |
|
| 3,028 |
|
| 432 |
|
| 26,762 |
Net earnings attributable to non-controlling interests |
|
| — |
|
| 932 |
|
| 224 |
|
| — |
|
| 1,156 |
Non-cash stock-based compensation |
|
| — |
|
| — |
|
| — |
|
| 2,652 |
|
| 2,652 |
Gain on foreign currency transactions, cost recovery income and other (2) |
|
| (836) |
|
| (545) |
|
| (887) |
|
| (418) |
|
| (2,686) |
Loss (gain) on disposition of fixed assets |
|
| 341 |
|
| 43 |
|
| 44 |
|
| (37) |
|
| 391 |
Adjusted EBITDAR |
| $ | 95,760 |
| $ | 9,510 |
| $ | 2,629 |
| $ | (9,973) |
| $ | 97,926 |
|
|
|
|
|
|
|
|
|
|
|
|
|
|
|
|
(1)ExpenseSee “Non-Operating Income (Expense) – Interest” below for a breakdown of $28.2 million related to our Master Lease is included in interest expense (income), net inand “Liquidity and Capital Resources” below for more information on the United States segment. Expense of $1.8 million related to our CDR land lease is included in interest expense (income), net in the Canada segment. Cashrent payments related to ourthe Master Lease and CDR land lease were $25.3 million and $2.0 million, respectively, for the period presented.Lease.
(2)Income of $0.8 million is included in the United States segment related to the sale of excess land at Mountaineer, net of related expenses.
|
|
|
|
|
|
|
|
|
|
|
|
|
|
|
|
| For the year ended December 31, 2020 |
Amounts in thousands |
| United States |
| Canada |
| Poland |
| Corporate and Other |
| Total |
Net (loss) earnings attributable to Century Casinos, Inc. shareholders |
| $ | (30,571) |
| $ | 2,551 |
| $ | (1,373) |
| $ | (18,609) |
| $ | (48,002) |
Interest expense (income), net (1) |
|
| 28,357 |
|
| 2,047 |
|
| 27 |
|
| 12,667 |
|
| 43,098 |
Income taxes (benefit) |
|
| 1,023 |
|
| 3,765 |
|
| (518) |
|
| 578 |
|
| 4,848 |
Depreciation and amortization |
|
| 17,580 |
|
| 5,264 |
|
| 3,124 |
|
| 566 |
|
| 26,534 |
Net earnings (loss) attributable to non-controlling interests |
|
| — |
|
| 553 |
|
| (687) |
|
| — |
|
| (134) |
Non-cash stock-based compensation |
|
| — |
|
| — |
|
| — |
|
| (214) |
|
| (214) |
Gain on foreign currency transactions, cost recovery income and other (2) |
|
| — |
|
| (6,015) |
|
| (233) |
|
| (6,897) |
|
| (13,145) |
Impairment - intangible and tangible assets |
|
| 30,746 |
|
| 3,375 |
|
| — |
|
| 1,000 |
|
| 35,121 |
Loss (gain) on disposition of fixed assets |
|
| 64 |
|
| (43) |
|
| 4 |
|
| 1 |
|
| 26 |
Acquisition costs |
|
| — |
|
| — |
|
| — |
|
| 266 |
|
| 266 |
Adjusted EBITDA |
| $ | 47,199 |
| $ | 11,497 |
| $ | 344 |
| $ | (10,642) |
| $ | 48,398 |
|
|
|
|
|
|
|
|
|
|
|
|
|
|
|
|
(1)Expense of $28.4 million related to our Master Lease is included in interest expense (income), net in the United States segment. Expense of $1.5 million related to our CDR land lease is included in interest expense (income), net in the Canada segment. Cash payments related to our Master Lease and CDR land lease were $25.0 million and $1.3 million, respectively, for the period presented.
(2)Income of $6.5 million is included in the Canada segment related to the gain on sale of the casino operations of Century Casino Calgary.
Non-GAAP Measures – Net Debt
We define Net Debt as total long-term debt (including current portion) plus deferred financing costs minus cash and cash equivalents. Net Debt is not considered a liquidity measure recognized under US GAAP. Management believes that Net Debt is a valuable measure of our overall financial situation. Net Debt provides investors with an indication of our ability to pay off all of our long-term debt if it becomes due simultaneously. The reconciliation of Net Debt is presented below.
|
|
|
|
|
|
|
|
|
|
|
|
|
|
|
|
|
|
Amounts in thousands |
| December 31, 2022 |
| December 31, 2021 |
| December 31, 2023 |
| December 31, 2022 |
Total long-term debt, including current portion |
| $ | 349,580 |
| $ | 181,484 |
| $ | 332,680 |
| $ | 349,580 |
Deferred financing costs |
|
| 16,844 |
|
| 7,695 |
|
| 14,149 |
|
| 16,844 |
Total principal |
| $ | 366,424 |
| $ | 189,179 |
| $ | 346,829 |
| $ | 366,424 |
Less: Cash and cash equivalents |
| $ | 101,785 |
| $ | 107,821 |
| $ | 171,327 |
| $ | 101,785 |
Net Debt |
| $ | 264,639 |
| $ | 81,358 |
| $ | 175,502 |
| $ | 264,639 |
|
|
|
|
|
|
|
|
|
|
|
|
|
REPORTABLE SEGMENTS
The following discussion provides further detail of consolidated results by reportable segment.
|
|
|
|
|
|
|
|
|
|
|
|
|
|
|
|
|
|
|
|
|
|
|
|
|
|
|
|
|
United States |
|
|
|
|
|
|
|
|
|
|
|
|
|
|
|
|
|
|
|
|
|
|
|
|
|
|
|
|
|
| For the year |
|
|
|
|
|
|
|
|
| For the year |
|
|
|
|
|
|
|
|
|
| ended December 31, |
| 2022/2021 |
|
| 2021/2020 |
| ended December 31, |
| 2023/2022 |
|
| 2022/2021 |
Amounts in thousands |
| 2022 |
| 2021 |
|
| 2020 |
|
| $ Change |
| % Change |
|
| $ Change |
| % Change |
| 2023 |
| 2022 |
|
| 2021 |
|
| $ Change |
| % Change |
|
| $ Change |
| % Change |
Gaming Revenue |
| $ | 232,871 |
| $ | 249,397 |
| $ | 168,904 |
| $ | (16,526) |
| (6.6%) |
| $ | 80,493 |
| 47.7% |
| $ | 272,499 |
| $ | 232,871 |
| $ | 249,397 |
| $ | 39,628 |
| 17.0% |
| $ | (16,526) |
| (6.6%) |
Pari-mutuel, Sports Betting and iGaming Revenue |
| 8,728 |
| 8,492 |
| 7,502 |
|
| 236 |
| 2.8% |
|
| 990 |
| 13.2% |
| 10,145 |
| 8,728 |
| 8,492 |
|
| 1,417 |
| 16.2% |
|
| 236 |
| 2.8% |
Hotel Revenue |
| 9,159 |
| 8,241 |
| 5,826 |
|
| 918 |
| 11.1% |
|
| 2,415 |
| 41.5% |
| 41,750 |
| 9,159 |
| 8,241 |
|
| 32,591 |
| 355.8% |
|
| 918 |
| 11.1% |
Food and Beverage Revenue |
| 12,394 |
| 11,761 |
| 9,795 |
|
| 633 |
| 5.4% |
|
| 1,966 |
| 20.1% |
| 36,803 |
| 12,394 |
| 11,761 |
|
| 24,409 |
| 196.9% |
|
| 633 |
| 5.4% |
Other Revenue |
|
| 5,430 |
|
| 5,394 |
|
| 6,317 |
|
| 36 |
| 0.7% |
|
| (923) |
| (14.6%) |
|
| 19,394 |
|
| 5,430 |
|
| 5,394 |
|
| 13,964 |
| 257.2% |
|
| 36 |
| 0.7% |
Net Operating Revenue |
|
| 268,582 |
|
| 283,285 |
|
| 198,344 |
|
| (14,703) |
| (5.2%) |
|
| 84,941 |
| 42.8% |
|
| 380,591 |
|
| 268,582 |
|
| 283,285 |
|
| 112,009 |
| 41.7% |
|
| (14,703) |
| (5.2%) |
Gaming Expenses |
|
| (117,731) |
|
| (120,316) |
|
| (90,553) |
|
| (2,585) |
| (2.1%) |
|
| 29,763 |
| 32.9% |
|
| (145,799) |
|
| (117,731) |
|
| (120,316) |
|
| 28,068 |
| 23.8% |
|
| (2,585) |
| (2.1%) |
Pari-mutuel, Sports Betting and iGaming Expenses |
| (6,402) |
| (6,656) |
| (6,423) |
|
| (254) |
| (3.8%) |
|
| 233 |
| 3.6% |
| (6,416) |
| (6,402) |
| (6,656) |
|
| 14 |
| 0.2% |
|
| (254) |
| (3.8%) |
Hotel Expenses |
| (2,568) |
| (2,315) |
| (2,056) |
|
| 253 |
| 10.9% |
|
| 259 |
| 12.6% |
| (14,108) |
| (2,568) |
| (2,315) |
|
| 11,540 |
| 449.4% |
|
| 253 |
| 10.9% |
Food and Beverage Expenses |
| (10,451) |
| (9,842) |
| (8,871) |
|
| 609 |
| 6.2% |
|
| 971 |
| 10.9% |
| (30,670) |
| (10,451) |
| (9,842) |
|
| 20,219 |
| 193.5% |
|
| 609 |
| 6.2% |
Other Expenses | |
| (9,601) |
| (1,004) |
| (943) |
|
| 8,597 |
| 856.3% |
|
| 61 |
| 6.5% |
General and Administrative Expenses |
| (51,182) |
| (48,737) |
| (43,306) |
|
| 2,445 |
| 5.0% |
|
| 5,431 |
| 12.5% |
| (76,260) |
| (50,178) |
| (47,794) |
|
| 26,082 |
| 52.0% |
|
| 2,384 |
| 5.0% |
Depreciation and Amortization |
| (19,364) |
| (18,398) |
| (17,580) |
|
| 966 |
| 5.3% |
|
| 818 |
| 4.7% |
| (33,739) |
| (19,364) |
| (18,398) |
|
| 14,375 |
| 74.2% |
|
| 966 |
| 5.3% |
Impairment - Intangible and Tangible Assets |
|
| — |
|
| — |
|
| (30,746) |
|
| — |
| — |
|
| (30,746) |
| (100.0%) | |
Total Operating Costs and Expenses |
|
| (207,698) |
|
| (206,264) |
|
| (199,535) |
|
| 1,434 |
| 0.7% |
|
| 6,729 |
| 3.4% |
|
| (316,593) |
|
| (207,698) |
|
| (206,264) |
|
| 108,895 |
| 52.4% |
|
| 1,434 |
| 0.7% |
Earnings (Loss) from Operations |
|
| 60,884 |
|
| 77,021 |
|
| (1,191) |
|
| (16,137) |
| (21.0%) |
|
| 78,212 |
| 6566.9% | |
Earnings from Operations | |
|
| 63,998 |
|
| 60,884 |
|
| 77,021 |
|
| 3,114 |
| 5.1% |
|
| (16,137) |
| (21.0%) |
|
|
|
|
|
|
|
|
|
|
|
|
|
|
|
|
|
|
|
|
|
|
|
|
|
|
|
|
|
|
|
|
|
|
|
|
|
|
|
Income Tax Expense |
| (7,595) |
| — |
| (1,023) |
|
| 7,595 |
| 100.0% |
|
| (1,023) |
| (100.0%) |
| (2,654) |
| (7,595) |
| — |
|
| (4,941) |
| (65.1%) |
|
| 7,595 |
| 100.0% |
Net Earnings (Loss) Attributable to Century Casinos, Inc. Shareholders |
| 24,759 |
| 49,628 |
| (30,571) |
|
| (24,869) |
| (50.1%) |
|
| 80,199 |
| 262.3% | |
Adjusted EBITDA |
| $ | 80,297 |
| $ | 95,760 |
| $ | 47,199 |
| $ | (15,463) |
| (16.1%) |
| $ | 48,561 |
| 102.9% | |
|
|
|
|
|
|
|
|
|
|
|
|
|
|
| |
Net Earnings Attributable to Non-controlling Interests | |
| (5,284) |
| — |
| — |
|
| 5,284 |
| 100.0% |
|
| — |
| — |
Net Earnings Attributable to Century Casinos, Inc. Shareholders | |
| 18,036 |
| 24,759 |
| 49,628 |
|
| (6,723) |
| (27.2%) |
|
| (24,869) |
| (50.1%) |
Adjusted EBITDAR | |
| $ | 98,190 |
| $ | 80,297 |
| $ | 95,760 |
| $ | 17,893 |
| 22.3% |
| $ | (15,463) |
| (16.1%) |
We began consolidating Nugget and Smooth Bourbon in the United States segment on April 3, 2023 following the Second Closing of the Nugget Acquisition, and we began consolidating Rocky Gap on July 25, 2023 following the closing of the Rocky Gap Acquisition.
Sports wagering in Colorado became legal onin May 1, 2020. We have partnered with sports betting operators that are conductingconduct sports wagering under each of the three Colorado master licenses for sports wagering held by our Colorado subsidiaries. One of these mobile sports betting apps launched in July 2020, a second launched in August 2021 and the third launched in September 2022. Each agreement with the sports betting operators provides for a share of net gaming revenue and a minimum revenue guarantee each year.
New table games and unlimited betting began in May 2021 in Colorado.
In December 2020,April 2021, we entered into an agreement with an iGaming partner to utilize our license with the state of West Virginia to operatebegan operating an internet and mobile interactive gaming app.application in West Virginia with two iGaming partners. The iGaming app launched in April 2021. The agreement providesagreements provide for a share of net gamingiGaming revenue.
In December 2021, we entered into an agreement to sell excess land at Mountaineer. The sale proceeds were shared between us and VICI PropCo and we recorded income related to the sale net of related expenses of $0.8 million in gain (loss) on foreign currency transactions, cost recovery income and other on our consolidated statement of (loss) earnings (loss) for the year ended December 31, 2021.
We recordedreleased the US valuation allowance in 2022 and began recording income tax expense of $7.6 million in the year ended December 31, 2022 dueexpense. The tax benefit related to the release of the US valuation allowance.allowance was recorded in the Corporate and Other reportable segment.
The table below provides the closureWalker’s Bluff Casino in Illinois opened in August 2023. This casino has increased competition for our Missouri casinos, primarily our Cape Girardeau casino, which caused a small decline in revenue and reopen dates for casinoscustomer visits in the United States duefirst couple of weeks of the Walker’s Bluff operations. However, we believe that our marketing efforts have been effective in offsetting this competition to COVID-19.
|
|
|
Operating Segment
| Closure Date
| Reopen Date
|
Colorado
| March 17, 2020
| June 15 and June 17, 2020
|
Missouri
| March 17, 2020
| June 1, 2020
|
West Virginia
| March 17, 2020
| June 5, 2020
|
date. In Cripple Creek, the competitor across the street from our casino opened its casino expansion the last week of December 2023. We did not see a competitive impact on Cripple Creek’s gaming revenue in the fourth quarter of 2023, but future periods could be impacted, either through decreased revenue or increased costs of promotional offers by us in order to compete. Additionally, two potential competing casinos may open in the Central City market in 2024. An increase in competitors in that market could lead to a decrease in visitors at our casino and have a negative impact on our results of operations in Central City.
The table below provides results belowby operating segment within the United States reportable segment. Rocky Gap was added to the East operating segment in July 2023 and Nugget was added to the West operating segment in April 2023.
|
|
|
|
|
|
|
|
|
|
|
|
|
|
|
|
|
|
|
|
|
| For the year |
|
|
|
|
|
|
|
|
|
|
|
| ended December 31, |
|
| 2023/2022 |
|
| 2022/2021 |
Amounts in millions |
|
| 2023 |
|
| 2022 |
|
| 2021 |
|
| $ Change |
| % Change |
|
| $ Change |
| % Change |
Net Operating Revenue |
|
|
|
|
|
|
|
|
|
|
|
|
|
|
|
|
|
|
|
East |
| $ | 143.0 |
| $ | 112.9 |
| $ | 115.0 |
| $ | 30.1 |
| 26.7% |
| $ | (2.1) |
| (1.8%) |
Midwest |
|
| 156.8 |
|
| 155.7 |
|
| 168.3 |
|
| 1.1 |
| 0.7% |
|
| (12.6) |
| (7.5%) |
West |
|
| 80.8 |
|
| — |
|
| — |
|
| 80.8 |
| 100.0% |
|
| — |
| — |
Total United States |
|
| 380.6 |
|
| 268.6 |
|
| 283.3 |
|
| 112.0 |
| 41.7% |
|
| (14.7) |
| (5.2%) |
|
|
|
|
|
|
|
|
|
|
|
|
|
|
|
|
|
|
|
|
Operating Costs and Expenses (1) |
|
|
|
|
|
|
|
|
|
|
|
|
|
|
|
|
|
|
|
East |
| $ | 118.8 |
| $ | 94.9 |
| $ | 94.9 |
| $ | 23.9 |
| 25.2% |
| $ | — |
| — |
Midwest |
|
| 97.3 |
|
| 93.5 |
|
| 92.9 |
|
| 3.8 |
| 4.1% |
|
| 0.6 |
| 0.6% |
West |
|
| 66.7 |
|
| — |
|
| — |
|
| 66.7 |
| 100.0% |
|
| — |
| — |
Total United States |
|
| 282.8 |
|
| 188.4 |
|
| 187.8 |
|
| 94.4 |
| 50.1% |
|
| 0.6 |
| 0.3% |
(1)Operating costs and expenses are presentedcalculated as total operating costs and expenses less depreciation and amortization.
2023 Compared to illustrate2022
The following discussion highlights results for the changes inyear ended December 31, 2023 compared to the year ended December 31, 2022.
East – Increased net operating revenue and operating costs and expenses were due to the acquisition of Rocky Gap. Net operating revenue from Mountaineer decreased due to decreased gaming revenue offset by increased hotel and pari mutuel revenue. We have seen a decrease in gaming revenue in West Virginia, particularly in table games, since sports betting in Ohio began at the beginning of 2023. Operating expenses in West Virginia decreased by ($0.2) million due to a decrease in gaming-related expenses.
Midwest – Net operating revenue increased by $1.1 million. The increase was primarily due to increased gaming revenue from a full year of normalized operations at our Caruthersville location which had disruptions in 2022 from low water levels in the United StatesMississippi River, and from a full year of hotel revenue from The Farmstead, which opened in October 2022. In addition to the increased revenue in Missouri, increased revenue from the third sports betting app in Colorado that launched in September 2022 was partially offset by decreased gaming revenue in Colorado. Operating expenses in the Midwest operating segment increased due to increased payroll and marketing costs.
West – As a new operating segment in 2023, all increases are due to the acquisition of the Nugget on April 3, 2023.
2022 Compared to 2021
The following discussion highlights results for the year ended December 31, 2022 compared to the year ended December 31, 2021 as well as the changes, primarily due to COVID-19, for the year ended December 31, 2021 compared to the year ended December 31, 2020.2021.
|
|
|
|
|
|
Amounts in millions | Q1 | Q2 | Q3 | Q4 | YTD |
Colorado |
|
|
|
|
|
2022 | 10.3 | 11.6 | 13.5 | 11.2 | 46.6 |
2021 | 9.4 | 12.1 | 12.5 | 11.3 | 45.3 |
2020 | 6.7 | 2.0 | 10.4 | 9.5 | 28.6 |
2022/2021 | 0.9 | (0.5) | 1.0 | (0.1) | 1.3 |
| 9.5% | (4.0%) | 8.1% | (1.0%) | 2.9% |
2021/2020 | 2.7 | 10.1 | 2.1 | 1.8 | 16.7 |
| 40.9% | 499.1% | 20.0% | 19.3% | 58.4% |
West Virginia |
|
|
|
|
|
2022 | 26.3 | 29.7 | 30.4 | 26.5 | 112.9 |
2021 | 23.9 | 30.6 | 31.7 | 28.8 | 115.0 |
2020 | 25.1 | 12.2 | 28.4 | 24.5 | 90.2 |
2022/2021 | 2.4 | (0.9) | (1.3) | (2.3) | (2.1) |
| 9.7% | (2.8%) | (4.2%) | (7.6%) | (1.8%) |
2021/2020 | (1.2) | 18.4 | 3.3 | 4.3 | 24.8 |
| (4.7%) | 151.2% | 11.9% | 17.2% | 27.5% |
Missouri |
|
|
|
|
|
2022 | 28.7 | 29.0 | 26.8 | 24.6 | 109.1 |
2021 | 31.0 | 34.1 | 29.7 | 28.2 | 123.0 |
2020 | 21.6 | 9.6 | 23.9 | 24.5 | 79.6 |
2022/2021 | (2.3) | (5.1) | (2.9) | (3.6) | (13.9) |
| (7.6%) | (14.8%) | (9.6%) | (13.1%) | (11.3%) |
2021/2020 | 9.4 | 24.5 | 5.8 | 3.7 | 43.4 |
| 43.4% | 253.0% | 24.3% | 15.7% | 54.6% |
|
|
|
|
|
|
The results below are presented to illustrate the changes in operating expenses in the United States segment for the year ended December 31, 2022 compared to the year ended December 31, 2021 as well as changes, primarily due to COVID-19, for the year ended December 31, 2021 compared to the year ended December 31, 2020, excluding depreciation and amortization expense and impairment – intangible and tangible assets.
|
|
|
|
|
|
Amounts in millions | Q1 | Q2 | Q3 | Q4 | YTD |
Colorado |
|
|
|
|
|
2022 | 7.1 | 7.2 | 8.2 | 7.5 | 30.0 |
2021 | 6.3 | 7.2 | 7.6 | 7.3 | 28.4 |
2020 | 5.9 | 1.7 | 5.7 | 6.1 | 19.4 |
2022/2021 | 0.8 | — | 0.6 | 0.2 | 1.6 |
| 12.7% | — | 7.9% | 2.7% | 5.6% |
2021/2020 | 0.4 | 5.5 | 1.9 | 1.2 | 9.0 |
| 7.1% | 323.5% | 33.3% | 19.7% | 46.4% |
West Virginia |
|
|
|
|
|
2022 | 22.0 | 24.7 | 25.1 | 23.1 | 94.9 |
2021 | 20.4 | 24.3 | 25.9 | 24.3 | 94.9 |
2020 | 23.3 | 12.7 | 23.6 | 21.2 | 80.8 |
2022/2021 | 1.6 | 0.4 | (0.8) | (1.2) | — |
| 7.8% | 1.6% | (3.1%) | (4.9%) | — |
2021/2020 | (2.9) | 11.6 | 2.3 | 3.1 | 14.1 |
| (12.4%) | 91.3% | 9.7% | 14.6% | 17.5% |
Missouri |
|
|
|
|
|
2022 | 15.9 | 16.0 | 16.2 | 15.4 | 63.5 |
2021 | 15.7 | 17.0 | 16.3 | 15.5 | 64.5 |
2020 | 15.5 | 7.3 | 14.2 | 14.1 | 51.1 |
2022/2021 | 0.2 | (1.0) | (0.1) | (0.1) | (1.0) |
| 1.3% | (5.9%) | (0.6%) | (0.6%) | (1.6%) |
2021/2020 | 0.2 | 9.7 | 2.1 | 1.4 | 13.4 |
| 1.5% | 132.9% | 14.8% | 9.9% | 26.2% |
|
|
|
|
|
|
2020 and 2021 COVID-19 Restrictions
During the closures of our United States properties in 2020, we suspended marketing initiatives, furloughed employees and reduced operating costs and expenses as much as possible. Additional savings related to gaming-related expenses.
Colorado – In Cripple Creek, table games were closed through December 2020 but the full slot floor was open by the end of 2020. In Central City, table games were closed from June to September 2020 and closed again in December 2020. In addition, after reopening in 2020, CTL’s slot floor was operating at approximately 65% from June to December 2020. Both properties reopened table games in February 2021 with restrictions on the number of gaming positions through the first quarter of 2021. Revenue from sports betting apps was $1.5 million for the year ended December 31, 2021 compared to $0.5 million for the year ended December 31, 2020.
West Virginia – During 2020 through the first quarter of 2021, the gaming floor was operating with reduced hours and at approximately 85% capacity with machines limited to six feet apart with barriers, casino hours of operation were reduced and there were capacity restrictions within the casino. Food and beverage outlets were operating with reduced hours and capacity, the hotel was operating at reduced capacity and the convention spaces were closed due to COVID-19 restrictions through the first quarter of 2021. Revenue from sports betting was $0.6 million for the year ended December 31, 2021 compared to $0.7 million for the year ended December 31, 2020. Revenue from iGaming, which began in 2021, was $0.2 million for the year ended December 31, 2021.
Missouri – After reopening in 2020 through the first quarter of 2021, the casinos operated with reduced hours and approximately 94% of the gaming floors were open. In addition, there were state-wide smoking restrictions in place through May 2021. During the first and second quarters of 2021, gaming revenue was positively impacted by federal stimulus payments.
2022 Results
Colorado – The increase in net operating revenue was primarily due to a second sports betting app that launched in August 2021 and a third sports betting app that launched in September 2022. Each agreement with the sports betting operators provides for a share of net gaming revenue and a minimum revenue guarantee each year. Revenue from sports betting apps was $2.1 million for the year ended December 31, 2022. Gaming revenue increased by $0.6 million, or 1.6%, for the year ended December 31, 2022 compared to the year ended December 31, 2021, primarily due to increased slot revenue at both properties in the third quarter of 2022. Colorado’s operating costs and expenses have increased due to increased payroll resulting from table game operations and no COVID-19 restrictions on food and beverage outlets as well as increased maintenance costs and gaming-related expenses.
West Virginia – The decrease in net operating revenue was primarily due to increased promotional allowances related to complimentary rooms and gaming offers. In addition, gaming revenue and pari-mutuel revenue decreased compared to 2021 due to lower customer volumes believed to be from economic and inflationary factors. Revenue from sports betting was $0.6 million and from iGaming was $0.6 million for the year ended December 31, 2022. West Virginia’s operatingOperating costs and expenses remained constant. In March 2022, weekend operating hours increased to 24 hours per day from 19 hours per day.
Midwest – Due to COVID-19, Missouri – Gaming revenue decreased ($14.0) million, or (11.8%), compared tocasinos operated with reduced hours and approximately 94% of the year ended December 31,gaming floors were open through the first quarter of 2021. In addition, there were state-wide smoking restrictions in place through May 2021. There were no restrictions in Colorado. The decrease in revenue was primarily due to decreased gaming revenue in Missouri, offset by increased revenue from the sports betting apps in Colorado. The decreased gaming revenue in Missouri was due to the positive impact of the stimulus payments in 2021 and decreases in the second half of 2022 due to lower customer volumes believed to be from economic and inflationary factors and decreased table game offerings due to staffing issues. In addition, revenue at our Caruthersville location was negatively impacted in 2022 by disruptions in operations due to the record low water levels in the Mississippi River that caused us to relocate the casino from the riverboat and barge to a land-based pavilion. During the transition, there were fewer slot machines and table games operating. The transition was completed in December 2022 and we believe thatto date there willhas not bebeen a material impact to operations in this temporary location while we are constructing the new land-based casino. Operating costs and expenses decreased due to decreased gaming-related expenses offset by minimum wage increases in Missouri and expenses at Caruthersville related to low water levels in the Mississippi River beginning in August 2022.
We continue to follow any government and local health board mandates related to COVID-19 and will adjust operations if there are any further COVID-19 or other health-related impacts.
A reconciliation of net earnings (loss) attributable to Century Casinos, Inc. shareholders to Adjusted EBITDA can be found in the “Non-GAAP Measures – Adjusted EBITDA” discussion above in this Item 7.
A breakdown of pari-mutuel, sports betting and iGaming revenue by operating segment is provided below.
|
|
|
|
|
|
|
|
|
|
|
|
|
|
|
|
|
|
|
|
Canada |
|
|
|
|
|
|
|
|
|
|
|
|
|
|
|
|
|
|
|
|
| For the year |
|
|
|
|
|
|
|
|
|
|
|
| ended December 31, |
|
| 2022/2021 |
|
| 2021/2020 |
Amounts in thousands |
|
| 2022 |
|
| 2021 |
|
| 2020 |
|
| $ Change |
| % Change |
|
| $ Change |
| % Change |
Gaming Revenue |
| $ | 43,972 |
| $ | 25,604 |
| $ | 30,319 |
| $ | 18,368 |
| 71.7% |
| $ | (4,715) |
| (15.6%) |
Pari-mutuel, Sports Betting and iGaming Revenue |
|
| 10,879 |
|
| 10,356 |
|
| 10,158 |
|
| 523 |
| 5.1% |
|
| 198 |
| 1.9% |
Hotel Revenue |
|
| 469 |
|
| 45 |
|
| 84 |
|
| 424 |
| 942.2% |
|
| (39) |
| (46.4%) |
Food and Beverage Revenue |
|
| 10,860 |
|
| 5,606 |
|
| 5,832 |
|
| 5,254 |
| 93.7% |
|
| (226) |
| (3.9%) |
Other Revenue |
|
| 5,392 |
|
| 4,817 |
|
| 3,847 |
|
| 575 |
| 11.9% |
|
| 970 |
| 25.2% |
Net Operating Revenue |
|
| 71,572 |
|
| 46,428 |
|
| 50,240 |
|
| 25,144 |
| 54.2% |
|
| (3,812) |
| (7.6%) |
Gaming Expenses |
|
| (9,952) |
|
| (4,730) |
|
| (5,583) |
|
| 5,222 |
| 110.4% |
|
| (853) |
| (15.3%) |
Pari-mutuel, Sports Betting and iGaming Expenses |
|
| (15,747) |
|
| (13,079) |
|
| (12,878) |
|
| 2,668 |
| 20.4% |
|
| 201 |
| 1.6% |
Hotel Expenses |
|
| (247) |
|
| (45) |
|
| (69) |
|
| 202 |
| 448.9% |
|
| (24) |
| (34.8%) |
Food and Beverage Expenses |
|
| (9,067) |
|
| (4,663) |
|
| (4,921) |
|
| 4,404 |
| 94.4% |
|
| (258) |
| (5.2%) |
General and Administrative Expenses |
|
| (18,190) |
|
| (14,473) |
|
| (15,257) |
|
| 3,717 |
| 25.7% |
|
| (784) |
| (5.1%) |
Depreciation and Amortization |
|
| (4,754) |
|
| (4,904) |
|
| (5,264) |
|
| (150) |
| (3.1%) |
|
| (360) |
| (6.8%) |
Impairment - Intangible and Tangible Assets |
|
| — |
|
| — |
|
| (3,375) |
|
| — |
| — |
|
| (3,375) |
| (100.0%) |
Gain on Sale of Casino Operations |
|
| — |
|
| — |
|
| 6,457 |
|
| — |
| — |
|
| (6,457) |
| (100.0%) |
(Loss) on Sale of Assets |
|
| (2,154) |
|
| — |
|
| — |
|
| (2,154) |
| (100.0%) |
|
| — |
| — |
Total Operating Costs and Expenses |
|
| (60,111) |
|
| (41,894) |
|
| (40,890) |
|
| 18,217 |
| 43.5% |
|
| 1,004 |
| 2.5% |
Earnings from Operations |
|
| 11,461 |
|
| 4,534 |
|
| 9,350 |
|
| 6,927 |
| 152.8% |
|
| (4,816) |
| (51.5%) |
|
|
|
|
|
|
|
|
|
|
|
|
|
|
|
|
|
|
|
|
Income Tax Expense |
|
| (2,354) |
|
| (1,256) |
|
| (3,765) |
|
| 1,098 |
| 87.4% |
|
| (2,509) |
| (66.6%) |
Net Earnings Attributable to Non-controlling Interests |
|
| (2,787) |
|
| (932) |
|
| (553) |
|
| 1,855 |
| 199.0% |
|
| 379 |
| 68.5% |
Net Earnings Attributable to Century Casinos, Inc. Shareholders |
|
| 6,070 |
|
| 1,124 |
|
| 2,551 |
|
| 4,946 |
| 440.0% |
|
| (1,427) |
| (55.9%) |
Adjusted EBITDA |
| $ | 18,396 |
| $ | 9,510 |
| $ | 11,497 |
| $ | 8,886 |
| 93.4% |
| $ | (1,987) |
| (17.3%) |
|
|
|
|
|
|
|
|
|
|
|
|
|
|
|
|
|
|
|
|
|
|
|
|
|
|
|
|
|
|
|
| For the year |
|
| ended December 31, |
Amounts in millions |
|
| 2023 |
|
| 2022 |
|
| 2021 |
East |
|
|
|
|
|
|
|
|
|
Pari-mutuel Revenue |
| $ | 5.9 |
| $ | 5.4 |
| $ | 6.2 |
Sports Betting Revenue |
|
| 0.2 |
|
| 0.6 |
|
| 0.6 |
iGaming Revenue |
|
| 1.1 |
|
| 0.6 |
|
| 0.2 |
|
|
| 7.2 |
|
| 6.6 |
|
| 7.0 |
Midwest |
|
|
|
|
|
|
|
|
|
Sports Betting Revenue |
|
| 2.8 |
|
| 2.1 |
|
| 1.5 |
West |
|
|
|
|
|
|
|
|
|
Sports Betting Revenue |
|
| 0.1 |
|
| — |
|
| — |
Total United States |
| $ | 10.1 |
| $ | 8.7 |
| $ | 8.5 |
|
|
|
|
|
|
|
|
|
|
We soldA reconciliation of Adjusted EBITDAR to net (loss) earnings attributable to Century Casinos, Inc. shareholders for the casino operations of CALUnited States reportable segment can be found in December 2020, which impacts comparability of the Calgary operating segment“Non-GAAP Measures Definitions and Calculations – Adjusted EBITDAR” discussion above in 2021. Wethis Item 7.
|
|
|
|
|
|
|
|
|
|
|
|
|
|
|
|
|
|
|
|
Canada |
|
|
|
|
|
|
|
|
|
|
|
|
|
|
|
|
|
|
|
|
| For the year |
|
|
|
|
|
|
|
|
|
|
|
| ended December 31, |
|
| 2023/2022 |
|
| 2022/2021 |
Amounts in thousands |
|
| 2023 |
|
| 2022 |
|
| 2021 |
|
| $ Change |
| % Change |
|
| $ Change |
| % Change |
Gaming Revenue |
| $ | 46,871 |
| $ | 43,972 |
| $ | 25,604 |
| $ | 2,899 |
| 6.6% |
| $ | 18,368 |
| 71.7% |
Pari-mutuel, Sports Betting and iGaming Revenue |
|
| 10,020 |
|
| 10,879 |
|
| 10,356 |
|
| (859) |
| (7.9%) |
|
| 523 |
| 5.1% |
Hotel Revenue |
|
| 519 |
|
| 469 |
|
| 45 |
|
| 50 |
| 10.7% |
|
| 424 |
| 942.2% |
Food and Beverage Revenue |
|
| 12,532 |
|
| 10,860 |
|
| 5,606 |
|
| 1,672 |
| 15.4% |
|
| 5,254 |
| 93.7% |
Other Revenue |
|
| 5,507 |
|
| 5,392 |
|
| 4,817 |
|
| 115 |
| 2.1% |
|
| 575 |
| 11.9% |
Net Operating Revenue |
|
| 75,449 |
|
| 71,572 |
|
| 46,428 |
|
| 3,877 |
| 5.4% |
|
| 25,144 |
| 54.2% |
Gaming Expenses |
|
| (10,032) |
|
| (9,952) |
|
| (4,730) |
|
| 80 |
| 0.8% |
|
| 5,222 |
| 110.4% |
Pari-mutuel, Sports Betting and iGaming Expenses |
|
| (15,336) |
|
| (15,747) |
|
| (13,079) |
|
| (411) |
| (2.6%) |
|
| 2,668 |
| 20.4% |
Hotel Expenses |
|
| (271) |
|
| (247) |
|
| (45) |
|
| 24 |
| 9.7% |
|
| 202 |
| 448.9% |
Food and Beverage Expenses |
|
| (10,700) |
|
| (9,067) |
|
| (4,663) |
|
| 1,633 |
| 18.0% |
|
| 4,404 |
| 94.4% |
Other Expenses |
|
| (121) |
|
| (201) |
|
| (357) |
|
| (80) |
| (39.8%) |
|
| (156) |
| (43.7%) |
General and Administrative Expenses |
|
| (20,985) |
|
| (17,989) |
|
| (14,116) |
|
| 2,996 |
| 16.7% |
|
| 3,873 |
| 27.4% |
Depreciation and Amortization |
|
| (4,590) |
|
| (4,754) |
|
| (4,904) |
|
| (164) |
| (3.4%) |
|
| (150) |
| (3.1%) |
Gain on Sale of Casino Operations |
|
| 1,660 |
|
| — |
|
| — |
|
| (1,660) |
| (100.0%) |
|
| — |
| — |
(Loss) on Sale of Assets |
|
| — |
|
| (2,154) |
|
| — |
|
| (2,154) |
| (100.0%) |
|
| 2,154 |
| 100.0% |
Total Operating Costs and Expenses |
|
| (60,375) |
|
| (60,111) |
|
| (41,894) |
|
| 264 |
| 0.4% |
|
| 18,217 |
| 43.5% |
Earnings from Operations |
|
| 15,074 |
|
| 11,461 |
|
| 4,534 |
|
| 3,613 |
| 31.5% |
|
| 6,927 |
| 152.8% |
|
|
|
|
|
|
|
|
|
|
|
|
|
|
|
|
|
|
|
|
Income Tax Benefit (Expense) |
|
| 4,256 |
|
| (2,354) |
|
| (1,256) |
|
| (6,610) |
| (280.8%) |
|
| 1,098 |
| 87.4% |
Net Earnings Attributable to Non-controlling Interests |
|
| (2,701) |
|
| (2,787) |
|
| (932) |
|
| (86) |
| (3.1%) |
|
| 1,855 |
| 199.0% |
Net Earnings Attributable to Century Casinos, Inc. Shareholders |
|
| 8,626 |
|
| 6,070 |
|
| 1,124 |
|
| 2,556 |
| 42.1% |
|
| 4,946 |
| 440.0% |
Adjusted EBITDAR |
| $ | 20,003 |
| $ | 18,396 |
| $ | 9,510 |
| $ | 1,607 |
| 8.7% |
| $ | 8,886 |
| 93.4% |
|
|
|
|
|
|
|
|
|
|
|
|
|
|
|
|
|
|
|
|
In February 2022, we sold the land and building of CALwe owned in February 2022, as a result of which weCalgary, transferred the lease agreement for the casino premises to the buyer and stoppedceased operating Century Sports.Sports, which impacts comparability in 2022. We have received earn out payments from the sale of the Calgary casino operations of CAD 2.2 million ($1.7 million based on the exchange rate of December 31, 2023) that are recorded to gain on sale of casino operations in our consolidated statement of (loss) earnings for the year ended December 31, 2023.
The AGLC approved the relocation ofIn late November 2022, a competing casino was relocated to a new site approximately eight miles south of Century Downs that opened in late November 2022. An increase in competitors close to ourDowns. Competition from this casino at Century Downs could havehas had a negative impact on financial results at this location. In addition, in January 2022, the AGLC removed the moratorium on new gaming facilities. While we do not expect new gaming facilities in the markets in which we operate, an increase in competitors could have a negative impact on our results of operations in Alberta.
OnIn February 28, 2023, the AGLC approved a temporary increase from the current 15% of slot machinesmachine net sales retained by casinos to 17% effective from April 1, 2023 through March 31, 2025. The increase in the slot machine net sales is expected to haveretention percentage had a positive impact on net operating revenue and results of operations at our Canadian properties.properties during this time period. Effective August 1, 2023, the AGLC extended the operating hours for slot machines by 30 minutes on weekdays and 90 minutes on weekends.
Results in US dollars were impacted by a (3.8%) exchange rate decrease and 6.5% exchange rate increase in the average rates between the US dollar and the Canadian dollar for the year ended December 31, 2022 compared to the year ended December 31, 2021 and the year ended December 31, 2021 compared to the year ended December 31, 2020, respectively.
The table below provides the closure and reopen dates for casinos in Canada due to COVID-19.
|
|
Closure Date
| Reopen Date
|
March 17, 2020
| June 13, 2020
|
December 13, 2020
| June 10, 2021
|
The results below are presented to illustrate changes in net operating revenue, primarily due to COVID-19, inIn September 2023, we completed the Canada segmentReal Estate Sale. As part of the sale, we purchased the land at CDR prior to its sale to VICI PropCo. The purchase of the land at CDR resulted in a loss on debt extinguishment of CAD 9.9 million ($7.3 million based on the exchange rate as of September 6, 2023) that is recorded as interest expense in our consolidated statement of (loss) earnings for the year ended December 31, 2022 compared to the year ended December 31, 2021 and the year ended December 31, 2021 compared to the year ended December 31, 2020, respectively.2023.
|
|
|
|
|
|
Amounts in millions | Q1 | Q2 | Q3 | Q4 | YTD |
Edmonton - CAD |
|
|
|
|
|
2022 | 13.6 | 16.8 | 17.8 | 15.8 | 64.0 |
2021 | 1.3 | 5.1 | 17.8 | 13.5 | 37.7 |
2020 | 13.1 | 3.9 | 13.5 | 10.2 | 40.7 |
2022/2021 | 12.3 | 11.7 | — | 2.3 | 26.3 |
| 926.4% | 230.1% | — | 16.7% | 69.5% |
2021/2020 | (11.8) | 1.2 | 4.3 | 3.3 | (3.0) |
| (89.9%) | 31.0% | 32.0% | 31.7% | (7.3%) |
Edmonton - USD |
|
|
|
|
|
2022 | 10.7 | 13.2 | 13.7 | 11.6 | 49.2 |
2021 | 1.0 | 4.2 | 14.2 | 10.7 | 30.1 |
2020 | 9.8 | 2.8 | 10.2 | 7.8 | 30.6 |
2022/2021 | 9.7 | 9.0 | (0.5) | 0.9 | 19.1 |
| 923.5% | 216.8% | (3.4%) | 8.2% | 63.4% |
2021/2020 | (8.8) | 1.4 | 4.0 | 2.9 | (0.5) |
| (89.3%) | 46.1% | 39.6% | 37.0% | (1.7%) |
|
|
|
|
|
|
|
|
|
|
|
|
Amounts in millions | Q1 | Q2 | Q3 | Q4 | YTD |
Calgary - CAD |
|
|
|
|
|
2022 | 6.7 | 7.5 | 8.3 | 6.6 | 29.1 |
2021 | 1.2 | 3.1 | 9.1 | 7.1 | 20.5 |
2020 | 8.5 | 2.6 | 8.6 | 6.4 | 26.1 |
2022/2021 | 5.5 | 4.4 | (0.8) | (0.5) | 8.6 |
| 449.4% | 144.5% | (8.3%) | (7.5%) | 42.0% |
2021/2020 | (7.3) | 0.5 | 0.5 | 0.7 | (5.6) |
| (85.7%) | 19.6% | 5.8% | 10.7% | (21.5%) |
Calgary - USD |
|
|
|
|
|
2022 | 5.3 | 5.8 | 6.4 | 4.9 | 22.4 |
2021 | 1.0 | 2.5 | 7.1 | 5.7 | 16.3 |
2020 | 6.4 | 1.9 | 6.4 | 4.9 | 19.6 |
2022/2021 | 4.3 | 3.3 | (0.7) | (0.8) | 6.1 |
| 447.1% | 134.9% | (11.5%) | (14.2%) | 37.1% |
2021/2020 | (5.4) | 0.6 | 0.7 | 0.8 | (3.3) |
| (84.9%) | 33.5% | 10.9% | 15.1% | (16.7%) |
|
|
|
|
|
|
The results below are presented to illustrate the changesOur casinos in operating expenses, primarily due to COVID-19, in the Canada segment for the year ended December 31, 2022 compared to the year ended December 31, 2021 and the year ended December 31, 2021 compared to the year endedwere closed from December 31, 2020 respectively, excluding depreciation and amortization expense, impairment – intangible and tangible assets and gain on sale of casino operations.
|
|
|
|
|
|
Amounts in millions | Q1 | Q2 | Q3 | Q4 | YTD |
Edmonton - CAD |
|
|
|
|
|
2022 | 11.2 | 13.0 | 14.3 | 13.2 | 51.7 |
2021 | 3.7 | 4.9 | 12.1 | 11.8 | 32.5 |
2020 | 11.6 | 4.1 | 10.3 | 7.8 | 33.8 |
2022/2021 | 7.5 | 8.1 | 2.2 | 1.4 | 19.2 |
| 202.7% | 165.3% | 18.2% | 11.9% | 59.1% |
2021/2020 | (7.9) | 0.8 | 1.8 | 4.0 | (1.3) |
| (68.2%) | 19.5% | 17.5% | 51.3% | (3.8%) |
Edmonton - USD |
|
|
|
|
|
2022 | 8.9 | 10.2 | 10.9 | 9.7 | 39.7 |
2021 | 3.0 | 3.9 | 9.6 | 9.4 | 25.9 |
2020 | 8.7 | 2.9 | 7.8 | 5.9 | 25.3 |
2022/2021 | 5.9 | 6.3 | 1.3 | 0.3 | 13.8 |
| 196.7% | 161.5% | 13.5% | 3.2% | 53.3% |
2021/2020 | (5.7) | 1.0 | 1.8 | 3.5 | 0.6 |
| (65.4%) | 34.5% | 23.1% | 59.3% | 2.4% |
|
|
|
|
|
|
|
|
|
|
|
|
Amounts in millions | Q1 | Q2 | Q3 | Q4 | YTD |
Calgary - CAD |
|
|
|
|
|
2022 | 4.0 | 4.2 | 5.3 | 4.0 | 17.5 |
2021 | 2.1 | 2.6 | 4.7 | 4.6 | 14.0 |
2020 | 6.0 | 2.5 | 5.8 | 3.6 | 17.9 |
2022/2021 | 1.9 | 1.6 | 0.6 | (0.6) | 3.5 |
| 90.5% | 61.5% | 12.8% | (13.0%) | 25.0% |
2021/2020 | (3.9) | 0.1 | (1.1) | 1.0 | (3.9) |
| (65.0%) | 4.0% | (19.0%) | 27.8% | (21.8%) |
Calgary - USD |
|
|
|
|
|
2022 | 3.2 | 3.3 | 4.1 | 2.9 | 13.5 |
2021 | 1.7 | 2.0 | 3.8 | 3.6 | 11.1 |
2020 | 4.5 | 1.8 | 4.4 | 2.7 | 13.4 |
2022/2021 | 1.5 | 1.3 | 0.3 | (0.7) | 2.4 |
| 88.2% | 65.0% | 7.9% | (19.4%) | 21.6% |
2021/2020 | (2.8) | 0.2 | (0.6) | 0.9 | (2.3) |
| (62.0%) | 11.1% | (13.6%) | 33.3% | (17.2%) |
|
|
|
|
|
|
COVID-19 has impacted each year presented aboveto June 10, 2021 due to closures or restrictions. These impacts are detailed below.COVID-19. During the closures of our Canada properties, we suspended marketing initiatives, furloughed employees and reduced operating costs and expenses as much as possible. We believe that we have captured operating synergies, labor savings and cost savings following the reopening of our Canada properties in June 2021.
2020 Comparability Impacts
Following the March 2020 closures, table games were reopened in mid-September 2020 and closed again in November 2020. Our casinos in Canada were operating with approximately 71% of the slot floor open prior to the second closures in December 2020. Closures of our showroom at CRA also negatively impacted food and beverage revenue at that property in 2020. We received wage subsidies provided by the Canadian government through the Canada Emergency Wage Subsidy (“CEWS”) that was enacted in April 2020 as a result of COVID-19 to help employers offset a portion of their employee wages for a limited period. CEWS reduced operating expenses by CAD 7.4 million ($5.5 million based on the average exchange rate for the year ended December 31, 2020) for the year ended December 31, 2020. We also received rent subsidies provided by the Canadian government through the Canada Emergency Rent Subsidy (“CERS”) that was enacted in November 2020 as a result of COVID-19 to help subsidize for a limited period rent for businesses experiencing a decrease in revenue. CERS reduced operating expenses by CAD 0.5 million ($0.4 million based on the average exchange rate for the year ended December 31, 2020) for the year ended December 31, 2020. In addition, we
sold the casino operations of CAL in December 2020. The sale resulted in a gain on sale of the casino operations which reduced total operating costs and expenses in the Calgary operating segment by $6.5 million for the year ended December 31, 2020.
2021 Comparability Impacts
We reopened the casinos in June 2021. From September 2021 to early February 2022, we required patrons to provide proof of vaccination, a negative rapid test result or an original medical exception letter for entry in order to comply with a government mandate. In accordance with a government mandate, all patrons and employees were required to wear masks while indoors. We continued closures of our showroom and hotel at CRA. These closures and the COVID-19 restrictions on restaurants and hotels through the third quarter of 2021 negatively impacted food and beverage revenue at our casinos.
Results in US dollars were impacted by (3.7%) and (3.8%) decreases in the average exchange rate between the US dollar and Canadian dollar for the year ended December 31, 2023 compared to the year ended December 31, 2022, and the year ended December 31, 2022 compared to the year ended December 31, 2021, respectively.
The tables below provide results for the Canada reportable segment.
|
|
|
|
|
|
|
|
|
|
|
|
|
|
|
|
|
|
|
|
|
| For the year |
| 2023/2022 |
|
| 2022/2021 |
|
| ended December 31, |
|
|
| % |
|
|
|
| % |
Amounts in CAD, in millions |
|
| 2023 |
|
| 2022 |
|
| 2021 |
|
| Change |
| Change |
|
| Change |
| Change |
Net Operating Revenue |
|
|
|
|
|
|
|
|
|
|
|
|
|
|
|
|
|
|
|
Canada |
|
| 101.8 |
|
| 93.1 |
|
| 58.2 |
|
| 8.7 |
| 9.4% |
|
| 34.9 |
| 60.0% |
|
|
|
|
|
|
|
|
|
|
|
|
|
|
|
|
|
|
|
|
Operating Costs and Expenses (1) |
|
|
|
|
|
|
|
|
|
|
|
|
|
|
|
|
|
|
|
Canada |
|
| 77.4 |
|
| 69.2 |
|
| 46.5 |
|
| 8.2 |
| 11.8% |
|
| 22.7 |
| 48.8% |
|
|
|
|
|
|
|
|
|
|
|
|
|
|
|
|
|
|
|
|
|
| For the year |
|
|
|
|
|
|
|
|
|
|
|
| ended December 31, |
|
| 2023/2022 |
|
| 2022/2021 |
Amounts in millions |
|
| 2023 |
|
| 2022 |
|
| 2021 |
|
| $ Change |
| % Change |
|
| $ Change |
| % Change |
Net Operating Revenue |
|
|
|
|
|
|
|
|
|
|
|
|
|
|
|
|
|
|
|
Canada |
| $ | 75.5 |
| $ | 71.6 |
| $ | 46.4 |
| $ | 3.9 |
| 5.4% |
| $ | 25.2 |
| 54.3% |
|
|
|
|
|
|
|
|
|
|
|
|
|
|
|
|
|
|
|
|
Operating Costs and Expenses (1) |
|
|
|
|
|
|
|
|
|
|
|
|
|
|
|
|
|
|
|
Canada |
| $ | 57.4 |
| $ | 53.2 |
| $ | 37.0 |
| $ | 4.2 |
| 7.9% |
| $ | 16.2 |
| 43.8% |
(1)Operating costs and expenses are calculated as total operating costs and expenses less depreciation and amortization and gain on sale of casino operations and loss on sale of assets.
2023 Compared to 2022
The following discussion highlights results for the year ended December 31, 2023 compared to the year ended December 31, 2022. Unless otherwise indicated, amounts in US dollars are for the respective years ended December 31.
As discussed above, COVID-19 restrictions were in place through the first quarter of 2022. Gaming revenue increased in 2023 at all of our Canada locations, with the exception of Century Downs, due to the COVID-19 restrictions lifting and the additional 2% slot machine net sales retained starting April 1, 2023. Gaming revenue decreased at Century Downs by (CAD 0.5 million), or (2.5%), ($0.9 million, or 6.1%), due to a competitor opening near the casino in November 2022. Operating costs and expenses increased due to increased payroll costs, cost of goods sold, utility costs and one-time costs of CAD 1.9 million ($1.4 million) related to the Canada Real Estate Sale. In February 2022, we ceased operating Century Sports, which contributed to a decrease in net operating revenue of (CAD 0.3 million) ($0.3 million) and decreased operating costs and expenses of (CAD 0.4 million) ($0.3 million) for the year ended December 31, 2023 compared to the year ended December 31, 2022.
2022 Compared to 2021
The following discussion highlights results for the year ended December 31, 2022 compared to the year ended December 31, 2021. Unless otherwise indicated, amounts in US dollars are for the respective years ended December 31.
As noted above, our Canada casinos were closed through June 2021 and additional COVID-19 restrictions were in place through the first quarter of 2022. The closures and restrictions negatively impacted revenue in Canada during this time. Operating expenses
were reduced by wage subsidies provided by the Canadian government through the Canada Emergency Wage Subsidy (“CEWS”) and rent subsidies provided by the Canadian government through the Canada Emergency Rent Subsidy (“CERS”). CEWS and CERS reduced operating expenses by CAD 3.1 million ($2.5 million based on the average exchange rate for the year ended December 31, 2021)million) and by CAD 1.6 million ($1.3 million based on the average exchange rate for the year ended December 31, 2021)million), respectively, for the year ended December 31, 2021. The sale of the casino operations of CAL decreasedIn February 2022, we ceased operating Century Sports, which contributed to a decrease in net operating revenue by approximately $2.7 millionof (CAD 1.7 million) ($1.3 million) and decreased operating costs and expenses by approximately $2.4 millionof (CAD 1.6 million) ($1.3 million) for the year ended December 31, 20212022 compared to the year ended December 31, 2020.
2022 Comparability Impacts
Through early February 2022, we required customers to provide proof of vaccination, a negative rapid test result or an original medical exception letter for entry to comply with a government mandate.2021. In accordance with a government mandate, all customers and employees were required to wear masks while indoors through early March 2022. Since the lifting of these restrictions, we have seen a positive impact in the number of customers coming to our casinos and inaddition, operating results. In Calgary, operating costs and expenses in the third quarter of 2022 increased due to hosting the World Professional Chuckwagon Association World Finals. These increases were offset by decreased expenses in 2022 because we no longer operated Century Sports.
A reconciliation of Adjusted EBITDAR to net (loss) earnings attributable to Century Casinos, Inc. shareholders to Adjusted EBITDAfor the Canada reportable segment can be found in the “Non-GAAP Measures Definitions and Calculations – Adjusted EBITDA”EBITDAR” discussion above in this Item 7.
|
|
|
|
|
|
|
|
|
|
|
|
|
|
|
|
|
|
|
|
|
|
|
|
|
|
|
|
|
Poland |
|
|
|
|
|
|
|
|
|
|
|
|
|
|
|
|
|
|
|
|
|
|
|
|
|
|
|
|
|
| For the year |
|
|
|
|
|
|
|
|
| For the year |
|
|
|
|
|
|
|
|
|
| ended December 31, |
| 2022/2021 |
|
| 2021/2020 |
| ended December 31, |
| 2023/2022 |
|
| 2022/2021 |
Amounts in thousands |
| 2022 |
| 2021 |
|
| 2020 |
|
| $ Change |
| % Change |
|
| $ Change |
| % Change |
| 2023 |
| 2022 |
|
| 2021 |
|
| $ Change |
| % Change |
|
| $ Change |
| % Change |
Gaming |
| $ | 88,959 |
| $ | 56,724 |
| $ | 53,228 |
| $ | 32,235 |
| 56.8% |
| $ | 3,496 |
| 6.6% |
| $ | 92,957 |
| $ | 88,959 |
| $ | 56,724 |
| $ | 3,998 |
| 4.5% |
| $ | 32,235 |
| 56.8% |
Food and Beverage |
| 843 |
| 421 |
| 462 |
|
| 422 |
| 100.2% |
|
| (41) |
| (8.9%) |
| 927 |
| 843 |
| 421 |
|
| 84 |
| 10.0% |
|
| 422 |
| 100.2% |
Other Revenue |
|
| 367 |
|
| 1,081 |
|
| 581 |
|
| (714) |
| (66.0%) |
|
| 500 |
| 86.1% |
|
| 221 |
|
| 367 |
|
| 1,081 |
|
| (146) |
| (39.8%) |
|
| (714) |
| (66.0%) |
Net Operating Revenue |
|
| 90,169 |
|
| 58,226 |
|
| 54,271 |
|
| 31,943 |
| 54.9% |
|
| 3,955 |
| 7.3% |
|
| 94,105 |
|
| 90,169 |
|
| 58,226 |
|
| 3,936 |
| 4.4% |
|
| 31,943 |
| 54.9% |
Gaming Expenses |
|
| (56,025) |
|
| (35,963) |
|
| (34,700) |
|
| 20,062 |
| 55.8% |
|
| 1,263 |
| 3.6% |
|
| (60,595) |
|
| (56,025) |
|
| (35,963) |
|
| 4,570 |
| 8.2% |
|
| 20,062 |
| 55.8% |
Food and Beverage Expenses |
| (3,113) |
| (2,018) |
| (2,037) |
|
| 1,095 |
| 54.3% |
|
| (19) |
| (0.9%) |
| (3,695) |
| (3,113) |
| (2,018) |
|
| 582 |
| 18.7% |
|
| 1,095 |
| 54.3% |
General and Administrative Expenses |
| (19,220) |
| (17,660) |
| (17,193) |
|
| 1,560 |
| 8.8% |
|
| 467 |
| 2.7% |
| (21,784) |
| (19,220) |
| (17,660) |
|
| 2,564 |
| 13.3% |
|
| 1,560 |
| 8.8% |
Depreciation and Amortization |
|
| (2,606) |
|
| (3,028) |
|
| (3,124) |
|
| (422) |
| (13.9%) |
|
| (96) |
| (3.1%) |
|
| (2,482) |
|
| (2,606) |
|
| (3,028) |
|
| (124) |
| (4.8%) |
|
| (422) |
| (13.9%) |
Total Operating Costs and Expenses |
|
| (80,964) |
|
| (58,669) |
|
| (57,054) |
|
| 22,295 |
| 38.0% |
|
| 1,615 |
| 2.8% |
|
| (88,556) |
|
| (80,964) |
|
| (58,669) |
|
| 7,592 |
| 9.4% |
|
| 22,295 |
| 38.0% |
Earnings (Loss) from Operations |
|
| 9,205 |
|
| (443) |
|
| (2,783) |
|
| 9,648 |
| 2177.9% |
|
| 2,340 |
| 84.1% |
|
| 5,549 |
|
| 9,205 |
|
| (443) |
|
| (3,656) |
| (39.7%) |
|
| 9,648 |
| 2177.9% |
|
|
|
|
|
|
|
|
|
|
|
|
|
|
|
|
|
|
|
|
|
|
|
|
|
|
|
|
|
|
|
|
|
|
|
|
|
|
|
Income Tax (Expense) Benefit |
| (2,326) |
| (257) |
| 518 |
|
| 2,069 |
| 805.1% |
|
| 775 |
| 149.6% | |
Net (Earnings) Loss Attributable to Non-controlling Interests |
| (2,907) |
| (224) |
| 687 |
|
| 2,683 |
| 1197.8% |
|
| 911 |
| 132.6% | |
Net Earnings (Loss) Attributable to Century Casinos, Inc. Shareholders |
| 5,811 |
| 440 |
| (1,373) |
|
| 5,371 |
| 1220.7% |
|
| 1,813 |
| 132.0% | |
Adjusted EBITDA |
| $ | 11,874 |
| $ | 2,629 |
| $ | 344 |
| $ | 9,245 |
| 351.7% |
| $ | 2,285 |
| 664.2% | |
|
|
|
|
|
|
|
|
|
|
|
|
|
|
| |
Income Tax Expense | |
| (1,534) |
| (2,326) |
| (257) |
|
| (792) |
| (34.0%) |
|
| 2,069 |
| 805.1% |
Net Earnings Attributable to Non-controlling Interests | |
| (1,724) |
| (2,907) |
| (224) |
|
| (1,183) |
| (40.7%) |
|
| 2,683 |
| 1197.8% |
Net Earnings Attributable to Century Casinos, Inc. Shareholders | |
| 3,446 |
| 5,811 |
| 440 |
|
| (2,365) |
| (40.7%) |
|
| 5,371 |
| 1220.7% |
Adjusted EBITDAR | |
| $ | 8,062 |
| $ | 11,874 |
| $ | 2,629 |
| $ | (3,812) |
| (32.1%) |
| $ | 9,245 |
| 351.7% |
In Poland, casino gaming licenses are granted for a term of six years. These licenses are not renewable. Before a gaming license expires, there is a public notification of the available license and any gaming company can apply for a new license for that city. In September 2022, CPL transferred the casino licenseThe licenses in Krakow, Lodz and for the LIM Center in Warsaw Marriott Hotel expiringall expire in July 2024 to the Warsaw Hilton Hotel, and2024. CPL was granted a new licensewill apply for the Warsaw Marriott Hotel expiringlicenses in September 2028. The next license expiration for a CPL casino occurs in October 2023 in Bielsko-Biala and Katowice and November 2023 in Wroclaw.all of these cities but there can be no assurance that such licenses will be received.
ResultsWe closed the casinos in US dollarsKatowice and Bielsko-Biala in October 2023 and in Wroclaw in November 2023 due to the expiration of the gaming licenses. We were impacted byawarded the Wroclaw license in December 2023 and the Katowice and Bielsko-Biala licenses in February 2024. The Bielsko-Biala casino reopened in February 2024, the Katowice casino is expected to reopen in mid-March 2024 and we anticipate reopening the Wroclaw casino in a (15.4%) exchange rate decrease and 1.0% exchange rate increasenew location in the average rates between the US dollar and the Polish zloty for the year ended December 31, 2022 compared to the year ended December 31, 2021 and the year ended December 31, 2021 compared to the year ended December 31, 2020, respectively.
The table below provides the closure and reopen dates forthird quarter of 2024. Through September 30, 2023, these three casinos in Poland due to COVID-19.
|
|
Closure Date
| Reopen Date
|
March 13, 2020
| May 18, 2020
|
December 29, 2020
| February 12, 2021
|
March 20, 2021
| May 28, 2021
|
The results below are presented to illustrate changes intogether generated approximately 32% of CPL’s net operating revenue, primarily due to COVID-19, in the Poland segment for the year ended December 31, 2022 compared to the year ended December 31, 2021 and the year ended December 31, 2021 compared to the year ended December 31, 2020, respectively.revenue.
|
|
|
|
|
|
Amounts in millions | Q1 | Q2 | Q3 | Q4 | YTD |
PLN |
|
|
|
|
|
2022 | 90.2 | 94.6 | 102.2 | 115.5 | 402.5 |
2021 | 22.4 | 32.4 | 82.0 | 90.7 | 227.5 |
2020 | 66.6 | 29.6 | 62.1 | 51.0 | 209.3 |
2022/2021 | 67.8 | 62.2 | 20.2 | 24.8 | 175.0 |
| 303.4% | 191.4% | 24.8% | 27.3% | 77.0% |
2021/2020 | (44.2) | 2.8 | 19.9 | 39.7 | 18.2 |
| (66.4%) | 9.9% | 32.0% | 77.8% | 8.7% |
USD |
|
|
|
|
|
2022 | 21.8 | 21.7 | 21.8 | 24.9 | 90.2 |
2021 | 5.9 | 8.7 | 21.2 | 22.4 | 58.2 |
2020 | 17.1 | 7.4 | 16.3 | 13.5 | 54.3 |
2022/2021 | 15.9 | 13.0 | 0.6 | 2.5 | 32.0 |
| 269.3% | 149.8% | 2.8% | 10.8% | 54.9% |
2021/2020 | (11.2) | 1.3 | 4.9 | 8.9 | 3.9 |
| (65.4%) | 17.6% | 30.1% | 66.8% | 7.3% |
|
|
|
|
|
|
The results below are presented to illustrate the changes in operating expenses, primarily due to COVID-19, in the Poland segment for the year ended December 31, 2022 compared to the year ended December 31, 2021 and the year ended December 31, 2021 compared to the year ended December 31, 2020, respectively, excluding depreciation and amortization expense and impairment – intangible and tangible assets.
|
|
|
|
|
|
Amounts in millions | Q1 | Q2 | Q3 | Q4 | YTD |
PLN |
|
|
|
|
|
2022 | 79.1 | 82.8 | 86.8 | 100.6 | 349.3 |
2021 | 32.0 | 36.5 | 68.7 | 79.4 | 216.6 |
2020 | 62.5 | 35.9 | 58.3 | 51.9 | 208.6 |
2022/2021 | 47.1 | 46.3 | 18.1 | 21.2 | 132.7 |
| 147.2% | 126.8% | 26.3% | 26.7% | 61.3% |
2021/2020 | (30.5) | 0.6 | 10.4 | 27.5 | 8.0 |
| (48.8%) | 1.7% | 17.8% | 53.0% | 3.8% |
USD |
|
|
|
|
|
2022 | 19.2 | 19.0 | 18.4 | 21.8 | 78.4 |
2021 | 8.5 | 9.7 | 17.8 | 19.6 | 55.6 |
2020 | 16.0 | 8.9 | 15.3 | 13.8 | 54.0 |
2022/2021 | 10.7 | 9.3 | 0.6 | 2.2 | 22.8 |
| 125.9% | 95.9% | 3.4% | 11.2% | 41.0% |
2021/2020 | (7.5) | 0.8 | 2.5 | 5.8 | 1.6 |
| (46.9%) | 9.0% | 16.3% | 42.0% | 3.0% |
|
|
|
|
|
|
2020 Comparability Impacts
Following the reopening of the casinos in March 2020 through December 2020, there were restrictions on the number of gaming positions that were open at table games. During the closures of our Poland casinos, we reduced operating costs and expenses as much as possible. Tourism was down in Poland due to travel restrictions, which had a negative impact on our results while the casinos were open from March to December 2020.
2021 Comparability Impacts
Through 2021, COVID-19 continued to impact international travel and hotel occupancy in Poland, which had a negative impact on our results. However, since reopening in May 2021, revenue from our Warsaw casinos increased as tourism returned stronger than it did following the reopening in 2020.
2022 Comparability Impacts
In 2022, revenue continued to increase as travel restrictions continued to lessen. Operating costs and expenses, particularly related to gaming, increased due to uninterrupted operations and increased revenue. We have not seen a material negative impact on our operations as a result of the war in Ukraine. Although Poland borders Ukraine, our casinos are not located near the border. However, continued conflict in that region could have a negative impact on our results of operations.
A reconciliation of net earnings (loss) attributable to Century Casinos, Inc. shareholders to Adjusted EBITDA can be found in the “Non-GAAP Measures – Adjusted EBITDA” discussion above in this Item 7.
|
|
|
|
|
|
|
|
|
|
|
|
|
|
|
|
|
|
|
|
Corporate and Other |
|
|
|
|
|
|
|
|
|
|
|
|
|
|
|
|
|
|
|
|
| For the year |
|
|
|
|
|
|
|
|
|
|
|
| ended December 31, |
|
| 2022/2021 |
|
| 2021/2020 |
Amounts in thousands |
|
| 2022 |
|
| 2021 |
|
| 2020 |
|
| $ Change |
| % Change |
|
| $ Change |
| % Change |
Gaming |
| $ | 184 |
| $ | 152 |
| $ | 830 |
| $ | 32 |
| 21.1% |
| $ | (678) |
| (81.7%) |
Food and Beverage Revenue |
|
| — |
|
| — |
|
| 105 |
|
| — |
| — |
|
| (105) |
| (100.0%) |
Other Revenue |
|
| 22 |
|
| 415 |
|
| 478 |
|
| (393) |
| (94.7%) |
|
| (63) |
| (13.2%) |
Net Operating Revenue |
|
| 206 |
|
| 567 |
|
| 1,413 |
|
| (361) |
| (63.7%) |
|
| (846) |
| (59.9%) |
Gaming Expenses |
|
| (133) |
|
| (110) |
|
| (727) |
|
| 23 |
| 20.9% |
|
| (617) |
| (84.9%) |
Food and Beverage Expenses |
|
| — |
|
| — |
|
| (133) |
|
| — |
| — |
|
| (133) |
| (100.0%) |
General and Administrative Expenses |
|
| (16,875) |
|
| (12,619) |
|
| (4,490) |
|
| 4,256 |
| 33.7% |
|
| 8,129 |
| 181.0% |
Depreciation and Amortization |
|
| (385) |
|
| (432) |
|
| (566) |
|
| (47) |
| (10.9%) |
|
| (134) |
| (23.7%) |
Impairment - Intangible and Tangible Assets |
|
| — |
|
| — |
|
| (1,000) |
|
| — |
| — |
|
| (1,000) |
| (100.0%) |
Total Operating Costs and Expenses |
|
| (17,393) |
|
| (13,161) |
|
| (6,916) |
|
| 4,232 |
| 32.2% |
|
| 6,245 |
| 90.3% |
Earnings from Equity Investment |
|
| 3,249 |
|
| — |
|
| — |
|
| 3,249 |
| 100.0% |
|
| — |
| — |
Losses from Operations |
|
| (13,938) |
|
| (12,594) |
|
| (5,503) |
|
| (1,344) |
| (10.7%) |
|
| (7,091) |
| (128.9%) |
|
|
|
|
|
|
|
|
|
|
|
|
|
|
|
|
|
|
|
|
Income Tax Benefit (Expense) |
|
| 19,935 |
|
| (4,858) |
|
| (578) |
|
| 24,793 |
| 510.4% |
|
| (4,280) |
| (740.5%) |
Net Loss Attributable to Century Casinos, Inc. Shareholders |
|
| (28,664) |
|
| (30,570) |
|
| (18,609) |
|
| 1,906 |
| 6.2% |
|
| (11,961) |
| (64.3%) |
Adjusted EBITDA |
| $ | (7,227) |
| $ | (9,973) |
| $ | (10,642) |
| $ | 2,746 |
| 27.5% |
| $ | 669 |
| 6.3% |
|
|
|
|
|
|
|
|
|
|
|
|
|
|
|
|
|
|
|
|
The following operations and agreements make up the reporting unit Cruise Ships & Other in the Corporate and Other reportable segment:
As of December 31, 2022, we had a concession agreement with TUI Cruises for one ship-based casino that ends in the second quarter of 2023. The table below illustratesprovides the ships operating during the years ended December 31, 2020, 2021closure and 2022.reopen dates for casinos in Poland due to COVID-19.
|
|
|
|
Ship
| Closure Date | Reopen Date | Contract Expiration
|
Mein Schiff Herz
| March 11,December 29, 2020
| April 5, 2022
| Second Quarter 2023
|
Mein Schiff 3
| March 14, 2020
| N/A
| May 2020
|
Mein Schiff 4
| March 13, 2020
| N/A
| MayFebruary 12, 2021
|
Mein Schiff 5
| March 12, 2020 | N/A20, 2021
| May 28, 2021 |
Mein Schiff 6
| March 7, 2020
| June 11, 2021
| April 2022
|
Results in US dollars were impacted by a 5.7% exchange rate increase and (15.4%) exchange rate decrease in the average rates between the US dollar and the Polish zloty for the year ended December 31, 2023 compared to the year ended December 31, 2022 and the year ended December 31, 2022 compared to the year ended December 31, 2021, respectively.
The tables below provide results for the Poland reportable segment.
|
|
|
|
|
|
|
|
|
|
|
|
|
|
|
|
|
|
|
|
|
| For the year |
| 2023/2022 |
|
| 2022/2021 |
|
| ended December 31, |
|
|
| % |
|
|
|
| % |
Amounts in PLN, in millions |
|
| 2023 |
|
| 2022 |
|
| 2021 |
|
| Change |
| Change |
|
| Change |
| Change |
Net Operating Revenue |
|
|
|
|
|
|
|
|
|
|
|
|
|
|
|
|
|
|
|
Poland |
|
| 396.8 |
|
| 402.5 |
|
| 227.5 |
|
| (5.7) |
| (1.4%) |
|
| 175.0 |
| 77.0% |
|
|
|
|
|
|
|
|
|
|
|
|
|
|
|
|
|
|
|
|
Operating Costs and Expenses (1) |
|
|
|
|
|
|
|
|
|
|
|
|
|
|
|
|
|
|
|
Poland |
|
| 362.3 |
|
| 349.3 |
|
| 216.6 |
|
| 13.0 |
| 3.7% |
|
| 132.7 |
| 61.3% |
|
|
|
|
|
|
|
|
|
|
|
|
|
|
|
|
|
|
|
|
|
| For the year |
|
|
|
|
|
|
|
|
|
|
|
| ended December 31, |
|
| 2023/2022 |
|
| 2022/2021 |
Amounts in millions |
|
| 2023 |
|
| 2022 |
|
| 2021 |
|
| $ Change |
| % Change |
|
| $ Change |
| % Change |
Net Operating Revenue |
|
|
|
|
|
|
|
|
|
|
|
|
|
|
|
|
|
|
|
Poland |
| $ | 94.1 |
| $ | 90.2 |
| $ | 58.2 |
| $ | 3.9 |
| 4.4% |
| $ | 32.0 |
| 54.9% |
|
|
|
|
|
|
|
|
|
|
|
|
|
|
|
|
|
|
|
|
Operating Costs and Expenses (1) |
|
|
|
|
|
|
|
|
|
|
|
|
|
|
|
|
|
|
|
Poland |
| $ | 86.1 |
| $ | 78.4 |
| $ | 55.6 |
| $ | 7.7 |
| 9.8% |
| $ | 22.8 |
| 41.0% |
2023 Compared to 2022
The following discussion highlights results for the year ended December 31, 2023 compared to the year ended December 31, 2022.
Net operating revenue decreased primarily due to decreased gaming revenue. As stated above, we had to temporarily close two casinos in October 2023 and one casino in November 2023. Revenue at these three locations decreased by PLN 25.2 million in the fourth quarter of 2023 compared to the fourth quarter of 2022. Operating costs and expenses increased due to an increase in payroll costs and marketing expenses. Licenses for all three locations have since been granted and the casinos are either open or expected to reopen in 2024.
2022 Compared to 2021
The following discussion highlights results for the year ended December 31, 2022 compared to the year ended December 31, 2021.
Through 2021, COVID-19 continued to impact international travel and hotel occupancy in Poland, which had a negative impact on our results. However, since reopening in May 2021 and through 2022, revenue continued to increase as travel restrictions continued to lessen. Operating costs and expenses, particularly related to gaming, increased due to uninterrupted operations and increased revenue.
A reconciliation of Adjusted EBITDAR to net (loss) earnings attributable to Century Casinos, Inc. shareholders for the Poland reportable segment can be found in the “Non-GAAP Measures Definitions and Calculations – Adjusted EBITDAR” discussion above in this Item 7.
|
|
|
|
|
|
|
|
|
|
|
|
|
|
|
|
|
|
|
|
Corporate and Other |
|
|
|
|
|
|
|
|
|
|
|
|
|
|
|
|
|
|
|
|
| For the year |
|
|
|
|
|
|
|
|
|
|
|
| ended December 31, |
|
| 2023/2022 |
|
| 2022/2021 |
Amounts in thousands |
|
| 2023 |
|
| 2022 |
|
| 2021 |
|
| $ Change |
| % Change |
|
| $ Change |
| % Change |
Gaming |
| $ | 61 |
| $ | 184 |
| $ | 152 |
| $ | (123) |
| (66.8%) |
| $ | 32 |
| 21.1% |
Other Revenue |
|
| — |
|
| 22 |
|
| 415 |
|
| (22) |
| (100.0%) |
|
| (393) |
| (94.7%) |
Net Operating Revenue |
|
| 61 |
|
| 206 |
|
| 567 |
|
| (145) |
| (70.4%) |
|
| (361) |
| (63.7%) |
Gaming Expenses |
|
| (49) |
|
| (133) |
|
| (110) |
|
| (84) |
| (63.2%) |
|
| 23 |
| 20.9% |
General and Administrative Expenses |
|
| (21,476) |
|
| (16,875) |
|
| (12,619) |
|
| 4,601 |
| 27.3% |
|
| 4,256 |
| 33.7% |
Depreciation and Amortization |
|
| (232) |
|
| (385) |
|
| (432) |
|
| (153) |
| (39.7%) |
|
| (47) |
| (10.9%) |
Total Operating Costs and Expenses |
|
| (21,757) |
|
| (17,393) |
|
| (13,161) |
|
| 4,364 |
| 25.1% |
|
| 4,232 |
| 32.2% |
Earnings from Equity Investment |
|
| 1,121 |
|
| 3,249 |
|
| — |
|
| (2,128) |
| (65.5%) |
|
| 3,249 |
| 100.0% |
Losses from Operations |
|
| (20,575) |
|
| (13,938) |
|
| (12,594) |
|
| (6,637) |
| (47.6%) |
|
| (1,344) |
| (10.7%) |
|
|
|
|
|
|
|
|
|
|
|
|
|
|
|
|
|
|
|
|
Income Tax Benefit (Expense) |
|
| 5,275 |
|
| 19,935 |
|
| (4,858) |
|
| (14,660) |
| (73.5%) |
|
| 24,793 |
| 510.4% |
Net Loss Attributable to Century Casinos, Inc. Shareholders |
|
| (58,306) |
|
| (28,664) |
|
| (30,570) |
|
| (29,642) |
| (103.4%) |
|
| 1,906 |
| 6.2% |
Adjusted EBITDAR |
| $ | (12,208) |
| $ | (7,227) |
| $ | (9,973) |
| $ | (4,981) |
| (68.9%) |
| $ | 2,746 |
| 27.5% |
|
|
|
|
|
|
|
|
|
|
|
|
|
|
|
|
|
|
|
|
We havereleased the $10.2 million US valuation allowance in 2022, resulting in an income tax benefit of $7.7 million for the year ended December 31, 2022.
Prior to the end of the agreement to operate a ship-based casino in April 2023, the results of operations from our ship-based casinos were included in the Corporate and Other reportable segment. We decreased our operation of ship-based casinos on cruise ships over the past few years, and mutually agreed with cruise lines with which we had concession agreements not to extend certain agreements at their termination dates.
We operated Century Casino Bath from May 2018 through March 2020. The casino was closed in March 2020 due to COVID-19 and CCB’s board of directors determined that CCB would enter into creditors voluntary liquidation, which occurred in May 2020. CCB was deconsolidated as a subsidiary in May 2020 andtable below illustrates the company was officially dissolved in October 2022. We recorded a $7.4 million gain related toships operating during the deconsolidation to general and administrative expenses for the yearyears ended December 31, 2020. For additional information related to CCB, see Note 1 to the Consolidated Financial Statements included in Part II, Item 8, “Financial Statements2023, 2022 and Supplementary Data” of this report.
Through our subsidiary CRM, we had a 7.5% ownership interest in MCE that was sold in November 2021 for nominal consideration. In addition, the consulting services agreement under which CRM provided advice to MCE on casino matters was terminated in November 2021. In March 2020, due to the impact of COVID-19 on MCE, we impaired the $1.0 million MCE investment and wrote-down a $0.3 million receivable related to MCE. For additional information related to MCE, see Note 1 to the Consolidated Financial Statements included in Part II, Item 8, “Financial Statements and Supplementary Data” of this report.
Revenue Highlights2023 Compared to 2022
The following discussion highlights results for the year ended December 31, 2023 compared to the year ended December 31, 2022.
Net operating revenue decreases aredecreased because the remaining ship-based casino contract ended in April 2023. Operating costs and expenses increased by $4.4 million, or 25.1%, due primarily to increased payroll and professional service expenses and acquisition costs. Earnings from equity investment relates to income from our 50% membership interest in Smooth Bourbon prior to its consolidation in the United States reportable segment on April 3, 2023, which reduced the amount in 2023.
2022 Compared to 2021
The following discussion highlights results for the year ended December 31, 2022 compared to the cessation of operations at CCB andyear ended December 31, 2021.
Net operating revenue decreased due to the decrease in the number of ship-based casinos operated as detailed above.
Operating Expense Highlights
Years ended December 31, 2022costs and 2021
General and administrative expenses increased by $4.3$4.2 million, or 33.7%32.2%, due primarily to increased payroll and stock compensation expense during the year ended December 31, 2022 as well as $3.1 million in acquisition costs related to the pending Nugget Acquisition and Rocky Gap Acquisition. These increased corporate expenses were offset by decreased expenses due to the decrease in the number of ship-based casinos operated as detailed above.
Earnings from our equity investment in Smooth Bourbon were $3.2 million for the year ended December 31, 2022.
Years ended December 31, 2021 and 2020
Gaming and food and beverage expenses for the year ended December 31, 2020 decreased due to casino closures for the ship operations and CCB. General and administrative expenses increased by $8.1 million, or 181.0%, due primarily to the deconsolidation of CCB that resulted in a gain of $7.4 million that we recognized in general and administrative expenses on our statements of earnings (loss) for the year ended December 31, 2020. In addition, payroll and stock compensation expense increased during the year ended December 31, 2021 offset by the write-down of a receivable related to MCE of $0.3 million and a receivable related to LOT of $0.7 million during the year ended December 31, 2020. In March 2020, we assessed the collectability of a receivable from LOT, which previously owned a 33.3% interest in CPL that we acquired in 2013, related to the Poland contingent liability and determined that, due to COVID-19, it was more likely than not that LOT would be unable to repay us for LOT’s portions of payments made by CPL to the Polish Internal Revenue Service (“Polish IRS”) for tax periods in January 2009 to March 2013. Due to COVID-19, LOT grounded flights in March 2020. Based on past efforts to collect on the receivable and analysis of LOT’s ability to pay, we wrote-down the receivable to general and administrative expenses for the year ended December 31, 2020. For additional information related to the Poland contingent liability, see Note 16 to the Consolidated Financial Statements included in Part II, Item 8, “Financial Statements and Supplementary Data” of this report.
In March 2020, we impaired the MCE investment due to an assessment of MCE’s operations resulting from COVID-19. As a result of the impairment, we recorded $1.0 million to impairment – intangible and tangible assets during the year ended December 31, 2020.
A reconciliation of Adjusted EBITDAR to net loss(loss) earnings attributable to Century Casinos, Inc. shareholders to Adjusted EBITDAfor the Corporate and Other reportable segment can be found in the “Non-GAAP Measures Definitions and Calculations – Adjusted EBITDA”EBITDAR” discussion above in this Item 7.
Non-Operating Income (Expense)
Non-operating income (expense) for the years ended December 31, 2023, 2022 2021 and 20202021 was as follows:
|
|
|
|
|
|
|
|
|
|
|
|
|
|
|
|
|
|
|
|
|
|
|
|
|
|
|
|
|
|
| For the year ended December 31, |
| 2022/2021 |
| 2021/2020 |
| For the year ended December 31, |
| 2023/2022 |
| 2022/2021 |
Amounts in thousands |
| 2022 |
| 2021 |
| 2020 |
| $ Change |
| % Change |
| $ Change |
| % Change |
| 2023 |
| 2022 |
| 2021 |
| $ Change |
| % Change |
| $ Change |
| % Change |
Interest Income |
| $ | 851 |
| $ | 174 |
| $ | 6 |
| $ | 677 |
| 389.1% |
| $ | 168 |
| 2800.0% |
| $ | 2,114 |
| $ | 851 |
| $ | 174 |
| $ | 1,263 |
| 148.4% |
| $ | 677 |
| 389.1% |
Interest Expense |
| (65,831) |
| (42,832) |
| (43,104) |
| 22,999 |
| 53.7% |
|
| (272) |
| (0.6%) |
| (93,925) |
| (65,831) |
| (42,832) |
| 28,094 |
| 42.7% |
|
| 22,999 |
| 53.7% |
Gain (Loss) on Foreign Currency Transactions, Cost Recovery Income and Other |
|
| 3,378 |
|
| 2,289 |
|
| (63) |
|
| 1,089 |
| 47.6% |
|
| 2,352 |
| 3733.3% | |
Gain on Foreign Currency Transactions, Cost Recovery Income and Other | |
|
| 3,933 |
|
| 3,378 |
|
| 2,289 |
|
| 555 |
| 16.4% |
|
| 1,089 |
| 47.6% |
Non-Operating (Expense) |
| $ | (61,602) |
| $ | (40,369) |
| $ | (43,161) |
| $ | (21,233) |
| (52.6%) |
| $ | 2,792 |
| 6.5% |
| $ | (87,878) |
| $ | (61,602) |
| $ | (40,369) |
| $ | (26,276) |
| (42.7%) |
| $ | (21,233) |
| (52.6%) |
|
|
|
|
|
|
|
|
|
|
|
|
|
|
|
|
|
|
|
|
|
|
|
|
|
|
|
|
|
|
|
|
|
|
|
|
|
|
|
Interest income
Interest income is related to interest earned on our cash reserves and, for 2022,reserves. We earned approximately $1.7 million in interest income in Canada from the funds from the Canada Real Estate Sale. Prior to April 3, 2023, we maintained a balance of $100.0 million in an escrow account (the “Acquisition Escrow”) from the proceeds from a $350.0 million term loan (“Goldman Term Loan”) under our Goldman Credit Agreement that were borrowed in connection with the Nugget Acquisition. Interest income on the Acquisition Escrow.Escrow was earned from April 1, 2022 until the funds were used for the Nugget Acquisition on April 3, 2023. In addition, PLN 2.0 million ($0.4 million) and PLN 0.6 million ($0.2 million) in interest income relates to the Polish IRS reimbursement of CPL after CPL prevailed in court challenges of tax audits for the years ended December 31, 2022 and 2021, respectively. See Note 16 to the Consolidated Financial Statements included in Part II, Item 8, “Financial Statements and Supplementary Data” of this report.
Interest expense
Interest expense is directly related to interest owed on our borrowings under our Goldman Credit Agreement, Macquarie Credit Agreement, our financing obligation with VICI PropCo, our CPL and CRM borrowings, our capital lease agreements and interest expense related to the CDR land lease. We recorded a loss on debt extinguishment related to the CDR land lease of CAD 9.9 million ($7.3 million based on the exchange rate on September 6, 2023) in interest expense in our consolidated statement of (loss) earnings for the year ended December 31, 2023. We wrote off approximately $7.3 million of deferred financing costs to interest expense in the year ended December 31,second quarter of 2022 in connection with the prepayment of the Macquarie Term Loan. Increases in interest expense were due to increased interest rates on our Goldman Credit Agreement, interest on a $30.0 million revolving line of credit (“Revolving Facility”) with Goldman, on which we drew from July 2023 to September 2023 for the Rocky Gap Acquisition and increased interest related to the addition of Rocky Gap and the Century Canadian Portfolio to the financing obligation under the Master Lease with VICI PropCo.
A breakdown of interest expense is below.
|
|
|
|
|
|
|
|
|
|
|
| For the year ended December 31, |
Amounts in thousands |
| 2023 |
| 2022 |
| 2021 |
Interest Expense - Credit Agreements |
| $ | 39,703 |
| $ | 25,089 |
| $ | 11,439 |
Interest Expense - VICI Financing Obligation |
|
| 42,426 |
|
| 28,533 |
|
| 28,232 |
Interest Expense - CDR Land Lease |
|
| 1,450 |
|
| 2,254 |
|
| 1,777 |
Interest Expense - Deferred Financing Costs |
|
| 2,695 |
|
| 2,412 |
|
| 1,565 |
Interest Expense - Misc |
|
| 327 |
|
| 239 |
|
| 168 |
Interest Expense - Other(1) |
|
| 7,324 |
|
| 7,304 |
|
| (349) |
Total Interest Expense |
| $ | 93,925 |
| $ | 65,831 |
| $ | 42,832 |
|
|
|
|
|
|
|
|
|
|
(1)Interest Expense – Other consists of $7.3 million related to the loss on debt extinguishment related to our CDR land lease in 2023, $7.3 million of deferred financing costs written off in connection with the prepayment of the Macquarie Term Loan in 2022, and ($0.3) million interest expense adjustments related to the Polish IRS tip litigation in 2021.
Gain (loss) on foreign currency transactions, cost recovery income and other
Cost recovery income of $3.5 million, $1.9 million $0.7 million and $0.2$0.7 million was received by CDR for the years ended December 31, 2023, 2022 2021 and 2020,2021, respectively, related to infrastructure built during the development of the Century Downs REC project. The distribution to CDR’s non-controlling shareholders through non-controlling interest is part of a credit agreement between CRM and CDR.
We adjusted the contingent liability related to the CPL tax audits to remove the estimated taxes accrued due to the expiration of the statute of limitations for each tax year. This adjustment reduced the contingent liability by PLN 1.8 million ($0.5 million) and PLN 2.8 million ($0.7 million) for the years
year ended December 31, 2021 and 2020, respectively.2021. In addition, the Polish IRS reimbursed CPL PLN 1.8 million ($0.4 million) and PLN 0.8 million ($0.2 million) for the years ended December 31, 2022 and 2021, respectively. See Note 16 to the Consolidated Financial Statements included in Part II, Item 8, “Financial Statements and Supplementary Data” of this report.
Taxes
Income tax expense is recorded relative to the jurisdictions that recognize book earnings. During the year ended December 31, 2022,2023, we recognized an income tax benefit of ($5.3) million on pre-tax loss of ($23.8) million, representing an effective income tax rate of 22.4%, compared to income tax benefit of ($7.7) million on pre-tax income of $6.0 million, representing an effective income tax rate of (127.5%), compared toand income tax expense of $6.4 million on pre-tax income of $28.1 million, representing an effective income tax rate of 22.6%, and income tax expense of $4.8 million on pre-tax loss of ($43.3) million, representing an effective income tax rate of 11.2% for the years ended December 31, 20212022 and 2020,2021, respectively. For further discussion of our effective income tax rates and an analysis of our effective income tax rate compared to the US federal statutory income tax rate, see Note 13 to the Consolidated Financial Statements included in Part II, Item 8, “Financial Statements and Supplementary Data” of this report.
LIQUIDITY AND CAPITAL RESOURCES
Our business is capital intensive, and we rely heavily on the ability of our casinos to generate operating cash flow. We use the cash flows that we generate to maintain operations, fund reinvestment in existing properties for both refurbishment and expansion projects, repay third party debt, and pursue additional growth via new development and acquisition opportunities. When necessary and available, we supplement the cash flows generated by our operations with either cash on hand or funds provided by bank borrowings or other debt or equity financing activities. In 2020, our liquidity was adversely affected by temporary closures of all of our casinos, hotels and other facilities to comply with quarantines issued by governments to contain the spread of COVID-19, as discussed below.
Cash Flows – Summary
Our cash flows; cash, cash equivalents and restricted cash; and working capital consisted of the following:
|
|
|
|
|
|
|
|
|
|
|
|
|
|
| For the year |
| For the year |
|
| ended December 31, |
| ended December 31, |
Amounts in thousands |
| 2022 |
| 2021 |
| 2020 |
| 2023 |
| 2022 |
| 2021 |
Net cash provided by operating activities |
| $ | 37,397 |
| $ | 59,190 |
| $ | 9,005 |
| $ | 24,055 |
| $ | 37,397 |
| $ | 59,190 |
Net cash used in investing activities |
| (103,140) |
| (9,992) |
| (5,287) |
| (206,997) |
| (103,140) |
| (9,992) |
Net cash provided by (used in) financing activities |
| 161,162 |
| (4,713) |
| 3,129 |
| 149,857 |
| 161,162 |
| (4,713) |
|
|
|
|
|
|
| |
Cash, cash equivalents and restricted cash (1) |
| $ | 202,131 |
| $ | 108,041 |
| $ | 63,677 | |
Working capital (2) |
| $ | 162,606 |
| $ | 80,247 |
| $ | 34,459 | |
|
|
|
|
|
|
|
|
|
|
|
| As of December 31, |
Amounts in thousands |
| 2023 |
| 2022 |
| 2021 |
Cash, cash equivalents and restricted cash (1) |
| $ | 171,590 |
| $ | 202,131 |
| $ | 108,041 |
Working capital (2) |
| $ | 113,398 |
| $ | 162,606 |
| $ | 80,247 |
(1)Cash, cash equivalents and restricted cash as of December 31, 2022 includesincluded $100.2 million related to the Acquisition Escrow.
(2)Working capital is defined as current assets minus current liabilities and includesliabilities. Working capital as of December 31, 2022 included the $100.2 million related to the Acquisition Escrow.
Operating Activities
Our cash flows from operations have historically been positive and sufficient to fund ordinary operations. Cash flows from operations decreased in the year ended December 31, 2022 compared to the year ended December 31, 2021years presented primarily because of increased interest payments. We entered into the Goldman Credit Agreement on April 1, 2022 in connection with the Nugget Acquisition, and the principal amount of our debt increased by $183.8 million. Cash flows from operations improved in the year ended December 31, 2021 compared to the year ended December 31, 2020 because our US facilities were open and operating for the entire period and our casinos in Canada and Poland reopened in June 2021 and May 2021, respectively. Cash flow from operations for the year ended December 31, 2020 was favorably impacted by the operations of the properties we acquired in the 2019 Acquisition and negatively impacted by the suspension of our operations due to COVID-19. Trends in our operating cash flows tend to follow trends in earnings from operations, excluding non-cash charges. Please refer also to the consolidated statements of cash flows in the Consolidated Financial Statements included in Part II, Item 8, “Financial Statements and Supplementary Data” of this report and to management’s discussion of the results of operations above in this Item 7 for a discussion of earnings (loss) from operations.
Investing Activities
Net cash used in investing activities for the year ended December 31, 2023 consisted of $98.8 million to acquire the Nugget, net of cash, $52.6 million to acquire Rocky Gap, net of cash, $0.5 million for a casino license in Poland, $0.4 million for slot machine purchases, $0.5 million in gaming-related purchases, $0.4 million on surveillance equipment, $1.4 million in various improvements to the Mountaineer property in West Virginia, $2.1 million in gaming-related purchases in Maryland, $20.0 million for our hotel project in Cape Girardeau, $18.6 million for our casino project in Caruthersville which is funded by VICI PropCo (the proceeds funded from VICI PropCo are recognized as financing activities), $1.3 million in improvement projects for the temporary land-based casino in Caruthersville, $0.2 million for our stand-alone hotel project in Caruthersville, $0.9 million for slot machine purchases and $0.4 million for surveillance equipment at our Missouri properties, $2.0 million for slot machine purchases, $1.2 million in signage and $1.1 million in exterior improvements in Nevada, $0.9 million for slot machine purchases and $0.1 million in camera upgrades at our Colorado properties, $0.6 million for employee housing in Cripple Creek, $1.4 million in slot machine
purchases and $0.5 million to remodel our new Wroclaw location in Poland, $0.6 million related to adding sportsbooks at our Canada properties and $5.1 million in other fixed asset additions at our properties, offset by $1.7 million in proceeds from the earn out related to the sale of casino operations in Calgary in 2020, $2.3 million in dividends from Smooth Bourbon, $0.1 million in proceeds from the disposition of assets, and $0.5 million in cash due to consolidating Smooth Bourbon following the Nugget Acquisition.
Net cash used in investing activities for the year ended December 31, 2022 consisted of $95.0 million for the purchase of the 50% equity interest in Smooth Bourbon, $0.4 million for the purchase of a casino license in Poland, $1.7 million for slot machine purchases, $0.2 million in gaming-related purchases, $0.1 million for outdoor pool and patio furniture and $0.1 million for hotel carpet in West Virginia, $2.4 million for our hotel remodel in Cape Girardeau, $1.6 million for our casino project in Caruthersville, $2.9 million for our stand-alone hotel project in Caruthersville, $0.4 million for renovations to the pavilion in Caruthersville which is funded by VICI PropCo (the proceeds funded from VICI PropCo are recognized as financing activities) to relocate the casino from the riverboat and barge, $1.8 million for slot machine purchases at our Missouri properties, $0.7 million for slot machine purchases, $0.2 million in gaming-related purchases and $0.3 million in camera upgrades at our Colorado properties, $1.6 million for employee housing in Cripple Creek, $0.7 million in slot machine and table game purchases in Poland, $0.2 million for carpet at Century Downs, $0.2 million for drainage at Century Mile, and $4.1 million in other fixed asset additions at our properties, offset by $6.3 million in proceeds from the sale of the land and building in Calgary, $5.0 million in dividends from Smooth Bourbon and $0.1 million in proceeds from the disposition of assets.
Net cash used in investing activities for the year ended December 31, 2021 consisted of $0.4 million for slot machine purchases, $0.2 million in energy efficiency upgrades, and $0.4 million in gaming floor upgrades at our West Virginia property; $1.3 million for slot machine purchases, $0.4 million in other gaming equipment, $0.4 million in surveillance equipment, $0.6 million in a restaurant remodel, $0.6 million in a hotel remodel, and $0.9 million related to our hotel and land-based casino project at our Missouri properties; $0.1 million in building and improvements, $0.1 million for slot machine purchases and $0.2 million in server upgrades at our Colorado properties; $0.6 million to build employee housing in Cripple Creek; $0.3 million for recreational vehicle stalls at Century Mile and $3.5 million in other fixed asset additions at our properties and $0.1 million in working capital adjustments paid to the buyer of Century Casino Calgary, offset by less than $0.1 million in proceeds from the Century Casino Calgary sale earn out and less than $0.1 million in proceeds from the sale of fixed assets.
Financing Activities
Net cash used in investingprovided by financing activities for the year ended December 31, 20202023 consisted of a $1.2$162.6 million paymentin proceeds from the Canada Real Estate Sale, $8.0 million in borrowings, net of principal payments, and $0.1 million in proceeds from the exercise of stock options, offset by $1.3 million to repurchase shares to satisfy tax withholding related to the working capital adjustment in the 2019 Acquisition; $0.6 million for slot machine purchases at our Colorado properties; $0.1 million for slot chairs at CTL; $1.0 million for slot machine purchases, $0.2performance stock unit awards and $19.6 million in rebranding signage, $1.8 million for player tracking systemsdistributions to non-controlling interests in CDR, CPL and upgrades to the slot accounting systems, and $0.6 million in computer upgrades at our Missouri properties; $0.2 million for surveillance upgrades, $1.1 million for slot machine purchases, $0.2 million for racetrack reconditioning, and $0.3 million in computer upgrades at our West Virginia property; $0.5 million for table game equipment, $0.9 million in building updates, and $0.2 million in racetrack and barn updates at our Edmonton properties; $0.2 million for table game equipment at our Calgary properties; $0.3 million in casino improvements in Poland; and $2.5 million in other fixed asset additions at our properties; offset by $6.6 million from the sale of Century Casino Calgary, net of cash assumed by the buyer.Smooth Bourbon.
Financing Activities
Net cash provided by financing activities for the year ended December 31, 2022 consisted of $178.5 million in proceeds from borrowings net of principal payments, $5.0 million proceeds from borrowing from VICI PropCo for construction at CCV and $0.3 million in proceeds from the exercise of stock options, offset by $18.9 million in payments of deferred financing costs, $0.4 million to repurchase shares to satisfy tax withholding related to our performance stock unit awards and $3.3 million in distributions to non-controlling interests in CDR and CPL.
Net cash used in financing activities for the year ended December 31, 2021 consisted of $4.2 million in principal payments and a $0.8 million distribution to non-controlling interests in CDR, offset by $0.2 million from the exercise of stock options.
Net cash provided by financing activities for the year ended December 31, 2020 consisted of $4.2 million in proceeds from borrowings net of principal payments, offset by $0.9 million in deferred financing costs and a $0.2 million distribution to non-controlling interests in CDR.
Borrowings and Repayments of Long-Term Debt and Lease Agreements
As of December 31, 2022,2023, our total debt under bank borrowings and other agreements net of $16.8$14.1 million related to deferred financing costs was $349.6$332.7 million, of which $344.3$324.2 million was long-term debt and $5.3$8.5 million was the current portion of long-term debt. The current portion relates to payments due within one year under our Goldman Credit Agreement and term loansloan with UniCredit Bank Austria AG (“UniCredit”)., and approximately $3.5 million principal amount of the Goldman Term Loan that we repurchased for 97% of its value in February 2024. On April 1, 2022, we entered into the Goldman Credit Agreement, which provides for athe $350.0 million term loan (“Goldman Term Loan”)Loan and athe $30.0 million revolving line of credit.Revolving Facility. We drew the $350.0 million under the Goldman Term Loan on April 1, 2022 and used the proceeds as well as approximately $29.3 million of cash on hand to fund the PropCoSmooth Bourbon Acquisition, repay the $166.2 million outstanding on the Macquarie Credit Agreement, fund $100.0 million of Acquisition Escrow for the Nugget Acquisition and for related fees and expenses. We drew $30.0 million under the Revolving Facility on our Goldman Credit Agreement on July 20, 2023 for the Rocky Gap Acquisition and repaid the Revolving Facility borrowing in full on September 21, 2023. We intend to repay the current portion of our debt obligations with available cash. If additional opportunities to repurchase debt at a discount are offered, we may undertake such repurchases, however we have no plans at this time to do so. For a description of our debt agreements, see Note 6 to the Consolidated Financial Statements included in Part II, Item 8, “Financial Statements and Supplementary Data” of this report. Net Debt was $175.5 million as of December 31, 2023 compared to $264.6 million as of December 31, 2022 compared to $81.4 million as of December 31, 2021.2022. The increasedecrease in Net Debt was primarilynet debt is due to increased cash from the Canada Real Estate
Sale and decreased debt due to the purchase of the land that was subject to the land lease at CDR in conjunction with the Canada Real Estate Sale. The CDR land lease was previously treated as a $177.2 million increase in total principal amount of debt.financing obligation. For the definition and reconciliation of Net Debt to the most directly comparable US GAAP measure, see “Non-GAAP Measures Definitions and Calculations – Net Debt” above in this Item 7.
The following table lists the 20232024 maturities of our debt:
|
|
|
|
|
|
|
|
|
|
|
|
|
Amounts in thousands | Amounts in thousands |
|
|
|
|
|
| Amounts in thousands |
|
|
|
|
Goldman Credit Agreement (1) | Goldman Credit Agreement (1) |
| UniCredit Term Loans |
| Century Downs
Land Lease |
| Total | Goldman Credit Agreement (1) |
| UniCredit Term Loans |
| Total |
$ | 3,500 |
| $ | 1,822 |
| $ | — |
| $ | 5,322 | 6,991 |
| $ | 1,477 |
| $ | 8,468 |
(1)The Goldman Term Loan under the Goldman Credit Agreement requires scheduled quarterly paymentpayments of $875,000, equal to 0.25% of the original aggregate principal amount of the Term Loan, with the balance due at maturity. We repurchased approximately $3.5 million principal amount of the Goldman Term Loan at 97% of its value in February 2024.
Estimated interest payments based on principal amounts and expected maturities of long-term debt outstanding and management’s forecasted rates for our long-term debt agreements for the year ended December 31, 20232024 are $37.6$39.9 million. Estimated interest payments do not reflect the impact of future foreign exchange rate changes. The estimate excludes the variable payments related to the CDR land lease and payments under the Master Lease.
Cash payments due under the Master Lease for 2024 are estimated to be $52.5 million, which includes a CPI increase. The estimated payments do not include the year ended December 31, 2023initial annualized increase of approximately $4.2 million that will occur after completion of the Caruthersville casino project. Cash payments to the non-controlling partners under the lease between Smooth Bourbon and Nugget for 2024 are $27.5estimated to be $7.0 million.
The first optionfollowing table details cash payments under the Master Lease, CDR Land Lease, which ended in September 2023, and 50% of the cash payments under Nugget Lease for the years ended December 31, 2023, 2022 and 2021.
|
|
|
|
|
|
|
|
|
|
|
| For the year ended |
|
| December 31, |
Amounts in thousands |
| 2023 |
| 2022 |
| 2021 |
Master Lease |
| $ | 40,739 |
| $ | 25,666 |
| $ | 25,271 |
Nugget Lease |
|
| 6,313 |
|
| — |
|
| — |
CDR Land Lease |
|
| 1,258 |
|
| 2,088 |
|
| 1,991 |
Rent expense related to purchase the land thatMaster Lease and CDR Land Lease is currently leased at CDRincluded in interest expense on our consolidated statements of (loss) earnings. The Nugget Lease is considered an intercompany lease and income and expense related to the lease are eliminated in consolidation. The 50% interest in the Nugget Lease owned by Marnell is recorded as noncontrolling interest on July 1, 2023.our consolidated statements of (loss) earnings.
The following table lists the amount of 20232024 payments due under our operating and finance lease agreements:
|
|
|
|
|
|
|
Amounts in thousands | Amounts in thousands |
|
| Amounts in thousands |
|
|
Operating Leases | Operating Leases |
| Finance Leases | Operating Leases |
| Finance Leases |
$ | 5,091 |
| $ | 184 | 4,989 |
| $ | 240 |
Acquisitions and Canada Real Estate Sale
The Nugget Acquisition. On April 3, 2023, we purchased 100% of the membership interests in Nugget for approximately $104.7 million using the funds in the Acquisition Escrow and cash on hand. On August 29, 2023, we paid an additional $0.8 million in working capital adjustments. We also have a five-year option to acquire the remaining 50% of the membership interests in Smooth Bourbon for $105.0 million plus 2% per annum.
Rocky Gap Acquisition. On July 25, 2023, we completed the Rocky Gap Acquisition for approximately $59.1 million using funds on hand and $30.0 million borrowed from the Revolving Facility. On December 18, 2023, we paid an additional $0.1 million in working capital adjustments. In connection with this acquisition one of our subsidiaries and a subsidiary of VICI PropCo entered into an amendment of the Master Lease that provides for an increase in initial annualized rent of approximately $15.5 million. We repaid the $30.0 million borrowed from the Revolving Facility on September 21, 2023.
Canada Real Estate Sale. On September 6, 2023, we completed the Canada Real Estate Sale with VICI PropCo and received, net of the CDR land purchase and closing costs, CAD 190.9 million ($140.1 million based on the exchange rate on September 6, 2023) in cash. We expect to retain approximately CAD 155.6 million (USD $117.6 million based on the exchange rate on December 31, 2023) of the purchase price after giving effect to the purchase of the Century Downs land that previously was subject to the CDR land lease, selling expenses, Canadian and US taxes and proceeds to be paid to the minority owners of Century Downs. Remaining
payments as of December 31, 2023 are estimated to be $19.0 million and include Canadian tax on the sale and a US foreign tax withholding tax required on a cash dividend to repatriate the funds to the US. Simultaneous with the closing of the transaction, our Canadian subsidiaries and subsidiaries of VICI PropCo entered into an amendment of the Master Lease that provides for an increase in initial annualized rent of approximately CAD 17.3 million ($13.1 million based on the exchange rate on December 31, 2023).
Common Stock Repurchase Program
The total amount remaining under our stock repurchase program was $14.7 million as of December 31, 2022.2023. We did not repurchase any common stock in 2023, 2022 2021 or 2020.2021. The repurchase program has no set expiration or termination date. We may consider repurchasing our common stock or increasing the amount of our stock repurchase program.
Potential Sources and Uses of Liquidity, and Short-Term and Long-Term Liquidity
Historically, our primary source of liquidity and capital resources has been cash flow from operations. As of December 31, 2022,2023, we had $101.8$171.3 million in cash and cash equivalents compared to $107.8$101.8 million in cash and cash equivalents at December 31, 2021. We also have $100.2 million of restricted cash in the Acquisition Escrow to fund the purchase price for the OpCo Acquisition.2022. When necessary and available, we supplement the cash flows generated by our operations with funds provided by bank borrowings or other debt or equity financing activities. As of December 31, 2022,2023, we had $30.0 million available on our Revolving Facility. In addition, we have generated cash from sales of existing casino operations, the sale and leaseback of real estate assets, and proceeds from the issuance of equity securities upon the exercise of stock options.
Impact of Economic Uncertainty and COVID-19
TheCurrent macroeconomic conditions remain very dynamic, including impacts from rising inflation and interest rates, volatile changes in foreign currency exchange rates, political unrest and armed conflicts, COVID-19 and other factors. Any worsening in economic conditions, or the perception that conditions may worsen, could reduce consumer discretionary spending or increase our costs and erode our net income and cash flows. While the effects of the COVID-19 pandemic had an adverse effect on our results ofbusiness have largely normalized, and currently our operations financial condition and liquidity for 2020 andhave no COVID-19 restrictions, we were negatively impacted in the first half of 2021. The table below provides a summary2021 because of the time periods in whichclosures of our casinos, hotels and other facilities were closed to comply with quarantines issued by governments to contain the spread of COVID-19.
|
|
|
|
|
|
Operating Segment
| Closure Date
| Reopen Date
|
Colorado
| March 17, 2020
| June 15 and June 17, 2020
|
Missouri
| March 17, 2020
| June 1, 2020
|
West Virginia
| March 17, 2020
| June 5, 2020
|
Edmonton
| March 17, 2020
| June 13, 2020
|
| December 13, 2020
| June 10, 2021
|
Calgary
| March 17, 2020
| June 13, 2020
|
| December 13, 2020
| June 10, 2021
|
Poland
| March 13, 2020
| May 18, 2020
|
| December 29, 2020
| February 12, 2021
|
| March 20, 2021
| May 28, 2021
|
We estimate that the net cash outflows related to operations during the time they were fully suspended in the first two quarters of 2020 were, on average, approximately $8.0 million per month and that the net cash outflows related to Canada and Poland operationsproperties during this period. We cannot predict the time they were fully suspended in 2021 were,negative impacts that additional variants of COVID-19 may have on average, approximately $2.7 million per month. As described in “Results of Operations” above, our casinos varied their operations basedconsumer demand, workforce, suppliers, contractors and other partners and whether future closures will be required. Such closures previously had material impacts on the governmental healthus and any future closures or safety requirements in the jurisdictions in which they are located.
In March 2020, ascould have a proactive measure to increase our cash position and preserve financial flexibility in light of the uncertainty resulting from the COVID-19 pandemic, we borrowed $9.95 millionmaterial impact on our revolving credit facility with Macquarie and $7.4 million on our credit agreement with UniCredit. We repaid the Macquarie revolving credit facility in July 2020 except for a $50,000 letter of credit that we repaid in May 2021. The $7.4 million credit agreement with UniCredit was refinanced in June 2021 to a EUR 6.0 million term loan repayable through December 31, 2025. See Note 6 to the Consolidated Financial Statements included in Part II, Item 8, “Financial Statements and Supplementary Data” of this report for further discussion of the Macquarie Credit Agreement and the UniCredit credit agreement.
We continue to monitor our liquidity and plan to make reductions to marketing and operating expenditures, where possible, ifus. If future government mandates or closures are required that would have an adverse impact on us.us, we will monitor our liquidity and make reductions to marketing and operating expenditures, where possible, as we did in response to COVID-19 in 2021.
Planned Projects, the Nugget Acquisition, the Rocky Gap Acquisition and Sources of Liquidity
Planned capital expenditures in 2023 include approximately $18.2 million in gaming equipment and renovations to various properties. We are constructing a new land-based casino with a small hotel adjacent to and connected with the existing pavilion building inat Century Casino Caruthersville. Construction began in December 2022 with completion expected in latethe fourth quarter of 2024. We estimate this project will cost $51.9 million. ThisThe project is being financed throughwith financing provided by VICI PropCo. As of December 31, 2022,2023, we have received $40.1 million from VICI PropCo and have spent approximately $2.2$20.7 million of those funds on this project. We estimateAs of December 31, 2023, we had approximately $19.4 million of cash on our consolidated balance sheet that was previously funded by VICI PropCo but has not yet been spent on the Caruthersville project. As of December 31, 2023, we had $40.1 million in taxes payable and other related to the financing from VICI PropCo, once the project is completed it will spend approximately $38.5 million on this project in 2023, whichbecome a part of the Master Lease and the liability will be financed by VICI PropCo. accounted for as a financing obligation.
We are also are building a hotel at our Cape Girardeau location. Construction began in September 2022 and is expected to be completed in the first half ofApril 2024. We estimate this project will cost approximately $30.5 million. We plan to fundare funding the project with cash on hand. As of December 31, 2022,2023, we have spent approximately $2.8$22.8 million on this project. We estimate that we will spend approximately $27.4the remaining $7.7 million on this project in 2023.the first half of 2024.
In February 2022,addition to using available cash to fund our working capital needs and pay required lease payments and interest and principal on our debt obligations, we entered into a definitive agreementintend to purchase (i) 50% ofutilize our available cash on capital projects throughout the membership interestscompany, including maintenance and other capital expenditures We estimate planned capital expenditures in PropCo, and (ii) 100% of2024 excluding the membership interests in OpCo. OpCo owns and operates the Nugget Casino Resort in Sparks, Nevada, and PropCo owns the real property on which the casino is located. At the First Closing, on April 1, 2022, we purchased 50% of the membership interests in PropCo for approximately $95.0Missouri construction projects to be between $24.5 million and PropCo entered into a lease with OpCo for an annual rent$35.9 million and will include purchases of $15.0 million.gaming equipment and renovations to various properties. Capital expenditures in 2023 were approximately $21.0 million excluding the Missouri construction projects. We usedspent approximately $29.3$20.0 million of cash on hand in connection with the First Closing. Subject to approval from the Nevada Gaming Commission, our purchase of 100% of the membership interests in OpCo for approximately $100.0 million (subject to certain adjustments) is expected to close in the second quarter of 2023, at which point we will own the operating assets of Nugget Casino Resort and 50% of the membership interests in PropCo. We also have a five-year option to acquire the remaining 50% of the membership interests in PropCo for $105.0 million plus 2% per annum.
As stated above, in connection with the Nugget Acquisition, we have entered into the Goldman Credit Agreement for (i) $350.0 million in senior secured term loan debt financing to refinance our existing debt under the Macquarie Credit Agreement, fund the Nugget Acquisition, and to pay related expenses, and (ii) a $30.0 million senior secured revolving credit facility. The purchase price for the OpCo Acquisition will be paid from $100.0 million of proceeds of the Goldman Term Loan that were borrowed and deposited in the Acquisition Escrow on the First Closing date.
On August 24, 2022, we entered into a definitive agreement with Lakes Maryland, Golden,Cape Girardeau hotel and approximately $18.6 million on the Caruthersville project in 2023. We received $35.1 million from VICI PropCo pursuant to which we agreed to acquire the operations of Rocky Gap for approximately $56.1 million subject to the conditions and terms set forth therein. Pursuant to a real estate purchase agreement, dated August 24, 2022, by and between Evitts and an affiliate of VICI PropCo, VICI PropCo agreed to acquire the real estate assets relating to Rocky Gap for approximately $203.9 million, subject to the conditions and terms set forth therein. In connection with the closing of this transaction, one of our subsidiaries and a subsidiary of VICI PropCo will enter into an amendment to the Master Lease to (i) add Rocky Gap to the Master Lease, (ii) provide for an initial annual rent for Rocky Gap of approximately $15.5 million, and (iii) extend the initial Master Lease term for 15 years from the date of the amendment (subject to the existing four five-year renewal options). We planin 2023 to fund the acquisition withCaruthersville project. We may also utilize available cash on hand.to pay down debt or repurchase our common stock.
We may be required to raise additional capital to address our liquidity and capital needs. We have a shelf registration statement with the SEC that became effective in July 2020June 2023 under which we may issue, from time to time, up to $100 million of common stock, preferred stock, debt securities and other securities. We intend to renew the shelf registration statement in 2023.2026.
If necessary, we may seek to obtain further term loans, mortgages or lines of credit with commercial banks; sellbanks, sale and leaseback transactions of property at our casinos in which we own the land and buildings;or acquire, or other debt or equity financings to supplement our working capital and investing requirements. Our access to and cost of financing will depend on, among other things, global economic conditions, conditions in the financing markets, the availability of sufficient amounts of financing, our prospects and our credit ratings. A financing transaction may not be available on terms acceptable to us, or at all, and a financing transaction may be dilutive to our current stockholders. The failure to raise the funds necessary to fund our debt service and rent obligations and finance our operations and other capital requirements could have a material and adverse effect on our business, financial condition and liquidity.
In addition, we expect our US domestic cash resources will be sufficient to fund our US operating activities and cash commitments for investing and financing activities. While we currently do not have an intent nor foresee a need to repatriate funds, we could require more capital in the US than is generated by our US operations for operations, capital expenditures or significant discretionary activities such as acquisitions of businesses and share repurchases. If so, we could elect to repatriate earnings from foreign jurisdictions in the form of a cash dividend, which would generally be exempt from taxation with the exception of the adverse impact of withholding taxes. We also could elect to raise capital in the US through debt or equity issuances. We estimate that approximately $37.1$118.0 million of our total $101.8$171.3 million in cash and cash equivalents at December 31, 20222023 is held by our foreign subsidiaries, of which $76.8 million is held by our Canadian subsidiaries and $29.4 million is held by our Austrian subsidiary. The cash and cash equivalents held by our foreign subsidiaries are not available to fund US operations unless repatriated. With the completion of the Canada Real Estate Sale, management intends to repatriate a portion of our current earnings in Canada in the form of cash dividends, which would generally be exempt from taxation except for a US foreign withholding tax. In anticipation of this potential repatriation, we recorded a deferred tax liability of $3.6 million for the required foreign tax withholding associated with the cash dividend.
Off-Balance Sheet Arrangements
We do not have any off-balance sheet arrangements, transactions, obligations or other relationships with unconsolidated entities that would be expected to have a material current or future effect upon our consolidated financial statements.
Tax Act
During 2018, the Companywe completed itsour accounting of the one-time transition tax on undistributed and previously untaxed post-1986 foreign earnings and profits imposed by the Tax Cuts and Jobs Act (the “Tax Act”). The Tax Act permits a company to pay the one-time transition tax over eight years on an interest free basis. The remaining cash payments due related to the transition tax total $0.9$0.7 million and are expected to be paid $0.2 million in 2023, $0.3 million in 2024 and $0.4 million in 2025.
Critical Accounting Estimates
Management's discussion and analysis of our results of operations and liquidity and capital resources are based on our consolidated financial statements. To prepare our consolidated financial statements in accordance with accounting principles generally accepted in the United States of America, we must make estimates and assumptions that affect the amounts reported in the consolidated financial statements. On an ongoing basis, we evaluate these estimates. We base our estimates on historical experience and on various other assumptions that we believe to be reasonable under the circumstances, the results of which form the basis for making judgments about the carrying values of assets and liabilities that are not readily apparent from other sources. Actual results may differ materially from these estimates under different assumptions or conditions. Our significant accounting policies are discussed in Note 2 to the Consolidated Financial Statements included in Item 8, “Financial Statements and Supplementary Data” of this report. Critical estimates inherent in these accounting policies are discussed in the following paragraphs.
Property and Equipment – We have significant capital invested in our property and equipment, which represented approximately 56%69% of our total assets as of December 31, 2022.2023. Judgments are made in determining the estimated useful lives of assets, salvage values to be assigned to assets and if or when an asset has been impaired. The accuracy of these estimates affects the amount of depreciation expense recognized in our financial results and the extent to which we have a gain or loss on the disposal of the asset. We assign lives to our assets based on our standard policy, which we believe is representative of the useful life of each category of assets. As of December 31, 2022,2023, we have made no changes to our estimates related to useful lives.
We use judgment in estimating future cash flows when we review the carrying value of our property and equipment whenever events and circumstances indicate that the carrying value of an asset may not be recoverable. The factors we consider in performing this assessment include current operating results, trends and prospects, as well as the effect of obsolescence, demand, competition and other economic factors. The accuracy of these estimates affects the carrying value of our property and equipment on our consolidated balance sheets. As of December 31, 2022,2023, we believe that our investments in property and equipment are recoverable.
Goodwill and Intangible Assets – We test goodwill and indefinite-lived intangible assets for impairment as of October 1 each year, or more frequently as circumstances indicate it is necessary. Our identifiable intangible assets include trademarks, player’s club lists and casino licenses. Testing compares the estimated fair values of our reporting units to the reporting units’ carrying values. Assessing goodwill and intangible assets for impairment requires significant judgment and involves detailed qualitative and quantitative business-specific analysis and many individual assumptions that may fluctuate between assessments. Our properties’ estimated future cash flows are a primary assumption in the respective impairment analyses. Cash flow estimates include assumptions regarding factors such as recent and budgeted operating performance, growth percentages as well as competitive impacts from current and anticipated competition, operating margins and current regulatory, social and economic climates. The most significant of the assumptions used in our valuations include revenue growth/decline percentages, discount rates, future
terminal values and capital expenditure assumptions. These assumptions are developed for each property based on historical trends, the current markets in which they operate and projections of future performance and competition.
We believe we have used reasonable estimates and assumptions to calculate the fair value of our goodwill and indefinite-lived intangible assets; however, these estimates and assumptions could be materially different from actual results. Unforeseen events, changes in circumstances and market conditions and material differences in estimates of future cash flows could negatively affect the fair value of our assets. If actual market conditions are less favorable than those projected, or if events occur or circumstances change that could reduce the fair value of our goodwill of intangible assets below the carrying value, we will recognize an impairment for the amount by which the carrying value exceeds the reporting unit’s fair value, which may be material.
Our reporting units with goodwill balances as of December 31, 20222023 are included within United States, Canada and Poland reportable segments. For the quantitative goodwill impairment test, the current fair value of each reporting unit with goodwill balances is estimated using a combination of (i) the income approach using the discounted cash flow method for projected revenue, EBITDAEBITDAR and working capital, (ii) the market approach observing the price at which comparable companies or shares of comparable companies are bought or sold, and (iii) fair value measurements using either quoted market price or an estimate of fair value using a present value technique. The cost approach, estimating the cost of reproduction or replacement of an asset, was considered but not used because it does not adequately capture an operating company’s intangible value. We make a variety of estimates and judgments about the relevance of these factors to the reporting units in estimating their fair values. During 2020, as a result of the COVID-19 pandemic and associated closures of our casinos, we determined that goodwill was impaired related to certain reporting units. For information about the 2020 impairments, see Note 5 to the Consolidated Financial Statements included in Part II, Item 8, “Financial Statements and Supplementary Data” of this report. As of December 31, 2022,2023, the estimated fair value of our CDRNugget and Rocky Gap reporting unit exceeded itsunits equaled their carrying value by 38%.values. Goodwill related to our CDRNugget and Rocky Gap reporting unit was $0.1units were $43.7 million and $26.5 million, respectively, as of December 31, 2022.2023. Key assumptions in the valuation of the CDR reporting unitunits relate to future earnings at CDR.Nugget and Rocky Gap. A downturn in the AlbertaNevada, Maryland or United States economy could negatively affect the key assumptions management used in its analysis.analysis of these reporting units.
Our Century Casinos and Casinos Poland trademarks and our casino licenses, with the exception of CPL, are indefinite-lived intangible assets and therefore are not amortized. The fair values are determined primarily using the multi-period excess earnings methodology (“MPEEM”) and the relief from royalty method under the income approach. For information about impairments in 2020, see Note 5 to the Consolidated Financial Statements included in Part II, Item 8, “Financial Statements and Supplementary Data” of this report. As of December 31, 2022,2023, the fair value of our indefinite-lived intangible assets at our CSA reporting unit was 8%10% in excess of its related carrying value. Intangible assets related to our CSA reporting unit were $9.0$9.2 million as of December 31, 2022.2023. Key assumptions in the valuation of intangible assets at the CSA reporting unit relate to future earnings at CSA. A downturn in the Alberta economy could negatively affect the key assumptions management used in its analysis.
Our casino licenses related to CPL, our Mountaineer trademark and our player’s club lists are finite-lived intangible assets and are amortized over their respective useful lives. Finite-lived intangibles are evaluated for impairment annually or more frequently if necessary. There were no impairment charges recorded for the finite-lived intangible assets for the periods presented in this report.
Income Taxes – The determination of our provision for income taxes requires management’s judgment in the use of estimates and the interpretation and application of complex tax laws. Judgment is also required in assessing the timing and amounts of deductible and taxable items. We establish contingency reserves for material, known tax exposures relating to deductions, transactions and other matters involving some uncertainty as to the proper tax treatment of the item. Our reserves reflect our judgment as to the resolution of the issues involved if subject to judicial review. Several years may elapse before a particular matter, for which we have established a reserve, is audited and finally resolved or clarified. While we believe that our reserves are adequate to cover reasonably expected tax risks, issues raised by a tax authority may be finally resolved at an amount different from the related reserve. Such differences could materially increase or decrease our income tax provision in the current and/or future periods. When facts and circumstances change (including a resolution of an issue or statute of limitations expiration), these reserves are adjusted through the provision for income taxes in the period of change. To the extent we determine that we will not realize the benefit of some or all of the deferred tax assets, then these assets will be adjusted through our provision for income taxes in the period in which this determination is made.
Additionally, evaluating the need for, and amount of, a valuation allowance for deferred tax assets often requires significant judgment and extensive analysis of all the positive and negative evidence available to determine whether all or some portion of deferred tax assets will not be realized. Because management believes it is more likely than not that the benefit from certain deferred tax assets will not be realized, a valuation allowance of $9.9$11.4 million in foreign jurisdictions has been provided in recognition of these risks. If our assumptions change and it is determined that we will be able to realize tax benefits related to these foreign deferred tax assets, we will realize a reduction in income tax expense in the year such valuation allowances are reversed. Further, management currently believes it is more likely than not that the $21.5 million of net deferred tax assets in the US will be realized. Unless sufficient taxable income is generated in the US, a valuation allowance to reduce deferred tax assets may be required in 2024, which would materially increase the tax expense in the period the allowance is recognized.
The Tax Act createdFollowing the completion of the Canada Real Estate Sale, management intends to utilize a new requirement that certain income earned by a controlled foreign corporation (“CFC”) referred to as global intangible low-taxed income (“GILTI”) must be included currentlysignificant portion of the sale proceeds in the gross incomeUS, which would require repatriation in the form of the CFC’s US shareholder.a cash dividend. We have elected to account for GILTI in the year therecorded a deferred tax is incurred as a current period expense. A tax expense, netliability of foreign tax credits, of $0.1$3.6 million was recorded in income tax (benefit) expense on our consolidated statement of earnings for the year ended December 31, 2022. We did not record a net tax expense related to GILTI for the years ended December 31, 2021 and 2020.
Based on our estimate of future domestic cash generation, debt, liquidity position, and specific plans for reinvestment of foreign subsidiary earnings, there is no expected need for cash repatriation. Therefore, we continue to consider our foreign earnings indefinitely reinvested outside the United States, and no US taxes have been provided for.
See Note 13 to the Consolidated Financial Statements included in Part II, Item 8, “Financial Statements and Supplementary Data” of this report for additional discussion of the Tax Act.
on the estimated foreign withholding tax required as part of a cash dividend to the US. Management continues to consider historical foreign earnings in Canada, as well as accumulated earnings in other jurisdictions, indefinitely reinvested outside of the US.
Business Combinations – In accordance with ASC 805, “Business Combinations” (“ASC 805”), the Nugget Acquisition and Rocky Gap Acquisition were recorded using the acquisition method of accounting. We consolidate the operating results of Nugget and Rocky Gap from the date of each acquisition. We recognize and measure the identifiable assets acquired, liabilities assumed and any non-controlling interest acquired at fair value at the acquisition date. The valuation of intangible assets requires management judgement, the utilization of independent valuation experts and often involves the use of significant estimates and assumptions with respect to timing and amounts of future cash inflows and outflows, discount rates, market prices and asset lives, among other things. If the subsequent projections of the underlying business activity change compared with the assumptions and projections used to develop these fair values, we could record impairment charges. The valuation of intangible assets was determined using an income approach methodology. Our key assumptions used in valuing the intangible assets included projected future revenues, customer attrition rates and market recognition. The excess of total consideration transferred over the fair value of identifiable assets acquired and liabilities assumed was recognized as goodwill. Costs incurred as the result of the acquisitions were recorded in the period the costs were incurred.
We accounted for the Nugget Acquisition as a business combination, and accordingly, the acquired assets of $256.6 million (including $6.8 million in cash) and liabilities of $194.8 million were included in our consolidated balance sheet at April 3, 2023. The Nugget Acquisition generated $43.7 million of tax deductible goodwill for the United States segment.
We accounted for the Rocky Gap Acquisition as a business combination, and accordingly, the acquired assets of $244.9 million (including $6.7 million in cash) and liabilities of $212.1 million were included in our consolidated balance sheet at July 25, 2023. The Rocky Gap Acquisition generated $26.5 million of tax deductible goodwill for the United States segment.
Item 7A. Quantitative and Qualitative Disclosures about Market Risk.
Our earnings, cash flows and financial position are exposed to market risks relating to fluctuations in interest rates and foreign currency exchange rates. All of the potential changes noted below are based on information available at December 31, 2022.2023. The majority of our $349.6$346.8 million face value of debt outstanding as of December 31, 20222023 is variable-rate debt. Each one percentage point change associated with the variable rate debt would result in a $3.5 million change to our annual cash interest expenses.
Foreign Currency Exchange Risk
As a result of our international business presence, we are exposed to foreign currency exchange risk. We transact in foreign currencies and have assets and liabilities denominated in foreign currencies. Therefore, our earnings experience volatility related to movements in foreign currency exchange rates. We have not hedged against foreign currency exchange rate changes related to our international operations. Our foreign subsidiaries transact in their local currencies and hold the majority of their assets and liabilities in their local currency.
The majority of our foreign currency exposure is related to the US dollar versus the Canadian dollar and the Polish zloty. The assets and liabilities of our foreign subsidiaries that are measured in foreign currencies are translated at the applicable period-end exchange rate on our consolidated balance sheets. The resulting translation adjustment is included in accumulated other comprehensive loss as a component of shareholders’ equity. During the years ended December 31, 2023, 2022 2021 and 2020,2021, the change in the relative value of the US dollar against all foreign currencies in which our foreign subsidiaries operate resulted in a ($3.8) million decrease, $9.7 million increase, and $0.5 million increase, and ($3.4) million decreaserespectively, in accumulated other comprehensive loss within shareholder’s equity, respectively.shareholders equity.
We translate revenue and expenses at each period’s average exchange rate on our consolidated statementstatements of (loss) earnings (loss) and the gains and losses from translation are included in the results of operations as incurred. A depreciation in the value of the US dollar in relation to all foreign currencies in which our foreign subsidiaries operate would increase the earnings from our foreign operations when translated into US dollars. The timing of the changes in the relative value of the US dollar combined with the operations that are impacted by that change can affect the magnitude of the impact that fluctuations in foreign exchange rates have on our earnings from operations. In 2022,2023, earnings from operations were $67.6$64.0 million. For the year ended December 31, 2022,2023, a 10% depreciation in the value of the US dollar relative to the Canadian dollar and the Polish zloty would have resulted in an increase in earnings from operations of $2.3 million.
As of December 31, 2022,2023, our debt is primarily held in US dollars.
Item 8. Financial Statements and Supplementary Data.
See Index to Financial Statements on page F-1.
Item 9. Changes in and Disagreements With Accountants on Accounting and Financial Disclosure.
None.
Item 9A. Controls and Procedures.
Evaluation of Disclosure Controls and Procedures – Our management, with the participation of our principal executive officers and principal financial officer, has evaluated the effectiveness of our disclosure controls and procedures, as defined in Rules 13a-15(e) and 15d-15(e) under the Exchange Act, as of December 31, 2022.2023. Based on such evaluation, our principal executive officers and principal financial officer have concluded that as of December 31, 2022,2023, our disclosure controls and procedures were effective.
Management’s Annual Report on Internal Control over Financial Reporting – Our management is responsible for establishing and maintaining adequate internal control over financial reporting, as defined in Rules 13a-15(f) and 15d-15(f) under the Exchange Act. Our internal control system was designed to provide reasonable assurance to our management and board of directors regarding the reliability of financial reporting and the preparation of financial statements.
Our management has assessed the effectiveness of our internal control over financial reporting as of December 31, 2022.2023. In making this assessment, our management used the criteria set forth in the Committee of Sponsoring Organizations of the Treadway Commission (“COSO”) in Internal Control – Integrated Framework (2013). Based on this assessment, our management believes that, as of December 31, 2022,2023, our internal control over financial reporting was effective based on those criteria.
We are in the process of integrating Nugget and Rocky Gap and our internal control over financial reporting. As a result of these integration activities, certain controls will be evaluated and may be changed. We believe, however, that we will be able to maintain sufficient internal control over financial reporting throughout this integration process.
The effectiveness of our internal control over financial reporting as of December 31, 20222023 has been audited by Grant Thornton LLP, an independent registered public accounting firm, as stated in their report which is included herein on the following page.
Changes in Internal Control Over Financial Reporting – There were no changes in our internal control over financial reporting during the three months ended December 31, 20222023 that have materially affected, or are reasonably likely to materially affect, our internal control over financial reporting.
REPORT OF INDEPENDENT REGISTERED PUBLIC ACCOUNTING FIRM
Board of Directors and Shareholders
Century Casinos, Inc.
Opinion on internal control over financial reporting
We have audited the internal control over financial reporting of Century Casinos, Inc. (a Delaware corporation) and subsidiaries (the “Company”) as of December 31, 2022,2023, based on criteria established in the 2013 Internal Control—Integrated Framework issued by the Committee of Sponsoring Organizations of the Treadway Commission (“COSO”). In our opinion, the Company maintained, in all material respects, effective internal control over financial reporting as of December 31, 2022,2023, based on criteria established in the 2013 Internal Control—Integrated Framework issued by COSO.
We also have audited, in accordance with the standards of the Public Company Accounting Oversight Board (United States) (“PCAOB”), the consolidated financial statements of the Company as of and for the year ended December 31, 2022,2023, and our report dated March 9, 202313, 2024 expressed an unqualified opinion on those financial statements.
Basis for opinion
The Company’s management is responsible for maintaining effective internal control over financial reporting and for its assessment of the effectiveness of internal control over financial reporting, included in the accompanying Management’s Annual Report on Internal Control over Financial Reporting.Reporting (“Management’s Report”). Our responsibility is to express an opinion on the Company’s internal control over financial reporting based on our audit. We are a public accounting firm registered with the PCAOB and are required to be independent with respect to the Company in accordance with the U.S. federal securities laws and the applicable rules and regulations of the Securities and Exchange Commission and the PCAOB.
We conducted our audit in accordance with the standards of the PCAOB. Those standards require that we plan and perform the audit to obtain reasonable assurance about whether effective internal control over financial reporting was maintained in all material respects. Our audit included obtaining an understanding of internal control over financial reporting, assessing the risk that a material weakness exists, testing and evaluating the design and operating effectiveness of internal control based on the assessed risk, and performing such other procedures as we considered necessary in the circumstances. We believe that our audit provides a reasonable basis for our opinion.
Our audit of, and opinion on, the Company’s internal control over financial reporting does not include the internal control over financial reporting of Nugget Casino Resort (“Nugget”) and Rocky Gap Casino, Resort & Golf (“Rocky Gap”), wholly-owned subsidiaries, whose financial statements reflect total assets (excluding goodwill and intangible assets) constituting 17 percent and 16 percent, respectively, and net operating revenues constituting 15 percent and 6 percent, respectively, of the related consolidated financial statement amounts as of and for the year ended December 31, 2023. As indicated in Management’s Report, Nugget and Rocky Gap were acquired during 2023. Management’s assertion on the effectiveness of the Company’s internal control over financial reporting excluded internal control over financial reporting of Nugget and Rocky Gap.
Definition and limitations of internal control over financial reporting
A company’s internal control over financial reporting is a process designed to provide reasonable assurance regarding the reliability of financial reporting and the preparation of financial statements for external purposes in accordance with generally accepted accounting principles. A company’s internal control over financial reporting includes those policies and procedures that (1) pertain to the maintenance of records that, in reasonable detail, accurately and fairly reflect the transactions and dispositions of the assets of the company; (2) provide reasonable assurance that transactions are recorded as necessary to permit preparation of financial statements in accordance with generally accepted accounting principles, and that receipts and expenditures of the company are being made only in accordance with authorizations of management and directors of the company; and (3) provide reasonable assurance regarding prevention or timely detection of unauthorized acquisition, use, or disposition of the company’s assets that could have a material effect on the financial statements.
Because of its inherent limitations, internal control over financial reporting may not prevent or detect misstatements. Also, projections of any evaluation of effectiveness to future periods are subject to the risk that controls may become inadequate because of changes in conditions, or that the degree of compliance with the policies or procedures may deteriorate.
/s/ GRANT THORNTON LLP
San Francisco, California
March 9, 202313, 2024
Item 9B. Other Information.
None.None of our directors or executive officers adopted, modified, or terminated a Rule 10b5-1 trading arrangement or a non-Rule10b5-1 trading arrangement during the fiscal quarter ended December 31, 2023.
Item 9C. Disclosure Regarding Foreign Jurisdictions that Prevent Inspections.
None.
PART III
Item 10. Directors, Executive Officers and Corporate Governance.
The information required by this item will be included in our definitive proxy statement for our 20232024 Annual Meeting of Stockholders to be filed with the SEC within 120 days after December 31, 20222023 and is incorporated herein by reference. Information required by Regulation S-K Item 401 concerning executive officers is included in Part I of this Annual Report on Form 10-K under the caption “Information about our Executive Officers.”
We have adopted a Code of Business Conduct and Ethics that applies to all directors, officers and employees, including our Co-Chief Executive Officers, our Principal Financial Officer and our Principal Accounting Officer. A complete text of this Code of Business Conduct and Ethics is available on our web site (www.cnty.com/(www.cnty.com/investor/governance/facts-overview)facts-overview). Any future amendments to or waivers of the Code of Business Conduct and Ethics will be posted to the Corporate Governance section of our web site.
Item 11. Executive Compensation.
The information required by this item will be included in our definitive proxy statement for our 20232024 Annual Meeting of Stockholders to be filed with the SEC within 120 days after December 31, 20222023 and is incorporated herein by reference.
Item 12. Security Ownership of Certain Beneficial Owners and Management and Related Stockholder Matters.
The information required by this item relating to securities ownership of certain beneficial owners and management will be included in our definitive proxy statement for our 20232024 Annual Meeting of Stockholders to be filed with the SEC within 120 days after December 31, 20222023 and is incorporated herein by reference. Information relating to securities authorized for issuance under equity compensation plans as of December 31, 20222023 is as follows:
|
|
|
Plan Category | Number of securities to be issued upon exercise of outstanding options, warrants and rights | Weighted-average exercise price of outstanding options, warrants and rights | Number of securities remaining available for future issuance under equity compensation plans (excluding securities reflected in column (a)) | Number of securities to be issued upon exercise of outstanding options, warrants and rights | Weighted-average exercise price of outstanding options, warrants and rights | Number of securities remaining available for future issuance under equity compensation plans (excluding securities reflected in column (a)) |
| (a) | (b) | (c) | (a) | (b) | (c) |
Equity compensation plans approved by security holders (1) | 2,158,862 (2) | $5.18 (3) | 2,437,838 | 2,207,107 (2) | $5.73 (3) | 420,385 |
Equity compensation plans not approved by security holders | — | — |
Total | 2,158,862 | $5.18 | 2,437,838 | 2,207,107 | $5.73 | 420,385 |
(1)These plans consist of the 2005 Equity Incentive Plan, as amended (the “2005 Plan”), which expired in June 2015, and the 2016 Equity Incentive Plan (the “2016 Plan”), which was approved by our stockholders on June 9, 2016.
(2)As of December 31, 2022,2023, there were (i) 1,096,70051,700 shares of our common stock issuable upon exercise of outstanding options issued under the 2005 Plan, (ii) 75,0001,095,000 shares of our common stock issuable upon exercise of outstanding options issued under the 2016 Plan, and (iii) 987,1621,060,407 performance stock units (the “PSUs”) issued under the 2016 Plan that, if and when vested, will be settled in shares of our common stock. The amount reported in the table assumes target level performance for the PSUs. Assuming maximum level performance for the PSUs, the number of shares of common stock would increase by 987,162.1,060,407.
(3)The weighted-average exercise price relates only to outstanding stock options.
Item 13. Certain Relationships and Related Transactions, and Director Independence.
The information required by this item will be included in our definitive proxy statement for our 20232024 Annual Meeting of Stockholders to be filed with the SEC within 120 days after December 31, 20222023 and is incorporated herein by reference.
Item 14. Principal Accounting Fees and Services.
The information required by this item will be included in our definitive proxy statement for our 20232024 Annual Meeting of Stockholders to be filed with the SEC within 120 days after December 31, 20222023 and is incorporated herein by reference.
PART IV
Item 15. Exhibits and Financial Statement Schedules.
|
|
|
|
|
|
(a) | List of documents filed with this report |
1. | Financial Statements |
| The financial statements and related notes, together with the reports of our independent registered public accounting firm, appear in Part II, Item 8, “Financial Statements and Supplementary Data”, of this Form 10-K. |
2. | Financial Statement Schedules |
| None. |
3. | List of Exhibits |
(b) | Exhibits Filed Herewith or Incorporated by Reference to Previous Filings with the Securities and Exchange Commission |
| (2) Plan of Acquisition, Reorganization, Arrangement, Liquidation or Succession |
2.1 | Equity Purchase Agreement, dated as of June 17, 2019, by and among Century Casinos, Inc., MTR Gaming Group, Inc., Isle of Capri Casinos LLC, VICI Properties L.P. and Eldorado Resorts, Inc. is hereby incorporated by reference to Exhibit 2.1 to the Company’s Current Report on Form 8-K filed on June 17, 2019.
|
2.2
| Membership Interest Purchase Agreement, dated as of February 22, 2022, by and among Marnell Gaming, LLC, as seller, Century Nevada Acquisition, Inc., as buyer, and Century Casinos, Inc., as guarantor, is hereby incorporated by reference to Exhibit 2.1 to the Company’s Current Report on Form 8-K filed on February 23, 2022. |
2.32.2
| Equity Purchase Agreement, dated as of August 24, 2022, by and among Lakes Maryland Development, LLC, Century Casinos, Inc., VICI Properties L.P. and Golden Entertainment, Inc., is hereby incorporated by reference to the Company’s Current Report on Form 8-K filed on August 26, 2022. |
2.3 | Portfolio Agreement of Purchase and Sale, dated as of May 16, 2023, by and among Century Resorts Alberta Inc., Century Casino St. Albert Inc., Century Mile Inc. and United Horsemen of Alberta Inc., collectively as Vendor and Century Casinos, Inc., as Vendor Parent and VICI Properties L.P. as Purchaser is hereby incorporated by reference to the Exhibit 2.1 to the Company's Quarterly Report on Form 10-Q filed on August 7, 2023. |
| (3) Articles of Incorporation and Bylaws |
3.1P | Certificate of Incorporation of Century Casinos, Inc. is hereby incorporated by reference to the Company’s Proxy Statement in respect of the 1994 Annual Meeting of Stockholders. |
3.2 | Amended and Restated Bylaws of Century Casinos, Inc., is hereby incorporated by reference to Exhibit 11.14 to the Company’s Quarterly Report on Form 10-Q for the quarter ended June 30, 2002. |
| (4) Instruments defining the rights of security holders, including indentures |
4.1 | Description of Securities, is hereby incorporated by reference to Exhibit 4.1 to the Company's Annual Report on Form 10-K filed on March 13, 2020. |
4.2 | Form of Indenture – Senior Debt Securities is hereby incorporated by reference to Exhibit 4.4 to the Company’s Registration Statement on Form S-3 filed with the SEC on July 7, 2020. |
4.3 | Form of Indenture – Subordinated Debt Securities is hereby incorporated by reference to Exhibit 4.5 to the Company’s Registration Statement on Form S-3 filed with the SEC on July 7, 2020. |
| (10) Material Contracts |
10.1 | Credit Agreement by and between Century Casinos Europe GmbH and United Horsemen of Alberta Inc., dated October 25, 2012, is hereby incorporated by reference to Exhibit 10.1 to the Company’s Current Report on Form 8-K filed on December 3, 2012. |
10.2 | Management Agreement by and between Century Casinos Europe GmbH and United Horsemen of Alberta Inc., dated November 30, 2012, is hereby incorporated by reference to Exhibit 10.2 to the Company’s Current Report on Form 8-K filed on December 3, 2012. |
10.3 | Credit Agreement dated as of November 29, 2013 by and between Century Casinos Europe GmbH and United Horsemen of Alberta Inc., is hereby incorporated by reference to Exhibit 10.2B to the Company’s Current Report on Form 8-K filed on December 3, 2013. |
10.4A* | Employment Agreement by and between Century Casinos, Inc. and Erwin Haitzmann as restated on February 18, 2003, is hereby incorporated by reference to Exhibit 10.120 to the Company’s Annual Report on Form 10-K for the fiscal year ended December 31, 2002. |
10.4B* | Amendment No. 1 to Employment Agreement by and between Century Casinos, Inc. and Erwin Haitzmann, dated February 3, 2005, is hereby incorporated by reference to Exhibit 10.143 to the Company’s Current Report on Form 8-K filed on February 10, 2005. |
10.4C* | Amendment No. 2 to Employment Agreement by and between Century Casinos, Inc. and Erwin Haitzmann, effective September 1, 2006, is hereby incorporated by reference to Exhibit 10.178 to the Company’s Current Report on Form 8-K filed on October 19, 2006. |
|
|
10.4D* | Amendment No. 3 to Employment Agreement by and between Century Casinos, Inc. and Erwin Haitzmann, effective November 5, 2009, is hereby incorporated by reference to Exhibit 10.1 to the Company’s Current Report on Form 8-K filed on November 10, 2009. |
10.4E* | Amendment No. 4 to Employment Agreement by and between Century Casinos, Inc. and Erwin Haitzmann, effective November 3, 2014, is hereby incorporated by reference to Exhibit 10.1 to the Company’s Current Report on Form 8-K filed on November 12, 2014. |
10.4F* | Amendment to Employment Agreement, by and among Century Casinos, Inc., Century Resorts International Ltd., Century Casinos Europe GmbH and Erwin Haitzmann, effective September 30, 2015, is hereby incorporated by reference to Exhibit 10.1 to the Company’s Quarterly Report on Form 10-Q filed on November 6, 2015. |
10.5A* | Employment Agreement by and between Century Casinos, Inc. and Peter Hoetzinger as restated on February 18, 2003, is hereby incorporated by reference to Exhibit 10.121 to the Company’s Annual Report on Form 10-K for the fiscal year ended December 31, 2002. |
10.5B* | Amendment No. 1 to Employment Agreement by and between Century Casinos, Inc. and Peter Hoetzinger, dated February 3, 2005, is hereby incorporated by reference to Exhibit 10.144 to the Company’s Current Report on Form 8-K filed on February 10, 2005. |
10.5C* | Amendment No. 2 to Employment Agreement by and between Century Casinos, Inc. and Peter Hoetzinger, effective September 1, 2006, is hereby incorporated by reference to Exhibit 10.179 to the Company’s Current Report on Form 8-K filed on October 19, 2006. |
10.5D* | Amendment No. 3 to Employment Agreement by and between Century Casinos, Inc. and Peter Hoetzinger, effective November 5, 2009, is hereby incorporated by reference to Exhibit 10.2 to the Company’s Current Report on Form 8-K filed on November 10, 2009. |
10.5E* | Amendment No. 4 to Employment Agreement by and between Century Casinos, Inc. and Peter Hoetzinger effective November 3, 2014, is hereby incorporated by reference to Exhibit 10.2 to the Company’s Current Report on Form 8-K filed on November 12, 2014. |
10.6* | Revised and Restated Management Agreement, effective September 30, 2006, by and between Century Resorts International Ltd, Century Casinos, Inc. and Flyfish Casino Consulting AG, is hereby incorporated by reference to Exhibit 10.176 to the Company’s Current Report on Form 8-K filed on October 19, 2006. |
10.7* | Revised and Restated Management Agreement, effective September 30, 2006, by and between Century Resorts International Ltd, Century Casinos, Inc. and Focus Casino Consulting AG, is hereby incorporated by reference to Exhibit 10.177 to the Company’s Current Report on Form 8-K filed on October 19, 2006. |
10.8* | Employment Agreement by and between Century Casinos, Inc. and Margaret Stapleton, effective November 18, 2019 is hereby incorporated by reference to Exhibit 10.1 to the Company’s Current Report on Form 8-K filed on November 20, 2019. |
10.9* | Century Casinos, Inc. Amended and Restated 2005 Equity Incentive Plan, as amended and restated as of December 26, 2014, is hereby incorporated by reference to Exhibit 10.13 to the Company’s Annual Report on Form 10-K for the fiscal year ended December 31, 2014. |
10.9*10.10*
| Century Casinos, Inc. 2016 Equity Incentive Plan is hereby incorporated by reference to Appendix A to the Company’s Definitive Proxy Statement on Schedule 14A filed on April 29, 2016. |
10.10A10.11*
| Form of Century Casinos, Inc. Performance Stock Unit Award Agreement is hereby incorporated by reference to Exhibit 10.1 to the Company’s Current Report on Form 8-K filed on March 8, 2017. |
10.12* | Form of Century Casinos, Inc. Option Agreement is hereby incorporated by reference to Exhibit 10.20 to the Company's Annual Report on Form 10-K filed on March 13, 2020. |
10.13* | Form of Stock Unit Agreement is hereby incorporated by reference to Exhibit 10.1 to the Company's Current Report on Form 8-K filed on March 21, 2023. |
10.14A | Share and Real Property Purchase Agreement, dated as of June 29, 2016, by and among Century Casinos Europe GmbH, 851896 Alberta Ltd., Game Plan Developments Ltd., Casino St. Albert Inc., Action ATM Inc., MVP Sports Bar Ltd. and Bruce McPherson, is hereby incorporated by reference to Exhibit 10.2 to the Company’s Quarterly Report on Form 10-Q filed on August 5, 2016. |
10.10B10.14B
| Assignment of Share and Real Property Purchase Agreement, dated July 22, 2016, by and between Century Casinos Europe GmbH and Century Casino St. Albert Inc., is hereby incorporated by reference to Exhibit 10.1 to the Company’s Quarterly Report on Form 10-Q filed on November 1, 2016. |
10.10C10.14C
| First Amendment to Share and Real Property Purchase Agreement, dated as of August 24, 2016, by and among Century Casino St. Albert Inc., Casino St. Albert Inc., Action ATM Inc., MVP Sports Bar Ltd., Game Plan Developments Ltd., 851896 Alberta Ltd. and Bruce McPherson, is hereby incorporated by reference to Exhibit 10.2 to the Company’s Quarterly Report on Form 10-Q filed on November 1, 2016. |
10.10D10.14D
| Second Amendment to Share and Real Property Purchase Agreement, dated as of September 19, 2016, by and among Century Casino St. Albert Inc., Casino St. Albert Inc., Action ATM Inc., MVP Sports Bar Ltd., Game Plan Developments Ltd., 851896 Alberta Ltd. and Bruce McPherson, is hereby incorporated by reference to Exhibit 10.3 to the Company’s Quarterly Report on Form 10-Q filed on November 1, 2016. |
10.11*
| Form of Century Casinos, Inc. Performance Stock Unit Award Agreement is hereby incorporated by reference to Exhibit 10.1 to the Company’s Current Report on Form 8-K filed on March 8, 2017.
|
10.1210.15
| Loan Agreement dated August 13, 2018, by and among Century Resorts Management GmbH, Century Casinos, Inc. and UniCredit Bank Austria AG is hereby incorporated by reference to Exhibit 10.1 to the Company’s Current Report on Form 8-K filed on August 16, 2018. |
10.13*
| Employment Agreement by and between Century Casinos, Inc. and Margaret Stapleton, effective November 18, 2019 is hereby incorporated by reference to Exhibit 10.1 to the Company’s Current Report on Form 8-K filed on November 20, 2019.
|
10.14A10.16A
| Credit Agreement, dated as of December 6, 2019, among the Company, as borrower, the Company’s subsidiaries party thereto, Macquarie Capital Funding LLC, as swingline lender, administrative agent and collateral agent, Macquarie Capital (USA) Inc., as sole lead arranger and sole bookrunner, and the Lenders and L/C Lenders party thereto is hereby incorporated by reference to Exhibit 10.1 to the Company’s Current Report on Form 8-K filed on December 9, 2019. |
10.14B10.16B
| Amendment No. 2 and Waiver to Credit Agreement, dated as of September 30, 2020, among the Company, as borrower, the Company’s subsidiaries party thereto, Macquarie Capital Funding LLC, as swingline lender, administrative agent and collateral agent, Macquarie Capital (USA) Inc., as sole lead arranger and sole bookrunner, and the Lenders and L/C Lenders party thereto, is hereby incorporated by reference to the Company’s Current Report on Form 8-K/A filed with the SEC on October 16, 2020. |
10.14C10.16C
| Amendment No. 3 to Credit Agreement, dated as of December 15, 2020, among the Company, as borrower, the Company’s subsidiaries party thereto, and Macquarie Capital Funding LLC, as administrative agent, collateral agent and Lender, is hereby incorporated by reference to the Company’s Current Report on Form 8-K filed with the SEC on December 17, 2020. |
10.15A10.17A
| Lease, dated as of December 6, 2019, among certain of the Company’s subsidiaries named therein, as tenant, and certain of VICI Properties Inc.’s subsidiaries named therein, as landlord is hereby incorporated by reference to Exhibit 10.1 to the Company’s Current Report on Form 8-K filed on December 11, 2019. |
10.15B†10.17B
| First Amendment to Memorandum of Lease, dated as of May 5, 2020, among certain of the Company’s subsidiaries named therein, as tenant, and certain of VICI Properties Inc.’s subsidiaries named therein, as landlord.landlord is hereby incorporated by reference to Exhibit 10.15B to the Company’s Annual Report on Form 10-K filed on March 3, 2023. |
10.15C†10.17C
| Second Amendment to Lease, dated as of December 14, 2021, among certain of the Company’s subsidiaries named therein, as tenant, and certain of VICI Properties Inc.’s subsidiaries named therein, as landlord.landlord is hereby incorporated by reference to Exhibit 10.15C to the Company’s Annual Report on Form 10-K filed on March 3, 2023. |
10.15D10.17D
| Third Amendment to Lease, dated as of December 1, 2022, among certain of the Company’s subsidiaries named therein, as tenant, and certain of VICI Properties Inc.’s subsidiaries named therein, as landlord is hereby incorporated by reference to Exhibit 10.1 to the Company’s Current Report on Form 8-K filed on December 5, 2022. |
10.16*10.17E
| FormFourth Amendment to Lease, dated as of Century Casinos,July 25, 2023, among certain of the Company’s subsidiaries named therein, as tenant, and certain of VICI Properties Inc. Option Agreement’s subsidiaries named therein, as landlord is hereby incorporated by reference to Exhibit 10.2010.2 to the Company's AnnualQuarterly Report on Form 10-K10-Q filed on March 13, 2020.August 7, 2023.
|
10.1710.17F
| Fifth Amendment to Lease, dated as of September 6, 2023, among certain of the Company’s subsidiaries named therein, as tenant, and certain of VICI Properties Inc.’s subsidiaries named therein, as landlord is hereby incorporated by reference to Exhibit 10.1 to the Company's Quarterly Report on Form 10-Q filed on November 8, 2023. |
10.18 | Credit Agreement, dated as of April 1, 2022, among Century Casinos, Inc., as borrower, the subsidiaries of Century Casinos, Inc. party thereto, Goldman Sachs Bank USA, as administrative agent and collateral agent, Goldman Sachs Bank USA and BOFA Securities, Inc., as joint lead arrangers and joint bookrunners, and the Lenders and L/C Lenders party thereto, is hereby incorporated by reference to the Company’s Current Report on Form 8-K filed on April 5, 2022. |
| (21) Subsidiaries of the Registrant |
21† | Subsidiaries of the Registrant |
| (23) Consents of Experts and Counsel |
23† | Consent of Independent Registered Public Accounting Firm – Grant Thornton LLP |
| (31) Rule 13a-14(a)/15d-14(a) Certifications |
31.1† | Certification of Erwin Haitzmann, Co-Chief Executive Officer, pursuant to Rule 13a-14(a) under the Securities Exchange Act of 1934. |
31.2† | Certification of Peter Hoetzinger, President and Co-Chief Executive Officer, pursuant to Rule 13a-14(a) under the Securities Exchange Act of 1934. |
31.3† | Certification of Margaret Stapleton, Chief Financial Officer, pursuant to Rule 13a-14(a) under the Securities Exchange Act of 1934. |
| (97) Policy relating to recovery of erroneously awarded compensation |
97.1† | Century Casinos, Inc. Compensation Recovery Policy, adopted September 20, 2023. |
| (99) Additional Exhibits |
99.1† | Governmental Regulation and Licensing. |
|
|
101.INS | XBRL Instance Document |
101.SCH | XBRL Taxonomy Extension Schema Document |
101.CAL | XBRL Taxonomy Extension Calculation Linkbase Document |
101.DEF | XBRL Taxonomy Extension Definition Linkbase Document |
101.LAB | XBRL Taxonomy Extension Label Linkbase Document |
101.PRE | XBRL Taxonomy Extension Presentation Linkbase Document |
104 | Cover Page Interactive Data File, formatted in Inline XBRL and contained in Exhibit 101 |
* A management contract or compensatory plan or arrangement required to be filed as an exhibit pursuant to Item 15(a)(3) of Form 10-K.
† Filed herewith.
†† Furnished herewith.
PFiled on Paper
Item 16. Form 10-K Summary.
None.
SIGNATURES
Pursuant to the requirements of Section 13 or 15(d) of the Securities Exchange Act of 1934, the registrant has duly caused this report to be signed on its behalf by the undersigned, thereunto duly authorized.
|
|
CENTURY CASINOS, INC. |
| |
By:/s/ Erwin Haitzmann | By:/s/ Peter Hoetzinger |
Erwin Haitzmann, Chairman of the Board and
Co-Chief Executive Officer
(Co Principal Executive Officer) | Peter Hoetzinger, Vice Chairman of the Board,
Co-Chief Executive Officer and President
(Co Principal Executive Officer) |
| |
| Date: March 9, 202313, 2024 |
Pursuant to the requirements of the Securities Exchange Act of 1934, this report has been signed below by the following persons on behalf of the registrant and in the capacities indicated on March 9, 2023.13, 2024.
|
|
|
|
Signature | Title | Signature | Title |
|
|
|
|
/s/ Erwin Haitzmann Erwin Haitzmann | Chairman of the Board and Co-Chief Executive Officer | /s/ Gottfried Schellmann Gottfried Schellmann | Director |
/s/ Peter Hoetzinger Peter Hoetzinger | Vice Chairman of the Board, Co-Chief Executive Officer
and President | /s/ Dinah Corbaci Dinah Corbaci | Director |
/s/ Margaret Stapleton Margaret Stapleton
| Chief Financial Officer | /s/ Eduard Berger Eduard Berger | Director |
/s/ Timothy Wright Timothy Wright | Chief Accounting Officer |
|
|
Item 8. Financial Statements and Supplementary Data.
Index to Financial Statements
|
Financial Statement Schedules: |
All schedules are omitted because they are not applicable or are insignificant, or the required information is shown in the consolidated financial statements or notes thereto. |
REPORT OF INDEPENDENT REGISTERED PUBLIC ACCOUNTING FIRM
Board of Directors and Shareholders
Century Casinos, Inc.
Opinion on the financial statements
We have audited the accompanying consolidated balance sheets of Century Casinos, Inc. (a Delaware corporation) and subsidiaries (the “Company”) as of December 31, 20222023 and 2021,2022, the related consolidated statements of (loss) earnings, (loss), comprehensive (loss) income, (loss), equity, and cash flows for each of the three years in the period ended December 31, 2022,2023, and the related notes (collectively referred to as the “financial statements”). In our opinion, the financial statements present fairly, in all material respects, the financial position of the Company as of December 31, 20222023 and 2021,2022, and the results of its operations and its cash flows for each of the three years in the period ended December 31, 2022,2023, in conformity with accounting principles generally accepted in the United States of America.
We also have audited, in accordance with the standards of the Public Company Accounting Oversight Board (United States) (“PCAOB”), the Company’s internal control over financial reporting as of December 31, 2022,2023, based on criteria established in the 2013 Internal Control—Integrated Framework issued by the Committee of Sponsoring Organizations of the Treadway Commission (“COSO”), and our report dated March 9, 202313, 2024 expressed an unqualified opinion.
Basis for opinion
These financial statements are the responsibility of the Company’s management. Our responsibility is to express an opinion on the Company’s financial statements based on our audits. We are a public accounting firm registered with the PCAOB and are required to be independent with respect to the Company in accordance with the U.S. federal securities laws and the applicable rules and regulations of the Securities and Exchange Commission and the PCAOB.
We conducted our audits in accordance with the standards of the PCAOB. Those standards require that we plan and perform the audit to obtain reasonable assurance about whether the financial statements are free of material misstatement, whether due to error or fraud. Our audits included performing procedures to assess the risks of material misstatement of the financial statements, whether due to error or fraud, and performing procedures that respond to those risks. Such procedures included examining, on a test basis, evidence regarding the amounts and disclosures in the financial statements. Our audits also included evaluating the accounting principles used and significant estimates made by management, as well as evaluating the overall presentation of the financial statements. We believe that our audits provide a reasonable basis for our opinion.
Critical audit matter
The critical audit mattercommunicated below is a matterarising from the current period audit of the financial statements that wascommunicated or required to be communicated to the audit committee and that: (1) relatesto accounts or disclosures that are material to the financial statements and (2) involved our especially challenging, subjective, or complex judgments. The communication of critical audit matters does not alter in any way our opinion on the financial statements, taken as a whole, and we are not, by communicating the critical audit matterbelow, providing aseparate opinionon the critical audit matteror on the accounts or disclosures to which it relates.
Indefinite-Lived Intangible Assets Impairment AnalysisBusiness Acquisitions – CenturyNugget Casino St. Albert
Resort (“Nugget”) and Rocky Gap Casino, Resort & Golf (“Rocky Gap”) – Valuation of acquired intangible assets
As of December 31, 2022,discussed in Note 3, the Company had $9.0acquired Nugget, on April 3, 2023 for a total purchase price of approximately $98.8 million, net of indefinite-livedcash acquired and Rocky Gap on July 25, 2023 for a total purchase price of approximately $52.6 million, net of cash acquired. The Company allocated the purchase price for each acquisition, on a preliminary basis, to the assets acquired and liabilities assumed based on their respective fair values, including identified intangible assets related to Century Casino St. Albert reporting unit.of $29.9 million and $23.3 million, respectively. We identified the valuation of acquired intangible assets as a critical audit matter.
The principal considerations for our determination that performing procedures relating to the impairment analysisvaluation of this indefinite-livedacquired intangible assetassets is a critical audit matter are (i) the significant judgment exercised by management when developing the assumptions used in the fair value measurement of the asset,acquired intangible assets, (ii) the high degree of auditor judgment and subjectivity in performing procedures and evaluating management’s significant assumptions relating to forecasted information including revenue EBITDA and discount rateEBITDAR, weighted average cost of capital (WACC), royalty rates, and revenue attrition rates and (iii) the audit effort involved the use of professionals with specialized skill and knowledge.
Our audit procedures related to the valuation of the acquired intangible analysis included the following, among others:
Our audit procedures related to the impairment analysis included the following, among others:
–we tested the design and operating effectiveness of the Company’s internal controls over indefinite-lived assets impairment analysis process, including evaluation of the valuation models and significant assumptions used
–•we assessed the reasonableness of the significant assumptions, including evaluating the accuracy, completeness and relevance of management’s data used in developing the assumptions
–•with the assistance of our valuation specialists, we tested the inputs and evaluated the assumptions used in developing the discountWACC, royalty rates and revenue attrition rates
/s/ GRANT THORNTON LLP
We have served as the Company's auditor since 2020.
San Francisco, California
March 9, 202313, 2024
CENTURY CASINOS, INC. AND SUBSIDIARIES
CONSOLIDATED BALANCE SHEETS
|
|
|
|
|
|
|
|
|
|
| December 31, |
|
| December 31, |
| December 31, |
|
| December 31, |
Amounts in thousands, except for share and per share information |
| 2022 |
|
| 2021 |
| 2023 |
|
| 2022 |
ASSETS |
|
|
|
|
|
|
|
|
|
|
|
|
Current Assets: |
|
|
|
|
|
|
|
|
Cash and cash equivalents |
| $ | 101,785 |
| $ | 107,821 |
| $ | 171,327 |
| $ | 101,785 |
Receivables, net |
| 9,085 |
|
| 9,414 |
| 18,253 |
|
| 9,085 |
Prepaid expenses |
| 13,780 |
|
| 12,417 |
| 11,859 |
|
| 13,780 |
Inventories |
| 1,530 |
|
| 1,443 |
| 4,652 |
|
| 1,530 |
Restricted cash |
| 100,151 |
|
| — |
| — |
|
| 100,151 |
Other current assets |
| 1,688 |
|
| 1,163 |
| 926 |
|
| 1,688 |
Assets held for sale |
|
| — |
|
| 8,422 | |
Total Current Assets |
|
| 228,019 |
|
| 140,680 |
|
| 207,017 |
|
| 228,019 |
|
|
|
|
|
|
|
|
|
|
|
Property and equipment, net |
| 464,650 |
|
| 472,302 |
| 913,561 |
|
| 464,650 |
Leased right-of-use assets, net |
| 27,190 |
|
| 28,383 |
| 25,973 |
|
| 27,190 |
Goodwill |
| 9,583 |
|
| 10,347 |
| 80,583 |
|
| 9,583 |
Intangible assets, net |
| 44,771 |
|
| 48,930 |
| 93,207 |
|
| 44,771 |
Deferred income taxes |
| 15,579 |
|
| 555 |
| 37,646 |
|
| 15,579 |
Equity investment |
| 93,260 |
|
| — |
| — |
|
| 93,260 |
Note receivable, net of current portion and unamortized discount |
| 336 |
|
| 358 |
| 316 |
|
| 336 |
Deposits and other |
|
| 1,579 |
|
| 1,803 |
|
| 1,359 |
|
| 1,579 |
Total Assets |
| $ | 884,967 |
| $ | 703,358 |
| $ | 1,359,662 |
| $ | 884,967 |
|
|
|
|
|
|
|
|
|
|
|
|
|
LIABILITIES AND EQUITY |
|
|
|
|
|
|
|
|
Current Liabilities: |
|
|
|
|
|
|
|
|
Current portion of long-term debt |
| $ | 5,322 |
| $ | 3,958 |
| $ | 8,468 |
| $ | 5,322 |
Current portion of operating lease liabilities |
| 3,947 |
|
| 3,915 |
| 3,395 |
|
| 3,947 |
Current portion of finance lease liabilities |
| 150 |
|
| 38 |
| 199 |
|
| 150 |
Accounts payable |
| 15,341 |
|
| 12,651 |
| 15,279 |
|
| 15,341 |
Accrued liabilities |
| 19,012 |
|
| 13,592 |
| 29,056 |
|
| 19,012 |
Accrued payroll |
| 11,840 |
|
| 11,190 |
| 16,221 |
|
| 11,840 |
Taxes payable |
| 9,801 |
|
| 15,089 |
| 21,001 |
|
| 9,801 |
Total Current Liabilities |
|
| 65,413 |
|
| 60,433 |
|
| 93,619 |
|
| 65,413 |
|
|
|
|
|
|
|
|
|
|
|
Long-term debt, net of current portion and deferred financing costs (Note 6) |
| 344,258 |
|
| 177,526 |
| 324,212 |
|
| 344,258 |
Long-term financing obligation to VICI Properties, Inc. subsidiaries (Note 7) |
| 284,904 |
|
| 281,901 |
| 658,007 |
|
| 284,904 |
Operating lease liabilities, net of current portion |
| 26,016 |
|
| 27,229 |
| 25,834 |
|
| 26,016 |
Finance lease liabilities, net of current portion |
| 399 |
|
| 43 |
| 427 |
|
| 399 |
Taxes payable and other |
| 6,965 |
|
| 2,954 |
| 41,758 |
|
| 6,965 |
Deferred income taxes |
|
| 2,813 |
|
| 2,915 |
|
| 1,364 |
|
| 2,813 |
Total Liabilities |
|
| 730,768 |
|
| 553,001 |
|
| 1,145,221 |
|
| 730,768 |
Commitments and Contingencies (Note 16) |
| |
|
| |
| |
|
| |
|
|
|
|
|
|
|
|
|
|
|
Equity: |
|
|
|
|
|
|
|
|
|
|
|
|
Preferred stock; $0.01 par value; 20,000,000 shares authorized; no shares issued or outstanding |
| — |
|
| — |
| — |
|
| — |
Common stock; $0.01 par value; 50,000,000 shares authorized; 29,870,547 and 29,624,814 shares issued and outstanding |
| 299 |
|
| 296 | |
Common stock; $0.01 par value; 50,000,000 shares authorized; 30,359,931 and 29,870,547 shares issued and outstanding | |
| 304 |
|
| 299 |
Additional paid-in capital |
| 121,653 |
|
| 118,469 |
| 124,094 |
|
| 121,653 |
Retained earnings |
| 37,265 |
|
| 29,289 |
| 9,067 |
|
| 37,265 |
Accumulated other comprehensive loss |
|
| (15,189) |
|
| (6,430) |
|
| (12,073) |
|
| (15,189) |
Total Century Casinos, Inc. Shareholders' Equity |
|
| 144,028 |
|
| 141,624 |
|
| 121,392 |
|
| 144,028 |
Non-controlling interests |
|
| 10,171 |
|
| 8,733 |
|
| 93,049 |
|
| 10,171 |
Total Equity |
|
| 154,199 |
|
| 150,357 |
|
| 214,441 |
|
| 154,199 |
Total Liabilities and Equity |
| $ | 884,967 |
| $ | 703,358 |
| $ | 1,359,662 |
| $ | 884,967 |
|
|
|
|
|
|
|
|
|
|
|
|
|
See notes to consolidated financial statements.
CENTURY CASINOS, INC. AND SUBSIDIARIES
CONSOLIDATED STATEMENTS OF (LOSS) EARNINGS (LOSS)
|
|
|
|
|
|
|
|
|
|
|
|
|
|
|
|
|
|
|
|
|
|
|
|
|
|
|
|
|
|
|
| For the year |
| For the year |
|
| ended December 31, |
| ended December 31, |
Amounts in thousands, except for per share information |
| 2022 |
| 2021 |
| 2020 |
| 2023 |
| 2022 |
| 2021 |
Operating revenue: |
|
|
|
|
|
|
|
|
|
|
|
|
|
|
Gaming |
| $ | 365,986 |
| $ | 331,877 |
| $ | 253,281 |
| $ | 412,388 |
| $ | 365,986 |
| $ | 331,877 |
Pari-mutuel, sports betting and iGaming |
|
| 19,607 |
| 18,848 |
| 17,660 |
|
| 20,165 |
| 19,607 |
| 18,848 |
Hotel |
|
| 9,628 |
| 8,286 |
| 5,910 |
|
| 42,269 |
| 9,628 |
| 8,286 |
Food and beverage |
|
| 24,097 |
| 17,788 |
| 16,194 |
|
| 50,262 |
| 24,097 |
| 17,788 |
Other |
|
| 11,211 |
|
| 11,707 |
|
| 11,223 |
|
| 25,122 |
|
| 11,211 |
|
| 11,707 |
Net operating revenue |
|
| 430,529 |
|
| 388,506 |
|
| 304,268 |
|
| 550,206 |
|
| 430,529 |
|
| 388,506 |
Operating costs and expenses: |
|
|
|
|
|
|
|
|
|
|
|
|
|
|
|
|
|
|
Gaming |
|
| 183,841 |
| 161,119 |
| 131,563 |
|
| 216,475 |
| 183,841 |
| 161,119 |
Pari-mutuel, sports betting and iGaming |
|
| 22,149 |
| 19,735 |
| 19,301 |
|
| 21,752 |
| 22,149 |
| 19,735 |
Hotel |
|
| 2,815 |
| 2,360 |
| 2,125 |
|
| 14,379 |
| 2,815 |
| 2,360 |
Food and beverage |
|
| 22,631 |
| 16,523 |
| 15,962 |
|
| 45,065 |
| 22,631 |
| 16,523 |
Other | |
|
| 9,722 |
| 1,205 |
| 1,300 |
General and administrative |
|
| 105,467 |
| 93,489 |
| 80,246 |
|
| 140,505 |
| 104,262 |
| 92,189 |
Depreciation and amortization |
|
| 27,109 |
| 26,762 |
| 26,534 |
|
| 41,043 |
| 27,109 |
| 26,762 |
Impairment - intangible and tangible assets |
|
| — |
| — |
| 35,121 | |
(Gain) on sale of casino operations (Note 1) |
|
| — |
| — |
| (6,457) |
|
| (1,660) |
| — |
| — |
Loss on sale of assets (Note 1) |
|
| 2,154 |
|
| — |
|
| — |
|
| — |
|
| 2,154 |
|
| — |
Total operating costs and expenses |
|
| 366,166 |
|
| 319,988 |
|
| 304,395 |
|
| 487,281 |
|
| 366,166 |
|
| 319,988 |
Earnings from equity investment |
|
| 3,249 |
|
| — |
|
| — |
|
| 1,121 |
|
| 3,249 |
|
| — |
Earnings (loss) from operations |
|
| 67,612 |
|
| 68,518 |
|
| (127) | |
Earnings from operations | |
|
| 64,046 |
|
| 67,612 |
|
| 68,518 |
Non-operating (expense) income: |
|
|
|
|
|
|
|
|
|
|
|
|
|
|
|
|
|
|
Interest income |
|
| 851 |
| 174 |
| 6 |
|
| 2,114 |
| 851 |
| 174 |
Interest expense |
|
| (65,831) |
| (42,832) |
| (43,104) |
|
| (93,925) |
| (65,831) |
| (42,832) |
Gain (loss) on foreign currency transactions, cost recovery income and other |
|
| 3,378 |
|
| 2,289 |
|
| (63) | |
Gain on foreign currency transactions, cost recovery income and other (Note 1) | |
|
| 3,933 |
|
| 3,378 |
|
| 2,289 |
Non-operating (expense) income, net |
|
| (61,602) |
|
| (40,369) |
|
| (43,161) |
|
| (87,878) |
|
| (61,602) |
|
| (40,369) |
Earnings (loss) before income taxes |
|
| 6,010 |
|
| 28,149 |
|
| (43,288) | |
(Loss) earnings before income taxes | |
|
| (23,832) |
|
| 6,010 |
|
| 28,149 |
Income tax benefit (expense) |
|
| 7,660 |
|
| (6,371) |
|
| (4,848) |
|
| 5,343 |
|
| 7,660 |
|
| (6,371) |
Net earnings (loss) |
|
| 13,670 |
|
| 21,778 |
|
| (48,136) | |
Net (earnings) loss attributable to non-controlling interests |
|
| (5,694) |
|
| (1,156) |
|
| 134 | |
Net earnings (loss) attributable to Century Casinos, Inc. shareholders |
| $ | 7,976 |
| $ | 20,622 |
| $ | (48,002) | |
Net (loss) earnings | |
|
| (18,489) |
|
| 13,670 |
|
| 21,778 |
Net earnings attributable to non-controlling interests | |
|
| (9,709) |
|
| (5,694) |
|
| (1,156) |
Net (loss) earnings attributable to Century Casinos, Inc. shareholders | |
| $ | (28,198) |
| $ | 7,976 |
| $ | 20,622 |
|
|
|
|
|
|
|
|
|
|
|
|
|
|
|
|
|
|
|
Earnings (loss) per share attributable to Century Casinos, Inc. shareholders: |
|
|
|
|
|
|
| |
(Loss) earnings per share attributable to Century Casinos, Inc. shareholders: | |
|
|
|
|
|
|
|
Basic |
| $ | 0.27 |
| $ | 0.70 |
| $ | (1.62) |
| $ | (0.93) |
| $ | 0.27 |
| $ | 0.70 |
Diluted |
| $ | 0.25 |
| $ | 0.66 |
| $ | (1.62) |
| $ | (0.93) |
| $ | 0.25 |
| $ | 0.66 |
Weighted average shares outstanding - basic |
|
| 29,809 |
| 29,593 |
| 29,559 |
|
| 30,274 |
| 29,809 |
| 29,593 |
Weighted average shares outstanding - diluted |
|
| 31,480 |
| 31,388 |
| 29,559 |
|
| 30,274 |
| 31,480 |
| 31,388 |
|
|
|
|
|
|
|
|
|
|
|
|
|
|
|
See notes to consolidated financial statements.
CENTURY CASINOS, INC. AND SUBSIDIARIES
CONSOLIDATED STATEMENTS OF COMPREHENSIVE INCOME (LOSS) INCOME
|
|
|
|
|
|
|
|
|
|
|
|
|
|
|
|
|
|
|
|
|
| For the year |
|
| ended December 31, |
Amounts in thousands |
| 2022 |
| 2021 |
| 2020 |
Net earnings (loss) |
| $ | 13,670 |
| $ | 21,778 |
| $ | (48,136) |
|
|
|
|
|
|
|
|
|
|
Other comprehensive income (loss) |
|
|
|
|
|
|
|
|
|
Foreign currency translation adjustments |
|
| (9,739) |
|
| (495) |
|
| 3,415 |
Other comprehensive loss |
|
| (9,739) |
|
| (495) |
|
| 3,415 |
Comprehensive income (loss) |
| $ | 3,931 |
| $ | 21,283 |
| $ | (44,721) |
|
|
|
|
|
|
|
|
|
|
Comprehensive income (loss) attributable to non-controlling interests |
|
|
|
|
|
|
|
|
|
Net (earnings) loss attributable to non-controlling interests |
|
| (5,694) |
|
| (1,156) |
|
| 134 |
Foreign currency translation adjustments |
|
| 980 |
|
| 444 |
|
| (352) |
Comprehensive income (loss) attributable to Century Casinos, Inc. shareholders |
| $ | (783) |
| $ | 20,571 |
| $ | (44,939) |
|
|
|
|
|
|
|
|
|
|
|
|
|
|
|
|
|
|
|
|
|
|
|
|
|
|
|
|
|
|
|
| For the year |
|
| ended December 31, |
Amounts in thousands |
| 2023 |
| 2022 |
| 2021 |
Net (loss) earnings |
| $ | (18,489) |
| $ | 13,670 |
| $ | 21,778 |
|
|
|
|
|
|
|
|
|
|
Other comprehensive (loss) income |
|
|
|
|
|
|
|
|
|
Foreign currency translation adjustments |
|
| 3,764 |
|
| (9,739) |
|
| (495) |
Other comprehensive (loss) income |
|
| 3,764 |
|
| (9,739) |
|
| (495) |
Comprehensive (loss) income |
| $ | (14,725) |
| $ | 3,931 |
| $ | 21,283 |
|
|
|
|
|
|
|
|
|
|
Comprehensive (loss) income attributable to non-controlling interests |
|
|
|
|
|
|
|
|
|
Net earnings attributable to non-controlling interests |
|
| (9,709) |
|
| (5,694) |
|
| (1,156) |
Foreign currency translation adjustments |
|
| (648) |
|
| 980 |
|
| 444 |
Comprehensive (loss) income attributable to Century Casinos, Inc. shareholders |
| $ | (25,082) |
| $ | (783) |
| $ | 20,571 |
|
|
|
|
|
|
|
|
|
|
See notes to consolidated financial statements.
CENTURY CASINOS, INC. AND SUBSIDIARIES
CONSOLIDATED STATEMENTS OF EQUITY
|
|
|
|
|
|
|
|
|
|
|
|
|
|
| For the year |
| For the year |
|
| ended December 31, |
| ended December 31, |
Amounts in thousands, except for share information |
| 2022 |
| 2021 |
| 2020 |
| 2023 |
| 2022 |
| 2021 |
Common Stock |
|
|
|
|
|
|
|
|
|
|
|
|
Balance, beginning of period |
| $ | 296 |
| $ | 296 |
| $ | 295 |
| $ | 299 |
| $ | 296 |
| $ | 296 |
Exercise of options |
| 1 |
| — |
| — |
| — |
| 1 |
| — |
Performance stock unit issuance |
|
| 2 |
|
| — |
|
| 1 |
|
| 5 |
|
| 2 |
|
| — |
Balance, end of period |
|
| 299 |
|
| 296 |
|
| 296 |
|
| 304 |
|
| 299 |
|
| 296 |
|
|
|
|
|
|
|
|
|
|
|
|
|
|
|
|
|
|
|
Additional Paid-in Capital |
|
|
|
|
|
|
|
|
|
|
|
|
Balance, beginning of period |
| $ | 118,469 |
| $ | 115,570 |
| $ | 115,784 |
| $ | 121,653 |
| $ | 118,469 |
| $ | 115,570 |
Amortization of stock-based compensation |
| 3,335 |
| 2,652 |
| (214) |
| 3,610 |
| 3,335 |
| 2,652 |
Exercise of options |
| 285 |
| 247 |
| — |
| 125 |
| 285 |
| 247 |
Performance stock unit issuance |
|
| (436) |
|
| — |
|
| — |
|
| (1,294) |
|
| (436) |
|
| — |
Balance, end of period |
|
| 121,653 |
|
| 118,469 |
|
| 115,570 |
|
| 124,094 |
|
| 121,653 |
|
| 118,469 |
|
|
|
|
|
|
|
|
|
|
|
|
|
|
|
|
|
|
|
Accumulated Other Comprehensive Loss |
|
|
|
|
|
|
|
|
|
|
|
|
Balance, beginning of period |
| $ | (6,430) |
| $ | (6,379) |
| $ | (9,442) |
| $ | (15,189) |
| $ | (6,430) |
| $ | (6,379) |
Foreign currency translation adjustment |
|
| (8,759) |
|
| (51) |
|
| 3,063 |
|
| 3,116 |
|
| (8,759) |
|
| (51) |
Balance, end of period |
|
| (15,189) |
|
| (6,430) |
|
| (6,379) |
|
| (12,073) |
|
| (15,189) |
|
| (6,430) |
|
|
|
|
|
|
|
|
|
|
|
|
|
|
|
|
|
|
|
Retained Earnings |
|
|
|
|
|
|
|
|
|
|
|
|
Balance, beginning of period |
| $ | 29,289 |
| $ | 8,667 |
| $ | 56,669 |
| $ | 37,265 |
| $ | 29,289 |
| $ | 8,667 |
Net earnings (loss) |
| 7,976 |
| 20,622 |
| (48,002) | |
Net (loss) earnings | |
| (28,198) |
| 7,976 |
| 20,622 |
Balance, end of period |
|
| 37,265 |
|
| 29,289 |
|
| 8,667 |
|
| 9,067 |
|
| 37,265 |
|
| 29,289 |
|
|
|
|
|
|
|
|
|
|
|
|
|
|
|
|
|
|
|
Total Century Casinos, Inc. Shareholders' Equity |
| $ | 144,028 |
| $ | 141,624 |
| $ | 118,154 |
| $ | 121,392 |
| $ | 144,028 |
| $ | 141,624 |
|
|
|
|
|
|
|
|
|
|
|
|
|
|
|
|
|
|
|
Noncontrolling Interests |
|
|
|
|
|
|
|
|
|
|
|
|
Balance, beginning of period |
| $ | 8,733 |
| $ | 8,829 |
| $ | 8,769 |
| $ | 10,171 |
| $ | 8,733 |
| $ | 8,829 |
Net earnings (loss) |
| 5,694 |
| 1,156 |
| (134) | |
Net earnings | |
| 9,709 |
| 5,694 |
| 1,156 |
Foreign currency translation adjustment |
| (980) |
| (444) |
| 352 |
| 648 |
| (980) |
| (444) |
Distribution to non-controlling interest |
| (3,276) |
| (808) |
| (158) | |
Distributions to non-controlling interests | |
| (19,604) |
| (3,276) |
| (808) |
Consolidation of Smooth Bourbon, LLC | |
| 92,125 |
| — |
| — |
Balance, end of period |
|
| 10,171 |
|
| 8,733 |
|
| 8,829 |
|
| 93,049 |
|
| 10,171 |
|
| 8,733 |
|
|
|
|
|
|
|
|
|
|
|
|
|
|
|
|
|
|
|
Total Equity |
| $ | 154,199 |
| $ | 150,357 |
| $ | 126,983 |
| $ | 214,441 |
| $ | 154,199 |
| $ | 150,357 |
|
|
|
|
|
|
|
|
|
|
|
|
|
|
|
|
|
|
|
Common shares issued |
| 245,733 |
| 48,852 |
| 75,635 |
| 489,384 |
| 245,733 |
| 48,852 |
See notes to consolidated financial statements.
CENTURY CASINOS, INC. AND SUBSIDIARIES
CONSOLIDATED STATEMENTS OF CASH FLOWS
|
|
|
|
|
|
|
|
|
|
|
|
|
| For the year | For the year |
| ended December 31, | ended December 31, |
Amounts in thousands |
| 2022 |
| 2021 |
| 2020 |
| 2023 |
| 2022 |
| 2021 |
Cash Flows provided by Operating Activities: |
|
|
|
|
|
|
|
|
Net earnings (loss) |
| $ | 13,670 |
| $ | 21,778 |
| $ | (48,136) | |
Adjustments to reconcile net earnings (loss) to net cash provided by operating activities: |
|
|
|
|
|
| |
Net (loss) earnings | |
| $ | (18,489) |
| $ | 13,670 |
| $ | 21,778 |
Adjustments to reconcile net (loss) earnings to net cash provided by operating activities: | |
|
|
|
|
|
|
Depreciation and amortization |
| 27,109 |
| 26,762 |
| 26,534 |
| 41,043 |
| 27,109 |
| 26,762 |
Lease amortization |
| 4,003 |
| 4,037 |
| 3,661 |
| 4,224 |
| 4,003 |
| 4,037 |
Loss on disposition of fixed assets |
| 18 |
| 389 |
| 24 |
| 691 |
| 18 |
| 389 |
Adjustment of contingent liability (Note 16) |
| — |
| (436) |
| 51 |
| — |
| — |
| (436) |
Income on equity investment |
| (3,249) |
| — |
| — | |
Income from equity investment | |
| (1,121) |
| (3,249) |
| — |
Amortization of stock-based compensation expense |
| 3,335 |
| 2,652 |
| (214) |
| 3,610 |
| 3,335 |
| 2,652 |
Amortization and write-off of deferred financing costs and discount on note receivable |
| 9,716 |
| 1,565 |
| 1,614 |
| 2,695 |
| 9,716 |
| 1,565 |
Impairment (Note 4, Note 5) |
| — |
| — |
| 35,121 | |
Gain on deconsolidated subsidiary, excluding cash (Note 1) |
| — |
| — |
| (7,848) | |
Loss on debt extinguishment (Note 1) | |
| 7,299 |
| — |
| — |
Loss on sale of assets (Note 1) |
| 2,154 |
| — |
| — |
| — |
| 2,154 |
| — |
Gain on sale of operations (Note 1) |
| — |
| — |
| (6,457) |
| (1,660) |
| — |
| — |
Deferred taxes |
| (15,126) |
| 345 |
| 3,448 |
| (23,516) |
| (15,126) |
| 345 |
Other |
| — |
| — |
| 1 | |
Changes in Operating Assets and Liabilities: |
|
|
|
|
|
|
|
|
|
|
|
|
Receivables, net |
| 139 |
| (1,218) |
| 2,502 |
| (5,968) |
| 139 |
| (1,218) |
Prepaid expenses and other assets |
| (1,335) |
| (473) |
| (1,250) |
| 8,047 |
| (1,335) |
| (473) |
Accounts payable |
| (1,941) |
| (4,939) |
| 4,640 |
| (6,112) |
| (1,941) |
| (4,939) |
Other current and long-term liabilities |
| 4,043 |
| 2,995 |
| (4,201) |
| 4,326 |
| 4,043 |
| 2,995 |
Inventories |
| (142) |
| 192 |
| 349 |
| 323 |
| (142) |
| 192 |
Accrued payroll |
| 985 |
| 2,944 |
| (4,970) |
| 391 |
| 985 |
| 2,944 |
Taxes payable |
| (5,982) |
| 2,597 |
| 4,136 |
| 8,272 |
| (5,982) |
| 2,597 |
Net cash provided by operating activities |
|
| 37,397 |
|
| 59,190 |
|
| 9,005 |
|
| 24,055 |
|
| 37,397 |
|
| 59,190 |
|
|
|
|
|
|
|
|
|
|
|
|
|
|
|
|
|
|
|
Cash Flows used in Investing Activities: |
|
|
|
|
|
|
|
|
|
|
|
|
Purchases of property and equipment |
| (19,193) |
| (10,012) |
| (10,705) |
| (59,621) |
| (19,193) |
| (10,012) |
Acquisition of Mountaineer Casino, Racetrack & Resort, Century Casino Cape Girardeau and Century Casino Caruthersville |
| — |
| — |
| (1,157) | |
Smooth Bourbon dividends (Note 3) |
| 4,989 |
| — |
| — |
| 2,256 |
| 4,989 |
| — |
Smooth Bourbon acquisition (Note 3) |
| (95,000) |
| — |
| — | |
Smooth Bourbon consolidation (Note 3) | |
| 528 |
| (95,000) |
| — |
Nugget acquisition, net of cash acquired (Note 3) | |
| (98,792) |
| — |
|
|
Rocky Gap acquisition, net of cash acquired (Note 3) | |
| (52,581) |
| — |
|
|
Purchase of intangible assets - casino license |
| (390) |
| — |
| — |
| (536) |
| (390) |
| — |
Proceeds from disposition of assets |
| 124 |
| 44 |
| — |
| 89 |
| 124 |
| 44 |
Century Casino Calgary sale working capital adjustment, net of earn out (Note 1) |
| — |
| (24) |
| 6,575 | |
Century Casino Calgary sale earn out | |
| 1,660 |
| — |
| (24) |
Calgary asset sale (Note 1) |
|
| 6,330 |
|
| — |
|
| — |
|
| — |
|
| 6,330 |
|
| — |
Net cash used in investing activities |
|
| (103,140) |
|
| (9,992) |
|
| (5,287) |
|
| (206,997) |
|
| (103,140) |
|
| (9,992) |
CENTURY CASINOS, INC. AND SUBSIDIARIES
CONSOLIDATED STATEMENTS OF CASH FLOWS (continued)
|
|
|
|
|
|
|
|
|
|
|
|
|
| For the year | For the year |
| ended December 31, | ended December 31, |
Amounts in thousands |
| 2022 |
| 2021 |
| 2020 |
| 2023 |
| 2022 |
| 2021 |
Cash Flows provided by (used in) Financing Activities: |
|
|
|
|
|
|
|
|
|
|
|
|
Proceeds from borrowings |
| 355,000 |
| — |
| 17,351 |
| 65,100 |
| 355,000 |
| — |
Principal payments |
| (171,550) |
| (4,152) |
| (13,188) |
| (57,123) |
| (171,550) |
| (4,152) |
Payment of deferred financing costs |
| (18,864) |
| — |
| (876) |
| — |
| (18,864) |
| — |
Proceeds from sale leaseback (Note 1) | |
| 162,648 |
| — |
| — |
Distribution to non-controlling interest |
| (3,276) |
| (808) |
| (158) |
| (19,604) |
| (3,276) |
| (808) |
Repurchase of shares to satisfy tax withholding |
| (434) |
| — |
| — |
| (1,290) |
| (434) |
| — |
Proceeds from exercise of stock options |
|
| 286 |
|
| 247 |
|
| — |
|
| 126 |
|
| 286 |
|
| 247 |
Net cash provided by (used in) financing activities |
|
| 161,162 |
|
| (4,713) |
|
| 3,129 |
|
| 149,857 |
|
| 161,162 |
|
| (4,713) |
|
|
|
|
|
|
|
|
|
|
|
|
|
|
|
|
|
|
|
Effect of Exchange Rate Changes on Cash, Cash Equivalents and Restricted Cash |
| $ | (1,329) |
| $ | (121) |
| $ | 1,190 |
| $ | 2,544 |
| $ | (1,329) |
| $ | (121) |
|
|
|
|
|
|
|
|
|
|
|
|
|
|
|
|
|
|
|
Increase in Cash, Cash Equivalents and Restricted Cash |
| $ | 94,090 |
| $ | 44,364 |
| $ | 8,037 | |
(Decrease) Increase in Cash, Cash Equivalents and Restricted Cash | |
| $ | (30,541) |
| $ | 94,090 |
| $ | 44,364 |
|
|
|
|
|
|
|
|
|
|
|
|
|
|
|
|
|
|
|
Cash, Cash Equivalents and Restricted Cash at Beginning of Period |
| $ | 108,041 |
| $ | 63,677 |
| $ | 55,640 |
| $ | 202,131 |
| $ | 108,041 |
| $ | 63,677 |
Cash, Cash Equivalents and Restricted Cash at End of Period |
| $ | 202,131 |
| $ | 108,041 |
| $ | 63,677 |
| $ | 171,590 |
| $ | 202,131 |
| $ | 108,041 |
|
|
|
|
|
|
|
|
|
|
|
|
|
|
|
|
|
|
|
Supplemental Disclosure of Cash Flow Information: |
|
|
|
|
|
|
|
|
|
|
|
|
Interest paid |
| $ | 53,276 |
| $ | 39,025 |
| $ | 38,832 |
| $ | 81,937 |
| $ | 53,276 |
| $ | 39,025 |
Income taxes paid |
| $ | 8,968 |
| $ | 6,025 |
| $ | 2,607 |
| $ | 5,754 |
| $ | 8,968 |
| $ | 6,025 |
Income tax refunds |
| $ | 890 |
| $ | 1,049 |
| $ | 1,242 |
| $ | — |
| $ | 890 |
| $ | 1,049 |
|
|
|
|
|
|
|
|
|
| |
Non-Cash Investing Activities: |
|
|
|
|
|
|
|
|
|
|
|
|
Purchase of property and equipment on account |
| $ | 6,717 |
| $ | 1,882 |
| $ | 867 |
| $ | 7,809 |
| $ | 6,717 |
| $ | 1,882 |
See notes to consolidated financial statements.
CENTURY CASINOS, INC. AND SUBSIDIARIES
NOTES TO CONSOLIDATED FINANCIAL STATEMENTS
1. DESCRIPTION OF BUSINESS AND BASIS OF PRESENTATION
Century Casinos, Inc. (the “Company”) is a casino entertainment company with operations primarily in North America. The Company’s operations as of December 31, 20222023 are detailed below.
The Company owns, operates and manages the following casinos through wholly-owned subsidiaries in North America:
The Century Casino & Hotel in Central City, Colorado (“CTL”Central City” or “CTL”)
The Century Casino & Hotel in Cripple Creek, Colorado (“CRC”Cripple Creek” or “CRC”)
Mountaineer Casino, RacetrackResort & ResortRaces in New Cumberland, West Virginia (“Mountaineer” or “MTR”) (1)
The Century Casino Cape Girardeau, Missouri (“Cape Girardeau” or “CCG”) (1)
The Century Casino Caruthersville, Missouri (“Caruthersville” or “CCV”) (1)
Nugget Casino Resort in Reno-Sparks, Nevada (“Nugget” or “NUG”) (2)
Rocky Gap Casino, Resort & Golf in Flintstone, Maryland (“Rocky Gap” or “ROK”) (1)
The Century Casino & Hotel in Edmonton, Alberta, Canada (“Century Resorts Alberta” or “CRA”)(1)
The Century Casino St. Albert in St. Albert, Alberta, Canada (“CSA”St. Albert” or “CSA”)(1); and
Century Mile Racetrack and Casino in Edmonton, Alberta, Canada (“CMR”Century Mile” or “Century Mile”“CMR”) (2)(1)(3)
(1)Subsidiaries of VICI Properties Inc. (“VICI PropCo”), an unaffiliated third party, own the real estate assets underlying these properties, and subsidiaries of the Company lease these properties under a triple net master lease agreement (“Master Lease”) with subsidiaries of VICI PropCo.
(2)Smooth Bourbon, LLC (“Smooth Bourbon”), a 50% owned subsidiary of the Company, owns the real estate assets.assets underlying this property. Smooth Bourbon is consolidated as a subsidiary for which the Company has a controlling financial interest. See discussion below.
(2)(3)CMR leases the land on which the racetrack and Racing and Entertainment Centre (“REC”) are located.
On February 10, 2022, the Company sold the land and building in Calgary, transferred the lease agreement for the casino premises to the buyer, and ceased operating Century Sports, a sports bar, bowling and entertainment facility located on the property. See below in Note 1 for additional information about Century Sports.
Through August 2021, the Company operated the pari-mutuel off-track betting network inThe southern Alberta Canada throughpari-mutuel network was operated by Century Bets!, Inc. (“CBS” or “CenturyCentury Bets”)., a subsidiary of the Company, through August 2021. In September 2021, the Company transferred these contracts to Century Mile. Century Bets was dissolved in November 2023.
The Company’s Colorado, and West Virginia and Nevada subsidiaries have partnered with sports betting and iGaming operators to offer sports wagering and online betting through mobile apps.
The Company currently has a controlling financial interest through its wholly-owned subsidiary CRM in the following majority-owned subsidiaries:
The Company owns 75% of United Horsemen of Alberta Inc. dba Century Downs Racetrack and Casino (“CDR” or “Century Downs”). CDR operates Century Downs Racetrack and Casino, a REC in Balzac, a north metropolitan area of Calgary, Alberta, Canada. CDR is consolidated as a majority-owned subsidiary for which the Company has a controlling financial interest. The remaining 25% is owned by unaffiliated shareholders and is reported as a non-controlling financial interest. A subsidiary of VICI PropCo owns the real estate assets underlying this property.
The Company owns 66.6% of Casinos Poland Ltd. (“CPL” or “Casinos Poland”). CPL owns and operates casinos throughout Poland. As of December 31, 2022,2023, CPL owned and operated eightfive casinos throughout Poland. CPL is consolidated as a majority-owned subsidiary for which the Company has a controlling financial interest. Polish Airports Company (“Polish Airports”) owns the remaining 33.3% of CPL, which is reported as a non-controlling financial interest. See Note 4 for additional information on CPL’s gaming licenses and casinos.
Through its wholly owned subsidiary Century Nevada Acquisition, Inc., the Company has a 50% equity interest in Smooth Bourbon, LLC (“PropCo” or “Smooth Bourbon”).Bourbon. The Company reportsreported this interest as an equity investment.
Asinvestment through April 2, 2023. On April 3, 2023, following the Company’s acquisition of December 31, 2022,Nugget, the Company hadbegan consolidating Smooth Bourbon as a concession agreement with TUI Cruisessubsidiary for one ship-based casino that endswhich it has a controlling financial interest. The Company determined it has a controlling financial interest in Smooth Bourbon based on the second quarterNugget being the primary beneficiary of 2023. In April 2022,Smooth Bourbon. The remaining 50% of Smooth Bourbon is owned by Marnell Gaming LLC (“Marnell”) and is reported as a concession agreement with TUI Cruisesnon-controlling financial interest. See “Equity Investment” below in this Note 1 for one other ship-based casino endedadditional information regarding the consolidation of Smooth Bourbon and in May 2021, a concession agreement with TUI CruisesNote 3 for two other ship-based casinos ended.additional information about Smooth Bourbon.
Recent Developments Related to COVID-19
The COVID-19 pandemic had an adverse effect on the Company’s 2020 results of operations and financial condition, and adversely impacted results of operations in the first half of 2021 because of closures at the Company’s Canada and Poland properties during this period. The table below provides a summary of the time periods in which the Company’s casinos, hotels and other facilities were closed to comply with quarantines issued by governments to contain the spread of COVID-19. The Company’s casinos have varied their operations based on the governmental health and safety requirements in the jurisdictions in which they are located. Currently, the Company’s operations are open and have no health and safety requirements for entry and few COVID-19 related restrictions.
|
|
|
Operating Segment
| Closure Date
| Reopen Date
|
Colorado
| March 17, 2020
| June 15 and June 17, 2020
|
Missouri
| March 17, 2020
| June 1, 2020
|
West Virginia
| March 17, 2020
| June 5, 2020
|
Edmonton
| March 17, 2020
| June 13, 2020
|
| December 13, 2020
| June 10, 2021
|
Calgary
| March 17, 2020
| June 13, 2020
|
| December 13, 2020
| June 10, 2021
|
Poland
| March 13, 2020
| May 18, 2020
|
| December 29, 2020
| February 12, 2021
|
| March 20, 2021
| May 28, 2021
|
In March 2020, as a proactive measure to increase its cash position and preserve financial flexibility, the Company borrowed an additional $9.95 million on its revolving credit facility (the “Revolving Facility”) under its credit facility (“Macquarie Credit Agreement”) with Macquarie Capital (“Macquarie”) and $7.4 million on its credit agreement with UniCredit Bank Austria AG (“UniCredit”). The Revolving Facility was repaid in July 2020 except for a $50,000 letter of credit that was repaid in May 2021. The $7.4 million credit agreement with UniCredit was refinanced in June 2021 to a EUR 6.0 million term loan repayable through December 31, 2025. See Note 6 for further discussion of the Macquarie Credit Agreement and the UniCredit credit agreement.
The duration and impact of the COVID-19 pandemic remains uncertain. The Company cannot predict the negative impacts that COVID-19 will have on its consumer demand, workforce, suppliers, contractors and other partners and whether future closures will be required. Such closures have had a material impact on the Company’s financial results. The effects of COVID-19, ongoing governmental health and safety requirements and any future closures could have a material impact on the Company. The Company will continue to monitor its liquidity and make reductions to marketing and operating expenditures, where possible, if future government mandates or closures are required that would have an adverse impact on the Company.
Other Projects and Developments
Nugget Casino Resort in Sparks,Reno-Sparks, Nevada
OnIn February 22, 2022, the Company entered into a definitive agreement with Marnell, Gaming, LLC (“Marnell”), pursuant to which a newly formedwholly-owned subsidiary of the Company (i) purchasedagreed to purchase from Marnell (i) 50% of the membership interests in Smooth Bourbon, and (ii) will purchase 100% of the membership interests in Nugget Sparks, LLC (“OpCo”). OpCo owns and operates the Nugget Casino Resort in Sparks,Reno-Sparks, Nevada, and PropCoSmooth Bourbon owns the real property on which the casino is located.
The Company purchased 50% of the membership interests in PropCoSmooth Bourbon for approximately $95.0 million (the “PropCo“Smooth Bourbon Acquisition”) at the first closing, which occurred on April 1, 2022 (the “First Closing”). TheAt the second closing (the “Second Closing”) on April 3, 2023, the Company used approximately $29.3 million of cash on hand and borrowings under the Goldman Credit Agreement (see Note 6) in connection with the First Closing. Subject to approval from the Nevada Gaming Commission, the Company’s purchase ofpurchased 100% of the membership interests in OpCo for approximately $100.0$104.7 million (subject to certain adjustments) (the “OpCo Acquisition” and together with the PropCoSmooth Bourbon Acquisition, the “Nugget Acquisition”) is expected to close in the second quarter of 2023 (the “Second Closing”). The purchase price for the OpCo Acquisition will be paid from proceeds of the Term Loan (as defined below) deposited in escrow (“Acquisition Escrow”) on the First Closing date. Following the Second Closing, the Company will ownowns the operating assets of Nugget Casino Resort and 50% of the membership interests in PropCo.Smooth Bourbon. The Company also has a five year option through April 1, 2027 to acquire the remaining 50% of the membership interests in PropCoSmooth Bourbon for $105.0 million plus 2% per annum. At the First Closing, PropCoSmooth Bourbon entered into a lease with OpCoNugget for an annual rent of $15.0 million.million plus annual escalators. See Note 3, “Acquisitions and Equity Investment – Acquisition – Nugget” for additional information.
Rocky Gap Casino Resort in Flintstone, Maryland
OnIn August 24, 2022, the Company entered into a definitive agreement with Golden Entertainment, Inc (“Golden”), Lakes Maryland Development, LLC, a subsidiary of Golden (“Lakes Maryland”), Golden Entertainment, Inc (“Golden”), and VICI PropCo, pursuant to which the Company agreed to acquire the operations of Rocky Gap Casino, Resort (“Rocky Gap”) for approximately $56.1 million subject to& Golf (such transaction, the conditions and terms set forth therein (the “Rocky Gap Acquisition”). Pursuant to a real estate purchase agreement, dated August 24, 2022, by and between Evitts Resort, LLC, a subsidiary of Golden (“Evitts”) and an affiliate of VICI PropCo (“VICI PropCo Buyer”), VICI PropCo Buyer agreed to acquire from Evitts a related interest in the real estate assets relatingland and building associated with Rocky Gap.
On July 25, 2023, the Company purchased the operations of Rocky Gap for approximately $59.1 million (subject to certain adjustments), and VICI PropCo Buyer purchased a related interest in the land and building associated with Rocky Gap for approximately $203.9 million, subject to the conditions and terms set forth therein.million. In connection with the Rocky Gap Acquisition, subsidiaries of the Company and a subsidiary of VICI PropCo amended the Master Lease. See Note 3, “Acquisitions and Equity Investment – Acquisition – Rocky Gap” and Note 7, “Financing Obligation” for additional information regarding the Rocky Gap Acquisition and the amendment to the Master Lease, respectively.
Canada Real Estate Sale
On May 16, 2023, the Company entered into definitive agreements for subsidiaries of VICI PropCo to acquire the real estate assets of Century Casino & Hotel Edmonton in Edmonton, Alberta, Century Casino St. Albert in Edmonton, Alberta, Century Mile Racetrack and Casino in Edmonton, Alberta and Century Downs Racetrack and Casino in Calgary, Alberta (collectively, the “Century Canadian Portfolio”). The transaction closed on September 6, 2023, for an aggregate purchase price of CAD 221.7 million ($162.6 million based on the exchange rate on September 6, 2023) in cash (the “Canada Real Estate Sale”). The Company expects to retain approximately CAD 155.6 million (USD $117.6 million based on the exchange rate on December 31, 2023) of the purchase price after giving effect to the purchase of the Century Downs land that previously was subject to the CDR land lease, selling expenses, Canadian and US taxes and proceeds to be paid to the minority owners of Century Downs. Simultaneous with the closing of thisthe transaction, subsidiaries of the Company and of VICI PropCo will enter into anamended the Master Lease. See Note 7, “Financing Obligation” for additional information regarding the amendment to their triple net lease agreement (the “Master Lease”) to (i) add Rocky Gap to the Master Lease, (ii) provide for an initial annual rent for Rocky Gap of approximately $15.5 million and (iii) extend the initial Master Lease term for 15 years from the date of the amendment (subjectLease. The Company recorded a loss on debt extinguishment related to the existing four fiveCDR land lease of CAD 9.9 million ($7.3 million based on the exchange rate on September 6, 2023) in interest expense in its consolidated statement of (loss) earnings for the year renewal options).ended December 31, 2023.
Recent Developments Related to Century Casino Caruthersville
The Caruthersville casino had operated on a riverboat and barge since 1994. On October 13, 2022, the riverboat had to be closed because it was no longer accessible from the barge because of the record low water levels in the Mississippi River. On October 26, 2022, the Missouri Gaming Commission approved the temporary relocation of the casino at Century Casino Caruthersville from the riverboat and the barge to a land-based pavilion until the new land-based casino and hotel are completed. On October 13, 2022, the riverboat, which had operated since 1994, had to be closedcompleted, as it was no longer accessible from the barge because of the record low water levels in the Mississippi River. The riverboat casino had 519 slot machines and seven table games. From October to December 2022, the casino was operated from the barge with 299 slot machines and four table games. The move to the pavilion, which has 425 slot machines and six table games, was completed in late December 2022.discussed below. The pavilion building will not be affected by water levels, is protected by a flood wall and provides for easier access to the casino for customers than the riverboat. The riverboat and barge were removed on February 25, 2023.
Caruthersville Land-Based Casino and Hotel
In July 2021, the Missouri law requiring each casino to be a floating facility was amended to allow casino facilities to be built as a standard building with a container with at least 2,000 gallons of water beneath the facility. This change, which recently survived a legal challenge, provides an opportunity for Century Casino Caruthersville to move to a non-floating facility. The Company is building a new land-based casino with a 38 room hotel adjacent to and connected with the existing casino pavilion building. Construction on the project began in December 2022 and it is expected to be completed in the second halffourth quarter of 2024 with an estimated project cost of $51.9 million. The Company is financing this project through financing provided by VICI PropCo. As of December 31, 2022,2023, the Company has spent $2.2 million on this project and has received $5.0$40.1 million from VICI PropCo in financing.and has spent approximately $20.7 million of
In July 2021,those funds on this project. As of December 31, 2023, the Company announcedhad approximately $19.4 million of cash included in its consolidated balance sheet that it had purchased land and a small two-story hotel near Century Casino Caruthersville with plans to refurbishwas previously funded by VICI PropCo but has not yet been spent on the existing hotel’s 36 rooms. The Company opened the hotel, The Farmstead, on October 30, 2022 with a total project cost of $3.6 million.project.
Cape Girardeau Hotel
The Company is building a 69 room hotel at its Cape Girardeau location.location called The hotelRiverview. The Riverview is planned as a six story building with 68,000 square feet that will be adjacent to and connected with the existing casino building. The hotel project has been approved by the City of Cape Girardeau. Construction on the project began in September 2022 and it is expected to be completed in the first half ofApril 2024. The Company estimates a project cost of approximately $30.5 million. The Company is financing the project with cash on hand. As of December 31, 2022,2023, the Company has spent $2.8approximately $22.8 million on this project.
Terminated Projects
Century Casino CalgaryCruise Ship Concession Agreements
The Company previously operated several ship-based casinos. The Company’s last concession agreement to operate ship-based casinos ended on April 16, 2023. The table below illustrates the ships operating during the years ended December 31, 2023, 2022 and 2021.
|
|
|
Ship | Operated From | Operated To |
Mein Schiff Herz | April 5, 2022 | April 16, 2023 |
Mein Schiff 6 | June 11, 2021 | April 18, 2022 |
Century Sports
In AugustThe Company owned land and a building in Calgary in which it operated Century Sports, a sports bar, bowling and entertainment facility, and leased space to a casino operator until February 10, 2022. The Company had previously sold its casino operations at this location in December 2020 the Company announced that it hadand entered into a definitive agreement to sell the casino operations of Century Casino Calgary for CAD 10.0 million ($7.5 million based on the exchange rate on August 5, 2020) plus a three year quarterly earn out as specified in the agreement. The Company received the CAD 10.0 million at the execution of the definitive agreement. The sale transaction closed on December 1, 2020. During the first quarter of 2021, the Company paid CAD 0.1 million ($0.1 million based on the exchange rate on February 12, 2021) in working capital adjustments under the purchase agreement. The Company recognized a gain on the sale of the casino operations of CAD 8.4 million ($6.5 million based on the exchange rate in effect on December 1, 2020), after giving effect to working capital and other adjustments. In December 2020, the Company entered into a three year lease agreement of the casino premises with the purchaser for annual net rent of CAD 0.5 million ($0.4 million based on the exchange rate on December 31, 2022)2023).
After the sale, the Company continued to operate Century Sports and own the underlying real estate. On February 10, 2022, the Company sold the land and building in Calgary for CAD 8.0 million ($6.3 million based on the exchange rate on February 10, 2022) at which time the Company transferred the lease agreement for the casino premises to the buyer and ceased operating Century Sports. As
The definitive agreement to sell the casino operations of Century Casino Calgary provided for a three year quarterly earn out that ended on August 4, 2023. The Company received earn out payments of CAD 2.2 million ($1.7 million based on the exchange rate on December 31, 2023) and CAD 0.1 million ($0.1 million based on the exchange rate on December 31, 2021) for the years ended December 31, 2023 and 2021, respectively, that are recorded to gain on sale of casino operations in its consolidated statements of (loss) earnings. There were no earn out payments in 2022. During the first quarter of 2021, the assets held forCompany paid CAD 0.1 million ($0.1 million based on the exchange rate on February 12, 2021) in working capital adjustments under the purchase agreement related to the sale included $4.8 million in land and $3.6 million in buildings and improvements, net of accumulated depreciation.its casino operations. Century Sports was included in the Canada reportable segment.
Century Casino Bath
In March 2020, Century Casino Bath (“CCB”) was closed due to COVID-19. Due to challenging conditions that included historical and forecast losses due to changes in the regulatory environment for casinos in England requiring enhanced due diligence of customers, CCB’s board of directors determined that it would enter into creditors voluntary liquidation and control of CCB was relinquished. Under Accounting Standards Codification (“ASC”) 810, Consolidation, specifically ASC 810-10-15, consolidation of a majority-owned subsidiary is precluded where control does not rest with the majority owners. Accordingly, when a subsidiary is in legal reorganization or files for bankruptcy, it is appropriate for the parent to deconsolidate the subsidiary. The Company determined that it was appropriate to deconsolidate CCB effective as of May 6, 2020. As a result of the deconsolidation, the Company recognized a gain of $7.4 million in general and administrative expenses on its consolidated statement of earnings (loss) for the year ended December 31, 2020. The process of voluntary liquidation was completed in October 2022 and CCB was dissolved.
Mendoza Central Entretenimientos S.A. (“MCE”)
The Company, through its subsidiary CRM, had a 7.5% ownership interest in Mendoza Central Entretenimientos S.A, an Argentina company (“MCE”), which leases slot machines and provides related services to Casino de Mendoza, a casino located in Mendoza, Argentina that is owned by the Province of Mendoza. The casino closed in March 2020 due to COVID-19 and reopened in November 2020. In March 2020, the Company assessed the MCE investment due to COVID-19. The investment was valued using the following approaches: (i) income approach utilizing the business enterprise value which resulted in no value, and (ii) a value in exchange basis which resulted in no value due to the circumstances of COVID-19. The Company charged $1.0 million to impairment – intangible and tangible assets in the Corporate and Other segment on the Company’s consolidated statement of earnings (loss) for the year ended December 31, 2020 and wrote-down a $0.3 million receivable related to MCE due to assessments made related to the impact of COVID-19 on MCE. In November 2021, CRM sold its ownership interest in MCE for nominal consideration. In addition, a consulting services agreement between CRM and MCE was terminated.
Bermuda
In August 2017, the Company announced that it had entered into a long-term casino management agreement with the owner of the Hamilton Princess Hotel & Beach Club in Hamilton, Bermuda. The Company would also provide a $5.0 million loan for the purchase of casino equipment if the gaming license was awarded. In January 2023, the management and funding agreements were mutually terminated because the project was not going forward.
Recent Developments Related to COVID-19
The COVID-19 pandemic had an adverse effect on the Company’s results of operations in the first half of 2021 because of closures at the Company’s Canada and Poland properties during this period. Currently, the Company’s operations have no COVID-19 related restrictions. The table below provides a summary of the time periods in which the Company’s casinos, hotels and other facilities were closed to comply with quarantines issued by governments to contain the spread of COVID-19.
|
|
|
Operating Segment | Closure Date | Reopen Date |
Canada | December 13, 2020 | June 10, 2021 |
Poland | December 29, 2020 | February 12, 2021 |
| March 20, 2021 | May 28, 2021 |
Future impacts of the COVID-19 pandemic remain uncertain. The Company cannot predict the negative impacts that continued variants of COVID-19 will have on its consumer demand, workforce, suppliers, contractors and other partners and whether future closures will be required. Such closures have had a material impact on the Company’s financial results and any future closures
could have a material impact on the Company. If future government mandates or closures are required, the Company will monitor its liquidity and make reductions to marketing and operating expenditures, where possible.
2. SIGNIFICANT ACCOUNTING POLICIES
Principles of Consolidation – The accompanying consolidated financial statements include the accounts of the Company and its wholly-owned subsidiaries. The Company also consolidates CPL, CDR and CDRSmooth Bourbon as majority owned subsidiaries for which the Company has a controlling interest. The portion of CPL, CDR and CDRSmooth Bourbon that are not wholly-owned are reflected as non-controlling interests in the accompanying consolidated financial statements. All intercompany transactions and balances have been eliminated.
Use of Estimates – The preparation of financial statements in conformity with accounting principles generally accepted in the United States (“US GAAP”) requires management to make estimates and assumptions that affect the reported amount of assets and liabilities, the disclosure of contingent assets and liabilities at the date of the financial statements, and the reported amounts of revenue and expenses during the reporting period. Actual results could differ materially from those estimates. Management’s use of estimates includes estimates for property and equipment, goodwill, intangible assets and income tax.
Recently Adopted Accounting Pronouncements – The Company has recently adopted the following accounting pronouncements:pronouncement:
In March 2020,2023, the Financial Accounting Standards Board (“FASB”) issued Accounting Standards Update (“ASU”) 2020-04,2023-01, Reference Rate ReformLeases (Topic 848)842); Common Control Arrangements (“ASU 2020-04”2023-01”). The objective of ASU 2020-04 is to provide optional expedients and exceptions for applying US GAAP to contracts, hedging relationships and other transactions that reference LIBOR or another reference rate expected to be discontinued because of reference rate reform. In January 2021, the FASB issued ASU 2021-01, Reference Rate Reform (Topic 848): Scope (“ASU 2021-01”), which provides clarification that certain optional expedients and exceptions in ASU 2020-04 for contract modification and hedge accounting apply to derivatives that are affected by discounting transition.The guidance was effective from March 12, 2020 through December 31, 2022. The Company evaluated its debt agreements under ASU 2020-04 and determined that it did not need to modify any of the agreements as a result of the discontinuation of LIBOR.
In October 2021, the FASB issued ASU 2021-08, Business Combinations (Topic 805) (“ASU 2021-08”). The objective of ASU 2021-082023-01 is to address diversity in practicestakeholder concerns about amortizing leasehold improvements for lease arrangements between entities under common control. ASU 2023-01 states that the leasehold improvements by a lessee under common control are to be amortized over the useful life of the leasehold improvements and inconsistency related to (i) recognitionadjusted through equity when the lessee no longer controls the use of an acquired contract liability and (ii) payment terms and their effect on subsequent revenue recognized by the acquirer.underlying asset. Early adoption of ASU 2023-01 is permitted. The guidance is effective for fiscal years beginning after December 15, 2022, and interim periods within those fiscal years.2023. The Company hasearly adopted thisASU 2023-01 as of January 1, 2023. Adoption of the standard and will applyhad no material impact on the guidance in connection with its pending acquisitions.Company’s financial statements.
Accounting Pronouncements Pending Adoption –
In October 2023, the FASB issued ASU 2023-06, Disclosure Improvements - Codification Amendments in Response to the SEC's Disclosure Update and Simplification Initiative (“ASU 2023-06”). The objective of ASU 2023-06 is to update and simplify disclosure requirements and is intended to align US GAAP and SEC requirements. Early adoption of ASU 2023-06 is not permitted. The guidance relates to various topics and is effective on the date on which the SEC’s removal of that related disclosure requirement from Regulation S-X or Regulation S-K becomes effective. The Company is reviewing the updates provided by this standard. The Company does not expect the adoption of the standard to have a material impact on the Company’s financial statements.
In November 2023, the FASB issued ASU 2023-07, Segment Reporting (Topic 280); Improvements to Reportable Segment Disclosures (“ASU 2023-07”). The objective of ASU 2023-07 is to improve reportable segment disclosure requirements, primarily through enhanced disclosures about significant segment expenses, as well enhance interim disclosure requirements, clarify circumstances in which an entity can disclose multiple segment measures of profit or loss and other disclosure requirements. Early adoption of ASU 2023-07 is permitted. The guidance is effective for fiscal years beginning after December 15, 2023, and interim periods within fiscal years beginning after December 15, 2024. The Company is reviewing the updates provided by this standard.
In December 2023, the FASB issued ASU 2023-09, Income Taxes (Topic 740); Improvements to Income Tax Disclosures (“ASU 2023-09”). The objective of ASU 2023-09 is to improve income tax disclosure requirements. Under ASU 2023-09, entities must annually (1) disclose specific categories in the income tax rate reconciliation and (2) provide additional information for reconciling items that meet a quantitative threshold. Early adoption of ASU 2023-07 is permitted. The guidance is effective for annual periods beginning after December 15, 2024. The Company is reviewing the updates provided by this standard.
The Company has considered all other recently issued accounting pronouncements and does not believe the adoption of such pronouncements will have a material impact on its audited consolidated financial statements or notes thereto.
Cash and Cash Equivalents – All highly liquid investments with an original maturity of three months or less are considered cash equivalents. As of December 31, 20222023 and 2021,2022, the Company had no cash equivalents. A reconciliation of cash, cash equivalents and restricted cash as stated in the Company’s statement of cash flows is presented in the following table:
|
|
|
|
|
|
|
|
|
|
| December 31, |
| December 31, |
| December 31, |
| December 31, |
Amounts in thousands |
| 2022 |
| 2021 |
| 2023 |
| 2022 |
Cash and cash equivalents |
| $ | 101,785 |
| $ | 107,821 |
| $ | 171,327 |
| $ | 101,785 |
Restricted cash |
| 100,151 |
| — |
| — |
| 100,151 |
Restricted cash included in deposits and other |
|
| 195 |
|
| 220 |
|
| 263 |
|
| 195 |
Total cash, cash equivalents, and restricted cash shown in the consolidated statement of cash flows |
| $ | 202,131 |
| $ | 108,041 | |
Total cash, cash equivalents, and restricted cash shown in the consolidated statements of cash flows | |
| $ | 171,590 |
| $ | 202,131 |
As of December 31, 2023, the Company had $0.2 million in deposits related to payments of prizes and giveaways for Casinos Poland and $0.1 million in deposits related to insurance policies in restricted cash included in deposits and other on its consolidated balance sheet. As of December 31, 2022, the Company had $100.2 million related to the Acquisition Escrow in restricted cash and $0.2 million in deposits related to payments of prizes and giveaways for Casinos Poland and less than $0.1 million in deposits related to an insurance policy in restricted cash included in deposits and other on its consolidated balance sheet. As of December 31, 2021, the Company had $0.2 million related to payments of prizes and giveaways for Casinos Poland, and less than $0.1 million related to an insurance policy in restricted cash included in deposits and other on its consolidated balance sheet.
Concentrations of Credit Risk – Financial instruments that potentially subject the Company to significant concentrations of credit risk consist principally of cash and cash equivalents. Although the amount of credit exposure to any one institution may exceed federally insured amounts, the Company limits its cash investments to high quality financial institutions in order to minimize its credit risk.
Accounts Receivable – Accounts receivable are expected to be collected within six months of the maturity date. Receivables not collected within that time frame are written down to the allowance for doubtful accounts and further written off after one year if not collected.
Inventories – Inventories, which consist primarily of food, beverage, retail merchandise and operating supplies, are stated at the lower of cost or net realizable value. Cost is determined by the first-in, first-out method.
Property and Equipment – Property and equipment are stated at cost. Costs of major improvements are capitalized, and costs of normal repairs and maintenance are charged to expense as incurred. Depreciation of assets in service is determined using the straight-line method over the estimated useful lives of the assets. Estimated service lives used are as follows:
|
|
|
|
Buildings and improvements | 5 – 39 years |
Gaming equipment | 3 – 7 years |
Furniture and non-gaming equipment | 3 – 7 years |
The Company evaluates long-lived assets for possible impairment whenever events or circumstances indicate that the carrying amount of an asset may not be recoverable. If there is an indication of impairment, determined by the excess of the carrying value in relation to anticipated undiscounted future cash flows, the carrying amount of the asset is written down to its estimated fair value by a charge to operations. See Note 4 for additional information about the Company’s property and equipment.
Goodwill – Goodwill represents the excess purchase price over the fair value of the net identifiable assets acquired related to third party business combinations. See Note 5 for additional information about the Company’s goodwill, including the impairments recorded in the year ended December 31, 2020.goodwill.
Intangible Assets – Identifiable intangible assets include trademarks, player’s club lists and casino licenses. The Company has determined that the trademarks and casino licenses, with the exception of the trademark related to MTR and the casino licenses related to CPL, areCompany’s intangible assets identified as indefinite-lived intangible assets and are therefore not amortized. The Company’s casino licenses related to CPL, the trademark related to MTR and the player’s club lists are finite-lived intangible assets and are amortized over their respective useful lives. See Note 5 for additional information about the Company’s intangible assets, including the impairments recorded in the year ended December 31, 2020.assets.
Financing Obligation with VICI PropCo – TheIn accordance with ASC 842, “Leases” (“ASC 842”), for transactions in which the Company and subsidiaries of VICI PropCo enteredenters into a triple net lease agreement (the “Master Lease”) concurrently withcontract to sell an asset and leases it back from the Company’s acquisition (the “2019 Acquisition”) in 2019 of MTR, CCGseller under a sale and CCV (the “2019 Acquired Casinos”). The Master Lease was evaluated as a sale-leaseback of real estate. Theleaseback transaction, the Company determined that the Master Lease did not qualify for sale-leaseback accounting and accounted for the transaction as a financing obligation based on the fair valuemust determine whether control of the real estate assets subject toasset has transferred from the Master Lease (see Note 7). As a financing obligation,Company. In cases whereby control has not transferred from the Company, the Company continues to reflect the real estate assets on its consolidated balance sheets as if the Company were the legal owner and continues to recognize depreciation expense over the estimatedshorter of the remaining useful lives.life or the lease term. Additionally, a financial liability is recognized and referred to as a financing obligation, in accordance with ASC 470, “Debt” (“ASC 470”). The accounting for financing obligations under ASC 470 is materially consistent with the accounting for finance leases under ASC 842. The Company concluded that its Master Lease is required to be accounted for as a financing obligation. See Note 7 for additional information about the Company’s financing obligation. The Company does not recognize rent expense related to these leased assets; instead, a portion of
the periodic paymentminimum lease payments under the Master Lease isare recognized as interest expense with the remainder of the payment reducing the failed sale-leaseback financing obligation using the effective interest method. Contingent payments and payments on account of CPI increases are recorded as interest expense as incurred. In the initial periods, cash payments are less than the interest expense recognized in the consolidated statements of (loss) earnings, (loss), which causes the financing obligation to increase during the initial years of the lease term.increase.
Foreign Currency – The Company’s functional currency is the US dollar (“USD” or “$”). Foreign subsidiaries with a functional currency other than the US dollar translate assets and liabilities at current exchange rates at the end of the reporting periods, while income and expense accounts are translated at average exchange rates for the respective periods. The Company and its subsidiaries enter into various transactions made in currencies different from their functional currencies. These transactions are typically denominated in the Canadian dollar (“CAD”), Euro (“EUR”), and Polish zloty (“PLN”) and British pound (“GBP”). Gains and losses resulting from changes in foreign currency exchange rates related to these transactions are included in non-operating income (expense) as they occur.
The exchange rates to the US dollar used to translate balances for the reported periods are as follows:
|
|
|
|
|
|
|
|
|
|
| As of December 31, |
| As of December 31, |
| As of December 31, |
| As of December 31, |
Ending Rates |
| 2022 |
| 2021 |
| 2023 |
| 2022 |
Canadian dollar (CAD) |
| 1.3550 |
| 1.2678 |
| 1.3232 |
| 1.3550 |
Euros (EUR) |
| 0.9393 |
| 0.8810 |
| 0.9030 |
| 0.9393 |
Polish zloty (PLN) |
| 4.4004 |
| 4.0492 |
| 3.9155 |
| 4.4004 |
|
|
|
|
|
|
|
|
|
|
|
|
|
|
|
|
|
|
|
|
|
|
|
|
|
|
|
|
|
|
|
|
|
|
|
|
|
|
|
|
|
|
|
| For the year |
|
|
|
|
| For the year |
|
|
|
|
|
| ended December 31, |
| % Change |
| ended December 31, |
| % Change |
Average Rates |
| 2022 |
| 2021 |
| 2020 |
| 2022/2021 |
| 2021/2020 |
| 2023 |
| 2022 |
| 2021 |
| 2023/2022 |
| 2022/2021 |
Canadian dollar (CAD) |
| 1.3011 |
| 1.2537 |
| 1.3412 |
| (3.8%) |
| 6.5% |
| 1.3496 |
| 1.3011 |
| 1.2537 |
| (3.7%) |
| (3.8%) |
Euros (EUR) |
| 0.9506 |
| 0.8456 |
| 0.8776 |
| (12.4%) |
| 3.6% |
| 0.9248 |
| 0.9506 |
| 0.8456 |
| 2.7% |
| (12.4%) |
Polish zloty (PLN) |
| 4.4559 |
| 3.8608 |
| 3.8989 |
| (15.4%) |
| 1.0% |
| 4.2034 |
| 4.4559 |
| 3.8608 |
| 5.7% |
| (15.4%) |
British pound (GBP) |
| N/A |
| 0.7270 |
| 0.7798 |
| N/A |
| 6.8% | |
Source: 2022 Xe Currency Converter, 2021 and 2020 Pacific Exchange Rate Service |
|
| |
Source: 2023 and 2022 Xe Currency Converter, 2021 Pacific Exchange Rate Service | | Source: 2023 and 2022 Xe Currency Converter, 2021 Pacific Exchange Rate Service |
|
|
|
|
|
|
|
|
|
|
|
|
|
|
|
|
|
|
|
|
|
|
|
Comprehensive Loss – Comprehensive loss includes the effect of fluctuations in foreign currency rates on the values of the Company’s foreign investments.
Revenue Recognition – The Company’s performance obligations related to contracts with customers consist of the following:
Gaming
The majority of the Company’s revenue is derived from gaming transactions involving wagers wherein, upon settlement, the Company either retains the customer’s wager, or returns the wager to the customer. Gaming revenue is reported as the net difference between wins and losses. Gaming revenue is reduced by the incremental amount of unpaid progressive jackpots in the period during which the jackpot increases and the dollar value of points earned through tracked play. In Canada, gaming revenue is also reduced by amounts retained by the Alberta Gaming, Liquor and Cannabis Commission (“AGLC”) and Horse Racing Alberta (“HRA”). Performance obligations are satisfied upon completion of the wager with liabilities recognized for points earned through play. The Company offers lines of credit to customers at select locations; the lines of credit are short-term in nature.
Hotel accommodations and food and beverage furnished without charge, coupons and downloadable credits provided to customers to entice play are considered marketing incentives to induce play and are presented as a reduction to gaming revenue at their retail value on the date of redemption. Members of the Company’s casinos’ player clubs earn points based on, among other things, their volume of play at the Company’s casinos. Players can accumulate points over time that they may redeem at their discretion under the terms of the program. The value of the points is offset against the revenue in the period in which the points were earned. Marketing incentives and player club points provided to gaming customers allocated to gaming revenue were $72.9 million, $42.4 million $39.0 million and $30.3$39.0 million for the years ended December 31, 2023, 2022 2021 and 2020,2021, respectively. The Company records a liability based on the redemption value of the player club points earned with an estimate for breakage, and records a corresponding reduction in gaming revenue. The value of unused or unredeemed points is included in accrued liabilities on the Company’s consolidated balance sheets.
Hotel, Food and Beverage and Other Sales
Goods and services provided include hotel room rentals, food and beverage sales and retail sales. The majority of the hotel, food and beverage and other sales contracts are satisfied on the same day and revenue is recognized on the date of the sale. Revenue that is collected before the date of sale is recorded as deferred revenue. In the normal course of business, the Company does not accept product returns. The Company excludes taxes assessed by a governmental authority and collected by the Company from the transaction price.
Pari-Mutuel
Pari-mutuel revenue involves wagers on horse racing. The Company facilitates wagers on horse racing through live racing at the Company’s racetrack, off-track betting parlors at the Company’s casinos, and the operation of the Alberta off-track betting network. The Company has determined that it is the principal in the performance obligations through which amounts are wagered on horse races run at the Company’s racetrack. For these performance obligations, the Company records revenue as the commission retained on wagers with revenue recognized on the date of the wager. The Company has determined that it is acting as the agent for all wagers placed through the Company’s off-track betting parlors and the off-track betting network. For these performance obligations, the Company records pari-mutuel revenue as the commission retained on wagers less the expense for host fees to the host racetrack with revenue recognized on the date of the wager. Expenses related to licenses and HRA levies are expensed in the same month as revenue is recognized. The Company takes future bets for the Kentucky Derby only and recognizes wagers on the Kentucky Derby as deferred revenue.
Sports Betting and iGaming
Sports betting revenue involves wagers on sporting events, and iGaming revenue involves wagers on casino games through an online platform. The Company has partneredpartners with sports betting and iGaming operators at its Colorado, and West Virginia and Nevada casinos and an iGaming operator at its West Virginia casino.to provide these services. The agreements generally provide the Company receiveswith a share of net gaming revenue and a minimum revenue guarantee each year from the sports betting and iGaming operators. The Company has determined that it is acting as the agent in its sports betting and iGaming transactions.
Management and Consulting Fees
The Company’s consulting services agreement with MCE was terminated in November 2021. Prior to termination, revenue from the agreement was recorded monthly as services were provided. Payments were typically due within 30 days of the month to which the services relate. The agreed upon price in the contract did not contain variable consideration.
Promotional Allowances – The Company issues coupons and downloadable promotional credits to customers for the purpose of generating future revenue. The value of coupons and downloadable promotional credits redeemed is applied against the revenue generated on the day of the redemption. For the years ended December 31, 2023, 2022 2021 and 2020,2021, the estimated direct costs of providing promotional allowances were as follows:
|
|
|
|
|
|
|
|
|
|
|
|
|
|
|
|
|
|
|
|
|
|
|
|
|
|
|
| For the year |
| For the year |
|
| ended December 31, |
| ended December 31, |
Amounts in thousands |
| 2022 |
| 2021 |
| 2020 |
| 2023 |
| 2022 |
| 2021 |
Hotel |
| $ | 348 |
| $ | 293 |
| $ | 248 |
| $ | 542 |
| $ | 348 |
| $ | 293 |
Food and beverage |
|
| 2,065 |
|
| 1,789 |
|
| 1,775 |
|
| 4,208 |
|
| 2,065 |
|
| 1,789 |
|
| $ | 2,413 |
| $ | 2,082 |
| $ | 2,023 |
| $ | 4,750 |
| $ | 2,413 |
| $ | 2,082 |
|
|
|
|
|
|
|
|
|
|
|
|
|
|
|
|
|
|
|
Loyalty Programs - Members of the Company’s casinos’ player clubs earn points based on, among other things, their volume of play at the Company’s casinos. Players can accumulate points over time that they may redeem at their discretion under the terms of the program. The Company records a liability based on the redemption value of the points earned and records a corresponding reduction in casino revenue. Points can be redeemed for cash, downloadable promotional credits and/or various amenities at the casino, such as meals, hotel stays and gift shop items. The value of the points is offset against the revenue in the period in which the points were earned. The value of unused or unredeemed points is reduced by points not expected to be redeemed (breakage) and included in accrued liabilities on the Company’s consolidated balance sheets. The outstanding balance of this liability on the Company’s consolidated balance sheets was $2.3 million and $1.0 million as of December 31, 2023 and 2022, and 2021.respectively.
Stock-Based Compensation – Stock-based compensation expense is measured at the grant date based on the fair value of the award and is recognized as expense over the vesting period. The Company accounts for forfeitures as they occur. The Company uses the Black-Scholes option pricing model for all non-performance option grants and the Monte Carlo option pricing model for all performance stock unit grants related to total shareholder return to determine the fair value of all such grants. See Note 12.
Advertising Costs – Advertising costs are expensed when incurred by the Company. Advertising costs were $5.6 million, $3.6 million $2.3 million and $2.6$2.3 million in the years ended December 31, 2023, 2022 2021 and 2020,2021, respectively, and are included in gaming expenses on the Company’s consolidated statementstatements of earnings (loss). earnings.
Income Taxes – The Company accounts for income taxes using the asset and liability method, which provides that deferred tax assets and liabilities are recorded based on the difference between the tax bases of assets and liabilities and their carrying amounts for financial reporting purposes, at a rate expected to be in effect when the differences become deductible or payable. Recorded deferred tax assets are evaluated for impairment by reviewing internal estimates for future taxable income.
Earnings Per Share – The calculation of basic earnings per share considers the weighted average outstanding common shares in the computation. The calculation of diluted earnings per share also gives effect to all potentially dilutive securities. The calculation of diluted earnings per share is based upon the weighted average number of common shares outstanding during the period, plus, if dilutive, the assumed exercise of stock options using the treasury stock method. Weighted average shares outstanding for the years ended December 31, 2023, 2022 2021 and 20202021 were as follows:
|
|
|
|
|
|
|
|
|
|
|
|
|
|
|
|
|
|
|
|
|
|
|
|
|
|
|
| For the year |
| For the year |
|
| ended December 31, |
| ended December 31, |
Amounts in thousands |
| 2022 |
| 2021 |
| 2020 |
| 2023 |
| 2022 |
| 2021 |
Weighted average common shares, basic |
| 29,809 |
| 29,593 |
| 29,559 |
| 30,274 |
| 29,809 |
| 29,593 |
Dilutive effect of stock options |
|
| 1,671 |
|
| 1,795 |
|
| — |
|
| — |
|
| 1,671 |
|
| 1,795 |
Weighted average common shares, diluted |
|
| 31,480 |
|
| 31,388 |
|
| 29,559 |
|
| 30,274 |
|
| 31,480 |
|
| 31,388 |
|
|
|
|
|
|
|
|
|
|
|
|
|
|
|
|
|
|
|
The following stock options are anti-dilutive and have not been included in the weighted-average shares outstanding calculation:
|
|
|
|
|
|
|
|
|
|
|
|
|
|
|
|
|
|
|
|
|
|
|
|
|
|
|
| For the year |
| For the year |
|
| ended December 31, |
| ended December 31, |
Amounts in thousands |
| 2022 |
| 2021 |
| 2020 |
| 2023 |
| 2022 |
| 2021 |
Stock options |
| 2,740 |
| 2,572 |
| 1,272 |
| 1,911 |
| 2,740 |
| 2,572 |
|
|
|
|
|
|
|
|
|
|
|
|
|
Equity Investment – On April 1, 2022, the Company purchased 50% of the membership interests in Smooth Bourbon. Smooth Bourbon owns the real property on which the Nugget Casino is located. The additional 50% of the membership interests in Smooth Bourbon is held by Marnell. At the time of the purchase of its membership interests in Smooth Bourbon decision-making is controlled by Marnell,at the managing member. TheFirst Closing, the Company completed an assessment of whether Smooth Bourbon is a variable interest entity in which it has a financial interest. Based on this assessment, the Company concluded that Smooth Bourbon iswas not subject to consolidation under the guidance for variable interest entities. The Company will evaluateentities prior to the Nugget Acquisition because Nugget is the primary beneficiary of Smooth Bourbon and reported its investmentinterest in Smooth Bourbon as an equity investment. After the Second Closing on April 3, 2023, the Company began consolidating Smooth Bourbon as a subsidiary for impairment onwhich it has a controlling financial interest and no longer reports its interest in Smooth Bourbon as an annual basis or whenever events or circumstances indicate the carrying amount may not be recoverable.equity investment. See Note 3 for additional information about Smooth Bourbon.
Government Wage and Rent Subsidies – In April 2020, the Canadian government enacted the Canada Emergency Wage Subsidy as a result of COVID-19 to help employers offset a portion of their employee wages for a limited period. The Company elected to treat qualified government subsidies for the Canada segment as offsets to the related operating expenses. During the yearsyear ended December 31, 2021, and 2020, qualified payroll credits reduced the Canada segment’s operating expenses by CAD 3.1 million ($2.5 million based on the exchange rate in effect on December 31, 2021) and CAD 7.4 million ($5.5 million based on the exchange rate in effect on December 31, 2020), respectively.. In November 2020, the Canadian government enacted the Canada Emergency Rent Subsidy as a result of COVID-19 to help subsidize for a limited period rent for businesses experiencing a drop in revenue. The qualified government rent subsidies reduced operating expenses by CAD 1.6 million ($1.3 million based on the average exchange rate for the year ended December 31, 2021) and CAD 0.5 million ($0.4 million based on the average exchange rate for the year ended December 31, 2020). There were no wage or rent subsidies received in Canada for the yearyears ended December 31, 2023 and 2022. Wage credits and subsidies were also provided by the US and Polish governments in 2021 but were immaterial.
3. ACQUISITIONS AND EQUITY INVESTMENT
Acquisition – Nugget
At the Second Closing on April 3, 2023, the Company completed its previously announced Nugget Acquisition of 100% of the membership interests in Nugget Sparks, LLC from Marnell. Nugget Sparks, LLC operates the Nugget Casino Resort, located in Sparks, Nevada. The purchase price paid at the Second Closing was from proceeds of the term loan (“Goldman Term Loan”) under the credit agreement (“Goldman Credit Agreement”) with Goldman Sachs Bank USA (“Goldman”) deposited in escrow (“Acquisition Escrow”) on the First Closing date. In connection with the Nugget Acquisition, the Company made an initial payment to Marnell of $104.7 million on April 3, 2023 consisting of a base price of $100.0 million plus adjustments based on working capital of Nugget at closing. The Company made an additional working capital adjustment payment of $0.8 million on August 29, 2023.
As of April 3, 2023, the Company began consolidating Nugget as a wholly-owned subsidiary. Nugget contributed $80.8 million in net operating revenue and $1.3 million in net earnings attributable to Century Casinos, Inc. shareholders for the year ended December 31, 2023.
The Company accounted for the transaction as a business combination, and accordingly, the acquired assets of $256.6 million (including $6.8 million in cash) and liabilities of $194.8 million were included in the Company’s consolidated balance sheet at April 3, 2023. The Nugget Acquisition generated $43.7 million of tax deductible goodwill for the Company’s United States segment. The goodwill from the Nugget Acquisition is attributable to the business expansion opportunity for the Company.
The fair value of the assets acquired and liabilities assumed (excluding cash received) was determined to be $55.1 million as of the acquisition date. The fair values of the acquired tangible and intangible assets were determined using variations of the income, market and cost approaches, including the following methods which the Company considered appropriate:
•multi-period excess earnings method;
•cost method;
•capitalized cash flow method;
•relief from royalty method;
•discounted cash flow method; and
•direct market value approach.
Both the income and market approach valuation methodologies used for the identifiable net assets acquired in the Nugget Acquisition make use of Level 3 inputs and are provisional pending development of a final valuation.
Trade receivables and payables, inventory and other current and noncurrent assets and liabilities were valued at the existing carrying values as they represented a reasonable approximation of the fair value of those items at the Nugget Acquisition date, based on management’s judgment and estimates.
The personal property components of the fixed assets were primarily valued utilizing the market and cost approaches. Certain personal property with an active and identifiable secondary market value were valued using the market approach. This property included, but was not limited to, certain gaming/slot equipment, information and technology equipment and vehicles. The cost approach was utilized to value all other personal property. The cost approach estimates fair value as the current cost of replacing or reproducing the utility of an asset, or group of assets and adjusting it for any depreciation resulting from one or more of the following: physical deterioration, functional obsolescence, and/or economic obsolescence.
The real estate assets that are owned by Smooth Bourbon were adjusted to fair value concurrently with the Nugget Acquisition. The fair value was determined utilizing the direct capitalization method of the income approach. The fair value of the acquired real estate assets was determined to be $184.7 million. The income approach incorporates all tangible and intangible property and served as a ceiling for the fair values of the acquired assets of the ongoing business enterprise, while still taking into account the premise of highest and best use.
The fair value of the customer relationships from the player’s club list was valued using the incremental cash flow method under the income approach. The incremental cash flow method is used to estimate the fair value of an intangible asset based on a residual cash flow notion. This method measures the benefits (e.g., cash flows) derived from ownership of an acquired intangible asset as if it were in place, as compared to the acquirer’s expected cash flows as if the intangible asset were not in place (i.e., with-and-without). The present value difference in the two cash flow streams is ascribable to the intangible asset. The Company has assigned a 10 year useful life to the player loyalty program based on estimated revenue attrition among the player’s club members, based on historical operations as estimated by management.
The fair value of the Nugget trademark was valued using the relief from royalty method. The relief from royalty method presumes that, without ownership of the asset, the Company would have to make a stream of payments to a brand or franchise owner in return for the right to use their name. By virtue of this asset, the Company avoids any such payments and records the related intangible value of the trademark. The primary assumptions in the valuation included projected revenue, a pre-tax royalty rate, the trademark’s useful life, and tax expense. The Company has assigned the Nugget trademark a 10 year useful life after considering, among other things, the expected use of the asset, the expected useful life of other related assets or asset groups, any legal, regulatory, or contractual provisions that may limit the useful life, the effects of obsolescence, demand and other economic factors, and the maintenance expenditures required to promote and support the trademark.
Details of the Nugget Acquisition in the table below are based on estimated fair values of assets and liabilities as of April 3, 2023. The Nugget Acquisition was accounted for using the acquisition method of accounting. Assets acquired and liabilities assumed in connection with the Nugget Acquisition have been recorded at their preliminary fair values. Certain estimated values for the Nugget Acquisition for accrued liabilities, property and equipment, intangible assets, and deferred income taxes are not yet finalized pending the final purchase price allocations and the receipt of additional information from the Nugget. As a result, the Company’s estimates and assumptions are subject to change within the measurement period as valuations are finalized. The Company expects to finalize the allocation of the purchase price by April 3, 2024, one year from the date of the Nugget Acquisition.
|
|
|
|
Amounts in thousands |
|
|
Cash |
| $ | 6,764 |
Receivables |
|
| 1,689 |
Prepaid expenses |
|
| 3,715 |
Inventories |
|
| 2,681 |
Property and equipment |
|
| 211,811 |
Intangible assets |
|
| 29,940 |
Accounts payable |
|
| (2,622) |
Accrued liabilities |
|
| (4,092) |
Accrued payroll |
|
| (2,348) |
Taxes payable |
|
| (998) |
Finance lease liabilities |
|
| (184,700) |
Net identifiable assets acquired |
|
| 61,840 |
Add: Goodwill |
|
| 43,716 |
Net assets acquired |
| $ | 105,556 |
The following table details the purchase consideration net cash outflow.
|
|
|
|
Amounts in thousands |
|
|
|
Outflow of cash to acquire subsidiaries, net of cash acquired |
|
|
|
Cash consideration |
| $ | 100,000 |
Working capital adjustments |
|
| 5,556 |
Less: Cash balances acquired |
|
| (6,764) |
Net cash used in investing activities |
| $ | 98,792 |
Acquisition-related costs
The Company incurred acquisition costs of approximately $0.5 million and $2.0 million for the years ended December 31, 2023 and 2022, respectively, in connection with the Nugget Acquisition. These costs include investment banking, legal and accounting fees and have been recorded as general and administrative expenses in the Corporate and Other reportable segment.
Ancillary Agreements
In connection with the Nugget Acquisition, the Company and the sellers entered into a consulting agreement dated December 19, 2022, whereby the sellers agreed to provide the Company with certain consulting services following the Nugget Acquisition. The agreement compensates the sellers for services following the Nugget Acquisition as performed by employees at a monthly rate. Fees incurred under the agreement were $0.4 million for the year ended December 31, 2023 and were recorded as general and administrative expenses in the United States segment. The agreement ended on September 30, 2023.
Acquisition-Related Contingencies
Nugget is party to various legal and administrative proceedings, which have arisen in the normal course of business and relate to underlying events that occurred on or before April 3, 2023. Estimated losses have been accrued as of the Nugget Acquisition date
for these proceedings in accordance with Accounting Standards Codification Topic 450 “Contingencies” (“ASC Topic 450”), which requires that an amount be accrued if the loss is probable and can be estimated. The Company estimated the range of these contingencies to be between $0.1 million and $0.2 million as of December 31, 2023.
Acquisition – Rocky Gap
On July 25, 2023, the Company completed its previously announced Rocky Gap Acquisition of 100% of the membership interests in Evitts Resort, LLC from Lakes Maryland. Evitts Resort, LLC operates Rocky Gap Casino, Resort & Golf, located in Flintstone, Maryland. Simultaneous with the closing of the Rocky Gap Acquisition, affiliates of VICI PropCo purchased the land and building associated with Rocky Gap. On July 25, 2023, the Company amended its Master Lease to add the Rocky Gap property. The Rocky Gap Acquisition was financed with $30.0 million borrowed under the revolving credit facility (“Revolving Facility”) of the Goldman Credit Agreement and cash on hand. In connection with the Rocky Gap Acquisition, the Company made an initial payment to Lakes Maryland of $59.1 million on July 25, 2023. This amount included a base price of $56.1 million plus an adjustment based on the estimated working capital of Rocky Gap at closing. The Company paid an additional $0.1 million in working capital adjustments on December 18, 2023.
As of July 25, 2023, the Company began consolidating Rocky Gap as a wholly-owned subsidiary. Rocky Gap contributed $31.7 million in net operating revenue and ($2.5) million in net loss attributable to Century Casinos, Inc. shareholders for the year ended December 31, 2023.
The Company accounted for the transaction as a business combination, and accordingly, the acquired assets of $244.9 million (including $6.7 million in cash) and liabilities of $212.1 million were included in the Company’s consolidated balance sheet at July 25, 2023. The Rocky Gap Acquisition generated $26.5 million of tax deductible goodwill for the Company’s United States segment. The goodwill from the Rocky Gap Acquisition is attributable to the business expansion opportunity for the Company.
The fair value of the assets acquired and liabilities assumed (excluding cash received) was determined to be $26.1 million as of the acquisition date. The fair values of the acquired tangible and intangible assets were determined using variations of the income, market and cost approaches, including the following methods which the Company considered appropriate:
•multi-period excess earnings method;
•cost method;
•capitalized cash flow method;
•relief from royalty method;
•discounted cash flow method; and
•direct market value approach.
Both the income and market approach valuation methodologies used for the identifiable net assets acquired in the Rocky Gap Acquisition make use of Level 3 inputs and are provisional pending development of a final valuation.
Trade receivables and payables, inventory and other current and noncurrent assets and liabilities were valued at the existing carrying values as they represented a reasonable approximation of the fair value of those items at the Rocky Gap Acquisition date, based on management’s judgment and estimates.
The personal property components of the fixed assets were primarily valued utilizing the market and cost approaches. Certain personal property with an active and identifiable secondary market value were valued using the market approach. This property included, but was not limited to, certain gaming/slot equipment, information and technology equipment and vehicles. The cost approach was utilized to value all other personal property. The cost approach estimates fair value as the current cost of replacing or reproducing the utility of an asset, or group of assets and adjusting it for any depreciation resulting from one or more of the following: physical deterioration, functional obsolescence, and/or economic obsolescence.
The real estate assets that were sold to VICI PropCo and leased back to the Company were adjusted to fair value concurrently with the Rocky Gap Acquisition. The fair value was determined utilizing the direct capitalization method of the income approach. The fair value of the acquired real estate assets was determined to be $203.9 million. The income approach incorporates all tangible and intangible property and served as a ceiling for the fair values of the acquired assets of the ongoing business enterprise, while still taking into account the premise of highest and best use.
The fair value of the customer relationships from the player’s club list was valued using the incremental cash flow method under the income approach. The incremental cash flow method is used to estimate the fair value of an intangible asset based on a residual cash flow notion. This method measures the benefits (e.g., cash flows) derived from ownership of an acquired intangible asset as if
it were in place, as compared to the acquirer’s expected cash flows as if the intangible asset were not in place (i.e., with-and-without). The present value difference in the two cash flow streams is ascribable to the intangible asset. The Company has assigned a 10 year useful life to the player loyalty program based on estimated revenue attrition among the player’s club members, based on historical operations as estimated by management.
The fair value of the Rocky Gap trademark was valued using the relief from royalty method. The relief from royalty method presumes that, without ownership of the asset, the Company would have to make a stream of payments to a brand or franchise owner in return for the right to use their name. By virtue of this asset, the Company avoids any such payments and records the related intangible value of the trademark. The primary assumptions in the valuation included projected revenue, a pre-tax royalty rate, the trademark’s useful life, and tax expense. The Company has assigned the Rocky Gap trademark a 10 year useful life after considering, among other things, the expected use of the asset, the expected useful life of other related assets or asset groups, any legal, regulatory, or contractual provisions that may limit the useful life, the effects of obsolescence, demand and other economic factors, and the maintenance expenditures required to promote and support the trademark.
Details of the Rocky Gap Acquisition in the table below are based on estimated fair values of assets and liabilities as of July 25, 2023. The Rocky Gap Acquisition was accounted for using the acquisition method of accounting. Assets acquired and liabilities assumed in connection with the Rocky Gap Acquisition have been recorded at their preliminary fair values. Certain estimated values for the Rocky Gap Acquisition for accrued liabilities, property and equipment, intangible assets, and deferred income taxes are not yet finalized pending the final purchase price allocations and the receipt of additional information from the Rocky Gap. As a result, the Company’s estimates and assumptions are subject to change within the measurement period as valuations are finalized. The Company expects to finalize the allocation of the purchase price within one year of the Rocky Gap Acquisition date.
|
|
|
|
Amounts in thousands |
|
|
Cash |
| $ | 6,653 |
Receivables |
|
| 79 |
Prepaid expenses |
|
| 876 |
Inventories |
|
| 724 |
Other current assets |
|
| 33 |
Property and equipment |
|
| 209,764 |
Leased right-of-use assets |
|
| 3,441 |
Intangible assets |
|
| 23,290 |
Deposits and other |
|
| 37 |
Accounts payable |
|
| (611) |
Accrued liabilities |
|
| (2,564) |
Accrued payroll |
|
| (1,393) |
Taxes payable |
|
| (202) |
Operating lease liabilities |
|
| (3,441) |
Finance lease liabilities |
|
| (203,925) |
Net identifiable assets acquired |
|
| 32,761 |
Add: Goodwill |
|
| 26,473 |
Net assets acquired |
| $ | 59,234 |
The following table details the purchase consideration net cash outflow.
|
|
|
|
Amounts in thousands |
|
|
|
Outflow of cash to acquire subsidiaries, net of cash acquired |
|
|
|
Cash consideration |
| $ | 56,075 |
Working capital adjustments |
|
| 3,159 |
Less: Cash balances acquired |
|
| (6,653) |
Net cash used in investing activities |
| $ | 52,581 |
Acquisition-related costs
The Company incurred acquisition costs of approximately $3.9 million and $0.6 million for the years ended December 31, 2023 and 2022, respectively, in connection with the Rocky Gap Acquisition. These costs include investment banking, legal and accounting fees and have been recorded as general and administrative expenses in the Corporate and Other reportable segment.
Ancillary Agreements
In connection with the Rocky Gap Acquisition, the Company and the sellers entered into a consulting agreement dated July 25, 2023, whereby the sellers agreed to provide the Company with certain transitional services following the Rocky Gap Acquisition.
The agreement compensates the sellers for services following the Rocky Gap Acquisition as performed by employees at a monthly rate. Fees incurred under the agreement were $0.1 million for the year ended December 31, 2023 and were recorded as general and administrative expenses in the United States segment. The agreement ended on October 8, 2023.
Acquisition-Related Contingencies
Rocky Gap is party to various legal and administrative proceedings, which have arisen in the normal course of business and relate to underlying events that occurred on or before the July 25, 2023 closing of the Rocky Gap Acquisition. Estimated losses have been accrued as of the Rocky Gap Acquisition date for these proceedings in accordance with ASC Topic 450, which requires that an amount be accrued if the loss is probable and can be estimated. The Company estimated the range of these contingencies to be between $0.1 million and $0.2 million as of December 31, 2023.
Pro forma results (Unaudited)
The following table provides unaudited pro forma information of the Company as if the Nugget Acquisition and the Rocky Gap Acquisition had occurred at the beginning of the earliest comparable period presented. The unaudited pro forma financial results include adjustments for transaction-related costs that are directly attributable to the Nugget Acquisition and Rocky Gap Acquisition for the years ended December 31, 2023 and 2022 including (i) pro forma adjustments to record the removal of interest expense related to the Macquarie Credit Agreement (see Note 6), (ii) pro forma adjustments to record interest expense related to the Goldman Credit Agreement, borrowing of the Revolving Facility, and interest on the VICI PropCo financing obligation under the Master Lease, (iii) pro forma adjustments to record depreciation and amortization for assets acquired in the Nugget Acquisition and the Rocky Gap Acquisition, (iv) an estimated tax impact, and (v) pro forma adjustments to record Smooth Bourbon as a consolidated subsidiary as of January 1, 2022. This pro forma information is not necessarily indicative either of the combined results of operations that actually would have been realized had the acquisitions been consummated during the periods for which the pro forma information is presented, or of future results. For the purposes of this table, financial information has been provided through December 31, 2023 for Nugget, Rocky Gap and the Company.
|
|
|
|
|
|
|
|
| For the year ended |
|
| December 31, |
Amounts in thousands, except for per share information |
| 2023 |
| 2022 |
Net operating revenue |
| $ | 608,776 |
| $ | 607,651 |
Net (loss) earnings attributable to Century Casinos, Inc. shareholders |
| $ | (36,349) |
| $ | 15,564 |
Equity Investment – Smooth Bourbon
The Company purchased membership interests in Smooth Bourbon on April 1, 2022. The Company began consolidating Smooth Bourbon on April 3, 2023 after the Nugget Acquisition and therefore no longer reports its interest in Smooth Bourbon as an equity investment. Following is summarized financial information regarding Smooth Bourbon as offor the years ended December 31, 2023 and 2022:
|
|
|
|
|
|
|
|
|
| For the year ended |
| For the year ended |
Amounts in thousands |
| December 31, 2022 |
| December 31, 2023 |
| December 31, 2022 |
Operating Results |
|
|
|
|
|
|
|
|
|
Net operating revenue |
| $ | 11,501 |
| $ | 4,059 |
| $ | 11,501 |
Earnings from continuing operations |
| $ | 11,219 |
| $ | 3,833 |
| $ | 11,219 |
Net earnings |
| $ | 6,497 |
| $ | 2,241 |
| $ | 6,497 |
Net earnings attributable to Century Casinos, Inc. |
| $ | 3,249 |
| $ | 1,121 |
| $ | 3,249 |
The Company’s maximum exposure to losses at December 31, 2022 was $93.3 million, the value of its equity investment in Smooth Bourbon.
Changes in the carrying amount of the investment in Smooth Bourbon for the yearyears ended December 31, 2023 and 2022 are presented in the table below.
|
|
|
|
|
|
|
|
|
|
|
|
|
|
|
|
|
|
|
Amounts in thousands |
|
| Balance at
January 1, 2023 |
|
| Acquisition |
|
| Equity Earnings |
|
| Dividend |
|
| Conversion to Consolidated Subsidiary |
|
| Balance at
December 31, 2023 |
Smooth Bourbon |
| $ | 93,260 |
| $ | — |
| $ | 1,121 |
| $ | (2,256) |
| $ | (92,125) |
| $ | — |
|
|
|
|
|
|
|
|
|
|
|
|
|
|
|
|
|
|
|
Amounts in thousands |
|
| Balance at January 1, 2022 |
|
| Acquisition |
|
| Equity Earnings |
|
| Dividend |
|
| Conversion to Consolidated Subsidiary |
|
| Balance at
December 31, 2022 |
Smooth Bourbon |
| $ | — |
| $ | 95,000 |
| $ | 3,249 |
| $ | (4,989) |
| $ | — |
| $ | 93,260 |
|
|
|
|
|
|
|
|
|
|
|
|
|
|
|
|
Amounts in thousands |
|
| Balance at
January 1, 2022 |
|
| Acquisition |
|
| Equity Earnings |
|
| Dividend |
|
| Balance at
December 31, 2022 |
Smooth Bourbon |
| $ | — |
| $ | 95,000 |
| $ | 3,249 |
| $ | (4,989) |
| $ | 93,260 |
4. PROPERTY AND EQUIPMENT
Property and equipment at December 31, 20222023 and 20212022 consisted of the following:
|
|
|
|
|
|
|
|
|
|
|
|
|
|
|
|
|
|
|
| December 31, |
| December 31, |
Amounts in thousands |
| 2022 |
| 2021 |
| 2023 |
| 2022 |
Land |
| $ | 43,654 |
| $ | 49,948 |
| $ | 44,662 |
| $ | 43,654 |
Buildings and improvements |
| 436,207 |
| 450,280 |
| 839,793 |
| 436,207 |
Gaming equipment |
| 43,590 |
| 41,523 |
| 57,750 |
| 43,590 |
Furniture and non-gaming equipment |
| 47,166 |
| 46,896 |
| 75,499 |
| 47,166 |
Property and equipment held under finance leases (Note 9) |
| 764 |
| 424 |
| 1,028 |
| 764 |
Capital projects in process |
|
| 18,954 |
|
| 4,086 |
|
| 53,072 |
|
| 18,954 |
|
| $ | 590,335 |
| $ | 593,157 |
| $ | 1,071,804 |
| $ | 590,335 |
Less: accumulated depreciation |
| (125,685) |
| (112,433) |
| (158,243) |
| (125,685) |
Less: assets held for sale |
|
| — |
|
| (8,422) | |
Property and equipment, net |
| $ | 464,650 |
| $ | 472,302 |
| $ | 913,561 |
| $ | 464,650 |
|
|
|
|
|
|
|
|
|
|
|
|
|
Depreciation expense was $34.2 million, $23.5 million $23.1 million and $22.9$23.1 million for the years ended December 31, 2023, 2022 2021 and 2020,2021, respectively. No long-lived asset impairment charges were recorded for the years ended December 31, 2023, 2022 2021 and 2020.
In December 2020, the Company began to market the sale of the land and building that it owned in Calgary, Alberta, Canada. The Company recorded assets held for sale that included $4.8 million in land and $3.6 million in building and improvements, net of accumulated depreciation as of December 31, 2021. In February 2022, the Company sold the land and building. Until the sale, the Company operated Century Sports from this location and leased a portion of the land and building.
5. GOODWILL AND INTANGIBLE ASSETS
Goodwill
Goodwill represents the future economic benefits of a business combination to the extent that the purchase price exceeds the fair value of the net identified tangible and intangible assets acquired and liabilities assumed. The Company determines the estimated fair value of the net identified tangible and intangible assets acquired and liabilities assumed after review and consideration of relevant information including discounted cash flows, quoted market prices, and estimates made by management.
The Company tests goodwill for impairment as of October 1 each year, or more frequently as circumstances indicate it is necessary. Testing compares the estimated fair values of the reporting units to the reporting units’ carrying values. The reportable segments with goodwill balances as of December 31, 20222023 included the United States, Canada and Poland. For the quantitative goodwill impairment test, the current fair value of each reporting unit with goodwill balances is estimated using a combination of (i) the income approach using the discounted cash flow method for projected revenue, EBITDAEBITDAR and working capital, (ii) the market approach observing the price at which comparable companies or shares of comparable companies are bought or sold, and (iii) fair value measurements using either quoted market price or an estimate of fair value using a present value technique. The cost approach, estimating the cost of reproduction or replacement of an asset, was considered but not used because it does not adequately capture an operating company’s intangible value. If the carrying value of a reporting unit exceeds its estimated fair value, the Company will recognize an impairment for the amount by which the carrying value exceeds the reporting unit’s fair value. The impairment analysis requires management to make estimates about future operating results, valuation multiples and discount rates and assumptions based on historical data and consideration of future market conditions. Changes in the assumptions can materially affect these estimates. Given the uncertainty inherent in any projection, actual results may differ from the estimates and assumptions used, or conditions may change, which could result in additional impairment charges in the future. Such impairments could be material.
Changes in the carrying value of goodwill related to the United States, Canada and Poland segments are as follows:
|
|
|
|
|
|
|
|
|
|
|
|
|
Amounts in thousands |
| United States |
| Canada |
| Poland |
| Total |
Gross carrying value January 1, 2022 |
| $ | 19,786 |
| $ | 7,402 |
| $ | 6,320 |
| $ | 33,508 |
Currency translation |
|
| — |
|
| (260) |
|
| (504) |
|
| (764) |
Gross carrying value December 31, 2022 |
|
| 19,786 |
|
| 7,142 |
|
| 5,816 |
|
| 32,744 |
Acquisitions |
|
| 70,189 |
|
| — |
|
| — |
|
| 70,189 |
Currency translation |
|
| — |
|
| 91 |
|
| 720 |
|
| 811 |
Gross carrying value December 31, 2023 |
|
| 89,975 |
|
| 7,233 |
|
| 6,536 |
|
| 103,744 |
|
|
|
|
|
|
|
|
|
|
|
|
|
Accumulated impairment losses January 1, 2022 |
|
| (19,786) |
|
| (3,375) |
|
| — |
|
| (23,161) |
Accumulated impairment losses December 31, 2022 |
|
| (19,786) |
|
| (3,375) |
|
| — |
|
| (23,161) |
Accumulated impairment losses December 31, 2023 |
|
| (19,786) |
|
| (3,375) |
|
| — |
|
| (23,161) |
|
|
|
|
|
|
|
|
|
|
|
|
|
Net carrying value at December 31, 2022 |
| $ | — |
| $ | 3,767 |
| $ | 5,816 |
| $ | 9,583 |
Net carrying value at December 31, 2023 |
| $ | 70,189 |
| $ | 3,858 |
| $ | 6,536 |
| $ | 80,583 |
Intangible Assets
The Company tests its indefinite-lived intangible assets as of October 1 each year, or more frequently as circumstances indicate it is necessary. The fair value is determined primarily using the multi-period excess earnings methodology (“MPEEM”) and the relief from royalty method under the income approach.
During the first quarter of 2020, as a result of the COVID-19 pandemic and associated closure of its casinos, the Company concluded these triggering events could indicate possible impairment of its goodwill and indefinite-lived intangible assets. The Company performed a quantitative and qualitative impairment analysis and determined that goodwill and casino licenses related to certain reporting units were impaired. During the second quarter of 2020, the Company paid an additional $1.2 million related to the working capital adjustment for the 2019 Acquisition that resulted in additional goodwill. This amount was subsequently impaired in the same period. The Company recorded $34.1 million to impairment – intangible and tangible assets on its consolidated statement of earnings (loss) for the year ended December 31, 2020 related to the impairment of its goodwill and casino licenses for certain reporting units. The impairment analysis required management to make estimates about future operating results, valuation multiples and discount rates and assumptions based on historical data and consideration of future market conditions. Changes in the assumptions can materially affect these estimates. Given the uncertainty inherent in any projection, heightened by the possibility of additional effects of COVID-19, actual results may differ from the estimates and assumptions used, or conditions may change, which could result in additional impairment charges in the future. Such impairments could be material.
Goodwill
Changes in the carrying value of goodwill related to the United States, Canada and Poland segments are as follows:
|
|
|
|
|
|
|
|
|
|
|
|
|
Amounts in thousands |
| United States |
| Canada |
| Poland |
| Total |
Gross carrying value January 1, 2021 |
| $ | 19,786 |
| $ | 7,385 |
| $ | 6,891 |
| $ | 34,062 |
Currency translation |
|
| — |
|
| 17 |
|
| (571) |
|
| (554) |
Gross carrying value December 31, 2021 |
|
| 19,786 |
|
| 7,402 |
|
| 6,320 |
|
| 33,508 |
Currency translation |
|
| — |
|
| (260) |
|
| (504) |
|
| (764) |
Gross carrying value December 31, 2022 |
|
| 19,786 |
|
| 7,142 |
|
| 5,816 |
|
| 32,744 |
|
|
|
|
|
|
|
|
|
|
|
|
|
Accumulated impairment losses January 1, 2021 |
|
| (19,786) |
|
| (3,375) |
|
| — |
|
| (23,161) |
Accumulated impairment losses December 31, 2021 |
|
| (19,786) |
|
| (3,375) |
|
| — |
|
| (23,161) |
Accumulated impairment losses December 31, 2022 |
|
| (19,786) |
|
| (3,375) |
|
| — |
|
| (23,161) |
|
|
|
|
|
|
|
|
|
|
|
|
|
Net carrying value at December 31, 2021 |
| $ | — |
| $ | 4,027 |
| $ | 6,320 |
| $ | 10,347 |
Net carrying value at December 31, 2022 |
| $ | — |
| $ | 3,767 |
| $ | 5,816 |
| $ | 9,583 |
Intangible Assets
Intangible assets at December 31, 20222023 and 20212022 consisted of the following:
|
|
|
|
|
|
|
|
|
|
| December 31, |
| December 31, |
| December 31, |
| December 31, |
Amounts in thousands |
| 2022 |
| 2021 |
| 2023 |
| 2022 |
Finite-lived |
|
|
|
|
|
|
|
|
Casino licenses |
| $ | 2,672 |
| $ | 2,768 |
| $ | 2,499 |
| $ | 2,672 |
Less: accumulated amortization |
|
| (1,763) |
|
| (1,749) |
|
| (1,417) |
|
| (1,763) |
|
|
| 909 |
|
| 1,019 |
|
| 1,082 |
|
| 909 |
Trademarks |
|
| 2,368 |
|
| 2,368 |
|
| 16,718 |
|
| 2,368 |
Less: accumulated amortization |
|
| (730) |
|
| (494) |
|
| (1,843) |
|
| (730) |
|
|
| 1,638 |
|
| 1,874 |
|
| 14,875 |
|
| 1,638 |
Players club lists |
|
| 20,373 |
|
| 20,373 |
|
| 59,253 |
|
| 20,373 |
Less: accumulated amortization |
|
| (8,974) |
|
| (6,063) |
|
| (14,272) |
|
| (8,974) |
|
|
| 11,399 |
|
| 14,310 |
|
| 44,981 |
|
| 11,399 |
Total finite-lived intangible assets, net |
|
| 13,946 |
|
| 17,203 |
|
| 60,938 |
|
| 13,946 |
Indefinite-lived |
|
|
|
|
|
|
|
|
|
|
|
|
Casino licenses |
| 29,331 |
| 30,112 |
| 30,604 |
| 29,331 |
Trademarks |
|
| 1,494 |
|
| 1,615 |
|
| 1,665 |
|
| 1,494 |
Total indefinite-lived intangible assets |
|
| 30,825 |
|
| 31,727 |
|
| 32,269 |
|
| 30,825 |
Total intangible assets, net |
| $ | 44,771 |
| $ | 48,930 |
| $ | 93,207 |
| $ | 44,771 |
Trademarks
The Company currently owns three trademarks, thefive trademarks: Century Casinos, trademark, the Mountaineer, trademarkNugget, Rocky Gap and the Casinos Poland trademark, whichPoland. The trademarks are reported as intangible assets on the Company’s consolidated balance sheets.
Trademarks: Finite-Lived
The Company has determined that the Mountaineer, trademark,Nugget and Rocky Gap trademarks, all reported in the United States segment, hashave a useful lifelives of ten years after considering, among other things, the expected use of the asset, the expected useful life of other related assets or asset groups, any legal, regulatory, or contractual provisions that may limit the useful life, the effects of obsolescence, demand and other economic factors, and the maintenance expenditures required to promote and support the trade name. The trademarktrademark. As such, the trademarks will be amortized over its useful life. Costs incurred to renew trademarks that are finite-lived are expensed over the renewal period to general and administrative expenses on the Company’s consolidated statementstatements of earnings (loss). earnings.
Changes in the carrying amount of the Mountaineer trademarkUnited States trademarks are as follows:
|
|
|
|
|
|
|
|
|
|
|
|
|
|
|
Amounts in thousands |
| Balance at January 1, 2022 |
| Amortization |
| Balance at December 31, 2022 |
| Balance at
January 1, 2023 |
| Acquisitions |
| Amortization |
| Balance at
December 31, 2023 |
United States |
| $ | 1,874 |
| $ | (236) |
| $ | 1,638 |
| $ | 1,638 |
| $ | 14,350 |
| $ | (1,113) |
| $ | 14,875 |
|
|
|
|
|
|
|
|
|
|
|
|
|
|
|
Amounts in thousands |
| Balance at January 1, 2021 |
| Amortization |
| Balance at December 31, 2021 |
| Balance at January 1, 2022 |
| Acquisitions |
| Amortization |
| Balance at December 31, 2022 |
United States |
| $ | 2,111 |
| $ | (237) |
| $ | 1,874 |
| $ | 1,874 |
| $ | — |
| $ | (236) |
| $ | 1,638 |
As of December 31, 2022,2023, estimated amortization expense for the Mountaineer trademarkUnited States trademarks over the next five years was as follows:
|
|
|
|
|
Amounts in thousands |
|
|
|
|
2023 |
| $ | 237 | |
2024 |
| 237 |
| $ | 1,665 |
2025 |
| 237 |
| 1,665 |
2026 |
| 237 |
| 1,665 |
2027 |
| 237 |
| 1,665 |
2028 | |
| 1,487 |
Thereafter |
|
| 453 |
|
| 6,728 |
|
| $ | 1,638 |
| $ | 14,875 |
The weighted-average amortization period of the Mountaineer trademarkUnited States trademarks is 6.98.3 years.
Trademarks: Indefinite-Lived
The Company has determined the Casinos Poland trademark, reported in the Poland segment, and the Century Casinos trademark, reported in the Corporate and Other segment, have indefinite useful lives and therefore the Company does not amortize these trademarks. Costs incurred to renew trademarks that are indefinite-lived are expensed over the renewal period as general and administrative expenses on the Company’s consolidated statement of earnings (loss). earnings.
Changes in the carrying amount of the indefinite-lived trademarks are as follows:
|
|
|
|
|
|
|
|
|
|
|
|
|
Amounts in thousands |
| Balance at January 1, 2022 |
| Currency translation |
| Balance at December 31, 2022 |
| Balance at January 1, 2023 |
| Currency translation |
| Balance at December 31, 2023 |
Poland |
| $ | 1,507 |
| $ | (121) |
| $ | 1,386 |
| $ | 1,386 |
| $ | 171 |
| $ | 1,557 |
Corporate and Other |
|
| 108 |
|
| — |
|
| 108 |
|
| 108 |
|
| — |
|
| 108 |
|
| $ | 1,615 |
| $ | (121) |
| $ | 1,494 |
| $ | 1,494 |
| $ | 171 |
| $ | 1,665 |
|
|
|
|
|
|
|
|
|
|
|
|
|
|
|
|
|
|
|
Amounts in thousands |
| Balance at January 1, 2021 |
| Currency translation |
| Balance at December 31, 2021 |
| Balance at January 1, 2022 |
| Currency translation |
| Balance at December 31, 2022 |
Poland |
| $ | 1,643 |
| $ | (136) |
| $ | 1,507 |
| $ | 1,507 |
| $ | (121) |
| $ | 1,386 |
Corporate and Other |
|
| 108 |
|
| — |
|
| 108 |
|
| 108 |
|
| — |
|
| 108 |
|
| $ | 1,751 |
| $ | (136) |
| $ | 1,615 |
| $ | 1,615 |
| $ | (121) |
| $ | 1,494 |
Casino Licenses: Finite-Lived
As of December 31, 2022,2023, Casinos Poland had eightsix casino licenses, each with an original term of six years, which are reported as finite-lived intangible assets and are amortized over their respective useful lives.
Changes in the carrying amount of the Casinos Poland licenses are as follows:
|
|
|
|
|
|
|
|
|
|
|
|
|
|
|
|
|
|
|
|
|
Amounts in thousands |
| Balance at January 1, 2022 |
| New Casino License |
| Amortization |
| Currency translation |
| Balance at
December 31, 2022 |
| Balance at January 1, 2023 |
| New Casino License |
| Amortization |
| Currency translation |
| Balance at December 31, 2023 |
Poland |
| $ | 1,019 |
| $ | 390 |
| $ | (443) |
| $ | (57) |
| $ | 909 |
| $ | 909 |
| $ | 537 |
| $ | (444) |
| $ | 80 |
| $ | 1,082 |
|
|
|
|
|
|
|
|
|
|
|
|
|
|
|
|
|
|
|
|
|
Amounts in thousands |
| Balance at January 1, 2021 |
| New Casino License |
| Amortization |
| Currency translation |
| Balance at December 31, 2021 |
| Balance at January 1, 2022 |
| New Casino License |
| Amortization |
| Currency translation |
| Balance at December 31, 2022 |
Poland |
| $ | 1,615 |
| $ | — |
| $ | (485) |
| $ | (111) |
| $ | 1,019 |
| $ | 1,019 |
| $ | 390 |
| $ | (443) |
| $ | (57) |
| $ | 909 |
As of December 31, 2022,2023, estimated amortization expense for the Casinos PolandCPL casino licenses over the next five years was as follows:
|
|
|
|
|
Amounts in thousands |
|
|
|
|
2023 |
| $ | 407 | |
2024 |
| 215 |
| $ | 331 |
2025 |
| 95 |
| 196 |
2026 |
| 70 |
| 168 |
2027 |
| 70 |
| 168 |
2028 | |
| 129 |
Thereafter |
|
| 52 |
|
| 90 |
|
| $ | 909 |
| $ | 1,082 |
These estimates do not reflect the impact of future foreign exchange rate changes or the continuation of the licenses following their expiration. The weighted average period before the next license expiration is 1.92.3 years. In Poland, casino gaming licenses are granted for a term of six years and are not renewable. Once a gaming license has expired, any gaming company can apply for the license.
Casino Licenses: Indefinite-Lived
The Company has determined that the casino licenses held in the United States segment from the Missouri Gaming Commission, and the West Virginia Lottery Commission and the Nevada Gaming Commission (held by Smooth Bourbon) and those held in the Canada segment from the AGLC and the HRA are indefinite-lived. Costs incurred to renew licenses that are indefinite-lived are expensed over the renewal period to general and administrative expenses on the Company’s consolidated statementstatements of earnings (loss). earnings. Changes in the carrying amount of the licenses are as follows:
|
|
|
|
|
|
|
|
|
|
|
|
|
Amounts in thousands |
|
| Balance at
January 1, 2023 |
|
| Consolidation of Smooth Bourbon |
|
| Currency translation |
|
| Balance at
December 31, 2023 |
United States |
| $ | 17,962 |
| $ | 1,000 |
| $ | — |
| $ | 18,962 |
Canada |
|
| 11,369 |
|
| — |
|
| 273 |
|
| 11,642 |
|
| $ | 29,331 |
| $ | 1,000 |
| $ | 273 |
| $ | 30,604 |
|
|
|
|
|
|
|
|
|
|
|
|
|
Amounts in thousands |
|
| Balance at January 1, 2022 |
|
| Consolidation of Smooth Bourbon |
|
| Currency translation |
|
| Balance at
December 31, 2022 |
United States |
| $ | 17,962 |
| $ | — |
| $ | — |
| $ | 17,962 |
Canada |
|
| 12,150 |
|
| — |
|
| (781) |
|
| 11,369 |
|
| $ | 30,112 |
| $ | — |
| $ | (781) |
| $ | 29,331 |
|
|
|
|
|
|
|
|
|
|
Amounts in thousands |
|
| Balance at
January 1, 2022 |
|
| Currency translation |
|
| Balance at
December 31, 2022 |
United States |
| $ | 17,962 |
| $ | — |
| $ | 17,962 |
Canada |
|
| 12,150 |
|
| (781) |
|
| 11,369 |
|
| $ | 30,112 |
| $ | (781) |
| $ | 29,331 |
|
|
|
|
|
|
|
|
|
|
Amounts in thousands |
|
| Balance at January 1, 2021 |
|
| Currency translation |
|
| Balance at
December 31, 2021 |
United States |
| $ | 17,962 |
| $ | — |
| $ | 17,962 |
Canada |
|
| 12,099 |
|
| 51 |
|
| 12,150 |
|
| $ | 30,061 |
| $ | 51 |
| $ | 30,112 |
Player’s Club Lists
The Company has determined that the player’s club lists, reported in the United States segment, have a useful life of seven to 10 years based on estimated revenue attrition among the player’s club members as estimated by management over each property’s historical operations as estimated by management. TheAs such, the player’s club lists will be amortized over their useful lives. Changes in the carrying amount of the player’s club lists are as follows:
|
|
|
|
|
|
|
|
|
|
|
|
|
|
|
Amounts in thousands |
| Balance at January 1, 2022 |
| Amortization |
| Balance at December 31, 2022 |
| Balance at
January 1, 2023 |
| Acquisitions |
| Amortization |
| Balance at
December 31, 2023 |
United States |
| $ | 14,310 |
| $ | (2,911) |
| $ | 11,399 |
| $ | 11,399 |
| $ | 38,880 |
| $ | (5,298) |
| $ | 44,981 |
|
|
|
|
|
|
|
|
|
|
|
|
|
|
|
Amounts in thousands |
| Balance at January 1, 2021 |
| Amortization |
| Balance at December 31, 2021 |
| Balance at January 1, 2022 |
| Acquisitions |
| Amortization |
| Balance at December 31, 2022 |
United States |
| $ | 17,220 |
| $ | (2,910) |
| $ | 14,310 |
| $ | 14,310 |
| $ | — |
| $ | (2,911) |
| $ | 11,399 |
As of December 31, 2022,2023, estimated amortization expense for the player’s club lists over the next five years was as follows:
|
|
|
|
|
Amounts in thousands |
|
|
|
|
2023 |
| $ | 2,910 | |
2024 |
| 2,910 |
| $ | 6,774 |
2025 |
| 2,910 |
| 6,799 |
2026 |
| 2,669 |
| 6,556 |
2027 | |
| 3,888 |
2028 | |
| 3,888 |
Thereafter | |
|
| 17,076 |
|
| $ | 11,399 |
| $ | 44,981 |
The weighted-average amortization period for the player’s club lists is 3.95.5 years.
6. LONG-TERM DEBT
Long-term debt and the weighted average interest rates at December 31, 20222023 and 20212022 consisted of the following:
|
|
|
|
|
|
|
|
|
|
|
|
|
|
|
|
|
|
|
|
|
|
|
|
|
|
|
|
|
|
|
|
|
|
Amounts in thousands |
| December 31, 2022 |
| December 31, 2021 |
| December 31, 2023 |
| December 31, 2022 |
Credit agreement - Goldman |
| $ | 347,375 |
| 8.45% |
| $ | — |
| — |
| $ | 343,875 |
| 11.44% |
| $ | 347,375 |
| 8.45% |
Credit agreement - Macquarie |
| — |
| — |
|
| 166,600 |
| 6.70% | |
Credit agreement - CPL |
| — |
|
| — |
|
| 207 |
| 2.12% | |
UniCredit term loans |
| 4,661 |
|
| 3.17% |
|
| 6,994 |
| 2.55% | |
UniCredit term loan | |
| 2,954 |
|
| 3.21% |
|
| 4,661 |
| 3.17% |
Financing obligation - CDR land lease |
|
| 14,388 |
|
| 15.05% |
|
| 15,378 |
| 11.44% |
|
| — |
|
| — |
|
| 14,388 |
| 15.05% |
Total principal |
| $ | 366,424 |
|
| 8.72% |
| $ | 189,179 |
| 6.89% |
| $ | 346,829 |
|
| 10.89% |
| $ | 366,424 |
| 8.72% |
Deferred financing costs |
|
| (16,844) |
|
|
|
|
| (7,695) |
|
|
|
| (14,149) |
|
|
|
|
| (16,844) |
|
|
Total long-term debt |
| $ | 349,580 |
|
|
|
| $ | 181,484 |
|
|
| $ | 332,680 |
|
|
|
| $ | 349,580 |
|
|
Less current portion |
|
| (5,322) |
|
|
|
|
| (3,958) |
|
|
|
| (8,468) |
|
|
|
|
| (5,322) |
|
|
Long-term portion |
| $ | 344,258 |
|
|
|
| $ | 177,526 |
|
|
| $ | 324,212 |
|
|
|
| $ | 344,258 |
|
|
|
|
|
|
|
|
|
|
|
|
|
|
|
|
|
|
|
|
|
|
|
Goldman Credit Agreement
On April 1, 2022, the Company entered into a Credit Agreement (the “Goldman Credit Agreement”) by and among the Company, as borrower, the subsidiary guarantors party thereto, Goldman Sachs Bank USA, as administrative agent and collateral agent, Goldman Sachs Bank USA and BOFA Securities, Inc., as joint lead arrangers and joint bookrunners, and the Lenders and L/C Lenders party thereto. The Goldman Credit Agreement replacesreplaced the Macquarie Credit Agreement discussed below. The Goldman Credit Agreement provides for a $350.0 million term loan (the “Term Loan”)Goldman Term Loan and a $30.0 million revolving credit facility (the “Revolving Facility”).Revolving Facility. As of December 31, 2022,2023, the outstanding balance of the Goldman Term Loan was $347.4$343.9 million and the Company had $30.0 million available to borrow on the Revolving Facility. The Company used the Goldman Credit AgreementTerm Loan to fund the PropCoNugget Acquisition (including the Acquisition Escrow), for the repayment of approximately $166.2 million outstanding under the Macquarie Credit Agreement to fund the Acquisition Escrow and for related fees and expenses. The Company borrowed $30.0 million from the Revolving Facility on July 20, 2023 to fund the Rocky Gap Acquisition, and repaid the full amount of this borrowing on September 21, 2023.
The Goldman Term Loan matures on April 1, 2029, and the Revolving Facility matures on April 1, 2027. The Revolving Facility includes up to $10.0 million available for the issuance of letters of credit. The Goldman Term Loan requires scheduled quarterly
payments of $875,000 equal to 0.25% of the original aggregate principal amount of the Goldman Term Loan, with the balance due at maturity. The Company repurchased approximately $3.5 million principal amount of the Goldman Term Loan for 97% of its value in February 2024.
Borrowings under the Goldman Credit Agreement bear interest at a rate equal to, at the Company’s option, either (a) the Adjusted Term SOFR (as defined in the Goldman Credit Agreement), plus an applicable margin (each loan, being a “SOFR Loan”) or (b) the ABR (as defined in the Goldman Credit Agreement), plus an applicable margin (each loan, being a “ABR Loan”). The applicable margin for the Goldman Term Loan is 6.00% per annum with respect to SOFR Loans and 5.00% per annum with respect to ABR Loans. The applicable margin for loans under the Revolving Facility (“Revolving Loans”) is (1) so long as the Consolidated First Lien Net Leverage Ratio (as defined in the Goldman Credit Agreement) of the Company is greater than 2.75 to 1.00, the applicable margin for Revolving Loans that are SOFR Loans will be 5.25% per annum, and for Revolving Loans that are ABR Loans will be 4.25% per annum; (2) so long as the Consolidated First Lien Net Leverage Ratio of the Company is less than or equal to 2.75 to 1.00 but greater than 2.25 to 1.00, the applicable margin for Revolving Loans that are SOFR Loans will be 5.00% per annum, and for Revolving Loans that are ABR Loans will be 4.00% per annum; and (3) so long as the Consolidated First Lien Net Leverage Ratio of the Company is less than or equal to 2.25 to 1.00, the applicable margin for Revolving Loans that are SOFR Loans will be 4.75% per annum, and for Revolving Loans that are ABR Loans will be 3.75% per annum.
In addition, on a quarterly basis, the Company is required to pay each lender under the Revolving Facility a commitment fee in respect of any unused commitments under the Revolving Facility at a per annum rate of 0.50% of the principal amount of unused commitments of such lender, subject to a stepdown to 0.375% based upon the Company’s Consolidated First Lien Net Leverage Ratio. The Company is also required to pay letter of credit fees equal to the applicable margin then in effect for SOFR Loans that are Revolving Loans multiplied by the average daily maximum aggregate amount available to be drawn under all letters of credit, plus such letter of credit issuer’s customary documentary and processing fees and charges and a fronting fee in an amount equal to 0.125% of the face amount of such letter of credit. The Company is also required to pay customary agency fees. Fees related to the Goldman Credit Agreement of $0.1 million were recorded as interest expense in the consolidated statements of (loss) earnings (loss) for the yearyears ended December 31, 2023 and 2022.
The Goldman Credit Agreement requires the Company to prepay the Goldman Term Loan, subject to certain exceptions, with:
• 100% of the net cash proceeds of certain non-ordinary course asset sales or certain casualty events, subject to certain exceptions; and
• 50% of the Company’s annual Excess Cash Flow (as defined in the Goldman Credit Agreement) (which percentage will be reduced to 25% if the Consolidated First Lien Net Leverage Ratio is greater than 2.25 to 1.00 but less than or equal to 2.75 to 1.00, and to 0% if the Consolidated First Lien Net Leverage Ratio is less than or equal to 2.25 to 1.00); and
• 100% of the funds in the Acquisition Escrow if the OpCo Acquisition does not occur..
The Goldman Credit Agreement provides that the Goldman Term Loan may be prepaid subject towithout a prepayment premium in an amount equal to 1.00% of the principal amount of the Term Loan if such event occurs on or before April 1, 2023. This premium does not apply if there is a mandatory prepayment with respect to the Acquisition Escrow.penalties.
The borrowings under the Goldman Credit Agreement are guaranteed by the material subsidiaries of the Company, subject to certain exceptions (including the exclusion of the Company’s non-domestic subsidiaries), and are secured by a pledge (and, with respect to real property, mortgage) of substantially all of the existing and future property and assets of the Company and the guarantors, subject to certain exceptions.
The Goldman Credit Agreement contains customary representations and warranties, affirmative, negative and financial covenants, and events of default. All future borrowings under the Goldman Credit Agreement are subject to the satisfaction of customary conditions, including the absence of a default and the accuracy of representations and warranties. The Company was in compliance with all applicable financial covenants under the Goldman Credit Agreement as of December 31, 2022.2023.
Deferred financing costs consist of the Company’s costs related to financings. The Company recognized $18.9 million in deferred financing costs related to the Goldman Credit Agreement for the year ended December 31, 2022. Amortization expenses relating to the Goldman Credit Agreement were $2.7 million and $2.0 million for the yearyears ended December 31, 2022.2023 and 2022 respectively. These costs are included in interest expense in the consolidated statement of (loss) earnings (loss) for the yearyears ended December 31, 2022.2023 and 2022, respectively.
Credit Agreement – Macquarie Capital
In December 2019, the Company entered into a $180.0 million credit agreement (the “Macquarie Credit Agreement”) with Macquarie Capital Funding LLC, as swingline lender, administrative agent and collateral agent, Macquarie Capital (USA) Inc., as sole lead arranger and sole bookrunner, and the Lenders and L/C Lenders party thereto. The Macquarie Credit Agreement replaced the Company’s credit agreement with the Bank of Montreal (the “BMO Credit Agreement”). The Macquarie Credit Agreement provided for a $170.0 million term loan (the “Macquarie Term Loan”) and a $10.0 million Revolving Facility (the “Macquarie
“Macquarie Revolving Facility”). The Macquarie Revolving Facility included up to $5.0 million available for the issuance of letters of credit. The Company used proceeds from the Macquarie Term Loan to fund the 2019 Acquisition, for the repayment of approximately $52.0 million outstanding under the BMO Credit Agreement and for general working capital and corporate purposes. In March 2020, the Company drew $9.95 million on the Macquarie Revolving Facility. The Macquarie Revolving Facility was repaid in July 2020 except for a $50,000 letter of credit that was repaid in May 2021. In connection with the Goldman Credit Agreement, the Macquarie Term Loan was repaid on April 1, 2022 and the Macquarie Credit Agreement was terminated.
Commitment fees related to the Macquarie Revolving Facility of less than $0.1 million were recorded as interest expense in the consolidated statementstatements of (loss) earnings (loss) for the years ended December 31, 2022 2021 and 2020.2021. The Company amortized $0.4 million, $1.6 million and $1.6 million for the years ended December 31, 2022 2021 and 2020,2021, respectively. These costs are included inwere recorded as interest expense in the consolidated statements of (loss) earnings (loss) for the years ended December 31, 2022 2021 and 2020.2021. The Company wrote off approximately $7.3 million of deferred financing costs to interest expense in the second quarter of 2022 in connection with the prepayment of the Macquarie Term Loan.
Casinos Poland
CPL’s short-term line of credit with Alior Bank ended in April 2020. The line of credit bore an interest rate of three-month Warsaw Interbank Offered Rate (“WIBOR”) plus 1.55%. CPL’s PLN 3.0 million term loan and PLN 4.0 million term loan with mBank were paid in full in November 2021. The term loans bore an interest rate of 1-month WIBOR plus 1.70%. CPL’sCPL previously had a PLN 2.5 million term loan with mBank S.A. (“mBank”) that was paid in full in September 2022. The term loan bore an interest rate of 1-month WIBOR plus 1.90%. CPL's PLN 10.0 million short-term line of credit was amended on April 22, 2022, and the PLN 2.5 million that was available for cash borrowing was removed from the line of credit. The short-term line of credit was terminated in October 2022.
As of December 31, 2022,2023, CPL had a short-term line of credit with mBank used to finance current operations. The line of credit bears an interest rate of overnight WIBOR plus 2.00% with a borrowing capacity of PLN 5.0 million and is available through April 27, 2023.June 4, 2024. As of December 31, 2022,2023, the credit facility had no outstanding balance and approximately PLN 5.0 million ($1.11.3 million based on the exchange rate in effect on December 31, 2022)2023) was available for borrowing. The credit agreement is secured by a building owned by CPL in Warsaw. The credit facility contains a number of covenants applicable to CPL, including covenants that require CPL to maintain certain liquidity and liability to asset ratios.
Under Polish gaming law, CPL is required to maintain PLN 3.6 million in the form of deposits or bank guarantees for payment of casino jackpots and gaming tax obligations. mBank issued guarantees to CPL for this purpose totaling PLN 3.6 million ($0.80.9 million based on the exchange rate in effect as of December 31, 2022)2023). The mBank guarantees are secured by land owned by CPL in Kolbaskowo, Poland as well as a deposit of PLN 1.2 million ($0.3 million based on the exchange rate in effect as of December 31, 2022)2023) with mBank and terminate in June 2024 and January 2026, respectively. CPL is also required to maintain deposits or provide bank guarantees for payment of additional prizes and giveaways at the casinos. The amount of these deposits varies depending on the value of the prizes. CPL maintained PLN 0.7 million ($0.2 million based on the exchange rate in effect as of December 31, 2022)2023) in deposits for this purpose as of December 31, 2022.2023. These deposits are included in deposits and other on the Company’s consolidated balance sheet for the year ended December 31, 2022.2023.
Century Resorts Management
As of December 31, 2022, CRM previously had two credit agreements with UniCredit (the “UniCredit Term Loans”).
The first credit agreement (“UniCredit Term Loan 1”) is a GBP 2.0 million term loan used for construction and fitting out of Century Casino Bath, a casino in Bath, Englandwith UniCredit Bank Austria AG (“UniCredit”) that the Company closed in March 2020. In November 2021, the Company amended the UniCredit Term Loan 1was converted to convert it into a USD term loan beginning December 31,in November 2021. The term loan matureswas paid in full in September 30, 2023 and bearsbore an interest atrate of LIBOR plus 1.625%. If LIBOR is not available, the interest rate will be determined based on a quoted rate from leading banks in the London interbank market.
As of December 31, 2022, the amount outstanding on UniCredit Term Loan 1 was $0.4 million.2023, CRM has no further borrowing availability under the loan agreement. The loan is unsecured and has no financial covenants.
The secondhad a credit agreement (“with UniCredit Term Loan 2”) isoriginally entered into in August 2018 as a $7.4 million line of credit for acquisitions and capital expenditures. The line of credit was converted to a EUR 6.0 million term loan converted from a $7.4 million line of credit in June 2021. In August 2018, CRM entered into a loan agreement with UniCredit for a revolving line of credit to be used for acquisitions and capital expenditures at the Company’s existing operations or new operations.2021 (the “UniCredit Term Loan”). In March 2020, CRM borrowed $7.4 million with a 12 month term under the UniCredit credit agreement. In March 2021, the term of the line of credit was extended to June 2021, when it was converted into UniCredit Term Loan 2. The term loan matures on December 31, 2025 and bears interest at a rate of 2.875%. As of December 31, 2022,2023, the amount outstanding was EUR 4.02.7 million ($4.33.0 million based on the exchange rate in effect on December 31, 2022)2023) and the Company had no further borrowings available. The UniCredit Term Loan 2 is secured by a EUR 6.0 million guarantee by the Company and has no financial covenants.
Century Downs Racetrack and Casino
CDR’sThe Company purchased the land lease is a financing obligationat CDR prior to the Company. Priorits sale to the Company’s acquisition of its ownership interest in CDR, CDR sold a portion of land on which Century Downs is located and then entered into an agreement to lease back a portionVICI PropCo as part of the land sold. The Company accountsCanada Real Estate Sale for the lease using the financing method by accounting for the land subject to lease as an asset and the lease payments as interest on the financing obligation. CAD 29.4 million (Under the land lease, CDR has four options to purchase the land. The first option is on July 1, 2023. Due to the nature of the CDR land lease financing obligation, there are no principal payments due until the Company exercises its option to purchase the land. Lease payments are applied to interest only, and any change in the outstanding balance of the financing obligation relates to foreign currency translation. As of December 31, 2022, the outstanding balance on the financing obligation was CAD 19.5 million ($14.4$21.6 million based on the exchange rate on September 6, 2023). Prior to this purchase, CDR leased the land, which was accounted for as a financing obligation. The Company recorded the loss on debt extinguishment of CAD 9.9 million ($7.3 million based on the exchange rate on September 6, 2023) in effect oninterest expense in the Company’s consolidated statement of (loss) earnings for the year ended December 31, 2022).2023.
As of December 31, 2022,2023, scheduled maturitiesrepayments related to the Company’slong-term debt were as follows:
|
|
|
|
|
|
|
|
|
|
|
|
|
|
|
Amounts in thousands |
| Goldman Credit Agreement |
| UniCredit Term Loans |
| Century Downs
Land Lease |
| Total |
| Goldman Credit Agreement |
| UniCredit Term Loan |
| Total |
2023 |
| $ | 3,500 |
| $ | 1,822 |
| $ | — |
| $ | 5,322 | |
2024 |
| 3,500 |
| 1,420 |
|
| — |
|
| 4,920 |
| $ | 6,991 |
| $ | 1,477 |
| $ | 8,468 |
2025 |
| 3,500 |
| 1,419 |
|
| — |
|
| 4,919 |
| 3,500 |
| 1,477 |
|
| 4,977 |
2026 |
| 3,500 |
| — |
|
| — |
|
| 3,500 |
| 3,500 |
| — |
|
| 3,500 |
2027 |
| 3,500 |
| — |
| — |
| 3,500 |
| 3,500 |
| — |
|
| 3,500 |
2028 | |
| 3,500 |
| — |
| 3,500 |
Thereafter |
|
| 329,875 |
|
| — |
|
| 14,388 |
|
| 344,263 |
|
| 322,884 |
|
| — |
|
| 322,884 |
Total |
| $ | 347,375 |
| $ | 4,661 |
| $ | 14,388 |
| $ | 366,424 |
| $ | 343,875 |
| $ | 2,954 |
| $ | 346,829 |
|
|
|
|
|
|
|
|
|
|
|
|
|
|
|
|
|
|
|
|
|
|
7. LONG-TERM FINANCING OBLIGATION
On December 6, 2019, certain subsidiaries of the Company (collectively, the “Tenant”) and certain subsidiaries of VICI PropCo (collectively, the “Landlord”) entered into thea sale and leaseback transaction forin connection with the 2019 Acquired Casino properties. The Tenantacquisition of the Company’s West Virginia and Missouri properties and entered into the Master Lease with the Landlord to lease the real estate assetsassets. See Note 1 for a list of the 2019 Acquired Casinos. Company’s subsidiaries under the Master Lease.
The Master Lease does not transfer control of the 2019 Acquired Casino properties to VICI Propco subsidiaries. has been modified as follows:
On December 1, 2022, the Master Lease was amended (the “Master Lease Amendment”) to providean amendment provided for certain (i) modifications with respect to certain project work to be done by the Company related to Century Casino Caruthersville, (ii) modifications to rent under the Master Lease to provide for an increase in initial annualized rent by approximately $4.2 million after completion of the Caruthersville casino project and (iii) other related modifications.
On July 25, 2023, an amendment (i) added Rocky Gap to the Master Lease, (ii) increased initial annualized rent by approximately $15.5 million and (iii) extended the initial Master Lease term for 15 years from the date of the amendment (subject to the existing four five year renewal options).
On September 6, 2023, an amendment (i) added the Century Canadian Portfolio to the Master Lease, (ii) increased initial annualized rent by approximately CAD 17.3 million ($13.1 million based on the exchange rate on December 31, 2023) and (iii) extended the initial Master Lease term for 15 years from the date of the amendment (subject to the existing four five year renewal options).
The Master Lease does not transfer control of the properties under the Master Lease to VICI PropCo subsidiaries. The Company accounts for the transaction as a failed sale-leaseback financing obligation. When cash proceeds are exchanged, a failed sale-leaseback financing obligation is equal to the proceeds received for the assets that are sold and then leased back. The value of the failed sale-leaseback financing obligations recognized in this transaction was determined to be the fair value of the leased real estate assets. In subsequent periods, a portion of the periodic payment under the Master Lease will be recognized as interest expense with the remainder of the payment reducing the failed sale-leaseback financing obligation using the effective interest method. The failed sale-leaseback obligations will not be reduced to less than the net book value of the leased real estate assets as of the end of the lease term, which is estimated to be $28.5 million.term.
The fair values of the real estate assets and the related failed sale-leaseback financing obligation were estimated based on the present value of the estimated future payments over the term plus renewal options of 35 years, using the imputed discount rate of approximately 10.2%8.9%. The value of the failed sale-leaseback financing obligation is dependent upon assumptions regarding the amount of the payments and the estimated discount rate of the payments required by a market participant.
The Master Lease provides for the lease of land, buildings, structures and other improvements on the land (including barges and riverboats), easements and similar appurtenances to the land and improvements relating to the operations of the leased properties. The Master Lease has an initial term of 15 years with no purchase option. At the Company’s option, the Master Lease may be extended for up to four five year renewal terms beyond the initial 15 year term. The Company exercised one five year renewal option when the Master Lease was amended on December 1, 2022. The renewal terms are effective as to all, but not less than all, of the property then subject to the Master Lease. The Company does not have the ability to terminate its obligations under the Master Lease prior to its expiration without the Landlord’s consent.
The Master Lease has a triple-net structure, which requires the Tenant to pay substantially all costs associated with the 2019 Acquired CasinoCompany’s properties that are subject to the Master Lease, including real estate taxes, insurance, utilities, maintenance and operating costs. The Master Lease contains certain covenants, including minimum capital improvement expenditures. The Company has provided a guarantee of the Tenant’s obligations under the Master Lease.
The rent payable under the Master Lease as amended on December 1, 2022, is:
An initial annual rent (the “Rent”) of approximately $25.0 million.
The Rent will escalatecurrently escalates at a rate of 1.01% for the 2nd and 3rd years and the greater of either 1.0125% (the “Base Rent Escalator”) or the increase in CPI. The CPI rent escalator for the Consumer Price Index (“CPI”) for each year starting in the 4th year. In addition, Rent will increase by approximately $4.2 million on the “CapEx Project Incremental Rent Increase Date” (as defined in the Master Lease Amendment)Century Canadian Portfolio is capped at 2.5%.
The Base Rent Escalator is subject to adjustment from and after the 6thsixth year if the Minimum Rent Coverage Ratio (as defined in the Master Lease) is not satisfied.
The estimated future payments in the table below include the payments and adjustments to reflect estimated payments as described in the Master Lease, including anthe minimum annual escalator of up to 1.0125%. The estimated future payments in the table below are not adjusted for increases based on the CPI. AnnualCPI or the additional rent related to the Caruthersville casino project that is anticipated to be completed in late 2024. Cash rent payments adjusted for CPI for the year ended December 31, 2023 is2024 are estimated to be $27.5 million, excluding the increased rent due to the Rocky Gap Acquisition.$52.2 million.
Pursuant to a real estate purchase agreement, dated August 24, 2022, between Evitts and VICI PropCo Buyer, VICI PropCo Buyer agreed to acquire the real estate assets relating to Rocky Gap for approximately $203.9 million. In connection with the Rocky Gap Acquisition, the Tenant and Landlord will enter into an amendment to the Master Lease to (i) add Rocky Gap to the Master Lease, (ii) provide for an initial annual rent for Rocky Gap of approximately $15.5 million and (iii) extend the initial Master Lease term for 15 years from the date of the amendment (subject to the existing four five year renewal options).
|
|
|
|
Amounts in thousands |
|
|
|
2024 |
| $ | 50,152 |
2025 |
|
| 55,395 |
2026 |
|
| 56,088 |
2027 |
|
| 56,789 |
2028 |
|
| 57,499 |
Thereafter |
|
| 2,082,469 |
Total payments |
|
| 2,358,392 |
Residual value |
|
| 21,643 |
Less imputed interest |
|
| (1,722,028) |
Total |
| $ | 658,007 |
Total payments and interest expense related to the Master Lease for the years ended December 31, 2023, 2022 and 2021 and 2020 were as follows:
|
|
|
|
|
|
|
|
|
|
|
| For the year ended |
|
| December 31, |
Amounts in thousands |
| 2022 |
| 2021 |
| 2020 |
Payments made |
| $ | 25,666 |
| $ | 25,271 |
| $ | 25,021 |
Interest expense on financing obligation |
| $ | 28,532 |
| $ | 28,232 |
| $ | 28,356 |
The estimated future payments related to the Master Lease financing obligation with VICI PropCo at December 31, 2022 are as follows:
|
|
|
|
Amounts in thousands |
|
|
|
2023 |
| $ | 23,670 |
2024 |
|
| 26,144 |
2025 |
|
| 26,471 |
2026 |
|
| 26,802 |
2027 |
|
| 27,137 |
Thereafter |
|
| 875,958 |
Total payments |
|
| 1,006,182 |
Less imputed interest |
|
| (749,770) |
Residual value |
|
| 28,492 |
Total |
| $ | 284,904 |
|
|
|
|
|
|
|
|
|
|
|
| For the year ended |
|
| December 31, |
Amounts in thousands |
| 2023 |
| 2022 |
| 2021 |
Payments made per Master Lease |
| $ | 39,048 |
| $ | 25,529 |
| $ | 25,271 |
CPI increase |
|
| 1,691 |
|
| 137 |
|
| — |
Total payments made including CPI increase |
|
| 40,739 |
|
| 25,666 |
|
| 25,271 |
|
|
|
|
|
|
|
|
|
|
Cash paid for principal 1 |
| $ | — |
| $ | — |
| $ | — |
Cash paid for interest |
|
| 40,739 |
|
| 25,666 |
|
| 25,271 |
|
|
|
|
|
|
|
|
|
|
Interest expense |
| $ | 42,426 |
| $ | 28,532 |
| $ | 28,232 |
1.For the initial periods of the Master Lease, cash payments are less than the interest expense recognized, which causes the financing obligation to increase.
8. REVENUE RECOGNITION
The Company derives revenue and other income from contracts with customers and financial instruments. A breakout of the Company’s revenue and other income is presented in the table below.
|
|
|
|
|
|
|
|
|
|
|
|
|
|
| For the year |
| For the year |
|
| ended December 31, |
| ended December 31, |
Amounts in thousands |
| 2022 |
| 2021 |
| 2020 |
| 2023 |
| 2022 |
| 2021 |
Revenue from contracts with customers |
| $ | 430,529 |
| $ | 388,506 |
| $ | 304,268 |
| $ | 550,206 |
| $ | 430,529 |
| $ | 388,506 |
Cost recovery income |
| 1,938 |
| 655 |
| 158 |
| 3,501 |
| 1,938 |
| 655 |
Century Casino Calgary sale earn out revenue |
|
| — |
|
| 51 |
|
| — |
|
| 1,660 |
|
| — |
|
| 51 |
Total revenue |
| $ | 432,467 |
| $ | 389,212 |
| $ | 304,426 |
| $ | 555,367 |
| $ | 432,467 |
| $ | 389,212 |
The Company operates gaming establishments as well as related lodging, restaurant, horse racing (including off-track betting), sports betting, iGaming, and entertainment facilities around the world. The Company generates revenue at its properties by providing the following types of products and services: gaming, pari-mutuel and sports betting, iGaming, hotel, food and beverage, and other.
Disaggregation of the Company’s revenue from contracts with customers by type of revenue and geographical location is presented in the tables below.
|
|
|
|
|
|
|
|
|
|
|
|
|
|
|
|
|
|
|
|
|
| For the year ended December 31, 2022 | For the year ended December 31, 2023 |
Amounts in thousands |
| United States |
|
| Canada |
| Poland |
| Corporate and Other |
| Total |
| United States |
|
| Canada |
| Poland |
| Corporate and Other |
| Total |
Gaming | $ | 232,871 |
| $ | 43,972 |
| $ | 88,959 |
| $ | 184 |
| $ | 365,986 | $ | 272,499 |
| $ | 46,871 |
| $ | 92,957 |
| $ | 61 |
| $ | 412,388 |
Pari-mutuel, sports betting and iGaming |
| 8,728 |
| 10,879 |
| — |
| — |
| 19,607 |
| 10,145 |
| 10,020 |
| — |
| — |
| 20,165 |
Hotel |
| 9,159 |
| 469 |
| — |
| — |
| 9,628 |
| 41,750 |
| 519 |
| — |
| — |
| 42,269 |
Food and beverage |
| 12,394 |
| 10,860 |
| 843 |
| — |
| 24,097 |
| 36,803 |
| 12,532 |
| 927 |
| — |
| 50,262 |
Other |
| 5,430 |
|
| 5,392 |
|
| 367 |
|
| 22 |
|
| 11,211 |
| 19,394 |
|
| 5,507 |
|
| 221 |
|
| — |
|
| 25,122 |
Net operating revenue | $ | 268,582 |
| $ | 71,572 |
| $ | 90,169 |
| $ | 206 |
| $ | 430,529 | $ | 380,591 |
| $ | 75,449 |
| $ | 94,105 |
| $ | 61 |
| $ | 550,206 |
|
|
|
|
|
|
|
|
|
|
|
|
|
|
|
|
|
|
|
|
|
|
|
|
|
|
|
|
|
|
|
|
|
|
|
|
|
|
|
|
|
|
|
|
|
|
|
|
|
|
| For the year ended December 31, 2021 | For the year ended December 31, 2022 |
Amounts in thousands |
| United States |
|
| Canada |
| Poland |
| Corporate and Other |
| Total |
| United States |
|
| Canada |
| Poland |
| Corporate and Other |
| Total |
Gaming | $ | 249,397 |
| $ | 25,604 |
| $ | 56,724 |
| $ | 152 |
| $ | 331,877 | $ | 232,871 |
| $ | 43,972 |
| $ | 88,959 |
| $ | 184 |
| $ | 365,986 |
Pari-mutuel, sports betting and iGaming |
| 8,492 |
| 10,356 |
| — |
| — |
| 18,848 |
| 8,728 |
| 10,879 |
| — |
| — |
| 19,607 |
Hotel |
| 8,241 |
| 45 |
| — |
| — |
| 8,286 |
| 9,159 |
| 469 |
| — |
| — |
| 9,628 |
Food and beverage |
| 11,761 |
| 5,606 |
| 421 |
| — |
| 17,788 |
| 12,394 |
| 10,860 |
| 843 |
| — |
| 24,097 |
Other |
| 5,394 |
|
| 4,817 |
|
| 1,081 |
|
| 415 |
|
| 11,707 |
| 5,430 |
|
| 5,392 |
|
| 367 |
|
| 22 |
|
| 11,211 |
Net operating revenue | $ | 283,285 |
| $ | 46,428 |
| $ | 58,226 |
| $ | 567 |
| $ | 388,506 | $ | 268,582 |
| $ | 71,572 |
| $ | 90,169 |
| $ | 206 |
| $ | 430,529 |
|
|
|
|
|
|
|
|
|
|
|
|
|
|
|
|
|
|
|
|
|
|
|
|
|
|
|
|
|
|
|
|
|
|
|
|
|
|
|
|
|
|
|
|
|
|
|
|
|
|
| For the year ended December 31, 2020 | For the year ended December 31, 2021 |
Amounts in thousands |
| United States |
|
| Canada |
| Poland |
| Corporate and Other |
| Total |
| United States |
|
| Canada |
| Poland |
| Corporate and Other |
| Total |
Gaming | $ | 168,904 |
| $ | 30,319 |
| $ | 53,228 |
| $ | 830 |
| $ | 253,281 | $ | 249,397 |
| $ | 25,604 |
| $ | 56,724 |
| $ | 152 |
| $ | 331,877 |
Pari-mutuel, sports betting and iGaming |
| 7,502 |
| 10,158 |
| — |
| — |
| 17,660 |
| 8,492 |
| 10,356 |
| — |
| — |
| 18,848 |
Hotel |
| 5,826 |
| 84 |
| — |
| — |
| 5,910 |
| 8,241 |
| 45 |
| — |
| — |
| 8,286 |
Food and beverage |
| 9,795 |
| 5,832 |
| 462 |
| 105 |
| 16,194 |
| 11,761 |
| 5,606 |
| 421 |
| — |
| 17,788 |
Other |
| 6,317 |
|
| 3,847 |
|
| 581 |
|
| 478 |
|
| 11,223 |
| 5,394 |
|
| 4,817 |
|
| 1,081 |
|
| 415 |
|
| 11,707 |
Net operating revenue | $ | 198,344 |
| $ | 50,240 |
| $ | 54,271 |
| $ | 1,413 |
| $ | 304,268 | $ | 283,285 |
| $ | 46,428 |
| $ | 58,226 |
| $ | 567 |
| $ | 388,506 |
|
|
|
|
|
|
|
|
|
|
|
|
|
|
|
|
|
|
|
|
|
|
|
|
|
|
|
|
|
For the majority of the Company’s contracts with customers, payment is made in advance of the services and contracts are settled on the same day the sale occurs with revenue recognized on the date of the sale. For contracts that are not settled, a contract liability is created. The expected duration of the performance obligation is less than one year.
The amount of revenue recognized that was included in the opening contract liability balance was $1.6$2.0 million and $0.6$1.6 million for each of the years ended December 31, 20222023 and 2021,2022, respectively. This revenue consisted primarily of the Company’s deferred gaming revenue from player points earned through play at the Company’s casinos located in the United States. Activity in the Company’s receivables and contract liabilities is presented in the table below.
|
|
|
|
|
|
|
|
|
|
|
|
|
|
|
|
|
|
| For the year |
| For the year |
| For the year ended |
| For the year ended |
|
| ended December 31, 2022 |
| ended December 31, 2021 |
| December 31, 2023 |
| December 31, 2022 |
Amounts in thousands |
| Receivables |
| Contract Liabilities |
| Receivables |
| Contract Liabilities |
| Receivables |
| Contract Liabilities |
| Receivables |
| Contract Liabilities |
Opening |
| $ | 1,269 |
| $ | 2,986 |
| $ | 1,103 |
| $ | 2,200 |
| $ | 1,351 |
| $ | 2,417 |
| $ | 1,269 |
| $ | 2,986 |
Closing |
|
| 1,351 |
|
| 2,417 |
|
| 1,269 |
|
| 2,986 |
|
| 1,640 |
|
| 4,714 |
|
| 1,351 |
|
| 2,417 |
Increase/(Decrease) |
| $ | 82 |
| $ | (569) |
| $ | 166 |
| $ | 786 |
| $ | 289 |
| $ | 2,297 |
| $ | 82 |
| $ | (569) |
The increase in contract liabilities is due to the added contract liabilities from Nugget and Rocky Gap. Receivables are included in accounts receivable and contract liabilities are included in accrued liabilities on the Company’s consolidated balance sheets. In March 2020, the Company wrote-down its receivables related to MCE based on assessments made due to COVID-19 and future cash flows of MCE, and as a result, charged $0.3 million to general and administrative expenses during the year ended December 31, 2020.
Substantially all of the Company’s contracts and contract liabilities have an original duration of one year or less. The Company applies the practical expedient for such contracts and does not consider the effects of the time value of money. Further, because of the short duration of these contracts, the Company has not disclosed the transaction price for the remaining performance obligations as of the end of each reporting period or when the Company expects to recognize this revenue.
9. LEASES
The Company determines if an arrangement is a lease at inception. Right-of-use (“ROU”) assets represent the Company’s right to use an underlying asset for the lease term, and lease liabilities represent the obligation to make lease payments arising from the lease. Operating lease ROU assets and liabilities are recognized at the commencement date based on the present value of lease payments over the lease term. The Company uses its incremental borrowing rate in each of the jurisdictions in which its subsidiaries operate to calculate the present value of lease payments. Lease terms may include options to extend or terminate the lease. These options are included in the lease term when it is reasonably certain that the Company will exercise those options. Operating lease expense is recorded on a straight-line basis over the lease term.
The Company accounts for lease agreements with lease and non-lease components as a single lease component for all asset classes. The Company does not establish ROU assets or lease liabilities for operating leases with terms of 12 months or less.
The Company’s operating and finance leases include land, casino space, corporate offices, and gaming and other equipment. The leases have remaining lease terms of one month to 1448 years. The Master Lease was evaluated as a sale-leaseback of real estate. The Company determined that the Master Lease did not qualify for sale-leaseback accounting and accounted for the transaction as a financing obligation based on the fair value of the real estate assets subject to the Master Lease (see Notes 2 and 7).
The components of lease expense were as follows:
|
|
|
|
|
|
|
|
|
|
|
|
|
|
| For the year ended |
| For the year ended |
|
| December 31, |
| December 31, |
Amounts in thousands |
| 2022 |
| 2021 |
| 2020 |
| 2023 |
| 2022 |
| 2021 |
Operating lease expense |
| $ | 5,345 |
| $ | 5,864 |
| $ | 5,250 |
| $ | 5,686 |
| $ | 5,345 |
| $ | 5,864 |
|
|
|
|
|
|
|
|
|
|
|
|
|
Finance lease expense: |
|
|
|
|
|
|
|
|
|
|
|
|
Amortization of right-of-use assets |
| $ | 136 |
| $ | 128 |
| $ | 165 |
| $ | 108 |
| $ | 136 |
| $ | 128 |
Interest on lease liabilities |
|
| 29 |
|
| 6 |
|
| 15 |
|
| 40 |
|
| 29 |
|
| 6 |
Total finance lease expense |
| $ | 165 |
| $ | 134 |
| $ | 180 |
| $ | 148 |
| $ | 165 |
| $ | 134 |
|
|
|
|
|
|
|
|
|
|
|
|
|
Variable lease expense |
| $ | 1,478 |
| $ | 1,290 |
| $ | 1,476 |
| $ | 1,405 |
| $ | 1,478 |
| $ | 1,290 |
Variable lease expense relates primarily to rates based on a percentage of gaming revenue, changes in indexes that are excluded from the lease liability and fluctuations in foreign currency related to leases in Poland.
Supplemental cash flow information related to leases was as follows:
|
|
|
|
|
|
|
|
|
|
|
|
|
|
| For the year ended |
| For the year ended |
|
| December 31, |
| December 31, |
Amounts in thousands |
| 2022 |
| 2021 |
| 2020 |
| 2023 |
| 2022 |
| 2021 |
Cash paid for amounts included in the measurement of lease liabilities: |
|
|
|
|
|
|
|
|
|
|
|
|
Operating cash flows from finance leases |
| $ | 25 |
| $ | 6 |
| $ | 5 |
| $ | 41 |
| $ | 25 |
| $ | 6 |
Operating cash flows from operating leases |
| 5,168 |
| 5,201 |
| 6,355 |
| 5,499 |
| 5,168 |
| 5,201 |
Financing cash flows from finance leases |
| 157 |
| 123 |
| 166 |
| 166 |
| 157 |
| 123 |
|
|
|
|
|
|
|
|
|
|
|
|
|
Right-of-use assets obtained in exchange for operating lease liabilities |
| $ | 1,076 |
| $ | 407 |
| $ | — |
| $ | 3,718 |
| $ | 1,076 |
| $ | 407 |
|
|
|
|
|
|
|
|
|
|
|
|
|
Supplemental balance sheet information related to leases was as follows:
|
|
|
|
|
|
|
|
|
|
| As of |
| As of |
| As of |
| As of |
Amounts in thousands |
| December 31, 2022 |
| December 31, 2021 |
| December 31, 2023 |
| December 31, 2022 |
Operating leases |
|
|
|
|
|
|
|
|
Leased right-of-use assets, net |
| $ | 27,190 |
| $ | 28,383 |
| $ | 25,973 |
| $ | 27,190 |
|
|
|
|
|
|
|
|
|
Current portion of operating lease liabilities |
| 3,947 |
| 3,915 |
| 3,395 |
| 3,947 |
Operating lease liabilities, net of current portion |
|
| 26,016 |
|
| 27,229 |
|
| 25,834 |
|
| 26,016 |
Total operating lease liabilities |
|
| 29,963 |
|
| 31,144 |
|
| 29,229 |
|
| 29,963 |
|
|
|
|
|
|
|
|
|
Finance leases |
|
|
|
|
|
|
|
|
Finance lease right-of-use assets, gross |
| 764 |
| 424 |
| 1,028 |
| 764 |
Accumulated depreciation |
|
| (175) |
|
| (342) |
|
| (296) |
|
| (175) |
Property and equipment, net | |
| 589 |
|
| 82 | |
| 732 |
|
| 589 |
|
|
|
|
|
|
|
|
|
Current portion of finance lease liabilities |
| 150 |
| 38 |
| 199 |
| 150 |
Finance lease liabilities, net of current portion |
|
| 399 |
|
| 43 |
|
| 427 |
|
| 399 |
Total finance lease liabilities |
|
| 549 |
|
| 81 |
|
| 626 |
|
| 549 |
|
|
|
|
|
|
|
|
|
Weighted-average remaining lease term |
|
|
|
|
|
|
|
|
Operating leases |
| 10.5 years |
| 11.2 years |
| 14.6 years |
| 10.5 years |
Finance leases |
| 3.6 years |
| 2.2 years |
| 3.4 years |
| 3.6 years |
|
|
|
|
|
|
|
|
|
Weighted-average discount rate |
|
|
|
|
|
|
|
|
Operating leases |
| 4.9% |
| 4.7% |
| 8.7% |
| 4.9% |
Finance leases |
| 7.0% |
| 4.0% |
| 7.7% |
| 7.0% |
Maturities of lease liabilities as of December 31, 20222023 were as follows:
|
|
|
|
|
|
|
|
|
Amounts in thousands |
|
| Operating Leases |
| Finance Leases |
|
| Operating Leases |
| Finance Leases |
2023 |
| $ | 5,091 |
| $ | 184 | |
2024 |
| 4,446 |
| 178 |
| $ | 4,989 |
| $ | 240 |
2025 |
| 3,413 |
| 160 |
| 4,171 |
| 221 |
2026 |
| 3,136 |
| 85 |
| 3,863 |
| 143 |
2027 |
| 3,123 |
| 15 |
| 3,803 |
| 72 |
2028 | |
| 3,684 |
| 39 |
Thereafter |
|
| 20,366 |
|
| — |
|
| 36,568 |
|
| — |
Total lease payments |
|
| 39,575 |
|
| 622 |
|
| 57,078 |
|
| 715 |
Less imputed interest |
|
| (9,612) |
|
| (73) |
|
| (27,849) |
|
| (89) |
Total |
| $ | 29,963 |
| $ | 549 |
| $ | 29,229 |
| $ | 626 |
10
10. OTHER BALANCE SHEET AND STATEMENT OF EARNINGS (LOSS) CAPTIONS
Accrued liabilities include the following as of December 31, 20222023 and 2021:2022:
|
|
|
|
|
|
|
|
|
|
|
|
|
|
|
| December 31, |
| December 31, |
Amounts in thousands |
| 2022 |
| 2021 |
| 2023 |
| 2022 |
Accrued commissions (AGLC) |
| $ | 2,436 |
| $ | 863 |
| $ | 3,141 |
| $ | 2,436 |
Progressive slot, table and on track liability |
| 3,719 |
| 3,340 |
| 6,243 |
| 3,719 |
Player point liability |
| 1,047 |
| 1,006 |
| 2,296 |
| 1,047 |
Chip liability |
| 639 |
| 592 |
| 1,087 |
| 639 |
Racing-related liabilities |
| 814 |
| 1,068 |
| 482 |
| 814 |
Deposit liability |
| 368 |
| 420 |
| 513 |
| 368 |
Deferred revenue | |
| 1,995 |
| 1,026 |
Construction liability |
| 3,562 |
| — |
| 4,546 |
| 3,562 |
Other accrued liabilities |
|
| 6,427 |
|
| 6,303 |
|
| 8,753 |
|
| 5,401 |
Total |
| $ | 19,012 |
| $ | 13,592 |
| $ | 29,056 |
| $ | 19,012 |
Accrued commissions (AGLC) include the portion of slot machine net sales and table game wins owed to the AGLC as of December 31, 20222023 and 2021.2022.
Taxes payable include the following as of December 31, 20222023 and 2021:2022:
|
|
|
|
|
|
|
|
|
|
|
|
|
|
|
|
|
|
|
| December 31, |
| December 31, |
Amounts in thousands |
| 2022 |
| 2021 |
| 2023 |
| 2022 |
Accrued property taxes |
| $ | 1,478 |
| $ | 1,567 |
| $ | 1,485 |
| $ | 1,478 |
Gaming taxes payable |
| 6,787 |
| 11,595 |
| 6,199 |
| 6,787 |
Income taxes payable | |
| 12,145 |
| 1,238 |
Other taxes payable |
|
| 1,536 |
|
| 1,927 |
|
| 1,172 |
|
| 298 |
Total |
| $ | 9,801 |
| $ | 15,089 |
| $ | 21,001 |
| $ | 9,801 |
Pari-mutuel, sports bettingTaxes payable and iGaming revenue includesother include the following for the years endedas of December 31, 2022, 20212023 and 2020:
2022:
|
|
|
|
|
|
|
|
|
|
|
| For the year ended December 31, |
Amounts in thousands |
| 2022 |
| 2021 |
| 2020 |
Pari-mutuel revenue |
| $ | 16,310 |
| $ | 16,484 |
| $ | 14,937 |
Sports betting revenue |
|
| 2,734 |
|
| 2,166 |
|
| 2,723 |
iGaming revenue |
|
| 563 |
|
| 198 |
|
| — |
Total |
| $ | 19,607 |
| $ | 18,848 |
| $ | 17,660 |
|
|
|
|
|
|
|
|
| December 31, |
Amounts in thousands |
| 2023 |
| 2022 |
Caruthersville project financing |
| $ | 40,100 |
| $ | 5,000 |
Income taxes payable - long term |
|
| 1,031 |
|
| 1,265 |
Other taxes payable and other |
|
| 627 |
|
| 700 |
Total |
| $ | 41,758 |
| $ | 6,965 |
The Caruthersville project financing liability will become part of the Master Lease financing obligation once construction on the project is complete.
11. SHAREHOLDERS’ EQUITY
Since March 2000, the Company has had a discretionary program to repurchase the Company’s outstanding common stock. The total remaining authorization under the repurchase program was $14.7 million as of December 31, 2022.2023. The Company did not repurchase any shares of its common stock during 20222023 and 2021.2022. The repurchase program has no set expiration or termination date.
The Company has not declared or paid any dividends. Declaration and payment of dividends, if any, in the future will be at the discretion of the board of directors.
The Company does not have any minimum capital requirements related to its status as a US corporation in the state of Delaware.
12. STOCK-BASED COMPENSATION
At the 2005 annual meeting of stockholders, stockholders of the Company approved an equity incentive plan (as amended, the “2005 Plan”). The 2005 Plan expired in June 2015. There are stock options issued under the 2005 Plan that remain outstanding. The 2005 Plan provided for the grant of awards to eligible individuals in the form of stock, restricted stock, stock options, performance units or other stock-based awards, all as defined in the 2005 Plan. The 2005 Plan provided for the issuance of up to 2,000,000 shares of common stock to eligible individuals, including directors, through the various forms of permitted awards. The Company was not permitted to issue stock options at an exercise price lower than fair market value at the date of grant. All stock options were required to have an exercise period not to exceed ten years. The Company had granted awards of incentive stock options and non-qualified stock options under the 2005 Plan, all of which had exercise prices that were not less than the fair market value at the date of grant. Options granted had six month, one year, three year or four year vesting periods. All outstanding options were issued at market value as of the date of the grant.
Stockholders of the Company approved the 2016 Equity Incentive Plan (the “2016 Plan”) at the 2016 annual meeting of stockholders. The 2016 Plan will expire in June 2026. The 2016 Plan provides for the grant of awards to eligible individuals in the form of stock, restricted stock, stock options, performance units or other stock-based awards, all as defined in the 2016 Plan. The 2016 Plan provides for the issuance of up to 3,500,000 shares of common stock to eligible individuals, including directors, through the various forms of permitted awards. The Company is not permitted to issue stock options at an exercise price lower than fair market value at the date of grant. All stock options are required to have an exercise period not to exceed ten years. As of December 31, 2022,2023, the Company has granted 1,062,162 target3,048,507 performance stock units (“PSUs”), restricted stock units (“RSUs”) and stock options under the 2016 Plan. Any committee as delegated by the board of directors has the power and discretion to, among other things, prescribe the terms and conditions for the exercise of, or modification of, any outstanding awards in the event of merger, acquisition or any other form of acquisition other than a reorganization of the Company under the United States Bankruptcy Code or liquidation of the Company. The 2016 Plan also allows limited transferability of any stock options to legal entities that are 100% owned or controlled by the optionee or to the optionee’s family trust.
PSUs
PSUs
The PSUs vest subject to market and performance conditions. The conditions are weighted 25% based on market conditions and 75% based on performance conditions. Market conditions are based on the Company’s total shareholder return (“TSR”) relative to a select group of peer companies at the end of a three year performance period. Performance conditions are based on the Company’s actual Adjusted EBITDAEBITDAR over the three year performance period compared to forecasted Adjusted EBITDAEBITDAR over the same period. Depending on the TSR and Adjusted EBITDAEBITDAR at the end of the performance period, anywhere from 0% to 200% of the target grant may vest. Expense is recognized on a straight-line basis over the performance period beginning on the date of grant. Probability is assessed quarterly on the performance conditions and compensation expense is adjusted accordingly. Actual forfeitures are recognized as they occur.
Activity in the Company’s stock-based compensation plan for the PSUs was as follows:
|
|
|
|
|
|
|
|
|
|
| Target PSUs |
| Weighted-Average Grant-Date Fair Value |
| Target PSUs |
| Weighted-Average Grant-Date Fair Value |
Nonvested at January 1, 2020 |
| 441,223 |
| $ | 9.62 | |
Granted |
| 413,964 |
| 3.75 | |
Vested |
| (87,171) |
| 6.75 | |
Forfeited |
| (80,797) |
| 9.41 | |
Nonvested at December 31, 2020 |
| 687,219 |
| $ | 6.47 | |
Nonvested at January 1, 2021 | |
| 687,219 |
| $ | 6.47 |
Granted |
| 268,947 |
| 6.44 |
| 268,947 |
| 6.44 |
Vested |
| — |
| — |
| — |
| — |
Forfeited |
| (141,002) |
| 11.97 |
| (141,002) |
| 11.97 |
Nonvested at December 31, 2021 |
| 815,164 |
| $ | 5.51 |
| 815,164 |
| $ | 5.51 |
Granted |
| 420,989 |
| 10.22 |
| 420,989 |
| 10.22 |
Vested |
| (227,510) |
| 9.17 |
| (227,510) |
| 9.17 |
Forfeited |
| (21,481) |
| 6.14 |
| (21,481) |
| 6.14 |
Nonvested at December 31, 2022 |
| 987,162 |
| $ | 6.66 |
| 987,162 |
| $ | 6.66 |
Granted | |
| 473,157 |
| 9.04 |
Vested | |
| (302,988) |
| 3.28 |
Forfeited | |
| (100,995) |
| 5.14 |
Nonvested at December 31, 2023 | |
| 1,056,336 |
| $ | 8.84 |
At December 31, 2022,2023, there was a total of $3.3$3.7 million of total unrecognized compensation expense related to the PSUs. The cost is expected to be recognized over a weighted-average period of 1.7 years. The PSUs granted during 20202021 will vest in March 2023.2024.
The fair value of the PSUs granted is estimated on the date of grant using the Monte Carlo model with the following assumptions:
|
|
|
|
|
Assumptions for PSU Awards |
|
|
|
|
| 2022 | 2021 | 2020 | 2023 | 2022 | 2021 |
Risk-free interest rate | 2.47% | 0.19% | 4.09% | 2.47% | 0.19% |
Expected life | 2.8 years | 2.9 years | 2.2 years | 2.9 years | 2.8 years | 2.9 years |
Expected volatility | 91.0% | 82.2% | 88.4% | 91.8% | 91.0% | 82.2% |
Expected dividends | $0 | $0 | $0 | $0 |
Forfeiture rate | 0% | 0% | 0% | 0% |
Stock Options
Activity related to options in the Company’s stock-based compensation plans for employee stock options was as follows:
|
|
|
|
|
|
|
|
|
|
|
|
|
|
|
|
|
|
|
|
|
|
| Option Shares |
| Weighted-Average Exercise Price |
| Weighted-Average Remaining Contractual Term (1) |
| Options Exercisable |
| Weighted-Average Exercise Price |
| Option Shares |
| Weighted-Average Exercise Price |
| Weighted-Average Remaining Contractual Term (1) |
| Options Exercisable |
| Weighted-Average Exercise Price |
Outstanding at January 1, 2022 |
| 1,127,500 |
| $ | 5.05 |
| 2.99 |
| 1,127,500 |
| $ | 5.05 | |
Outstanding at January 1, 2023 | |
| 1,075,000 |
| $ | 5.05 |
| 1.99 |
| 1,075,000 |
| $ | 5.05 |
Granted |
| — |
| — |
|
|
|
|
|
|
| 1,020,000 |
| 5.61 |
|
|
|
|
|
|
Exercised |
| (52,500) |
| 5.05 |
|
|
|
|
|
|
| (25,000) |
| 5.05 |
|
|
|
|
|
|
Cancelled or forfeited |
| — |
| — |
|
|
|
|
|
|
| (1,020,000) |
| 5.05 |
|
|
|
|
|
|
Expired |
| — |
| — |
|
|
|
|
|
|
| — |
| — |
|
|
|
|
|
|
Outstanding at December 31, 2022 |
| 1,075,000 |
| $ | 5.05 |
| 1.99 |
| 1,075,000 |
| $ | 5.05 | |
Outstanding at December 31, 2023 | |
| 1,050,000 |
| $ | 5.59 |
| 1.81 |
| 285,000 |
| $ | 5.55 |
|
|
|
|
|
|
|
|
|
|
|
|
|
|
|
|
|
|
|
|
|
(1)In years
(2)Employees with options expiring in December 2024 were given the option to cancel their existing $5.05 options and exchange them for $5.61 options expiring in September 2033. Six employees exchanged their options. The exchange increased compensation expense related to employee stock options by $0.6 million for the year ended December 31, 2023.
The following table summarizes information about employee stock options outstanding and exercisable at December 31, 2022:2023:
|
|
|
|
|
|
|
|
|
|
|
|
|
|
|
|
|
|
|
|
|
|
|
|
|
Dollar amounts in thousands |
| Options Outstanding |
| Options Exercisable |
| Intrinsic Value of Options Outstanding |
| Intrinsic Value of Options Exercisable |
| Weighted-Average Life of Options Outstanding (1) |
| Weighted-Average Life of Options Exercisable
(1) |
| Options Outstanding |
| Options Exercisable |
| Intrinsic Value of Options Outstanding |
| Intrinsic Value of Options Exercisable |
| Weighted-Average Life of Options Outstanding (1) |
| Weighted-Average Life of Options Exercisable
(1) |
Exercise Price: |
|
|
|
|
|
|
|
|
|
|
|
|
|
|
|
|
|
|
|
|
|
|
|
|
$5.05 |
| 1,075,000 |
| 1,075,000 |
| $ | 2,129 |
| $ | 2,129 |
| 2.0 |
| 2.0 |
| 30,000 |
| 30,000 |
| $ | — |
| $ | — |
| 1.0 |
| 1.0 |
$5.61 | |
| 1,020,000 |
| 255,000 |
| — |
| — |
| 9.7 |
| 9.7 |
|
|
|
|
|
|
|
|
|
|
|
|
|
| 1,050,000 |
| 285,000 |
| $ | — |
| $ | — |
| 9.5 |
| 8.8 |
| |
|
|
|
|
|
|
|
|
|
|
|
|
(1) In years
The aggregate intrinsic value represents the difference between the Company’s closing stock price of $7.03$4.88 per share as of December 31, 20222023 and the exercise price multiplied by the number of options outstanding or exercisable as of that date. At December 31, 2023, there was a total of $1.2 million of unrecognized compensation expense related to employee stock options. The cost is expected to be recognized over a weighted-average period of 2.7 years.
Assumptions for Employee Stock Options
|
|
| 2023 |
Risk-free interest rate | 4.27% |
Expected life | 6.8 years |
Expected volatility | 58.1% |
Expected dividend | 0% |
Forfeiture rate | 0 |
Director Equity
The Company’s outside directors were issued 4,071 RSUs with a grant date fair value of $7.37 per share during 2023. The RSUs will vest in March 2024. There were no options issued to directors of the Company during 2022.2023. As of December 31, 2022,2023, there were 96,700 options outstanding to independent directors of the Company with a weighted-average exercise price of $7.16 per share. At December 31, 2022,2023, there was less than $0.1 million in unrecognized compensation expense related to directors’ RSUs and options.
Additional Stock Information
The following table includes additional information related to exercises of stock options:
|
|
|
|
|
|
|
|
|
|
|
|
|
|
| For the year ended December 31, |
| For the year ended December 31, |
Amounts in thousands |
| 2022 |
| 2021 |
| 2020 |
| 2023 |
| 2022 |
| 2021 |
Intrinsic value of share-based awards exercised |
| $ | 183 |
| $ | 451 |
| $ | — |
| $ | 15 |
| $ | 183 |
| $ | 451 |
Stock-based compensation expense was recognized in general and administrative expenses on the Company’s consolidated statementstatements of (loss) earnings (loss) as follows:
|
|
|
|
|
|
|
|
|
|
|
|
|
|
| For the year ended December 31, |
| For the year ended December 31, |
Amounts in thousands |
| 2022 |
| 2021 |
| 2020 |
| 2023 |
| 2022 |
| 2021 |
Compensation expense: |
|
|
|
|
|
|
|
|
|
|
|
|
|
|
2016 Plan |
| $ | 3,335 |
| $ | 2,652 |
| $ | (214) |
| $ | 3,610 |
| $ | 3,335 |
| $ | 2,652 |
|
|
|
|
|
|
|
|
|
|
|
|
|
|
|
13. INCOME TAXES
The Company’s US and foreign pre-tax (loss) income (loss) is summarized in the table below:
|
|
|
|
|
|
|
|
|
|
|
|
|
Amounts in thousands |
| 2022 |
| 2021 |
| 2020 |
| 2023 |
| 2022 |
| 2021 |
Income (loss) before taxes: |
|
|
|
|
|
| |
(Loss) income before taxes: | |
|
|
|
|
|
|
US |
| $ | (10,142) |
| $ | 29,715 |
| $ | (45,927) |
| $ | (30,793) |
| $ | (10,142) |
| $ | 29,715 |
Foreign |
|
| 16,152 |
|
| (1,566) |
|
| 2,639 |
|
| 6,961 |
|
| 16,152 |
|
| (1,566) |
Total income (loss) before taxes |
| $ | 6,010 |
| $ | 28,149 |
| $ | (43,288) | |
Total (loss) income before taxes | |
| $ | (23,832) |
| $ | 6,010 |
| $ | 28,149 |
The Company’s (benefit) provision for income taxes is summarized as follows:
|
|
|
|
|
|
|
|
|
|
|
|
|
|
|
|
|
|
|
| For the year ended December 31, |
| For the year ended December 31, |
Amounts in thousands |
|
| 2022 |
| 2021 |
| 2020 |
|
| 2023 |
| 2022 |
| 2021 |
US - Current |
| $ | 3,176 |
| $ | 5,160 |
| $ | 270 |
| $ | 1,088 |
| $ | 3,176 |
| $ | 5,160 |
US - Deferred |
|
| (14,981) |
|
| — |
|
| 973 |
|
| (6,504) |
|
| (14,981) |
|
| — |
(Benefit) provision for US income taxes |
| $ | (11,805) |
| $ | 5,160 |
| $ | 1,243 |
| $ | (5,416) |
| $ | (11,805) |
| $ | 5,160 |
|
|
|
|
|
|
|
|
|
|
|
|
|
|
|
|
|
|
|
Foreign - Current |
| $ | 4,291 |
| $ | 866 |
| $ | 1,130 |
| $ | 17,085 |
| $ | 4,291 |
| $ | 866 |
Foreign - Deferred |
|
| (146) |
|
| 345 |
|
| 2,475 |
|
| (17,012) |
|
| (146) |
|
| 345 |
Provision for foreign income taxes |
| $ | 4,145 |
| $ | 1,211 |
| $ | 3,605 |
| $ | 73 |
| $ | 4,145 |
| $ | 1,211 |
Total (benefit) provision for income taxes |
| $ | (7,660) |
| $ | 6,371 |
| $ | 4,848 |
| $ | (5,343) |
| $ | (7,660) |
| $ | 6,371 |
The Company’s effective income tax rate differs from the statutory federal income tax rate as follows:
|
|
|
Amounts in thousands | 2022 | 2021 | 2020 | 2023 | 2022 | 2021 |
US federal income tax statutory rate | 21.0% | (21.0%) | 21.0% |
Foreign tax rate differential | 18.6% | (0.5%) | (5.8%) | 23.3% | 18.6% | (0.5%) |
State income tax (net of federal benefit) | 0.9% | 3.0% | (3.8%) | 2.1% | 0.9% | 3.0% |
Income taxed to owners of non-controlling interest (Smooth Bourbon) | | 4.7% | — |
Meals, entertainment, gifts and giveaways | 3.7% | 0.4% | — | (1.0%) | 3.7% | 0.4% |
Statutory to US GAAP adjustments, including foreign currency | (3.7%) | 2.6% | (1.8%) | 0.8% | (3.7%) | 2.6% |
Valuation allowance | (173.5%) | (4.6%) | 41.0% | (5.5%) | (173.5%) | (4.6%) |
Unrecognized tax benefit | (4.7%) | (0.3%) | — | (0.3%) | (4.7%) | (0.3%) |
Stock options | 7.0% | 1.3% | (0.1%) | (1.0%) | 7.0% | 1.3% |
Global Intangible Low-Taxed Income ("GILTI"), net foreign tax credits | 2.5% | — | — | 2.5% | — |
Foreign dividend withholding - current | | (5.1%) | — |
Foreign dividend withholding - unremitted earnings | | (15.0%) | — |
Permanent and other items | 0.7% | (0.3%) | 2.7% | (1.6%) | 0.7% | (0.3%) |
Total provision for income taxes | (127.5%) | 22.6% | 11.2% | 22.4% | (127.5%) | 22.6% |
The Company’s effective income tax rate for the year ended December 31, 20222023 was (127.5%)22.4%. The comparison of pre-tax income of $6.0 million for the year ended December 31, 2022 compared to pre-tax income of $28.1 million for the year ended December 31, 2021 should be considered when comparing tax rates year-over-year. The federal corporate income tax rate in the United States for 20222023 was 21%; additionally, the. The Company is also subject to Colorado, Missouri, and West Virginia and Maryland state jurisdictions that had corporate tax rates ranging from 4.0% to 6.5%8.25% in 2022.2023. The Company’s foreign tax rate differential reflects the fact that the US federal corporate income tax rate differs from statutory rates in Poland, Austria, Mauritius and Canada, which are 19.0%, 25.0%, 15.0% and 23.0%, respectively. Additionally, the Company had a preferential tax rate of 11.5% on a portion of the taxable gain recognized from the Canada Real Estate Sale with VICI PropCo. Further, the income tax burden on the earnings taxed to the non-controlling interest holders of Smooth Bourbon is not reported by the Company.
Items unfavorably impacting the effective tax rate ininclude a foreign withholding tax related to a cash dividend paid from the United States for 2022 was 116.4%, primarily dueCompany’s Canadian subsidiary CDR to its wholly owned Austrian subsidiary CRM. Additionally, the release of the valuation allowance onCompany does not intend to permanently reinvest its deferred tax assets in 2022, as well as other permanent items such as nondeductible stock compensation, lobbying costs and GILTI. The effective tax rate of 36.9%current earnings in Canada, which predominately include earnings from the Canada Real Estate Sale. In anticipation of the Company’s plan to potentially repatriate a portion of these unremitted earnings to the US in the form of a cash dividend, the Company has recorded a 23.0% incomedeferred tax rate, was due to various permanent addbacks and movementliability of $3.6 million for the required foreign tax withholding associated with the potential dividend. Movement in the valuation allowance on Century Mile’s deferred tax assets. Theassets also impacted the Company’s effective tax rate of 20.7% related to 2022 earnings in Poland, which has a 19.0% income tax rate, was due to nondeductible payments to certain governing authorities as well as nondeductible meals, entertainment, gifts and giveaways. The effective tax rate of 0.0% related to 2022 losses in Mauritius, which has a 15.0% income tax rate, was primarily due to movement in the valuation allowance on deferred tax assets, which was established in 2021. The effective tax rate of 1.7% related to 2022 income in Austria, which has a 25.0% income tax rate, was due to various permanent addbacks, including the change in the valuation allowance recorded on the Company’s deferred tax assets during 2020.rate. The movement of exchange rates for intercompany loans denominated in US dollars further impactsimpacted the effective income tax rate because foreign currency gains and losses generally are not taxed until realized. Therefore, the overall effective income tax rate can be impacted by foreign currency gains or losses in the future.
The Tax Cuts and Jobs Act (the “Tax Act”) created requirements that certain income, such as GILTI, earned by a controlled foreign corporation (“CFC”) must be included currently in the gross income of the CFC’s US shareholder, effective in 2018. Under US GAAP, the Company is allowed to make an accounting policy election of either (1) treating taxes due on future US inclusions in taxable income related to GILTI as a current period expense when incurred (the “period cost method”) or (2) factoring such amounts into the Company’s measurement of its deferred taxes (the “deferred method”). The Company has elected to account for GILTI in the year the tax is incurred as a current period expense and recorded a tax expense, net of foreign tax credits, of $0.1 million for the year ended December 31, 2022. There was no net tax expense related to GILTI for the years ended December 31, 2021 and 2020.
The Company records deferred tax assets and liabilities based on the difference between the financial statement and income tax basis of assets and liabilities using the enacted statutory tax rate in effect for the year these differences are expected to be taxable or reversed. Deferred income tax expenses or credits are based on the changes in the asset or liability from period to period. The recorded deferred tax assets are reviewed for impairment on a quarterly basis by reviewing the Company’s internal estimates for future taxable income. The Company assesses the need for a valuation allowance based on its ability to realize the benefits of the Company’s deferred tax assets.
The Company determined it is more-likely-than-not thatcontinues to maintain a full valuation allowance on deferred tax assets for CMR, CRM and Century Resorts International, Ltd. As of December 31, 2023, the remainingCompany had $21.5 million in net deferred tax assets in the United States wouldUS. These deferred tax assets include approximately $11.0 million for disallowed interest expense and $2.7 million related to net operating loss (“NOL”) carryforwards that can be utilized and releasedused to offset taxable income in future periods. At this time, management considers it more likely than not that the Company will have sufficient taxable income in the future to utilize these deferred tax assets. However, unless the Company is able to generate sufficient taxable income in the US, a valuation allowance previously recorded,to reduce these deferred tax assets may be required, which resultedwould materially increase the tax expense in a ($10.2) million tax benefit recognized during 2022.the period the allowance is recognized.
The Company’s deferred income taxes at December 31, 20222023 and 20212022 are summarized as follows:
|
|
|
|
|
|
|
|
|
Amounts in thousands |
| 2022 |
| 2021 |
| 2023 |
| 2022 |
Deferred tax assets (liabilities) - US Federal and state: |
|
|
|
|
|
|
|
|
Deferred tax assets |
|
|
|
|
|
|
|
|
Amortization of goodwill for tax |
| $ | 8,101 |
| $ | 7,902 |
| $ | 8,115 |
| $ | 8,101 |
Financing obligation to VICI Properties, Inc. subsidiaries |
|
| 69,356 |
|
| 68,342 |
|
| 127,074 |
|
| 69,356 |
NOL carryforward | |
|
| 2,705 |
|
| — |
Operating and finance leases |
|
| 462 |
|
| 329 |
|
| 394 |
|
| 462 |
Disallowed interest expense |
|
| 3,588 |
|
| — |
|
| 11,036 |
|
| 3,588 |
Accrued liabilities and other |
|
| 1,040 |
|
| 861 |
|
| 1,780 |
|
| 1,040 |
|
|
| 82,547 |
|
| 77,434 |
|
| 151,104 |
|
| 82,547 |
Valuation allowance |
|
| — |
|
| (10,236) |
|
| — |
|
| — |
|
| $ | 82,547 |
| $ | 67,198 |
| $ | 151,104 |
| $ | 82,547 |
Deferred tax liabilities |
|
|
|
|
|
|
|
|
|
|
|
|
Property and equipment |
| $ | (66,062) |
| $ | (66,616) |
| $ | (126,426) |
| $ | (66,062) |
Operating and finance leases |
| (444) |
|
| (313) |
| (375) |
|
| (444) |
Prepaid expenses |
| (342) |
|
| (269) |
| (475) |
|
| (342) |
Unremitted foreign subsidiary earnings | |
| (2,343) |
|
| — |
Other |
|
| (718) |
|
| — |
|
| — |
|
| (718) |
|
| $ | (67,566) |
| $ | (67,198) |
| $ | (129,619) |
| $ | (67,566) |
Long-term deferred tax asset |
| $ | 14,981 |
| $ | — |
| $ | 21,485 |
| $ | 14,981 |
|
|
|
|
|
|
|
|
|
|
|
|
|
Deferred tax assets (liabilities) - foreign |
|
|
|
|
|
|
|
|
|
|
Deferred tax assets |
|
|
|
|
|
|
|
|
|
|
|
|
Property and equipment |
| $ | 276 |
| $ | 704 |
| $ | 314 |
| $ | 276 |
Financing obligation to VICI Properties, Inc. subsidiaries | |
|
| 38,354 |
|
| — |
NOL carryforward |
|
| 7,464 |
|
| 6,331 |
|
| 10,245 |
|
| 7,464 |
Accrued liabilities and other |
|
| 984 |
|
| 1,018 |
|
| 978 |
|
| 984 |
Operating and finance leases |
|
| 8,415 |
|
| 8,615 |
|
| 5,138 |
|
| 8,415 |
Subsidiary liquidation |
|
| 2,810 |
|
| 3,802 |
|
| 2,378 |
|
| 2,810 |
Exchange rate gain |
|
| 926 |
|
| 992 |
|
| 589 |
|
| 926 |
|
|
| 20,875 |
|
| 21,462 |
|
| 57,996 |
|
| 20,875 |
Valuation allowance |
|
| (9,907) |
|
| (10,088) |
|
| (11,389) |
|
| (9,907) |
|
| $ | 10,968 |
| $ | 11,374 |
| $ | 46,607 |
| $ | 10,968 |
Deferred tax liabilities |
|
|
|
|
|
|
|
|
|
|
|
|
Property and equipment |
| $ | (3,823) |
| $ | (4,071) |
| $ | (24,425) |
| $ | (3,823) |
Exchange rate loss |
| (4) |
| (158) |
| (4) |
| (4) |
Intangibles |
| (1,037) |
| (1,110) |
| (1,062) |
| (1,037) |
Operating and finance leases |
| (7,726) |
| (7,894) |
| (4,485) |
| (7,726) |
Unremitted foreign subsidiary earnings | |
| (1,225) |
| — |
Others |
|
| (592) |
|
| (501) |
|
| (609) |
|
| (592) |
|
| $ | (13,182) |
| $ | (13,734) |
| $ | (31,810) |
| $ | (13,182) |
Long-term deferred tax liability |
| $ | (2,214) |
| $ | (2,360) | |
Long-term deferred tax asset (liability) | |
| $ | 14,797 |
| $ | (2,214) |
|
|
|
|
|
|
|
|
|
|
|
|
|
The Company has analyzed filing positions in all of the US federal, state and foreign jurisdictions where it is required to file income tax returns, as well as all open tax years in these jurisdictions. The Company has identified its US federal tax return, its state tax returns in Colorado, Missouri, and West Virginia and Maryland and its foreign tax returns in Canada and Poland as “major” tax jurisdictions, as defined by the Internal Revenue Code.
The Company is not currently under an income tax auditaudits in any US or foreign jurisdiction. However, anyCanada for two of its subsidiaries. Any adjustment made by a taxing authority in the future could impact the effective tax rate.
The Company’s income tax returns for the following periods are currently subject to examination:
|
|
|
|
|
|
|
|
Jurisdiction |
| Periods |
|
US Federal |
| 2017(1), 2019-20212020-2022 |
|
US State - Colorado |
| 2018-20212019-2022
|
|
US State – Missouri |
| 2019-20212020-2022
|
|
US State – West Virginia |
| 2019-20212020-2022
|
|
Canada |
| 2008-20212008-2022
|
|
Mauritius |
| 2019-20212020-2022
|
|
Poland |
| 2017-20212018-2022
|
|
Austria |
| 2017-20212018-2022
|
|
(1)The 2017 tax period subject to examination only applies to the Company’s transition tax liability in the United States.
The Company had income tax net operating loss carryforwards related to its domestic and international operations of approximately $32.9$61.7 million as of December 31, 2022.2023. The Company had recorded $7.5$13.0 million of deferred tax assets related to the net operating loss carryforwards, excluding the impact of the adjustments of valuation allowances and unrecognized tax benefits. The deferred tax assets expire as follows:
|
|
|
|
|
Amounts in thousands |
|
|
|
|
2022 - 2032 |
| $ | 176 | |
2033 - 2042 |
| 6,424 | |
2023 - 2033 | |
| $ | 153 |
2034 - 2043 | |
| 8,747 |
No expiration |
|
| 864 |
|
| 4,050 |
Total deferred tax assets |
| $ | 7,464 |
| $ | 12,950 |
Certain net operating loss carryforwards in the Company’s filed income tax returns include unrecognized tax benefits. The deferred tax assets recognized for those net operating loss carryforwards are presented net of these unrecognized tax benefits.
As of December 31, 2022,2023, the Company has accumulated undistributed earnings generated by its foreign subsidiaries that significantly exceed the approximately $37.1$118.0 million of cash and cash equivalents held by its foreign subsidiaries. Because substantially all of these accumulated undistributed earnings have previously been subject to the one-time transition tax on foreign earnings required by the Tax Act or have been subject to tax under the GILTI regime, any additional taxes due with respect to such earnings or the excess of the amount for financial reporting over the tax basis of the Company’s foreign investments would generally be limited to foreign withholding and state taxes. The determinationthe tax effect of current gains or losses. Historically, the additional deferred taxes that would be provided for undistributed earningsCompany has not been determined because the hypothetical calculation is not practicable. The Company intends, however,intended to indefinitely reinvest these earnings in its foreign subsidiaries. Following the completion of the Canada Real Estate Sale with VICI PropCo, the Company intends to repatriate a portion of its Canadian current earnings for use in the US. As such, the Company has recorded a deferred tax liability of $3.6 million in anticipation of the foreign withholding tax required on a cash dividend to the US. Absent a need for additional funds in the US, management intends to indefinitely reinvest the historical earnings in Canada and expects its future US cash generation to be sufficient to meet its future US cash needs.other foreign jurisdictions.
As of December 31, 2022,2023, the Company’s unrecognized tax benefit totaled $0.5 million.million due to the Company’s ability to utilize pre-acquisition net operating losses. The net decreaseincrease in the current year unrecognized tax benefit is due to a change in foreign exchange rates as well as a lapse of statute of limitations related to the Company’s ability to utilize pre-acquisition net operating losses.rates. A portion of this adjustment has been recorded as a component of taxes payable in the accompanying consolidated balance sheet as of December 31, 2022. It is anticipated that certain tax positions related to2023. The Company received notification of an examination by Canada Revenue Agency and will assess the Company’s ability to utilize pre-acquisition net operating losses will decrease the Company’s balance of unrecognized tax benefits by approximatelyrecognize $0.5 million in 2023, dueincome tax benefits upon completion of the examination, which is anticipated to lapseconclude during 2024. The recognition of statute of limitations. The Company may, from time to time, be assessed interest or penalties by majorthe income tax jurisdictions, although any such assessments historically have been minimal and immaterial to our financial results.benefits would affect the effective tax rate. The Company’s total amount of unrecognized tax benefit and changes to unrecognized tax benefit during the years ended December 31, 20222023 and 20212022 are summarized in the table below:
|
|
|
|
|
|
|
|
|
Amounts in thousands |
| 2022 |
| 2021 |
| 2023 |
| 2022 |
Unrecognized tax benefit - January 1 |
| $ | 777 |
| $ | 835 |
| $ | 528 |
| $ | 777 |
Gross increases - tax positions in prior period |
| 0 |
|
| 3 |
| 11 |
|
| — |
Gross decreases - tax positions in prior period |
| (31) |
|
| — |
| — |
|
| (31) |
Gross increases - tax positions in current period |
| — |
|
| — |
| — |
|
| — |
Settlements |
| — |
|
| — |
| — |
|
| — |
Lapse of statute of limitations |
|
| (218) |
|
| (61) |
|
| — |
|
| (218) |
Unrecognized tax benefit - December 31 |
| $ | 528 |
| $ | 777 |
| $ | 539 |
| $ | 528 |
The Company recognizes interest accrued related to unrecognized tax benefits and penalties as income tax expense. Related to the unrecognized tax benefits noted above, the Company accrued penalties and interest of less than $0.1 million during 2022 and 2021. The $0.5 million balance of unrecognized tax benefits, if recognized, would affect the effective tax rate.
2023.
14. FAIR VALUE MEASUREMENTS AND DERIVATIVE INSTRUMENTS REPORTING
Fair Value Measurements
The Company follows fair value measurement authoritative accounting guidance for all assets and liabilities measured at fair value. That authoritative accounting guidance defines fair value as the price that would be received to sell an asset or paid to transfer a liability (an exit price) in an orderly transaction between market participants at the measurement date. Market or observable inputs are the preferred sources of values, followed by assumptions based on hypothetical transactions in the absence of market inputs. The fair value hierarchy for grouping these assets and liabilities is based on the significance level of the following inputs:
Level 1 – quoted prices in active markets for identical assets or liabilities
Level 2 – quoted prices in active markets for similar assets or liabilities, quoted prices for identical or similar instruments in markets that are not active, and model-derived valuations whose inputs are observable or whose significant value drivers are observable
Level 3 – significant inputs to the valuation model are unobservable
A financial instrument’s categorization within the valuation hierarchy is based upon the lowest level of input that is significant to the fair value measurement. The Company’s assessment of the significance of a particular input to the fair value measurement in its entirety requires judgment and considers factors specific to the asset or liability. The Company reflects transfers between the three levels at the beginning of the reporting period in which the availability of observable inputs no longer justifies classification in the original level. There were no transfers between the three levels for the year ended December 31, 2022.2023.
Nonrecurring Fair Value Measurements
The Company applies the provisions of the fair value measurement standard to its non-recurring, non-financial assets and liabilities measured at fair value. During 2020,The Company applied the Company wrote-down goodwill and intangible assets at certain properties based on forecasted losses and cash flows at these reporting units resulting from the triggering events caused by COVID-19 and, as a result, charged $34.1 million to impairment – intangible and tangible assets on its consolidated statementacquisition method of earnings (loss)accounting for the year endedNugget Acquisition and the Rocky Gap Acquisition. Identifiable assets and liabilities assumed were recognized and measured at fair value as of the acquisition dates. See Note 3 for more information about and accounting for the Nugget Acquisition and the Rocky Gap Acquisition. There were no assets or liabilities measured at fair value on a non-recurring basis as of December 31, 2020. Management’s assessments were designated as Level 3 measurements based on the unobservable nature of the inputs used to evaluate the goodwill and intangible assets. In addition, the Company impaired its MCE investment based on evaluations of the investment resulting from the triggering events caused by COVID-19. The Company made assessments about MCE’s ability to continue as a going concern and future cash flows of MCE. Management’s assessments were designated as Level 3 measurements based on the unobservable nature of the inputs used to evaluate the investment. The Company used an income approach and cost approach and weighted both equally. The resulting fair value was insignificant, and consequently the investment was fully impaired resulting in $1.0 million expense recorded as impairment – intangible and tangible assets on the Company’s consolidated statement of earnings (loss) for the year ended December 31, 2020. The Company classified these impairments as Level 3 because inputs into the valuation model were based on unobservable market information.2022.
Long-Term Debt – The carrying values of the Goldman Credit Agreement, the UniCredit Term LoansLoan and CPLCPL’s short term line of credit approximate fair value based on variable interest paid on the obligations. The carrying values of the UniCredit Term Loan 2 and CPL short-term line of credit approximate fair value due to the short-term nature of the agreements and recently negotiated terms. The estimated fair values of the outstanding balances under the Goldman Credit Agreement and UniCredit Term Loan 1 are designated as Level 2 measurements in the fair value hierarchy based on quoted prices in active markets for similar liabilities. The carrying values of the Company’s finance lease obligations approximate fair value based on the similar terms and conditions currently available to the Company in the marketplace for similar financings.
Other Estimated Fair Value Measurements – The estimated fair values of other assets and liabilities, such as cash and cash equivalents, accounts receivable and accounts payable, have been determined to approximate carrying value based on the short-term nature of those financial instruments. As of December 31, 20222023 and 2021,2022, the Company had no cash equivalents.
15. SEGMENT AND GEOGRAPHIC INFORMATION
The Company reports its financial performance in three reportable segments based on the geographical locations in which its casinos operate: the United States, Canada and Poland. After the Nugget Acquisition, the Company evaluated its operating segments and concluded that as a result of the growth in the United States it would begin viewing its operating segments as East, Midwest and West. The Company views each market in which it operates as a separate operating segment and each casino or other operation within those markets as a reporting unit. Operating segments are aggregated within reportable segments based on their similar economic characteristics, types of customers, types of services and products provided, the regulatory environments in which they operate, and their management and reporting structure. The Company’s operations related to Century Casino Bath, which the Company deconsolidated in May 2020, its concession, management and consulting agreements and certain other corporate and management operations have not been identified as separate reportable segments; therefore, these operations are included in Corporate and Other in the following segment disclosures to reconcile to consolidated results. All intercompany transactions are eliminated in consolidation.
The table below provides information about the aggregation of the Company’s reporting units and operating segments into reportable segments as of December 31, 2022:2023:
|
|
|
Reportable Segment | Operating Segment | Reporting Unit |
United States | ColoradoEast
| Mountaineer Casino, Resort & Races (1) |
|
| Rocky Gap Casino, Resort & Golf (1) |
| Midwest | Century Casino & Hotel - Central City |
|
| Century Casino & Hotel - Cripple Creek |
| West Virginia
| Mountaineer Casino, Racetrack & Resort
|
| Missouri
| Century Casino Cape Girardeau(1) |
|
| Century Casino Caruthersville (1) and The Farmstead |
| West | Nugget Casino Resort and Smooth Bourbon, LLC |
Canada | EdmontonCanada (2)
| Century Casino & Hotel - Edmonton(1) |
|
| Century Casino St. Albert(1) |
|
| Century Mile Racetrack and Casino(1) |
| Calgary (2)
| Century Downs Racetrack and Casino(1) |
Poland | Poland | Casinos Poland |
Corporate and Other | Corporate and Other | Cruise Ships & Other(3) |
|
| Corporate Other (3)(4) |
(1)Includes The Farmstead.real estate assets are owned by VICI PropCo and its affiliates.
(2)The Company operated Century Sports through February 10, 2022 and Century Bets through August 2021, when operations were transferred to Century Mile. For more information about Century Sports and Century Bets, see2022. See Note 1.
(3)The Company operated on ship-based casinos through April 16, 2023. See Note 1.
(4)Prior to the Nugget Acquisition, the Company’s equity investment in Smooth Bourbon iswas included in the Corporate Other reporting unit.
The Company’s chief operating decision maker is a management function comprised of two individuals. These two individuals are the Company’s Co-Chief Executive Officers. The Company’s chief operating decision makers and management utilize Adjusted EBITDAEBITDAR as a primary profit measure for its reportable segments.
Adjusted EBITDAEBITDAR
Adjusted EBITDAR is a non-US GAAP measure defined as net earnings (loss) attributable to Century Casinos, Inc. shareholders before interest expense (income), net, income taxes (benefit), depreciation, amortization, non-controlling interest (earnings) losses and transactions, pre-opening expenses, acquisition costs, non-cash stock-based compensation charges, asset impairment costs, (gain) loss on disposition of fixed assets, discontinued operations, (gain) loss on foreign currency transactions, cost recovery income and other, gain on business combination and certain other one-time transactions. Expense related to the Master Lease is included in the interest expense (income), net line item. Intercompany transactions consisting primarily of management and royalty fees and interest, along with their related tax effects, are excluded from the presentation of net earnings (loss) attributable to Century Casinos, Inc. shareholders and Adjusted EBITDAEBITDAR reported for each segment. Non-cash stock-based compensation expense is presented under Corporate and Other in the tables below as the expense is not allocated to reportable segments when reviewed by the Company’s chief operating decision makers. Not all of the aforementioned items occur in each reporting period, but have been included in the definition based on historical activity. These adjustments have no effect on the consolidated results as reported under US GAAP. Adjusted EBITDAR is not considered a measure of performance recognized under US GAAP.
The following tables provide summary information regarding the Company’s reportable segments:
|
|
|
|
|
|
|
|
|
|
|
|
|
|
|
|
|
|
|
|
|
|
|
| For the year ended December 31, 2022 | For the year ended December 31, 2023 |
Amounts in thousands |
|
| United States |
|
| Canada |
|
| Poland |
|
| Corporate and Other |
|
| Total |
|
| United States |
|
| Canada |
|
| Poland |
|
| Corporate and Other |
|
| Total |
Net operating revenue (1) |
| $ | 268,582 |
| $ | 71,572 |
| $ | 90,169 |
| $ | 206 |
| $ | 430,529 |
| $ | 380,591 |
| $ | 75,449 |
| $ | 94,105 |
| $ | 61 |
| $ | 550,206 |
|
|
|
|
|
|
|
|
|
|
|
| |
Earnings from equity investment |
| $ | — |
| $ | — |
| $ | — |
| $ | 3,249 |
| $ | 3,249 |
| — |
| — |
|
| — |
| 1,121 |
| 1,121 |
|
|
|
|
|
|
|
|
|
|
|
| |
Earnings (loss) before income taxes |
| $ | 32,354 |
| $ | 11,211 |
| $ | 11,044 |
| $ | (48,599) |
| $ | 6,010 |
| 25,974 |
| 7,071 |
|
| 6,704 |
| (63,581) |
| (23,832) |
|
|
|
|
|
|
|
|
|
|
|
|
|
|
|
|
|
|
|
|
|
|
|
|
|
|
|
|
|
|
|
Net earnings (loss) attributable to Century Casinos, Inc. shareholders |
| $ | 24,759 |
| $ | 6,070 |
| $ | 5,811 |
| $ | (28,664) |
| $ | 7,976 |
| $ | 18,036 |
| $ | 8,626 |
| $ | 3,446 |
| $ | (58,306) |
| $ | (28,198) |
Interest expense (income), net (2) |
| 28,531 |
| 2,281 |
|
| (686) |
| 34,854 |
| 64,980 |
| 38,024 |
| 11,527 |
|
| (345) |
| 42,605 |
| 91,811 |
Income taxes (benefit) |
| 7,595 |
| 2,354 |
|
| 2,326 |
| (19,935) |
| (7,660) | |
Income tax expense (benefit) | |
| 2,654 |
| (4,256) |
|
| 1,534 |
| (5,275) |
| (5,343) |
Depreciation and amortization |
| 19,364 |
| 4,754 |
|
| 2,606 |
| 385 |
| 27,109 |
| 33,739 |
| 4,590 |
|
| 2,482 |
| 232 |
| 41,043 |
Net earnings attributable to non-controlling interests |
| — |
| 2,787 |
|
| 2,907 |
| — |
| 5,694 |
| 5,284 |
| 2,701 |
|
| 1,724 |
| — |
| 9,709 |
Non-cash stock-based compensation |
| — |
| — |
|
| — |
| 3,335 |
| 3,335 |
| — |
| — |
|
| — |
| 3,610 |
| 3,610 |
(Gain) loss on foreign currency transactions, cost recovery income and other (3) |
| (1) |
| 123 |
|
| (1,153) |
| (205) |
| (1,236) |
| (84) |
| (3,195) |
|
| (810) |
| 401 |
| (3,688) |
Loss (gain) on disposition of fixed assets |
| 49 |
| 27 |
|
| 63 |
| (121) |
| 18 | |
Loss on disposition of fixed assets | |
| 537 |
| 10 |
|
| 31 |
| 113 |
| 691 |
Acquisition costs |
| — |
| — |
|
| — |
| 3,124 |
| 3,124 |
| — |
| — |
|
| — |
| 4,412 |
| 4,412 |
Adjusted EBITDA |
| $ | 80,297 |
| $ | 18,396 |
| $ | 11,874 |
| $ | (7,227) |
| $ | 103,340 | |
Adjusted EBITDAR | |
| $ | 98,190 |
| $ | 20,003 |
| $ | 8,062 |
| $ | (12,208) |
| $ | 114,047 |
|
|
|
|
|
|
|
|
|
|
|
|
|
|
|
|
|
|
|
|
|
|
|
|
|
|
|
|
|
|
|
Long-lived assets (4) |
| $ | 466,403 |
| $ | 139,304 |
| $ | 27,134 |
| $ | 8,192 |
| $ | 641,033 |
| $ | 947,075 |
| $ | 137,543 |
| $ | 26,736 |
| $ | 3,328 |
| $ | 1,114,682 |
|
|
|
|
|
|
|
|
|
|
|
|
|
|
|
| |
Total assets (5) |
| $ | 425,820 |
| $ | 162,088 |
| $ | 42,173 |
| $ | 254,886 |
| $ | 884,967 |
| $ | 1,018,926 |
| $ | 238,643 |
| $ | 39,892 |
| $ | 62,201 |
| $ | 1,359,662 |
|
|
|
|
|
|
|
|
|
|
|
|
|
|
|
| |
Capital expenditures |
| $ | 16,000 |
| $ | 1,566 |
| $ | 1,578 |
| $ | 49 |
| $ | 19,193 |
| $ | 55,389 |
| $ | 2,330 |
| $ | 1,816 |
| $ | 86 |
| $ | 59,621 |
|
|
|
|
|
|
|
|
|
|
|
|
|
|
|
| |
|
|
|
|
|
|
|
|
|
|
|
| |
(1)Net operating revenue for the Corporate and Other segment primarily relatesrelated to the Company’s cruise ship operations.operations, which ceased in April 2023.
(2)Expense of $28.5 million related to the Master Lease is included in interestInterest expense (income), net in the United States segment.and Canada segments primarily relates to the Master Lease. Expense of $2.3 million related to the CDR land lease is included inwas recorded as interest expense (income), net in the Canada segment. Cash paymentsThe CDR land lease ended on September 6, 2023 in conjunction with the Canada Real Estate Sale. Expense of $7.3 million in Canada relates to the debt extinguishment of the CDR land lease.
(3)Included in the Canada segment is $1.7 million related to the earn out from the sale of casino operations in Calgary in 2020 and $3.5 million cost recovery income for CDR.
(4)Long-lived assets are calculated as total assets less total current assets, deferred income taxes and note receivable, net of current portion and unamortized discount. Long-lived assets in the United States segment include $283.6 million related to the Nugget Acquisition and $261.7 million related to the Rocky Gap Acquisition.
(5)Total assets in the United States segment include $298.8 million related to the Nugget Acquisition and $268.9 million related to the Rocky Gap Acquisition.
|
|
|
|
|
|
|
|
|
|
|
|
|
|
|
|
| For the year ended December 31, 2022 |
Amounts in thousands |
|
| United States |
|
| Canada |
|
| Poland |
|
| Corporate and Other |
|
| Total |
Net operating revenue (1) |
| $ | 268,582 |
| $ | 71,572 |
| $ | 90,169 |
| $ | 206 |
| $ | 430,529 |
Earnings from equity investment |
|
| — |
|
| — |
|
| — |
|
| 3,249 |
|
| 3,249 |
Earnings (loss) before income taxes |
|
| 32,354 |
|
| 11,211 |
|
| 11,044 |
|
| (48,599) |
|
| 6,010 |
|
|
|
|
|
|
|
|
|
|
|
|
|
|
|
|
Net earnings (loss) attributable to Century Casinos, Inc. shareholders |
| $ | 24,759 |
| $ | 6,070 |
| $ | 5,811 |
| $ | (28,664) |
| $ | 7,976 |
Interest expense (income), net (2) |
|
| 28,531 |
|
| 2,281 |
|
| (686) |
|
| 34,854 |
|
| 64,980 |
Income tax expense (benefit) |
|
| 7,595 |
|
| 2,354 |
|
| 2,326 |
|
| (19,935) |
|
| (7,660) |
Depreciation and amortization |
|
| 19,364 |
|
| 4,754 |
|
| 2,606 |
|
| 385 |
|
| 27,109 |
Net earnings attributable to non-controlling interests |
|
| — |
|
| 2,787 |
|
| 2,907 |
|
| — |
|
| 5,694 |
Non-cash stock-based compensation |
|
| — |
|
| — |
|
| — |
|
| 3,335 |
|
| 3,335 |
(Gain) loss on foreign currency transactions, cost recovery income and other (3) |
|
| (1) |
|
| 123 |
|
| (1,153) |
|
| (205) |
|
| (1,236) |
Loss (gain) on disposition of fixed assets |
|
| 49 |
|
| 27 |
|
| 63 |
|
| (121) |
|
| 18 |
Acquisition costs |
|
| — |
|
| — |
|
| — |
|
| 3,124 |
|
| 3,124 |
Adjusted EBITDAR |
| $ | 80,297 |
| $ | 18,396 |
| $ | 11,874 |
| $ | (7,227) |
| $ | 103,340 |
|
|
|
|
|
|
|
|
|
|
|
|
|
|
|
|
Long-lived assets (4) |
| $ | 466,403 |
| $ | 139,304 |
| $ | 27,134 |
| $ | 8,192 |
| $ | 641,033 |
Total assets (5) |
| $ | 425,820 |
| $ | 162,088 |
| $ | 42,173 |
| $ | 254,886 |
| $ | 884,967 |
Capital expenditures |
| $ | 16,000 |
| $ | 1,566 |
| $ | 1,578 |
| $ | 49 |
| $ | 19,193 |
(1)Net operating revenue for the Corporate and Other segment primarily related to the Company’s cruise ship operations, which ceased in April 2023.
(2)Interest expense in the United States segment primarily relates to the Master Lease andLease. Expense in the Canada segment primarily relates to the CDR land lease were $25.7 million and $2.1 million, respectively, for the period presented. lease. Expense of $7.3 million related to the write-off of deferred financing costs in connection with the prepayment of the Macquarie Term Loan is included in interest expense (income), net in the Corporate and Other segment.
(3)Loss of $2.2 million related to the sale of the land and building in Calgary in February 2022 is included in the Canada segment. The loss from the sale was offset by $1.9 million cost recovery income for CDR.
(4)Long-lived assets are calculated as total assets less total current assets, deferred income taxes and note receivable, net of current portion and unamortized discount.
(5)Total assets for the Corporate and Other segment include $100.2 million in restricted cash related to the Acquisition Escrow and $93.3 million related to the equity investment in Smooth Bourbon.
|
|
|
|
|
|
|
|
|
|
|
|
|
|
|
|
|
|
|
|
|
|
|
| For the year ended December 31, 2021 | For the year ended December 31, 2021 |
Amounts in thousands |
|
| United States |
|
| Canada |
|
| Poland |
|
| Corporate and Other |
|
| Total |
|
| United States |
|
| Canada |
|
| Poland |
|
| Corporate and Other |
|
| Total |
Net operating revenue (1) |
| $ | 283,285 |
| $ | 46,428 |
| $ | 58,226 |
| $ | 567 |
| $ | 388,506 |
| $ | 283,285 |
| $ | 46,428 |
| $ | 58,226 |
| $ | 567 |
| $ | 388,506 |
|
|
|
|
|
|
|
|
|
|
|
| |
Earnings from equity investment | |
|
| — |
| — |
|
| — |
| — |
| — |
Earnings (loss) before income taxes |
| $ | 49,628 |
| $ | 3,312 |
| $ | 921 |
| $ | (25,712) |
| $ | 28,149 |
| 49,628 |
| 3,312 |
|
| 921 |
| (25,712) |
| 28,149 |
|
|
|
|
|
|
|
|
|
|
|
|
|
|
|
|
|
|
|
|
|
|
|
|
|
|
|
|
|
|
|
Net earnings (loss) attributable to Century Casinos, Inc. shareholders |
| $ | 49,628 |
| $ | 1,124 |
| $ | 440 |
| $ | (30,570) |
| $ | 20,622 |
| $ | 49,628 |
| $ | 1,124 |
| $ | 440 |
| $ | (30,570) |
| $ | 20,622 |
Interest expense (income), net (2) |
| 28,229 |
| 1,796 |
|
| (477) |
| 13,110 |
| 42,658 |
| 28,229 |
| 1,796 |
|
| (477) |
| 13,110 |
| 42,658 |
Income taxes |
| — |
| 1,256 |
|
| 257 |
| 4,858 |
| 6,371 | |
Income tax expense | |
| — |
| 1,256 |
|
| 257 |
| 4,858 |
| 6,371 |
Depreciation and amortization |
| 18,398 |
| 4,904 |
|
| 3,028 |
| 432 |
| 26,762 |
| 18,398 |
| 4,904 |
|
| 3,028 |
| 432 |
| 26,762 |
Net earnings attributable to non-controlling interests |
| — |
| 932 |
|
| 224 |
| — |
| 1,156 |
| — |
| 932 |
|
| 224 |
| — |
| 1,156 |
Non-cash stock-based compensation |
| — |
| — |
|
| — |
| 2,652 |
| 2,652 |
| — |
| — |
|
| — |
| 2,652 |
| 2,652 |
Gain on foreign currency transactions, cost recovery income and other (3) |
| (836) |
| (545) |
|
| (887) |
| (418) |
| (2,686) |
| (836) |
| (545) |
|
| (887) |
| (418) |
| (2,686) |
Loss (gain) on disposition of fixed assets |
| 341 |
| 43 |
|
| 44 |
| (37) |
| 391 |
| 341 |
| 43 |
|
| 44 |
| (37) |
| 391 |
Adjusted EBITDA |
| $ | 95,760 |
| $ | 9,510 |
| $ | 2,629 |
| $ | (9,973) |
| $ | 97,926 | |
Adjusted EBITDAR | |
| $ | 95,760 |
| $ | 9,510 |
| $ | 2,629 |
| $ | (9,973) |
| $ | 97,926 |
|
|
|
|
|
|
|
|
|
|
|
|
|
|
|
|
|
|
|
|
|
|
|
|
|
|
|
|
|
|
|
Long-lived assets (4) |
| $ | 376,210 |
| $ | 152,278 |
| $ | 29,865 |
| $ | 3,412 |
| $ | 561,765 |
| $ | 376,210 |
| $ | 152,278 |
| $ | 29,865 |
| $ | 3,412 |
| $ | 561,765 |
|
|
|
|
|
|
|
|
|
|
|
|
|
|
|
| |
Total assets |
| $ | 422,409 |
| $ | 179,297 |
| $ | 44,204 |
| $ | 57,448 |
| $ | 703,358 |
| $ | 422,409 |
| $ | 179,297 |
| $ | 44,204 |
| $ | 57,448 |
| $ | 703,358 |
|
|
|
|
|
|
|
|
|
|
|
|
|
|
|
| |
Capital expenditures |
| $ | 8,672 |
| $ | 646 |
| $ | 163 |
| $ | 531 |
| $ | 10,012 |
| $ | 8,672 |
| $ | 646 |
| $ | 163 |
| $ | 531 |
| $ | 10,012 |
|
|
|
|
|
|
|
|
|
|
|
|
|
|
|
| |
|
|
|
|
|
|
|
|
|
|
|
| |
(1)Net operating revenue for the Corporate and Other segment primarily relates to the Company’s cruise ship operations.operations, which ceased in April 2023.
(2)Expense of $28.2 million related to the Master Lease is included in interestInterest expense (income), net in the United States segment.segment primarily relates to the Master Lease. Expense of $1.8 million relatedin the Canada segment primarily relates to the CDR land lease is included in interest expense (income), net in the Canada segment. Cash payments related to the Master Lease and CDR land lease were $25.3 million and $2.0 million, respectively, for the period presented.lease.
(3)Income of $0.8 million related to the sale of unused land at Mountaineer, net of expenses, is included in the United States segment.
(4)Long-lived assets are calculated as total assets less total current assets, deferred income taxes and note receivable, net of current portion and unamortized discount.
|
|
|
|
|
|
|
|
|
|
|
|
|
|
|
|
| For the year ended December 31, 2020 |
Amounts in thousands |
|
| United States |
|
| Canada |
|
| Poland |
|
| Corporate and Other |
|
| Total |
Net operating revenue (1) |
| $ | 198,344 |
| $ | 50,240 |
| $ | 54,271 |
| $ | 1,413 |
| $ | 304,268 |
|
|
|
|
|
|
|
|
|
|
|
|
|
|
|
|
(Loss) earnings before income taxes |
| $ | (29,548) |
| $ | 6,869 |
| $ | (2,578) |
| $ | (18,031) |
| $ | (43,288) |
|
|
|
|
|
|
|
|
|
|
|
|
|
|
|
|
Net (loss) earnings attributable to Century Casinos, Inc. shareholders |
| $ | (30,571) |
| $ | 2,551 |
| $ | (1,373) |
| $ | (18,609) |
| $ | (48,002) |
Interest expense (income), net (2) |
|
| 28,357 |
|
| 2,047 |
|
| 27 |
|
| 12,667 |
|
| 43,098 |
Income taxes (benefit) |
|
| 1,023 |
|
| 3,765 |
|
| (518) |
|
| 578 |
|
| 4,848 |
Depreciation and amortization |
|
| 17,580 |
|
| 5,264 |
|
| 3,124 |
|
| 566 |
|
| 26,534 |
Net earnings (loss) attributable to non-controlling interests |
|
| — |
|
| 553 |
|
| (687) |
|
| — |
|
| (134) |
Non-cash stock-based compensation |
|
| — |
|
| — |
|
| — |
|
| (214) |
|
| (214) |
Gain on foreign currency transactions, cost recovery income and other (3) |
|
| — |
|
| (6,015) |
|
| (233) |
|
| (6,897) |
|
| (13,145) |
Impairment - intangible and tangible assets |
|
| 30,746 |
|
| 3,375 |
|
| — |
|
| 1,000 |
|
| 35,121 |
Loss (gain) on disposition of fixed assets |
|
| 64 |
|
| (43) |
|
| 4 |
|
| 1 |
|
| 26 |
Acquisition costs |
|
| — |
|
| — |
|
| — |
|
| 266 |
|
| 266 |
Adjusted EBITDA |
| $ | 47,199 |
| $ | 11,497 |
| $ | 344 |
| $ | (10,642) |
| $ | 48,398 |
|
|
|
|
|
|
|
|
|
|
|
|
|
|
|
|
Long-lived assets (4) |
| $ | 385,426 |
| $ | 156,433 |
| $ | 39,066 |
| $ | 3,971 |
| $ | 584,896 |
|
|
|
|
|
|
|
|
|
|
|
|
|
|
|
|
Total assets |
| $ | 417,388 |
| $ | 181,477 |
| $ | 49,372 |
| $ | 32,523 |
| $ | 680,760 |
|
|
|
|
|
|
|
|
|
|
|
|
|
|
|
|
Capital expenditures |
| $ | 7,767 |
| $ | 2,057 |
| $ | 719 |
| $ | 162 |
| $ | 10,705 |
|
|
|
|
|
|
|
|
|
|
|
|
|
|
|
|
(1)Net operating revenue for the Corporate and Other segment primarily relates to CCB and the Company’s cruise ship operations.
(2)Expense of $28.4 million related to the Master Lease is included in interest expense (income), net in the United States segment. Expense of $1.5 million related to the CDR land lease is included in interest expense (income), net in the Canada segment. Cash payments related to the Master Lease and CDR land lease were $25.0 million and $1.3 million, respectively, for the period presented.
(3)Income of $6.5 million is included in the Canada segment related to the sale of the casino operations of Century Casino Calgary.
(4)Long-lived assets are calculated as total assets less total current assets, deferred income taxes and note receivable, net of current portion and unamortized discount.
16. COMMITMENTS, CONTINGENCIES AND OTHER MATTERS
Litigation – From time to time, the Company is subject to various legal proceedings arising from normal business operations. The Company does not expect the outcome of such proceedings, either individually or in the aggregate, to have a material effect on its financial position, cash flows or results of operations.
The Company had a contingent liability related to a series of tax audits conducted by the Polish IRS related to the calculation and payment of personal income tax by CPL employees for periods ranging from 2007 to 2013. The Polish IRS asserted that CPL should calculate, collect and remit to the Polish IRS personal income tax on tips received by CPL employees from casino customers and prevailed in several court challenges by CPL. Through December 31, 2022,2023, CPL has paid PLN 14.3 million ($4.2 million) to the Polish IRS related to these audits.
The statute of limitations expired on all open periods in which CPL calculated personal income tax in which the Polish IRS disagreed. The Company adjusted its contingent liability related to the CPL taxes to remove the estimated taxes accrued for these tax years due to the statute of limitations expiring. The adjustments reduced the contingent liability by PLN 1.8 million ($0.5 million) and PLN 2.8 million ($0.7 million) in December 2021 and 2020, respectively, and were recorded as gain on foreign currency transactions, cost recovery income and other on the Company’s consolidated statementsstatement of (loss) earnings (loss) for the yearsyear ended December 31, 2021 and 2020, respectively.2021. In September 2022, the Polish IRS reimbursed PLN 1.8 million ($0.4 million based on the exchange rate in effect on September 30, 2022) plus interest, after CPL prevailed in a court challenge of a 2011 tax audit. In September 2021, the Polish IRS reimbursed CPL PLN 2.4 million ($0.6 million based on the exchange rate in effect on September 30, 2021) plus interest, after CPL prevailed in a court challenge of a 2012 tax audit. The Company recorded the Polish IRS reimbursement to gain on foreign currency transactions, cost recovery income and other on its consolidated statementstatements of (loss) earnings (loss) for the years ended December 31, 2022 and 2021. Any additional tax obligations are not probable or estimable and no additional future tax obligations as a result of these matters are expected.
Distribution to Non-Controlling Interest – The Company purchased a portion of its ownership interest in CDR in November 2013. Prior to the Company’s acquisition of its ownership interest in CDR, the non-controlling shareholders built infrastructure in the land surrounding CDR. When funds for the use of this infrastructure are received by CDR from unrelated parties, they are distributed to CDR’s non-controlling shareholders through non-controlling interest. The Company distributed $3.5 million, $2.0 million $0.7 million and $0.2$0.7 million related to the infrastructure to CDR’s non-controlling shareholders during the years ended December 31, 2023, 2022 2021 and 2020,2021, respectively.
Employee Benefit Plans – The Company provides its employees in the United States with a 401(k) Savings and Retirement Plan (the “401K Plan”). The 401K Plan allows eligible employees to make tax-deferred cash contributions that are matched on a discretionary basis by the Company up to a specified level. Participants become fully vested in employer contributions over a six year period. The Company contributed $0.5$1.0 million, $0.5 million and $0.3$0.5 million for the years ended December 31, 2023, 2022 2021 and 2020,2021, respectively.
The Company provides its employees in Canada with two registered retirement plans: the Registered Savings Plan (the “RSP Plan”) and Registered Pension Plan (the “RPP Plan”, and collectively the “RSP and RPP Plans”). The RSP and RPP Plans allow eligible employees to make tax-deferred cash contributions that are matched on a discretionary basis by the Company up to a specified level. Participants in the RPP Plan become fully vested in employer contributions over a two year period, and participants in the RSP Plan become fully vested in employer contributions immediately. The Company contributed $0.3 million, $0.2$0.3 million and $0.2 million to the RSP and RPP Plans for the years ended December 31, 2023, 2022 2021 and 2020,2021, respectively.
17. TRANSACTIONS WITH RELATED PARTIES
The Company has entered into separate management agreements with Flyfish Management & Consulting AG (“Flyfish”), a management company controlled by Co CEO Erwin Haitzmann, and with Focus Lifestyle and Entertainment AG (“Focus”), a management company controlled by Co CEO Peter Hoetzinger’s family trust/foundation, to secure the services of each officer and related management company. Both Co CEOs are responsible for planning, directing, and controlling the activities of the Company. Included in the consolidated statements of (loss) earnings (loss) are payments to both Flyfish and Focus for a total of $0.8 million, $0.7 million, and $0.7 million for each of the years ended December 31, 2023, 2022 and 2021, and 2020.respectively.
The Company has entered into an agreement for general contracting services with Marnell, with which the Company owns 50% of Smooth Bourbon.Bourbon, for general contracting and consulting services. The Company hashad a liability of less than $0.1 million related to open invoices in accounts payable and $0.4 million related to construction performed by Marnell in accrued liabilities on its consolidated balance sheets for the yearyears ended December 31, 2022. 2023 and 2022, respectively.
The Company has also has entered into certaina consulting agreementsagreement with Marnell for services after the acquisition of OpCo isNugget Acquisition was completed. Fees incurred under the agreement were $0.4 million for the year ended December 31, 2023 and were recorded as general and administrative expenses in the United States segment. The agreement ended on September 30, 2023. Additional expenses related to Marnell were $0.1 million for the year ended December 31, 2023 and were recorded as general and administrative expenses in the United States segment. No services were performed under the agreementsagreement during the year ended December 31, 2022.
18. SUBSEQUENT EVENTS
The Company evaluated subsequent events and accounting and disclosure requirements related to material subsequent events in its consolidated financial statements and related notes.
The Company did not identify any material subsequent events impactingrepurchased approximately $3.5 million principal amount of the Goldman Term Loan at 97% of its financial statementsvalue in this report.February 2024.
In Poland, the Company was granted licenses for the two casinos that it had closed in October 2023 due to the expiration of the casino licenses. The Company reopened the casino in Bielsko-Biala in February 2024 and anticipates reopening the casino in Katowice in March 2024. In November 2023, the Company closed its Wroclaw casino due to the expiration of the casino license. The Company was granted a new license for Wroclaw in December 2023 and anticipates reopening the casino in a new location in the third quarter of 2024.