Use these links to rapidly review the document
INDEX TO FINANCIAL STATEMENTS AND FINANCIAL STATEMENT SCHEDULES
TABLE OF CONTENTS
UNITED STATES
SECURITIES AND EXCHANGE COMMISSION
Washington, D.C. 20549
FORM 10-K
(Mark One)
(x)ý ANNUAL REPORT PURSUANT TO SECTION 13 OR 15(d) OF THE SECURITIES
EXCHANGE ACT OF 1934
For the fiscal year endedDecember 31, 20002004
or
( )o TRANSITION REPORT PURSUANT TO SECTION 13 OR 15(d) OF THE SECURITIES
EXCHANGE ACT OF 1934
For the transition period fromto
| Commission Commision
File Number
| | | | Registrant, State of Incorporation,
Address and Telephone Number
| | | | I.R.S. Employer
Identification No.
|
|---|
| | | | |
1-11377 | | CINERGY CORP.
(A Delaware Corporation)
139 East Fourth Street
Cincinnati, Ohio 45202
(513) 287-1099421-9500 | | 31-1385023 |
| | | | |
1-1232 | | THE CINCINNATI GAS & ELECTRIC COMPANY
(An Ohio Corporation)
139 East Fourth Street
Cincinnati, Ohio 45202
(513) 287-1099421-9500 | | 31-0240030 |
| | | | |
1-3543 | | PSI ENERGY, INC.
(An Indiana Corporation)
1000 East Main Street
Plainfield, Indiana 46168
(513) 287-1099421-9500 | | 35-0594457 |
| | | | |
2-7793 | | THE UNION LIGHT, HEAT AND POWER COMPANY
(A Kentucky Corporation)
139 East Fourth Street
Cincinnati, Ohio 45202
(513) 287-1099421-9500 | | 31-0473080 |
| | | | |
| | | | |
| | | | |
Each of the following classes or series of securities registered pursuant to Section 12(b) of the Act is registered on the New York Stock Exchange:
| Registrant
| | | | Title of each class
| |
|
|---|
| | | | | |
Cinergy Corp. | | Common Stock | | | |
| | | | | |
The Cincinnati Gas & Electric Company | | Cumulative Preferred Stock | | 4 | % |
| | Junior Subordinated Debentures | | 8.28 | % |
PSI Energy, Inc. | | Cumulative Preferred Stock | | 4.32 | % |
| | Cumulative Preferred Stock | | 4.16 | % |
| | Cumulative Preferred Stock | | 6-7/6-7/8 | % |
| | | | | |
The Union Light, Heat and Power Company | | None | | | |
| | | | | |
Securities registered pursuant to Section 12(g) of the Act: None
Indicate by check mark whether each registrant (1) has filed all reports required to be filed by Section 13 or 15(d) of the Securities Exchange Act of 1934 during the preceding 12 months (or for such shorter period that such registrant was required to file such reports), and (2) has been subject to such filing requirements for the past 90 days.
Yes /x/ý No / /o
Indicate by check mark if disclosure of delinquent filers pursuant to Item 405 of Regulation S-K is not contained herein, and will not be contained, to the best of registrants'registrants’ knowledge, in definitive proxy or information statements incorporated by reference in Part III of this Form 10-K or any amendment to this Form 10-K. ( )o
Requirements pursuant to Item 405 of Regulation S-K are not applicable forThe Union Light,,Heat and Power Company.
The Union Light,,Heat and Power Company meets the conditions set forth in General Instruction I (1)(a) and (b) of Form 10-K and is therefore filing this Form 10-K with the reduced disclosure format specified in General Instruction I (2) of Form 10-K.
Indicate by check mark whether each registrant is an accelerated filer (as defined in Rule 12b-2 of the Act).
| Cinergy Corp. | Yes | ý | No | o |
| The Cincinnati Gas & Electric Company | Yes | o | No | ý |
| PSI Energy, Inc. | Yes | o | No | ý |
| The Union Light, Heat and Power Company | Yes | o | No | ý |
As of January 31, 2001,June 30, 2004, the aggregate market value of the common equity ofCinergy Corp. held by nonaffiliatesnon-affiliates (shareholders who are not directors or executive officers) was $4.8$6.8 billion. All of the common stock ofThe Cincinnati Gas & Electric Company andPSI Energy,,Inc. is owned byCinergy Corp., and all of the common stock ofThe Union Light,,Heat and Power Company is owned byThe Cincinnati Gas & Electric Company. As of January 31, 2001,2005, each registrant had the following shares of common stock outstanding:
| Registrant
| | |
| Description
| | |
| Shares
|
|
|---|
| | | | | |
Cinergy Corp. | | Par value $.01 per share | | 158,980,363191,404,406 | |
| | | | | |
The Cincinnati Gas & Electric Company | | Par value $8.50 per share | | 89,663,086 | |
| | | | | |
PSI Energy, Inc. | | Without par value, stated value $.01 per share | | 53,913,701 | |
| | | | | |
The Union Light, Heat and Power Company | | Par value $15.00 per share | | 585,333 | |
| | | | | |
2
DOCUMENTS INCORPORATED BY REFERENCE
Portions of the Proxy Statement ofCinergy Corp. and the Information Statement ofPSI Energy, Inc. filed, or to be filed with the Securities and Exchange Commission in 2005 are incorporated by reference into Part III of this report.
This combined Form 10-K is separately filed byCinergy Corp.,The Cincinnati Gas & Electric Company,PSI Energy,,Inc., andThe Union Light,,Heat and Power Company. Information contained herein relating to any individual registrant is filed by such registrant on its own behalf. Each registrant makes no representation as to information relating to registrants other than itself.
3
CAUTIONARY STATEMENTS
In this reportCinergy (which includesCinergy Corp. and all of our regulated and non-regulated subsidiaries) is, at times, referred to in the first person as "we"“we”, "our"“our”, or "us"“us”.
CAUTIONARY STATEMENTS REGARDING FORWARD-LOOKING INFORMATION
In this report we discuss various matters that may make management's corporate visionThis document includes forward-looking statements within the meaning of Section 27A of the future clearer for you. This report outlines management's goalsSecurities Act of 1933 and projections forSection 21E of the future. These goals and projections are considered forward-lookingSecurities Exchange Act of 1934. Forward-looking statements and are based on management'smanagement’s beliefs and assumptions. These forward-looking statements are identified by terms and phrases such as “anticipate”, “believe”, “intend”, “estimate”, “expect”, “continue”, “should”, “could”, “may”, “plan”, “project”, “predict”, “will”, and similar expressions.
Forward-looking statements involve risks and uncertainties that may cause actual results to be materially different from the results predicted. Factors that could cause actual results to differ are often presented with forward-looking statements. In addition, other factors could cause actual results to differ materially from those indicated in any forward-looking statement. These include:statement include, but are not limited to:
•
- Factors affecting operations, such as:
(1)
(1) unusual unanticipated weather conditions;
(2) catastrophic weather-related damage;
(3) unscheduled generation outages;
(4)
(3) unusual maintenance or repairs;
(5)
(4) unanticipated changes in fossil fuel costs, gas supply costs, or availability constraints;
(6)costs;
(5) environmental incidents; and
(7)
(6) electric transmission or gas pipeline system constraints.
•
- Legislative and regulatory initiatives
regarding deregulation of the industry, including potential deregulation legislation in Indiana, and potential national deregulation legislation.
- legal developments.
•
The timing and extent of the entry of additional Additional competition in electric or gas markets and the effects of continued industry consolidation through the pursuit of mergers, acquisitions, and strategic alliances.
- consolidation.
•
Regulatory factors such as changes in the policies or procedures that set rates; changes in our ability to recover capital expenditures for environmental compliance, purchased power costs and investments made under traditional regulation through rates; and changes to the frequency and timing of rate increases.
•- Financial or regulatory accounting principles
or policies imposed by governing bodies.
•Political, legal,including costs of compliance with existing and economic conditions and developments in the United States (U.S.) and the foreign countries in which we have a presence. This would include inflation rates and monetary fluctuations.
- future environmental requirements.
•
- Changing market conditions and other factors related to physical energy and financial trading activities.
These would include price, basis, credit, liquidity, volatility, capacity, transmission, currency exchange rates, interest rates, and warranty risks.
•
- The performance of projects undertaken by our non-regulated businesses and the success of efforts to invest in and develop new opportunities.
•
- Availability of, or cost of, capital.
•
- Employee workforce
factors, including changes in key executives, collective bargaining agreements with union employees, and work stoppages.
- factors.
•
Legal and regulatory delays Delays and other obstacles associated with mergers, acquisitions, and investments in joint ventures.•
•- Costs and effects of legal and administrative proceedings, settlements, investigations, and claims.
Examples can be found in Note 12We undertake no obligation to update the information contained herein.
5
BUSINESS
We make our annual report on Form 10-K, quarterly reports on Form 10-Q, current reports on Form 8-K, and amendments to those reports, filed or furnished pursuant to section 13(a) or 15(d) of the "NotesSecurities Exchange Act of 1934 available free of charge on or through our internet website, www.cinergy.com, as soon as reasonably practicable after we electronically file such material with, or furnish it to, Financial Statements" in "Part I. Financial Information".
•Changes in international, federal, state, or local legislative requirements, such as changes in tax laws, tax rates, and environmental laws and regulations. Unless we otherwise have a duty to do so, the Securities and Exchange Commission'sCommission (SEC) rules do not require forward-looking statements to be revised or updated (whether as a result of changes in actual results, changes in assumptions, or other factors affecting the statements). Our forward-looking statements reflect our best beliefs as of the time they are made and may not be updated for subsequent developments.
PART I.
ITEM 1. BUSINESS
ORGANIZATION
Cinergy Corp., a Delaware corporation createdorganized in October 1994,1993, owns all outstanding common stock of The Cincinnati Gas & Electric Company (CG&E) and PSI Energy, Inc. (PSI), both of which are public utility subsidiaries.utilities. As a result of this ownership, we are considered a utility holding company. Because we are a holding company whosewith material utility subsidiaries operateoperating in multiple states, we are registered with and are subject to regulation by the SEC under the Public Utility Holding Company Act of 1935, as amended (PUHCA).amended. Our other principal subsidiaries are:
•are Cinergy Services, Inc. (Services);
• and Cinergy Investments, Inc. (Investments);
• Cinergy Global Resources, Inc. (Global Resources);
• Cinergy Technologies, Inc. (Technologies); and
• Cinergy Wholesale Energy, Inc. (CWE).
CG&E, an Ohio corporation organized in 1837, is a combination electric and gas public utility company that provides service in the southwestern portion of Ohio and, through its subsidiaries, in nearby areas of Kentucky and Indiana. It has three wholly-owned utility subsidiaries and two wholly-owned non-utility subsidiaries.CG&E's principal utility subsidiary, The Union Light, Heat and Power Company (ULH&P), in nearby areas of Kentucky. CG&Eis responsible for the majority of our power marketing and trading activity. CG&E’s principal subsidiary, ULH&P, a Kentucky corporation thatorganized in 1901, provides electric and gas service in northern Kentucky.
CG&E's&E is in a market development period for residential customers and in the competitive retail electric market for non-residential customers, transitioning to deregulation of electric generation and a competitive retail electric service market in the state of Ohio. Applicable legislation governing the transition period provides for a market development (frozen rate) period that began January 1, 2001, ended December 31, 2004 for non-residential customers and is scheduled to end December 31, 2005 for residential customers. At the end of these market development periods, CG&E will not implement market rates, but rather a rate stabilization plan (RSP) approved by the Public Utilities Commission of Ohio (PUCO) that covers the period after the market development period through 2008. The RSP, among other subsidiaries are insignificantthings, increases rates for environmental costs and capacity reserves and provides for a fuel and emission allowance tracker through 2008. See “Electric Industry” in “Item 7. Management’s Discussion and Analysis of Financial Condition and Results of Operations (MD&A)” for the various filings that led to its resultsthe PUCO’s approval of operations.CG&E’s RSP, further details of the plan, and a discussion of key elements of Ohio deregulation.
PSI, an Indiana corporation organized in 1942, is ana vertically integrated and regulated electric utility that provides service in north central, central, and southern Indiana.
6
The following table presents further information related to the operations of our domestic utility companies, CG&E, PSI, and ULH&P(our utility operating companies):
| | |
|
| Principal
Line(s) of Business
| | |
| Major Cities
Served |
| Approximate Population Served
| | | Approximate
Population
Served
|
|---|
|
|
|
|
|
|
|
|
CG&E and subsidiaries | | • Generation, transmission,
distribution, and sale of
electricity
• Sale and/or transportation of
natural gas • Electric commodity marketing and trading operations | | Cincinnati, OH
Middletown, OH
Covington, KY
Florence, KY
Newport, KY
Lawrenceburg, IN | | 2,017,0002,064,000 | |
|
|
| | | | | | | |
PSI |
|
• Generation, transmission,
distribution, and sale of
electricity |
| Bloomington, IN
Bloomington,Carmel, IN
Columbus, IN
Kokomo, IN
Lafayette, IN
New Albany, IN
Terre Haute, IN |
|
2,202,0002,283,000 | |
| | | | | | | |
ULH&P(1) |
|
• Transmission, distribution,
and sale of electricity
• Sale and transportation of
natural gas |
|
Covington, KY
Florence, KY
Newport, KY |
|
330,000345,000 | |
|
(1)See “Generation — Fuel Supply and Emission Allowances” under the “Regulated” section for further discussion of the possible transfer of generation assets.
Services is a service company that provides our regulated and non-regulated subsidiaries with a variety of centralized administrative, management, and support services. Investments holds most of our domestic non-regulated, energy-related businesses and investments. Global Resources holds our international businesses and investments, and directs our renewable energy investing activities (for example, wind farms). Technologies primarily holds our portfolio of technology-related investments. In
November 2000, CWE was formed to act as a holding company forCinergy's energy commodity businesses, including production, as the generation assets eventually become unbundled from the utility subsidiaries. See Note 18 of the "Notes to Financial Statements" in "Item 8. Financial Statements and Supplementary Data" for a discussion on Ohio deregulation.
We have collective bargaining agreements with the International Brotherhood of Electrical Workers (IBEW), the United Steelworkers of America (USWA), the Independent Utilities Union (IUU), and various international union organizations.
The following table indicates the number of employees by classification at December 31, 2000:
| | Regulated
| | Non-Regulated
|
|---|
Classification
| | CG&E(4)
| | PSI
| | ULH&P
| | Total
Regulated
| | Domestic(5)
| | International
| | Total Non-
Regulated
| | Cinergy
Total(6)
|
|---|
| IBEW(1) | | 1,098 | | 1,319 | | 61 | | 2,478 | | 315 | | — | | 315 | | 2,793 |
| USWA(2) | | 297 | | — | | 87 | | 384 | | — | | — | | — | | 384 |
| IUU(3) | | 464 | | — | | 63 | | 527 | | 393 | | — | | 393 | | 920 |
| Various Union Organizations | | — | | — | | — | | — | | 17 | | 492 | | 509 | | 509 |
| Non-Bargaining | | 376 | | 600 | | 20 | | 996 | | 2,341 | | 419 | | 2,760 | | 3,756 |
| | |
| |
| |
| |
| |
| |
| |
| |
|
| | | 2,235 | | 1,919 | | 231 | | 4,385 | | 3,066 | | 911 | | 3,977 | | 8,362 |
(1) IBEW #1347 contract will expire on April 1, 2006, and IBEW #1393 will expire on April 30, 2002.
(2) Contract will expire May 15, 2002.
(3) Contract will expire April 1, 2002.
(4) CG&E and subsidiaries excludingULH&P.
(5) Includes Services' employees who provide services to both regulated and non-regulated operations.
(6) On January 1, 2001, 1,448 of our employees were transferred to a non-regulated domestic subsidiary of CWE. For
more information on "Ohio deregulation" see Note 18 of the "Notes to Financial Statements" in "Item 8. Financial
Statements and Supplementary Data".
CURRENT TRENDS
The structure of the electric industry in our service territory and throughout the U.S. has been relatively stable for many years. In recent years, however, there have been both federal and state developments aimed at industry restructuring and increasing competition. This process is leading to an industry model whereby the generating assets become deregulated and the transmission and distribution systems remain under some type of regulation. The underlying belief, which we share, is that over the long-term, deregulation of wholesale generation markets will, through increased competition, result in lower commodity prices than would otherwise be achieved. However, in recent months, unprecedented high prices, extreme price volatility, a lack of market liquidity, and inadequate generation supply led to customer blackouts in California, demonstrating the necessity for a constructive approach to deregulation. Within our service territory, Ohio is the first state to implement electric deregulation legislation. See the "Retail Market Developments" section in "Item 7. Management's Discussion and Analysis of Financial Condition and Results of Operations" for a discussion of key elements of Ohio deregulation, which became effective January 1, 2001. Ohio's situation is different than California's in many respects, including the following:
•In California, demand for electricity has risen sharply over the last decade, with no new increased generating capacity; however, within Ohio, demand has risen more steadily, with increased capacity being added. For example, according to statistics reported by the Public Utilities Commission of Ohio (PUCO), 1,230 megawatts (MW, the basic unit of electric energy equal to one million watts) of generating capacity was added during this past year in Ohio;
another 1,330 MW is planned for service during 2001. By comparison, California, which is estimated at about three times Ohio's population, has added minimal capacity over the last several years.
•California's restructuring plan required utilities to divest their generation assets and prohibited the utilities from entering into long term contracts for supply; this forced the utilities to rely on the spot market to meet demand. Ohio's restructuring plan does not require utilities to divest their generation assets and allows for utilities to negotiate long-term commodity supply contracts at fixed prices for commodity purchases.
•Existing transmission constraints limit the amount of electricity California can access from outside its borders. Ohio, however, shares interconnections with such states as Indiana, Kentucky, Michigan, Pennsylvania, and West Virginia.
•California's generation is largely dependent on natural gas the costmarketing and trading operations (which are primarily conducted through Cinergy Marketing and Trading, LP (Marketing & Trading), one of which has increased dramatically in recent months, and also on hydroelectric production, which has been reduced due to drought conditions. Generation in Ohio, however, is largely fueled by coal, which has been more stable in price.
Twenty-four states and the District of Columbia have adopted deregulation plans. In response to the situation in California, some of these states, while not having similar experiences as California, are considering delaying or altering terms of implementation. A number of the remaining states are reconsidering their deregulation timetables. While we believe the situation in Ohio, as described above, and generally within the Midwest are different than California, we cannot predict the consequences, if any, on efforts to deregulate the remaining markets within our service territory. Indiana and Kentucky have not yet approved legislation.
BUSINESS UNITS
its subsidiaries).
We conduct operations through our subsidiaries and manage our businesses through the following four business units:three reportable segments:
• Energy CommoditiesCommercial Business Unit (Commodities)(Commercial);
• Energy DeliveryRegulated Business Unit (Delivery)(Regulated);
and
• Cinergy InvestmentsPower Technology and Infrastructure Services Business Unit (Cinergy Investments);(Power Technology and
• International Business Unit (International) Infrastructure).
The following section describes the activities of our business unitssegments as of December 31, 2000. As the utility industry continues to evolve,Cinergy will continue to analyze its operating structure and make modifications as appropriate. In early 2001, we announced certain organizational changes, which further aligned the business units consistent withCinergy's strategic vision. The revised structure reflects three business units, as follows:2004.
•Energy Merchant—will operate power plants, both domestically and abroad, and conduct all wholesale energy marketing, trading, origination, and risk management services;
•Regulated Businesses—will operate all gas and electric transmission and distribution services, both domestically and abroad, and will be responsible for all regulatory planning for the regulated utility businesses ofCG&E,PSI, andULH&P; and
•Power Technology and Infrastructure Services—will originate and manage a portfolio of emerging energy businesses.
See Note 1516 of the "Notes“Notes to Financial Statements"Statements” in "Item“Item 8. Financial Statements and Supplementary Data"Data” for financial information by business segment.
Commercial
CommoditiesCommercial manages our wholesale generation and energy marketing and trading activities. Commercial’s wholesale generation consists of CG&E’s electric generation in Ohio due to Ohio’s transition to deregulation of electric generation and a competitive retail service market. See “Electric Industry” in “Item 7. MD&A” for further detail of key elements of Ohio deregulation. Commercial also performs energy risk management activities, provides
Commodities operates
7
customized energy solutions and maintains our domestic regulated and non-regulated electric generating plants and someis responsible for all of our jointly-owned plants. international operations. See the “Market Risk Sensitive Instruments” section of “Item 7. MD&A” for information on risks associated with these activities.
Detail of Commercial’s operations can be found in the following sections:
•Generation — Fuel Supply and Emission Allowances — Describes Commercial’s generation capacity, sources of fuel, and its various cost recovery mechanisms;
•Trading Operations and Risk Management — Describes Commercial’s energy marketing and trading activities in the United States and Canada;
•Competition — Describes the key competitors to Commercial’s various business operations;
•Energy Services — Describes Commercial’s operations consulting services and its operation of a synthetic fuel production facility;
•International — Describes Commercial’s operations outside of the United States; and
•Revenue Data and Customer Base — Describes the primary revenue generators for the various business operations of Commercial.
Generation — Fuel Supply and Emission Allowances
As of December 31, 2000,2004, the total winter electric capabilitycapacity (including our portion of the total capacity for the jointly-owned plants) of theseCommercial’s domestic generating plants was 11,889 MW. These plants are mostly6,276 megawatts (MW). Approximately 67 percent of this generation portfolio is coal-fired. In December 2000,Cinergy announced its intent to acquire an additional 998 MW of natural-gas fired generation. See "Item“Item 2. Properties"Properties” for a further discussion of the generating facilities. Commodities also conducts the following activities:
• wholesale energy marketing and trading;
• energy risk management;
• financial restructuring services; and
• proprietary arbitrage activities.
See the "Market Risk Sensitive Instruments and Positions" section of "Item 7. Management's Discussion and Analysis of Financial Condition and Results of Operations" for information on risks associated with these activities.
Fuel SupplyEach year throughCG&E andPSI, we purchase approximately 27 purchases over 10 million tons of coal to generate electricity. The majority of this coal is obtained through long-term coal supply agreements. The remaining coal is purchased either on the spot market or through short-term supply agreements. We receive our coal supplyelectricity, primarily from mines located in Indiana, West Virginia, Ohio, Kentucky, Pennsylvania, Illinois, and Illinois.Colorado. The price of coal has increased dramatically in 2004 as compared to 2003. Contributing to the rise in the price of coal are (1) increases in demand for electricity, (2) environmental regulation, and (3) decreases in the number of suppliers of coal from prior years. To help mitigate the price fluctuation of coal, Cinergy has a general practice to procure a substantial portion of coal through fixed-price contracts of varying length. We hold fixed-price contracts that will source a substantial portion of our expected 2005 coal requirements. We evaluate the appropriate amount of contract coal and length of contracts based on market conditions, including pricing trends, volatility and supplier reliability. See “Contractual Cash Obligations” in “Item 7. MD&A” for further detail on CG&E’s total commitment under fixed-price coal contracts.
Commodities
Commercial has natural gas-fired peaking plants that have a capacity of 1,766 MW. The fuel for these units is primarily obtained through the natural gas spot market as it is difficult to forecast the natural gas requirements for these plants. For further information on the risk of purchasing natural gas, see the “Market Risk Sensitive Instruments” section of “Item 7. MD&A”.
A joint operating agreement, effective in April 2002, allows Cinergy to jointly dispatch the regulated generating assets of PSI in conjunction with the deregulated generating assets of CG&E. Under this agreement, transfers of power between PSI and CG&E are generally priced at market rates.
Commercial monitors alternative sources of coal and natural gas to assure a continuing availability of economical fuel supplies. As such, it will maintain its practice of purchasing a portion of coal and natural gas requirements on the spotopen market and will continue to investigate least-cost coal options to comply with new and existing environmental requirements.
BothCinergy and CG&E andPSI believe that they can continue to obtain enough coal and natural gas to meet future needs. However, future environmental requirements may significantly impact the availability and price of coal.these fuels.
Purchased Power
At times, we purchaseCommercial purchases power to meet the energy needs of our wholesale customers and to meet the requirements of our retail native load customers (end-use customers within our operating companies' franchise territory).its customers. Factors that could causeCinergy Commercial to purchase power for retail native loadits customers include generating plant outages, extreme weather conditions, summer reliability, growth, and other factors associated with supplying full requirements electricity.price. We believe we can obtain enough purchased power to meet future needs. However, during periods of excessive demand, such as those which occurred in the summers of 1998 and 1999, the price and availability of these purchases may be significantly impacted. See the "Significant Rate Developments" section of "Item 7. Management's Discussion
8
Commercial emits sulfur dioxide (SO2) and Analysis of Financial Condition and Results of Operations" for additional information onPSI's Purchased Power Tracker.
Environmental Matters In December 2000,Cinergy reached an agreement in principle with the U.S. Environmental Protection Agency (EPA) and various parties, that may serve as the basis for a negotiated resolution of the Clean Air Act (CAA) claims and other related matters brought against coal-fired power plants owned and operated byCinergy's operating companies. The estimated cost for these capital expenditures is expected to be approximately $700 million. These capital expenditures are in addition to our previously announced commitment to install nitrogen oxideoxides (NOX) controls overin the next five years at an estimated costgeneration of approximately $700 million. In 2000, we spent $75 million forelectricity and maintains emission allowances to offset their emissions in order to comply with NOX and other environmental compliance as comparedSO2 emission reduction requirements. In 2004, the market prices of SO2 allowances rose more than 200 percent from 2003. Cinergy is continually evaluating market conditions and managing our overall cost structure through the addition of pollution control equipment, where economically feasible, and the use of emission allowance markets to $16 millionhelp manage our emissions costs.
Under CG&E’s new RSP, retail fuel and emission allowance costs will be recovered through a cost tracking mechanism that recovers costs that exceed the amount originally included in 1999. Forecasted expendituresthe rates frozen in CG&E’s earlier transition plan. CG&E willrecover retail fuel and emission allowance costs consumed in serving retail load and collect a Provider of Last Resort charge from non-residential customers from 2005 through 2008 and from residential customers from 2006 through 2008. See “Electric Industry” in “Item 7. MD&A” for NOXfurther detail of CG&E’s RSP.
Trading Operations and Risk Management
Commercial’s energy marketing and trading activities principally consist of Marketing & Trading’s natural gas marketing and trading operations and CG&E’s power marketing and trading operations. In April 2002, CG&E and PSI executed a new joint operating agreement whereby new power marketing and trading contracts since April 2002 are originated on behalf of CG&E only. Historically, such contracts were executed on behalf of CG&E and PSI jointly.
Our domestic operations market and trade over-the-counter (an informal market where the buying/selling of commodities occurs) contracts for the purchase and sale of electricity (primarily in the midwest region of the United States), natural gas, and other environmental compliance (in nominal dollars)energy-related products, including coal and emission allowances. Our natural gas domestic operations provide services that manage storage, transportation, gathering, and processing activities. In addition, our domestic operations also market and trade natural gas and other energy-related products on the New York Mercantile Exchange.
Marketing & Trading’s natural gas marketing and trading operations also extend to Canada where natural gas marketing and management services are $210 million for 2001provided to producers and $789 million for 2001-2005. industrial customers. Our Canadian operations also market and trade over-the-counter contracts.
See the "Environmental Issues"“Market Risk Sensitive Instruments” section of “Item 7. MD&A” for information on risks associated with these activities.
Competition
Commercial competes for wholesale contracts for the purchase and "Constructionsale of electricity and Other Commitments" sectionsnatural gas. Commercial’s main competitors include public utilities, power and natural gas marketers and traders, and independent power producers.
Energy Services
Commercial, through Cinergy Solutions Holding Company, Inc., is an on-site energy solutions and utility services provider. We provide utility systems construction, operation and maintenance of "Item 7. Management's Discussionutility facilities, energy efficiencies and Analysisconservation consulting services, as well as cogeneration. Cogeneration is the simultaneous production of two or more forms of useable energy from a single fuel source.
Commercial, through Cinergy Capital & Trading, Inc., owns a coal-based synthetic fuel production facility which converts coal feedstock into synthetic fuel for sale to a third party. As of December 31, 2004, Cinergy has produced and sold approximately 7.8 million tons of synthetic fuel at this facility. The synthetic fuel produced at this facility qualifies for tax credits (through 2007) in accordance with the Internal Revenue Code Section 29 if certain requirements are satisfied. The three key requirements are that (a) the synthetic fuel differs significantly in chemical composition from the coal used to produce such synthetic fuel, (b) the fuel produced is sold to an unrelated entity
9
and (c) the fuel was produced from a facility that was placed in service before July 1, 1998. For further information on the tax credit qualifications see Note 11(c)(iv) of the “Notes to Financial ConditionStatements” in “Item 8. Financial Statements and ResultsSupplementary Data”.
International
As of Operations"December 31, 2004, we had ownership interests in (1) generation assets located in three countries capable of producing approximately 150 MW of electricity and 700 MW equivalents of steam; and (2) approximately 1,200 miles of gas and electric transmission and distribution systems through jointly-owned investments in two countries, through which we serve approximately 8,500 transmission and distribution customers. These assets serve retail and wholesale customers by providing utility services including generation of electricity and heat as well as the distribution of gas and electric commodities.
Revenue Data and Customer Base
Commercial primarily recognizes revenues from generation provided to customers in CG&E’s service territory who have not switched to an alternative generation supplier under Ohio’s electric deregulation market. Because rates are frozen during the market development period in Ohio, the majority of these revenues are under a fixed-price tariff. Under the Ohio customer choice program, CG&E’s retail customers may choose their electric supplier. The percentage of customers switching to other electric suppliers and the related volume by customer class was as follows:
| | | | | | MW Hours For the | | Switching | |
| | MW at December 31 | | Years Ended December 31 | | Percentage at December 31(1) | |
Revenue Class | | 2004 | | 2003 | | 2004 | | 2003 | | 2004 | | 2003 | |
| | | | | | | | | | | | | |
Residential | | 75 | | 92 | | 334,224 | | 283,477 | | 4.07 | % | 5.17 | % |
Commercial | | 339 | | 374 | | 1,722,822 | | 1,654,061 | | 19.17 | % | 21.55 | % |
Industrial | | 226 | | 295 | | 1,376,210 | | 1,591,345 | | 17.89 | % | 23.60 | % |
Other Public Authorities | | 89 | | 91 | | 284,214 | | 265,039 | | 19.09 | % | 19.95 | % |
Total | | 729 | | 852 | | 3,717,470 | | 3,793,922 | | | | | |
(1) The residential switching percentage is based on annual energy consumption and the non-residential switching percentages are based on average monthly peak demand.
Customer switching reduces retail revenues by the generation component of rates and shopping incentives. CG&E still collects transmission and distribution revenues from the delivery of electricity to switched customers (see Regulated section for further information.
Deliveryinformation). During the market development period, the reduction in revenues due to customer switching is mitigated by wholesale power sales from the freed-up generation capacity. For further discussion on Ohio deregulation and the recently approved RSP see “Electric Industry” in “Item 7. MD&A”.
Delivery
Commercial’s operating revenue is also derived by providing electricity at wholesale and trading electricity primarily in the midwest region of the United States. In addition, Commercial provides and trades natural gas primarily to wholesale customers across the United States. The majority of these customers are public utilities, power and natural gas marketers and traders, and independent power producers.
Energy services operating revenues are derived primarily by providing steam, electricity, and operation and maintenance services to large industrial customers.
No single Commercial customer provides more than 10 percent of total operating revenues.
Regulated
Regulated consists of PSI’s regulated generation and transmission and distribution operations, and CG&E and its subsidiaries’ regulated electric and gas transmission and distribution systems. Regulated plans, constructs, operates, and maintains our operating companies'Cinergy’s transmission and distribution systems and providesdelivers gas and electric energy to customers. Deliveryconsumers. Regulated also earns revenues from wholesale customers primarily by these customers transmitting electric power
10
through Cinergy’s transmission system. These businesses are subject to cost of service rate making where rates to be charged to customers are based on prudently incurred costs over a test period plus a reasonable rate of return. Regulated operated approximately 45,80048,000 circuit miles (the total length in miles of separate circuits) of electric lines to provide regulated transmission and distribution service to approximately 1.5 million customers as of December 31, 2000. Delivery2004. Regulated operated approximately 7,5509,226 miles of gas mains (gas distribution lines that serve as a common source of supply for more than one service line) and service lines to provide domestic regulated transmission and distribution serviceservices to approximately 489,000500,000 customers as of December 31, 2000.2004. See "Item“Item 2. Properties"Properties” for a further discussion of the transmission and distribution linessystems owned by our utility operating companies.
Detail of Regulated’s operations can be found in the following sections:
•Generation - - Fuel Supply and Emission Allowances — Describes Regulated’s generation capacity, sources of fuel, and its various cost recovery mechanisms;
•Transmission and Distribution — Describes Regulated’s agreements with the regional utilities and regional transmission organization (RTO) that coordinate the planning and operation of generation and transmission facilities and the associated cost recovery mechanisms;
•Gas Supply — Describes Regulated’s responsibility to purchase and deliver natural gas to native load (the total requirements of a wholesale utility’s franchised retail market) customers and the mechanisms used to fulfill their responsibility; and
•Revenue Data and Customer Base — Describes the primary revenue generators for the various business operations of Regulated.
Electric OperationsGeneration - - Fuel Supply and Emission Allowances
As of December 31, 2004, the total winter electric capacity (including our portion of the total capacity for the jointly-owned plants) of Regulated’s generating plants was 7,055 MW. Approximately 78 percent of this generation portfolio is coal-fired. See “Item 2. Properties” for a further discussion of the generating facilities.
Each year PSI purchases over 15 million tons of coal to generate electricity, primarily from mines located in Indiana, Pennsylvania, and Illinois. The price of coal has increased dramatically in 2004 as compared to 2003. The primary driving forces behind the increase in coal prices are (1) increases in demand for electricity, (2) environmental regulation, and (3) decreases in the number of suppliers of coal from prior years. To help mitigate the price fluctuation of coal, Cinergy has a general practice to procure a substantial portion of coal through fixed-price contracts of varying length. We hold fixed-price contracts that will source a substantial portion of our expected 2005 coal requirements. We evaluate the appropriate amount of contract coal and length of contracts based on market conditions, including pricing trends, volatility and supplier reliability. See “Contractual Cash Obligations” in “Item 7. MD&A” for further detail on PSI’s total commitment under fixed-price coal contracts.
Regulated Deliveryhas natural gas-fired peaking plants that have a capacity of 1,263 MW. The fuel for these units is primarily obtained through the natural gas spot market as it is difficult to forecast the natural gas requirements for these plants. For further information on the risk of purchasing natural gas see the “Market Risk Sensitive Instruments” section of “Item 7. MD&A”.
A joint operating agreement, effective in April 2002, allows Cinergy to jointly dispatch the regulated generating assets of PSI in conjunction with the deregulated generating assets of CG&E. Under this agreement, transfers of power between PSI and CG&E are generally priced at market rates.
At times, Regulated purchases power to meet the energy needs of its customers. Factors that could cause Regulated to purchase power for its customers include generating plant outages, extreme weather conditions, summer reliability, growth, and price. We believe we can obtain enough purchased power to meet future needs. However, during periods of excessive demand, the price and availability of these purchases may be significantly impacted.
ULH&P purchases energy from CG&E pursuant to a contract effective January 1, 2002, which was approved by the Federal Energy Regulatory Commission (FERC) and the Kentucky Public Service Commission (KPSC). This five-year agreement is a negotiated fixed-rate contract with CG&E.
11
The KPSC has conditionally approved a long-term electric supply plan for ULH&P that will replace the current contract with CG&E as previously discussed. Under this new plan, CG&E will transfer ownership of approximately 1,100 MW of electric generating capacity to ULH&P. The capacity is currently part of CG&E’s generating assets used to service ULH&P under a multi-year wholesale power supply contract as previously discussed. ULH&P is currently seeking approval of the transaction from the SEC, wherein the Ohio Consumers Counsel has intervened in opposition, and the FERC. The transfer, which will be paid for at net book value, will not affect current electric rates for ULH&P’s customers, as power will be provided under the same terms as under the current wholesale power contract with CG&E through December 31, 2006. Assuming receipt of regulatory approvals, we would anticipate the transfer to take place in the second quarter of 2005.
Cinergy is studying the feasibility of constructing a commercial integrated coal gasification combined cycle (IGCC) generating station to help meet increased demand over the next decade. PSI would own all or part of the facility and operate it. Cinergy will partner with Bechtel Corporation and General Electric Company to complete this study. An IGCC plant turns coal to gas, removing most of the SO2 and other emissions before the gas is used to fuel a combustion turbine generator. The technology uses less water and has fewer emissions than a conventional coal-fired plant with currently required pollution control equipment. Another benefit is the potential to remove mercury and carbon dioxide (CO2) upstream of the combustion process at a lower cost than conventional plants. If a decision is reached to move forward with constructing such a plant, PSI would seek approval from the Indiana Utility Regulatory Commission (IURC) to begin construction. If approved, we would anticipate the IURC’s subsequent approval to include the assets in PSI’s rate base.
Regulated monitors alternative sources of coal and natural gas to assure a continuing availability of economical fuel supplies. As such, it will maintain its practice of purchasing a portion of coal and natural gas requirements on the open market and will continue to investigate least-cost coal options to comply with new and existing environmental requirements. Cinergy and PSI believe that they can continue to obtain enough coal and natural gas to meet future needs. However, future environmental requirements may significantly impact the availability and price of these fuels.
PSI recovers retail and a portion of its wholesale fuel costs from customers on a dollar-for-dollar basis through a cost tracking recovery mechanism (commonly referred to as a fuel adjustment clause). In addition to the fuel adjustment clause, PSI utilizes a purchased power tracking mechanism approved by the IURC for the recovery of costs related to certain specified purchases of power necessary to meet native load peak demand requirements to the extent such costs are not recovered through the existing fuel adjustment clause.
Regulated emits SO2 and NOX in the generation of electricity and maintains emission allowances to offset their emissions in order to comply with NOX and SO2 emission reduction requirements. In 2004, the market prices of SO2 allowances rose more than 200 percent from 2003. PSI utilizes a cost tracking mechanism as approved by the IURC allowing it to recover substantially all of its emission allowance costs from its customers. Cinergy is continually evaluating market conditions and managing our overall cost structure through the addition of pollution control equipment, where economically feasible, and the use of emission allowance markets to help manage our emissions costs.
Transmission and Distribution
Cinergy (through our utility operating companies) and other non-affiliated utilities in an eight-statea nine-state region participate inare parties to the East Central Area Reliability Coordination Agreement (ECAR Agreement). The(ECAR) Agreement. Through the ECAR Agreement, coordinatesECAR supports the planning and operation of generation and transmission facilities, which provides for maximum reliability of regional bulk power supply.
Midwest ISOCinergy As part of the effort to create(through our utility operating companies) is also a competitive wholesale power marketplace, the Federal Energy Regulatory Commission (FERC) approved the formationmember of the Midwest Independent Transmission System Operator, Inc. (Midwest ISO) during 1998. In that same year,Cinergy agreed to join the Midwest ISO, a RTO established in preparation for meeting anticipated changes in the FERC regulations and future deregulation requirements. The Midwest ISO was established1998 as a non-profit organization to maintainwhich maintains functional control over the combined transmission systems of its members. The organization was expected to begin operations in November 2001.
In
The Midwest ISO is the fallprovider for transmission service requested on the transmission facilities under its tariff. It is responsible for the reliable operation of 2000, threethose transmission owners announced their intent to leavefacilities and the regional planning of new
12
transmission facilities. The Midwest ISO also will administer energy markets utilizing Locational Marginal Pricing (i.e., the energy price for the next MW may vary throughout the Midwest ISO market based on transmission congestion and joinenergy losses) as the proposed Alliance Regional Transmission Organization (Alliance RTO) bymethodology for relieving congestion on the endtransmission facilities under its functional control. ECAR will maintain the responsibility for establishing the level of 2001. The Alliance RTO is a planned for-profit transmission company involving variousoperating reserves for those utilities which have transmission systems that cover partsparticipating in the ECAR Agreement and the operation of Michigan, Ohio, Indiana, West Virginia, and Virginia.
On December 13, 2000, six additional transmission owners, includingCinergy, announced a planthe Automatic Reserve Sharing system upon the Midwest ISO’s implementation of its Energy Markets Tariff. See “Electric Industry” in “Item 7. MD&A” for conditional withdrawal fromfurther detail regarding the Midwest ISO if theenergy markets.
Transmission and Distribution Cost Recovery
Transmission cost recovery mechanisms will be established under CG&E’s new RSP to, among other three withdrawing members left the organization.things, permit CG&E
On January 24, 2001, the FERC issued an order providing 30 days of confidential settlement talks between the Alliance RTO and the to recover Midwest ISO charges. CG&E also plans to file a distribution rate case to recover certain distribution costs with rates to become effective January 1, 2006 and its stakeholders,has deferred certain costs in an effort to resolve issues related to such withdrawals.Cinergy actively participated in the settlement process. On February 23, 2001, the settlement judge reported to the FERC that settlement talks produced a unanimous comprehensive settlement between all related parties. Specific details of this settlement are yet to be finalized2004 and will need approval by the FERC. The definitive settlement agreement language isdefer costs in 2005 pursuant to be filed with the FERC on March 19, 2001. If approved, the settlement agreement is not expected to present any material adverse impacts to the company.its RSP. See “Electric Industry” in “Item 7. MD&A” for further detail of CG&E’s RSP.
PSI has received IURC approval for the recovery of Midwest ISO costs and is currently seeking IURC approval that would further define the mechanisms for recovery of such costs.
13
Transmission System Interconnections
The following map illustrates the interconnections between our electric systems and other electric systems.
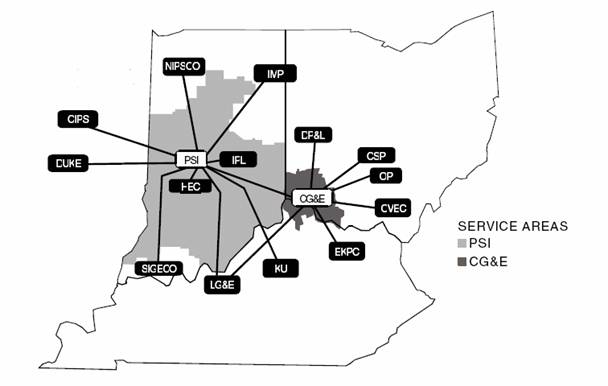

Electricity Supply Delivery currently receives all of its electricity from Commodities at a transfer price based upon current regulatory ratemaking methodology. With the implementation of electric deregulation in Ohio, effective January 1, 2001, Delivery continues to acquire its electricity requirements through Commodities for those retail customers who do not switch suppliers. For further details on electricity supply ofCG&E refer to Note 18 of the "Notes to Financial Statements" in "Item 8. Financial Statements and Supplementary Data".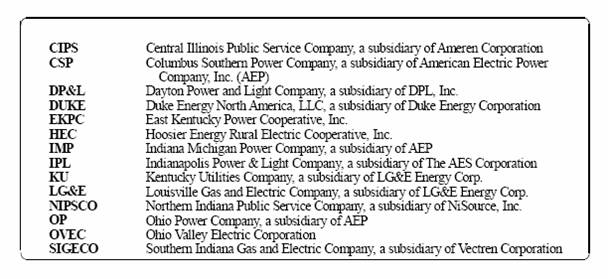
ULH&P purchases its energy fromCG&E pursuant to a FERC-approved contract that is due to expire on December 31, 2001. Currently the contract is under negotiation with the involvement of the Kentucky Public Service Commission. The Ultimate supplier(s) ofULH&P's energy and the pricing of electric commodity requirements contained in any new arrangement could reflect a market-based approach. At the current time we are unable to predict the outcome of this matter.
14
Gas Supply Delivery
Regulated is responsible for the purchase and the subsequent delivery of natural gas to native load customers. Delivery'sRegulated’s natural gas procurement strategy is to buy firm natural gas supplies (natural gas intended to be available at all times) and firm interstate pipeline transportation capacity during the winter season (November through March) and buy spot supply and capacity during the non-heating season (April through October). through a combination of firm supply and transportation capacity along with spot supply and interruptible transportation capacity. This strategy allows DeliveryRegulated to assure reliable natural gas supply for its high priority (non-curtailable) firm customers during peak winter conditions and provides DeliveryRegulated the flexibility to reduce its contract commitments if firm customers choose alternate gas suppliers.suppliers under Regulated’s customer choice/gas transportation programs. In 2000,2004, firm supply (gas intended to be available at all times) purchase commitment agreements provided approximately 55%63 percent of the natural gas supply. Thesupply, with the remaining gas was purchased on the spot market. These firm supply agreements feature two levels of gas supply, specifically (1) base load, which is a continuous supply to meet normal demand requirements, and (2) swing load, which is gas available on a daily basis to accommodate changes in demand. Delivery pays reservation chargesdemand due primarily to changing weather conditions.
Regulated manages natural gas procurement-price volatility mitigation programs forCG&E and ULH&P. These programs pre-arrange between 20-75 percent of winter heating season base load gas requirements and swingup to 50 percent of summer season base load supplies. These charges secure delivery fromrequirements. CG&E and ULH&P use primarily fixed-price forward contracts and contracts with a ceiling and floor on the supplier during periodsprice. As of extreme weather or high demand.December 31, 2004, CG&E and ULH&P, combined, had hedged approximately 60 percent of their winter 2004/2005 base load requirements. See the "Gas Industry"“Gas Industry” section of "Item“Item 7. Management's Discussion and Analysis of Financial Condition and Results of Operations"MD&A” for further information.
Interstate pipelines either (1) transport gas purchased directly to the distribution systems or (2) inject gas purchased into pipeline storage facilities for future withdrawal and delivery. The majority of the gas supply comes from the Gulf of Mexico coastal areas of Texas and Louisiana. In addition, a limited supply comes from the mid-continent (Arkansas-Oklahoma) basin. Also, industrial transportation customers behindCinergy's city gate (point where the distribution system connects to an interstate gas pipeline) are obtaining methane gas recovered locally from an Ohio landfill. Delivery expects the natural gas market will remain competitive in future years. However, short-term price fluctuations could occur as a result of weather conditions, availability of supply, changes in demand, and storage inventories. The market price of natural gas has increased significantly in 2000, which has causedCG&E andULH&P to pay more for the gas they deliver to customers. Under the gas cost recovery mechanism that is mandated under state law, gas commodity cost is passed through directly to the customer dollar-for-dollar. It is expected that gas commodity prices will remain at these historically high levels well into 2001.
Revenue Data and Customer Base
Regulated’s generation revenue is derived from the fulfillment of its native load requirements. The percent of retail operating revenues derived from full service electricity and gas sales and fromtransportation for each of the sale and/or transportation of natural gas for thethree years ended December 31 were as follows:
| | Operating Revenues
|
|---|
| | 2000
| | 1999
| | 1998
|
|---|
Registrant
| | Electric %
| | Gas %
| | Electric %
| | Gas %
| | Electric %
| | Gas %
|
|---|
| Cinergy(1) | | 64 | | 36 | | 73 | | 27 | | 81 | | 19 |
| CG&Eand subsidiaries | | 85 | | 15 | | 85 | | 15 | | 86 | | 14 |
| PSI | | 100 | | — | | 100 | | — | | 100 | | — |
| ULH&P | | 71 | | 29 | | 75 | | 25 | | 75 | | 25 |
(1)The results ofCinergyalso include amounts related to non-registrants.
| | Operating Revenues | |
Registrant | | 2004 | | 2003 | | 2002 | |
| | Electric | | Gas | | Electric | | Gas | | Electric | | Gas | |
| | | | | | | | | | | | | |
Cinergy | | 76 | % | 24 | % | 76 | % | 24 | % | 81 | % | 19 | % |
CG&E and subsidiaries | | 45 | | 55 | | 46 | | 54 | | 56 | | 44 | |
PSI | | 100 | | — | | 100 | | — | | 100 | | — | |
ULH&P | | 65 | | 35 | | 67 | | 33 | | 74 | | 26 | |
Electric and gas sales are seasonal. Electricity usage in our service territory peaks during the summer and gas usage peaks during the winter. Air conditioning increases electricity demand and heating increases the demand for electricity and gas.gas demand.
The service territory ofCG&E and its utility subsidiaries, includingULH&P, is heavily populated and is characterized by a stable residential customer base and a diverse mix of industrial customers. The territory served byPSI is composed of residential, agricultural, and widely diversified industrial customers. No single retail customer provides more than ten10 percent of total operating revenues (electric or gas) for anyRegulated.
Power Technology and Infrastructure
Power Technology and Infrastructure primarily manages Cinergy Ventures, LLC (Ventures), Cinergy’s venture capital subsidiary. Ventures identifies, invests in, and integrates new energy technologies into Cinergy’s existing businesses, focused primarily on operational efficiencies and clean energy technologies. In addition, Power
15
Technology and Infrastructure manages our investments in other energy infrastructure and telecommunication service providers.
In March 2004, Cinergy announced that it would begin offering broadband over power line (BPL) services in the Cincinnati, Ohio area. BPL utilizes the low and medium voltage distribution lines ofCinergy to transmit high speed data and other digital information to and from the internet via home electrical outlets and can be used for monitoring utility infrastructure. These services are being offered through joint ventures created by Ventures and Current Communications Group LLC, marketing to Cinergy service territory and municipal and co-op utilities throughout the United States. Ventures has invested approximately $18 million to date.
We have collective bargaining agreements with the International Brotherhood of Electrical Workers (IBEW), the United Steelworkers of America (USWA), the Utility Workers Union of America (UWUA), and various international union organizations.
The following table indicates the number of employees by classification at January 31, 2005:
Classification | | CG&E(4) | | PSI | | ULH&P | | Cinergy(5) | |
| | | | | | | | | |
IBEW(1) | | 1,018 | | 1,218 | | 60 | | 2,546 | |
USWA(2) | | 280 | | — | | 79 | | 398 | |
UWUA(3) | | 387 | | — | | 58 | | 768 | |
Various Union Organizations | | — | | — | | — | | 355 | |
Non-Bargaining | | 198 | | 354 | | 19 | | 3,775 | |
| | 1,883 | | 1,572 | | 216 | | 7,842 | |
(1) IBEW #1347 contract will expire on April 1, 2006, IBEW #1393 contract will expire on May 1, 2005, and IBEW #352 contract expired on February 5, 2005 and was replaced with a new contract set to expire on February 5, 2008.
(2) USWA #12049 and #5541-06 contracts will expire on May 15, 2007.
(3) Contract will expire on March 31, 2005.
(4) CG&E and subsidiaries excluding ULH&P.
(5) Includes 3,154 Services’ employees who provide services to our operating utilities and other non-regulated companies.
Cinergy Investments is currently affected by several different issues which involve compliance with federal and state regulations regarding the protection of the environment including, but not limited to, reductions in mercury, NOX, and SO2 emissions. Cinergy is able to recover certain costs of this environmental compliance equipment through various trackers set up with Cinergy’s respective state regulatory agencies. See the “Environmental Issues” section in “Item 7. MD&A” for a discussion of these environmental issues and the estimated capital expenditures.
Cinergy Investments manages the development, marketing, and sales of our domestic non-regulated, and non-wholesale energy and energy-related products and services. This is accomplished through various subsidiaries and joint ventures. These products and services include the following:
•providing energy management-consulting services and infrastructure solutions to government, industrial, and commercial customers that operate retail facilities;
•providing various utility services to utilities (for example, providing underground locating and construction services for utilities);
•providing telecommunication services including dark fiber, high capacity service, internet service, local phone service, and long distance service;
•leasing of space on wireless telecommunication towers and the purchase and construction of such towers;
•providing various engineering, procurement, construction, operation, and maintenance functions such as designing and constructing turnkey gas pipelines, electric transmission and distribution lines, substations for industrial and large commercial customers, and fiber optic telecommunication cables;
•providing information, systems, and services to multi-site national chains in retail industries to optimize their energy, telecommunications, and other facility-wide costs;
•building, owning, operating, and maintaining combined heat and power facilities; and
•
International
International primarily directs and manages our international business holdings. These holdings include wholly-owned and jointly-owned companies in ten foreign countries. In addition, International directs our renewable energy investing activities (for example, wind farms) which include investments within the U.S. as well as abroad.
In 1999, we sold our 50% ownership interest in Midlands Electricity plc (Midlands). Prior to the sale, Midlands had provided the majority of International's earnings. See Note 10 of the "Notes to Financial Statements" in "Item 8. Financial Statements and Supplementary Data" for further information on the sale of our ownership interest in Midlands.
During the fourth quarter of 2000, a joint venture between a subsidiary ofCinergy and a subsidiary of Royal Dutch Petroleum (Shell) was awarded a 49% interest and operational control of the gas distribution business in Athens, Greece. We expect this transaction to close during the first half of 2001. International's plans for 2001 include development of the Greek gas business itself and other opportunities which may arise in the Greek market. In addition, International expects to continue its development of, and investment in, renewable energy projects in both the U.S. and Europe. The timing of International's investments depends on changing market conditions and regulatory approvals. Our international investments present certain risks, including foreign exchange risk. See the "Market Risk Sensitive Instruments and Positions" section of "Item 7. Management's Discussion and Analysis of Financial Condition and Results of Operations" for further information on these risks and how we address our exposure to them. See Note 15 of the "Notes to Financial Statements" in "Item 8. Financial Statements and Supplementary Data" for further information on revenues from foreign operations and long-lived assets.
OTHER DEVELOPMENTS
Our ability to invest in growth initiatives, such as Exempt Wholesale Generators (EWG) and Foreign Utility Companies (FUCO) is limited by certain legal and regulatory requirements, including the PUHCA. An EWG is a special-purpose entity that owns or operates domestic or foreign electric generating facilities whose power is sold entirely at wholesale. FUCOs are companies whose utility assets and operations are located entirely outside the U.S. and which are used for the generation, transmission, or distribution of electric energy for sale, or the distribution of gas at retail. In late 1999, we filed a request with the SEC under the PUHCA for an additional $5 billion in authority to invest in EWGs and FUCOs. On June 23, 2000, the SEC issued an interim order granting us authority to invest a total of $1.7 billion in EWGs and FUCOs, replacing an earlier order capping our investment authority under PUHCA at an amount equal toCinergy's average retained earnings from time to time. As of December 31, 2000, we had invested or committed to invest $1.4 billion of the $1.7 billion available.
In January 2001,Cinergy modified its request to the SEC for additional investment authority, proposing a new investment limitation capped at $4 billion, subject to various terms and conditions. This request is pending before the SEC. While we currently cannot predict the outcome of this request, the existing limits could restrict our ability to invest in future transactions.
FUTURE EXPECTATIONS/TRENDS
See the information appearing under the same caption in "Item“Item 7. Management's DiscussionMD&A” for the following discussions:
•Regulatory Outlook and Analysis of Financial Condition and Results of Operations" for discussion of "Future Expectations/Trends."
Significant Rate Developments;
•FERC and Midwest ISO;
•Gas Industry; and
•Other Matters.
16
PROPERTIES
ITEM 2. PROPERTIES
Electric
Domestic Power Generation
COMMODITIES
Regulated
Our operating companies'Commercial’s domestic power generating stations’ total winter electric capabilitiescapacity, reflected in MWmegawatts (MW), as of December 31, 2000,2004, are shown in the table that follows. OurCommercial’s electric generating plants are primarily located in Ohio Kentucky, and IndianaKentucky and are wholly-owned andor jointly-owned facilities.
| | | | | | Natural | | | | | |
| | | | Coal | | Gas | | Oil | | Total | |
Commercial(1) | | Stations | | MW | | MW | | MW | | MW | |
| | | | | | | | | | | |
The Cincinnati Gas & Electric Company (CG&E) | | 9 | | 4,186 | | 736 | | 324 | | 5,246 | |
Cinergy Investments, Inc. (Investments)(2) | | 2 | | — | | 1,030 | | — | | 1,030 | |
| | | | | | | | | | | |
Total | | 11 | | 4,186 | | 1,766 | | 324 | | 6,276 | |
Registrant(1)
| | Stations
| | Coal
MW
| | Natural
Gas
MW
| | Oil
MW
| | Hydro
MW
| | Total
MW
|
|---|
| CG&E | | 9 | | 4,186 | | 736 | | 323 | | — | | 5,245 |
| PSI | | 8 | | 5,578 | | 120 | | 261 | | 45 | | 6,004 |
| | |
| |
| |
| |
| |
| |
|
| Total | | 17 | | 9,764 | | 856 | | 584 | | 45 | | 11,249 |
| | |
| |
| |
| |
| |
| |
|
(1)
- This table includes only our portion of the total capacity for the jointly-owned plants.
Refer to Note 13 of(2) Represents natural gas peaking plants located in Tennessee and Mississippi, owned by Investments, that sell electricity on the "Notes to Financial Statements" in "Item 8. Financial Statements and Supplementary Data" for a discussion of the jointly-owned plants.
wholesale market.
During 2000, our2004, Commercial’s electric generating plants, operatedincluding those that we own but do not operate, performed reliably, as evidenced by our annual capacity factor of 73% (excluding natural gas peaking stations),68 percent and a utilization factor of greater than 86%.83 percent (excluding natural gas and fuel oil peaking stations) and anequivalent availability factor of 84 percent. A capacity factor is a percentage that indicates how much of a power plant'splant’s capacity is used over time. A utilization factor is a percentage that indicates how much of a power plant’s capacity is used while being available. An equivalent availability factor is a percentage that indicates how much of a unit is available to generate compared to its potential maximum generation.
17
Below is a geographical map showing the locations of Commercial’s generation plants.
During August, we experienced peak loads
Legend | |
Number | | Generation Plant | | Fuel Type | | MW Capacity | |
| | | | | | | |
1 | | Dick’s Creek | | Gas | | 172 | |
2 | | Woodsdale | | Gas | | 564 | |
3 | | Miami Fort | | Coal/Oil | | 962 | |
4 | | East Bend | | Coal | | 414 | |
5 | | Beckjord | | Coal/Oil | | 1,107 | |
6 | | Wm. Zimmer | | Coal | | 604 | |
7 | | J.M. Stuart | | Coal | | 913 | |
8 | | Killen | | Coal | | 198 | |
9 | | Conesville | | Coal | | 312 | |
10 | | Brownsville | | Gas | | 480 | |
| | Caledonia(1) | | Gas | | 550 | |
| | | | Total | | 6,276 | |
(1) Commercial’s generation plant not included in the map is located in Caledonia, Mississippi.
Cogeneration
As of 4,731December 31, 2004, Cinergy had ownership interests in and/or operated 27 domestic cogeneration facilities capable of producing 5,357 MW forCG&Eof electricity, 4,303 MW equivalents of steam and 5,410236 MW forPSI. At times we purchase power to meetequivalents of chilled water. Cogeneration is the energy needssimultaneous production of our wholesale customers and to meet the requirements of our retail native load customers. Factors that could causeCinergy to purchase power for retail native load customers include outages, extreme weather conditions, growth, and other factors associated with supplying full requirements electricity. We believe we can obtain enough purchased power to meet future needs.
Promptly after receipt of all required regulatory approvals and third-party consents,CG&E anticipates transferring its generating stations and their related assets and obligations to onetwo or more non-regulated corporate subsidiary(ies). Subsequent to this transferCG&E will continue operations asforms of useable energy from a transmission and distribution company. To facilitate this transfer, the generation assetssingle fuel source. During 2005, Cinergy anticipates completion ofCG&E as of August 2000, were released from the first mortgage indenture lien allowing them to move un-encumbered to the non-regulated subsidiary. Generating assets added after August 2000, remain subject to the lien ofCG&E's first mortgage bond indenture and will require release an expansion at some future date prior to being transferred. For a further discussion on Ohio deregulation see Note 18 of the "Notes to Financial Statements" in "Item 8. Financial Statements and Supplementary Data".
Non-Regulated
During 1999, one of our non-regulated subsidiaries formedexisting cogeneration facilities, which is expected to provide an additional 70 MW equivalents of steam and 42 MW equivalents of chilled water.
18
Synthetic Fuel
Cinergy Capital & Trading, Inc. owns a partnership (each party havingcoal-based synthetic fuel production facility, which converts coal into synthetic fuel for sale to a 50% ownership) with Duke Energy North America LLC (Duke). The partnership was formedthird party. See “Synthetic Fuel Production” in “Item 7. MD&A” for the purposeadditional information regarding this business initiative.
International
As of jointly constructing and owning three wholesale generating facilitiesDecember 31, 2004, we had ownership interests in (1) generation assets located in southwestern Ohio,three countries capable of producing approximately 150 MW of electricity and east central700 MW equivalents of steam; and western Indiana. Two(2) approximately 1,200 miles of these properties became fully operational in June 2000. The total capacity of these plants is 1,280 MW. Construction of the third facility, with a capacity of 129 MW, has been suspended by order of the Indiana Utility Regulatory Commission (IURC). For further information on the IURC's order, see the "Wholesale Market Developments" section of "Item 7. Management's Discussiongas and Analysis of Financial Condition and Results of Operations".
In December 2000,Cinergy announced that one of its non-regulated subsidiaries entered into a definitive agreement to acquire two natural gas-fired merchant electric generating facilities from Enron. The facilities are located in Tennessee and Mississippi and have a total combined capacity of 998 MW. It is anticipated that this transaction will close in the second quarter of 2001.
DELIVERY
Electric
Metrics for our operating companies' electric transmission and distribution systems through jointly-owned investments in two countries, through which we serve approximately 8,500 transmission and distribution customers. These assets serve retail and wholesale customers by providing utility services including generation of electricity and heat as well as the distribution of gas and electric commodities.
Electric
Domestic Power Generation
Regulated’s domestic power generating stations’ total winter electric capacity, reflected in MW, as of December 31, 2004, are shown in the table that follows. The electric generating plants are located in Indiana and Ohio and are wholly-owned or jointly-owned facilities.
| | | | | | Natural | | | | | | | |
| | | | Coal | | Gas | | Oil | | Hydro | | Total | |
Regulated(1) | | Stations | | MW | | MW | | MW | | MW | | MW | |
| | | | | | | | | | | | | |
PSI | | 11 | | 5,488 | | 1,263 | | 259 | | 45 | | 7,055 | |
(1) This table includes only our portion of the total capacity for the jointly-owned plants.
During 2004, Regulated’s electric generating plants, including those that we own but do not operate, performed reliably, as evidenced by our annual capacity factor of 74 percent and a utilization factor of 85 percent (excluding natural gas and fuel oil peaking stations) and anequivalent availability factor of 89 percent. A capacity factor is a percentage that indicates how much of a power plant’s capacity is used over time. A utilization factor is a percentage that indicates how much of a power plant’s capacity is used while being available. An equivalent availability factor is a percentage that indicates how much of a unit is available to generate compared to its potential maximum generation.
19
Below is a geographical map showing the locations of Regulated’s generation plants.
Legend | |
Number | | Generation Plant | | Fuel Type | | MW Capacity | |
| | | | | | | |
1 | | Cayuga | | Coal/Gas/Oil | | 1,135 | |
2 | | Wabash River | | Coal/Oil | | 966 | |
3 | | Edwardsport | | Coal/Oil | | 160 | |
4 | | Gibson | | Coal | | 2,844 | |
5 | | Miami Wabash | | Oil | | 104 | |
6 | | Noblesville | | Gas | | 310 | |
7 | | Henry County | | Gas | | 129 | |
8 | | Connersville | | Oil | | 98 | |
9 | | Gallagher | | Coal | | 560 | |
10 | | Markland | | Hydro | | 45 | |
11 | | Madison | | Gas | | 704 | |
| | | | Total | | 7,055 | |
20
Transmission and Distribution
Relevant information for our proportionate share of jointly-owned facilities) are estimatedutility operating companies’ electric transmission and distribution systems located in Ohio, Kentucky, and Indiana is as follows:
| | Electric | | Electric | | Substation | |
| | Transmission | | Distribution | | Combined | |
Registrant | | Systems | | Systems | | Capacity | |
| | (circuit miles) | | (circuit miles) | | (kilovolt-amperes)(1) | |
| | | | | | | |
CG&E and subsidiaries | | | | | | | |
CG&E | | 1,561 | | 16,743 | | 21,121,288 | |
The Union Light, Heat and Power Company (ULH&P) | | 106 | | 2,883 | | 1,419,878 | |
Other subsidiaries | | 40 | | — | | — | |
Total CG&E and subsidiaries | | 1,707 | | 19,626 | | 22,541,166 | |
PSI Energy, Inc. (PSI) | | 5,354 | | 20,917 | | 30,569,289 | |
| | | | | | | |
Total | | 7,061 | | 40,543 | | 53,110,455 | |
Registrant
| | Electric
Transmission
Systems
| | Electric
Distribution
Systems
| | Substation
Combined
Capacity
|
|---|
| | (circuit miles)
| | (circuit miles)
| | (kilovolt-amperes)(1)
|
|---|
| CG&E | | 1,641 | | 15,315 | | 20,518,621 |
| | ULH&P | | 105 | | 2,646 | | 1,115,298 |
| | Other subsidiaries | | 40 | | 10 | | — |
| | |
| |
| |
|
| CG&E and subsidiaries | | 1,786 | | 17,971 | | 21,633,919 |
| PSI | | 5,515 | | 20,557 | | 28,946,637 |
| | |
| |
| |
|
| Total | | 7,301 | | 38,528 | | 50,580,556 |
| | |
| |
| |
|
(1)
- Kilovolt-amperes (1,000 volt-amperes) are a broad measure of our substation transformer capacity.
At the end of 19992004, our utility operating companies'companies’ electric systems were interconnected with thirteen14 other utilities. An additional interconnection was completed in 2000 betweenCinergy and a new generation-only area established by Enron bringing the total number of interconnections to fourteen.
Our electric transmission and distribution systems are designed and constructed to further the goal of providing reliable service to our customers. Every effort is made to ensure that sufficient facilities are in service to meet this goal without installing facilities beyond what is required to operate reliably and within design orthe designed parameters. Through our ongoing review of these systems, enhancements are developed and constructed to meet our planning, loading, and reliability guidelines. This process allows us to prudently invest in capacity additions only when and where they are required. The Midwest Independent Transmission System Operator, Inc. (Midwest ISO) holds functional control of Regulated’s transmission systems.
Gas
As of December 31, 2000,2004, the natural gas transmission and distribution systems ofCinergy and CG&E and its subsidiaries had approximately 7,5009,226 miles of mains and service lines located in southwestern Ohio southeastern Indiana, and northern Kentucky.Cinergy and CG&E and its subsidiaries also jointly own three underground caverns with a total storage capacity of approximately 23 million gallons of liquid propane.propane (of which 18.7 million gallons belongs to CG&E, including 7.5 million gallons belonging to ULH&P). As of December 31, 2000, we2004, Cinergy had 1716.6 million gallons of liquid propane in storage.storage (of which 14.4 million gallons belongs to CG&E, including 5.8 million gallons belonging to ULH&P). This liquid propane is used in the three propane/air peak shaving plants located in Ohio and Kentucky. ThesePropane/air peak shaving plants convert liquidstore propane intoand, when needed, vaporize the propane and mix with natural gas to be used onlysupplement the natural gas supply during peak demand periods and emergencies. During 2000,
In July 2004, we experienced peak loads for the year of 10,911 MW, 4,998 MW,and 6,000 MW for Cinergy, CG&E and its subsidiaries' natural gas transmission and distribution systems operated reliably, at a load factor of 34%, and at satisfactory levelsPSI, respectively. Cinergy and CG&E set record peak loads of utilization. Load factor is used to indicate the percentage11,305 MW and 5,311 MW in August 2002, respectively, while PSI set a record peak load of capacity of an energy facility, such as gas distribution, that is utilized at a given period of time.
CINERGY INVESTMENTS
In 1997,Cinergy and Trigen Energy Corporation formed a joint venture company, Trigen-Cinergy Solutions LLC, to build, own, operate, and maintain combined heat and power facilities for large
industrial customers. As of December 31, 2000, we have an ownership interest and/or operating control6,088 MW in nine domestic cogeneration (simultaneous production of two or more forms of useable energy from a single fuel source) plants producing 294 MW of electricity through our various joint ventures. During 2001-2002, we anticipate completing construction of three new cogeneration plants, which will produce an additional 40 MW of electricity.
In 2000,Cinergy formed a new wholly-owned subsidiary, Cinergy Solutions, Inc. (Cinergy Solutions), to develop, acquire, own, and operate energy-related projects. In October 2000, Cinergy Solutions agreed to form a partnership with British Petroleum to construct, own, and operate two new cogeneration plants located in Texas that, with existing facilities to be acquired by the partnership, will produce more than 800 MW of electricity. The operation of these two new cogeneration projects will coincide with the decommissioning of older, less efficient energy facilities. This agreement was finalized in late January 2001.
INTERNATIONAL
July 2002.
As of December 31, 2000, International had ownership interests in generating plants located in 11 countries, including the U.S., producing a total of 1,626 MW of electricity. Five of these plants are district heating plants in the Czech Republic, of which we own four and have a minority interest in the fifth, that in total provide 1,094 MW of thermal steam capacity, which may be used to produce 149 MW of electricity. We also own interests in 1,975 miles of gas and electric transmission and distribution systems through jointly-owned investments. International serves 51,140 transmission and distribution customers, 518 retail district heating and district electric customers, and 106 wholesale heating and electric customers.
During 2000,Cinergy invested or acquired the right to invest in two gas distribution businesses, both of which are located in major international markets and both of which will require development over the next several years in order to add customers. Specifically, in August 2000, together with a South African minority partner (5%),Cinergy acquired Egoli Gas, which has the right to develop and operate the gas distribution business in the Greater Johannesburg, South Africa market. Also, during the fourth quarter of 2000, a joint venture between a subsidiary ofCinergy and a subsidiary of Shell was awarded a 49% interest and operational control of a gas distribution business in Athens, Greece. We expect this transaction to close during the first half of 2001.21
LEGAL PROCEEDINGSGENERAL INFORMATION
NEW SOURCE REVIEW AND NOTICES OF VIOLATION
See Notes 12(c)In November 1999, and (d)through subsequent amendments, the United States brought a lawsuit in the United States Federal District Court for the Southern District of Indiana (District Court) against Cinergy, CG&E, and PSI alleging various violations of the "NotesCAA. Specifically, the lawsuit alleges that we violated the CAA by not obtaining Prevention of Significant Deterioration (PSD), Non-Attainment New Source Review (NSR), and Ohio and Indiana State Implementation Plans (SIP) permits for various projects at our owned and co-owned generating stations. Additionally, the suit claims that we violated an Administrative Consent Order entered into in 1998 between the Environmental Protection Agency (EPA) and Cinergy relating to alleged violations of Ohio’s SIP provisions governing particulate matter at Unit 1 at CG&E’s W.C. Beckjord Generating Station (Beckjord Station). The suit seeks (1) injunctive relief to require installation of pollution control technology on various generating units at CG&E’s Beckjord Station and Miami Fort Station, and PSI’s Cayuga Generating Station, Gallagher Generating Station, Wabash River Generating Station, and Gibson Generating Station (Gibson Station), and (2) civil penalties in amounts of up to $27,500 per day for each violation. In addition, three northeast states and two environmental groups have intervened in the case. The case is currently in discovery, and the District Court has set the case for trial by jury commencing in February 2006.
In March 2000, the United States also filed in the District Court an amended complaint in a separate lawsuit alleging violations of the CAA relating to PSD, NSR, and Ohio SIP requirements regarding various generating stations, including a generating station operated by Columbus Southern Power Company (CSP) and jointly-owned by CSP, The Dayton Power and Light Company (DP&L), and CG&E. The EPA is seeking injunctive relief and civil penalties of up to $27,500 per day for each violation. This suit is being defended by CSP. In April 2001, the District Court in that case ruled that the Government and the intervening plaintiff environmental groups cannot seek monetary damages for alleged violations that occurred prior to November 3, 1994; however, they are entitled to seek injunctive relief for such alleged violations. Neither party appealed that decision.
In addition, Cinergy and CG&E have been informed by DP&L that in June 2000, the EPA issued a Notice of Violation (NOV) to DP&L for alleged violations of PSD, NSR, and Ohio SIP requirements at a generating station operated by DP&L and jointly-owned by CG&E. The NOV indicated the EPA may (1) issue an order requiring compliance with the requirements of the Ohio SIP, or (2) bring a civil action seeking injunctive relief and civil penalties of up to $27,500 per day for each violation. In September 2004, Marilyn Wall and the Sierra Club brought a lawsuit against Cinergy, DP&L and CSP for alleged violations of the CAA at this same generating station.
We are unable to predict whether resolution of these matters would have a material effect on our financial position or results of operations. We intend to vigorously defend against these allegations.
In July 2004, the states of Connecticut, New York, California, Iowa, New Jersey, Rhode Island, Vermont, Wisconsin, and the City of New York brought a lawsuit in the United States District Court for the Southern District of New York against Cinergy, American Electric Power Company, Inc., American Electric Power Service Corporation, The Southern Company, Tennessee Valley Authority, and Xcel Energy Inc. That same day, a similar lawsuit was filed in the United States District Court for the Southern District of New York against the same companies by Open Space Institute, Inc., Open Space Conservancy, Inc., and The Audubon Society of New Hampshire. These lawsuits allege that the defendants’ emissions of CO2 from the combustion of fossil fuels at electric generating facilities contribute to global warming and amount to a public nuisance. The complaints also allege that the defendants could generate the same amount of electricity while emitting significantly less CO2. Plaintiffs are seeking an injunction requiring each defendant to cap its CO2 emissions and then reduce them by a specified percentage each year for at least a decade. Cinergy intends to defend these lawsuits vigorously in court and filed motions to dismiss with the other defendants in September 2004. We are not able to predict whether resolution of these matters would have a material effect on our financial position or results of operations.
22
In May 2004, SCRs and other pollution control equipment became operational at Units 4 and 5 of PSI’s Gibson Station in accordance with compliance deadlines under the NOX SIP Call. In June and July 2004, Gibson Station temporarily shut down the equipment on these units due to a concern over an acid aerosol mist haze (plume) sometimes occurring in areas near the plant. Portions of the plume from those units’ stacks appeared to break apart and descend to ground level at certain times under certain weather conditions. As a result, and, working with the City of Mt. Carmel, Illinois, Illinois EPA, Indiana Department of Environmental Management (IDEM), EPA, and the State of Illinois, we developed a protocol regarding the use of the SCRs while we explored alternatives to address this issue. After the protocol was finalized, the Illinois Attorney General brought an action in Wabash County Circuit Court against PSI seeking a preliminary injunction to enforce the protocol. In August 2004, the court granted that preliminary injunction. PSI is appealing that decision to the Fifth District Appellate Court, but we cannot predict the ultimate outcome of that appeal or of the underlying action by the Illinois Attorney General.
We will seek recovery of any related capital as well as increased emission allowance expenditures through the regulatory process. We do not believe costs related to resolving this matter will have a material impact on our financial position or results of operations.
In November 2004, a citizen of the Village of Moscow, Ohio, the town adjacent to CG&E’s Zimmer Station, brought a purported class action in the United States District Court for the Southern District of Ohio seeking monetary damages and injunctive relief against CG&E for alleged violations of the CAA, the Ohio SIP, Ohio laws against nuisance and common law nuisance. CG&E filed a motion to dismiss the lawsuit on primarily procedural grounds and we intend to defend against these claims vigorously. At this time, we cannot predict whether the outcome of this matter will have a material impact on our financial position or result of operations.
Coal tar residues, related hydrocarbons, and various metals have been found in at least 22 sites that PSI or its predecessors previously owned and sold in a series of transactions with Northern Indiana Public Service Company (NIPSCO) and Indiana Gas Company, Inc. (IGC). The 22 sites are in the process of being studied and will be remediated, if necessary. In 1998 NIPSCO, IGC, and PSI entered into Site Participation and Cost Sharing Agreements to allocate liability and responsibilities between them. The IDEM oversees investigation and cleanup of all of these sites. Thus far, PSI has primary responsibility for investigating, monitoring and, if necessary, remediating nine of these sites. In December 2003, PSI entered into a voluntary remediation plan with the state of Indiana, providing a formal framework for the investigation and cleanup of the sites.
In April 1998, PSI filed suit in Hendricks County in the state of Indiana against its general liability insurance carriers. PSI sought a declaratory judgment to obligate its insurance carriers to (1) defend MGP claims against PSI and compensate PSI for its costs of investigating, preventing, mitigating, and remediating damage to property and paying claims related to MGP sites; or (2) pay PSI’s cost of defense. The trial court issued a variety of rulings with respect to the claims and defenses in the litigation. PSI appealed certain adverse rulings to the Indiana Court of Appeals and the appellate court remanded the case to the trial court. PSI settled its claims with all but one of the insurance carriers in January 2005 prior to commencement of the trial. With respect to the lone insurance carrier, a jury returned a verdict against PSI in February 2005. PSI is considering whether to appeal this decision. At the present time, PSI cannot predict the outcome of this litigation if it were to appeal the decision.
PSI has accrued costs related to investigation, remediation, and groundwater monitoring for those sites where such costs are probable and can be reasonably estimated. We will continue to investigate and remediate the sites as outlined in the voluntary remediation plan. As additional facts become known and investigation is completed, we will assess whether the likelihood of incurring additional costs becomes probable. Until all investigation and remediation is complete, we are unable to determine the overall impact on our financial position or results of operations.
CG&E and ULH&P have performed site assessments on certain of their sites where we believe MGP activities have occurred at some point in the past and have found no imminent risk to the environment. At the present time,
23
CG&E and ULH&P cannot predict whether investigation and/or remediation will be required in the future at any of these sites.
CG&E and PSI have been named as defendants or co-defendants in lawsuits related to asbestos at their electric generating stations. Currently, there are approximately 100 pending lawsuits. In these lawsuits, plaintiffs claim to have been exposed to asbestos-containing products in the course of their work at the CG&E and PSI generating stations. The plaintiffs further claim that as the property owner of the generating stations, CG&E and PSI should be held liable for their injuries and illnesses based on an alleged duty to warn and protect them from any asbestos exposure. A majority of the lawsuits to date have been brought against PSI. The impact on CG&E’s and PSI’s financial position or results of operations of these cases to date has not been material.
Of these lawsuits, one case filed against PSI has been tried to verdict. The jury returned a verdict against PSI in the amount of approximately $500,000 on a negligence claim and a verdict for PSI on punitive damages. PSI received an adverse ruling in its initial appeal of the negligence claim verdict, but the Indiana Supreme Court accepted the transfer of the case and heard oral argument in June 2004. In addition, PSI has settled a number of other lawsuits for amounts, which neither individually nor in the aggregate, are material to PSI’s financial position or results of operations.
At this time, CG&E and PSI are not able to predict the ultimate outcome of these lawsuits or the impact on CG&E’s and PSI’s financial position or results of operations.
We currently, and from time to time, are involved in lawsuits, claims, and complaints incidental to the conduct of our business. In the opinion of management, no such proceeding is likely to have a material adverse effect on us.
See Note 11 of the “Notes to Financial Statements"Statements” in "Item“Item 8. Financial Statements and Supplementary Data"Data” for a discussion of the lawsuitfurther information regarding our commitments and notices of violation filed by the EPA againstCinergy,CG&E, andPSI.
MANUFACTURED GAS PLANT SITES
contingencies.
See Note 12(f) of the "Notes to Financial Statements" in "Item 8. Financial Statements and Supplementary Data" for a discussion of manufactured gas plant sites as they relate to our operating companies.
24
M METALS SUPERFUND SITE
On July 6, 2000, the EPA identifiedSUBMISSION OF MATTERS TO A VOTE OF SECURITY HOLDERSPSI and Indianapolis Power and Light Company (IPL) as Potentially Responsible Parties for the release of hazardous substances at the M Metals Superfund Site (Site) located in Indianapolis, Indiana. The EPA advised that it had taken response actions relating to the Site and had incurred costs of approximately $500,000. The EPA has demanded reimbursement of these costs incurred related to the Site and has encouragedPSI and IPL to work out an allocation between themselves for the payment of the costs. However,PSI and IPL will be held jointly and severally liable for the costs.PSI is communicating with the EPA and is in the process of reviewing EPA documentation of the cleanup in preparation of entering into settlement discussions. Resolution of this matter is not expected to materially impact our results of operations or financial condition.
No matters were submitted to a vote of security holders forof Cinergy,CG&E, The Cincinnati Gas & Electric Company, orPSIEnergy, Inc. during the fourth quarter of 2000.2004.
25
MARKET FOR REGISTRANT’S COMMON EQUITY, RELATED STOCKHOLDER MATTERS AND ISSUER PURCHASES OF EQUITY SECURITIES
PART II
Cinergy Corp.'s’s common stock is listed on the New York Stock Exchange. The high and low stock prices for each quarter for the past two years are indicated below:
| | High
| | Low
| | High | | Low | |
|---|
| 2000 | | | | | |
2004 | | | | | | |
| First Quarter | | $ | 25.88 | | $ | 20.00 | | $ | 41.10 | | $ | 37.17 | |
| Second Quarter | | 28.13 | | 21.19 | | 41.04 | | 34.92 | |
| Third Quarter | | 33.25 | | 25.56 | | 40.75 | | 36.95 | |
| Fourth Quarter | | 35.25 | | 28.50 | | 42.63 | | 38.08 | |
1999 |
|
|
|
| |
| | | | | | |
2003 | | | | | | |
| First Quarter | | $ | 34.88 | | $ | 27.38 | | $ | 35.87 | | $ | 29.77 | |
| Second Quarter | | 34.63 | | 27.44 | | 38.75 | | 33.25 | |
| Third Quarter | | 33.00 | | 27.31 | | 36.99 | | 33.14 | |
| Fourth Quarter | | 29.63 | | 23.44 | | 38.86 | | 35.19 | |
Cinergy Corp. holds all outstanding common stock of The Cincinnati Gas & Electric Company (CG&E) and PSI Energy, Inc. (PSI), and CG&E andPSI holds all of the common stock of The Union Light, Heat and Power Company (ULH&P)CG&E holds allULH&P common stock.. Therefore, no public trading market exists for the common stock ofCG&E,PSI, andULH&P.
As of January 29, 2001, the most recent dividend record date, we had 61,049 common stockholders of record.
31, 2005, Cinergy Corp. had 45,628 shareholders of record.
Cinergy Corp. declared dividends on its common stock of $.45$.47 and $.46 per share for each quarter of 19992004 and 2000.2003, respectively. The quarterly dividends
paid toCinergy Corp. byCG&E andPSI, and toCG&E byULH&P for the past two years were as follows:
Registrant
| | Quarter
| | 2000
| | 1999
| | Quarter | | 2004 | | 2003 | |
|---|
| |
| | (in thousands)
| | | | (in thousands) | |
|---|
| | | | | | | | |
| CG&E | | First | | $ | 53,600 | | $ | 71,400 | | First | | $ | 54,926 | | $ | 47,082 | |
| | | Second | | 55,612 | | 63,100 | |
| | | Second | | | 53,600 | | | 71,500 | | Third | | 57,971 | | 56,473 | |
| | | Third | | | 53,600 | | | 53,600 | | Fourth | | 67,249 | | 61,208 | |
| | | Fourth | | | 71,534 | | | 53,600 | | | | | | | |
PSI |
|
First |
|
$ |
18,000 |
|
$ |
— | | First | | $ | 28,957 | | $ | 30,503 | |
| | | Second | | | 18,000 | | | — | | Second | | 28,913 | | 17,837 | |
| | | Third | | | 18,000 | | | 17,900 | | Third | | 26,839 | | 24,984 | |
| | | Fourth | | | — | | | 18,000 | | Fourth | | 17,879 | | 20,626 | |
| | | | | | | | |
ULH&P |
|
First |
|
$ |
— |
|
$ |
— | | First | | $ | — | | $ | — | |
| | | Second | | | 4,974 | | | 4,976 | | Second | | — | | 6,305 | |
| | | Third | | | — | | | — | | Third | | — | | — | |
| | | Fourth | | | 4,683 | | | 4,683 | | Fourth | | 14,600 | | — | |
See Note 2(b)
On January 14, 2005, the Board of the "Notes to Financial Statements" in "Item 8. Financial Statements and Supplementary Data" for a brief descriptionDirectors of the registrants'Cinergy Corp. declared dividends on its common stock dividend restrictions.
of $.48 per share, payable February 15, 2005, to shareholders of record at the close of business on February 1, 2005.
ITEM 6. SELECTED FINANCIAL DATA
| | 2000(1)
| | 1999(1)
| | 1998(2)
| | 1997
| | 1996
|
|---|
| | (in millions, except per share amounts)
|
|---|
| Cinergy | | | | | | | | | | | | | | | |
| Operating revenues | | $ | 8,422 | | $ | 5,938 | | $ | 5,911 | | $ | 4,387 | | $ | 3,276 |
| Net income before extraordinary item | | | 399 | | | 404 | | | 261 | | | 363 | | | 335 |
| Net income | | | 399 | | | 404 | | | 261 | | | 253 | (3) | | 335 |
| Common stock | | | | | | | | | | | | | | | |
| | Earnings per share (EPS) | | | | | | | | | | | | | | | |
| | | Net income before extraordinary item | | | 2.51 | | | 2.54 | | | 1.65 | | | 2.30 | | | 2.00 |
| | | Net income | | | 2.51 | | | 2.54 | | | 1.65 | | | 1.61 | (3) | | 2.00 |
| | EPS—assuming dilution | | | | | | | | | | | | | | | |
| | | Net income before extraordinary item | | | 2.50 | | | 2.53 | | | 1.65 | | | 2.28 | | | 1.99 |
| | | Net income | | | 2.50 | | | 2.53 | | | 1.65 | | | 1.59 | (3) | | 1.99 |
| | Dividends declared per share | | | 1.80 | | | 1.80 | | | 1.80 | | | 1.80 | | | 1.74 |
Total assets |
|
|
12,330 |
|
|
9,617 |
|
|
9,687 |
|
|
8,858 |
|
|
8,725 |
| Long-term debt | | | 2,876 | | | 2,989 | | | 2,604 | | | 2,151 | | | 2,326 |
| Long-term debt due within one year | | | 41 | | | 31 | | | 136 | | | 85 | | | 140 |
CG&E |
|
|
|
|
|
|
|
|
|
|
|
|
|
|
|
| Operating revenues | | $ | 3,230 | | $ | 2,551 | | $ | 2,856 | | $ | 2,452 | | $ | 1,976 |
| Net income | | | 267 | | | 234 | | | 216 | | | 239 | | | 227 |
Total assets |
|
|
5,987 |
|
|
4,917 |
|
|
5,154 |
|
|
4,914 |
|
|
4,844 |
| Long-term debt | | | 1,205 | | | 1,206 | | | 1,220 | | | 1,324 | | | 1,381 |
| Long-term debt due within one year | | | 1 | | | — | | | 130 | | | — | | | 130 |
PSI |
|
|
|
|
|
|
|
|
|
|
|
|
|
|
|
| Operating revenues | | $ | 2,684 | | $ | 2,136 | | $ | 2,403 | | $ | 1,960 | | $ | 1,332 |
| Net income | | | 135 | | | 117 | | | 52 | | | 132 | | | 126 |
Total assets |
|
|
4,630 |
|
|
3,835 |
|
|
3,584 |
|
|
3,406 |
|
|
3,295 |
| Long-term debt | | | 1,074 | | | 1,212 | | | 1,026 | | | 826 | | | 945 |
| Long-term debt due within one year | | | 38 | | | 31 | | | 6 | | | 85 | | | 10 |
(1)See "Item“Dividend Restrictions” in “Item 7. Management'sManagement’s Discussion and Analysis of Financial Condition and Results of Operations",Operations” for a brief description of the registrants’ common stock dividend restrictions.
26
The number of shares (or units) provided in the table below represent shares exchanged in connection with employee option exercises and shares purchased by the "Notesplan trustee on behalf of the 401(k) Excess Plan.
Period | | (a) Total Number of Shares (or Units) Purchased | | (b) Average Price Paid per Share (or Unit) | | (c) Total Number of Shares (or Units) Purchased as Part of Publicly Announced Plans or Programs | | (d) Maximum Number (or Approximate Dollar Value) of Shares (or Units) that May Yet Be Purchased Under the Plans or Programs | |
| | | | | | | | | |
October 1 — October 31 | | 4,580 | | $ | 39.67 | | N/A | | N/A | |
November 1 — November 30 | | 2,288 | | $ | 39.45 | | N/A | | N/A | |
December 1 — December 31 | | — | | $ | — | | N/A | | N/A | |
27
SELECTED FINANCIAL DATA
| | 2004 | | 2003 | | 2002 | | 2001 | | 2000 | |
| | (in millions, except per share amounts) | |
| | | | | | | | | | | |
Cinergy(1) | | | | | | | | | | | |
Results of Operations: | | | | | | | | | | | |
Operating revenues | | $ | 4,688 | | $ | 4,416 | | $ | 4,059 | | $ | 3,950 | | $ | 3,752 | |
Income before discontinued operations and cumulative effect of changes in accounting principles | | 401 | | 435 | | 397 | | 457 | | 400 | |
Discontinued operations, net of tax(2) | | — | | 9 | | (25 | ) | (15 | ) | (1 | ) |
Cumulative effect of changes in accounting principles, net of tax(3) | | — | | 26 | | (11 | ) | — | | — | |
Net income | | 401 | | 470 | | 361 | | 442 | | 399 | |
| | | | | | | | | | | |
Per Share Data: | | | | | | | | | | | |
Earnings per common share (EPS) - basic: | | | | | | | | | | | |
Income before discontinued operations and cumulative effect of changes in accounting principles | | 2.22 | | 2.46 | | 2.37 | | 2.87 | | 2.52 | |
Discontinued operations, net of tax(2) | | — | | 0.05 | | (0.15 | ) | (0.09 | ) | (0.01 | ) |
Cumulative effect of changes in accounting principles, net of tax(3) | | — | | 0.15 | | (0.06 | ) | — | | — | |
Net income | | 2.22 | | 2.66 | | 2.16 | | 2.78 | | 2.51 | |
EPS - diluted: | | | | | | | | | | | |
Income before discontinued operations and cumulative effect of changes in accounting principles | | 2.18 | | 2.43 | | 2.34 | | 2.84 | | 2.51 | |
Discontinued operations, net of tax(2) | | — | | 0.05 | | (0.15 | ) | (0.09 | ) | (0.01 | ) |
Cumulative effect of changes in accounting principles, net of tax(3) | | — | | 0.15 | | (0.06 | ) | — | | — | |
Net income | | 2.18 | | 2.63 | | 2.13 | | 2.75 | | 2.50 | |
Cash dividends declared per share | | 1.88 | | 1.84 | | 1.80 | | 1.80 | | 1.80 | |
| | | | | | | | | | | |
Balance Sheet Data (at end of period): | | | | | | | | | | | |
Total assets from continuing operations | | 14,982 | | 14,114 | | 13,685 | | 12,558 | | 12,604 | |
Total assets from discontinued operations | | — | | 5 | | 147 | | 234 | | 197 | |
| | 14,982 | | 14,119 | | 13,832 | | 12,792 | | 12,801 | |
Long-term debt (including amounts due within one year) | | 4,448 | | 4,971 | | 4,188 | | 3,656 | | 2,868 | |
| | | | | | | | | | | |
The Cincinnati Gas & Electric Company (CG&E) | | | | | | | | | | | |
Results of Operations: | | | | | | | | | | | |
Operating revenues | | $ | 2,511 | | $ | 2,382 | | $ | 2,137 | | $ | 2,247 | | $ | 2,101 | |
Income before cumulative effect of changes in accounting principles | | 257 | | 300 | | 264 | | 327 | | 267 | |
Cumulative effect of changes in accounting principles, net of tax(4) | | — | | 31 | | — | | — | | — | |
Net income | | 257 | | 331 | | 264 | | 327 | | 267 | |
| | | | | | | | | | | |
Balance Sheet Data (at end of period): | | | | | | | | | | | |
Total assets | | 6,232 | | 5,809 | | 5,751 | | 5,559 | | 6,182 | |
Long-term debt (including amounts due within one year) | | 1,594 | | 1,569 | | 1,690 | | 1,205 | | 1,206 | |
| | | | | | | | | | | |
PSI Energy, Inc. (PSI) | | | | | | | | | | | |
Results of Operations: | | | | | | | | | | | |
Operating revenues | | $ | 1,754 | | $ | 1,603 | | $ | 1,611 | | $ | 1,574 | | $ | 1,512 | |
Income before cumulative effect of a change in accounting principle | | 165 | | 134 | | 214 | | 162 | | 135 | |
Cumulative effect of a change in accounting principle, net of tax(5) | | — | | (1 | ) | — | | — | | — | |
Net income | | 165 | | 133 | | 214 | | 162 | | 135 | |
| | | | | | | | | | | |
Balance Sheet Data (at end of period): | | | | | | | | | | | |
Total assets | | 5,450 | | 5,140 | | 4,539 | | 4,864 | | 4,906 | |
Long-term debt (including amounts due within one year) | | 1,874 | | 1,720 | | 1,372 | | 1,348 | | 1,113 | |
(1) The results of Cinergy also include amounts related to non-registrants.
(2) See Note 14 of the “Notes to Financial Statements"Statements” in "Item“Item 8. Financial Statements and Supplementary Data"Data” for factors affecting earningsfurther explanation.
(3) In 2003, Cinergy recognized a gain/(loss) on cumulative effect of changes in accounting principles of $39 million (net of tax) and discussion$(13) million (net of material uncertaintiestax) as a result of the reversal of accrued cost of removal for non-regulated generating assets and the change in accounting of certain energy related contracts from fair value to accrual. In 2002, Cinergy recognized a cumulative effect of a change in accounting principle of $(11) million (net of tax) as a result of an impairment charge for goodwill related to certain of our international assets.
,(4) In 2003, CG&E recognized a gain/(loss) on cumulative effect of changes in accounting principles of $39 million (net of tax) and $(8) million (net of tax) as a result of the reversal of accrued cost of removal for non-regulated generating assets and the change in accounting of certain energy related contracts from fair value to accrual.
, and(5) In 2003, PSI.
(2)See "Item 7. Management's Discussion and AnalysisFinancial Condition and Resultsa change in accounting principle of Operations".
(3)Included$(1) million (net of tax) as a result of a change in net income for 1997 was a one-time extraordinary chargeaccounting of $110 million ($.69 per share basic and diluted) for the windfall profits tax levied against our 50% ownership interest in Midlands. In the third quarter of 1999, we sold our ownership interest in Midlands.certain energy related contracts from fair value to accrual.
28
MD&A - EXECUTIVE SUMMARY
ITEM 7. MANAGEMENT'SMANAGEMENT’S DISCUSSION AND ANALYSIS OF FINANCIAL
CONDITION AND RESULTS OF OPERATIONS
In this report,Cinergy (which includesCinergy Corp. and all of ourits regulated and non-regulated subsidiaries) is, at times, referred to in the first person as "we"“we”, "our"“our”, or "us"“us”.
The following discussion should be read in conjunction with the accompanying financial statements and related notes included elsewhere in this report. We have reclassified certain prior-year amounts in the financial statements of Cinergy, The Cincinnati Gas & Electric Company (CG&E), PSI Energy, Inc. (INTRODUCTION
PSI), and The Union Light, Heat and Power Company (ULH&P) to conform to current presentation. The following discussions of results are not necessarily indicative of the results to be expected in any future period.
In Management'sManagement’s Discussion and Analysis of Financial Condition and Results of Operations (MD&A), we explain our general operating environment, as well as our results of operations, liquidity, capital resources, future expectations/trends, market risk sensitive instruments, and results of operations.accounting matters. Specifically, we discuss the following:
•
- factors affecting current and future operations;
•
- why
revenues and expensesresults changed from period to period; •
how the above items affect our overall financial condition;•what our expenditures for construction and other commitments were during 2000, and what we expect them to be in 2001-2005; and•- potential sources of cash for future capital
expenditures.
expenditures; and•ORGANIZATION
how these items affect our overall financial condition.
Financial Highlights
Net income for Cinergy for the years ended December 31, 2004, and 2003 was as follows:
| | Cinergy | |
| | 2004 | | 2003 | | Change | | % Change | |
| | (in millions) | |
| | | | | | | | | |
Net income | | $ | 401 | | $ | 470 | | $ | (69 | ) | (15 | )% |
| | | | | | | | | | | | |
The decrease in net income was primarily due to the following factors:
•Higher operating costs due, in part, to increases in costs for employee labor and benefits, production maintenance, and the implementation of a continuous improvement initiative;
•Lower margins from the sale of electricity in the Commercial Business Unit (Commercial) primarily due to higher fuel and emission allowance costs;
•Impairment and disposal charges on certain investments primarily in the Power Technology and Infrastructure Services Business Unit (Power Technology and Infrastructure); and
•Net gains recognized in 2003 resulting from the implementation of certain accounting changes and the disposal of discontinued operations.
These decreases were partially offset by:
•A higher price received per megawatt hour (MWh) resulting from the Indiana Utility Regulatory Commission’s (IURC) approval of PSI’s base retail electric rate increase in May 2004;
•Growth in non-weather related demand for electricity;
•An increase in gross margins on power marketing, trading, and origination contracts; and
•A gain related to a Power Technology and Infrastructure investment.
For further information, see “2004 Results of Operations — Cinergy”.
29
Forward-looking Challenges and Risks
Environmental Challenges
Cinergy faces many uncertainties with regard to future environmental legislation and the impact of this legislation on our generating assets and our decisions to construct new assets. In two separate rulemakings, the Environmental Protection Agency (EPA) has proposed significant reductions in sulfur dioxide (SO2), nitrogen oxides (NOX) and mercury emissions from power plants, neither of which have been finalized. Additionally, multi-emissions reductions legislation could be passed in 2005 that may take the place of these proposed rulemakings. In 2004, Cinergy’s utility operating companies began an environmental construction program to reduce overall plant emissions that is estimated to cost approximately $1.8 billion over the next five years. We believe that our construction program optimally balances these uncertainties and provides a level of emission reduction that will be required and/or economical to Cinergy under a variety of possible regulatory outcomes. See “Environmental Issues” in “Liquidity and Capital Resources” for further information.
Regulatory Challenges
Ohio has enacted electric generation deregulation legislation. CG&E’s residential customers are in a market development period through 2005, during which prices are fixed, while non-residential customers are under a recently approved rate stabilization plan (RSP) that runs through December 31, 2008. Residential customers will be under the RSP beginning in 2006, also ending in 2008. At this time, it is difficult to predict how the regulatory environment will look after the rate stabilization period ends. To date, deregulation in Ohio has not progressed as originally anticipated and the Ohio General Assembly may consider re-regulation laws as early as 2005. However, the possibility of deregulation or a hybrid of both deregulation and regulation still exists. These regulatory uncertainties are particularly challenging as we attempt to address short-term and long-term generation capacity needs as well as environmental requirements previously discussed. See “Regulatory Outlook and Significant Rate Developments” in “Future Expectations/Trends” for further discussion of these risks and uncertainties.
Midwest Independent Transmission System Operator, Inc. (Midwest ISO) Energy Markets
The projected implementation date is April 1, 2005 for the Midwest ISO to begin operating under the Energy Markets Tariff (sometimes referred to as a Locational Marginal Pricing (LMP) market or MISO Day 2 market). The implementation of an LMP market will introduce new scheduling requirements, new products for mitigating transmission congestion risks, and new pricing points for the purchase and sale of power. Cinergy is in the process of preparing for the implementation and the Midwest ISO is currently conducting market trials and testing of the Energy Markets. This is a significant undertaking by the Midwest ISO and its stakeholders and testing is not yet complete. See “Midwest ISO Energy Markets” in “Future Expectations/Trends” for further details regarding these new markets.
Rising Coal and Emission Allowance Prices
The prices of coal and SO2 allowances have increased dramatically in 2004, as compared to 2003. Contributing to the increases in coal and SO2 prices have been (1) increases in demand for electricity, (2) environmental regulation, and (3) decreases in the number of suppliers of coal from prior years. Since rates have been frozen for non-residential customers through 2004 and residential customers through 2005, pursuant to Ohio deregulation, these increases in coal and emission allowance prices could not be recovered through rates. The impact of these price increases on earnings is discussed in more detail in “Results of Operations”. See “Generation Portfolio Risks”in “Market Risk Sensitive Instruments” for information on how we plan to mitigate these risks going forward.
30
MD&A - - 2004 RESULTS OF OPERATIONS - CINERGY
Gross Margins
Given the dynamics of our business, which include regulatory revenues with directly offsetting expenses and commodity trading operations for which results are primarily reported on a net basis, we have concluded that a discussion of our results on a gross margin basis is most appropriate. Electric gross margins represent electric operating revenues less the related direct costs of fuel, emission allowances, and purchased power. Gas gross margins represent gas operating revenues less the related direct cost of gas purchased. Within each of these areas, we will discuss the key drivers of our results. Gross margins for Cinergy for the Regulated Business Unit (Regulated) and Commercial for the years ended December 31, 2004, and 2003 were as follows:
| | Cinergy | |
| | Regulated | | Commercial | |
| | 2004 | | 2003 | | Change | | % Change | | 2004 | | 2003 | | Change | | % Change | |
| | (in millions) | |
| | | | | | | | | | | | | | | | | |
Electric gross margin(1) | | $ | 1,656 | | $ | 1,469 | | $ | 187 | | 13 | % | $ | 637 | | $ | 714 | | $ | (77 | ) | (11 | )% |
Gas gross margin(2) | | 263 | | 244 | | 19 | | 8 | | 92 | | 88 | | 4 | | 5 | |
Total gross margin | | $ | 1,919 | | $ | 1,713 | | $ | 206 | | 12 | | $ | 729 | | $ | 802 | | $ | (73 | ) | (9 | ) |
| | | | | | | | | | | | | | | | | |
(1)Electric gross margin is calculated as Electric operating revenues less Fuel, emission allowances, and purchasedpower expense from the Statements of Income.
(2)Gas gross margin is calculated as Gas operating revenues less Gas purchased expense from the Statements ofIncome.
Cooling degree days and heating degree days are metrics commonly used in the utility industry as a measure of the impact weather has on results of operations. Cooling degree days and heating degree days in Cinergy’s service territory for the years ended December 31, 2004, and 2003 were as follows:
| | Cinergy | |
| | 2004 | | 2003 | | Change | | % Change | |
| | | | | | | | | |
Cooling degree days(1) | | 882 | | 831 | | 51 | | 6 | % |
Heating degree days(2) | | 5,006 | | 5,316 | | (310 | ) | (6 | ) |
| | | | | | | | | |
(1)Cooling degree days are the differences between the average temperature for each day and 65 degrees, assuming the average temperature is greater than 65 degrees.
(2) Heating degree days are the differences between the average temperature for each day and 65 degrees, assuming the average temperature is less than 65 degrees.
The change in cooling degree days and heating degree days did not have a material effect on Cinergy’s gross margins for the year ended December 31, 2004, as compared to 2003.
Regulated Gross Margins
The 13 percent increase in Regulated’s electric gross margins was primarily due to the following factors:
•An approximate $80 million increase resulting from a higher price received per MWh due to PSI’s base retail electric rate increase in May 2004; and
•An approximate $32 million increase due to growth in non-weather related demand.
The eight percent increase in Regulated’s gas gross margins was primarily due to an approximate $16 million increase in tariff adjustments mainly associated with the gas main replacement program. Partially offsetting this increase was an approximate $7 million decrease reflecting a decline in non-weather related demand.
31
Commercial
Gross Margins
The 11 percent decrease in Commercial’s electric gross margins was primarily due to the following factors:
•An approximate $51 million increase in CG&E’s average price of fuel without a matching increase in the price of power charged to customers (the majority of which were under fixed price contracts); and
•An approximate $62 million increase in emission allowance costs, primarily due to increases in SO2 emission allowance market prices, without a matching increase in the price of power charged to customers. The number of SO2 emission allowances used also increased in 2004.
Partially offsetting these decreases were:
•An approximate $24 million increase in gross margins on power marketing, trading, and origination contracts attributable to higher margins on physical and financial trading, primarily related to regional spreads between the mideast and midwest markets; and
•An approximate $15 million increase due to growth in non-weather related demand.
Commercial’s gas gross margins under generally accepted accounting principles (GAAP) and Commercial’s adjusted gas gross margins were relatively flat in 2004, as compared to 2003, although volatility during 2004 was significant due to timing differences in revenue recognition between physical storage activities and the associated derivative contracts that hedge the physical storage. We evaluate the results of our gas marketing and trading business on an economic basis, which we term “adjusted gas gross margins”.
Our gas marketing and trading business regularly hedges its price exposure of natural gas held in storage by selling derivative contracts for winter month delivery. The majority of the gas held in storage is designated as being hedged under Statement of Financial Accounting Standards No. 133’s, Accounting for Derivative Instruments and Hedging Activities (Statement 133), fair value hedge accounting model, which allows the gas to be accounted for at its fair value (based on spot prices). Under GAAP, the derivative contracts hedging the gas are accounted for at fair value (based on forward winter prices). Conversely, the agreements with pipelines to store this natural gas until the winter periods are not derivatives and are not adjusted for changes in fair value (see footnote 1 in the table below).
For a more complete understanding of our gas marketing and trading results, we have prepared the following table, which reconciles the gas margins under GAAP, the impact of adjusting these margins for the fair value of pipeline agreements and certain gas held in storage, and the resulting adjusted gas gross margins:
| | 2004 | | 2003 | | Change | |
| | (in millions) | |
| | | | | | | |
Gas margins, as reported (GAAP) | | $ | 92 | | $ | 88 | | $ | 4 | |
| | | | | | | |
Fair value adjustments not recognized under GAAP(1) | | (7 | ) | (5 | ) | (2 | ) |
| | | | | | | |
Adjusted gas gross margins | | $ | 85 | | $ | 83 | | $ | 2 | |
(1)Relates to fair value of storage agreements. The value of a storage agreement is the ability to store and optimize gas between periods of lower prices (typically summer) and periods of higher prices (typically winter). A large component of the fair value is therefore the differences between winter prices and spot prices. As this spread gets wider, the value of a storage agreement increases.
32
Other Operating Revenues and Costs of Fuel Resold
The 41 percent increase in Other Operating Revenues was primarily due to the following factors:
•An approximate $67 million increase in Commercial’s revenues from coal origination resulting from increases in coal prices and the number of coal origination contracts. Coal origination includes contract structuring and marketing of physical coal; and
•An approximate $28 million increase in Commercial’s revenues from the sale of synthetic fuel.
Costs of fuel resold includes Commercial’s costs of coal origination activities and the production of synthetic fuel. These costs have increased in 2004, which is consistent with the increases in the associated revenues as previously discussed.
The following explanations correspond with the line items on the Statements of Income for Cinergy. However, only the line items that varied significantly from prior periods are discussed.
Other Operating Expenses
| | Cinergy | |
| | 2004 | | 2003 | | Change | | % Change | |
| | (in millions) | |
| | | | | | | | | |
Operation and maintenance | | $ | 1,282 | | $ | 1,119 | | $ | 163 | | 15 | % |
Depreciation | | 460 | | 399 | | 61 | | 15 | |
Taxes other than income taxes | | 254 | | 250 | | 4 | | 2 | |
Total | | $ | 1,996 | | $ | 1,768 | | $ | 228 | | 13 | |
Operation and Maintenance
The 15 percent increase in Operation and maintenance expense was primarily due to the following factors:
•Costs primarily associated with employee labor and benefits increased approximately $50 million. Labor and benefit costs increased approximately six percent;
•Maintenance expenses, primarily production related, were higher by approximately $26 million;
•An approximate $20 million of costs incurred in 2004 related to a continuous improvement initiative;
•Higher transmission costs of approximately $15 million. This increase was due, in part, to refunds received in 2003, which offset a portion of the costs for that year; and
•An approximate $14 million increase in operation expenses for non-regulated service subsidiaries that started operations, or became fully consolidated, after the second quarter of 2003.
These increases were partially offset by:
•The recognition of approximately $14 million of costs associated with voluntary early retirement programs and employee severance programs in 2003; and
•An approximate $12 million for costs incurred in 2003 associated with the bankruptcy of Enron Corp.
Depreciation
The 15 percent increase in Depreciation expense was primarily due to the following factors:
•An approximate $36 million increase due to the addition of depreciable plant, primarily for pollution control equipment, and the accelerated gas main replacement program; and
•An approximate $27 million increase resulting from a) higher depreciation rates, as a result of changes in useful lives of production assets and an increased rate for cost of removal and b) recovery of deferred depreciation costs, both of which were approved in PSI’s latest retail rate case.
33
These increases were partially offset by approximately $15 million due to longer estimated useful lives of CG&E’s generation assets resulting from a depreciation study completed during the third quarter of 2003.
Equity in Earnings of Unconsolidated Subsidiaries
The increase in Equity in Earnings of Unconsolidated Subsidiaries was primarily due to a gain of approximately $21 million relating to the sale of most of the assets by a company in which Power Technology and Infrastructure holds an investment. See Note 15(b) of the “Notes to Financial Statements” in “Item 8. Financial Statements and Supplementary Data” for further information.
Miscellaneous Income (Expense) - Net
The decrease in Miscellaneous Income (Expense) — Net was primarily due to the recognition of approximately $56 million in impairment and disposal charges in 2004 primarily associated with certain investments in the Power Technology and Infrastructure portfolio. The values of these investments reflect our estimates and judgments about the future performance of these investments, for which actual results may differ. A substantial portion of these charges relate to a company, in which Cinergy holds a non-controlling interest that sold its major assets in 2004. This company is involved in the development and sale of outage management software.
This decrease was partially offset by interest income of approximately $9 million on the notes receivable of two subsidiaries consolidated in the third quarter of 2003.
Interest Expense
The two percent increase in Interest Expense was primarily due to the following factors:
•An approximate $12 million increase due to Cinergy’s recognition of a note payable to a trust; and
•An approximate $9 million increase related to additional debt recorded in accordance with the consolidation of two new entities.
The note payable and additional debt were both recorded in July 2003 resulting from the adoption of Financial Accounting Standards Board Interpretation No. 46, Consolidation of Variable Interest Entities (Interpretation 46).
These increases were partially offset by:
•A decline in average long-term debt; and
•Charges recorded during 2003 associated with CG&E’s refinancing of certain debt.
Preferred Dividend Requirement of Subsidiary Trust
The decrease in Preferred Dividend Requirement of Subsidiary Trust was a result of the implementation of Interpretation 46. Effective July 1, 2003, the preferred trust securities and the related dividends are no longer reported in Cinergy’s financial statements. However, interest expense is still being incurred on a note payable to this trust as previously discussed. See Note 1(q)(i) of the “Notes to Financial Statements” in “Item 8. Financial Statements and Supplementary Data” for further details.
Income Taxes
Cinergy’s 2004 effective tax rate was approximately 21 percent, a decrease of four percent from 2003, resulting from a greater amount of tax credits associated with the production and sale of synthetic fuel and the successful resolution of certain tax matters.
34
Discontinued Operations
During 2003, Cinergy completed the disposal of its gas distribution operation in South Africa, sold its remaining wind assets in the United States, and substantially sold or liquidated the assets of its energy trading operation in the Czech Republic. Pursuant to Statement of Financial Accounting Standards No. 144, Accounting for the Impairment or Disposal of Long-lived Assets (Statement 144), these investments have been classified as discontinued operations in our financial statements. See Note 14 of the “Notes to Financial Statements” in “Item 8. Financial Statements and Supplementary Data” for additional information.
Cumulative Effect of Changes in Accounting Principles
In 2003, Cinergy recognized a Delaware corporation createdCumulative effect of changes in October 1994, owns all outstanding common stockaccounting principles, net of tax gain of approximately $26 million. The Cincinnati Gas & Electric Company cumulative effect of changes in accounting principles was a result of the adoption of Statement of Financial Accounting Standards No. 143, Accounting for Asset Retirement Obligations (Statement 143) and the rescission of Emerging Issues Task Force (EITF) Issue 98-10, Accounting for Contracts Involved in Energy Trading and Risk Management Activities (EITF 98-10). See Note 1(q)(iv) of the “Notes to Financial Statements” in “Item 8. Financial Statements and Supplementary Data” for further information.
35
MD&A - 2004 RESULTS OF OPERATIONS – CG&E
Summary of Results
Net income for CG&E) for the years ended December 31, 2004, and PSI Energy, Inc. (2003 were as follows:
| | CG&E and subsidiaries | |
| | 2004 | | 2003 | | Change | | % Change | |
| | (in millions) | |
| | | | | | | | | |
Net income | | $ | 257 | | $ | 331 | | $ | (74 | ) | (22 | )% |
| | | | | | | | | | | | |
The decrease in net income was primarily due to the following factors:
•Higher operating costs due, in part, to increases in costs for employee labor and benefits;
•Lower margins from the sale of electricity primarily due to higher fuel and emission allowance costs; and
•A net gain recognized in 2003 resulting from the implementation of certain accounting changes.
These decreases were partially offset by:
•Growth in non-weather related demand for electricity; and
•An increase in gross margins on power marketing, trading, and origination contracts.
Gross Margins
Gross margins for CG&E for the years ended December 31, 2004, and 2003 were as follows:
| | CG&E and subsidiaries | |
| | 2004 | | 2003 | | Change | | % Change | |
| | (in millions) | |
| | | | | | | | | |
Electric gross margin(1) | | $ | 1,168 | | $ | 1,195 | | $ | (27 | ) | (2 | )% |
Gas gross margin(2) | | 263 | | 245 | | 18 | | 7 | |
| | | | | | | | | | | | |
(1)Electric gross margin is calculated as Electric operating revenues less Fuel, emission allowances, and purchased power expense from the Statements of Income.
(2)Gas gross margin is calculated as Gas operating revenues less Gas purchased expense from the Statements of Income.
Cooling degree days and heating degree days in CG&E’s service territory for the years ended December 31, 2004, and 2003 were as follows:
| | CG&E and subsidiaries | |
| | 2004 | | 2003 | | Change | | % Change | |
| | | | | | | | | |
Cooling degree days(1) | | 876 | | 812 | | 64 | | 8 | % |
Heating degree days(2) | | 4,881 | | 5,119 | | (238 | ) | (5 | ) |
(1)Cooling degree days are the differences between the average temperature for each day and 65 degrees, assuming the average temperature is greater than 65 degrees.
(2)Heating degree days are the differences between the average temperature for each day and 65 degrees, assuming the average temperature is less than 65 degrees.
The change in cooling degree days and heating degree days did not have a material effect on CG&E’s gross margins for the period.
36
Electric Gross Margins
The two percent decrease in CG&E’s electric gross margins was primarily due to the following factors:
•An approximate $51 million increase in the average price of fuel without a matching increase in the price of power charged to customers (the majority of which were under fixed price contracts); and
•An approximate $32 million increase in emission allowance costs, primarily due to an increase in SO2 emission allowance market prices, without a matching increase in the price of power charged to customers.
These decreases were partially offset by:
•An approximate $31 million increase in margins from retail customers due to growth in non-weather related demand; and
•An approximate $29 million increase in gross margins on power marketing, trading, and origination contracts attributable to higher margins on physical and financial trading, primarily related to regional spreads between the mideast and midwest markets.
Gas Gross Margins
The seven percent increase in CG&E’s gas gross margins was primarily due to an approximate $16 million increase in tariff adjustments mainly associated with the gas main replacement program. Partially offsetting this increase was an approximate $7 million decrease reflecting a decline in non-weather related demand.
Other Operating Revenues and Costs of Fuel Resold
The increase in Other Operating Revenues was due to an approximate $67 million increase in revenues from coal origination resulting from increases in coal prices and the number of coal origination contracts.
Costs of fuel resold represents the costs of coal origination activities. These costs have increased in 2004, which is consistent with the increase in the associated revenues as previously discussed.
The following explanations correspond with the line items on the Statements of Income for CG&E. However, only the line items that varied significantly from prior periods are discussed.
Other Operating Expenses
| | CG&E and subsidiaries | |
| | 2004 | | 2003 | | Change | | % Change | |
| | (in millions) | |
| | | | | | | | | |
Operation and maintenance | | $ | 594 | | $ | 500 | | $ | 94 | | 19 | % |
Depreciation | | 179 | | 187 | | (8 | ) | (4 | ) |
Taxes other than income taxes | | 198 | | 200 | | (2 | ) | (1 | ) |
Total | | $ | 971 | | $ | 887 | | $ | 84 | | 9 | |
Operation and Maintenance
The 19 percent increase in Operation and maintenance expense was primarily due to the following factors:
•Costs primarily associated with employee labor and benefits increased approximately $28 million;
•Maintenance expenses, primarily production and distribution related, were higher by approximately $21 million;
•An approximate $9 million of costs incurred in 2004 related to a continuous improvement initiative; and
37
•Higher transmission costs of approximately $9 million. This increase was due, in part, to refunds received in 2003, which offset a portion of the costs for that year.
Partially offsetting these increases was the recognition of approximately $4 million of costs associated with voluntary early retirement programs and employee severance programs in 2003.
Depreciation
The four percent decrease in Depreciation expense was primarily due to longer estimated useful lives of CG&E’s generation assets resulting from a depreciation study completed during the third quarter of 2003, which resulted in a decrease of approximately $15 million. This decrease was partially offset by an approximate $8 million increase due to the addition of depreciable plant primarily for pollution control equipment and the accelerated gas main replacement program.
Miscellaneous Income - Net
The 47 percent decrease in Miscellaneous Income — Net was primarily due to the following factors:
•A final reconciliation recorded in 2003 between CG&E and PSI due to a previous demutualization of a medical insurance carrier used by both companies; and
•A decline in the allowance for equity funds used during construction resulting from certain assets being placed into service and a decrease in the equity rate applied.
Interest Expense
The 21 percent decrease in Interest Expense was primarily due to the following factors:
•A decline in average long-term debt; and
•Charges recorded during 2003 associated with the refinancing of certain debt.
Cumulative Effect of Changes in Accounting Principles
In 2003, CG&E recognized a Cumulative effect of changes in accounting principles, net of tax gain of approximately $31 million as a result of the adoption of Statement 143 and the rescission of EITF 98-10. See Note 1(q)(iv), of the “Notes to Financial Statements” in “Item 8. Financial Statements and Supplementary Data” for further information.
38
MD&A - - 2004 RESULTS OF OPERATIONS – PSI
Summary of Results
Net income for PSI for the years ended December 31, 2004, and 2003 were as follows:
| | PSI | |
| | 2004 | | 2003 | | Change | | % Change | |
| | (in millions) | |
| | | | | | | | | |
Net income | | $ | 165 | | $ | 133 | | $ | 32 | | 24 | % |
| | | | | | | | | | | | |
The increase in net income was primarily due to the following factors:
•The impact of the PSI base retail electric rate increase in May 2004; and
•Growth in non-weather related demand.
These increases were partially offset by higher operating costs due, in part, to increases in costs for employee labor and benefits.
Electric Gross Margins
Gross margins for PSI for the years ended December 31, 2004, and 2003 were as follows:
| | PSI | |
| | 2004 | | 2003 | | Change | | % Change | |
| | (in millions) | |
| | | | | | | | | |
Electric gross margin(1) | | $ | 1,103 | | $ | 973 | | $ | 130 | | 13 | % |
| | | | | | | | | | | | |
(1) Electric gross margin is calculated as Electric operating revenues less Fuel, emission allowances, and purchased power expense from the Statements of Income.
Cooling degree days and heating degree days in PSI’s service territory for the years ended December 31, 2004, and 2003 were as follows:
| | PSI | |
| | 2004 | | 2003 | | Change | | % Change | |
| | | | | | | | | |
Cooling degree days(1) | | 887 | | 850 | | 37 | | 4 | % |
Heating degree days(2) | | 5,128 | | 5,512 | | (384 | ) | (7 | ) |
(1)Cooling degree days are the differences between the average temperature for each day and 65 degrees, assuming the average temperature is greater than 65 degrees.
(2)Heating degree days are the differences between the average temperature for each day and 65 degrees, assuming the average temperature is less than 65 degrees.
39
The change in degree days did not have a material effect on electric gross margins for the period. The 13 percent increase in PSI’s electric gross margins was primarily due to the following factors:
•An approximate $80 million increase resulting from a higher price received per MWh due to PSI’s base retail electric rate increase in May 2004; and
•An approximate $16 million increase due to growth in non-weather related demand.
The following explanations correspond with the line items on the Statements of Income for PSI. However, only the line items that varied significantly from prior periods are discussed.
Other Operating Expenses
| | PSI | |
| | 2004 | | 2003 | | Change | | % Change | |
| | (in millions) | |
| | | | | | | | | |
Operation and maintenance | | $ | 475 | | $ | 449 | | $ | 26 | | 6 | % |
Depreciation | | 222 | | 164 | | 58 | | 35 | |
Taxes other than income taxes | | 47 | | 46 | | 1 | | 2 | |
Total | | $ | 744 | | $ | 659 | | $ | 85 | | 13 | |
Operation and Maintenance
The six percent increase in Operation and maintenance expense was primarily due to the following factors:
•Costs primarily associated with employee labor and benefits increased approximately $14 million;
•An approximate $8 million of costs incurred in 2004 related to a continuous improvement initiative;
•An increase in production related maintenance expense of approximately $7 million; and
•Higher transmission costs of approximately $6 million. This increase was due, in part, to refunds received in 2003, which offset a portion of the costs for that year.
Partially offsetting these increases was the recognition of approximately $4 million of costs associated with voluntary early retirement programs and employee severance programs in 2003.
Depreciation
The 35 percent increase in Depreciation expense was primarily due to the following factors:
•An approximate $27 million increase due to the addition of depreciable plant primarily for pollution control equipment; and
•An approximate $27 million increase resulting from a) higher depreciation rates, as a result of changes in useful lives of production assets and an increased rate for cost of removal and b) recovery of deferred depreciation costs, both of which were approved in PSI’s latest retail rate case.
Interest Expense
The seven percent increase in Interest Expense was primarily due to an increase in the effective interest rate on short-term debt and an increase in the average amount of short-term debt outstanding.
40
MD&A - 2004 RESULTS OF OPERATIONS – ULH&P
The Results of Operations discussion for ULH&P is presented only for the year ended December 31, 2004, in accordance with General Instruction I(2)(a).
Electric and gas gross margins and net income for ULH&P for the years ended December 31, 2004 and 2003, were as follows:
| | ULH&P | |
| | 2004 | | 2003 | | Change | | % Change | |
| | (in millions) | |
| | | | | | | | | |
Electric gross margin(1) | | $ | 68 | | $ | 68 | | $ | — | | — | % |
Gas gross margin(2) | | 45 | | 40 | | 5 | | 13 | |
Net income | | 19 | | 19 | | — | | — | |
| | | | | | | | | | | | |
(1)Electric gross margin is calculated as Electric operating revenues less Electricity purchased from parent company for resale expense from the Statements of Income.
(2)Gas gross margin is calculated as Gas operating revenues less Gas purchased expense from the Statements of Income.
Electric gross margins for ULH&P remained flat as growth in non-weather related demand was offset by the cost of increased electricity purchases to meet that demand. The 13 percent increase in gas gross margins was due, in part, to an approximate $3 million increase in rate tariff adjustments associated with the gas main replacement program and the demand-side management program, which encourages efficient customer gas usage.
Net income remained flat as an approximate $2 million increase in operating costs, primarily related to increased transmission and distribution expenses, was partially offset by an approximate $1 million reduction in property taxes during 2004.
41
MD&A - - 2003 RESULTS OF OPERATIONS - CINERGY
Summary of Results
Net income for Cinergy for the years ended December 31, 2003, and 2002 was as follows:
| | Cinergy | |
| | 2003 | | 2002 | | Change | | % Change | |
| | (in millions) | |
| | | | | | | | | |
Net income | | $ | 470 | | $ | 361 | | $ | 109 | | 30 | % |
| | | | | | | | | | | | |
Cinergy’s increase in net income was primarily due to the following factors:
•Increases in gas gross margins as a result of an increase in base rates for Ohio customers, colder weather and increased volatility in gas prices in the first quarter of 2003, as compared to 2002, and an increase in natural gas sold from storage;
•Lower operating costs primarily resulting from the recognition of higher costs in 2002 associated with employee severance programs;
•Lower property taxes, primarily resulting from the change in property value assessment in the state of Indiana in 2003;
•The 2002 write-off of certain investments;
•A net gain recognized in 2003 resulting from the implementation of certain accounting changes;
•Gains realized in 2003 and losses incurred in 2002 from the disposal of discontinued operations; and
•Lower income taxes resulting primarily from tax credits associated with the production of synthetic fuel, which began in July 2002.
These increases were partially offset by:
•A decrease in electric gross margins primarily due to milder weather in 2003; and
•A decline in electric gross margins associated with Cinergy’s natural gas peaking assets.
Gross Margins
Given the dynamics of our business, which include regulatory revenues with directly offsetting expenses and commodity trading operations for which results are primarily reported on a net basis, we have concluded that a discussion of our results on a gross margin basis is most appropriate. Electric gross margins represent electric operating revenues less the related direct costs of fuel, emission allowances, and purchased power. Gas gross margins represent gas operating revenues less the related direct cost of gas purchased. Within each of these areas, we will discuss the key drivers of our results. Gross margins for Cinergy for Regulated and Commercialfor the years ended December 31, 2003, and 2002 were as follows:
| | Cinergy | |
| | Regulated | | Commercial | |
| | 2003 | | 2002 | | Change | | % Change | | 2003 | | 2002 | | Change | | % Change | |
| | (in millions) | |
| | | | | | | | | | | | | | | | | |
Electric gross margin(1) | | $ | 1,469 | | $ | 1,571 | | $ | (102 | ) | (6 | )% | $ | 714 | | $ | 735 | | $ | (21 | ) | (3 | )% |
Gas gross margin(2) | | 244 | | 203 | | 41 | | 20 | | 88 | | 77 | | 11 | | 14 | |
Total gross margin | | $ | 1,713 | | $ | 1,774 | | $ | (61 | ) | (3 | ) | $ | 802 | | $ | 812 | | $ | (10 | ) | 1 | |
| | | | | | | | | | | | | | | | | | | | | | | | | | | | | | |
(1)Electric gross margin is calculated as Electric operating revenues less Fuel, emission allowances, and purchased power expense from the Statements of Income.
(2)Gas gross margin is calculated as Gas operating revenues less Gas purchased expense from the Statements of Income.
42
Cooling degree days and heating degree days are metrics commonly used in the utility industry as a measure of the impact weather has on results of operations. Cooling degree days and heating degree days in Cinergy’s service territory for the years ended December 31, 2003, and 2002 were as follows:
| | Cinergy | |
| | 2003 | | 2002 | | Change | | % Change | |
| | | | | | | | | |
Cooling degree days(1) | | 831 | | 1,357 | | (526 | ) | (39 | )% |
Heating degree days(2) | | 5,316 | | 5,093 | | 223 | | 4 | |
(1)Cooling degree days are the differences between the average temperature for each day and 65 degrees, assuming the average temperature is greater than 65 degrees.
(2)Heating degree days are the differences between the average temperature for each day and 65 degrees, assuming the average temperature is less than 65 degrees.
Regulated Gross Margins
The six percent decrease in Regulated’s electric gross margins was primarily due to a decline in retail electric margins mainly resulting from milder weather in 2003, compared to 2002. As noted in the table, cooling degree days were down 39 percent in Cinergy’s service territory. Partially offsetting this decrease was an increase in rate tariff adjustments associated with certain construction programs at PSI.
The 20 percent increase in Regulated’s gas gross margins was primarily due to the following factors:
•An increase in base rates, as approved by the Public Utilities Commission of Ohio (PUCO) in May 2002, and tariff adjustments associated with the gas main replacement program and Ohio excise taxes; and
•The colder weather in the first quarter of 2003, compared to 2002, which resulted in a greater amount of thousand cubic feet (mcf) delivered to customers.
Commercial
Gross Margins
The three percent decrease in Commercial’s electric gross margins was primarily due to a decline in margins associated with Commercial’snatural gas peaking assets in 2003, as compared to 2002. Partially offsetting this decrease were higher margins from physical and financial trading primarily in and around the midwest.
The 14 percent increase in Commercial’s gas gross margins was primarily due to the following factors:
•An increase in the volatility of natural gas prices in the first quarter of 2003, as compared to the same period in 2002; and
•An increase in natural gas sold out of storage in 2003. Cinergy Marketing & Trading, LP (Marketing & Trading) began engaging in significant storage activities at the end of the second quarter of 2002.
Other Operating Revenues and Costs of Fuel Resold
The 22 percent increase in Other Operating Revenues was primarily due to an increase in Commercial’s revenues from the sale of synthetic fuel, which began in July 2002. This increase was partially offset by a decline in Commercial’s revenues from coal origination.
Costs of fuel resold includes Commercial’s costs of coal origination activities and the production of synthetic fuel. In 2003, the costs of producing synthetic fuel increased and the costs of coal origination activities decreased, both of which are public utility subsidiaries. Asconsistent with the changes in the associated revenues as previously discussed.
43
The following explanations correspond with the line items on the Statements of Income for Cinergy. However, only the line items that varied significantly from prior periods are discussed.
Other Operating Expenses
| | Cinergy | |
| | 2003 | | 2002 | | Change | | % Change | |
| | (in millions) | |
| | | | | | | | | |
Operation and maintenance | | $ | 1,119 | | $ | 1,202 | | $ | (83 | ) | (7 | )% |
Depreciation | | 399 | | 404 | | (5 | ) | (1 | ) |
Taxes other than income taxes | | 250 | | 263 | | (13 | ) | (5 | ) |
Total | | $ | 1,768 | | $ | 1,869 | | $ | (101 | ) | (5 | ) |
| | | | | | | | | | | | | | | |
Operation and Maintenance
The seven percent decrease in Operation and maintenance expense was primarily due to the following factors:
•The recognition of higher costs associated with employee severance programs in 2002;
•Decreased transmission costs, largely the result of changes in the Midwest ISO operations; and
•A decrease in employee incentive costs.
These decreases were partially offset by:
•The charges associated with our resolution of claims with respect to the bankruptcy of Enron Corp.; and
•An increase in maintenance expense for our generating units and overhead lines.
Depreciation
The one percent decrease in Depreciation expense was primarily due to the following factors:
•An increase in estimated useful lives of CG&E’s generation assets resulting from a depreciation study completed during the third quarter of 2003; and
•CG&E’s discontinuance of accruing costs of removal for generating assets (which was previously included as part of Depreciation expense) as a result of the adoption of Statement 143. See Note 1(j) of the “Notes to Financial Statements” in “Item 8. Financial Statements and Supplementary Data” for further details. Prior periods were not restated for the adoption of Statement 143.
Partially offsetting these decreases was the addition of depreciable plant primarily including pollution control equipment, accelerated gas main replacement program assets, and equipment associated with the production of synthetic fuel.
Taxes Other Than Income Taxes
The five percent decrease in Taxes other than income taxes expense was primarily due to lower property taxes, which were partially offset by increased excise taxes. This decrease was primarily a result of a change in property value assessments in the state of Indiana in 2003.
44
Miscellaneous Income (Expense) - Net
The increase in Miscellaneous Income (Expense) - Net was primarily due to the following factors:
•2002 write-offs of certain equipment and technology investments and costs accrued related to the termination of a contract for the construction of combustion turbines; and
•Interest income on the notes receivable of two newly consolidated subsidiaries in 2003. See Note 1(q)(i) of the “Notes to Financial Statements” in “Item 8. Financial Statements and Supplementary Data” for further details.
Partially offsetting these increases were net gains realized in 2002 from the sale of equity investments in certain renewable energy projects.
Interest Expense
The 11 percent increase in InterestExpense was primarily due to the following factors:
•An increase in average long-term debt outstanding during the year ended December 31, 2003;
•Charges during 2003 associated with the re-financing of certain debt; and
•Additional debt recorded in July 2003 with the consolidation of two new entities and the recognition of a note payable to a trust resulting from the adoption of Interpretation 46. See Note 1(q)(i) of the “Notes to Financial Statements” in “Item 8. Financial Statements and Supplementary Data”.
Theseincreases were partially offset by a decrease in short-term interest rates.
Preferred Dividend Requirement of Subsidiary Trust
The 50 percent decrease in Preferred Dividend Requirement of Subsidiary Trust was a result of the implementation of Interpretation 46. Effective July 1, 2003, the preferred trust securities and the related dividends are no longer reported in Cinergy’s financial statements. However, interest expense is still being incurred on a note payable to this ownership, we are consideredtrust as previously discussed. See Note 1(q)(i) of the “Notes to Financial Statements” in “Item 8. Financial Statements and Supplementary Data” for further details.
Income Taxes
The decrease in the effective income tax rate was primarily due to tax credits associated with the production and sale of synthetic fuel, which began in July 2002. Cinergy’s effective tax rate for 2003 was approximately 25 percent.
Discontinued Operations
In 2002, Cinergy sold and/or classified as held for sale, several non-core investments, including renewable and international investments. During 2003, Cinergy completed the disposal of its gas distribution operation in South Africa, sold its remaining wind assets in the United States, and substantially sold or liquidated the assets of its energy trading operation in the Czech Republic. Pursuant to Statement 144, these investments have been classified as discontinued operations in our financial statements. See Note 14 of the “Notes to Financial Statements” in “Item 8. Financial Statements and Supplementary Data” for additional information.
The increase in discontinued operations in 2003 as compared to 2002 was due to the recognition of losses on disposal of foreign investments in 2002 and the recognition of gains on disposal in 2003.
Cumulative Effect of Changes in Accounting Principles
In 2003, Cinergy recognized a utility holding company. Because we areCumulative effect of changes in accounting principles, net of tax gain of approximately $26 million. The cumulative effect of changes in accounting principles was a holding company whose utility subsidiaries operateresult of the adoption of Statement 143 and the rescission of EITF 98-10.
45
In 2002, Cinergy recognized a Cumulative effect of a change in multiple states, we are registered withaccounting principle, net of tax loss of approximately $11 million as a result of implementation of Statement of Financial Accounting Standards No. 142, Goodwill and are subjectOther Intangible Assets. See Note 1(q)(iv) of the “Notes to regulationFinancial Statements” in “Item 8. Financial Statements and Supplementary Data” for further information.
46
MD&A - 2003 RESULTS OF OPERATIONS – CG&E
2003 RESULTS OF OPERATIONS - CG&E
Summary of Results
Net income for CG&E for the years ended December 31, 2003, and 2002 were as follows:
| | CG&E and subsidiaries | |
| | 2003 | | 2002 | | Change | | % Change | |
| | (in millions) | |
| | | | | | | | | |
Net income | | $ | 331 | | $ | 264 | | $ | 67 | | 25 | % |
| | | | | | | | | | | | |
CG&E’s increase in net income was primarily due to the following factors:
•Increases in gas gross margins due to an increase in base rates, as approved by the SecuritiesPUCO in May 2002, and Exchange Commission (SEC)colder weather in the first quarter of 2003 as compared to 2002;
•Lower operating costs primarily resulting from the recognition of higher costs in 2002 associated with employee severance programs; and
•A net gain recognized in 2003 resulting from the implementation of certain accounting changes.
Offsetting these increases was a decrease in electric gross margins primarily due to milder weather in 2003, as compared to 2002.
Gross Margins
Gross margins for CG&E for the years ended December 31, 2003, and 2002 were as follows:
| | CG&E and subsidiaries | |
| | 2003 | | 2002 | | Change | | % Change | |
| | (in millions) | |
| | | | | | | | | |
Electric gross margin(1) | | $ | 1,195 | | $ | 1,205 | | $ | (10 | ) | (1 | )% |
Gas gross margin(2) | | 245 | | 205 | | 40 | | 20 | |
| | | | | | | | | | | | |
(1)Electric gross margin is calculated as Electric operating revenues less Fuel, emission allowances, and purchased power expense from the Statements of Income.
(2)Gas gross margin is calculated as Gas operating revenues less Gas purchased expense from the Statements of Income.
Cooling degree days and heating degree days in CG&E’s service territory for the years ended December 31, 2003, and 2002 were as follows:
| | CG&E and subsidiaries | |
| | 2003 | | 2002 | | Change | | % Change | |
| | | | | | | | | |
Cooling degree days(1) | | 812 | | 1,353 | | (541 | ) | (40 | )% |
Heating degree days(2) | | 5,119 | | 4,926 | | 193 | | 4 | |
(1)Cooling degree days are the differences between the average temperature for each day and 65 degrees, assuming the average temperature is greater than 65 degrees.
(2)Heating degree days are the differences between the average temperature for each day and 65 degrees, assuming the average temperature is less than 65 degrees.
47
Electric Gross Margins
The one percent decrease in CG&E’s electric gross margins was primarily due to a decline in retail electric margins mainly resulting from milder weather in 2003 as compared to 2002. As noted in the table, cooling degree days were down 40 percent in CG&E’s service territory. Higher margins from physical and financial trading partially offset this decrease.
Gas Gross Margins
The 20 percent increase in CG&E’s gas gross margins was primarily due to the following factors:
•An increase in base rates, as approved by the PUCO in May 2002, and tariff adjustments associated with the gas main replacement program and Ohio excise taxes; and
•The colder weather in the first quarter of 2003, compared to 2002, which resulted in a greater amount of mcf delivered to customers.
Other Operating Revenues and Costs of Fuel Resold
The 23 percent decrease in Other Operating Revenues was due to a decrease in revenues from coal origination.
Costs of fuel resold represents the costs of coal origination activities. These costs decreased in 2003, which is consistent with the decline in the associated revenues as previously discussed.
The following explanations correspond with the line items on the Statements of Income for CG&E. However, only the line items that varied significantly from prior periods are discussed.
Other Operating Expenses
| | CG&E and subsidiaries | |
| | 2003 | | 2002 | | Change | | % Change | |
| | (in millions) | |
| | | | | | | | | |
Operation and maintenance | | $ | 500 | | $ | 531 | | $ | (31 | ) | (6 | )% |
Depreciation | | 187 | | 197 | | (10 | ) | (5 | ) |
Taxes other than income taxes | | 200 | | 198 | | 2 | | 1 | |
Total | | $ | 887 | | $ | 926 | | $ | (39 | ) | (4 | ) |
Operation and Maintenance
The six percent decrease in Operation and maintenance expense was primarily due to the following factors:
•Decreased transmission costs largely the result of changes in the Midwest ISO operations;
•The recognition of higher costs associated with employee severance programs in 2002; and
•A decrease in employee incentive costs.
These decreases were partially offset by an increase in maintenance expense for our generating units and overhead lines.
48
Depreciation
The five percent decrease in Depreciation expense was primarily due to the following factors:
•An increase in the estimated useful lives of CG&E’s generation assets resulting from a depreciation study completed during the third quarter of 2003; and
•The discontinuance of accruing costs of removal for generating assets (which was previously included as part of Depreciation expense) as a result of the adoption of Statement 143. See Note 1(j) of the “Notes to Financial Statements” in “Item 8. Financial Statements and Supplementary Data” for further details. Prior periods were not restated for the adoption of Statement 143.
Miscellaneous Income - Net
The increase in Miscellaneous Income - Net was due, in part, to a final reconciliation with PSI of a previous demutualization of a medical insurance carrier used by both companies which was recorded in 2003.
Interest Expense
The 20 percent increase in InterestExpense was primarily due to the following factors:
•An increase in average long-term debt outstanding; and
•Charges during 2003 associated with the re-financing of certain debt.
Cumulative Effect of Changes in Accounting Principles
In 2003, CG&E recognized a Cumulative effect of changes in accounting principles, net of tax gain of approximately $31 million as a result of the adoption of Statement 143 and the rescission of EITF 98-10. See Note 1(q)(iv) of the “Notes to Financial Statements” in “Item 8. Financial Statements and Supplementary Data” for further information.
49
MD&A - - 2003 RESULTS OF OPERATIONS – PSI
Summary of Results
Net income for PSI for the years ended December 31, 2003, and 2002 was as follows:
| | PSI | |
| | 2003 | | 2002 | | Change | | % Change | |
| | (in millions) | |
| | | | | | | | | |
Net income | | $ | 133 | | $ | 214 | | $ | (81 | ) | (38 | )% |
| | | | | | | | | | | | |
PSI’s decrease in net income was primarily attributable to decreases in electric gross margins due to milder weather in 2003, as compared to 2002. This decrease was partially offset by the following factors:
•The recognition of higher operating costs in 2002 associated with employee severance programs; and
•Lower property taxes, primarily resulting from the change in property value assessment in the state of Indiana in 2003.
Electric Gross Margins
Gross margins for PSI for the years ended December 31, 2003, and 2002 were as follows:
| | PSI | |
| | 2003 | | 2002 | | Change | | % Change | |
| | (in millions) | |
| | | | | | | | | |
Electric gross margin(1) | | $ | 973 | | $ | 1,064 | | $ | (91 | ) | (9 | )% |
| | | | | | | | | | | | |
(1)Electric gross margin is calculated as Electric operating revenues less Fuel, emission allowances, and purchased power expense from the Statements of Income.
Cooling degree days and heating degree days in PSI’s service territory for the years ended December 31, 2003, and 2002 were as follows:
| | PSI | |
| | 2003 | | 2002 | | Change | | % Change | |
| | | | | | | | | |
Cooling degree days(1) | | 850 | | 1,360 | | (510 | ) | (38 | )% |
Heating degree days(2) | | 5,512 | | 5,260 | | 252 | | 5 | |
(1)Cooling degree days are the differences between the average temperature for each day and 65 degrees, assuming the average temperature is greater than 65 degrees.
(2)Heating degree days are the differences between the average temperature for each day and 65 degrees, assuming the average temperature is less than 65 degrees.
The nine percent decrease in PSI’s electric gross margins was primarily due to a decline in retail electric margins resulting from milder weather in 2003, compared to 2002. As noted in the table, cooling degree days were down 38 percent in PSI’s service territory. An increase in rate tariff adjustments associated with certain construction programs partially offset these decreases.
The following explanations correspond with the line items on the Statements of Income for PSI. However, only the line items that varied significantly from prior periods are discussed.
50
Other Operating Expenses
| | PSI | |
| | 2003 | | 2002 | | Change | | % Change | |
| | (in millions) | |
| | | | | | | | | |
Operation and maintenance | | $ | 449 | | $ | 470 | | $ | (21 | ) | (4 | )% |
Depreciation | | 164 | | 155 | | 9 | | 6 | |
Taxes other than income taxes | | 46 | | 57 | | (11 | ) | (19 | ) |
Total | | $ | 659 | | $ | 682 | | $ | (23 | ) | (3 | ) |
Operation and Maintenance
The four percent decrease in Operation and maintenance expense was primarily due to the following factors:
•Recognition of higher costs associated with employee severance programs in 2002;
•Decreased transmission costs, largely the result of changes in the Midwest ISO operations; and
•A decrease in employee incentive costs.
These decreases were partially offset by an increase in maintenance expense for our generating units and overhead lines.
Depreciation
The six percent increase in Depreciation expense was primarily due to the following factors:
•The addition of depreciable plant resulting from PSI’s December 2002 purchase of two gas-fired peaking plants from non-regulated affiliates. See Note 19 of the “Notes to Financial Statements” in “Item 8. Financial Statements and Supplementary Data” for more information; and
•The addition of other depreciable plant primarily reflecting pollution control equipment and the repowering of Noblesville Station.
Taxes Other Than Income Taxes
The 19 percent decrease in Taxes other than income taxes expense was primarily due to lower property taxes, which were partially offset by increased excise taxes. This decrease was primarily a result of a change in property value assessments in the state of Indiana in 2003.
Miscellaneous Income - Net
The 69 percent decrease in Miscellaneous Income - Net was primarily a result of a final reconciliation with CG&E of a previous demutualization of a medical insurance carrier used by both companies which was recorded in 2003.
Interest Expense
The 16 percent increase in InterestExpense was primarily a result of an increase in average long-term debt outstanding during the year ended December 31, 2003. Thisincrease was partially offset by a decrease in short-term interest rates.
Income Taxes
The increase in the effective income tax rate was primarily due to an increase in the Indiana state income tax rate.
51
MD&A – LIQUIDITY AND CAPITAL RESOURCES
Historical Cash Flow Analysis From Continuing Operations
Operating Activities from Continuing Operations
For the years ended December 31, 2004, 2003, and 2002, our cash flows from operating activities from continuing operations were as follows:
Net Cash Provided by Operating Activities from Continuing Operations | |
| | | | | | | |
| | 2004 | | 2003 | | 2002 | |
| | (in thousands) | |
| | | | | | | |
Cinergy(1) | | $ | 833,004 | | $ | 945,673 | | $ | 955,802 | |
CG&E and subsidiaries | | 445,621 | | 557,761 | | 653,029 | |
PSI | | 483,463 | | 246,735 | | 499,047 | |
ULH&P | | 45,381 | | 33,061 | | 60,707 | |
| | | | | | | | | | | |
(1)The results of Cinergy also include amounts related to non-registrants.
The tariff-based gross margins of our utility operating companies continue to be the principal source of cash from operating activities. The diversified retail customer mix of residential, commercial, and industrial classes and a commodity mix of gas and electric services provide a reasonably predictable gross cash flow.
For the year ended December 31, 2004, Cinergy’s and CG&E’s decrease in net cash provided by operating activities was primarily due to unfavorable working capital fluctuations, including the build up of fuel and emission allowances inventory. PSI’s increase was due to an increase in earnings (after adjusting for non-cash items) and a difference in the timing of payables and income tax payments. ULH&P’s increase in net cash provided by operating activities was attributable to favorable working capital fluctuations.
For the year ended December 31, 2003, CG&E’s, PSI’s,and ULH&P’s net cash provided by operating activities decreased, as compared to 2002. CG&E’s decrease was primarily due to unfavorable working capital fluctuations. PSI’s decrease was largely due to a decrease in earnings (after adjusting for non-cash items) and a decrease in receivables sold under the receivables sale facility. A significant portion of ULH&P’s decrease was due to unfavorable working capital fluctuations and an increase in deferred costs under the gas cost recovery mechanism. Cinergy’s net cash provided by operating activities in 2003 was comparable to 2002, comprised of the decreases at CG&E and PSI discussed above offset by improved operating cash flows at our non-regulated subsidiaries.
Financing Activities from Continuing Operations
For the years ended December 31, 2004, 2003, and 2002, our cash flows from financing activities from continuing operations were as follows:
Net Cash Provided by (Used in) Financing Activities from Continuing Operations
| | 2004 | | 2003 | | 2002 | |
| | (in thousands) | |
| | | | | | | |
Cinergy(1) | | $ | (233,881 | ) | $ | (245,128 | ) | $ | 42,689 | |
CG&E and subsidiaries | | (172,782 | ) | (263,296 | ) | (293,445 | ) |
PSI | | (164,141 | ) | 90,070 | | (43,817 | ) |
ULH&P | | (9,226 | ) | 4,852 | | (22,026 | ) |
| | | | | | | | | | |
(1)The results of Cinergy also include amounts related to non-registrants.
For the year ended December 31, 2004, CG&E’s decrease in net cash used in financing activities was primarily due to a decrease in redemptions of long-term debt. PSI’s increase in net cash used in financing activities was attributable to the repayment of short-term debt in 2004 and capital contributions from Cinergy Corp. that were made in 2003. ULH&P’s increase in net cash used in financing activities was due to an increase in dividends on common stock. Cinergy’s net cash used in financing activities in 2004 was comparable to 2003.
52
For the year ended December 31, 2003, Cinergy’s net cash used in financing activities increased, as compared to 2002, primarily due to increases in redemptions of long-term debt. CG&E’s net cash used in financing activities decreased during 2003, as compared to 2002, primarily due to a net increase in short-term debt financing. PSI’s and ULH&P’s net cash provided by financing activities increased during 2003, as compared to 2002. PSI’s increase was primarily due to capital contributions from Cinergy Corp.ULH&P’s increase was primarily attributable to increases in short-term debt.
Investing Activities from Continuing Operations
For the years ended December 31, 2004, 2003, and 2002, our cash flows used in investing activities from continuing operations were as follows:
Net Cash Used in Investing Activities from Continuing Operations
| | 2004 | | 2003 | | 2002 | |
| | (in thousands) | |
| | | | | | | |
Cinergy(1) | | $ | (603,702 | ) | $ | (731,537 | ) | $ | (885,636 | ) |
CG&E and subsidiaries | | (284,527 | ) | (323,959 | ) | (323,322 | ) |
PSI | | (315,093 | ) | (332,247 | ) | (454,810 | ) |
ULH&P | | (33,857 | ) | (39,940 | ) | (38,854 | ) |
| | | | | | | | | | |
(1)The results of Cinergy also include amounts related to non-registrants.
For the year ended December 31, 2004, Cinergy’s decrease in net cash used in investing activities was primarily due to decreases in capital expenditures related to energy-related investments. CG&E’s decrease in net cash used in investing activities was primarily due to a decrease in capital expenditures for ongoing environmental compliance programs and normal construction activity. PSI’s and ULH&P’s net cash used in investing activities in 2004 was comparable to 2003.
For the year ended December 31, 2003, Cinergy’s net cash used in investing activities decreased, as compared to 2002, primarily due to decreases in capital expenditures related to environmental compliance programs and other energy-related investments. Cinergy also purchased a synthetic fuel production facility during 2002. PSI’s decrease was primarily due to decreases in capital expenditures for ongoing environmental compliance programs and other construction projects. CG&E’s and ULH&P’s net cash used in 2003 investing activities was comparable to 2002.
Capital Requirements
Environmental Issues
Proposed Environmental Protection Agency Regulations
In December 2003, the United States EPA proposed the Clean Air Interstate Rule (CAIR), formerly the Interstate Air Quality Rule, which would require states to revise their State Implementation Plans (SIP) to address alleged contributions to downwind non-attainment with the revised National Ambient Air Quality Standards for ozone and fine particulate matter. The proposed rule would establish a two-phase, regional cap and trade program for SO2 and NOX, affecting approximately 30 states, including Ohio, Indiana, and Kentucky, and would require SO2 and NOX emissions to be cut approximately 70 percent and 65 percent, respectively, by 2015. The EPA also issued draft regulations regarding required reductions in mercury emissions from coal-fired power plants (Clean Air Mercury Rule). The draft regulations include two possible alternatives to achieve emissions reductions: a mercury cap and trade program or source specific reductions achieved through a command and control approach. The cap and trade approach would provide a longer compliance horizon and provide more flexible compliance options for coal-fired generators, including the purchase of allowances in lieu of further capital expenditures with respect to these investments. This approach would require a reduction of approximately 30 percent by 2010 and 70 percent by 2018. The source specific reduction approach would require a reduction of approximately 30 percent by 2008. The EPA is expected to issue final rules on CAIR and the Clean Air Mercury Rule by March 2005.
Over the 2005-2009 time period, estimated capital costs associated with reducing mercury, SO2, and NOX in compliance with the currently proposed CAIR and Clean Air Mercury Rule are not expected to exceed approximately
53
$1.72 billion if the EPA approves the mercury cap and trade approach and approximately $2.15 billion if the EPA approves the source specific reduction approach without a cap and trade program. These estimates include estimated costs to comply at plants that we own but do not operate and could change when taking into consideration compliance plans of co-owners or operators involved. Moreover, as market conditions change, additional compliance options may become available and our plans will be adjusted accordingly. Approximately 60 percent of these estimated environmental costs would be incurred at PSI’s coal-fired plants, for which recovery would be pursued in accordance with regulatory statutes governing environmental cost recovery. CG&E would receive partial recovery of depreciation and financing costs related to environmental compliance projects for 2005-2008 through its recently approved RSP. See Note 11(b)(iii) of the “Notes to Financial Statements” in “Item 8. Financial Statements and Supplementary Data” for more details.
In June 2004, the EPA made final state non-attainment area designations to implement the revised ozone standard. In January 2005, the EPA made final state non-attainment area designations to implement the new fine particulate standard. Several counties in which we operate have been designated as being in non-attainment with the new ozone standard and/or fine particulate standard. States with counties that are designated as being in non-attainment with the new ozone and/or fine particulate standards are required to develop a plan of compliance. Although the EPA has attempted to structure the CAIR to resolve purported utility contributions to ozone and fine particulate non-attainment, at this time, Cinergy cannot predict the effect of current or future non-attainment designations on its financial position or results of operations.
In May 2004, the EPA issued proposed revisions to its regional haze rules and implementing guidelines in response to a 2002 judicial ruling overturning key provisions of the original program. The regional haze program is aimed at reducing certain emissions impacting visibility in national parks and wilderness areas. The EPA is currently considering whether SO2 and NOX reductions under the CAIR regulation will also satisfy the reduction requirements under the regional haze rule. However, the regional haze rule, when finalized, could potentially require significant additional SO2 and NOX reductions necessitating the installation of pollution controls for certain generating units at Cinergy’s power plants. In light of the EPA’s ongoing rulemaking efforts and the fact that the states have yet to announce how they will implement the final rule, at this time it is not possible to predict whether the regional haze rule will have a material effect on our financial position or results of operations.
Clear Skies Legislation
President Bush has proposed environmental legislation that would combine a series of Clean Air Act (CAA) requirements, including the recently proposed regulations for mercury and particulate matter for coal-fired power plants with a legislative solution that includes trading and specific emissions reductions and timelines to meet those reductions. The President’s “Clear Skies Initiative” would seek an overall 70 percent reduction in emissions from power plants over a phased-in reduction schedule beginning in 2010 and continuing through 2018. When the Clear Skies Initiative was stalled in Congress, the EPA proposed the CAIR regulations to accomplish Clear Skies’ goals within the existing framework of the CAA. Clear Skies has been reintroduced in the Senate and could be considered in Committee over the next several weeks. However, at this time, we cannot predict whether this or any multi-emissions bill will achieve approval.
Energy Bill
The United States House of Representatives (House) passed the Energy Policy Act in April 2003. The legislation, as passed in the House, included the repeal of the Public Utility Holding Company Act of 1935, as amended (PUHCA). Our other principal subsidiaries are:
•Cinergy Services, Inc. (Services);•Cinergy Investments, Inc. (Investments);•Cinergy Global, as well as tax incentives for gas and electric distribution lines, and combined heat and power and renewable energy projects. The United States Senate (Senate) Energy and Natural Resources Inc. (Global Resources);•Cinergy Technologies, Inc. (Technologies);Committee passed its version of comprehensive energy legislation in April 2003. A conference agreement which merged both the House and•Cinergy Wholesale Energy, Inc. (CWE).
CG&E, an Ohio corporation, is a combination electric and gas public utility company that provides service Senate versions passed in the southwestern portion of Ohio and, through its subsidiaries,House in nearby areas of Kentucky and Indiana. It has three wholly-owned utility subsidiaries and two wholly-owned non-utility subsidiaries.CG&E's principal utility subsidiary,October 2003, but failed to pass in the Senate. The Union Light, Heat and Power Company (ULH&P),legislation will be introduced again during the 109th Congress, however, it is anticipated that several changes will be made. At this time, it is not possible to predict whether a Kentucky corporation that provides electric and gas servicefinal energy bill will pass in northern Kentucky.CG&E's other subsidiaries are insignificant to its results of operations.2005.
54
PSIEnvironmental Lawsuits, an Indiana corporation, is an electric utility that provides service
We are currently involved in north central, central, and southern Indiana.
Thethe following table presents further information related to the operations of our domestic utility companies (our operating companies):
Principal Line(s) of Business
|
|---|
CG&E and subsidiaries | | • | | Generation, transmission, distribution, and sale of electricity |
| | • | | Sale and/or transportation of natural gas |
PSI |
|
• |
|
Generation, transmission, distribution, and sale of electricity |
ULH&P |
|
• |
|
Transmission, distribution, and sale of electricity |
| | • | | Sale and transportation of natural gas |
Services is a service company that provides our regulated and non-regulated subsidiaries with a variety of centralized administrative, management, and support services. Investments holds most of our domestic non-regulated, energy-related businesses and investments. Global Resources holds our international businesses and investments and directs our renewable energy investing activities (for example, wind farms). Technologies primarily holds our portfolio of technology-related investments. In November 2000, CWE was formed to act as a holding company forCinergy's energy commodity businesses, including production, as the generation assets eventually become unbundled from the utility subsidiaries. Seelawsuits which are discussed in more detail in Note 1811(a) of the "Notes“Notes to Financial Statements"Statements” in "Item“Item 8. Financial Statements and Supplementary Data" forData”. An unfavorable outcome of any of these lawsuits could have a discussionmaterial impact on Ohio deregulation.our liquidity and capital resources.
The majority of our operating revenues are derived from the sale of electricity and the sale and/or transportation of natural gas.
We conduct operations through our subsidiaries, and we manage through the following four business units:
•Energy Commodities Business Unit (Commodities);•Energy Delivery Business Unit (Delivery);•Cinergy Investments Business Unit; and•International Business Unit.
As the utility industry continues to evolve,Cinergy will continue to analyze its operating structure and make modifications as appropriate. In early 2001, we announced certain organizational changes which further aligned the business units to reflectCinergy's strategic vision. The revised structure reflects three business units, as follows:
•Energy Merchant—will operate power plants, both domestically and abroad, and conduct all wholesale energy marketing, trading, origination and risk management services;•Regulated Businesses—will operate all gas and electric transmission and distribution services, both domestically and abroad, and will be responsible for all regulatory planning for the regulated utility businesses ofCG&E,PSI, andULH&P; and•Power Technology and Infrastructure Services—will originate and manage a portfolio of emerging energy businesses.
See Note 15 of the "Notes to Financial Statements" in "Item 8. Financial Statements and Supplementary Data" for financial information by business unit.
•CAA Lawsuit
•LIQUIDITY
Carbon Dioxide (CO
In the "Liquidity" section, we discuss 2000 cash flows, environmental issues, construction, and other investing activities as they relate to our current and future cash needs. In the "Capital Resources" section we discuss how we intend to meet these capital requirements.
22000 Cash Flows
) Lawsuit
Operating Activities
For the year ended December 31, 2000,Cinergy's andPSI's cash from operating activities increased $229 million and $331 million, respectively, compared to 1999, primarily due to the cash requirement for the purchase of the remainder of Dynegy, Inc.'s 25 year contract for coal gasification services in 1999.CG&E's cash provided from operating activities during 2000 decreased $111 million for the year ended December 31, 2000, as compared to last year, due primarily to a net increase in receivables less payables pertaining to customer accounts and power marketing and trading activities.ULH&P's cash from operating activities increased $17 million primarily due to changes in working capital and deferred income taxes.
Financing Activities
Cinergy's net cash provided by financing activities increased $514 million in 2000, as compared to the prior year. This change is primarily attributable to an increase in short-term borrowings which is partially offset by a decrease in the issuance of long-term debt.CG&E's net cash used in financing activities decreased $206 million compared to 1999. This comparative decrease is primarily a result of the redemption of $164 million in long-term debt that occurred during 1999.PSI's net cash provided by financing activities decreased $258 million over the prior year due to a decrease in the net issuance of long-term debt. This decrease was partially offset by an increase in short-term borrowings.ULH&P reduced its short-term borrowings during 2000, as compared to 1999, which accounts for the decrease in net cash provided by financing activities of $14 million.
Investing Activities
For the year ended December 31, 2000,Cinergy's net cash used in investing activities increased $714 million as compared to the prior year. This change primarily reflects the proceeds of $690 million received in 1999 from the sale of our 50% ownership interest in Midlands Electricity plc (Midlands).CG&E's andPSI's net cash used in investing activities increased $66 million and $70 million, respectively, as compared to 1999, as a result of an increase in construction expenditures.
For further detail regarding the classification of these items, see our Consolidated Statements of Cash Flows in "Item 8. Financial Statements and Supplementary Data".
Environmental Issues
In the "Environmental Issues" section, we discuss the ozone transport rulemaking, ambient air standards, regional haze, global climate change, mercury, new source review, W.C. Beckjord Generating Station (Beckjord Station) Notices of Violations (NOV), United States (U.S.) Environmental Protection Agency (EPA) Agreement, and manufactured gas plants sites as they relate to us and our operating companies.
Ozone Transport Rulemaking In June 1997, the Ozone Transport Assessment Group, which consisted of 37 states, made a wide range of recommendations to the EPA to address the impact of ozone transport on serious non-attainment areas (geographic areas defined by the EPA as non-compliant with ozone standards) in the Northeast, Midwest, and South. Ozone transport refers to wind-blown movement of ozone and ozone-causing materials across city and state boundaries. In late 1997, the EPA published a proposed call for revisions to State Implementation Plans (SIPs). SIP is an acronym for a state's implementation plan for achieving emissions reductions to address air quality concerns. The EPA must approve all SIPs.
• Nitrogen Oxide (NOX ) SIP Call In October 1998, the EPA finalized its ozone transport rule, also known as the NOX SIP Call. It applied to 22 states in the eastern half of the U.S., including the three states in which our electric utilities operate, and also proposed a model NOX emission allowance trading program. This rule recommended states reduce NOX emissions primarily from industrial and utility sources to a certain level by May 2003. The EPA gave the affected states until September 30, 1999, to incorporate NOX reductions and,Selective Catalytic Reduction Units at the discretion of the state, a NOX trading program into their SIPs. The EPA proposed to implement a federal plan to accomplish the equivalent NOX reductions by May 2003, if states failed to revise their SIPs.
Ohio, Indiana, a number of other states, and various industry groups (some of which we are a member), filed legal challenges to the NOX SIP Call in late 1998. On May 25, 1999, the U.S. Circuit Court of Appeals for the District of Columbia (Court of Appeals) granted a request for a deferral of the rule and indefinitely suspended the September 30 filing deadline, pending further review by the Court of Appeals.
In March 2000, the Court of Appeals substantially upheld the EPA's rule. On April 11, 2000, the EPA asked the Court of Appeals to remove its May 25, 1999 suspension of the rule and also directed states to submit SIP revisions by September 1, 2000. On April 17, 2000, various states and industry groups (some of which we are a member) filed a request with the Court of Appeals for a rehearing of the NOX SIP Call decisions. On April 24, 2000, the same group filed a request with the Court of Appeals to require a rulemaking and a comment period to determine a new compliance date. The states also filed a request to obtain more time to file their SIPs. On June 23, 2000, the Court of Appeals denied both requests and directed the states to submit their SIP revisions by October 30, 2000. The states of Indiana, Kentucky, and Ohio subsequently submitted letters stating their intent to revise their SIPs in response to the NOX SIP Call.
In August 2000, the Court of Appeals extended the May 1, 2003 deadline for NOX reductions to May 31, 2004. The states and other groups appealed the Court of Appeals ruling to the U.S. Supreme Court (Supreme Court).
On September 25, 2000,Cinergy announced a plan to invest approximately $700 million in pollution control equipment and other methods to reduce NOX emissions. This expected investment includes the following:
•install up to 11 selective catalytic reduction units (SCRs) at several different generating stations;•install other pollution control technologies, including new computer software, at all generating stations;•make combustion improvements; and•utilize market opportunities to buy and sell NOX allowances.
SCRs are the most proven technology currently available for reducing NOX emissions produced in coal-fired generating stations.
Section 126 Petitions In February 1998, the northeast states filed petitions seeking the EPA's assistance in reducing ozone in the eastern U.S. under Section 126 of the Clean Air Act (CAA). The EPA believes that Section 126 petitions allow a state to claim that sources in another state are contributing to its air quality problem and request that the EPA require the upwind sources to reduce their emissions.
In December 1999, the EPA granted four Section 126 petitions relating to NOX emissions. This ruling affected all of our Ohio and Kentucky facilities, as well as some of our Indiana facilities, and requires us to reduce our NOX emissions to a certain level by May 2003. The EPA's action granting the Section 126 petitions was appealed to the Court of Appeals. Oral arguments were held in this case on December 15, 2000. A final decision is expected some time within the next few months.
State Ozone Plans On November 15, 1999, the State of Indiana and the Commonwealth of Kentucky (along with Jefferson County, Kentucky) jointly filed an amendment to their attainment demonstration on how they intend to bring the greater Louisville area, including Floyd and Clark Counties in Indiana, into attainment with the one-hour ozone standard. The SIP amendments call for, among other things, statewide NOX reductions from utilities in Indiana, Kentucky, and surrounding states which are less stringent than the EPA's NOX SIP Call. Indiana and Kentucky committed to adopt utility NOX control rules by December 2000 that would require controls be installed by May 2003. However, Indiana halted the rulemaking for NOX controls at this level, but continues to develop NOX SIP Call level reduction regulations. Kentucky did complete their rulemaking, but has issued a notice of intent to revise the rules to change the compliance deadline to mirror the NOX SIP Call (May 31, 2004).
See "EPA Agreement" below for a discussion of the tentative EPA settlement, which relates to matters discussed herein.
Ambient Air Standards During 1997, the EPA revised the National Ambient Air Quality Standards for ozone and fine particulate matter. Fine particulate matter refers to very small solid or liquid particles in the air. It was anticipated that utility NOX reductions called for in the EPA's final NOX SIP Call would address both the pre-existing one-hour ozone standard and the new eight-hour ozone standard. With the recent challenges to the NOX SIP Call and the eight-hour ozone standard (discussed below), it is unclear to what extent additional NOX reductions will be required of utilities to address eight-hour ozone non-attainment issues.
The EPA estimates it will take up to five years to collect sufficient ambient air monitoring data to determine fine particulate matter non-attainment areas. The states will then determine the sources of the particulates and determine a regional emission reduction plan. We currently cannot predict the exact amount and timing of required reductions.
On May 14, 1999, the Court of Appeals ruled that both the new eight-hour ozone standard and the fine particulate matter standard were questionable and were determined to be unenforceable by the EPA. In June 1999, the EPA appealed the decision. On October 29, 1999, the full Court of Appeals rejected the EPA's request for reconsideration. In January 2000, the EPA appealed to the Supreme Court and oral arguments were held on November 17, 2000, with a ruling expected any time, but no later than July 2001. We currently cannot determine the outcome of the appeals process and the effects on future emissions reduction requirements.
Regional Haze The EPA published the final regional haze rule on July 1, 1999. This rule established planning and emission reduction timelines for states to use to improve visibility in national parks throughout the U.S. The ultimate effect of the new regional haze rule could be requirements for (1) newer and cleaner technologies and additional controls on conventional particulates, and (2) reductions in sulfur dioxide (SO2) and NOX emissions from utility sources. If more utility emissions reductions are required, the compliance cost could be significant. In August 1999, several industry groups (some of which we are a member) filed a challenge to the regional haze rules with the Court of Appeals. In addition, several industry groups (some of which we are a member) have petitioned the new administration to reconsider its approach to regional haze, including possible modifications to the rule and/or settlement of the lawsuit. We currently cannot determine the outcome or effects of the EPA's, courts', or states' determinations.
Global Climate Change In December 1997, delegates to the United Nations' climate summit in Japan adopted an agreement, the Kyoto Protocol, to address global warming. The Kyoto Protocol establishes legally binding greenhouse gas emission (man-made pollutants thought to be artificially warming the earth's atmosphere) targets for developed nations. On November 12, 1998, the U.S. signed the Kyoto Protocol, however, it will not be effective in the U.S. until it is approved by a two-thirds vote of the U.S. Senate, which is currently deemed unlikely. In November 2000, another Conference of the Parties was held to negotiate the details of administrating the Kyoto Protocol. On November 25, 2000, the delegation failed to reach an agreement and suspended any further discussion until 2001.
Because of a lack of support for the Kyoto Protocol or similar legislation, significant uncertainty exists about how and when greenhouse gas emissions reductions will be required. Our plan for managing the potential risk and uncertainty of regulations relating to climate change includes the following:
•implementing cost-effective greenhouse gas emission reduction and offsetting activities;•funding research of more efficient and alternative electric generating technologies;•funding research to better understand the causes and consequences of climate change;•encouraging a global discussion of the issues and how best to manage them; and•advocating comprehensive legislation for fossil-fired power plants.
Mercury The air toxics provisions of the CAA delayed possible air toxics regulation of fossil-fueled steam utility plants until the EPA completed a study. The final report, issued in February 1998, confirmed that utility air toxic emissions pose little risk to public health. It stated that mercury is the pollutant of the greatest concern and requires further study. A Mercury Study Report, issued in December 1997, stated that mercury is not a risk to the average American and expressed uncertainty about whether reductions in current domestic sources would reduce human mercury exposure. U.S. utilities are a large domestic source, but they are insignificant when compared to global mercury emissions. The EPA was unable to show a feasible mercury control technology for coal-fired utility plants.
In November 1998, the EPA finalized its mercury Information Collection Request (ICR). The ICR required all generating units to provide detailed information about coal use and mercury content during 1999. The EPA also selected about 100 generating units for one-time stack sampling. We completed testing at the Gibson Generating Station Unit No. 3 and the Wabash River Repowering Project in October 1999.
On December 14, 2000, the EPA made its regulatory determination on the need for additional regulation of mercury emissions from coal-fired power plants. The EPA is expected to issue draft regulations in 2003 and final rules by 2004, with reductions required before 2010. We currently cannot predict the outcome or effects of the EPA's determination and subsequent regulation.
New Source Review (NSR) The CAA's NSR provisions require that a company obtain a pre-construction permit if it plans to build a new stationary source of pollution or make a major change to an existing facility unless the changes are exempt. In July 1998, the EPA requested comments on proposed revisions to the NSR rules that would change NSR applicability by eliminating exemptions contained in the current regulation.
Since July 1999,•CG&E andPSI have received requests from the EPA (Region 5), under Section 114 of the CAA, seeking documents and information regarding capital and maintenance expenditures at several of their respective generating stations. These activities were part of an industry-wide investigation assessing compliance with the NSR and the New Source Performance Standards (NSPS) of the CAA at electric generating stations.Zimmer Generating Station Lawsuit
On September 15, 1999, November 3, 1999, and February 2, 2001, the Attorney General's of New York, Connecticut, and New Jersey, respectively, issued letters notifying•Cinergy andCG&E of their
intent to sue under the citizens' suit provisions of the CAA. These states allege violations of the CAA by constructing and continuing to operate a major change toCG&E's Beckjord Station without obtaining the required NSR pre-construction permits.
On November 3, 1999, the EPA sued a number of holding companies and electric utilities, includingCinergy,CG&E, andPSI, in various U.S. District Courts. TheCinergy,CG&E, andPSI suit alleged violations of the CAA at two of our generating stations relating to NSR and NSPS requirements. The suit sought (1) injunctive relief to require installation of pollution control technology on each of the generating units at Beckjord Station andPSI's Cayuga Generating Station (Cayuga Station), and (2) civil penalties in amounts of up to $27,500 per day for each violation.
On March 1, 2000, the EPA filed an amended complaint againstCinergy,CG&E, andPSI. The amended complaint added the alleged violations of the NSR requirements of the CAA at two of our generating stations contained in an NOV filed by the EPA on November 3, 1999. It also added claims for relief of alleged violations of nonattainment NSR, Indiana and Ohio SIPs, and particulate matter emission limits (as discussed below in the "Beckjord Station NOV" section).
The amended complaint sought (1) injunctive relief to require installation of pollution control technology on each of the generating units at Beckjord Station, Cayuga Station, andPSI's Wabash River and Gallagher Generating Stations, and such other measures as necessary, and (2) civil penalties in amounts of up to $27,500 per day for each violation.
On March 1, 2000, the EPA also filed an amended complaint in a separate lawsuit alleging violations of the CAA relating to NSR, Prevention of Significant Deterioration (PSD), and Ohio SIP requirements regarding a generating station operated by the Columbus Southern Power Company (CSP) and jointly-owned by CSP, the Dayton Power and Light Company (DP&L), andCG&E. The EPA is seeking injunctive relief and civil penalties of up to $27,500 per day for each violation. This suit is being defended by CSP.
On June 28, 2000, the EPA issued an NOV toCinergy,CG&E, andPSI for alleged violations of NSR, PSD, and SIP requirements atCG&E's Miami Fort Station andPSI's Gibson Station. In addition,Cinergy andCG&E have been informed by DP&L, the operator of J.M. Stuart Station (Stuart Station), that on June 30, 2000, the EPA issued an NOV for alleged violations of NSR, PSD, and SIP requirements at this station.CG&E owns 39% of Stuart Station. The NOVs indicated that the EPA may (1) issue an order requiring compliance with the requirements of the SIP, or (2) bring a civil action seeking injunctive relief and civil penalties of up to $27,500 per day for each violation.
See "EPA Agreement" below for a discussion of the tentative EPA settlement, which relates to matters discussed herein.
Beckjord Station NOV On November 30, 1999, the EPA filed an NOV againstCinergy andCG &E alleging that emissions of particulate matter at the Beckjord Station exceeded the allowable limit. The NOV indicated that the EPA may (1) issue an administrative penalty order, or (2) file a civil action seeking injunctive relief and civil penalties of up to $27,500 per day for each violation. The allegations contained in this NOV were incorporated within the March 1, 2000 amended complaint, as discussed in the "New Source Review" section. On June 22, 2000, the EPA issued an NOV and a Finding of Violation (FOV) alleging additional particulate emission violations at Beckjord Station and offered us an opportunity to meet and discuss the allegations and corrective measures. The NOV/FOV indicated the EPA may issue an administrative compliance order, issue an administrative penalty order, or bring a civil or criminal action.
See "EPA Agreement" below for a discussion of the tentative EPA settlement, which relates to matters discussed herein.
EPA Agreement On December 21, 2000,Cinergy,CG&E, andPSI reached an agreement in principle with the EPA, the U.S. Department of Justice, three northeast states, and two environmental groups that could serve as the basis for a negotiated resolution of CAA claims and other related matters brought against coal-fired power plants owned and operated byCinergy's operating subsidiaries. The complete resolution of these issues is contingent upon establishing a final agreement with the EPA and other parties. If a final agreement is reached with these parties, this would resolve past claims of the NSR as well as the Beckjord Station NOVs/FOV discussed above.
Under the terms of the tentative agreement, the EPA and the other plaintiffs have agreed to drop all challenges of past maintenance and repair activities at our coal-fired generation plants. In addition, the intent of the tentative agreement is that we would be allowed to continue on-going activities to maintain reliability and availability without subjecting the plants to future litigation regarding federal permitting requirements.
In return for resolution of past claims, future operational certainty, and protection of system wide demand growth, we have tentatively agreed to:
•shut down or repower with natural gas nine small coal-fired boilers at three power plants beginning in 2004;•build four additional SO2 scrubbers, the first of which must be operational by December 31, 2007;•upgrade existing pollution control systems;•phase in the operation of NOX reduction technology year-round starting in 2004;•retire 50,000 tons of SO2 allowances between 2001 and 2005 and reduce our SO2 cap by 35% in 2013;•pay a civil penalty of $8.5 million to the U.S. government; and•implement $21.5 million in environmental mitigation projects.
The estimated cost for these capital expenditures is expected to be approximately $700 million. These capital expenditures are in addition to our previously announced commitment to install NOX controls over the next five years at an estimated cost of approximately $700 million as previously discussed in "Ozone Transport Rulemaking."
In reaching the tentative agreement, we did not admit any wrongdoing and remain free to continue our current maintenance practices, as well as implement future projects for improved reliability. If the settlement is not completed, we believe the allegations contained in the amended complaint are without merit, and we would defend the suit vigorously in court. In such an event, it is not possible at this time to determine the likelihood that the plaintiffs would prevail on their claims or whether resolution of this matter would have a material effect on our financial condition or results of operations.
Manufactured Gas Plant (MGP) SitesPSI received claims from Indiana Gas Company, Inc. (IGC) in 1994, and from Northern Indiana Public Service Company (NIPSCO) in 1995, as more fully discussed in Note 12(f)(ii) of the "Notes to Financial Statements" in "Item 8. Financial Statements and Supplementary Data". The basis of these claims was thatPSI is a Potentially Responsible Party with respect to certain MGP sites under the Comprehensive Environmental Response, Compensation and Liability Act (CERCLA). The claims further asserted thatPSI is legally responsible for the costs of investigating and remediating the sites. In August 1997, NIPSCO filed suit againstPSI in federal court claiming recovery (pursuant to CERCLA) of NIPSCO's past and future costs of investigating and remediating MGP-related contamination at the Goshen MGP site.
In November 1998, NIPSCO, IGC, and•PSI entered into a Site Participation and Cost Sharing Agreement. This agreement allocated CERCLA liability for past and future costs at seven MGP sites in Indiana among the three companies. As a result of the agreement, NIPSCO's lawsuit againstPSI was dismissed. The parties have assigned lead responsibility for managing further investigation and
remediation activities at each of the sites to one of the parties. Similar agreements were reached between IGC andPSI that allocate CERCLA liability at 14 MGP sites with which NIPSCO was not involved. These agreements conclude all CERCLA and similar claims between the three companies related to MGP sites. The parties continue to investigate and remediate the sites, as appropriate under the agreements and applicable laws. The Indiana Department of Environmental Management (IDEM) oversees investigation and cleanup of some of the sites.Asbestos Claims Litigation
PSI notified its insurance carriers of the claims related to MGP sites raised by IGC, NIPSCO,Capital and the IDEM. In April 1998,Investment ExpendituresPSI filed suit in Hendricks County Circuit Court in the State of Indiana (Court) against its general liability insurance carriers. Among other matters,PSI requested a declaratory judgment that would obligate its insurance carriers to (1) defend MGP claims againstPSI, or (2) payPSI's costs of defense and compensatePSI for its costs of investigating, preventing, mitigating, and remediating damage to property and paying claims related to MGP sites. Recently, the trial date for the case was moved from May 2001 to January 2002. In addition, the Court has ordered the parties to submit the case to mediation. The parties have selected a mediator and scheduled mediation sessions in early 2001.PSI cannot predict the outcome of this litigation. Recently,PSI has been involved in settlement discussions with some of the insurance carriers. At the present time,PSI cannot predict either the progress or outcome of these discussions.
PSI has accrued costs for the sites related to investigation, remediation, and groundwater monitoring to the extent such costs are probable and can be reasonably estimated.PSI does not believe it can provide an estimate of the reasonably possible total remediation costs for any site before a remedial investigation/feasibility study has been completed. To the extent remediation is necessary, the timing of the remediation activities impacts the cost of remediation. Therefore,PSI currently cannot determine the total costs that may be incurred in connection with the remediation of all sites, to the extent that remediation is required. According to current information, these future costs at the 21 Indiana MGP sites are not material to our financial condition or results of operations. As further investigation and remediation activities are performed at these sites, the potential liability for the 21 Indiana MGP sites could be material to our financial position or results of operations.
CG&E and its utility subsidiaries are aware of potential sites where MGP activities have occurred at some time in the past. None of these sites is known to present a risk to the environment.CG&E and its utility subsidiaries have begun preliminary site assessments to obtain information about some of these MGP sites.
Construction and Other Commitments
Actual construction and other committed expenditures for 20002004 and forecasted construction and other committed expenditures for the year 20012005 and for the five-year period 2001-20052005-2009 (in nominal dollars) are presented in the table below:
Capital and Investment Expenditures
| | Actual
Expenditures
| | Forecasted Expenditures
| | Actual | | Forecasted | |
|---|
| | 2000
| | 2001
| | 2001-2005
| | 2004 | | 2005 | | 2005-2009 | |
|---|
| | (in millions)
| | (in millions) | |
|---|
| Cinergy(1) | | $ | 778 | | $ | 1,467 | | $ | 4,635 | |
| | | | | | | | |
Cinergy(1) | | | $ | 701 | | $ | 1,115 | | $ | 5,430 | |
| CG&E and subsidiaries | | | 265 | | | 423 | | | 1,676 | | 300 | | 430 | | 2,345 | |
| PSI | | | 261 | | | 406 | | | 2,264 | | 340 | | 620 | | 2,645 | |
| ULH&P | | | 28 | | | 37 | | | 178 | | 34 | | 80 | | 335 | |
|
(1)The results ofCinergy also include amounts related to non-registrants.
This forecast includes an estimate of expenditures in accordance with the companies' plans regardingIn 2004, we spent $203 million for NOX emission control standards and other environmental compliance (excludingprojects. Forecasted expenditures for environmental compliance projects (in nominal dollars) are approximately $465 million for 2005 and $1.8 billion for the 2005-2009 period. The vast majority of this forecast includes our entire estimate of costs to comply with draft regulations requiring reductions in mercury, NOX, and SO2 emissions, assuming a cap and trade approach to mercury emissions. Approximately 60 percent of these estimated environmental costs would be incurred at PSI’s regulated coal-fired plants. See “Environmental Issues” for further discussion.
55
Contractual Cash Obligations
The following table presents Cinergy’s, CG&E’s, PSI’s, and ULH&P’s significant contractual cash obligations:
| | Payments Due | |
| | | | | | | | | | | | There- | | | |
Contractual Cash Obligations | | 2005 | | 2006 | | 2007 | | 2008 | | 2009 | | after | | Total | |
| | (in millions) | |
| | | | | | | | | | | | | | | |
Cinergy(1) | | | | | | | | | | | | | | | |
Capital leases | | $ | 7 | | $ | 7 | | $ | 7 | | $ | 10 | | $ | 10 | | $ | 24 | | $ | 65 | |
Operating leases | | 43 | | 36 | | 28 | | 18 | | 14 | | 27 | | 166 | |
Long-term debt(2) | | 220 | (3)(4) | 355 | | 726 | | 551 | | 270 | | 2,376 | | 4,498 | |
Fuel purchase contracts(5) | | 879 | | 495 | | 420 | | 49 | | — | | — | | 1,843 | |
Other commodity purchase contracts(6) | | 28 | | 7 | | 3 | | 1 | | — | | — | | 39 | |
Total Cinergy | | $ | 1,177 | | $ | 900 | | $ | 1,184 | | $ | 629 | | $ | 294 | | $ | 2,427 | | $ | 6,611 | |
| | | | | | | | | | | | | | | |
CG&E and subsidiaries | | | | | | | | | | | | | | | |
Capital leases | | $ | 4 | | $ | 4 | | $ | 4 | | $ | 6 | | $ | 6 | | $ | 16 | | $ | 40 | |
Operating leases | | 10 | | 8 | | 7 | | 5 | | 4 | | 6 | | 40 | |
Long-term debt(2) | | 150 | (4) | — | | 100 | | 120 | | 20 | | 1,240 | | 1,630 | |
Fuel purchase contracts(5) | | 413 | | 202 | | 161 | | — | | — | | — | | 776 | |
Other commodity purchase contracts(6) | | 5 | | 1 | | — | | 1 | | — | | — | | 7 | |
Total CG&E and subsidiaries | | $ | 582 | | $ | 215 | | $ | 272 | | $ | 132 | | $ | 30 | | $ | 1,262 | | $ | 2,493 | |
| | | | | | | | | | | | | | | |
PSI | | | | | | | | | | | | | | | |
Capital leases | | $ | 3 | | $ | 3 | | $ | 3 | | $ | 4 | | $ | 4 | | $ | 8 | | $ | 25 | |
Operating leases | | 11 | | 10 | | 9 | | 7 | | 6 | | 13 | | 56 | |
Long-term debt(2) | | 50 | (3) | 326 | | 266 | | 43 | | 223 | | 976 | | 1,884 | |
Fuel purchase contracts(5) | | 466 | | 293 | | 259 | | 49 | | — | | — | | 1,067 | |
Total PSI | | $ | 530 | | $ | 632 | | $ | 537 | | $ | 103 | | $ | 233 | | $ | 997 | | $ | 3,032 | |
| | | | | | | | | | | | | | | |
ULH&P | | | | | | | | | | | | | | | |
Capital leases | | $ | 1 | | $ | 1 | | $ | 1 | | $ | 1 | | $ | 2 | | $ | 3 | | $ | 9 | |
Long-term debt(2) | | — | | — | | — | | 20 | | 20 | | 55 | | 95 | |
Total ULH&P | | $ | 1 | | $ | 1 | | $ | 1 | | $ | 21 | | $ | 22 | | $ | 58 | | $ | 104 | |
| | | | | | | | | | | | | | | | | | | | | | | | | |
(1)Includes amounts related to non-registrants.
(2)Amounts do not include interest payments. See the Consolidated Statements of Capitalization in “Item 8. Financial Statements and Supplementary Data” for disclosure of interest rates for interest payments.
(3)Includes PSI’s 6.50% Debentures due August 1, 2026, reflected as maturing in 2005, as the interest rate is due to reset on August 1, 2005. If the interest rate does not reset, the bonds are subject to mandatory redemption by PSI.
(4)CG&E’s 6.90 implementation% Debentures due June 1, 2025, are putable to CG&E at the option of the tentative EPA Agreement),holders on June 1, 2005. However, based upon current market conditions, we believe it is unlikely that the debentures will be put to CG&E on this date.
(5)We have significantly more coal under contract; however, these contracts contain price re-opener provisions effectively making them variable contracts after certain dates. Contract coal after the price re-opener date is therefore excluded from this table.
(6)Includes long-term contracts accounted for on an accrual basis. See the Fair Value of Contracts maturity table in “Market Risk Sensitive Instruments” for disclosure of energy trading contracts that are accounted for at fair value.
56
Pension and Other Postretirement Benefits
Cinergy maintains qualified defined benefit pension plans covering substantially all United States employees meeting certain minimum age and service requirements. Plan assets consist of investments in equity and debt securities. Funding for the qualified defined benefit pension plans is based on actuarially determined contributions, the maximum of which is generally the amount deductible for tax purposes and the minimum being that required by the Employee Retirement Income Security Act of 1974, as discussedamended (ERISA). Although mitigated by strong performance in 2003 and 2004, ongoing retiree payments and the decline in market value of the investment portfolio in 2002 reduced the assets held in trust to satisfy plan obligations. Additionally, continuing low long-term interest rates have increased the liability for funding purposes. As a result of these events, our near term funding targets have increased substantially. Cinergy has adopted a five-year plan to reduce, or eliminate, the unfunded pension obligation initially measured as of January 1, 2003. This unfunded obligation will be recalculated as of January 1 of each year in the "Environmental Issues" section. Approximately $210five-year plan. Because this unfunded obligation is the difference between the liability determined actuarially on an ERISA basis and the market value of plan assets as of January 1, 2003, the liability determined by this calculation is different than the pension liability calculated for accounting purposes reported on Cinergy’s Balance Sheets.
Cinergy’s minimum required contribution in calendar year 2004 was $16 million, is estimatedas compared to $11 million in calendar year 2003. Actual contributions during calendar year 2004 and 2003 totaled $117 million and $74 million, reflecting additional discretionary contributions of $101 million and $63 million, respectfully, under the aforementioned five-year plan. Due to the significant 2004 and 2003 calendar year contributions, Cinergy’s minimum required contributions in calendar year 2005 are expected to be spent in 2001 and approximately $789 million is estimatedzero. Should Cinergy continue funding under the five-year plan, discretionary contributions are expected to be spent between 2001$72 million in 2005. Cinergy may consider making discretionary contributions in 2006 and 2005. This forecast also includes expendituresfuture periods; however, at this time, we are unable to determine the amount of those contributions. Estimated contributions fluctuate based on changes in market performance of plan assets and actuarial assumptions. Absent the occurrence of interim events that could materially impact these targets, we will update our expected target contributions annually as the actuarial funding valuations are completed and make decisions about future contributions at that time.
Cinergy sponsors non-qualified pension plans that cover officers, certain key employees, and non-employee directors. Cinergy’s payments for these non-qualified pension plans are expected to be approximately $9 million in 2005.
We provide certain health care and life insurance benefits to retired United States employees and their eligible dependents. Cinergy’s payments for these postretirement benefits in 2005 are expected to be approximately $25 million. See Note 9 of the pending purchase of two natural gas-fired merchant electric generating facilities from Enron North America (Enron) with a total combined capacity of 998 megawatts (MW), the acquisition of an interest“Notes to Financial Statements” in a gas distribution business in Athens, Greece,“Item 8. Financial Statements and Supplementary Data” for additional information about our pension and other committed investments.postretirement benefit plans.
All forecasted amounts reflect the following assumptions relating to the factors below, which may change significantly:
•the general economy;•capital markets;•construction programs;•legislative and regulatory actions;•frequency and timing of rate proceedings; and•other related factors.
Other Investing Activities
Our goal is to pursue a market leadership position in our regional Midwest market and at the same time extend that market leadership position to neighboring areas. In pursuit of this goal, we have entered into various growth initiatives including:
•"new market" energy merchant businesses;•industrial infrastructure cogeneration and combined heat and power businesses; and•power technology and infrastructure businesses.
We are consistently working towards maximizing the value of existing assets and operations. We will continue to explore and implement the use of mergers, acquisitions, strategic combinations, and internal expansions if they enhance our ability to achieve our goal of creating a competitive advantage.
Our ability to invest in growth initiatives is limited by certain legal and regulatory requirements, including the PUHCA. The PUHCA restrictslimits the types of non-utility businesses in which Cinergy and other registered holding companies under the PUHCA can invest as well as the amount whichof capital that can be invested in permissible non-utility businesses. Also, the timing and amount of investments in the non-utility businesses is dependent on the development and favorable evaluations of opportunities. Under the PUHCA regulations,restrictions, we are allowed to invest, or commit to invest, in certain non-utility businesses, including:
1.•Exempt Wholesale Generators (EWG) and Foreign Utility Companies (FUCO)
An EWG is a special purposean entity, that owns certified by the Federal Energy Regulatory Commission (FERC), devoted exclusively to owning and/or operates domesticoperating, and selling power from one or foreignmore electric generating facilities. An EWG whose generating facilities whose powerare located in the United States is sold entirely at wholesale. limited to making only wholesale sales of electricity. An entity claiming status as an EWG must provide notification thereof to the SEC under the PUHCA.
57
A FUCO is a company all of whose utility assets and operations are located outside the U.S.United States and which are used for the generation, transmission, or distribution of electric energy for sale at retail or wholesale, or the distribution of gas at retail. A FUCO may not derive any income, directly or indirectly, from the generation, transmission, or distribution of electric energy for sale or the distribution of gas at retail.
In late 1999, we filedretail within the United States. An entity claiming status as a request withFUCO must provide notification thereof to the SEC under the PUHCA.
Cinergy has been granted SEC authority under the PUHCA for an additional $5 billion in authority to invest in EWGs and FUCOs. On June 23, 2000, the SEC issued(including by way of guarantees) an interim order granting us authority to invest a total of $1.7 billionaggregate amount in EWGs and FUCOs replacing an earlier order cappingequal to the sum of (1) our investment authority under PUHCA at an amount equal toCinergy'saverage consolidated retained earnings from time to time.time plus (2) $2 billion through June 30, 2005. As of December 31, 2000,2004, we had invested or committed to invest $1.4approximately $0.8 billion in EWGs and FUCOs, leaving available investment capacity under the order of the $1.7 billion available.
approximately $2.8 billion. In January 2001,February 2005, Cinergy modified its request to filed an application with the SEC for additional investment authority, proposing a new investment limitation capped at $4 billion, subject to various terms and conditions. This request is pending beforeunder the SEC. While we currently cannot predict the outcomePUHCA requesting an extension of this request,authority through December 31, 2008. At this time, we are unable to predict whether the existing limits could restrict our ability to invest in future transactions.SEC will approve this request.
•
2.- Qualifying Facilities and Energy-Related Non-utility Entities
SEC regulations under the PUHCA permitCinergy and other registered holding companies to invest and/or guarantee an amount equal to 15%15 percent of consolidated capitalization (consolidated capitalization is the sum ofNotes payable and other short-term obligations,,Long-term debt (including(including amounts due within one year),Cumulative preferred stockPreferred Stock of subsidiariesSubsidiaries, and totalCommon stock equityStock Equity) in domestic qualifying cogeneration and small power production plants (qualifying facilities) and certain other domestic energy-related non-utility entities. At December 31, 2000, 15%2004, we had invested and/or guaranteed approximately $1.1 billion of the $1.4 billion available. In August 2004, Cinergy filed an application with the SEC requesting authority under the PUHCA to increase its investment and/or guarantee authority by $2 billion above the current authorized amount. At this time, we are unable to predict whether the SEC will approve this request.
Cinergy's• consolidated capitalization was approximatelyEnergy-Related Assets
Cinergy has been granted SEC authority under the PUHCA to invest up to $1 billion in non-utility Energy-Related Assets within the United States, Canada, and Mexico. Energy-Related Assets include natural gas exploration, development, production, gathering, processing, storage and transportation facilities and equipment, liquid oil reserves and storage facilities, and associated assets, facilities and equipment, but would exclude any assets, facilities, or equipment that would cause the owner or operator thereof to be deemed a public utility company. As of December 31, 2004, we did not have any investments in these Energy-Related Assets.
•Infrastructure Services Companies
Cinergy has been granted SEC authority under the PUHCA to invest up to $500 million in companies that derive or will derive substantially all of their operating revenues from the sale of Infrastructure Services including:
• Design, construction, retrofit, and maintenance of utility transmission and distribution systems;
• Installation and maintenance of natural gas pipelines, water and sewer pipelines, and underground and overhead telecommunications networks; and
• Installation and servicing of meter reading devices and related communications networks, including fiber optic cable.
At December 31, 2004, we had invested approximately $.7 billion, leaving $.3 billion available for additional investing.$30 million in Infrastructure Services companies. In February 2005, Cinergy
CAPITAL RESOURCES
filed an application with the SEC under PUHCA requesting authority to invest up to $100 million in Infrastructure Services companies through December 31,
During 2000,
58
2008, which is a $400 million reduction in Cinergy’s current authority. At this time, we metare unable to predict whether the SEC will approve this request.
Guarantees
We are subject to an SEC order under the PUHCA, which limits the amounts Cinergy Corp. can have outstanding under guarantees at any one time to $2 billion. As of December 31, 2004, we had approximately $877 million outstanding under the guarantees issued, of which approximately 96 percent represents guarantees of obligations reflected on Cinergy’s Balance Sheets. The amount outstanding represents Cinergy Corp.’s guarantees of liabilities and commitments of its consolidated subsidiaries, unconsolidated subsidiaries, and joint ventures. In February 2005, Cinergy filed an application with the SEC under the PUHCA requesting authority to have an aggregate amount of guarantees outstanding at any point in time not to exceed $3 billion. At this time, we are unable to predict whether the SEC will approve this request.
See Note 11(c)(v) of the “Notes to Financial Statements” in “Item 8. Financial Statements and Supplementary Data” for a discussion of guarantees in accordance with Financial Accounting Standards Board Interpretation No. 45, Guarantor’s Accounting and Disclosure Requirements for Guarantees, Including Indirect Guarantees of Indebtedness of Others (Interpretation 45). Interpretation 45 requires disclosure of maximum potential liabilities for guarantees issued on behalf of unconsolidated subsidiaries and joint ventures and under indemnification clauses in various contracts. The Interpretation 45 disclosure differs from the PUHCA restrictions in that it requires a calculation of maximum potential liability, rather than actual amounts outstanding; it excludes guarantees issued on behalf of consolidated subsidiaries; and it includes potential liabilities under indemnification clauses.
Marketing & Trading Liquidity Risks
Cinergy has certain contracts in place, primarily with trading counterparties, that require the issuance of collateral in the event our debt ratings are downgraded below investment grade. Based upon our December 31, 2004 trading portfolio, if such an event were to occur, Cinergy would be required to issue up to approximately $310 million in collateral related to its gas and power trading operations, of which $69 million is related to CG&E.
Capital Resources
Cinergy, CG&E, PSI, and ULH&P meet their current and future capital requirements through a combination of funding sources including, but not limited to, internally generated fundscash flows, tax-exempt bond issuances, capital lease and operating lease structures, the securitization of certain asset classes, short-term bank borrowings, issuance of commercial paper, and issuances of long-term debt issuances. We expectand equity. Funding decisions are based on market conditions, market access, relative pricing information, borrowing duration and current versus forecasted cash needs. Cinergy, CG&E, PSI, and ULH&P are committed to maintaining balance sheet health, responsibly managing capitalization, and maintaining adequate credit ratings. Cinergy, CG&E, PSI, and ULH&P believe that they have adequate financial resources to meet ourtheir future capital needs throughneeds.
Sale of Accounts Receivable
CG&E, PSI, and ULH&P have an agreement with Cinergy Receivables Company, LLC (Cinergy Receivables), an affiliate, to sell, on a combinationrevolving basis, nearly all of internallythe retail accounts receivable and externally generatedrelated collections of CG&E, PSI, and ULH&P. Cinergy Receivables funds includingits purchases with borrowings from commercial paper conduits that obtain a security interest in the issuancereceivables. This program accelerates the collection of debt and/or equity securities.
cash for In early 2000,CG&E, PSI, and ULH&P related to these retail receivables. Cinergy Corp. filed does not consolidate Cinergy Receivables because it meets the requirements to be accounted for as a request withqualifying special purpose entity (SPE). A decline in the SEC underlong-term senior unsecured credit ratings of CG&E, PSI, and ULH&P below investment grade would result in the PUHCA for an amendment to its certificatetermination of incorporation authorizing the issuancesale program and discontinuance of preferred securities in addition to common stock. We also requested SEC authority to solicit proxies for shareholder approvalfuture sales of this amendment. In June 2000, we received the authorization from the SEC. At this time, it is not known whether shareholder approval will be granted or, if granted, whether or when any preferred stock will be issued.
Internally Generated Funds
receivables.
As of December 31, 2000, a significant portion of our revenues
59
Notes Payable and corresponding cash flows were derived from our regulated subsidiaries. With the passage of customer choice legislation in several states, we believe it is likely the generation component of the electric utility industry will ultimately be deregulated. (Within our own utility jurisdictions, only Ohio is currently in the process of transitioning to a deregulated environment. Refer to the "Retail Market Developments" section.) As a low cost provider of energy service, we believe we will be successful in this competitive environment. However, as the industry becomes more competitive, future cash flows from operations could be subject to a higher degree of volatility than under our present regulatory structure. In 2001, we believe revenues provided by our regulated operations will continue as a major source of funds.Other Short-term Obligations
Debt
We are required to secure authority to issue short-term debt from the SEC under the PUHCA and from the PUCO. The SEC under the PUHCA regulates the issuance of short-term debt by Cinergy Corp., PSI, and ULH&P. The PUCO has regulatory jurisdiction over the issuance of short-term debt by CG&E.
| | Short-term Regulatory Authority
December 31, 2004 | |
| | (in millions) | |
| | | | | |
| | Authority | | Outstanding | |
| | | | | |
Cinergy Corp. | | $ | 5,000 | (1) | $ | 676 | |
CG&E and subsidiaries | | 665 | (2) | 180 | |
PSI | | 600 | | 131 | |
ULH&P | | 65 | (2) | 11 | |
| | | | | | | |
(1) Cinergy Corp., under the PUHCA, was granted approval to increase total capitalization (excluding retained earnings and accumulated other comprehensive income (loss)), which may be any combination of debt and equity securities, by $5 billion. Outside this requirement, Cinergy Corp. is not subject to specific regulatory debt authorizations.
(2) In December 2004, Cinergy and ULH&P requested approval from the SEC for an increase in ULH&P’s authority from $65 million to $150 million to coincide with the completion of its pending transaction with CG&E in which ULH&P will acquire interests in three of CG&E’s electric generating stations. At this time, we are unable to predict whether the SEC will approve this request.
For the purposes of quantifying regulatory authority, short-term debt includes revolving credit line borrowings, uncommitted credit line borrowings, intercompany money pool obligations, and commercial paper.
60
Cinergy Corp.’s short-term borrowing consists primarily of unsecured revolving lines of credit and the sale of commercial paper. Cinergy Corp.’s $2 billion revolving credit facilities and $1.5 billion commercial paper program also support the short-term borrowing needs of CG&E, PSI, and ULH&P. In addition, Cinergy Corp., CG&E, and PSI maintain uncommitted lines of credit. These facilities are not firm sources of capital but rather informal agreements to lend money, subject to availability, with pricing determined at the time of advance. The following is a summary of outstanding short-term borrowings for Cinergy, CG&E, PSI, and ULH&P, including variable rate pollution control notes:
| | Short-term Borrowings | |
| | December 31, 2004 | |
| | | | | | | | | | | |
| | | | | | | | | | Available | |
| | | | | | | | | | Revolving | |
| | Established | | | | | | Standby | | Lines of | |
| | Lines | | Outstanding | | Unused | | Liquidity(1) | | Credit | |
| | (in millions) | |
| | | | | | | | | | | |
Cinergy | | | | | | | | | | | |
Cinergy Corp. | | | | | | | | | | | |
Revolving lines(2) | | $ | 2,000 | | $ | — | | $ | 2,000 | | $ | 688 | | $ | 1,312 | |
Uncommitted lines(3) | | 40 | | — | | 40 | | | | | |
Commercial paper(4) | | | | 676 | | | | | | | |
| | | | | | | | | | | |
Utility operating companies | | | | | | | | | | | |
Uncommitted lines(3) | | 75 | | — | | 75 | | | | | |
Pollution control notes | | | | 248 | | | | | | | |
| | | | | | | | | | | |
Non-regulated subsidiaries | | | | | | | | | | | |
Revolving lines(5) | | 158 | | 8 | | 150 | | — | | 150 | |
Short-term debt | | | | 2 | | | | | | | |
Pollution control notes | | | | 25 | | | | | | | |
| | | | | | | | | | | |
Cinergy Total | | | | $ | 959 | | | | | | $ | 1,462 | |
| | | | | | | | | | | |
CG&E and subsidiaries | | | | | | | | | | | |
Uncommitted lines(3) | | $ | 15 | | $ | — | | $ | 15 | | | | | |
Pollution control notes | | | | 112 | | | | | | | |
Money pool | | | | 180 | | | | | | | |
| | | | | | | | | | | |
CG&E Total | | | | $ | 292 | | | | | | | |
| | | | | | | | | | | |
PSI | | | | | | | | | | | |
Uncommitted lines(3) | | $ | 60 | | $ | — | | $ | 60 | | | | | |
Pollution control notes | | | | 136 | | | | | | | |
Money pool | | | | 130 | | | | | | | |
| | | | | | | | | | | |
PSI Total | | | | $ | 266 | | | | | | | |
| | | | | | | | | | | |
ULH&P | | | | | | | | | | | |
Money pool | | | | $ | 11 | | | | | | | |
| | | | | | | | | | | |
ULH&P Total | | | | $ | 11 | | | | | | | |
| | | | | | | | | | | | | | | | |
(1)Standby liquidity is reserved against the revolving lines of credit to support the commercial paper program and outstanding letters of credit (currently $676 million and $12 million, respectively).
(2)Consists of a three-year $1 billion facility and a five-year $1 billion facility. The five-year facility contains $500 million sublimits each for CG&E and PSI.
(3)These facilities are not guaranteed sources of capital and represent an informal agreement to lend money, subject to availability, with pricing to be determined at the time of advance.
(4)In September 2004, Cinergy Corp. increased its commercial paper program limit from $800 million to $1.5 billion. The commercial paper program is supported by Cinergy Corp.’s revolving lines of credit.
(5)In December 2004, Cinergy Canada, Inc. successfully placed a $150 million three-year senior revolving credit facility.
61
At December 31, 2004, Cinergy Corp. had approximately $1.3 billion remaining unused and available capacity relating to its $2 billion revolving credit facilities. These revolving credit facilities include the following:
| | | Outstanding | |
Credit Facility | | Expiration | | Established Lines | | and Committed | | Unused and Available | |
| | | (in millions) | |
| | | | | | | | | |
Five-year senior revolving | | December 2009 | | | | | | | |
Direct borrowing | | | | $ | | | $ | — | | $ | | |
Commercial paper support | | | | | | — | | | |
| | | | | | | | | |
Total five-year facility(1) | | | | 1,000 | | — | | 1,000 | |
| | | | | | | | | |
Three-year senior revolving | | April 2007 | | | | | | | |
Direct borrowing | | | | | | — | | | |
Commercial paper support | | | | | | 676 | | | |
Letter of credit support | | | | | | 12 | | | |
| | | | | | | | | |
Total three-year facility(2) | | | | 1,000 | | 688 | | 312 | |
| | | | | | | | | |
Total Credit Facilities | | | | $ | 2,000 | | $ | 688 | | $ | 1,312 | |
(1)In April 2004, Cinergy Corp. successfully placed a $500 million 364-day senior unsecured revolving credit facility. This facility replaced the $600 million 364-day senior unsecured revolving credit facility that expired in April 2004. In December 2004, Cinergy Corp. successfully replaced the $500 million 364-day facility with a $1 billion five-year facility. CG&E and PSI each have $500 million borrowing sublimits on this facility.
(2)In April 2004, Cinergy Corp. successfully placed a $1 billion three-year senior unsecured revolving credit facility. This facility replaced the $400 million three-year senior unsecured revolving credit facility that was set to expire in May 2004.
In our credit facilities, Cinergy Corp. has covenanted to maintain:
• a consolidated net worth of $2 billion; and
• a ratio of consolidated indebtedness to consolidated total capitalization not in excess of 65 percent.
As part of CG&E’s $500 million sublimit under the $1 billion five-year credit facility, CG&E has covenanted to maintain:
• a consolidated net worth of $1 billion; and
• a ratio of consolidated indebtedness to consolidated total capitalization not in excess of 65 percent.
As part of PSI’s $500 million sublimit under the $1 billion five-year credit facility, PSI has covenanted to maintain:
• a consolidated net worth of $900 million; and
• a ratio of consolidated indebtedness to consolidated total capitalization not in excess of 65 percent.
A breach of these covenants could result in the termination of the credit facilities and the acceleration of the related indebtedness. In addition to breaches of covenants, certain other events that could result in the termination of available credit and acceleration of the related indebtedness include:
• bankruptcy;
• defaults in the payment of other indebtedness; and
• judgments against the company that are not paid or insured.
The latter two events, however, are subject to dollar-based materiality thresholds.
As discussed in Note 1(q)(i) of the “Notes to Financial Statements” in “Item 8. Financial Statements and Supplementary Data”, long-term debt increased in the third quarter of 2003 resulting from the adoption of Interpretation 46. The debt which was recorded as a result of this new accounting pronouncement did not cause
62
Cinergy Corp. to be in breach of any covenants at the time of adoption. As of December 31, 2004, Cinergy, CG&E, and PSI are in compliance with all of their debt covenants.
Variable Rate Pollution Control Notes
CG&E and PSI have issued certain variable rate pollution control notes (tax-exempt notes obtained to finance equipment or land development for pollution control purposes). Because the holders of these notes have the right to have their notes redeemed on a daily, weekly, or monthly basis, they are reflected in Notes payable and other short-term obligations on the Balance Sheets of Cinergy, CG&E, and PSI. At December 31, 2004, Cinergy, CG&E and PSI had $273 million, $112 million and $136 million, respectively, outstanding in variable rate pollution control notes, classified as short-term debt. ULH&P had no outstanding short-term pollution control notes. Any short-term pollution control note borrowings outstanding do not reduce the unused and available short-term debt regulatory authority of CG&E, PSI, and ULH&P. See Note 5 of the “Notes to Financial Statements” in “Item 8. Financial Statements and Supplementary Data”.
Commercial Paper
Cinergy Corp.’s commercial paper program is supported by Cinergy Corp.’s $2 billion revolving credit facilities. The commercial paper program supports, in part, the short-term borrowing needs of CG&E and PSI and eliminates their need for separate commercial paper programs. In September 2004, Cinergy Corp. expanded its commercial paper program from $800 million to a maximum outstanding principal amount of $1.5 billion. As of December 31, 2004, Cinergy Corp. had $676 million in commercial paper outstanding.
Money Pool
Cinergy Corp., Cinergy Services, Inc., and our utility operating companies participate in a money pool arrangement to better manage cash and working capital requirements. Under this arrangement, those companies with surplus short-term funds provide short-term loans to affiliates (other than Cinergy Corp.) participating under this arrangement. This surplus cash may be from internal or external sources. The amounts outstanding under this money pool arrangement are shown as a component of Notes receivable from affiliated companies and/or Notes payable to affiliated companies on the Balance Sheets of CG&E, PSI, and ULH&P. Any money pool borrowings outstanding reduce the unused and available short-term debt regulatory authority of CG&E, PSI, and ULH&P.
Operating Leases
We have entered into operating lease agreements for various facilities and properties such as computer, communication and transportation equipment, and office space. See Note 6(a) of the “Notes to Financial Statements” in “Item 8. Financial Statements and Supplementary Data” for additional information regarding operating leases.
Capital Leases
Our utility operating companies are able to enter into capital leases subject to the authorization limitations of the applicable state utility commissions. New financing authority is subject to the approval of the respective commissions. The following table presents further information related to the capital lease authorizations of CG&E, PSI, and ULH&P at December 31, 2004.
| | Capital Lease Authority
December 31, 2004 | |
| | (in millions) | |
| | | | | | | | | |
| | Authority | | Outstanding | | Remaining | | Expiration Date | |
CG&E and subsidiaries | | $ | 60 | | $ | 9 | | $ | 51 | | 12/31/2005 | |
PSI | | 100 | | 4 | | 96 | | 12/31/2005 | |
ULH&P | | 25 | | 2 | | 23 | | 12/31/2006 | |
| | | | | | | | | | | | |
63
See Note 6(b) of the “Notes to Financial Statements” in “Item 8. Financial Statements and Supplementary Data” for additional information regarding capital leases.
Long-term Debt
We are required to secure authority to issue long-term debt from the SEC under the PUHCA and the state utility commissions of Ohio, Kentucky, and Indiana. The SEC under the PUHCA regulates the issuance of long-term debt forby Cinergy Corp. Our three The respective state utility commissions regulate the issuance of long-term debt forby our utility operating companies. On June 23, 2000, the SEC issued an order
A current summary of our long-term debt authorizations at December 31, 2004, was as follows:
| | Authorized | | Used | | Available | |
| | (in millions) | |
| | | | | | | |
Cinergy Corp. | | | | | | | |
PUHCA total capitalization(1)(2) | | $ | 5,000 | | $ | 1,747 | | $ | 3,253 | |
| | | | | | | |
CG&E and subsidiaries(3) | | | | | | | |
State Public Utility Commissions | | $ | 575 | | $ | — | | $ | 575 | |
State Public Utility Commission - Tax-Exempt | | 250 | | 94 | | 156 | |
| | | | | | | |
PSI | | | | | | | |
State Public Utility Commission | | $ | 500 | | $ | — | | $ | 500 | |
State Public Utility Commission - Tax-Exempt | | 250 | | 209 | | 41 | |
| | | | | | | |
ULH&P | | | | | | | |
State Public Utility Commission(4) | | $ | 75 | | $ | — | | $ | 75 | |
(1)Cinergy Corp., under the PUHCA, authorizingCinergy Corp.was granted approval to increase its total capitalization at December 31, 1999, (excluding retained earnings and accumulated other comprehensive income)income (loss)), which may be any combination of debt and equity securities, by $5 billion. Outside this requirement, Cinergy Corp. is not subject to specific regulatory debt authorizations.
(2)In February 2005, Cinergy filed an application with the SEC under the PUHCA to issue an additional $5 billion through issuance ofin any combination of debt and equity and debt securities. This increased authorization is subjectsecurities from time to certain conditions, including, among others, that common equity comprises at least 30% ofCinergy Corp.'s consolidated capital structure and thatCinergy Corp., under certain circumstances, maintains an investment grade rating on its senior debt obligations. This increased authority is intendedtime through December 31, 2008. At this time, we are unable to provideCinergy Corp. flexibility to respond quickly and efficiently to financing needs and available conditions in capital markets.predict whether the SEC will approve this request.
(3)Includes amounts for Short-term DebtULH&P.
(4)In connectionJanuary 2005, ULH&P filed an application with the current SEC authorization,Cinergy Corp. has $795Kentucky Public Service Commission (KPSC) seeking financing authority to issue and sell up to $500 million established linesprincipal amount of credit. Assecured and unsecured debt; enter into inter-company promissory notes up to an aggregate principal amount of December 31, 2000,Cinergy Corp. had $157 million unused$200 million; and available on its established lines. In early 2001,Cinergy Corp. successfully placed a new $400 million, 364-day revolving credit facility. This new facility will support an expansion of our commercial paper program and is not included in the lines of credit discussed above.
Our operating companies have regulatory authority to borrow up to a totalmaximum of $853$200 million in short-term debt ($453 million forCG&E and its subsidiaries including $50 million forULH&P, and $400 million forPSI). In connection with this authority, we have established lines of credit forCG&E andPSI, $120 million and $185 million, respectively, of which, $40 million and $80 million, respectively, remained unused and available at December 31, 2000.
Also, certain of our non-regulated subsidiaries have established lines of credit. As of December 31, 2000, $1.9 million was unused and available on these established lines. Our non-regulated subsidiaries have the availability of funds fromCinergy Corp. if the need arises.
As of December 31, 2000, the commercial paper (debt instruments exchanged between companies) program is limited to a maximum outstandingaggregate principal amount of $400 million fortax-exempt debt through December 31, 2006.
Cinergy Corp. Ashas an effective shelf registration statement with the SEC relating to the issuance of December 31, 2000,Cinergy Corp. had issued $216up to $750 million in commercial paper. Additionally,any combination of common stock, preferred stock, stock purchase contracts or unsecured debt securities, of which approximately $323 million remains available for issuance. CG&E and has an effective shelf registration statement with the SEC relating to the issuance of up to $800 million in any combination of unsecured debt securities, first mortgage bonds, or preferred stock, all of which remains available for issuance. PSI has an effective shelf registration statement with the SEC relating to the issuance of up to $800 million in any combination of unsecured debt securities, first mortgage bonds, or preferred stock, all of which remains available for issuance. ULH&P has an effective shelf registration statement with the SEC for the issuance of up to $75 million in unsecured debt securities, $35 million of which remains available for issuance. ULH&P also has an effective shelf registration statement with the SEC relating to the issuance of up to $40 million in first mortgage bonds, of which $20 million remains available for issuance.
Off-Balance Sheet Arrangements
Cinergy haveuses off-balance sheet arrangements from time to time to facilitate financing of various projects. Off-balance sheet arrangements are often created for a single specified purpose, for example, to facilitate securitization, leasing, hedging, research and development, reinsurance, or other transactions or arrangements. The following describes our major off-balance sheet arrangements excluding the capacity to issue commercial paper,investments Cinergy holds in various unconsolidated subsidiaries which must be supported by available committed linesare accounted for under the equity method. See Note 1(b)(ii) of the respective company. The maximum outstanding principal amount forCG&E is $200 million and forPSI is $100 million. NeitherCG&E norPSI issued commercial paper in 2000 or 1999.
In early 2001,Cinergy Corp. expanded the commercial paper program“Notes to a maximum outstanding principal amount of $800 million and reduced the established lines of credit atCG&E andPSI. The expansion of the commercial paper program at theCinergy Corp. level will, in part, support the short-term borrowing needs ofCG&E andPSI and will eliminate the need for commercial paper programs atCG&E andPSI. TheCinergy Corp. commercial paper program expansion is supported by the new $400 million, 364-day revolving credit facility as discussed above.
For a detailed discussion of the registrants' short-term indebtedness, refer to Note 5 of the "Notes to
64
Financial Statements"Statements” in "Item“Item 8. Financial Statements and Supplementary Data".
Long-term Debt UnderData” for additional information on the PUHCA authorization mentioned above, we are able to issue and sell long-term debt at the parent holding company level. As of December 31, 2000,Cinergy Corp. had $400 million of long-term debt outstanding.accounting for equity method investments.
Currently, our operating companies have outstanding long-term debt in the form of First Mortgage Bonds and Other Secured Notes, and Senior and Junior Unsecured Debt. Under our existing authority, the remaining authorized but unissued debt,
(i) Guarantees
Cinergy has entered into various contracts that are classified as of December 31, 2000, is reflected in the following table:
Authorizing Agency
| | CG&E
| | PSI
| | ULH&P
|
|---|
| | (in millions)
|
|---|
Applicable State Utility Commission
(Secured or Unsecured Debt) | | $ | 200 | | $ | 346 | | $ | 30 |
We may, at any time, request additional long-term debt authorization. This request is subject to regulatory approval, which may or may not be granted.
As of December 31, 2000, through shelf registrations filed with the SECguarantees under the Securities Act of 1933, we could issue the following amounts of debt securities:
| | CG&E
| | PSI
| | ULH&P
|
|---|
| | (in millions)
|
|---|
| First Mortgage Bonds and Other Secured Notes | | $ | 300 | | $ | 265 | | $ | 20 |
| Senior or Junior Unsecured Debt | | | 50 | | | 400 | | | 30 |
Interpretation 45. For further information, see Note 11(c)( Capital Leasesv We are able to enter into capital leases subject to the authorization limitations) of the applicable state utility commissions. We may, at any time, request the applicable state utility commission to increase our limits. Any request may or may not be granted. As of December 31, 2000, unused capital lease authority is $80 million forCG&E, $88 million forPSI, and $25 million forULH&P.
Common Stock
In addition to the authority to issue common stock pursuant to the SEC's June 23, 2000 order permittingCinergy Corp. to increase its total capitalization by $5 billion (as previously discussed),Cinergy Corp. has SEC authority to issue an additional 50 million shares of common stock for our various stock-based plans. We also have the option of purchasing shares of common stock on the open market to satisfy the obligations of our various stock-based plans. The proceeds from any new issuances will be used for general corporate purposes.
The following table reflects the number of shares purchased and issued for our various stock-based plans:
| | 2000
| | 1999
| | 1998
|
|---|
| | (in thousands)
|
|---|
| Purchased Shares | | 2,299 | | 748 | | 861 |
| Issued Shares | | 77 | | 291 | | 194 |
See Note 2(a) of the "Notes“Notes to Financial Statements"Statements” in "Item“Item 8. Financial Statements and Supplementary Data" for additional information on issued shares.
Dividend Restrictions
Data”.
(ii) Retained Interest in Assets Transferred to an Unconsolidated Entity
In February 2002, CG&E, PSI, and ULH&P replaced their existing agreement to sell certain of their accounts receivable and related collections. Cinergy Corp. formed Cinergy Receivables to purchase, on a revolving basis, nearly all of the retail accounts receivable and related collections of CG&E, PSI, and ULH&P. Cinergy Corp. does not consolidate Cinergy Receivables since it meets the requirements to be accounted for as a qualifying SPE. CG&E, PSI, and ULH&P each retain an interest in the receivables transferred to Cinergy Receivables. The transfer of receivables are accounted for as sales, pursuant to Statement of Financial Accounting Standards No. 140, Accounting for Transfers and Servicing of Financial Assets and Extinguishments of Liabilities. For a more detailed discussion of dividend restrictions, refer toour sales of accounts receivable, see Note 2(b)3(c) of the "Notes“Notes to Financial Statements"Statements” in "Item“Item 8. Financial Statements and Supplementary Data"Data”.
Securities Ratings
(iii) Derivative Instruments that are Classified as Equity
In 2001, Cinergy Corp. issued approximately $316 million notional amounts of combined securities, a component of which was stock purchase contracts. These contracts obligated the holder to purchase common shares of Cinergy Corp. stock by February 2005. Since the stock purchase contracts were detachable and classified in equity, the change in their fair value was not recorded in equity or earnings. In January and February 2005, the stock purchase contracts were settled, resulting in the issuance of common stock that is recorded on Cinergy’s Balance Sheets as Common Stock Equity. For further information see Note 3(b) of the “Notes to Financial Statements” in “Item 8. Financial Statements and Supplementary Data”.
(iv) Variable Interest Entities (VIE)
Cinergy holds interests in VIEs, consolidated and unconsolidated, as defined by Interpretation 46. For further information, see Note 1(q)(i) and Note 3 of the “Notes to Financial Statements” in “Item 8. Financial Statements and Supplementary Data”.
65
Securities Ratings
As of January 31, 2001,2005, the major credit rating agencies rated our securities as follows:
| | |
|
| FitchFitch(1)
|
| (1)Moody’s(2)
| | Moody's(2)
| | |
| S&P&P(3)(3)
|
|
|---|
| | | | | | | |
Cinergy Corp. | | | | | | | |
| Corporate Credit | | BBB+ | | Baa2 | | BBB+/A-2 | |
| Senior Unsecured Debt | | BBB+ | | Baa2 | | BBB+BBB | |
| Commercial Paper | | F-2 | | P-2 | | A-2 | |
Preferred Trust Securities | | BBB+ | | Baa2 | | BBB | |
| | | | | | | |
CG&E | | | | | | | |
| Senior Secured Debt | | A- | | A3 | | A- | |
| Senior Unsecured Debt | | BBB+ | | Baa1 | | BBB+BBB | |
| Junior Unsecured Debt | | BBB | | Baa2 | | BBBBBB- | |
| Preferred Stock | | BBB | | baa1Baa3 | | BBBBBB- | |
| Commercial Paper | | F-2 | | P-2 | | Not Rated | |
PSI | | | | | | | |
PSI | | | | | | | |
Senior Secured Debt | | A- | | A3 | | A- | |
| Senior Unsecured Debt | | BBB+ | | Baa1 | | BBB+BBB | |
| Junior Unsecured Debt | | BBB | | Baa2 | | BBBBBB- | |
| Preferred Stock | | BBB | | baa1Baa3 | | BBBBBB- | |
| Commercial Paper | | F-2 | | P-2 | | Not Rated | |
| | | | | | | |
ULH&P | | | | | | | |
| Senior Unsecured Debt | | Not RatedBBB+ | | Baa1 | | BBB+BBB | |
(1)
During 2000, Fitch IBCA, Inc. and Duff & Phelps Credit Rating Co. merged, and are now known as Fitch, thereby combining their ratings ofCinergy Corp. and its affiliates.- Ratings (Fitch)
(2)
Moody's Moody’s Investors Service (Moody's)- (Moody’s)
(3)
- Standard &
Poor'sPoor’s Ratings Services (S&P)
On December 12, 2000,
The highest investment grade credit rating for Fitch is AAA, Moody’s is Aaal, and S&P placed its ratings ofCinergy Corp.is AAA.
The lowest investment grade credit rating for Fitch is BBB-, Moody’s is Baa3, and its operating affiliates,CG&E andPSI, on CreditWatch with negative implications. On January 22, 2001, Moody's announced it had assigned negative outlooksS&P is BBB-.
A security rating is not a recommendation to the debt and preferred stock securities ofCinergy Corp. and all of its subsidiaries. These actions are primarily in response toCinergy's announcement regarding one of its
non-regulated subsidiaries entering into a definitive agreement to acquire two natural gas-fired merchant electric generating facilities from Enron (as further discussed in the "Wholesale Market Developments" section of "Item 7. Management's Discussion and Analysis of Financial Condition and Results of Operations"). Other items of concern include (1) the announcement thatCinergy Corp.,CG&E, andPSI have reached an agreement in principle with the EPA; (2) the continuing uncertainty surroundingCG&E's post-deregulation corporate and financial structure; (3) the absence of restructuring legislation and stranded investment resolution in Indiana; and (4) Cinergy's emphasis on higher-risk non-regulated activities.
buy, sell, or hold securities. These securities ratings may be revised or withdrawn at any time, and each rating should be evaluated independently of any other rating.
EquityGuarantees
We are subject to a SEC order underUnder the PUHCA, which limits the amountsSEC’s June 2000 Order, Cinergy Corp. can have outstanding under guarantees (promises is permitted to payincrease its total capitalization by one party in the event of default by another party) at$5 billion (as previously discussed). The proceeds from any one time to $2 billion. As of December 31, 2000, we had $1.4 billion outstanding under the guarantees issued. This amount representsnew issuances will be used for general corporate purposes.
Cinergy Corp.'s guarantees of liabilitiesissued approximately 3.9 million shares in 2004 and commitments of our consolidated subsidiaries, unconsolidated subsidiaries,approximately 4.6 million shares in 2003 to satisfy its obligations under its various employee stock plans and joint ventures.the Cinergy Corp.
Sale of Accounts Receivable
Direct Stock Purchase and Dividend Reinvestment Plan.
For
In January 2003, Cinergy Corp. filed a shelf registration statement with the detailed discussionSEC with respect to the issuance of our salescommon stock, preferred stock, and other securities in an aggregate offering amount of accounts receivable, refer$750 million. In February 2003, Cinergy issued 5.7 million shares of common stock of Cinergy Corp. with net proceeds of approximately $175 million under this registration statement. The net proceeds from this transaction were used to reduce short-term debt of Cinergy Corp. and for other general corporate purposes. In December 2004, Cinergy Corp. issued 6.1 million shares of common stock with net proceeds of approximately $247 million, which were used to reduce short-term debt.
In May and August of 2003, Cinergy Corp. contributed $200 million in capital to PSI in two separate $100 million capital contributions to support PSI’s current credit ratings.
In January and February 2005, Cinergy Corp. issued a total of 9.2 million shares of common stock pursuant to certain stock purchase contracts that were issued as a component of combined securities in December 2001. Net proceeds from the transaction of approximately $316 million were used to reduce short-term debt. See
66
Note 63(b) of the "Notes“Notes to Financial Statements"Statements” in "Item“Item 8. Financial Statements and Supplementary Data".
The Results of Operations discussionsData” forCinergy,CG&E, andPSI are combined within this section.
2000 RESULTS OF OPERATIONS
SUMMARY OF RESULTS
Electric and gas margins and net income forCinergy,CG&E, andPSI for the years ended December 31, 2000, and 1999, were as follows:
| | Cinergy(1)
| | CG&E
| | PSI
|
|---|
| | 2000
| | 1999
| | 2000
| | 1999
| | 2000
| | 1999
|
|---|
| | (in thousands)
|
|---|
| Electric gross margin | | $ | 2,229,869 | | $ | 2,052,602 | | $ | 1,183,816 | | $ | 1,108,371 | | $ | 959,541 | | $ | 922,053 |
| Gas gross margin | | | 267,304 | | | 212,153 | | | 224,633 | | | 204,016 | | | — | | | — |
| Net income | | | 399,466 | | | 403,641 | | | 266,820 | | | 233,576 | | | 135,398 | | | 117,199 |
(1)The results ofCinergy also include amounts related to non-registrants.
Our diluted earnings per share (EPS) for the year ended December 31, 2000, were $2.50 per share, as compared to $2.53 per share for the year ended December 31, 1999, mainly due to a decrease in contributions from our international operations, offset by increased earnings in our regulated business.
The contribution to earnings of our international operations decreased $.70 per share for the year ended December 31, 2000, as compared to last year, primarily due to the loss of equity earnings and resulting gain from the sale of our share of Midlands, which took place in July 1999. For further details regarding this transaction, refer to Note 10 of the "Notes to Financial Statements" in "Item 8. Financial Statements and Supplementary Data". Earnings from our regulated operations had a net increase of $.66 per share for the year 2000 compared with 1999. This increase was primarily attributable to growth in electric margins and continued improvement in our commodity supply business. Growth in residential, commercial, and industrial customer bases, along with improvements in cost of sales, were somewhat offset by the effects of milder weather experienced during 2000.
Partially offsetting the overall increase in regulated operations were one-time charges totaling $.11 per share related to a tentative agreement with the EPA and a limited early retirement program offered in 2000 as part of a corporate restructuring initiative.
The explanations below follow the line items on the Statements of Income forCinergy,CG&E, andPSI. However, only the line items that varied significantly from prior periods are discussed.
ELECTRIC OPERATING REVENUES
| | Cinergy(1)
| | CG&E
| | PSI
| |
|---|
| | 2000
| | 1999
| | % Change
| | 2000
| | 1999
| | % Change
| | 2000
| | 1999
| | %
Change
| |
|---|
| | (in millions)
| |
|---|
| Retail | | $ | 2,692 | | $ | 2,725 | | (1 | ) | $ | 1,482 | | $ | 1,468 | | 1 | | $ | 1,210 | | $ | 1,258 | | (4 | ) |
| Wholesale | | | 2,464 | | | 1,455 | | 69 | | | 1,226 | | | 687 | | 78 | | | 1,443 | | | 840 | | 72 | |
| Other | | | 228 | | | 133 | | 71 | | | 31 | | | 20 | | 55 | | | 31 | | | 38 | | (18 | ) |
| | |
| |
| | | |
| |
| | | |
| |
| | | |
| | Total | | $ | 5,384 | | $ | 4,313 | | 25 | | $ | 2,739 | | $ | 2,175 | | 26 | | $ | 2,684 | | $ | 2,136 | | 26 | |
(1)The results ofCinergy also include amounts related to non-registrants.
Electric operating revenues forCinergy,CG&E, andPSI increased for the year ended December 31, 2000, as compared to 1999, mainly due to an increase in volumes and the average price per megawatt hour (MWh) realized on non-firm wholesale transactions related to the commodities supply business. Non-firm power is power without a guaranteed commitment for physical delivery.
The increase in other electric operating revenues forCinergy primarily reflects marketing activities of Cinergy Capital and Trading, Inc., aCinergy non-regulated affiliate.
GAS OPERATING REVENUES
| | Cinergy(1)
| | CG&E and subsidiaries
|
|---|
| | 2000
| | 1999
| | % Change
| | 2000
| | 1999
| | % Change
|
|---|
| | (in millions)
|
|---|
| Non-regulated | | $ | 2,452 | | $ | 1,221 | | 101 | | $ | — | | $ | — | | — |
| Retail | | | 429 | | | 320 | | 34 | | | 429 | | | 320 | | 34 |
| Transportation | | | 56 | | | 51 | | 10 | | | 56 | | | 51 | | 10 |
| Other | | | 5 | | | 4 | | 25 | | | 6 | | | 5 | | 20 |
| | |
| |
| | | |
| |
| | |
| Total | | $ | 2,942 | | $ | 1,596 | | 84 | | $ | 491 | | $ | 376 | | 31 |
(1)The results ofCinergy also include amounts related to non-registrants.
Gas operating revenues forCinergy increased in 2000, when compared to 1999, primarily as a result of a higher price realized per thousand cubic feet (mcf) sold by our commodity supply business.
CG&E's retail gas revenues increased primarily due to a higher price realized per mcf sold. Transportation revenues increased due to the continued trend of full-service customers (customers who purchase gas and utilize the transportation services ofCG&E) purchasing gas directly from other suppliers.
The market price of natural gas has increased significantly in 2000, which has causedCG&E to pay more for the gas they deliver to customers. The wholesale gas commodity cost is passed directly to the retail customer dollar-for-dollar under the gas cost recovery mechanism that is mandated under state law.
OTHER REVENUES
Other operating revenues forCinergy increased $67 million for 2000, when compared to 1999, primarily due to revenues resulting from the acquisition of an energy-related services affiliate in late 1999.
OPERATING EXPENSES
| | Cinergy(1)
| | CG&E and subsidiaries
| | PSI
|
|---|
| | 2000
| | 1999
| | % Change
| | 2000
| | 1999
| | % Change
| | 2000
| | 1999
| | % Change
|
|---|
| | (in millions)
|
|---|
| Fuel | | $ | 773 | | $ | 761 | | 2 | | $ | 344 | | $ | 341 | | 1 | | $ | 407 | | $ | 397 | | 3 |
Purchased and exchanged
power | | | 2,382 | | | 1,499 | | 59 | | | 1,211 | | | 726 | | 67 | | | 1,318 | | | 817 | | 61 |
| Gas purchased | | | 2,674 | | | 1,384 | | 93 | | | 266 | | | 172 | | 55 | | | — | | | — | | — |
| Operation and maintenance | | | 1,089 | | | 981 | | 11 | | | 463 | | | 416 | | 11 | | | 462 | | | 461 | | — |
Depreciation and
amortization | | | 374 | | | 354 | | 6 | | | 210 | | | 204 | | 3 | | | 143 | | | 136 | | 5 |
Taxes other than income
taxes | | | 268 | | | 266 | | 1 | | | 208 | | | 212 | | (2 | ) | | 57 | | | 53 | | 8 |
| | |
| |
| | | |
| |
| | | |
| |
| | |
| Total | | $ | 7,560 | | $ | 5,245 | | 44 | | $ | 2,702 | | $ | 2,071 | | 30 | | $ | 2,387 | | $ | 1,864 | | 28 |
(1)The results ofCinergy also include amounts related to non-registrants.
Fuel
Fuel represents the cost of coal, natural gas, and oil that is used to generate electricity. The following table details the changes to fuel expense from 1999 to 2000:
| | Cinergy(1)
| | CG&E and
subsidiaries
| | PSI
| |
|---|
| | (in millions)
| |
|---|
| 1999 fuel expense | | $ | 761 | | $ | 341 | | $ | 397 | |
| Increase (Decrease) due to changes in: | | | | | | | | | | |
| Price of fuel | | | (14 | ) | | (12 | ) | | (2 | ) |
| Deferred fuel cost | | | (17 | ) | | 9 | | | (26 | ) |
| MWh generation | | | 44 | | | 6 | | | 38 | |
| Other | | | (1 | ) | | — | | | — | |
| | |
| |
| |
| |
| 2000 fuel expense | | $ | 773 | | $ | 344 | | $ | 407 | |
(1)The results ofCinergy also include amounts related to non-registrants.
Purchased and Exchanged Power
Purchased and exchanged power expense increased forCinergy,CG&E, andPSI for 2000, when compared to 1999. This increase was primarily due to an increase in purchases of non-firm wholesale power as a result of an increase in sales volumes from our commodity supply business.
Gas Purchased
Gas purchased expense increased forCinergy in 2000, when compared to 1999, primarily due to increased gas commodity trading activity of one of its non-regulated subsidiaries and, for bothCinergy andCG&E, an increase in the average cost per mcf of gas purchased.
Operation and Maintenance
Cinergy'sOperation and maintenance expenses increased in 2000, in comparison to 1999, primarily due to a full year's realization of operating expenses resulting from the acquisition of an energy-related
services affiliate in late 1999. Additionally for 2000, operation expenses increased forCinergy,CG&E, andPSI as a result of one-time charges related to a tentative agreement reached with the EPA and a limited early retirement plan offered as part of a corporate restructuring initiative.
Depreciation and Amortization
Cinergy's,CG&E's, andPSI'sDepreciation and amortization costs increased in 2000, as compared to 1999, due to additions to depreciable plant.
EQUITY IN EARNINGS OF UNCONSOLIDATED SUBSIDIARIES
Cinergy'sEquity in earnings of unconsolidated subsidiaries decreased $53 million in 2000, as compared to 1999. This decrease is primarily due to the loss in earnings resulting from the July 1999 sale of our 50% ownership interest in Midlands. For further information see Note 10 of the "Notes to the Financial Statements" in "Item 8. Financial Statements and Supplementary Data".
INTEREST
PSI'sInterest expense decreased $8 million in 2000, as compared to 1999. This decrease is primarily due toPSI's net redemption of approximately $130 million of long-term debt during the year, which was slightly offset by an increase in average short-term interest rates.
ULH&P
The Results of Operations discussion forULH&P is presented only for the year ended December 31, 2000, in accordance with General Instructions I(2)(a).
Electric and gas margins and net income forULH&P for the years ended December 31, 2000, and 1999 were as follows:
| | ULH&P
|
|---|
| | 2000
| | 1999
|
|---|
| | (in thousands)
|
|---|
| Electric gross margin | | $ | 65,686 | | $ | 51,678 |
| Gas gross margin | | | 40,359 | | | 36,038 |
| Net income | | | 24,632 | | | 12,274 |
The increase in electric gross margin is primarily due to the effects of a Federal Energy Regulatory Commission (FERC) wholesale rate case that became effective during 2000. For further information see Note 12 of the "Notes to Financial Statements" in "Item 8. Financial Statements and Supplementary Data". Gas gross margin increased primarily as a result of an increase in volumes sold.
The increase inOperation and maintenance costs for the year ended December 31, 2000, as compared to 1999, was primarily the result of expenses related to a water main break in Newport, Kentucky, on October 5, 2000, that resulted in damage to our gas main.
The increase inDepreciation for the year ended December 31, 2000, as compared to 1999, was due to additions to depreciable plant.
1999 RESULTS OF OPERATIONS
SUMMARY OF RESULTS
Electric and gas margins and net income forCinergy,CG&E, andPSI for the years ended December 31, 1999, and 1998, were as follows:
| | Cinergy(1)
| | CG&E
| | PSI
|
|---|
| | 1999
| | 1998
| | 1999
| | 1998
| | 1999
| | 1998
|
|---|
| | (in thousands)
|
|---|
| Electric gross margin | | $ | 2,052,602 | | $ | 1,909,423 | | $ | 1,108,371 | | $ | 1,045,556 | | $ | 922,053 | | $ | 855,527 |
| Gas gross margin | | | 212,153 | | | 204,684 | | | 204,016 | | | 203,748 | | | — | | | — |
| Net income | | | 403,641 | | | 260,968 | | | 233,576 | | | 215,812 | | | 117,199 | | | 52,038 |
(1)The results ofCinergy also include amounts related to non-registrants.
Our 1999 diluted EPS increased to $2.53 from $1.65 per share for 1998.
The overall increase in EPS for 1999 was mainly due to our international operations and our regulated electric operations. The contribution to earnings of our international operations increased $.36 per share for the year ended December 31, 1999, compared with 1998, primarily the result of the sale of our 50% ownership interest in Midlands. Earnings from regulated operations had a net increase of $.55 per share for the year ended December 31, 1999, compared with a year earlier. The increase was primarily due to an overall return to more normal weather in 1999 and growth in retail electric revenues. This retail revenue growth reflected an increase in residential and commercial customers and growth in the industrial market. Included in this overall increase was a $.36 per share reduction related to energy marketing and trading losses experienced in July 1999. Our electric margins were positively impacted $12 million or $.07 per share (net of fuel and income taxes) as a result of a change in estimate ofPSI's utility services delivered but unbilled at month end which occurred during the third quarter of 1999.
The 1999 increase in earnings from regulated operations was also impacted by the following 1998 charges:
•a reduction of $.14 per share for the effects of milder than normal weather;•a charge of $.32 per share related to a settlement with Wabash Valley Power Association, Inc. (WVPA). See Note 17 of the "Notes to Financial Statements" in "Item 8. Financial Statements and Supplementary Data" for a discussion of the WVPA settlement; and•total chargessecurities.Dividend Restrictions
Cinergy Corp.’s ability to pay dividends to holders of $.54 per share due to losses related to our energy marketing and trading activity.
The explanations below follow the line itemsits common stock is principally dependent on the Statementsability of Income forCinergy,CG&E, andPSI. However, only the line items that varied significantly from prior periods are discussed.
ELECTRIC OPERATING REVENUES
| | Cinergy(1)
| | CG&E
| | PSI
| |
|---|
| | 1999
| | 1998
| | % Change
| | 1999
| | 1998
| | % Change
| | 1999
| | 1998
| | %
Change
| |
|---|
| | (in millions)
| |
|---|
| Retail | | $ | 2,725 | | $ | 2,553 | | 7 | | $ | 1,468 | | $ | 1,392 | | 5 | | $ | 1,258 | | $ | 1,161 | | 8 | |
| Wholesale | | | 1,455 | | | 2,140 | | (32 | ) | | 687 | | | 1,046 | | (34 | ) | | 840 | | | 1,206 | | (30 | ) |
| Other | | | 133 | | | 70 | | 90 | | | 20 | | | 15 | | 33 | | | 38 | | | 36 | | 6 | |
| | |
| |
| | | |
| |
| | | |
| |
| | | |
| Total | | $ | 4,313 | | $ | 4,763 | | (9 | ) | $ | 2,175 | | $ | 2,453 | | (11 | ) | $ | 2,136 | | $ | 2,403 | | (11 | ) |
(1)The results of to pay Cinergy Corp. also include amounts related to non-registrants.
Electric operating revenues for dividends on their common stock. Cinergy Corp.,CG&E, andPSI cannot pay dividends on their common stock if their respective preferred stock dividends or preferred trust dividends are in arrears. The amount of common stock dividends that each company can pay is also limited by certain capitalization and earnings requirements under decreased for 1999, as comparedCG&E’s and PSI’s credit instruments. Currently, these requirements do not impact the ability of either company to 1998, due to a decrease in volumespay dividends on non-firm wholesale transactions related to energy marketing and trading activity. Partially offsetting the decline was an increase in the average price per MWh realized for non-firm power transactions and higher firm wholesale MWh sales. Non-firm power is power without a guaranteed commitment for physical delivery. Retail MWh sales also increased as a result of new residential and commercial customers, growth in the industrial market, and an overall return to more normal weather. Our electric margins were positively impacted $12 million or $.07 per share (net of fuel and income taxes) as a result of a change in estimate ofPSI's utility services delivered but unbilled at month end which occurred during the third quarter of 1999.
GAS OPERATING REVENUES
| | Cinergy(1)
| | CG&E and subsidiaries
| |
|---|
| | 1999
| | 1998
| | % Change
| | 1999
| | 1998
| | % Change
| |
|---|
| | (in millions)
| |
|---|
| Non-regulated | | $ | 1,221 | | $ | 698 | | 75 | | $ | — | | $ | — | | — | |
| Retail | | | 320 | | | 357 | | (10 | ) | | 320 | | | 357 | | (10 | ) |
| Transportation | | | 51 | | | 41 | | 24 | | | 51 | | | 41 | | 24 | |
| Other | | | 4 | | | 4 | | — | | | 5 | | | 5 | | — | |
| | |
| |
| | | |
| |
| | | |
| Total | | $ | 1,596 | | $ | 1,100 | | 45 | | $ | 376 | | $ | 403 | | (7 | ) |
(1)The results ofCinergy also include amounts related to non-registrants.
Gas operating revenues forCinergy increased in 1999, when compared to 1998. This increase reflected a full year's realization of the gas operating revenues of Cinergy Marketing and Trading, LLC (Marketing & Trading), an indirect subsidiary ofCinergy that was acquired in June 1998. Based on the actual results of Marketing & Trading for 1998, if we had owned it for all of 1998, our 1999 revenues, as compared to 1998, would have increased due to a higher price received per mcf sold.its common stock.
CG&E'sOther retail gas revenues decreased due
Where subject to a decline in mcf sales. This resulted primarily from milder weather experienced duringrate regulations, our utility operating companies have the first quarter of 1999. This decline was partially offset by an increase in transportation revenues dueability to the continued progression of full-service customers (customers who purchase gastimely recover certain cash outlays through various regulatory mechanisms.
As opportunities arise, we will continue to monetize certain non-core investments, which would include our international assets and utilize the transportation services ofCG&E) purchasing gas directly from suppliers and using transportation services provided byCG&E.
OPERATING EXPENSES
| | Cinergy(1)
| | CG&E and subsidiaries
| | PSI
| |
|---|
| | 1999
| | 1998
| | % Change
| | 1999
| | 1998
| | % Change
| | 1999
| | 1998
| | % Change
| |
|---|
| | (in millions)
| |
|---|
| Fuel | | $ | 761 | | $ | 730 | | 4 | | $ | 341 | | $ | 339 | | 1 | | $ | 397 | | $ | 382 | | 4 | |
Purchased and exchanged
power | | | 1,499 | | | 2,124 | | (29 | ) | | 726 | | | 1,068 | | (32 | ) | | 817 | | | 1,166 | | (30 | ) |
| Gas purchased | | | 1,384 | | | 895 | | 55 | | | 172 | | | 200 | | (14 | ) | | — | | | — | | — | |
Operation and
maintenance | | | 981 | | | 976 | | — | | | 416 | | | 393 | | 6 | | | 461 | | | 509 | | (9 | ) |
Depreciation and
amortization | | | 354 | | | 326 | | 9 | | | 204 | | | 191 | | 7 | | | 136 | | | 131 | | 4 | |
Taxes other than income
taxes | | | 266 | | | 275 | | (3 | ) | | 212 | | | 217 | | (2 | ) | | 53 | | | 54 | | (2 | ) |
| | |
| |
| | | |
| |
| | | |
| |
| | | |
| Total | | $ | 5,245 | | $ | 5,326 | | (2 | ) | $ | 2,071 | | $ | 2,408 | | (14 | ) | $ | 1,864 | | $ | 2,242 | | (17 | ) |
(1)The results ofCinergy also include amounts related to non-registrants.
Fuelother technology investments.
Fuel represents the cost of coal, natural gas, and oil that is used to generate electricity. The following table details the changes to fuel expense from 1998 to 1999:
| | Cinergy(1)
| | CG&E and
subsidiaries
| | PSI
| |
|---|
| |
| | (in millions)
| |
| |
|---|
| 1998 fuel expense | | $ | 730 | | $ | 339 | | $ | 382 | |
| Increase (Decrease) due to changes in: | | | | | | | | | | |
| Price of fuel | | | — | | | 4 | | | (5 | ) |
| Deferred fuel cost | | | (10 | ) | | (15 | ) | | 5 | |
| MWh generation | | | 28 | | | 13 | | | 15 | |
| Other | | | 13 | | | — | | | — | |
| | |
| |
| |
| |
| 1999 fuel expense | | $ | 761 | | $ | 341 | | $ | 397 | |
(1)The results ofCinergy also include amounts related to non-registrants.
Purchased and Exchanged Power
�� Purchased and exchanged power is the electricity that is bought to be sold through our energy marketing and trading activities.Purchased and exchanged power is also occasionally purchased forPSI's andCG&E's retail customers. This expense decreased forCinergy,CG&E, andPSI in 1999. This decrease was primarily due to a reduction in purchases of non-firm wholesale power as a result of a decline in sales volume in the energy marketing and trading operations.67
Included in purchased and exchanged power are additional costs related to energy marketing and trading losses experienced in July 1999, as previously indicated above in "Summary of Results", as well as losses related to our 1998 energy marketing and trading activity.
Gas Purchased
Gas purchased expense increased forCinergy in 1999, when compared to 1998. This increase primarily reflected a full year'sGas purchased volumes for Marketing & Trading in 1999, as previously indicated above in "Gas Operating Revenues".
CG&E'sGas purchased expense decreased for 1999, as compared to 1998. This decline was mainly due to decreased sales volumes as previously indicated above in "Gas Operating Revenues".
Operation and Maintenance
PSI'sOperation costs decreased in 1999, in comparison to 1998. This decrease was the result of a one-time charge of $80 million in 1998 for the implementation of the 1989 settlement with WVPA. See Note 17 of the "Notes to Financial Statements" in "Item 8. Financial Statements and Supplementary Data" for a discussion of the WVPA settlement.
Cinergy's,CG&E's, andPSI'sMaintenance costs increased in 1999, as compared to 1998, primarily as a result of planned outages and repairs at certain production facilities. These activities represented a return to a more normal level of maintenance expenditures.
Depreciation and Amortization
Cinergy's,CG&E's, andPSI'sDepreciation and amortization costs increased in 1999, as compared to 1998. These increases were the result of additions to depreciable plant. Additionally,Cinergy's andCG&E's increases also included the amortization of phase-in deferrals reflecting the Public Utilities Commission of Ohio (PUCO)-approved phase-in plan forCG&E's William H. Zimmer Station.
EQUITY IN EARNINGS OF UNCONSOLIDATED SUBSIDIARIES
Cinergy'sEquity in earnings of unconsolidated subsidiaries increased $7 million in 1999, as compared to 1998. This increase was primarily driven by the earnings of our non-regulated domestic and international subsidiaries. Included inEquity in earnings of unconsolidated subsidiaries was $58 million for 1999, and $57 million for 1998, related to our 50% ownership interest in Midlands. For further information see Note 10 of the "Notes to the Financial Statements" in "Item 8. Financial Statements and Supplementary Data".
GAIN ON SALE OF INVESTMENT IN UNCONSOLIDATED SUBSIDIARY
On July 15, 1999, we sold our 50% ownership interest in Midlands, as previously indicated above in "Summary of Results." The sale resulted in a net contribution to earnings of approximately $.43 per share (basic and diluted). For a further discussion of this transaction, see Note 10 of the "Notes to Financial Statements" in "Item 8. Financial Statements and Supplementary Data".
PREFERRED DIVIDEND REQUIREMENTS
Cinergy'sPreferred dividend requirements of subsidiaries andPSI'sPreferred dividend requirement each decreased $1 million for 1999, as compared to 1998. These decreases were attributable toPSI's redemption of all outstanding shares of its 7.44% Series Cumulative Preferred Stock on March 1, 1998.
MD&A - FUTURE EXPECTATIONS/TRENDS
In the "Future“Future Expectations/Trends"Trends” section, we discuss developments in the electric and gas industry developments, market risk sensitive instruments and positions, accounting changes, and the shareholder rights plan.other matters. Each of these discussions will address the current status and potential future impact on our financial position or results of operationsoperations.
ELECTRIC INDUSTRY
Regulatory Outlook and financial condition.
ELECTRIC INDUSTRY
The utility industry has traditionally operated as a regulated monopoly but is transitioning to an environment of increased wholesale and retail competition. Regulatory and legislative decisions being made at the federal and state levels are aimed at promoting customer choice and are shaping this transition. Customer choice provides the customer the ability to select an energy supplier (the company that generates or supplies the commodity) in an open and competitive marketplace. This emerging environment presents significant challenges, which are discussed below.
Wholesale Market Developments
In 1996, the FERC issued orders to open the wholesale electric markets to competition. Competitors within the wholesale market include both utilities and non-utilities such as exempt wholesale generators, independent power producers, and power marketers. We are involved in wholesale power marketing and trading through Commodities.
In late June 1998, and again in late July 1999, Midwest wholesale electric power markets experienced record price spikes. These spikes were caused by a number of factors including unseasonably hot weather, unplanned generating unit outages, transmission constraints, and increased electric commodity market volatility. These simultaneous events created temporary but extreme prices in the Midwest electricity markets. In response to these events, we have aggressively adopted a model that is focused on a balance of customers and supply.
Supply-side Actions On September 30, 1999, one of our non-regulated subsidiaries formed a partnership (each party having a 50 percent ownership) with Duke Energy North America LLC (Duke), to increase the available generating capacity for use during peak demand periods. The partnership was formed for the purpose of jointly constructing and owning three wholesale generating facilities.
On March 9, 2000, the Indiana Utility Regulatory Commission (IURC) issued an order, requiring the partnership to immediately suspend all construction activities at the site located near Cadiz, (Henry County) Indiana (a peaking plant with a total capacity of 129 MW, of which we own 65 MW). In making this decision the IURC found that it needed additional information related to the project before issuing a final decision. The IURC requested the Henry County Planning Commission and/or the Henry County Commissioners to supply additional information, which was provided on June 1, 2000. The issues raised were air quality, water supply, noise control, landscaping, plant abandonment, and emergency services training. During the third quarter of 2000, the partnership filed responses to the issues indicating how it would address these concerns. The IURC held a hearing on this matter on November 17, 2000, and a ruling is expected in the first half of 2001. Although we expect a favorable ruling from the IURC, at this timeCinergy cannot predict the outcome of this matter.
The remaining two facilities became fully operational in June 2000. The total capacity of these operational plants is approximately 1,280 MW.
On December 12, 2000,Cinergy announced that one of its non-regulated affiliates entered into a definitive agreement with Enron to acquire two natural gas-fired merchant electric generating facilities. The acquisition will consist of a 494 MW facility in Tennessee and a 504 MW facility in Mississippi.
Cinergy's portfolio of natural gas-fired peaking stations has increased due to the partnership with Duke and the pending consummation of the acquisition of the Enron units.CG&E andPSI also have an additional 856 MW of capacity that are natural gas-fired. These units are used to meet the demand for electric commodity in periods of high electric use by our customers. In the latter part of 2000 natural gas was selling at record prices. If it is necessary forCinergy to call upon the use of our natural gas-fired peakers, the cost of natural gas will directly affectCinergy's cost to supply the electric commodity to our customers.
Demand-side Actions Demand (the amount of electric power that can be used at a point in time) on our system is expected to be reduced in future years as a result of the expiration of existing wholesale contractual obligations and peak load management initiatives which we have recently developed. Also, Ohio's recently enacted customer choice legislation contemplates that 20% ofCG&E's retail load will switch to alternative suppliers by December 2003. In its approved transition plan,CG&E indicated that it currently has no plans to replace these customers by acquiring new retail customers, althoughCG&E reserved the flexibility to replace load in the wholesale market to the extent it chooses. For a further discussion on Ohio deregulation, see Note 18 of the "Notes to Financial Statements" in "Item 8. Financial Statements and Supplementary Data".
Retail MarketSignificant Rate Developments
Currently, regulatory and legislative initiatives shaping the transition to a competitive retail market are the responsibilities of the individual states. Many states, including Ohio, have enacted electric utility deregulation legislation. In general, these initiatives have sought to separate the electric utility service into its basic components (generation, transmission, and distribution) and offer each component separately for sale. This separation is referred to as unbundling of the integrated services. Under the customer choice initiatives,initiative in Ohio, we will continue to transmit and distribute electricity; however, the customer can purchase electricity from any available supplier and we will be compensated by a charge to use our transmission assets.certified supplier. The following sections further discuss the current status of deregulation legislation and other significant regulatory developments in the states of Ohio, Indiana, and Kentucky, each of which includesencompass our utility service territories.
Ohio
CG&E is in a portion of our service territory.
Federal Update The Clinton Administrationmarket development period for residential customers and Congress made attempts to legislate comprehensive electric industry restructuring during the past four years. After attempting to reach a consensus on comprehensive electric restructuring legislation, the U.S. Senate, on June 30, 2000, approved S. 2071, the Electric Reliability 2000 Act. The S. 2071 would have authorized the establishment of a North American Electric Reliability Organization and did not legislate on additional issues surrounding the restructuring of the electric industry. President Bush has indicated that legislation addressing the energy security needs of America, deserves prompt consideration. The start of a new congressional session and presidential administration makes comprehensive electric industry deregulation uncertain in the near future.
Ohio On July 6, 1999, Ohio Governor Robert Taft signed Amended Substitute Senate Bill No. 3 (Electric Restructuring Bill), beginning the transitioncompetitive retail electric market for non-residential customers, transitioning to deregulation of electric deregulationgeneration and customer choice fora competitive retail electric service market in the state of Ohio. The Electric Restructuring Bill created a competitive electric retail service market effective January 1, 2001. The legislation provided for a market development (frozen rate) period that began January 1, 2001, and ends no later thanended December 31, 2005. Ohio electric utilities have an opportunity2004 for non-residential customers and is scheduled to recover PUCO-approved transition costs during a transition period. The legislation also froze retail electricend December 31, 2005 for residential customers.
CG&E made multiple rate filings in 2003 with the PUCO seeking approval of CG&E’s methodology for establishing market-based rates duringfor generation service at the end of the market development period at the rates in effect on October 4, 1999, except for a five-percent reductionand to recover investments made in the generation component of residential rates. Furthermore,transmission and distribution system. The PUCO requested in these proceedings that CG&E propose a RSP to mitigate the legislation contemplated that 20%potential for significant rate increases when the market development period comes to an end. In January 2004, CG&E filed its proposed RSP. In May 2004, CG&E entered into a settlement agreement with many of the current electric retail customers will switch suppliers no later than December 31, 2003.parties to these proceedings requesting that the PUCO approve a modified version of the RSP. In September 2004, the PUCO issued an order seeking to modify several key provisions of this settlement and as a result of these modifications, CG&E filed a petition for rehearing in October 2004. The PUCO approved a modified version of the plan in November 2004, the major features of which are as follows:
On May 8, 2000,•Provider of Last Resort (POLR) Charge:CG&E reached will begin to collect a stipulated agreement with the PUCO staff and various other interested parties with respect to its proposal to implement electric customer choice in OhioPOLR charge from non-residential customers effective January 1, 2001. On August 31, 2000, the PUCO approvedCG&E's stipulation agreement. The major features of this agreement include:
•Residential customer rates will be frozen through December 31, 2005;•Residential2005, and from residential customers will receive a five-percent reduction in the generation portion of their electric rates, effective January 1, 2001;
•- 2006. The POLR charge includes several discrete charges, the most significant being an annually adjusted component (AAC) intended to provide cost recovery primarily for environmental compliance expenditures; an infrastructure maintenance fund charge (IMF) intended to provide compensation to CG&E
has agreed for committing its physical capacity to meet its POLR obligation; anda system reliability tracker (SRT) intended to provide fourcost recovery for capacity purchases, purchased power, reserve capacity, and related market costs for purchases to meet capacity needs. We anticipate the collection of the AAC and IMF will result in an approximate $36 million dollars overincrease in revenues in 2005 and an additional $50 million in 2006. The SRT will be billed based on dollar-for-dollar costs incurred. A portion of these charges are avoidable by certain customers who switch to an alternative generation supplier. Therefore, these estimates are subject to change, depending on the next five yearslevel of switching that occurs in support of energy efficiencyfuture periods. In 2007 and weatherization services for low income customers; •The creation of a Regulatory Transition Charge, designed to recoverCG&E's regulatory assets and other transition costs over a ten-year period;•Authority for2008, CG&E could seek additional increases in the AAC component of the POLR based on to transfer itsCG&E’s actual net costs for the specified expenditures.•Generation Rates and Fuel Recovery: A new rate has been established for generation assets to one or more separate, non-regulated corporate subsidiary(ies) to provide flexibility to manage its generation asset portfolio inservice after the market development period ends. In addition, a manner that enhances opportunities in a competitive marketplace;
•Authority forCG&E to apply the proceeds of transitionfuel cost recovery mechanism will be established to recover costs incurred during the transition period including implementation costsfor fuel, emission allowances, and certain purchased power costs, that may be incurred byexceed the amount originally included in the rates frozen in the CG&E transition plan. These new rates will apply to68
non-residential customers beginning January 1, 2005 and to maintain an operating reserve margin sufficient to provide reliable service to its customers;residential customers beginning January 1, 2006.
•
Generation Rate Reduction: The existing five percent generation rate reduction required by statute for residential customers implemented under CG&E’s 2000 plan will end on December 31, 2005.•
Transmission Cost Recovery: Transmission cost recovery mechanisms will be established beginning January 1, 2005 for non-residential customers and January 1, 2006 for residential customers. The transmission cost recovery mechanisms will permit CG&E will provide standard offer default supplier to recover Midwest ISO charges, all FERC approved transmission costs, and all congestion costs allocable to retail ratepayers that are provided service (i.e.,by CG&E.•Distribution Cost Recovery: CG&E will have the ability to defer certain capital-related distribution costs from July 1, 2004 through December 31, 2005 with recovery from non-residential customers to be provided through a rider beginning January 1, 2006 through December 31, 2010.
CG&E will be the supplier of last resort, so that no customer will be withouthad also filed an electric supplier);distribution base rate case for residential and
•CG &E has agreed non-residential customers to provide shopping credits to switching customers. With regard tobe effective January 1, 2005. Under the PUCO's order, two parties filed applications for rehearing with the PUCO. On October 18, 2000, the PUCO denied these applications. Oneterms of the parties appealed to the Ohio Supreme Court in the fourth quarter of 2000 andRSP described previously, CG&E subsequently intervened withdrew this base rate case and, in that case.February 2005, CG&E filed a new distribution base rate case with rates to become effective January 1, 2006. The requested amount of the increase is unableapproximately $78 million.
The RSP provides for rate recovery through December 31, 2008. Although it is difficult to predict, it is likely that any one of three scenarios could exist after the outcome of this appeal.rate stabilization period ends in 2008:
As previously discussed, the August 31, 2000 order authorizes•CG&E The legislation could be repealed or revised to transfer its generation assetsestablish a return to one or more non-regulated corporate subsidiary(ies). This transfer may require the approval or consent of one or more of the following: the IURC, the Kentucky Public Service Commission (KPSC), the FERC, the SEC under the PUHCA, and various third parties. As the transfer is contingent upon the company receiving various consents and approvals, the timing and receipt of which are unknown, the completion date of the transfer of generation assets to a non-regulated subsidiary is uncertain. See Note 1(c) of the "Notes to the Financial Statements" in "Item 8. Financial Statements and Supplementary Data" regarding the effects of the transition order.
In connection with its approved stipulation agreement,CG&E discontinued the application of Statement of Financial Accounting Standards No. 71,Accounting for the Effects of Certain Types of Regulation (Statement 71), for the generation portion of its business and adopted Statement of Financial Accounting Standards No. 101, Regulated Enterprises—Accounting for Discontinuation of Application of FASB Statement No. 71,with no material financial statement impact. Pursuant to Statement of Financial Accounting Standards No. 121,Accounting for the Impairment of Long-Lived Assets and for Long-Lived Assets to be Disposed Of, our analysis indicates future revenues will be sufficient to recover the costs of our generating assets over their estimated remaining lives.
Indiana Due to a "short session" in 2000, the Indiana General Assembly did not consider any electric deregulation initiatives. Electric industry deregulation is not expected to be addressed by the 2001 Indiana General Assembly. We will continue to work with the other Indiana investor-owned utilities in an effort to draft acceptable customer choice legislation. The outcome of this effort remains uncertain.
Kentucky Throughout 1999, a special Kentucky Electricity Restructuring Task Force (Task Force), convened by the Kentucky legislature, studied the issuesregulation of electric deregulation. In January 2000, the Task Force issuedgeneration;
• Deregulation and a final report to Kentucky Governor Paul Patton recommending that lawmakers wait until the 2002 General Assembly before considering any deregulation legislation that would open the state'scompetitive retail electric industry to competition.service market with market-based rates for all customer classes; or
Other States• Twenty-four states A hybrid of regulation and the District of Columbia have adopted deregulation plans. In response to the situation in California, some of these states, while not having similar experiences as California, are considering delaying or altering terms of implementation. A number of the remaining states are reconsidering their deregulation timetables. While we believe the situation in Ohio, asderegulation.
described above, and generally within the Midwest are different than California,
Although we cannot predict the consequences, ifregulatory outcome, we believe any of these scenarios could have a material impact on our financial position and results of operations. However, we believe that a return to efforts to deregulateregulation of electric generation would provide the remaining markets within our service territory. Indiana and Kentucky have not yet approved legislation.least volatility in ongoing results, although likely accompanied by less opportunity for growth in earnings.
Other
Under generally accepted accounting principles,PSI,In December 2004, CG&E filed an application with the PUCO requesting recovery of future costs of additional generating facilities in Ohio, for either construction of new electric generating facilities or the purchase of existing assets currently owned by others. CG&E would seek recovery of these costs over the lives of the assets. These investments are needed to meet ongoing load growth by customers receiving generation service from CG&E and would enable the company to reliably meet its obligation as the provider of last resort for customers returning to CG&E from alternate suppliers. To maintain flexibility in providing electric service at the lowest cost, CG&E is also seeking the authority to purchase existing capacity and power from other suppliers and to earn a return commensurate with the risk from these agreements.
Indiana
We are not aware of any current plans for electric deregulation in Indiana.
In May 2004, the IURC issued an order approving PSI’s base retail electric rate case, and PSI implemented base retail electric rate changes to its tariffs. When combined with revenue increases attributable to PSI’s environmental construction-work-in-progress tracking mechanism, the order results in an approximate $140 million increase in annual revenues. PSI’s original request for an approximate $180 million annual revenue increase was reduced by approximately $20 million for a lower return on equity, approximately $15 million of assumed profits included in base rates related to off-system sales (subject to future adjustment through a tracking mechanism and a 50/50 sharing agreement), andULH&P apply approximately $5 million of additional items. The order authorizes full recovery of all requested regulatory assets and an overall 7.3 percent return, including a 10.5 percent return on equity. In addition, the provisionsIURC’s order provides PSI the continuation of Statement 71a purchased power tracker and the establishment of new trackers for future NOX emission allowance costs and certain costs related to the applicable rate-regulated portionsMidwest ISO.
Cinergy is studying the feasibility of their businesses. The provisions of Statement 71 allowconstructing a commercial integrated coal gasification combined cycle (IGCC) generating station to
69
help meet increased demand over the next decade. PSI,CG&E, andULH&P to capitalize (record as a deferred asset) costs that would normally be charged to expense. These costs are classified as regulatory assets in the accompanying financial statements and the majority have been approved by regulators for future recovery from customers through our rates. As of December 31, 2000,PSI,CG&E, andULH&P, have $977 million of net regulatory assets, of which $938 million have been approved for recovery.
Except with respect to the generation assets ofCG&E, as of December 31, 2000,PSI,CG&E, andULH&P continue to meet each of the criteria required for the use of Statement 71. However, as other states implement deregulation legislation, the application of Statement 71 will need to be reviewed. Based on our operating companies' current regulatory orders and the regulatory environment in which they currently operate, the future recovery of regulatory assets recognized in the accompanying Balance Sheets as of December 31, 2000, is probable. The effect of future discontinuance of Statement 71 on the results of operations, cash flows,own all or statements of position cannot be determined until deregulation legislation plans have been approved by each state in which we do business. See Note 1(c) of the "Notes to Financial Statements" in "Item 8. Financial Statements and Supplementary Data" for a further discussion of our regulatory assets.
Midwest ISO
As part of the effortfacility and operate it. Cinergy will partner with Bechtel Corporation and General Electric Company to createcomplete this study. An IGCC plant turns coal to gas, removing most of the SO2 and other emissions before the gas is used to fuel a competitivecombustion turbine generator. The technology uses less water and has fewer emissions than a conventional coal-fired plant with currently required pollution control equipment. Another benefit is the potential to remove mercury and CO2 upstream of the combustion process at a lower cost than conventional plants. If a decision is reached to move forward with constructing such a plant, PSI would seek approval from the IURC to begin construction. If approved, we would anticipate the IURC’s subsequent approval to include the assets in PSI’s rate base.
In November 2004,PSI filed a compliance plan case with the IURC seeking approval of PSI’s plan for complying with pending SO2, NOX, and mercury emission reduction requirements, including approval of cost recovery and an overall rate of return of eight percent related to certain projects. PSI requested approval to recover the financing, depreciation, and operating and maintenance costs, among others, related to approximately $1.08 billion in capital projects designed to reduce emissions of SO2, NOX, and Mercury at PSI’s coal burning generating stations. An evidentiary hearing is scheduled for April 2005 and a final IURC Order is expected in the third quarter of 2005.
Kentucky
We are not aware of any current plans for electric deregulation in Kentucky.
The KPSC has conditionally approved ULH&P’s planned acquisition of CG&E’s 68.9 percent ownership interest in the East Bend Generating Station, located in Boone County, Kentucky, the Woodsdale Generating Station, located in Butler County, Ohio, and one generating unit at the four-unit Miami Fort Station located in Hamilton County, Ohio. ULH&P is currently seeking approval of the transaction from the SEC, wherein the Ohio Consumers Counsel has intervened in opposition, and the FERC. The transfer, which will be paid for at net book value, will not affect current electric rates for ULH&P’s customers, as power will be provided under the same terms as under the current wholesale power marketplace,contract with CG&E through December 31, 2006. Assuming receipt of regulatory approvals, we would anticipate the transfer to take place in the second quarter of 2005. Once approved, ULH&P would be required to file a rate case with the KPSC to include these assets in rate base with rate increases to be effective January 1, 2007. Costs of fuel and emission allowances would be recovered through a fuel adjustment clause currently in existence in Kentucky, beginning January 1, 2007 when the assets are in rate base. Because the KPSC has already conditionally approved the transfer, we expect the regulatory process to result in a reasonable rate base valuation for these assets; however, at this time we cannot predict whether we will receive approval of the transaction from the FERC approved the formation of theand SEC.
FERC and Midwest Independent Transmission System Operator, Inc. (Midwest ISO) during 1998. In that same year,ISO
Cinergy agreed to join the Midwest ISO in preparation for meeting anticipated changes in the FERC regulations and future deregulation requirements. Energy Markets
The Midwest ISO wasis a regional transmission organization established in 1998 as a non-profit organization to maintainwhich maintains functional control over the combined transmission systems of its members. The organization was expected to begin operations in November 2001.members, including Cinergy
. In the fall of 2000, three transmission owners announced their intent to leaveMarch 2004, the Midwest ISO filed with the FERC proposed changes to its existing transmission tariff to add terms and joinconditions to implement a centralized economic dispatch platform supported by a Day-Ahead and Real-Time Energy Market design, including Locational Marginal Pricing and Financial Transmission Rights (Energy Markets Tariff). The Midwest ISO is now in the proposed Alliance Regional Transmission Organization (Alliance RTO) byfinal stages of market trials and testing of its Energy Markets Tariff. The FERC has issued orders that, among other things, conditionally approve the endstart-up of 2001.the Energy Markets Tariff. The Alliance RTOprojected implementation date is April 1, 2005. Requests for rehearing are pending before FERC, and FERC’s orders have also been appealed to a planned for-profit transmission company involving various utilitiesfederal appeals court.
Specifically, the Energy Markets Tariff proposes to manage system reliability through the use of a market-based congestion management system. The proposal includes a centralized dispatch platform, the intent of which have transmission systems that cover parts of Michigan, Ohio, Indiana, West Virginia,is to dispatch the most economic resources to meet load requirements reliably and Virginia.
On December 13, 2000, six additional transmission owners, includingCinergy, announced a plan for conditional withdrawal fromefficiently in the Midwest ISO ifregion, which covers a large portion of 15 midwestern states and one Canadian province. The Energy Markets Tariff uses Locational Marginal Pricing (i.e., the other three withdrawing members leftenergy price for the organization.next MW may vary throughout the Midwest ISO market based on transmission congestion and energy losses), and the allocation or auction of Financial Transmission Rights, which are instruments that hedge against congestion costs occurring in the Day-Ahead market. The Energy Markets Tariff also includes market monitoring and mitigation measures as well as a resource adequacy proposal, that
70
On January 24, 2001,proposes both an interim solution for participants providing and having access to adequate generation resources as well as a proposal to develop a long-term solution to resource adequacy concerns. The Midwest ISO will perform a day-ahead unit commitment and dispatch forecast for all resources in its market. The Midwest ISO will also perform the FERC issued an order providing 30 days of confidential settlement talks betweenreal time resource dispatch for resources under its control on a five minute basis. The Cinergy utility operating companies will seek to recover costs that they incur related to the Alliance RTO andEnergy Markets Tariff. This is a significant undertaking by the Midwest ISO and its stakeholders in an effort to resolve issues related to such withdrawals.and testing is not yet complete. At this time, we cannot predict the outcome of these matters and whether they will have a material effect on our financial position or results of operations.
CinergyBlackout Report actively participated
In April 2004, the United States-Canada Power System Outage Task Force issued its Final Report on the August 14, 2003 Blackout in the settlement process. On February 23, 2001,United States and Canada. The report reviewed the settlement judge reportedcauses of the Blackout and made 46 recommendations intended to minimize the likelihood and scope of similar events in the future. One of the recommendations is to make reliability standards mandatory and enforceable with penalties for noncompliance. In the past, compliance with North American Electric Reliability Council’s reliability standards and guidelines has largely been voluntary. At this time, we do not believe the recommendations of the Final Report, if implemented, will have a material impact on our financial position or results of operations.
FERC’s Market Screen Orders
In April 2004, the FERC issued an order establishing a new, interim set of market power screens for use in evaluating sales of wholesale power at market-based rates. In July 2004, the FERC issued an order generally affirming that settlement talks producedorder. In April 2004, the FERC also commenced a unanimous comprehensive settlement between all related parties. Specificrulemaking to evaluate whether its overall test for market-based rates should be continued, and to determine a permanent market power test to replace the interim test. That rulemaking process remains pending. Under FERC’s interim generation market power analysis, as a member of the Midwest ISO, Cinergy could consider the Midwest ISO geographic market for purposes of FERC’s market power analysis once the Midwest ISO has a sufficient market structure and a single energy market. Cinergy does not believe it has market power in generation. However, if Cinergy were unable to establish that it does not have the ability to exercise market power in generation, it could result in the loss of market-based rate authority in certain regions of the wholesale market and, assuming such loss of market-based rate authority, would require Cinergy to charge certain wholesale customers cost-based rates for wholesale sales of electricity. In February, 2005, FERC issued final rules that may affect how and when circumstances have changed to an extent that requires FERC review of previously granted authorization to sell at existing market-based rates. At this time, we cannot predict the outcome of these matters and whether they will have a material effect on our financial position or results of operations.
Global Climate Change
Presently, GHG emissions, which principally consist of CO2, are not regulated, and while several legislative proposals have been introduced in Congress to reduce utility GHG emissions, none have been passed. Nevertheless, we anticipate a mandatory program to reduce GHG emissions will exist in the future. We expect that any regulation of GHGs will impose costs on Cinergy. Depending on the details, any GHG regulation could mean:
•Increased capital expenditures associated with investments to improve plant efficiency or install CO2 emission reduction technology (to the extent that such technology exists) or construction of this settlement are yetalternatives to coal generation;
•Increased operating and maintenance expense;
•Our older, more expensive generating stations may operate fewer hours each year because the addition of CO2 costs could cause their generation to be finalizedless economic; and will need approval by the FERC. The definitive settlement agreement language is to be filed
•Increased expenses associated with the FERCpurchase of CO2 emission allowances, should such an emission allowances market be created.
We would plan to seek recovery of the costs associated with a GHG program in rate regulated states where cost recovery is permitted.
71
In September 2003, Cinergy announced a voluntary GHG management commitment to reduce its GHG emissions during the period from 2010 through 2012 by five percent below our 2000 level, maintaining those levels through 2012. This was also published in our December 2004 Air Issues Report to Stakeholders. Cinergy expects to spend $21 million between 2004 and 2010 on March 19, 2001. If approved,projects to reduce or offset its GHG emissions. Cinergy is committed to supporting the settlement agreementPresident’s voluntary initiative, addressing shareholder interest in the issue, and building internal expertise in GHG management and GHG markets. Our voluntary commitment includes the following:
•measuring and inventorying company related sources of GHG emissions;
•identifying and pursuing cost-effective GHG emission reduction and offsetting activities;
•funding research of more efficient and alternative electric generating technologies;
•funding research to better understand the causes and consequences of climate change;
•encouraging a global discussion of the issues and how best to manage them; and
•participating in discussions to help shape the policy debate.
Cinergy is notalso studying the feasibility of constructing a commercial IGCC generating station. The IGCC plant would be expected to present any material adverse impactsrun more efficiently than traditionally constructed coal-fired generation and would thus contribute fewer CO2 tons per megawatt of electricity produced. See the previous section “Indiana” for more details on the plans to construct the company.
Repeal of PUHCAIGCC facility.
Early in 2001, the 107th Congress introduced S.206, a bill to repeal the PUHCA, in the U.S. Senate. It has been referred to the Senate Banking, Housing and Urban Affairs Committee for action. Various proposals to repeal or amend the PUHCA were considered by the previous Congress. In February 1999, the Senate Banking, Housing and Urban Affairs Committee reported out of committee S.313, a bill to repeal the PUHCA. In June 1999, H.R.2363, a bill to repeal the PUHCA, was introduced in the U.S. House of Representatives as a companion to S.313. At the end of the 106th Congress, no action was taken on passage of either of these bills.
During the Clinton Administration, legislation was introduced which would have repealed the PUHCA as part of a broader restructuring of the electricity industry. At the end of the Clinton Administration, no action was taken on this legislation. President Bush has identified the need for the repeal of the PUHCA as a priority of the federal energy legislation. We support the repeal of the PUHCA either as part of broader restructuring of the electricity industry or as separate legislation.
GAS INDUSTRY
Significant Rate Developments
ULH&P Gas Rate Case
In the second quarter of 2001, Purchased Power TrackerULH&P On May 28, 1999,PSI filed a petitionretail gas rate case with the IURC seeking approval of a purchased power tracking mechanism (Tracker). This request was designed to provide for theKPSC requesting, among other things, recovery of costs relatedassociated with an accelerated gas main replacement program of up to purchases$112 million over ten years. The costs would be recovered through a tracking mechanism for an initial three year period, with the possibility of power necessaryrenewal up to meet native load requirementsten years. The tracking mechanism allows ULH&P to recover depreciation costs and rate of return annually over the life of the deferred assets. Through December 31, 2004, ULH&P has recovered approximately $5.1 million under this tracking mechanism. The Kentucky Attorney General has appealed to the extent such costs are not sought throughFranklin Circuit Court the existing fuel adjustment clause. The Tracker applies to a limited number of purchases made for the purpose of ensuring adequate power reserves to meet peak retail native load requirements, which in recent years, have coincided with periods of extreme price volatility. The Tracker only applies to capacity purchases, which are presented for review andKPSC’s approval by the IURC as reasonable under the circumstances. On May 31, 2000, the IURC approved the Tracker for the summer of 2000, subject to a review of the summertracking mechanism and the new tracking mechanism rates. At the present time, ULH&P cannot predict the timing or outcome of 2000 purchases. The IURC subsequently establishedthis litigation.
In February 2005, ULH&P filed a procedural schedule. Ingas base rate case with the first quarter of 2001, a hearingKPSC.ULH&P is scheduled to reviewPSI's 2000 purchases and rule on its associated request for recovery of costs. The IURC will also determine whether it is appropriate forPSIrequesting approval to continue the tracking mechanism in addition to its request for future periods. Amounts relating to PSI's 2000 purchases (approximately $20 million) have been deferred for subsequent recovery.a $14 million increase in base rates, which is a seven percent increase in current retail gas rates.
Gas Prices
While natural gas prices remained relatively high during the first three quarters of 2004, some moderation in prices was seen in the latter half of the fourth quarter. Price movement is usually driven by the effects of weather conditions, availability of supply, and changes in demand and storage inventories. Currently, neither Purchased Power AgreementCG&E nor ULH&P profit from changes in the cost of natural gas since natural gas purchase costs are passed directly to the customer dollar-for-dollar under the gas cost recovery mechanism that is mandated under state law.
ULH&P purchases its energy fromutilizes a price mitigation program designed to mitigate the effects of gas price volatility on customers, which the KPSC has approved through March 31, 2005. The program allows the pre-arranging of between 20-75 percent of winter heating season base load gas requirements and up to 50 percent of summer season base load gas requirements. CG&E similarly mitigates its gas procurement costs, however, pursuantCG&E’s gas price mitigation program has not been pre-approved by the PUCO but rather it is subject to PUCO review as part of the normal gas cost recovery process.
72
CG&E and ULH&P use primarily long-term fixed price contracts and contracts with a FERC-approved contractceiling and floor on the price. These contracts employ the normal purchases and sales scope exception, and do not involve hedges under Statement 133.
73
INFLATION
We believe that the recent inflation rates do not materially impact our financial condition. However, under existing regulatory practice for all of PSI, ULH&P, and the non-generating portion of CG&E, only the historical cost of plant is duerecoverable from customers. As a result, cash flows designed to expire onprovide recovery of historical plant costs may not be adequate to replace plant in future years.
OTHER MATTERS
Synthetic Fuel Production
In July 2002, Cinergy Capital & Trading, Inc. acquired a coal-based synthetic fuel production facility. The synthetic fuel produced at this facility qualifies for tax credits (through 2007) in accordance with Internal Revenue Code (IRC) Section 29 if certain requirements are satisfied. The three key requirements are that (a) the synthetic fuel differs significantly in chemical composition from the coal used to produce such synthetic fuel, (b) the fuel produced is sold to an unrelated entity and (c) the fuel was produced from a facility that was placed in service before July 1, 1998. In addition to the existing plant, we have recently exercised an option to buy an additional synthetic fuel plant.
During the third quarter of 2004, several unrelated entities announced that the Internal Revenue Service (IRS) had or threatened to challenge the placed in service dates of some of the entities’ synthetic fuel plants. A successful IRS challenge could result in disallowance of all credits previously claimed for fuel produced by the subject plants. Cinergy’s sale of synthetic fuel has generated approximately $219 million in tax credits through December 31, 2001. Currently2004, of which approximately $96 million were generated in 2004.
The IRS has not yet audited Cinergy for any tax year in which Cinergy has claimed Section 29 credits related to synthetic fuel. However, it is reasonable to anticipate that the contract is under negotiationIRS will evaluate the placed in service date and other key requirements for claiming the credit. We anticipate this audit to begin in the spring of 2005.
Cinergy received a private letter ruling from the IRS in connection with the involvementacquisition of the KPSC.facility that specifically addressed the significant chemical change requirement. Additionally, although not addressed in the letter ruling, we believe that our facility’s in service date meets the Section 29 requirements.
IRC Section 29 also provides for a phase-out of the credit based on the price of crude oil. The ultimate supplier(s)phase-out is based on a prescribed calculation and definition of crude oil prices. We do not expect any impact on our ability to utilize Section 29 credits in 2004. Future increases in crude oil prices above the price stipulated by the IRS could negatively impact our ability to utilize credits in subsequent years.
Workforce Issues
ULH&P'sBetween 2005 and 2013, 44 percent of our workforce will be eligible for retirement. The loss of these employees could have a negative impact on Cinergy’s energyoverall operations. Cinergy is preparing for this loss that (a) understanding our current employee profile (demographics), (b) identifying critical positions (considered core to our business and that have licensing or lengthy apprenticeship requirements associated with them), and (c) preparing an action plan. The action plan involves long-term staffing plans including such things as detailed recruitment plans, the pricingutilization of electric commodity requirements contained in anyco-ops and interns, identification of key employees, and strong succession planning. We will also use senior and phased retirement programs that allow new arrangement could reflect a market-based approach. At the current time,employees to train and consult with experienced highly-skilled employees post- and pre-retirement. In addition, we are unable to predict the outcomeexploring ways of this matter.accelerating and enhancing our training programs through collaboration with area educational institutions and other third-party providers.
74
MD&A - MARKET RISK SENSITIVE INSTRUMENTS
MARKET RISK SENSITIVE INSTRUMENTS AND POSITIONS
Energy Commodities Sensitivity
The transactions associated with Commodities'Commercial’s energy marketing and trading activities and substantial investment in generation assets give rise to various risks, including marketprice risk. MarketPrice risk represents the potential risk of loss from adverse changes in the market price of electricity or other energy commodities. As CommoditiesCommercial continues to develop its energy marketing and trading business, (and due to its substantial investment in generation assets), its exposure to movements in the price of electricity and other energy commodities may become greater. As a result, we may be subject to increased future earnings volatility.
TheCommercial’s energy marketing and trading activities of Commodities principally consist of Marketing & Trading’s natural gas marketing and trading operations and CG&E's&E’s andPSI's power marketing and trading operations. These
Our domestic operations market and trade over-the-counter (an informal market where the buying/selling of commodities occurs) contracts for the purchase and sale of electricity primarily(primarily in the Midwestmidwest region of the U.S. The powerUnited States), natural gas, and other energy-related products, including coal and emission allowances. Our natural gas domestic operations provide services that manage storage, transportation, gathering and processing activities. In addition, our domestic operations also market and trade natural gas and other energy-related products on the New York Mercantile Exchange.
Marketing & Trading’s natural gas marketing and trading operation consistsoperations also extend to Canada where natural gas marketing and management services are provided to producers and industrial customers. Our Canadian operations also market and trade over-the-counter contracts.
Many of both physical and trading activities. Transactions are designated as a physical activity when there is intent and ability to physically deliver the power from company-owned generation. All other transactions are considered trading activities. Substantially all of thethese energy commodity contracts in both the physical and trading portfolios commit us to purchase or sell electricity, natural gas, and other energy-related products at fixed prices in the future. CommoditiesThe majority of the contracts in the natural gas and other energy-related product portfolios are financially settled contracts (i.e., there is no physical delivery related with these items). In addition, Commercial also markets and trades over-the-counter option contracts. Substantially all of the contracts in the physical portfolio require settlement by physical delivery of electricity. Contracts within the trading portfolio generally require settlement by physical delivery or are netted out in accordance with industry trading standards. The use of these types of physical commodity instruments is designed to allow CommoditiesCommercial to:
•
•- manage and economically hedge contractual commitments;
•
- reduce exposure relative to the volatility of cash market prices;
and •
- take advantage of selected arbitrage
opportunities.
opportunities; and•originate customized transactions with municipalities and end-use customers.
Commodities
Commercial structures and modifies its net position to capture the following:
•
- expected changes in future demand;
•
- seasonal market pricing characteristics;
•
- overall market sentiment; and
•
- price relationships between different time periods and trading regions.
At times, a net open position is created or is allowed to continue when CommoditiesCommercial believes future changes in prices and market conditions may possibly result in profitable positions. Position imbalances can also occur due to the basic lack of liquidity in the wholesale power market. The existence of net open positions can potentially result in an adverse impact on our financial condition or results of operations. This potential adverse impact could be realized if the market price of electric power does not react in the manner or direction expected.Cinergy’s Risk Management Control Policy contains limits associated with the overall size of net open positions for each trading operation.
Commodities
Trading Portfolio Risks
Commercial measures the market risk inherent in the trading portfolio employing value-at-riskvalue at risk (VaR) analysis and other methodologies, which utilize forward price curves in electric power and natural gas markets to quantify estimates of the magnitude and probability of potential future lossesvalue changes related to open contract positions. Value-at-riskVaR is a
75
statistical measure used to quantify the potential losschange in fair value of the trading portfolio over a particular period of time, with a specified likelihood of occurrence, due to an adverse market movement. Because most of the contracts in the physical portfolio require physical delivery of electricity and generally do not allow for net cash settlement, these contracts are not included in the value-at-risk analysis.
Our value-at-risk is reported as a percentage of operating income, based on a 95% confidence interval, utilizing one-day holding periods. This means that on a given day (one-day holding period) there is a 95% chance (confidence interval) that our trading portfolio will lose less than the stated
percentage of operating income. We disclose our value-at-risk for power activities as a percent of consolidated operating income for a one-day basis at December 31, the average one-day basis at the end of each quarter, and the daily basis at December 31 of each year. On a one-day basis as of December 31, 2000, the value-at-risk for the power trading activity was less than 1% of 2000 consolidated operating income and as of December 31, 1999, was less than 1% of 1999 consolidated operating income. On a one-day basis at the end of each quarter, the value-at-risk for the power trading activity was less than 1% of consolidated operating income in 2000, and less than 1% in 1999. The daily value-at-risk for the power trading portfolio as of December 31, 1999, was less than 1% of 2000 consolidated operating income and as of December 31, 1998, was also less than 1% of 1999 consolidated operating income. The value-at-risk model uses the variance-covariance statistical modeling technique and historical volatilities and correlations over the past 200-day period. The estimated market prices used to value these transactions for value-at-risk purposes reflect the use of established pricing models and various factors including quotations from exchanges and over-the-counter markets, price volatility factors, the time value of money, and location differentials.
Commodities,Commercial, through some of our non-regulated subsidiaries, actively markets physical natural gas and activelyelectricity and trades derivative commodity instruments which are usually settled in cash including: forwards, futures, swaps, and options.
Any proprietary trading transaction, whether settled physically or financially, is included in the VaR calculation.
Our VaR is reported based on a 95 percent confidence interval, utilizing a one-day holding period. This means that on a given day (one-day holding period) there is a 95 percent chance (confidence level) that our trading portfolio will not lose more than the stated amount. Prior to March 31, 2004, our VaR model used the Parametric variance-covariance statistical modeling technique and historical volatilities and correlations over the past 21-trading day period. Beginning with April 1, 2004, we calculate VaR using a Monte Carlo simulation methodology using implied forward-looking volatilities and historical correlations. Comparisons indicated that the differences in VaR between the Monte Carlo and Parametric calculations were not material and were within expectations. The aggregated value-at-riskprimary reason for changing to a Monte Carlo approach is that it offers a more scalable method for handling more complex derivative positions and provides a consistent platform for quantifying both market and credit risk.
The VaR for Cinergy’s trading portfolio is presented in the table below:
VaR Associated with Energy Trading Contracts | |
| | | | | | | | | |
| | 2004 | | 2003 | |
| | Trading VaR | | Percentage of Operating Income | | Trading VaR | | Percentage of Operating Income | |
| | (dollars in millions) | |
| | | | | | | | | |
95% confidence level, one-day holding period, one-tailed December 31 | | $ | 1.9 | | 0.3 | % | $ | 0.6 | | 0.1 | % |
Average for the twelve months ended December 31 | | 2.4 | | 0.3 | | 1.3 | | 0.2 | |
High for the twelve months ended December 31 | | 5.8 | | 0.8 | | 3.8 | | 0.5 | |
Low for the twelve months ended December 31 | | 0.7 | | 0.1 | | 0.4 | | 0.1 | |
| | | | | | | | | | | |
76
Changes in Fair Value
The changes in fair value of the energy risk management assets and liabilities for Cinergy and CG&E for the years ended December 31, 2004 and 2003 are presented in the table below. In April 2002, CG&E and PSI executed a new joint operating agreement whereby we chose to originate all new power marketing and trading contracts since April 2002 on behalf of CG&E only. Historically, such contracts were executed on behalf of PSI and CG&E jointly. PSI’s remaining contracts, entered into prior to the new joint operating agreement, are not material. Therefore, we have not presented PSI separately in the fair value tables below.
| | Change in Fair Value | |
| | 2004 | | 2003 | |
| | Cinergy(1) | | CG&E | | Cinergy(1) | | CG&E | |
| | (in millions) | |
Fair value of contracts outstanding at the beginning of period | | $ | 41 | | $ | 20 | | $ | 75 | | $ | 42 | |
| | | | | | | | | |
Changes in fair value attributable to changes in valuation techniques and assumptions(2) | | (5 | ) | (4 | ) | 1 | | 1 | |
| | | | | | | | | |
Other changes in fair value(3) | | 185 | | 70 | | 127 | | 53 | |
| | | | | | | | | |
Option premiums paid/(received) | | 5 | | 6 | | (3 | ) | 2 | |
| | | | | | | | | |
Accounting Changes(4) | | | | | | | | | |
| | | | | | | | | |
Consolidation of previously unconsolidated entities | | — | | — | | 7 | | — | |
| | | | | | | | | |
Cumulative effect of changes in accounting principles | | — | | — | | (20 | ) | (13 | ) |
| | | | | | | | | |
Contracts settled | | (144 | ) | (56 | ) | (146 | ) | (65 | ) |
| | | | | | | | | |
Fair value of contracts outstanding at end of period | | $ | 82 | | $ | 36 | | $ | 41 | | $ | 20 | |
(1)The results ofCinergyalso include amounts associated with these otherrelated to non-registrants.
(2)Represents changes in fair value recognized in income, caused by changes in assumptions used in calculating fair value or changes in modeling techniques.
(3)Represents changes in fair value recognized in income, primarily attributable to fluctuations in price. This amount includes both realized and unrealized gains on energy trading contracts.
(4)See Note 1(q)(i) and hedging activities were less than one million dollarsNote 1(q)(iv) of the “Notes to Financial Statements” in “Item 8. Financial Statements and Supplementary Data” for further information.
The following are the balances at December 31, 2004 and 2003 of our energy risk management assets and liabilities:
| | 2004 | | 2003 | |
| | Cinergy(1) | | CG&E | | Cinergy(1) | | CG&E | |
| | (in millions) | |
| | | | | | | | | |
Energy risk management assets - current | | $ | 381 | | $ | 149 | | $ | 305 | | $ | 73 | |
Energy risk management assets - non-current | | 139 | | 47 | | 97 | | 37 | |
| | | | | | | | | |
Energy risk management liabilities - current | | (311 | ) | (120 | ) | (296 | ) | (78 | ) |
Energy risk management liabilities - non-current | | (127 | ) | (40 | ) | (65 | ) | (12 | ) |
| | | | | | | | | |
| | $ | 82 | | $ | 36 | | $ | 41 | | $ | 20 | |
(1)The results of Cinergy also include amounts related to non-registrants.
77
The following table presents the expected maturity of the energy risk management assets and liabilities as of December 31, 2000,2004 for Cinergy and less thanCG&E:
| | Fair Value of Contracts at December 31, 2004 | |
| | Maturing | | | |
Source of Fair Value(1) | | 2005 | | 2006-2007 | | 2008-2009 | | Thereafter | | Total Fair Value | |
| | (in millions) | |
Cinergy(2) | | | | | | | | | | | |
Prices actively quoted | | $ | 74 | | $ | 18 | | $ | — | | $ | — | | $ | 92 | |
| | | | | | | | | | | |
Prices based on models and other valuation methods(3) | | (4 | ) | (5 | ) | 2 | | (3 | ) | (10 | ) |
| | | | | | | | | | | |
Total | | $ | 70 | | $ | 13 | | $ | 2 | | $ | (3 | ) | $ | 82 | |
| | | | | | | | | | | |
CG&E | | | | | | | | | | | |
Prices actively quoted | | $ | 25 | | $ | 13 | | $ | — | | $ | — | | $ | 38 | |
| | | | | | | | | | | |
Prices based on models and other valuation methods(3) | | 4 | | (6 | ) | — | | — | | (2 | ) |
| | | | | | | | | | | |
Total | | $ | 29 | | $ | 7 | | $ | — | | $ | — | | $ | 36 | |
(1) �� While liquidity varies by trading regions, active quotes are generally available for two years for standard electricity transactions and three years for standard gas transactions. Non-standard transactions are classified based on the extent, if any, of modeling used in determining fair value. Long-term transactions can have portions in both categories depending on the length.
(2)The results of Cinergy also include amounts related to non-registrants.
(3)A substantial portion of these amounts include option values.
Generation Portfolio Risks
Cinergy optimizes the value of its non-regulated portfolio. The portfolio includes generation assets (power and capacity), fuel, and emission allowances and we manage all of these components as a portfolio. We use models that forecast future generation output, fuel requirements, and emission allowance requirements based on forward power, fuel and emission allowance markets. The component pieces of the portfolio are bought and sold based on this model in order to manage the economic value of the portfolio. With the issuance of Statement of Financial Accounting Standards No. 149, Amendment of Statement 133 on Derivative Instruments and Hedging Activities (Statement 149), most forward power transactions from management of the portfolio are accounted for at fair value. The other component pieces of the portfolio are typically not subject to Statement 149 and are accounted for using the accrual method, where changes in fair value are not recognized. As a result, we are subject to earnings volatility via mark-to-market gains or losses from changes in the value of the contracts accounted for using fair value. A hypothetical $1.00 per MWh increase or decrease consistently applied to all forward power prices would have resulted in an increase or decrease in fair value of these contracts of approximately $3 million dollars atas of December 31, 1999. The2004.
Cinergy is exposed to risk from changes in the market risk exposuresprices of these non-regulated trading activitiesfuel (primarily coal) and emission allowances to the extent the risk is not considered significantmitigated by regulatory recovery mechanisms in Ohio and Indiana. To the extent we must purchase fuel or emission allowances in a rising price environment, increased cost of electricity production could result without a corresponding increase in revenue. Cinergy manages this risk through the use of long-term fixed price fuel contracts and acquisitions of emission allowances. These risks at CG&E are partially mitigated in 2005 and significantly mitigated from 2006 through 2008 by a retail fuel cost recovery mechanism established in Ohio as part of the RSP for non-residential customers beginning January 1, 2005 and for residential customers beginning January 1, 2006. This mechanism will recover costs for fuel and emission allowances that exceed the amount originally included in the rates frozen in the CG&E transition plan through December 31, 2008. PSI continues to our financial condition or resultsbe protected against market price changes of operations.fuel and emission allowances costs incurred for its retail customers by the use of cost tracking and recovery mechanisms in the state of Indiana.
78
Concentrations of Credit Risk
Credit risk is the exposure to economic loss that would occur as a result of nonperformance by counterparties, pursuant to the terms of their contractual obligations. Specific components of credit risk include counterparty default risk, collateral risk, concentration risk, and settlement risk.
Trade Receivables and Physical Power Portfolio
Our concentration of credit risk with respect to Delivery's trade accounts receivable from electric and gas retail customers is limited. The large number of customers and diversified customer base of residential, commercial, and industrial customers significantly reduces our credit risk. Contracts within the physical portfolio of Commodities' power marketing and trading operations are primarily with the traditional electric cooperatives and municipalities and other investor-owned utilities. At December 31, 2000,2004, we do not believe we hadthe likelihood of significant exposure tolosses associated with credit risk within our trade accounts receivable within Delivery or our physical power portfolio within Commodities.is remote.
Power-TradingEnergy Trading Credit Risk
Cinergy’s Contracts within the trading portfolioextension of the powercredit for energy marketing and trading operations are primarily with power marketersis governed by a Corporate Credit Policy. Written guidelines approved by Cinergy’s Risk Policy Committee document the management approval levels for credit limits, evaluation of creditworthiness, and other investor-owned utilities. As of December 31, 2000, approximately 60%credit risk mitigation procedures. Cinergy analyzes net credit exposure and establishes credit reserves based on the counterparties’ credit rating, payment history, and length of the activity withinoutstanding obligation. Exposures to credit risks are monitored daily by the totalCorporate Credit Risk function, which is independent of all trading portfolio was with ten counterparties. The majority of these contracts are for terms of one year or less. Electric poweroperations. Energy commodity prices can be extremely volatile and the market can, at times, lack liquidity. Because of these issues, credit risk for energy commodities is generally greater than with other commodity trading.
79
The following tables provide information regarding Cinergy’s and CG&E’s exposure on energy trading especiallycontracts as well as the expected maturities of those exposures as of December 31, 2004. The tables include accounts receivable and energy risk management assets, which are net of accounts payable and energy risk management liabilities with the same counterparties when dealing with new market entrants. Credit discounts are includedwe have the right of offset. The credit collateral shown in the determination of fair value for all open positions in the power-trading portfolio.
During the last quarter of 2000, the Western U.S., primarily California, began experiencing unprecedented price levels for wholesale electricity. Because of the nature of deregulation in California, the utilities have been unable to pass these price increases on to customers. Consequently, California's two largest utilities have accumulated significant unpaid obligations and are having difficulty obtaining capital. While we maintain a balanced Western U.S. portfolio and have no unrealized gain positions directly with these utilities, a large portion of such positions are with less than five power marketers. If prices continue at elevated levels or should these utilities be unable to fund their unpaid obligations, credit failures by power marketers could result. Given these issues, the fair values of our positions in
the Western U.S. have been adjusted to reflect a higher level of credit discount. We have also been actively pursuing other forms of credit enhancement including, but not limited to, parent company guaranteesfollowing tables includes cash and letters of credit from counterparties. In determining fair value for all derivative instruments,credit. As previously discussed, PSI’s remaining contracts are not material; therefore, we consider the credit quality of each counterparty, contractual netting arrangements for longs and shorts with the same counterparty, and any security obtained. A significant portion of ourEnergy risk management assets andEnergy risk management liabilities —current are with counterparties in the Western U.S. Nonperformance by any of the Western U.S. counterparties could have a material effect on the operating results ofCinergy,CG&E, andPSI.
Gas Trading As of December 31, 2000, approximately 50% of the activity within the physical gas marketing and trading portfolio represented commitments with 20 counterparties. Credit risk losses related to gas and other physical commodity and trading operations have not been significant. At December 31, 2000,presented PSI separately in the credit risk within the gas and commodity trading portfolios was not believedtables below.
Cinergy(1)
Rating | | Total Exposure
Before Credit Collateral | | Credit Collateral | | Net Exposure | | Percentage of
Total Net Exposure | | Number of
Counterparties
Greater than 10% of Total Net Exposure | | Net Exposure of
Counterparties Greater than
10% of Total Net Exposure(4) | |
| | (in millions) | |
| | | | | | | | | | | | | |
Investment Grade(2) | | $ | 737 | | $ | 75 | | $ | 662 | | 84 | % | — | | $ | — | |
Internally Rated-Investment Grade(3) | | 68 | | 1 | | 67 | | 9 | | — | | — | |
Non-Investment Grade | | 135 | | 90 | | 45 | | 5 | | — | | — | |
Internally Rated-Non-Investment Grade | | 51 | | 37 | | 14 | | 2 | | — | | — | |
| | | | | | | | | | — | | | |
Total | | $ | 991 | | $ | 203 | | $ | 788 | | 100 | % | — | | $ | — | |
| | | | Maturity of Credit Risk Exposure | |
| | | | | | | | | | | |
| | | | | | | | Exposure | | Total Exposure | |
| | | | | | | | Greater than | | Before Credit | |
Rating | | 2005 | | 2006-2007 | | 2008-2009 | | 5 Years | | Collateral | |
| | (in millions) | |
| | | | | | | | | | | |
Investment Grade(2) | | $ | 636 | | $ | 74 | | $ | 16 | | $ | 11 | | $ | 737 | |
Internally Rated-Investment Grade(3) | | 61 | | 7 | | — | | — | | 68 | |
Non-Investment Grade | | 133 | | 2 | | — | | — | | 135 | |
Internally Rated-Non-Investment Grade | | 50 | | 1 | | — | | — | | 51 | |
| | | | | | | | | | | |
Total | | $ | 880 | | $ | 84 | | $ | 16 | | $ | 11 | | $ | 991 | |
(1)Includes amounts related to be significant because of the characteristics of counterparties and customers with which transactions are executed.non-registrants.
(2)Includes counterparties rated Investment Grade or the counterparties’ obligations are guaranteed or secured by an Investment Grade entity.
(3)Counterparties include a variety of entities, including investor-owned utilities, privately held companies, cities and municipalities. Cinergy assigns internal credit ratings to all counterparties within our credit risk portfolio, applying fundamental analytical tools. Included in this analysis is a review of (but not limited to) counterparty financial statements with consideration given to off-balance sheet obligations and assets, specific business environment, access to capital, and indicators from debt and equity capital markets.
(4)Exposures, positive or negative, with counterparties that are related to one another are not aggregated when no right of offset exists and as a result, credit is extended and evaluated on a separate basis.
80
CG&E
| | Total Exposure Before Credit Collateral | | Credit Collateral | | Net Exposure | | Percentage of Total Net Exposure | | Number of Counterparties
Greater than 10% of Total Net Exposure | | Net Exposure of
Counterparties Greater than 10% of Total Net Exposure(3) | |
Rating | | | | | | | |
| | (in millions) | |
| | | | | | | | | | | | | |
Investment Grade(1) | | $ | 165 | | $ | 21 | | $ | 144 | | 92 | % | 2 | | $ | 45 | |
Internally Rated-Investment Grade(2) | | 8 | | — | | 8 | | 5 | | — | | — | |
Non-Investment Grade | | 18 | | 15 | | 3 | | 2 | | — | | — | |
Internally Rated-Non-Investment Grade | | 3 | | 1 | | 2 | | 1 | | — | | — | |
| | | | | | | | | | | | | |
Total | | $ | 194 | | $ | 37 | | $ | 157 | | 100 | % | 2 | | $ | 45 | |
| | Maturity of Credit Risk Exposure | |
| | | | | | | | Exposure | | Total Exposure | |
| | | | | | | | Greater than | | Before Credit | |
Rating | | 2005 | | 2006-2007 | | 2008-2009 | | 5 Years | | Collateral | |
| | (in millions) | |
| | | | | | | | | | | |
Investment Grade(1) | | $ | 156 | | $ | 8 | | $ | 1 | | $ | — | | $ | 165 | |
Internally Rated-Investment Grade(2) | | 8 | | — | | — | | — | | 8 | |
Non-Investment Grade | | 18 | | — | | — | | — | | 18 | |
Internally Rated-Non-Investment Grade | | 3 | | — | | — | | — | | 3 | |
| | | | | | | | | | | |
Total | | $ | 185 | | $ | 8 | | $ | 1 | | $ | — | | $ | 194 | |
(1) Includes counterparties rated Investment Grade or the counterparties’ obligations are guaranteed or secured by an Investment Grade entity.
(2) Counterparties include various cities and municipalities.
(3) Exposures, positive or negative, with counterparties that are related to one another are not aggregated when no right of offset exists and as a result, credit is extended and evaluated on a separate basis.
Financial Derivatives
Potential exposure to credit risk also exists from our use of financial derivatives such as currency swaps, foreign exchange forward contracts, and interest rate swaps.swaps and treasury locks. Because these financial instruments are transacted only with highly rated financial institutions, we do not anticipate nonperformance by any of the counterparties.
Risk Management
We manage, on a portfolio basis, the market risks in our energy marketing and trading transactions subject to parameters established by our Risk Policy Committee. Our market and credit risks are monitored by the risk management and credit functionsGlobal Risk Management function to ensure compliance with stated risk management policies and procedures. The risk management and credit functions operateGlobal Risk Management function operates independently from the business units, and other corporate functions, which originate and actively manage the market and credit risk exposures. The policiesPolicies and procedures are periodically reviewed and monitored to ensureassess their responsiveness to changing market and business conditions. In addition, efforts are ongoing to develop systems to improve the timeliness and quality of market and creditCredit risk information. Some of the policies and proceduresmitigation practices include requiring parent company guarantees, various forms of collateral, and the use of mutual netting/closeout agreements.
Exchange Rate Sensitivity
From time to time, we may utilize foreign exchange forward contracts and currency swaps to hedge foreign currency denominated purchase and sale commitments and certain of our net investments in foreign operations against currency exchange rate fluctuations.
Cinergy has exposure to fluctuations in exchange rates between the U.S.United States dollar and the currencies of foreign countries where we have investments. When it is appropriate we will hedge our exposure to cash flow transactions, such as a dividend payment by one of our foreign subsidiaries. As of December 31, 2000, we do not believe we had a material exposure to the currency risk attributable to these investments.
81
Interest Rate Sensitivity
Our net exposure to changes in interest rates primarily consists of short-term debt instruments (including net money pool borrowings) and variable-rate pollution control debt, sales of accounts receivable, and capital leases.debt. The following table reflects the different instruments used and the method of benchmarking interest rates, as of December 31, 2000, and 1999:2004:
| |
| | Interest Benchmark
| |
| | 2000
| | 1999
|
|---|
| |
| |
| |
| | (in millions)
|
|---|
| Short-term Bank Loans/Commercial Paper | | • | | Short-term Money Market | | Cinergy | | $ | 862 | | $ | 283 |
| | | • | | LIBOR(1) | | CG&E | | | 80 | | | 51 |
| | | | | | | PSI | | | 105 | | | 150 |
Pollution Control Debt |
|
• |
|
Daily Market |
|
Cinergy |
|
|
267 |
|
|
267 |
| | �� | | | | | CG&E | | | 184 | | | 184 |
| | | | | | | PSI | | | 83 | | | 83 |
Sales of Accounts Receivable |
|
• |
|
Short-term Money Market |
|
Cinergy |
|
|
257 |
|
|
257 |
| | | | | | | CG&E | | | 156 | | | 157 |
| | | | | | | ULH&P | | | 26 | | | 21 |
| | | | | | | PSI | | | 101 | | | 100 |
Variable Rate Capital Leases |
|
• |
|
LIBOR(1) |
|
Cinergy |
|
|
31 |
|
|
22 |
| | | | | | | CG&E | | | 31 | | | 22 |
Interest Benchmark | | 2004 | |
| | | | | | (in millions) | |
| | | | | | | |
Short-term Bank Loans/Commercial Paper/Money Pool | | •Short-term Money Market | | Cinergy | | $ | 686 | |
| | •Commercial Paper | | CG&E and subsidiaries | | 180 | |
| | Composite Rate(1) | | PSI | | 131 | |
| | •LIBOR(2) | | ULH&P | | 11 | |
| | | | | | | |
Pollution Control Debt | | •Daily Market | | Cinergy | | 741 | |
| | •Weekly Market | | CG&E and subsidiaries | | 290 | |
| | •Auction Rate | | PSI | | 426 | |
| | | | | | | | |
(1)30-day Federal Reserve “AA” Industrial Commercial Paper Composite Rate
(2)London Inter-Bank Offered Rate (LIBOR)
The weighted-average interest rates on the abovepreviously discussed instruments at December 31, 2000, and 1999, were as follows:
| | 2000
| | 1999
| |
|---|
| Short-term Bank Loans/Commercial Paper | | 7.0 | % | 6.2 | % |
| Pollution Control Debt | | 4.5 | % | 4.1 | % |
| Sales of Accounts Receivable | | 6.6 | % | 6.1 | % |
| Variable Rate Capital Leases | | 7.5 | % | 5.3 | % |
|
| 2004 |
|
| | | |
Short-term Bank Loans/Commercial Paper |
| 2.5 | % |
Money Pool |
| 2.4 | % |
Pollution Control Debt |
| 2.3 | % |
| | | |
At December 31, 2000,2004, forward yield curves project a decreasean increase in applicable short-term interest rates over the next five years.
82
The following table presents principal cash repayments, by maturity date and other selected information, for each registrant'sregistrant’s long-term fixed-rate debt, other debt, and capital lease obligations as of December 31, 2000:2004:
| | Expected Maturity Date | |
| | | | | | | | | | | | There- | | | | Fair | |
Liabilities | | 2005 | | 2006 | | 2007 | | 2008 | | 2009 | | after | | Total | | Value | |
| | (in millions) | |
| | | | | | | | | | | | | | | | | |
Cinergy | | | | | | | | | | | | | | | | | |
Long-term Debt(1)(6) | | $ | 200 | (4)(5) | $ | 326 | | $ | 366 | | $ | 513 | | $ | 243 | | $ | 2,223 | | $ | 3,871 | | $ | 4,074 | |
Weighted-average interest rate(2) | | 6.8 | % | 6.6 | % | 7.6 | % | 6.4 | % | 7.4 | % | 7.1 | % | 7.0 | % | | |
| | | | | | | | | | | | | | | | | |
Other(3) | | $ | 20 | | $ | 29 | | $ | 360 | | $ | 38 | | $ | 27 | | $ | 153 | | $ | 627 | | $ | 687 | |
Weighted-average interest rate(2) | | 7.9 | % | 6.8 | % | 6.9 | % | 6.9 | % | 6.7 | % | 6.9 | % | 6.9 | % | | |
| | | | | | | | | | | | | | | | | |
Capital Leases | | | | | | | | | | | | | | | | | |
Fixed-rate leases | | $ | 7 | | $ | 7 | | $ | 7 | | $ | 10 | | $ | 10 | | $ | 24 | | $ | 65 | | $ | 65 | |
Interest rate(2) | | 5.4 | % | 5.3 | % | 5.3 | % | 5.2 | % | 5.1 | % | 4.9 | % | 5.5 | % | | |
| | | | | | | | | | | | | | | | | |
CG&E and subsidiaries | | | | | | | | | | | | | | | | | |
Long-term Debt(1) | | $ | 150 | (5) | $ | — | | $ | 100 | | $ | 120 | | $ | 20 | | $ | 1,240 | | $ | 1,630 | | $ | 1,677 | |
Weighted-average interest rate(2) | | 6.9 | % | — | % | 6.9 | % | 6.4 | % | 7.9 | % | 5.1 | % | 5.5 | % | | |
| | | | | | | | | | | | | | | | | |
Capital Leases | | | | | | | | | | | | | | | | | |
Fixed-rate leases | | $ | 4 | | $ | 4 | | $ | 4 | | $ | 6 | | $ | 6 | | $ | 16 | | $ | 40 | | $ | 40 | |
Interest rate(2) | | 5.3 | % | 5.3 | % | 5.2 | % | 5.2 | % | 5.1 | % | 4.9 | % | 5.4 | % | | |
| | | | | | | | | | | | | | | | | |
PSI | | | | | | | | | | | | | | | | | |
Long-term Debt(1) | | $ | 50 | (4) | $ | 326 | | $ | 266 | | $ | 43 | | $ | 223 | | $ | 976 | | $ | 1,884 | | $ | 2,009 | |
Weighted-average interest rate(2) | | 6.5 | % | 6.6 | % | 7.8 | % | 6.4 | % | 7.3 | % | 9.6 | % | 8.4 | % | | |
| | | | | | | | | | | | | | | | | |
Capital Leases | | | | | | | | | | | | | | | | | |
Fixed-rate leases | | $ | 3 | | $ | 3 | | $ | 3 | | $ | 4 | | $ | 4 | | $ | 8 | | $ | 25 | | $ | 25 | |
Interest rate(2) | | 5.5 | % | 5.4 | % | 5.4 | % | 5.3 | % | 5.1 | % | 4.9 | % | 5.6 | % | | |
| | | | | | | | | | | | | | | | | |
ULH&P | | | | | | | | | | | | | | | | | |
Long-term Debt | | $ | — | | $ | — | | $ | — | | $ | 20 | | $ | 20 | | $ | 55 | | $ | 95 | | $ | 100 | |
Weighted-average interest rate(2) | | — | % | — | % | — | % | 6.5 | % | 7.9 | % | 5.7 | % | 6.3 | % | | |
| | | | | | | | | | | | | | | | | |
Capital Leases | | | | | | | | | | | | | | | | | |
Fixed-rate leases | | $ | 1 | | $ | 1 | | $ | 1 | | $ | 1 | | $ | 2 | | $ | 3 | | $ | 9 | | $ | 9 | |
Interest rate(2) | | 5.4 | % | 5.4 | % | 5.4 | % | 5.3 | % | 5.2 | % | 4.9 | % | 5.6 | % | | |
| | | | | | | | | | | | | | | | | | | | | | | | | | | | | | | | | | | | | | | | |
(1)
| | Expected Maturity Date
|
|---|
Liabilities
| | 2001
| | 2002
| | 2003
| | 2004
| | 2005
| | There-
after
| | Total
| | Fair
Value
|
|---|
| | (in millions)
|
|---|
| Cinergy | | | | | | | | | | | | | | | | | | | | | | | | |
| Long-term Debt(1) | | $ | 90 | (4) | $ | 124 | | $ | 177 | (5) | $ | 311 | | $ | 51 | (6) | $ | 2,126 | | $ | 2,879 | | $ | 2,901 |
| | Weighted-average interest rate(2) | | | 5.2 | % | | 7.3 | % | | 6.2 | % | | 6.2 | % | | 6.5 | % | | 7.0 | % | | 6.8 | % | | |
Other(3) |
|
$ |
1.0 |
|
$ |
21.0 |
|
$ |
8.2 |
|
$ |
1.8 |
|
$ |
1.6 |
|
$ |
15.0 |
|
$ |
48.6 |
|
$ |
49.2 |
| | Weighted-average interest rate(2) | | | 7.2 | % | | 7.4 | % | | 7.4 | % | | 7.2 | % | | 7.2 | % | | 7.2 | % | | 7.3 | % | | |
Capital Leases |
|
|
|
|
|
|
|
|
|
|
|
|
|
|
|
|
|
|
|
|
|
|
|
|
| | Fixed rate leases | | $ | 1.8 | | $ | 1.9 | | $ | 2.1 | | $ | 2.2 | | $ | 2.4 | | $ | 14.5 | | $ | 24.9 | | $ | 24.9 |
| | Interest rate | | | 6.5 | % | | 6.5 | % | | 6.5 | % | | 6.5 | % | | 6.5 | % | | 6.5 | % | | 6.5 | % | | |
| |
Variable rate leases |
|
$ |
22.9 |
|
$ |
0.9 |
|
$ |
0.9 |
|
$ |
0.9 |
|
$ |
0.9 |
|
$ |
4.6 |
|
$ |
31.1 |
|
$ |
31.1 |
| | Weighted-average interest rate(2) | | | 7.5 | % | | 8.3 | % | | 8.3 | % | | 8.3 | % | | 8.3 | % | | 8.3 | % | | 7.5 | % | | |
CG&E and subsidiaries |
|
|
|
|
|
|
|
|
|
|
|
|
|
|
|
|
|
|
|
|
|
|
|
|
| Long-term Debt(1) | | $ | 1 | | $ | 100 | | $ | 120 | (5) | $ | 110 | | $ | — | | $ | 878 | | $ | 1,209 | | $ | 1,203 |
| | Weighted-average interest rate(2) | | | 9.8 | % | | 7.3 | % | | 6.3 | % | | 6.5 | % | | — | | | 6.9 | % | | 6.8 | % | | |
Capital Leases |
|
|
|
|
|
|
|
|
|
|
|
|
|
|
|
|
|
|
|
|
|
|
|
|
| | Fixed rate leases | | $ | 1.0 | | $ | 1.0 | | $ | 1.1 | | $ | 1.2 | | $ | 1.3 | | $ | 7.9 | | $ | 13.5 | | $ | 13.5 |
| | Interest rate | | | 6.5 | % | | 6.5 | % | | 6.5 | % | | 6.5 | % | | 6.5 | % | | 6.5 | % | | 6.5 | % | | |
| |
Variable rate leases |
|
$ |
22.9 |
|
$ |
0.9 |
|
$ |
0.9 |
|
$ |
0.9 |
|
$ |
0.9 |
|
$ |
4.6 |
|
$ |
31.1 |
|
$ |
31.1 |
| | Weighted-average interest rate(2) | | | 7.5 | % | | 8.3 | % | | 8.3 | % | | 8.3 | % | | 8.3 | % | | 8.3 | % | | 7.5 | % | | |
PSI |
|
|
|
|
|
|
|
|
|
|
|
|
|
|
|
|
|
|
|
|
|
|
|
|
| Long-term Debt(1) | | $ | 89 | (4) | $ | 24 | | $ | 57 | | $ | 1 | | $ | 51 | (6) | $ | 898 | | $ | 1,120 | | $ | 1,136 |
| | Weighted-average interest rate(2) | | | 5.2 | % | | 7.6 | % | | 5.9 | % | | 6.0 | % | | 6.5 | % | | 7.3 | % | | 7.0 | % | | |
Capital Lease |
|
|
|
|
|
|
|
|
|
|
|
|
|
|
|
|
|
|
|
|
|
|
|
|
| | Fixed rate leases | | $ | 0.8 | | $ | 0.9 | | $ | 1.0 | | $ | 1.0 | | $ | 1.1 | | $ | 6.5 | | $ | 11.3 | | $ | 11.3 |
| | Interest rate | | | 6.5 | % | | 6.5 | % | | 6.5 | % | | 6.5 | % | | 6.5 | % | | 6.5 | % | | 6.5 | % | | |
ULH&P |
|
|
|
|
|
|
|
|
|
|
|
|
|
|
|
|
|
|
|
|
|
|
|
|
| Long-term Debt(1) | | | — | | | — | | $ | 20 | | | — | | | — | | $ | 55 | | $ | 75 | | $ | 76 |
| | Weighted-average interest rate(2) | | | — | | | — | | | 6.1 | % | | — | | | — | | | 7.3 | % | | 7.0 | % | | |
Capital Lease |
|
|
|
|
|
|
|
|
|
|
|
|
|
|
|
|
|
|
|
|
|
|
|
|
| | Fixed rate leases | | $ | 0.3 | | $ | 0.4 | | $ | 0.4 | | $ | 0.4 | | $ | 0.4 | | $ | 2.8 | | $ | 4.7 | | $ | 4.7 |
| | Interest rate | | | 6.5 | % | | 6.5 | % | | 6.5 | % | | 6.5 | % | | 6.5 | % | | 6.5 | % | | 6.5 | % | | |
(1)All long-term debt is fixed rate andLong-term Debt includes amounts reflected as long-termLong-term debt due within one year.
- year.
(2)
- The weighted-average interest rate is calculated as follows: (1) for
long-term debt obligations,Long-term Debt and Other, the weighted-average interest rate is based on the couponinterest rates at December 31, 2004 of the debt that is maturing in the year reported;reported and includes the effects of an interest rate swap that fixes the interest payments differently from the stated rate; and (2) for Capital Leases, the variable rate capital leases, theweighted-average interest rate is based on a spread over 3-month LIBOR, and averaged to be approximately 7.5% in 2000; (3) for the fixed rate capital leases, theaverage interest rate is fixed at approximately 6.50% with an amortizing principal structure;of the lease payments made during the year reported.(3)Promissory notes and (4) for thelong-term notes payable related to investments under Cinergy Global Resources, investment, the interest rate is based on a spread over 6-Inc., Cinergy Investments, Inc., and 12-month LIBOR.
(3)Variable rate debt related to an investment under Global Resources.
(4)6.00% Debentures due December 14, 2016, reflected as maturingCC Funding Trust. See Note 3(b) of the “Notes to Financial Statements” in 2001, as“Item 8. Financial Statements and Supplementary Data” for a discussion of the interest rate resets on December 14, 2001.
(5)6.35% Debentures due June 15, 2038, reflected as maturing in 2003, asdebt associated with the interest rate resets on June 15, 2003.
(6)- CC Funding Trust.
(4)Includes PSI’s6.50% Debentures due inAugust 1, 2026, reflected as maturing in 2005, as the interest rate resetsis due to reset on August 1, 2005.
If the interest rate is not reset, the bonds are subject to mandatory redemption by PSI.(5)CG&E’s 6.90% Debentures due June 1, 2025, are putable to CG&E at the option of the holders on June 1, 2005. However, based on current market conditions, we believe it is unlikely that the debentures will be put to CG&E on this date.
(6)Includes amounts related to non-registrants.
Our current policy in managing exposure to fluctuations in interest rates is to maintain approximately 25%30 percent of the total amount of outstanding debt in floatingvariable interest rate debt instruments. To help maintainIn maintaining this level of exposure, we have previously, and will consider in the future, entering intouse interest rate swaps. Under thesethe swaps, we agree with other parties to exchange, at specified intervals, the difference between fixed ratefixed-rate and floating ratevariable-rate interest amounts calculated on an agreed upon notional amount.PSI had an In the future, we will continually monitor market conditions to evaluate whether to modify our level of exposure to fluctuations in interest rate swap agreement that expired on November 15, 2000, which had a notional amount of $100 million.rates.
83
CG&E has an outstanding interest rate swap agreement that decreased the percentage of floating ratevariable-rate debt. UnderSee Note 7(a) of the seven year agreement,“Notes to Financial Statements” in “Item 8. Financial Statements and Supplementary Data” for additional information on financial derivatives.
84
MD&A - - ACCOUNTING MATTERS
Critical Accounting Estimates
Preparation of financial statements and related disclosures in compliance with GAAP requires the use of assumptions and estimates regarding future events, including the likelihood of success of particular investments or initiatives, estimates of future prices or rates, legal and regulatory challenges, and anticipated recovery of costs. Therefore, the possibility exists for materially different reported amounts under different conditions or assumptions. We consider an accounting estimate to be critical if: 1) the accounting estimate requires us to make assumptions about matters that were reasonably uncertain at the time the accounting estimate was made, and 2) changes in the estimate are reasonably likely to occur from period to period.
These critical accounting estimates should be read in conjunction with the “Notes to Financial Statements” in “Item 8. Financial Statements and Supplementary Data”. We have other accounting policies that we consider to be significant; however, these policies do not meet the definition of critical accounting estimates, because they generally do not require us to make estimates or judgments that are particularly difficult or subjective.
Fair Value Accounting for Energy Marketing and Trading
We use fair value accounting for energy trading contracts, which is required, with certain exceptions, by Statement 133. Short-term contracts used in our trading activities are generally priced using exchange based or over-the-counter price quotes. Long-term contracts typically must be valued using less actively quoted prices or valuation models. Use of model pricing requires estimating surrounding factors such as volatility and price curves beyond what is actively quoted in the market. In addition, some contracts do not have fixed notional amounts and therefore must be valued using estimates of volumes to be consumed by the counterparty. See “Changes in Fair Value” for additional information.
We measure these risks by using complex analytical tools, both external and proprietary. These models are dynamic and are continuously updated with the most recent data to improve assessments of potential future outcomes. We measure risks for contracts that do not contain fixed notional amounts by obtaining historical data and projecting expected consumption. These models incorporate expectations surrounding the impacts that weather may play in future consumption. The results of these measures assist us in managing such risks within our portfolio. We also have a Global Risk Management function within Cinergy that is independent of the marketing and trading function and is under the oversight of a Risk Policy Committee comprised primarily of senior company executives. This group provides an independent evaluation of both forward price curves and the valuation of energy contracts. See “Trading Portfolio Risks” for additional information.
There is inherent risk in valuation modeling given the complexity and volatility of energy markets. Fair value accounting has risk, including its application to short-term contracts, as gains and losses recorded through its use are not yet realized. Therefore, it is possible that results in future periods may be materially different as contracts are ultimately settled. We monitor potential losses using VaR analysis. As previously discussed, our one-day VaR at December 31, 2004, assuming a notional95 percent confidence level, was approximately $1.9 million, which means there is a 95 percent statistical chance (based on market implied volatilities) that any adverse moves in the value of our portfolio will be less than the reported amount. In addition, our five-day VaR at December 31, 2004, assuming the same 95 percent confidence level, was approximately $3.9 million.
For financial reporting purposes, assets and liabilities associated with energy trading transactions accounted for using fair value are reflected on the Balance Sheets as Energyrisk management assets current and non-current and Energy risk management liabilities current and non-current, classified as current or non-current pursuant to each contract’s length. Net gains and losses resulting from revaluation of contracts during the period are recognized currently in the Statements of Income.
85
Regulatory Accounting
CG&E, PSI, and ULH&P are regulated utility companies. Except with respect to the electric generation-related assets and liabilities of CG&E, the companies apply the provisions of Statement 71. In accordance with Statement 71, regulatory actions may result in accounting treatment different from that of non-rate regulated companies. The deferral of costs (as regulatory assets) or amounts provided in current rates to cover costs to be incurred in the future (as regulatory liabilities) may be appropriate when the future recovery or refunding of such costs is probable. In assessing probability, we consider such factors as regulatory precedent and the current regulatory environment. To the extent recovery of costs is no longer deemed probable, related regulatory assets would be required to be recognized in current period earnings. Our calculations under the fuel adjustment and emission allowance cost recovery mechanisms at PSI (and CG&E for non-residential retail customers beginning in 2005 and residential retail customers in 2006) involve the use of estimates. Fuel costs (including purchased power when economically displacing fuel) and emission allowance costs must be allocated between PSI’s retail customers and wholesale customers, with the lowest costs allocated to retail customers. This process is complex and involves the use of estimates that when finalized in future periods may result in adjustments to amounts deferred and collected from customers.
At December 31, 2004, regulatory assets totaled $609 million for CG&E (including $10 million for ULH&P) and $421 million for PSI. Current rates include the recovery of $602 million for CG&E (including $9 million for ULH&P) and $378 million for PSI. In addition to the regulatory assets, CG&E and PSI have regulatory liabilities totaling $165 million (including $30 million for ULH&P) and $392 million at December 31, 2004, respectively. See Note 1(c) of the “Notes to Financial Statements” in “Item 8. Financial Statements and Supplementary Data” for additional detail regarding regulatory assets and regulatory liabilities.
Income Taxes
Management judgment is required in developing our provision for income taxes, including the determination of deferred tax assets, deferred tax liabilities, and any valuation allowances recorded against the deferred tax assets. We evaluate quarterly the realizability of our deferred tax assets by assessing our valuation allowance and adjusting the amount of $100 million,such allowance, if necessary. The factors used to assess the likelihood of realization are our forecast of future taxable income and the availability of tax planning strategies that can be implemented to realize deferred tax assets. These tax planning strategies include the utilization of Section 29 tax credits associated with our production of synthetic fuel. Failure to achieve forecasted taxable income might affect our ability to utilize the Section 29 tax credits and the ultimate realization of deferred tax assets.
Contingencies
When it is probable that an environmental, tax, or other legal liability has been incurred, a loss is recognized when the amount of the loss can be reasonably estimated. Estimates of the probability and the amount of loss are often made based on currently available facts, present laws and regulations, and consultation with third-party experts. Accounting for contingencies requires significant judgment by management regarding the estimated probabilities and ranges of exposure to potential liability. Management’s assessment of Cinergy’s exposure to contingencies could change to the extent there are additional future developments, administrative actions, or as more information becomes available. If actual obligations incurred are different from our estimates, the recognition of the actual amounts may have a material impact on Cinergy’s financial position and results of operations.
Impairment of Long-lived Assets
Current accounting standards require long-lived assets be measured for impairment whenever indicators of impairment exist. If deemed impaired under the standards, assets are written down to fair value with a charge to current period earnings. As a producer of electricity, Cinergy, CG&E, and PSI are owners of generating plants, which are largely coal-fired. At December 31, 2004, the carrying value of these generating plants is $5 billion for Cinergy, $2 billion for CG&E and $2 billion for PSI. As a result of the various emissions and by-products of coal consumption, the companies are subject to extensive environmental regulations and are currently subject to a number of environmental contingencies. See Note 11(a) of the “Notes to Financial Statements” in “Item 8. Financial Statements and Supplementary Data” for additional information. While we cannot predict the potential
86
effect the resolution of these matters will have on the recoverability of our coal-fired generating assets, we believe that the carrying values of these assets are recoverable. In making this assessment, we consider such factors as the expected ability to recover through the regulatory process any additional investments in environmental compliance expenditures for PSI, the relative pricing of wholesale electricity in the region, the anticipated demand, and the cost of coal.
For the gas-fired peaking plants that Cinergy owns that are not subject to cost-of-service-based ratemaking, the recoverability will be dependent on many factors, but primarily the price of power compared to the cost of natural gas, often referred to as the spark spread, over the life of the plants. While we currently believe these assets are recoverable on a nominal basis (the basis required for evaluation under Statement 144 given our intent to continue operating these assets), changes in the estimates and assumptions used (primarily power and gas prices along with their related volatilities) in evaluating these assets over their useful life could result in an impairment in the future. At December 31, 2004, the carrying value of these gas-fired peaking plants is approximately $441 million.
We will continue to evaluate these assets for impairment when events or circumstances indicate the carrying value may not be recoverable.
Impairment of Unconsolidated Investments
We evaluate the recoverability of investments in unconsolidated subsidiaries when events or changes in circumstances indicate the carrying amount of the asset is other than temporarily impaired. An investment is considered impaired if the fair value of the investment is less than its carrying value. We only recognize an impairment loss when an impairment is considered to be other than temporary. We consider an impairment to be other than temporary when a forecasted recovery up to the investment’s carrying value is not expected for a reasonable period of time. We evaluate several factors, including but not limited to our intent and ability to hold the investment, the severity of the impairment, the duration of the impairment and the entity’s historical and projected financial performance, when determining whether or not impairment is other than temporary.
Fair value is determined by quoted market prices, when available, however in most instances we rely on valuations based on discounted cash flows and market multiples. There are many significant assumptions involved in performing such valuations, including but not limited to forecasted financial performance, discount rates, earnings multiples and terminal value considerations. Variations in any one or a combination of these assumptions could result in different conclusions regarding impairment.
Once an investment is considered other than temporarily impaired and an impairment loss is recognized, the carrying value of the investment is not adjusted for any subsequent recoveries in fair value. As of December 31, 2004, we do not have any material unrealized losses that are deemed to be temporary in nature. See Note 15(a) of the “Notes to Financial Statements” in “Item 8. Financial Statements and Supplementary Data” for the amount of impairment charges incurred during the year.
Accounting Changes
Consolidation of VIEs
In January 2003, the FASB issued Interpretation 46, which significantly changed the consolidation requirements for traditional SPEs and certain other entities subject to its scope. This interpretation defines a VIE as (a) an entity that does not have sufficient equity to support its activities without additional financial support or (b) any entity that has equity investors that do not have substantive voting rights, do not absorb first dollar losses, or receive residual returns. These entities must be consolidated whenever Cinergy would be anticipated to absorb greater than 50 percent of the losses or receive greater than 50 percent of the returns.
In accordance with its two stage adoption guidance, we implemented Interpretation 46 for traditional SPEs on July 1, 2003, and for all other entities, including certain operating joint ventures, as of March 31, 2004. The consolidation of certain operating joint ventures as of March 31, 2004, did not have a material impact on our financial position or results of operations.
87
On July 1, 2003, Interpretation 46 required us to consolidate two SPEs that have individual power sale agreements with Central Maine Power Company. Further, we were no longer permitted to consolidate a trust that was established by Cinergy Corp. in 2001 to issue approximately $316 million of combined preferred trust securities and stock purchase contracts. Prior period financial statements were not restated for these changes. For further information on the accounting for these entities see Notes 3(a) and (b) of the “Notes to Financial Statements” in “Item 8. Financial Statements and Supplementary Data”.
Cinergy payshas concluded that its accounts receivable sale facility, as discussed in Note 3(c) of the “Notes to Financial Statements” in “Item 8. Financial Statements and Supplementary Data”, will remain unconsolidated since it involves transfers of financial assets to a fixed ratequalifying SPE, which is exempted from consolidation by Interpretation 46 and receives a floating rate. This swap qualifies as a cash flow hedge under the provisions of Statement of Financial Accounting Standards No. 133,140, Accounting for Derivative InstrumentsTransfers and Hedging ActivitiesServicing of Financial Assets and Extinguishments of Liabilities.
(Statement 133). AsShare-Based Payment
In December 2004, the terms of the swap agreement mirror the terms of the debt agreement that it is hedging, we anticipate that this swap will be effective asFASB issued a hedge. Future changes in fair value of this swap will be recorded inAccumulated other comprehensive income (loss), beginning with our adoptionreplacement of Statement 133 effective January 1, 2001. In the future, we will continually monitor market conditions to evaluate whether to increase, or decrease, our level123, Statement of exposure to fluctuations in interest rates.
GAS INDUSTRY
Customer Choice In 1997, the state of Ohio commenced a customer choice program for the gas utility industry. This voluntary program gives residential and small commercial customers the opportunity to select their own gas supplier. Approximately two-thirds of the gas customers in the state of Ohio are eligible to participate. This program excludes large industrial, commercial, and educational institution customers because they already have the ability to select their own gas supplier.
Although the gas supplier may vary by customer,CG&E continues to provide gas transportation services for substantially all customers within its franchise territory.
In early 2001, an alternative gas supplier withinCG&E's franchise territory was removed from participating in the Ohio Gas Customer Choice program as a result of numerous violations of the terms and conditions of the program.CG&E has filed a complaint with the PUCO requesting a finding that it complied with the terms and conditions of the Ohio Gas Customer Choice program in terminating the supplier from the program.CG&E is also requesting reimbursement of its costs incurred to date in connection with this matter.CG&E estimates that the financial statement exposure is immaterial.
In early 2001,Cinergy,CG&E, and Cinergy Resources, Inc. (a former subsidiary of Investments which was sold in January 2000) were named as defendants in two class action lawsuits. These lawsuits are in connection with the above referenced alternative gas supplier's removal from the Ohio Gas Customer Choice program and its failure to deliver gas supply to its customers. At the present time,Cinergy andCG&E cannot predict the outcome of this litigation.
Gas Prices The market price of natural gas has increased significantly in 2000, which has causedCG&E andULH&P to pay more for the gas they deliver to customers. NeitherCG&E norULH&P profit from changes in the cost of gas. This cost is passed directly through to the customer—dollar-for-dollar—under the gas cost recovery mechanisms that are applicable in Ohio and Kentucky. In addition to regularly scheduled filings, bothCG&E andULH&P made several interim filings during 2000 for increased gas cost recovery rates with the PUCO and the KPSC, respectively, in order to keep the rates passed through to customers as current as possible. In January 2001, the KPSC ordered all gas distribution companies in Kentucky, includingULH&P, to begin filing and revising their gas cost recovery rate every month until further notice. We believe that the commissions will continue to allow recovery of prudently incurred gas costs.
INFLATION
We believe that the recent inflation rates do not materially impact our financial condition. However, under existing regulatory practice for all ofPSI, andULH&P, and the non-generating portion ofCG&E, only the historical cost of plant is recoverable from customers. As a result, cash flows designed to provide recovery of historical plant costs may not be adequate to replace plant in future years.
ACCOUNTING CHANGES
During 1998, the Financial Accounting Standards Board (FASB) issued Statement 133.No. 123 (revised 2004), Share-Based Payment (Statement 123R). This standard will require accounting for all stock-based compensation arrangements under the fair value method in addition to other provisions.
In 2003, we prospectively adopted accounting for our stock-based compensation plans using the fair value recognition provisions of Statement 123, as amended by Statement of Financial Accounting Standards No. 148, Accounting for Stock-Based Compensation-Transition and Disclosure, for all employee awards granted or with terms modified on or after January 1, 2003. Therefore, the impact of implementation of Statement 123R on stock options within our stock-based compensation plans is effectivenot expected to be material. Statement 123R contains certain provisions that will modify the accounting for fiscal years beginning after June 15, 2000, and requires companies to record derivative instruments as assets or liabilities, measured at fair value. Changesvarious stock-based compensation plans other than stock options. We are in the derivative's fair value must be recognized currently inprocess of evaluating the impact of this new standard on these plans. Cinergy will adopt Statement 123R on July 1, 2005.
Income Taxes
In October 2004, the American Jobs Creation Act (AJCA) was signed into law. The AJCA includes a one-time deduction of 85 percent of certain foreign earnings unless specific hedge accounting criteriathat are met. Gains and losses on derivatives that qualifyrepatriated, as hedges can offset related fair value changes on the hedged itemdefined in the income statementAJCA. In December 2004, the FASB issued Staff Position 109-2, Accounting and Disclosure Guidance for fair value hedges or be recorded in other comprehensive incomethe Foreign Earnings Repatriation Provision within the American Jobs Creation Act of 2004. The staff position allows additional time for cash flow hedges.
We will reflectan entity to evaluate the adoption of this standard in financial statements issued beginning in the first quarter of 2001. Since manyeffect of the existing relevant contracts and financial instruments are currently required to use mark-to-market accounting, we anticipatelegislation on its plan for repatriation of foreign earnings for purposes of applying Statement of Financial Accounting Standards No. 109, Accounting for Income Taxes. Cinergy will complete its evaluation of the effects of implementation to be immaterial. These effects do not reflect the potential effectsprovision on its plan for repatriation of applying mark-to-market accounting to selected call options and forwards we use to hedge peak period exposure to electricity demand. We have not historically marked these instruments to market because they are intended as hedges of peak period exposure and are not considered trading instruments. Our intent is to classify these types of instruments as normal purchases under Statement 133. However, the FASB-sponsored Derivatives Implementation Group has yet to issue its final guidance on these types of instruments. There are currently viewpoints that range from allowing them as normal purchases to not allowing hedge accounting under Statement 133. Given these issues, there is the possibility that these instruments will require mark-to-market accounting. This could create additional volatilityforeign earnings in future earnings. At December 31, 2000, the fair value of these instruments was not material.2005.
SHAREHOLDER RIGHTS PLAN
88
Reference is made to the "Market“Market Risk Sensitive Instruments and Positions"Instruments” section of "Item“Item 7. Management's Discussion and Analysis of Financial Condition and Results of Operations"MD&A”.
89
INDEX TO FINANCIAL STATEMENTS AND FINANCIAL STATEMENT SCHEDULES
FINANCIAL STATEMENTS
Independent Auditors’ Report
Cinergy Corp. and Subsidiaries
Consolidated Statements of Income for the three years ended December 31, 2004
Consolidated Balance Sheets at December 31, 2004 and 2003
|
|---|
FINANCIAL STATEMENTS |
Report of Independent Public Accountants |
Cinergy Corp. and Subsidiaries |
| Consolidated Statements of Income for the three years ended December 31, 2000 |
| Consolidated Balance Sheets at December 31, 2000, and 1999 |
| Consolidated Statements of Changes in Common Stock Equity for the three years ended December 31, 2000 |
| Consolidated Statements of Cash Flows for the three years ended December 31, 2000 |
The Cincinnati Gas & Electric Company and Subsidiaries |
| Consolidated Statements of Income for the three years ended December 31, 2000 |
| Consolidated Balance Sheets at December 31, 2000, and 1999 |
| Consolidated Statements of Changes in Common Stock Equity for the three years ended December 31, 2000 |
| Consolidated Statements of Cash Flows for the three years ended December 31, 2000 |
| Consolidated Statements of Capitalization at December 31, 2000, and 1999 |
PSI Energy, Inc. and Subsidiary |
| Consolidated Statements of Income for the three years ended December 31, 2000 |
| Consolidated Balance Sheets at December 31, 2000, and 1999 |
| Consolidated Statements of Changes in Common Stock Equity for the three years ended December 31, 2000 |
| Consolidated Statements of Cash Flows for the three years ended December 31, 2000 |
| Consolidated Statements of Capitalization at December 31, 2000, and 1999 |
The Union Light, Heat and Power Company |
| Statements of Income for the three years ended December 31, 2000 |
| Balance Sheets at December 31, 2000, and 1999 |
| Statements of Changes in Common Stock Equity for the three years ended December 31, 2000 |
| Statements of Cash Flows for the three years ended December 31, 2000 |
| Statements of Capitalization at December 31, 2000, and 1999 |
Notes to Financial Statements |
FINANCIAL STATEMENT SCHEDULES |
| Schedule II—Valuation and Qualifying Accounts |
| | Cinergy |
| | CG&E |
| | PSI |
| | ULH&P |
Consolidated Statements of Changes in Common Stock Equity for the three years ended December 31, 2004
Consolidated Statements of Cash Flows for the three years ended December 31, 2004
Consolidated Statements of Capitalization at December 31, 2004 and 2003
The Cincinnati Gas & Electric Company and Subsidiaries
Consolidated Statements of Income for the three years ended December 31, 2004
Consolidated Balance Sheets at December 31, 2004 and 2003
Consolidated Statements of Changes in Common Stock Equity for the three years ended December 31, 2004
Consolidated Statements of Cash Flows for the three years ended December 31, 2004
Consolidated Statements of Capitalization at December 31, 2004 and 2003
PSI Energy, Inc. and Subsidiary
Consolidated Statements of Income for the three years ended December 31, 2004
Consolidated Balance Sheets at December 31, 2004 and 2003
Consolidated Statements of Changes in Common Stock Equity for the three years ended December 31, 2004
Consolidated Statements of Cash Flows for the three years ended December 31, 2004
Consolidated Statements of Capitalization at December 31, 2004 and 2003
The Union Light, Heat and Power Company
Statements of Income for the three years ended December 31, 2004
Balance Sheets at December 31, 2004 and 2003
Statements of Changes in Common Stock Equity for the three years ended December 31, 2004
Statements of Cash Flows for the three years ended December 31, 2004
Statements of Capitalization at December 31, 2004 and 2003
Notes to Financial Statements
FINANCIAL STATEMENT SCHEDULES
Schedule II - Valuation and Qualifying Accounts
Cinergy Corp. and Subsidiaries
The Cincinnati Gas & Electric Company and Subsidiaries
PSI Energy, Inc. and Subsidiary
The Union Light, Heat and Power Company
The information required to be submitted in schedules other than those indicated above haspreviously, have been included in the Balance Sheets, the Statements of Income, related schedules, the notes thereto, or omitted as not required by the Rules of Regulation S-X.
90
ITEM 8. FINANCIAL STATEMENTS AND SUPPLEMENTARY DATA
REPORT OF INDEPENDENT REGISTERED PUBLIC ACCOUNTANTS
ACCOUNTING FIRM
To the Board of Directors of Cinergy Corp., The Cincinnati Gas & Electric Company, PSI Energy, Inc., and The Union Light, Heat and Power Company::
We have audited the financialaccompanying consolidated balance sheets and statements of capitalization of Cinergy Corp. (a Delaware Corporation), The Cincinnati Gas & Electric Company (an Ohio Corporation), PSI Energy, Inc. (an Indiana Corporation) and The Union Light, Heat and Power Company (a Kentucky Corporation),subsidiaries as of December 31, 20002004 and 1999,2003, and the related consolidated statements of income, changes in common stock equity, and cash flows for each of the three years in the period ended December 31, 2000, as listed on2004. Our audits also included the index.financial statement schedule included in Item 15 of this Annual Report. These financial statements and the schedules referred to belowfinancial statement schedule are the responsibility of the Company'sCompany’s management. Our responsibility is to express an opinion on these financial statements and financial statement schedule based on our audits.
We conducted our audits in accordance with auditingthe standards generally accepted inof the United States.Public Company Accounting Oversight Board (United States). Those standards require that we plan and perform the audit to obtain reasonable assurance about whether the financial statements are free of material misstatement. An audit includes examining, on a test basis, evidence supporting the amounts and disclosures in the financial statements. An audit also includes assessing the accounting principles used and significant estimates made by management, as well as evaluating the overall financial statement presentation. We believe that our audits provide a reasonable basis for our opinion.
In our opinion, thesuch consolidated financial statements referred to above present fairly, in all material respects, the financial position of Cinergy Corp., The Cincinnati Gas & Electric Company, PSI Energy, Inc., and The Union Light, Heat and Power Companysubsidiaries as of December 31, 20002004 and 1999,2003, and the results of their operations and their cash flows for each of the three years in the period ended December 31, 2000,2004, in conformity with accounting principles generally accepted in the United States.
Our audits were made forStates of America. Also, in our opinion, the purpose of forming an opinion onfinancial statement schedule, when considered in relation to the basic consolidated financial statements taken as a whole.whole, presents fairly in all material respects the information set forth therein.
As discussed in Note 1 to the financial statements, in 2003, Cinergy Corp. adopted Statement of Financial Accounting Standards (SFAS) No. 143, “Accounting for Asset Retirement Obligations;” Financial Accounting Standards Board Interpretation No. 46, “Consolidation of Variable Interest Entities;” and the fair value recognition provisions of SFAS No. 123 “Accounting for Stock-Based Compensation.”
We have also audited, in accordance with the standards of the Public Company Accounting Oversight Board (United States), the effectiveness of the Company’s internal control over financial reporting as of December 31, 2004, based on the criteria established in Internal Control—Integrated Framework issued by the Committee of Sponsoring Organizations of the Treadway Commission and our report dated February 11, 2005 expressed an unqualified opinion on management’s assessment of the effectiveness of the Company’s internal control over financial reporting and an unqualified opinion on the effectiveness of the Company’s internal control over financial reporting.
/s/ Deloitte & Touche LLP | |
Deloitte & Touche LLP | |
| |
Cincinnati, Ohio | |
February 11, 2005 | |
91
REPORT OF INDEPENDENT REGISTERED PUBLIC ACCOUNTING FIRM
To the Board of Directors of The schedules listedCincinnati Gas & Electric Company:
We have audited the accompanying consolidated balance sheets and statements of capitalization of The Cincinnati Gas & Electric Company and subsidiaries as of December 31, 2004 and 2003, and the related consolidated statements of income, changes in common stock equity, and cash flows for each of the three years in the index pursuant toperiod ended December 31, 2004. Our audits also included the financial statement schedule included in Item 14, are presented for purposes15 of complying with the Securities and Exchange Commission's Rules of 1934 and are not part of the basic financial statements. The schedules have been subjected to the auditing procedures applied in our audits of the basicthis Annual Report. These financial statements and the financial statement schedule are the responsibility of the Company’s management. Our responsibility is to express an opinion on these financial statements and financial statement schedule based on our audits.
We conducted our audits in accordance with the standards of the Public Company Accounting Oversight Board (United States). Those standards require that we plan and perform the audit to obtain reasonable assurance about whether the financial statements are free of material misstatement. An audit includes consideration of internal control over financial reporting as a basis for designing audit procedures that are appropriate in the circumstances, but not for the purpose of expressing an opinion on the effectiveness of the Company’s internal control over financial reporting. Accordingly, we express no such opinion. An audit also includes examining, on a test basis, evidence supporting the amounts and disclosures in the financial statements, assessing the accounting principles used and significant estimates made by management, as well as evaluating the overall financial statement presentation. We believe that our audits provide a reasonable basis for our opinion.
In our opinion, such consolidated financial statements present fairly, state in all material respects, the financial data requiredposition of The Cincinnati Gas & Electric Company and subsidiaries as of December 31, 2004 and 2003, and the results of their operations and their cash flows for each of the three years in the period ended December 31, 2004, in conformity with accounting principles generally accepted in the United States of America. Also, in our opinion, the financial statement schedule, when considered in relation to bethe basic consolidated financial statements taken as a whole, presents fairly in all material respects the information set forth thereintherein.
As discussed in Note 1 to the financial statements, in 2003, The Cincinnati Gas & Electric Company adopted Statement of Financial Accounting Standards (SFAS) No. 143, “Accounting for Asset Retirement Obligations.”
/s/ Deloitte & Touche LLP | |
Deloitte & Touche LLP | |
| |
Cincinnati, Ohio | |
February 11, 2005 | |
92
REPORT OF INDEPENDENT REGISTERED PUBLIC ACCOUNTING FIRM
To the Board of Directors of PSI Energy, Inc.:
We have audited the accompanying consolidated balance sheets and statements of capitalization of PSI Energy, Inc. and subsidiary as of December 31, 2004 and 2003, and the related consolidated statements of income, changes in common stock equity, and cash flows for each of the three years in the period ended December 31, 2004. Our audits also included the financial statement schedule included in Item 15 of this Annual Report. These financial statements and the financial statement schedule are the responsibility of the Company’s management. Our responsibility is to express an opinion on these financial statements and financial statement schedule based on our audits.
We conducted our audits in accordance with the standards of the Public Company Accounting Oversight Board (United States). Those standards require that we plan and perform the audit to obtain reasonable assurance about whether the financial statements are free of material misstatement. An audit includes consideration of internal control over financial reporting as a basis for designing audit procedures that are appropriate in the circumstances, but not for the purpose of expressing an opinion on the effectiveness of the Company’s internal control over financial reporting. Accordingly, we express no such opinion. An audit also includes examining, on a test basis, evidence supporting the amounts and disclosures in the financial statements, assessing the accounting principles used and significant estimates made by management, as well as evaluating the overall financial statement presentation. We believe that our audits provide a reasonable basis for our opinion.
In our opinion, such consolidated financial statements present fairly, in all material respects, the financial position of PSI Energy, Inc. and subsidiary as of December 31, 2004 and 2003, and the results of their operations and their cash flows for each of the three years in the period ended December 31, 2004, in conformity with accounting principles generally accepted in the United States of America. Also, in our opinion, the financial statement schedule, when considered in relation to the basic consolidated financial statements taken as a whole, presents fairly in all material respects the information set forth therein.
As discussed in Note 1 to the financial statements, in 2003, PSI Energy, Inc. adopted Statement of Financial Accounting Standards (SFAS) No. 143, “Accounting for Asset Retirement Obligations.”
/s/ Deloitte & Touche LLP | |
Deloitte & Touche LLP | |
| |
Cincinnati, Ohio | |
February 11, 2005 | |
93
REPORT OF INDEPENDENT REGISTERED PUBLIC ACCOUNTING FIRM
To the Board of Directors of The Union Light, Heat and Power Company:
We have audited the accompanying balance sheets and statements of capitalization of The Union Light, Heat and Power Company as of December 31, 2004 and 2003, and the related statements of income, changes in common stock equity, and cash flows for each of the three years in the period ended December 31, 2004. Our audits also included the financial statement schedule included in Item 15 of this Annual Report. These financial statements and the financial statement schedule are the responsibility of the Company’s management. Our responsibility is to express an opinion on these financial statements and financial statement schedule based on our audits.
We conducted our audits in accordance with the standards of the Public Company Accounting Oversight Board (United States). Those standards require that we plan and perform the audit to obtain reasonable assurance about whether the financial statements are free of material misstatement. An audit includes consideration of internal control over financial reporting as a basis for designing audit procedures that are appropriate in the circumstances, but not for the purpose of expressing an opinion on the effectiveness of the Company’s internal control over financial reporting. Accordingly, we express no such opinion. An audit also includes examining, on a test basis, evidence supporting the amounts and disclosures in the financial statements, assessing the accounting principles used and significant estimates made by management, as well as evaluating the overall financial statement presentation. We believe that our audits provide a reasonable basis for our opinion.
In our opinion, such financial statements present fairly, in all material respects, the financial position of The Union Light, Heat and Power Company as of December 31, 2004 and 2003, and the results of their operations and their cash flows for each of the three years in the period ended December 31, 2004, in conformity with accounting principles generally accepted in the United States of America. Also, in our opinion, the financial statement schedule, when considered in relation to the basic financial statements taken as a whole.whole, presents fairly in all material respects the information set forth therein.
Arthur Andersen LLP
Cincinnati, Ohio
January 23, 2001
As discussed in Note 1 to the financial statements, in 2003, The Union Light, Heat and Power Company adopted Statement of Financial Accounting Standards (SFAS) No. 143, “Accounting for Asset Retirement Obligations.”
/s/ Deloitte & Touche LLP | |
Deloitte & Touche LLP | |
| |
Cincinnati, Ohio | |
February 11, 2005 | |
94
CINERGY CORP.
CONSOLIDATED STATEMENTS OF INCOME
| | 2000
| | 1999
| | 1998
| |
|---|
| | (dollars in thousands, except per share amounts)
| |
|---|
| Operating Revenues | | | | | | | | | | |
| | Electric | | $ | 5,384,082 | | $ | 4,312,899 | | $ | 4,763,289 | |
| | Gas | | | 2,941,753 | | | 1,596,146 | | | 1,099,629 | |
| | Other | | | 96,129 | | | 28,843 | | | 48,373 | |
| | |
| |
| |
| |
| | | Total Operating Revenues | | | 8,421,964 | | | 5,937,888 | | | 5,911,291 | |
Operating Expenses |
|
|
|
|
|
|
|
|
|
|
| | Fuel and purchased and exchanged power | | | 3,154,213 | | | 2,260,297 | | | 2,853,866 | |
| | Gas purchased | | | 2,674,449 | | | 1,383,993 | | | 894,945 | |
| | Operation and maintenance | | | 1,089,363 | | | 981,054 | | | 976,289 | |
| | Depreciation and amortization | | | 373,965 | | | 353,820 | | | 326,492 | |
| | Taxes other than income taxes | | | 268,346 | | | 265,501 | | | 274,635 | |
| | |
| |
| |
| |
| | | Total Operating Expenses | | | 7,560,336 | | | 5,244,665 | | | 5,326,227 | |
Operating Income |
|
|
861,628 |
|
|
693,223 |
|
|
585,064 |
|
Equity in Earnings of Unconsolidated Subsidiaries |
|
|
5,048 |
|
|
58,021 |
|
|
51,484 |
|
Gain on Sale of Investment in Unconsolidated
Subsidiary (Note 10) | | | — | | | 99,272 | | | — | |
| Miscellaneous—Net | | | 13,391 | | | 2,031 | | | (8,289 | ) |
| Interest | | | 224,459 | | | 234,778 | | | 243,587 | |
| | |
| |
| |
| |
| Income Before Taxes | | | 655,608 | | | 617,769 | | | 384,672 | |
Income Taxes(Note 11) |
|
|
251,557 |
|
|
208,671 |
|
|
117,187 |
|
| Preferred Dividend Requirements of Subsidiaries | | | 4,585 | | | 5,457 | | | 6,517 | |
| | |
| |
| |
| |
| Net Income | | $ | 399,466 | | $ | 403,641 | | $ | 260,968 | |
| | |
| |
| |
| |
| Average Common Shares Outstanding | | | 158,938 | | | 158,863 | | | 158,238 | |
Earnings Per Common Share(Note 16) |
|
|
|
|
|
|
|
|
|
|
| | Net Income | | $ | 2.51 | | $ | 2.54 | | $ | 1.65 | |
Earnings Per Common Share—Assuming Dilution(Note 16) |
|
|
|
|
|
|
|
|
|
|
| | Net Income | | $ | 2.50 | | $ | 2.53 | | $ | 1.65 | |
Dividends Declared Per Common Share |
|
$ |
1.80 |
|
$ |
1.80 |
|
$ |
1.80 |
|
| | 2004 | | 2003 | | 2002 | |
| | (in thousands, except per share amounts) | |
| | | | | | | |
Operating Revenues (Note 1(d)) | | | | | | | |
Electric | | $ | 3,536,649 | | $ | 3,320,256 | | $ | 3,256,437 | |
Gas | | 783,316 | | 835,507 | | 590,471 | |
Other (Note 1(d)(iii)) | | 367,985 | | 260,114 | | 212,444 | |
Total Operating Revenues | | 4,687,950 | | 4,415,877 | | 4,059,352 | |
| | | | | | | |
Operating Expenses | | | | | | | |
Fuel, emission allowances, and purchased power | | 1,244,027 | | 1,136,950 | | 950,463 | |
Gas purchased | | 428,087 | | 503,834 | | 309,983 | |
Costs of fuel resold | | 280,891 | | 196,974 | | 130,286 | |
Operation and maintenance | | 1,282,278 | | 1,118,680 | | 1,201,564 | |
Depreciation | | 460,389 | | 398,871 | | 403,909 | |
Taxes other than income taxes | | 253,945 | | 249,746 | | 263,002 | |
Total Operating Expenses | | 3,949,617 | | 3,605,055 | | 3,259,207 | |
| | | | | | | |
Operating Income | | 738,333 | | 810,822 | | 800,145 | |
| | | | | | | |
Equity in Earnings of Unconsolidated Subsidiaries | | 48,249 | | 15,201 | | 15,261 | |
Miscellaneous Income (Expense) - Net | | (3,213 | ) | 38,156 | | 12,402 | |
Interest Expense | | 275,238 | | 270,874 | | 243,652 | |
Preferred Dividend Requirement of Subsidiary Trust (Note 3(b)) | | — | | 11,940 | | 23,832 | |
Preferred Dividend Requirements of Subsidiaries | | 3,432 | | 3,433 | | 3,433 | |
| | | | | | | |
Income Before Taxes | | 504,699 | | 577,932 | | 556,891 | |
| | | | | | | |
Income Taxes (Note 10) | | 103,831 | | 143,508 | | 160,255 | |
| | | | | | | |
Income Before Discontinued Operations and Cumulative Effect of Changes in Accounting Principles | | 400,868 | | 434,424 | | 396,636 | |
| | | | | | | |
Discontinued operations, net of tax (Note 14) | | — | | 8,886 | | (25,161 | ) |
Cumulative effect of changes in accounting principles, net of tax (Note 1(q)(iv)) | | — | | 26,462 | | (10,899 | ) |
Net Income | | $ | 400,868 | | $ | 469,772 | | $ | 360,576 | |
| | | | | | | |
Average Common Shares Outstanding - Basic | | 180,965 | | 176,535 | | 167,047 | |
| | | | | | | |
Earnings Per Common Share - Basic (Note 17) | | | | | | | |
Income before discontinued operations and cumulative effect of changes in accounting principles | | $ | 2.22 | | $ | 2.46 | | $ | 2.37 | |
Discontinued operations, net of tax (Note 14) | | — | | 0.05 | | (0.15 | ) |
Cumulative effect of changes in accounting principles, net of tax (Note 1(q)(iv)) | | — | | 0.15 | | (0.06 | ) |
Net Income | | $ | 2.22 | | $ | 2.66 | | $ | 2.16 | |
| | | | | | | |
Average Common Shares Outstanding - Diluted | | 183,531 | | 178,473 | | 169,052 | |
| | | | | | | |
Earnings Per Common Share - Diluted (Note 17) | | | | | | | |
Income before discontinued operations and cumulative effect of changes in accounting principles | | $ | 2.18 | | $ | 2.43 | | $ | 2.34 | |
Discontinued operations, net of tax (Note 14) | | — | | 0.05 | | (0.15 | ) |
Cumulative effect of changes in accounting principles, net of tax (Note 1(q)(iv)) | | — | | 0.15 | | (0.06 | ) |
Net Income | | $ | 2.18 | | $ | 2.63 | | $ | 2.13 | |
| | | | | | | |
Cash Dividends Declared Per Common Share | | $ | 1.88 | | $ | 1.84 | | $ | 1.80 | |
The accompanying notes as they relate to Cinergy Corp. are an
integral part of these consolidated financial statements.
96
CINERGY CORP.
CONSOLIDATED BALANCE SHEETS
| | December 31
|
|---|
ASSETS
| | 2000
| | 1999
|
|---|
| | (dollars in thousands)
|
|---|
| Current Assets | | | | | | |
| | Cash and cash equivalents | | $ | 93,054 | | $ | 81,919 |
| | Restricted deposits | | | 4,195 | | | 628 |
| | Notes receivable | | | 35,945 | | | 481 |
| | Accounts receivable less accumulated provision for doubtful accounts of $29,951 at December 31, 2000, and $26,811 at December��31, 1999 (Note 6) | | | 1,623,402 | | | 706,068 |
| | Materials, supplies, and fuel—at average cost | | | 159,340 | | | 205,749 |
| | Prepayments and other | | | 129,666 | | | 77,701 |
| | Energy risk management current assets (Note 1(j)) | | | 1,413,281 | | | 131,145 |
| | |
| |
|
| | | | | Total Current Assets | | | 3,458,883 | | | 1,203,691 |
Utility Plant—Original Cost |
|
|
|
|
|
|
| | In service | | | | | | |
| | | Electric | | | 9,698,128 | | | 9,414,744 |
| | | Gas | | | 865,303 | | | 824,427 |
| | | Common | | | 211,424 | | | 189,124 |
| | |
| |
|
| | | | Total | | | 10,774,855 | | | 10,428,295 |
| | Accumulated depreciation | | | 4,555,614 | | | 4,259,877 |
| | |
| |
|
| | | | Total | | | 6,219,241 | | | 6,168,418 |
| | Construction work in progress | | | 411,183 | | | 249,054 |
| | |
| |
|
| | | | | Total Utility Plant | | | 6,630,424 | | | 6,417,472 |
Other Assets |
|
|
|
|
|
|
| | Regulatory assets (Note 1(c)) | | | 976,614 | | | 1,055,012 |
| | Investments in unconsolidated subsidiaries | | | 538,322 | | | 358,853 |
| | Energy risk management non-current assets (Note 1(j)) | | | 37,228 | | | 26,624 |
| | Other | | | 688,257 | | | 555,296 |
| | |
| |
|
| | | | | Total Other Assets | | | 2,240,421 | | | 1,995,785 |
Total Assets |
|
$ |
12,329,728 |
|
$ |
9,616,948 |
| | |
| |
|
ASSETS | | | | | |
| | December 31 | |
| | 2004 | | 2003 | |
| | (dollars in thousands) | |
Current Assets | | | | | |
Cash and cash equivalents | | $ | 164,541 | | $ | 169,120 | |
Notes receivable, current | | 214,513 | | 189,854 | |
Accounts receivable less accumulated provision for doubtful accounts of $5,514 at December 31, 2004, and $7,884 at December 31, 2003 (Note 3(c)) | | 1,061,140 | | 1,074,518 | |
Fuel, emission allowances, and supplies (Note 1(g)) | | 444,750 | | 357,625 | |
Energy risk management current assets (Note 1(k)(i)) | | 381,146 | | 305,058 | |
Prepayments and other | | 174,624 | | 146,422 | |
Total Current Assets | | 2,440,714 | | 2,242,597 | |
| | | | | |
Property, Plant, and Equipment - at Cost | | | | | |
Utility plant in service (Note 19) | | 10,076,468 | | 9,732,123 | |
Construction work in progress | | 333,687 | | 275,459 | |
Total Utility Plant | | 10,410,155 | | 10,007,582 | |
Non-regulated property, plant, and equipment (Note 19) | | 4,700,009 | | 4,527,943 | |
Accumulated depreciation (Note 1(h)(i)) | | 5,180,699 | | 4,908,019 | |
Net Property, Plant, and Equipment | | 9,929,465 | | 9,627,506 | |
| | | | | |
Other Assets | | | | | |
Regulatory assets (Note 1(c)) | | 1,030,333 | | 1,029,242 | |
Investments in unconsolidated subsidiaries | | 513,675 | | 494,520 | |
Energy risk management non-current assets (Note 1(k)(i)) | | 138,787 | | 97,334 | |
Notes receivable, non-current | | 193,857 | | 213,853 | |
Other investments | | 125,367 | | 184,044 | |
Goodwill and other intangible assets | | 60,502 | | 45,349 | |
Restricted funds held in trust | | 358,006 | | — | |
Other | | 191,611 | | 180,260 | |
Total Other Assets | | 2,612,138 | | 2,244,602 | |
| | | | | |
Assets of Discontinued Operations (Note 14) | | — | | 4,501 | |
| | | | | |
Total Assets | | $ | 14,982,317 | | $ | 14,119,206 | |
The accompanying notes as they relate to Cinergy Corp. are an
integral part of these consolidated financial statements.
97
CINERGY CORP.
CONSOLIDATED BALANCE SHEETS
| | December 31
| |
|---|
LIABILITIES AND SHAREHOLDERS' EQUITY
| | 2000
| | 1999
| |
|---|
| | (dollars in thousands)
| |
|---|
| Current Liabilities | | | | | | | |
| | Accounts payable | | $ | 1,496,494 | | $ | 734,937 | |
| | Accrued taxes | | | 247,006 | | | 219,266 | |
| | Accrued interest | | | 47,351 | | | 49,354 | |
| | Notes payable and other short-term obligations (Note 5) | | | 1,128,657 | | | 550,194 | |
| | Long-term debt due within one year (Note 4) | | | 40,545 | | | 31,000 | |
| | Energy risk management current liabilities (Note 1(j)) | | | 1,456,375 | | | 126,682 | |
| | Other | | | 106,679 | | | 76,774 | |
| | |
| |
| |
| | | | | Total Current Liabilities | | | 4,523,107 | | | 1,788,207 | |
Non-Current Liabilities |
|
|
|
|
|
|
|
| | Long-term debt (Notes 4 and 17) | | | 2,876,367 | | | 2,989,242 | |
| | Deferred income taxes (Note 11) | | | 1,185,968 | | | 1,174,818 | |
| | Unamortized investment tax credits | | | 137,965 | | | 147,550 | |
| | Accrued pension and other postretirement benefit costs (Note 9) | | | 411,361 | | | 355,917 | |
| | Energy risk management non-current liabilities (Note 1(j)) | | | 97,507 | | | 132,041 | |
| | Other | | | 245,658 | | | 282,855 | |
| | |
| |
| |
| | | | | Total Non-Current Liabilities | | | 4,954,826 | | | 5,082,423 | |
Total Liabilities |
|
|
9,477,933 |
|
|
6,870,630 |
|
Cumulative Preferred Stock of Subsidiaries(Note 3) |
|
|
|
|
|
|
|
| |
Not subject to mandatory redemption |
|
|
62,834 |
|
|
92,597 |
|
Common Stock Equity(Note 2) |
|
|
|
|
|
|
|
| | Common Stock—$.01 par value; authorized shares—600,000,000; outstanding shares—158,967,661 at December 31, 2000, and 158,923,399 at December 31, 1999 | | | 1,590 | | | 1,589 | |
| | Paid-in capital | | | 1,619,153 | | | 1,597,554 | |
| | Retained earnings | | | 1,179,113 | | | 1,064,319 | |
| | Accumulated other comprehensive income (loss) | | | (10,895 | ) | | (9,741 | ) |
| | |
| |
| |
| | | | | Total Common Stock Equity | | | 2,788,961 | | | 2,653,721 | |
Commitments and Contingencies(Note 12) |
|
|
|
|
|
|
|
Total Liabilities and Shareholders' Equity |
|
$ |
12,329,728 |
|
$ |
9,616,948 |
|
| | |
| |
| |
LIABILITIES AND SHAREHOLDERS’ EQUITY | | | | | |
| | December 31 | |
| | 2004 | | 2003 | |
| | (dollars in thousands) | |
Current Liabilities | | | | | |
Accounts payable | | $ | 1,348,576 | | $ | 1,240,423 | |
Accrued taxes | | 216,804 | | 217,993 | |
Accrued interest | | 54,473 | | 68,952 | |
Notes payable and other short-term obligations (Note 5) | | 958,910 | | 351,412 | |
Long-term debt due within one year | | 219,967 | | 839,103 | |
Energy risk management current liabilities (Note 1(k)(i)) | | 310,741 | | 296,122 | |
Other | | 171,188 | | 107,438 | |
Total Current Liabilities | | 3,280,659 | | 3,121,443 | |
| | | | | |
Non-Current Liabilities | | | | | |
Long-term debt (Note 4) | | 4,227,741 | | 4,131,909 | |
Deferred income taxes (Note 10) | | 1,597,120 | | 1,557,981 | |
Unamortized investment tax credits | | 99,723 | | 108,884 | |
Accrued pension and other postretirement benefit costs (Note 9) | | 688,277 | | 662,834 | |
Regulatory liabilities (Note 1(c)) | | 557,419 | | 490,856 | |
Energy risk management non-current liabilities (Note 1(k)(i)) | | 127,340 | | 64,861 | |
Other | | 225,298 | | 205,344 | |
Total Non-Current Liabilities | | 7,522,918 | | 7,222,669 | |
| | | | | |
Liabilities of Discontinued Operations (Note 14) | | — | | 11,594 | |
| | | | | |
Commitments and Contingencies (Note 11) | | | | | |
| | | | | |
Total Liabilities | | 10,803,577 | | 10,355,706 | |
| | | | | |
Cumulative Preferred Stock of Subsidiaries | | | | | |
Not subject to mandatory redemption | | 62,818 | | 62,818 | |
| | | | | |
Common Stock Equity (Note 2) | | | | | |
Common stock - $.01 par value; authorized shares - 600,000,000; issued shares - 187,653,506 at December 31, 2004, and
178,438,369 at December 31, 2003; outstanding shares - 187,524,229 at December 31, 2004, and 178,336,854 at December 31, 2003 | | 1,877 | | 1,784 | |
Paid-in capital | | 2,559,715 | | 2,195,985 | |
Retained earnings | | 1,613,340 | | 1,551,003 | |
Treasury shares at cost - 129,277 shares at December 31, 2004, and 101,515 shares at December 31, 2003 | | (4,336 | ) | (3,255 | ) |
Accumulated other comprehensive loss (Note 18) | | (54,674 | ) | (44,835 | ) |
Total Common Stock Equity | | 4,115,922 | | 3,700,682 | |
| | | | | |
Total Liabilities and Shareholders’ Equity | | $ | 14,982,317 | | $ | 14,119,206 | |
| | | | | |
The accompanying notes as they relate to Cinergy Corp. are an
integral part of these consolidated financial statements.
98
CINERGY CORP.
CONSOLIDATED STATEMENTS OF CHANGES IN COMMON STOCK EQUITY
| | Common
Stock
| | Paid-in
Capital
| | Retained
Earnings
| | Accumulated
Other
Comprehensive
Income (Loss)
| | Total
Common Stock
Equity
| |
|---|
| | (dollars in thousands)
| |
|---|
| 1998 | | | | | | | | | | | | | | | | |
| Beginning balance | | $ | 1,577 | | $ | 1,573,064 | | $ | 967,420 | | $ | (2,861 | ) | $ | 2,539,200 | |
| Comprehensive income: | | | | | | | | | | | | | | | | |
| | Net income | | | — | | | — | | | 260,968 | | | — | | | 260,968 | |
| | Other comprehensive income (loss), net of tax effect of $(1,815) | | | | | | | | | | | | | | | | |
| | | Foreign currency translation adjustment | | | — | | | — | | | — | | | 2,160 | | | 2,160 | |
| | | Minimum pension liability adjustment | | | — | | | — | | | — | | | (106 | ) | | (106 | ) |
| | | | | | | | | | | | | | |
| |
| | Total comprehensive income | | | — | | | — | | | — | | | — | | | 263,022 | |
Issuance of 919,874 shares of common stock—net |
|
|
10 |
|
|
30,225 |
|
|
— |
|
|
— |
|
|
30,235 |
|
| Treasury shares purchased | | | (3 | ) | | (8,205 | ) | | — | | | — | | | (8,208 | ) |
| Treasury shares reissued | | | 3 | | | 12,455 | | | — | | | — | | | 12,458 | |
| Dividends on common stock | | | — | | | — | | | (284,703 | ) | | — | | | (284,703 | ) |
| Other | | | — | | | (12,302 | ) | | 1,529 | | | — | | | (10,773 | ) |
| | |
| |
| |
| |
| |
| |
| Ending balance | | $ | 1,587 | | $ | 1,595,237 | | $ | 945,214 | | $ | (807 | ) | $ | 2,541,231 | |
1999 |
|
|
|
|
|
|
|
|
|
|
|
|
|
|
|
|
| Comprehensive income: | | | | | | | | | | | | | | | | |
| | Net income | | | — | | | — | | | 403,641 | | | — | | | 403,641 | |
| | Other comprehensive income (loss), net of tax effect of $5,289 | | | | | | | | | | | | | | | | |
| | | Foreign currency translation adjustment | | | — | | | — | | | — | | | (9,781 | ) | | (9,781 | ) |
| | | Minimum pension liability adjustment | | | — | | | — | | | — | | | (1,239 | ) | | (1,239 | ) |
| | | Unrealized gain (loss) on grantor and rabbi trusts | | | — | | | — | | | — | | | 2,086 | | | 2,086 | |
| | | | | | | | | | | | | | |
| |
| | Total comprehensive income | | | — | | | — | | | — | | | — | | | 394,707 | |
Issuance of 258,867 shares of common stock—net |
|
|
2 |
|
|
6,720 |
|
|
— |
|
|
— |
|
|
6,722 |
|
| Treasury shares purchased | | | — | | | (233 | ) | | — | | | — | | | (233 | ) |
| Treasury shares reissued | | | — | | | 3,660 | | | — | | | — | | | 3,660 | |
| Dividends on common stock | | | — | | | — | | | (284,545 | ) | | — | | | (284,545 | ) |
| Other | | | — | | | (7,830 | ) | | 9 | | | — | | | (7,821 | ) |
| | |
| |
| |
| |
| |
| |
| Ending balance | | $ | 1,589 | | $ | 1,597,554 | | $ | 1,064,319 | | $ | (9,741 | ) | $ | 2,653,721 | |
2000 |
|
|
|
|
|
|
|
|
|
|
|
|
|
|
|
|
| Comprehensive income: | | | | | | | | | | | | | | | | |
| | Net income | | | — | | | — | | | 399,466 | | | — | | | 399,466 | |
| | Other comprehensive income (loss), net of tax effect of $2,755 | | | | | | | | | | | | | | | | |
| | | Foreign currency translation adjustment | | | — | | | — | | | — | | | 2,074 | | | 2,074 | |
| | | Minimum pension liability adjustment | | | — | | | — | | | — | | | (1,099 | ) | | (1,099 | ) |
| | | Unrealized gain (loss) on grantor and rabbi trusts | | | — | | | — | | | — | | | (2,129 | ) | | (2,129 | ) |
| | | | | | | | | | | | | | |
| |
| | Total comprehensive income | | | — | | | — | | | — | | | — | | | 398,312 | |
Issuance of 44,262 shares of common stock—net |
|
|
1 |
|
|
1,769 |
|
|
— |
|
|
— |
|
|
1,770 |
|
| Treasury shares purchased | | | — | | | (3,969 | ) | | — | | | — | | | (3,969 | ) |
| Treasury shares reissued | | | — | | | 16,264 | | | — | | | — | | | 16,264 | |
| Dividends on common stock | | | — | | | — | | | (285,242 | ) | | — | | | (285,242 | ) |
| Other | | | — | | | 7,535 | | | 570 | | | — | | | 8,105 | |
| | |
| |
| |
| |
| |
| |
| Ending balance | | $ | 1,590 | | $ | 1,619,153 | | $ | 1,179,113 | | $ | (10,895 | ) | $ | 2,788,961 | |
| | |
| |
| |
| |
| |
| |
| | | | | | | | | | Accumulated | | Total | |
| | | | | | | | | | Other | | Common | |
| | Common | | Paid-in | | Retained | | Treasury | | Comprehensive | | Stock | |
| | Stock | | Capital | | Earnings | | Stock | | Income (Loss) | | Equity | |
| | (dollars in thousands, except per share amounts) | |
| | | | | | | | | | | | | |
2002 | | | | | | | | | | | | | |
Beginning balance (159,402,839 shares) | | $ | 1,594 | | $ | 1,619,659 | | $ | 1,337,135 | | $ | — | | $ | (16,929 | ) | $ | 2,941,459 | |
| | | | | | | | | | | | | |
Comprehensive income: | | | | | | | | | | | | | |
Net income | | | | | | 360,576 | | | | | | 360,576 | |
Other comprehensive income (loss), net of tax effect of $11,509 (Note 18) | | | | | | | | | | | | | |
Foreign currency translation adjustment, net of reclassification adjustments (Note 1(r)) | | | | | | | | | | 25,917 | | 25,917 | |
Minimum pension liability adjustment | | | | | | | | | | (13,763 | ) | (13,763 | ) |
Unrealized loss on investment trusts | | | | | | | | | | (5,277 | ) | (5,277 | ) |
Cash flow hedges (Note 1(k)(ii)) | | | | | | | | | | (19,748 | ) | (19,748 | ) |
Total comprehensive income | | | | | | | | | | | | 347,705 | |
| | | | | | | | | | | | | |
Issuance of common stock - net (9,260,276 shares) | | 93 | | 267,768 | | | | | | | | 267,861 | |
Dividends on common stock ($1.80 per share) | | | | | | (298,292 | ) | | | | | (298,292 | ) |
Other | | | | 30,709 | | 4,034 | | | | | | 34,743 | |
Ending balance (168,663,115 shares) | | $ | 1,687 | | $ | 1,918,136 | | $ | 1,403,453 | | $ | — | | $ | (29,800 | ) | $ | 3,293,476 | |
| | | | | | | | | | | | | |
2003 | | | | | | | | | | | | | |
Comprehensive income: | | | | | | | | | | | | | |
Net income | | | | | | 469,772 | | | | | | 469,772 | |
Other comprehensive income (loss), net of tax effect of $11,700 (Note 18) | | | | | | | | | | | | | |
Foreign currency translation adjustment, net of reclassification adjustments (Note 1(r)) | | | | | | | | | | 10,528 | | 10,528 | |
Minimum pension liability adjustment | | | | | | | | | | (33,846 | ) | (33,846 | ) |
Unrealized gain on investment trusts | | | | | | | | | | 6,757 | | 6,757 | |
Cash flow hedges (Note 1(k)(ii)) | | | | | | | | | | 1,526 | | 1,526 | |
Total comprehensive income | | | | | | | | | | | | 454,737 | |
| | | | | | | | | | | | | |
Issuance of common stock - net (9,775,254 shares) | | 97 | | 269,977 | | | | | | | | 270,074 | |
Treasury shares purchased (101,515 shares) | | | | | | | | (3,255 | ) | | | (3,255 | ) |
Dividends on common stock ($1.84 per share) | | | | | | (322,371 | ) | | | | | (322,371 | ) |
Other | | | | 7,872 | | 149 | | | | | | 8,021 | |
Ending balance (178,336,854 shares) | | $ | 1,784 | | $ | 2,195,985 | | $ | 1,551,003 | | $ | (3,255 | ) | $ | (44,835 | ) | $ | 3,700,682 | |
| | | | | | | | | | | | | |
2004 | | | | | | | | | | | | | |
Comprehensive income: | | | | | | | | | | | | | |
Net income | | | | | | 400,868 | | | | | | 400,868 | |
Other comprehensive income (loss), net of tax effect of $8,259 (Note 18) | | | | | | | | | | | | | |
Foreign currency translation adjustment (Note 1(r)) | | | | | | | | | | 14,953 | | 14,953 | |
Minimum pension liability adjustment | | | | | | | | | | (31,752 | ) | (31,752 | ) |
Unrealized gain on investment trusts | | | | | | | | | | 2,418 | | 2,418 | |
Cash flow hedges (Note 1(k)(ii)) | | | | | | | | | | 4,542 | | 4,542 | |
Total comprehensive income | | | | | | | | | | | | 391,029 | |
| | | | | | | | | | | | | |
Issuance of common stock - net (9,215,137 shares) | | 93 | | 350,433 | | | | | | | | 350,526 | |
Treasury shares purchased (27,762 shares) | | | | | | | | (1,081 | ) | | | (1,081 | ) |
Dividends on common stock ($1.88 per share) | | | | | | (338,630 | ) | | | | | (338,630 | ) |
Other | | | | 13,297 | | 99 | | | | | | 13,396 | |
Ending balance (187,524,229 shares) | | $ | 1,877 | | $ | 2,559,715 | | $ | 1,613,340 | | $ | (4,336 | ) | $ | (54,674 | ) | $ | 4,115,922 | |
| | | | | | | | | | | | | |
The accompanying notes as they relate to Cinergy Corp. are an
integral part of these consolidated financial statements.
99
CINERGY CORP.
CONSOLIDATED STATEMENTS OF CASH FLOWS
| | 2000
| | 1999
| | 1998
| |
|---|
| | (dollars in thousands)
| |
|---|
| Operating Activities | | | | | | | | | | |
| | Net income | | $ | 399,466 | | $ | 403,641 | | $ | 260,968 | |
| | Items providing or (using) cash currently: | | | | | | | | | | |
| | | Depreciation and amortization | | | 373,965 | | | 353,820 | | | 326,492 | |
| | | Wabash Valley Power Association, Inc. settlement | | | — | | | — | | | 80,000 | |
| | | Deferred income taxes and investment tax credits—net | | | 47,404 | | | 96,067 | | | (107,835 | ) |
| | | Gain on sale of investment in unconsolidated subsidiary | | | — | | | (99,272 | ) | | — | |
| | | Unrealized (gain) loss from energy risk management activities | | | 2,419 | | | (47,192 | ) | | 135,000 | |
| | | Equity in earnings of unconsolidated subsidiaries | | | (5,048 | ) | | (44,904 | ) | | (45,374 | ) |
| | | Allowance for equity funds used during construction | | | (5,813 | ) | | (3,633 | ) | | (1,668 | ) |
| | | Regulatory assets — net | | | (6,805 | ) | | (203,224 | ) | | 46,856 | |
| | | Changes in current assets and current liabilities: | | | | | | | | | | |
| | | | Restricted deposits | | | (3,567 | ) | | 2,959 | | | (1,268 | ) |
| | | | Accounts and notes receivable, net of reserves on receivables sold | | | (963,309 | ) | | (118,561 | ) | | (45,811 | ) |
| | | | Materials, supplies, and fuel | | | 46,409 | | | (3,002 | ) | | (33,484 | ) |
| | | | Accounts payable | | | 761,557 | | | 61,590 | | | 44,535 | |
| | | | Accrued taxes and interest | | | 25,737 | | | (11,406 | ) | | 46,371 | |
| | | Other items—net | | | (51,811 | ) | | 4,543 | | | (7,876 | ) |
| | |
| |
| |
| |
| | | | | Net cash provided by operating activities | | | 620,604 | | | 391,426 | | | 696,906 | |
Financing Activities |
|
|
|
|
|
|
|
|
|
|
| | Change in short-term debt | | | 578,463 | | | (353,506 | ) | | (245,413 | ) |
| | Issuance of long-term debt | | | 126,420 | | | 829,948 | | | 785,554 | |
| | Redemption of long-term debt | | | (234,247 | ) | | (553,191 | ) | | (384,520 | ) |
| | Retirement of preferred stock of subsidiaries | | | (29,393 | ) | | (34 | ) | | (85,299 | ) |
| | Issuance of common stock | | | 1,770 | | | 6,722 | | | 3,724 | |
| | Dividends on common stock | | | (285,242 | ) | | (285,925 | ) | | (283,884 | ) |
| | |
| |
| |
| |
| | | | | Net cash provided by (used in) financing activities | | | 157,771 | | | (355,986 | ) | | (209,838 | ) |
Investing Activities |
|
|
|
|
|
|
|
|
|
|
| | Construction expenditures (less allowance for equity funds used during construction) | | | (519,574 | ) | | (386,293 | ) | | (368,609 | ) |
| | Acquisition of businesses (net of cash acquired) | | | — | | | (24,500 | ) | | (63,412 | ) |
| | Investments in unconsolidated subsidiaries | | | (171,298 | ) | | (284,343 | ) | | (35,305 | ) |
| | Miscellaneous investments | | | (76,368 | ) | | (48,808 | ) | | 27,102 | |
| | Sale of investment in unconsolidated subsidiary | | | — | | | 690,269 | | | — | |
| | |
| |
| |
| |
| | | | | Net cash used in investing activities | | | (767,240 | ) | | (53,675 | ) | | (440,224 | ) |
Net increase (decrease) in cash and cash equivalents |
|
|
11,135 |
|
|
(18,235 |
) |
|
46,844 |
|
Cash and cash equivalents at beginning of period |
|
|
81,919 |
|
|
100,154 |
|
|
53,310 |
|
| | |
| |
| |
| |
| Cash and cash equivalents at end of period | | $ | 93,054 | | $ | 81,919 | | $ | 100,154 | |
| | |
| |
| |
| |
| Supplemental Disclosure of Cash Flow Information | | | | | | | | | | |
| | Cash paid during the year for: | | | | | | | | | | |
| | | Interest (net of amount capitalized) | | $ | 223,666 | | $ | 232,019 | | $ | 236,982 | |
| | | Income taxes | | $ | 216,556 | | $ | 130,179 | | $ | 179,677 | |
| | 2004 | | 2003 | | 2002 | |
| | (dollars in thousands) | |
| | | | | | | |
Cash Flows from Continuing Operations | | | | | | | |
Operating Activities | | | | | | | |
Net income | | $ | 400,868 | | $ | 469,772 | | $ | 360,576 | |
Adjustments to reconcile net income to net cash provided by operating activities: | | | | | | | |
Depreciation | | 460,389 | | 398,871 | | 403,909 | |
(Income) Loss of discontinued operations, net of tax | | — | | (8,886 | ) | 25,161 | |
(Income) Loss on impairment or disposal of subsidiaries and investments, net | | 48,144 | | (93 | ) | (16,518 | ) |
Cumulative effect of changes in accounting principles, net of tax | | — | | (26,462 | ) | 10,899 | |
Change in net position of energy risk management activities | | (40,443 | ) | (11,723 | ) | (43,202 | ) |
Deferred income taxes and investment tax credits - net | | (4,113 | ) | 85,108 | | 148,069 | |
Equity in earnings of unconsolidated subsidiaries | | (48,249 | ) | (15,201 | ) | (15,261 | ) |
Allowance for equity funds used during construction | | (2,269 | ) | (7,532 | ) | (12,861 | ) |
Regulatory asset/liability deferrals | | (38,868 | ) | (81,791 | ) | (132,117 | ) |
Regulatory asset amortization | | 92,422 | | 89,931 | | 115,967 | |
Accrued pension and other postretirement benefit costs | | 25,443 | | 36,667 | | 127,366 | |
Cost of removal | | (17,763 | ) | (16,598 | ) | — | |
Changes in current assets and current liabilities: | | | | | | | |
Accounts and notes receivable | | (11,555 | ) | 123,504 | | (235,437 | ) |
Fuel, emission allowances, and supplies | | (89,699 | ) | 1,410 | | (81,303 | ) |
Prepayments | | (88,463 | ) | 8,859 | | (26,818 | ) |
Accounts payable | | 108,476 | | (89,149 | ) | 311,339 | |
Accrued taxes and interest | | (15,360 | ) | (35,510 | ) | 65,019 | |
Other assets | | (50,234 | ) | (26,008 | ) | (50,572 | ) |
Other liabilities | | 104,278 | | 50,504 | | 1,586 | |
Net cash provided by operating activities | | 833,004 | | 945,673 | | 955,802 | |
| | | | | | | |
Financing Activities | | | | | | | |
Change in short-term debt | | 545,405 | | (393,096 | ) | (442,472 | ) |
Issuance of long-term debt | | 39,361 | | 688,166 | | 628,170 | |
Redemption of long-term debt | | (830,543 | ) | (487,901 | ) | (112,578 | ) |
Issuance of common stock | | 350,526 | | 270,074 | | 267,861 | |
Dividends on common stock | | (338,630 | ) | (322,371 | ) | (298,292 | ) |
Net cash provided by (used in) financing activities | | (233,881 | ) | (245,128 | ) | 42,689 | |
| | | | | | | |
Investing Activities | | | | | | | |
Construction expenditures (less allowance for equity funds used during construction) | | (697,643 | ) | (704,117 | ) | (853,332 | ) |
Proceeds from notes receivable | | 17,460 | | 9,187 | | — | |
Withdrawal of restricted funds held in trust | | 25,273 | | — | | — | |
Acquisitions and other investments | | (2,965 | ) | (87,859 | ) | (118,375 | ) |
Proceeds from distributions by investments and sale of investments and subsidiaries | | 54,173 | | 51,252 | | 86,071 | |
Net cash used in investing activities | | (603,702 | ) | (731,537 | ) | (885,636 | ) |
| | | | | | | |
Net increase (decrease) in cash and cash equivalents from continuing operations | | (4,579 | ) | (30,992 | ) | 112,855 | |
| | | | | | | |
Cash and cash equivalents from continuing operations at beginning of period | | 169,120 | | 200,112 | | 87,257 | |
| | | | | | | |
Cash and cash equivalents from continuing operations at end of period | | $ | 164,541 | | $ | 169,120 | | $ | 200,112 | |
| | | | | | | |
Cash Flows from Discontinued Operations | | | | | | | |
Operating activities | | $ | (7,093 | ) | $ | (5,871 | ) | $ | 40,397 | |
Financing activities | | 7,093 | | (14,898 | ) | (39,464 | ) |
Investing activities | | — | | (202 | ) | (3,772 | ) |
| | | | | | | |
Net decrease in cash and cash equivalents from discontinued operations | | — | | (20,971 | ) | (2,839 | ) |
| | | | | | | |
Cash and cash equivalents from discontinued operations at beginning of period | | — | | 20,971 | | 23,810 | |
| | | | | | | |
Cash and cash equivalents from discontinued operations at end of period | | $ | — | | $ | — | | $ | 20,971 | |
| | | | | | | |
Supplemental Disclosure of Cash Flow Information | | | | | | | |
Cash paid during the year for: | | | | | | | |
Interest (net of amount capitalized) | | $ | 298,142 | | $ | 263,228 | | $ | 253,266 | |
Income taxes | | $ | 73,197 | | $ | 92,175 | | $ | 57,739 | |
| | | | | | | |
The accompanying notes as they relate to Cinergy Corp. are an
integral part of these consolidated financial statements.
100
CINERGY CORP.
CONSOLIDATED STATEMENTS OF CAPITALIZATION
| | December 31 | |
| | 2004 | | 2003 | |
| | (dollars in thousands) | |
| | | | | |
Long-term Debt (excludes current portion) | | | | | |
Cinergy Corp. | | | | | |
Other Long-term Debt: | | | | | |
6.53% Debentures due December 16, 2008 | | $ | 200,000 | | $ | 200,000 | |
6.90% Note Payable due February 16, 2007 | | 326,032 | | 326,032 | |
Total Other Long-term Debt | | 526,032 | | 526,032 | |
Unamortized Premium and Discount - Net | | (3,980 | ) | (6,080 | ) |
Total - Cinergy Corp. | | 522,052 | | 519,952 | |
| | | | | |
Cinergy Global Resources, Inc. | | | | | |
Other Long-term Debt: | | | | | |
6.20% Debentures due November 3, 2008 | | 150,000 | | 150,000 | |
Variable interest rate of Euro Inter-Bank Offered Rate plus 1.2%, maturing November 2016 | | 89,391 | | 79,104 | |
Total Other Long-term Debt | | 239,391 | | 229,104 | |
Unamortized Premium and Discount - Net | | (126 | ) | (160 | ) |
Total - Cinergy Global Resources, Inc. | | 239,265 | | 228,944 | |
| | | | | |
Cinergy Investments, Inc. | | | | | |
Other Long-term Debt: | | | | | |
9.23% Notes Payable, due November 5, 2016 | | 105,834 | | 107,142 | |
7.81% Notes Payable, due June 1, 2009 | | 74,773 | | 93,041 | |
Other | | 17,930 | | 3,547 | |
Total - Cinergy Investments, Inc. | | 198,537 | | 203,730 | |
| | | | | |
Operating Companies | | | | | |
The Cincinnati Gas & Electric Company (CG&E) and subsidiaries | | | | | |
First Mortgage Bonds | | 94,700 | | 94,700 | |
Other Long-term Debt | | 1,385,721 | | 1,401,721 | |
Unamortized Premium and Discount - Net | | (36,753 | ) | (37,614 | ) |
Total Long-term Debt | | 1,443,668 | | 1,458,807 | |
PSI Energy, Inc. (PSI) | | | | | |
First Mortgage Bonds | | 620,720 | | 620,720 | |
Secured Medium-term Notes | | 77,500 | | 77,500 | |
Other Long-term Debt | | 1,135,813 | | 1,032,663 | |
Unamortized Premium and Discount - Net | | (9,814 | ) | (10,407 | ) |
Total Long-term Debt | | 1,824,219 | | 1,720,476 | |
| | | | | |
Total Consolidated Long-term Debt | | $ | 4,227,741 | | $ | 4,131,909 | |
| | | | | |
Cumulative Preferred Stock of Subsidiaries | | | | | |
| | | | | |
CG&E and subsidiaries | | $ | 20,485 | | $ | 20,485 | |
PSI | | 42,333 | | 42,333 | |
Total Cumulative Preferred Stock of Subsidiaries | | $ | 62,818 | | $ | 62,818 | |
| | | | | |
Common Stock Equity | | $ | 4,115,922 | | $ | 3,700,682 | |
| | | | | |
Total Consolidated Capitalization | | $ | 8,406,481 | | $ | 7,895,409 | |
| | | | | | | |
| | | | | | | | | |
The accompanying notes as they relate to Cinergy Corp. are an integral part of these consolidated financial statements.
101
THE CINCINNATI GAS &
ELECTRIC COMPANY
AND SUBSIDIARY COMPANIES
102
THE CINCINNATI GAS & ELECTRIC COMPANY
CONSOLIDATED STATEMENTS OF INCOME
| | 2000
| | 1999
| | 1998
| |
|---|
| | (dollars in thousands)
| |
|---|
| Operating Revenues | | | | | | | | | | |
| | Electric | | $ | 2,738,775 | | $ | 2,174,861 | | $ | 2,452,692 | |
| | Gas | | | 490,972 | | | 376,013 | | | 403,431 | |
| | |
| |
| |
| |
| | | Total Operating Revenues | | | 3,229,747 | | | 2,550,874 | | | 2,856,123 | |
Operating Expenses |
|
|
|
|
|
|
|
|
|
|
| | Fuel and purchased and exchanged power | | | 1,554,959 | | | 1,066,490 | | | 1,407,136 | |
| | Gas purchased | | | 266,339 | | | 171,997 | | | 199,683 | |
| | Operation and maintenance | | | 462,601 | | | 416,257 | | | 392,841 | |
| | Depreciation and amortization | | | 209,922 | | | 204,468 | | | 191,109 | |
| | Taxes other than income taxes | | | 208,385 | | | 212,193 | | | 217,691 | |
| | |
| |
| |
| |
| | | Total Operating Expenses | | | 2,702,206 | | | 2,071,405 | | | 2,408,460 | |
Operating Income |
|
|
527,541 |
|
|
479,469 |
|
|
447,663 |
|
Miscellaneous—Net |
|
|
(2,119 |
) |
|
(2,480 |
) |
|
(1,291 |
) |
| Interest | | | 99,204 | | | 99,737 | | | 102,238 | |
| | |
| |
| |
| |
| Income Before Taxes | | | 426,218 | | | 377,252 | | | 344,134 | |
Income Taxes (Note 11) |
|
|
159,398 |
|
|
143,676 |
|
|
128,322 |
|
| | |
| |
| |
| |
| Net Income | | $ | 266,820 | | $ | 233,576 | | $ | 215,812 | |
| Preferred Dividend Requirement | | | 847 | | | 856 | | | 858 | |
| | |
| |
| |
| |
| Net Income Applicable to Common Stock | | $ | 265,973 | | $ | 232,720 | | $ | 214,954 | |
| | |
| |
| |
| |
| | 2004 | | 2003 | | 2002 | |
| | (dollars in thousands) | |
| | | | | | | |
Operating Revenues (Note 1(d)) | | | | | | | |
Electric | | $ | 1,689,683 | | $ | 1,691,353 | | $ | 1,618,687 | |
Gas | | 690,675 | | 627,720 | | 437,092 | |
Other (Note 1(d)(iii)) | | 130,365 | | 62,876 | | 81,631 | |
Total Operating Revenues | | 2,510,723 | | 2,381,949 | | 2,137,410 | |
| | | | | | | |
Operating Expenses | | | | | | | |
Fuel, emission allowances, and purchased power | | 521,959 | | 496,041 | | 413,406 | |
Gas purchased | | 427,585 | | 382,310 | | 232,558 | |
Costs of fuel resold | | 98,898 | | 54,661 | | 60,674 | |
Operation and maintenance | | 594,381 | | 499,556 | | 531,482 | |
Depreciation | | 179,487 | | 186,819 | | 196,539 | |
Taxes other than income taxes | | 198,445 | | 199,818 | | 197,827 | |
Total Operating Expenses | | 2,020,755 | | 1,819,205 | | 1,632,486 | |
| | | | | | | |
Operating Income | | 489,968 | | 562,744 | | 504,924 | |
| | | | | | | |
Miscellaneous Income - Net | | 16,228 | | 30,660 | | 9,742 | |
Interest Expense | | 90,836 | | 115,215 | | 95,629 | |
| | | | | | | |
Income Before Taxes | | 415,360 | | 478,189 | | 419,037 | |
| | | | | | | |
Income Taxes (Note 10) | | 158,518 | | 178,077 | | 155,341 | |
| | | | | | | |
Income Before Cumulative Effect of Changes in Accounting Principles | | 256,842 | | 300,112 | | 263,696 | |
| | | | | | | |
Cumulative effect of changes in accounting principles, net of tax (Note 1(q)(iv)) | | — | | 30,938 | | — | |
| | | | | | | |
Net Income | | $ | 256,842 | | $ | 331,050 | | $ | 263,696 | |
| | | | | | | |
Preferred Dividend Requirement | | 845 | | 846 | | 846 | |
| | | | | | | |
Net Income Applicable to Common Stock | | $ | 255,997 | | $ | 330,204 | | $ | 262,850 | |
| | | | | | | |
| | | | | | | | | | | | |
The accompanying notes as they relate to The Cincinnati Gas & Electric Company are an
integral part of these consolidated financial statements.
103
THE CINCINNATI GAS & ELECTRIC COMPANY
CONSOLIDATED BALANCE SHEETS
| | December 31
|
|---|
ASSETS
| | 2000
| | 1999
|
|---|
| | (dollars in thousands)
|
|---|
| Current Assets | | | | | | |
| | Cash and cash equivalents | | $ | 20,637 | | $ | 9,554 |
| | Restricted deposits | | | 160 | | | 132 |
| | Notes receivable from affiliated companies | | | 91,732 | | | — |
| | Accounts receivable less accumulated provision for doubtful accounts of $19,044 at December 31, 2000, and $16,740 at December 31, 1999 (Note 6) | | | 494,501 | | | 279,591 |
| | Accounts receivable from affiliated companies | | | 26,743 | | | 12,718 |
| | Materials, supplies, and fuel—at average cost | | | 99,061 | | | 98,999 |
| | Prepayments and other | | | 39,320 | | | 35,527 |
| | Energy risk management current assets (Note 1(j)) | | | 697,488 | | | 63,926 |
| | |
| |
|
| | | | | Total Current Assets | | | 1,469,642 | | | 500,447 |
Utility Plant—Original Cost |
|
|
|
|
|
|
| | In service | | | | | | |
| | | Electric | | | 4,999,038 | | | 4,875,633 |
| | | Gas | | | 865,303 | | | 824,427 |
| | | Common | | | 211,424 | | | 189,124 |
| | |
| |
|
| | | | Total | | | 6,075,765 | | | 5,889,184 |
| | Accumulated depreciation | | | 2,444,867 | | | 2,279,587 |
| | |
| |
|
| | | | Total | | | 3,630,898 | | | 3,609,597 |
| | Construction work in progress | | | 220,410 | | | 153,229 |
| | |
| |
|
| | | | | Total Utility Plant | | | 3,851,308 | | | 3,762,826 |
Other Assets |
|
|
|
|
|
|
| | Regulatory assets (Note 1(c)) | | | 502,328 | | | 536,224 |
| | Energy risk management non-current assets (Note 1(j)) | | | 7,000 | | | 7,368 |
| | Other | | | 156,692 | | | 109,753 |
| | |
| |
|
| | | | | Total Other Assets | | | 666,020 | | | 653,345 |
Total Assets |
|
$ |
5,986,970 |
|
$ |
4,916,618 |
| | |
| |
|
ASSETS | | | | | |
| | December 31 | |
| | 2004 | | 2003 | |
| | (dollars in thousands) | |
Current Assets | | | | | |
Cash and cash equivalents | | $ | 4,154 | | $ | 15,842 | |
Notes receivable from affiliated companies | | 121,559 | | 110,149 | |
Accounts receivable less accumulated provision for doubtful accounts of $722 at December 31, 2004, and $1,602 at December 31, 2003 (Note 3(c)) | | 145,105 | | 107,733 | |
Accounts receivable from affiliated companies | | 30,916 | | 58,406 | |
Fuel, emission allowances, and supplies (Note 1(g)) | | 199,769 | | 135,948 | |
Energy risk management current assets (Note 1(k)(i)) | | 148,866 | | 72,830 | |
Prepayments and other | | 54,650 | | 15,186 | |
Total Current Assets | | 705,019 | | 516,094 | |
| | | | | |
Property, Plant, and Equipment - at Cost | | | | | |
Utility plant in service (Note 19) | | | | | |
Electric | | 2,249,352 | | 2,155,457 | |
Gas | | 1,179,764 | | 1,104,797 | |
Common | | 249,576 | | 288,394 | |
Total Utility Plant In Service | | 3,678,692 | | 3,548,648 | |
Construction work in progress | | 45,762 | | 71,947 | |
Total Utility Plant | | 3,724,454 | | 3,620,595 | |
Non-regulated property, plant, and equipment (Note 19) | | 3,660,226 | | 3,576,187 | |
Accumulated depreciation (Note 1(h)(i)) | | 2,694,708 | | 2,625,568 | |
Net Property, Plant, and Equipment | | 4,689,972 | | 4,571,214 | |
| | | | | |
Other Assets | | | | | |
Regulatory assets (Note 1(c)) | | 609,550 | | 611,855 | |
Energy risk management non-current assets (Note 1(k)(i)) | | 47,276 | | 36,583 | |
Restricted funds held in trust | | 93,671 | | — | |
Other | | 86,871 | | 73,733 | |
Total Other Assets | | 837,368 | | 722,171 | |
| | | | | |
Total Assets | | $ | 6,232,359 | | $ | 5,809,479 | |
| | | | | |
| | | | | | | | |
The accompanying notes as they relate to The Cincinnati Gas & Electric Company are an
integral part of these consolidated financial statements.
104
THE CINCINNATI GAS & ELECTRIC COMPANY
CONSOLIDATED BALANCE SHEETS
| | December 31
| |
|---|
LIABILITIES AND SHAREHOLDER'S EQUITY
| | 2000
| | 1999
| |
|---|
| | (dollars in thousands)
| |
|---|
| Current Liabilities | | | | | | | |
| | Accounts payable | | $ | 543,006 | | $ | 253,115 | |
| | Accounts payable to affiliated companies | | | 23,927 | | | 65,256 | |
| | Accrued taxes | | | 152,750 | | | 136,118 | |
| | Accrued interest | | | 17,645 | | | 17,375 | |
| | Notes payable and other short-term obligations (Note 5) | | | 264,000 | | | 234,702 | |
| | Notes payable to affiliated companies | | | 163,478 | | | 60,360 | |
| | Long-term debt due within one year (Note 4) | | | 1,200 | | | — | |
| | Energy risk management current liabilities (Note 1(j)) | | | 717,902 | | | 60,478 | |
| | Other | | | 37,603 | | | 25,468 | |
| | |
| |
| |
| | | Total Current Liabilities | | | 1,921,511 | | | 852,872 | |
Non-Current Liabilities |
|
|
|
|
|
|
|
| | Long-term debt (Note 4) | | | 1,205,061 | | | 1,205,916 | |
| | Deferred income taxes (Note 11) | | | 735,799 | | | 720,168 | |
| | Unamortized investment tax credits | | | 98,624 | | | 104,655 | |
| | Accrued pension and other postretirement benefit costs (Note 9) | | | 164,901 | | | 154,718 | |
| | Energy risk management non-current liabilities (Note 1(j)) | | | 26,337 | | | 57,644 | |
| | Other | | | 118,421 | | | 140,794 | |
| | |
| |
| |
| | | Total Non-Current Liabilities | | | 2,349,143 | | | 2,383,895 | |
Total Liabilities |
|
|
4,270,654 |
|
|
3,236,767 |
|
Cumulative Preferred Stock (Note 3) |
|
|
|
|
|
|
|
| | Not subject to mandatory redemption | | | 20,486 | | | 20,686 | |
Common Stock Equity (Note 2) |
|
|
|
|
|
|
|
| | Common Stock—$8.50 par value; authorized shares—120,000,000; outstanding shares—89,663,086 at December 31, 2000, and December 31, 1999 | | | 762,136 | | | 762,136 | |
| | Paid-in capital | | | 565,777 | | | 562,851 | |
| | Retained earnings | | | 368,911 | | | 335,144 | |
| | Accumulated other comprehensive income (loss) | | | (994 | ) | | (966 | ) |
| | |
| |
| |
| | | Total Common Stock Equity | | | 1,695,830 | | | 1,659,165 | |
Commitments and Contingencies (Note 12) |
|
|
|
|
|
|
|
Total Liabilities and Shareholder's Equity |
|
$ |
5,986,970 |
|
$ |
4,916,618 |
|
| | |
| |
| |
LIABILITIES AND SHAREHOLDER’S EQUITY | | | | | |
| | December 31 | |
| | 2004 | | 2003 | |
| | (dollars in thousands) | |
Current Liabilities | | | | | |
Accounts payable | | $ | 332,316 | | $ | 217,652 | |
Accounts payable to affiliated companies | | 85,127 | | 136,470 | |
Accrued taxes | | 149,010 | | 146,216 | |
Accrued interest | | 19,408 | | 21,572 | |
Notes payable and other short-term obligations (Note 5) | | 112,100 | | 112,100 | |
Notes payable to affiliated companies (Note 5) | | 180,116 | | 49,126 | |
Long-term debt due within one year | | 150,000 | | 110,000 | |
Energy risk management current liabilities (Note 1(k)(i)) | | 120,204 | | 77,791 | |
Other | | 33,712 | | 32,319 | |
Total Current Liabilities | | 1,181,993 | | 903,246 | |
| | | | | |
Non-Current Liabilities | | | | | |
Long-term debt (Note 4) | | 1,443,668 | | 1,458,807 | |
Deferred income taxes (Note 10) | | 1,090,897 | | 985,481 | |
Unamortized investment tax credits | | 73,120 | | 79,186 | |
Accrued pension and other postretirement benefit costs (Note 9) | | 228,058 | | 219,393 | |
Regulatory liabilities (Note 1(c)) | | 164,846 | | 155,336 | |
Energy risk management non-current liabilities (Note 1(k)(i)) | | 40,184 | | 11,665 | |
Other | | 70,395 | | 69,687 | |
Total Non-Current Liabilities | | 3,111,168 | | 2,979,555 | |
| | | | | |
Commitments and Contingencies (Note 11) | | | | | |
| | | | | |
Total Liabilities | | 4,293,161 | | 3,882,801 | |
| | | | | |
Cumulative Preferred Stock | | | | | |
Not subject to mandatory redemption | | 20,485 | | 20,485 | |
| | | | | |
Common Stock Equity (Note 2) | | | | | |
Common stock - $8.50 par value; authorized shares - 120,000,000; outstanding shares—89,663,086 at December 31, 2004 and December 31, 2003 | | 762,136 | | 762,136 | |
Paid-in capital | | 584,176 | | 586,528 | |
Retained earnings | | 610,232 | | 589,993 | |
Accumulated other comprehensive loss (Note 18) | | (37,831 | ) | (32,464 | ) |
Total Common Stock Equity | | 1,918,713 | | 1,906,193 | |
| | | | | |
Total Liabilities and Shareholder’s Equity | | $ | 6,232,359 | | $ | 5,809,479 | |
| | | | | |
The accompanying notes as they relate to The Cincinnati Gas & Electric Company are an
integral part of these consolidated financial statements.
105
THE CINCINNATI GAS & ELECTRIC COMPANY
CONSOLIDATED STATEMENTS OF CHANGES IN COMMON STOCK EQUITY
| | Common
Stock
| | Paid-in
Capital
| | Retained
Earnings
| | Accumulated
Other
Comprehensive
Income (Loss)
| | Total Common
Stock
Equity
| |
|---|
| | (dollars in thousands)
| |
|---|
| 1998 | | | | | | | | | | | | | | | | |
| Beginning balance | | $ | 762,136 | | $ | 534,649 | | $ | 314,553 | | $ | (750 | ) | $ | 1,610,588 | |
| Comprehensive income: | | | | | | | | | | | | | | | | |
| | Net income | | | — | | | — | | | 215,812 | | | — | | | 215,812 | |
| | Other comprehensive income (loss), net of tax effect of $201 | | | | | | | | | | | | | | | | |
| | | Minimum pension liability adjustment | | | — | | | — | | | — | | | (374 | ) | | (374 | ) |
| | | | | | | | | | | | | | |
| |
| | Total comprehensive income | | | — | | | — | | | — | | | — | | | 215,438 | |
| Dividends on preferred stock | | | — | | | — | | | (859 | ) | | — | | | (859 | ) |
| Dividends on common stock | | | — | | | — | | | (178,000 | ) | | — | | | (178,000 | ) |
| Contribution from parent company for reallocation of taxes | | | — | | | 19,253 | | | — | | | — | | | 19,253 | |
| Other | | | — | | | 24 | | | (1 | ) | | — | | | 23 | |
| | |
| |
| |
| |
| |
| |
| Ending balance | | $ | 762,136 | | $ | 553,926 | | $ | 351,505 | | $ | (1,124 | ) | $ | 1,666,443 | |
| 1999 | | | | | | | | | | | | | | | | |
| Comprehensive income: | | | | | | | | | | | | | | | | |
| | Net income | | | — | | | — | | | 233,576 | | | — | | | 233,576 | |
| | Other comprehensive income (loss), net of tax effect of $(85) | | | | | | | | | | | | | | | | |
| | | Minimum pension liability adjustment | | | — | | | — | | | — | | | 158 | | | 158 | |
| | | | | | | | | | | | | | |
| |
| | Total comprehensive income | | | — | | | — | | | — | | | — | | | 233,734 | |
| | | | | | | | | | | | | | |
| |
| Dividends on preferred stock | | | — | | | — | | | (856 | ) | | — | | | (856 | ) |
| Dividends on common stock | | | — | | | — | | | (250,100 | ) | | — | | | (250,100 | ) |
| Contribution from parent company for reallocation of taxes | | | — | | | 8,920 | | | — | | | — | | | 8,920 | |
| Other | | | — | | | 5 | | | 1,019 | | | — | | | 1,024 | |
| | |
| |
| |
| |
| |
| |
| Ending balance | | $ | 762,136 | | $ | 562,851 | | $ | 335,144 | | $ | (966 | ) | $ | 1,659,165 | |
| 2000 | | | | | | | | | | | | | | | | |
| Comprehensive income: | | | | | | | | | | | | | | | | |
| | Net income | | | — | | | — | | | 266,820 | | | — | | | 266,820 | |
| | Other comprehensive income (loss), net of tax effect of $15 | | | | | | | | | | | | | | | | |
| | | Minimum pension liability adjustment | | | — | | | — | | | — | | | (28 | ) | | (28 | ) |
| | | | | | | | | | | | | | |
| |
| | Total comprehensive income | | | — | | | — | | | — | | | — | | | 266,792 | |
| Dividends on preferred stock | | | — | | | — | | | (847 | ) | | — | | | (847 | ) |
| Dividends on common stock | | | — | | | — | | | (232,334 | ) | | — | | | (232,334 | ) |
| Contribution from parent company for reallocation of taxes | | | — | | | 2,894 | | | — | | | — | | | 2,894 | |
| Other | | | — | | | 32 | | | 128 | | | — | | | 160 | |
| | |
| |
| |
| |
| |
| |
| Ending balance | | $ | 762,136 | | $ | 565,777 | | $ | 368,911 | | $ | (994 | ) | $ | 1,695,830 | |
| | |
| |
| |
| |
| |
| |
| | | | | | | | Accumulated | | Total | |
| | | | | | | | Other | | Common | |
| | Common | | Paid-in | | Retained | | Comprehensive | | Stock | |
| | Stock | | Capital | | Earnings | | Income (Loss) | | Equity | |
| | (dollars in thousands) | |
| | | | | | | | | | | |
2002 | | | | | | | | | | | |
Beginning balance | | $ | 762,136 | | $ | 571,926 | | $ | 408,706 | | $ | (5,678 | ) | $ | 1,737,090 | |
| | | | | | | | | | | |
Comprehensive income: | | | | | | | | | | | |
Net income | | | | | | 263,696 | | | | 263,696 | |
Other comprehensive loss, net of tax effect of $13,060 (Note 18) | | | | | | | | | | | |
Minimum pension liability adjustment | | | | | | | | (872 | ) | (872 | ) |
Unrealized loss on investment trusts | | | | | | | | (462 | ) | (462 | ) |
Cash flow hedges (Note 1(k)(ii)) | | | | | | | | (18,734 | ) | (18,734 | ) |
Total comprehensive income | | | | | | | | | | 243,628 | |
| | | | | | | | | | | |
Dividends on preferred stock | | | | | | (846 | ) | | | (846 | ) |
Dividends on common stock | | | | | | (185,909 | ) | | | (185,909 | ) |
Contribution from parent company for reallocation of taxes | | | | 14,366 | | | | | | 14,366 | |
Other | | | | | | 2,005 | | | | 2,005 | |
Ending balance | | $ | 762,136 | | $ | 586,292 | | $ | 487,652 | | $ | (25,746 | ) | $ | 1,810,334 | |
| | | | | | | | | | | |
2003 | | | | | | | | | | | |
Comprehensive income: | | | | | | | | | | | |
Net income | | | | | | 331,050 | | | | 331,050 | |
Other comprehensive income (loss), net of tax effect of $4,321 (Note 18) | | | | | | | | | | | |
Minimum pension liability adjustment | | | | | | | | (8,017 | ) | (8,017 | ) |
Unrealized gain on investment trusts | | | | | | | | 1 | | 1 | |
Cash flow hedges (Note 1(k)(ii)) | | | | | | | | 1,298 | | 1,298 | |
Total comprehensive income | | | | | | | | | | 324,332 | |
| | | | | | | | | | | |
Dividends on preferred stock | | | | | | (846 | ) | | | (846 | ) |
Dividends on common stock | | | | | | (227,863 | ) | | | (227,863 | ) |
Contribution from parent company for reallocation of taxes | | | | 236 | | | | | | 236 | |
Ending balance | | $ | 762,136 | | $ | 586,528 | | $ | 589,993 | | $ | (32,464 | ) | $ | 1,906,193 | |
| | | | | | | | | | | |
2004 | | | | | | | | | | | |
Comprehensive income: | | | | | | | | | | | |
Net income | | | | | | 256,842 | | | | 256,842 | |
Other comprehensive income (loss), net of tax effect of $3,453 (Note 18) | | | | | | | | | | | |
Minimum pension liability adjustment | | | | | | | | (9,666 | ) | (9,666 | ) |
Cash flow hedges (Note 1(k)(ii)) | | | | | | | | 4,299 | | 4,299 | |
Total comprehensive income | | | | | | | | | | 251,475 | |
| | | | | | | | | | | |
Dividends on preferred stock | | | | | | (845 | ) | | | (845 | ) |
Dividends on common stock | | | | | | (235,758 | ) | | | (235,758 | ) |
Other | | | | (2,352 | ) | | | | | (2,352 | ) |
Ending balance | | $ | 762,136 | | $ | 584,176 | | $ | 610,232 | | $ | (37,831 | ) | $ | 1,918,713 | |
| | | | | | | | | | | |
The accompanying notes as they relate to The Cincinnati Gas & Electric Company are an
integral part of these consolidated financial statements.
106
THE CINCINNATI GAS & ELECTRIC COMPANY
CONSOLIDATED STATEMENTS OF CASH FLOWS
| | 2000
| | 1999
| | 1998
| |
|---|
| | (dollars in thousands)
| |
|---|
| Operating Activities | | | | | | | | | | |
| | Net income | | $ | 266,820 | | $ | 233,576 | | $ | 215,812 | |
| | Items providing or (using) cash currently: | | | | | | | | | | |
| | | Depreciation and amortization | | | 209,922 | | | 204,468 | | | 191,109 | |
| | | Deferred income taxes and investment tax credits—net | | | 36,238 | | | 2,366 | | | (27,045 | ) |
| | | Unrealized (gain) loss from energy risk management activities | | | (7,077 | ) | | (27,245 | ) | | 73,000 | |
| | | Allowance for equity funds used during construction | | | (4,459 | ) | | (2,565 | ) | | (1,647 | ) |
| | | Regulatory assets—net | | | (17,623 | ) | | 14,325 | | | 4,606 | |
| | | Changes in current assets and current liabilities: | | | | | | | | | | |
| | | | Restricted deposits | | | (28 | ) | | 1,040 | | | — | |
| | | | Accounts and notes receivable, net of reserves on receivables sold | | | (326,826 | ) | | 17,676 | | | (55,788 | ) |
| | | | Materials, supplies, and fuel | | | (62 | ) | | 16,295 | | | (7,327 | ) |
| | | | Accounts payable | | | 248,562 | | | 22,462 | | | 35,550 | |
| | | | Accrued taxes and interest | | | 16,902 | | | (18,533 | ) | | (2,533 | ) |
| | | Other items—net | | | (50,226 | ) | | 19,501 | | | 35,423 | |
| | |
| |
| |
| |
| | | | | Net cash provided by operating activities | | | 372,143 | | | 483,366 | | | 461,160 | |
Financing Activities |
|
|
|
|
|
|
|
|
|
|
| | Change in short-term debt | | | 132,416 | | | 88,759 | | | (94,950 | ) |
| | Issuance of long-term debt | | | — | | | 19,818 | | | 243,186 | |
| | Redemption of long-term debt | | | — | | | (164,264 | ) | | (220,409 | ) |
| | Retirement of preferred stock | | | (168 | ) | | (26 | ) | | (52 | ) |
| | Dividends on preferred stock | | | (847 | ) | | (856 | ) | | (859 | ) |
| | Dividends on common stock | | | (232,334 | ) | | (250,100 | ) | | (178,000 | ) |
| | |
| |
| |
| |
| | | | | Net cash used in financing activities | | | (100,933 | ) | | (306,669 | ) | | (251,084 | ) |
Investing Activities |
|
|
|
|
|
|
|
|
|
|
| | Construction expenditures (less allowance for equity funds used during construction) | | | (260,127 | ) | | (194,132 | ) | | (185,436 | ) |
| | |
| |
| |
| |
| | | | | Net cash used in investing activities | | | (260,127 | ) | | (194,132 | ) | | (185,436 | ) |
| | |
| |
| |
| |
| Net increase (decrease) in cash and cash equivalents | | | 11,083 | | | (17,435 | ) | | 24,640 | |
Cash and cash equivalents at beginning of period |
|
|
9,554 |
|
|
26,989 |
|
|
2,349 |
|
| | |
| |
| |
| |
| Cash and cash equivalents at end of period | | $ | 20,637 | | $ | 9,554 | | $ | 26,989 | |
| | |
| |
| |
| |
| Supplemental Disclosure of Cash Flow Information | | | | | | | | | | |
| | Cash paid during the year for: | | | | | | | | | | |
| | | Interest (net of amount capitalized) | | $ | 99,009 | | $ | 101,264 | | $ | 107,419 | |
| | | Income taxes | | $ | 121,158 | | $ | 159,241 | | $ | 125,704 | |
| | 2004 | | 2003 | | 2002 | |
| | (dollars in thousands) | |
| | | | | | | |
Operating Activities | | | | | | | |
Net income | | $ | 256,842 | | $ | 331,050 | | $ | 263,696 | |
Adjustments to reconcile net income to net cash provided by operating activities: | | | | | | | |
Depreciation | | 179,487 | | 186,819 | | 196,539 | |
Deferred income taxes and investment tax credits - net | | 53,519 | | 82,228 | | 104,103 | |
Cumulative effect of changes in accounting principles, net of tax | | — | | (30,938 | ) | — | |
Change in net position of energy risk management activities | | (15,797 | ) | (20,593 | ) | (7,061 | ) |
Allowance for equity funds used during construction | | (458 | ) | (2,749 | ) | (356 | ) |
Regulatory asset/liability deferrals | | (16,535 | ) | (40,510 | ) | (84,694 | ) |
Regulatory asset amortization | | 48,649 | | 36,824 | | 44,339 | |
Accrued pension and other postretirement benefit costs | | 8,665 | | 18,109 | | 20,559 | |
Cost of removal | | (7,875 | ) | — | | — | |
Changes in current assets and current liabilities: | | | | | | | |
Accounts and notes receivable | | (25,348 | ) | 23,453 | | 84,193 | |
Fuel, emission allowances, and supplies | | (65,030 | ) | (14,061 | ) | 19,014 | |
Prepayments | | (39,586 | ) | (6,393 | ) | 1,750 | |
Accounts payable | | 63,928 | | 9,608 | | (38,441 | ) |
Accrued taxes and interest | | 938 | | (14,283 | ) | 48,885 | |
Other assets | | (11,286 | ) | 20,314 | | 2,713 | |
Other liabilities | | 15,508 | | (21,117 | ) | (2,210 | ) |
| | | | | | | |
Net cash provided by operating activities | | 445,621 | | 557,761 | | 653,029 | |
| | | | | | | |
Financing Activities | | | | | | | |
Change in short-term debt, including net affiliate notes | | 134,460 | | 104,114 | | (587,260 | ) |
Issuance of long-term debt | | 39,361 | | 256,198 | | 580,570 | |
Redemption of long-term debt | | (110,000 | ) | (394,899 | ) | (100,000 | ) |
Dividends on preferred stock | | (845 | ) | (846 | ) | (846 | ) |
Dividends on common stock | | (235,758 | ) | (227,863 | ) | (185,909 | ) |
| | | | | | | |
Net cash used in financing activities | | (172,782 | ) | (263,296 | ) | (293,445 | ) |
| | | | | | | |
Investing Activities | | | | | | | |
Construction expenditures (less allowance for equity funds used during construction) | | (299,751 | ) | (323,959 | ) | (323,320 | ) |
Other investments | | 59 | | — | | (2 | ) |
Proceeds from disposition of subsidiaries and investments | | 15,165 | | — | | — | |
| | | | | | | |
Net cash used in investing activities | | (284,527 | ) | (323,959 | ) | (323,322 | ) |
| | | | | | | |
Net increase (decrease) in cash and cash equivalents | | (11,688 | ) | (29,494 | ) | 36,262 | |
| | | | | | | |
Cash and cash equivalents at beginning of period | | 15,842 | | 45,336 | | 9,074 | |
| | | | | | | |
Cash and cash equivalents at end of period | | $ | 4,154 | | $ | 15,842 | | $ | 45,336 | |
| | | | | | | |
Supplemental Disclosure of Cash Flow Information | | | | | | | |
Cash paid during the year for: | | | | | | | |
Interest (net of amount capitalized) | | $ | 92,542 | | $ | 103,339 | | $ | 86,895 | |
Income taxes | | $ | 102,502 | | $ | 45,937 | | $ | 28,687 | |
| | | | | | | |
The accompanying notes as they relate to The Cincinnati Gas & Electric Company are an
integral part of these consolidated financial statements.
107
THE CINCINNATI GAS & ELECTRIC COMPANY
CONSOLIDATED STATEMENTS OF CAPITALIZATION
| | December 31
| |
|---|
| | 2000
| | 1999
| |
|---|
| | (dollars in thousands)
| |
|---|
| Long-term Debt(excludes current portion) | | | | | | | |
| | CG&E | | | | | | | |
| | | First Mortgage Bonds: | | | | | | | |
| | | | 71/4 % Series due September 1, 2002 | | $ | 100,000 | | $ | 100,000 | |
| | | | 6.45% Series due February 15, 2004 | | | 110,000 | | | 110,000 | |
| | | | 7.20% Series due October 1, 2023 | | | 265,500 | | | 265,500 | |
| | | | 5.45% Series due January 1, 2024 (Pollution Control) | | | 46,700 | | | 46,700 | |
| | | | 51/2 % Series due January 1, 2024 (Pollution Control) | | | 48,000 | | | 48,000 | |
| | |
| |
| |
| | | | | Total first mortgage bonds | | | 570,200 | | | 570,200 | |
| | | Pollution Control Notes: | | | | | | | |
| | | | 6.50% due November 15, 2022 | | | 12,721 | | | 12,721 | |
| | | Other Long-term Debt: | | | | | | | |
| | | | Liquid Asset Notes with Coupon Exchange (LANCE) due October 1, 2007 (Executed interest rate swap set at 6.87% through maturity commencing at October 2, 2000) | | | 100,000 | | | 100,000 | |
| | | | 6.40% Debentures due April 1, 2008 | | | 100,000 | | | 100,000 | |
| | | | 6.90% Debentures due June 1, 2025 (Redeemable at the option of the holders on June 1, 2005) | | | 150,000 | | | 150,000 | |
| | | | 8.28% Junior Subordinated Debentures due July 1, 2025 | | | 100,000 | | | 100,000 | |
| | | | 6.35% Debentures due June 15, 2038 (Interest rate resets June 15, 2003) | | | 100,000 | | | 100,000 | |
| | |
| |
| |
| | | | | Total other long-term debt | | | 550,000 | | | 550,000 | |
| | | Unamortized Premium and Discount—Net | | | (2,449 | ) | | (2,762 | ) |
| | |
| |
| |
| | | Total long-term debt | | | 1,130,472 | | | 1,130,159 | |
| | ULH&P | | | | | | | |
| | | Other Long-term Debt: | | | | | | | |
| | | | 6.11% Debentures due December 8, 2003 | | | 20,000 | | | 20,000 | |
| | | | 6.50% Debentures due April 30, 2008 | | | 20,000 | | | 20,000 | |
| | | | 7.65% Debentures due July 15, 2025 | | | 15,000 | | | 15,000 | |
| | | | 7.875% Debentures due September 15, 2009 | | | 20,000 | | | 20,000 | |
| | |
| |
| |
| | | | | Total other long-term debt | | | 75,000 | | | 75,000 | |
| | | Unamortized Premium and Discount—Net | | | (411 | ) | | (443 | ) |
| | |
| |
| |
| | | Total long-term debt | | | 74,589 | | | 74,557 | |
| |
Lawrenceburg Gas Company |
|
|
|
|
|
|
|
| | | First Mortgage Bonds: | | | | | | | |
| | | | 93/4% Series due October 1, 2001 | | | — | | | 1,200 | |
| | |
| |
| |
| | | Total CG&E Consolidated long-term debt | | $ | 1,205,061 | | $ | 1,205,916 | |
| | | December 31 | | | | 2004 | | 2003 | | | | (dollars in thousands) | | | | | | | | Long-term Debt (excludes current portion) | | | | | | CG&E | | | | | | First Mortgage Bonds: | | | | | | 5.45% Series due January 1, 2024 (Pollution Control) | | $ | 46,700 | | $ | 46,700 | | 5 ½% Series due January 1, 2024 (Pollution Control) | | 48,000 | | 48,000 | | Total First Mortgage Bonds | | 94,700 | | 94,700 | | | | | | | | Other Long-term Debt: | | | | | | Liquid Asset Notes with Coupon Exchange due October 1, 2007 (Executed interest rate swap to fix the rate at 6.87% through maturity) | | 100,000 | | 100,000 | | 6.40% Debentures due April 1, 2008 | | 100,000 | | 100,000 | | 6.90% Debentures due June 1, 2025 (Redeemable at the option of the holders on June 1, 2005) | | — | | 150,000 | | 5.70% Debentures due September 15, 2012, effective interest rate of 6.42% | | 500,000 | | 500,000 | | 5.40% Debentures due June 15, 2033, effective interest rate of 6.90% | | 200,000 | | 200,000 | | 5 3/8% Debentures due June 15, 2033 | | 200,000 | | 200,000 | | Series 2002A, Ohio Air Quality Development Revenue Refunding Bonds, due September 1, 2037 (Pollution Control) | | 42,000 | | 42,000 | | Series 2002B, Ohio Air Quality Development Revenue Refunding Bonds, due September 1, 2037 (Pollution Control) | | 42,000 | | 42,000 | | Series 2004A, Ohio Air Quality Development Revenue Bonds, due November 1, 2039 (Pollution Control) (Note 4) | | 47,000 | | — | | Series 2004B, Ohio Air Quality Development Revenue Bonds, due November 1, 2039 (Pollution Control) (Note 4) | | 47,000 | | — | | Series 1992A, 6.50% Collateralized Pollution Control Revenue Refunding Bonds, due November 15, 2022 | | 12,721 | | 12,721 | | Total Other Long-term Debt | | 1,290,721 | | 1,346,721 | | | | | | | | Unamortized Premium and Discount - Net | | (36,093 | ) | (37,299 | ) | Total Long-term Debt | | 1,349,328 | | 1,404,122 | | | | | | | | The Union Light, Heat and Power Company | | | | | | Other Long-term Debt | | 95,000 | | 55,000 | | Unamortized Premium and Discount - Net | | (660 | ) | (315 | ) | Total Long-term Debt | | 94,340 | | 54,685 | | | | | | | | Total Consolidated Long-term Debt | | $ | 1,443,668 | | $ | 1,458,807 | | | | | | | | Cumulative Preferred Stock | | | | | | | | | | Shares | | | | | | | | | | Par/
Stated
Value | | Authorized
Shares | | Outstanding at December 31, 2004 | | Series | | Mandatory Redemption | | | | | | $ | 100 | | 6,000,000 | | 204,849 | | 4% - 4 ¾% | | No | | $ | 20,485 | | $ | 20,485 | | | | | | | | | | | | | | | | Common Stock Equity | | | | | | | | $ | 1,918,713 | | $ | 1,906,193 | | | | | | | | | | | | | | | | | | Total Consolidated Capitalization | | | | $ | 3,382,866 | | $ | 3,385,485 | | | | | | | | | | | | | | | | | | | | | | | | | | | | | | | | |
Cumulative Preferred Stock
| | | | | | | |
Par/Stated
Value
| | Authorized
Shares
| | Shares
Outstanding at
December 31, 2000
| | Series
| | Mandatory
Redemption
| |
| |
|
|---|
| $ | 100 | | 6,000,000 | | 204,859 | | 4% - 43/4% | | No | | $ | 20,486 | | $ | 20,686 |
| Common Stock Equity | | | | | | | |
| | Common Stock—$8.50 par value; authorized shares—120,000,000; outstanding shares—89,663,086 at December 31, 2000, and December 31, 1999 | | $ | 762,136 | | $ | 762,136 | |
| | Paid-in capital | | | 565,777 | | | 562,851 | |
| | Retained earnings | | | 368,911 | | | 335,144 | |
| | Accumulated other comprehensive income (loss) | | | (994 | ) | | (966 | ) |
| | |
| |
| |
| | | | Total common stock equity | | | 1,695,830 | | | 1,659,165 | |
| | | | |
Total Capitalization |
|
$ |
2,921,377 |
|
$ |
2,885,767 |
|
| | |
| |
| |
The accompanying notes as they relate to The Cincinnati Gas & Electric Company are an
integral part of these consolidated financial statements.
108
PSI ENERGY, INC.
CONSOLIDATED STATEMENTS OF INCOME
| | 2000
| | 1999
| | 1998
|
|---|
| | (dollars in thousands)
|
|---|
| Operating Revenues | | | | | | | | | |
| | Electric | | $ | 2,684,197 | | $ | 2,135,706 | | $ | 2,403,038 |
Operating Expenses |
|
|
|
|
|
|
|
|
|
| | Fuel and purchased and exchanged power | | | 1,724,656 | | | 1,213,653 | | | 1,547,511 |
| | Operation and maintenance | | | 462,577 | | | 460,707 | | | 509,138 |
| | Depreciation and amortization | | | 142,584 | | | 136,402 | | | 130,604 |
| | Taxes other than income taxes | | | 56,908 | | | 52,920 | | | 54,541 |
| | |
| |
| |
|
| | | Total Operating Expenses | | | 2,386,725 | | | 1,863,682 | | | 2,241,794 |
Operating Income |
|
|
297,472 |
|
|
272,024 |
|
|
161,244 |
Miscellaneous—Net |
|
|
4,723 |
|
|
655 |
|
|
3,300 |
| Interest | | | 78,250 | | | 86,265 | | | 89,359 |
| | |
| |
| |
|
Income Before Taxes |
|
|
223,945 |
|
|
186,414 |
|
|
75,185 |
Income Taxes(Note 11) |
|
|
88,547 |
|
|
69,215 |
|
|
23,147 |
| | |
| |
| |
|
Net Income |
|
$ |
135,398 |
|
$ |
117,199 |
|
$ |
52,038 |
| Preferred Dividend Requirement | | | 3,738 | | | 4,601 | | | 5,659 |
| | |
| |
| |
|
| Net Income Applicable to Common Stock | | $ | 131,660 | | $ | 112,598 | | $ | 46,379 |
| | |
| |
| |
|
| | 2004 | | 2003 | | 2002 | |
| | (dollars in thousands) | |
| | | | | | | |
Operating Revenues (Note 1(d)) | | | | | | | |
Electric | | $ | 1,753,699 | | $ | 1,603,019 | | $ | 1,610,578 | |
| | | | | | | |
Operating Expenses | | | | | | | |
Fuel, emission allowances, and purchased power | | 651,086 | | 630,216 | | 547,031 | |
Operation and maintenance | | 474,517 | | 448,668 | | 470,263 | |
Depreciation | | 221,596 | | 163,938 | | 154,524 | |
Taxes other than income taxes | | 47,152 | | 46,200 | | 56,695 | |
Total Operating Expenses | | 1,394,351 | | 1,289,022 | | 1,228,513 | |
| | | | | | | |
Operating Income | | 359,348 | | 313,997 | | 382,065 | |
| | | | | | | |
Miscellaneous Income - Net | | 9,348 | | 6,288 | | 20,582 | |
Interest Expense | | 91,481 | | 85,843 | | 73,689 | |
| | | | | | | |
Income Before Taxes | | 277,215 | | 234,442 | | 328,958 | |
| | | | | | | |
Income Taxes (Note 10) | | 112,213 | | 100,567 | | 114,709 | |
| | | | | | | |
Income Before Cumulative Effect of a Change in Accounting Principle | | 165,002 | | 133,875 | | 214,249 | |
| | | | | | | |
Cumulative effect of a change in accounting principle, net of tax (Note 1(q)(iv)) | | — | | (494 | ) | — | |
| | | | | | | |
Net Income | | $ | 165,002 | | $ | 133,381 | | $ | 214,249 | |
| | | | | | | |
Preferred Dividend Requirement | | 2,587 | | 2,587 | | 2,587 | |
| | | | | | | |
Net Income Applicable to Common Stock | | $ | 162,415 | | $ | 130,794 | | $ | 211,662 | |
| | | | | | | |
| | | | | | | | | | | | |
The accompanying notes as they relate to PSI Energy, Inc. are an
integral part of these consolidated financial statements.
110
PSI ENERGY, INC.
CONSOLIDATED BALANCE SHEETS
| | December 31
|
|---|
ASSETS
| | 2000
| | 1999
|
|---|
| | (dollars in thousands)
|
|---|
| Current Assets | | | | | | |
| | Cash and cash equivalents | | $ | 1,311 | | $ | 8,842 |
| | Restricted deposits | | | 341 | | | — |
| | Notes receivable | | | 3 | | | 481 |
| | Notes receivable from affiliated companies | | | 12,798 | | | 60,360 |
| | Accounts receivable less accumulated provision for doubtful accounts of $9,317 at December 31, 2000, and $9,934 at December 31, 1999 (Note 6) | | | 464,930 | | | 253,022 |
| | Accounts receivable from affiliated companies | | | 5,385 | | | 42,715 |
| | Materials, supplies, and fuel—at average cost | | | 53,838 | | | 103,490 |
| | Prepayments and other | | | 49,049 | | | 36,173 |
| | Energy risk management current assets (Note 1(j)) | | | 697,488 | | | 63,927 |
| | |
| |
|
| | | | Total Current Assets | | | 1,285,143 | | | 569,010 |
Electric Utility Plant—Original Cost |
|
|
|
|
|
|
| | In service | | | 4,699,090 | | | 4,539,111 |
| | Accumulated depreciation | | | 2,110,747 | | | 1,980,290 |
| | |
| |
|
| | | Total | | | 2,588,343 | | | 2,558,821 |
| | Construction work in progress | | | 190,773 | | | 95,825 |
| | |
| |
|
| | | | Total Electric Utility Plant | | | 2,779,116 | | | 2,654,646 |
Other Assets |
|
|
|
|
|
|
| | Regulatory assets (Note 1(c)) | | | 474,286 | | | 518,788 |
| | Energy risk management non-current assets (Note 1(j)) | | | 7,000 | | | 7,368 |
| | Other | | | 84,230 | | | 85,024 |
| | |
| |
|
| | | | Total Other Assets | | | 565,516 | | | 611,180 |
Total Assets |
|
$ |
4,629,775 |
|
$ |
3,834,836 |
| | |
| |
|
ASSETS | | | | | |
| | December 31 | |
| | 2004 | | 2003 | |
| | (dollars in thousands) | |
Current Assets | | | | | |
Cash and cash equivalents | | $ | 10,794 | | $ | 6,565 | |
Restricted deposits | | 22,063 | | 92,675 | |
Notes receivable from affiliated companies | | 72,958 | | 65,715 | |
Accounts receivable less accumulated provision for doubtful accounts of $171 at December 31, 2004, and $1,110 at December 31, 2003 (Note 3(c)) | | 31,177 | | 37,194 | |
Accounts receivable from affiliated companies | | 437 | | 459 | |
Fuel, emission allowances, and supplies (Note 1(g)) | | 108,793 | | 149,392 | |
Energy risk management current assets (Note 1(k)(i)) | | 2,820 | | 7,959 | |
Prepayments and other | | 8,984 | | 5,303 | |
Total Current Assets | | 258,026 | | 365,262 | |
| | | | | |
Property, Plant, and Equipment - at Cost | | | | | |
Utility plant in service (Note 19) | | 6,397,776 | | 6,183,475 | |
Construction work in progress | | 287,925 | | 203,512 | |
Total Utility Plant | | 6,685,701 | | 6,386,987 | |
Accumulated depreciation (Note 1(h)(i)) | | 2,284,932 | | 2,133,235 | |
Net Property, Plant, and Equipment (Note 19) | | 4,400,769 | | 4,253,752 | |
| | | | | |
Other Assets | | | | | |
Regulatory assets (Note 1(c)) | | 420,783 | | 417,387 | |
Energy risk management non-current assets (Note 1(k)(i)) | | 1,690 | | 7,061 | |
Other investments | | 73,396 | | 66,803 | |
Restricted funds held in trust | | 264,335 | | - | |
Other | | 30,897 | | 29,372 | |
Total Other Assets | | 791,101 | | 520,623 | |
| | | | | |
Total Assets | | $ | 5,449,896 | | $ | 5,139,637 | |
| | | | | |
The accompanying notes as they relate to PSI Energy, Inc. are an
integral part of these consolidated financial statements.
111
PSI ENERGY, INC.
CONSOLIDATED BALANCE SHEETS
| | December 31
|
|---|
LIABILITIES AND SHAREHOLDER'S EQUITY
| | 2000
| | 1999
|
|---|
| | (dollars in thousands)
|
|---|
| Current Liabilities | | | | | | |
| | Accounts payable | | $ | 392,206 | | $ | 241,072 |
| | Accounts payable to affiliated companies | | | 32,448 | | | 6,762 |
| | Accrued taxes | | | 80,995 | | | 93,056 |
| | Accrued interest | | | 23,708 | | | 26,989 |
| | Notes payable and other short-term obligations (Note 5) | | | 188,391 | | | 232,597 |
| | Notes payable to affiliated companies | | | 146,381 | | | 6,707 |
| | Long-term debt due within one year (Note 4) | | | 38,325 | | | 31,000 |
| | Energy risk management current liabilities (Note 1(j)) | | | 717,902 | | | 60,478 |
| | Other | | | 12,748 | | | 1,986 |
| | |
| |
|
| | | Total Current Liabilities | | | 1,633,104 | | | 700,647 |
Non-Current Liabilities |
|
|
|
|
|
|
| | Long-term debt (Notes 4 and 17) | | | 1,074,255 | | | 1,211,552 |
| | Deferred income taxes (Note 11) | | | 458,593 | | | 460,748 |
| | Unamortized investment tax credits | | | 39,341 | | | 42,895 |
| | Accrued pension and other postretirement benefit costs (Note 9) | | | 150,135 | | | 129,103 |
| | Energy risk management non-current liabilities (Note 1(j)) | | | 26,337 | | | 57,645 |
| | Other | | | 71,967 | | | 104,638 |
| | |
| |
|
| | | Total Non-Current Liabilities | | | 1,820,628 | | | 2,006,581 |
| | |
Total Liabilities |
|
|
3,453,732 |
|
|
2,707,228 |
Cumulative Preferred Stock(Note 3) |
|
|
|
|
|
|
| | Not subject to mandatory redemption | | | 42,348 | | | 71,911 |
| Common Stock Equity(Note 2) | | | | | | |
| | Common Stock—without par value; $.01 stated value; authorized shares—60,000,000; outstanding shares—53,913,701 at December 31, 2000, and December 31, 1999 | | | 539 | | | 539 |
| | Paid-in capital | | | 413,523 | | | 411,198 |
| | Retained earnings | | | 720,153 | | | 642,569 |
| | Accumulated other comprehensive income (loss) | | | (520 | ) | | 1,391 |
| | |
| |
|
| | | Total Common Stock Equity | | | 1,133,695 | | | 1,055,697 |
Commitments and Contingencies(Note 12) |
|
|
|
|
|
|
Total Liabilities and Shareholder's Equity |
|
$ |
4,629,775 |
|
$ |
3,834,836 |
| | |
| |
|
LIABILITIES AND SHAREHOLDER’S EQUITY | | | | | |
| | December 31 | |
| | 2004 | | 2003 | |
| | (dollars in thousands) | |
Current Liabilities | | | | | |
Accounts payable | | $ | 65,151 | | $ | 58,286 | |
Accounts payable to affiliated companies | | 38,292 | | 69,746 | |
Accrued taxes | | 65,871 | | 69,419 | |
Accrued interest | | 27,532 | | 26,615 | |
Notes payable and other short-term obligations (Note 5) | | 135,500 | | 80,500 | |
Notes payable to affiliated companies (Note 5) | | 130,580 | | 188,446 | |
Long-term debt due within one year | | 50,000 | | - | |
Energy risk management current liabilities (Note 1(k)(i)) | | 1,428 | | 14,744 | |
Other | | 31,898 | | 25,636 | |
Total Current Liabilities | | 546,252 | | 533,392 | |
| | | | | |
Non-Current Liabilities | | | | | |
Long-term debt (Note 4) | | 1,824,219 | | 1,720,476 | |
Deferred income taxes (Note 10) | | 638,061 | | 573,946 | |
Unamortized investment tax credits | | 26,603 | | 29,698 | |
Accrued pension and other postretirement benefit costs (Note 9) | | 209,992 | | 193,336 | |
Regulatory liabilities (Note 1(c)) | | 392,573 | | 335,520 | |
Energy risk management non-current liabilities (Note 1(k)(i)) | | 475 | | 2,796 | |
Other | | 88,190 | | 74,958 | |
Total Non-Current Liabilities | | 3,180,113 | | 2,930,730 | |
| | | | | |
Commitments and Contingencies (Note 11) | | | | | |
| | | | | |
Total Liabilities | | 3,726,365 | | 3,464,122 | |
| | | | | |
Cumulative Preferred Stock | | | | | |
Not subject to mandatory redemption | | 42,333 | | 42,333 | |
| | | | | |
Common Stock Equity (Note 2) | | | | | |
Common stock - without par value; $.01 stated value; authorized shares - 60,000,000; outstanding shares - 53,913,701 at December 31, 2004 and December 31, 2003 | | 539 | | 539 | |
Paid-in capital | | 626,019 | | 627,274 | |
Retained earnings | | 1,078,617 | | 1,018,790 | |
Accumulated other comprehensive loss (Note 18) | | (23,977 | ) | (13,421 | ) |
Total Common Stock Equity | | 1,681,198 | | 1,633,182 | |
| | | | | |
Total Liabilities and Shareholder’s Equity | | $ | 5,449,896 | | $ | 5,139,637 | |
| | | | | |
| | | | | | | | |
The accompanying notes as they relate to PSI Energy, Inc. are an
integral part of these consolidated financial statements.
112
PSI ENERGY, INC.
CONSOLIDATED STATEMENTS OF CHANGES IN COMMON STOCK EQUITY
| | Common
Stock
| | Paid-in
Capital
| | Retained
Earnings
| | Accumulated
Other
Comprehensive
Income (Loss)
| | Total
Common Stock
Equity
| |
|---|
| | (dollars in thousands)
| |
|---|
| 1998 | | | | | | | | | | | | | | | | |
| Beginning balance | | $ | 539 | | $ | 400,893 | | $ | 637,814 | | $ | (1,586 | ) | $ | 1,037,660 | |
Comprehensive income: |
|
|
|
|
|
|
|
|
|
|
|
|
|
|
|
|
| | Net income | | | — | | | — | | | 52,038 | | | — | | | 52,038 | |
| | Other comprehensive income (loss), net of tax effect of $(666) | | | | | | | | | | | | | | | | |
| | | Minimum pension liability adjustment | | | — | | | — | | | — | | | 1,091 | | | 1,091 | |
| | | | | | | | | | | | | | |
| |
| | Total comprehensive income | | | — | | | — | | | — | | | — | | | 53,129 | |
Dividends on preferred stock |
|
|
— |
|
|
— |
|
|
(6,187 |
) |
|
— |
|
|
(6,187 |
) |
| Dividends on common stock | | | — | | | — | | | (106,800 | ) | | — | | | (106,800 | ) |
| Non-cash dividend on common stock | | | — | | | — | | | (11,999 | ) | | — | | | (11,999 | ) |
| Contribution from parent company for reallocation of taxes | | | — | | | 9,823 | | | — | | | — | | | 9,823 | |
| Other | | | — | | | 23 | | | (1 | ) | | — | | | 22 | |
| | |
| |
| |
| |
| |
| |
| Ending balance | | $ | 539 | | $ | 410,739 | | $ | 564,865 | | $ | (495 | ) | $ | 975,648 | |
1999 |
|
|
|
|
|
|
|
|
|
|
|
|
|
|
|
|
| Comprehensive income: | | | | | | | | | | | | | | | | |
| | Net income | | | — | | | — | | | 117,199 | | | — | | | 117,199 | |
| | Other comprehensive income (loss), net of tax effect of $(418) | | | | | | | | | | | | | | | | |
| | | Minimum pension liability adjustment | | | — | | | — | | | — | | | (163 | ) | | (163 | ) |
| | | Unrealized gain (loss) on grantor trust | | | — | | | — | | | — | | | 2,049 | | | 2,049 | |
| | | | | | | | | | | | | | |
| |
| | Total comprehensive income | | | — | | | — | | | — | | | — | | | 119,085 | |
Dividends on preferred stock |
|
|
— |
|
|
— |
|
|
(4,601 |
) |
|
— |
|
|
(4,601 |
) |
| Dividends on common stock | | | — | | | — | | | (35,900 | ) | | — | | | (35,900 | ) |
| Contribution from parent company for reallocation of taxes | | | — | | | 457 | | | — | | | — | | | 457 | |
| Other | | | — | | | 2 | | | 1,006 | | | — | | | 1,008 | |
| | |
| |
| |
| |
| |
| |
| Ending balance | | $ | 539 | | $ | 411,198 | | $ | 642,569 | | $ | 1,391 | | $ | 1,055,697 | |
2000 |
|
|
|
|
|
|
|
|
|
|
|
|
|
|
|
|
| Comprehensive income: | | | | | | | | | | | | | | | | |
| | Net income | | | — | | | — | | | 135,398 | | | — | | | 135,398 | |
| | Other comprehensive income (loss), net of tax effect of $584 | | | | | | | | | | | | | | | | |
| | | Minimum pension liability adjustment | | | — | | | — | | | — | | | (47 | ) | | (47 | ) |
| | | Unrealized gain (loss) on grantor trust | | | — | | | — | | | — | | | (1,864 | ) | | (1,864 | ) |
| | | | | | | | | | | | | | |
| |
| | Total comprehensive income | | | — | | | — | | | — | | | — | | | 133,487 | |
Dividends on preferred stock |
|
|
— |
|
|
— |
|
|
(3,738 |
) |
|
— |
|
|
(3,738 |
) |
| Dividends on common stock | | | — | | | — | | | (54,000 | ) | | — | | | (54,000 | ) |
| Contribution from parent company for reallocation of taxes | | | — | | | 1,989 | | | — | | | — | | | 1,989 | |
| Other | | | — | | | 336 | | | (76 | ) | | — | | | 260 | |
| | |
| |
| |
| |
| |
| |
| Ending balance | | $ | 539 | | $ | 413,523 | | $ | 720,153 | | $ | (520 | ) | $ | 1,133,695 | |
| | |
| |
| |
| |
| |
| |
| | | | | | | | Accumulated | | Total | |
| | | | | | | | Other | | Common | |
| | Common | | Paid-in | | Retained | | Comprehensive | | Stock | |
| | Stock | | Capital | | Earnings | | Income (Loss) | | Equity | |
| | (dollars in thousands) | |
| | | | | | | | | | | |
2002 | | | | | | | | | | | |
Beginning balance | | $ | 539 | | $ | 416,414 | | $ | 880,129 | | $ | (1,595 | ) | $ | 1,295,487 | |
| | | | | | | | | | | |
Comprehensive income: | | | | | | | | | | | |
Net income | | | | | | 214,249 | | | | 214,249 | |
Other comprehensive loss, net of tax effect of $4,189 (Note 18) | | | | | | | | | | | |
Minimum pension liability adjustment | | | | | | | | (2,138 | ) | (2,138 | ) |
Unrealized loss on investment trusts | | | | | | | | (4,386 | ) | (4,386 | ) |
Total comprehensive income | | | | | | | | | | 207,725 | |
| | | | | | | | | | | |
Dividends on preferred stock | | | | | | (2,587 | ) | | | (2,587 | ) |
Dividends on common stock | | | | | | (111,842 | ) | | | (111,842 | ) |
Contribution from parent company for reallocation of taxes | | | | 10,519 | | | | | | 10,519 | |
Other | | | | (2 | ) | 1,997 | | | | 1,995 | |
Ending balance | | $ | 539 | | $ | 426,931 | | $ | 981,946 | | $ | (8,119 | ) | $ | 1,401,297 | |
| | | | | | | | | | | |
2003 | | | | | | | | | | | |
Comprehensive income: | | | | | | | | | | | |
Net income | | | | | | 133,381 | | | | 133,381 | |
Other comprehensive income (loss), net of tax effect of $3,645 (Note 18) | | | | | | | | | | | |
Minimum pension liability adjustment | | | | | | | | (11,534 | ) | (11,534 | ) |
Unrealized gain on investment trusts | | | | | | | | 6,232 | | 6,232 | |
Total comprehensive income | | | | | | | | | | 128,079 | |
| | | | | | | | | | | |
Dividends on preferred stock | | | | | | (2,587 | ) | | | (2,587 | ) |
Dividends on common stock | | | | | | (93,950 | ) | | | (93,950 | ) |
Contribution from parent company - equity infusion | | | | 200,000 | | | | | | 200,000 | |
Contribution from parent company for reallocation of taxes | | | | 343 | | | | | | 343 | |
Ending balance | | $ | 539 | | $ | 627,274 | | $ | 1,018,790 | | $ | (13,421 | ) | $ | 1,633,182 | |
| | | | | | | | | | | |
2004 | | | | | | | | | | | |
Comprehensive income: | | | | | | | | | | | |
Net income | | | | | | 165,002 | | | | 165,002 | |
Other comprehensive income (loss), net of tax effect of $7,350 (Note 18) | | | | | | | | | | | |
Minimum pension liability adjustment | | | | | | | | (12,597 | ) | (12,597 | ) |
Unrealized gain on investment trusts | | | | | | | | 2,041 | | 2,041 | |
Total comprehensive income | | | | | | | | | | 154,446 | |
| | | | | | | | | | | |
Dividends on preferred stock | | | | | | (2,587 | ) | | | (2,587 | ) |
Dividends on common stock | | | | | | (102,588 | ) | | | (102,588 | ) |
Other | | | | (1,255 | ) | | | | | (1,255 | ) |
Ending balance | | $ | 539 | | $ | 626,019 | | $ | 1,078,617 | | $ | (23,977 | ) | $ | 1,681,198 | |
| | | | | | | | | | | |
| | | | | | | | | | | | | | | | | |
The accompanying notes as they relate to PSI Energy, Inc. are an
integral part of these consolidated financial statements.
113
PSI ENERGY, INC.
CONSOLIDATED STATEMENTS OF CASH FLOWS
| | 2000
| | 1999
| | 1998
| |
|---|
| | (dollars in thousands)
| |
|---|
| Operating Activities | | | | | | | | | | |
| | Net income | | $ | 135,398 | | $ | 117,199 | | $ | 52,038 | |
| | Items providing or (using) cash currently: | | | | | | | | | | |
| | | Depreciation and amortization | | | 142,584 | | | 136,402 | | | 130,604 | |
| | | Wabash Valley Power Association, Inc. settlement | | | — | | | — | | | 80,000 | |
| | | Deferred income taxes and investment tax credits—net | | | (6,582 | ) | | 102,878 | | | (57,130 | ) |
| | | Unrealized (gain) loss from energy risk management activities | | | (7,077 | ) | | (27,245 | ) | | 62,000 | |
| | | Allowance for equity funds used during construction | | | (1,354 | ) | | (1,068 | ) | | (21 | ) |
| | | Regulatory assets—net | | | 10,818 | | | (217,549 | ) | | 42,250 | |
| | | Changes in current assets and current liabilities: | | | | | | | | | | |
| | | | Restricted deposits | | | (341 | ) | | 2,414 | | | (1,268 | ) |
| | | | Accounts and notes receivable, net of reserves on receivables sold | | | (130,891 | ) | | (118,183 | ) | | (16,850 | ) |
| | | | Materials, supplies, and fuel | | | 49,652 | | | (23,045 | ) | | (25,256 | ) |
| | | | Accounts payable | | | 176,820 | | | (270 | ) | | (7,086 | ) |
| | | | Accrued taxes and interest | | | (15,342 | ) | | 32,809 | | | (3,437 | ) |
| | | Other items—net | | | 23,695 | | | 42,491 | | | 1,044 | |
| | |
| |
| |
| |
| | | | Net cash provided by operating activities | | | 377,380 | | | 46,833 | | | 256,888 | |
Financing Activities |
|
|
|
|
|
|
|
|
|
|
| | Change in short-term debt | | | 95,468 | | | (36,804 | ) | | 69,073 | |
| | Issuance of long-term debt | | | 53,075 | | | 589,225 | | | 200,228 | |
| | Redemption of long-term debt | | | (187,097 | ) | | (379,484 | ) | | (164,111 | ) |
| | Retirement of preferred stock | | | (29,225 | ) | | (8 | ) | | (85,247 | ) |
| | Dividends on preferred stock | | | (3,738 | ) | | (4,601 | ) | | (6,187 | ) |
| | Dividends on common stock | | | (54,000 | ) | | (35,900 | ) | | (106,800 | ) |
| | |
| |
| |
| |
| | | Net cash provided by (used in) financing activities | | | (125,517 | ) | | 132,428 | | | (93,044 | ) |
Investing Activities |
|
|
|
|
|
|
|
|
|
|
| | Construction expenditures (less allowance for equity funds used during construction) | | | (259,394 | ) | | (189,207 | ) | | (163,225 | ) |
| | |
| |
| |
| |
| | | Net cash used in investing activities | | | (259,394 | ) | | (189,207 | ) | | (163,225 | ) |
Net increase (decrease) in cash and cash equivalents |
|
|
(7,531 |
) |
|
(9,946 |
) |
|
619 |
|
Cash and cash equivalents at beginning of period |
|
|
8,842 |
|
|
18,788 |
|
|
18,169 |
|
| | |
| |
| |
| |
Cash and cash equivalents at end of period |
|
$ |
1,311 |
|
$ |
8,842 |
|
$ |
18,788 |
|
| | |
| |
| |
| |
Supplemental Disclosure of Cash Flow Information |
|
|
|
|
|
|
|
|
|
|
| | Cash paid (received) during the year for: | | | | | | | | | | |
| | | Interest (net of amount capitalized) | | $ | 80,854 | | $ | 86,256 | | $ | 80,712 | |
| | | Income taxes | | $ | 112,210 | | $ | (54,099 | ) | $ | 63,957 | |
| | 2004 | | 2003 | | 2002 | |
| | (dollars in thousands) | |
| | | | | | | |
Operating Activities | | | | | | | |
Net income | | $ | 165,002 | | $ | 133,381 | | $ | 214,249 | |
Adjustments to reconcile net income to net cash provided by operating activities: | | | | | | | |
Depreciation | | 221,596 | | 163,938 | | 154,524 | |
Cumulative effect of a change in accounting principle, net of tax | | — | | 494 | | — | |
Deferred income taxes and investment tax credits - net | | 49,085 | | 38,424 | | 33,908 | |
Change in net position of energy risk management activities | | (5,127 | ) | (1,133 | ) | 9,544 | |
Allowance for equity funds used during construction | | (1,811 | ) | (4,783 | ) | (12,505 | ) |
Regulatory asset/liability deferrals | | (22,333 | ) | (41,282 | ) | (47,423 | ) |
Regulatory asset amortization | | 43,723 | | 53,107 | | 71,628 | |
Accrued pension and other postretirement benefit costs | | 16,656 | | 9,037 | | 24,130 | |
Cost of removal | | (9,887 | ) | (16,598 | ) | — | |
Changes in current assets and current liabilities: | | | | | | | |
Accounts and notes receivable | | (1,204 | ) | 35,643 | | 233,040 | |
Fuel, emission allowances, and supplies | | 39,234 | | 27,330 | | (50,463 | ) |
Prepayments | | 297 | | 686 | | (2,908 | ) |
Accounts payable | | (24,589 | ) | (104,515 | ) | (119,032 | ) |
Accrued taxes and interest | | (2,631 | ) | (33,004 | ) | 2,961 | |
Other assets | | (4,906 | ) | (5,721 | ) | (20,830 | ) |
Other liabilities | | 20,358 | | (8,269 | ) | 8,224 | |
| | | | | | | |
Net cash provided by operating activities | | 483,463 | | 246,735 | | 499,047 | |
| | | | | | | |
Financing Activities | | | | | | | |
Change in short-term debt, including net affiliate notes | | (57,866 | ) | 15,542 | | 46,991 | |
Issuance of long-term debt | | — | | 431,968 | | 47,600 | |
Redemption of long-term debt | | (1,100 | ) | (460,903 | ) | (23,979 | ) |
Contribution from parent | | — | | 200,000 | | — | |
Dividends on preferred stock | | (2,587 | ) | (2,587 | ) | (2,587 | ) |
Dividends on common stock | | (102,588 | ) | (93,950 | ) | (111,842 | ) |
| | | | | | | |
Net cash provided by (used in) financing activities | | (164,141 | ) | 90,070 | | (43,817 | ) |
| | | | | | | |
Investing Activities | | | | | | | |
Construction expenditures (less allowance for equity funds used | | | | | | | |
during construction) | | (337,208 | ) | (330,362 | ) | (451,326 | ) |
Withdrawal of restricted funds held in trust | | 25,273 | | — | | — | |
Other investments | | (3,158 | ) | (1,885 | ) | (3,484 | ) |
| | | | | | | |
Net cash used in investing activities | | (315,093 | ) | (332,247 | ) | (454,810 | ) |
| | | | | | | |
Net increase in cash and cash equivalents | | 4,229 | | 4,558 | | 420 | |
| | | | | | | |
Cash and cash equivalents at beginning of period | | 6,565 | | 2,007 | | 1,587 | |
| | | | | | | |
Cash and cash equivalents at end of period | | $ | 10,794 | | $ | 6,565 | | $ | 2,007 | |
| | | | | | | |
Supplemental Disclosure of Cash Flow Information | | | | | | | |
Cash paid during the year for: | | | | | | | |
Interest (net of amount capitalized) | | $ | 101,275 | | $ | 95,733 | | $ | 89,865 | |
Income taxes | | $ | 60,353 | | $ | 65,564 | | $ | 27,401 | |
| | | | | | | |
The accompanying notes as they relate to PSI Energy, Inc. are an
integral part of these consolidated financial statements.
114
PSI ENERGY, INC.
CONSOLIDATED STATEMENTS OF CAPITALIZATION
| | December 31
| |
|---|
| | 2000
| | 1999
| |
|---|
| | (dollars in thousands)
| |
|---|
| Long-term Debt (excludes current portion) | | | | | | | |
| |
First Mortgage Bonds: |
|
|
|
|
|
|
|
| | | Series TT, 73/8%, due March 15, 2012 (Pollution Control) | | $ | — | | $ | 10,000 | |
| | | Series UU, 71/2%, due March 15, 2015 (Pollution Control) | | | — | | | 14,250 | |
| | | Series YY, 5.60%, due February 15, 2023 (Pollution Control) | | | — | | | 29,945 | |
| | | Series ZZ, 53/4%, due February 15, 2028 (Pollution Control) | | | 50,000 | | | 50,000 | |
| | | Series AAA, 71/8%, due February 1, 2024 | | | 30,000 | | | 30,000 | |
| | | Series BBB, 8.0%, due July 15, 2009 | | | 124,665 | | | 124,665 | |
| | | Series CCC, 8.85%, due January 15, 2022 | | | 53,055 | | | 53,055 | |
| | | Series DDD, 8.31%, due September 1, 2032 | | | 38,000 | | | 38,000 | |
| | |
| |
| |
| | | | Total first mortgage bonds | | | 295,720 | | | 349,915 | |
| |
Secured Medium-term Notes: |
|
|
|
|
|
|
|
| | | Series A, 7.61% to 8.81%, due January 2, 2002 to June 1, 2022 | | | 57,300 | | | 75,800 | |
| | | Series B, 5.93% to 8.24%, due September 17, 2003 to August 22, 2022 | | | 126,000 | | | 126,000 | |
| | |
| |
| |
| | | | (Series A and B, 7.105% weighted average interest rate and 9 year weighted average remaining life) | | | | | | | |
| | | | | Total secured medium-term notes | | | 183,300 | | | 201,800 | |
| |
Other Long-term Debt: |
|
|
|
|
|
|
|
| | | Series 2000A, Pollution Control Revenue Refunding Bond, due May 1, 2035 | | | 44,025 | | | — | |
| | | Series 2000B, Pollution Control Revenue Refunding Bond, due April 1, 2022 | | | 10,000 | | | — | |
| | | Series 1994A Promissory Note, non-interest bearing, due January 3, 2001 | | | — | | | 19,825 | |
| | | 6.35% Debentures due November 15, 2006 | | | 50 | | | 100,000 | |
| | | 6.00% Debentures due December 14, 2016 (The interest rate resets on December 14, 2001) | | | 50,000 | | | 50,000 | |
| | | 6.50% Synthetic Putable Yield Securities due August 1, 2026 | | | 50,000 | | | 50,000 | |
| | | 7.25% Junior Maturing Principal Securities due March 15, 2028 | | | 2,658 | | | 2,658 | |
| | | 6.00% Rural Utilities Service (RUS) Obligation payable in annual installments (Note 17) | | | 83,927 | | | 84,798 | |
| | | 6.52% Senior Notes due March 15, 2009 | | | 97,342 | | | 97,342 | |
| | | 7.85% Debentures due October 15, 2007 | | | 265,000 | | | 265,000 | |
| | |
| |
| |
| | | | Total other long-term debt | | | 603,002 | | | 669,623 | |
| |
Unamortized Premium and Discount—Net |
|
|
(7,767 |
) |
|
(9,786 |
) |
| | |
| |
| |
| | Total long-term debt | | | 1,074,255 | | | 1,211,552 | |
| | December 31 | |
| | 2004 | | 2003 | |
| | (dollars in thousands) | |
Long-term Debt (excludes current portion) | | | | | |
| | | | | |
First Mortgage Bonds: | | | | | |
Series ZZ, 5 ¾% due February 15, 2028 (Pollution Control) | | $ | 50,000 | | $ | 50,000 | |
Series AAA, 7 1/8% due February 1, 2024 | | 30,000 | | 30,000 | |
Series BBB, 8.0% due July 15, 2009 | | 124,665 | | 124,665 | |
Series CCC, 8.85% due January 15, 2022 | | 53,055 | | 53,055 | |
Series DDD, 8.31% due September 1, 2032 | | 38,000 | | 38,000 | |
Series EEE, 6.65% due June 15, 2006 | | 325,000 | | 325,000 | |
Total First Mortgage Bonds | | 620,720 | | 620,720 | |
| | | | | |
Secured Medium-term Notes: | | | | | |
Series A, 8.55% to 8.57% as of December 31, 2004 and 2003, respectively. Due December 27, 2011. | | 7,500 | | 7,500 | |
Series B, 6.37% to 8.24%, due August 15, 2008 to August 22, 2022 | | 70,000 | | 70,000 | |
(Series A and B, 7.255% weighted average interest rate as of December 31, 2004 and 2003, respectively. 9.1 and 10.1 year weighted average remaining life at December 31, 2004 and 2003, respectively) | | | | | |
Total Secured Medium-term Notes | | 77,500 | | 77,500 | |
| | | | | |
Other Long-term Debt: | | | | | |
Indiana Development Finance Authority Environmental Refunding Revenue Bonds, due May 1, 2035 | | 44,025 | | 44,025 | |
Indiana Development Finance Authority Environmental Refunding Revenue Bonds, due April 1, 2022 | | 10,000 | | 10,000 | |
6.35% Debentures due November 15, 2006 | | 50 | | 50 | |
6.50% Synthetic Putable Yield Securities due August 1, 2026 (Interest rate resets August 1, 2005) | | - | | 50,000 | |
7.25% Junior Maturing Principal Securities due March 15, 2028 | | 2,658 | | 2,658 | |
6.00% Rural Utilities Service Obligation payable in annual installments | | 79,888 | | 80,988 | |
6.52% Senior Notes due March 15, 2009 | | 97,342 | | 97,342 | |
7.85% Debentures due October 15, 2007 | | 265,000 | | 265,000 | |
5.00% Debentures due September 15, 2013 | | 400,000 | | 400,000 | |
Series 2002A, Indiana Development Finance Authority Environmental Refunding Revenue Bonds, due March 1, 2031 | | 23,000 | | 23,000 | |
Series 2002B, Indiana Development Finance Authority Environmental Refunding Revenue Bonds, due March 1, 2019 | | 24,600 | | 24,600 | |
Series 2003, Indiana Development Finance Authority Environmental Refunding Revenue Bonds, due April 1, 2022 | | 35,000 | | 35,000 | |
Series 2004B, Indiana Development Finance Authority Environmental Revenue Bonds, due December 1, 2039 (Note 4) | | 77,125 | | — | |
Series 2004C, Indiana Development Finance Authority Environmental Revenue Bonds, due December 1, 2039 (Note 4) | | 77,125 | | — | |
Total Other Long-term Debt | | 1,135,813 | | 1,032,663 | |
| | | | | |
Unamortized Premium and Discount - Net | | (9,814 | ) | (10,407 | ) |
Total Long-term Debt | | $ | 1,824,219 | | $ | 1,720,476 | |
| | | | | |
Cumulative Preferred Stock | | | | | | | | | | | |
| | | | | | | | | | | |
| | | | Shares | | | | | | | | | |
Par/Stated | | Authorized | | Outstanding at | | | | Mandatory | | | | | |
Value | | Shares | | December 31, 2004 | | Series | | Redemption | | | | | |
$ | 100 | | 5,000,000 | | 347,445 | | 3 1/2% - 6 7/8% | | No | | $ | 34,744 | | $ | 34,744 | |
$ | 25 | | 5,000,000 | | 303,544 | | 4.16% - 4.32% | | No | | 7,589 | | 7,589 | |
Total Preferred Stock | | | | | | | | $ | 42,333 | | $ | 42,333 | |
| | | | | | | | | | | | | |
Common Stock Equity | | | | | | | | $ | 1,681,198 | | $ | 1,633,182 | |
| | | | | | | | | | | | | |
| | Total Consolidated Capitalization | | $ | 3,547,750 | | $ | 3,395,991 | |
| | | | | | | | | | | | | |
| | | | | | | | | | | | | | | | | |
|
Cumulative Preferred Stock |
Par/Stated
Value
|
|
Authorized
Shares
|
|
Shares
Outstanding at
December 31, 2000
|
|
Series
|
|
Mandatory
Redemption
|
|
|
|
|
|---|
| $ | 100 | | 5,000,000 | | 347,592 | | 31/2%—6.875% | | No | | $ | 34,759 | | $ | 63,963 |
| $ | 25 | | 5,000,000 | | 303,544 | | 4.16%—4.32% | | No | | | 7,589 | | | 7,948 |
| | | | | | | | | | | |
| |
|
| Total preferred stock | | | 42,348 | | | 71,911 |
Common Stock Equity |
|
|
|
|
|
|
| |
Common Stock—without par value; $0.01 stated value; authorized
shares—60,000,000; outstanding shares—53,913,701 at
December 31, 2000, and December 31, 1999 |
|
$ |
539 |
|
$ |
539 |
| | Paid-in capital | | | 413,523 | | | 411,198 |
| | Retained earnings | | | 720,153 | | | 642,569 |
| | Accumulated other comprehensive income (loss) | | | (520 | ) | | 1,391 |
| | |
| |
|
| | Total common stock equity | | | 1,133,695 | | | 1,055,697 |
| |
Total Capitalization |
|
$ |
2,250,298 |
|
$ |
2,339,160 |
| | |
| |
|
The accompanying notes as they relate to PSI Energy, Inc. are an
integral part of these consolidated financial statements.
115
THE UNION LIGHT, HEAT AND POWER COMPANY
STATEMENTS OF INCOME
| | 2000
| | 1999
| | 1998
| |
|---|
| | (dollars in thousands)
| |
|---|
| Operating Revenues | | | | | | | | | | |
| | Electric | | $ | 225,601 | | $ | 210,234 | | $ | 191,359 | |
| | Gas | | | 91,950 | | | 70,728 | | | 65,454 | |
| | |
| |
| |
| |
| | | Total Operating Revenues | | | 317,551 | | | 280,962 | | | 256,813 | |
Operating Expenses |
|
|
|
|
|
|
|
|
|
|
| | Electricity purchased from parent company for resale | | | 159,915 | | | 158,556 | | | 142,567 | |
| | Gas purchased | | | 51,591 | | | 34,690 | | | 32,804 | |
| | Operation and maintenance | | | 40,699 | | | 38,611 | | | 37,131 | |
| | Depreciation and amortization | | | 15,685 | | | 14,830 | | | 13,148 | |
| | Taxes other than income taxes | | | 3,938 | | | 4,136 | | | 3,993 | |
| | |
| |
| |
| |
| | | Total Operating Expenses | | | 271,828 | | | 250,823 | | | 229,643 | |
Operating Income |
|
|
45,723 |
|
|
30,139 |
|
|
27,170 |
|
Miscellaneous—Net |
|
|
(982 |
) |
|
(1,567 |
) |
|
(1,242 |
) |
| Interest | | | 6,308 | | | 6,114 | | | 4,604 | |
| | |
| |
| |
| |
Income Before Taxes |
|
|
38,433 |
|
|
22,458 |
|
|
21,324 |
|
Income Taxes(Note 11) |
|
|
13,801 |
|
|
10,184 |
|
|
7,774 |
|
| | |
| |
| |
| |
| Net Income | | $ | 24,632 | | $ | 12,274 | | $ | 13,550 | |
| | |
| |
| |
| |
| | 2004 | | 2003 | | 2002 | |
| | (dollars in thousands) | |
| | | | | | | |
Operating Revenues (Note 1(d)) | | | | | | | |
Electric | | $ | 230,068 | | $ | 222,081 | | $ | 226,856 | |
Gas | | 124,475 | | 110,072 | | 81,706 | |
Total Operating Revenues | | 354,543 | | 332,153 | | 308,562 | |
| | | | | | | |
Operating Expenses | | | | | | | |
Electricity purchased from parent company for resale (Note 1(s)(ii)) | | 162,497 | | 154,572 | | 159,734 | |
Gas purchased | | 79,278 | | 69,774 | | 46,886 | |
Operation and maintenance | | 55,810 | | 53,704 | | 50,223 | |
Depreciation | | 20,034 | | 18,315 | | 17,350 | |
Taxes other than income taxes | | 3,544 | | 4,412 | | 4,598 | |
Total Operating Expenses | | 321,163 | | 300,777 | | 278,791 | |
| | | | | | | |
Operating Income | | 33,380 | | 31,376 | | 29,771 | |
| | | | | | | |
Miscellaneous Income - Net | | 813 | | 3,561 | | 666 | |
Interest Expense | | 5,179 | | 6,127 | | 5,938 | |
| | | | | | | |
Income Before Taxes | | 29,014 | | 28,810 | | 24,499 | |
| | | | | | | |
Income Taxes (Note 10) | | 10,376 | | 9,781 | | 12,349 | |
| | | | | | | |
Net Income | | $ | 18,638 | | $ | 19,029 | | $ | 12,150 | |
| | | | | | | |
| | | | | | | | | | | | |
The accompanying notes as they relate to The Union Light, Heat and Power Company are an
integral part of these financial statements.
117
THE UNION LIGHT, HEAT AND POWER COMPANY
BALANCE SHEETS
| | December 31
|
|---|
ASSETS
| | 2000
| | 1999
|
|---|
| | (dollars in thousands)
|
|---|
| Current Assets | | | | | | |
| | Cash and cash equivalents | | $ | 6,460 | | $ | 3,641 |
| | Accounts receivable less accumulated provision for doubtful accounts of $1,492 at December 31, 2000, and $1,513 at December 31, 1999 (Note 6) | | | 28,518 | | | 17,786 |
| | Accounts receivable from affiliated companies | | | 2,279 | | | 775 |
| | Materials, supplies, and fuel—at average cost | | | 6,300 | | | 7,654 |
| | Prepayments and other | | | 274 | | | 219 |
| | |
| |
|
| | | | | Total Current Assets | | | 43,831 | | | 30,075 |
Utility Plant—Original Cost |
|
|
|
|
|
|
| | In service | | | | | | |
| | | Electric | | | 234,482 | | | 222,035 |
| | | Gas | | | 184,878 | | | 173,011 |
| | | Common | | | 44,603 | | | 42,351 |
| | |
| |
|
| | | | Total | | | 463,963 | | | 437,397 |
| | Accumulated depreciation | | | 169,403 | | | 154,607 |
| | |
| |
|
| | | | Total | | | 294,560 | | | 282,790 |
| | Construction work in progress | | | 15,069 | | | 13,761 |
| | |
| |
|
| | | | | Total Utility Plant | | | 309,629 | | | 296,551 |
Other Assets |
|
|
|
|
|
|
| | Regulatory assets (Note 1(c)) | | | 10,177 | | | 10,639 |
| | Other | | | 5,110 | | | 5,000 |
| | |
| |
|
| | | | | Total Other Assets | | | 15,287 | | | 15,639 |
Total Assets |
|
$ |
368,747 |
|
$ |
342,265 |
| | |
| |
|
ASSETS | | | | | |
| | December 31 | |
| | 2004 | | 2003 | |
| | (dollars in thousands) | |
Current Assets | | | | | |
Cash and cash equivalents | | $ | 4,197 | | $ | 1,899 | |
Notes receivable from affiliated companies | | 20,675 | | 17,906 | |
Accounts receivable less accumulated provision for doubtful accounts of $13 at December 31, 2004, and $192 at December 31, 2003 (Note 3(c)) | | 1,451 | | 2,458 | |
Accounts receivable from affiliated companies | | 5,671 | | 4,407 | |
Fuel and supplies | | 8,500 | | 7,936 | |
Prepayments and other | | 285 | | 279 | |
Total Current Assets | | 40,779 | | 34,885 | |
| | | | | |
Property, Plant, and Equipment - at Cost | | | | | |
Utility plant in service | | | | | |
Electric | | 285,828 | | 273,895 | |
Gas | | 256,667 | | 239,670 | |
Common | | 42,176 | | 53,297 | |
Total Utility Plant In Service | | 584,671 | | 566,862 | |
Construction work in progress | | 6,070 | | 6,165 | |
Total Utility Plant | | 590,741 | | 573,027 | |
Accumulated depreciation (Note 1(h)(i)) | | 176,726 | | 176,368 | |
Net Property, Plant, and Equipment (Note 19) | | 414,015 | | 396,659 | |
| | | | | |
Other Assets | | | | | |
Regulatory assets (Note 1(c)) | | 10,070 | | 16,150 | |
Other | | 2,801 | | 977 | |
Total Other Assets | | 12,871 | | 17,127 | |
| | | | | |
Total Assets | | $ | 467,665 | | $ | 448,671 | |
| | | | | |
The accompanying notes as they relate to The Union Light, Heat and Power Company are an
integral part of these financial statements.
118
THE UNION LIGHT, HEAT AND POWER COMPANY
BALANCE SHEETS
| | December 31
|
|---|
LIABILITIES AND SHAREHOLDER'S EQUITY
| | 2000
| | 1999
|
|---|
| | (dollars in thousands)
|
|---|
| Current Liabilities | | | | | | |
| | Accounts payable | | $ | 24,249 | | $ | 8,487 |
| | Accounts payable to affiliated companies | | | 20,192 | | | 20,122 |
| | Accrued taxes | | | (5,760 | ) | | 739 |
| | Accrued interest | | | 1,215 | | | 1,298 |
| | Notes payable to affiliated companies | | | 29,403 | | | 37,752 |
| | Other | | | 11,669 | | | 4,062 |
| | |
| |
|
| | | Total Current Liabilities | | | 80,968 | | | 72,460 |
Non-Current Liabilities |
|
|
|
|
|
|
| | Long-term debt (Note 4) | | | 74,589 | | | 74,557 |
| | Deferred income taxes (Note 11) | | | 35,822 | | | 23,000 |
| | Unamortized investment tax credits | | | 3,684 | | | 3,961 |
| | Accrued pension and other postretirement benefit costs (Note 9) | | | 13,041 | | | 12,333 |
| | Amounts due to customers—income taxes | | | 7,439 | | | 11,308 |
| | Other | | | 6,016 | | | 12,596 |
| | |
| |
|
| | | Total Non-Current Liabilities | | | 140,591 | | | 137,755 |
Total Liabilities |
|
|
221,559 |
|
|
210,215 |
Common Stock Equity(Note 2) |
|
|
|
|
|
|
| | Common Stock—$15.00 par value; authorized shares—1,000,000; outstanding shares—585,333 at December 31, 2000, and December 31, 1999 | | | 8,780 | | | 8,780 |
| | Paid-in capital | | | 20,305 | | | 20,142 |
| | Retained earnings | | | 118,103 | | | 103,128 |
| | |
| |
|
| | | Total Common Stock Equity | | | 147,188 | | | 132,050 |
Commitments and Contingencies(Note 12) |
|
|
|
|
|
|
Total Liabilities and Shareholder's Equity |
|
$ |
368,747 |
|
$ |
342,265 |
LIABILITIES AND SHAREHOLDER’S EQUITY | | | | | |
| | December 31 | |
| | 2004 | | 2003 | |
| | (dollars in thousands) | |
Current Liabilities | | | | | |
Accounts payable | | $ | 16,028 | | $ | 13,431 | |
Accounts payable to affiliated companies | | 22,236 | | 21,131 | |
Accrued interest | | 1,370 | | 1,230 | |
Notes payable to affiliated companies (Note 5) | | 11,246 | | 45,233 | |
Other | | 7,009 | | 7,113 | |
Total Current Liabilities | | 57,889 | | 88,138 | |
| | | | | |
Non-Current Liabilities | | | | | |
Long-term debt (Note 4) | | 94,340 | | 54,685 | |
Deferred income taxes (Note 10) | | 58,422 | | 55,488 | |
Unamortized investment tax credits | | 2,626 | | 2,879 | |
Accrued pension and other postretirement benefit costs (Note 9) | | 17,762 | | 16,953 | |
Regulatory liabilities (Note 1(c)) | | 29,979 | | 27,443 | |
Other | | 14,136 | | 13,729 | |
Total Non-Current Liabilities | | 217,265 | | 171,177 | |
| | | | | |
Commitments and Contingencies (Note 11) | | | | | |
| | | | | |
Total Liabilities | | 275,154 | | 259,315 | |
| | | | | |
Common Stock Equity (Note 2) | | | | | |
Common stock - $15.00 par value; authorized shares - 1,000,000; outstanding shares—585,333 at December 31, 2004 and December 31, 2003 | | 8,780 | | 8,780 | |
Paid-in capital | | 23,455 | | 23,541 | |
Retained earnings | | 161,562 | | 157,524 | |
Accumulated other comprehensive loss | | (1,286 | ) | (489 | ) |
Total Common Stock Equity | | 192,511 | | 189,356 | |
| | | | | |
Total Liabilities and Shareholder’s Equity | | $ | 467,665 | | $ | 448,671 | |
| | | | | |
The accompanying notes as they relate to The Union Light, Heat and Power Company are an
integral part of these financial statements.
119
THE UNION LIGHT, HEAT AND POWER COMPANY
STATEMENTS OF CHANGES IN COMMON STOCK EQUITY
| | Common
Stock
| | Paid-in
Capital
| | Retained
Earnings
| | Total Common
Stock
Equity
| |
|---|
| | (dollars in thousands)
| |
|---|
| 1998 | | | | | | | | | | | | | |
| Beginning balance | | $ | 8,780 | | $ | 18,683 | | $ | 95,450 | | $ | 122,913 | |
| Net income | | | — | | | — | | | 13,550 | | | 13,550 | |
| Dividends on common stock | | | — | | | — | | | (8,487 | ) | | (8,487 | ) |
| Contribution from parent for reallocation of taxes | | | — | | | 843 | | | — | | | 843 | |
| Other | | | — | | | (1 | ) | | — | | | (1 | ) |
| | |
| |
| |
| |
| |
| Ending balance | | $ | 8,780 | | $ | 19,525 | | $ | 100,513 | | $ | 128,818 | |
1999 |
|
|
|
|
|
|
|
|
|
|
|
|
|
| Net income | | | — | | | — | | | 12,274 | | | 12,274 | |
| Dividends on common stock | | | — | | | — | | | (9,659 | ) | | (9,659 | ) |
| Contribution from parent for reallocation of taxes | | | — | | | 617 | | | — | | | 617 | |
| | |
| |
| |
| |
| |
| Ending balance | | $ | 8,780 | | $ | 20,142 | | $ | 103,128 | | $ | 132,050 | |
2000 |
|
|
|
|
|
|
|
|
|
|
|
|
|
| Net income | | | — | | | — | | | 24,632 | | | 24,632 | |
| Dividends on common stock | | | — | | | — | | | (9,657 | ) | | (9,657 | ) |
| Contribution from parent for reallocation of taxes | | | — | | | 163 | | | — | | | 163 | |
| | |
| |
| |
| |
| |
| Ending balance | | $ | 8,780 | | $ | 20,305 | | $ | 118,103 | | $ | 147,188 | |
| | |
| |
| |
| |
| |
| | Common Stock | | Paid-in Capital | | Retained Earnings | | Accumulated Other Comprehensive Loss | | Total Common Stock Equity | |
| | (dollars in thousands) | |
| | | | | | | | | | | |
2002 | | | | | | | | | | | |
Beginning balance | | $ | 8,780 | | $ | 21,111 | | $ | 142,320 | | $ | (8 | ) | $ | 172,203 | |
| | | | | | | | | | | |
Comprehensive income: | | | | | | | | | | | |
Net income | | | | | | 12,150 | | | | 12,150 | |
Other comprehensive loss, net of tax effect of $36 | | | | | | | | | | | |
Minimum pension liability adjustment | | | | | | | | (52 | ) | (52 | ) |
Total comprehensive income | | | | | | | | | | 12,098 | |
| | | | | | | | | | | |
Dividends on common stock | | | | | | (9,670 | ) | | | (9,670 | ) |
Contribution from parent company for reallocation of taxes | | | | 2,533 | | | | | | 2,533 | |
Ending balance | | $ | 8,780 | | $ | 23,644 | | $ | 144,800 | | $ | (60 | ) | $ | 177,164 | |
| | | | | | | | | | | |
2003 | | | | | | | | | | | |
Comprehensive income: | | | | | | | | | | | |
Net income | | | | | | 19,029 | | | | 19,029 | |
Other comprehensive loss, net of tax effect of $291 | | | | | | | | | | | |
Minimum pension liability adjustment | | | | | | | | (429 | ) | (429 | ) |
Total comprehensive income | | | | | | | | | | 18,600 | |
| | | | | | | | | | | |
Dividends on common stock | | | | | | (6,305 | ) | | | (6,305 | ) |
Contribution from parent company for reallocation of taxes | | | | (103 | ) | | | | | (103 | ) |
Ending balance | | $ | 8,780 | | $ | 23,541 | | $ | 157,524 | | $ | (489 | ) | $ | 189,356 | |
| | | | | | | | | | | |
2004 | | | | | | | | | | | |
Comprehensive income: | | | | | | | | | | | |
Net income | | | | | | 18,638 | | | | 18,638 | |
Other comprehensive loss, net of tax effect of $539 | | | | | | | | | | | |
Minimum pension liability adjustment | | | | | | | | (797) | | (797 | ) |
Total comprehensive income | | | | | | | | | | 17,841 | |
| | | | | | | | | | | |
Dividends on common stock | | | | | | (14,600 | ) | | | (14,600 | ) |
Other | | | | (86 | ) | | | | | (86 | ) |
Ending balance | | $ | 8,780 | | $ | 23,455 | | $ | 161,562 | | $ | (1,286 | ) | $ | 192,511 | |
| | | | | | | | | | | |
| | | | | | | | | | | | | | | | | |
The accompanying notes as they relate to The Union Light, Heat and Power Company are an
integral part of these financial statements.
120
THE UNION LIGHT, HEAT AND POWER COMPANY
STATEMENTS OF CASH FLOWS
| | 2000
| | 1999
| | 1998
| |
|---|
| | (dollars in thousands)
| |
|---|
| Operating Activities | | | | | | | | | | |
| | Net income | | $ | 24,632 | | $ | 12,274 | | $ | 13,550 | |
| | Items providing or (using) cash currently: | | | | | | | | | | |
| | | Depreciation and amortization | | | 15,685 | | | 14,830 | | | 13,148 | |
| | | Deferred income taxes and investment tax credits—net | | | 8,926 | | | (738 | ) | | (261 | ) |
| | | Allowance for equity funds used during construction | | | (61 | ) | | (36 | ) | | (142 | ) |
| | | Regulatory assets—net | | | 259 | | | 138 | | | 3 | |
| | | Changes in current assets and current liabilities: | | | | | | | | | | |
| | | | Accounts and notes receivable, net of reserves on receivables sold | | | (14,269 | ) | | (5,099 | ) | | (4,820 | ) |
| | | | Materials, supplies, and fuel | | | 1,354 | | | 615 | | | (2,175 | ) |
| | | | Accounts payable | | | 15,832 | | | 7,720 | | | (9,920 | ) |
| | | | Accrued taxes and interest | | | (6,582 | ) | | (3,138 | ) | | (2,443 | ) |
| | | Other items—net | | | 3,482 | | | 5,971 | | | 3,228 | |
| | |
| |
| |
| |
| | | | | Net cash provided by operating activities | | | 49,258 | | | 32,537 | | | 10,168 | |
Financing Activities |
|
|
|
|
|
|
|
|
|
|
| | Change in short-term debt | | | (8,349 | ) | | 5,935 | | | 8,330 | |
| | Issuance of long-term debt | | | — | | | 19,818 | | | 40,066 | |
| | Redemption of long-term debt | | | — | | | (20,000 | ) | | (10,118 | ) |
| | Dividends on common stock | | | (9,657 | ) | | (9,659 | ) | | (8,487 | ) |
| | |
| |
| |
| |
| | | | | Net cash provided by (used in) financing activities | | | (18,006 | ) | | (3,906 | ) | | 29,791 | |
Investing Activities |
|
|
|
|
|
|
|
|
|
|
| | Construction expenditures (less allowance for equity funds used during construction) | | | (28,433 | ) | | (28,234 | ) | | (37,261 | ) |
| | |
| |
| |
| |
| | | | | Net cash used in investing activities | | | (28,433 | ) | | (28,234 | ) | | (37,261 | ) |
Net increase in cash and cash equivalents |
|
|
2,819 |
|
|
397 |
|
|
2,698 |
|
Cash and cash equivalents at beginning of period |
|
|
3,641 |
|
|
3,244 |
|
|
546 |
|
| | |
| |
| |
| |
| Cash and cash equivalents at end of period | | $ | 6,460 | | $ | 3,641 | | $ | 3,244 | |
| | |
| |
| |
| |
| Supplemental Disclosure of Cash Flow Information | | | | | | | | | | |
| | Cash paid during the year for: | | | | | | | | | | |
| | | Interest (net of amount capitalized) | | $ | 6,534 | | $ | 6,691 | | $ | 4,257 | |
| | | Income taxes | | $ | 11,760 | | $ | 12,794 | | $ | 11,305 | |
| | 2004 | | 2003 | | 2002 | |
| | (dollars in thousands) | |
| | | | | | | |
Operating Activities | | | | | | | |
Net income | | $ | 18,638 | | $ | 19,029 | | $ | 12,150 | |
Adjustments to reconcile net income to net cash provided by operating activities: | | | | | | | |
Depreciation | | 20,034 | | 18,315 | | 17,350 | |
Deferred income taxes and investment tax credits - net | | 7,601 | | 7,808 | | 3,116 | |
Allowance for equity funds used during construction | | 18 | | (183 | ) | (794 | ) |
Regulatory asset/liability deferrals | | (2,337 | ) | (8,138 | ) | 7,787 | |
Regulatory asset amortization | | 1,613 | | 1,843 | | (1,452 | ) |
Accrued pension and other postretirement benefit costs | | 809 | | 1,333 | | 2,343 | |
Cost of removal | | (1,588 | ) | — | | — | |
Changes in current assets and current liabilities: | | | | | | | |
Accounts and notes receivable | | (3,026 | ) | (9,060 | ) | 8,997 | |
Fuel and supplies | | (564 | ) | 246 | | 2,653 | |
Prepayments | | (6 | ) | 37 | | (16 | ) |
Accounts payable | | 3,702 | | 3,449 | | 6,997 | |
Accrued taxes and interest | | (729 | ) | (1,185 | ) | (4,981 | ) |
Other assets | | 1,815 | | (3,521 | ) | 2,852 | |
Other liabilities | | (599 | ) | 3,088 | | 3,705 | |
| | | | | | | |
Net cash provided by operating activities | | 45,381 | | 33,061 | | 60,707 | |
| | | | | | | |
Financing Activities | | | | | | | |
Change in short-term debt, including net affiliate notes | | (33,987 | ) | 31,157 | | (12,356 | ) |
Issuance of long-term debt | | 39,361 | | — | | — | |
Redemption of long-term debt | | — | | (20,000 | ) | — | |
Dividends on common stock | | (14,600 | ) | (6,305 | ) | (9,670 | ) |
| | | | | | | |
Net cash provided by (used in) financing activities | | (9,226 | ) | 4,852 | | (22,026 | ) |
| | | | | | | |
Investing Activities | | | | | | | |
Construction expenditures (less allowance for equity funds used during construction) | | (33,857 | ) | (39,940 | ) | (38,854 | ) |
| | | | | | | |
Net cash used in investing activities | | (33,857 | ) | (39,940 | ) | (38,854 | ) |
| | | | | | | |
Net increase (decrease) in cash and cash equivalents | | 2,298 | | (2,027 | ) | (173 | ) |
| | | | | | | |
Cash and cash equivalents at beginning of period | | 1,899 | | 3,926 | | 4,099 | |
| | | | | | | |
Cash and cash equivalents at end of period | | $ | 4,197 | | $ | 1,899 | | $ | 3,926 | |
| | | | | | | |
Supplemental Disclosure of Cash Flow Information | | | | | | | |
Cash paid during the year for: | | | | | | | |
Interest (net of amount capitalized) | | $ | 4,796 | | $ | 5,842 | | $ | 5,067 | |
Income taxes | | $ | 2,827 | | $ | 3,001 | | $ | 2,398 | |
| | | | | | | |
| | | | | | | | | | | |
The accompanying notes as they relate to The Union Light, Heat and Power Company are an
integral part of these financial statements.
121
THE UNION LIGHT, HEAT AND POWER COMPANY
STATEMENTS OF CAPITALIZATION
| | December 31
| |
|---|
| | 2000
| | 1999
| |
|---|
| | (dollars in thousands)
| |
|---|
| Long-term Debt (excludes current portion) | | | | | | | |
| | Other Long-term Debt: | | | | | | | |
| | | 6.11% Debentures due December 8, 2003 | | $ | 20,000 | | $ | 20,000 | |
| | | 6.50% Debentures due April 30, 2008 | | | 20,000 | | | 20,000 | |
| | | 7.65% Debentures due July 15, 2025 | | | 15,000 | | | 15,000 | |
| | | 7.875% Senior Unsecured Debentures due September 15, 2009 | | | 20,000 | | | 20,000 | |
| | |
| |
| |
| | | | Total other long-term debt | | | 75,000 | | | 75,000 | |
| | Unamortized Premium and Discount—Net | | | (411 | ) | | (443 | ) |
| | |
| |
| |
| | Total long-term debt | | | 74,589 | | | 74,557 | |
| Common Stock Equity | | | | | | | |
| | Common Stock—$15.00 par value; authorized shares—1,000,000; outstanding shares—585,333 at December 31, 2000, and December 31, 1999 | | $ | 8,780 | | $ | 8,780 | |
| | Paid-in capital | | | 20,305 | | | 20,142 | |
| | Retained earnings | | | 118,103 | | | 103,128 | |
| | |
| |
| |
| | | | Total common stock equity | | | 147,188 | | | 132,050 | |
| | | | |
Total Capitalization |
|
$ |
221,777 |
|
$ |
206,607 |
|
| | |
| |
| |
| | December 31 | |
| | 2004 | | 2003 | |
| | (dollars in thousands) | |
| | | | | |
Long-term Debt (excludes current portion) | | | | | |
| | | | | |
Other Long-term Debt: | | | | | |
6.50% Debentures due April 30, 2008 | | $ | 20,000 | | $ | 20,000 | |
7.65% Debentures due July 15, 2025 | | 15,000 | | 15,000 | |
7.875% Debentures due September 15, 2009 | | 20,000 | | 20,000 | |
5.00% Debentures due December 15, 2014 (Note 4) | | 40,000 | | — | |
Total Other Long-term Debt | | 95,000 | | 55,000 | |
| | | | | |
Unamortized Premium and Discount - Net | | (660 | ) | (315 | ) |
Total Long-term Debt | | $ | 94,340 | | $ | 54,685 | |
| | | | | |
Common Stock Equity | | $ | 192,511 | | $ | 189,356 | |
| | | | | |
Total Capitalization | | $ | 286,851 | | $ | 244,041 | |
| | | | | |
| | | | | | | | | |
The accompanying notes as they relate to The Union Light, Heat and Power Company are an
integral part of these financial statements.statements
122
NOTES TO FINANCIAL STATEMENTS
In this reportCinergy (which includesCinergy Corp. and all of our regulated and non-regulated subsidiaries) is, at times, referred to in the first person as "we"“we”, "our"“our”, or "us"“us”. In addition, when discussing Cinergy’s
1. Summary of Significant Accounting Policies
(a) Nature of OperationsCinergy Corp., a Delaware corporation created in October 1994, owns all outstanding common stock financial information, it necessarily includes the results of The Cincinnati Gas & Electric Company (CG&E) and, PSIEnergy, Inc. (PSI), The Union Light, Heat and Power Company (ULH&P) and all of Cinergy’s other consolidated subsidiaries. When discussing CG&E’s financial information, it necessarily includes the results of ULH&P and all of CG&E’s other consolidated subsidiaries.
1. Summary of Significant Accounting Policies
(a)Nature of Operations
Cinergy Corp., a Delaware corporation organized in 1993, owns all outstanding common stock of CG&E and PSI, both of which are public utility subsidiaries.utilities. As a result of this ownership, we are considered a utility holding company. Because we are a holding company whosewith material utility subsidiaries operateoperating in multiple states, we are registered with and are subject to regulation by the Securities and Exchange Commission (SEC) under the Public Utility Holding Company Act of 1935, as amended (PUHCA). Our other principal subsidiaries are:
•- are CinergyServices, Inc. (Services)
; •- and CinergyInvestments, Inc. (Investments)
; •Cinergy Global Resources, Inc. (Global Resources);•Cinergy Technologies, Inc. (Technologies); and•Cinergy Wholesale Energy, Inc. (CWE).
CG&E, an Ohio corporation organized in 1837, is a combination electric and gas public utility company that provides service in the southwestern portion of Ohio and, through its subsidiaries,ULH&P, in nearby areas of KentuckyKentucky. CG&E is responsible for the majority of our power marketing and Indiana. It has three wholly-owned utility subsidiaries and two wholly-owned non-utility subsidiaries.trading activity. CG&E's&E’s principal utility subsidiary, The Union Light, Heat and Power Company (ULH&P), is a Kentucky corporation thatorganized in 1901, provides electric and gas service in northern Kentucky.CG&E's other subsidiaries are insignificant to its results of operations.
PSI, an Indiana corporation organized in 1942, is ana vertically integrated and regulated electric utility that provides service in north central, central, and southern Indiana.
The following table presents further information related to the operations of our domestic utility companies CG&E, PSI, and ULH&P(our utility operating companies):
| Principal Line(s) of Business
|
|---|
|
|
|
CG&E and subsidiaries |
|
• |
|
Generation, transmission, distribution, and sale of electricity |
| | • | | Sale and/or transportation of natural gas • Electric commodity marketing and trading operations |
| | |
PSI |
|
• |
|
Generation, transmission, distribution, and sale of electricity |
| | |
ULH&P(1) |
|
• |
|
Transmission, distribution, and sale of electricity |
| | • | | Sale and transportation of natural gas |
(1) | See Note 19 for further discussion of the possible transfer of generation assets. |
Services is a service company that provides our regulated and non-regulated subsidiaries with a variety of centralized administrative, management, and support services. Investments holds most of our domestic non-regulated, energy-related businesses and investments. Global Resources holds our international businessesinvestments, including natural gas marketing and investments and directs our renewable energy investing activities (for example, wind farms). Technologiestrading operations (which are primarily holds our portfolioconducted through CinergyMarketing & Trading, LP (Marketing & Trading), one of technology-related investments. In November 2000, CWE was formed to act as a holding company forCinergy's energy commodity businesses, including production, as the generation assets eventually become unbundled from utility subsidiaries. See Note 18 for a discussion on Ohio deregulation.its subsidiaries).
123
We conduct operations through our subsidiaries and we manage our businesses through the following four business units:three reportable segments:
•
•Energy CommoditiesCommercial Business Unit (Commodities)(Commercial);•
Energy DeliveryRegulated Business Unit (Delivery);•Cinergy Investments Business Unit (Cinergy Investments); and•International Business Unit (International).
As the utility industry continues to evolve,Cinergy will continue to analyze its operating structure and make modifications as appropriate. In early 2001, we announced certain organizational changes which further aligned the business units consistent withCinergy's strategic vision. The revised structure reflects three business units, as follows:
•Energy Merchant—will operate power plants, both domestically and abroad, and conduct all wholesale energy marketing, trading, origination and risk management services;•Regulated Businesses—will operate all gas and electric transmission and distribution services, both domestically and abroad, and will be responsible for all regulatory planning for the regulated utility businesses ofCG&E,PSI, andULH&P(Regulated); and•
- Power Technology and Infrastructure Services
—will originate Business Unit (Power Technology and manage a portfolio of emerging energy businesses.Infrastructure).
See Note 1516 for further discussion of our reportable segments.
(b)Presentation
Management makes estimates and assumptions when preparing financial information by business unit.statements under generally accepted accounting principles (GAAP). Actual results could differ, as these estimates and assumptions involve judgment about future events or performance. These estimates and assumptions affect various matters, including:
(b)•the reported amounts of assets and liabilities in our Balance Sheets at the dates of the financial statements;
•the disclosure of contingent assets and liabilities at the dates of the financial statements; and
•the reported amounts of revenues and expenses in our Statements of Income during the reporting periods.
Additionally, we have reclassified certain prior-year amounts in the financial statements of PresentationCinergy, CG&E, PSI, and ULH&P to conform to current presentation.
We use twothree different methods to report investments in subsidiaries or other companies: the consolidation methodmethod; the equity method; and the equitycost method. Additionally, we use estimates and have reclassified certain amounts in the preparation of the financial statements.
(i) Consolidation Method
Consolidation Method WeFor traditional operating entities, we use the consolidation method when we own a majority of the voting stock of or have the ability to control a subsidiary. For variable interest entities (VIE) (discussed further in Note 3), we use the consolidation method when we anticipate absorbing a majority of the losses or receiving a majority of the returns of an entity, should they occur. We eliminate all significant intercompany transactions when we consolidate these accounts. Our consolidated financial statements include the accounts ofCinergy,CG&E, andPSI, and their wholly-owned subsidiaries.
(ii) Equity Method
We use the equity method to report investments, joint ventures, partnerships, subsidiaries, and affiliated companies in which we do not have control, but have the ability to exercise influence over operating and financial policies (generally, 20%20 percent to 50%50 percent ownership). Under the equity method we report:
•
•- our investment in the entity asInvestments in unconsolidated subsidiaries in our
Consolidated Balance Sheets; and •
- �� our percentage share of the earnings from the entity asEquity in earnings of unconsolidated subsidiaries
in our Consolidated Statements of Income.
Use of Estimate Management makes estimates and assumptions when preparing financial statements under generally accepted accounting principles (GAAP). Actual results could differ, as these estimates and assumptions involve judgment. These estimates and assumptions affect various matters, including:
•the reported amounts of assets and liabilities in our Balance Sheets at the dates of the financial statements;•the disclosure of contingent assets and liabilities at the dates of the financial statements; and•the reported amounts of revenues and expenses in our Statements of Income duringIncome.(iii) Cost Method
We use the reporting periods.
Reclassifications Wecost method to report investments, joint ventures, partnerships, subsidiaries, and affiliated companies in which we do not have reclassified certain prior-year amountscontrol and are unable to exercise significant influence over operating and financial policies (generally, up to 20 percent ownership). Under the cost method we report our investments in the financial statements ofentity as Other investments Cinergy,CG&E,PSI, andULH&P to conform to current presentation.in our Balance Sheets.
124
(c) RegulationRegulation
Our utility operating companies and certain of our non-utility subsidiaries must comply with the rules prescribed by the SEC under the PUHCA. Our utility operating companies must also comply with the rules prescribed by the Federal Energy Regulatory Commission (FERC) and the applicable state utility commissions of Ohio, Indiana, and Kentucky.
Our utility operating companies use the same accounting policies and practices for financial reporting purposes as non-regulated companies under GAAP. However, sometimes actions by the FERC and the state utility commissions result in accounting treatment different from that used by non-regulated companies. When this occurs, we apply the provisions of Financial Accounting Standards Board (FASB) Statement of Financial Accounting Standards No. 71,Accounting for the Effects of Certain Types of Regulation (Statement(Statement 71). In accordance with Statement 71, we record regulatory assets and liabilities (expenses deferred for future recovery from customers or obligationsamounts provided in current rates to cover costs to be refunded to customers)incurred in the future, respectively) on our Balance Sheets.
ComprehensiveThe state of Ohio passed comprehensive electric deregulation legislation was passed in Ohio on July 6, 1999. As required by the legislation,
CG&E filed its Proposed Transition Plan for approval by1999, and in 2000, the Public Utilities Commission of Ohio (PUCO) on December 28,
1999. On August 31, 2000, the PUCO approved a stipulation agreement relating toCG&E's&E’s transition plan. This plan creates
creating a Regulatory Transition Charge (RTC), designed to recoverCG&E's&E’s generation-related regulatory assets and transition costs
over a ten year period.ten-year period beginning January 1, 2001. Accordingly, application of Statement 71 was discontinued for the generation portion ofCG&E's&E’s business and
Statement of Financial Accounting Standards No. 101,Regulated Enterprises—Enterprises - Accounting for the Discontinuation of
Application of FASB Statement No. 71 (Statement 101), was applied. The effect of this change to the financial statements was
immaterial. Except with respect to the generationExcluding CG&E’s deregulated generation-related assets ofCG&E,and liabilities, as of December 31, 2000,PSI,2004, CG&E, PSI, and
ULH&P continue to meet each of the criteria required for the use of Statement 71. However, as other states implementto the extent Indiana or Kentucky implements deregulation legislation, the application of Statement 71 will need to be reviewed. Based on our utility operating companies'companies’ current regulatory orders and the regulatory environment in which they currently operate, the future recovery of regulatory assets recognized in the accompanying Balance Sheets as of December 31, 2000,2004, is probable. The effect of future discontinuance of Statement 71 on results of operations, cash flows, or statement of position cannot be determined until deregulation legislation plans have been approved by each state in which we do business. For a further discussion of Ohio DeregulationCG&E’s regulatory developments see Note 18.11(b)(iii). For a further discussion of PSI’s regulatory developments see Notes 11(b)(i) and 11(b)(ii).
125
Our regulatory assets, liabilities, and amounts authorized for recovery through regulatory orders at December 31, 2000,2004, and 1999, are2003, were as follows:
| | CG&E(1)
| | 2000
PSI
| | Cinergy
| | CG&E(1)
| | 1999
PSI
| | Cinergy
|
|---|
| | (in millions)
|
|---|
| Amounts due from customers—income taxes(2) | | $ | 53 | | $ | 20 | | $ | 73 | | $ | 276 | | $ | 18 | | $ | 294 |
| Gasification services agreement buyout costs(3) | | | — | | | 251 | | | 251 | | | — | | | 250 | | | 250 |
| Post-in-service carrying costs and deferred operating expenses | | | — | | | 41 | | | 41 | | | 121 | | | 42 | | | 163 |
| Coal contract buyout cost(4) | | | — | | | 53 | | | 53 | | | — | | | 77 | | | 77 |
| Deferred demand-side management (DSM) | | | — | | | — | | | — | | | 38 | | | 11 | | | 49 |
| Phase-in deferred return and depreciation | | | — | | | — | | | — | | | 54 | | | — | | | 54 |
| Deferred merger costs | | | 7 | | | 60 | | | 67 | | | 15 | | | 65 | | | 80 |
| Unamortized costs of reacquiring debt | | | 11 | | | 31 | | | 42 | | | 31 | | | 30 | | | 61 |
| Coal gasification services expenses | | | — | | | 12 | | | 12 | | | — | | | 16 | | | 16 |
| RTC recoverable assets(5) | | | 432 | | | — | | | 432 | | | — | | | — | | | — |
| Other | | | — | | | 6 | | | 6 | | | 1 | | | 10 | | | 11 |
| | |
| |
| |
| |
| |
| |
|
| | Total regulatory assets | | $ | 503 | | $ | 474 | | $ | 977 | | $ | 536 | | $ | 519 | | $ | 1,055 |
| | Authorized for recovery(6) | | $ | 494 | | $ | 444 | | $ | 938 | | $ | 467 | | $ | 489 | | $ | 956 |
| | 2004 | | 2003 | |
| | CG&E(1) | | PSI | | Cinergy | | CG&E(1) | | PSI | | Cinergy | |
| | (in millions) | |
Regulatory assets | | | | | | | | | | | | | |
| | | | | | | | | | | | | |
Amounts due from customers - income taxes(2) | | $ | 74 | | $ | 22 | | $ | 96 | | $ | 53 | | $ | 22 | | $ | 75 | |
Gasification services agreement buyout costs(3)(4) | | — | | 227 | | 227 | | — | | 235 | | 235 | |
Post-in-service carrying costs and deferred operating expenses(4)(9) | | 3 | | 80 | | 83 | | 2 | | 70 | | 72 | |
Deferred merger costs | | — | | 38 | | 38 | | 1 | | 46 | | 47 | |
Unamortized costs of reacquiring debt | | 15 | | 25 | | 40 | | 17 | | 28 | | 45 | |
RTC recoverable assets(4) (5) | | 494 | | — | | 494 | | 517 | | — | | 517 | |
Capital-related distribution costs(6) | | 11 | | — | | 11 | | — | | — | | — | |
Other | | 12 | | 29 | | 41 | | 22 | | 16 | | 38 | |
| | | | | | | | | | | | | |
Total Regulatory assets | | $ | 609 | | $ | 421 | | $ | 1,030 | | $ | 612 | | $ | 417 | | $ | 1,029 | |
| | | | | | | | | | | | | |
Total Regulatory assets authorized for recovery(7) | | $ | 602 | | $ | 378 | | $ | 980 | | $ | 604 | | $ | 317 | | $ | 921 | |
| | | | | | | | | | | | | |
Regulatory liabilities | | | | | | | | | | | | | |
| | | | | | | | | | | | | |
Accrued cost of removal(8) | | $ | (164 | ) | $ | (367 | ) | $ | (531 | ) | $ | (155 | ) | $ | (336 | ) | $ | (491 | ) |
Deferred fuel costs | | (1 | ) | (25 | ) | (26 | ) | — | | — | | — | |
Total Regulatory liabilities | | $ | (165 | ) | $ | (392 | ) | $ | (557 | ) | $ | (155 | ) | $ | (336 | ) | $ | (491 | ) |
(1)Includes $10 million at December 31, 2000, and $11 million at December 31, 1999, related toULH&P (for deferred merger costs, unamortized costs of reacquiring debt and other regulatory assets). Of these amounts, $3 million at December 31, 2000, and $4 million at December 31, 1999, have been authorized for recovery.(2)
(1) | Includes $10 million at December 31, 2004, and $16 million at December 31, 2003, related to ULH&P’s regulatory assets. Of these amounts, $9 million at December 31, 2004, and $15 million at December 31, 2003, have been authorized for recovery. Includes $(30) million and $(27) million of regulatory liabilities at December 31, 2004 and 2003, respectively, related to ULH&P. |
(2) | The various regulatory commissions overseeing the regulated business operations of our utility operating companies regulate income tax provisions reflected in customer rates. In accordance with the provisions of Statement 71, we have recorded net regulatory assets for CG&E, PSI, and ULH&P. |
(3) | PSI reached an agreement with Dynegy, Inc. to purchase the remainder of its 25-year contract for coal gasification services. In accordance with an order from the Indiana Utility Regulatory Commission (IURC), PSI began recovering this asset over an 18-year period that commenced upon the termination of the gas services agreement in 2000. |
(4) | Regulatory assets earning a return at December 31, 2004. |
(5) | In August 2000, CG&E’s deregulation transition plan was approved. Effective January 1, 2001, a RTC went into effect and provides for recovery of all then existing generation-related regulatory assets and various transition costs over a ten-year period. Because a separate charge provides for recovery, these assets were aggregated and are included as a single amount in this presentation. The classification of all transmission and distribution related regulatory assets has remained the same. |
(6) | In November 2004, CG&E’s rate stabilization plan (RSP) was approved by the PUCO. CG&E will have the ability to defer certain capital-related distribution costs from July 1, 2004 through December 31, 2005 with recovery from non-residential customers to be provided through a rider from January 1, 2006 through December 31, 2010. |
(7) | At December 31, 2004, these amounts were being recovered through rates charged to customers over remaining periods ranging from 1 to 60 years for CG&E, 1 to 51 years for PSI, and 1 to 16 years for ULH&P. |
(8) | Represents amounts received for anticipated future removal and retirement costs of regulated property, plant, and equipment that do not represent legal obligations pursuant to Statement of Financial Accounting Standards No. 143, Accounting for Asset Retirement Obligations (Statement 143). See Note 1(j) for a further discussion of Statement 143. |
(9) | For PSI, this amount includes $38 million that is not yet authorized for recovery and is not earning a return at December 31, 2004. |
(d)Revenue Recognition
(i) Utility Revenues
Our utility operating companies regulate income tax provisions reflected in customer rates. In accordance with the provisions of Statement 71, we have recorded net regulatory assets forCG&E andPSI and a regulatory liability forULH&P.
(3)PSI reached an agreement with Dynegy, Inc. to purchase the remainder of its 25-year contract for coal gasification services. In accordance with an order from the Indiana Utility Regulatory Commission (IURC),PSI began recovering this asset over an 18-year period that commenced upon the termination of the gas services agreement in 2000.(4)In August 1996,PSI entered into a coal supply agreement, which expired December 31, 2000. The agreement provided for a buyout charge, which is being recovered through the fuel adjustment clause through December 2002.(5)In August 2000,CG&E's deregulation transition plan was approved. Effective January 1, 2001, an RTC went into effect and provides for recovery of all then existing generation-related regulatory assets and various transition costs over a ten year period. Because a separate charge provides for recovery, these assets were aggregated and are included as a single amount in the 2000 presentation. The classification of all transmission and distribution related regulatory assets has remained the same.(6)At December 31, 2000, these amounts were being recovered through rates charged to customers over a period ranging from 1 to 23 years forCG&E, 1 to 32 years forPSI, and 3 to 21 years forULH&P. (d) Statements of Cash Flows We definerecord Cash equivalents as investments with maturities of three months or less when acquired. See Note 17 for information concerning non-cash financing transactions.
(e)Operating Revenues and Fuel Costs Our operating companies recordOperating revenues for electric and gas service includingwhen delivered to customers. Customers are billed throughout the month as both gas and electric meters are read. We recognize revenues for retail energy sales that have not yet been billed, but where gas or electricity has been consumed. This is termed “unbilled revenues” and is a widely recognized and accepted practice for utilities. In making our estimates of unbilled revenues, we use systems that consider various factors, including weather, in our calculation of retail customer consumption at the end of each month. Given the use of these systems and the fact that customers are billed monthly, we believe it is unlikely that materially different results will occur in future periods when these amounts are subsequently billed.
126
The amount of unbilled revenues for Cinergy, CG&E, PSI, and ULH&P as of December 31, 2004, 2003, and 2002 were as follows:
| | 2004 | | 2003 | | 2002 | |
| | (in millions) | |
| | | | | | | |
Cinergy | | $ | 203 | | $ | 176 | | $ | 153 | |
CG&E and subsidiaries | | 129 | | 112 | | 89 | |
PSI | | 74 | | 64 | | 64 | |
ULH&P | | 23 | | 20 | | 15 | |
| | | | | | | |
| | | | | | | | | | |
(ii) Energy Marketing and Trading Revenues
We market and trade electricity, natural gas, and other energy-related products. Many of the contracts associated expenses, whenwith these products qualify as derivatives in accordance with Statement of Financial Accounting Standards No. 133, Accounting for Derivative Instruments and Hedging Activities (Statement 133), further discussed in (k)(i). We designate derivative transactions as either trading or non-trading at the time they provide the serviceare originated in accordance with Emerging Issues Task Force (EITF) Issue 02-3, Issues Involved in Accounting for Derivative Contracts Held for Trading Purposes and Contracts Involved in Energy Trading and Risk Management Activities (EITF 02-3). Trading contracts are reported on a net basis and non-trading contracts are reported on a gross basis.
1. Net Reporting
Net reporting requires presentation of realized and unrealized gains and losses on trading derivatives on a net basis in Operating Revenues pursuant to the customers. requirements of EITF 02-3, regardless of whether the transactions were settled physically. Energy derivatives involving frequent buying and selling with the objective of generating profits from differences in price are classified as trading and reported net.
2. Gross Reporting
Gross reporting requires presentation of sales contracts in Operating Revenues and purchase contracts in Fuel, emission allowances, and purchased power expense or Gas purchased expense. Non-trading derivatives typically involve physical delivery of the underlying commodity and are therefore generally presented on a gross basis.
Derivatives are classified as non-trading only when (a) the contracts involve the purchase of gas or electricity to serve our native load requirements (end-use customers within our utility operating companies’ franchise service territories), or (b) the contracts involve the sale of gas or electricity and we have the intent and projected ability to fulfill substantially all obligations from company-owned assets, which generally is limited to the sale of generation to third parties when it is not required to meet native load requirements.
(iii) Other Operating Revenues
Cinergy and CG&E recognize revenue from coal origination, which represents contract structuring and marketing of physical coal. These revenues are included in Other Operating Revenues on the Statements of Income. Other Operating Revenues for Cinergy also includes sales of synthetic fuel.
(e)Energy Purchases and Fuel Costs
The expenses associated expenseswith electric and gas services include:
•
•the fuel used to generate electricity;- electricity and the associated transportation costs;
•
- costs of emission allowances;
•electricity purchased from others;
- and
•
- natural gas purchased from
others;others and •- the associated transportation
costs associated with the purchase of fuel, electricity, and natural gas.
costs.127
These expenses are shown in ourthe Statements of Income of Cinergy, CG&E, and PSIasFuel, emission allowances, and purchased power expense and exchanged power andGas purchasedexpense. These expenses are shown in ULH&P’s Statements of Income as . AnyElectricity purchased from parent company for resale expense and Gas purchased expense.
PSI utilizes a cost tracking recovery mechanism (commonly referred to as a fuel adjustment clause) that recovers retail and a portion of theseits wholesale fuel costs that are recoverable or refundable to customers in future periods is deferred in eitherAccounts receivable orAccounts payable in our Balance Sheets.
from customers. Indiana law limits the amount of fuel costs thatPSI can recover to an amount that will not result in earning a return in excess of that allowed by the Indiana Utility Regulatory Commission (IURC).IURC. The fuel adjustment clause is calculated based on the estimated cost of fuel in the next three-month period, and is trued up after actual costs are known. PSI records any under-recovery or over-recovery resulting from the differences between estimated and actual costs as a deferred asset or liability until it is billed or refunded to its customers, at which point it is adjusted through fuel expense.
In addition to the fuel adjustment clause, PSI utilizes a purchased power tracking mechanism approved by the IURC for the recovery of costs related to certain specified purchases of power necessary to meet native load peak demand requirements to the extent such costs are not recovered through the existing fuel adjustment clause.
As part of the PUCO’s November 2004 approval of CG&E’s RSP, a cost tracking recovery mechanism was established to recover costs of retail fuel and emission allowances that exceed the amount originally included in the rates frozen in the CG&E transition plan. This mechanism was effective January 1, 2005 for non-residential customers and will be effective January 1, 2006 for residential customers. CG&E will begin utilizing a tracking mechanism approved by the PUCO for the recovery of system reliability capacity costs related to certain specified purchases of power. This mechanism was effective January 1, 2005 for non-residential customers and will be effective January 1, 2006 for residential customers. See Note 11(b)(iii) for additional information.
(f)Cash and Cash Equivalents
(f)We define Cash and cash equivalents on our Balance Sheets and Statements of Cash Flows as investments with maturities of three months or less when acquired.
Utility(g)Fuel, Emission Allowances, and Supplies
We maintain coal inventories for use in the production of electricity and emission allowances inventories for regulatory compliance purposes due to the production of electricity. These inventories are accounted for at the lower of cost or market, with cost being determined using the weighted-average method.
Prior to January 1, 2003, natural gas held in storage for our gas trading operations was accounted for at fair value. All other gas held in storage was accounted for at the lower of cost or market, cost being determined through the weighted-average method. Effective January 1, 2003, accounting for our gas trading operations’ gas held in storage was adjusted to the lower of cost or market method with a cumulative effect adjustment, as required by EITF 02-3. See (q)(iv) for a summary of the cumulative effect adjustments.
Materials and supplies inventory is accounted for on a weighted-average cost basis.
(h)Property, Plant, and Equipment
Property, Plant, and Equipment Utility plant includes the utility and non-regulated business property and equipment that is in use, being held for future use, or under construction. We report our utility plantProperty, Plant, and Equipment at its original cost, which includes:
•
- materials;
•
- contractor fees;
•salaries;
•
- payroll taxes;
•
- fringe benefits;
•
an allowance for financing costs of funds used during construction (described below in (h)(ii) and (iii)); and•
- other miscellaneous amounts.
In August 2000, the generation assets ofCG&E were released from the first mortgage indenture lien.CG&E's transmission assets, distribution assets, and any generating assets added after August 2000, remain subject to the lien of the first mortgage bond indenture. The utility property ofPSI is also subject to the lien of its first mortgage bond indenture.
128
(g)We capitalize costs for regulated property, plant, and equipment that are associated with the replacement or the addition of equipment that is considered a property unit. Property units are intended to describe an item or group of items. The cost of normal repairs and maintenance is expensed as incurred. On an annual basis, we perform major pre-planned maintenance activities on our generating units. These pre-planned activities are accounted for when incurred. When regulated property, plant, and equipment is retired, Cinergy charges the original cost, less salvage, to Accumulated depreciation and the cost of removal to Regulatory liabilities, which is consistent with the composite method of depreciation. See (j) for further information on accrued cost of removal. A gain or loss is recorded on the sale of regulated property, plant, and equipment if an entire operating unit, as defined by the FERC, is sold. A gain or loss is recorded on non-regulated property, plant, and equipment whenever there is a related sale or retirement.
(i) Depreciation
We determine the provisions for depreciation expense using the straight-line method. The depreciation rates are based on periodic studies of the estimated useful lives (the number of years we expect to be able to useand the properties) and thenet cost to remove the properties. Inclusion of cost of removal in depreciation rates was discontinued for all non-regulated property beginning in 2003 as a result of adopting Statement 143. Our utility operating companies use composite depreciation rates. These rates are approved by the respective state utility commissions with respect to regulated property. The average depreciation rates for utility plant, excluding software,Property, Plant, and Equipment are presented in the table below.following table.
| | | 2004 | | 2003 | | 2002 | |
| | | | | | | | |
Cinergy(1) | | | 3.2 | % | 2.8 | % | 3.0 | % |
|
| | 2000
| | 1999
| | 1998
| | | | | | | | |
|---|
| CG&E and subsidiaries | CG&E and subsidiaries | | | | | | | | | 2.6 | | 2.6 | | 2.9 | |
| | Electric | | 2.9 | % | 2.9 | % | 2.9 | % | | | | | | | |
| | Gas | | 2.9 | | 2.9 | | 2.9 | | |
PSI | | | 3.7 | | 3.1 | | 3.0 | |
| | Common | | 3.3 | | 2.7 | | 2.6 | | | | | | | | |
| ULH&P | ULH&P | | | | | | | | | 3.5 | | 3.2 | | 3.2 | |
| | Electric | | 3.3 | | 3.3 | | 3.4 | | |
| | Gas | | 3.1 | | 3.1 | | 3.1 | | |
| | Common | | 5.1 | | 5.2 | | 5.0 | | |
| PSI | | 3.0 | | 3.0 | | 3.0 | | |
(1) | The results of Cinergy also include amounts related to non-registrants. |
(h)In June 2004, PSI implemented new depreciation rates, as a result of changes in useful lives of production assets and an increased rate for cost of removal, that were approved in PSI’s latest retail rate case. The impact of this change in accounting estimate was an increase of approximately $18 million in Cinergy’s and PSI’s 2004 Depreciation expense. The prospective impact of this change in accounting estimate is expected to be an increase of approximately $30 million in annual Depreciation expense, which will be collected in revenues over that same period.
(ii) Allowance for Funds Used During Construction (AFUDC)
Our utility operating companies finance construction projects with borrowed funds and equity funds. Regulatory authorities allow us to record the costs of these funds as part of the cost of construction projects. AFUDC is calculated using a
methodology authorized by the regulatory authorities.
129
The equity component of AFUDC, rates are compounded semi-annuallywhich is credited to Miscellaneous Income (Expense) — Net, for the years ended December 31, 2004, 2003, and are2002, was as follows:
| | 2000
| | 1999
| | 1998
| |
|---|
| Cinergy average | | 8.0 | % | 7.3 | % | 6.6 | % |
| CG&E and subsidiaries average | | 8.4 | | 8.0 | | 7.1 | |
| ULH&P average | | 6.6 | | 5.3 | | 6.1 | |
| PSI average | | 7.4 | | 6.5 | | 5.6 | |
| | 2004 | | 2003 | | 2002 | |
| | (in millions) | |
| | | | | | | |
Cinergy | | $ | 1.6 | | $ | 7.5 | | $ | 12.9 | |
CG&E and subsidiaries | | 0.5 | | 2.7 | | 0.4 | |
PSI | | 1.1 | | 4.8 | | 12.5 | |
ULH&P | | — | | 0.2 | | 0.8 | |
| | | | | | | | | | |
The borrowed funds component of AFUDC, which is recorded on a pre-tax basis and is credited to Interest Expense, for the years ended December 31, 2004, 2003, and 2002, was as follows:
| | | 2004 | | 2003 | | 2002 | |
| | 2000
| | 1999
| | 1998
| | (in millions) | |
|---|
| | (in millions)
| | | | | | | |
|---|
| Cinergy | | $ | 8.2 | | $ | 5.6 | | $ | 7.5 | | $ | 2.7 | | $ | 5.7 | | $ | 10.1 | |
| CG&E and subsidiaries | | | 5.0 | | | 3.4 | | | 5.5 | | 0.4 | | 1.0 | | 1.0 | |
PSI | | | 2.3 | | 4.7 | | 9.1 | |
| ULH&P | | | 0.4 | | | 0.2 | | | 0.6 | | 0.1 | | 0.1 | | 0.2 | |
| PSI | | | 3.2 | | | 2.2 | | | 2.0 | |
|
With the deregulation ofCG&E's&E’s generation assets, the AFUDC method willis no longer be used to capitalize the cost of funds used during generation-related construction atCG&E. Instead, accounting principles requireSee (iii) for a discussion of capitalized interest. The equity and borrowed funds components of AFUDC have decreased from 2004 as compared to 2003 and 2002. The majority of PSI’s projects are being recovered through a construction work in progress (CWIP) tracker. Once CWIP projects are approved and included in the applicationCWIP tracking mechanism, the costs of funds are no longer accrued on the project.
(iii) Capitalized Interest
Cinergy capitalizes interest costs for non-regulated construction projects in accordance with Statement of Financial Accounting Standards No. 34,Capitalization of Interest Cost (Statement 34). The primary differences in methodologiesfrom AFUDC are that the Statement 34 methodology does not include a component for equity funds and does not emphasize short-term borrowings over long-term borrowings. Capitalized interest costs, which are recorded on a pre-tax basis, for the years ended December 31, 2004, 2003, and 2002, were as follows:
| | 2004 | | 2003 | | 2002 | |
| | (in millions) | |
| | | | | | | |
Cinergy | | $ | 4.5 | | $ | 7.9 | | $ | 7.3 | |
CG&E and subsidiaries | | 4.1 | | 7.7 | | 7.3 | |
| | | | | | | | | | |
(i) Federal and State Income TaxesImpairments
(i) Long-Lived Assets
In accordance with Statement of Financial Accounting Standards No. 144, Accounting for the Impairment or Disposal of Long-Lived Assets, we evaluate long-lived assets for impairment when events or changes in circumstances indicate that the carrying value of such assets may not be recoverable. So long as an asset or group of assets is not held for sale, the determination of whether an impairment has occurred is based on an estimate of undiscounted future cash flows attributable to the assets, as compared with the carrying value of the assets. If an impairment has occurred, the amount of the impairment recognized is determined by estimating the fair value of the assets and recording a provision for an impairment loss if the carrying value is greater than the fair value. Once assets are classified as held for sale, the comparison of undiscounted cash flows to carrying value is disregarded and
130
an impairment loss is recognized for any amount by which the carrying value exceeds the fair value of the assets less cost to sell.
(ii) Unconsolidated Investments
We evaluate the recoverability of investments in unconsolidated subsidiaries when events or changes in circumstances indicate the carrying amount of the asset is other than temporarily impaired. An investment is considered impaired if the fair value of the investment is less than its carrying value. We only recognize an impairment loss when an impairment is considered to be other than temporary. We consider an impairment to be other than temporary when a forecasted recovery up to the investment’s carrying value is not expected for a reasonable period of time. We evaluate several factors, including but not limited to our intent and ability to hold the investment, the severity of the impairment, the duration of the impairment and the entity’s historical and projected financial performance, when determining whether or not an impairment is other than temporary. Once an investment is considered other than temporarily impaired and an impairment loss is recognized (as Miscellaneous Income (Expense)-Net), the carrying value of the investment is not adjusted for any subsequent recoveries in fair value. As of December 31, 2004, we do not have any material unrealized losses that are deemed to be temporary in nature. See Note 15(a) for the amount of impairment charges incurred during the year.
(j)Asset Retirement Obligations and Accrued Cost of Removal
In accordance with Statement 143, we recognize the fair value of legal obligations associated with the retirement or removal of long-lived assets at the time the obligations are incurred and can be reasonably estimated. The initial recognition of this liability is accompanied by a corresponding increase in property, plant, and equipment. Subsequent to the initial recognition, the liability is adjusted for any revisions to the expected value of the retirement obligation (with corresponding adjustments to property, plant, and equipment), and for accretion of the liability due to the passage of time (recognized as Operation and maintenance expense). Additional depreciation expense is recorded prospectively for any property, plant, and equipment increases.
We do not recognize liabilities for asset retirement obligations for which the fair value cannot be reasonably estimated. CG&E and PSI have asset retirement obligations associated with river structures at certain generating stations. However, the retirement date for these river structures cannot be reasonably estimated; therefore, the fair value of the associated liability currently cannot be estimated and no amounts are recognized in the financial statements.
CG&E’s transmission and distribution business, PSI, and ULH&P ratably accrue the estimated retirement and removal cost of rate regulated property, plant, and equipment when removal of the asset is considered likely, in accordance with established regulatory practices. The accrued, but not incurred, balance for these costs is classified as Regulatory liabilities, under Statement 71, as previously disclosed in (c). Effective with our adoption of Statement 143, on January 1, 2003, we do not accrue the estimated cost of removal when no legal obligation associated with retirement or removal exists for any of our non-regulated assets (including CG&E’s generation assets). See (q)(iv) for a summary of cumulative effect adjustments.
(k)Derivatives
We account for derivatives under Statement 133, which requires all derivatives, subject to certain exemptions, to be accounted for at fair value. Changes in a derivative’s fair value must be recognized currently in earnings unless specific hedge accounting criteria are met. Gains and losses on derivatives that qualify as hedges can (a) offset related fair value changes on the hedged item in the Statements of Income for fair value hedges; or (b) be recorded in other comprehensive income for cash flow hedges. To qualify for hedge accounting, derivatives must be designated as a hedge (for example, an offset of interest rate risks) and must be effective at reducing the risk associated with the hedged item. Accordingly, changes in the fair values or cash flows of instruments designated as hedges must be highly correlated with changes in the fair values or cash flows of the related hedged items.
131
(i) Energy Marketing and Trading
We account for all energy trading derivatives at fair value. These derivatives are shown in our Balance Sheets as Energy risk management assets and Energy risk management liabilities. Changes in a derivative’s fair value represent unrealized gains and losses and are recognized as revenues in our Statements of Income unless specific hedge accounting criteria are met.
Non-trading derivatives involve the physical delivery of energy and are therefore typically accounted for as accrual contracts, unless the contract does not qualify for the normal purchases and sales scope exception in Statement 133. Accrual contracts are not adjusted for changes in fair value.
Although we intend to settle accrual contracts with company-owned assets, occasionally we settle these contracts with purchases on the open trading markets. The cost of these purchases could be in excess of the associated revenues. We recognize the gains or losses on these transactions as delivery occurs. Open market purchases may occur for the following reasons:
•generating station outages;
•least-cost alternative;
•native load requirements; and
•extreme weather.
We value derivatives using end-of-the-period fair values, utilizing the following factors (as applicable):
•closing exchange prices (that is, closing prices for standardized electricity and natural gas products traded on an organized exchange, such as the New York Mercantile Exchange);
•broker-dealer and over-the-counter price quotations; and
•model pricing (which considers time value and historical volatility factors of electricity and natural gas).
In October 2002, the EITF reached a consensus in EITF 02-3 to rescind EITF Issue 98-10, Accounting for Contracts Involved in Energy Trading and Risk Management Activities (EITF 98-10). EITF 98-10 permitted non-derivative contracts to be accounted for at fair value if certain criteria were met. Effective with the adoption of EITF 02-3 on January 1, 2003, non-derivative contracts and natural gas held in storage that were previously accounted for at fair value were required to be accounted for on an accrual basis, with gains and losses on the transactions being recognized at the time the contract was settled. See (q)(iv) for a summary of cumulative effect adjustments.
As a response to this discontinuance of fair value accounting, in June 2003, Cinergy began designating derivatives as fair value hedges for certain volumes of our natural gas held in storage. Under this accounting election, changes in the fair value of both the derivative as well as the hedged item (the specified gas held in storage) are included in the Statements of Income. We assess the effectiveness of the derivatives in offsetting the change in fair value of the gas held in storage on a quarterly basis. Selected information on Cinergy’s hedge accounting activities was as follows:
| | 2004 | | 2003 | |
| | (in millions) | |
| | | | | |
Portion of gain (loss) on hedging instruments determined to be ineffective | | $ | (2 | ) | $ | — | |
Portion of gain on hedging instruments related to changes in time value excluded from assessment of ineffectiveness | | 28 | | 5 | |
| | | | | |
Total included in Gas operating revenues | | $ | 26 | | $ | 5 | |
(ii) Financial
In addition to energy marketing and trading, we use derivative financial instruments to manage exposure to fluctuations in interest rates. We use interest rate swaps (an agreement by two parties to exchange fixed-interest rate
132
cash flows for variable-interest rate cash flows) and treasury locks (an agreement that fixes the yield or price on a specific treasury security for a specific period, which we sometimes use in connection with the issuance of fixed rate debt). We account for such derivatives at fair value and assess the effectiveness of any such derivative used in hedging activities.
At December 31, 2004, the ineffectiveness of instruments that we have classified as cash flow hedges of variable-rate debt instruments was not material. Reclassification of unrealized gains or losses on cash flow hedges of debt instruments from Accumulated other comprehensive income (loss) occurs as interest is accrued on the debt instrument. The unrealized losses that will be reclassified as a charge to Interest Expense during the twelve-month period ending December 31, 2005, are not expected to be material.
(l)Intangible Assets
We adopted Statement of Financial Accounting Standards No. 142, Goodwill and Other Intangible Assets (Statement 142) in the first quarter of 2002. Under the provisions of Statement 142, goodwill and other intangible assets with indefinite lives are not amortized. Statement 142 requires that goodwill is assessed annually, or when circumstances indicate that the fair value of a reporting unit has declined significantly, by applying a fair-value-based test. This test is applied at the “reporting unit” level, which is not broader than the current business segments discussed in Note 16. Acquired intangible assets are separately recognized if the benefit of the intangible asset is obtained through contractual or other legal rights, or if the intangible asset can be sold, transferred, licensed, rented, or exchanged, regardless of intent to do so.
We finalized our transition impairment test in the fourth quarter of 2002 and recognized a non-cash impairment charge of approximately $11 million (net of tax) for goodwill related to certain of our international assets. This amount is reflected in Cinergy’s Statements of Income as a cumulative effect adjustment, net of tax. See (q)(iv) for a summary of cumulative effect adjustments.
(m)Income Taxes
Cinergy and its subsidiaries file a consolidated federal income tax return and combined/consolidated state and local tax returns in certain jurisdictions. Cinergy and its subsidiaries have an income tax allocation agreement, which conforms to the requirements of the PUHCA. The corporate taxable income method is used to allocate tax benefits to the subsidiaries whose investments or results of operations provide those tax benefits. Any tax liability not directly attributable to a specific subsidiary is allocated proportionately among the subsidiaries as required by the agreement.
Statement of Financial Accounting Standards No. 109,Accounting for Income Taxes (Statement 109), requires an asset and liability approach for financial accounting and reporting of income taxes. The tax effects of differences between the financial reporting and tax basis of accounting are reported asDeferred income tax assetsor orliabilitiesliabilities in our Balance Sheets and are based on currently enacted income tax rates. We evaluate quarterly the realizability of our deferred tax assets by assessing our valuation allowance and adjusting the amount of such allowance, if necessary.
Investment tax credits, which have been used to reduce our federal income taxes payable, have been deferred for financial reporting purposes. These deferred investment tax credits are being amortized over the useful lives of the property to which they are related. For a further discussion of income taxes, see Note 11.10.
(n)Contingencies
(j)In the normal course of business, Cinergy, CG&E, PSI, and ULH&P aresubject to various regulatory actions, proceedings, and lawsuits related to environmental, tax, or other legal matters. We reserve for these potential contingencies when they are deemed probable and reasonably estimable liabilities. We believe that the amounts provided for in our financial statements are adequate. However, these amounts are estimates based upon assumptions involving judgment and therefore actual results could differ. For further discussion of contingencies, see Note 11.
133
Energy Marketing(o)Pension and TradingOther Postretirement Benefits
Cinergy We market and trade electricity, natural gas,provides benefits to retirees in the form of pension and other energy-related products. We designate transactions as physical or trading atpostretirement benefits. Our reported costs of providing these pension and other postretirement benefits are developed by actuarial valuations and are dependent upon numerous factors resulting from actual plan experience and assumptions of future experience. Changes made to the time they are originated. Physical refers to our intent and projected ability to fulfill substantially all obligations from company-owned assets. We sell generation to third parties when it is not required to meet native load requirements (end-use customers within our operating companies' franchise service territory). We account for physical transactions on a settlement basis and trading transactions usingprovisions of the mark-to-market method of accounting. Under the mark-to-market method of accounting, trading transactions are shown at fair value in our Consolidated Balance Sheets asEnergy risk management assets—andEnergy risk management liabilities—plans may impact current and long-termfuture pension costs. Pension costs associated with Cinergy’s . We reflectdefined benefit plans are impacted by employee demographics, the level of contributions we make to the plan, and earnings on plan assets. These pension costs may also be significantly affected by changes in fair value resultingkey actuarial assumptions, including anticipated rates of return on plan assets and the discount rates used in unrealized gains and lossesdetermining the projected benefit obligation. Changes inFuel and purchased and exchanged power andGas purchased. We record pension obligations associated with the revenues andpreviously discussed factors are not immediately recognized as pension costs for all transactions in our Consolidatedon the Statements of Income whenbut are deferred and amortized in the contracts are settled. We recognize revenues infuture over the average remaining service period of active plan participants to the extent they exceed certain thresholds prescribed by Statement of Financial Accounting Standards No. 87, Employers’ Accounting for Pensions (Statement 87).
Operating revenues;Other postretirement benefit costs are recordedimpacted by employee demographics, per capita claims costs, and health care cost trend rates and may also be affected by changes inFuel key actuarial assumptions, including the discount rate used in determining the accumulated postretirement benefit obligation (APBO). Changes in postretirement benefit obligations associated with these factors are not immediately recognized as postretirement benefit costs but are deferred and purchased and exchanged poweramortized in the future over the average remaining service period of active plan participants to the extent they exceed certain thresholds prescribed by Statement of Financial Accounting Standards No. 106, Employers’ Accounting for Postretirement Benefits Other Than Pensions andGas purchased(Statement 106).
Although we intend to settle physical contracts with company-owned generation, there are times when we have to settle these contracts with power purchased on the open trading markets. The cost of these purchases could be in excess of the associated revenues. We recognize the gains or losses on
Cinergy these transactions as the power is delivered. Open market purchases may occurreviews and updates its actuarial assumptions for the following reasons:
•generating station outages;•least-cost alternative;•native load requirements;its pension and•extreme weather.
We value contracts in the trading portfolio using end-of-the-period market prices, utilizing the following factors (as applicable):
•closing exchange prices (that is, closing prices for standardized electricity products traded postretirement benefit plans on an organized exchange such as the New York Mercantile Exchange);•broker dealer and over-the-counter price quotations; and•model pricing (which considers time value and historical volatility factors of electricity pricing underlying any options and contractual commitments).
We anticipate that some of these obligations, even though considered trading contracts, will ultimately be settled using company-owned generation. The cost of this generation is usually below the market priceannual basis, unless plan amendments or other significant events require earlier remeasurement at which the trading portfolio has been valued. We expect earnings volatility from period to period due to the risks associated with marketing and trading electricity, natural gas,an interim period. For additional information on pension and other energy-related products.postretirement benefits, see Note 9.
Commodities, through Cinergy Marketing & Trading, LLC, and International, through Cinergy Global Trading Limited, market and trade natural gas and other energy-related products.
(p)Stock-Based Compensation
(k) Financial Derivatives We use derivative financial instruments to manage:
•funding costs;•exposures to fluctuations in interest rates; and•exposures to foreign currency exchange rates.
To qualifyIn 2003, we prospectively adopted accounting for hedge accounting, these financial instruments must be designated as a hedge (for example, an offset of foreign exchange or interest rate risks) at the inception of the contract and must be effective at reducing the risk associated with the hedged item. Accordingly, changes inour stock-based compensation plans using the fair values or cash flows of instruments designated as hedges must be highly correlated with changes in the fair values or cash flows of the related hedged items.
From time to time, we may utilize foreign exchange forward contracts (for example, a contract obligating one party to buy, and the other to sell, a specified quantity of a foreign currency for a fixed price at a future date) and currency swaps (for example, a contract whereby two parties exchange principal and interest cash flows denominated in different currencies) to hedge foreign currency denominated purchase and sale commitments and certain of our net investments in foreign operations against currency exchange rate fluctuations. At December 31, 2000, no such instruments were held.
We also use interest rate swaps (an agreement by two parties to exchange fixed-interest rate cash flows for floating-interest rate cash flows). Through December 31, 2000, we utilized the accrual method to account for these interest rate swaps. Accordingly, gains and losses were calculated based on the difference between the fixed-rate and the floating-rate interest amounts, using agreed upon notional amounts. These gains and losses are recognized in our Consolidated Statements of Income as a component ofInterest over the life of the agreement. Effective with our adoptionvalue recognition provisions of Statement of Financial Accounting Standards No. 133,123, Accounting for Derivative Instruments and Hedging ActivitiesStock-Based Compensation (Statement 133) in the first quarter123), as amended by Statement of 2001, we will begin accounting for interest rate swaps using mark-to-market accounting and will assess the effectiveness of any swaps used in hedging activities. See Note 1(l) below for further discussion of Statement 133.
(l) Accounting Changes During 1998, the Financial Accounting Standards No. 148, Accounting for Stock-Based Compensation-Transition and Disclosure (Statement 148), for all employee awards granted or with terms modified on or after January 1, 2003. Prior to 2003, we had accounted for our stock-based compensation plans using the intrinsic value method under Accounting Principles Board (FASB)Opinion No. 25, Accounting for Stock Issued to Employees (APB 25). See Note 2(c) for further information on our stock-based compensation plans. The impact on our Net Income and earnings per common share (EPS) if the fair value based method had been applied to all outstanding and unvested awards in each period was not material. In December 2004, the FASB issued a revision of Statement 133.123 entitled Share-Based Payment. See (q)(ii) for further information.
(q)Accounting Changes
(i) Consolidation of VIEs
In January 2003, the FASB issued Interpretation No. 46, Consolidation of Variable Interest Entities (Interpretation 46), which significantly changed the consolidation requirements for traditional special purpose entities (SPE) and certain other entities subject to its scope. This interpretation defines a VIE as (a) an entity that does not have sufficient equity to support its activities without additional financial support or (b) any entity that has equity investors that do not have substantive voting rights, do not absorb first dollar losses, or receive residual returns. These entities must be consolidated whenever Cinergy would be anticipated to absorb greater than 50 percent of the losses or receive greater than 50 percent of the returns.
In accordance with its two stage adoption guidance, we implemented Interpretation 46 for traditional SPEs on July 1, 2003, and for all other entities, including certain operating joint ventures, as of March 31, 2004. The consolidation of certain operating joint ventures as of March 31, 2004, did not have a material impact on our financial position or results of operations.
134
On July 1, 2003, Interpretation 46 required us to consolidate two SPEs that have individual power sale agreements with Central Maine Power Company (CMP). Further, we were no longer permitted to consolidate a trust that was established by Cinergy Corp. in 2001 to issue approximately $316 million of combined preferred trust securities and stock purchase contracts. Prior period financial statements were not restated for these changes. For further information on the accounting for these entities see Notes 3(a) and (b).
Cinergy has concluded that its accounts receivable sale facility, as discussed in Note 3(c), will remain unconsolidated since it involves transfers of financial assets to a qualifying SPE, which is exempted from consolidation by Interpretation 46 and Statement of Financial Accounting Standards No. 140, Accounting for Transfers and Servicing of Financial Assets and Extinguishments of Liabilities (Statement 140).
(ii) Share-Based Payment
In December 2004, the FASB issued a replacement of Statement 123, Statement of Financial Accounting Standards No. 123 (revised 2004), Share-Based Payment (Statement 123R). This standard will require accounting for all stock-based compensation arrangements under the fair value method in addition to other provisions.
In 2003, we prospectively adopted accounting for our stock-based compensation plans using the fair value recognition provisions of Statement 123, as amended by Statement 148, for all employee awards granted or with terms modified on or after January 1, 2003. Therefore, the impact of implementation of Statement 123R on stock options within our stock-based compensation plans is effectivenot expected to be material. Statement 123R contains certain provisions that will modify the accounting for fiscal years beginning after June 15, 2000,various stock-based compensation plans other than stock options. We are in the process of evaluating the impact of this new standard on these plans. Cinergy will adopt Statement 123R on July 1, 2005.
(iii) Income Taxes
In October 2004, the American Jobs Creation Act (AJCA) was signed into law. The AJCA includes a one-time deduction of 85 percent of certain foreign earnings that are repatriated, as defined in the AJCA. In December 2004, the FASB issued Staff Position 109-2, Accounting and requires companiesDisclosure Guidance for the Foreign Earnings Repatriation Provision within the American Jobs Creation Act of 2004. The staff position allows additional time for an entity to record derivative instruments as assets or liabilities, measured at fair value.evaluate the effect of the legislation on its plan for repatriation of foreign earnings for purposes of applying Statement 109. Cinergy will complete its evaluation of the effects of the provision on its plan for repatriation of foreign earnings in 2005.
135
(iv) Cumulative Effect of Changes in Accounting Principles, Net of Tax
In 2003, Cinergy, CG&E, and PSI recognized Cumulative effect of changes in accounting principles, net of tax as a result of the derivative's fair value must be recognized currentlyreversal of accrued cost of removal for non-regulated generating assets in earnings unless specific hedge accounting criteria are met. Gains and losses on derivatives that qualify as hedges can offset related fair value changes on the hedged item in the income statement for fair value hedges or be recorded in other comprehensive income for cash flow hedges.
We will reflectconjunction with the adoption of this standardStatement 143 and the change in financial statements issued beginningaccounting for certain energy related contracts from fair value to accrual in accordance with the first quarterrescission of 2001. Since manyEITF 98-10. In 2002, Cinergy recognized a Cumulative effect of a change in accounting principle, net of tax loss as a result of the existing relevant contractsvaluation and financial instruments are currently required to use mark-to-market accounting, we anticipateimpairment of goodwill with the effectsimplementation of implementation to be immaterial. These effects do not reflect the potential effects of applying mark-to-market accounting to selected call optionsStatement 142. The following table summarizes these cumulative effect adjustments and forwards we use to hedge peak period exposure to electricity demand. We have not historically marked these instruments to market because they are intended as hedges of peak period exposure and are not considered trading instruments. Our intent is to classify these types of instruments as normal purchases under Statement 133. However, the FASB-sponsored Derivatives Implementation Group has yet to issue its final guidance on these types of instruments. There are currently viewpoints that range from allowing them as normal purchases to not allowing hedge accounting under Statement 133. Given these issues, there is the possibility that these instruments will require mark-to-market accounting. This could create additional volatility in future earnings. At December 31, 2000, the fair value of these instruments was not material.their related tax effects.
(m)
| | Year to Date December 31 | |
| | 2003 | | 2002 | |
| | Before-tax Amount | | Tax (Expense) Benefit | | Net-of-tax Amount | | Before-tax Amount | | Tax (Expense) Benefit | | Net-of-tax Amount | |
| | (in millions) | |
Cinergy(1) | | | | | | | | | | | | | |
Goodwill impairment (Statement 142 adoption) | | $ | — | | $ | — | | $ | — | | $ | (11 | ) | $ | — | | $ | (11 | ) |
Rescission of EITF 98-10 (EITF 02-3 adoption) | | (20 | ) | 8 | | (12 | ) | — | | — | | — | |
Asset retirement obligation (Statement 143 adoption) | | 64 | | (25 | ) | 39 | | — | | — | | — | |
| | $ | 44 | | $ | (17 | ) | $ | 27 | | $ | (11 | ) | $ | — | | $ | (11 | ) |
CG&E | | | | | | | | | | | | | |
Rescission of EITF 98-10 (EITF 02-3 adoption) | | $ | (13 | ) | $ | 5 | | $ | (8 | ) | $ | — | | $ | — | | $ | — | |
Asset retirement obligation (Statement 143 adoption) | | 64 | | (25 | ) | 39 | | — | | — | | — | |
| | $ | 51 | | $ | (20 | ) | $ | 31 | | $ | — | | $ | — | | $ | — | |
PSI | | | | | | | | | | | | | |
Rescission of EITF 98-10 (EITF 02-3 adoption) | | $ | (1 | ) | $ | 0.5 | | $ | (0.5 | ) | $ | — | | $ | — | | $ | — | |
| | $ | (1 | ) | $ | 0.5 | | $ | (0.5 | ) | $ | — | | $ | — | | $ | — | |
(1) | The results of Cinergy also include amounts related to non-registrants. |
(r)Translation of Foreign Currency
We translate the assets and liabilities of foreign subsidiaries, whose functional currency (generally, that is the local currency of the country in which the subsidiary is located) is not the United States (U.S.) dollar, using the appropriate exchange rate as of the end of the year. We translate income and expense items using the average exchange rate prevailing during the month the respective transaction occurs. We record translation gains and losses inAccumulated other comprehensive income (loss), which is a component of common stock equity. When a foreign subsidiary is sold, the cumulative translation gain or loss as of the date of sale is removed from Accumulated other comprehensive income (loss) and is recognized as a component of the gain or loss on the sale of the subsidiary in our Statements of Income.
(n)
(s)Related Party Transactions
CG&E, PSI,and ULH&P engage in related party transactions. These transactions, which are eliminated upon consolidation, are generally performed at cost and in accordance with the SEC regulations under the PUHCA and the applicable state and federal commission regulations. The Balance Sheets of our utility operating companies reflect amounts payable to and/or receivable from related parties as Accounts payable to affiliated companies and Accounts receivable from affiliated companies. The significant related party transactions are disclosed below.
(i) Services
Services provides our regulated and non-regulated subsidiaries with a variety of centralized administrative, management, and support services in accordance with agreements approved by the SEC under the PUHCA. The costcosts of these services are charged to our operating companies on a direct basis, or for general costs which cannot be directly attributed, based on predetermined allocation factors, including the following:following ratios:
•sales;
•
sales ratio;•- electric peak
load ratio; - load;
136
•number of employees ratio;employees;
•number of customers ratio;customers; and
•construction expenditures ratio; and•other statistical information ratios.expenditures.
These costs were as follows for the years ended December 31:31, 2004, 2003, and 2002:
| | 2000
| | 1999
| | 1998
| | 2004 | | 2003 | | 2002 | |
|---|
| | (in millions)
| | (in millions) | |
|---|
| CG&E and its subsidiaries | | $ | 250 | | $ | 208 | | $ | 207 | |
| | | | | | | | |
CG&E and subsidiaries | | | $ | 286 | | $ | 219 | | $ | 206 | |
| PSI | | | 187 | | | 168 | | | 183 | | 230 | | 193 | | 190 | |
| ULH&P | | | 25 | | | 23 | | | 24 | | 21 | | 22 | | 23 | |
|
At
During 2002 and 2003, CinergyPower Generation Services, LLC (Generation Services) supplied electric production-related construction, operation and maintenance services to certain of our subsidiaries pursuant to agreements approved by the SEC under the PUHCA. CG&E and subsidiaries received services from Generation Services in the amounts of $96 million and $104 million for the years ended December 31, 2000,2003 and 1999,2002, respectively. PSI received services in the amounts of $55 million and $58 million for the years ended December 31, 2003 and 2002, respectively. Effective January 1, 2004, these services are now provided by Services and/or directly by CG&E and PSI as all Generation Services employees were transferred to other affiliated corporations.
(ii) Purchased Energy
ULH&P purchases energy from CG&E pursuant to a contract effective January 1, 2002, which was approved by the FERC and the Kentucky Public Service Commission (KPSC). This five-year agreement is a negotiated fixed-rate contract with CG&E. ULH&P purchased energy from CG&E for resale in the amounts of $162 million, $155 million, and $160 million for the years ended December 31, 2004, 2003, and 2002, respectively. These amounts are reflected in the Statements of Income for ULH&P as Electricity purchased from parent company for resale. For information on the proposed transfer of generating assets to ULH&P and the effect it will have on purchased energy see Note 19.
PSI and CG&E purchase energy from each other under a federal and state approved joint operating agreement. These sales and purchases are reflected in the Statements of Income of PSI and CG&E as Electric operating revenues and Fuel, emission allowances, and purchased power expense and were as follows for the years ended December 31, 2004, 2003, and 2002:
| | 2004 | | 2003 | | 2002 | |
| | (in millions) | |
| | | | | | | |
CG&E | | | | | | | |
Electric operating revenues | | $ | 48 | | $ | 63 | | $ | 59 | |
Purchased power(1) | | 80 | | 74 | | 43 | |
PSI | | | | | | | |
Electric operating revenues | | 80 | | 74 | | 43 | |
Purchased power(1) | | 48 | | 63 | | 59 | |
| | | | | | | | | | |
(1) Includes intercompany purchases that are presented net in accordance with EITF 02-3. |
To supplement native load requirements, CG&E and PSI have, from time to time, purchased peaking power from Cinergy Capital & Trading, Inc. (Capital & Trading), an indirect wholly-owned subsidiary of Cinergy Corp., under the terms of a wholesale market-based tariff. There were no purchases in 2004. For the year ended December 31, 2003, payments under this contract totaled approximately $5 million for CG&E. For the year ended December 31, 2002, payments under this contract for CG&E and PSI totaled approximately $27 million and $28 million, respectively. For PSI, certain of these amounts were deferred and have subsequently been recovered.
137
CG&E and PSI have an agreement with Marketing & Trading to purchase gas for certain gas-fired peaking plants. Purchases under this agreement were approximately $4 million, $6 million, and $9 million for CG&E and $37 million, $20 million, and $5 million for PSI for the years ended December 31, 2004, 2003, and 2002, respectively. The amounts are reflected in the Statements of Income of CG&E and PSI as Fuel, emission allowances, and purchased power expense.
(iii) Other
CG&E and ULH&P enter into various agreements with Marketing & Trading to manage theirinterstate pipeline transportation, storage capacity, and gas supply contracts. Under the terms of these agreements, Marketing & Trading is obligated to deliver natural gas to meet CG&E’s and ULH&P’s requirements. Payments under these agreements for the years ended December 31, 2004, 2003 and 2002 were approximately $480 million, $413 million and $40 million for CG&E and subsidiaries, and $79 million, $78 million and $7 million for ULH&P. These amounts are recorded in the Statements of Income for CG&E and ULH&P as Gas purchased expense. Certain of these amounts for CG&E and ULH&P have been deferred for future recovery. In addition, certain of these amounts for CG&E are presented net in Gas operating revenues in accordance with EITF 02-3.
In 2004, CG&E and PSI purchased emission allowances from each other under a federal and state approved joint operating agreement. These purchases, which totaled approximately $11 million and $36 million for CG&E and PSI, respectively, are reflected in the emission allowances inventories of both CG&E and PSI.
In February 2003, PSI acquired gas-fired peaking plants in Henry County, Indiana and Butler County, Ohio from two non-regulated affiliates. For a further discussion on the transfer of these generating assets see Note 19.
Cinergy Corp., Services, and our utility operating companies participate in a money pool arrangement to better manage cash and working capital requirements. These amounts are reflected in Notes payable to affiliated companies and Notes receivable from affiliated companies on the Balance Sheets of our utility operating companies includedcompanies. For a further discussion on the following amounts payable to Services:money pool agreement see Note 5.
138
| | 2000
| | 1999
|
|---|
| | (in millions)
|
|---|
| CG&E and its subsidiaries | | $ | 23 | | $ | 23 |
| PSI | | | 15 | | | 7 |
| ULH&P | | | 2 | | | 2 |
2. Common Stock
(a)Changes In Common Stock Outstanding
The following table reflects selected information related to our shares of Cinergy Corp.common stock reservedissued for stock-based plans.
| | Shares Reserved at Dec. 31, 2000
| | Shares Issued
|
|---|
| | 2000
| | 1999
| | 1998
|
|---|
Cinergy Corp. 1996 Long-term Incentive Compensation Plan (LTIP) |
|
6,956,386 |
|
— |
|
— |
|
— |
| Cinergy Corp. Stock Option Plan | | 4,035,787 | | 77,042 | | 255,828 | | 192,591 |
| Cinergy Corp. Employee Stock Purchase and Savings Plan | | 1,930,904 | | 208 | | 266 | | 1,006 |
| Cinergy Corp. UK Sharesave Scheme | | 75,000 | | — | | — | | — |
| Cinergy Corp. Retirement Plan for Directors | | 175,000 | | — | | — | | — |
| Cinergy Corp. Directors' Equity Compensation Plan | | 75,000 | | — | | — | | — |
| Cinergy Corp. Directors' Deferred Compensation Plan | | 200,000 | | — | | — | | — |
| Cinergy Corp. 401(k) Plans | | 6,469,373 | | — | | — | | — |
| Cinergy Corp. Dividend Reinvestment and Stock Purchase Plan | | 1,798,486 | | — | | — | | — |
| Cinergy Corp. Performance Shares Plan | | 736,751 | | — | | 34,550 | | — |
| | Shares Authorized for Issuance under Plan | | Number of Shares Available for Future Issuance(2) | | Shares Used to Grant or Settle Awards | |
| | | | 2004 | | 2003 | | 2002 | |
| | | | | | | | | | | |
Cinergy Corp. 1996 Long-Term Incentive Compensation Plan (LTIP) | | 14,500,000 | | 3,122,900 | | 1,729,679 | | 1,742,046 | | 674,005 | |
| | | | | | | | | | | |
Cinergy Corp. Stock Option Plan (SOP) | | 5,000,000 | | 1,318,500 | | 393,523 | | 421,611 | | 870,867 | |
| | | | | | | | | | | |
Cinergy Corp. Employee Stock Purchase and Savings Plan | | 2,000,000 | | 1,482,664 | | — | | 168,756 | | 4,912 | |
| | | | | | | | | | | |
Cinergy Corp. UK Sharesave Scheme | | 75,000 | | 62,200 | | 7,313 | | 3,364 | | 8,878 | |
| | | | | | | | | | | |
Cinergy Corp. Retirement Plan for Directors | | 175,000 | (1) | — | | 5,909 | | 5,602 | | 1,768 | |
| | | | | | | | | | | |
Cinergy Corp. Directors’ Equity Compensation Plan | | 75,000 | | 41,034 | | 1,095 | | 3,824 | | 196 | |
| | | | | | | | | | | |
Cinergy Corp. Directors’ Deferred Compensation Plan | | 200,000 | | 103,234 | | 5,388 | | 25,826 | | — | |
| | | | | | | | | | | |
Cinergy Corp. 401(k) Plans | | 6,469,373 | (1) | 2,785,258 | | 1,174,600 | | 1,544,900 | | 964,615 | |
| | | | | | | | | | | |
Cinergy Corp. Direct Stock Purchase and Dividend Reinvestment Plan | | 3,000,000 | (1) | 1,035,551 | | 627,205 | | 679,301 | | 657,943 | |
| | | | | | | | | | | |
Cinergy Corp. 401(k) Excess Plan | | 100,000 | (1) | — | | — | | — | | — | |
(1) | Plan does not contain an authorization limit. The number of shares presented reflects amounts registered with the SEC as of December 31, 2004. |
(2) | Shares available exclude the number of shares to be issued upon exercise of outstanding options, warrants, and rights. |
We retired 32,988829,575 shares of common stock in 2000; 31,7772004, 519,976 shares in 1999;2003, and 44,981422,908 shares in 1998,2002, mainly representing shares tendered as payment for the exercise of previously granted stock options.
In 1998,February 2002, Cinergy Corp. issued 771,2586.5 million shares of new common stock with net proceeds of approximately $200 million which were used to acquire Cinergy Marketingreduce short-term debt and Trading, LLC.for other general corporate purposes.
In January 2003, Cinergy Corp. filed a registration statement with the SEC with respect to the issuance of common stock, preferred stock, and other securities in an aggregate offering amount of $750 million. In February 2003, Cinergy sold 5.7 million shares of Cinergy Corp. common stock with net proceeds of approximately $175 million under this registration statement. The net proceeds from the transaction were used to reduce short-term debt of Cinergy Corp. and for other general corporate purposes. In December 2004, Cinergy Corp. issued 6.1 million shares of common stock with net proceeds of approximately $247 million, which were used to reduce short-term debt.
In January and February 2005, CinergyCorp. issued a total of 9.2 million shares of common stock pursuant to certain stock purchase contracts that were issued as a component of combined securities in December 2001. Net proceeds from the transaction of approximately $316 million were used to reduce short-term debt. See Note 3(b) for further discussion of the securities.
Cinergy Corp. owns all of the common stock ofCG&E andPSI. All ofULH&P's&P’s common stock is held byCG&E.
139
(b)Dividend Restrictions
Cinergy Corp.'s’s ability to pay dividends to holders of its common stock is principally dependent on the ability ofCG&E andPSI to payCinergy Corp. dividends on their common dividends.stock. Cinergy Corp., CG&E, andPSI cannot purchase or otherwise acquire for value or pay dividends on their common stock if their respective preferred stock dividends or preferred trust dividends are in arrears. The amount of common stock dividends that each company can pay is also limited by certain capitalization and earnings requirements underCG&E's&E’s and andPSI’s
PSI's credit instruments. Currently, these requirements do not impact the ability of either company to pay dividends on its common stock.
(c)Stock-based Compensation Plans
We currently have the following stock-based compensation plans:
•
- LTIP;
•
Stock Option Plan;- SOP;
•
- Employee Stock Purchase and Savings Plan;
•
- UK Sharesave Scheme;
•
- Retirement Plan for Directors;
•
Directors' Directors’ Equity Compensation Plan; and•
Directors' Directors’ Deferred Compensation Plan;• 401(k) Plans; and
• 401(k) Excess Plan.
The LTIP, the Stock Option Plan, andSOP, the Employee Stock Purchase and Savings Plan, 401(k) Plans, and the 401(k) Excess Plan are discussed below. The activity in 20002004, 2003, and 2002 for the remaining stock-based compensation plans was not significant.
We accountIn 2003, we prospectively adopted accounting for our stock-based compensation plans using the fair value recognition provisions of Statement 123, as amended by Statement 148, for all employee awards granted or with terms modified on or after January 1, 2003. Prior to 2003, we had accounted for our stock-based compensation plans using the intrinsic value method under Accounting Principles Board Opinion No. 25,AccountingAPB 25. See Note 1(p) for Stock Issued to Employees. In 2000, 1999, and 1998,additional information on costs we recognized compensation cost related to stock-based compensation plans, before income taxes, of $12.8 million, $(7) million and $1 million, respectively, in the Consolidated Statements of Income. The $7 million reduction in 1999 was a result of our revised estimatesplans. Effective July 1, 2005, Cinergy will adopt Statement 123R. See Note 1(q)(ii) for the performance-based shares accrued under the LTIP plan for Performance Cycle (Cycle) I. For further discussion see section (i) below.
Net income for 2000, 1999, and 1998, assuming compensation cost for these plans had been determined at fair value, consistent with the provisions of Statement of Financial Accounting Standards No. 123,Accounting for Stock-Based Compensation (Statement 123), would have been decreased by $4.4 million for 2000, $3.0 million for 1999 and $2.4 million for 1998. Earnings per share (EPS) would have been decreased by $.03 basic and diluted for 2000, $.02 basic and diluted for 1999, and $.02 basic and $.03 diluted for 1998.additional information regarding this new accounting standard.
In estimating the pro forma amounts, the fair value method of accounting was not applied to options granted prior to January 1, 1995. This is in accordance with the provisions of Statement 123. As a result, the pro forma effect on net income and EPS may not be representative of future years. In addition, the pro forma amounts reflect certain assumptions used in estimating fair values. These fair value assumptions are described, as applicable, below.
(i) LTIP LTIP The LTIP was originally adopted in 1996.
Under this plan, certain key employees may be granted incentive and non-qualified stock options, andstock appreciation rights (SARs), restricted stock, dividend equivalents, phantom stock, the opportunity to earn performance-based shares. For each Cycle, stockshares and certain other stock-based awards. Stock options are granted to participants atwith an option price equal to or greater than the fair market value on the grant date, and generally with a vesting period of grant.three years. The number ofvesting period begins on the grant date and all options expire within 10 years from that date.
Historically, the performance-based shares have been paid 100 percent in the form of common stock issuable understock. In order to maintain market competitiveness with respect to the form of LTIP is limitedawards and to a total of 7,000,000 shares.
LTIP stock option activity for 2000, 1999, and 1998 is summarized as follows:
| | Shares Subject to
Option
| | Weighted Average
Exercise Price
|
|---|
| Balance at December 31, 1997 | | 369,600 | | $ | 33.60 |
| |
Options granted |
|
471,400 |
|
|
38.19 |
| | Options forfeited | | (68,000 | ) | | 36.06 |
| | |
| | | |
| Balance at December 31, 1998 | | 773,000 | | | 36.19 |
| |
Options granted |
|
2,713,600 |
|
|
25.45 |
| | Options forfeited | | (59,500 | ) | | 35.65 |
| | |
| | | |
Balance at December 31, 1999 |
|
3,427,100 |
|
|
27.69 |
| |
Options granted |
|
1,329,800 |
|
|
24.59 |
| | Options forfeited | | (357,200 | ) | | 26.47 |
| | |
| | | |
Balance at December 31, 2000 |
|
4,399,700 |
|
$ |
26.85 |
| | |
| | | |
Options Exercisable: |
|
|
|
|
|
| |
At December 31, 1998 |
|
11,600 |
|
$ |
36.05 |
| | At December 31, 1999 | | 88,600 | | $ | 35.78 |
| | At December 31, 2000 | | 1,033,020 | | $ | 28.35 |
The weighted average fair value of options granted was $2.78ensure continued compliance with internal guidelines on common share dilution, in 2000, $2.56 in 1999, and $4.68 in 1998. The fair values of options granted were estimated as2003, the Compensation Committee of the dateCinergy Corp. Board of grant usingDirectors approved the Black-Scholes option-pricing modelfuture payment of performance-based share awards 50 percent in common stock and 50 percent in cash. As a result, the following assumptions:
| | 2000
| | 1999
| | 1998
|
|---|
| Risk-free interest rate | | 6.5% | | 6.1% | | 5.6% |
| Expected dividend yield | | 7.2% | | 7.2% | | 4.8% |
| Expected lives | | 5.6 yrs. | | 5.6 yrs. | | 5.6 yrs. |
| Expected common stock variance | | 4.1% | | 3.8% | | 1.8% |
Price ranges, along with certain other information, forexpected cash payout portion of the options outstanding under the LTIP at December 31, 2000, were as follows:
| | Outstanding
| | Exercisable
|
|---|
Exercise
Price Range
| | Number of Shares
| | Weighted Average Exercise Price
| | Weighted Average Contractual Life
| | Number of Shares
| | Weighted Average Exercise Price
|
|---|
| $23.66 - $24.38 | | 3,266,000 | | $ | 24.00 | | 9.0 yrs. | | 598,920 | | $ | 23.87 |
| $27.28 - $33.88 | | 345,600 | | $ | 32.68 | | 6.7 yrs. | | 277,900 | | $ | 33.50 |
| $34.13 - $38.59 | | 788,100 | | $ | 36.12 | | 7.5 yrs. | | 156,200 | | $ | 36.34 |
performance shares is reported in Current Liabilities - Other and Non-Current Liabilities - Other.
140
Entitlement to performance basedperformance-based shares is based onCinergy’sCinergy's Total Shareholder Return total shareholder return (TSR) over designated Cycles as measured against a pre-defined peer group. Target grants of performance basedperformance-based shares were made for the following Cycles:
| Cycle
| | |
| Grant
Date
| | |
| Performance
Period
| | |
| Target
Grant of Shares
|
|
|---|
| |
| |
| | |
|
|
|
|
|
| (in thousands)
|
|---|
III | | 1/2000 | | 2000-2001 | | 241
|
IV
|
| 1/2000
|
| 2000-2002
|
| 362
|
|
VVII | | 1/20012003 | | 2001-20032003-2005 | | 287411 | |
VIII | | 1/2004 | | 2004-2006 | | 404 | |
IX | | 1/2005 | | 2005-2007 | | 395 | |
| | | | | | | |
Potential awards for Cycle III are prorated for the length of the cycle. Participants may earn additional performance shares ifCinergy’sCinergy's TSR exceeds that of the 55th percentile of the TSR of its peer group. The Cycle II award of 122,820For the three-year performance period ended December 31, 2004 (Cycle VI), approximately 634,000 shares for calendar year 2000 was distributed in January 2001.(including dividend equivalent shares) were earned, based on our relative TSR.
(ii) SOP Stock Option Plan
The Stock Option PlanSOP is designed to align executive compensation with shareholder interests. Under the Stock Option Plan,SOP, incentive and non-qualified stock options, stock appreciation rights (SARs),SARs, and SARs in tandem with stock options may be granted to key employees, officers, and outside directors. The activity under this plan has predominantly consisted of the issuancegrant of stock options. Options are granted atwith an option price equal to the fair market value of the shares on the date of grant.grant date. Options generally vest over five years at a rate of 20%20 percent per year, beginning on the grant date, of grant, and expiringexpire 10 years from the dategrant date. As of grant. The total number of shares of common stock issuable under the Stock Option Plan may not exceed 5,000,000 shares. NoOctober 2004, no additional incentive stock options may be granted under the plan after October 24, 2004.plan.
Stock Option Plan activity for 2000, 1999, and 1998 is summarized as follows:
| | Shares Subject to
Option
| | Weighted Average
Exercise Price
|
|---|
| Balance at December 31, 1997 | | 2,954,475 | | $ | 23.79 |
| |
Options granted |
|
480,000 |
|
|
36.88 |
| | Options exercised | | (430,961 | ) | | 21.62 |
| | Options forfeited | | (100,000 | ) | | 26.92 |
| | |
| | | |
Balance at December 31, 1998 |
|
2,903,514 |
|
|
26.17 |
| |
Options granted |
|
152,500 |
|
|
24.66 |
| | Options exercised | | (259,865 | ) | | 21.51 |
| | Options forfeited | | (36,000 | ) | | 25.89 |
| | |
| | | |
Balance at December 31, 1999 |
|
2,760,149 |
|
|
26.53 |
| | Options exercised | | (123,978 | ) | | 23.50 |
| | Options forfeited | | (45,000 | ) | | 28.34 |
| | |
| | | |
Balance at December 31, 2000 |
|
2,591,171 |
|
$ |
26.64 |
| | |
| | | |
Options Exercisable: |
|
|
|
|
|
| |
At December 31, 1998 |
|
1,535,514 |
|
$ |
23.61 |
| | At December 31, 1999 | | 1,898,149 | | | 24.67 |
| | At December 31, 2000 | | 2,162,171 | | | 25.17 |
The weighted average fair value of options granted was $2.40 in 1999 and $4.53 in 1998 (no options were granted in 2000). The fair values of options granted in 1999 and 1998 were estimated as of the date of grant using the Black-Scholes option-pricing model and the following assumptions:
| | 1999
| | 1998
|
|---|
| Risk-free interest rate | | 6.2% | | 5.6% |
| Expected dividend yield | | 7.3% | | 4.8% |
| Expected lives | | 6.5 yrs. | | 6.5 yrs. |
| Expected common stock variance | | 3.9% | | 2.0% |
Price ranges, along with certain other information, for options outstanding under the Stock Option Plan at December 31, 2000, were as follows:
| | Outstanding
| | Exercisable
|
|---|
Exercise
Price Range
| | Number of Shares
| | Weighted Average Exercise Price
| | Weighted Average Contractual Life
| | Number of Shares
| | Weighted Average Exercise Price
|
|---|
| $17.35 - $23.81 | | 911,747 | | $ | 22.90 | | 4.5 yrs. | | 831,747 | | $ | 22.81 |
| $24.31 - $24.63 | | 933,451 | | $ | 24.32 | | 4.1 yrs. | | 933,451 | | $ | 24.32 |
| $25.19 - $36.88 | | 745,973 | | $ | 34.12 | | 6.5 yrs. | | 396,973 | | $ | 32.12 |
(iii) Employee Stock Purchase and Savings Plan
The Employee Stock Purchase and Savings Plan allows essentially all full-time, regular employees to purchase shares of common stock pursuant to a stock option feature. Under the Employee Stock Purchase and Savings Plan, after-tax funds are withheld from a participant's compensation during a 26-month offering period and are deposited in an interest-bearing account. At the end of the offering period, participants may apply amounts deposited in the account, plus interest, toward the purchase of shares of common stock. The purchase price is equal to 95% of the fair market value of a share of common stock on the first date of the offering period. Any funds not applied toward the purchase of shares are returned to the participant. A participant may elect to terminate participation in the plan at any time. Participation also will terminate if the participant's employment ceases. Upon termination of participation, all funds, including interest, are returned to the participant without penalty. The third (current)last offering period began MarchMay 1, 1999,2001, and ends Aprilended June 30, 2001.2003, with 168,101 shares purchased and the remaining cash distributed to the respective participants. The purchase price for all shares under this offering is $27.73. The second offering period ended February 28, 1999. Atwas $32.78.
141
Activity for 2004, 2003, and 2002 for the end of the second offering of the plan, the market price was below the established share price; therefore, in accordance with the plan provisions, all participants in the plan at February 28, 1999, were distributed cash funds in March 1999. The total number of shares of common stock issuable under theLTIP, SOP, and Employee Stock Purchase and Savings Plan may not exceed 2,000,000.
Employee Stock Purchase and Savings Plan activity for 2000, 1999, and 1998 is summarized as follows:
| | Shares Subject
to Option
| | Weighted Average
Exercise Price
|
|---|
| Balance at December 31, 1997 | | 326,367 | | $ | 31.83 |
| |
Options exercised |
|
(3,342 |
) |
|
31.83 |
| | Options forfeited | | (25,651 | ) | | 31.83 |
| | |
| | | |
Balance at December 31, 1998 |
|
297,374 |
|
|
31.83 |
| |
Options granted |
|
368,889 |
|
|
27.73 |
| | Options exercised | | (266 | ) | | 27.73 |
| | Options forfeited | | (306,692 | ) | | 27.73 |
| | |
| | | |
Balance at December 31, 1999 |
|
359,305 |
|
|
27.73 |
| |
Options exercised |
|
(2,718 |
) |
|
27.73 |
| | Options forfeited | | (76,261 | ) | | 27.73 |
| | |
| | | |
Balance at December 31, 2000 |
|
280,326 |
|
$ |
27.73 |
| | |
| | | |
| | LTIP and SOP | | Employee Stock Purchase and Savings Plan(1) | |
| | Shares Subject | | Weighted Average | | Shares Subject | | Weighted Average | |
| | to Option | | Exercise Price | | to Option | | Exercise Price | |
| | | | | | | | | |
Balance at December 31, 2001 | | 7,447,778 | | $ | 27.63 | | 278,325 | | $ | 32.78 | |
| | | | | | | | | |
Options granted(2) | | 1,241,200 | | 32.27 | | — | | — | |
Options exercised | | (1,308,738 | ) | 23.96 | | (4,912 | ) | 32.78 | |
Options forfeited | | (18,540 | ) | 31.57 | | (55,243 | ) | 32.78 | |
| | | | | | | | | |
Balance at December 31, 2002 | | 7,361,700 | | 29.06 | | 218,170 | | 32.78 | |
| | | | | | | | | |
Options granted(2) | | 897,100 | | 34.30 | | — | | — | |
Options exercised | | (1,630,046 | ) | 24.89 | | (168,101 | ) | 32.78 | |
Options forfeited | | (59,300 | ) | 30.51 | | (50,069 | ) | 32.78 | |
| | | | | | | | | |
Balance at December 31, 2003 | | 6,569,454 | | 30.79 | | — | | $ | — | |
| | | | | | | | | |
Options granted(2) | | 739,200 | | 38.79 | | | | | |
Options exercised | | (1,950,570 | ) | 26.41 | | | | | |
Options forfeited | | (32,700 | ) | 35.95 | | | | | |
| | | | | | | | | |
Balance at December 31, 2004 | | 5,325,384 | | $ | 33.35 | | | | | |
| | | | | | | | | |
Options Exercisable(3): | | | | | | | | | |
At December 31, 2002 | | 3,744,420 | | $ | 28.98 | | | | | |
At December 31, 2003 | | 3,700,346 | | $ | 29.52 | | | | | |
At December 31, 2004 | | 2,706,876 | | $ | 32.01 | | | | | |
(1) | Shares were not offered after June 30, 2003. |
(2) | Options were not granted under the SOP during 2004, 2003, or 2002. |
(3) | The options under the Employee Stock Purchase and Savings Plan are generally only exercisable at the end of the offering period. |
The weighted average fair value of options granted under the LTIP was $3.97$5.65 in 1999 (no options were granted2004, $4.96 in 1998 or 2000).2003, and $4.95 in 2002. The fair values of options granted were estimated as of the grant date of grant using the Black-Scholes option-pricing model and the following assumptions:
| | LTIP | |
| | 2004 | | 2003 | | 2002 | |
| | | | | | | |
Risk-free interest rate | | 3.35 | % | 3.02 | % | 3.92 | % |
Expected dividend yield | | 4.97 | % | 5.34 | % | 5.66 | % |
Expected life | | 5.33 | yrs. | 5.35 | yrs. | 5.42 | yrs. |
Expected volatility | | 24.47 | % | 26.15 | % | 26.45 | % |
Price ranges, along with certain other information, for options outstanding under the combined LTIP and SOP plans at December 31, 2004, were as follows:
| | | | | | Outstanding | | Exercisable | |
Exercise Price Range | | Number of Shares | | Weighted Average Exercise Price | | Weighted Average Remaining Contractual Life | | Number of Shares | | Weighted Average Exercise Price | |
| | | | | | | | | | | | | | | |
$ | 23.66 | | - | | $ | 33.64 | | 2,315,346 | | $ | 29.59 | | 6.00 yrs. | | 1,264,238 | | $ | 27.42 | |
$ | 33.88 | | - | | $ | 36.88 | | 2,061,638 | | $ | 35.09 | | 5.90 yrs. | | 1,233,938 | | $ | 35.60 | |
$ | 37.82 | | - | | $ | 39.65 | | 948,400 | | $ | 38.74 | | 7.68 yrs. | | 208,700 | | $ | 38.59 | |
| | | | | | | | | | | | | | | | | | | | | | | | | |
142
(iv) 401(k) Plans
We sponsor 401(k) employee retirement plans that cover substantially all United States employees. Employees can contribute up to 50 percent of pre-tax base salary (subject to Internal Revenue Service (IRS) limits) and up to 15 percent of after-tax base salary. We make matching contributions to these plans in the form of Cinergy Corp. common stock, contributing 100 percent of the first three percent of an employee’s pre-tax contributions plus 50 percent of the next two percent of an employee’s pre-tax contributions, and we have the discretion to make incentive matching contributions based on Cinergy’s net income. Employees are immediately vested in both their contributions and our matching contributions.
Cinergy’s, CG&E’s, and PSI’s matching contributions for the years ended December 31, 2004, 2003, and 2002 were as follows:
| | 2004 | | 2003 | | 2002 | |
| | | | (in millions) | | | |
| | | | | | | |
Cinergy(1) | | $ | 20 | | $ | 18 | | $ | 19 | |
CG&E and subsidiaries | | 5 | | 3 | | 3 | |
PSI | | 4 | | 4 | | 3 | |
| | | | | | | | | | |
| | 1999
|
|---|
Risk-free interest rate(1) | | 5.0% |
Expected dividend yield | | 6.2% |
Expected lives | | 2.0 yrs. |
Expected common stock variance | | 5.2%The results of Cinergy also include amounts related to non-registrants. |
(d)Effective January 1, 2003, each Cinergy employee whose pension benefit is determined using a cash balance formula is also eligible to receive an annual deferred profit sharing contribution, calculated as a percentage of that employee’s total pension eligible earnings. The deferred profit sharing contribution made by Director, OfficerCinergy is based on the corporate net income performance level for the year, and Key Employee Stock Purchase Program In December 1999,is made to the 401(k) plans in the form of Cinergy Corp. common stock. Each year’s contribution must remain invested in adoptedCinergy Corp. common stock for a minimum of three years, or until an employee reaches age 50. Employees age 50 or older may transfer their benefit from Cinergy Corp. common stock into another investment option offered under our 401(k) plans. Employees vest in their benefit upon reaching three years of service, or immediately upon reaching age 65 while employed. Cinergy has recorded approximately $2.4 million and $1.5 million, respectively, of profit sharing contribution costs for the Director, Officer,years ended December 31, 2004 and Key Employee Stock Purchase Program (the Program). December 31, 2003.
(v) 401(k) Excess Plan
The purpose401(k) Excess Plan is a non-qualified deferred compensation plan for a select group of Cinergy management and other highly compensated employees. It is a means by which these employees can defer additional compensation, and receive company matching contributions, provided they have already contributed the maximum amount (pursuant to the anti-discrimination rules for highly compensated employees) under the qualified 401(k) Plans. All funds deferred are held in a rabbi trust administered by an independent trustee.
3. Variable Interest Entities
(a)Power Sale SPEs
In accordance with Interpretation 46, we consolidate two SPEs that have individual power sale agreements with CMP for approximately 45 megawatts (MW) of capacity, ending in 2009, and 35 MW of capacity, ending in 2016. In addition, these SPEs have individual power purchase agreements with Capital & Trading to supply the power. Capital & Trading also provides various services, including certain credit support facilities. Upon the initial consolidation of these two SPEs on July 1, 2003, approximately $239 million of notes receivable, $225 million of non-recourse debt, and miscellaneous other assets and liabilities were included on Cinergy’s Balance Sheets. The debt was incurred by the SPEs to finance the buyout of the Program isexisting power contracts that CMP held with the former suppliers. The cash flows from the notes receivable are designed to facilitaterepay the purchasedebt. Notes 4 and ownership of8 provide additional information regarding the debt and the notes receivable, respectively.
143
(b)Preferred Trust Securities
In December 2001, Cinergy Corp.'sissued approximately $316 million notional amount of combined securities consisting of (a) 6.9 percent preferred trust securities, due February 2007, and (b) stock purchase contracts obligating the holders to purchase between 9.2 and 10.8 million shares of Cinergy Corp. common stock by its directors, officersFebruary 2005. A $50 preferred trust security and key employees, thereby further aligning their interests with thosestock purchase contract were sold together as a single security unit (Unit). The preferred trust securities were issued through a trust whose common stock is 100 percent owned by Cinergy Corp. The stock purchase contracts were issued directly by Cinergy Corp. The trust loaned the proceeds from the issuance of its shareholders.the securities to Cinergy Corp.
in exchange for a note payable to the trust that was eliminated in consolidation. The proceeds of $306 million, which is net of approximately $10 million of issuance costs, were used to pay down Cinergy Corp.’s short-term indebtedness. In January and February 2005, certain holders settled the stock purchase contracts early and elected to remove the units from the remarketing. In February 2000,2005, the remaining preferred trust securities were successfully remarketed and the dividend rate was reset at 6.9 percent. The preferred trust securities will mature in February 2007. To settle the stock purchase contracts, Cinergy Corp. purchased approximately 1.6 issued 9.2 million shares of common stock on behalfat the ceiling price of $34.40 per share as the market price of the participants at an averagestock exceeded the ceiling price of $24.82the contract. Net proceeds of approximately $316 million were used to repay short-term indebtedness.
Each Unit continues to receive quarterly cash payments of 6.9 percent per share.annum of the notional amount, which represents a preferred trust security dividend. Each Unit received quarterly cash payments of 2.6 percent per annum of the notional amount, which represented principal and interest on the stock purchase contracts. These payments ceased upon delivery of the shares in January and February 2005. The trust’s ability to pay dividends on the preferred trust securities is solely dependent on its receipt of interest payments from Cinergy Corp. on the note payable. However, Cinergy Corp. has fully and unconditionally guaranteed the preferred trust securities.
As of July 1, 2003, we no longer consolidate the trust that was established to issue the preferred trust securities. The preferred trust securities are no longer included in Cinergy Corp.’s Balance Sheets. In addition, the note payable owed to the trust, which has a current carrying value of $322 million, is included in Long-term debt.
(c)Sales of Accounts Receivable
Participants had the optionIn February 2002, CG&E, PSI, and ULH&P entered into an agreement to sell certain of financing the purchases through a five-year credit facility arranged bytheir accounts receivable and related collections. Cinergy Corp. formed Cinergy Receivables Company, LLC (Cinergy Receivables) to purchase, on a revolving basis, nearly all of the retail accounts receivable and related collections of CG&E, PSI, and ULH&P. Cinergy Corp. does not consolidate Cinergy Receivables since it meets the requirements to be accounted for as a qualifying SPE. The transfers of receivables are accounted for as sales, pursuant to Statement 140.
The proceeds obtained from the sales of receivables are largely cash but do include a subordinated note from Cinergy Receivables for a portion of the purchase price (typically approximates 25 percent of the total proceeds). The note is subordinate to senior loans that Cinergy Receivables obtains from commercial paper conduits controlled by unrelated financial institutions. Cinergy Receivables provides credit enhancement related to senior loans in the form of over-collateralization of the purchased receivables. However, the over-collateralization is calculated monthly and does not extend to the entire pool of receivables held by Cinergy Receivables at any point in time. As such, these senior loans do not have recourse to all assets of Cinergy Receivables. These loans provide the cash portion of the proceeds paid to CG&E, PSI, and ULH&P.
This subordinated note is a retained interest (right to receive a specified portion of cash flows from the sold assets) under Statement 140 and is classified within Notes receivable from affiliated companies in the accompanying Balance Sheets of CG&E, PSI, and ULH&P and is classified within Notes receivable on Cinergy Corp.’s Balance Sheets. In addition, Cinergy Corp.’s investment in Cinergy Receivables constitutes a purchased beneficial interest (purchased right to receive specified cash flows, in our case residual cash flows), which is subordinate to the retained interests held by CG&E, PSI, and ULH&P. The carrying values of the retained interests are determined by allocating the carrying value of the receivables between the assets sold and the interests retained based on relative fair value. The key assumptions in estimating fair value are credit losses and selection of discount rates. Because (a) the receivables generally turn in less than two months, (b) credit losses are reasonably predictable due to each
144
company’s broad customer base and lack of significant concentration, and (c) the purchased beneficial interest is subordinate to all retained interests and thus would absorb losses first, the allocated bases of the subordinated notes are not materially different than their face value. Interest accrues to CG&E, PSI, and ULH&P on the retained interests using the accretable yield method, which generally approximates the stated rate on the notes since the allocated basis and the face value are nearly equivalent. Cinergy Corp. records income from Cinergy Receivables in a similar manner. We record an impairment charge against the carrying value of both the retained interests and purchased beneficial interest whenever we determine that an other-than-temporary impairment has occurred (which is unlikely unless credit losses on the receivables far exceed the anticipated level).
The key assumptions used in measuring the retained interests are as follows (all amounts are averages of the assumptions used in sales during the period):
| | Cinergy | | CG&E and subsidiaries | | PSI | | ULH&P | |
| | 2004 | | 2003 | | 2004 | | 2003 | | 2004 | | 2003 | | 2004 | | 2003 | |
Anticipated credit loss rate | | 0.7 | % | 0.6 | % | 0.9 | % | 0.8 | % | 0.5 | % | 0.5 | % | 1.2 | % | 1.0 | % |
Discount rate on expected cash flows | | 3.8 | % | 4.4 | % | 3.8 | % | 4.4 | % | 3.8 | % | 4.4 | % | 3.8 | % | 4.4 | % |
Receivables turnover rate(1) | | 12.6 | % | 12.8 | % | 13.4 | % | 13.6 | % | 11.5 | % | 11.8 | % | 12.9 | % | 13.2 | % |
(1) Receivables at each month-end divided by annualized sales for the month. | |
|
| | |
The hypothetical effect on the fair value of the retained interests assuming both a 10 percent and 20 percent unfavorable variation in credit losses or discount rates is not material due to the short turnover of receivables and historically low credit loss history.
CG&E withretains servicing responsibilities for its role as a bank. Each participant is obligated to repaycollection agent on the bank any loan principal, interest, and prepayment fees, and each has assigned his or her dividend rightsamounts due on the sold receivables. However, Cinergy Receivables assumes the risk of collection on the purchased sharesreceivables without recourse to the bank to be applied to interest payments as due on the loan.
Services, and in part,Cinergy Corp., have guaranteed repayment to the bank of 100% of each participant's loan obligations and the associated interest, and each participant has agreed to indemnify the guarantor for any payments made by it under the guaranty on the participant's behalf. A participant's obligations to the bank are unsecured, and no restrictions are placed on the participant's ability to sell, pledge or otherwise encumber or dispose of his or her purchased shares.
3. Change in Preferred Stock of Subsidiaries
In 2000,PSI redeemed 289,250 shares of its $100 par value, 6.875% Series preferred stock for $29 million. In 1998,PSI redeemed approximately 3.4 million shares of its $25 par value, 7.44% Series preferred stock for $85 million. All other classes of preferred stock redeemed from 1998 to 2000 were immaterial forCG&E and, PSI. Refer, and ULH&P in the event of a loss. While no direct recourse to the Consolidated Statements of Capitalization for detailed information forCG&E and, PSI., and ULH&P exists, these entities risk loss in the event collections are not sufficient to allow for full recovery of their retained interests. No servicing asset or liability is recorded since the servicing fee paid to CG&E approximates a market rate.
145
The following table shows the gross and net receivables sold, retained interests, purchased beneficial interest, sales, and cash flows during the periods ending December 31, 2004 and 2003.
| | 2004 | |
| | | | | | | | | |
| | (in millions) | |
| | | | | | | | | |
Receivables sold as of period end | | $ | 538 | | $ | 339 | | $ | 199 | | $ | 54 | |
Less: Retained interests | | 194 | | 121 | | 73 | | 21 | |
| | | | | | | | | |
Net receivables sold as of period end | | $ | 344 | | $ | 218 | | $ | 126 | | $ | 33 | |
| | | | | | | | | |
Purchased beneficial interest | | $ | 18 | | $ | — | | $ | — | | $ | — | |
| | | | | | | | | |
Sales during period | | | | | | | | | |
Receivables sold | | $ | 3,895 | | $ | 2,253 | | $ | 1,642 | | $ | 367 | |
Loss recognized on sale | | 38 | | 25 | | 13 | | 4 | |
| | | | | | | | | |
Cash flows during period | | | | | | | | | |
Cash proceeds from sold receivables | | $ | 3,835 | | $ | 2,213 | | $ | 1,622 | | $ | 360 | |
Collection fees received | | 2 | | 2 | | — | | — | |
Return received on retained interests | | 17 | | 10 | | 7 | | 2 | |
| | | | | | | | | |
| | 2003 | |
| | | | | | | | | |
| | (in millions) | |
| | | | | | | | | |
Receivables sold as of period end | | $ | 487 | | $ | 310 | | $ | 177 | | $ | 50 | |
Less: Retained interests | | 172 | | 107 | | 65 | | 18 | |
| | | | | | | | | |
Net receivables sold as of period end | | $ | 315 | | $ | 203 | | $ | 112 | | $ | 32 | |
| | | | | | | | | |
Purchased beneficial interest | | $ | 14 | | $ | — | | $ | — | | $ | — | |
| | | | | | | | | |
Sales during period | | | | | | | | | |
Receivables sold | | $ | 3,681 | | $ | 2,140 | | $ | 1,541 | | $ | 346 | |
Loss recognized on sale | | 36 | | 23 | | 13 | | 4 | |
| | | | | | | | | |
Cash flows during period | | | | | | | | | |
Cash proceeds from sold receivables | | $ | 3,601 | | $ | 2,092 | | $ | 1,509 | | $ | 337 | |
Collection fees received | | 2 | | 2 | | — | | — | |
Return received on retained interests | | 16 | | 9 | | 7 | | 2 | |
A decline in the long-term senior unsecured credit ratings of CG&E, PSI, or ULH&P below investment grade would result in a termination of the sale program and discontinuance of future sales of receivables, and could prevent Cinergy Receivables from borrowing additional funds from commercial paper conduits.
(d)Other
Cinergy also holds interests in several joint ventures, primarily engaged in cogeneration and energy efficiency operations, that are considered VIEs which do not require consolidation. Our exposure to loss from our involvement with these entities is not material.
146
4. Long-Term Debt
Refer to the Statements of Capitalization for detailed information forCinergy’s, CG&E’s, PSI’s, and ULH&P’s long-term debt.
In March 2003, PSI borrowed the proceeds from the Indiana Development Finance Authority’s issuance of $35 million of its Environmental Refunding Revenue Bonds, Series 2003, due April 1, 2022. Interest was initially set at 1.05 percent and resets every 35 days by auction. Because the holders cannot tender the bonds for purchase by the issuer while the Bonds are in the auction rate mode, PSI’s obligation is classified as Long-term debt. Later in March 2003, the proceeds from this borrowing plus the interest income earned were used to cause the refunding of the $35 million principal amount outstanding of the City of Princeton, Indiana Pollution Control Revenue Refunding Bonds, 1997 Series.
In April 2003, PSI redeemed $26.8 million of the following Series A, Medium-term Notes:
Principal Amount | | Interest Rate | | Maturity Date | |
(in millions) | | | | | |
| | | | | |
$ | 2.0 | | 8.37 | % | 11/08/2006 | |
5.0 | | 8.81 | | 05/16/2022 | |
3.0 | | 8.80 | | 05/18/2022 | |
16.8 | | 8.67 | | 06/01/2022 | |
| | | | | | |
In June 2003, CG&E,PSI, andULH&P issued $200 million principal amount of its 5 3/8% 2003 Series B Debentures due June 15, 2033 (effective interest rate of 5.66 percent). Proceeds from this issuance were used for general corporate purposes, including the funding of capital expenditures related to construction projects and environmental compliance initiatives, and the repayment of outstanding indebtedness.
Also, in June 2003, CG&E modified existing debt resulting in a $200 million principal amount 5.40% 2003 Series A Debenture with a 30-year maturity. The effective interest rate is 6.90 percent.
In June 2003, CG&E also redeemed its $100 million 8.28% Junior Subordinated Debentures due July 1, 2025.
Cinergy adopted Interpretation 46 on July 1, 2003, as discussed in Note 1(q)(i). The adoption of this new accounting principle had the following effects on long-term debt:
•Cinergy no longer consolidates the trust that held Company obligated, mandatorily redeemable, preferred trust securities of subsidiary, holding solely debt securities of the company. This resulted in the removal of these securities from our 2003 Balance Sheet and the addition to long-term debt of a $319 million (net of discount) note payable that Cinergy Corp. owes to the trust.
•Cinergy consolidated two SPEs effective July 1, 2003. As a result, Cinergy has approximately $200 million of additional non-recourse debt as of December 31, 2004, comprised of two separate notes.
The first note, with a December 31, 2004 balance of $93 million bears an interest rate of 7.81 percent and Global Resources also havematures in June 2009. The second note, with a December 31, 2004 balance of $107 million, bears an interest rate of 9.23 percent and matures in November 2016.
In September 2003, PSI redeemed $56 million of its 5.93% Series B, Medium-term Notes at maturity.
In September 2003, PSI issued $400 million principal amount of its 5.00% Debentures due September 15, 2013 (effective interest rate of 5.20 percent). Proceeds from this issuance were used for the following total long-term debt (excludingearly redemption at par of two subordinated promissory notes to Cinergy Corp. totaling $376 million, issued as consideration for two gas fired electric peaking facilities transferred from Long-term debtCinergy Corp. to PSI in early 2003. The remaining proceeds were used
147
to reduce short-term indebtedness associated with general corporate purposes including funding capital expenditures related to construction projects and environmental compliance initiatives.
In October 2003, CG&E redeemed its $265.5 million First Mortgage Bonds, 7.20% due within one yearOctober 1, 2023.
In December 2003, ULH&P redeemed $20 million of its 6.11% Senior Debentures at maturity.
In February 2004, CG&E repaid at maturity $110 million of its 6.45% First Mortgage Bonds.
In April 2004, Cinergy Corp. repaid at maturity $200 million of its 6.125% Debentures.
In September 2004, Cinergy Corp. repaid at maturity $500 million of its 6.25% Debentures.
In November 2004, CG&E borrowed the proceeds from the Ohio Air Quality Development Authority’s issuance of $47 million principal amount of its State of Ohio Air Quality Development Revenue Bonds 2004 Series A and $47 million principal amount of its State of Ohio Air Quality Development Revenue Bonds 2004 Series B (for loans totaling $94 million), whichboth due November 1, 2039. Payment of principal and interest on the Bonds when due is reflected inCurrent liabilitiesinsured by separate bond insurance policies issued by XL Capital Assurance. The initial interest rate for both Series A and Series B was 1.92%. The interest rates on Series A and Series B were initially reset on January 5, 2005 and January 12, 2005, respectively, and then every 35 days by auction thereafter. Because the holders cannot tender the Bonds for purchase by the issuer while the Bonds are in the Consolidated Balance Sheets):auction rate mode, these debt obligations are classified as Long-term debt. CG&E is using the proceeds from these borrowings to assist in financing its portion of the costs of acquiring, constructing and installing certain solid waste disposal facilities comprising air quality facilities at Units 7 and 8 at CG&E’s majority-owned Miami Fort Generating Station (Miami Fort Station).
| | December 31
| |
|---|
| | 2000
| | 1999
| |
|---|
| | (in thousands)
| |
|---|
| Cinergy Corp. | | | | | | | |
| | Other Long-term Debt | | | | | | | |
| | | 6.53% Debentures due December 16, 2008 | | $ | 200,000 | | $ | 200,000 | |
| | | 6.125% Debentures due April 15, 2004 | | | 200,000 | | | 200,000 | |
| | |
| |
| |
| | | | Total Other Long-term Debt | | | 400,000 | | | 400,000 | |
| | Unamortized Discount | | | (265 | ) | | (333 | ) |
| | |
| |
| |
| | | |
Total—Cinergy Corp. |
|
$ |
399,735 |
|
$ |
399,667 |
|
Global Resources |
|
|
|
|
|
|
|
| | Other Long-term Debt | | | | | | | |
| | | 6.20% Debentures due November 3, 2008 | | $ | 150,000 | | $ | 150,000 | |
| | | Variable interest rate of London Inter-Bank Offered Rate (LIBOR) plus 1.75%, due July 2015 | | | 14,156 | | | 15,300 | |
| | | Variable interest rate of LIBOR plus 2.5%, due July 2015 | | | 6,323 | | | 7,100 | |
| | | Variable interest rates ranging between the 3 month Prague Inter-Bank Offered Rate plus 0.55% to the 3 month Euro Inter-Bank Offered Rate plus 4.12%, maturing April 30, 2002 to June 20, 2004 | | | 8,314 | | | — | |
| | | 7.4% interest rate, due May 30, 2003 | | | 18,783 | | | — | |
| | |
| |
| |
| | | | Total Other Long-term Debt | | | 197,576 | | | 172,400 | |
| | Unamortized Discount | | | (260 | ) | | (293 | ) |
| | |
| |
| |
| | | |
Total—Global Resources |
|
$ |
197,316 |
|
$ |
172,107 |
|
Operating Companies |
|
|
|
|
|
|
|
| | CG&E and its subsidiaries | | $ | 1,205,061 | | $ | 1,205,916 | |
| | PSI | | | 1,074,255 | | | 1,211,552 | |
| | |
| |
| |
| | | |
Total—Operating Companies |
|
$ |
2,279,316 |
|
$ |
2,417,468 |
|
Total—Cinergy |
|
$ |
2,876,367 |
|
$ |
2,989,242 |
|
In December 2004, PSI borrowed the proceeds from the Indiana Development Finance Authority’s issuance of $77 million principal amount of its Environmental Revenue Bonds, Series 2004B and $77 million principal amount of its Environmental Revenue Bonds, Series 2004C, both due December 1, 2039 (for loans totaling $154 million). Payment of principal and interest on the Bonds when due is insured by separate bond insurance policies issued by XL Capital Assurance. The initial interest rate for Series 2004B was 1.80% and for Series 2004C was 1.85%. The interest rates on both Series 2004B and Series 2004C were initially reset on January 11, 2005 and then every 35 days by auction thereafter. Because the holders cannot tender the Bonds for purchase by the issuer while the Bonds are in the auction rate mode, these debt obligations are classified as Long-termdebt. PSI is using the proceeds from these borrowings to assist in the acquisition and construction of solid waste disposal facilities located at various generating stations in Indiana.
In December 2004, ULH&P issued $40 million principal amount of its 5.00% Debentures due December 15, 2014 (effective interest rate of 5.26%). Proceeds from this issuance were used for general corporate purposes and the repayment of outstanding indebtedness.
148
The following table reflects the long-term debt maturities for the next five years, excluding any redemptions due to the exercise of call provisions or put provisions.capital lease obligations. Callable means the issuer haswe have the right to buy
back a given security from the holder at a specified price before maturity. Putable means the holder has the right to sell a given security back to the issuer at a specified price before maturity.
Long-term Debt Maturities
| | Cinergy and
Subsidiaries(1)
| | CG&E and
Subsidiaries(1)
| | PSI(1)
|
|---|
| | (in millions)
|
|---|
| 2001 | | $ | 41 | (2) | $ | 1 | | $ | 39 |
| 2002 | | | 145 | | | 100 | | | 24 |
| 2003 | | | 85 | | | 20 | (3) | | 57 |
| 2004 | | | 313 | | | 110 | | | 1 |
| 2005 | | | 3 | | | — | | | 1 |
| | |
| |
| |
|
| | | $ | 587 | | $ | 231 | | $ | 122 |
| | Cinergy(1) | | CG&E and subsidiaries | | PSI | | ULH&P | |
| | (in millions) | |
| | | | | | | | | |
2005(2) | | $ | 220 | | $ | 150 | | $ | 50 | | $ | — | |
| | | | | | | | | |
2006 | | 355 | | — | | 326 | | — | |
| | | | | | | | | |
2007 | | 726 | | 100 | | 266 | | — | |
| | | | | | | | | |
2008 | | 551 | | 120 | | 43 | | 20 | |
| | | | | | | | | |
2009 | | 270 | | 20 | | 223 | | 20 | |
| | | | | | | | | |
Thereafter | | 2,376 | | 1,240 | | 976 | | 55 | |
| | | | | | | | | |
Total | | $ | 4,498 | | $ | 1,630 | | $ | 1,884 | | $ | 95 | |
(1)Excludes capital leases.(2)Excludes $27 million ofLong-term debt due within one year for a subsidiary of Global Resources, which is classified asNotes payable and other short-term obligations.(3)CG&E and subsidiaries includesULH&P's $20 million maturing in 2003.
(1) The results of Cinergy also include amounts related to non-registrants. |
(2) CG&E and subsidiaries includes long-term debt with put provisions of $150 million in 2005. PSI includes long-term debt with put provisions of $50 million in 2005. |
Maintenance and replacement fund provisions contained inPSI’sPSI's first mortgage bond indenture require: (1) cash payments, (2) bond retirements, or (3) pledges of unfunded property additions each year based on an amount related toPSI’sPSI's net revenues.
CG&E’s transmission and distribution assets of approximately $2.8 billion are subject to the lien of its first mortgage bond indenture. The utility property of PSI is also subject to the lien of its first mortgage bond indenture.
As discussed previously, CG&E and PSI periodically borrowed proceeds from the issuance of tax exempt bonds for the purpose of funding the acquisition and construction of solid waste disposal facilities located at various generating stations in Indiana and Ohio. Because some of these facilities have not commenced construction and others are not yet complete, proceeds from the borrowings have been placed in escrow with a trustee and may be drawn upon only as facilities are built and qualified costs incurred. In the event any of the proceeds are not drawn, CG&E and PSI would eventually be required to return the unused proceeds to bondholders. CG&E and PSI expect to draw down all of the proceeds over the next three years.
5. Notes Payable and Other Short-term Obligations
Short-term obligations may include:
•
- short-term notes;
•
commercial paper;•- variable rate pollution control notes;
•commercial paper; and
•
- money
pooling.
pool.Short-term Notes
Short-term borrowings mature within one year from the date of issuance. We primarily use unsecured revolving lines of credit and the sale of commercial paper for short-term borrowings. A portion of each company's committedCinergy Corp.’s revolving lines is used to provide credit support for commercial paper (discussed below).and letters of credit. When committedrevolving lines are reserved for commercial paper or backing letters of credit, they are not available for additional borrowings. The fees we paid to secure short-term notesborrowings were immaterial during each of the period from 1998 to 2000.years ended December 31, 2004, 2003, and 2002.
149
At December 31, 2000,2004, Cinergy Corp. had $157 million$1.3 billion remaining unused and available capacity relating to its authorized $795 million$2 billion revolving and uncommitted lines. Early in 2001,credit facilities. These revolving credit facilities include the following:
Credit Facility | | Expiration | | Established Lines | | Outstanding and Committed | | Unused and Available | |
| | (in millions) | |
| | | | | | | | | |
Five-year senior revolving | | December 2009 | | | | | | | |
Direct borrowing | | | | $ | | | $ | — | | $ | | |
Commercial paper support | | | | | | — | | | |
| | | | | | | | | |
Total five-year facility(1) | | | | 1,000 | | — | | 1,000 | |
| | | | | | | | | |
Three-year senior revolving | | April 2007 | | | | | | | |
Direct borrowing | | | | | | — | | | |
Commercial paper support | | | | | | 676 | | | |
Letter of credit support | | | | | | 12 | | | |
| | | | | | | | | |
Total three-year facility(2) | | | | 1,000 | | 688 | | 312 | |
| | | | | | | | | |
Total Credit Facilities | | | | $ | 2,000 | | $ | 688 | | $ | 1,312 | |
(1) In April 2004, Cinergy Corp. successfully placed a $500 million 364-day senior unsecured revolving credit facility which replaced the $600 million 364-day senior unsecured revolving credit facility that expired in April 2004. In December 2004, Cinergy Corp. successfully replaced the $500 million 364-day facility with a $1 billion five-year facility. CG&E and PSIeach have $500 million borrowing sublimits on this facility. |
(2) In April 2004, Cinergy Corp. successfully placed a $1 billion three-year senior unsecured revolving credit facility. This facility replaced the $400 million three-year senior unsecured revolving credit facility that was set to expire in May 2004. |
In addition to revolving credit facilities, Cinergy Corp., successfully placed a new $400 million, 364-day revolving credit facility. This new facility will support an expansion of our commercial paper programCG&E, and is not included in thePSI also maintain uncommitted lines of credit discussed above.credit. These facilities are not guaranteed sources of capital and represent an informal agreement to lend money, subject to availability, with pricing to be determined at the time of advance. Cinergy Corp.
, CG&E, and Commercial PaperPSI As have established uncommitted lines of $40 million, $15 million, and $60 million, respectively, all of which remained unused as of December 31, 2000, the commercial paper (debt instruments exchanged between companies) program is limited to a maximum outstanding principal amount of $400 million forCinergy Corp. As of December 31, 2000,Cinergy Corp. had issued $216 million in commercial paper. Additionally,CG&E andPSI have the capacity to issue commercial paper, which must be supported by available committed lines of the respective company. The maximum outstanding principal amount forCG&E is $200 million and forPSI is $100 million. NeitherCG&E norPSI issued commercial paper in 2000 or 1999.2004.
In early 2001,Cinergy Corp. expanded the commercial paper program to a maximum outstanding principal amount of $800 million and reduced the established lines of credit atCG&E andPSI. The expansion of the commercial paper program at theCinergy Corp. level will, in part, support the short-term borrowing needs ofCG&E andPSI and will eliminate the need for commercial paper
programs atCG&E andPSI. TheCinergy Corp. commercial paper program expansion is supported by the new $400 million, 364-day revolving credit facility as discussed above.
Variable Rate Pollution Control Notes
CG&E andPSI have issued certain variable rate pollution control notes (tax-exempt notes obtained to finance equipment or land development tofor pollution control pollution)purposes). Because the holders of these notes have the right to redeemhave their notes redeemed on any business day,a daily, weekly, or monthly basis, they are reflected inNotes payable and other short-term obligations in on the Consolidated Balance Sheets forof Cinergy, forCG&E, and forPSI. At December 31, 2004, Cinergy, CG&E and PSI had $273 million, $112 million and $136 million, respectively, outstanding in variable rate pollution control notes, classified as short-term debt. ULH&P had no outstanding short-term pollution control notes. Any short-term pollution control note borrowings outstanding do not reduce the unused and available short-term debt regulatory authority of CG&E, PSI, and ULH&P.
In August 2003, CG&E caused the remarketing by the Ohio Air Quality Development Authority of $84 million of its State of Ohio Air Quality Development Revenue Refunding Bonds, due September 1, 2030. The following tables summarize ourissuance consists of a $42 million 1995 Series A and a $42 million 1995 Series B. The remarketing effected the conversion from a daily interest rate reset mode supported by a letter of credit to an unsecured weekly interest rate mode. The interest rate for both series was initially set at 1.30 percent and will reset every seven days going forward. Because the holders of these notes have the right to have their notes redeemed on a weekly basis, they are reflected in Notes payable and other short-term obligations on the Balance Sheets of Cinergy and , but excludeCG&E.
Also in August 2003, CG&E caused the remarketing by the Ohio Air Quality Development Authority of $12.1 million of its State of Ohio Air Quality Development Revenue Bonds 2001 Series A due August 1, 2033. The remarketing affected the conversion from an unsecured one-year interest rate reset mode to a daily interest rate reset
150
mode supported by a standby letter of credit. The interest rate was initially set at 0.95 percent and will be reset daily going forward. Because the holders of these notes have the right to have their notes redeemed on a daily basis, they are reflected in Notes payable to affiliated companiesand other short-term obligations on the Balance Sheets of Cinergy and CG&E.
In December 2003, PSI borrowed the proceeds from the issuance by the Indiana Development Finance Authority of $80.5 million of its Indiana Development Finance Authority Environmental Revenue Bonds due December 1, 2038. The issuance consists of two $40.25 million tranches designated Series 2003A and Series 2003B. The initial interest rate for both tranches was 1.27 percent and is reset weekly. Proceeds from the borrowing are being used for the acquisition and construction of various solid waste disposal facilities located at various generating stations in Indiana. The remaining funds are being held in escrow by an independent trustee and will be drawn down as the facilities are built. Because the holders of these notes have the right to have their notes redeemed on a weekly basis, they are reflected in Notes payable and other short-term obligations on the Balance Sheets of Cinergy and PSI.
| | December 31, 2000
| | December 31, 1999
| |
|---|
| | Established
Lines
| | Outstanding
| | Weighted
Average
Rate
| | Established
Lines
| | Outstanding
| | Weighted
Average
Rate
| |
|---|
| |
| | (in millions)
| |
| |
| | (in millions)
| |
| |
|---|
| Cinergy Corp. | | | | | | | | | | | | | | | | | |
| | Committed lines | | | | | | | | | | | | | | | | | |
| | | Revolving lines | | $ | 750 | | $ | 359 | | 6.84 | % | $ | 600 | | $ | — | | — | % |
| | Uncommitted line | | | 45 | | | 12 | | 7.25 | | | 45 | | | — | | — | |
| | Commercial paper | | | 400 | | | 216 | | 7.06 | | | — | | | — | | — | |
| |
Operating companies |
|
|
|
|
|
|
|
|
|
|
|
|
|
|
|
|
|
| | Committed lines | | | 180 | | | 180 | | 7.18 | | | 195 | | | 120 | | 6.68 | |
| | Uncommitted lines | | | 125 | | | 5 | | 7.00 | | | 300 | | | 81 | | 6.44 | |
| | Pollution control notes | | | N/A | | | 267 | | 4.52 | | | N/A | | | 267 | | 4.10 | |
| |
Non-regulated subsidiaries |
|
|
|
|
|
|
|
|
|
|
|
|
|
|
|
|
|
| | Revolving lines | | | 13 | | | 11 | | 5.86 | | | 14 | | | 13 | | 6.26 | |
| | Short-term debt | | | 79 | | | 79 | | 6.77 | | | 69 | | | 69 | | 6.86 | |
| | | | | |
| | | | | | |
| | | |
| Cinergy Total | | | | | $ | 1,129 | | 6.38 | % | | | | $ | 550 | | 5.41 | % |
In August 2004, PSI borrowed the proceeds from the issuance by the Indiana Development Finance Authority of $55 million principal amount of its Environmental Revenue Bonds, Series 2004A, due August 2039. The initial interest rate for the bonds was 1.13 percent and is reset weekly. Proceeds from the borrowing will be used for the acquisition and construction of various solid waste disposal facilities located at various generating stations in Indiana. The funds are being held in escrow by an independent trustee and will be drawn upon as facilities are built. Holders of these notes are entitled to credit enhancement in the form of a standby letter of credit which, if drawn upon, provides for the payment of both interest and principal on the notes. Because the holders of these notes have the right to have their notes redeemed on a weekly basis, they are reflected in Notes payable and other short-term obligations on Cinergy’s and PSI’s Balance Sheets.
Commercial Paper
Cinergy Corp.’s commercial paper program is supported by Cinergy Corp.’s $2 billion revolving credit facilities. The commercial paper program supports, in part, the short-term borrowing needs of CG&E
| | December 31, 2000
| | December 31, 1999
| |
|---|
| | Established
Lines
| | Outstanding
| | Weighted
Average
Rate
| | Established
Lines
| | Outstanding
| | Weighted
Average
Rate
| |
|---|
| |
| | (in millions)
| |
| |
| | (in millions)
| |
| |
|---|
| Committed lines | | $ | 80 | | $ | 80 | | 7.06 | % | $ | 65 | | $ | 30 | | 6.27 | % |
| Uncommitted line | | | 40 | | | — | | — | | | 130 | | | 21 | | 6.42 | |
| Pollution control notes | | | N/A | | | 184 | | 4.61 | | | N/A | | | 184 | | 4.08 | |
| | | | | |
| | | | | | |
| | | |
| Total | | | | | $ | 264 | | 5.35 | % | | | | $ | 235 | | 4.57 | % |
and PSI
and eliminates their need for separate commercial paper programs. In September 2004, PSI
| | December 31, 2000
| | December 31, 1999
| |
|---|
| | Established
Lines
| | Outstanding
| | Weighted
Average
Rate
| | Established
Lines
| | Outstanding
| | Weighted
Average
Rate
| |
|---|
| |
| | (in millions)
| |
| |
| | (in millions)
| |
| |
|---|
| Committed lines | | $ | 100 | | $ | 100 | | 7.27 | % | $ | 130 | | $ | 90 | | 6.81 | % |
| Uncommitted line | | | 85 | | | 5 | | 7.00 | | | 170 | | | 60 | | 6.44 | |
| Pollution control notes | | | N/A | | | 83 | | 4.34 | | | N/A | | | 83 | | 4.15 | |
| | | | | |
| | | | | | |
| | | |
| Total | | | | | $ | 188 | | 5.97 | % | | | | $ | 233 | | 5.77 | % |
Money PoolCinergy Corp. expanded its commercial paper program from $800 million to a maximum outstanding principal amount of $1.5 billion. As of December 31, 2004, Cinergy Corp. had $676 million in commercial paper outstanding.
Money Pool
Cinergy Corp., Services, and our utility operating companies and their subsidiaries participate in a money pool arrangement to better manage cash and working capital requirements. Under this arrangement, those companies with surplus short-term funds provide short-term loans to others.affiliates (other than Cinergy Corp.) participating under this arrangement. This surplus cash may be from internal or external sources. The amounts outstanding under this money pool arrangement are shown as a component of Notes receivable from affiliated companies and/or orNotes payable to affiliated companies on the Consolidated Balance Sheets forCG&E andPSI, and on the Balance Sheets forof CG&E, PSI, and ULH&P. Any money pool borrowings outstanding reduce the unused and available short-term debt regulatory authority of CG&E, PSI, and ULH&P.
6. Sale of Accounts Receivable
CG&E,PSI, andULH&P have an agreement to sell, on a revolving basis, undivided percentage interests in certain of their accounts receivable and the related collections up to an aggregate maximum of $350 million.CG&E retains servicing responsibilities for its role as a collection agent of the amounts due on the sold receivables. However, the purchaser assumes the risk of collection on the sold receivables without recourse toCG&E,PSI, orULH&P in the event of a loss. Proceeds from a portion of the sold receivables are held back as a reserve to reduce the purchaser's credit risk.CG&E,PSI, andULH&P do not retain any ownership interest in the sold receivables, but do retain undivided interests in their remaining balances of accounts receivable. The recorded amounts of the retained interests are measured at net realizable value.151
TheAccounts receivable on the Consolidated Balance Sheets ofCinergy, CG&E andPSI and on the Balance Sheets of
ULH&P are net of the amounts sold at December 31, 2000, and 1999. The following table showssummarizes our Notes payable and other short-term obligations and Notes payable to affiliated companies.
| | December 31, 2004 | | December 31, 2003 | |
| | Established Lines | | Outstanding | | Weighted Average Rate | | Established Lines | | Outstanding | | Weighted Average Rate | |
| | (in millions) | |
| | | | | | | | | | | | | |
Cinergy | | | | | | | | | | | | | |
Cinergy Corp. | | | | | | | | | | | | | |
Revolving lines | | $ | 2,000 | | $ | — | | — | % | $ | 1,000 | | $ | — | | — | % |
Uncommitted lines(1) | | 40 | | — | | — | | 40 | | — | | — | |
Commercial paper(2) | | | | 676 | | 2.45 | | | | 146 | | 1.18 | |
| | | | | | | | | | | | | |
Utility operating companies | | | | | | | | | | | | | |
Uncommitted lines(1) | | 75 | | — | | — | | 75 | | — | | — | |
Pollution control notes | | | | 248 | | 2.43 | | | | 193 | | 1.37 | |
| | | | | | | | | | | | | |
Non-regulated subsidiaries | | | | | | | | | | | | | |
Revolving lines(3) | | 158 | | 8 | | 5.67 | | 19 | | 10 | | 5.90 | |
Short-term debt | | | | 2 | | 4.50 | | | | 2 | | 4.80 | |
Pollution control notes | | | | 25 | | 2.30 | | | | — | | — | |
| | | | | | | | | | | | | |
Cinergy Total | | | | $ | 959 | | 2.47 | % | | | $ | 351 | | 1.45 | % |
| | | | | | | | | | | | | |
CG&E and subsidiaries | | | | | | | | | | | | | |
Uncommitted lines(1) | | $ | 15 | | $ | — | | — | % | $ | 15 | | — | | — | % |
Pollution control notes | | | | 112 | | 2.34 | | | | 112 | | 1.28 | |
Money pool | | | | 180 | | 2.38 | | | | 49 | | 1.11 | |
| | | | | | | | | | | | | |
CG&E Total | | | | $ | 292 | | 2.36 | % | | | $ | 161 | | 1.23 | |
| | | | | | | | | | | | | |
PSI | | | | | | | | | | | | | |
Uncommitted lines(1) | | $ | 60 | | $ | — | | — | % | $ | 60 | | $ | — | | — | % |
Pollution control notes | | | | 136 | | 2.49 | | | | 81 | | 1.48 | |
Money pool | | | | 130 | | 2.38 | | | | 188 | | 1.11 | |
| | | | | | | | | | | | | |
PSI Total | | | | $ | 266 | | 2.44 | % | | | $ | 269 | | 1.22 | % |
| | | | | | | | | | | | | |
ULH&P | | | | | | | | | | | | | |
Money pool | | | | $ | 11 | | 2.38 | % | | | $ | 45 | | 1.11 | % |
| | | | | | | | | | | | | |
ULH&P Total | | | | $ | 11 | | 2.38 | % | | | $ | 45 | | 1.11 | % |
(1) These facilities are not guaranteed sources of capital and represent an informal agreement to lend money, subject to availability, with pricing to be determined at the time of advance. |
(2) In September 2004, Cinergy Corp. increased its commercial paper program limit from $800 million to $1.5 billion. The commercial paper program is supported by Cinergy Corp.’s revolving lines of credit. |
(3) In December 2004, Cinergy Canada, Inc. successfully placed a $150 million three-year senior revolving credit facility. |
In our credit facilities, Cinergy Corp. has covenanted to maintain:
• a consolidated net worth of $2 billion; and
• a ratio of consolidated indebtedness to consolidated total capitalization not in excess of 65 percent.
As part of CG&E’s $500 million sublimit under the receivables sold,$1 billion five-year credit facility, CG&E has covenanted to maintain:
• a consolidated net worth of $1 billion; and
• a ratio of consolidated indebtedness to consolidated total capitalization not in excess of 65 percent.
152
As part of PSI’s $500 million sublimit under the associated reserves held back,$1 billion five-year credit facility, PSI has covenanted to maintain:
• a consolidated net worth of $900 million; and
• a ratio of consolidated indebtedness to consolidated total capitalization not in excess of 65 percent.
A breach of these covenants could result in the termination of the credit facilities and the net amounts receivedacceleration of the related indebtedness. In addition to breaches of covenants, certain other events that could result in the termination of available credit and acceleration of the related indebtedness include:
• bankruptcy;
• defaults in the payment of other indebtedness; and
• judgments against the company that are not paid or insured.
The latter two events, however, are subject to dollar-based materiality thresholds.
As discussed in Note 1(q)(i), long-term debt increased in the third quarter of 2003 resulting from the adoption of Interpretation 46. The debt which was recorded as a result of this new accounting pronouncement did not cause Cinergy Corp. to be in breach of any covenants at the time of adoption. As of December 31, 2000,2004, Cinergy, CG&E, and 1999, as well as the losses on the salesPSI are in compliance with all of accounts receivable for the years ended December 31, 2000, and 1999:their debt covenants.
| | Receivables Sold
| | Reserves
| | Net Amount
| | Loss on Sale(1)
|
|---|
| |
| | (in millions)
| |
|
|---|
2000
| | | | | | | | | | | | |
| Cinergy | | $ | 316 | | $ | 59 | | $ | 257 | | $ | 17 |
| CG&E and subsidiaries | | | 192 | | | 36 | | | 156 | | | 11 |
| PSI | | | 124 | | | 23 | | | 101 | | | 6 |
| ULH&P | | | 32 | | | 6 | | | 26 | | | 1 |
1999
|
|
|
|
|
|
|
|
|
|
|
|
|
| Cinergy | | $ | 306 | | $ | 49 | | $ | 257 | | $ | 15 |
| CG&E and subsidiaries | | | 187 | | | 30 | | | 157 | | | 10 |
| PSI | | | 119 | | | 19 | | | 100 | | | 5 |
| ULH&P | | | 25 | | | 4 | | | 21 | | | 1 |
(1)Represents monthly fees payable to the purchaser.6. Leases
(a)
7.Operating Leases
(a) Operating LeasesWe have entered into operating lease agreements for various facilities and properties such as computer, communication and transportation equipment, and office space. Total rental payments on operating leases for each of the past three years are detailed in the table below.following table. This table also shows future minimum lease payments required for operating leases with remaining non-cancelable lease terms in excess of one year as of December 31, 2000:2004:
| | Actual Payments
| | Estimated Minimum Payments
|
|---|
| | 1998
| | 1999
| | 2000
| | 2001
| | 2002
| | 2003
| | 2004
| | 2005
| | After
2005
| | Total
|
|---|
| | (in millions)
| | (in millions)
|
|---|
| Cinergy(1) | | $ | 42 | | $ | 50 | | $ | 56 | | $ | 41 | | $ | 31 | | $ | 23 | | $ | 17 | | $ | 15 | | $ | 68 | | $ | 195 |
| CG&E and subsidiaries | | | 21 | | | 27 | | | 30 | | | 10 | | | 9 | | | 7 | | | 5 | | | 5 | | | 18 | | | 54 |
| PSI | | | 21 | | | 21 | | | 21 | | | 9 | | | 8 | | | 7 | | | 6 | | | 5 | | | 25 | | | 60 |
| ULH&P(2) | | | 3 | | | 4 | | | 4 | | | — | | | — | | | — | | | — | | | — | | | — | | | — |
| | Lease Expense | | Estimated Minimum Lease Payments | |
| | 2002 | | 2003 | | 2004 | | 2005 | | 2006 | | 2007 | | 2008 | | 2009 | | Thereafter | | Total | |
| | (in millions) | |
| | | | | | | | | | | | | | | | | | | | | |
Cinergy(1) | | $ | 64 | | $ | 72 | | $ | 85 | | $ | 43 | | $ | 36 | | $ | 28 | | $ | 18 | | $ | 14 | | $ | 27 | | $ | 166 | |
CG&E and subsidiaries | | 30 | | 34 | | 36 | | 10 | | 8 | | 7 | | 5 | | 4 | | 6 | | 40 | |
PSI | | 23 | | 31 | | 32 | | 11 | | 10 | | 9 | | 7 | | 6 | | 13 | | 56 | |
ULH&P | | 4 | | 4 | | 4 | | — | | — | | — | | — | | — | | — | | — | |
| | | | | | | | | | | | | | | | | | | | | | | | | | | | | | | | | | |
(1) The results of Cinergy also include amounts related to non-registrants. |
The results ofCinergy also include amounts related to non-registrants.
(2)Estimated minimum lease payments are immaterial.
(b)Capital Leases
In 2000 andeach of the years 1999 through 2004, CG&E,PSI, andULH&P entered into capital lease arrangementsagreements to fund the purchase of gas and electric meters.meters, and associated equipment. The lease terms are for 120 months commencing December 2000with the date of purchase and December 1999, respectively, with earlycontain buyout options atranging from 48 72, andto 105 months. Since theIt is our objective is to own the meters and associated equipment indefinitely and the operating companies plan to exercise the buyout option at month 105. TheAs of December 31, 2004, Cinergy’s effective interest rate on capital lease rate used to determine the monthly payments is 6.385% and 6.71% for 2000 and 1999, respectively.obligations outstanding was 5.5 percent. The meters and associated equipment are depreciated at the same rate as if they were owned by the operating companies.CG&E,PSI, andULH&P each recorded a capital lease obligation, included inNon-Current Liabilities-OtherNon-current liabilities—other.
Effective October 2000,CG&E entered into a capital lease agreement with a lease term of 120 months, to fund the purchase of equipment for the William H. Zimmer Station. The lease rate used to determine the monthly payments is a variable rate that is based upon the applicable LIBOR rate and was 8.275% at December 31, 2000. LIBOR is the rate at which the highest rated banks offer to lend to one another. Interest rates are frequently quoted as a spread to LIBOR. The equipment under the capital lease is depreciated at the same rate as if it was owned byCG&E.CG&E recorded a capital lease obligation, included inCurrent liabilities—other for $.9 million andNon-current liabilities—other for $8.4 million, which is the book value of the equipment at the beginning of the lease. The title to all equipment will transfer toCG&E at the end of the lease term. The capitalized lease obligation is amortized over the term of the lease.
153
The total minimum lease payments and the present values for these capital lease items are shown below:
| | Total Minimum Lease Payments
| |
|---|
| | Cinergy
| | CG&E and
subsidiaries
| | PSI
| | ULH&P
| |
|---|
| |
| | (in millions)
| |
| |
|---|
| Total minimum lease payments(1) | | $ | 46 | | $ | 31 | | $ | 15 | | $ | 6 | |
| Less: amount representing interest | | | (12 | ) | | (8 | ) | | (4 | ) | | (1 | ) |
| | |
| |
| |
| |
| |
| Present value of minimum lease payments | | $ | 34 | | $ | 23 | | $ | 11 | | $ | 5 | |
| | |
| |
| |
| |
| |
| | Total Minimum Lease Payments | |
| | Cinergy | | CG&E and subsidiaries | | PSI | | ULH&P | |
| | (in millions) | |
| | | | | | | | | |
Total minimum lease payments(1) | | $ | 79 | | $ | 49 | | $ | 30 | | $ | 11 | |
Less: amount representing interest | | (14 | ) | (9 | ) | (5 | ) | (2 | ) |
| | | | | | | | | |
Present value of minimum lease payments | | $ | 65 | | $ | 40 | | $ | 25 | | $ | 9 | |
(1) Annual minimum lease payments are immaterial. | |
Annual minimum lease payments are immaterial.7. Financial Instruments
(a)
In 1996,CG&E entered into a sale-leaseback agreement for certain equipment at Woodsdale Generating Station. The lease is a capital lease with an initial lease term of five years, which expires on October 31, 2001. At the end of this term, the lease may be renewed at mutually agreeable terms orCG&E may purchase the equipment at the original sale amount. The monthly lease payment is interest only and is based on the applicable LIBOR rate. The capital lease obligation will not be reduced over the initial lease term. The equipment under the capital lease is depreciated at the same rate as if it was owned byCG&E. CG&E recorded a capital lease obligation, included inNon-current liabilities—other for $22 million, which is the book value of the equipment at the beginning of the lease.Financial Derivatives
8. Financial Instruments
(a) Financial DerivativesWe have entered into financial derivative contracts for the purposes described below.purpose of managing financial instrument risk.
(i) Interest Rate Risk ManagementOur current policy inof managing exposure to fluctuations in interest rates is to maintain approximately 25%30 percent of the total amount of outstanding debt in floatingvariable interest rate debt instruments. To help maintainIn maintaining this level of exposure, we have previously and will consider in the future entering intouse interest rate swaps. Under thesethe swaps, we have agreedagree with other parties to exchange, at specified intervals, the difference between fixed-rate and floating-ratevariable-rate interest amounts calculated on an agreed notional amount.PSI had an interest rate swap agreement that expired on November 15, 2000, which had a notional amount of $100 million.CG&E has an outstanding interest rate swap agreement that decreased the percentage of floating ratevariable-rate debt. Under the seven-year agreement,provisions of the swap, which has a notional amount of $100 million,CG&E pays a fixed ratefixed-rate and receives a floating rate.variable-rate through October 2007. This swap will qualifyqualifies as a cash flow hedge under the provisions of Statement 133. As the terms of the swap agreement mirror the terms of the debt agreement that it is hedging, we anticipate that this swap will continue to be effective as a hedge. Future changesChanges in fair value of this swap will beare recorded inAccumulated other comprehensive income (loss). Cinergy Corp., beginning had three interest rate swaps with our adoptiona combined notional amount of $250 million which settled in September 2004. These swaps qualified as fair value hedges under the provisions of Statement 133 effective January 1, 2001.133.
Treasury locks are agreements that fix the yield or price on a specified treasury security for a specified period, which we sometimes use in connection with the issuance of fixed-rate debt. On September 23, 2002, CG&E issued $500 million principal amount senior unsecured debentures due September 15, 2012, with an interest rate of 5.70 percent. In July 2002, CG&E executed a treasury lock with a notional amount of $250 million, which was designated as a cash flow hedge of 50 percent of the forecasted interest payments on this debt offering. The treasury lock effectively fixed the benchmark interest rate (i.e., the treasury component of the interest rate, but not the credit spread) for 50 percent of the offering from July 2002 through the issuance date in order to reduce the exposure associated with treasury rate volatility. With the issuance of the debt, the treasury lock was settled. Given the use of hedge accounting, this settlement was reflected in other Accumulated other comprehensive income (loss) on an after-tax basis in the amount of $13 million, rather than a charge to net income. This amount will be reclassified to InterestExpense over the 10-year life of the related debt as interest is accrued.
See Note 1(k)(ii) for additional information on financial derivatives. In the future, we will continually monitor market conditions to evaluate whether to increase, or decrease,modify our leveluse of exposurefinancial derivative contracts to fluctuations in interest rates. See Note 1(l) on page 107 for further discussion of Statement 133.
(ii) Foreign Exchange Hedging Activity From time to time, we may utilize foreign exchange forward contracts and currency swaps to hedge foreign currency denominated purchase and sale commitments and certain of our net investments in foreign operations. These contracts and swaps allow us to potentially hedge our position against currency exchange rate fluctuations and would qualify as derivatives.manage financial instrument risk.
Cinergy has exposure to fluctuations in exchange rates between the U.S. dollar and the currencies of foreign countries where we have investments. When it is appropriate we will hedge our exposure to cash flow transactions, such as a dividend payment by one of our foreign subsidiaries. As of December 31, 2000, we do not believe we had a material exposure to the currency risk attributable to these investments and have no outstanding foreign currency derivatives.
154
(b)Fair Value of Other Financial Instruments
The estimated fair values of other financial instruments were as follows (this information does not claim to be a valuation of the companies as a whole):
| | December 31, 2000
| | December 31, 1999
|
|---|
Financial Instruments
| | Carrying
Amount
| | Fair
Value
| | Carrying
Amount
| | Fair
Value
|
|---|
| |
| | (in millions)
| |
|
|---|
| Cinergy | | | | | | | | | | | | |
| First mortgage bonds and other long-term debt (includes amounts reflected as long-term debt due within one year) | | $ | 2,917 | | $ | 2,950 | | $ | 3,020 | | $ | 2,820 |
CG&E and subsidiaries |
|
|
|
|
|
|
|
|
|
|
|
|
| First mortgage bonds and other long-term debt (includes amounts reflected as long-term debt due within one year) | | $ | 1,206 | | $ | 1,203 | | $ | 1,206 | | $ | 1,065 |
PSI |
|
|
|
|
|
|
|
|
|
|
|
|
| First mortgage bonds and other long-term debt (includes amounts reflected as long-term debt due within one year) | | $ | 1,113 | | $ | 1,136 | | $ | 1,243 | | $ | 1,215 |
ULH&P |
|
|
|
|
|
|
|
|
|
|
|
|
| Other long-term debt | | $ | 75 | | $ | 76 | | $ | 75 | | $ | 71 |
| | December 31, 2004 | | December 31, 2003 | |
Financial Instruments | | Carrying Amount | | Fair Value | | Carrying Amount | | Fair Value | |
| | (in millions) | |
| | | | | | | | | |
Cinergy(1) | | | | | | | | | |
First mortgage bonds and other long-term debt(2) | | $ | 4,448 | | $ | 4,710 | | $ | 4,971 | | $ | 5,297 | |
| | | | | | | | | |
CG&E and subsidiaries | | | | | | | | | |
First mortgage bonds and other long-term debt(2) | | $ | 1,594 | | $ | 1,641 | | $ | 1,569 | | $ | 1,582 | |
| | | | | | | | | |
PSI | | | | | | | | | |
First mortgage bonds and other long-term debt(2) | | $ | 1,874 | | $ | 1,999 | | $ | 1,720 | | $ | 1,861 | |
| | | | | | | | | |
ULH&P | | | | | | | | | |
Other long-term debt | | $ | 94 | | $ | 99 | | $ | 55 | | $ | 61 | |
(1) The results of Cinergy also include amounts related to non-registrants. | |
(2) Includes amounts reflected as Long-term debt due within one year. | |
The following methods and assumptions were used to estimate the fair values of each major class of instruments:
(i) Cash and cash equivalents, Restricted deposits, andNotes payable and other short-term obligations
Due to the short period to maturity, the carrying amounts reflected on the Balance Sheets approximate fair values.
(ii) Long-term debt
The fair values of long-term debt issues were estimated based on the latest quoted market prices or, if not listed on the New York Stock Exchange, on the present value of future cash flows. The discount rates used approximate the incremental borrowing costs for similar instruments.
(c)Concentrations of Credit Risk
Credit risk is the exposure to economic lossesloss that would occur as a result of nonperformance by counterparties, pursuant to the terms of their contractual obligations. Specific components of credit risk include counterparty default risk, collateral risk, concentration risk, and settlement risk.
(i) Trade Receivables and Physical Power Portfolio
Our concentration of credit risk with respect to Delivery's trade accounts receivable from electric and gas retail customers is limited. The large number of customers and diversified customer base of residential, commercial, and industrial customers significantly reduces our credit risk. Contracts within the physical portfolio of Commodities' power marketing and trading operations are primarily with the traditional electric cooperatives and municipalities and other investor-owned utilities. At December 31, 2000,2004, we do not believe we hadthe likelihood of significant exposure tolosses associated with credit risk within our trade accounts receivable within Delivery or our physical power portfolio within Commodities.is remote.
(ii) Energy Trading Credit Risk
Cinergy’s (ii) Power-Trading Contracts within the trading portfolioextension of the powercredit for energy marketing and trading operationsis governed by a Corporate Credit Policy. Written guidelines approved by Cinergy’s Risk Policy Committee document the management approval levels for credit
155
limits, evaluation of creditworthiness, and credit risk mitigation procedures. Exposures to credit risks are primarily with power marketers and other investor-owned utilities.monitored daily by the Corporate Credit Risk function, which is independent of all trading operations. As of December 31, 2000,2004, approximately 60%93 percent of the activity within the totalcredit exposure, net of credit collateral, related to energy trading portfolioand marketing activity was with 10 counterparties.counterparties rated investment grade or the counterparties’ obligations were guaranteed or secured by an investment grade entity. The majority of these contractsinvestment grade counterparties are externally rated. If a counterparty has an external rating, the lower of Standard & Poor’s or Moody’s Investors Service is used; otherwise, Cinergy’s internal rating of the counterparty is used. The remaining seven percent represents $59 million with counterparties rated non-investment grade.
As of December 31, 2004, CG&E had a concentration of trading credit exposure of approximately $45 million with two counterparties accounting for termsgreater than 10 percent of one year or less. Electric powerCG&E’s total trading credit exposure. These counterparties are rated investment grade.
Energy commodity prices can be extremely volatile and the market can, at times, lack liquidity. Because of these issues, credit
risk for energy commodities is generally greater than with other commodity trading, especially when dealing with new market entrants. Credit discounts are included in the determination of fair valuetrading.
We continually review and monitor our credit exposure to all counterparties and secondary counterparties. If appropriate, we may adjust our credit reserves to attempt to compensate for all open positions in the power-trading portfolio.
During the last quarter of 2000, the Western U.S., primarily California, began experiencing unprecedented price levels for wholesale electricity. Because of the nature of deregulation in California, the utilities have been unable to pass these price increases on to customers. Consequently, California's two largest utilities have accumulated significant unpaid obligations and are having difficulty obtaining capital. While we maintain a balanced Western U.S. portfolio and have no unrealized gain positions directly with these utilities, a large portion of such positions are with less than five power marketers. If prices continue at elevated levels or should these utilities be unable to fund their unpaid obligations, credit failures by power marketers could result. Given these issues, the fair values of our positions in the Western U.S. have been adjusted to reflect a higher level of credit discount. We have also been actively pursuing other forms of credit enhancement including, but not limited to, parent company guarantees and letters of credit from counterparties. In determining fair value for all derivative instruments, we consider the credit quality of each counterparty, contractual netting arrangements for longs and shorts with the same counterparty, and any security obtained. A significant portion of ourEnergy risk management assets andEnergy risk management liabilities—current are with counterparties in the Western U.S. Nonperformance by any of the Western U.S. counterparties could have a material effect on the operating results ofCinergy,CG&E, andPSI.
(iii) Gas-Trading As of December 31, 2000, approximately 50% of the activity within the physical gas marketing and trading portfolio represented commitments with 20 counterparties. Credit risk losses related to gas and other physical commodity and trading operations have not been significant. At December 31, 2000, theincreased credit risk within the gas and commodity trading portfolios was not believedindustry. Counterparty credit limits may be adjusted on a daily basis in response to be significant because of the characteristics of counterparties and customers with which transactions are executed.changes in a counterparty’s financial status or public debt ratings.
(iv) (iii) Financial Derivatives
Potential exposure to credit risk also exists from our use of financial derivatives such as currency swaps, foreign exchange forward contracts, and interest rate swaps.swaps and treasury locks. Because these financial instruments are transacted only with highly rated financial institutions, we do not anticipate nonperformance by any of the counterparties.
8. Notes Receivable
As discussed in Note 1(q)(i), Cinergy consolidated two previously unconsolidated SPEs effective July 1, 2003. As a result, Cinergy has approximately $214 million and $231 million of additional notes receivable as of December 31, 2004 and 2003, respectively, comprised of two separate notes.
The first note, with a December 31, 2004 balance of $101 million and a December 31, 2003 balance of $118 million, bears an effective interest rate of 7.81 percent and matures in August 2009. The second note, with a balance of $113 million as of December 31, 2004 and 2003, respectively, bears an effective interest rate of 9.23 percent and matures in December 2016.
The following table reflects the maturities of these notes as of December 31, 2004.
Notes Receivable Maturities | |
(in millions) | |
| | | |
2005 | | $ | 20 | |
2006 | | 22 | |
2007 | | 25 | |
2008 | | 29 | |
2009 | | 24 | |
Thereafter | | 94 | |
| | | |
Total | | $ | 214 | |
156
9. Pension and Other Postretirement Benefits
We provide benefits to retirees in the form of pensionsCinergy Corp. sponsors both pension and other postretirement benefits.benefit plans.
Our qualified defined benefit pension plans cover substantially all U.S.United States employees meeting certain minimum age and service requirements. During 2002, eligible Cinergy employees were offered the opportunity to make a one-time election, effective January 1, 2003, to either continue to have their pension benefit determined by the traditional defined benefit pension formula or to have their benefit determined using a cash balance formula. A similar election was provided to certain union employees at a later time.
The traditional defined benefit program utilizes a final average pay formula determines planto determine pension benefits. These plan benefits are based on:
•
- years of participation;
•
- age at retirement; and
•
- the applicable average Social Security wage
base or benefit amount.
base. Our
Benefits are accrued under the cash balance formula based upon a percentage of pension eligible earnings plus interest. In addition, participants with the cash balance formula may request a lump-sum cash payment upon termination of their employment, which may result in increased cash requirements from pension plan funding policyassets. At the effective time of the election, benefits ceased accruing under the traditional defined benefit pension formula for U.S. employees who elected the cash balance formula. There was no change to retirement benefits earned prior to the effective time of the election. The pension benefits of all non-union and certain union employees hired after December 31, 2002 are calculated using the cash balance formula. At December 31, 2004, approximately 80 percent of Cinergy’s employees remain in the traditional defined benefit program.
The introduction of the cash balance features to our defined benefit plans did not have a material effect on our financial position or results of operations.
Funding for the qualified defined benefit pension plans is to contribute at leastbased on actuarially determined contributions, the maximum of which is generally the amount deductible for tax purposes and the minimum being that required by the Employee Retirement Income Security Act of 1974, and up to the amount deductible for income tax purposes.as amended. The pension plans'plans’ assets consist of investments in equity and fixed incomedebt securities.
Cinergy’s investment strategy with respect to pension assets is designed to achieve a moderate level of overall portfolio risk in keeping with our desired risk objective, which is established through careful consideration of plan liabilities, plan funded status, and corporate financial condition. The portfolio’s target asset allocation is 60 percent equity and 40 percent debt with specified allowable ranges around these targets. Within the equity segment, we are broadly diversified across domestic, developed international, and emerging market equities, with the largest concentration being domestic. Further diversification is achieved through allocations to growth/value and small-, mid-, and large-cap equities. Within the debt segment, we principally maintain separate “core plus” and “core” portfolios. The “core plus” portfolio makes tactical use of the “plus” sectors (e.g., high yield, developed international, emerging markets, etc.) while the “core” portfolio is a domestic, investment grade portfolio. In late 2004, Cinergy commenced the implementation of an alternative investment strategy in its investment program. This strategy incorporates an investment in a fund of hedge funds in conjunction with an S&P 500 swaps and futures overlay program and will be classified as part of our large-cap United States equity allocation. Other than the alternative investment strategy, the use of derivatives is currently limited to collateralized mortgage obligations and asset-backed securities. Investment risk is measured and monitored on an ongoing basis through quarterly investment portfolio reviews, annual liability measurements, and periodic asset/liability studies.
157
Cinergy uses a September 30 measurement date for its defined benefit pension plans. The asset allocation at September 30, 2004 and 2003 by asset category was as follows:
| | Percentage of Fair Value of Plan Assets at September 30 | |
Asset Category | | 2004 | | 2003 | |
| | | | | |
Equity securities(1) | | 62% | | 62% | |
Debt securities(2) | | 38% | | 38% | |
(1) The portfolio’s target asset allocation is 60 percent equity with an allowable range of 50 percent to 70 percent.
(2) The portfolio’s target asset allocation is 40 percent debt with an allowable range of 30 percent to 50 percent.
In addition, Cinergy Corp. sponsors non-qualified pension plans (plans that do not meet the criteria for certain tax benefits) that cover officers, certain other key employees, and non-employee directors. We providebegan funding certain of these non-qualified plans through a rabbi trust in 1999. This trust, which consists of equity (65 percent) and debt (35 percent) securities at December 31, 2004, is not restricted to the payment of plan benefits and therefore, not considered plan assets under Statement 87. At December 31, 2004 and 2003, trust assets were approximately $10 million and $9 million, respectively, and are reflected in Cinergy’s Balance Sheets as Other investments.
In 2003 and 2002, Cinergy offered voluntary early retirement programs to certain individuals. In accordance with Statement of Financial Accounting Standards No. 88, Employers’ Accounting for Settlements and Curtailments of Defined Benefit Pension Plans and for Termination Benefits (Statement 88), Cinergy recognized expense of approximately $9 million and $39 million in 2003 and 2002, respectively.
Cinergy Corp. provides certain health care and life insurance benefits to retired U.S.United States employees and their eligible dependents. These benefits are subject to minimum age and service requirements. The health care benefits include medical coverage, dental coverage, and prescription drugs and are subject to certain limitations, such as deductibles and co-payments. NeitherCG&E norULH&P pre-fund their obligations for these postretirement benefits. In 1999,PSI began pre-funding its obligations through a grantor trust as authorized by the IURC.
In 2000,Cinergy offered early retirement plans This trust, which consists of equity (65 percent) and debt (35 percent) securities at December 31, 2004, is not restricted to certain individualsthe payment of plan benefits and therefore, not considered plan assets under a Limited Early Retirement Program (LERP). In accordance with Statement of Financial Accounting Standards No. 88,Employers' Accounting for Settlements106. At December 31, 2004 and Curtailments of Defined Benefit Pension Plans2003, trust assets were approximately $71 million and for Termination Benefits (Statement 88),Cinergy recognized a one-time expense of $12.8$64 million, respectively, and are reflected in 2000.Cinergy’s Balance Sheets as Other investments.
Based on preliminary estimates, we expect 2005 contributions of $72 million for qualified pension benefits. As discussed previously, we do not hold “plan assets” as defined by Statement 87 and Statement 106 for our non-qualified pension plans and other postretirement benefit costs, and therefore contributions are equal to the benefit payments presented in the following table.
The following estimated benefits payments, which reflect future service, are expected to be paid:
| | | | | | Other | |
| | Qualified Pension Benefits | | Non-Qualified Pension Benefits | | Postretirement Benefits | |
| | (in millions) | |
| | | | | | | |
2005 | | $ | 77 | | $ | 9 | | $ | 25 | |
2006 | | 76 | | 9 | | 26 | |
2007 | | 77 | | 9 | | 27 | |
2008 | | 78 | | 9 | | 28 | |
2009 | | 80 | | 11 | | 29 | |
Five years thereafter | | 443 | | 56 | | 162 | |
| | | | | | | | | | |
158
Our benefit plans'plans’ costs for the past three years as well as the actuarial assumptions used in determining these costs, included the following components:
| | Pension Benefits
| | Other Postretirement Benefits
| |
|---|
| | 2000
| | 1999
| | 1998
| | 2000
| | 1999
| | 1998
| |
|---|
| |
| |
| | (in millions)
| |
| |
| |
|---|
| Service cost | | $ | 27.4 | | $ | 24.8 | | $ | 21.8 | | $ | 3.4 | | $ | 3.5 | | $ | 4.1 | |
| Interest cost | | | 73.0 | | | 70.8 | | | 71.6 | | | 17.0 | | | 16.2 | | | 16.1 | |
| Expected return on plans' assets | | | (77.0 | ) | | (72.0 | ) | | (66.9 | ) | | — | | | — | | | — | |
| Amortization of transition (asset) obligation | | | (1.3 | ) | | (1.3 | ) | | (1.3 | ) | | 5.0 | | | 5.0 | | | 5.0 | |
| Amortization of prior service cost | | | 4.5 | | | 4.5 | | | 4.4 | | | — | | | — | | | — | |
| Recognized actuarial (gain) loss | | | (2.4 | ) | | 0.6 | | | — | | | — | | | 0.8 | | | 0.4 | |
| LERP Statement 88 cost | | | 11.9 | | | — | | | — | | | — | | | — | | | — | |
| | |
| |
| |
| |
| |
| |
| |
| Net periodic benefit cost | | $ | 36.1 | | $ | 27.4 | | $ | 29.6 | | $ | 25.4 | | $ | 25.5 | | $ | 25.6 | |
Actuarial assumptions: |
|
|
|
|
|
|
|
|
|
|
|
|
|
|
|
|
|
|
|
| | Discount rate | | | 7.50 | % | | 7.50 | % | | 6.75 | % | | 7.50 | % | | 7.50 | % | | 6.75 | % |
| | Rate of future compensation increase | | | 4.50 | | | 4.50 | | | 3.75 | | | N/A | | | N/A | | | N/A | |
| | Rate of return on plans' assets | | | 9.00 | | | 9.00 | | | 9.00 | | | N/A | | | N/A | | | N/A | |
For measurement purposes, we assumed an eight percent annual rate
| | Qualified | | Non-Qualified | | Other | |
| | Pension Benefits | | Pension Benefits | | Postretirement Benefits | |
| | 2004 | | 2003 | | 2002 | | 2004 | | 2003 | | 2002 | | 2004 | | 2003 | | 2002 | |
| | (in millions) | |
| | | | | | | | | | | | | | | | | | | |
Service cost | | $ | 35 | | $ | 31 | | $ | 27 | | $ | 5 | | $ | 3 | | $ | 3 | | $ | 5 | | $ | 4 | | $ | 3 | |
Interest cost | | 89 | | 86 | | 79 | | 7 | | 7 | | 5 | | 22 | | 23 | | 20 | |
Expected return on plans’ assets | | (81 | ) | (81 | ) | (86 | ) | — | | — | | — | | — | | — | | — | |
Amortization of transition (asset) obligation | | (1 | ) | (1 | ) | (1 | ) | — | | — | | — | | 1 | | 3 | | 5 | |
Amortization of prior service cost | | 5 | | 5 | | 6 | | 2 | | 1 | | 1 | | — | | — | | — | |
Recognized actuarial (gain) loss | | 2 | | — | | (6 | ) | 2 | | 2 | | 1 | | 8 | | 5 | | 1 | |
Voluntary early retirement costs (Statement 88) | | — | | 9 | | 39 | | — | | — | | — | | — | | — | | — | |
Net periodic benefit cost | | $ | 49 | | $ | 49 | | $ | 58 | | $ | 16 | | $ | 13 | | $ | 10 | | $ | 36 | | $ | 35 | | $ | 29 | |
| | | | | | | | | | | | | | | | | | | | | | | | | | | | | |
The net periodic benefit cost by registrant was as follows:
| | Qualified | | Non-Qualified | | Other | |
| | Pension Benefits | | Pension Benefits | | Postretirement Benefits | |
| | 2004 | | 2003 | | 2002 | | 2004 | | 2003 | | 2002 | | 2004 | | 2003 | | 2002 | |
| | (in millions) | | |
| | | | | | | | | | | | | | | | | | | |
Cinergy(1) | | $ | 49 | | $ | 49 | | $ | 58 | | $ | 16 | | $ | 13 | | $ | 10 | | $ | 36 | | $ | 35 | | $ | 29 | |
CG&E and subsidiaries | | 15 | | 10 | | 7 | | 1 | | 1 | | 1 | | 9 | | 9 | | 7 | |
PSI | | 13 | | 12 | | 12 | | 1 | | 1 | | 1 | | 20 | | 18 | | 15 | |
ULH&P | | 1 | | 1 | | 2 | | — | | — | | — | | 1 | | 1 | | — | |
| | | | | | | | | | | | | | | | | | | | | | | | | | | | |
(1) The results of increase in the per capita cost of covered health care benefits for 2001. It was assumed that the rate would decrease graduallyCinergy also include amounts related to five percent in 2008 and remain at that level thereafter.non-registrants.
159
The following table provides a reconciliation of the changes in the plans'plans’ benefit obligations and fair value of assets over the two-year period ended December 31, 2000,for 2004 and 2003, and a statement of the funded status as of December 31 offor both years.Cinergy uses a September 30 measurement date for its defined benefit pension plans and other postretirement benefit plans.
| | Pension Benefits
| | Other Postretirement Benefits
| |
|---|
| | 2000
| | 1999
| | 2000
| | 1999
| |
|---|
| |
| | (in millions)
| |
| |
|---|
| Change in benefit obligation | | | | | | | | | | | | | |
Benefit obligation at beginning of period |
|
$ |
1,002.0 |
|
$ |
1,052.1 |
|
$ |
234.4 |
|
$ |
246.5 |
|
Service cost |
|
|
27.4 |
|
|
24.8 |
|
|
3.4 |
|
|
3.5 |
|
| Interest cost | | | 73.0 | | | 70.8 | | | 17.0 | | | 16.2 | |
| Amendments(1) | | | 13.1 | | | 1.1 | | | — | | | — | |
| Actuarial (gain) loss | | | 12.0 | | | (90.3 | ) | | 6.7 | | | (18.4 | ) |
| Benefits paid | | | (63.0 | ) | | (56.5 | ) | | (14.4 | ) | | (13.4 | ) |
| | |
| |
| |
| |
| |
| Benefit obligation at end of period | | | 1,064.5 | | | 1,002.0 | | | 247.1 | | | 234.4 | |
Change in plan assets |
|
|
|
|
|
|
|
|
|
|
|
|
|
| Fair value of plan assets at beginning of period | | | 946.1 | | | 865.3 | | | — | | | — | |
| Actual return on plan assets | | | 160.5 | | | 137.3 | | | — | | | — | |
| Employer contribution | | | — | | | — | | | 14.4 | | | 13.4 | |
| Benefits paid | | | (63.0 | ) | | (56.5 | ) | | (14.4 | ) | | (13.4 | ) |
| | |
| |
| |
| |
| |
| Fair value of plan assets at end of period | | | 1,043.6 | | | 946.1 | | | — | | | — | |
Funded status |
|
|
(20.9 |
) |
|
(55.9 |
) |
|
(247.1 |
) |
|
(234.4 |
) |
| Unrecognized prior service cost | | | 36.6 | | | 39.9 | | | — | | | — | |
| Unrecognized net actuarial (gain) loss | | | (249.6 | ) | | (180.6 | ) | | 26.6 | | | 20.1 | |
| Unrecognized net transition (asset) obligation | | | (4.5 | ) | | (5.8 | ) | | 55.8 | | | 60.8 | |
| | |
| |
| |
| |
| |
| Accrued benefit cost at December 31 | | $ | (238.4 | ) | $ | (202.4 | ) | $ | (164.7 | ) | $ | (153.5 | ) |
| | | | | | | | | | Other | |
| | Qualified | | Non-Qualified | | Postretirement | |
| | Pension Benefits | | Pension Benefits | | Benefits | |
| | 2004 | | 2003 | | 2004 | | 2003 | | 2004 | | 2003 | |
| | (in millions) | |
| | | | | | | | | | | | | |
Change in benefit obligation | | | | | | | | | | | | | |
| | | | | | | | | | | | | |
Benefit obligation at beginning of period | | $ | 1,458 | | $ | 1,315 | | $ | 108 | | $ | 98 | | $ | 399 | | $ | 343 | |
| | | | | | | | | | | | | |
Service cost | | 35 | | 31 | | 5 | | 3 | | 5 | | 4 | |
Interest cost | | 88 | | 86 | | 7 | | 7 | | 22 | | 23 | |
Amendments(1) | | (1 | ) | — | | 8 | | — | | (24 | ) | (3 | ) |
Actuarial (gain) loss | | 69 | | 98 | | — | | 7 | | 27 | | 54 | |
Benefits paid | | (71 | ) | (72 | ) | (8 | ) | (7 | ) | (20 | ) | (22 | ) |
| | | | | | | | | | | | | |
Benefit obligation at end of period | | 1,578 | | 1,458 | | 120 | | 108 | | 409 | | 399 | |
| | | | | | | | | | | | | |
Change in plan assets | | | | | | | | | | | | | |
| | | | | | | | | | | | | |
Fair value of plan assets at beginning of period | | 877 | | 757 | | — | | — | | — | | — | |
| | | | | | | | | | | | | |
Actual return on plan assets | | 98 | | 118 | | — | | — | | — | | — | |
Employer contribution | | 117 | | 74 | | 8 | | 7 | | 20 | | 22 | |
Benefits paid | | (71 | ) | (72 | ) | (8 | ) | (7 | ) | (20 | ) | (22 | ) |
| | | | | | | | | | | | | |
Fair value of plan assets at end of period | | 1,021 | | 877 | | — | | — | | — | | — | |
| | | | | | | | | | | | | |
Funded status | | (557 | ) | (581 | ) | (120 | ) | (108 | ) | (409 | ) | (399 | ) |
| | | | | | | | | | | | | |
Unrecognized prior service cost | | 30 | | 36 | | 19 | | 13 | | (2 | ) | — | |
Unrecognized net actuarial loss | | 304 | | 256 | | 38 | | 43 | | 189 | | 176 | |
Unrecognized net transition (asset) obligation | | — | | (1 | ) | — | | — | | 4 | | 27 | |
Employer contribution | | — | | — | | 2 | | — | | 5 | | — | |
| | | | | | | | | | | | | |
Accrued benefit cost at December 31 | | $ | (223 | ) | $ | (290 | ) | $ | (61 | ) | $ | (52 | ) | $ | (213 | ) | $ | (196 | ) |
| | | | | | | | | | | | | |
Amounts recognized in balance sheets | | | | | | | | | | | | | |
| | | | | | | | | | | | | |
Accrued benefit liability | | $ | (366 | ) | $ | (366 | ) | $ | (109 | ) | $ | (101 | ) | $ | (213 | ) | $ | (196 | ) |
Intangible asset | | 30 | | 22 | | 19 | | 13 | | — | | — | |
Accumulated other comprehensive income (pre-tax) | | 113 | | 54 | | 29 | | 36 | | — | | — | |
| | | | | | | | | | | | | |
Net recognized at end of period | | $ | (223 | ) | $ | (290 | ) | $ | (61 | ) | $ | (52 | ) | $ | (213 | ) | $ | (196 | ) |
(1)The 2000 Amendments balance contains $11.9For 2003, the Qualified Pension Benefits includes approximately $9 million of LERPvoluntary early retirement expenses in accordance with Statement 88, as previously discussed.
The accumulated benefit obligation for the qualified defined benefit pension plans was approximately $1,387 million and approximately $1,237 million for 2004 and 2003, respectively. The accumulated benefit obligation for the non-qualified defined benefit pension plans was approximately $111 million and $102 million for 2004 and 2003, respectively.
160
The weighted-average assumptions used to determine benefit obligations were as follows:
| | Qualified
Pension Benefits | | Non-Qualified Pension
Benefits | | Other
Postretirement
Benefits | |
| | 2004 | | 2003 | | 2004 | | 2003 | | 2004 | | 2003 | |
| | | | | | | | | | | | | |
Discount rate | | 6.25 | % | 6.25 | % | 6.25 | % | 6.25 | % | 5.75 | % | 6.25 | % |
Rate of future compensation increase | | 4.00 | | 4.00 | | 4.00 | | 4.00 | | N/A | | N/A | |
The weighted-average assumptions used to determine net periodic benefit cost for the years ended December 31, 2004, 2003, and 2002 were as follows:
| | Qualified Pension Benefits | | Non-Qualified Pension Benefits | | Other Postretirement Benefits | |
| | 2004 | | 2003 | | 2002 | | 2004 | | 2003 | | 2002 | | 2004 | | 2003 | | 2002 | |
| | | | | | | | | | | | | | | | | | | |
Discount rate | | 6.25 | % | 6.75 | % | 7.50 | % | 6.25 | % | 6.75 | % | 7.50 | % | 6.25 | % | 6.75 | % | 7.50 | % |
Expected return on plans’ assets | | 8.50 | | 9.00 | | 9.25 | | N/A | | N/A | | N/A | | N/A | | N/A | | 3.00 | |
Rate of future compensation increase | | 4.00 | | 4.00 | | 4.00 | | 4.00 | | 4.00 | | 4.00 | | N/A | | N/A | | N/A | |
The calculation of Cinergy’s expected long-term rate of return is a two-step process. Capital market assumptions (e.g., forecasts) are first developed for various asset classes based on underlying fundamental and economic drivers of performance. Such drivers for equity and debt instruments include profit margins, dividend yields, and interest paid for use of capital. Risk premiums for each asset class are then developed based on factors such as expected illiquidity, credit spreads, inflation uncertainty and country/currency risk. Current valuation factors such as present interest and inflation rate levels underpin this process.
The assumptions are then modeled via a probability based multi-factor capital market methodology. Through this modeling process, a range of possible 10-year annualized returns are generated for each strategic asset class. Those returns falling at the 50th percentile are utilized in the calculation of Cinergy’s expected long-term rate of return.
The assumed health care cost trend rates were as follows:
| | 2004 | | 2003 | |
| | | | | |
Health care cost trend rate assumed for next year | | 8.00 | % | 9.00 | % |
Rate to which the cost trend rate is assumed to decline (the ultimate trend rate) | | 5.00 | % | 5.00 | % |
Year that the rate reaches the ultimate trend rate | | 2008 | | 2008 | |
Assumed health care cost trend rates have a significant effect on the amounts reported for the health care plans. A one-percentage-point change in assumed health care cost trend rates would have the following effects:
| | One-Percentage-
Point Increase
| | One-Percentage-
Point Decrease
| |
|---|
| | (in millions)
| |
|---|
| Effect on total of service and interest cost components | | $ | 3.1 | | $ | (2.7 | ) |
| Effect on postretirement benefit obligation | | | 33.8 | | | (29.2 | ) |
In addition, we sponsor non-qualified pension
| | One-Percentage- Point Increase | | One-Percentage- Point Decrease | |
| | (in millions) | |
| | | | | |
Effect on total of service and interest cost components | | $ | 4 | | $ | (3 | ) |
Effect on APBO | | 48 | | (43 | ) |
| | | | | | | |
On December 8, 2003, President Bush signed into law the Medicare Prescription Drug, Improvement and Modernization Act of 2003 (the Act). The Act introduced a prescription drug benefit to retirees as well as a federal subsidy to sponsors of retiree health care benefit plans (plans that do not meetprovide a prescription drug benefit that is actuarially equivalent to the criteriabenefit provided by Medicare. We believe that our coverage for tax benefits) that cover officers, certain other key employees, and non-employee directors. We began funding certain of these non-qualified plans through a rabbi trust in 1999.prescription drugs is at least
161
actuarially equivalent to the benefits provided by Medicare for most current retirees because our benefits for that group substantially exceed the benefits provided by Medicare, thereby allowing us to qualify for the subsidy. We have accounted for the subsidy as a reduction of our APBO. The pensionAPBO was reduced by approximately $17 million and will be amortized as an actuarial gain over future periods, thus reducing future benefit obligationscosts. The impact on our 2004 net periodic benefit cost was not material. Our accounting treatment for the subsidy is consistent with FASB Staff Position No. 106-2, Accounting and pension cost under these plans were as follows:
| | 2000
| | 1999
|
|---|
| | (in millions)
|
|---|
| Pension benefit obligation | | $ | 67.0 | | $ | 37.0 |
| Pension cost | | $ | 8.3 | | $ | 4.0 |
10. DispositionDisclosure Requirements Related to the Medicare Prescription Drug, Improvement and Modernization Act of Unconsolidated Subsidiary2003.
On July 15, 1999, we sold our 50% ownership interest
In January 2004, Cinergy announced to employees the creation of a new retiree Health Reimbursement Account (HRA) option, which will impact the postretirement healthcare benefits provided by Cinergy. HRAs are bookkeeping accounts that can be used to pay for qualified medical expenses after retirement. The majority of employees had the opportunity during the Fall of 2004 to make a one-time election to remain in Midlands Electricity plc (Midlands)Cinergy’s current retiree healthcare program or to GPU, Inc. In exchange for our interest in Midlands, we received 452.5 million pounds sterling (approximately $700 million)move to the new HRA option. Approximately 40 percent of Cinergy’s employees elected the new HRA option. The HRA option has no effect on current retirees receiving postretirement benefits from Cinergy. As a resultis the case under the current retiree health program, employees who participate in the HRA option, generally, will become eligible to receive their HRA benefit only upon retirement on or after the age of 50 with at least five years of service. We expect that the impact of the transaction, we realized a net contributionnew HRA option will not be material to earnings of approximately $.43 per share (basic and diluted), after deducting financing, transaction, and currencyour other postretirement benefit costs.
162
10. Income Taxes
The pro forma information presented below reflectsCinergy's net income and EPS without the investment in Midlands for 1999 and 1998.
| | Year Ended December 31
|
|---|
| | 1999
| | 1998
|
|---|
| | Net Income
| | EPS(1)
| | Net Income
| | EPS(2)
|
|---|
| | (in millions, except for earnings per share)
|
|---|
| Reported results | | $ | 404 | | $ | 2.54 | | $ | 261 | | $ | 1.65 |
Pro forma adjustments: |
|
|
|
|
|
|
|
|
|
|
|
|
| | Equity in earnings of Midlands | | | (58 | ) | | | | | (57 | ) | | |
| | Gain on sale of investment in Midlands | | | (99 | ) | | | | | — | | | |
| | Interest | | | 21 | | | | | | 43 | | | |
| | Income taxes | | | 40 | | | | | | (18 | ) | | |
| | |
| | | | |
| | | |
| Pro forma results | | $ | 308 | | $ | 1.94 | | $ | 229 | | $ | 1.45 |
(1)Represents basic EPS. Actual diluted EPS were $2.53, and pro forma diluted EPS were $1.93.(2)Both basic and diluted.
11. Income Taxes
The following table shows the significant components ofCinergy’s, Cinergy's, CG&E's&E’s, PSI’s, andULH&P’sPSI's net deferred income tax liabilities as of December 31, 2000,31:
| | Cinergy(1) | | CG&E and subsidiaries | | PSI | | ULH&P | |
| | 2004 | | 2003 | | 2004 | | 2003 | | 2004 | | 2003 | | 2004 | | 2003 | |
| | (in millions) | |
| | | | | | | | | | | | | | | | | |
Deferred Income Tax Liability | | | | | | | | | | | | | | | | | |
Property, plant, and equipment | | $ | 1,706 | | $ | 1,525 | | $ | 971 | | $ | 879 | | $ | 656 | | $ | 569 | | $ | 63 | | $ | 50 | |
Unamortized costs of reacquiring debt | | 15 | | 16 | | 6 | | 6 | | 9 | | 10 | | — | | — | |
Deferred operating expenses and carrying costs | | — | | 2 | | — | | 1 | | — | | — | | — | | — | |
Purchased power tracker | | 4 | | 4 | | — | | — | | 4 | | 4 | | — | | — | |
RTC | | 194 | | 204 | | 194 | | 204 | | — | | — | | — | | — | |
Net energy risk management assets | | 51 | | 10 | | 5 | | 10 | | — | | — | | — | | — | |
Amounts due from customers-income taxes | | 39 | | 47 | | 28 | | 26 | | 11 | | 22 | | 2 | | 4 | |
Gasification services agreement buyout costs | | 86 | | 86 | | — | | — | | 86 | | 86 | | — | | — | |
Other | | 32 | | 24 | | 19 | | 15 | | 7 | | — | | — | | 11 | |
| | | | | | | | | | | | | | | | | |
Total Deferred Income Tax Liability | | 2,127 | | 1,918 | | 1,223 | | 1,141 | | 773 | | 691 | | 65 | | 65 | |
| | | | | | | | | | | | | | | | | |
Deferred Income Tax Asset | | | | | | | | | | | | | | | | | |
Unamortized investment tax credits | | 39 | | 39 | | 29 | | 30 | | 11 | | 9 | | 1 | | 1 | |
Accrued pension and other postretirement benefit costs | | 222 | | 195 | | 60 | | 98 | | 65 | | 58 | | 5 | | 4 | |
Net energy risk management liabilities | | 28 | | 9 | | — | | — | | 28 | | 9 | | — | | — | |
Deferred operating expenses and carrying costs | | 26 | | — | | 9 | | — | | — | | — | | — | | — | |
Rural Utilities Service obligation | | 27 | | 28 | | — | | — | | 27 | | 28 | | — | | — | |
Tax credit carryovers | | 121 | | 47 | | — | | — | | — | | — | | — | | — | |
Other | | 67 | | 42 | | 34 | | 28 | | 4 | | 13 | | 1 | | 5 | |
| | | | | | | | | | | | | | | | | |
Total Deferred Income Tax Asset | | 530 | | 360 | | 132 | | 156 | | 135 | | 117 | | 7 | | 10 | |
| | | | | | | | | | | | | | | | | |
Net Deferred Income Tax Liability | | $ | 1,597 | | $ | 1,558 | | $ | 1,091 | | $ | 985 | | $ | 638 | | $ | 574 | | $ | 58 | | $ | 55 | |
| | | | | | | | | | | | | | | | | | | | | | | | | | |
(1) The results of Cinergy also include amounts related to non-registrants.
Cinergy and 1999:
| | Cinergy(1)
| | CG&E and subsidiaries
| | PSI
|
|---|
| | 2000
| | 1999
| | 2000
| | 1999
| | 2000
| | 1999
|
|---|
| | (in millions)
| | (in millions)
| | (in millions)
|
|---|
| Deferred Income Tax Liability | | | | | | | | | | | | | | | | | | |
| | Utility plant | | $ | 1,135.9 | | $ | 1,130.4 | | $ | 703.0 | | $ | 696.0 | | $ | 432.8 | | $ | 434.4 |
| | Unamortized costs of reacquiring debt | | | 18.2 | | | 20.9 | | | 8.1 | | | 10.5 | | | 10.1 | | | 10.4 |
| | Deferred operating expenses and carrying costs | | | 60.2 | | | 43.5 | | | 40.7 | | | 26.9 | | | 19.5 | | | 16.6 |
| | Amounts due from customers—income taxes | | | 96.2 | | | 95.6 | | | 91.2 | | | 91.6 | | | 5.0 | | | 4.0 |
| | Gasification services agreement buyout costs | | | 94.8 | | | 94.9 | | | — | | | — | | | 94.8 | | | 94.9 |
| | Other | | | 60.9 | | | 55.7 | | | 37.0 | | | 23.3 | | | 9.0 | | | 6.8 |
| | |
| |
| |
| |
| |
| |
|
| Total Deferred Income Tax Liability | | | 1,466.2 | | | 1,441.0 | | | 880.0 | | | 848.3 | | | 571.2 | | | 567.1 |
Deferred Income Tax Asset |
|
|
|
|
|
|
|
|
|
|
|
|
|
|
|
|
|
|
| | Unamortized investment tax credits | | | 56.1 | | | 53.6 | | | 42.8 | | | 37.3 | | | 13.2 | | | 16.3 |
| | Accrued pension and other benefit costs | | | 137.7 | | | 88.0 | | | 67.5 | | | 34.3 | | | 39.8 | | | 26.9 |
| | Net energy risk management liabilities | | | 24.6 | | | 32.3 | | | 6.1 | | | 11.5 | | | 18.5 | | | 20.9 |
| | Rural Utilities Service (RUS) obligation | | | 28.2 | | | 30.7 | | | — | | | — | | | 28.2 | | | 30.7 |
| | Other | | | 33.6 | | | 61.6 | | | 27.8 | | | 45.0 | | | 12.9 | | | 11.6 |
| | |
| |
| |
| |
| |
| |
|
| Total Deferred Income Tax Asset | | | 280.2 | | | 266.2 | | | 144.2 | | | 128.1 | | | 112.6 | | | 106.4 |
| | |
| |
| |
| |
| |
| |
|
Net Deferred Income Tax Liability |
|
$ |
1,186.0 |
|
$ |
1,174.8 |
|
$ |
735.8 |
|
$ |
720.2 |
|
$ |
458.6 |
|
$ |
460.7 |
(1)Cinergy's net deferred income tax liability also includes the effects of foreign non-registrant subsidiaries' activity.
We willits subsidiaries file a consolidated federal income tax return forand combined/consolidated state and local tax returns in certain jurisdictions. Cinergy and its subsidiaries have an income tax allocation agreement, which conforms to the year ended December 31, 2000.requirements of the PUHCA. The currentcorporate taxable income method is used to allocate tax benefits to the subsidiaries whose investments or results of operations provide those tax benefits. Any tax liability not directly attributable to a specific subsidiary is allocated proportionately among the members ofsubsidiaries as required by theCinergy consolidated group pursuant to a tax sharing agreement filed with the SEC under the PUHCA. agreement.
163
The following table summarizes federal and state income taxes charged (credited) to income forCinergy, CG&E, PSI, andULH&PPSI:
| | Cinergy
| | CG&E and subsidiaries
| | PSI
| |
|---|
| | 2000
| | 1999
| | 1998
| | 2000
| | 1999
| | 1998
| | 2000
| | 1999
| | 1998
| |
|---|
| | (in millions)
| | (in millions)
| | (in millions)
| |
|---|
| Current Income Taxes | | | | | | | | | | | | | | | | | | | | | | | | | | | | |
| | Federal | | $ | 187.3 | | $ | 114.0 | | $ | 209.0 | | $ | 121.5 | | $ | 137.3 | | $ | 151.7 | | $ | 84.4 | | $ | (30.6 | ) | $ | 69.8 | |
| | State | | | 16.9 | | | (1.5 | ) | | 16.9 | | | 1.6 | | | 4.0 | | | 3.9 | | | 10.8 | | | (3.1 | ) | | 10.5 | |
| | |
| |
| |
| |
| |
| |
| |
| |
| |
| |
Total Current
Income Taxes | | | 204.2 | | | 112.5 | | | 225.9 | | | 123.1 | | | 141.3 | | | 155.6 | | | 95.2 | | | (33.7 | ) | | 80.3 | |
Deferred Income Taxes |
|
|
|
|
|
|
|
|
|
|
|
|
|
|
|
|
|
|
|
|
|
|
|
|
|
|
|
|
| | Federal | | | | | | | | | | | | | | | | | | | | | | | | | | | | |
| | | Depreciation and other utility plant-related items | | | 26.1 | | | 24.0 | | | 25.3 | | | 19.0 | | | 13.8 | | | 14.7 | | | 7.1 | | | 10.2 | | | 10.7 | |
| | | Pension and other benefit costs | | | (21.3 | ) | | (10.5 | ) | | (3.3 | ) | | (7.5 | ) | | (5.3 | ) | | 5.0 | | | (11.5 | ) | | (5.0 | ) | | (1.9 | ) |
| | | RUS obligations | | | — | | | — | | | (22.5 | ) | | — | | | — | | | — | | | — | | | — | | | (22.5 | ) |
| | | Unrealized energy risk management losses | | | 10.9 | | | (5.1 | ) | | (49.4 | ) | | 5.6 | | | (11.6 | ) | | (25.2 | ) | | 2.0 | | | 6.5 | | | (24.2 | ) |
| | | Fuel costs | | | 28.7 | | | 4.3 | | | (1.0 | ) | | 26.7 | | | 2.7 | | | (1.5 | ) | | 2.0 | | | 1.6 | | | .5 | |
| | | Gasification services agreement buyout costs | | | (0.1 | ) | | 83.6 | | | — | | | — | | | — | | | — | | | (0.1 | ) | | 83.6 | | | — | |
| | | Other items—net | | | 11.0 | | | (5.1 | ) | | (40.8 | ) | | (3.0 | ) | | 8.3 | | | (13.7 | ) | | (1.2 | ) | | (4.5 | ) | | (10.6 | ) |
| | |
| |
| |
| |
| |
| |
| |
| |
| |
| |
| Total Deferred Federal Income Taxes | | | 55.3 | | | 91.2 | | | (91.7 | ) | | 40.8 | | | 7.9 | | | (20.7 | ) | | (1.7 | ) | | 92.4 | | | (48.0 | ) |
| | | State | | | 1.7 | | | 14.2 | | | (7.4 | ) | | 1.5 | | | .6 | | | (.4 | ) | | (1.4 | ) | | 13.6 | | | (5.8 | ) |
| | |
| |
| |
| |
| |
| |
| |
| |
| |
| |
| Total Deferred Income Taxes | | | 57.0 | | | 105.4 | | | (99.1 | ) | | 42.3 | | | 8.5 | | | (21.1 | ) | | (3.1 | ) | | 106.0 | | | (53.8 | ) |
Investment Tax Credits—Net |
|
|
(9.6 |
) |
|
(9.2 |
) |
|
(9.6 |
) |
|
(6.0 |
) |
|
(6.1 |
) |
|
(6.2 |
) |
|
(3.6 |
) |
|
(3.1 |
) |
|
(3.4 |
) |
| | |
| |
| |
| |
| |
| |
| |
| |
| |
| |
Total Income Taxes |
|
$ |
251.6 |
|
$ |
208.7 |
|
$ |
117.2 |
|
$ |
159.4 |
|
$ |
143.7 |
|
$ |
128.3 |
|
$ |
88.5 |
|
$ |
69.2 |
|
$ |
23.1 |
|
| | Cinergy(1) | | CG&E and subsidiaries | | PSI | | ULH&P | |
| | 2004 | | 2003 | | 2002 | | 2004 | | 2003 | | 2002 | | 2004 | | 2003 | | 2002 | | 2004 | | 2003 | | 2002 | |
| | (in millions) | |
| | | | | | | | | | | | | | | | | | | | | | | | | |
Current Income Taxes | | | | | | | | | | | | | | | | | | | | | | | | | |
Federal | | $ | 78 | | $ | 34 | | $ | 16 | | $ | 88 | | $ | 84 | | $ | 50 | | $ | 52 | | $ | 45 | | $ | 71 | | $ | 3 | | $ | 1 | | $ | 3 | |
State | | 30 | | 25 | | (4 | ) | 17 | | 12 | | 1 | | 11 | | 17 | | 10 | | — | | 1 | | 6 | |
Total Current Income Taxes | | 108 | | 59 | | 12 | | 105 | | 96 | | 51 | | 63 | | 62 | | 81 | | 3 | | 2 | | 9 | |
| | | | | | | | | | | | | | | | | | | | | | | | | |
Deferred Income Taxes | | | | | | | | | | | | | | | | | | | | | | | | | |
Federal | | | | | | | | | | | | | | | | | | | | | | | | | |
Depreciation and other property, plant, and equipment-related items | | 126 | | 130 | | 172 | | 76 | | 74 | | 74 | | 61 | | 41 | | 80 | | 7 | | 8 | | 3 | |
Pension and other postretirement benefit costs | | (29 | ) | 23 | | (17 | ) | — | | 10 | | (5 | ) | (14 | ) | 7 | | (7 | ) | — | | — | | — | |
Unrealized energy risk management transactions | | 26 | | 6 | | 9 | | 13 | | 5 | | 2 | | 1 | | 1 | | (3 | ) | — | | — | | — | |
Fuel costs | | (48 | ) | 7 | | (23 | ) | (27 | ) | 5 | | 9 | | (21 | ) | 3 | | (32 | ) | (1 | ) | — | | (1 | ) |
Purchased power tracker | | 4 | | (5 | ) | 2 | | 5 | | — | | — | | (1 | ) | (7 | ) | 2 | | — | | — | | — | |
Gasification services agreement buyout costs | | — | | (3 | ) | (3 | ) | — | | — | | — | | — | | (3 | ) | (3 | ) | — | | — | | — | |
Tax credit carryovers | | (74 | ) | (47 | ) | — | | — | | — | | — | | — | | — | | — | | — | | — | | — | |
Other-net | | 3 | | (40 | ) | (14 | ) | (7 | ) | (20 | ) | 8 | | 13 | | (8 | ) | (8 | ) | — | | (2 | ) | 1 | |
| | | | | | | | | | | | | | | | | | | | | | | | | |
Total Deferred Federal Income Taxes | | 8 | | 71 | | 126 | | 60 | | 74 | | 88 | | 39 | | 34 | | 29 | | 6 | | 6 | | 3 | |
| | | | | | | | | | | | | | | | | | | | | | | | | |
State | | (4 | ) | 22 | | 30 | | (1 | ) | 13 | | 21 | | 13 | | 8 | | 8 | | 1 | | 2 | | — | |
| | | | | | | | | | | | | | | | | | | | | | | | | |
Total Deferred Income Taxes | | 4 | | 93 | | 156 | | 59 | | 87 | | 109 | | 52 | | 42 | | 37 | | 7 | | 8 | | 3 | |
| | | | | | | | | | | | | | | | | | | | | | | | | |
Investment Tax Credits-Net | | (8 | ) | (8 | ) | (8 | ) | (5 | ) | (5 | ) | (5 | ) | (3 | ) | (3 | ) | (3 | ) | — | | — | | — | |
| | | | | | | | | | | | | | | | | | | | | | | | | |
Total Income Taxes | | $ | 104 | | $ | 144 | | $ | 160 | | $ | 159 | | $ | 178 | | $ | 155 | | $ | 112 | | $ | 101 | | $ | 115 | | $ | 10 | | $ | 10 | | $ | 12 | |
(1) The following table presents a reconciliationresults of federal income taxes (which are calculated by multiplying the statutory federal income tax rate by book income before federal income tax)Cinergy also include amounts related to thenon-registrants.
Internal Revenue Code (IRC) Section 29 provides a tax credit (nonconventional fuel source credit) for qualified fuels produced and sold by a taxpayer to an unrelated person during the taxable year. The nonconventional fuel source credit reduced current federal income tax expense reported in the Consolidated Statements of Incomeapproximately $98 million, $84 million, and $42 million for 2004, 2003, and 2002, respectively. See Note 11(c)(ivCinergy, CG&E, andPSI.
| | Cinergy
| | CG&E and subsidiaries
| | PSI
| |
|---|
| | 2000
| | 1999
| | 1998
| | 2000
| | 1999
| | 1998
| | 2000
| | 1999
| | 1998
| |
|---|
| |
| | (in millions)
| |
| |
| | (in millions)
| |
| |
| | (in millions)
| |
| |
|---|
| Statutory federal income tax provision | | $ | 221.3 | | $ | 209.9 | | $ | 129.0 | | $ | 148.1 | | $ | 130.4 | | $ | 119.2 | | $ | 75.1 | | $ | 61.6 | | $ | 24.7 | |
| Increases (Reductions) in taxes resulting from: | | | | | | | | | | | | | | | | | | | | | | | | | | | | |
| | Amortization of investment tax credits | | | (9.6 | ) | | (9.2 | ) | | (9.6 | ) | | (6.0 | ) | | (6.1 | ) | | (6.2 | ) | | (3.6 | ) | | (3.1 | ) | | (3.4 | ) |
| | Depreciation and other utility plant-related differences | | | 17.7 | | | 14.4 | | | 10.4 | | | 14.0 | | | 11.6 | | | 9.0 | | | 3.6 | | | 2.8 | | | 1.5 | |
| | Preferred dividend requirements of subsidiaries | | | 1.6 | | | 1.9 | | | 2.3 | | | — | | | — | | | — | | | — | | | — | | | — | |
| | Foreign tax adjustments | | | — | | | (15.5 | ) | | (20.0 | ) | | — | | | — | | | — | | | — | | | — | | | — | |
| Other—net | | | 2.0 | | | (5.5 | ) | | (4.4 | ) | | 0.2 | | | 3.2 | | | 2.8 | | | 4.0 | | | (2.6 | ) | | (4.4 | ) |
| | |
| |
| |
| |
| |
| |
| |
| |
| |
| |
| Federal income tax expense | | $ | 233.0 | | $ | 196.0 | | $ | 107.7 | | $ | 156.3 | | $ | 139.1 | | $ | 124.8 | | $ | 79.1 | | $ | 58.7 | | $ | 18.4 | |
| | |
| |
| |
| |
| |
| |
| |
| |
| |
| |
The following table shows the significant components ofULH&P's net deferred income) for further information on this tax liability as of December 31, 2000, and 1999:
| | ULH&P
|
|---|
| | 2000
| | 1999
|
|---|
| | (in thousands)
|
|---|
| Deferred Income Tax Liability | | | | | | |
| | Utility plant | | $ | 32,674 | | $ | 34,903 |
| | Unamortized costs of reacquiring debt | | | 747 | | | 1,356 |
| | Deferred fuel costs | | | 6,934 | | | — |
| | Other | | | 3,620 | | | 2,062 |
| | |
| |
|
| Total Deferred Income Tax Liability | | | 43,975 | | | 38,321 |
Deferred Income Tax Asset |
|
|
|
|
|
|
| | Unamortized investment tax credits | | | 1,309 | | | 1,608 |
| | Amounts due to customers—income taxes | | | 2,627 | | | 4,618 |
| | Deferred fuel costs | | | — | | | 949 |
| | Accrued pension and other benefit costs | | | 2,660 | | | 2,282 |
| | Other | | | 1,557 | | | 5,864 |
| | |
| |
|
| Total Deferred Income Tax Asset | | | 8,153 | | | 15,321 |
Net Deferred Income Tax Liability |
|
$ |
35,822 |
|
$ |
23,000 |
| | |
| |
|
credit.
The following table summarizes federal and state income taxes charged (credited) to income forULH&P:
| | ULH&P
| |
|---|
| | 2000
| | 1999
| | 1998
| |
|---|
| | (in thousands)
| |
|---|
| Current Income Taxes | | | | | | | | | | |
| | Federal | | $ | 5,003 | | $ | 8,668 | | $ | 6,699 | |
| | State | | | (129 | ) | | 2,253 | | | 1,336 | |
| | |
| |
| |
| |
| Total Current Income Taxes | | | 4,874 | | | 10,921 | | | 8,035 | |
Deferred Income Taxes |
|
|
|
|
|
|
|
|
|
|
| | Federal | | | | | | | | | | |
| | | Depreciation and other utility plant-related items | | | 1,059 | | | 831 | | | 420 | |
| | | Pension and other benefit costs | | | (605 | ) | | 40 | | | 319 | |
| | | Fuel costs | | | 8,564 | | | (1,385 | ) | | 820 | |
| | | Unamortized costs of reacquiring debt | | | (30 | ) | | (39 | ) | | (58 | ) |
| | | Service company allocations | | | 251 | | | 324 | | | (1,376 | ) |
| | | Other items-net | | | (338 | ) | | (155 | ) | | (415 | ) |
| | |
| |
| |
| |
| Total Deferred Federal Income Taxes | | | 8,901 | | | (384 | ) | | (290 | ) |
Deferred State Income Taxes |
|
|
303 |
|
|
(76 |
) |
|
308 |
|
| | |
| |
| |
| |
| Total Deferred Income Taxes | | | 9,204 | | | (460 | ) | | 18 | |
Investment Tax Credits—Net |
|
|
(277 |
) |
|
(277 |
) |
|
(279 |
) |
| | |
| |
| |
| |
| Total Income Taxes | | $ | 13,801 | | $ | 10,184 | | $ | 7,774 | |
164
The following table presents a reconciliation of federal income taxes (which are calculated by multiplying the statutory federal income tax rate by book income before federal income tax) to the federal income tax expense reported in the StatementStatements of Income forCinergy, CG&E, PSI, and ULH&P.
| | ULH&P
| |
|---|
| | 2000
| | 1999
| | 1998
| |
|---|
| | (in thousands)
| |
|---|
| Statutory federal income tax provision | | $ | 13,391 | | $ | 7,098 | | $ | 6,937 | |
| Increases (Reductions) in taxes resulting from: | | | | | | | | | | |
| | Amortization of investment tax credits | | | (277 | ) | | (277 | ) | | (279 | ) |
| | Depreciation and other utility plant-related differences | | | 830 | | | 94 | | | (168 | ) |
| | Other—net | | | (317 | ) | | 1,092 | | | (360 | ) |
| | |
| |
| |
| |
| Federal income tax expense | | $ | 13,627 | | $ | 8,007 | | $ | 6,130 | |
| | |
| |
| |
| |
| | Cinergy(1) | | CG&E and subsidiaries | | PSI | | ULH&P | |
| | 2004 | | 2003 | | 2002 | | 2004 | | 2003 | | 2002 | | 2004 | | 2003 | | 2002 | | 2004 | | 2003 | | 2002 | |
| | (in millions) | |
| | | | | | | | | | | | | | | | | | | | | | | | | |
Statutory federal income tax provision | | $ | 167 | | $ | 186 | | $ | 186 | | $ | 140 | | $ | 158 | | $ | 139 | | $ | 89 | | $ | 73 | | $ | 109 | | $ | 9 | | $ | 9 | | $ | 6 | |
Increases (reductions) in taxes resulting from: | | | | | | | | | | | | | | | | | | | | | | | | | |
Amortization of investment tax credits | | (8 | ) | (8 | ) | (8 | ) | (5 | ) | (5 | ) | (5 | ) | (3 | ) | (3 | ) | (3 | ) | — | | — | | — | |
Depreciation and other property, plant, and equipment-related differences | | 8 | | 4 | | — | | 4 | | 1 | | 1 | | 4 | | 4 | | (1 | ) | — | | (2 | ) | — | |
Preferred dividend requirements of subsidiaries | | 1 | | 1 | | 1 | | — | | — | | — | | — | | — | | — | | — | | — | | — | |
Income tax credits | | (97 | ) | (84 | ) | (42 | ) | — | | — | | — | | — | | — | | — | | — | | — | | — | |
Foreign tax adjustments | | 4 | | 5 | | 3 | | — | | — | | — | | — | | — | | — | | — | | — | | — | |
Employee SOP dividend | | (7 | ) | (6 | ) | (3 | ) | — | | — | | — | | — | | — | | — | | — | | — | | — | |
Other-net | | 10 | | (1 | ) | (3 | ) | 4 | | (1 | ) | (2 | ) | (2 | ) | 2 | | (8 | ) | — | | — | | — | |
| | | | | | | | | | | | | | | | | | | | | | | | | |
Federal Income Tax Expense | | $ | 78 | | $ | 97 | | $ | 134 | | $ | 143 | | $ | 153 | | $ | 133 | | $ | 88 | | $ | 76 | | $ | 97 | | $ | 9 | | $ | 7 | | $ | 6 | |
12. Commitments and Contingencies
(a) Construction and Other Commitments Forecasted construction and other committed expenditures for the year 2001 and for the five-year period 2001-2005 (in nominal dollars) are presented in the table below:
| | 2001
| | 2001-2005
|
|---|
| | (in millions)
|
|---|
| Cinergy(1) | | $ | 1,467 | | $ | 4,635 |
| CG&E and subsidiaries | | | 423 | | | 1,676 |
| PSI | | | 406 | | | 2,264 |
| ULH&P | | | 37 | | | 178 |
- (1)
- The results ofCinergy also include amounts related to non-registrants.
165
This forecast includes an estimate of expenditures in accordance with the companies' plans regarding nitrogen oxide (NOX) emission control standards11. Commitments and other environmental compliance (excluding implementation of the tentative EPA Agreement), as discussed below. Approximately $210 million is estimated to be spent in 2001 and approximately $789 million is estimated to be spent between 2001 and 2005. This forecast also includes expenditures for the pending purchase of two natural gas-fired merchant electric generating facilities from Enron North America with a total combined capacity of 998 megawatts (MW), the acquisition of an interest in a gas distribution business in Athens, Greece, and other committed investments.Contingencies
(a)Environmental
(b)(i) Ozone Transport RulemakingRulemakings
In June 1997,October 1998, the Ozone Transport Assessment Group, which consisted of 37 states, made a wide range of recommendations to the U.S.United States Environmental Protection Agency (EPA) to address the impact of ozone transport on serious non-attainment areas (geographic areas defined by the EPA as non-compliant with ozone standards) in the Northeast, Midwest, and South. Ozone transport refers to wind-blown movement of ozone and ozone-causing materials across city and state boundaries. In late 1997, the EPA published a proposed call for revisions to State Implementation Plans (SIPs). SIP is an acronym for a state's implementation plan for achieving emissions reductions to address air quality concerns. The EPA must approve all SIPs.
NOX SIP Call In October 1998, the EPA finalized its ozone transport rule, also known as the NOnitrogen oxides (NOX SIP Call. It applied) State Implementation Plan (SIP) Call, which addresses wind-blown ozone and ozone precursors that impact air quality in downwind states. The EPA’s final rule, which applies to 22 states in the eastern half of the U.S.,United States including the three states in which our electric utilities operate, and also proposed a model NOX emission allowance trading program. This rule recommendedrequired states to develop rules to reduce NOX emissions primarily from utility and industrial and utilitysources. In a related matter, in response to petitions filed by several states alleging air quality impacts from upwind sources located in other states, the EPA issued a rule pursuant to a certain level by May 2003. The EPA gave the affected states until September 30, 1999 to incorporate NOX reductions and, at the discretionSection 126 of the state, a NOX trading program into their SIPs. The EPA proposedClean Air Act (CAA) that required reductions similar to implement a federal plan to accomplish the equivalent NOX reductions by May 2003 if states failed to revise their SIPs.
Ohio, Indiana, a number of other states, and various industry groups (some of which we are a member), filed legal challenges tothose required under the NOX SIP CallCall. Various states and industry groups challenged the final rules in late 1998. On May 25, 1999, the U.S. Circuit Court of Appeals for the District of Columbia (Court of Appeals) granted a request for a deferralCircuit, but the court upheld the key provisions of the rule and indefinitely suspended the September 30 filing deadline, pending further review by the Court of Appeals.rules.
In March 2000, the Court of Appeals substantially upheld the EPA's rule. On April 11, 2000, theThe EPA asked the Court of Appeals to remove its May 25, 1999, suspensionhas proposed withdrawal of the Section 126 rule in states with approved rules under the final NOX SIP Call, which includes Indiana, Kentucky, and also directedOhio. All three states have adopted a cap and trade program as the mechanism to submit SIP revisions by September 1, 2000. On April 17, 2000,achieve the required reductions. Cinergy, CG&E, and PSI have installed selective catalytic reduction units (SCR) and other pollution controls and implemented certain combustion improvements at various states and industry groups (some of which we are a member) filed a requestgenerating stations to comply with the Court of Appeals for a rehearing of the NOX SIP Call decisions. On April 24, 2000, the same group filed a request with the Court of Appeals to require a rulemaking and a comment period to determine a new compliance date. TheCall. Cinergy
states also filed a request to obtain more time to file their SIPs. On June 23, 2000, the Court of Appeals denied both requests and directed the states to submit their SIP revisions by October 30, 2000. The states of Indiana, Kentucky, and Ohio subsequently submitted letters stating their intent to revise their SIPs in response toutilizes the NOX SIP Call.
In August 2000, the Court of Appeals extended the May 1, 2003 deadline for NOX reductions to May 31, 2004. The states and other groups appealed the Court of Appeals ruling to the U.S. Supreme Court.
On September 25, 2000,Cinergy announced a plan to invest approximately $700 million in pollution control equipment and other methods to reduce NOX emissions. This expected investment includes the following:
•install up to 11 selective catalytic reduction units (SCRs) at several different generating stations;•install other pollution control technologies, including new computer software, at all generating stations;•make combustion improvements; and•utilizeemission allowance market opportunities to buy andor sell NOX allowances.
SCRs are the most proven technologyemission allowances as appropriate. We currently available for reducing NOX emissions producedestimate that we will incur capital costs of approximately $23 million in coal-fired generating stations.addition to $777 million already incurred to comply with this program.
(ii) Section 126 Petitions
In February 1998,March 2004, the northeast statesstate of North Carolina filed petitions seeking the EPA's assistance in reducing ozone in the eastern U.S.a petition under Section 126 of the Clean Air Act (CAA). The EPA believes that Section 126 petitions allow a state to claimCAA in which it alleges that sources in another state are contributing13 upwind states including Ohio, Indiana, and Kentucky, significantly contribute to itsNorth Carolina’s non-attainment with certain ambient air quality problemstandards. Depending on the EPA’s final disposition of the pending petition and request that the EPA require the upwind sourcesits proposal discussed previously, Cinergy’s generating stations could become subject to reduce their emissions.
In December 1999, the EPA granted four Section 126 petitions relating to NOrequirements for additional sulfur dioxide (SOX2 emissions. This ruling affected all of our Ohio) and Kentucky facilities, as well as some of our Indiana facilities, and requires us to reduce our NOX emissions toreductions. We expect a certain leveldecision from the EPA on this matter by May 2003. The EPA's action grantingAugust 2005. It is unclear at this time whether any additional reductions would be necessary beyond those required under the Section 126 petitions was appealed toCAA.
(iii) Clean Air Act Lawsuit
In November 1999, and through subsequent amendments, the United States brought a lawsuit in the United States Federal District Court of Appeals. Oral arguments were held in this case on December 15, 2000. A final decision is expected some time withinfor the next few months.
State Ozone Plans On November 15, 1999, the StateSouthern District of Indiana (District Court) against Cinergy, CG&E, and the Commonwealth of Kentucky (along with Jefferson County, Kentucky) jointly filed an amendment to their attainment demonstration on how they intend to bring the greater Louisville area, including Floyd and Clark Counties in Indiana, into attainment with the one-hour ozone standard. The SIP amendments call for, among other things, statewide NOX reductions from utilities in Indiana, Kentucky, and surrounding states which are less stringent than the EPA's NOX SIP Call. Indiana and Kentucky committed to adopt utility NOX control rules by December 2000, that would require controls be installed by May 2003. However, Indiana, halted the rulemaking for NOX controls at this level, but continues to develop NOX SIP Call level reduction regulations. Kentucky did complete their rulemaking, but has issued a notice of intent to revise the rules to change the compliance deadline to mirror the NOX SIP Call (May 31, 2004).PSI
See section (e) below for a discussion alleging various violations of the tentative EPA settlement, which relates to matters discussed within this note.
(c)CAA. Specifically, the lawsuit alleges that we violated the CAA by not obtaining Prevention of Significant Deterioration (PSD), Non-Attainment New Source Review (NSR) The CAA's NSR provisions require, and Ohio and Indiana SIP permits for various projects at our owned and co-owned generating stations. Additionally, the suit claims that a company obtain a pre-construction permit if it plans to build a new stationary source of pollution or make a major change towe violated an existing facility unless the changes are exempt. In JulyAdministrative Consent Order entered into in 1998 between the EPA requested comments on proposed revisions to the NSR rules that would change NSR applicability by eliminating exemptions contained in the current regulation.
Since July 1999,CG&E andPSI have received requests from the EPA (Region 5), under Section 114 of the CAA, seeking documents and information regarding capital and maintenance expenditures at several of their respective generating stations. These activities were part of an industry-wide investigation assessing compliance with the NSR and the New Source Performance Standards (NSPS) of the CAA at electric generating stations.
On September 15, 1999, November 3, 1999, and February 2, 2001, the Attorney General's of New York, Connecticut, and New Jersey, respectively, issued letters notifyingCinergy andCG&E of their intent relating to sue under the citizens' suit provisions of the CAA. These states alleged violations of the CAA by constructing and continuing to operate a major change toOhio’s SIP provisions governing particulate matter at Unit 1 at CG&E's&E’s W.C. Beckjord Generating Station (Beckjord Station) without obtaining the required NSR pre-construction permits.
On November 3, 1999, the EPA sued a number of holding companies and electric utilities, includingCinergy,CG&E, andPSI, in various U.S. District Courts. TheCinergy,CG&E, andPSI suit alleged violations of the CAA at two of our generating stations relating to NSR and NSPS requirements.. The suit soughtseeks (1) injunctive relief to require installation of pollution control technology on each of thevarious generating units at CG&E’sBeckjord Station and Miami Fort Station, and PSI’sPSI's Cayuga Generating Station, (CayugaGallagher Generating Station, Wabash River Generating Station, and Gibson Generating Station (Gibson Station), and (2) civil penalties in amounts of up to $27,500 per day for each violation. In addition, three northeast states and two environmental groups have intervened in the case. The case is currently in discovery, and the District Court has set the case for trial by jury commencing in February 2006.
OnIn March 1, 2000, the EPAUnited States also filed an amended complaint againstCinergy,CG&E, andPSI. The amended complaint added alleged violations of the NSR requirements of the CAA at two of our generating stations contained in a notice of violation (NOV) filed by the EPA on November 3, 1999. It also added claims for relief of alleged violations of nonattainment NSR, Indiana and Ohio SIPs, and particulate matter emission limits (as discussed below in the "Beckjord Station NOV" section).
The amended complaint sought (1) injunctive relief to require installation of pollution control technology on each of the generating units at Beckjord Station, Cayuga Station, andPSI's Wabash River and Gallagher Generating Stations, and such other measures as necessary, and (2) civil penalties in amounts of up to $27,500 per day for each violation.
On March 1, 2000, the EPA also filedDistrict Court an amended complaint in a separate lawsuit alleging violations of the CAA relating to thePSD, NSR, Prevention of Significant Deterioration (PSD), and Ohio SIP requirements regarding various generating stations, including a generating station operated by the Columbus Southern Power Company (CSP) and jointly-owned by CSP, The Dayton Power and Light Company (DP&L), andCG&E. The EPA is seeking injunctive relief and civil penalties of up to $27,500 per day for each violation. This suit is being defended by CSP. In April 2001, the District Court in that case ruled that the Government and the intervening plaintiff environmental groups cannot seek
On June 28, 2000, the EPA issued an NOV toCinergy,CG&E, andPSI
166
monetary damages for alleged violations of NSR, PSD,that occurred prior to November 3, 1994; however, they are entitled to seek injunctive relief for such alleged violations. Neither party appealed that decision.
In addition, Cinergy and SIP requirements atCG&E's Miami Fort Station andPSI's Gibson Station. In addition,Cinergy andCG&E have been informed by DP&L the operator of Stuart Station, that onin June 30, 2000, the EPA issued an NOVa Notice of Violation (NOV) to DP&L for alleged violations of PSD, NSR, PSD, and Ohio SIP requirements at this station.a generating station operated by DP&L and jointly-owned by CG&E owns 39% of Stuart Station.. The NOVsNOV indicated that the EPA may (1) issue an order requiring compliance with the requirements of the Ohio SIP, or (2) bring a civil action seeking injunctive relief and civil penalties of up to $27,500 per day for each violation. In September 2004, Marilyn Wall and the Sierra Club brought a lawsuit against Cinergy, DP&L and CSP for alleged violations of the CAA at this same generating station.
See section (e) below for a discussion of the tentative EPA settlement, which relates
We are unable to matters discussed within this note.
(d) Beckjord Station NOV On November 30, 1999, the EPA filed an NOV againstCinergy andCG&E alleging that emissions of particulate matter at the Beckjord Station exceeded the allowable limit. The NOV indicated that the EPA may (1) issue an administrative penalty order, or (2) file a civil action seeking injunctive relief and civil penalties of up to $27,500 per day for each violation. The allegations contained in this NOV were incorporated within the March 1, 2000 amended complaint, as discussed in section (c). On June 22, 2000, the EPA issued an NOV and a Finding of Violation (FOV) alleging additional particulate emission violations at Beckjord Station and offered us an opportunity to
meet and discuss the allegations and corrective measures. The NOV/FOV indicated the EPA may issue an administrative compliance order, issue an administrative penalty order, or bring a civil or criminal action.
See section (e) below for a discussion of the tentative EPA settlement, which relates to matters discussed within this note.
(e) EPA Agreement On December 21, 2000,Cinergy,CG&E, andPSI reached an agreement in principle with the EPA, the U.S. Department of Justice, three northeast states, and two environmental groups that could serve as the basis for a negotiated resolution of CAA claims and other related matters brought against coal-fired power plants owned and operated byCinergy's operating subsidiaries. The completepredict whether resolution of these issues is contingent upon establishing a final agreement with the EPA and other parties. If a final agreement is reached with these parties, this would resolve past claims of the NSR as well as the Beckjord Station NOVs/FOV discussed above.
Under the terms of the tentative agreement, the EPA and the other plaintiffs have agreed to drop all challenges of past maintenance and repair activities at our coal-fired generation plants. In addition, the intent of the tentative agreement is that we would be allowed to continue on-going activities to maintain reliability and availability without subjecting the plants to future litigation regarding federal permitting requirements.
In return for resolution of past claims, future operational certainty, and protection of system wide demand growth, we have tentatively agreed to:
•shut down or repower with natural gas nine small coal-fired boilers at three power plants beginning in 2004;•build four additional SO2 scrubbers, the first of which must be operational by December 31, 2007;•upgrade existing pollution control systems;•phase in the operation of NOX reduction technology year-round starting in 2004;•retire 50,000 tons of SO2 allowances between 2001 and 2005 and reduce our SO2 cap by 35% in 2013;•pay a civil penalty of $8.5 million to the U.S. government; and•implement $21.5 million in environmental mitigation projects.
The estimated cost for these capital expenditures is expected to be approximately $700 million. These capital expenditures are in addition to our previously announced commitment to install NOX controls over the next five years at an estimated cost of approximately $700 million as previously discussed in "Ozone Transport Rulemaking".
In reaching the tentative agreement, we did not admit any wrongdoing and remain free to continue our current maintenance practices, as well as implement future projects for improved reliability. If the settlement is not completed, we believe the allegations contained in the amended complaint are without merit, and we would defend the suit vigorously in court. In such an event, it is not possible at this time to determine the likelihood that the plaintiffs would prevail on their claims or whether resolution of this mattermatters would have a material effect on our financial conditionposition or results of operations. We intend to vigorously defend against these allegations.
(iv) Carbon Dioxide (CO2) Lawsuit
In July 2004, the states of Connecticut, New York, California, Iowa, New Jersey, Rhode Island, Vermont, Wisconsin, and the City of New York brought a lawsuit in the United States District Court for the Southern District of New York against Cinergy, American Electric Power Company, Inc., American Electric Power Service Corporation, The Southern Company, Tennessee Valley Authority, and Xcel Energy Inc. That same day, a similar lawsuit was filed in the United States District Court for the Southern District of New York against the same companies by Open Space Institute, Inc., Open Space Conservancy, Inc., and The Audubon Society of New Hampshire. These lawsuits allege that the defendants’ emissions of CO2 from the combustion of fossil fuels at electric generating facilities contribute to global warming and amount to a public nuisance. The complaints also allege that the defendants could generate the same amount of electricity while emitting significantly less CO2. Plaintiffs are seeking an injunction requiring each defendant to cap its CO2 emissions and then reduce them by a specified percentage each year for at least a decade. Cinergy intends to defend these lawsuits vigorously in court and filed motions to dismiss with the other defendants in September 2004. We are not able to predict whether resolution of these matters would have a material effect on our financial position or results of operations.
(v) Selective Catalytic Reduction Units at Gibson Generating Station
In May 2004, SCRs and other pollution control equipment became operational at Units 4 and 5 of PSI’s Gibson Station in accordance with compliance deadlines under the NOX SIP Call. In June and July 2004, Gibson Station temporarily shut down the equipment on these units due to a concern over an acid aerosol mist haze (plume) sometimes occurring in areas near the plant. Portions of the plume from those units’ stacks appeared to break apart and descend to ground level at certain times under certain weather conditions. As a result, and, working with the City of Mt. Carmel, Illinois, Illinois EPA, Indiana Department of Environmental Management (IDEM), EPA, and the State of Illinois, we developed a protocol regarding the use of the SCRs while we explored alternatives to address this issue. After the protocol was finalized, the Illinois Attorney General brought an action in Wabash County Circuit Court against PSI seeking a preliminary injunction to enforce the protocol. In August 2004, the court granted that preliminary injunction. PSI is appealing that decision to the Fifth District Appellate Court, but we cannot predict the ultimate outcome of that appeal or of the underlying action by the Illinois Attorney General.
We will seek recovery of any related capital as well as increased emission allowance expenditures through the regulatory process. We do not believe costs related to resolving this matter will have a material impact on our financial position or results of operations.
(f)(vi) Zimmer Generating Station (Zimmer Station) Lawsuit
In November 2004, a citizen of the Village of Moscow, Ohio, the town adjacent to CG&E’s Zimmer Station, brought a purported class action in the United States District Court for the Southern District of Ohio seeking monetary damages and injunctive relief against CG&E for alleged violations of the CAA, the Ohio SIP, Ohio laws against nuisance and common law nuisance. CG&E filed a motion to dismiss the lawsuit on primarily procedural grounds and we intend to defend against these claims vigorously. At this time, we cannot predict whether the outcome of this matter will have a material impact on our financial position or result of operations.
167
(vii) Manufactured Gas Plant (MGP) Sites
(i) General Prior to the 1950s, gas was produced at MGP sites through a process that involved the heating of coal and/or oil. The gas produced from this process was sold for residential, commercial, and industrial uses.
(ii) PSICoal tar residues, related hydrocarbons, and various metals associated with MGP sites have been found at former MGP sites in Indiana, including at least 2122 sites whichthat PSI or its predecessors previously owned.PSI acquired fourowned and sold in a series of the sites fromtransactions with Northern Indiana Public Service
Company (NIPSCO) in 1931. At the same time,PSI sold NIPSCO the sites located in Goshen and Warsaw, Indiana. In 1945,PSI sold 19 of these sites (including the four sites it acquired from NIPSCO) to the predecessor of the Indiana Gas Company, Inc. (IGC). IGC later soldThe 22 sites are in the site located in Rochester, Indiana, to NIPSCO.
IGC (in 1994)process of being studied and NIPSCO (in 1995) both made claims againstPSI. The basis of these claims was thatPSI is a Potentially Responsible Party with respect to the 21 MGP sites under the Comprehensive Environmental Response, Compensation and Liability Act (CERCLA). The claims further asserted thatPSI is legally responsible for the costs of investigating and remediating the sites.will be remediated, if necessary. In August 1997, NIPSCO filed suit againstPSI in federal court claiming recovery (pursuant to CERCLA) of NIPSCO's past and future costs of investigating and remediating MGP-related contamination at the Goshen MGP site.
In November 1998 NIPSCO, IGC, andPSI entered into a Site Participation and Cost Sharing Agreement. This agreement allocated CERCLAAgreements to allocate liability for past and future costs at seven MGP sites in Indiana among the three companies. As a result of the agreement, NIPSCO's lawsuit againstPSI was dismissed.responsibilities between them. The parties have assigned lead responsibility for managing further investigation and remediation activities at each of the sites to one of the parties. Similar agreements were reached between IGC andPSI that allocate CERCLA liability at 14 MGP sites with which NIPSCO was not involved. These agreements conclude all CERCLA and similar claims between the three companies related to MGP sites. The parties continue to investigate and remediate the sites, as appropriate under the agreements and applicable laws. The Indiana Department of Environmental Management (IDEM)IDEM oversees investigation and cleanup of someall of these sites. Thus far, PSI has primary responsibility for investigating, monitoring and, if necessary, remediating nine of these sites. In December 2003, PSI entered into a voluntary remediation plan with the state of Indiana, providing a formal framework for the investigation and cleanup of the sites.
PSI notified its insurance carriers of the claims related to MGP sites raised by IGC, NIPSCO, and the IDEM. In April 1998,PSI filed suit in Hendricks County Circuit Court in the Statestate of Indiana (Court) against its general liability insurance carriers. Among other matters,PSI requested sought a declaratory judgment that wouldto obligate its insurance carriers to (1) defend MGP claims againstPSI, or (2) payPSI's costs of defense and compensatePSI for its costs of investigating, preventing, mitigating, and remediating damage to property and paying claims related to MGP sites. Recently,sites; or (2) pay PSI’s cost of defense. The trial court issued a variety of rulings with respect to the trial date forclaims and defenses in the case was moved from May 2001litigation. PSI appealed certain adverse rulings to January 2002. In addition, the Indiana Court has orderedof Appeals and the parties to submitappellate court remanded the case to mediation. The parties have selectedthe trial court. PSI settled its claims with all but one of the insurance carriers in January 2005 prior to commencement of the trial. With respect to the lone insurance carrier, a mediator and scheduled mediation sessionsjury returned a verdict against PSI in early 2001.February 2005. PSI is considering whether to appeal this decision. At the present time, PSI cannot predict the outcome of this litigation. Recently,PSI has been involved in settlement discussions with some oflitigation if it were to appeal the insurance carriers. At the present time,PSI cannot predict either the progress or outcome of these discussions.decision.
PSI has accrued costs for the sites related to investigation, remediation, and groundwater monitoring to the extentfor those sites where such costs are probable and can be reasonably estimated.PSI does not believe it can provide an estimate We will continue to investigate and remediate the sites as outlined in the voluntary remediation plan. As additional facts become known and investigation is completed, we will assess whether the likelihood of the reasonably possible total remediationincurring additional costs for any site before a remedial investigation/feasibility study has been completed. To the extent remediation is necessary, the timing of the remediation activities impacts the cost of remediation. Therefore,PSI currently cannot determine the total costs that may be incurred in connection with the remediation ofbecomes probable. Until all sites, to the extent that remediation is required. According to current information, these future costs at the 21 Indiana MGP sites are not material to our financial condition or results of operations. As further investigation and remediation activitiesis complete, we are performed at these sites,unable to determine the potential liability for the 21 Indiana MGP sites could be material tooverall impact on our financial position or results of operations.
(iii)
CG&ECG&E and its utility subsidiaries are awareULH&P have performed site assessments on certain of potentialtheir sites where we believe MGP activities have occurred at some timepoint in the past. None of these sites is known to present apast and have found no imminent risk to the environment. At the present time, CG&E and ULH&P cannot predict whether investigation and/or remediation will be required in the future at any of these sites.
(viii) Asbestos Claims Litigation
CG&E and its utility subsidiariesPSI have begun preliminary site assessmentsbeen named as defendants or co-defendants in lawsuits related to obtain information about someasbestos at their electric generating stations. Currently, there are approximately 100 pending lawsuits. In these lawsuits, plaintiffs claim to have been exposed to asbestos-containing products in the course of their work at the CG&E and PSI generating stations. The plaintiffs further claim that as the property owner of the generating stations, CG&E and PSI should be held liable for their injuries and illnesses based on an alleged duty to warn and protect them from any asbestos exposure. A majority of the lawsuits to date have been brought against PSI. The impact on CG&E’s and PSI’s financial position or results of operations of these MGP sites.cases to date has not been material.
Of these lawsuits, one case filed against PSI has been tried to verdict. The jury returned a verdict against PSI in the amount of approximately $500,000 on a negligence claim and a verdict for PSI on punitive damages. PSI received an adverse ruling in its initial appeal of the negligence claim verdict, but the Indiana Supreme Court accepted the transfer of the case and heard oral argument in June 2004. In addition, PSI has settled a number of other lawsuits for amounts, which neither individually nor in the aggregate, are material to PSI’s financial position or results of operations.
At this time, CG&E and PSI are not able to predict the ultimate outcome of these lawsuits or the impact on CG&E’s and PSI’s financial position or results of operations.
168
(b)Regulatory
(i) PSI Retail Electric Rate Case
In May 2004, the IURC issued an order approving PSI’s base retail electric rate case, and PSI implemented base retail electric rate changes to its tariffs. When combined with revenue increases attributable to PSI’s environmental construction-work-in-progress tracking mechanism, the order results in an approximate $140 million increase in annual revenues. PSI’s original request for an approximate $180 million annual revenue increase was reduced by approximately $20 million for a lower return on equity, approximately $15 million of assumed profits included in base rates related to off-system sales (subject to future adjustment through a tracking mechanism and a 50/50 sharing agreement), and approximately $5 million of additional items. The order authorizes full recovery of all requested regulatory assets and an overall 7.3 percent return, including a 10.5 percent return on equity. In addition, the IURC’s order provides PSI the continuation of a purchased power tracker and the establishment of new trackers for future NOX emission allowance costs and certain costs related to the Midwest Independent Transmission System Operator, Inc. (Midwest ISO).
(ii) PSI Environmental Compliance Case
In November 2004,PSI filed a compliance plan case with the IURC seeking approval of (g)PSI’s plan for complying with pending SO2, NOX, and mercury emission reduction requirements, including approval of cost recovery and an overall rate of return of eight percent related to certain projects. PSI requested approval to recover the financing, depreciation, and operating and maintenance costs, among others, related to approximately $1.08 billion in capital projects designed to reduce emissions of SO2, NOX, and Mercury at PSI’s coal burning generating stations. An evidentiary hearing is scheduled for April 2005 and a final IURC Order is expected in the third quarter of 2005.
Other(iii) CG&E Electric Rate Filings
CG&E made multiple rate filings in 2003 with the PUCO seeking approval of CG&E’s methodology for establishing market-based rates for generation service at the end of the market development period and to recover investments made in the transmission and distribution system. The PUCO requested in these proceedings that CG&E propose a RSP to mitigate the potential for significant rate increases when the market development (frozen rate) period comes to an end. In January 2004, CG&E filed its proposed RSP. In May 2004, CG&E entered into a settlement agreement with many of the parties to these proceedings requesting that the PUCO approve a modified version of the RSP. In September 2004, the PUCO issued an order seeking to modify several key provisions of this settlement and as a result of these modifications, CG&E filed a petition for rehearing in October 2004. The PUCO approved a modified version of the plan in November 2004, the major features of which are as follows:
•Provider of Last Resort (POLR) Charge:CG&E will begin to collect a POLR charge from non-residential customers effective January 1, 2005, and from residential customers effective January 1, 2006. The POLR charge includes several discrete charges, the most significant being an annually adjusted component (AAC) intended to provide cost recovery primarily for environmental compliance expenditures; an infrastructure maintenance fund charge (IMF) intended to provide compensation to CG&E for committing its physical capacity to meet its POLR obligation; anda system reliability tracker (SRT) intended to provide cost recovery for capacity purchases, purchased power, reserve capacity, and related market costs for purchases to meet capacity needs. We anticipate the collection of the AAC and IMF will result in an approximate $36 million increase in revenues in 2005 and an additional $50 million in 2006. The SRT will be billed based on dollar-for-dollar costs incurred. A portion of these charges are avoidable by certain customers who switch to an alternative generation supplier. Therefore, these estimates are subject to change, depending on the level of switching that occurs in future periods. In 2007 and 2008, CG&E could seek additional increases in the AAC component of the POLR based on CG&E’s actual net costs for the specified expenditures.
•Generation Rates and Fuel Recovery: A new rate has been established for generation service after the market development period ends. In addition, a fuel cost recovery mechanism will be established to recover costs for fuel, emission allowances, and certain purchased power costs, that exceed the amount originally included in the rates frozen in the CG&E transition plan. These new rates will apply to
169
non-residential customers beginning January 1, 2005 and to residential customers beginning January 1, 2006.
•Generation Rate Reduction: The existing five percent generation rate reduction required by statute for residential customers implemented under CG&E’s 2000 plan will end on December 31, 2005.
•Transmission Cost Recovery: Transmission cost recovery mechanisms will be established beginning January 1, 2005 for non-residential customers and January 1, 2006 for residential customers. The transmission cost recovery mechanisms will permit CG&E to recover Midwest ISO charges, all FERC approved transmission costs, and all congestion costs allocable to retail ratepayers that are provided service by CG&E.
•Distribution Cost Recovery: CG&E will have the ability to defer certain capital-related distribution costs from July 1, 2004 through December 31, 2005 with recovery from non-residential customers to be provided through a rider beginning January 1, 2006 through December 31, 2010.
CG&E had also filed an electric distribution base rate case for residential and non-residential customers to be effective January 1, 2005. Under the terms of the RSP described previously, CG&E withdrew this base rate case and, in February 2005, CG&E filed a new distribution base rate case with rates to become effective January 1, 2006. The requested amount of the increase is approximately $78 million.
(iv) ULH&P Gas Rate Case
In the second quarter of 2001, ULH&P filed a retail gas rate case with the KPSC requesting, among other things, recovery of costs associated with an electric wholesaleaccelerated gas main replacement program of up to $112 million over ten years. The costs would be recovered through a tracking mechanism for an initial three year period, with the possibility of renewal up to ten years. The tracking mechanism allows ULH&P to recover depreciation costs and rate of return annually over the life of the deferred assets. Through December 31, 2004, ULH&P has recovered approximately $5.1 million under this tracking mechanism. The Kentucky Attorney General has appealed to the Franklin Circuit Court the KPSC’s approval of the tracking mechanism and the new tracking mechanism rates. At the present time, ULH&P cannot predict the timing or outcome of this litigation.
In February 2005, ULH&P filed a gas base rate case with the KPSC. ULH&P is requesting approval to continue the tracking mechanism in addition to its request for a $14 million increase in base rates, which is a seven percent increase in current retail gas rates.
(v) Gas Distribution Plant
In June 2003, the PUCO approved an amended settlement adopted by the FERC effective February 2000,agreement between CG&E and the PUCO Staff in a gas distribution safety case arising out of a gas leak at a service head-adapter (SHA) style riser on reducedCG&E’s distribution system. The amended settlement agreement required CG&E to expend a minimum of $700,000 to replace SHA risers by December 31, 2003, and to file a comprehensive plan addressing all SHA risers on its distribution system. CG&E filed a comprehensive plan with the PUCO in December 2004 providing for replacement of approximately 5,000 risers in 2005 with continued monitoring thereafter. CG&E estimates the replacement cost of fuel reflected in its wholesale base rates the approximately 5,000 SHA risers will not be material. At this time, Cinergy, CG&E,and revised its wholesale fuel adjustment factor. Beginning March 1, 2000,ULH&P began passing through to retail customers the fuel costs incurred pursuant to the revised wholesale fuel adjustment factor. The company believes it is not required to synchronize the cost of fuel reflected in retail base rates with the reduced cost of fuel reflected in wholesale base rates, outside of a general rate proceeding. As a result, in 2000,ULH&P recovered and recognized as revenue approximately $14 million more in costs than it incurred. This issue is currently before the Kentucky Public Service Commission (KPSC). WhileULH&P believes its position is consistent with applicable rate regulations, it is possible that the KPSC might require rate synchronization prospectively or disallow recovery of the $14 million recognized as revenue during 2000.ULH&P currently cannot predict the outcome of this matter.
13.(c)Other
(i) Gas Customer Choice
In January 2000, Investments sold Cinergy Resources, Inc. (Resources), a former subsidiary, to Licking Rural Electrification, Inc., doing business as The Energy Cooperative (Energy Cooperative). In February 2001, Cinergy, CG&E, and Resources were named as defendants in three class action lawsuits brought by customers relating to Energy Cooperative’s removal from the Ohio Gas Customer Choice program and the failure to deliver gas to customers. Subsequently, these class action suits were amended and consolidated into one suit (Class-action). In October 2001, Cinergy, CG&E, and Investments initiated litigation against Energy Cooperative requesting
170
indemnification by Energy Cooperative for the claims asserted by former customers in the Class-action litigation (Cinergy lawsuit).
In March 2001, Cinergy, CG&E, and Investments were named as defendants in a lawsuit filed by Energy Cooperative and Resources (Energy Cooperative lawsuit). This lawsuit concerned any obligations or liabilities Investments may have had to Energy Cooperative following its sale of Resources. All three matters were settled in the second quarter of 2004. In the Energy Cooperative lawsuit, Energy Cooperative agreed to indemnify Cinergy, CG&E and Investments for the claims asserted by the former residential customers in the Class-action litigation. In exchange, Cinergy has agreed to settle claims that it brought in the Cinergylawsuit. The settlement received final court approval in January 2005. None of these settlements are material to Cinergy’s financial position or results of operations.
(ii) Energy Market Investigations
In July 2003, Cinergy received a subpoena from the Commodity Futures Trading Commission (CFTC). The CFTC request sought certain information regarding our trading activities, including price reporting to energy industry publications for the period May 2000 through January 2001. Based on our review of these matters, we terminated one employee and took disciplinary action on a second employee. In November 2004, we settled this matter with the CFTC with a payment of $3 million.
In August 2003, Cinergy, along with Marketing & Trading and 37 other companies, were named as defendants in civil litigation filed as a purported class action on behalf of all persons who purchased and/or sold New York Mercantile Exchange natural gas futures and options contracts between January 1, 2000, and December 31, 2002. The complaint alleges that improper price reporting caused damages to the class. Two similar lawsuits have subsequently been filed, and these three lawsuits have been consolidated for pretrial purposes. Plaintiffs filed a consolidated class action complaint in January 2004. Cinergy’s motion to dismiss was granted in September 2004 leaving only Marketing & Trading in the lawsuit. We believe this action against Marketing & Trading is without merit and intend to defend this lawsuit vigorously.
In the second quarter of 2003, Cinergy received initial and follow-up third-party subpoenas from the SEC requesting information related to particular trading activity with one of its counterparties who was the target of an investigation by the SEC. Cinergy fully cooperated with the SEC in connection with this matter and has received no further requests since the second quarter of 2003.
From time to time, Cinergy receives subpoenas regarding investigations into energy market practices that various Assistant United States Attorneys are conducting. We understand that we are neither a target nor into energy market practices are we under investigation by the Department of Justice in relation to any of these communications.
At this time, we do not believe the outcome of these investigations and litigation will have a material impact on Cinergy’s financial position or results of operations.
(iii) Patents
Ronald A. Katz Technology Licensing, L.P. (RAKTL) has offered us a license to a portfolio of patents claiming that the patents may be infringed by certain products and services utilized by us. The patents purportedly relate to various aspects of telephone call processing in Cinergy call centers. As of this date, no legal proceedings have been instituted against us, but if the RAKTL patents are valid, enforceable, and apply to our business, we could be required to seek a license from RAKTL or to discontinue certain activities. Based on the information we have at this time, we do not believe resolution of this matter will have a material impact on our financial position or results of operations.
(iv) Synthetic Fuel Production
In July 2002, Capital & Trading acquired a coal-based synthetic fuel production facility. The synthetic fuel produced at this facility qualifies for tax credits (through 2007) in accordance with IRC Section 29 if certain
171
requirements are satisfied. The three key requirements are that (a) the synthetic fuel differs significantly in chemical composition from the coal used to produce such synthetic fuel, (b) the fuel produced is sold to an unrelated entity and (c) the fuel was produced from a facility that was placed in service before July 1, 1998.
During the third quarter of 2004, several unrelated entities announced that the IRS had or threatened to challenge the placed in service dates of some of the entities’ synthetic fuel plants. A successful IRS challenge could result in disallowance of all credits previously claimed for fuel produced by the subject plants. Cinergy’s sale of synthetic fuel has generated approximately $219 million in tax credits through December 31, 2004, of which approximately $96 million were generated in 2004.
The IRS has not yet audited Cinergy for any tax year in which Cinergy has claimed Section 29 credits related to synthetic fuel. However, it is reasonable to anticipate that the IRS will evaluate the placed in service date and other key requirements for claiming the credit. We anticipate this audit to begin in the spring of 2005.
Cinergy received a private letter ruling from the IRS in connection with the acquisition of the facility that specifically addressed the significant chemical change requirement. Additionally, although not addressed in the letter ruling, we believe that our facility’s in service date meets the Section 29 requirements.
IRC Section 29 also provides for a phase-out of the credit based on the price of crude oil. The phase-out is based on a prescribed calculation and definition of crude oil prices. We do not expect any impact on our ability to utilize Section 29 credits in 2004. Future increases in crude oil prices above the price stipulated by the IRS could negatively impact our ability to utilize credits in subsequent years.
(v) Guarantees
In the ordinary course of business, Cinergy enters into various agreements providing financial or performance assurances to third parties on behalf of certain unconsolidated subsidiaries and joint ventures. These agreements are entered into primarily to support or enhance the creditworthiness otherwise attributed to these entitieson a stand-alone basis, thereby facilitating the extension of sufficient credit to accomplish their intended commercial purposes. The guarantees have various termination dates, from short-term (less than one year) to open-ended.
In many cases, the maximum potential amount of an outstanding guarantee is an express term, set forth in the guarantee agreement, representing the maximum potential obligation of Cinergy under that guarantee (excluding, at times, certain legal fees to which a guaranty beneficiary may be entitled). In those cases where there is no maximum potential amount expressly set forth in the guarantee agreement, we calculate the maximum potential amount by considering the terms of the guaranteed transactions, to the extent such amount is estimable.
Cinergy has guaranteed the payment of approximately $9 million as of December 31, 2004, for borrowings by individuals under the Director, Officer, and Key Employee Stock Purchase Program. Cinergy may be obligated to pay the debt’s principal and any related interest in the event of an unexcused breach of a guaranteed payment obligation by certain directors, officers, and key employees. The guarantees do not have a set termination date; however, the borrowings associated with these guarantees are due in March 2005.
Cinergy Corp. has also provided performance guarantees on behalf of certain unconsolidated subsidiaries and joint ventures. These guarantees support performance under various agreements and instruments (such as construction contracts, operations and maintenance agreements, and energy service agreements). Cinergy Corp. may be liable in the event of an unexcused breach of a guaranteed performance obligation by an unconsolidated subsidiary. Cinergy Corp. has estimated its maximum potential liability to be $52 million under these guarantees as of December 31, 2004. Cinergy Corp. may also have recourse to third parties for claims required to be paid under certain of these guarantees. The majority of these guarantees expire at the completion of the underlying performance agreement, the majority of which expire from 2016 to 2019.
Cinergy has entered into contracts that include indemnification provisions as a routine part of its business activities. Examples of thesecontracts include purchase and sale agreements and operating agreements. In general, these provisions indemnify the counterparty for matters such as breaches of representations and warranties and covenants
172
contained in the contract. In some cases, particularly with respect to purchase and sale agreements, the potential liability for certain indemnification obligations is capped, in whole or in part (generally at an aggregate amount not exceeding the sale price), and subject to a deductible amount beforeany payments would become due.In other cases (such as indemnifications for willful misconduct of employees in a joint venture), the maximum potential liability is not estimable given that the magnitude of any claims under those indemnifications would be a function of the extent of damages actually incurred. Cinergy has estimated the maximum potential liability, where estimable, to be $128 million under these indemnification provisions. The termination period for the majority of matters provided by indemnification provisions in these types of agreements generally ranges from 2005 to 2009.
We believe the likelihood that Cinergy would be required to perform or otherwise incur any significant losses associated with any or all of the guarantees described in the preceding paragraphs is remote.
(vi) Construction and Other Commitments
Forecasted construction and other committed expenditures for the year 2005 and for the five-year period 2005-2009 (in nominal dollars) are presented in the table below:
| | 2005 | | 2005-2009 | |
| | (in millions) | |
| | | | | |
Cinergy(1) | | $ | 1,115 | | $ | 5,430 | |
CG&E and subsidiaries | | 430 | | 2,345 | |
PSI | | 620 | | 2,645 | |
ULH&P | | 80 | | 335 | |
| | | | | | | |
(1) The results of Cinergy also include amounts related to non-registrants.
This forecast includes an estimate of expenditures in accordance with the companies’ plans regarding environmental compliance.
173
12. Jointly-Owned Plant
CG&E, CSP, and DP&L jointly own electric generating units and related transmission facilities.PSI is also a joint-owner of Gibson Station Unit No. 5 with Wabash Valley Power Association, Inc. (WVPA), and Indiana Municipal Power Agency (IMPA). Additionally,PSI is a joint-owner with WVPA and IMPA of certain transmission property and local facilities. These facilities constitute part of the integrated transmission and distribution systems, which are operated and maintained byPSI. The Consolidated Statements of Income reflectCG&E's&E’s and andPSI’sPSI's portions of all operating costs associated with the jointly-owned facilities.
As of December 31, 2004, CG&E's&E’s and andPSI’sPSI's investments in jointly-owned plant or facilities arewere as follows:
| | Ownership
Share
| | Utility Plant
in Service
| | Accumulated
Depreciation
| | Construction
Work in
Progress
|
|---|
| | (in millions)
|
|---|
| CG&E | | | | | | | | | | | |
| | Production: | | | | | | | | | | | |
| | | Miami Fort Station (Units 7 and 8) | | 64.00 | % | $ | 227 | | $ | 134 | | $ | 17 |
| | | Beckjord Station (Unit 6) | | 37.50 | | | 42 | | | 29 | | | 1 |
| | | Stuart Station(1) | | 39.00 | | | 280 | | | 146 | | | 21 |
| | | Conesville Station (Unit 4)(1) | | 40.00 | | | 77 | | | 44 | | | — |
| | | Zimmer Station | | 46.50 | | | 1,241 | | | 348 | | | 9 |
| | | East Bend Station | | 69.00 | | | 336 | | | 190 | | | 13 |
| | | Killen Station(1) | | 33.00 | | | 187 | | | 101 | | | 1 |
| | Transmission | | Various | | | 65 | | | 34 | | | 6 |
| PSI | | | | | | | | | | | |
| | Production: | | | | | | | | | | | |
| | | Gibson Station (Unit 5) | | 50.05 | | | 214 | | | 112 | | | 1 |
| | Transmission and local facilities | | 94.94 | | | 2 | | | 1 | | | — |
| | Ownership | | Property, Plant, and | | Accumulated | | Construction Work in | |
| | Share | | Equipment | | Depreciation | | Progress | |
| | (in millions) | |
| | | | | | | | | |
CG&E | | | | | | | | | |
Production: | | | | | | | | | |
Miami Fort Station (Units 7 and 8) | | 64.00 | % | $ | 328 | | $ | 133 | | $ | 18 | |
Beckjord Station (Unit 6) | | 37.50 | | 45 | | 29 | | — | |
Stuart Station(1) | | 39.00 | | 384 | | 161 | | 15 | |
Conesville Station (Unit 4)(1) | | 40.00 | | 76 | | 48 | | 5 | |
Zimmer Station | | 46.50 | | 1,308 | | 438 | | 4 | |
East Bend Station | | 69.00 | | 394 | | 200 | | 5 | |
Killen Station(1) | | 33.00 | | 206 | | 112 | | 1 | |
Transmission | | Various | | 88 | | 44 | | — | |
| | | | | | | | | |
PSI | | | | | | | | | |
Production: | | | | | | | | | |
Gibson Station (Unit 5) | | 50.05 | | 287 | | 131 | | 6 | |
Transmission and local facilities | | 94.54 | | 2,567 | | 1,006 | | — | |
| | | | | | | | | | | | |
(1)Station is not operated byCG&E.
174
13.
14. Quarterly Financial Data (unaudited)
| | First | | Second | | Third | | Fourth | | | |
| | Quarter | | Quarter | | Quarter | | Quarter | | Total | |
| | (in millions, except per share amounts) | |
Cinergy(1) | | | | | | | | | | | |
| | | | | | | | | | | |
2004 | | | | | | | | | | | |
| | | | | | | | | | | |
Results of Operations: | | | | | | | | | | | |
Operating Revenues | | $ | 1,289 | | $ | 1,054 | | $ | 1,129 | | $ | 1,216 | | $ | 4,688 | |
Operating Income | | 216 | | 137 | | 183 | | 202 | | 738 | |
Net Income | | 103 | | 59 | | 93 | | 146 | | 401 | |
| | | | | | | | | | | |
Per Share Data: | | | | | | | | | | | |
EPS - basic: | | | | | | | | | | | |
Net Income | | 0.57 | | 0.33 | | 0.51 | | 0.81 | | 2.22 | |
EPS - diluted: | | | | | | | | | | | |
Net Income | | 0.57 | | 0.32 | | 0.50 | | 0.79 | | 2.18 | |
| | | | | | | | | | | |
2003 | | | | | | | | | | | |
| | | | | | | | | | | |
Results of Operations: | | | | | | | | | | | |
Operating Revenues | | $ | 1,268 | | $ | 934 | | $ | 1,092 | | $ | 1,122 | | $ | 4,416 | |
Operating Income | | 256 | | 138 | | 205 | | 212 | | 811 | |
| | | | | | | | | | | |
Income before discontinued operations and cumulative effect of changes in accounting principles | | 140 | | 76 | | 112 | | 107 | | 435 | |
Discontinued operations, net of tax(2) | | — | | 9 | | — | | — | | 9 | |
Cumulative effect of changes in accounting principles, net of tax(3) | | 26 | | — | | — | | — | | 26 | |
Net Income | | $ | 166 | | $ | 85 | | $ | 112 | | $ | 107 | | $ | 470 | |
| | | | | | | | | | | |
Per Share Data: | | | | | | | | | | | |
EPS - basic: | | | | | | | | | | | |
Income before discontinued operations and cumulative effect of changes in accounting principles | | 0.81 | | 0.42 | | 0.63 | | 0.60 | | 2.46 | |
Discontinued operations, net of tax(2) | | — | | 0.05 | | — | | — | | 0.05 | |
Cumulative effect of changes in accounting principles, net of tax(3) | | 0.15 | | — | | — | | — | | 0.15 | |
Net Income | | $ | 0.96 | | $ | 0.47 | | $ | 0.63 | | $ | 0.60 | | $ | 2.66 | |
EPS - diluted: | | | | | | | | | | | |
Income before discontinued operations and cumulative effect of changes in accounting principles | | 0.80 | | 0.42 | | 0.62 | | 0.59 | | 2.43 | |
Discontinued operations, net of tax(2) | | — | | 0.05 | | — | | — | | 0.05 | |
Cumulative effect of changes in accounting principles, net of tax(3) | | 0.15 | | — | | — | | — | | 0.15 | |
Net Income | | $ | 0.95 | | $ | 0.47 | | $ | 0.62 | | $ | 0.59 | | $ | 2.63 | |
| | | | | | | | | | | | | | | | | | | |
175
| | First | | Second | | Third | | Fourth | | | |
| | Quarter | | Quarter | | Quarter | | Quarter | | Total | |
| | (in millions, except per share amounts) | |
| | | | | | | | | | | |
CG&E and subsidiaries | | | | | | | | | | | |
| | | | | | | | | | | |
2004 | | | | | | | | | | | |
| | | | | | | | | | | |
Results of Operations: | | | | | | | | | | | |
Operating Revenues | | $ | 765 | | $ | 546 | | $ | 554 | | $ | 646 | | $ | 2,511 | |
Operating Income | | 144 | | 106 | | 120 | | 120 | | 490 | |
Net Income | | 77 | | 55 | | 64 | | 61 | | 257 | |
| | | | | | | | | | | |
2003 | | | | | | | | | | | |
| | | | | | | | | | | |
Results of Operations: | | | | | | | | | | | |
Operating Revenues | | $ | 704 | | $ | 483 | | $ | 541 | | $ | 654 | | $ | 2,382 | |
Operating Income | | 157 | | 102 | | 144 | | 160 | | 563 | |
| | | | | | | | | | | |
Income before cumulative effect of changes in accounting principles | | 86 | | 51 | | 79 | | 84 | | 300 | |
Cumulative effect of changes in accounting principles, net of tax(3) | | 31 | | — | | — | | — | | 31 | |
Net Income | | $ | 117 | | $ | 51 | | $ | 79 | | $ | 84 | | $ | 331 | |
| | | | | | | | | | | |
PSI | | | | | | | | | | | |
| | | | | | | | | | | |
2004 | | | | | | | | | | | |
| | | | | | | | | | | |
Results of Operations: | | | | | | | | | | | |
Operating Revenues | | $ | 416 | | $ | 414 | | $ | 480 | | $ | 444 | | $ | 1,754 | |
Operating Income | | 87 | | 67 | | 112 | | 93 | | 359 | |
Net Income | | 41 | | 25 | | 48 | | 51 | | 165 | |
| | | | | | | | | | | |
2003 | | | | | | | | | | | |
| | | | | | | | | | | |
Results of Operations: | | | | | | | | | | | |
Operating Revenues | | $ | 412 | | $ | 361 | | $ | 437 | | $ | 393 | | $ | 1,603 | |
Operating Income | | 74 | | 55 | | 89 | | 96 | | 314 | |
| | | | | | | | | | | |
Income before cumulative effect of a change in accounting principle | | 34 | | 23 | | 38 | | 39 | | 134 | |
Cumulative effect of a change in accounting principle, net of tax(3) | | (1 | ) | — | | — | | — | | (1 | ) |
Net Income | | $ | 33 | | $ | 23 | | $ | 38 | | $ | 39 | | $ | 133 | |
(1) The results of Cinergy also include amounts related to non-registrants.
| | Cinergy
| | CG&E
| | PSI
| |
|---|
Quarter Ended
| | 2000
| | 1999
| | 2000
| | 1999
| | 2000
| | 1999
| |
|---|
| | (in millions, except per share amounts)
| |
|---|
| March 31 | | | | | | | | | | | | | | | | | | | |
| | Operating Revenues | | $ | 1,583 | | $ | 1,402 | | $ | 716 | | $ | 645 | | $ | 534 | | $ | 482 | |
| | Operating Income | | | 274 | | | 234 | | | 181 | | | 155 | | | 102 | | | 86 | |
| | Net Income | | | 138 | | | 127 | | | 96 | | | 80 | | | 50 | | | 40 | |
| | Basic EPS | | | .87 | | | .80 | | | N/A | | | N/A | | | N/A | | | N/A | |
| | Diluted EPS | | | .87 | | | .80 | | | N/A | | | N/A | | | N/A | | | N/A | |
| June 30 | | | | | | | | | | | | | | | | | | | |
| | Operating Revenues | | $ | 1,770 | | $ | 1,275 | | $ | 707 | | $ | 531 | | $ | 620 | | $ | 463 | |
| | Operating Income | | | 167 | | | 137 | | | 113 | | | 88 | | | 49 | | | 61 | |
| | Net Income | | | 75 | | | 59 | | | 56 | | | 39 | | | 19 | | | 26 | |
| | Basic EPS | | | .47 | | | .37 | | | N/A | | | N/A | | | N/A | | | N/A | |
| | Diluted EPS | | | .47 | | | .37 | | | N/A | | | N/A | | | N/A | | | N/A | |
| September 30 | | | | | | | | | | | | | | | | | | | |
| | Operating Revenues | | $ | 2,300 | | $ | 1,782 | | $ | 840 | | $ | 738 | | $ | 804 | | $ | 707 | |
| | Operating Income | | | 196 | | | 137 | (2) | | 81 | | | 104 | (2) | | 63 | | | 47 | (2) |
| | Net Income | | | 94 | | | 122 | (1,2) | | 39 | | | 48 | (2) | | 31 | | | 16 | (2) |
| | Basic EPS | | | .59 | | | .77 | (1,2) | | N/A | | | N/A | | | N/A | | | N/A | |
| | Diluted EPS | | | .58 | | | .76 | (1,2) | | N/A | | | N/A | | | N/A | | | N/A | |
| December 31 | | | | | | | | | | | | | | | | | | | |
| | Operating Revenues | | $ | 2,769 | | $ | 1,479 | | $ | 967 | | $ | 637 | | $ | 726 | | $ | 484 | |
| | Operating Income | | | 225 | | | 185 | | | 153 | | | 132 | | | 83 | | | 78 | |
| | Net Income | | | 92 | | | 96 | | | 76 | | | 67 | | | 35 | | | 35 | |
| | Basic EPS | | | .58 | | | .60 | | | N/A | | | N/A | | | N/A | | | N/A | |
| | Diluted EPS | | | .58 | | | .60 | | | N/A | | | N/A | | | N/A | | | N/A | |
| Total | | | | | | | | | | | | | | | | | | | |
| | Operating Revenues | | $ | 8,422 | | $ | 5,938 | | $ | 3,230 | | $ | 2,551 | | $ | 2,684 | | $ | 2,136 | |
| | Operating Income | | | 862 | | | 693 | | | 528 | | | 479 | | | 297 | | | 272 | |
| | Net Income | | | 399 | | | 404 | | | 267 | | | 234 | | | 135 | | | 117 | |
| | Basic EPS | | | 2.51 | | | 2.54 | | | N/A | | | N/A | | | N/A | | | N/A | |
| | Diluted EPS | | | 2.50 | | | 2.53 | | | N/A | | | N/A | | | N/A | | | N/A | |
(2) See Note 14 for further explanation.
(3) See Note 1(q)(iv) for further explanation of cumulative effect of changes in accounting principles.
176
14. Discontinued Operations
During 2002, Cinergy began taking steps to monetize certain non-core investments, including renewable and international investments within Commercial. During the second half of 2002, Cinergy either sold or initiated plans to dispose of generation and electric and gas distribution operations in the Czech Republic, Estonia, and South Africa. Cinergy also sold investments, which were accounted for under the equity method, in renewable investments located in Spain and California. In total, Cinergy disposed of approximately $125 million of investments at a net loss, after-tax, of $7 million in 2002. Included in this net loss were cumulative foreign currency translation losses of approximately $4 million, after-tax.
During 2003, Cinergy completed the disposal of its gas distribution operation in South Africa, sold its remaining wind assets in the United States, and substantially sold or liquidated the assets of its energy marketing business in the Czech Republic.
As a result of the 2003 transactions, assets of approximately $140 million were sold or converted into cash and liabilities of approximately $100 million were assumed by buyers or liquidated. The net, after-tax, gain from these disposal and liquidation transactions was approximately $9 million (including a net after-tax cumulative currency translation gain of approximately $6 million).
GAAP requires different accounting treatment for investment disposals involving entities which are consolidated and entities which are accounted for under the equity method. The consolidated entities have been presented as Discontinued operations, net of tax in Cinergy’s Statements of Income and as Assets/Liabilities of Discontinued Operations in Cinergy’s Balance Sheets. The accompanying financial statements and prior year financial statements have been reclassified to account for these entities as such. The disposal of the entities accounted for using the equity method cannot be presented as discontinued operations. A gain of approximately $17 million on the sale of these entities is included in Miscellaneous Income (Expense)-Net in Cinergy’s 2002 Statements of Income.
177
The following table reflects the assets and liabilities, the results of operations, and the income (loss) on disposal related to investments accounted for as discontinued operations for the years ended December 31, 2003 and 2002. We did not have any investments accounted for as discontinued operations in 2004.
| | December 31 | |
| | 2003 | | 2002 | |
| | (in millions) | |
| | | | | |
Revenues(1) | | $ | 22 | | $ | 95 | |
| | | | | |
Income (Loss) Before Taxes | | $ | 4 | | $ | (27 | ) |
| | | | | |
Income Taxes Benefit | | $ | 4 | | $ | 2 | |
| | | | | |
Income (Loss) from Discontinued Operations | | | | | |
Income (Loss) from operations, net of tax | | $ | — | | $ | (1 | ) |
Gain (Loss) on disposal, net of tax(2) | | 9 | | (24 | ) |
| | | | | |
Total Income (Loss) from Discontinued Operations | | $ | 9 | | $ | (25 | ) |
| | | | | |
Assets | | | | | |
Current assets | | $ | 5 | | $ | 49 | |
Property, plant, and equipment-net | | — | | 78 | |
Other assets | | — | | 20 | |
| | | | | |
Total Assets | | $ | 5 | | $ | 147 | |
| | | | | |
Liabilities | | | | | |
Current liabilities | | $ | 12 | | $ | 7 | |
Long-term debt (including Long-term debt due within one year) | | — | | 85 | |
Other | | — | | 17 | |
| | | | | |
Total Liabilities | | $ | 12 | | $ | 109 | |
(1) Presented for informational purposes only. All results of operations are reported net in our Statements of Income.
(2) For 2002, approximately $17 million of this amount represents a write-down to fair value, less cost to sell, on assets classified as held for sale at December 31, 2002. The remaining loss on disposal for 2002 represents actual losses on completed sales.
The losses included in the 2002 discontinued operations primarily pertain to two investments. In one case, the primary customer of a combined heat and power plant filed for bankruptcy resulting in a significant reduction in future expected revenues from the investment. This investment was sold in December 2002. In the thirdsecond case, the retail market of a gas distribution business did not develop as expected, and we elected to exit the business rather than invest the additional capital which would be required to reach a sustainable level of market penetration. The investment was written down to its realizable value in December 2002 and was subsequently sold in April 2003.
178
15. Investment Activity
(a)Investment Impairment
Cinergy holds a portfolio of direct and indirect investments in Power Technology and Infrastructure (discussed further in Note 16). During 2004, Cinergy recognized approximately $56 million in impairment and disposal charges primarily associated with this portfolio. A substantial portion of these charges relate to a company in which Cinergy holds a non-controlling interest, that sold its major assets. This company is involved in the development and sale of outage management software. Based on the terms of the transaction, Cinergy concluded that this cost method investment was other-than-temporarily impaired. These impairment charges are included in Miscellaneous Income (Expense) — Net in Cinergy’s Statements of Income.
(b)Sale of Investment
Power Technology and Infrastructure holds an investment in a company that develops, owns and operates wireless communication towers. In July 2004, this company agreed to sell the majority of its assets. Most of the assets contemplated in the purchase/sale agreement were sold in the fourth quarter of 1999,2004 and we realizedrecorded a net contribution to earningsgain of approximately $.43 per share (basic and diluted) when we sold our 50% ownership interest$21 million relating to this sale. These earnings are reflected in Midlands.(2)In the third quarterEquity in Earnings of 1999, throughUnconsolidated SubsidiariesCG&E andPSI, we experienced extreme weather conditions which resulted in a reduction in net incomeCinergy’s Statements of $57 million ($16 million forIncome.
CG&E16., $41 million forPSI) after tax or $.36 per share (basic and diluted).
15. Financial Information by Business Segment
We conduct operations through our subsidiaries and manage our businesses through the following three reportable segments:
•Commercial;
During 1998, we adopted the requirements of Statement of Financial Accounting Standards No. 131,•Disclosures about Segments of an EnterpriseRegulated; and
•Power Technology and Related InformationInfrastructure. (Statement 131). Statement 131 requires disclosures about reportable operating segments in annual and interim condensed financial statements based on the following:
•products and services;
•geography;•legal structure;•management structure; or•any other manner in which management divides a company.
Our business units were initially formed during the second half of 1996 and began operating as separately identifiable business units in 1997. As of December 31, 2000, each business unit has its own management structure, headed by a business unit president. As discussed in Note 1(a), during 2000 our business units were Commodities, Delivery, Cinergy Investments, and International. Each business unit and its responsibilities as of this date, are described below.
Commodities operates
Commercial manages our wholesale generation and maintains our domestic regulated and non-regulated electric generating plants and some of our jointly-owned plants. It also conducts the following activities:
•wholesale energy marketing and trading;•- trading activities. Commercial also performs energy risk
management; •financial restructuring services;management activities, provides customized energy solutions and•proprietary arbitrage activities.
Commodities earns revenues from external customers from its marketing, trading, and risk management activities. Commodities earns intersegment revenues from the sale is responsible for all of electric power to Delivery.our international operations.
Delivery
Regulated consists of PSI’s regulated generation and transmission and distribution operations, and CG&E and its subsidiaries’ regulated electric and gas transmission and distribution systems. Regulated plans, constructs, operates, and maintains our operating companies'Cinergy’s transmission and distribution systems and providesdelivers gas and electric energy to consumers. DeliveryRegulated also earns revenues from wholesale customers primarily by these customers transmitting electric power through ourCinergy’s transmission system. Delivery currently receives allThese businesses are subject to cost of its electricity from Commodities atservice rate making where rates to be charged to customers are based on prudently incurred costs over a transfer price based upon current regulatory ratemaking methodology.test period plus a reasonable rate of return.
Cinergy Investments manages the development, marketing, and sales of our domestic non-regulated and non-wholesale energy and energy-related products and services. This is accomplished through various subsidiaries and joint ventures. These products and services include the following:
•providing energy management-consulting services and infrastructure solutions to government, industrial, and commercial customers that operate retail facilities;•providing various utility services to utilities (for example, providing underground locating and construction services for utilities);•providing telecommunication services including dark fiber, high capacity service, internet service, local phone service, and long distance service;•leasing of space on wireless telecommunication towers and the purchase and construction of such towers;•providing various engineering, procurement, construction, operation and maintenance functions such as designing and constructing turnkey gas pipelines, electric transmission and distribution lines, substations for industrial and large commercial customers, and fiber optic telecommunication cables;•providing information, systems, and services to multi-site national chains in retail industries to optimize their energy, telecommunications, and other facility-wide costs;•building, owning, operating, and maintaining combined heat and power facilities; and•pursuing technology equity investments and running technology pilots.
International primarily directs and manages our international business holdings. These holdings include wholly-owned and jointly-owned companies in ten foreign countries. In addition, International directs our renewable energy investing activities (for example, wind farms), which includes investments within the U.S. as well as abroad. International earns (1) revenues from consolidated subsidiaries, and (2) equity earnings from unconsolidated companies primarily from energy-related businesses.
As the utility industry continues to evolve,Cinergy will continue to analyze its operating structure and make modifications as appropriate. In early 2001, we announced certain organizational changes which further aligned the business units consistent withCinergy's strategic vision. The revised structure reflects three business units, as follows:
•Energy Merchant—will operate power plants, both domestically and abroad, and conduct all wholesale energy marketing, trading, origination and risk management services;•Regulated Businesses—will operate all gas and electric transmission and distribution services, both domestically and abroad, and will be responsible for all regulatory planning for the regulated utility businesses ofCG&E,PSI, andULH&P; and•- Power Technology and Infrastructure
Servicesprimarily manages Cinergy Ventures, LLC (Ventures), Cinergy’s—will originate venture capital subsidiary. Ventures identifies, invests in, and manage a portfolio of emergingintegrates new energy businesses.technologies into Cinergy’s
existing businesses, focused primarily on operational efficiencies and clean energy technologies. In addition, Power Technology and Infrastructure manages our investments in other energy infrastructure and telecommunication service providers.Following are the financial results by business unit. Certain prior year amounts have been reclassified to conform to the current presentation.
179
Financial informationresults by (1) business units, (2) products and services, and (3) geographic areas and long-lived assetsunit for the years endingended December 31, 2000, 1999,2004, 2003, and 1998,2002, are as follows:indicated below:
Business Units
| | 2004 | |
| | Cinergy Business Units | | | | | | | |
| | | | Reconciling
Regulated | | Power Technology | | | | | | | | | |
| | Commercial | | | and Infrastructure | | Total | | All Other(1) | | Eliminations(2) | | Consolidated | |
| | (in millions) | |
Operating revenues - | | | | | | | | | | | | | | | |
External customers | | $ | 1,665 | | $ | 3,023 | | $ | — | | $ | 4,688 | | $ | — | | $ | — | | $ | 4,688 | |
Intersegment revenues | | 163 | | — | | — | | 163 | | — | | (163 | ) | — | |
| | | | | | | | | | | | | | | |
Gross Margins | | | | | | | | | | | | | | | |
Electric(3) | | 637 | | 1,656 | | — | | 2,293 | | — | | — | | 2,293 | |
Gas(4) | | 92 | | 263 | | — | | 355 | | — | | — | | 355 | |
| | | | | | | | | | | | | | | |
Depreciation | | 133 | | 326 | | 1 | | 460 | | — | | — | | 460 | |
Equity in earnings of unconsolidated subsidiaries | | 25 | | 3 | | 20 | | 48 | | — | | — | | 48 | |
Interest expense(5) | | 121 | | 149 | | 5 | | 275 | | — | | — | | 275 | |
| | | | | | | | | | | | | | | |
Income taxes | | (61 | )(6) | 178 | | (13 | ) | 104 | | — | | — | | 104 | |
| | | | | | | | | | | | | | | |
Segment profit (loss)(7) | | 179 | | 253 | | (31 | ) | 401 | | — | | — | | 401 | |
| | | | | | | | | | | | | | | |
Total segment assets | | 4,992 | | 9,774 | | 136 | | 14,902 | | 80 | | — | | 14,982 | |
Investments in unconsolidated subsidiaries | | 413 | | 18 | | 83 | | 514 | | — | | — | | 514 | |
Total expenditures for long-lived assets | | 176 | | 517 | | 7 | | 700 | | — | | — | | 700 | |
| | | | | | | | | | | | | | | | | | | | | | | |
(1)
| | 2000
|
|---|
| | Cinergy Business Units
| |
| |
| |
|
|---|
| | Commodities
| | Delivery
| | Cinergy
Investments
| | International
| | Total
| | All Other(1)
| | Reconciling
Eliminations(2)
| | Consolidated
|
|---|
| | (in millions)
|
|---|
| Operating revenues— | | | | | | | | | | | | | | | | | | | | | | | | |
| | External customers | | $ | 4,923 | | $ | 3,333 | | $ | 83 | | $ | 83 | | $ | 8,422 | | $ | — | | $ | — | | $ | 8,422 |
| | Intersegment revenues | | | 1,889 | | | — | | | — | | | — | | | 1,889 | | | — | | | (1,889 | ) | | — |
| Depreciation and amortization(3) | | | 212 | | | 146 | | | 3 | | | 13 | | | 374 | | | — | | | — | | | 374 |
| Equity in earnings of unconsolidated subsidiaries | | | (8 | ) | | — | | | 4 | | | 9 | | | 5 | | | — | | | — | | | 5 |
| Interest(4) | | | 99 | | | 92 | | | 11 | | | 22 | | | 224 | | | — | | | — | | | 224 |
| Income taxes | | | 159 | | | 109 | | | (6 | ) | | (10 | ) | | 252 | | | — | | | — | | | 252 |
| Segment profit (loss)(5) | | | 254 | | | 168 | | | (11 | ) | | (12 | ) | | 399 | | | — | | | — | | | 399 |
| Total segment assets | | | 7,084 | | | 4,413 | | | 283 | | | 508 | | | 12,288 | | | 42 | | | — | | | 12,330 |
| Investments in unconsolidated subsidiaries | | | 364 | | | — | | | 79 | | | 95 | | | 538 | | | — | | | — | | | 538 |
| Total expenditures for long-lived assets | | | 260 | | | 265 | | | (1 | ) | | — | | | 524 | | | 1 | | | — | | | 525 |
(1)- The All Other category represents miscellaneous corporate items, which are not allocated to business units for purposes of segment
profitperformance measurement. (2)
- The Reconciling Eliminations category eliminates the intersegment revenues of
Commodities. - Commercial.
(3)
The componentsElectric gross margins are calculated as Electric operating revenues less Fuel, emission allowances, and purchased power expense from the Statements of depreciation and amortization include depreciationIncome.(4) Gas gross margins are calculated as Gas operating revenues less Gas purchased expense from the Statements of fixed assets, amortization of intangible assets, amortization of phase-in deferrals, and amortization of post-in-service deferred operating expenses.
(4)InterestIncome.(5) Interest income is deemed immaterial.
(5)(6) The reduction in income taxes in 2004, as compared to 2003, primarily reflects lower business unit taxable income and also includes an increase in the annual tax credits associated with the production and sale of synthetic fuel. For further information, see Note 11(c)(iv).
(7) Management utilizes segmentSegment profit (loss), after taxes, to evaluate segment profitability.performance.
180
| | 2003 | | |
| | Cinergy Business Units | | | | | | | |
| | | | | | Power Technology | | | | | | Reconciling
Eliminations (2) | | | | |
| | Commercial | | Regulated | | and Infrastructure | | Total | | All Other (1) | | | Consolidated | | |
| | (in millions) | | |
Operating revenues - | | | | | | | | | | | | | | | | |
External customers | | $ | 1,630 | | $ | 2,786 | | $ | — | | $ | 4,416 | | $ | — | | $ | — | | $ | 4,416 | | |
Intersegment revenues | | 185 | | 1 | | — | | 186 | | — | | (186 | ) | — | | |
| | | | | | | | | | | | | | | | |
Gross margins | | | | | | | | | | | | | | | | |
Electric(3) | | 714 | | 1,469 | | — | | 2,183 | | — | | — | | 2,183 | | |
Gas(4) | | 88 | | 244 | | — | | 332 | | — | | — | | 332 | | |
| | | | | | | | | | | | | | | | |
Depreciation | | 135 | | 264 | | — | | 399 | | — | | — | | 399 | | |
Equity in earnings (losses) of unconsolidated subsidiaries | | 14 | | 4 | | (3 | ) | 15 | | — | | — | | 15 | | |
Interest expense(5) | | 94 | | 160 | | 17 | | 271 | | — | | — | | 271 | | |
| | | | | | | | | | | | | | | | |
Income taxes | | 7(6 | ) | 148 | | (11 | ) | 144 | | — | | — | | 144 | | |
| | | | | | | | | | | | | | | | |
Discontinued operations, net of tax(7) | | 9 | | — | | — | | 9 | | — | | — | | 9 | | |
Cumulative effect of changes in accounting principles (net of tax)(8) | | 26 | | — | | — | | 26 | | — | | — | | 26 | | |
| | | | | | | | | | | | | | | | |
Segment profit (loss)(9) | | 275 | | 211 | | (16 | ) | 470 | | — | | — | | 470 | | |
| | | | | | | | | | | | | | | | |
Segment assets from continuing operations | | 5,361 | | 8,515 | | 175 | | 14,051 | | 63 | | — | | 14,114 | | |
Segment assets from discontinued operations | | 5 | | — | | — | | 5 | | — | | — | | 5 | | |
Total segment assets | | 5,366 | | 8,515 | | 175 | | 14,056 | | 63 | | — | | 14,119 | | |
| | | | | | | | | | | | | | | | |
Investments in unconsolidated subsidiaries | | 400 | | 14 | | 81 | | 495 | | — | | — | | 495 | | |
Total expenditures for long-lived assets | | 158 | | 554 | | — | | 712 | | — | | — | | 712 | | |
| | | | | | | | | | | | | | | | | | | | | | | | | | | | | | | | | | |
(1) Business Units (cont.)
| | 1999
|
|---|
| | Cinergy Business Units
| |
| |
| |
|
|---|
| | Commodities
| | Delivery
| | Cinergy
Investments
| | International
| | Total
| | All Other(1)
| | Reconciling
Eliminations(2)
| | Consolidated
|
|---|
| | (in millions)
|
|---|
| Operating revenues— | | | | | | | | | | | | | | | | | | | | | | | | |
| | External customers | | $ | 2,586 | | $ | 3,232 | | $ | 59 | | $ | 61 | | $ | 5,938 | | $ | — | | $ | — | | $ | 5,938 |
| | Intersegment revenues | | | 1,857 | | | — | | | — | | | — | | | 1,857 | | | — | | | (1,857 | ) | | — |
| Depreciation and amortization(3) | | | 209 | | | 138 | | | — | | | 7 | | | 354 | | | — | | | — | | | 354 |
| Equity in earnings of unconsolidated subsidiaries | | | (2 | ) | | — | | | — | | | 60 | | | 58 | | | — | | | — | | | 58 |
| Gain on sale of investment in unconsolidated subsidiary | | | — | | | — | | | — | | | 99 | | | 99 | | | — | | | — | | | 99 |
| Interest(4) | | | 96 | | | 102 | | | 4 | | | 32 | | | 234 | | | 1 | | | — | | | 235 |
| Income taxes | | | 70 | | | 120 | | | (6 | ) | | 25 | | | 209 | | | — | | | — | | | 209 |
| Segment profit (loss)(5) | | | 136 | | | 184 | | | (9 | ) | | 93 | | | 404 | | | — | | | — | | | 404 |
| Total segment assets | | | 5,042 | | | 4,058 | | | 130 | | | 340 | | | 9,570 | | | 47 | | | — | | | 9,617 |
| Investments in unconsolidated subsidiaries | | | 257 | | | — | | | 25 | | | 77 | | | 359 | | | — | | | — | | | 359 |
| Total expenditures for long-lived assets | | | 131 | | | 256 | | | 3 | | | — | | | 390 | | | — | | | — | | | 390 |
(1)- The All Other category represents miscellaneous corporate items, which are not allocated to business units for purposes of segment
profitperformance measurement. (2)
- The Reconciling Eliminations
categorycolumn eliminates the intersegment revenues of Commodities. - Commercial.
(3)
The componentsElectric gross margins are calculated as Electric operating revenues less Fuel, emission allowances, and purchased power expense from the Statements of depreciation and amortization include depreciationIncome.(4) Gas gross margins are calculated as Gas operating revenues less Gas purchased expense from the Statements of fixed assets, amortization of intangible assets, amortization of phase-in deferrals, and amortization of post-in-service deferred operating expenses.
(4)InterestIncome.(5) Interest income is deemed immaterial.
(5)(6) The decrease in 2003, as compared to 2002, in part reflects the effect of tax credits associated with production of synthetic fuel beginning in July 2002.
(7) For further information, see Note 14.
(8) For further information, see Note 1(q)(iv).
(9) Management utilizes segmentSegment profit (loss), after taxes, to evaluate segment profitability.
performance.
181
Business Units (cont.)
| | 1998
|
|---|
| | Cinergy Business Units
| |
| |
| |
|
|---|
| | Commodities
| | Delivery
| | Cinergy
Investments
| | International
| | Total
| | All Other(1)
| | Reconciling
Eliminations(2)
| | Consolidated
|
|---|
| | (in millions)
|
|---|
| Operating revenues— | | | | | | | | | | | | | | | | | | | | | | | | |
| | External customers | | $ | 2,726 | | $ | 3,090 | | $ | 52 | | $ | 43 | | $ | 5,911 | | $ | — | | $ | — | | $ | 5,911 |
| | Intersegment revenues | | | 1,782 | | | — | | | — | | | — | | | 1,782 | | | — | | | (1,782 | ) | | — |
| Depreciation and amortization(3) | | | 197 | | | 127 | | | — | | | 2 | | | 326 | | | — | | | — | | | 326 |
| Equity in earnings of unconsolidated subsidiaries | | | (1 | ) | | — | | | (4 | ) | | 56 | | | 51 | | | — | | | — | | | 51 |
| Interest(4) | | | 95 | | | 91 | | | — | | | 51 | | | 237 | | | 7 | | | — | | | 244 |
| Income taxes | | | 57 | | | 90 | | | (6 | ) | | (17 | ) | | 124 | | | (7 | ) | | — | | | 117 |
| Segment profit (loss)(5) | | | 94 | | | 157 | | | (11 | ) | | 32 | | | 272 | | | (11 | ) | | — | | | 261 |
| Total segment assets | | | 4,863 | | | 3,987 | | | 42 | | | 752 | | | 9,644 | | | 43 | | | — | | | 9,687 |
| Investments in unconsolidated subsidiaries | | | — | | | — | | | 8 | | | 566 | | | 574 | | | — | | | — | | | 574 |
| Total expenditures for long-lived assets | | | 108 | | | 242 | | | 3 | | | — | | | 353 | | | 17 | | | — | | | 370 |
| | 2002 | |
| | Cinergy Business Units | | | | | | | |
| | | | | | Power Technology | | | | | | Reconciling
Eliminations(2) | | | |
| | Commercial | | Regulated | | and Infrastructure | | Total | | All Other(1) | | | Consolidated | |
| | (in millions) | |
Operating revenues - | | | | | | | | | | | | | | | |
External customers | | $ | 1,592 | | $ | 2,467 | | $ | — | | $ | 4,059 | | $ | — | | $ | — | | $ | 4,059 | |
Intersegment revenues | | 190 | | — | | — | | 190 | | — | | (190 | ) | — | |
| | | | | | | | | | | | | | | |
Gross margins | | | | | | | | | | | | | | | |
Electric(3) | | 735 | | 1,571 | | — | | 2,306 | | — | | — | | 2,306 | |
Gas(4) | | 77 | | 203 | | — | | 280 | | — | | — | | 280 | |
| | | | | | | | | | | | | | | |
Depreciation | | 150 | | 248 | | 6 | | 404 | | — | | — | | 404 | |
Equity in earnings (losses) of unconsolidated subsidiaries | | 20 | | 5 | | (10 | ) | 15 | | — | | — | | 15 | |
Interest expense(5) | | 102 | | 133 | | 9 | | 244 | | — | | — | | 244 | |
| | | | | | | | | | | | | | | |
Income taxes | | 23 | | 151 | | (14 | ) | 160 | | — | | — | | 160 | |
| | | | | | | | | | | | | | | |
Discontinued operations (net of tax)(6) | | (25 | ) | — | | — | | (25 | ) | — | | — | | (25 | ) |
Cumulative effect of a change in accounting principle (net of tax)(7) | | (11 | ) | — | | — | | (11 | ) | — | | — | | (11 | ) |
| | | | | | | | | | | | | | | |
Segment profit (loss)(8) | | 115 | | 270 | | (24 | ) | 361 | | — | | — | | 361 | |
| | | | | | | | | | | | | | | |
Segment assets from continuing operations | | 5,691 | | 7,746 | | 155 | | 13,592 | | 93 | | — | | 13,685 | |
Segment assets from discontinued operations | | 147 | | — | | — | | 147 | | — | | — | | 147 | |
Total segment assets | | 5,838 | | 7,746 | | 155 | | 13,739 | | 93 | | — | | 13,832 | |
| | | | | | | | | | | | | | | |
Investments in unconsolidated subsidiaries | | 337 | | 10 | | 70 | | 417 | | — | | — | | 417 | |
| | | | | | | | | | | | | | | |
Total expenditures for long-lived assets from continuing operations | | 184 | | 681 | | 1 | | 866 | | — | | — | | 866 | |
Total expenditures for long-lived assets from discontinued operations | | 4 | | — | | — | | 4 | | — | | — | | 4 | |
Total expenditures for long-lived assets | | 188 | | 681 | | 1 | | 870 | | — | | — | | 870 | |
| | | | | | | | | | | | | | | | | | | | | | |
(1)
The All Other category represents miscellaneous corporate items, which are not allocated to business units for purposes of segment profitperformance measurement.(2)
The Reconciling Eliminations categorycolumn eliminates the intersegment revenues of Commodities.Commercial.(3)
The components Electric gross margins are calculated as Electric operating revenues less Fuel, emission allowances, and purchased power expense from the Statements of depreciation and amortization include depreciationIncome.(4) Gas gross margins are calculated as Gas operating revenues less Gas purchased expense from the Statements of fixed assets, amortization of intangible assets, amortization of phase-in deferrals, and amortization of post-in-service deferred operating expenses.
(4)Income.(5) Interest income is deemed immaterial.
(5)(6) For further information, see Note 14.
(7) For further information, see Note 1(q)(iv).
(8) Management utilizes segment profit (loss), after taxes, to evaluate segment profitability.
performance.182
Products and Services
(in millions)
| | Revenues
|
|---|
| | Utility
| | Energy Marketing
and Trading
| |
| |
|
|---|
Year
| | Electric
| | Gas
| | Total
| | Electric
| | Gas
| | Total
| | Other
| | Consolidated
|
|---|
| | (in millions)
|
|---|
| 2000 | | $ | 2,932 | | $ | 503 | | $ | 3,435 | | $ | 2,452 | | $ | 2,439 | | $ | 4,891 | | $ | 96 | | $ | 8,422 |
| 1999 | | | 2,938 | | | 420 | | | 3,358 | | | 1,375 | | | 1,176 | | | 2,551 | | | 29 | | | 5,938 |
| 1998 | | | 2,707 | | | 441 | | | 3,148 | | | 2,056 | | | 659 | | | 2,715 | | | 48 | | | 5,911 |
| | Revenues | |
| | Traditional Utility | | Wholesale Commodity | | | | | |
Year | | Electric | | Gas | | Total | | Electric | | Gas | | Total | | Other | | Consolidated | |
2004 | | $ | 2,324 | | $ | 690 | | $ | 3,014 | | $ | 1,213 | | $ | 93 | | $ | 1,306 | | $ | 368 | | $ | 4,688 | |
2003 | | 2,156 | | 626 | | 2,782 | | 1,164 | | 210 | | 1,374 | | 260 | | 4,416 | |
2002 | | 2,024 | | 436 | | 2,460 | | 1,232 | | 155 | | 1,387 | | 212 | | 4,059 | |
| | | | | | | | | | | | | | | | | | | | | | | | | |
Our products and services focus on providing utility services (the supply of electric energy and gas) and energy marketing and trading services.
Geographic Areas and Long-Lived Assets
Revenues
| | Revenues
|
|---|
| |
| | International
| |
|
|---|
Year
| | Domestic
| | United Kingdom (UK)(1)
| | All Other(2)
| | Total
| | Consolidated
|
|---|
| | (in millions)
|
|---|
| 2000 | | $ | 8,339 | | $ | — | | $ | 83 | | $ | 83 | | $ | 8,422 |
| 1999 | | | 5,877 | | | — | | | 61 | | | 61 | | | 5,938 |
| 1998 | | | 5,868 | | | — | | | 43 | | | 43 | | | 5,911 |
| | Long-Lived Assets
|
|---|
| |
| | International
| |
|
|---|
Year
| | Domestic
| | United Kingdom (UK)(1)
| | All Other(2)
| | Total
| | Consolidated
|
|---|
| 2000 | | $ | 8,267 | | $ | — | | $ | 328 | | $ | 328 | | $ | 8,595 |
| 1999 | | | 7,841 | | | 2 | | | 277 | | | 279 | | | 8,120 |
| 1998 | | | 7,375 | | | 501 | | | 209 | | | 710 | | | 8,085 |
(1)As discussed (in Note 10, on July 15, 1999, we sold our 50% ownership interest in Midlands. Prior to the sale, Midlands had provided the majority of International's earnings.
(2)- millions)
Year | | Domestic | | International | | Consolidated | |
2004 | | $ | 4,637 | | $ | 51 | | $ | 4,688 | |
2003 | | 4,371 | | 45 | | 4,416 | |
2002 | | 4,011 | | 48 | | 4,059 | |
| | | | | | | | | | |
| | Long-Lived Assets from
Continuing Operations | | Long-Lived Assets from
Discontinued Operations | | Total Long-Lived Assets | |
| | (in millions) | | (in millions) | | (in millions) | |
Year | | Domestic | | International | | Consolidated | | Domestic | | International | | Consolidated | | Domestic | | International | | Consolidated | |
| | | | | | | | | | | | | | | | | | | |
2004 | | $ | 12,162 | | $ | 284 | | $ | 12,446 | | $ | — | | $ | — | | $ | — | | $ | 12,162 | | $ | 284 | | $ | 12,446 | |
2003 | | 11,524 | | 273 | | 11,797 | | — | | — | | — | | 11,524 | | 273 | | 11,797 | |
2002 | | 10,801 | | 296 | | 11,097 | | — | | 97 | | 97 | | 10,801 | | 393 | | 11,194 | |
| | | | | | | | | | | | | | | | | | | | | | | | | | | | |
183
International revenues are primarily from assets which we own in the Czech Republic, the majority of which are four district heating plants that provide 1,094 MW of thermal steam capacity which may be used to produce 149 MW of electricity. The Czech assets and results of operations are consolidated into our financial statements.17.
16. Earnings Per Common Share
A reconciliation of EPS - basic to EPS to earnings per common share assuming dilution (diluted EPS)- diluted is presented below:below for the years ended December 31, 2004, 2003, and 2002:
| | Income
| | Shares
| | EPS
|
|---|
| | (in millions, except per share amounts)
|
|---|
| 2000 | | | | | | | | |
| Basic EPS: | | | | | | | | |
| | Net income | | $ | 399 | | 159 | | $ | 2.51 |
| Effect of dilutive securities: | | | | | | | | |
| | Common stock options | | | | | 1 | | | |
| | |
| |
| | | |
| Diluted EPS: | | | | | | | | |
| | Net income plus assumed conversions | | $ | 399 | | 160 | | $ | 2.50 |
| 1999 | | | | | | | | |
| Basic EPS: | | | | | | | | |
| | Net income | | $ | 404 | | 159 | | $ | 2.54 |
| Effect of dilutive securities: | | | | | | | | |
| | Common stock options | | | | | — | | | |
| | |
| |
| | | |
| Diluted EPS: | | | | | | | | |
| | Net income plus assumed conversions | | $ | 404 | | 159 | | $ | 2.53 |
| 1998 | | | | | | | | |
| Basic EPS: | | | | | | | | |
| | Net income | | $ | 261 | | 158 | | $ | 1.65 |
| Effect of dilutive securities: | | | | | | | | |
| | Common stock options | | | | | 1 | | | |
| | |
| |
| | | |
| Diluted EPS: | | | | | | | | |
| | Net income plus assumed conversions | | $ | 261 | | 159 | | $ | 1.65 |
| | Income | | Shares | | EPS | |
| | (in thousands, except per share amounts) | |
| | | | | | | |
Year ended December 31, 2004 | | | | | | | |
EPS - basic: | | | | | | | |
Net income | | $ | 400,868 | | 180,965 | | $ | 2.22 | |
| | | | | | | |
Effect of dilutive securities: | | | | | | | |
Common stock options | | | | 678 | | | |
Directors’ compensation plans | | | | 150 | | | |
Contingently issuable common stock | | | | 605 | | | |
Stock purchase contracts | | | | 1,133 | | | |
| | | | | | | |
EPS - diluted: | | | | | | | |
Net income plus assumed conversions | | $ | 400,868 | | 183,531 | | $ | 2.18 | |
| | | | | | | |
Year ended December 31, 2003 | | | | | | | |
EPS - basic: | | | | | | | |
Income before discontinued operations and cumulative effect of changes in accounting principles | | $ | 434,424 | | | | $ | 2.46 | |
Discontinued operations, net of tax | | 8,886 | | | | 0.05 | |
Cumulative effect of changes in accounting principles, net of tax | | 26,462 | | | | 0.15 | |
Net income | | $ | 469,772 | | 176,535 | | $ | 2.66 | |
| | | | | | | |
Effect of dilutive securities: | | | | | | | |
Common stock options | | | | 746 | | | |
Directors’ compensation plans | | | | 152 | | | |
Contingently issuable common stock | | | | 851 | | | |
Stock purchase contracts | | | | 189 | | | |
| | | | | | | |
EPS - diluted: | | | | | | | |
Net income plus assumed conversions | | $ | 469,772 | | 178,473 | | $ | 2.63 | |
| | | | | | | |
Year ended December 31, 2002 | | | | | | | |
EPS - basic: | | | | | | | |
Income before discontinued operations and cumulative effect of a change in accounting principle | | $ | 396,636 | | | | $ | 2.37 | |
Discontinued operations, net of tax | | (25,161 | ) | | | (0.15 | ) |
Cumulative effect of a change in accounting principle, net of tax | | (10,899 | ) | | | (0.06 | ) |
Net income | | $ | 360,576 | | 167,047 | | $ | 2.16 | |
| | | | | | | |
Effect of dilutive securities: | | | | | | | |
Common stock options | | | | 899 | | | |
Employee Stock Purchase and Savings Plan | | | | 3 | | | |
Directors’ compensation plans | | | | 169 | | | |
Contingently issuable common stock | | | | 934 | | | |
| | | | | | | |
EPS - diluted: | | | | | | | |
Net income plus assumed conversions | | $ | 360,576 | | 169,052 | | $ | 2.13 | |
| | | | | | | | | | | |
Options to purchase shares of common stock are excluded from the calculation of EPS - diluted, EPS whenif they are considered to be anti-dilutive. For the exercise prices of these options are greater than the average market price of the common shares during the period. For 2000, 1999,years ended December 31, 2004, 2003, and 1998,2002, approximately two0.9 million, two1.6 million, and one3.0 million shares, respectively, were excluded from the EPS - diluted EPS calculation.
The Employee Stock Purchase and Savings Plan was also
Also excluded from the EPS - diluted EPS calculation for the years ended December 31, 2004, 2003, and 2002 are up to 9.7 million, 10.6 million, and 10.8 million shares, respectively, issuable pursuant to the stock purchase contracts issued by Cinergy Corp.in 2000, 1999, December 2001 associated with the preferred trust securities transaction. In January
184
and 1998 sinceFebruary 2005, the stock purchase price was greater than the average market price during this period. This plan allows all full-time, regular employees to purchasecontracts were settled and holders purchased a total of 9.2 million shares of Cinergy Corp.common stock pursuantstock. Net proceeds of approximately $316 million were used to reduce short-term debt.
18. Comprehensive Income
Comprehensive income includes all changes in equity during a stock option feature.period except those resulting from investments by and distributions to shareholders. The major components include net income, foreign currency translation adjustments, minimum pension liability adjustments, unrealized gains and losses on investment trusts and the effects of certain hedging activities.
We translate the assets and liabilities of foreign subsidiaries, whose functional currency (generally, the local currency of the country in which the subsidiary is located) is not the United States dollar, using the appropriate exchange rate as of the end of the year. Foreign currency translation adjustments are unrealized gains and losses on the difference in foreign country currency compared to the value of the United States dollar. The gains and losses are accumulated in comprehensive income. When a foreign subsidiary is substantially liquidated, the cumulative translation gain or loss is removed from comprehensive income and is recognized as a component of the gain or loss on the sale of the subsidiary in our Statements of Income.
17. WVPA SettlementWe record a minimum pension liability adjustment associated with our defined benefit pension plans when the unfunded accumulated benefit obligation is in excess of our accrued pension liabilities and the unrecognized prior service costs recorded as an intangible asset. The corresponding offset is recorded on the Balance Sheets in Accrued pension and other postretirement benefit costs. Details of the pension plans’ assets and obligations are explained further in Note 9.
We record unrealized gains and losses on equity investments in trusts we have established for our benefit plans, primarily by PSI. See Note 9 for further details.
The changes in fair value of derivatives that qualify as hedges, under Statement 133, are recorded in comprehensive income. The specific hedge accounting and the derivatives that qualify are explained in greater detail in Note 7(a).
185
The elements of Comprehensive income and their related tax effects for the years ended December 31, 2004, 2003, and 2002 are as follows:
| | Comprehensive Income | |
| | 2004 | | 2003 | | 2002 | |
| | Before-tax Amount | | Tax (Expense) Benefit | | Net-of-Tax Amount | | Before-tax Amount | | Tax (Expense) Benefit | | Net-of-Tax Amount | | Before-tax Amount | | Tax (Expense) Benefit | | Net-of-Tax Amount | |
| | (dollars in millions) | |
Cinergy(1) | | | | | | | | | | | | | | | | | | | |
Net income | | $ | 505 | | $ | (104 | ) | $ | 401 | | $ | 626 | | $ | (156 | ) | $ | 470 | | $ | 519 | | $ | (158 | ) | $ | 361 | |
| | | | | | | | | | | | | | | | | | | |
Other comprehensive income (loss): | | | | | | | | | | | | | | | | | | | |
Foreign currency translation adjustment | | 23 | | (8 | ) | 15 | | 25 | | (8 | ) | 17 | | 36 | | (14 | ) | 22 | |
Reclassification adjustments | | — | | — | | — | | (9 | ) | 3 | | (6 | ) | 4 | | — | | 4 | |
Total foreign currency translation adjustment | | 23 | | (8 | ) | 15 | | 16 | | (5 | ) | 11 | | 40 | | (14 | ) | 26 | |
Minimum pension liability adjustment | | (53 | ) | 21 | | (32 | ) | (56 | ) | 22 | | (34 | ) | (23 | ) | 9 | | (14 | ) |
Unrealized gain (loss) on investment trusts | | 4 | | (2 | ) | 2 | | 11 | | (4 | ) | 7 | | (8 | ) | 3 | | (5 | ) |
Cash flow hedges | | 8 | | (3 | ) | 5 | | 2 | | (1 | ) | 1 | | (33 | ) | 13 | | (20 | ) |
Total other comprehensive income (loss) | | (18 | ) | 8 | | (10 | ) | (27 | ) | 12 | | (15 | ) | (24 | ) | 11 | | (13 | ) |
| | | | | | | | | | | | | | | | | | | |
Total comprehensive income | | $ | 487 | | $ | (96 | ) | $ | 391 | | $ | 599 | | $ | (144 | ) | $ | 455 | | $ | 495 | | $ | (147 | ) | $ | 348 | |
| | | | | | | | | | | | | | | | | | | |
CG&E and subsidiaries(2) | | | | | | | | | | | | | | | | | | | |
Net income | | $ | 415 | | $ | (158 | ) | $ | 257 | | $ | 529 | | $ | (198 | ) | $ | 331 | | $ | 419 | | $ | (155 | ) | $ | 264 | |
| | | | | | | | | | | | | | | | | | | |
Other comprehensive income (loss): | | | | | | | | | | | | | | | | | | | |
Minimum pension liability adjustment | | (16 | ) | 6 | | (10 | ) | (13 | ) | 5 | | (8 | ) | (1 | ) | — | | (1 | ) |
Cash flow hedges | | 7 | | (3 | ) | 4 | | 2 | | (1 | ) | 1 | | (32 | ) | 13 | | (19 | ) |
Total other comprehensive income (loss) | | (9 | ) | 3 | | (6 | ) | (11 | ) | 4 | | (7 | ) | (33 | ) | 13 | | (20 | ) |
| | | | | | | | | | | | | | | | | | | |
| | | | | | | | | | | | | | | | | | | | | | | | | | | | | | | | | | | | | |
Total comprehensive income | | $ | 406 | | $ | (155 | ) | $ | 251 | | $ | 518 | | $ | (194 | ) | $ | 324 | | $ | 386 | | $ | (142 | ) | $ | 244 | |
| | | | | | | | | | | | | | | | | | | |
PSI | | | | | | | | | | | | | | | | | | | |
Net income | | $ | 277 | | $ | (112 | ) | $ | 165 | | $ | 233 | | $ | (100 | ) | $ | 133 | | $ | 329 | | $ | (115 | ) | $ | 214 | |
| | | | | | | | | | | | | | | | | | | |
Other comprehensive income (loss): | | | | | | | | | | | | | | | | | | | |
Minimum pension liability adjustment | | (21 | ) | 8 | | (13 | ) | (18 | ) | 7 | | (11 | ) | (3 | ) | 1 | | (2 | ) |
Unrealized gain (loss) on investment trusts | | 3 | | (1 | ) | 2 | | 10 | | (4 | ) | 6 | | (7 | ) | 3 | | (4 | ) |
Total other comprehensive income (loss) | | (18 | ) | 7 | | (11 | ) | (8 | ) | 3 | | (5 | ) | (10 | ) | 4 | | (6 | ) |
| | | | | | | | | | | | | | | | | | | |
Total comprehensive income | | $ | 259 | | $ | (105 | ) | $ | 154 | | $ | 225 | | $ | (97 | ) | $ | 128 | | $ | 319 | | $ | (111 | ) | $ | 208 | |
(1) The results of Cinergy also include amounts related to non-registrants.
(2) Individual amounts for ULH&P are immaterial.
186
The after-tax components of Accumulated other comprehensive income (loss) as of December 31, 2004, 2003, and 2002 are as follows:
| | Accumulated Other Comprehensive Income (Loss) Classification | |
| | Foreign Currency Translation Adjustment | | Minimum Pension Liability Adjustment | | Unrealized Gain (Loss) on Investment Trusts | | Cash Flow Hedges | | Total Other Comprehensive Income (Loss) | |
| | (dollars in millions) | |
| | | | | | | | | | | |
Cinergy(1) | | | | | | | | | | | |
| | | | | | | | | | | |
Balance at December 31, 2001 | | $ | (5 | ) | $ | (6 | ) | $ | (1 | ) | $ | (5 | ) | $ | (17 | ) |
Current-period change | | 26 | | (14 | ) | (5 | ) | (20 | ) | (13 | ) |
| | | | | | | | | | | |
Balance at December 31, 2002 | | $ | 21 | | $ | (20 | ) | $ | (6 | ) | $ | (25 | ) | $ | (30 | ) |
Current-period change | | 11 | | (34 | ) | 7 | | 1 | | (15 | ) |
| | | | | | | | | | | |
Balance at December 31, 2003 | | $ | 32 | | $ | (54 | ) | $ | 1 | | $ | (24 | ) | $ | (45 | ) |
Current-period change | | 15 | | (32 | ) | 2 | | 5 | | (10 | ) |
| | | | | | | | | | | |
Balance at December 31, 2004 | | $ | 47 | | $ | (86 | ) | $ | 3 | | $ | (19 | ) | $ | (55 | ) |
| | | | | | | | | | | |
CG&E and subsidiaries(2) | | | | | | | | | | | |
| | | | | | | | | | | |
Balance at December 31, 2001 | | $ | — | | $ | (1 | ) | $ | — | | $ | (5 | ) | $ | (6 | ) |
Current-period change | | — | | (1 | ) | — | | (19 | ) | (20 | ) |
| | | | | | | | | | | |
Balance at December 31, 2002 | | $ | — | | $ | (2 | ) | $ | — | | $ | (24 | ) | $ | (26 | ) |
Current-period change | | — | | (8 | ) | — | | 1 | | (7 | ) |
| | | | | | | | | | | |
Balance at December 31, 2003 | | $ | — | | $ | (10 | ) | $ | — | | $ | (23 | ) | $ | (33 | ) |
Current-period change | | — | | (9 | ) | — | | 4 | | (5 | ) |
| | | | | | | | | | | |
Balance at December 31, 2004 | | $ | — | | $ | (19 | ) | $ | — | | $ | (19 | ) | $ | (38 | ) |
| | | | | | | | | | | |
PSI | | | | | | | | | | | |
| | | | | | | | | | | |
Balance at December 31, 2001 | | $ | — | | $ | (1 | ) | $ | (1 | ) | $ | — | | $ | (2 | ) |
Current-period change | | — | | (2 | ) | (4 | ) | — | | (6 | ) |
| | | | | | | | | | | |
Balance at December 31, 2002 | | $ | — | | $ | (3 | ) | $ | (5 | ) | $ | — | | $ | (8 | ) |
Current-period change | | — | | (11 | ) | 6 | | — | | (5 | ) |
| | | | | | | | | | | |
Balance at December 31, 2003 | | $ | — | | $ | (14 | ) | $ | 1 | | $ | — | | $ | (13 | ) |
Current-period change | | — | | (13 | ) | 2 | | — | | (11 | ) |
| | | | | | | | | | | |
Balance at December 31, 2004 | | $ | — | | $ | (27 | ) | $ | 3 | | $ | — | | $ | (24 | ) |
(1) The results of Cinergy also include amounts related to non-registrants.
(2) Individual amounts for ULH&P are immaterial.
187
19. Transfer of Generating Assets
In February 1989,PSI and WVPA entered intoDecember 2002, the IURC approved a settlement agreement to resolve all claims related to Marble Hill, a nuclear project canceled in 1984. Implementationamong PSI, the Indiana Office of the settlement was contingentUtility Consumer Counselor, and the IURC Staff authorizing PSI’s purchases of the Henry County, Indiana and Butler County, Ohio, gas-fired peaking plants from two non-regulated affiliates. In February 2003, the FERC issued an order under Section 203 of the Federal Power Act authorizing PSI’s acquisitions of the plants, which occurred on February 5, 2003. Subsequently, in April 2003, the FERC issued a number of events. During 1998,PSI reached agreement on all matters with the relevant parties and, astolling order allowing additional time to consider a result, recorded a liabilityrequest for rehearing filed in response to the RUS.February 2003 FERC order. In September 2004, FERC issued an order denying the request for rehearing and affirming the acquisition of the plants.
The KPSC has conditionally approved ULH&P’s PSIplanned acquisition of CG&E’s will repay 68.9 percent ownership interest in the obligation toEast Bend Generating Station, located in Boone County, Kentucky, the RUS with interest over a 35-year term.Woodsdale Generating Station, located in Butler County, Ohio, and one generating unit at the four-unit Miami Fort Station located in Hamilton County, Ohio. ULH&P is currently seeking approval for the transaction from the SEC, wherein the Ohio Consumers Counsel has intervened in opposition, and the FERC. The net proceeds from a 35-year power sales agreement with WVPAtransfer, which will be usedpaid for at net book value, will not affect current electric rates for ULH&P’s customers, as power will be provided under the same terms as under the current wholesale power contract with CG&E through December 31, 2006. Assuming receipt of regulatory approvals, we would anticipate the transfer to fund the principal and interest on the obligation to the RUS. Assumption of the liability (recorded asLong-term debt in the Consolidated Balance Sheet) resulted in a charge against earnings of $80 million ($50 million after tax or $.32 per share basic and diluted)take place in the second quarter of 1998.
18. Ohio Deregulation2005.
On July 6, 1999, Ohio Governor Robert Taft signed Amended Substitute Senate Bill No. 3 (Electric Restructuring Bill), beginning the transition to electric deregulation and customer choice for the state of Ohio. The Electric Restructuring Bill created a competitive electric retail service market effective January 1, 2001. The legislation provided for a market development period that began January 1, 2001, and ends no later than December 31, 2005. Ohio electric utilities have an opportunity to recover PUCO approved transition costs during a transition period. The legislation also froze retail electric rates during the market development period, at the rates in effect on October 4, 1999, except for a five-percent reduction in the generation component of residential rates. Furthermore, the legislation contemplated that 20% of the current electric retail customers will switch suppliers no later than December 31, 2003.
188
On May 8, 2000,CG&E reached a stipulated agreement with the PUCO staff and various other interested parties with respect to its proposal to implement electric customer choice in Ohio effective January 1, 2001. On August 31, 2000, the PUCO approvedCG&E's stipulation agreement. The major features of this agreement include:•Residential customer rates will be frozen through December 31, 2005;•Residential customers will receive a five-percent reduction in the generation portion of their electric rates, effective January 1, 2001;•CG&E has agreed to provide four million dollars over the next five years in support of energy efficiency and weatherization services for low income customers;•The creation of an RTC designed to recoverCG&E's regulatory assets and other transition costs over a ten-year period;•Authority forCG&E to transfer its generation assets to one or more separate, non-regulated corporate subsidiary(ies) to provide flexibility to manage its generation asset portfolio in a manner that enhances opportunities in a competitive marketplace;•Authority forCG&E to apply the proceeds of transition cost recovery to costs incurred during the transition period including implementation costs and purchased power costs that may be incurred byCG&E to maintain an operating reserve margin sufficient to provide reliable service to its customers;•CG&E will provide standard offer default supplier service (i.e.,CG&E will be the supplier of last resort, so that no customer will be without an electric supplier); and•CG &E has agreed to provide shopping credits to switching customers.
With regard to the PUCO's order, two parties filed applications for rehearing with the PUCO. On October 18, 2000, the PUCO denied these applications. One of the parties appealed to the Ohio Supreme Court in the fourth quarter of 2000 andCG&E subsequently intervened in that case.CG&E is unable to predict the outcome of the appeal.
As indicated above, the August 31, 2000 order authorizesCG&E to transfer its generation assets to one or more non-regulated corporate subsidiary(ies). This transfer may require the approval or consent of one or more of the following: the IURC, the Kentucky Public Service Commission, the FERC, the SEC under the PUHCA, and various third parties. As the transfer is contingent upon the company receiving various consents and approvals, the timing and receipt of which are unknown, the completion date of the transfer of generation assets to a non-regulated subsidiary is uncertain. See Note 1(c) regarding the effects of the transition order.
In connection with the approval of the stipulation agreement,CG&E discontinued the application of Statement 71 for the generation portion of its business and adopted Statement 101, with no material financial statement impact. Pursuant to Statement of Financial Accounting Standards No. 121,Accounting for the Impairment of Long-Lived Assets and for Long-Lived Assets to Be Disposed Of our analysis indicates future revenues will be sufficient to recover the costs of our generating assets over their estimated remaining lives.
ITEM 9. CHANGES IN AND DISAGREEMENTS WITH ACCOUNTANTS ON
ACCOUNTING AND FINANCIAL DISCLOSURE
None.
Disclosure controls and procedures are our controls and other procedures that are designed to provide reasonable assurance that information required to be disclosed by us in the reports that we file or submit under the Securities Exchange Act of 1934 (Exchange Act) is recorded, processed, summarized, and reported, within the time periods specified in the Securities and Exchange Commission’s (SEC) rules and forms. Disclosure controls and procedures include, without limitation, controls and procedures designed to provide reasonable assurance that information required to be disclosed by us in the reports that we file under the Exchange Act is accumulated and communicated to our management, including our chief executive officer and chief financial officer, as appropriate to allow timely decisions regarding required disclosure.
Under the supervision and with the participation of our management, including our chief executive officer and chief financial officer, we have evaluated the effectiveness of our disclosure controls and procedures as of December 31, 2004, and, based upon this evaluation, our chief executive officer and chief financial officer have concluded that these controls and procedures are effective in providing reasonable assurance that information requiring disclosure is recorded, processed, summarized, and reported within the timeframe specified by the SEC’s rules and forms.
Under the supervision and with the participation of our management, including our chief executive officer and chief financial officer, we have evaluated any change in our internal control over financial reporting (as such term is defined in Rules 13a-15(f) and 15d-15(f) under the Exchange Act) during the fiscal quarter ended December 31, 2004 and found no change that has materially affected, or is reasonably likely to materially affect, our internal control over financial reporting.
Management Report on Internal Control over Financial Reporting
Management of Cinergy Corp. (the Company) is responsible for establishing and maintaining adequate internal control over financial reporting, as defined in Rules 13a-15(f) and 15d-15(f) under the Exchange Act. The Company’s internal control over financial reporting is designed to provide reasonable assurance regarding the reliability of financial reporting and the preparation of financial statements for external purposes, in accordance with generally accepted accounting principles.
Because of its inherent limitations, internal control over financial reporting may not prevent or detect misstatements. Also, projections of any evaluation of effectiveness to future periods are subject to the risk that controls may become inadequate because of changes in conditions, or that the degree of compliance with the policies or procedures may deteriorate.
The Company’s management assessed the effectiveness of the Company’s internal control over financial reporting as of December 31, 2004. In making this assessment, management used the criteria established in Internal Control-Integrated Framework issued by the Committee of Sponsoring Organizations of the Treadway Commission.
Based on our assessment and those criteria, management believes that the internal control over financial reporting maintained by the Company, as of December 31, 2004, was effective.
The Company’s independent auditors have issued an attestation report on management’s assessment of the Company’s internal control over financial reporting. That report follows.
189
REPORT OF INDEPENDENT REGISTERED PUBLIC ACCOUNTING FIRM
To the Board of Directors and Stockholders of Cinergy Corp.
Cincinnati, Ohio
We have audited management’s assessment, included in the accompanying Management Report on Internal Control over Financial Reporting, that the Company maintained effective internal control over financial reporting as of December 31, 2004, based on criteria established in Internal Control-Integrated Framework issued by the Committee of Sponsoring Organizations of the Treadway Commission. The Company’s management is responsible for maintaining effective internal control over financial reporting and for its assessment of the effectiveness of internal control over financial reporting. Our responsibility is to express an opinion on management’s assessment and an opinion on the effectiveness of the Company’s internal control over financial reporting based on our audit.
We conducted our audit in accordance with the standards of the Public Company Accounting Oversight Board (United States). Those standards require that we plan and perform the audit to obtain reasonable assurance about whether effective internal control over financial reporting was maintained in all material respects. Our audit included obtaining an understanding of internal control over financial reporting, evaluating management’s assessment, testing and evaluating the design and operating effectiveness of internal control, and performing such other procedures as we considered necessary in the circumstances. We believe that our audit provides a reasonable basis for our opinions.
A company’s internal control over financial reporting is a process designed by, or under the supervision of, the company’s principal executive and principal financial officers, or persons performing similar functions, and effected by the company’s board of directors, management, and other personnel to provide reasonable assurance regarding the reliability of financial reporting and the preparation of financial statements for external purposes in accordance with generally accepted accounting principles. A company’s internal control over financial reporting includes those policies and procedures that (1) pertain to the maintenance of records that, in reasonable detail, accurately and fairly reflect the transactions and dispositions of the assets of the company; (2) provide reasonable assurance that transactions are recorded as necessary to permit preparation of financial statements in accordance with generally accepted accounting principles, and that receipts and expenditures of the company are being made only in accordance with authorizations of management and directors of the company; and (3) provide reasonable assurance regarding prevention or timely detection of unauthorized acquisition, use, or disposition of the company’s assets that could have a material effect on the financial statements.
Because of the inherent limitations of internal control over financial reporting, including the possibility of collusion or improper management override of controls, material misstatements due to error or fraud may not be prevented or detected on a timely basis. Also, projections of any evaluation of the effectiveness of the internal control over financial reporting to future periods are subject to the risk that the controls may become inadequate because of changes in conditions, or that the degree of compliance with the policies or procedures may deteriorate.
In our opinion, management’s assessment that the Company maintained effective internal control over financial reporting as of December 31, 2004, is fairly stated, in all material respects, based on the criteria established in Internal Control-Integrated Framework issued by the Committee of Sponsoring Organizations of the Treadway Commission. Also in our opinion, the Company maintained, in all material respects, effective internal control over financial reporting as of December 31, 2004, based on the criteria established in Internal Control-Integrated Framework issued by the Committee of Sponsoring Organizations of the Treadway Commission.
We have also audited, in accordance with the standards of the Public Company Accounting Oversight Board (United States), the consolidated financial statements and financial statement schedule as of and for the year ended December 31, 2004 of the Company and our report dated February 11, 2005 expressed an unqualified opinion on those financial statements and financial statement schedule and contained an explanatory paragraph regarding the Company’s change in accounting in 2003, for asset retirement obligations, variable interest entities, and stock-based compensation.
/s/ Deloitte & Touche LLP | |
Deloitte & Touche LLP | |
| |
Cincinnati, Ohio | |
February 11, 2005 | |
190
Information regardingCinergy Corp.'s’s directors is incorporated by reference from its definitive Proxy Statement for the 20012005 Annual Meeting of Shareholders.
The directors of The Cincinnati Gas & Electric Company (CG&E) at January 31, 2001,2005, are as follows:
•
- Michael J.
Joseph Hale, Jr.Cyrus —-Mr. Hale,Cyrus, age 51,49, is Executive Vice President ofCG&E, a position he has held since July 2000.February 2001. He has served as a director ofCG&E since December 2000.September 2001. His current term as director expires April 30, 2001.May 4, 2005.•
•- James E. Rogers
— - Mr. Rogers, age 53,57, is Chairman of the Board and Chief Executive Officer ofCG&E. He has served as a director ofCG&E since 1994. His current term as director expires April 30, 2001.May 4, 2005.•
•- James L. Turner
— - Mr. Turner, age 41,45, is Executive Vice President and Chief Financial Officer ofCG&E, a position he has held since September 2004. Prior to that, Mr. Turner served as Executive Vice President of CG&E since July 2000. He has served as a director ofCG&E since from February 15, 1999. His1999 to April 30, 2001 and was re-elected, effective October 1, 2001. Mr. Turner’s current term as director expires April 30, 2001.
May 4, 2005.Additional information on each of the directors ofCG&E is presented in and incorporated in the following "Executive Officers"“Executive Officers” section.
Information regarding PSI Energy, Inc.'s’s (PSI) directors is incorporated by reference from its 2001PSI’s 2005 Information Statement.
192
The names and ages of the executive officers of each registrant, their ages (as of December 31, 2000)Cinergy, CG&E, and PSI and the positions they hold, held, or have been elected to as(as of this report filing date,January 31, 2005), and their business experience during the past five years is included in the chart below.
| |
| | |
|
|
|
| Positions and Length of Service
|
|---|
| Name | Name
| | | Age
| | |
| Cinergy Corp.
| | |
| CG&E
| | |
| PSI
|
|---|
Vicky A. Bailey(1) | | 48 | | | | | | President
2/00 - present |
John Bryant(2) | | 54 | | Vice President
1/98 - present
President, International Business Unit
7/00 - 2/01 | | | | |
Michael J. Cyrus(3)Cyrus | | 4549 | | Executive Vice President
2/01 - present
Chief Executive Officer, Regulated Business Unit
9/04 - present
Chief Executive Officer, Commercial Business Unit (formerly known as the Energy Merchant Business UnitUnit)
2/01 - present9/04
President, Energy Commodities Business Unit
3/99 - 2/01
Vice President
4/98 - 2/01 |
| Executive VicePresident
2/01 - present
Vice President
4/9899 - present
2/01Chief Operating Officer, Energy Commodities Business Unit
11/98 - 3/99 |
| Executive Vice President
2/01 - present
Vice President
4/99 - 2/01 |
R. Foster Duncan(1) | | 50 | | Executive Vice President
2/01 - present
Chief Executive Officer, Commercial Business Unit
Vice President
4/999/04 - present
Chief Financial Officer
2/01 - 9/04 |
R. Foster Duncan(4) |
| 46 | | Executive Vice President and Chief Financial Officer
2/01 - present
Chief Financial Officer
2/01 - 9/04 |
| Executive Vice President and Chief Financial Officer
2/01 - present | |
Executive Vice President and Chief Financial Officer
2/01 - present9/04 |
Lisa D. Gamblin(5)Gregory C. Ficke | | 3752 | | Vice President and Treasurer
10/00 - present
Vice President and Chief FinancialInformation Officer, Regulated Business Unit
2/01 - 10/01
Vice President and Chief Information Officer, Energy Delivery Business Unit
3/997/00 - 10/002/01
Vice President, and Chief Financial Officer, InternationalOperations Services, Energy Delivery Business Unit
4/99 - 7/00 |
| President
2/9810/01 - 3/99
presentManager, Corporate Development
5/97 - 2/98 | | |
Lynn J. Good(2) | | 45 | | Vice President, Finance and TreasurerController
10/0011/03 - present | |
Vice President, Financial
Project Strategy
5/03 - 11/03 |
| Vice President, Finance and TreasurerController
10/0011/03 - present
Vice President, Financial
Project Strategy
5/03 - 11/03 |
| Vice President, Finance and Controller
11/03 - present
Vice President, Financial
Project Strategy
5/03 - 11/03 |
William J. Grealis(6)Grealis | | 5559 | | Executive Vice President
2/017/00 - present
Chief Executive Officer, Regulated Businesses Business Unit
2/01 - present10/01
Executive Vice President and Chief of Staff
7/00 - 2/01
Vice President, Corporate Services, and Chief Strategic Officer
8/98 - 7/00
Vice President
1/95 - 8/98 |
| Executive Vice President
2/017/00 - present
Executive Vice President and Chief of Staff
7/00 - 2/01
Vice President, Corporate Services, and Chief Strategic Officer
8/98 - 7/00
Vice President
4/98 - 8/98
President
1/95 - 3/98 |
| Executive Vice President
2/017/00 - present
Executive Vice President and Chief of Staff
7/00 - 2/01
Vice President, Corporate Services, and Chief Strategic Officer
8/98 - 7/00
Vice President
4/98 - 8/98 |
J. Joseph Hale, Jr.(7)Julia S. Janson | | 5140 | | Vice PresidentChief Compliance Officer
12/9610/04 - present
Secretary
| | President
7/00 - present
Senior CounselVice President
8/7/98 - 7/00
present |
| General Manager, Marketing OperationsChief Compliance Officer
1/9510/04 - 8/98present
Secretary
| |
1/03 - present
Vice PresidentAssistant Secretary
2/7/00 - 1/03
Senior Counsel
7/00
Interim President
6/99 - 2/00
Vice President
8/98 - 6/99present |
M. Stephen Harkness(8) |
| 52 | | Vice PresidentChief Compliance Officer
12/9610/04 - present
General Manager, Corporate Development and Financial Services
10/94 - 12/96
| | | | |
Donald B. Ingle, Jr.(9) | | 51 | | President, Power Technology and Infrastructure Services Business Unit
2/01 - present
President, Cinergy Investments Business Unit
3/99 - 2/01
Vice President
10/97 - present | | Vice President
10/97 - 3/99 | | Vice President
10/97 - 3/99 |
Julia S. Janson | | 36 | | Secretary
7/00 - present
Senior Counsel
7/98 - present
Counsel
5/96 - 7/98
Manager, Investor Relations
1/95 - 5/96 |
193
|
| Assistant Secretary
7/00 - present
Senior Counsel
7/98 - present
Counsel
5/96 - 7/98
Manager, Investor Relations
1/95 - 5/96
|
| SecretaryPositions and Length of Service
7/00 - present
Senior Counsel
7/98 - present
Counsel
5/96 - 7/98
Manager, Investor Relations
1/95 - 5/96
|
Bernard F. RobertsName |
| 48Age |
| Vice President and ComptrollerCinergy Corp.
|
|
3/99 - present
CG&E
|
| PSI |
Marc E. Manly(3) | | 52 | | Executive Vice President and Chief FinancialLegal Officer Energy Commodities Business Unit
7/9611/02 - 3/99present
Assistant TreasurerSecretary
1/03 - present |
| Executive Vice President and Chief Legal Officer
12/9411/02 - 7/96present |
| Executive Vice President and Chief Legal Officer
11/02 - present
Assistant Secretary
1/03 - present |
Theodore R. Murphy II(4) | | 47 | | Senior Vice President and Chief Risk Officer
8/02 - present |
| Senior Vice President and Chief Risk Officer
8/02 - present |
| Senior Vice President and Chief Risk Officer
8/02 - present |
Frederick J. Newton III(5) | | 49 | | Executive Vice President and Chief Administrative Officer
5/02 - present |
| Executive Vice President and Chief Administrative Officer
5/02 - present |
| Executive Vice President and Chief Administrative Officer
5/02 - present |
Kay E. Pashos | | 45 |
| Vice President and ComptrollerGeneral Counsel, Regulated Business Unit
3/99 - present11/03 -12/04
Assistant TreasurerGeneral Counsel
1/01 - 11/03
Senior Counsel
1/95 - 7/961/01 |
|
|
| President
12/04 - present
Vice President and ComptrollerGeneral Counsel, Regulated Business Unit
11/03 -12/04
Assistant General Counsel
1/01 - 11/03
Senior Counsel
1/95 - 1/01 |
Ronald R. Reising(6) | | 44 |
| Chief Procurement Officer
3/9910/04 - present
Vice President
6/02 - present |
| Assistant TreasurerChief Procurement Officer
12/9410/04 - 7/96present
Vice President
6/02 - present
|
| Chief Procurement Officer
10/04 - present
Vice President
6/02 - present |
James E. Rogers | | 5357 |
| Chairman of the Board 12/00 - present
President and Chief Executive Officer
12/95 - present
Vice Chairman
12/95 - 12/00 |
| Chairman of the Board 12/00 - present
Chief Executive Officer
12/95 - present
Vice Chairman
12/95 - 12/00 |
| Chairman of the Board
12/00 - present
Vice Chairman, President and Chief Executive Officer
12/95 - present
Vice Chairman
12/95 - 12/00 |
James L. Turner(7) | | Chairman of the Board and Chief Executive Officer
12/00 - present
Vice Chairman and Chief Executive Officer
12/95 - 12/0045 |
| Chairman of the Board and Chief Executive Officer
12/00 - present
Vice Chairman and Chief Executive Officer
12/95 - 12/00 |
Larry E. Thomas(10) | | 55 | | Executive Vice President
10/01 - present
Chief Financial Officer
9/04 - present
Chief Executive Officer, Regulated Business Unit
12/01 - 9/04
President, Regulated Business Unit
2/01 - present
Chief Executive Officer, Power Technology and Infrastructure Services Business Unit
2/01 - present
Group President
7/00 - 2/12/01
Vice President
4/97 - 7/00
President, Energy Delivery Business Unit
5/96 - 7/00
Group Vice President and Chief Transformation Officer
9/95 - 4/97 | | Executive Vice President
2/01 - present
Group President
7/00 - 2/01
Vice President
4/9799 - 7/00
12/01Group Vice President and Chief Transformation Officer
9/95 - 4/97 |
| Executive Vice President
2/01 - present
Group President
7/00 - 2/01
Vice President
4/97 - 7/00
Group Vice President and Chief Transformation Officer
9/95 - 4/97 |
James L. Turner(11) | | 41 | | President, Regulated Businesses Business Unit
2/01 - present
President, Energy Delivery Business Unit
7/00 - 2/01
Vice President
4/99 - present
Senior Counsel
6/95 - 3/97 | | Vice President
7/00 - present
Chief Financial Officer
9/04 - present
President
2/99 - 7/00 |
| Executive Vice President
7/00 - present |
Jerome A. Vennemann | | 50 | |
Vice President and General Counsel
1/00 - present
Acting General Counsel
3/99 - 1/00
Assistant Secretary
12/94 - present
Associate General Counsel
2/96 - 3/99
Senior Counsel
10/94 - 2/96 | | Vice President and General Counsel
1/00 - present
Acting General Counsel
3/99 - 1/00
Secretary
4/98 - present
Associate General Counsel
2/96 - 3/99
Assistant Secretary
1/95 - 4/98
Senior Counsel
10/94 - 2/96 | | Vice President and General Counsel
1/00 - present
Acting General Counsel
3/99 - 1/00
Assistant Secretary
12/94 - present
Associate General Counsel
2/96 - 3/99
Senior Counsel
10/94 - 2/96 |
Timothy J. Verhagen(12) | | 54 | | Vice President
1/01 - present | | | | |
Charles J. Winger | | 55 | | Vice President
2/01 - present
Vice President and Acting Chief Financial Officer
6/009/04 - 2/01
presentVice President
3/99 - 6/00
Vice President and Chief Financial Officer
4/98 - 3/99
Vice President
8/97 - 4/98
Vice President and Comptroller
4/97 - 8/97
Comptroller
12/94 - 4/97 | | Vice President and Acting Chief Financial Officer
6/00 - 2/01
Vice President and Chief Financial Officer
4/98 - 3/99
Vice President and Comptroller
4/97 - 8/97
Comptroller
1/95 - 4/97 | | Vice President and Acting Chief Financial Officer
6/00 - 2/01
Vice President and Chief Financial Officer
4/98 - 3/99
Vice President and Comptroller
4/97 - 8/97
Comptroller
3/84 - 4/97 |
None of the officers are related in any manner. Our executive officers hold the offices set opposite their names until the next annual meeting of the Board of Directors and until their successors have been elected and qualified.
(1)
(1) | Prior to joining Cinergy, Mr. Duncan was Executive Vice President and Chief Financial Officer of LG&E Energy Corp. (LG&E) (a non-affiliate of Cinergy) in Louisville, Kentucky since December 1998. |
| |
(2) | Prior to joining Cinergy, Ms. Good was a partner with the international accounting firm Deloitte & Touche LLP in Cincinnati, Ohio since May 2002. Prior to that, she was a partner with the international accounting firm Arthur Andersen LLP from 1992 to May 2002. While at Arthur Andersen LLP, she had regional energy responsibilities for risk consulting and internal audit practices. |
| |
(3) | Prior to joining Cinergy, Mr. Manly was Managing Director, Law and Governmental Affairs, General Counsel and Corporate Secretary of NewPower Holdings, Inc. (a non-affiliate of Cinergy) from April 2000 to August 2002. Prior to that, he was Vice President, Chief Counsel for AT&T Consumer Services Group (a non-affiliate of Cinergy) from January 1995 to April 2000. On June 11, 2002, NewPower Holdings, Inc. and its affiliates, TNPC Holdings, Inc. and the NewPower Company, filed a petition for relief under Chapter 11 of The United States Bankruptcy Code. |
| |
(4) | Prior to joining Cinergy, Mr. Murphy was Vice President and Chief Risk Officer of Enron Europe, Ltd. (a non-affiliate of Cinergy) from January 2001 to July 2002. Prior to that, he was Vice President of Market Risk of Enron Corp. (a non-affiliate of Cinergy) from March 1997 to December 2000. |
| |
(5) | Prior to joining Cinergy, Mr. Newton was Senior Vice President, Chief Administrative Officer of LG&E (a non-affiliate of Cinergy) from January 1999 to May 2002. |
| |
194
(6) | Prior to joining Cinergy, Mr. Reising was Chief Financial Officer of Focal Communications Corporation (a non-affiliate of Cinergy) from February 2001 to January 2002. Prior to that, he was Chief Financial Officer of Derivon (a non-affiliate of Cinergy) from May 2000 to February 2001. Prior to that, he was Chief Financial Officer of Bell Canada (a non-affiliate of Cinergy) from May 1999 to May 2000. On December 19, 2002, Focal Communications filed a petition for relief under Chapter 11 of The United States Bankruptcy Code. |
| |
(7) | Mr. Turner served as Vice President of Customer Services from January 2000 until July 2000. |
Cinergy Corp. has adopted both a code of business conduct and ethics applicable to joiningPSI, Ms. Bailey servedall of its directors, officers, and employees as Commissionerwell as corporate governance guidelines. Both of these documents are available on Cinergy’s website at www.cinergy.com. In addition, any amendments to or waivers from the code of business conduct and ethics will be posted on the website. Any such amendment or waiver would require the prior consent of the Federal Energy Regulatory Commission, a position she had held since 1993.
(2)Mr. Bryant also serves as the PresidentBoard of Cinergy Global Resources, Inc. and Cinergy Global Power, Inc., and as the Managing Director of Cinergy Global Power Services Limited,Cinergy's (which includesCinergy Corp. and all of our regulated and non-regulated subsidiaries) international project development subsidiary from 1997 to present. Previously, he served as the Executive Generation Director of Midlands Electricity plc (Midlands; a non-affiliate ofCinergy) from 1996 to 1997, and Generation Director of Midlands from 1992 to 1996.
(3)Prior to joiningCinergy, Mr. Cyrus was Senior Vice President of Trading and Operations with Electric Clearinghouse, Inc. (a non-affiliate ofCinergy), the power subsidiary of Natural Gas Clearinghouse (NGC; a non-affiliate ofCinergy) in Houston, Texas, a position he had held since 1997. Prior to that, Mr. Cyrus was President of NGC Canada and Executive Vice President of Novagas Clearinghouse, Ltd. Previously, Mr. Cyrus held various executive positions involving energy trading, marketing, and risk management with NGC since 1993.
(4)Prior to joiningCinergy, Mr. Duncan was Executive Vice President and Chief Financial Officer of LG&E Energy Corporation (LG&E; a non-affiliate ofCinergy) in Louisville, Kentucky since December 1998. Prior to that, he was Executive Vice President of Planning and Corporate Development at LG&E from January 1998 to December 1998. Prior to joining LG&E, in January 1998, he was Vice President and Treasurer of Freeport-McMoRan, Inc. and Freeport-McMoRan Copper & Gold (non-affiliates ofCinergy), global natural resource companies headquartered in New Orleans, Louisiana since May 1994.
(5)From October 1995 to May 1997, Ms. Gamblin served as Assistant to the Chief Executive Officer, where she had responsibility for a wide range of projects, including venture capital analysis, merger and acquisition analysis, international projects and general strategy.
(6)As Executive Vice President and Chief of Staff, Mr. Grealis had responsibility for all shared service functions, including legal, external communications, human resources, creative services, information technology, budgets and certain accounting functions. Mr. Grealis served as President of Cinergy Investments, Inc. (Investments) from 1995 to March 1999. Mr. Grealis also served as President of the former Energy Services Business Unit from 1996 to May 1997.
(7)Since 1992, Mr. Hale has served as President of Cinergy Foundation, Inc., aCinergy affiliate that is organized and operated exclusively for charitable purposes.
(8)Mr. Harkness also serves as President and Chief Operating Officer of Cinergy Solutions, Inc.
(9)From 1995 to March 1999, Mr. Ingle served as Contract Consultant for Investments. Mr. Ingle also served as President of the former Energy Services Business Unit from 1997 to March 1999.
(10)As Group President, Mr. Thomas had responsibility forCinergy's new technology initiatives and energy delivery. Effective January 10, 2000,Cinergy's Economic Development, Community Affairs, State Regulatory Affairs and State Governmental Affairs were merged into the former Energy Delivery Business Unit.
(11)In March 1997, Mr. Turner was appointed Vice President of Cinergy Services, Inc., (Services) having responsibility for the coordination of transition issues across all corporate subsidiaries in the move for full customer choice. Beginning in April 1998 until January 2000, Mr. Turner had full responsibility forCinergy's Government and Regulatory Affairs Department. Mr. Turner served as Vice President of Customer Services from January 2000 until July 2000.
(12)Prior to joiningCinergy, Mr. Verhagen served as Senior Vice President, Human Resources and Administration of United Dominion Industries Ltd. (United Dominion; a non-affiliate ofCinergy), a diversified manufacturer of industrial test equipment in Charlotte, North Carolina, from 1998 to 2000. From 1993 to 1998 he served as Vice President, Human Resources of United Dominion.
ITEM 11. EXECUTIVE COMPENSATION
Directors or an applicable committee thereof.
Information in response to this item forItem 405 of Regulation S-K and regarding Cinergy Corp.’s audit committee required by Items 401(h) andCG&E 401(i) of Regulation S-K is incorporated by reference from its definitive Proxy Statement for the 20012005 Annual Meeting of Shareholders.
195
Information in response to this item for Cinergy Corp. and CG&E is incorporated by reference from Cinergy Corp.’s definitive Proxy Statement for the 2005 Annual Meeting of Shareholders.
All CG&E directors currently are employees ofCinergy Corp. orCG&E, and receive no compensation for their services as directors.
Information in response to this item forPSI executive compensation is incorporated by reference fromPSI’sPSI's 2001 2005 Information Statement.
Information in response to this item forCinergy Corp. is incorporated by reference from its definitive Proxy Statement for the 20012005 Annual Meeting of Shareholders.
Cinergy Corp. owns all outstanding shares of common stock ofCG&E,CG&E's&E’s only voting security. Pursuant to Section 13(d) of the Securities Exchange Act of 1934, a beneficial owner of a security is any person who directly or indirectly has or shares voting or investment power over such security. No person or group is known by the management ofCG&E to be the beneficial owner of more than 5% of any series ofCG&E's class of cumulative preferred stock as of December 31, 2000.
CG&E's&E’s directors and executive officers did not beneficially own any shares of any seriesclass of the classequity security ofCG&E's&E cumulative preferred stock as of January 31, 2001.2005. The beneficial ownership ofCinergy Corp. common stock by each director and named executive officer ofCG&E as of January 31, 2001,2005, is set forth in the following table:
| Name of Beneficial Owner(1)
Owner
| | |
| Amount and Nature of
of Beneficial Ownership(2)Ownership(1) |
| Percent of
Class
|
|
|---|
| | | | | |
Michael J. Cyrus | | 166,473258,803 shares | | | * |
R. Foster Duncan | | 235,526 shares | | | * |
William J. Grealis | | 284,275378,244 shares | | | * |
J. Joseph Hale, Jr.James L. Turner | | 56,991132,828 shares | | | * |
Jackson H. Randolph | | 270,137 shares |
James E. Rogers | | 988,8631,699,317 shares | | | * |
Larry E. Thomas | | 302,987 shares |
James L. Turner | | 25,268 shares |
Charles J. Winger | | 98,340 shares |
All directors and executive officers as a group (11(12 persons) | | 2,319,1672,874,140 shares
(representing 1.46% of the class) | | 1.51 | % |
(1)No individual listed beneficially owned more than 0.623% of the outstanding shares of our common stock.
(2)Includes shares which there is a right to acquire within 60 days pursuant to the exercise of stock options in the following amounts: Mr. Cyrus—54,300; Mr. Grealis—157,796; Mr. Hale—29,221; Mr. Randolph—136,887; Mr. Rogers—696,429; Mr. Thomas—144,945; Mr. Turner—14,600; Mr. Winger—58,617; and all directors and executive officers as a group—1,376,477.
* | Less than 1 percent |
(1) | Includes shares which there is a right to acquire within 60 days pursuant to the exercise of stock options in the following amounts: Mr. Cyrus - 141,799; Mr. Duncan - 213,500; Mr. Grealis - 235,701; Mr. Turner - 101,626; Mr. Rogers - 970,300; and all directors and executive officers as a group - 1,768,036. |
Information in response to this item forPSI is incorporated by reference from its 20012005 Information Statement.
196
The following table reflects Cinergy’s equity compensation plan information as of December 31, 2004:
Equity Compensation Plan Information
Plan Category | | Number of securities to be issued upon exercise of outstanding options, warrants and rights
(a) | | Weighted-average exercise price of outstanding options, warrants and rights
(b) | | Number of securities remaining available for future issuance under equity compensation plans (excluding securities reflected in column (a))
(c) | |
| | | | | | | |
Equity compensation plans approved by security holders | | | | | | | |
Cinergy Corp. 1996 Long-Term Incentive Compensation Plan | | 6,564,519 | | $ | 33.25 | | 3,122,900 | |
Cinergy Corp. Stock Option Plan | | 628,400 | | $ | 34.12 | | 1,318,500 | |
Cinergy Corp. Employee Stock Purchase and Savings Plan | | — | | N/A | | 1,482,664 | |
Cinergy Corp. Retirement Plan for Directors | | 3,917 | | N/A | | — | |
Cinergy Corp. Directors’ Equity Compensation Plan | | 26,843 | | N/A | | 41,034 | |
Cinergy Corp. Directors’ Deferred Compensation Plan | | 48,564 | | N/A | | 103,234 | |
| | | | | | | |
Equity compensation plans not approved by security holders | | | | | | | |
Cinergy Corp. UK Sharesave Scheme | | 436 | | $ | 25.14 | | 62,200 | |
Cinergy Corp. 401(k) Excess Plan | | 77,558 | | N/A | | — | |
| | | | | | | |
The following information describes the equity compensation plans that have not been approved by shareholders.
Cinergy Corp. UK Sharesave Scheme
The Cinergy Corp. UK Sharesave Scheme allows essentially all full-time, regular United Kingdom employees working a minimum of 25 hours per week to purchase shares of common stock pursuant to a stock option feature. Under the Cinergy Corp. UK Sharesave Scheme, after-tax funds are withheld from a participant’s compensation during a 36-month or 60-month offering period, at the election of the participants, and are deposited in an account. At the end of the offering period, participants may apply amounts deposited in the account toward the purchase of shares of common stock. The purchase price cannot be less than 80 percent of the average market price at date of grant or shortly prior to the grant. Any funds not applied toward the purchase of shares are returned to the participant. A participant may elect to terminate participation in the plan at any time. Participation also will terminate if the participant’s employment ceases. Upon termination of participation, all funds are returned to the participant without penalty although, in certain specified circumstances, options may be exercised early on a pro-rata basis.
Cinergy Corp. 401(k) Excess Plan
The Cinergy Corp. 401(k) Excess Plan is a non-qualified deferred compensation plan for a select group of Cinergy management and other highly compensated employees. It is a means by which these employees can defer additional compensation, and receive additional company matching contributions, when they have already contributed the maximum amount (pursuant to the anti-discrimination rules for highly compensated employees) under the 401(k) Plan. All funds deferred are held in a rabbi trust administered by an independent trustee.
ITEM 13. CERTAIN RELATIONSHIPS AND RELATED TRANSACTIONS
Information in response to this item forCinergy Corp. andCG&E is incorporated by reference fromCinergy Corp.'s’s definitive Proxy Statement for the 20012005 Annual Meeting of Shareholders.
Information in response to this item forPSI is incorporated by reference from its 2001PSI’s 2005 Information Statement.
197
Information in response to this item for Cinergy, CG&E and PSI is incorporated by reference from Cinergy Corp.’s definitive Proxy Statement for the 2005 Annual Meeting of Shareholders.
198
Financial Statements and Schedules
Refer to the page captioned "Index“Index to Financial Statements and Financial Statement Schedules",Schedules” for an index of the financial statements and financial statement schedules included in this report.
The following reports on Form 8-K were filed during the quarter ended December 31, 2000:
Date of Report
| | Registrant(s)
| | Item Filed
|
|---|
October 16, 2000 | | Cinergy Corp. | | Item 5. Other Events
Item 7. Financial Statements and Exhibits. |
December 22, 2000 |
|
Cinergy Corp.
CG&E
PSI |
|
Item 5. Other Events
Item 7. Financial Statements and Exhibits. |
Exhibits
The documents listed below are being filed or have previously been filed on behalf ofCinergy Corp.,CG&E,PSI, and The Union Light, Heat and Power Company (ULH&P) and are incorporated herein by reference from the documents indicated and made a part hereof. Exhibits not identified as previously filed are filed herewith:
| Exhibit
Designation
| | |
| Registrant(s)(1)
| | |
| Nature of Exhibit
| | |
| Previously Filed as
Exhibit to:
|
|---|
| Articles of Incorporation
/By-laws /By-laws
| |
| |
| |
|
|
|
|
|
|
|
|---|
3-a | | Cinergy Corp.(1) | | Certificate of Incorporation ofCinergy Corp., a Delaware corporation.corporation, as amended May 10, 2001. |
| Cinergy Corp. March 31, 2001, Form 10-Q |
3-b | | Cinergy Corp. 1993 Form 10-K. |
3-b | | By-Laws of Cinergy Corp. | | By-Laws ofCinergy Corp., as amended on April 27, 2000.July 23, 2003. |
| Cinergy Corp. SeptemberJune 30, 2000,2003, Form 10-Q.10-Q |
3-c | | Cinergy Corp.CG&E
| | By-Laws ofCinergy Corp., as amended on December 14, 2000. | | |
3-d | | CG&E(2) | | Amended Articles of Incorporation ofCG&E effective October 23, 1996. |
| CG&E September 30, 1996, Form 10-Q.10-Q |
3-e3-d | | CG&E | | Regulations ofCG&E, as amended April 25, 1996.on July 23, 2003. |
| CG&E March 31, 1996,June 30, 2003, Form 10-Q.10-Q |
3-f3-e | | PSI(3)PSI
| | Amended Articles of Consolidation ofPSI, as amended to April 20, 1995. |
| PSI June 30, 1995, Form 10-Q.10-Q |
3-g3-f | | PSI | | Amendment to Article D of the Amended Articles of Consolidation ofPSI, effective July 10, 1997. |
| Cinergy Corp.PSI 1997 Form 10-K.10-K
|
3-h3-g | | PSI | | By-Laws ofPSI, as amended to December 17, 1996.on July 23, 2003. |
| PSI March 31, 1997,June 30, 2003, Form 10-Q.10-Q |
3-i3-h | | ULH&P(4)&P | | Restated Articles of Incorporation made effective May 7, 1976. |
| ULH&P Form 8-K, May 1976.1976 |
3-j3-i | | ULH&P | | By-Laws ofULH&P, as amended adopted May 8, 1996.on July 23, 2003. |
| ULH&P March 31, 1996,June 30, 2003, Form 10-Q.10-Q |
3-k3-j | | ULH&P | | Amendment to Restated Articles of Incorporation ofULH&P (Article Third) and Amendment to the By-lawsBy-Laws ofULH&P (Article 1), both effective July 24, 1997. |
| Cinergy Corp.ULH&P 1997 Form 10-K.10-K
|
| Instruments defining the rights of holders, incl. Indentures
| |
| |
| |
|
|
|
|
|
|
|
|---|
4-a | | Cinergy Corp.
PSI | | Original Indenture (First Mortgage Bonds) dated September 1, 1939, betweenPSI and The First National Bank of Chicago, as Trustee, and LaSalle National Bank, as Successor Trustee. | | Exhibit A-Part 3 in File No. 70-258 Supplemental Indenture dated March 30, 1984.1984 |
4-b | | Cinergy Corp.
PSI | | Twenty-fifth Supplemental Indenture betweenPSI and The First National Bank of Chicago dated September 1, 1978. | | File No. 2-62543.2-62543 |
4-c | | Cinergy Corp.
PSI | | Thirty-fifth Supplemental Indenture betweenPSI and The First National Bank of Chicago dated March 30, 1984. |
| PSI 1984 Form 10-K.10-K |
4-d | | Cinergy Corp.
PSI | | Forty-second Supplemental Indenture betweenPSI and LaSalle National Bank dated August 1, 1988. |
| PSI 1988 Form 10-K.10-K |
4-e | | Cinergy Corp.
PSI | | Forty-fourth Supplemental Indenture betweenPSI and LaSalle National Bank dated March 15, 1990. |
| PSI 1990 Form 10-K.10-K |
4-f | | Cinergy Corp.
PSI | | Forty-fifth Supplemental Indenture betweenPSI and LaSalle National Bank dated March 15, 1990. |
| PSI 1990 Form 10-K.10-K |
4-g | | Cinergy Corp.
PSI | | Forty-sixth Supplemental Indenture betweenPSI and LaSalle National Bank dated June 1, 1990. |
| PSI 1991 Form 10-K.10-K |
4-h | | Cinergy Corp.
PSI | | Forty-seventh Supplemental Indenture betweenPSI and LaSalle National Bank dated July 15, 1991. |
| PSI 1991 Form 10-K.10-K |
4-i | | Cinergy Corp.
PSI | | Forty-eighth Supplemental Indenture betweenPSI and LaSalle National Bank dated July 15, 1992. |
| PSI 1992 Form 10-K.10-K |
4-j | | Cinergy Corp.
PSI | | Forty-ninth Supplemental Indenture betweenPSI and LaSalle National Bank dated February 15, 1993. |
| PSI 1992 Form 10-K.10-K |
4-k | | Cinergy Corp.
PSI | | Fiftieth Supplemental Indenture betweenPSI and LaSalle National Bank dated February 15, 1993. |
| PSI 1992 Form 10-K.10-K |
199
4-l | | Cinergy Corp.
PSI | | Fifty-first Supplemental Indenture betweenPSI and LaSalle National Bank dated February 1, 1994. |
| PSI 1993 Form 10-K.10-K |
4-m | | Cinergy Corp.
PSI | | Fifty-second Supplemental Indenture betweenPSI and LaSalle National Bank, as Trustee, dated as of April 30, 1999. |
| PSI March 31, 1999, Form 10-Q.10-Q |
4-n | | Cinergy Corp.
PSI | | Fifty-third Supplemental Indenture between PSI and LaSalle National Bank dated June 15, 2001. |
| PSI June 30, 2001, Form 10-Q |
4-o | | Cinergy Corp. PSI | | Fifty-fifth Supplemental Indenture between PSI and LaSalle National Bank dated February 15, 2003. |
| PSI September 30, 2003, Form 10-Q |
4-p | | Cinergy Corp. PSI | | Indenture (Secured Medium-term Notes, Series A), dated July 15, 1991, betweenPSI and LaSalle National Bank, as Trustee. |
| PSI Form 10-K/A, Amendment No. 2, dated July 15, 1993.1993 |
4-o4-q | | Cinergy Corp.
PSI | | Indenture (Secured Medium-term Notes, Series B), dated July 15, 1992, betweenPSI and LaSalle National Bank, as Trustee. |
| PSI Form 10-K/A, Amendment No. 2, dated July 15, 1993.1993 |
4-p4-r | | Cinergy Corp.
PSI | | Loan Agreement betweenPSI and the City of Princeton, Indiana dated as of November 7, 1996. |
| PSI September 30, 1996, Form 10-Q.10-Q |
4-q4-s | | Cinergy Corp.
PSI | | Loan Agreement betweenPSI and the City of Princeton, Indiana dated as of February 1, 1997. |
| Cinergy Corp.PSI 1996 Form 10-K.10-K
|
4-r4-t | | Cinergy Corp.
PSI | | Indenture dated November 15, 1996, betweenPSI and The Fifth Third Bank, as Trustee. |
| Cinergy Corp.PSI 1996 Form 10-K.10-K
|
4-s4-u | | Cinergy Corp.
PSI | | First Supplemental Indenture dated November 15, 1996, betweenPSI and The Fifth Third Bank, as Trustee. |
| Cinergy Corp.PSI 1996 Form 10-K.10-K
|
4-t4-v | | Cinergy Corp.
PSI | | Third Supplemental Indenture dated as of March 15, 1998, betweenPSI and The Fifth Third Bank, as Trustee. |
| Cinergy Corp.PSI 1997 Form 10-K.10-K
|
4-u4-w | | Cinergy Corp.
PSI | | Fourth Supplemental Indenture dated as of August 5, 1998, betweenPSI and The Fifth Third Bank, as Trustee. |
| PSI June 30, 1998, Form 10-Q.10-Q |
4-v4-x | | Cinergy Corp.
PSI | | Fifth Supplemental Indenture dated as of December 15, 1998, betweenPSI and The Fifth Third Bank, as Trustee. |
| PSI 1998 Form 10-K.10-K |
4-w4-y | | Cinergy Corp.
PSI | | Sixth Supplemental Indenture dated as of April 30, 1999, betweenPSI and Fifth Third Bank, as Trustee, dated as of April 30, 1999.Trustee. |
| PSI March 31, 1999, Form 10-Q.10-Q |
4-x4-z | | Cinergy Corp.
PSI | | Seventh Supplemental Indenture dated as of October 20, 1999, betweenPSI and Fifth Third Bank, as Trustee. |
| PSI September 30, 1999, Form 10-Q.10-Q |
4-y4-aa | | Cinergy Corp.
PSI | | Eighth Supplemental Indenture dated as of September 23, 2003, between PSI and Fifth Third Bank, as Trustee. |
| PSI September 30, 2003, Form 10-Q |
4-bb | | Cinergy Corp. PSI | | Unsecured Promissory Note dated October 14, 1998, betweenPSI and the Rural Utilities Service. |
| PSI 1998 Form 10-K.10-K |
4-z4-cc | | Cinergy Corp.
PSI | | Loan Agreement betweenPSI and the Indiana Development Finance Authority dated as of July 15, 1998. |
| PSI June 30, 1998, Form 10-Q.10-Q |
4-aa4-dd | | Cinergy Corp.
PSI | | Loan Agreement betweenPSI and the Indiana Development Finance Authority dated as of May 1, 2000. |
| PSI June 30, 2000, Form 10-Q.10-Q |
4-bb4-ee | | Cinergy Corp.
CG&E | | Original Indenture (First Mortgage Bonds) betweenCG&E and The Bank of New York (as Trustee) dated as of August 1, 1936. |
| CG&E Registration Statement No. 2-2374.2-2374 |
4-cc4-ff | | Cinergy Corp.
CG&E | | Fourteenth Supplemental Indenture betweenCG&E and The Bank of New York dated as of November 2, 1972. |
| CG&E Registration Statement No. 2-60961.2-60961 |
4-dd4-gg | | Cinergy Corp.
CG&E | | Thirty-third Supplemental Indenture betweenCG&E and The Bank of New York dated as of September 1, 1992. |
| CG&E Registration Statement No. 33-53578.33-53578 |
4-ee4-hh | | Cinergy Corp.
CG&E | | Thirty-fourth Supplemental Indenture betweenCG&E and The Bank of New York dated as of October 1, 1993. |
| CG&E September 30, 1993, Form 10-Q.10-Q |
4-ff4-ii | | Cinergy Corp.
CG&E | | Thirty-fifth Supplemental Indenture betweenCG&E and The Bank of New York dated as of January 1, 1994. |
| CG&E Registration Statement No. 33-52335.33-52335 |
4-gg4-jj | | Cinergy Corp.
CG&E | | Thirty-sixth Supplemental Indenture betweenCG&E and The Bank of New York dated as of February 15, 1994. |
| CG&E Registration Statement No. 33-52335.33-52335 |
4-hh4-kk | | Cinergy Corp.
CG&E | | Thirty-seventh Supplemental Indenture betweenCG&E and The Bank of New York dated as of October 14, 1996. |
| Cinergy Corp.CG&E 1996 Form 10-K.10-K
|
4-ii4-ll | | Cinergy Corp.
CG&E | | Thirty-eighth Supplemental Indenture between CG&E and The Bank of New York dated as of February 1, 2001. |
| CG&E March 31, 2001, Form 10-Q |
4-mm | | Cinergy Corp. CG&E | | Loan Agreement betweenCG&E and the County of Boone, Kentucky dated as of February 1, 1985. |
| CG&E 1984 Form 10-K.10-K |
4-jj4-nn | | Cinergy Corp.
CG&E | | Repayment Agreement betweenCG&E and The Dayton Power and Light Company dated as of December 23, 1992. |
| CG&E 1992 Form 10-K.10-K |
4-kk4-oo | | Cinergy Corp.
CG&E | | Loan Agreement betweenCG&E and the County of Boone, Kentucky dated as of January 1, 1994. |
| CG&E 1993 Form 10-K.10-K |
4-ll4-pp | | Cinergy Corp.
CG&E | | Loan Agreement betweenCG&E and the State of Ohio Air Quality Development Authority dated as of December 1, 1985. |
| CG&E 1985 Form 10-K.10-K |
4-mm4-qq | | Cinergy Corp.
CG&E | | Loan Agreement betweenCG&E and the State of Ohio Air Quality Development Authority dated as of September 13, 1995. |
| CG&E September 30, 1995, Form 10-Q.10-Q |
4-nn4-rr | | Cinergy Corp.
CG&E | | Loan Agreement betweenCG&E and the State of Ohio Water Development Authority dated as of January 1, 1994. |
| CG&E 1993 Form 10-K.10-K |
200
4-oo4-ss | | Cinergy Corp.
CG&E | | Loan Agreement betweenCG&E and the State of Ohio Air Quality Development Authority dated as of January 1, 1994. |
| CG&E 1993 Form 10-K.10-K |
4-pp4-tt | | CG&E | | Loan Agreement between CG&E and the State of Ohio Air Quality Development Authority dated August 1, 2001. |
| CG&E September 30, 2001, Form 10-Q |
4-uu | | Cinergy Corp.
CG&E | | Original Indenture (Unsecured Debt Securities) betweenCG&E and The Fifth Third Bank dated as of May 15, 1995. |
| CG&E Form 8-A dated July 24, 1995.1995 |
4-rr4-vv | | Cinergy Corp.
CG&E | | First Supplemental Indenture betweenCG&E and The Fifth Third Bank dated as of June 1, 1995. |
| CG&E June 30, 1995, Form 10-Q.10-Q |
4-ss4-ww | | Cinergy Corp.
CG&E | | Second Supplemental Indenture betweenCG&E and The Fifth Third Bank dated as of June 30, 1995. |
| CG&EForm 8-A dated July 24, 1995.1995 |
4-tt4-xx | | Cinergy Corp.
CG&E | | Third Supplemental Indenture betweenCG&E and The Fifth Third Bank dated as of October 9, 1997. |
| CG&E September 30, 1997, Form 10-Q.10-Q |
4-uu4-yy | | Cinergy Corp.
CG&E | | Fourth Supplemental Indenture betweenCG&E and The Fifth Third Bank dated as of April 1, 1998. |
| CG&E March 31, 1998, Form 10-Q.10-Q |
4-vv4-zz | | Cinergy Corp.
CG&E | | Fifth Supplemental Indenture betweenCG&E and The Fifth Third Bank dated as of June 9, 1998. |
| CG&E June 30, 1998, Form 10-Q.10-Q |
4-ww4-aaa | | Cinergy Corp.
CG&E | | Seventh Supplemental Indenture between CG&E and The Fifth Third Bank dated as of June 15, 2003. |
| CG&E June 30, 2003, Form 10-Q |
4-bbb | | Cinergy Corp. CG&E
ULH&P | | Original Indenture (First Mortgage Bonds) betweenULH&P and The Bank of New York dated as of February 1, 1949. |
| ULH&P Registration Statement No. 2-7793.2-7793 |
4-xx4-ccc | | Cinergy Corp.
CG&E
ULH&P | | Fifth Supplemental Indenture betweenULH&P and The Bank of New York dated as of January 1, 1967. |
| CG&E Registration Statement No. 2-60961.2-60961 |
4-yy4-ddd | | Cinergy Corp.
CG&E
ULH&P | | Thirteenth Supplemental Indenture betweenULH&Pand The Bank of New York dated as of August 1, 1992. |
| ULH&P1992 Form 10-K.10-K |
4-zz4-eee | | Cinergy Corp.
CG&E
ULH&P | | Original Indenture (Unsecured Debt Securities) betweenULH&P and The Fifth Third Bank dated as of July 1, 1995. |
| ULH&P June 30, 1995, Form 10-Q.10-Q |
4-aaa4-fff | | Cinergy Corp.
CG&E
ULH&P | | First Supplemental Indenture betweenULH&P and The Fifth Third Bank dated as of July 15, 1995. |
| ULH&P June 30, 1995, Form 10-Q.10-Q |
4-bbb4-ggg | | Cinergy Corp.
CG&E
ULH&P | | Second Supplemental Indenture betweenULH&P and The Fifth Third Bank dated as of April 30, 1998. |
| ULH&P March 31, 1998, Form 10-Q.10-Q |
4-ccc4-hhh | | Cinergy Corp.
CG&E
ULH&P | | Third Supplemental Indenture betweenULH&P and The Fifth Third Bank dated as of December 8, 1998. |
| ULH&P1998 Form 10-K.10-K |
4-ddd4-iii | | Cinergy Corp.
CG&E
ULH&P | | Fourth Supplemental Indenture between ULH&P and The Fifth Third Bank, as Trustee, dated as of September 17, 1999, between1999. |
| ULH&P and Fifth Third Bank as Trustee. | | ULH&P September 30, 1999, Form 10-Q.10-Q |
4-eee4-jjj | | Cinergy Corp. | | Base Indenture dated as of October 15, 1998, between Cinergy Global Resources Inc. (Global Resources) and The Fifth Third Bank, as Trustee. |
| Cinergy Corp. September 30, 1998, Form 10-Q.10-Q |
4-fff4-kkk | | Cinergy Corp. | | First Supplemental Indenture dated as of October 15, 1998, between Global Resources and The Fifth Third Bank, as Trustee. |
| Cinergy Corp. September 30, 1998, Form 10-Q.10-Q |
4-ggg4-lll | | Cinergy Corp. | | Indenture dated as of December 16, 1998, betweenCinergy Corp. and The Fifth Third Bank. |
| Cinergy Corp. 1998 Form 10-K.10-K |
4-hhh4-mmm | | Cinergy Corp. | | Indenture betweenCinergy Corp. and The Fifth Third Bank, as Trustee, dated as of April 15, 1999. |
| Cinergy Corp. March 31, 1999, Form 10-Q.10-Q |
4-iii4-nnn | | Cinergy Corp. | | Indenture between Cinergy Corp. and The Fifth Third Bank, as Trustee, dated September 12, 2001. |
| Cinergy Corp. September 30, 2001, Form 10-Q |
4-ooo | | Cinergy Corp. | | First Supplemental Indenture between Cinergy Corp. and The Fifth Third Bank, as Trustee, dated September 12, 2001. |
| Cinergy Corp. September 30, 2001, Form 10-Q |
4-ppp | | Cinergy Corp. | | Second Supplemental Indenture, dated December 18, 2001, between Cinergy Corp. and The Fifth Third Bank, as Trustee. |
| Cinergy Corp. Form 8-K, December 19, 2001 |
4-qqq | | Cinergy Corp. | | Rights Agreement betweenCinergy Corp. and The Fifth Third Bank, as Rights Agent.Agent, dated October 16, 2000. |
| Cinergy Corp. Registration Statement on Form 8-A dated October 16, 2000.2000 |
| 4-rrr | | Material contractsCinergy Corp.
| |
| |
| |
| | Purchase Contract Agreement, dated December 18, 2001, between Cinergy Corp. and The Bank of New York, as Purchase Contract Agent. |
| Cinergy Corp. Form 8-K, December 19, 2001 |
|---|
10-a4-sss | | Cinergy Corp. | | Pledge Agreement, dated December 18, 2001, among Cinergy Corp., JP Morgan Chase Bank, as Collateral Agent, Custodial Agent and Securities Intermediary, and The Bank of New York, as Purchase Contract Agent. |
| Cinergy Corp. Form 8-K, December 19, 2001 |
201
4-ttt | | Cinergy Corp.
CG&E | | Thirty-ninth Supplemental Indenture dated as of September 1, 2002, between CG&E and The Bank of New York, as Trustee. |
| Cinergy Corp. September 30, 2002, Form 10-Q |
4-uuu | | Cinergy
Corp.
PSI | | Fifty-fourth Supplemental Indenture dated as of September 1, 2002, between PSI and LaSalle Bank National Association, as Trustee. |
| Cinergy Corp. September 30, 2002, Form 10-Q |
4-vvv | | Cinergy Corp.
CG&E | | Sixth Supplemental Indenture between CG&E and Fifth Third Bank dated as of September 15, 2002. |
| Cinergy Corp. September 30, 2002, Form 10-Q |
4-www | | Cinergy
Corp.
PSI | | Loan Agreement between PSI and the Indiana Development Finance Authority dated as of September 1, 2002. |
| Cinergy Corp. September 30, 2002, Form 10-Q |
4-xxx | | Cinergy Corp.
PSI | | Loan Agreement between PSI and the Indiana Development Finance Authority dated as of September 1, 2002. |
| Cinergy Corp. September 30, 2002, Form 10-Q |
4-yyy | | Cinergy Corp.
CG&E | | Loan Agreement between CG&E and the Ohio Air Quality Development Authority dated as of September 1, 2002. |
| Cinergy Corp. September 30, 2002, Form 10-Q |
4-zzz | | Cinergy Corp. | | First Amendment to Rights Agreement, dated August 28, 2002, effective September 16, 2002, between Cinergy Corp. and The Fifth Third Bank, as Rights Agent. |
| Cinergy Corp. Form 8-A/A, Amendment No. 1, filed September 16, 2002 |
4-aaaa | | PSI | | Loan Agreement between PSI and the Indiana Development Finance Authority dated as of February 15, 2003. |
| PSI March 31, 2003, Form 10-Q |
4-bbbb | | PSI | | 6.302% Subordinated Note between PSI and Cinergy Corp., dated February 5, 2003. |
| PSI March 31, 2003, Form 10-Q |
4-cccc | | PSI | | 6.403% Subordinated Note between PSI and Cinergy Corp., dated February 5, 2003. |
| PSI March 31, 2003, Form 10-Q |
4-dddd | | CG&E | | Loan Agreement between CG&E and the Ohio Air Quality Development Authority dated as of November 1, 2004, relating to Series A |
| CG&E Form 8-K, filed November 19, 2004 |
4-eeee | | CG&E | | Loan Agreement between CG&E and the Ohio Air Quality Development Authority dated as of November 1, 2004, relating to Series B |
| CG&E Form 8-K, filed November 19, 2004 |
4-ffff | | PSI | | Loan Agreement between PSI and the Indiana Development Finance Authority dated as of December 1, 2004, relating to Series 2004B |
| PSI Form 8-K, filed December 9, 2004 |
4-gggg | | PSI | | Loan Agreement between PSI and the Indiana Development Finance Authority dated as of December 1, 2004, relating to Series 2004C |
| PSI Form 8-K, filed December 9, 2004 |
4-hhhh | | Cinergy Corp.
PSI | | Fifty-Sixth Supplemental Indenture dated as of December 1, 2004, between PSI and LaSalle Bank National Association, as Trustee |
|
|
4-iiii | | Cinergy Corp.
ULH&P | | Indenture between ULH&P and Deutsche Bank dated as of December 1, 2004, between ULH&P and Deutsche Bank Trust Company Americas, as Trustee |
|
|
Material
contracts | |
| | | | |
10-a | | Cinergy Corp. CG&E
PSI | | Amended and Restated Employment Agreement dated October 24, 1994, amongCG&E (an Ohio corporation),Cinergy Corp. (a Delaware corporation),PSI Resources, Inc., andPSI, and Jackson H. Randolph. |
| Cinergy Corp. 1994 Form 10-K.10-K |
10-b | | Cinergy Corp.
CG&E
PSI | | Employment Agreement dated February 4, 2004, among Cinergy Corp., CG&E, and PSI, and James E. Rogers. |
| Cinergy Corp. 2003 Form 10-K |
10-c | | Cinergy Corp. CG&E
PSI | | Amended and Restated Employment Agreement dated December 30, 1999,October 11, 2002, among Services,CG&E, andPSI, and James E. Rogers. | | Cinergy Corp., Cinergy Services, Inc. (Services), 1999CG&E, and PSI, and William J. Grealis. |
| Cinergy Corp. 2002 Form 10-K.10-K |
10-c10-d | | Cinergy Corp.
CG&E
PSI | | Amended Employment Agreement effective December 17, 2003 to Employment Agreement dated October 11, 2002, among Cinergy Corp., Services, CG&E, and PSI, and William J. Grealis. |
| Cinergy Corp. 2003 Form 10-K |
10-e | | Cinergy Corp. CG&E
PSI | | Amended and Restated Employment Agreement dated December 30, 1999,October 1, 2002, amongCinergy Corp., Services,CG&E, andPSI, and William J. Grealis.PSI, and Donald B. Ingle, Jr. |
| Cinergy Corp. 19992002 Form 10-K.10-K |
10-d10-f | | Cinergy Corp.
CG&E
PSI | | Amended and Restated Employment Agreement dated December 30, 1999,September 12, 2002, amongCinergy Corp., Services,CG&E, andPSI, and Larry E. Thomas.Michael J. Cyrus. |
| Cinergy Corp. 19992002 Form 10-K.10-K |
10-e10-g | | Cinergy Corp.
CG&E
PSI | | Amended Employment Agreement effective December 17, 2003 to Employment Agreement dated September 12, 2002, among Cinergy Corp., Services, CG&E, and PSI, and Michael J. Cyrus. |
| Cinergy Corp. 2003 Form 10-K |
10-h | | Cinergy Corp.
CG&E
PSI | | Amended and Restated Employment Agreement dated December 30, 1999,September 24, 2002, amongCinergy Corp., Services,CG&E, andPSI, and Donald B. Ingle, Jr.PSI, and James L. Turner. |
| Cinergy Corp. 19992002 Form 10-K.10-K |
10-f10-i | | Cinergy Corp.
CG&E
PSI | | Amended Employment Agreement effective December 17, 2003 to Employment Agreement dated September 24, 2002, among Cinergy Corp., Services, CG&E, and PSI, and James L. Turner. |
| Cinergy Corp. 2003 Form 10-K |
10-j | | Cinergy Corp.
CG&E
PSI | | Amended and Restated Employment Agreement dated December 30, 1999,January 1, 2002, amongCinergy Corp., Services,CG&E, andPSI, and Michael J. Cyrus.PSI, and R. Foster Duncan. |
| Cinergy Corp. 19992002 Form 10-K.10-K |
10-g10-k | | Cinergy Corp.
CG&E
PSI | | Amended Employment Agreement effective December 17, 2003 to Employment Agreement dated December 30, 1999January 1, 2002, amongCinergy Corp., Services,CG&E, andPSI, and Jerome A. Vennemann.PSI, and R. Foster Duncan. |
| Cinergy Corp. 19992003 Form 10-K.10-K |
10-h10-l | | Cinergy Corp.
CG&E
PSI | | Employment Agreement dated November 15, 2002, among Cinergy Corp., CG&E, and PSI and Marc E. Manly. |
| Cinergy Corp. 2003 Form 10-K |
10-m | | Cinergy Corp.
CG&E
PSI | | Amended Employment Agreement effective December 17, 2003 to Employment Agreement dated November 15, 2002, among Cinergy Corp., CG&E, and PSI, and Marc E. Manly. |
| Cinergy Corp. 2003 Form 10-K |
10-n | | Cinergy Corp. | | Amended and Restated EmploymentSeparation and Retirement Agreement and Waiver and Release of Liability dated December 30, 1999, amongFebruary 15, 2002, between Cinergy Corp., Services,CG&E andPSI, and Charles J. Winger.Larry E. Thomas. |
| Cinergy Corp. 19992001 Form 10-K.10-K |
202
10-o | | Cinergy Corp. | | Separation and Retirement Agreement and Waiver and Release of Liability dated October 8, 2002 between Cinergy Corp. and Donald B. Ingle, Jr. |
| Cinergy Corp. 2002 Form 10-K |
10-i10-p | | Cinergy Corp.
PSI | | Deferred Compensation Agreement, effective as of January 1, 1992, betweenPSI and James E. Rogers. |
| PSI Form 10-K/A, Amendment No. 1, dated April 29, 1993.1993 |
10-j10-q | | Cinergy Corp.
PSI | | Split Dollar Life Insurance Agreement, effective as of January 1, 1992, betweenPSI and James E. Rogers. |
| PSI Form 10-K/A, Amendment No. 1, dated April 29, 1993.1993 |
10-k10-r | | Cinergy Corp.
PSI | | First Amendment to Split Dollar Life Insurance Agreement betweenPSI and James E. Rogers dated December 11, 1992. |
| PSI Form 10-K/A, Amendment No. 1, dated April 29, 1993.1993 |
10-l10-s | | Cinergy Corp.
CG&E | | Deferred Compensation Agreement betweenCG&E and Jackson H. Randolph dated January 1, 1992. |
| CG&E 1992 Form 10-K.10-K |
10-m10-t | | Cinergy Corp.
CG&E | | Split Dollar Insurance Agreement, effective as of May 1, 1993, betweenCG&E and Jackson H. Randolph. |
| Cinergy Corp.CG&E 1994 Form 10-K.10-K
|
10-n10-u | | Cinergy Corp.
CG&E | | Amended and Restated Supplemental Retirement Income Agreement betweenCG&E and Jackson H. Randolph.Randolph dated January 1, 1995. |
| Cinergy Corp.CG&E 1995 Form 10-K.10-K
|
10-o10-v | | Cinergy Corp.
CG&E | | Amended and Restated Supplemental Executive Retirement Income Agreement betweenCG&Eand certain executive officers. |
| Cinergy Corp.CG&E 1997 Form 10-K.10-K
|
10-p10-w | | Cinergy Corp. |
| Cinergy Corp. Union Employees' 401(k) Plan as amended and restated effective January 1, 1998, adopted December 18, 1997. | | Cinergy Corp. 1999 Form 10-K. |
10-q | | Cinergy Corp. | | Amendment toCinergy Corp. Union Employees' 401(k) Plan, adopted December 10, 1999, effective December 1, 1999. | | Cinergy Corp. 1999 Form 10-K. |
10-r | | Cinergy Corp. | | Cinergy Corp. Non-Union Employees' 401(k) Plan as amended and restated effective January 1, 1998, adopted December 18, 1997. | | Cinergy Corp. 1999 Form 10-K. |
10-s | | Cinergy Corp. | | Amendment toCinergy Corp. Non-Union Employees' 401(k) Plan, adopted December 10, 1999, effective December 1, 1999. | | Cinergy Corp. 1999 Form 10-K. |
10-t | | Cinergy Corp. | | Cinergy Corp. Union Employees' Savings Incentive Plan as amended and restated effective January 1, 1998, adopted December 18, 1997. | | Cinergy Corp. 1999 Form 10-K. |
10-u | | Cinergy Corp. | | Amendment toCinergy Corp. Union Employees' Savings Incentive Plan, effective December 1, 1999, adopted December 10, 1999. | | Cinergy Corp. 1999 Form 10-K. |
10-v | | Cinergy Corp. | | Cinergy Corp. Supplemental Executive Retirement Plan amended and restated effective January 1, 1999, adopted October 15, 1998. |
| Cinergy Corp. 1999 Form 10-K.10-K |
10-w10-x | | Cinergy Corp. | | Amendment to Cinergy Corp. Supplemental Executive Retirement Plan, effective January 1, 2003, adopted October 10, 2003. |
| Cinergy Corp. 2003 Form 10-K |
10-y | | Cinergy Corp. | | Amendment to Cinergy Corp. Supplemental Executive Retirement Plan, effective January 1, 2003, adopted December 15, 2003. |
| Cinergy Corp. 2003 Form 10-K |
10-z | | Cinergy Corp. | | 1997 Amendments to Various Compensation and Benefit Plans ofCinergy Corp., adopted January 30, 1997. |
| Cinergy Corp. 1997 Form 10-K.10-K |
10-x10-aa | | Cinergy Corp. |
| Cinergy Corp. Stock Option Plan, adopted October 18, 1994, effective October 24, 1994. |
| Cinergy Corp. Form S-8, filed October 19, 1994.1994 |
10-y10-bb | | Cinergy Corp. | | Amendment toCinergy Corp. Stock Option Plan, amended October 22, 1996, effective November 1, 1996. |
| Cinergy Corp. September 30, 1996, Form 10-Q.10-Q |
10-z10-cc | | Cinergy Corp. | | Amended and Restated Cinergy Corp. Annual Incentive Plan, adopted October 18, 1994, effective October 24, 1994.January 25, 2002. |
| Cinergy Corp. 2001 Form 10-K |
10-dd | | Cinergy Corp. 1994 Form 10-K. |
10-aa |
| Cinergy Corp. | | Amendment toCinergy Corp. Annual Incentive Plan, amended January 25, 1996, effective January 1, 1996. | | Cinergy Corp. 1996 Form 10-K. |
10-bb | | Cinergy Corp. | | Cinergy Corp. Employee Stock Purchase and Savings Plan, adopted October 18, 1994, effective October 24, 1994. |
| Cinergy Corp. Form S-8, filed October 19, 1994.1994 |
10-cc10-ee | | Cinergy Corp. | | Amendment toCinergy Corp. Employee Stock Purchase and Savings Plan, adopted April 26, 1996, effective January 1, 1996. |
| Cinergy Corp. June 30, 1996, Form 10-Q.10-Q |
10-dd10-ff | �� | Cinergy Corp. | | Amendment toCinergy Corp. Employee Stock Purchase and Savings Plan, adopted October 22, 1996, effective November 1, 1996. |
| Cinergy Corp. September 30, 1996, Form 10-Q.10-Q |
10-ee10-gg | | Cinergy Corp. |
| Cinergy Corp. UK Sharesave Scheme, adopted and effective December 16, 1999. |
| Cinergy Corp. 1999 Form 10-K.10-K |
10-ff10-hh | | Cinergy Corp. |
| Cinergy Corp. Directors'Directors’ Deferred Compensation Plan, adopted October 18, 1994, effective October 24, 1994. |
| Cinergy Corp. Form S-8, filed October 19, 1994.1994 |
10-gg10-ii | | Cinergy Corp. | | Amendment toCinergy Corp. Directors' Directors’ Deferred Compensation Plan, adopted October 22, 1996. |
| Cinergy Corp. September 30, 1996, Form 10-Q.10-Q |
10-hh10-jj | | Cinergy Corp. |
| Cinergy Corp. Retirement Plan for Directors, adopted October 18, 1994, effective October 24, 1994. | | Cinergy Corp. 1994 Form 10-K. |
10-ii | | Cinergy Corp. | | Cinergy Corp. Retirement Plan for Directors, amended and restated effective January 1, 1999, adopted October 15, 1998. |
| Cinergy Corp. Schedule 14A Definitive Proxy Statement filed March 12, 1999.1999 |
10-jj10-kk | | Cinergy Corp. |
| Cinergy Corp. Directors'Directors’ Equity Compensation Plan adopted October 15, 1998, effective January 1, 1999. |
| Cinergy Corp. Schedule 14ADefinitive Proxy Statement filed March 12, 1999.1999 |
10-kk10-ll | | Cinergy Corp. |
| Cinergy Corp. Executive Supplemental Life Insurance Program adopted October 18, 1994, effective October 24, 1994, consisting of Defined Benefit Deferred Compensation Agreement, Executive Supplemental Life Insurance Program Split Dollar Agreement I, and Executive Supplemental Life Insurance Program Split Dollar Agreement II. |
| Cinergy Corp. 1994 Form 10-K.10-K |
10-ll10-mm | | Cinergy Corp. |
| Cinergy Corp. Executive Life Insurance Plan, effective as of January 1, 2004, adopted December 18, 2003. |
| Cinergy Corp. 2003 Form 10-K |
10-nn | | Cinergy Corp. | | Amended and Restated Cinergy Corp. 1996 Long-term Incentive Compensation Plan, adopted April 26, 1996.effective January 25, 2002. |
| Cinergy Corp. 2001 Form 10-K |
10-oo | | Cinergy Corp. Schedule 14A Definitive Proxy Statement filed March 13, 1996. |
10-mm |
| Cinergy Corp. | | Amendment toCinergy Corp. 1996 Long-term Incentive Compensation Plan, adopted October 22, 1996, effective November 1, 1996. | | Cinergy Corp. September 30, 1996, Form 10-Q. |
10-nn | | Cinergy Corp. | | Cinergy Corp. 401(k) Excess Plan, effective January 1, 1997, adopted December 17, 1996. |
| Cinergy Corp. 1996 Form 10-K.10-K |
10-oo10-pp | | Cinergy Corp. | | Amendment to Cinergy Corp. 401(k) Excess Plan, adopted January 24, 2002, effective January 1, 2002. |
| Cinergy Corp. Form S-8, filed January 31, 2002 |
203
10-qq | | Cinergy Corp. | | Amendment to Cinergy Corp. 401(k) Excess Plan, adopted December 18, 2002, effective January 1, 2003. |
| Cinergy Corp. 2002 Form 10-K |
10-rr | | Cinergy Corp. | | Amendment to Cinergy Corp. 401(k) Excess Plan, adopted March 31, 2004, effective January 1, 2004. |
| Cinergy Corp. March 31, 2004 Form 10-Q |
10-ss | | Cinergy Corp. |
| Cinergy Corp. Nonqualified Deferred Incentive Compensation Plan, effective January 1, 1997, adopted December 17, 1996. |
| Cinergy Corp. 1996 Form 10-K.10-K |
10-pp10-tt | | Cinergy Corp. | | Amendment to Cinergy Corp. Nonqualified Deferred Incentive Compensation Plan, adopted December 18, 2002, effective January 1, 2002. |
| Cinergy Corp. 2002 Form 10-K |
10-uu | | Cinergy Corp. |
| Cinergy Corp. Director, Officer and Key Employee Stock Purchase Program, effective January 7, 2000, adopted December 10, 1999. |
| Cinergy Corp. 1999 Form 10-K.10-K |
10-qq10-vv | | Cinergy Corp. |
| Cinergy Corp. Non-Union Employees'Employees’ Pension Plan adopted December 18, 2002, amended and restated effective January 1, 2003. |
| Cinergy Corp. 2002 Form 10-K |
10-ww | | Cinergy Corp. | | Amendment to Cinergy Corp. Non-Union Employees’ Pension Plan, effective May 1, 2003, adopted October 10, 2003. |
| Cinergy Corp. 2003 Form 10-K |
10-xx | | Cinergy Corp. | | Amendment to Cinergy Corp. Non-Union Employees’ Pension Plan, effective December 1, 2003, adopted October 10, 2003. |
| Cinergy Corp. 2003 Form 10-K |
10-yy | | Cinergy Corp. | | Amendment to Cinergy Corp. Non-Union Employees’ Pension Plan, effective January 1, 2005, adopted December 17, 2004. |
|
|
10-zz | | Cinergy Corp. |
| Cinergy Corp. Non-Union Employees’ Severance Opportunity Plan as amended and restated effective June 1, 2001, adopted May 30, 2001. |
| Cinergy Corp. June 30, 2001, Form 10-Q |
10-aaa | | Cinergy Corp. | | Amendment to the Amended and Restated Separation and Retirement Agreement and Waiver and Release of Liability, between Cinergy Corp. and Larry E. Thomas. |
| Cinergy Corp. March 31, 2002, Form 10-Q |
10-bbb | | Cinergy Corp. | | Second Amendment to the Amended and Restated Separation and Retirement Agreement and Waiver and Release of Liability, between Cinergy Corp. and Larry E. Thomas. |
| Cinergy Corp. June 30, 2002, Form 10-Q |
10-ccc | | Cinergy Corp. | | Amended and Restated Cinergy Corp. Non-Union Employees’ 401(k) Plan, adopted December 18, 2002, effective January 1, 2003. |
| Cinergy Corp. 2002 Form 10-K |
10-ddd | | Cinergy Corp. | | Amendment to Cinergy Corp. Non-Union Employees’ 401(k) Plan, effective December 1, 2003, adopted October 10, 2003. |
| Cinergy Corp. 2003 Form 10-K |
10-eee | | Cinergy Corp. | | Amendment to Cinergy Corp. Non-Union Employees’ 401(k) Plan, effective January 1, 2004, adopted December 16, 2003. |
| Cinergy Corp. 2003 Form 10-K |
10-fff | | Cinergy Corp. | | Amendment to Cinergy Corp. Non-Union Employees’ 401(k) Plan, effective January 1, 2005, adopted December 17, 2004. |
|
|
10-ggg | | Cinergy Corp. |
| Cinergy Corp. Union Employees’ 401(k) Plan as amended and restated effective January 1, 1998, adopted December 18, 1997. |
| Cinergy Corp. 1999 Form 10-K.10-K |
10-rr10-hhh | | Cinergy Corp. | | Amendment to Cinergy Corp. Union Employees’ 401(k) Plan, adopted December 1, 1999, effective December 10, 1999. |
| Cinergy Corp. 1999 Form 10-K |
10-iii | | Cinergy Corp. | | Amendment to Cinergy Corp. Union Employees’ 401(k) Plan, effective January 1, 2004, adopted December 16, 2003. |
| Cinergy Corp. 2003 Form 10-K |
10-jjj | | Cinergy Corp. | | Amendment to Cinergy Corp. Union Employees’ 401(k) Plan, effective January 1, 2005, adopted December 17, 2004. |
|
|
10-kkk | | Cinergy Corp. |
| Cinergy Corp. Union Employees' Retirement IncomeEmployees’ Savings Incentive Plan as amended and restated effective January 1, 1998, adopted December 18, 1997. |
| Cinergy Corp. 1999 Form 10-K.10-K |
10-ss10-lll | | Cinergy Corp.
CG&E
PSI
| | Employment Agreement dated February 12, 2001, amongCinergy Corp. | | , Services,Amendment to Cinergy Corp. Union Employees’ Savings Incentive Plan, effective December 1, 1999, adopted December 10, 1999.
|
| CG&ECinergy Corp., 1999 Form 10-K
|
10-mmm | | Cinergy Corp. | | Amendment to Cinergy Corp. Union Employees’ Savings Incentive Plan, effective January 1, 2004, adopted December 16, 2003. |
| Cinergy Corp. 2003 Form 10-K |
10-nnn | | Cinergy Corp. | | Amendment to Cinergy Corp. Union Employees’ Savings Incentive Plan, effective January 1, 2005, adopted December 17, 2004. |
|
|
10-ooo | | Cinergy Corp. |
| Cinergy Corp. Excess Profit Sharing Plan, effective as of January 1, 2003, adopted December 20, 2002. |
| Cinergy Corp. 2003 Form 10-K |
10-ppp | | Cinergy Corp. |
| Cinergy Corp. Excess Pension Plan, as amended and restated, effective as of January 1, 1998. |
| Cinergy Corp. 2003 Form 10-K |
10-qqq | | Cinergy Corp. | | Amendment to Cinergy Corp. Excess Pension Plan, effective as of August 29, 2002. |
| Cinergy Corp. 2003 Form 10-K |
10-rrr | | Cinergy Corp. | | Amendment to Cinergy Corp. Excess Pension Plan, effective as of January 1, 2003, adopted October 10, 2003. |
| Cinergy Corp. 2003 Form 10-K |
10-sss | | Cinergy Corp. | | Amendment to Cinergy Corp. Excess Pension Plan, effective as of December 15, 2003. |
| Cinergy Corp. 2003 Form 10-K |
204
10-ttt | | Cinergy Corp. | | Amendment to Cinergy Corp. Excess Pension Plan, effective as of January 1, 2004, adopted December 16, 2003. |
| Cinergy Corp. 2003 Form 10-K |
10-uuu | | Cinergy Corp. | | Amendment to Cinergy Corp. Excess Pension Plan, effective as of January 1, 2005, adopted December 17, 2004. |
|
|
10-vvv | | PSI | | Asset Purchase Agreement by and among Cinergy Capital & Trading, Inc., CinCap Madison, LLC and R. Foster Duncan.PSI dated as of February 5, 2003. |
| PSI March 31, 2003 Form 10-Q |
| 10-www | | PSI | | Asset Purchase Agreement by and among Cinergy Capital & Trading, Inc., CinCap VII, LLC and PSI dated as of February 5, 2003. |
| PSI March 31, 2003 Form 10-Q |
|---|
| |
| | |
|
|
10-xxx | | Cinergy Corp. | | Form of incentive stock option grant agreement. |
| Cinergy Corp. September 30, 2004 Form 10-Q |
| |
| | |
|
|
10-yyy | | Cinergy Corp. | | Form of non-qualified stock option grant agreement. |
| Cinergy Corp. September 30, 2004 Form 10-Q |
| |
| | |
|
|
10-zzz | | Cinergy Corp. | | Form of restricted stock grant agreement. |
| Cinergy Corp. September 30, 2004 Form 10-Q |
| |
| | |
|
|
10-aaaa | | Cinergy Corp. | | Form of performance share grant agreement. |
| Cinergy Corp. September 30, 2004 Form 10-Q |
| |
| | |
|
|
10-bbbb | | Cinergy Corp. | | Form of phantom stock grant agreement. |
| Cinergy Corp. September 30, 2004 Form 10-Q |
| |
| | |
|
|
10-cccc | | Cinergy Corp. | | Summary Sheet of Compensation Arrangement between Cinergy Corp. and its Non-Employee Directors. |
|
|
| | | | | | |
10-dddd | | Cinergy Corp. | | Form of Stock Award Agreement by and between Cinergy Corp. and its Directors |
| Cinergy Corp. Form 8-K, filed December 14, 2004 |
| | | | | | |
10-eeee | | Cinergy Corp. | | Form of Deferred Compensation Agreement by and between Cinergy Corp. and its Directors |
| Cinergy Corp. Form 8-K, filed December 14, 2004 |
Subsidiaries of the registrant
| |
| |
| |
|
|
|
|
|
|
|
|---|
21 | | Cinergy Corp. CG&E
PSI | | Subsidiaries of Cinergy Corp.
, CG&E
, and PSI | | Subsidiaries ofCinergy Corp.,CG&E, andPSI | | |
| Consent of experts and counsel
| |
| |
| |
|
|
|
|
|
|
|
|---|
23 | | Cinergy Corp.
CG&E
PSI
ULH&P | | Consent of Independent Public AccountantsAuditors’ Consent | | |
| Power of attorney
| |
| |
| |
|
|
|
|
|
|
|
|---|
24 | | Cinergy Corp.
CG&E
PSI
ULH&P | | Power of Attorney | | |
Certifications |
|
|
|
|
|
|
31-a | | Cinergy Corp. CG&E
PSI
ULH&P | | Certification by James E. Rogers pursuant to Rule 13a-14(a)/15d-14(a) of the Exchange Act, as adopted pursuant to Section 302 of the Sarbanes-Oxley Act of 2002. |
|
|
31-b | | Cinergy Corp. CG&E
PSI
ULH&P | | Certification by James L. Turner pursuant to Rule 13a-14(a)/15d-14(a) of the Exchange Act, as adopted pursuant to Section 302 of the Sarbanes-Oxley Act of 2002. |
|
|
32-a | | Cinergy Corp. CG&E
PSI
ULH&P | | Certification by James E. Rogers pursuant to 18 U.S.C. Section 1350, as adopted pursuant to Section 906 of the Sarbanes-Oxley Act of 2002. |
|
|
32-b | | Cinergy Corp. CG&E
PSI
ULH&P | | Certification by James L. Turner pursuant to 18 U.S.C. Section 1350, as adopted pursuant to Section 906 of the Sarbanes-Oxley Act of 2002. |
|
|
| |
(1) | Regulation S-K 229.10(d) requires Registrants to identify the physical location, by SEC file number reference, of all documents that are incorporated by reference and have been on file with the SEC for more than five years. The SEC file number references for Cinergyand its subsidiaries, which are registrants are provided below: |
| Cinergy Corp. in file number 1-11377 |
| CG&E in file number 1-1232 |
| PSI in file number 1-3543 |
| ULH&P in file number 2-7793 |
|
|
| Each registrant hereby undertakes to furnish to the SEC upon request a copy of any long-term debt instrument not previously listed. |
205
Cinergy Corp.in file number 1-11377(2)CG&Ein file number 1-1232(3)PSIin file number 1-3543(4)ULH&Pin file number 2-7793(5)Each registrant hereby undertakes to furnish to the Commission upon request a copy of any long-term debt instrument not listed above.
FINANCIAL STATEMENT SCHEDULES
CINERGY CORP.
SCHEDULE II—II - VALUATION AND QUALIFYING ACCOUNTS
FOR THE THREE YEARS ENDED DECEMBER 31, 2000
2004
(in thousands)
Col. A
| | Col. B
| | Col. C
| | Col. D
| | Col. E
|
|---|
| |
| | Additions
| | Deductions
| |
|
|---|
Description
| | Balance at
Beginning
of Period
| | Charged to
Expenses
| | Charged to
Other
Accounts
| | For Purposes
for Which
Reserves
Were Created
| | Other
| | Balance at
Close of
Period
|
|---|
| Accumulated Provisions Deducted from Applicable Assets | | | | | | | | | | | | | | | | | | |
| | Allowance for Doubtful Accounts | | | | | | | | | | | | | | | | | | |
| | | 2000 | | $ | 26,811 | | $ | 22,746 | | $ | 4,486 | | $ | 24,092 | | $ | — | | $ | 29,951 |
| | | 1999 | | $ | 25,622 | | $ | 20,805 | | $ | 3,777 | | $ | 23,393 | | $ | — | | $ | 26,811 |
| | | 1998 | | $ | 10,382 | | $ | 29,430 | | $ | 4,022 | | $ | 18,212 | | $ | — | | $ | 25,622 |
THE CINCINNATI GAS & ELECTRIC COMPANY
SCHEDULE II—VALUATION AND QUALIFYING ACCOUNTS
FOR THE THREE YEARS ENDED DECEMBER 31, 2000
(in thousands)
Col. A
| | Col. B
| | Col. C
| | Col. D
| | Col. E
|
|---|
| |
| | Additions
| | Deductions
| |
|
|---|
Description
| | Balance at
Beginning
of Period
| | Charged to
Expenses
| | Charged to
Other
Accounts
| | For Purposes
for Which
Reserves
Were Created
| | Other
| | Balance at
Close of
Period
|
|---|
| Accumulated Provisions Deducted from Applicable Assets | | | | | | | | | | | | | | | | | | |
| | Allowance for Doubtful Accounts | | | | | | | | | | | | | | | | | | |
| | | 2000 | | $ | 16,740 | | $ | 14,056 | | $ | 4,486 | | $ | 16,238 | | $ | — | | $ | 19,044 |
| | | 1999 | | $ | 17,607 | | $ | 9,754 | | $ | 4,017 | | $ | 14,638 | | $ | — | | $ | 16,740 |
| | | 1998 | | $ | 9,199 | | $ | 16,131 | | $ | 4,021 | | $ | 11,744 | | $ | — | | $ | 17,607 |
PSI ENERGY, INC.
SCHEDULE II—VALUATION AND QUALIFYING ACCOUNTS
FOR THE THREE YEARS ENDED DECEMBER 31, 2000
(in thousands)
Col. A
| | Col. B
| | Col. C
| | Col. D
| | Col. E
|
|---|
| |
| | Additions
| | Deductions
| |
|
|---|
Description
| | Balance at
Beginning
of Period
| | Charged to
Expenses
| | Charged to
Other
Accounts
| | For Purposes
for Which
Reserves
Were Created
| | Other
| | Balance at
Close of
Period
|
|---|
| Accumulated Provisions Deducted from Applicable Assets | | | | | | | | | | | | | | | | | | |
| | Allowance for Doubtful Accounts | | | | | | | | | | | | | | | | | | |
| | | 2000 | | $ | 9,934 | | $ | 7,088 | | $ | — | | $ | 7,705 | | $ | — | | $ | 9,317 |
| | | 1999 | | $ | 7,893 | | $ | 11,036 | | $ | (240 | ) | $ | 8,755 | | $ | — | | $ | 9,934 |
| | | 1998 | | $ | 1,183 | | $ | 13,178 | | $ | — | | $ | 6,468 | | $ | — | | $ | 7,893 |
THE UNION LIGHT, HEAT AND POWER COMPANY
SCHEDULE II—VALUATION AND QUALIFYING ACCOUNTS
FOR THE THREE YEARS ENDED DECEMBER 31, 2000
(in thousands)
Col. A
| | Col. B
| | Col. C
| | Col. D
| | Col. E
|
|---|
| |
| | Additions
| | Deductions
| |
|
|---|
Description
| | Balance at
Beginning
of Period
| | Charged to
Expenses
| | Charged to
Other
Accounts
| | For Purposes
for Which
Reserves
Were Created
| | Other
| | Balance at
Close of
Period
|
|---|
| Accumulated Provisions Deducted from Applicable Assets | | | | | | | | | | | | | | | | | | |
| | Allowance for Doubtful Accounts | | | | | | | | | | | | | | | | | | |
| | | 2000 | | $ | 1,513 | | $ | 2,555 | | $ | 746 | | $ | 3,322 | | $ | — | | $ | 1,492 |
| | | 1999 | | $ | 1,248 | | $ | 2,169 | | $ | 693 | | $ | 2,597 | | $ | — | | $ | 1,513 |
| | | 1998 | | $ | 996 | | $ | 1,861 | | $ | 583 | | $ | 2,192 | | $ | — | | $ | 1,248 |
SIGNATURES
Col. A | | Col. B | | Col. C | | Col. D | | Col. E | |
| | | | Additions | | Deductions | | | |
Description | | Balance at Beginning of Period | | Charged to Expenses | | Charged to Other Accounts | | For Purposes for Which Reserves Were Created | | Other | | Balance at Close of Period | |
| | | | | | | | | | | | | |
Cinergy Corp. and subsidiaries | | | | | | | | | | | | | |
| | | | | | | | | | | | | |
Accumulated Provisions | | | | | | | | | | | | | |
Deducted from Applicable Assets | | | | | | | | | | | | | |
| | | | | | | | | | | | | |
Allowance for Doubtful Accounts | | | | | | | | | | | | | |
| | | | | | | | | | | | | |
2004 | | $ | 7,884 | | $ | 1,317 | | $ | 153 | | $ | 3,840 | | $ | — | | $ | 5,514 | |
| | | | | | | | | | | | | |
2003 | | $ | 16,368 | | $ | 3,256 | | $ | 302 | | $ | 12,042 | | $ | — | | $ | 7,884 | |
| | | | | | | | | | | | | |
2002 | | $ | 34,110 | | $ | 7,883 | | $ | 9,270 | | $ | 34,873 | | $ | 22 | | $ | 16,368 | |
| | | | | | | | | | | | | |
CG&E and subsidiaries | | | | | | | | | | | | | |
| | | | | | | | | | | | | |
Accumulated Provisions | | | | | | | | | | | | | |
Deducted from Applicable Assets | | | | | | | | | | | | | |
| | | | | | | | | | | | | |
Allowance for Doubtful Accounts | | | | | | | | | | | | | |
| | | | | | | | | | | | | |
2004 | | $ | 1,602 | | $ | 570 | | $ | 114 | | $ | 1,564 | | $ | — | | $ | 722 | |
| | | | | | | | | | | | | |
2003 | | $ | 5,942 | | $ | 2,900 | | $ | 256 | | $ | 7,496 | | $ | — | | $ | 1,602 | |
| | | | | | | | | | | | | |
2002 | | $ | 25,874 | | $ | 2,029 | | $ | 6,096 | | $ | 28,057 | | $ | — | | $ | 5,942 | |
| | | | | | | | | | | | | |
PSI | | | | | | | | | | | | | |
| | | | | | | | | | | | | |
Accumulated Provisions | | | | | | | | | | | | | |
Deducted from Applicable Assets | | | | | | | | | | | | | |
| | | | | | | | | | | | | |
Allowance for Doubtful Accounts | | | | | | | | | | | | | |
| | | | | | | | | | | | | |
2004 | | $ | 1,110 | | $ | 21 | | $ | — | | $ | 960 | | $ | — | | $ | 171 | |
| | | | | | | | | | | | | |
2003 | | $ | 5,656 | | $ | — | | $ | — | | $ | 4,546 | | $ | — | | $ | 1,110 | |
| | | | | | | | | | | | | |
2002 | | $ | 6,773 | | $ | 2,310 | | $ | 3,174 | | $ | 6,579 | | $ | 22 | | $ | 5,656 | |
| | | | | | | | | | | | | |
ULH&P | | | | | | | | | | | | | |
| | | | | | | | | | | | | |
Accumulated Provisions | | | | | | | | | | | | | |
Deducted from Applicable Assets | | | | | | | | | | | | | |
| | | | | | | | | | | | | |
Allowance for Doubtful Accounts | | | | | | | | | | | | | |
| | | | | | | | | | | | | |
2004 | | $ | 192 | | $ | — | | $ | — | | $ | 179 | | $ | — | | $ | 13 | |
| | | | | | | | | | | | | |
2003 | | $ | 84 | | $ | — | | $ | 108 | | $ | — | | $ | — | | $ | 192 | |
| | | | | | | | | | | | | |
2002 | | $ | 1,196 | | $ | 392 | | $ | 2,383 | | $ | 3,887 | | $ | — | | $ | 84 | |
| | | | | | | | | | | | | |
| | | | | | | | | | | | | | | | | | | | | | |
206
Pursuant to the requirements of Section 13 or 15(d) of the Securities Exchange Act of 1934, Cinergy Corp., The Cincinnati Gas & Electric Company, PSI Energy, Inc., and The Union Light, Heat and Power Company each has duly has caused this report to be signed on its behalf by the undersigned, thereunto duly authorized.
CINERGY CORP.
CORP.
THE CINCINNATI GAS & ELECTRIC COMPANY
PSI ENERGY,ENERGY, INC.
THE UNION LIGHT, HEAT AND POWER COMPANY
Registrants
Date: February 27, 200125, 2004 |
|
|
|
|
By |
|
|
| |
| By | /s/ JAMES E. ROGERS
James E. Rogers
Chairman | |
| | James E. Rogers | |
| | Chief Executive Officer | |
207
Pursuant to the requirements of the Securities Exchange Act, of 1934, this report has been signed by the following persons on behalf of the indicated registrants and in the capacities and on the dates indicated:
| Signature
| | |
| Title
| | |
| Date
|
|---|
Cinergy |
|
|
|
|
|
|
|
|
|
|
|
Cinergy Corp. |
|
|
|
|
|
| Michael G. Browning* | | Director | | February 25, 2005 |
| Phillip R. CoxCox* | | Director | | February 25, 2005 |
| George C. JuilfsJuilfs* | | Director | | February 25, 2005 |
| Thomas E. PetryPetry* | | Director | | February 25, 2005 |
| Jackson H. Randolph | | Director | | | |
| /s/ James E. Rogers | | | | | |
| James E. Rogers | | | Director and Chief Executive Officer (principal executive officer) | | February 25, 2005 |
| Mary L. SchapiroSchapiro* | | Director | | February 25, 2005 |
| John J. Schiff, Jr.* | | Director | | February 25, 2005 |
| Philip R. SharpSharp* | | Director | | February 25, 2005 |
| Dudley S. TaftTaft* | | Director | | February 25, 2005 |
Cinergy and PSI |
|
|
|
| | |
| James K. Baker | | Director | | |
| Michael G. Browning | | Director | | |
| John A. Hillenbrand II | | Director | | |
CG&E and ULH&P |
|
|
|
|
| /s/ James L. Turner | | | | | |
| James L. Turner | | | Chief Financial Officer (principal financial officer) | | February 25, 2005 |
| | | | | | |
| /s/ Lynn J. Good | | | | | |
| Lynn J. Good | | | Vice President and DirectorController (principal accounting officer) | | February 25, 2005 |
|
|
|
|
|
|
|
CG&E |
|
|
|
|
|
| Michael J. Joseph Hale, Jr.Cyrus* | | President and Director | | February 25, 2005 |
PSI |
|
|
|
| | |
| Vicky A. Bailey | | President and Director | | |
Cinergy, CG&E, PSI, and ULH&P |
|
|
|
|
/s/ JAMES E. ROGERS
James E. Rogers
Attorney-in-fact for all
the foregoing persons |
|
Chairman, | | | |
| James E. Rogers | | | Director and Chief Executive Officer and Director President of Cinergy
(Principal Executive Officer)(principal executive officer) |
|
February 27, 200125, 2005 |
/s/ CHARLES J. WINGER
Charles J. Winger |
|
Vice President and
Director of ULH&P
(Principal Financial Officer) |
|
February 27, 2001 | | |
| /s/ BERNARD F. ROBERTS
Bernard F. RobertsJames L. Turner |
|
| | | |
| James L. Turner | | | Director and Chief Financial Officer (principal financial officer) | | February 25, 2005 |
| | | | | | |
| /s/ Lynn J. Good | | | | | |
| Lynn J. Good | | | Vice President and Comptroller
(Principal Accounting Officer)Controller (principal accounting officer) |
|
February 27, 200125, 2005 |
| | | | | | |
PSI |
|
|
|
|
|
| Michael G. Browning* | | Director | | February 25, 2005 |
| Kay E. Pashos* | | | Director | | February 25, 2005 |
| | | | | | |
| /s/ James E. Rogers | | | | | |
| James E. Rogers | | | Director and Chief Executive Officer (principal executive officer) | | February 25, 2005 |
| | | | | | |
| /s/ James L. Turner | | | | | |
| James L. Turner | | | Chief Financial Officer (principal financial officer) | | February 25, 2005 |
| | | | | | |
| /s/ Lynn J. Good | | | | | |
| Lynn J. Good | | | Vice President and Controller (principal accounting officer) | | February 25, 2005 |
| | | | | | |
ULH&P |
|
|
|
|
|
| | | | | | |
| Michael J. Cyrus* | | | Director | | February 25, 2005 |
| | | | | | |
| /s/ James E. Rogers | | | | | |
| James E. Rogers | | | Director and Chief Executive Officer (principal executive officer) | | February 25, 2005 |
| | | | | | |
| /s/ James L. Turner | | | | | |
| James L. Turner | | | Director and Chief Financial Officer (principal financial officer) | | February 25, 2005 |
| | | | | | |
| /s/ Lynn J. Good | | | | | |
| Lynn J. Good | | | Vice President and Controller (principal accounting officer) | | February 25, 2005 |
| | | | | | |
| | | | | | | | | | | | | | | | | |
* The undersigned, by signing his name hereto, does hereby execute this Form 10-K on behalf of the officers and directors of the registrant previously indicated by asterisks, pursuant to powers of attorney duly executed by such officers and directors and incorporated by reference as an exhibit to this Form 10-K.
208
/s/ James E. Rogers |
James E. Rogers |
Attorney-In-Fact |
February 25, 2005 |
|
/s/ James L. Turner |
James L. Turner |
Attorney-In-Fact |
February 25, 2005 |
209