Documents Incorporated by Reference:
Portions of the Registrant’s definitive Proxy Statement for its 20182022 Annual Meeting of Stockholders are incorporated by reference into Part III hereof.
|
| | |
Item no. | Form 10-K Report Page |
| |
| | | |
| |
| | |
| | |
| | |
| | |
| | |
| | |
| | | |
| |
| | |
| | |
| | |
| | |
| | |
| | |
| | |
| | |
| | | |
| |
| | |
| | |
| | |
| | |
| | |
| | | |
| |
| | |
| | |
| | | | | | | | |
Item No. | Form 10-K Report Page |
| |
| | |
| |
| | |
| | |
| | |
| | |
| | |
| | |
| | |
| |
| | |
| | |
| | |
| | |
| | |
| | |
| | |
| | |
| | |
| | |
| | |
| |
| | |
| | |
| | |
| | |
| | |
| | |
| |
| | |
| | |
FORWARD-LOOKING STATEMENTS OR INFORMATION
This Form 10-K and statements included or incorporated by reference in this Form 10-K include certain historical and forward-looking information. The forward-looking statements, includedwhich are made pursuant to the safe harbor provisions of the Private Securities Litigation Reform Act of 1995 (the “Act”). All statements, other than statements of historical facts, which address activities, events, or developments that we expect or anticipate will or may occur in the future, including such things as future capital expenditures (including their amount and nature), business strategy, expansion, anticipated future performance and growth of theour business operations and other such matters are forward-looking statements. To take advantage of the safe harbor provided by the Act, we are identifying certain factors that could cause actual results to differ materially from those expressed in any forward-looking statements, whether oral or written.statements. These factors include, without limitation, national, regional, and local economic conditions affecting consumer spending, weather conditions,including the seasonal natureeffects of the business,COVID-19 pandemic, the efficacy and distribution of COVID-19 vaccines, the timing and acceptance of new products, in the stores, the timing and mix of goods sold, purchase price volatility (including inflationary and deflationary pressures), transportation costs, constraints in the supply chain affecting timing and availability of merchandise inventory, the ability to increase sales at existing stores or on our e-commerce platforms, the ability to manage growth and identify suitable locations, the ability to complete acquisitions on expected terms, failure of an acquisition to produce anticipated results, the ability to successfully manage expenses (including increased expenses as a result of operating during the COVID-19 pandemic) and to execute our key gross margin enhancing initiatives, increases in fuel and other transportation costs, increases in wages due to competitive pressures or minimum wage laws and regulations, the availability of favorable credit sources, capital market conditions in general, the ability to open new stores in the time, manner and number currently contemplated, particularly in light of the COVID-19 pandemic, the ability to open distribution centers in the anticipated timeframe and within budget, the impact of new stores on theour business, competition, including that from online competitors, weather conditions, the seasonal nature of our business, effective merchandising initiatives and marketing initiatives,emphasis, the ability to retain vendors, reliance on foreign suppliers, the ability to attract, train, and retain qualified employees, increasing labor and benefit costs, our ability to meet our sustainability, stewardship, carbon emission, and diversity, equity, and inclusion ("DE&I") related environmental, social, and governance ("ESG") projections, goals, and commitments, product liability and other claims, changes in federal, state, or local regulations, the potential effects on our business of responses of government and public health authorities to the COVID-19 pandemic, the “shelter in place” and similar federal, state, and local regulations and protocols could have on our business, including our supply chain and employees, the effectiveness of the Company’s responses to COVID-19, including our efforts to make a vaccine available to our employees, and customer response with respect to those actions, the refusal by our employees and the public generally to be vaccinated against COVID-19, the imposition of tariffs on imported products or the disallowance of tax deductions on imported products, potential judgments, fines, legal fees, and other costs, breach of information systems or theft of employee or customer data, ongoing and potential future legal or regulatory proceedings, management of the Company’sour information systems, failure to develop and implement new technologies, the failure of customer-facing technology systems, business disruption resultingincluding from a natural or other disaster orthe implementation of new technologies, including but not limited to, new supply chain technologies, effective tax rate changes including expected effects of the Tax Cuts and Jobs Act, and results of examination by taxing authorities, the ability to maintain an effective system of internal control over financial reporting, and changes in accounting standards, assumptions, and estimates, and those described in Item 1A. “Risk Factors.” Forward-looking statements are based on currently available information and are based on our current expectations and projections about future events. We undertake no obligation to release publicly any revisions to these forward-looking statements to reflect events or circumstances after the date hereof or to reflect the occurrence of unanticipated events.
events, except as required by law.
PART I
Item 1. Business
Overview
Tractor Supply Company (the “Company” or "Tractor Supply" or “we” or “our” or “us”) is the largest operator of rural lifestyle retail storesretailer in the United States (“U.S.”). The Company is focused on supplying the needs of recreational farmers, and ranchers, and othersall those who enjoy living the rural lifestyle (which we refer to as the “Out Here” lifestyle), as well as tradesmen and small businesses.. We operate retail stores under the names Tractor Supply Company, Petsense, and Del’s Feed & Farm Supply and Petsense and operate websites under the names TractorSupply.com andPetsense.com. Supply. Our stores are located primarily in towns outlying major metropolitan markets and in rural communities.
We also offer an expanded assortment of products through the Tractor Supply mobile application and online at TractorSupply.com andPetsense.com.
The Company has one reportable industry segment which is the retail sale of products that support the rural lifestyle. At December 30, 2017,25, 2021, we operated 1,8532,181 retail stores in 49 states (1,685(2,003 Tractor Supply and Del’s retail stores and 168178 Petsense retail stores). Our Tractor Supply stores typically range in size from 15,000 to 20,000 square feet of inside selling space, along with additional outside selling space, and our Petsense stores have approximately 5,500 square feet of inside selling space. For Tractor Supply retail locations, we use a standard design for most new built-to-suit locations that includes approximately 15,500 square feet of inside selling space. Our online selling websites and our mobile application offer an extended assortment of products beyond those offered in-store and drive traffic into our stores through our buy online and pickup in-store and ship to store programs. Our retail store locations and digital capabilities provide the convenience to allow our customers to engage with us anytime, anywhere and in any way they choose.
On February 17, 2021, the Company announced that it entered into an agreement to acquire all of the outstanding equity interests of Orscheln Farm and Home, LLC, a farm and ranch retailer with 167 retail stores in 11 states, in an all-cash transaction for approximately $320 million. The Company intends to fund the acquisition through cash-on-hand. The acquisition is conditioned on the receipt of regulatory clearance and the satisfactory completion of customary closing conditions within a specified timeframe.
Business Strategy for Tractor Supply Company
We believe our sales and earnings growth is the result of executing our businessmulti-year strategy, which includes the following key components:
Market Niche
We have identified a specialized market niche: supplying the lifestyle needs of recreational farmers, and ranchers, and othersall those who enjoy living the rural lifestyle, as well as tradesmen and small businesses.lifestyle. By focusing our product assortment on these core customers, we believe we are differentiated from general merchandise, home center, and other specialty retailers. We cater to the rural lifestyle and often serve a market by being a trip consolidator for many basic maintenance needs for farm, ranch, and rural customers.customers through convenient shopping options both in-store and online.
Customers
Our target customers are home, land, pet, and livestock owners who generally have above average income and below average cost of living. We seek to serve a customer base that primarily lives in towns outlying major metropolitan markets and in rural communities. This customer base includes recreational farmers, and ranchers, and othersall those who enjoy living the rural lifestyle,lifestyle. We have seen a continuation of shifting consumer behavior trends due to the COVID-19 pandemic as well as tradesmencustomers focused on the care of their homes, land, and small businesses.animals, which resulted in a growing demand in everyday merchandise, including consumable, usable, and edible ("C.U.E.") products and seasonal categories.
Customer Service
We are committed to providing our customers reliable product availability and a high level of in-store service throughconvenient, customer-centric experience across shopping channels. In our motivated, well-trained store team members. Westores, we believe the ability of our storemotivated, well-trained team members to provide friendly, responsive and seasoned advice helps our customers find the right products to satisfy their everyday needs, as well as the specialty items needed to complete their rural lifestyle projects. We also engage with our customers through our e-commerce website (TractorSupply.com),websites and mobile application, which providesprovide the opportunity to allow customers to shop at a timeanytime, anywhere, and place that fits their schedulein any way
they choose, while delivering enhanced product information, research, and decision tools that support product selection and informational needs in specific subject areas. Additionally, we maintain a customer solutions centerCustomer Solutions Center at our Store Support Center located in Brentwood, Tennessee, to support our in-store and online customers, as well as our store team members. We believe this commitment to customer service promotes strong customer loyalty through personalized experiences and provides convenience that our customers expect, which drives repeat shopping.shopping experiences.
We use a third-party provider to survey and measure our level of customer service. This process allows customers to provide feedback on their shopping experience. Based on the third-party provider’s data, we believe our customer satisfaction scores to beare among the best-in-class. We carefully evaluate the feedback we receive from our customers and implement improvements at both the Company and the individual store level based on that feedback.
Store Personnel and Training
We seek to hire store team members with farming and ranching backgrounds, with particular emphasis on general maintenance, equine and welding. We endeavor to staff our stores with courteous, highly motivated team members and devote considerable resources to training store team members, often in cooperation with our vendors. Our training programs include:
a thorough on-boarding process to prepare new team members for their new role;
productive workplace environment training that is intended to educate team members on company policies and procedures covering topics such as harassment, discrimination, and retaliation;
new store opening training that prepares our store managers to open new stores to Company standards;
a management training program which covers all aspects of our store operations, delivering superior service and managing the team member experience;
structured training on customer service and selling skills;
online product knowledge training produced in conjunction with key vendors;
leadership development programs that prepare leaders to expand their current contributions; and
an annual store manager meeting with vendor product presentations.
Store Environment
Our stores are designed and managed to make shopping an enjoyable experience and to maximize sales and operating efficiencies. Stores are strategically arranged to provide an open environment for optimal product placement and visual display. In addition, these layouts allow for departmental space to be easily re-allocatedreallocated and visual displays to be changed for seasonal products and promotions. Display and product placement information is routinely sent to stores to ensure quality and uniformity among the stores.stores, and our Field Activity Support Teams ("FAST") are dedicated to support the stores in creating an enhanced in-store experience for our customers through best-in-class merchandising execution. Our store layouts and visual displays are designed to provide our customers a feeling of familiarity and convenience to enhance the shopping experience. Informative signs are located in key product categories to conveniently assist customers with purchasing decisions and merchandise location. These signs provide customers with a comparison of product qualities, clear pricing, useful information regarding product benefits, and suggestions for appropriate accessories. Our store layouts and visual displays are designed to provide our customers a feeling of familiarity and enhance the shopping experience. Also, our store team members wear highly visible red vests or aprons or smocks with nametags,name tags, and our customer service and checkout counters are conveniently located near the front of the store.Our stores have been equipped with tools such as team member communication devices, wireless internet, and mobile point-of-sale devices that enable our team members to provide an enhanced shopping experience to our customers. In addition, our buy online and pickup in-store and ship to store programs, including curbside pickup, provides convenient access for customers to pick up merchandise from our store locations.
We are in the midst of a multi-year project that began in 2020 to remodel our existing store base, bringing programs to life with new fixtures, layouts and products that truly enhance the customer shopping experience. The site level space is analyzed category by category and reallocated as needed to align with current merchandising strategies and to drive space productivity. Another space productivity initiative is to transform our side lot with an expanded product offering and an enhanced shopping experience. With this investment, the side lots space is leveraged to offer a wider product offering in the lawn and garden categories and our new categories with the garden center, and offer greater convenience through the expansion of our buy online and pickup in-store and ship to store capabilities for drive-thru pickup.
Merchandising and Purchasing
We offer an extensive assortment of products for all those seeking to enjoy the “Out Here” lifestyle, as well as tradesmen and small businesses. lifestyle. Our product assortment is tailored to meet the needs of our customers in various geographic markets. Our full line of product offerings includes a broad selection of high quality, reputable brand name and exclusive brand products and is supported by a strong in-stock inventory position with an average of 15,500approximately 16,000 to 20,00022,000 products per store.store as well as over 170,000 products online. No onesingle product accounted for more than 10% of our sales during 2017.fiscal 2021. Our comprehensive selection of merchandise is comprised of the following major product categories:
•Equine, livestock, pet, and small animal products, including items necessary for their health, care, growth, and containment;containment (i.e. fencing);
•Hardware, truck, towing, and tool products;
•Seasonal products, including heating, lawn and garden items, power equipment, gifts, and toys;
•Work/recreational clothing and footwear; and
•Maintenance products for agricultural and rural use.
The following table indicates the percentage of net sales represented by each of our major product categories during fiscal 2017, 20162021, 2020, and 2015:2019:
| | | | | | | | | | | | | | | | | |
| | Percent of Net Sales |
| Fiscal Year |
| Product Category: | 2021 | | 2020 | | 2019 |
| Livestock and Pet | 47 | % | | 47 | % | | 47 | % |
| Hardware, Tools and Truck | 21 | | | 21 | | | 21 | |
| Seasonal, Gift and Toy Products | 21 | | | 21 | | | 20 | |
| Clothing and Footwear | 8 | | | 7 | | | 8 | |
| Agriculture | 3 | | | 4 | | | 4 | |
| Total | 100 | % | | 100 | % | | 100 | % |
|
| | | | | | | | |
| | Percent of Net Sales |
| Product Category: | 2017 | | 2016 | | 2015 |
| Livestock and Pet | 47 | % | | 46 | % | | 44 | % |
| Hardware, Tools and Truck | 22 |
| | 22 |
| | 23 |
|
| Seasonal, Gift and Toy Products | 19 |
| | 19 |
| | 20 |
|
| Clothing and Footwear | 8 |
| | 8 |
| | 8 |
|
| Agriculture | 4 |
| | 5 |
| | 5 |
|
| Total | 100 | % | | 100 | % | | 100 | % |
Our buying team continuously reviews and updates our product assortment as necessary to respond to customer needs and to offer new, relevant products. We are focused on providing key products that our customers use on a regular basis for their lifestyle and maintenance
needs with emphasis on consumable, usable, and edible (“("C.U.E.”") products. Examples of C.U.E. product categories include, but are not limited to, livestock feed and bedding, pet food, bird seed, lubricants, propane, and various seasonal products, such as heating,fertilizer, weed control, mulch, pest control, and twine.
Our products are sourced through both domestic and international vendors.vendors, each of whom are expected to adhere to a code of conduct that guides our relationship. Our business is not dependent upon any onesingle vendor or particular group of vendors. We purchase our products from a group of approximately 900975 vendors, with no one vendor representing more than 10% of our purchases during fiscal 2017.2021. Approximately 350375 core vendors accounted for 90% of our merchandise purchases during fiscal 2017. We2021. Although the COVID-19 pandemic has resulted in the fluctuation of customer demands for certain products as well as global supply chain disruptions and delays, we have not experienced any significant difficulty in obtaining satisfactory alternative sources of supply for our products and weto meet customer demands. We believe that adequate sources of supply exist, at substantially similar costs for nearly all of our products. We have no material long-term contractual commitments with any of our product vendors.but they may cost more or require us to incur higher transportation costs.
Our buying teams focus on merchandise procurement, vendor line reviews, and testing of new products and programs. We also employ a dedicated inventory management team that focuses exclusively on forecasting and inventory replenishment, a committed merchandise planning team that concentrates on assortment planning, and a specialized pricing team that seeks to optimize market-specific pricing for our products. Through the combined efforts of these teams, we continue to focus on improving our overall inventory productivity and in-stock inventory position.
Intellectual Property
Our subsidiary, Tractor Supply Co. of Texas, LP (“TSCT”), owns registrations with the U.S. Patent and Trademark Office (“USPTO”) for various service marks including TSC®, Tractor Supply Co.®, TSC Tractor Supply Co.®, and the trapezium design for retail store services. We consider these service marks, and the accompanying goodwill and name recognition, to be valuable assets of our business. TSCT also owns several other service marks for retail services, some of which have been registered with the USPTO and some of which are the subject of applications for registration pending before the USPTO.
In addition to selling products that bear nationally-known manufacturer brands, we also sell products manufactured for us under a number of exclusive brands that we consider to be important to our business. These exclusive brands are manufactured for us by a number of vendors and provide an alternative to the national brands, which helps provide value for our customers and positions us as a destination store.retailer.
Our exclusive brands represented approximately 32%29% of our total sales in both fiscal 20172021 and 20162020 and 31% of our total sales in fiscal 2015.2019. Our exclusive brands include:
|
| | | | |
Ÿ 4health® (pet foods and supplies)
| Ÿ JobSmart® (tools)
|
Ÿ Bit & Bridle® (apparel and footwear)
| Ÿ Paws & Claws® (pet foods and supplies)
|
Ÿ Blue Mountain® (apparel)
| Ÿ Producer’s Pride® (livestock and horse feed and supplies)
|
Ÿ C.E. SchmidtAmerican Farmworks®(apparel (livestock, farm and footwear)ranch
| Ÿ Red Shed® (gifts, collectibles, and outdoor furniture)
|
| equipment) | |
Bit & Bridle® (apparel and footwear) | Redstone® (heating products) |
Ÿ Blue Mountain® (apparel)
| Retriever® (pet foods and supplies) |
C.E. Schmidt® (apparel and footwear) | Ridgecut® (apparel) |
Countyline® (livestock, farm and ranch equipment) | Ÿ RedstoneRoyal Wing® (heating products)bird feed and supplies)
|
Ÿ Dumor® (livestock and horse feed and supplies)
| Ÿ RetrieverStrive® (pet foods and supplies)(pet food)
|
Ÿ Equistages®(horse feed)
| Ÿ Royal WingGroundwork® (bird feed and supplies)
|
Ÿ Groundwork® (lawn and garden supplies)
| Ÿ Traveller® (truck and automotive products)
|
Ÿ Huskee® (outdoor power equipment)
| Ÿ Treeline® (hunting gear and accessories)
|
JobSmart® (tools) | TSC Tractor Supply Co® (trailers, truck tool boxes, and animal |
| bedding) |
Paws & Claws® (pet foods and supplies) | Untamed® (pet foods)
|
The exclusive brands identified above have been registered as trademarks with the USPTO for certain products and some are the subject of additional applications for registration pending before the USPTO for other products.
Our trademark and service mark registrations have various expiration dates; however, provided that we continue to use the marks and renewfile appropriate maintenance and renewal documentation with the registrationsUSPTO in a timely manner, the registrations are potentially perpetual in duration. Our patents (both United States and foreign) have expiration dates ranging from March 2024 to December 2045 and protect various elements, designs or functions of farm and ranch equipment, as well as light systems for trucks and other vehicles.
We believe our intellectual property, which includes the trademarks and service marks identified above, together with certain trade names, domain names, patents, and copyrights, has significant value and is an important component of our merchandising and marketing strategies.
Distribution
We currently operate a distribution facility network for supplying stores with merchandise and delivering product ordered through TractorSupply.com.our websites and mobile application. In fiscal 2017,2021, our Tractor Supply stores received approximately 74%76% of merchandise through this network while the remaining merchandise shipped directly to the stores from our vendors or directly to our stores or customers. We believe this flow facilitates the prompt and efficient distribution of merchandise in orderthat allows us to enhance in-stocks, minimizebe a dependable supplier to our customers for their "Out Here" lifestyle solutions by enhancing in-stock inventory positions, while minimizing freight costsexpense and improveimproving the inventory turn rate. Our distribution facilities, located in Arizona, Georgia, Indiana, Kentucky, Maryland, Nebraska, New York, Texas, and Washington represent a total distribution center capacity of 5.06.1 million square feet. In fiscal 2017, we began construction onWe also use third-party operated import centers, mixing centers and pop-up distribution facilities which provide additional distribution capacity.
The Company is building a new northeast distribution center in Frankfort, New York, as well as an expansionNavarre, Ohio, which is expected to be approximately 900,000 square feet and is currently anticipated to be completed in the fall of our existingfiscal 2022.
In addition, on January 26, 2022, the Company announced plans to build a new distribution center in Waverly, Nebraska, which will provide additionalMaumelle, Arkansas. This new distribution capacity once constructioncenter is completed.expected to be approximately 900,000 square feet. Construction is planned to begin in the middle of 2022 and is currently anticipated to be completed in late 2023.
We select the locations of our distribution facilities in an effort to minimize logistics costs and optimize the distance from distribution facilities to our stores. Our distribution centers utilize warehouse and labor management tools that support the planning, control, and processing of inventory. We manage our inbound and outbound transportation activity in-house through the use of a transportation management system. We utilize multiple common carriers for store and direct to customer
deliveries. We manage our transportation costs through carrier negotiations, the monitoring of transportation routes, and the scheduling of deliveries.
Marketing
We utilize an “everyday valuelow price” philosophy to consistently offer our products at competitive prices complemented by strategically planned promotions throughout the year. To drive store traffic and position ourselves as a destination store,retailer, we promote a broad selectionsselection of merchandise withthrough various digital and social media initiatives, television, newspaper circulars, customer targetedand customer-targeted direct e-mail and direct mail, as well as e-mail, digitallimited use of radio and socialother media initiatives.channels. In addition, our Neighbor’s Club loyalty program enhances our ability to create engagementengage with our customers, recognize and reward our best customers. customers, drive desired behaviors, and create brand advocacy. Vendors frequently support these specific programs by offering temporary cost reductions, additional funding, and honoring coupons. Our vendors also provide assistance with product presentation and fixture design, brochures, support for in-store events, and point-of-purchase materials for customer education, and product knowledge for our team members.
Omni-Channel
We connect with
Ensuring that our customers can engage with us in theirthe most convenient manner of choosing,for them whether that is in store,our stores, on our e-commerce website, (TractorSupply.com), e-mail, social media, direct mailon our mobile application, or throughvia our customer solutions center.Customer Solutions Center, is a high priority for us. Our goal is to be available anytime, anywhere, and in any way our customers choose to engage with our brand. We provide our customers the opportunity to shop in a manner that fits their lifestyle and is most convenient for them. Our focus is on delivering a comprehensive, seamless omni-channel shopping experience offering the conveniences our customers want and expect. We offer buy online, pickup in-store, and curbside pickup, which provides convenient access for customers to pick up merchandise from our store locations. Additionally, our online experience offers an expansive product assortment search capabilitiesincluding a direct to consumer assortment. This allows us to extend our aisles beyond our store locations and informationprovides convenient and useful content that is relevant for theirto our customers’ lifestyle. We provide our customers the ability to have products shipped directdirectly to our retail stores,store locations or to their homes or offices. For select products, we offer same day delivery. We maintain two fulfillment centers withinuse our distribution centerfacility network as well as our stores to support our e-commerce activities. In 2017, we completed the expansion of our buy online and pick up in store program which provides convenient customer pick up in our store locations. We also began providing additional convenience through flexible payment options and simplified checkout. We are focused on delivering an enhanced mobile and tablet experience, improving the site response time and expanding our product offerings for vendor direct to customer shipments, allowing us to serve our customers at any time. DigitalOur digital capabilities have further enhanced customer serviceour in-store shopping experience, allowing us to engage with our customers more effectively, and allowed us toexpanded our target markets outside of our current retail store locations.
Continuous Improvement
We are committed to a continuous improvement program to drive change throughout our organization. Using data analytics and team member engagement, we examine business processes and identify opportunities to reduce costs, drive innovation, and improve effectiveness. We establish goals for productivity and cost improvement. We have implemented numerous continuous improvement projects, with team members from multiple areas of our business, to evaluate key operations and implement process change. Team members are empowered and expected to challenge current paradigms and improve processes. Management encourages the participation of all team members in the decision-making process, regularly solicits input and suggestions from our team members, and incorporates suggestions into our improvement activities.
Management Information and Control Systems
We have invested resources in management information and control systems to provide legendary customer service and to deliver the right products in the right place at the right time. This investment includes use of digital technologies that support the "Out Here" lifestyle and integrate the customer experience in-store, online, and through our Customer Solutions Center, which offers customers the ability to shop anytime, anywhere, and in any way they choose. Our key platforms include:
•Point-of-sale system;
•In-store mobility;
•E-commerce platform;
•Consumer mobile app;
•Replenishment and allocation systems;
•Merchandising presentation and inventory management tools;
•Warehouse and transportation management systems;
•Labor management tools for stores and supply chain;
•Price optimization system;
•Vendor purchase order control system;
•Business intelligence and analytics tools; and
•Customer loyalty and campaign management system.
These systems are integrated through an enterprise resource planning (“ERP”) system. This ERP system tracks merchandise from initial order through ultimate sale and interfaces with our financial systems.
We continue to invest in technology to support store, online, and distribution facility expansion and our long-term strategic growth initiatives focused heavily on improving the customer experience across all channels. We also continue to evaluate and improve the functionality of our systems to maximize their effectiveness. Such efforts include ongoing hardware and software evaluations, refreshes, and upgrades to support optimal software configurations, and application performance. We plan to continue to invest in information technology and implement efficiency-driving system enhancements such as in-store mobility, labor management tools, and back-office support systems. We will continue to evaluate the use of technologies to improve productivity such as artificial intelligence, automation software, quantum computing, and other technologies. We also maintain and continue to strengthen the security of our information systems to help protect and prevent unauthorized access to personal information of our customers, employees, vendors, and other confidential Company data. We are endeavoring to adhere to quickly evolving industry privacy laws and standards. Critical areas of focus include cloud, end point protection and privacy. Collectively, these efforts are directed toward improving business processes, maintaining secure, efficient, and stable systems, and enabling the continued growth and success of our business.
Petsense
Petsense is a small-box pet specialty supply retailer focused on meeting the needs of pet owners, primarily in small and mid-sized communities, and offering a variety of pet products and services. At December 25, 2021, we operated a total of 178 Petsense stores in 23 states, with approximately 500 full-time and 1,000 part-time team members, and an e-commerce website (Petsense.com). The Petsense name is registered with the USPTO.
Human Capital
We believe that our team members are the foundation of our business and that their hard work, passion, commitment, and experience drive our success. As a result of our commitment to our team members, in both 2021 and 2020, we were recognized by the Great Place to Work Institute as a "Great Place to Work-Certified" company and were included in Forbes’ 2021 "America’s Best Employers for New Graduates" list for the second year in a row. Below are further descriptions of our Company and our focus on the development and support of our team members:
Management and Team Members
As of December 30, 2017,25, 2021, we employed approximately 14,000approximately 22,000 full-time and 14,00024,000 part-time Tractor Supply team members. We alsotypically employ additional part-time team members throughout the year during peakhigh sales volume periods. We are not party to any collective bargaining agreements.
At the end of fiscal 2017, ourOur store operations wereare divided between east and west divisions, and each division is overseen by a senior vice president. The divisions are organized into ten regions. Each regionregions, each of which is led by a regional vice president, and thepresident. The region is further organized into districts, each of which is led by a district manager. We have two internal advisory boards, one comprised of store managers and the other comprised of district managers. These groups bring a grassroots perspective to operational initiatives and generate chain-wide endorsement of proposed best-practice solutions.
All of ourEligible team members can participate in one of our various bonus incentive programs, which provide the opportunity to receive additional compensation based upon individual, team, and/or Company performance. In addition to bonus incentive programs, we provide our eligible team members the opportunity to participate in an employee stock purchase plan and a 401(k) retirement savings plan. We alsoplan and health insurance for which we share ina significant portion of the cost of health insurance provided topremiums. We additionally provide our eligible team members with paid time off and a six-week parental leave policy for new parents. Our team members also receive a discount on merchandise purchased from the Company.
We continue to make wage investments to offer our team members competitive compensation. On an annualized basis in 2021, we invested an additional $40 million in hourly store team members as a result of our increases in the minimum wage paid to team members.
We encourage a promote-from-within environment when internal resources permit. We also provide internal leadership development programs designed to prepare our high-potential team members for greater responsibility. Our current team of
district managers and store managers havehas an average tenure of approximately nine and six years,years, respectively. We believe internal
promotions, coupled with the hiring of individuals with previous retail experience, will provide the management structure necessary to support our planned growth.long-term strategic growth initiatives.
Continuous ImprovementStore Personnel and Training
We seek to hire store team members who live and appreciate the "Out Here" lifestyle, including those with farming and ranching backgrounds, with particular emphasis on general maintenance, equine, and welding. We endeavor to staff our stores with courteous, highly motivated team members and devote considerable resources to training store team members, often in cooperation with our vendors. Our training programs include:
•A thorough on-boarding process to prepare new team members for their new role;
•Productive workplace environment training that is intended to educate team members on Company policies and procedures covering topics such as harassment, discrimination, and retaliation;
•Diversity and inclusion training which is intended to advance a diverse and inclusive culture built on one of our core values of respect, to foster different perspectives, ideas and innovative thinking;
•New store opening training that prepares our store managers to open new stores to Company standards;
•A management training program which covers all aspects of our store operations, delivering superior service, and managing the team member experience;
•Structured training on customer service and selling skills;
•Online product knowledge training produced in conjunction with key vendors;
•Leadership development programs that prepare leaders to expand their current contributions;
•Quarterly all store team member meetings; and
•An annual store manager meeting with vendor product presentations.
Workplace Health and Safety
We strive to provide a safe and healthy workplace for all team members and drive a culture of safe practices and continuous improvement. We provide role based safety training during the onboarding process and through other specific safety programs. In response to the COVID-19 pandemic, we implemented enhanced cleaning standards, adapted to the evolving public health guidance in our workplaces, and provided training and education to our team members. We implemented a vaccination incentive program, provided paid time off to receive vaccinations, and held onsite vaccination clinics for our team members among other COVID-19 mitigation practices. We continually monitor and adapt our safety practices as the COVID-19 pandemic continues.
COVID-19 Response
The Company has been and continues to closely monitor the impact of the COVID-19 pandemic on all facets of our business. This includes the impact on our team members, customers, suppliers, vendors, business partners, and supply chain networks.
The health and safety of our team members and customers are the primary concerns of our management team. We have taken and continue to take numerous actions to promote health and safety, including, encouraging vaccination efforts, providing personal protective equipment to our team members, following local and federal guidance regarding the use of masks in our facilities, maintaining enhanced services for cleaning and sanitation, continuing to provide additional functionality to support contactless shopping experiences, promoting social distancing and cleaning actions in our stores, and continuing to offer remote work plans at our Store Support Center.
Additionally, we continue to support our team members during this pandemic through offering COVID-19 paid medical leave, 100% coverage of COVID-19 testing and treatment under our medical plan.
Diversity, Equity, and Inclusion ("DE&I")
Tractor Supply is committed to DE&I. We have built a strong and diverse team by purposefully seeking highly qualified diverse candidates with different backgrounds, experience, perspectives, ideas and skill sets. As we move forward, we are working to implement new DE&I initiatives that will result in an even more diverse team across the entire company.
We are committed to providing a continuous improvement programdiverse and inclusive culture supported by our Mission & Values where we welcome diverse backgrounds and experiences and respectfully foster different perspectives, ideas and innovative thinking. We are stronger together, and we believe in the authenticity our team members bring to drive change throughoutwork every day. By focusing on our organization. Using data analyticsteam members, we know that our customers, communities and suppliers will be well served. Diversity and inclusion play a key role in moving our business forward. Our workforce is approximately 51% male and 49% female. Minorities comprise approximately 17% of our workforce. Women serve in key leadership roles within the Company, including as Executive Vice President, Chief Human Resources Officer, Senior Vice President, General Counsel and Corporate Secretary, Senior Vice President of Investor Relations and Public Relations, Senior Vice President, Chief Marketing Officer and Senior Vice President of E-Commerce. We have taken several steps over the past twelve months to further enhance our diversity and inclusion strategy including publishing external DE&I goals aligned with our environmental, social, and governance ("ESG") efforts, enhancing our DE&I Strategy to include supplier diversity efforts, establishing our DE&I Customer Promise and continuing activation of our numerous team member engagement we examine business processesgroups supporting the development, community involvement and identify opportunities to reduce costs, drive innovation, and improve effectiveness.allyship within our Company. We have implemented numerous continuous improvement projects (with team members from multiple areas of our business) to evaluate key operations and implement process changes. Team members are empowered and expected to challenge current paradigms and improve processes. Our management encourages the participation of all team members in decision-making, regularly solicits input and suggestions from our team members and incorporates suggestions into our improvement activities.
Management Information and Control Systems
We have invested resources in management information and control systems to provide legendary customer service. This includes use of digital technologies to integrate the customer experience in store, online, and through our customer solutions center, offering customers the ability to shop anytime, anywhere, and in any way they choose. Our key platforms include a point-of-sale system, in-store mobility and digital technology system, an e-commerce platform, a supply chain management and replenishment system, a transportation management system, warehouse and labor management tools, a price optimization system, a vendor purchase order control system, a merchandise presentation system, and a customer loyalty system. These systems are integrated through an enterprise resource planning (“ERP”) system. This ERP system tracks merchandise from initial order through ultimate sale and interfaces with our financial systems.
Wewill continue to invest in technologybuild on these initiatives to support store, online,enhance our culture of respect and distribution facility expansion. We also continue to evaluate and improve the functionality ofteamwork across our systems to maximize their effectiveness. Such efforts include ongoing hardware and software evaluations, refreshes and upgrades to support optimal software configurations and application performance. We plan to continue to invest in information technology and implement efficiency-driving system enhancements, as well as evaluate use of technologies to improve productivity such as artificial intelligence, automation software, and other technologies. We also maintain and continue to strengthen the security of our information systems to help protect and prevent unauthorized access to personal information of our customers, employees and vendors or other confidential Company data. Collectively, these efforts are directed toward improving business processes, maintaining secure, efficient and stable systems, and enabling the continued growth and success of our business.organization.
Petsense
Petsense is a small-box pet specialty supply retailer focused on meeting the needs of pet owners, primarily in small and mid-sized communities, and offering a variety of pet products and services. At December 30, 2017, we operated a total of 168 Petsense stores in 26 states, with 400 full-time and 900 part-time team members, and an e-commerce website (Petsense.com). The Petsense name is registered with the USPTO.
Growth Strategy
Tractor Supply believes we can grow our business by being an integral part of our customers’ lives as the most dependable supplier of relevant products and services for the “"Out Here”Here" lifestyle solutions, creating customer loyalty through personalized experiences, our Neighbor's Club loyalty program and providing convenience that our customers expect at anytime, anywhere, and in any way they choose. Our long-term growth strategy is to: (1) drive profitable growth through new store openingsexpand and deepen our customer base by expanding omni-channel capabilities, thus tying together our website productproviding personal, localized, and memorable customer engagements by leveraging content, social media, and digital and online shopping experience,experiences, attracting new customers and driving loyalty, (2) build customer-centric engagementevolve customer experiences by leveraging analytics to deliver legendary customer service, seasoned advicedigitizing our business processes and personalized experiences,furthering our omni-channel capabilities, (3) offer relevant assortments and services across all channels through exclusive and national brands and continue to introducegrow our total addressable market by introducing new products and services through our test and learn strategy, (4) enhance our coredrive operational excellence and foundationalproductivity through continuous improvement, increasing space utilization, and implementing advanced supply chain capabilities by investing in infrastructure and process improvements which willto support growth, scale and agility, while improving the customer experience, and (5) expand through selective acquisitions, as such opportunities arise, to add complementary businesses and to enhance penetration into new and existing markets to supplement organic growth.
Achieving this strategy will require a foundational focus on: (1) organizing, optimizingconnecting, empowering and empoweringgrowing our team members for growth by developing skills, talentto enhance our team members' lives and leadership across the organization,communities in which they live, enabling them to provide legendary service to our customers, and (2) implementing operational efficiency initiativesallocating resources in a disciplined and efficient manner to drive profitable growth and build stockholder value, including leveraging technology and automation to align our cost structure to support new business capabilities for margin improvement and cost reductions.
Over the past five years, we have experienced considerable sales growth, resulting in a compounded annual growth rate of approximately 9.2%13.4%. We plan to open approximately 75 to 80 new Tractor Supply and 2010 new Petsense stores in fiscal 2018,2022, a selling square footage increase of approximately 5.0%4%. In fiscal 2017,2021, we opened 10180 new Tractor Supply stores and 25seven new Petsense
stores. In fiscal 2016,2020, we opened 11380 new Tractor Supply stores and began operating 143nine new Petsense stores. This represents a selling square footage increase of approximately 6.3%4% during each of fiscal 20172021 and 10.8% during fiscal 2016.2020.
At December 30, 2017,25, 2021, we operated 1,8532,181 retail stores in 49 states (1,685(2,003 Tractor Supply and Del’s retail stores and 168178 Petsense retail stores). Given the size of the communities that we target, we believe that there is ample opportunity for new store growth in many existing and new markets. We believe we have developed a proven method for selecting store sites and we believe we have identified approximately 800significant additional marketsopportunities for new Tractor Supply stores. We also believe that there is opportunity for up to 1,000continued growth for Petsense stores.
Approximately 40%57% of our Tractor Supply stores are in freestanding buildings and 60%43% are located in strip shopping centers. We lease approximately 93%95% of our stores and own the remaining 7%5%.
In addition to new store expansion, we will continue to support our strategic growth through expansion of our distribution network and initiatives including, among others, space productivity and side lot improvements in certain existing stores as well as continued improvements in technology and infrastructure at our existing stores, and ongoing investments to enhance our digital and omni-channel capabilities to better serve our customers.
Competition
We operate in a competitive retail industry. TheWe believe the principal competitive factors include location of stores, fulfillment options, price, quality of merchandise, in-stock inventory consistency, merchandise assortment and presentation, product knowledge, and customer service. We compete with general merchandise retailers, home center retailers, pet retailers, specialty and discount retailers, independently owned retail farm and ranch stores, numerous privately-held regional farm store chains and farm cooperatives, as well as internet-based retailers. However, we believe we successfully differentiate ourselves from many of these retailers by focusing on our specialized market niche for customers living the rural lifestyle. See further discussion of competition in 1A,1A. “Risk Factors” of this Annual Report on Form 10-K.
Seasonality and Weather
Our business is seasonal. Historically, our sales and profits are the highest in the second and fourth fiscal quarters due to the sale of seasonal products. We usually experience our highest inventory and accounts payable balances during our first fiscal quarter for purchases of seasonal products to support the higher sales volume of the spring selling season, and again during our third fiscal quarter to support the higher sales volume of the cold-weather selling season. We believe that our business can be more accurately assessed by focusing on the performance of the halves, not the quarters, due to the fact that different weather patterns from year-to-year can shift the timing of sales and profits between quarters, particularly between the first and second fiscal quarters and the third and fourth fiscal quarters.
Historically, weather conditions, including unseasonably warm weather in the fall and winter months and unseasonably cool weather in the spring and summer months, have unfavorably affected the timing and volume of our sales and results of operations. In addition, extreme weather conditions, including snow and ice storms, flood and wind damage, hurricanes, tornadoes, extreme rain, and droughts have impacted operating results both negatively and positively, depending on the severity and length of these conditions. Our strategy is to manage product flow and adjust merchandise assortments and depth of inventory to capitalize on seasonal demand trends.
Stewardship and Compliance with Environmental Matters
Our operations are subject to numerous federal, state, and local laws and regulations, enacted or adopted, regulating the discharge of materials into the environment or otherwise relating to the protection of the environment. We are committed to complying with all applicable environmental laws and regulations. We are also committed to becoming a more environmentally sustainable company. This commitment is demonstrated through our Stewardship Program, which is our environmental sustainability program. Through this program, the Company has implemented a number of initiatives designed to reduce our impact on the environment. These initiatives include the installation of energy management systems, LED lighting, high efficiency heating/air conditioning systems, in our stores, and recycling programs in our stores, distribution facilities, and the Store Support Center. Our Store Support Center opened in 2014, and our distribution centercenters in Casa Grande, Arizona, opened in 2015, were each awardedand Frankfort, New York, are LEED (Leadership in Energy and Environmental Design) Silver certificationcertified for environmentally sustainable design, construction, and operation. We also installed solar arrays at the Store Support Center in Brentwood, Tennessee, and our Tractor Supply store in Hendersonville, Tennessee.
Executive OfficersThe Company has been a SmartWay Transport partner since 2013. SmartWay Transport is a public-private initiative between the U.S. Environmental Protection Agency, large and small trucking companies, retailers, and other federal and state agencies. Its purpose is to improve fuel efficiency and the environmental performance (reduction of both greenhouse gas emissions and air pollution) of supply chains.
In December 2018, we announced a goal to reduce carbon emissions from our facilities by 25% by 2025 from our 2015 baseline as part of the RegistrantCompany's Stewardship Program. In December 2020, we announced that we had reached this goal five years early.
In December 2021, we released our 2020 Task Force on Climate-Related Financial Disclosures Report, following the announcement of our goal in September 2021 to reduce our carbon footprint by 50% by 2030 and achieve net zero missions across all operations by 2040. In the report, we discussed our approach to evaluating and managing climate change risks and identifying opportunities. We also detailed the next phase of our sustainability journey, including increasing efforts to procure renewable energy, continuing investments in energy efficiency and cleaner technologies, avoiding future emissions through better design of both stores and distribution centers, and enhancing our Scope 3 focus with greater transparency and reduction efforts, including new vendor engagement to drive down value chain emissions.
Additional information can be found in our ESG Tear Sheet and on our website (TractorSupply.com). The information provided on our website is not part of this report, and is therefore not incorporated by reference unless such information is otherwise specifically referenced elsewhere in this report.
Information about our Executive Officers
Pursuant to General Instruction G(3) of Form 10-K, the following list is included in Part I of this Report in lieu of being included in the Proxy Statement for the Annual Meeting of Stockholders to be held on May 10, 2018.11, 2022.
The following is a list of the names and ages of all executive officers of the registrant, indicating all positions and offices with the registrant held by each such person and each person’s principal occupations and employment during at least the past five years:
|
| | | | | | | |
| Name | Position | Age |
GregoryHarry A. SandfortLawton, III | President and Chief Executive Officer | 6247 |
Steve K. BarbarickKurt D. Barton | Executive Vice President – Chief Financial Officer and Treasurer | 50 |
| Robert D. Mills | Executive Vice President – Chief Technology, Digital Commerce and Strategy Officer | 49 |
| John P. Ordus | Executive Vice President – Chief Stores Officer | 46 |
| Jonathan S. Estep | Executive Vice President – Chief Merchandising Officer | 5042 |
Benjamin F. Parrish, Jr.Melissa D. Kersey | Executive Vice President – Chief Human Resources Officer | 47 |
| Colin W. Yankee | Executive Vice President – Chief Supply Chain Officer | 44 |
| Noni L. Ellison | Senior Vice President – General Counsel and Corporate Secretary | 6150 |
Kurt D. BartonChristi C. Korzekwa | Senior Vice President – Chief FinancialMarketing Officer and Treasurer | 4656 |
Chad M. FrazellMatthew L. Rubin | Senior Vice President – Human Resourcesand General Manager of Petsense | 45 |
Robert D. Mills | Senior Vice President – Chief Information Officer | 4542 |
GregoryHarry A. Sandfort has served as Chief Executive Officer since December 2012. He servedLawton, III was appointed as President and Chief Executive Officer on January 13, 2020. Mr. Lawton served as President of the CompanyMacy's, Inc. from September 2017 to December 2012 to May 2016.2019. Prior to that time, heMr. Lawton served as President and Chief Operating Officer of the Company since February 2012. Mr. Sandfort previously served as President and Chief Merchandising Officer of the Company since February 2009, after having served as ExecutiveSenior Vice President, – Chief Merchandising OfficerNorth America at eBay, Inc. since May 2015. Mr. Lawton previously held a number of the Company since November 2007. Mr. Sandfort served as President and Chief Operating Officerleadership positions at Michaels Stores,Home Depot, Inc. from March 20062005 to August 2007 and as Executive2015, including Senior Vice President – General Merchandise Manager at Michaels Stores, Inc. fromof Merchandising and head of Home Depot's online business. Since January 2004 to February 2006.2019, Mr. SandfortLawton has served as a director of the Company since February 2013.
Steve K. Barbarick hasSealed Air Corporation and previously served as President and Chief Merchandising Officer since Maya director of Buffalo Wild Wings, Inc. from October 2016 prior to which he served asFebruary 2018.
Kurt D. Barton was promoted to Executive Vice President – Chief MerchandisingFinancial Officer for the Company since September 2012. Prior to that time, he served as Senior Vice President – Merchandising sinceand Treasurer in February 2011. Mr. Barbarick previously served as Vice President – Merchandising since June 2009,2019, after having served as Vice President and Divisional Merchandise Manager since 2003.
Benjamin F. Parrish, Jr. has served as Executive Vice President – General Counsel and Corporate Secretary of the Company since February 2016, after having served as Senior Vice President – General Counsel and Corporate Secretary of the Company since October 2010. Mr. Parrish previously served as Executive Vice President and General Counsel of MV Transportation, Inc. from September 2008 until he joined the Company. He served as Senior Vice President and General Counsel of Central Parking Corporation from 1998 to 2008.
Kurt D. Barton has served as Senior Vice President – Chief Financial Officer and Treasurer since March 2017, after having2017. Prior to that time, Mr. Barton served as Senior Vice President – Controller of the Company since February 2016. Mr. Barton previously served as Vice President -– Controller of the Company from February 2009, after having previously served as the Company's Director, Internal Audit from July 2002 to February 2009. Mr. Barton has served in various other leadership roles in accounting since he joined the Company in 1999. Mr. Barton, a Certified Public Accountant, began his career in public accounting in 1993, spending six years at Ernst & Young, LLP.
Chad M. Frazell has served as Senior Vice President - Human Resources since August 2014. Mr. Frazell previously served as Senior Vice President, Human Resources for Shopko Stores Operating Co., LLC from April 2011 until he joined the Company. From 2008 to 2011, Mr. Frazell served as Vice President, Human Resources for Kohl’s Corporation, where he began as a store manager in 1999. Prior to 1999, Mr. Frazell served as a store manager and assistant manager for Target Corporation. He began his career with Wal-Mart Stores, Inc., where he served as an assistant manager and sales associate.
Robert D. Mills has served as Executive Vice President – Chief Technology, Digital Commerce and Strategy Officer since August 2018, prior to which he served as the Company's Senior Vice President -– Chief Information Officer since February 2014. Mr. Mills previously served as Chief Information Officer for Ulta Beauty, Inc. from October 2011 until he joined the Company. From 2005 to 2011, Mr. Mills was Vice President, Chief Information Officer for the online business unit at Sears Holdings Corporation where he began as an Information Technology Customer Relationship Leader in 2001. Prior to 2001, Mr. Mills held roles at The Allstate Insurance,Corporation, Rockwell International, Telecommunications Division, and Household Finance Corporation. Since March 2018, Mr. Mills has served as a director of B&G Foods, Inc.
John P. Ordus was promoted to Executive Vice President – Chief Stores Officer in February 2020, after having served as the Company's Senior Vice President - Store Operations since August 2015. Prior to that time, Mr. Ordus served as Regional Vice President for the Company from June 2010 and as a Regional Director for the Company since September 2008. Mr. Ordus joined the Company as a District Manager in February 2002 after the acquisition of Quality Farm & Fleet, Inc. with which Mr. Ordus held roles since January 1988.
Jonathan S. Estep was promoted to Executive Vice President – Chief Merchandising Officer in February 2020, after having served as the Company's Senior Vice President, General Merchandising since April 2017. Prior to that time, Mr. Estep served the Company as a Vice President, Divisional Merchandise Manager from February 2014. Mr. Estep also previously served in various other leadership roles in merchandising since he re-joined the Company in January 2008.
Melissa D. Kersey was appointed as Executive Vice President – Chief Human Resources Officer on July 20, 2020. Ms. Kersey was previously Senior Vice President and Chief People Officer for McDonald's USA, LLC from 2017 until July 2020. Ms. Kersey also previously held a number of executive level roles with Walmart Inc. (previously Wal-Mart Stores, Inc.) from 2008 to 2017, including Senior Vice President of Global Human Resource Transformation and People Services, Senior Vice President and Chief Human Resources Officer for U.S. Stores, and Senior Vice President of Learning and Human Resources Strategy. Prior to that time, Ms. Kersey spent eight years with Alltel Wireless and four years with the Target Corporation in Operations, Distribution, Human Resources and Technology roles.
Colin W. Yankee was promoted to Executive Vice President - Chief Supply Chain Officer in February 2020, after having served as the Company's Senior Vice President, Supply Chain since November 2015 when he joined the Company. Mr. Yankee was previously Vice President of Logistics for Neiman Marcus Group LLC from 2013 to 2015. Prior to that time, Mr. Yankee held various leadership roles in logistics and supply chain with the Target Corporation since 2004. He began his career as a Cavalry Officer, Captain in the United States Army.
Noni L. Ellison was appointed as Senior Vice President – General Counsel and Corporate Secretary on January 11, 2021. Ms. Ellison was previously General Counsel, Chief Compliance Officer and Corporate Secretary for Carestream Dental LLC from August 2017 until January 2021. Ms. Ellison also previously served as Associate General Counsel and Assistant Corporate Secretary at W.W. Grainger, Inc. from February 2015 until July 2017. Prior to that time, Ms. Ellison held roles of increasing responsibility at Turner Broadcasting System, Inc. and Scripps Networks Interactive, Inc. and practiced law with two national law firms as a corporate finance and securities associate.
Christi C. Korzekwa was promoted to Senior Vice President - Chief Marketing Officer in February 2022, after having served as Senior Vice President – Marketing since February 2015. Ms. Korzekwa previously served as Vice President, Marketing since she joined the Company in February 2012. Prior to joining the Company, Ms. Korzekwa served as Senior Vice President, Director of Client Services for Blue Sky Agency. She worked for Home Depot, Inc. from 2004 to 2011 in roles of increasing importance in marketing and advertising, most recently as Senior Director, Marketing. Before joining Home Depot, Inc., Ms. Korzekwa spent 17 years with TM Advertising, LLC, most recently serving as their Senior Vice President, Global Media Director.
Matthew L. Rubin was appointed Senior Vice President and General Manager of Petsense on February 1, 2021. Mr. Rubin previously served as Senior Vice President of Business Development & Growth at The Michaels Stores, Inc. from October 2018 until January 2021. Mr. Rubin was previously an executive in Accenture plc's North America Retail Practice from April 2015 to October 2018. Before April 2015, Mr. Rubin was a Partner at Consolidated Venture Partners & Consolidated Marketing and a Co-Founder & Finance Partner at OnTrend Products. Mr. Rubin also previously served as Vice President of Specialty Business Operations at BJ’s Wholesale Club Holding, Inc.. Mr. Rubin began his career at Office Depot, Inc. where he had multiple merchandising and strategic project leadership roles of increasing responsibility.
Additional Information
We file reports with the Securities and Exchange Commission (“SEC”), including Annual Reports on Form 10-K, quarterly reports on Form 10-Q, current reports on Form 8-K and other reports as required. The public may read and copy any materials the Company files with the SEC at the SEC’s Public Reference Room at 100 F Street, NE, Washington, DC 20549. The public may obtain information on the operation of the Public Reference Room by calling the SEC at 1-800-SEC-0330. We are an electronic filer and the SEC maintains an Internet sitewebsite at sec.gov that contains the reports, proxy and information statements, and other information filed electronically.we file.
We make available, free of charge through our Internet website, TractorSupply.com, our Annual Report on Form 10-K, quarterly reports on Form 10-Q, current reports on Form 8-K, and all amendments to those reports as soon as reasonably practicable after such material is electronically filed with or furnished to the SEC. The information provided on our website is not part of this report, and is therefore not incorporated by reference unless such information is otherwise specifically referenced elsewhere in this report.
Item 1A. Risk Factors
Our business faces many risks. ThoseCertain risks of which we are currently aware and deem to be material are described below. If any of the events or circumstances described in the following risk factors occur, our business, financial condition or results of operations may significantly suffer, and the trading price of our common stock could decline. These risk factors should be read in conjunction with the other information in this Form 10-K.
General economic conditions may adversely affect our financial performance.Strategic and Competitive Risks
Our results of operations may be sensitive to changes in overall economic conditions that impact consumer spending, including discretionary spending. A weakening of economic conditions affecting disposable consumer income such as lower employment levels, uncertainty or changes in business or political conditions, higher interest rates, higher tax rates, higher fuel and energy costs, higher labor and healthcare costs, the impact of natural disasters or acts of terrorism, and other matters could reduce consumer spending or cause consumers to shift their spending to competitors. A general reduction in the level of discretionary spending, shifts in consumer discretionary spending to our competitors or shifts in discretionary spending to less profitable products sold by us could result in lower net sales, slower inventory turnover, greater markdowns on inventory, and a reduction in profitability due to lower margins.
Failure to protect our reputation could have a material adverse effect on our brand name.name or any of our exclusive brands.
Our success depends in part on the value and strength of the Tractor Supply name.name, including our exclusive brands. The Tractor Supply name is integral to our business, as well as to the implementation of our strategies for expanding our business. Maintaining, promoting, and positioning our brand will depend largely on the success of our marketing and merchandising efforts and our ability to provide high quality merchandise and a consistent, high quality customer experience. Our brand could be adversely affected if we fail to achieve these objectives or if our public image or reputation were to be tarnished by negative publicity. Failurepublicity, whether or not based on fact. Any failure to comply or accusation of our failure to comply with ethical, social, product, labor, data privacy, and environmental standards could also jeopardize our reputation and potentially lead to various adverse consumer actions. Customers are also increasingly using social media to provide feedback and information about our Company, including our products and services, in a manner that can be quickly and broadly disseminated. Further, adverse publicity about our merchandise products, whether valid or not, may discourage consumers from buying the products we offer. Additionally, our proprietary rights in our trademarks, trade names, service marks, domain names, copyrights, patents, trade secrets and other intellectual property rights are valuable assets of our business. We may not be able to prevent or even discover every instance of unauthorized third party uses of our intellectual property or dilution of our brand names, such as when a third party uses trademarks that are identical or similar to our own. Any of these events could result in decreased revenue or otherwise adversely affect our business.
We may be unable to increase sales at our existing stores.
We experience fluctuations in our comparable store sales at our existing stores, defined as sales in stores which have been open for at least twelve months. See Item 7. "Management's Discussion and Analysis of Financial Condition and Results of Operations" for a further discussion of comparable store sales. Various factors affect the comparable store sales at our existing stores, including, among others, the general retail sales environment, our ability to efficiently source and distribute products, global supply chain disruptions, changes in our merchandise assortment, competition, proximity of our locations to one another or to the locations of other competing retailers, increased presence of online retailers, current economic conditions, customer satisfaction with our products, retail pricing, the timing of promotional events, the release of new merchandise, the success of marketing programs, weather conditions, and weather conditions.our ability to attract and retain qualified team members. These factors may cause ourthe comparable store sales results at our existing stores to differ materially from prior periods and from expectations. Past comparable store sales are not an indication of future results, and there can be no assurance that our comparable store sales will not decrease in the future.
Purchase price volatility, including inflationary and deflationary pressures, may adversely affect our financial performance.
Although we cannot determineFurthermore, the full effectsignificant positive impact of inflation and deflationthe COVID-19 pandemic on our operations, we believe our sales and results of operations are affected by both. We are subject to market risk with respect to the pricing of certain products and services, which include, among other items, grain, corn, steel, petroleum, cotton and other commodities as well as diesel fuel and transportation services. Therefore, we may experience both inflationary and deflationary pressure on product cost, which may impact consumer demand and, as a result, sales and gross margin. Our strategy is to reduce or mitigate the effects of purchase price volatility principally by taking advantage of vendor incentive programs, economies of scale from increased volume of purchases, adjusting retail prices and selectively buying from the most competitive vendors while maintaining product quality. Should our strategy to mitigate purchase price volatility not be effective, our financial performance could be adversely impacted.
Weather conditions may have a significant impact on our financial results.
Weather conditions affect the demand for our products in fiscal 2021 and 2020 resulted in a significant increase in new or reacquired customers and in some cases the supply of, products, whichcomparable store sales growth. Our sales performance in turn has an impact on prices. Historically, weather conditions, including unseasonably warm weather in the fallfiscal 2021 and winter months and unseasonably cool weather in the spring and summer months, have affected the timing and volume of our sales and results of operations. In addition, extreme weather conditions, including snow and ice storms, flood and wind damage, hurricanes, tornadoes, extreme rain and
droughts, have impacted operating results. While extreme weather conditions can positively impact our operating results by increasing demand in affected locations for products needed2020 may present a greater risk to cope with the weather condition and its effects, they can also negatively affect our business depending on the severity and length of these conditions as a result of store closings or the inability of customers to shop at our stores due to weather conditions. Our strategy is to manage product flow and adjust merchandise assortments and depth of inventory to capitalize on seasonal demand trends. Should such a strategy not be effective, the weather may have a material adverse effect on our financial condition and results of operations.
Our merchandising and marketing initiatives may not provide expected results.
We believe our past performance has been based on, and future success will depend upon, in part, the ability to develop and execute merchandising initiatives with effective marketing programs. These merchandising initiatives and marketing programs may not deliver expected results, and there is no assurance that we will correctly identify and respond in a timely manner to evolving trends and consumer preferences and expectations. If we misjudge the market or our marketing programs are not successful, we may overstock unpopular products and be forced to take inventory price reductions that have a material adverse effect on our profitability. Failure to execute and promote such initiatives in a timely manner could harm our ability to grow the business and could have a material adverse effect on our results of operations and financial condition. Shortages of key merchandise could also have a material adverse impact on operating results and financial condition.
Capital required for growth may not be available.
The construction or acquisition of new stores,increase comparable store support center facilities, distribution facilities or other facilities, the remodeling and renovation of existing facilities and investments in information technology require significant amounts of capital. In the past, our growth has been funded through internally generated cash flow and bank borrowings. Disruptionssales in the capitalfollowing year(s) and credit markets could adversely affect thein our ability of the banks to meet their commitments. Our access to funds undermaintain our debt facilities is dependent on the ability of the banks that are parties to the facility to meet their funding commitments. Those banksnew or reacquired customers gained in those years. Therefore, we may not be able to meet their funding commitments to us if they experience shortages of capitalsustain or increase our comparable store sales in fiscal 2022 and liquidity or if they experience excessive volumes of borrowing requests within a short period of time. In addition, tight lending practices may make it difficult for our real estate developers to obtain financing under acceptable loan terms and conditions. Unfavorable lending practices could impact the timing of our store openings and materially adversely affect our ability to open new stores in desirable locations.beyond.
Longer term disruptions in the capital and credit markets as a result of uncertainty, changing or increased regulation, reduced funding alternatives, or failures of significant financial institutions could adversely affect our access to liquidity needed for our business. Any disruption could require us to take measures to conserve cash until the markets stabilize or until alternative credit arrangements or other funding for our business needs can be arranged. Such measures could include deferring capital expenditures and reducing or eliminating future share repurchases, cash dividends or other discretionary uses of cash.
Failure to open and manage new stores in the number and manner currently contemplated could adversely affect our financial performance.
An integral part of our business strategy includes the expansion of our store base through new store openings. This expansion strategy is dependent on our ability to find suitable locations, and we face competition from many retailers and other businesses for such sites. If we are unable to implement this strategy, our ability to increase our sales, profitability, and cash flow could be impaired significantly. To the extent that we are unable to open new stores in the manner we anticipate (due to, among other reasons, site approval or unforeseen delays in construction), our sales growth may be impeded.
Although we have a rigorous real estate site selection and approval process, there can be no assurance that our new store openings will be successful or result in incremental sales and profitability for the Company. New stores build their sales volumes and refine their merchandise selection over time and, as a result, generally have lower gross margins and higher
operating expenses as a percentage of net sales than our more mature stores. As we continue to open new stores, there may be a negative impact on our results from a lower contribution margin of these new stores until their sales levels ramp to chain average, if at all, as well as from the impact of related pre-opening costs. Additionally, new stores can also impact the sales and contribution margins of existing stores located in close proximity.
As we execute this expansion strategy, we may also experience managerial or operational challenges which may prevent any expected increase in sales, profitability, or cash flow. Our ability to manage our planned expansion depends on the adequacy of our existing information systems, the efficiency and expansion of our distribution systems, the adequacy of the hiring and training process for new personnel (especially store managers), the effectiveness of our controls and procedures, and the ability to identify customer demand and build market awareness in different geographic areas. There can be no assurance that we will be able to achieve our planned expansion, that the new stores will be effectively integrated into our existing operations or that such stores will be profitable.
Although we have a rigorous real estate site selectionOur merchandising and approval process,marketing initiatives may not provide expected results.
We believe our past performance has been based on, and future success will depend, in part, upon the ability to develop and execute merchandising initiatives with effective marketing programs. These merchandising initiatives and marketing programs may not deliver expected results, and there can beis no assurance that we will correctly identify and respond in a timely manner to evolving trends and consumer preferences and expectations. If we misjudge the market or our new store openings willmarketing programs are not successful, we may overstock unpopular products and be successfulforced to take inventory impairment or resultretail price reductions that have a material adverse effect on our profitability. Failure to execute and promote such initiatives in incremental salesa timely manner could harm our ability to grow the business and profitability for the Company. New stores build their sales volumes and refine their merchandise selection over time and, ascould have a result, generally have lower gross margins and higher operating expenses as a percentage of net sales than our more mature stores. As we continue to open new stores, there may be a negative impactmaterial adverse effect on our results fromof operations and financial condition. Shortages of key merchandise could also have a lower contribution marginmaterial adverse effect on our financial condition and results of these newoperations.
Competition may hinder our ability to execute our business strategy and adversely affect our operations.
We operate in the highly competitive retail merchandise sector with numerous competitors. These competitors include general merchandise retailers, home center retailers, pet retailers, specialty and discount retailers, independently-owned retail farm and ranch stores, until their sales levels ramp to chain average, if at all,numerous privately-held regional farm store chains, and farm cooperatives, as well as frominternet-based retailers. We compete for customers, merchandise, real estate locations, and employees. This competitive environment subjects us to various other risks, including the impact of related pre-opening costs.
inability to continue our store and sales growth and to provide attractive merchandise to our customers at competitive prices that allow us to maintain our profitability. Our failure to attract and retain qualified team members, increasescompete effectively in wage and labor costs and changes in laws and other labor issuesthis environment could adversely affectimpact our financial performance.
Our ability to continue expanding operations depends on our ability to attract and retain a large and growing number of qualified team members. Our ability to meet labor needs while controlling wage and related labor costs is subject to numerous external factors, including the availability of a sufficient number of qualified persons in the work force, unemployment levels, prevailing wage rates, changing demographics, health and other insurance costs, changes in employment legislation and the potential for changes in local labor practices or union activities. If we are unable to locate, attract or retain qualified personnel, or if costs of labor or related costs increase significantly, our financial performance could be adversely affected.
We are subject to federal, state, and local laws governing employment practices and working conditions. These laws cover wage and hour practices, labor relations, paid and family leave, workplace safety and immigration, among others. The laws and regulations being passed at the state and local level create unique challenges for a multi-state employer. We must continue to monitor and adapt our employment practices to comply with these various laws and regulations. If our costs of labor or related costs increase significantly as new or revised labor laws, rules or regulations or healthcare laws are adopted or implemented, our financial performance could be adversely affected.
We may pursue strategic acquisitions and the failure of an acquisition to produce the anticipated results or the inability to fully integrate the acquired companies could have an adverse impact on our business.
We may, from time to time, acquire businesses we believe to be complementary to our business.business, for example, the pending acquisition of Orscheln Farm and Home, LLC discussed previously. The success of an acquisition is based on our ability to make accurate assumptions regarding the valuation, operations, growth potential, integration, and other factors relating to the target business. Acquisitions may result in difficulties in assimilating acquired companies and may result in the diversion of our capital and our management’s attention from other business issues and opportunities. We may not be able to successfully integrate an organization that we acquire, including their personnel, financial systems, distribution, operations, and general operating procedures. If we fail to successfully integrate acquisitions, we could experience increased costs associated with operating inefficiencies which could have an adverse effect on our financial results. Also, while we employ several different methodologies to assess potential business opportunities, the newacquired businesses may not meetachieve desired profitability objectives or other expectations, causing lower than expected earnings and cash flows which could adversely affect our expectationsfinancial performance and therefore,subsequently require impairment of long-lived assets, goodwill and other intangible assets.
Weather and Climate Risks
Unseasonal and extreme weather may have a significant impact on our financial results.
Weather conditions affect the demand for, and in some cases the supply of, products, which in turn has an impact on prices. Historically, weather conditions, including unseasonably warm weather in the fall and winter months and unseasonably cool weather in the spring and summer months, have affected the timing and volume of our sales and results of operations. In addition, extreme weather conditions, such as more frequent or intense hurricanes, thunderstorms, tornadoes, flood, fires,
droughts, and snow or ice storms, as well as rising sea levels, have impacted operating results both positively and negatively and may positively or negatively impact our business in the future. While extreme weather conditions can positively impact our operating results by increasing demand in affected locations for products needed to cope with the weather condition and its effects, they can also negatively affect our business depending on the severity and length of these conditions, as a result of store closings, damage to our stores or merchandise, or the inability of customers to shop at our stores due to weather conditions. Our strategy is to manage product flow and adjust merchandise assortments and depth of inventory to capitalize on seasonal demand trends. Should such a strategy not be effective, the weather may have a material adverse effect on our financial condition and results of operations.
Weather conditions may cause a disruption in our distribution and transportation network that would adversely affect our ability to conduct our operations.
We rely on our distribution and transportation network, including third-party logistics providers, to provide goods to our stores and to our customers in a timely and cost-effective manner through deliveries to our distribution facilities from vendors and then from the distribution facilities or direct ship vendors to our stores or customers by various means of transportation, including shipments by sea, air, rail, and truck. Although we believe that our operations are efficient, disruptions due to extreme weather conditions, including snow and ice storms, flood and wind damage, hurricanes, tornadoes, extreme rain, fires and droughts may result in delays in the transportation and delivery of merchandise to our distribution centers, our stores, or our customers. Significant disruptions or delays in our distribution and transportation network could adversely affect sales and the satisfaction of our customers which could have a material adverse impact on our financial condition and results of operations.
We may be adversely affected by legal, regulatory or market responses to global climate change.
Growing concern over climate change has led policy makers in the U.S. to consider the enactment of legislative and regulatory proposals that would impose mandatory requirements on greenhouse gas emissions. Such laws, if enacted, are likely to impact our business in a number of ways. For example, we use natural gas, diesel fuel, gasoline and electricity in conducting our operations. Increased government regulations to limit carbon dioxide and other greenhouse gas emissions may result in increased compliance costs and legislation or regulation affecting energy inputs, which could materially affect our profitability. Compliance with any new or more stringent laws or requirements, or stricter interpretations of existing laws, could require additional expenditures by us or our suppliers. Our inability to appropriately respond to such changes could adversely impact our business, financial condition, results of operations or cash flows.
Macroeconomic Risks
General economic conditions may adversely affect our financial performance.
CompetitionOur results of operations may hinderbe sensitive to changes in overall economic conditions that impact consumer spending, including discretionary spending. A weakening of economic conditions affecting disposable consumer income such as lower employment levels, uncertainty or changes in business or political conditions, social and political causes and movements, higher interest rates, higher tax rates, higher fuel and energy costs, higher labor and healthcare costs, the impact of natural disasters or acts of terrorism, general health epidemics, and other matters could reduce consumer spending or cause consumers to shift their spending to competitors. A general reduction in the level of discretionary spending, shifts in consumer discretionary spending to our competitors or shifts in discretionary spending to less profitable products sold by us could result in lower net sales, slower inventory turnover, greater markdowns on inventory, and a reduction in profitability due to lower margins.
Purchase price volatility, including inflationary and deflationary pressures, may adversely affect our financial performance.
Although we cannot determine the full effect of inflation and deflation on our operations, we believe our sales and results of operations are affected by both. We are subject to market risk with respect to the pricing of certain products and services, which include, among other items, grain, corn, steel, petroleum, cotton, and other commodities, as well as duties, tariffs, diesel fuel, and transportation services. Therefore, we may experience both inflationary and deflationary pressure on product cost, which may impact consumer demand and, as a result, sales and gross margin. Our strategy is to reduce or mitigate the effects of purchase price volatility principally by taking advantage of vendor incentive programs, economies of scale from increased volume of purchases, adjusting retail prices, and selectively buying from the most competitive vendors while maintaining product quality. Should our strategy to mitigate purchase price volatility not be effective, our financial performance could be adversely impacted.
Team Member Risks
Our failure to attract and retain qualified team members, increases in wage, and labor costs, and changes in laws and other labor issues could adversely affect our financial performance.
Our ability to maintain and continue expanding operations depends on our ability to executeattract and retain a large and growing number of qualified team members. Our ability to meet labor needs while controlling wage and related labor costs is subject to numerous external factors, including the availability of a sufficient number of qualified persons in the work force, unemployment levels, prevailing wage rates, increases in legally required minimum wage rates, changing demographics, health and other insurance costs, changes in employment legislation and the potential for changes in local labor practices or union activities. If we are unable to locate, attract or retain qualified personnel, or if costs of labor or related costs increase significantly, our business strategyfinancial performance could be adversely affected.
We are subject to federal, state, and local laws governing employment practices and working conditions. These laws cover wage and hour practices, labor relations, paid and family leave, workplace safety and immigration, among others. The laws and regulations being passed at the state and local level create unique challenges for a multi-state employer. We must continue to monitor and adapt our employment practices to comply with these various laws and regulations. If our costs of labor or related costs increase significantly as new or revised labor laws, rules or regulations or healthcare laws are adopted or implemented, our financial performance could be adversely affected.
The loss of current members of our senior management team and other key team members or the failure to successfully manage an executive officer transition may adversely affect our operations.operating results.
Our success depends in large part on the continued availability and service of our executive officers, senior management, and other key team members. Competition for senior management and key team members in our industry is strong and we may not be able to retain our key team members or attract new qualified team members. We operate in the highly competitive retail merchandise sector with numerous competitors. These competitors include general merchandise retailers, home center retailers, specialtymust continue to recruit, retain, and discount retailers, independently owned retail farmmotivate management and ranch stores, numerous privately-held regional farm store chains and farm cooperatives, as well as internet-based retailers. We compete for customers, merchandise, real estate locations, and employees. This competitive environment subjects us to various other risks, including the inability to continue our store and sales growth and to provide attractive merchandise to our customers at competitive prices that allow usteam members sufficiently, both to maintain our profitability. Ourcurrent business and to execute our long-term strategic growth initiatives. The loss of any of our executive officers or other key senior management without sufficient advance notice could prevent or delay the implementation and completion of our strategic initiatives or divert management’s attention to seeking qualified replacements. Additionally, any failure by us to compete effectively in this environmentmanage a successful leadership transition of an executive officer and to timely identify a qualified permanent replacement could adversely impactharm our financial performance.business and have a material adverse effect on our results of operations.
Supply Chain and Third-Party Vendor Risks
We face risks associated with vendors from whom our products are sourced.
The products we sell are sourced from a variety of domestic and international vendors. We have agreements with our vendors in which the vendors agree to comply with applicable laws, including labor and environmental laws, and to indemnify us against certain liabilities and costs. Our ability to recover liabilities and costs under these vendor agreements is dependent upon the financial condition and integrity of the vendors. We rely on long-term relationships with our suppliers but have no significant long-term contracts with such suppliers. Our future success will depend in large measure upon our ability to maintain our existing supplier relationships or to develop new ones. This reliance exposes us to the risk of inadequate and untimely supplies of various products due to political, economic, social, health (including, but not limited to, the COVID-19 coronavirus), or environmental conditions, transportation delays, or changes in laws and regulations affecting distribution. Our vendors may be forced to reduce their production, shut down their operations or file for bankruptcy protection, which could make it difficult for us to serve the market’s needs and could have a material adverse effect on our business.
While the Company selects these third-party vendors carefully, it does not control their actions.actions or the components or manufacture of their products. Any problems caused by these third parties,third-parties, or issues associated with their products or workforce, including those resulting fromcustomer or governmental complaints, breakdowns or other disruptions in communication services provided by a vendor, failure of a vendor to handle current or higher volumes, and cyber attacks or security breaches at a vendor could subject the Company to litigation and adversely affect the Company’s ability to deliver products and services to its customers and otherwise conduct its business.have a material adverse effect on our results of operations and financial condition.
We rely on foreign manufacturers for various products that we sell. In addition, many of our domestic suppliers purchase a portion of their products from foreign sources. As an importer, our business is subject to the risks generally associated with doing business internationally, such as domestic and foreign governmental regulations, economic disruptions, global or regional
health epidemics, delays in shipments, transportation capacity and costs, currency exchange rates, and changes in political or economic conditions in countries from which we purchase products. If any such factors were to render the conduct of business in particular countries undesirable or impractical or if additional
U.S. quotas, duties, tariffs, taxes, or other charges or restrictions were imposed upon the importation of our products in the future, our financial condition and results of operations could be materially adversely affected.
The current political landscape in the U.S. has introduced greatercontains uncertainty with respect to tax and trade policies, tariffs and regulations affecting trade between the U.S. and other countries. We source a portion of our merchandise from manufacturers located outside the U.S., primarily in Asia and Central America. Major developments in tax policy or trade relations, such as the disallowance of tax deductions for imported merchandise or the imposition of tariffs on imported products, could have a material adverse effect on our business, results of operations, and liquidity.financial condition.
We rely on manufacturers located in foreign countries, including China, for merchandise. Additionally, a portion of our domestically purchased merchandise is manufactured abroad. Our business may be materially adversely affected by risks associated with international trade, including the impact of current or potential tariffs by the U.S. with respect to certain consumer goods imported from China.
We source a portion of our merchandise from manufacturers located outside the U.S., primarily in Asia and Central America, and many of our domestic vendors have a global supply chain. The U.S. has imposed tariffs on certain products imported into the U.S. from China and could propose additional tariffs. The imposition of tariffs on imported products has increased our costs and could result in reduced sales and profits. The changes in certain tax and trade policies, tariffs and other regulations affecting trade between the U.S. and other countries enacted under the prior U.S. administration increased the cost of our merchandise sourced from outside of the U.S., which represents a large percentage of our overall merchandise. It remains unclear how tax or trade policies, tariffs or trade relations may change under the current U.S. administration, which could adversely affect our business, results of operations, effective income tax rate, liquidity and net income.
In addition, the imposition of tariffs by the U.S. has resulted in the adoption of tariffs by China on U.S. exports and could result in the adoption of tariffs by other countries as well. A resulting trade war could have a significant adverse effect on world trade and the world economy. Further, the imposition of tariffs or other changes in world trade could have an impact on certain U.S. industries and consumers and could negatively impact the consumer demand for products that we sell.
We continue to evaluate the impact of the effective and potential tariffs on our supply chain, costs, sales, and profitability as well as our strategies to mitigate any negative impact, including negotiating with our vendors, seeking alternative sourcing options, and adjusting retail selling prices. Given the uncertainty regarding the scope and duration of the current and potential tariffs, as well as the potential for additional trade actions by the U.S. or other countries, the impact on our business, results of operations, and financial condition is uncertain but could be significant. Thus, we can provide no assurance that any strategies we implement to mitigate the impact of such tariffs or other trade actions will be successful in whole or in part. To the extent that our supply chain, costs, sales, or profitability are negatively affected by the tariffs or other trade actions, our business, financial condition, and results of operations may be materially adversely affected.
A significant disruption to our distribution network or to the timely receipt of inventory could adversely impact sales or increase our transportation costs, which would decrease our profits.
We rely on our distribution and transportation network, including third-party logistics providers, to provide goods to our stores in a timely and cost-effective manner through deliveries to our distribution facilities from vendors and then from the distribution facilities or direct ship vendors to our stores or customers by various means of transportation, including shipments by sea, air, rail, and truck. Any disruption, unanticipated expense, or operational failure related to this process could negatively affect store operations negatively.our operations. For example, unexpected delivery delays (including delays due to weather, fuel shortages, work stoppages, global or regional health epidemics, product shortages from vendors, or other reasons) or increases in transportation costs (including increased fuel costs or a decrease in transportation capacity for overseas shipments) could significantly decrease our ability to provide adequate productproducts to meet increased customer demand for sale,certain products, or products at a desired price, resulting in lower sales and profitability. In addition, labor shortages or work stoppages in the transportation industry or long-term disruptions to the national and international transportation infrastructure that lead to delays or interruptions of deliveries could negatively affect our business. Also, a fire, tornado, or other disaster at one of our distribution facilities could disrupt our timely receiving, processing, and shipment of merchandise to our stores which could adversely affect our business. While we believe there are adequate reserve quantities and alternative suppliers available, shortages or interruptions in the receipt or supply of products caused by unanticipated demand, such as occurred during, and as the economy recovers from, the COVID-19 pandemic, problems in production or distribution, financial or other difficulties of supplies,
inclement weather or other economic conditions, including the availability of qualified drivers and distribution center team members, could adversely affect the availability, quality and cost of products, and our operating results.
The implementation of our supply chain initiatives could disrupt our operations in the near term, and these initiatives might not provide the anticipated benefits or might fail.
We maintain a network of distribution facilities and have plans to build new distribution facilities and expand existing facilities to support our long-term strategic growth objectives.initiatives. Delays in opening new or expanded distribution facilities could adversely affect our future operations by slowing store growth or negatively impacting our fulfillment capabilities, which may in turn reduce revenue growth. In addition, distribution-related construction or expansion projects entail risks which could cause delays and cost overruns, such as: shortages of materials; shortages of skilled labor or work stoppages; unforeseen construction, scheduling, engineering, environmental, or geological problems; weather interference; fires or other casualty losses; and unanticipated cost increases. The completion date and ultimate cost of future projects could differ significantly from initial expectations due to construction-related or other reasons. We cannot guarantee that all projects will be completed on time or within established budgets.
We continue to make significant technology investments in our supply chain. These initiatives are designed to streamline our distribution process so that we can optimize the delivery of goods and services to our stores, and distribution facilities, and customers in a timely manner and at a reasonable cost. The cost and potential problems and interruptions associated with the implementation of these initiatives, including those associated with managing third-party service providers and employing new web-based tools and services, could disrupt or reduce the efficiency of our operations in the near term. In addition, our improved supply chain technology might not provide the anticipated benefits, it might take longer than expected to realize the anticipated benefits, or the initiatives might fail altogether.
We are subject to personal injury, workers’ compensation, product liability, discrimination, harassment, wrongful terminationTechnology, Data Security, Business Continuity and other claims in the ordinary course of business.Disaster Recovery Risks
Our business involves a risk of personal injury, workers’ compensation, product liability, discrimination, harassment, wrongful termination and other claims in the ordinary course of business. Product liability claims from customers and product recalls for merchandise alleged to be defective or harmful could lead to the disposal or write-off of merchandise inventories, the incurrence of fines or penalties and damage to our reputation. We maintain general liability and workers’ compensation insurance with a self-insured retention for each policy type and a deductible for each occurrence. We also maintain umbrella limits above the primary general liability and product liability coverage. In many cases, we have indemnification rights against the manufacturers of the products and their products liability insurance as well as the property owners of our leased buildings. Our ability to recover costs and damages under such insurance or indemnification arrangements is subject to the financial viability of the insurers, manufacturers and landlords and the specific allegations of a claim. No assurance can be given that our insurance coverage or the manufacturers’ or landlords’ indemnity will be available or sufficient in any claims brought against us.
Additionally, we are subject to U.S. federal, state and local employment laws that expose us to potential liability if we are determined to have violated such employment laws, including but not limited to, laws pertaining to minimum wage rates, overtime pay,
discrimination, harassment, and wrongful termination. Compliance with these laws, including the remediation of any alleged violation, may have a material adverse effect on our business or results of operations.
Failure to maintain an effective system of internal control over financial reporting could materially impact our business and results.
The Company’s management is responsible for establishing and maintaining adequate internal control over financial reporting. An internal control system, no matter how well designed and operated, can provide only reasonable, not absolute, assurance that the objectives of the control system are met. Further, the design of a control system must reflect the fact that there are resource constraints, and the benefits of controls must be considered relative to their costs. Because of the inherent limitations in all internal
control systems, internal control over financial reporting may not prevent or detect misstatements. Any failure to maintain an effective system of internal control over financial reporting could limit our ability to report our financial results accurately and timely or to detect and prevent fraud, and could expose us to litigation or adversely affect the market price of our common stock.
Any failure to maintain the security of the information relating to our business, customers, employeesteam members, and vendors that we hold, whether as a result of cybersecurity attacks or otherwise, could damage our reputation with customers, employees, and vendors, could cause us to incur substantial additional costs and to become subject to litigation, and could adverselymaterially affect our operating results, financial condition, and liquidity.
We depend on information systems and technology, some of which are managed or provided by third-parties, for many activities important to our business. As do most retailers, we receive and store in our information systems certain personal and other confidentialsensitive information about our business, customers, employeesteam members, and vendors. WeAdditionally, we also rely on business partners to provide services to us that may include important businessreceive and process information or data aboutpermitting cashless payments as part of our customers, employeesin-store and vendors. In addition, our online operations at TractorSupply.com and Petsense.com and on our mobile application, some of which depend upon the secure transmission of confidential information over public networks. The information that we receive and store makes us subject to cybersecurity attacks and cyber incidents, which are occurring more frequently, are constantly evolving in nature, are becoming more sophisticated, and are being made by groups and individuals with a wide range of expertise and motives. We are the target of attempted cyber and other security threats and we continuously monitor our information technology networks including information permitting cashless payments. While we maintain substantialand infrastructure in an effort to prevent, detect, address and mitigate the risk of unauthorized access, misuse, computer viruses and other events that could have a security impact. However, these security measures cannot provide absolute assurance or guarantee that we will be successful in preventing, detecting, or responding to help protect and prevent unauthorized access toevery such information, it is possible that unauthorized parties (through cybersecurity attacks, which are rapidly evolving and becoming increasingly sophisticated,breach or by other means) might compromise our security measures and obtain anddisruption and/or preventing the misuse the personalof confidential information of our business, customers, employeesteam members, or vendors. Similar risks exist with respect to the third-party vendors on which we rely for aspects of our information technology support services and administrative functions, even if the attack or breach does not directly impact our systems or information.
A compromise of our information security and privacy controls, or those of businesses and vendors thatwith whom we holdinteract, which results in confidential information being accessed, obtained, damaged, or used by unauthorized or improper parties; loss or unavailability of data; disruptions to our business activities; or any other confidential Company data. It is possible that suchoutcome stemming from a compromise could go undetected by us. Such an occurrencecybersecurity incident could materially adversely affect our reputation with our customers, employees, andcustomers, team members, and vendors, as well as our operations, results of operations, financial condition, and liquidity, and could result in significant legal and financial exposure beyond the scope or limits of insurance coverage. Moreover, a security breach could require that we expend significant additional resources to respond to the attack or breach and could result in a disruption of our operations.
In addition, states and the federal government are increasingly enactinghave enacted laws and regulations relating to privacy, data breaches, and theft of employee and customer data. These laws will likely increasehave increased the costs of doing business and, if we fail to comply with these laws and regulations or to implement appropriate safeguards or to detect and provide prompt notice of unauthorized access as required
by some of these new laws, we could be subject to potential claims for damages and other remedies, which could harm our business.
We are subject to payments-related risks that could increase our operating costs, expose us to fraud, subject us to potential liability, and potentially disrupt our business.
We accept payments using a variety of methods, including credit cards, debit cards, credit accounts, our private label credit cards, gift cards, direct debit from a customer’s bank account, consumer invoicing, and physical bank checks, and we may offer different payment options over time. These payment options subject us to many compliance requirements, including, but not limited to, compliance with payment card association operating rules, including data security rules, certification requirements, rules governing electronic funds transfers, and Payment Card Industry Data Security Standards. They also subject us to potential fraud by criminal elements seeking to discover and take advantage of security vulnerabilities that may exist in some of these payment systems. For certain payment methods, including credit and debit cards, we pay interchange and other fees, which may increase over time and raise our operating costs and lower profitability. We rely on third parties to provide payment processing services, including the processing of credit cards, debit cards, electronic checks, gift cards and promotional financing, and it could disrupt our business if these companies become unwilling or unable to provide these services to us. If we fail to comply with these rules or requirements, adequately encrypt payment transaction data, or if our data security systems are breached or compromised, we may be liable for card issuing banks’ costs, subject to fines and higher transaction fees, and lose our ability to accept credit and debit card payments from our customers, process electronic funds transfers, or facilitate other types of online payments, and our business and operating results could be adversely affected.
Our business and operations could suffer material losses in the event of system interruptions or failures.
Our information technology systems, some of which are dependent on services managed or provided by third parties,third-parties, serve an important role in the operation and administration of our business. These systems are vulnerable to damages from any number of sources, including, but not limited to, human error, cybersecurity attacks, computer viruses, unauthorized access, fire, flood, power outages, telecommunication failures, facility or equipment damage, natural disasters, terrorism, and war. In addition, we continually make investments in technology to implement new processes and systems, as well as to maintain and update our existing processes and systems. Implementing process and system changes increases the risk of disruption. If our information technology systems are interrupted or fail and our redundant systems or recovery plans are not adequate to address such interruptions or failures on a timely basis, our revenues and profits could be reduced and the reputation of our brand and our business could be materially adversely affected. Additionally, remediation of any problems with our systems could result in significant, unplanned expenses.
As customer-facingCustomer-facing technology systems becomeare an increasingly important part of our sales and marketing strategy and the failure of those systems to perform effectively and reliably could keep us from delivering positive customer experiences.
Through our continued information technology enhancements, we believe we are able to provide an improved overall shopping environment and an omni-channel experience that empowers our customers to shop and interact with us from computers, tablets, smart phones, and other mobile communication devices. We use our websitewebsites, TractorSupply.com and Petsense.com, and our mobile application as both as a sales channel for our products and also as a method of providing product, project, and other relevant information to our customers to drive both in-store and online sales. Omni-channel retailing is continually evolving and expanding, and we must effectively respond to changing customer expectations and new developments. The portion of total consumer expenditures with retailers occurring online and through mobile applications has continued to increase and has accelerated significantly during the COVID-19 pandemic. The pace of this increase could further accelerate in the future. Our business has evolved from an in-store experience to interaction with customers across numerous channels, including in-store, online, mobile and social media, among others. Omni-channel retailing is rapidly evolving, and we must keep pace with changing customer expectations and new developments by our competitors. Our customers are increasingly using mobile phones, tablets, computers, and other devices to shop and to interact with us through social media, particularly in the wake of COVID-19. We are making investments in our websites and mobile applications. If we are unable to make, improve, or develop relevant customer-facing technology in a timely manner, our ability to compete and our results of operations could be adversely affected. Disruptions, failures, or other performance issues with these customer-facing technology systems could impair the benefits that they provide to our onlinein-store and in-storeonline business and negatively affect our relationship with our customers.
If we are unable to maintain or upgrade our management information systems and software programs or if we are unable to convert to alternate systems in an efficient and timely manner, our operations may be disrupted or become less efficient and our long-term strategic businessgrowth initiatives may not be successful.
We depend on management information systems for many aspects of our business. We rely on certain software vendors to maintain and periodically upgrade many of these systems so that we can continue to support our business. We could be materially adversely affected if we experienced a disruption or data loss relating to our management information systems and are unable to recover timely. We could also be adversely impacted if we are unable to improve, upgrade, maintain, and expand our management information systems, particularly in light of the contemplated continued store growth.
The success of our long-term strategic businessgrowth initiatives designed to increase our sales and improve margin isare dependent in varying degrees on the timely delivery and the functionality of information technology systems to support them. Extended delays or cost overruns in securing, developing, and otherwise implementing technology solutions to support the long-term strategic businessgrowth initiatives would delay and possibly even prevent us from realizing the projected benefits of those initiatives.
Financial Risks
Changes in market conditions or in our credit rating could restrict capital and adversely affect our business operations and growth initiatives.
We rely on the positive cash flow we generate from our operating activities and our access to the credit and capital markets to fund our operations, growth strategy, capital expenditures, and return of cash to our stockholders through share repurchases and dividends. Changes in the credit and capital markets, including market disruptions, limited liquidity and interest rate fluctuations, may increase the cost of financing or restrict our access to these potential sources of future liquidity. Our continued access to liquidity sources on favorable terms depends on multiple factors, including our operating performance and credit ratings. There can be no assurance that we will be able to maintain and/or improve our current credit ratings. A rating organization may lower our rating, or change our ratings’ outlook, or decide not to rate our securities, temporarily or permanently, in its sole discretion. In the event that our current credit ratings are downgraded or removed, we would most likely incur higher borrowing costs and experience greater difficulty in obtaining additional financing, which in turn would have a material adverse impact on our financial condition, results of operations, cash flows, and liquidity. We can make no assurances that our ability to obtain additional financing through the debt and equity markets will not be adversely affected by economic conditions or that we will be able to maintain or improve our current credit ratings.
In addition, tight lending practices may make it difficult for our real estate developers to obtain financing under acceptable loan terms and conditions. Unfavorable lending conditions could impact the timing of our store openings and materially adversely affect our ability to open new stores in desirable locations.
Longer-term disruptions in the capital and credit markets as a result of uncertainty, changing or increased regulation, reduced funding alternatives, or failures of significant financial institutions could adversely affect our access to liquidity needed for our business. Any disruption could require us to take measures to conserve cash until the markets stabilize or until alternative credit arrangements or other funding for our business needs can be arranged. Such measures could include deferring capital expenditures and reducing or eliminating future share repurchases, cash dividends, or other discretionary uses of cash.
Our level of indebtedness could limit our cash flow available for operations and could adversely affect our ability to service our debt or obtain additional financing.
As of December 25, 2021, our total outstanding consolidated debt was approximately $986.4 million. Our level of indebtedness could restrict our operations and make it more difficult for us to satisfy our debt obligations. Our ability to make payments on our indebtedness, to refinance our indebtedness, and to fund planned capital expenditures will depend on our ability to generate cash in the future.This ability, to a certain extent, is subject to general economic, financial, competitive, legislative, regulatory, and other factors that are beyond our control. Our business may not be able to generate sufficient cash flow from operations, and future borrowings may not be available to us in an amount sufficient to enable us to pay our indebtedness or to fund our other liquidity needs.We may need to refinance all or a portion of our indebtedness on or before maturity.Our ability to refinance all or a portion of our indebtedness on acceptable terms, or at all, will be dependent upon a number of factors, including our degree of leverage, the value of our assets, borrowing and other financial restrictions imposed by lenders and conditions in the credit markets at the time we refinance. If we are unable to refinance our indebtedness on acceptable terms, we may be forced to agree to otherwise unfavorable financing terms. This could have a material adverse effect on our business, financial condition and results of operations.
In addition, so long as we comply with any existing limitations in our credit and debt agreements while they are in effect, we may issue an indeterminate amount of debt securities from time to time. If new debt is added to our and our subsidiaries' current debt levels, the related risks that we and they now face could intensify.
Our credit facilities, the indenture related to our 1.75% Senior Notes, and other debt instruments have restrictive covenants and change of control provisions that could limit our financial and business flexibility.
Our credit agreement governing our senior credit facilities and our note purchase and private shelf agreement governing our senior unsecured notes due August 14, 2029 (the “2029 notes”) each contain financial, operative and other restrictive covenants in addition to the restrictive covenants contained in the indenture governing our 1.75% Senior Notes (as defined in the Notes to the Consolidated Financial Statements). Our failure to comply with those covenants could result in an event of default which, if not cured or waived, could result in the acceleration of all of our debt, which would have a material adverse effect on our financial condition. In addition, upon certain events constituting a change of control, as that term is defined in the indenture for our 1.75% Senior Notes and in our note purchase and private shelf agreement for our 2029 notes, we are required to make an offer in cash to repurchase all or any part of each holder's 1.75% Senior Notes at a repurchase price equal to 101% of the principal thereof, plus accrued interest, and to prepay all of each holder’s 2029 notes at a prepayment price equal to 100% of the principal thereof, plus accrued interest. Sufficient funds may not be available to us, however, at the time of any change of control event to repurchase and prepay, as applicable, all or a portion of the tendered notes pursuant to these requirements. Our failure to offer to repurchase 1.75% Senior Notes and prepay 2029 notes, or to repurchase and prepay, as applicable, notes tendered, following a change of control will result in a default under the indentures for our 1.75% Senior Notes and the note purchase and private shelf agreement for our 2029 notes, which could lead to a cross-default under our credit agreement for our senior credit facilities.
We cannot provide any guaranty of future dividend payments or that we will continue to repurchase our common stock pursuant to our stock repurchase program.
Although our Board of Directors has indicated an intention to pay future quarterly cash dividends on our common stock, any determination to pay or increase cash dividends on our common stock in the future will be based primarily upon our financial condition, results of operations, business requirements, and our Board of Directors’ continuing determination that the declaration of dividends is in the best interests of our stockholders and is in compliance with all laws and agreements applicable to the dividend. Furthermore, although our Board of Directors has authorized a share repurchase program of up to $3$6.5 billion, through December 2020, we may temporarily pause or permanently discontinue this program at any time or significantly reduce the amount of repurchases under the program. The currently authorized amount reflects a $2.0 billion increase to the existing share repurchase program which was approved by our Board of Directors on January 26, 2022. The share repurchase program does not have an expiration date. As of December 25, 2021, prior to the expanded $2.0 billion repurchase authorization, the Company had remaining authorization under the share repurchase program of $345.0 million, exclusive of any fees, commissions or other expenses.
The market price for our common stock might be volatile and could result in a decline in value.
The price at which our common stock trades may be volatile and could be subject to significant fluctuations in response to our operating results, general trends and prospects for the retail industry, announcements by our competitors, analyst recommendations, our ability to meet or exceed analysts’ or investors’ expectations, the condition of the financial markets, and other factors. The Company’s stock price is dependent in part on the multiple of earnings that investors are willing to pay. That multiple is in part dependent on investors’ perception of the Company’s future earnings growth prospects. If investor perceptionsinvestors’ perception of the Company’s earnings growth prospects change, the Company’s earnings multiple may decline and its stock price could be adversely affected.
In addition, the stock market in recent years has at times experienced extreme price and volume fluctuations that often have been unrelated or disproportionate to the operating performance of companies. These fluctuations, as well as general economic and market conditions, may adversely affect the market price of our common stock notwithstanding our actual operating performance.
Impairment of the carrying value of our goodwill or other intangible assets could adversely affect our financial condition and results of operations.
Goodwill represents the difference between the purchase price of an acquired company and the related fair value of net assets acquired. A significant amount of judgment is involved in determining if an indication of impairment of goodwill exists. As
with goodwill, we also test our indefinite-lived intangible assets for impairment annually and whenever events or changes in circumstances indicate that their carrying value may not be recoverable. Factors indicating impairment of goodwill or other intangible assets may include, among others: a significant decline in our expected future cash flows; a sustained, significant decline in our stock price and market capitalization; a significant adverse change in legal factors or in the business climate; unanticipated or changing competition; the testing for recoverability of a significant asset group within a reporting unit; and reduced growth rates. Any adverse change in these factors could have a significant impact on the recoverability of these assets and negatively affect our financial condition and results of operations. To the extent that business conditions deteriorate or if changes in key assumptions and estimates differ significantly from management's expectations, it may be necessary to record additional impairment charges in the future which could have an adverse effect on our financial condition and results of operations.
Legal, Regulatory and Compliance Risks
We are subject to personal injury, workers’ compensation, product liability, discrimination, harassment, wrongful termination, wage and hour, and other claims in the ordinary course of business.
Our business involves a risk of personal injury, workers’ compensation, product liability, discrimination, harassment, wrongful termination, wage and hour, and other claims in the ordinary course of business. Product liability claims from customers and product recalls for merchandise alleged to be defective or harmful could lead to the disposal or write-off of merchandise inventories, the incurrence of fines or penalties, and damage to our reputation. We maintain general liability with a self-insured retention and workers’ compensation insurance with a deductible for each occurrence. We also maintain umbrella limits above the primary general liability and product liability coverage. In many cases, we have indemnification rights against the manufacturers of the products and their products liability insurance, as well as the property owners of our leased buildings. Our ability to recover costs and damages under such insurance or indemnification arrangements is subject to the financial viability of doingthe insurers, manufacturers, and landlords and the specific allegations of a claim. No assurance can be given that our insurance coverage or the manufacturers’ or landlords’ indemnity will be available or sufficient in any claims brought against us.
Additionally, we are subject to U.S. federal, state, and local employment laws that expose us to potential liability if we are determined to have violated such employment laws, including but not limited to, laws pertaining to minimum wage rates, overtime pay, discrimination, harassment, and wrongful termination. Compliance with these laws, including the remediation of any alleged violation, may have a material adverse effect on our business or results of operations.
Our business could increasebe negatively impacted as a result of federal, state, local, or foreign laws and regulations.
We are subject to numerous federal, state, local, and foreign laws and governmental regulations including those relating to competition, environmental protection, personal injury, intellectual property, consumer product safety, building, land use and zoning requirements, workplace regulations, wage and hour, privacy and information security, and employment law matters.
Our operations, including our outsourced exclusive brand manufacturing partners, are subject to regulation by the Occupational Safety and Health Administration (“OSHA”), the Food and Drug Administration (the “FDA”), the Department of Agriculture (the “USDA”), the Environmental Protection Agency (the "EPA") and by various other federal, state, local and foreign authorities regarding the processing, packaging, storage, distribution, advertising, labeling and export of our products, including food safety standards.
If we fail to comply with existing or future laws or regulations, or if these laws or regulations are violated by importers, manufacturers or distributors, we may be subject to governmental or judicial fines or sanctions, while incurring substantial legal fees and costs. In addition, our capital expenditures could increase due to remediation measures that may be required if we are found to be noncompliant with any existing or future laws or regulations.
We are also subject to the Foreign Corrupt Practices Act (the “FCPA”), which prohibits U.S. companies and their intermediaries from making improper payments to foreign officials for the purposes of obtaining or retaining business, and the anti-bribery laws of other jurisdictions. Failure to comply with the FCPA and similar laws could subject us to, among other things, penalties and legal expenses that could harm our reputation and have a material adverse effect on our business, financial condition, and results of operations.
Potential noncompliance with environmental regulations could materially impact our results of operations or financial condition.
Our business is subject to various federal, state, and local laws, regulations, and other requirements pertaining to protection of the environment and public health, including, for example, regulations governing the management of waste materials and waste waters. Governmental agencies on the federal, state, and local levels have, in recent years, increasingly focused on the retail sector’s compliance with such laws and regulations, and have at times pursued enforcement activities. We periodically receive information requests and notices of potential noncompliance with environmental laws and regulations from governmental agencies, which are addressed on a case-by-case basis with the relevant agency. Any of these events could have a material adverse effect on our results of operations or financial condition.
Failure to maintain an effective system of internal control over financial reporting could materially impact our business and results.
The Company’s management is responsible for establishing and maintaining adequate internal control over financial reporting. An internal control system, no matter how well designed and operated, can provide only reasonable, not absolute, assurance that the objectives of the control system are met. Further, the design of a control system must reflect the fact that there are resource constraints, and the benefits of controls must be considered relative to their costs. Because of the inherent limitations in all internal control systems, internal control over financial reporting may not prevent or detect misstatements. Any failure to maintain an effective system of internal control over financial reporting could limit our ability to report our financial results accurately and timely or to detect and prevent fraud, and could expose us to litigation or adversely affect the market price of our common stock.
Effective tax rate changes and results of examinations by taxing authorities could materially impact our results.
Our future effective tax rates could be adversely affected by legislative tax reform, changes in statutory rates or changes in tax laws, or interpretations thereof. Additionally, our future effective tax rates could be adversely affected by the earnings mix being lower than historical results in states where we have lower statutory rates and higher than historical results in states where we have higher statutory rates or by changes in the measurement of our deferred tax assets and liabilities.
We are subject to periodic audits and examinations by the Internal Revenue Service (“IRS”), as well as state and local taxing authorities. Like many retailers, a portion of our sales are to tax-exempt customers. The business activities of our customers and the intended use of the unique products sold by us create a challenging and complex compliance environment. These circumstances create risk that we could be challenged as to the propriety of our sales tax compliance. Our results could be materially impacted by the determinations and expenses related to these and other proceedings by the IRS and other state and local taxing authorities.
COVID-19 Risks
The COVID-19 coronavirus pandemic has, and could continue to have a material negative effect on our results of operations, cash flows, financial position, and business operations.
The COVID-19 pandemic has created significant public health concerns as well as economic disruption, uncertainty, and volatility, such as increased transportation costs, supply chain distributions, labor shortages, increased overhead, among other impacts, which have, and may continue to, negatively affect our business operations.
Despite the previous impacts of the pandemic on our business, we are unable to predict the future impact that COVID-19 will have on our results of operations, cash flows, financial position, and business operations due to numerous uncertainties. These uncertainties include, but are not limited to: the severity of the virus; the duration of the pandemic, including the likelihood of resurgences and the emergence of variants; the efficacy and public acceptance of vaccines; governmental actions which include restrictions on our operations up to and including potential closure of our stores and distribution centers; the duration and degree of quarantine or shelter-in-place measures, including additional measures that may still occur; impacts on our supply chain which include suppliers of our products and our transportation vendors; impacts on our distribution network; the health of our workforce and our ability to maintain staffing needs to operate our business; how macroeconomic factors evolve including unemployment rates and recessionary pressures; the impact of the pandemic on consumer shopping patterns; volatility in the economy as well as the credit and financial markets; the incremental costs of doing business during the pandemic as well as on a long-term basis; potential increases in insurance premiums, medical claims costs, and workers' compensation claim costs; unknown consequences on our business performance and initiatives stemming from the substantial investment of time and other
resources to the pandemic response; potential delays in growth initiatives including the timing of new store openings; potential adverse effects on our internal control environment and information security as a result of changes to a remote work environment; and the long-term impact of the pandemic on our business.
In addition, we cannot predict the impact that the pandemic will have on our manufacturers and suppliers of our products and other business partners such as service vendors; however, any material effect on these parties could adversely impact our results of operations and our ability to operate our business effectively.
The COVID-19 coronavirus pandemic has had, and could continue to have a material negative effect on our supply chain and distribution network.
Circumstances surrounding and related to the COVID-19 pandemic have created unprecedented impacts on the global supply chain. Our business relies on an efficient and effective supply chain, including the manufacture and transportation of our products as well as the effective functioning of our distribution centers. Impacts related to the COVID-19 pandemic are placing strains on the domestic and international supply chains that have negatively affected, and could continue to negatively affect the flow or availability of our products and result in higher out-of-stock inventory positions due to difficulties in timely obtaining product from the manufacturers and suppliers of our products as well as transportation of those products to our distribution centers and stores. Further, we may have to source products from different manufacturers or geographic locations which could result in, among other things, higher product costs, increased transportation costs, delays in receiving products or lower quality of the products.
Additionally, the operation of our distribution centers is crucial to our business operations. If our distribution centers experience closures or worker shortages, whether temporary or sustained, we could sustain significant adverse impacts related to the flow or availability of products to our stores and customers.
Any of these circumstances could adversely affect our ability to deliver inventory in a timely manner, which could impair our ability to meet customer demand for products and result in lost sales, increased supply chain costs, or damage to our reputation.
Economic impacts stemming from the COVID-19 coronavirus pandemic could significantly impact our financial position, including liquidity, capital allocation, and access to capital markets for additional funds to operate our business.
The financial and credit markets have experienced, and may continue to experience significant volatility and turmoil as a result of the COVID-19 pandemic. Changes in the financial and credit markets could adversely impact our ability to access capital on favorable terms and continue to meet our liquidity needs.
Additionally, changes in our capital allocation strategy could have significant adverse impacts, both short- and long-term, on our business, results of operations, and financial position. Any future suspension of our share repurchase program, if necessary and depending on duration, could negatively impact our earnings per share which in turn could adversely impact our common stock price. While not contemplated at this time, any potential suspension or reduction in our dividend declaration could have an adverse impact on investor perception and our common stock price.
Actions taken to protect the health and safety of our team members and customers during the COVID-19 coronavirus pandemic have increased our operating costs and may not be sufficient to protect against operational or reputational harm to our business, regulatory actions or claims and litigation.
In response to the COVID-19 pandemic, we have taken a number of actions across our business to help protect our team members, customers, and others in the communities we serve. These measures include encouraging vaccination efforts, personal protective equipment for our team members, following local and federal guidance regarding the use of masks in our facilities, increased staffing in order to provide contact-free curbside pickup from stores, expansion of our capabilities to support delivery to customer homes, increased cleaning and sanitizing measures, offering remote work plans at our Store Support Center and monitoring for “social distancing” directives, as well as additional cleaning materials in our facilities. Additionally, we have provided appreciation bonuses as well as permanent increases in compensation and benefits for our team members in our stores and distribution centers to further support them during and after the COVID-19 pandemic. Actions such as these have resulted in significant incremental costs in fiscal 2021 and 2020, and we expect that we will continue to incur these costs for the foreseeable future, which in turn will have an adverse impact on our results of operations.
The health and safety of our team members and customers are of primary concern to our management team. However, due to the unpredictable nature of this virus and the consequences of our actions, we may see unexpected outcomes notwithstanding
our added safety measures. For instance, if we do not respond appropriately to the pandemic, or if our team members or customers do not participate in “social distancing”, vaccination efforts and other safety measures, the well-being of our team members and customers could be jeopardized. Furthermore, any failure to appropriately respond, or the perception of an inadequate response, could cause reputational harm to our brand and subject us to claims and litigation from team members, customers and service providers. Additionally, we may experience increased litigation expenses resulting from team member or customer lawsuits, including those related to the Company’s COVID-19 response and team member or customer contraction of COVID-19, increased insurance costs, medical claims costs and workers’ compensation claims costs and an adverse impact of regulatory and judicial changes in liability for workers’ compensation claims related to the COVID-19 pandemic.
Further, an outbreak of confirmed cases of COVID-19 in our stores or distribution centers could result in temporary or sustained workforce shortages or facility closures which would negatively impact our underlying business and results of operations.
Item 1B. Unresolved Staff Comments
None.
Item 2. Properties
At December 30, 2017,25, 2021, the Company operated 1,8532,181 stores in 49 states.states (2,003 Tractor Supply and Del’s retail stores and 178 Petsense retail stores). The Company leases approximately 93%95% of its stores. Store leases typically have initial terms of between 10 toand 15 years, with two to four optional renewal periods of five years each, exercisable at our option. No single lease is material to Companythe Company’s operations.
Approximately 57% of our stores are in freestanding buildings and 43% are located in shopping centers. The following is a count of store locations by state:
| | | | | | | | | | | | | | | | | | | | |
| State | | Number
of Stores | | State | | Number
of Stores |
| Texas | | 235 | | New Jersey | | 27 |
| North Carolina | | 113 | | Maryland | | 25 |
| Pennsylvania | | 102 | | Washington | | 25 |
| Tennessee | | 102 | | Illinois | | 24 |
| Georgia | | 101 | | Massachusetts | | 24 |
| Michigan | | 97 | | Maine | | 23 |
| Ohio | | 97 | | Colorado | | 22 |
| Florida | | 96 | | New Hampshire | | 22 |
| New York | | 96 | | Connecticut | | 20 |
| California | | 74 | | Nebraska | | 18 |
| Kentucky | | 72 | | Utah | | 16 |
| Virginia | | 71 | | Minnesota | | 14 |
| Alabama | | 67 | | North Dakota | | 14 |
| Indiana | | 62 | | Oregon | | 13 |
| Louisiana | | 60 | | Iowa | | 9 |
| Oklahoma | | 58 | | South Dakota | | 9 |
| South Carolina | | 54 | | Vermont | | 9 |
| Mississippi | | 50 | | Wyoming | | 8 |
| Arkansas | | 39 | | Delaware | | 6 |
| Arizona | | 35 | | Idaho | | 6 |
| Missouri | | 32 | | Montana | | 6 |
| New Mexico | | 30 | | Nevada | | 6 |
| West Virginia | | 30 | | Rhode Island | | 4 |
| Wisconsin | | 29 | | Hawaii | | 2 |
| Kansas | | 27 | | | | |
| | | | | | 2,181 |
|
| | | | | | |
| State | | Number of Stores | | State | | Number of Stores |
| Texas | | 210 | | Maryland | | 22 |
| North Carolina | | 94 | | New Hampshire | | 21 |
| Pennsylvania | | 93 | | Maine | | 20 |
| Tennessee | | 91 | | Massachusetts | | 20 |
| Ohio | | 90 | | Wisconsin | | 20 |
| Georgia | | 83 | | Connecticut | | 19 |
| Michigan | | 83 | | Washington | | 19 |
| New York | | 77 | | Nebraska | | 18 |
| Kentucky | | 69 | | Illinois | | 17 |
| Florida | | 63 | | New Jersey | | 17 |
| California | | 59 | | Utah | | 15 |
| Indiana | | 57 | | North Dakota | | 14 |
| Alabama | | 56 | | Minnesota | | 12 |
| Virginia | | 55 | | Iowa | | 9 |
| Oklahoma | | 53 | | South Dakota | | 9 |
| Louisiana | | 44 | | Wyoming | | 8 |
| South Carolina | | 44 | | Vermont | | 7 |
| Mississippi | | 39 | | Montana | | 6 |
| Arkansas | | 35 | | Delaware | | 5 |
| Arizona | | 34 | | Idaho | | 4 |
| Missouri | | 30 | | Rhode Island | | 4 |
| New Mexico | | 28 | | Nevada | | 3 |
| West Virginia | | 28 | | Oregon | | 3 |
| Colorado | | 22 | | Hawaii | | 2 |
| Kansas | | 22 | | | | |
| | | | | | | 1,853 |
The following is a list of distribution locations including the approximate square footage and if the location is leased or owned:
|
| | | | | | | | | | | | | |
| Distribution Facility Location | | Approximate Square Footage | | Owned/Leased Facility |
Franklin, KentuckyFrankfort, New York | | 833,000924,000 | | Owned |
Pendleton, IndianaFranklin, Kentucky | | 764,000833,000 | | Owned |
Macon, GeorgiaPendleton, Indiana | | 684,000764,000 | | Owned |
Waco, TexasMacon, Georgia | | 666,000684,000 | | Owned |
| Waco, Texas | | 666,000 | | Owned |
| Casa Grande, Arizona | | 650,000 | | Owned |
| Waverly, Nebraska | | 592,000 | | Owned |
Hagerstown, Maryland(a) | | 482,000 | | Owned |
Hagerstown, Maryland (a) | | 309,000 | | Leased |
Waverly, Nebraska | | 422,000 | | Owned |
Seguin, Texas (b) | | 71,000 | | Owned |
Lakewood, Washington | | 64,000 | | Leased |
Lakewood, Washington (b) | | 64,000 | | Leased |
Longview, Texas (b) | | 63,000 | | Owned |
(a) The leased facilitydistribution center in Hagerstown is treated as an extension of the existing owned Hagerstown location and is not considered a separate distribution center.
(b) This is a mixing center designed to process certain high-volume bulk products.
The Company’s Store Support Center occupies approximately 260,000 square feet of owned building space in Brentwood, Tennessee, and the Company’s Merchandising Innovation Center occupies approximately 32,000 square feet of leased building space in Nashville, Tennessee.
The Company also leases approximately 8,000 square feet ofis building space for the Petsense corporate headquarters located in Scottsdale, Arizona.
In fiscal 2017, we began construction on a new northeast distribution center in Frankfort, New York, as well as an expansionNavarre, Ohio, which is expected to be approximately 900,000 square feet and is currently anticipated to be completed in the fall of our existingfiscal 2022.
In addition, on January 26, 2022, the Company announced plans to build a new distribution center in Waverly, Nebraska,Maumelle, Arkansas. This new distribution center is expected to be approximately 900,000 square feet. Construction is planned to begin in the middle of 2022 and is currently anticipated to be completed in late 2023.
We also use third-party operated import centers, mixing centers and pop-up distribution facilities which will provide additional distribution capacity once construction is completed.capacity.
Item 3. Legal Proceedings
Item 103For a description of SEC Regulation S-K requires disclosure of certain environmentalthe Company's legal proceedings, if the proceeding reasonably involves potential monetary sanctions of $100,000 or more. We periodically receive information requests and notices of potential noncompliance with environmental laws and regulations from governmental agencies, which are addressed on a case-by-case basis with the relevant agency. The Company received a subpoena from the District Attorney of Yolo County, California, requesting records and information regarding its hazardous waste management and disposal practices in California. The Company and the Office of the District Attorney of Yolo County engaged in settlement discussions which resulted in the settlement of the matter. A consent decree reflecting the terms of settlement was filed with the Yolo County Superior Court on June 23, 2017. Under the settlement, the Company agreedrefer to a compliance plan and also agreed to pay a civil penalty and fund supplemental environmental projects furthering consumer protection and environmental enforcement in California. The civil penalty did not differ materially from the amount accrued. The cost of the settlement and the compliance with the consent decree will not have a material effect on our consolidated financial position, results of operations or cash flows.
The Company is also involved in various litigation matters arising in the ordinary course of business. The Company believes that any estimated loss related to such matters has been adequately provided for in accrued liabilitiesNote 11 to the extent probable and reasonably estimable. Accordingly, the Company currently expects these matters will be resolved without material adverse effectCondensed Consolidated Financial Statements included under Part II, Item 8 of this Annual Report on its consolidated financial position, results of operations or cash flows. Form 10-K.
Item 4. Mine Safety Disclosures
Not applicable.
PART II
| |
Item 5.
| Market for Registrant’s Common Equity, Related Stockholder Matters and Issuer Purchases of Equity Securities |
Item 5. Market for Registrant’s Common Equity, Related Stockholder Matters and Issuer Purchases of Equity Securities
Common Stock
The Company’s common stock trades on the NasdaqNASDAQ Global Select Market under the symbol, “TSCO.”
The table below sets forth the high and low sales prices of our common stock as reported by the Nasdaq Global Select Market for each fiscal quarter of the periods indicated:
|
| | | | | | | |
| | Price Range |
| | 2017 | | 2016 |
| | High | | Low | | High | | Low |
| First Quarter | $78.25 | | $67.70 | | $90.76 | | $78.05 |
| Second Quarter | $71.53 | | $52.09 | | $97.25 | | $86.44 |
| Third Quarter | $63.40 | | $49.87 | | $95.39 | | $66.77 |
| Fourth Quarter | $75.64 | | $54.76 | | $78.17 | | $61.50 |
As of February 2, 2018,January 22, 2022, the number of record holders of our common stock was 585725 (excluding individual participants in nominee security position listings),.
Dividends
We paid cash dividends totaling $239.0 million and $174.7 million in fiscal 2021 and 2020, respectively. In fiscal 2021, we declared and paid cash dividends to stockholders of $2.08 per common share outstanding as compared to $1.50 per common share outstanding in fiscal 2020. These payments reflect an increase in the estimated numberquarterly dividend to $0.52 in the first quarter of beneficial holdersfiscal 2021 from $0.40 per share and an increase in the third quarter of our common stock was approximately 200,000.fiscal 2020 to $0.40 per share from $0.35 per share.
Common Stock Dividends
During 2017 and 2016,On January 26, 2022, the Company’s Board of Directors declared a quarterly cash dividend of $0.92 per share of the following cash dividends:Company’s outstanding common stock. The dividend will be paid on March 8, 2022, to stockholders of record as of the close of business on February 21, 2022.
|
| | | | | | |
Date Declared | | Dividend Amount
Per Share
| | Stockholders of Record Date | | Date Paid |
November 6, 2017 | | $0.27 | | November 20, 2017 | | December 5, 2017 |
August 7, 2017 | | $0.27 | | August 21, 2017 | | September 6, 2017 |
May 8, 2017 | | $0.27 | | May 22, 2017 | | June 6, 2017 |
February 8, 2017 | | $0.24 | | February 27, 2017 | | March 14, 2017 |
| | | | | | |
October 31, 2016 | | $0.24 | | November 14, 2016 | | November 29, 2016 |
August 1, 2016 | | $0.24 | | August 15, 2016 | | August 30, 2016 |
May 2, 2016 | | $0.24 | | May 16, 2016 | | June 1, 2016 |
February 3, 2016 | | $0.20 | | February 22, 2016 | | March 8, 2016 |
It is the present intention of the Company’s Board of Directors to continue to pay a quarterly cash dividend; however, the declaration and payment amount of future dividends will be determined by the Company’s Board of Directors in its sole discretion and will depend upon the earnings, financial condition, and capital needs of the Company, as well asalong with any other factors which the Company’s Board of Directors deem relevant.
On February 7, 2018, our Board of Directors declared a quarterly cash dividend of $0.27 per share of the Company’s common stock. The dividend will be paid on March 13, 2018, to stockholders of record as of the close of business on February 26, 2018.
Issuer Purchases of Equity Securities
The Company’s Board of Directors has authorized common stock repurchases under a share repurchase program which was announced in February 2007. The authorization amount of the program, which has been increased from time to time, is currently authorized for up to $3$6.5 billion, exclusive of any fees, commissions or other expenses related to such repurchases throughrepurchases. The currently authorized amount reflects a $2.0 billion increase to the existing share repurchase program which was approved by the Company's Board of Directors on January 26, 2022. The share repurchase program does not have an expiration date. As of December 31, 2020.25, 2021, prior to the expanded $2.0 billion repurchase authorization, the Company had remaining authorization under the share repurchase program of $345.0 million, exclusive of any fees, commissions or other expenses. Additionally, the Company withholds shares from vested restricted stock units and performance-based restricted share units to satisfy employees’ minimum statutory tax withholding requirements. Stock purchase activity during fiscal 20172021 is set forth in the table below:
| | | | | | | | | | | | | | | | | | | | | | | | | | |
| Period | | Total Number
of Shares
Purchased | | Average
Price Paid
Per Share | | Total Number of Shares Purchased as Part of Publicly Announced Plans or Programs | | Maximum Dollar Value of Shares That May Yet Be
Purchased
Under the Plans or Programs |
First Quarter (a) | | 1,681,348 | | | $ | 157.89 | | | 1,600,354 | | | $ | 890,467,715 | |
Second Quarter (a) | | 1,126,487 | | | $ | 181.83 | | | 1,118,208 | | | $ | 687,175,560 | |
Third Quarter (a) | | 748,943 | | | $ | 190.01 | | | 743,344 | | | $ | 545,926,155 | |
| | | | | | | | |
Fourth Quarter: (a) | | | | | | | | |
| 9/26/21 - 10/23/21 | | 160,205 | | | $ | 200.65 | | | 160,000 | | | $ | 513,824,218 | |
| 10/24/21 - 11/20/21 | | 165,433 | | | $ | 223.01 | | | 164,569 | | | $ | 477,120,646 | |
| 11/21/21 - 12/25/21 | | 577,384 | | | $ | 228.83 | | | 577,329 | | | $ | 345,018,590 | |
| | | 903,022 | | | $ | 222.76 | | | 901,898 | | | $ | 345,018,590 | |
| | | | | | | | |
| As of and for the year ended December 25, 2021 | | 4,459,800 | | | $ | 182.47 | | | 4,363,804 | | | $ | 345,018,590 | |
|
| | | | | | | | | | | | | | |
| Period | | Total Number of Shares Purchased | | Average Price Paid Per Share | | Total Number of Shares Purchased as Part of Publicly Announced Plans or Programs | | Maximum Dollar Value of Shares That May Yet Be Purchased Under the Plans or Programs |
First Quarter (a) | | 1,605,165 |
| | $ | 71.77 |
| | 1,596,167 |
| | $ | 1,124,516,565 |
|
| Second Quarter | | 2,209,506 |
| | 60.47 |
| | 2,209,506 |
| | 990,943,666 |
|
Third Quarter (a) | | 1,427,570 |
| | 55.08 |
| | 1,425,371 |
| | 912,461,301 |
|
| | | | | | | | | |
| Fourth Quarter: | | |
| | |
| | |
| | |
|
| 10/1/17 – 10/28/17 | | 315,000 |
| | 58.98 |
| | 315,000 |
| | 893,885,189 |
|
10/29/17 – 11/25/17 (a) | | 259,359 |
| | 61.08 |
| | 258,801 |
| | 878,077,270 |
|
| 11/26/17 – 12/30/17 | | 119,900 |
| | 69.77 |
| | 119,900 |
| | 869,713,394 |
|
| | | 694,259 |
| | 61.63 |
| | 693,701 |
| | 869,713,394 |
|
| | | | | | | | | |
| As of December 30, 2017 | | 5,936,500 |
| | $ | 62.36 |
| | 5,924,745 |
| | $ | 869,713,394 |
|
(a) The total number of shares purchased and average price paid per share include shares withheld from vested restricted stock unitsawards to satisfy employees’ minimum statutory tax withholding requirements of 8,99880,994 during the first quarter, 2,1998,279 during the second quarter, 5,599 during the third quarter, and 5581,124 during the fourth quarter.
We expect to implement the balance of the repurchase program through purchases made from time to time either in the open market or through private transactions, in accordance with regulations of the SEC and other applicable legal requirements. The timing and amount of any common stock repurchased under the program will depend on a variety of factors including price, corporate and regulatory requirements, capital availability, and other market conditions.
Any additional stock repurchase programs will be subject to the discretion of our Board of Directors and subject to our results of operations,will depend upon earnings, financial condition, cash requirements and capital needs of the Company, along with any other factors deemed relevant by ourwhich the Board of Directors.Directors deem relevant. The program may be limited, temporarily paused, or terminated at any time, without prior notice.
STOCK PERFORMANCE GRAPH
This performance graph shall not be deemed “filed” for purposes of Section 18 of the Securities Exchange Act of 1934, as amended (the “Exchange Act”) or otherwise subject to the liabilities under that Section and shall not be deemed to be incorporated by reference into any filing of Tractor Supply Company under the Securities Act of 1933, as amended, or the Exchange Act.
The following graph compares the cumulative total stockholder return on our common stock from December 29, 201231, 2016 to December 30, 201725, 2021 (the Company’s fiscal year-end), with the cumulative total returns of the S&P 500 Index and the S&P Retail Index over the same period. The comparison assumes that $100 was invested on December 29, 2012,31, 2016, in our common stock and in each of the foregoing indices and in each case assumes reinvestment of dividends. The historical stock price performance shown on this graph is not indicative of future performance.
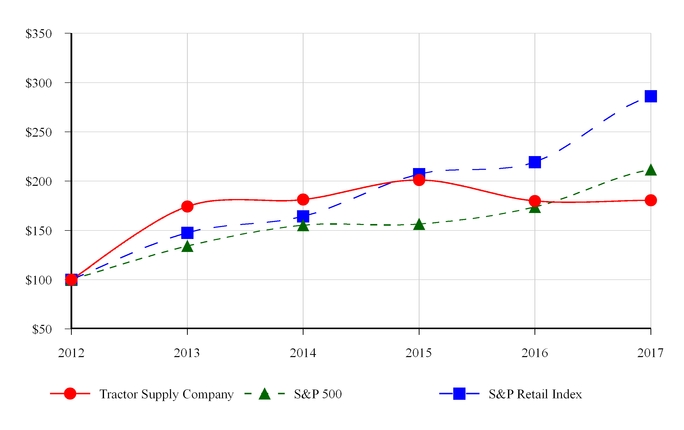
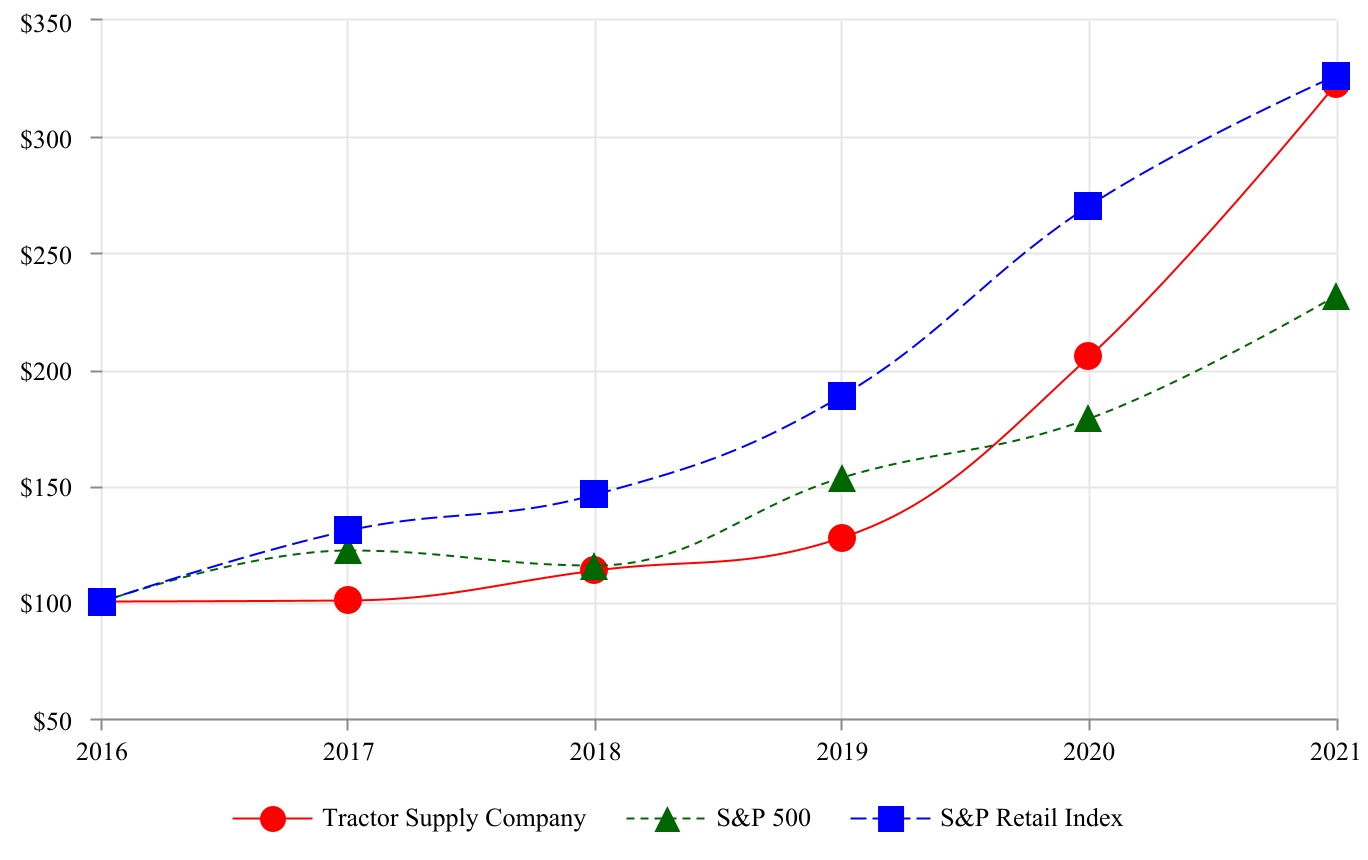
| | | | | | | | | | | | | | | | | | | | | | | | | | | | | | | | | | | | | | |
| | | 12/31/2016 | | 12/30/2017 | | 12/29/2018 | | 12/28/2019 | | 12/26/2020 | | 12/25/2021 |
| Tractor Supply Company | | $ | 100.00 | | | $ | 100.32 | | | $ | 113.40 | | | $ | 127.52 | | | $ | 205.47 | | | $ | 322.80 | |
| S&P 500 | | $ | 100.00 | | | $ | 121.83 | | | $ | 115.49 | | | $ | 153.58 | | | $ | 178.76 | | | $ | 231.39 | |
| S&P Retail Index | | $ | 100.00 | | | $ | 130.40 | | | $ | 146.11 | | | $ | 188.70 | | | $ | 270.43 | | | $ | 326.24 | |
|
| | | | | | | | | | | | | | | | | | | | | | | | |
| | | 12/29/2012 | | 12/28/2013 | | 12/27/2014 | | 12/26/2015 | | 12/31/2016 | | 12/30/2017 |
| Tractor Supply Company | | $ | 100.00 |
| | $ | 174.14 |
| | $ | 181.29 |
| | $ | 201.04 |
| | $ | 179.94 |
| | $ | 180.52 |
|
| S&P 500 | | $ | 100.00 |
| | $ | 134.11 |
| | $ | 155.24 |
| | $ | 156.43 |
| | $ | 173.74 |
| | $ | 211.67 |
|
| S&P Retail Index | | $ | 100.00 |
| | $ | 147.73 |
| | $ | 164.24 |
| | $ | 207.15 |
| | $ | 219.43 |
| | $ | 286.13 |
|
| |
Item 6.
| Selected Financial Data |
FIVE YEAR SELECTED FINANCIAL AND OPERATING HIGHLIGHTS (a)(b)
The following selected financial data is derived frompreviously required by Item 301 of Regulation S-K has been omitted in accordance with the Consolidatedamendments to Regulation S-K.
Item 7. Management’s Discussion and Analysis of Financial StatementsCondition and Results of Tractor Supply Company and provides summary historical financial information for the fiscal periodsended and as of the dates indicated(in thousands, except per share amounts and selected operating and other data): Operations
|
| | | | | | | | | | | | | | | | | | | |
| | 2017 | | 2016 | | 2015 | | 2014 | | 2013 |
| | (52 weeks) | | (53 weeks) | | (52 weeks) | | (52 weeks) | | (52 weeks) |
| Operating Results: | | | | | | | | | |
| Net sales | $ | 7,256,382 |
| | $ | 6,779,579 |
| | $ | 6,226,507 |
| | $ | 5,711,715 |
| | $ | 5,164,784 |
|
| Gross profit | 2,491,965 |
| | 2,325,202 |
| | 2,143,174 |
| | 1,950,415 |
| | 1,753,609 |
|
| Selling, general and administrative expenses | 1,639,749 |
| | 1,488,164 |
| | 1,369,097 |
| | 1,246,308 |
| | 1,138,934 |
|
| Depreciation and amortization | 165,834 |
| | 142,958 |
| | 123,569 |
| | 114,635 |
| | 100,025 |
|
| Operating income | 686,382 |
| | 694,080 |
| | 650,508 |
| | 589,472 |
| | 514,650 |
|
| Interest expense, net | 13,859 |
| | 5,810 |
| | 2,891 |
| | 1,885 |
| | 557 |
|
| Income before income taxes | 672,523 |
| | 688,270 |
| | 647,617 |
| | 587,587 |
| | 514,093 |
|
| Income tax expense | 249,924 |
| | 251,150 |
| | 237,222 |
| | 216,702 |
| | 185,859 |
|
| Net income | $ | 422,599 |
| | $ | 437,120 |
| | $ | 410,395 |
| | $ | 370,885 |
| | $ | 328,234 |
|
Net income per share – basic (c) | $ | 3.31 |
| | $ | 3.29 |
| | $ | 3.03 |
| | $ | 2.69 |
| | $ | 2.35 |
|
Net income per share – diluted (c) | $ | 3.30 |
| | $ | 3.27 |
| | $ | 3.00 |
| | $ | 2.66 |
| | $ | 2.32 |
|
| | | | | | | | | | |
Weighted average shares – diluted (c) | 128,204 |
| | 133,813 |
| | 136,845 |
| | 139,435 |
| | 141,723 |
|
| Dividends declared per common share outstanding | $ | 1.05 |
| | $ | 0.92 |
| | $ | 0.76 |
| | $ | 0.61 |
| | $ | 0.49 |
|
| | | | | | | | | | |
| Operating Data (percent of net sales): | |
| | |
| | | | |
| | |
|
| Gross margin | 34.3 | % | | 34.3 | % | | 34.4 | % | | 34.1 | % | | 34.0 | % |
| Selling, general and administrative expenses | 22.6 | % | | 22.0 | % | | 22.0 | % | | 21.8 | % | | 22.1 | % |
| Operating income | 9.4 | % | | 10.2 | % | | 10.4 | % | | 10.3 | % | | 10.0 | % |
| Net income | 5.8 | % | | 6.4 | % | | 6.6 | % | | 6.5 | % | | 6.4 | % |
| Store, Sales and Other Data: | |
| | |
| | | | |
| | |
|
| Stores open at end of year | 1,853 |
| | 1,738 |
| | 1,488 |
| | 1,382 |
| | 1,276 |
|
Comparable store sales increase (d) | 2.7 | % | | 1.6 | % | | 3.1 | % | | 3.8 | % | | 4.8 | % |
New store sales (as a % of net sales) (e) | 5.6 | % | | 5.6 | % | | 5.6 | % | | 6.2 | % | | 5.4 | % |
| Average transaction value | $ | 44.61 |
| | $ | 44.42 |
| | $ | 44.87 |
| | $ | 44.84 |
| | $ | 44.48 |
|
Comparable store average transaction value increase (decrease) (c) | 0.5 | % | | (0.9 | )% | | (0.2 | )% | | 0.6 | % | | — | % |
Comparable store average transaction count increase (d) | 2.2 | % | | 2.6 | % | | 3.3 | % | | 3.2 | % | | 4.7 | % |
| Total selling square footage (000���s) | 28,180 |
| | 26,511 |
| | 23,938 |
| | 22,176 |
| | 20,470 |
|
| Total team members | 29,300 |
| | 26,000 |
| | 23,000 |
| | 21,100 |
| | 19,200 |
|
| Capital expenditures (000’s) | $ | 250,401 |
| | $ | 226,017 |
| | $ | 236,496 |
| | $ | 160,613 |
| | $ | 218,200 |
|
| Balance Sheet Data (at end of period): | |
| | |
| | | | |
| | |
|
Average inventory per store (f) | $ | 735.4 |
| | $ | 741.7 |
| | $ | 820.1 |
| | $ | 752.7 |
| | $ | 723.5 |
|
| Inventory turns | 3.24 |
| | 3.19 |
| | 3.23 |
| | 3.32 |
| | 3.29 |
|
Working capital (g) | $ | 806,154 |
| | $ | 740,615 |
| | $ | 768,177 |
| | $ | 670,897 |
| | $ | 677,107 |
|
| Total assets | $ | 2,868,769 |
| | $ | 2,674,942 |
| | $ | 2,370,826 |
| | $ | 2,034,571 |
| | $ | 1,903,391 |
|
Long-term debt, less current portion (h) | $ | 433,686 |
| | $ | 289,769 |
| | $ | 166,992 |
| | $ | 4,957 |
| | $ | 1,200 |
|
| Stockholders’ equity | $ | 1,418,673 |
| | $ | 1,453,218 |
| | $ | 1,393,294 |
| | $ | 1,293,561 |
| | $ | 1,246,894 |
|
(a) Our fiscal year includes 52 or 53 weeks and ends on the last Saturday of the calendar year. References to fiscal year mean the year in which that fiscal year ended. Fiscal year 2016 consisted of 53 weeks while all other fiscal years presented consisted of 52 weeks.
(b) Beginning in the fourth quarter ended December 31, 2016, selected financial and operating information includes the consolidation of Petsense, unless otherwise noted.
(c) Basic net income per share is calculated based on the weighted average number of common shares outstanding applied to net income. Diluted net income per share is calculated using the treasury stock method for stock options and restricted stock units.
(d) Comparable store metrics are calculated on an annual basis using sales generated from all stores open at least one year and all online sales, excluding certain adjustments to net sales. Beginning in fiscal 2015, stores closed during the year are removed from our comparable store metrics calculations. This change in the calculation methodology did not have a material impact on the comparable store metrics reported in prior periods presented due to the minimal number of stores closed in those periods. Stores relocated during the years being compared are not removed from our comparable store metrics. If the effect of relocated stores on our comparable store metrics becomes material, we would remove relocated stores from the calculations. Acquired Petsense stores are considered comparable stores beginning in the fourth quarter of fiscal 2017.
(e) New stores sales metrics are based on stores open for less than one year.
(f) Assumes average inventory cost, excluding inventory in-transit.
(g) Working capital for 2017, 2016 and 2015 reflects deferred tax assets as non-current as a result of the adoption of ASU 2015-17 (which is discussed in Note 15 to the Consolidated Financial Statements). Years prior to 2015 have not been adjusted to reflect the adoption of this guidance.
(h) Long-term debt includes amounts outstanding under the Company’s debt facilities and capital lease obligations, excluding the current portions.
| |
Item 7.
| Management’s Discussion and Analysis of Financial Condition and Results of Operations |
The following discussion and analysis is intended to provide the reader with information that will assist in understanding the significant factors affecting our consolidated operating results, financial condition, liquidity, and capital resources during the three-yeartwo-year period ended December 30, 201725, 2021 (our fiscal years 2017, 20162021 and 2015)2020). For a comparison of our results of operations for fiscal year December 26, 2020 and December 28, 2019, see “Part II, Item 7. Management’s Discussion and Analysis of Financial Condition and Results of Operations” of our Annual Report on Form 10-K for the fiscal year ended December 26, 2020, filed with the SEC on February 18, 2021. This discussion should be read in conjunction with our Consolidated Financial Statements and Notes to the Consolidated Financial Statements included elsewhere in this report. This discussion contains forward-looking statements.statements and information. See “Forward-Looking Statements”Statements and Information” and “Risk Factors” included elsewhere in this report.
Tractor Supply reports its financial results in accordance with accounting principles generally accepted in the United States of America (“U.S. GAAP”). Tractor Supply also uses certain non-GAAP measures that fall within the meaning of Securities and Exchange Commission Regulation G and Regulation S-K Item 10(e), which may provide users of the financial information with additional meaningful comparison to prior reported results. Non-GAAP measures do not have standardized definitions and are not defined by U.S. GAAP. Therefore, Tractor Supply’s non-GAAP measures are unlikely to be comparable to similar measures presented by other companies. The presentation of these non-GAAP measures should not be considered in isolation from, as a substitute for, or as superior to the financial information presented in accordance with U.S. GAAP. We believe this information is useful in providing period-to-period comparisons of the results of our continuing operations.
Overview
Founded in 1938, Tractor Supply Company (the “Company” or "Tractor Supply" or “we” or “our” or “us”) is the largest operator of rural lifestyle retail storesretailer in the United States (“U.S.”). The Company is focused on supplying the needs of recreational farmers, and ranchers, and othersall those who enjoy living the rural lifestyle (which we refer to as the “Out Here” lifestyle), as well as tradesmen and small businesses.. As of December 30, 2017,25, 2021, we operated 1,8532,181 retail stores in 49 states under the names Tractor Supply Company,Petsense, andDel’s Feed & Farm Supply and Petsense. We also operate websites under the names TractorSupply.com and Petsense.com.Supply. Our stores are located primarily in towns outlying major metropolitan markets and in rural communities,communities. We also operate websites under the names TractorSupply.com and theyPetsense.com as well as a Tractor Supply Company mobile application. Through our stores and e-commerce channels, we offer the following comprehensive selection of merchandise:
•Equine, livestock, pet, and small animal products, including items necessary for their health, care, growth, and containment;containment (i.e. fencing);
•Hardware, truck, towing, and tool products;
•Seasonal products, including heating, lawn and garden items, power equipment, gifts, and toys;
•Work/recreational clothing and footwear; and
•Maintenance products for agricultural and rural use.
Tractor Supply Company believes we can grow our business by being an integral part of our customers’ lives as the most dependable supplier of relevant products and services for the “"Out Here”Here" lifestyle solutions, creating customer loyalty through personalized experiences, and providing convenience that our customers expect at anytime, anywhere, and in any way they choose. Our long-term growth strategy is to: (1) drive profitable growth through new store openingsexpand and deepen our customer base by expanding omni-channel capabilities, thus tying together our website productproviding personal, localized, and memorable customer engagements by leveraging content, social media, and digital and online shopping experience,experiences, attracting new customers and driving loyalty, (2) build customer-centric engagementevolve customer experiences by leveraging analytics to deliver legendary customer service, seasoned advicedigitizing our business processes and personalized experiences,furthering our omni-channel capabilities, (3) offer relevant assortments and services across all channels through exclusive and national brands and continue to introducegrow our total addressable market by introducing new products and services through our test and learn strategy, (4) enhance our coredrive operational excellence and foundationalproductivity through continuous improvement, increasing space utilization, and implementing advanced supply chain capabilities by investing in infrastructure and process improvements which willto support growth, scale and agility, while improving the customer experience, and (5) expand through selective acquisitions, as such opportunities arise, to add complementary businesses and to enhance penetration into new and existing markets to supplement organic growth.
Achieving this strategy will require a foundational focus on: (1) organizing, optimizingconnecting, empowering and empoweringgrowing our team members for growth by developing skills, talentto enhance their lives and leadership across the organization,communities they live in, enabling them to provide legendary service to our customers, and (2) implementing operational efficiency initiativesallocating resources in a disciplined and efficient manner to drive profitable growth and build stockholder value, including leveraging technology and automation, to align our cost structure to support new business capabilities for margin improvement and cost reductions.
Over the past five years, we have experienced considerable growth in stores, growing from 1,1761,738 stores at the end of 2012fiscal 2016 to 1,8532,181 stores (1,685(2,003 Tractor Supply and Del’s retail stores and 168178 Petsense retail stores) at the end of fiscal 2017,2021, and in net sales, with a compounded annual growth rate of approximately 9.2%13.4%. Given the size of the communities that we target, we believe that there is ample opportunity for new store growth in many existing and new markets. We have developed a proven method for selecting store sites, and we believe we have identified approximately 800significant additional opportunities for new Tractor Supply stores. We also believe that there is opportunity for up to 1,000continued growth for Petsense stores.
Executive Summary
In 2017,fiscal 2021, we opened 10180 new Tractor Supply stores in 3927 states and 25seven new Petsense stores in 11four states. In 2016,fiscal 2020, we opened 11380 new Tractor Supply stores in 31 states and began operating 143nine new Petsense stores.stores in three states. This resulted in a selling square footage increase of approximately 6.3%4% in each of fiscal 20172021 and approximately 10.8% in fiscal 2016.2020.
Net sales increased 7.0%19.9% to $7.26$12.73 billion in fiscal 2017 (52 weeks)2021 from $6.78$10.62 billion in fiscal 2016 (53 weeks).2020 as we experienced significant demand for our products across all product categories, geographies and channels in fiscal 2021 as we acquired new customers who entered our markets and our existing customers focused on the care of their homes, land, and animals while navigating the COVID-19 pandemic. Comparable store sales increased 2.7%16.9% in fiscal 20172021 versus a 1.6%23.1% increase in fiscal 2016.2020. Gross profit increased 7.2%19.0% to $2.49$4.48 billion in fiscal 20172021 from $2.33$3.76 billion in fiscal 2016,2020, and gross margin remained flatdecreased 25 basis points to prior year at 34.3% as a percentage35.2% of net sales.sales in fiscal 2021 from 35.4% of net sales in fiscal 2020. Operating income decreased 80increased 88 basis points to 10.3% of net sales in fiscal 2021 from 9.4% of net sales in fiscal 2017 from 10.2% of net sales in fiscal 2016.2020. For fiscal 2017,2021, net income was $422.6$997.1 million, or $3.30$8.61 per diluted share, compared to $437.1$749.0 million, or $3.27$6.38 per diluted share, in fiscal 2016. Excluding the impact of the revaluation of the Company’s net deferred tax asset resulting in a one-time, non-cash charge of approximately $4.9 million, or $0.03 per diluted share, adjusted net income for fiscal 2017 was $427.5 million, or $3.33 per diluted share.2020.
We ended the yearfiscal 2021 with $109.1$878.0 million in cash and cash equivalents and outstanding debt of $426.1$986.4 million, after returning $503.2 million$1.04 billion to our stockholders through stock repurchases and quarterly cash dividends.
Information Regarding COVID-19 Coronavirus Pandemic
The Company has been and continues to closely monitor the impact of the COVID-19 pandemic on all facets of our business. This includes the impact on our team members, customers, suppliers, vendors, business partners, and supply chain networks.
The health and safety of our team members and customers are the primary concerns of our management team. We have taken and continue to take numerous actions to promote health and safety, including, encouraging vaccination efforts, providing personal protective equipment to our team members, following local and federal guidance regarding the use of masks in our facilities, maintaining enhanced services for cleaning and sanitation, continuing to provide additional functionality to support contactless shopping experiences, promoting social distancing in our stores, and continuing to offer remote work plans at our Store Support Center.
As further described in the results of operations, our net sales have significantly increased due to unprecedented customer demand across all major product categories, channels, and geographic regions. However, the net incremental costs of doing business during this crisis have increased as a result of the aforementioned actions we have taken to support and promote the safety and well-being of our team members and customers, and we believe some of these incremental costs will continue after the pandemic is over.
There are numerous uncertainties surrounding the pandemic and its impact on the economy and our business, as further described in the Risk Factors section under Part I Item 1A. of this Form 10-K, which make it difficult to predict the impact on our business, financial position, or results of operations in fiscal 2022 and beyond. While our stores, distribution centers, and e-commerce operations are open and plan to remain open, we cannot predict the uncertainties, or the corresponding impacts on our business, at this time.
Performance Metrics
Comparable Store Metrics
Comparable store metrics are a key performance indicator used in the retail industry and by the Company to measure the performance of the underlying business.Our comparable store metrics are calculated on an annual basis using sales generated from all stores open at least one year and all online sales and exclude certain adjustments to net sales.Stores closed during either of the years being compared are removed from our comparable store metrics calculations.Stores relocated during either of the years being compared are not removed from our comparable store metrics calculations.If the effect of relocated stores on our comparable store metrics calculations became material, we would remove relocated stores from the calculations.
Transaction Count and Transaction Value
Transaction count and transaction value metrics are used by the Company to measure sales performance.Transaction count represents the number of customer transactions during a given period.Transaction value represents the average amount paid per transaction and is calculated as net sales divided by the total number of customer transactions during a given period.
Significant Accounting Policies and Estimates
Management’s discussion and analysis of our financial position and results of operations are based upon our Consolidated Financial Statements, which have been prepared in accordance with U.S. GAAP. The preparation of these financial statements requires management to make informed estimates and judgments that affect the reported amounts of assets, liabilities, revenues and expenses, and related disclosure of contingent assets and liabilities. Our financial position and/or results of operations may be materially different when reported under different conditions or when using different assumptions in the application of such policies. In the event estimates or assumptions prove to be different from actual amounts, adjustments are made in subsequent periods to reflect more current information. Our significant accounting policies are disclosed in Note 1 to ourthe Consolidated Financial Statements. The following discussion addresses our most critical accounting policies and estimates, which are those that are both important to the portrayal of our financial condition and results of operations and that require significant judgment or use of complex estimates.
|
| | | | |
Description | | Judgments and Uncertainties | | Effect if Actual Results Differ from Assumptions |
| | | | |
Inventory Valuation: | | | | |
Inventory Impairment | | | | |
We identify potentially excess and slow-moving inventory by evaluating turn rates, historical and expected future sales trends, age of merchandise, overall inventory levels, current cost of inventory and other benchmarks. We have established an inventory valuation reserve to recognize the estimated impairment in value (i.e., an inability to realize the full carrying value) based on our aggregate assessment of these valuation indicators under prevailing market conditions and current merchandising strategies. | | We do not believe our merchandise inventories are subject to significant risk of obsolescence in the near term. However, changes in market conditions or consumer purchasing patterns could result in the need for additional reserves.
Our impairment reserve contains uncertainties because the calculation requires management to make assumptions and to apply judgment regarding forecasted customer demand and the promotional environment.
| | We have not made any material changes in the accounting methodology used to recognize inventory impairment reserves in the financial periods presented.
We do not believe there is a reasonable likelihood that there will be a material change in the future estimates or assumptions we use to calculate impairment. However, if assumptions regarding consumer demand or clearance potential for certain products are inaccurate, we may be exposed to losses or gains that could be material.
A 10% change in our impairment reserve as of December 30, 2017, would have affected net income by approximately $0.5 million in fiscal 2017.
|
Merchandise Inventory:
We identify potentially excess and slow-moving inventory by evaluating turn rates, historical and expected future sales trends, age of merchandise, overall inventory levels, current cost of inventory, and other benchmarks. We have established an inventory valuation reserve to recognize the estimated impairment in value (i.e., an inability to realize the full carrying value) based on our aggregate assessment of these valuation indicators under prevailing market conditions and current merchandising strategies.
|
| | | | |
Description | | Judgments and Uncertainties | | Effect if Actual Results Differ from Assumptions |
Shrinkage | | | | |
We perform physical inventories at least once a year for each store that has been open more than 12 months, and we have established a reserve for estimating inventory shrinkage between physical inventory counts. The reserve is established by assessing the chain-wide average shrinkage experience rate, applied to the related periods’ sales volumes. Such assessments are updated on a regular basis for the most recent individual store experiences. | | The estimated store inventory shrink rate is based on historical experience. We believe historical rates are a reasonably accurate reflection of future trends.
We also have established a reserve for estimating inventory shrinkage between physical inventory counts. The reserve is established by assessing the chain-wide average shrinkage experience rate, applied to the related periods’ sales volumes. Such assessments are updated on a regular basis for the most recent individual store experiences. Our general policy is to perform physical inventories at least once a year for each store that has been open more than twelve months.
We receive funding from substantially all of our significant merchandise vendors, in support of our business initiatives, through a variety of programs and arrangements, including guaranteed vendor support funds (“vendor support”) and volume-based rebate funds (“volume rebates”). The amounts received are subject to terms of vendor agreements, most of which are “evergreen”, reflecting the on-going relationship with our significant merchandise vendors. Certain of our agreements, primarily volume rebates, are renegotiated annually, based on expected annual purchases of the vendor’s product. Vendor funding is initially deferred as a reduction of the purchase price of inventory, and then recognized as a reduction of cost of merchandise as the related inventory is sold. During interim periods, the amount of vendor support and volume rebates are estimated based upon initial commitments and anticipated purchase levels with applicable vendors.
We do not believe our merchandise inventories are subject to significant risk of obsolescence in the near term. However, changes in market conditions or consumer purchasing patterns could result in the need for additional reserves. Our impairment reserves contain uncertainties because the calculations require management to make assumptions and to apply judgment regarding forecasted customer demand and the promotional environment. The estimated store inventory shrink rate is based on historical experience. We believe historical rates are a reasonably accurate reflection of future trends. Our shrinkage reserve contains uncertainties because the calculation requires management to make assumptions and to apply judgment regarding future shrinkage trends, the effect of loss prevention measures and new merchandising strategies. | | We have not made any material changes in the accounting methodology used to recognize shrinkage in the financial periods presented.
We do not believe there is a reasonable likelihood that there will be a material change in the future estimates or assumptions we use to calculate our shrinkage reserve. However, if our estimates regarding inventory losses are inaccurate, we may be exposed to losses or gains that could be material.
A 10% change in our shrinkage reserve as of December 30, 2017, would have affected net income by approximately $1.7 million in fiscal 2017.
|
Vendor Funding | | | | |
We receive funding from substantially all of our significant merchandise vendors, in support of our business initiatives, through a variety of programs and arrangements, including vendor support funds (“vendor support”) and volume-based rebate funds (“volume rebates”). The amounts received are subject to terms of vendor agreements, most of which are “evergreen”, reflecting the on-going relationship with our significant merchandise vendors. Certain of our agreements, primarily volume rebates, are renegotiated annually, based on expected annual purchases of the vendor’s product.
Vendor funding is initially deferred as a reduction of the purchase price of inventory, and then recognized as a reduction of cost of merchandise as the related inventory is sold.
During interim periods, the amount of vendor support and volume rebates is estimated based upon initial commitments and anticipated purchase levels with applicable vendors.
| | The estimated purchase volume (and related vendor funding) is based on our current knowledge of inventory levels, sales trends and expected customer demand, as well as planned new store openings and relocations. Although we believe we can reasonably estimate purchase volume and related volume rebates at interim periods, it is possible that actual year-end results could be different from previously estimated amounts.
Our allocation methodology contains uncertainties because the calculation requires management to make assumptions and to apply judgment regarding customer demand, purchasing activity, target thresholds, vendor attrition and collectability.
| | We have not made any material changes in the accounting methodology used to establish our vendor funding reserves in the financial periods presented.
At the end of each fiscal year, a significant portion of the actual purchase activity is known. Thus, we do not believe there is a reasonable likelihood that there will be a material change in the amounts recorded as vendor funding.
We do not believe there is a significant collectability risk related to vendor funding amounts due to us at the end of fiscal 2017.
If a 10% reserve had been applied against our outstanding vendor funding due as of December 30, 2017, net income would have been affected by approximately $1.4 million in fiscal 2017.
Although it is unlikely that there will be any significant reduction in historical levels of vendor funding, if such a reduction were to occur in future periods, the Company could experience a higher inventory balance and higher cost of sales.
|
Freight | | | | |
We incur various types of transportation and delivery costs in connection with inventory purchases and distribution. Such costs are included as a component of the overall cost of inventories (on an aggregate basis) and recognized as a component of cost of merchandise sold as the related inventory is sold. | | We allocate freight as a component of total cost of sales without regard to inventory mix or unique freight burden of certain categories. This assumption has been consistently applied for all years presented. | | We have not made any material changes in the accounting methodology used to establish our capitalized freight balance or freight allocation in the financial periods presented.
If a 10% increase or decrease had been applied against our current inventory capitalized freight balance as of December 30, 2017, net income would have been affected by approximately $7.8 million in fiscal 2017.
|
|
| | | | |
Description | | Judgments and Uncertainties | | Effect if Actual Results Differ from Assumptions |
Self-Insurance Reserves: | | | | |
We self-insure a significant portion of our employee medical insurance, workers’ compensation insurance and general liability (including product liability) insurance plans. We have stop-loss insurance policies to protect from individual losses over specified dollar values.
Provisions for losses related to our self-insured liabilities are based upon periodic independent actuarially determined estimates that consider a number of factors including historical claims experience, demographic factors and severity factors.
| | The full extent of certain claims, especially workers’ compensation and general liability claims, may not become fully determined for several years.
Our self-insured liabilities contain uncertainties because management is required to make assumptions and to apply judgment to estimate the ultimate cost to settle reported claims and claims incurred but not reported as of the balance sheet date based upon historical data and experience, including actuarial calculations.
| | We have not made any material changes in the accounting methodology used to establish our self-insurance reserves in the financial periods presented.
We do not believe there is a reasonable likelihood that there will be a material change in the assumptions we use to calculate insurance reserves. However, if we experience a significant increase in the number of claims or the cost associated with these claims, we may be exposed to losses that could be material.
A 10% change in our self-insurance reserves as of December 30, 2017, would have affected net income by approximately $3.6 million in fiscal 2017.
|
Sales Tax Audit Reserve: | | | | |
A portion of our sales are to tax-exempt customers, predominantly agricultural-based. We obtain exemption information as a necessary part of each tax-exempt transaction. Many of the states in which we conduct business will perform audits to verify our compliance with applicable sales tax laws. The business activities of our customers and the intended use of the unique products sold by us create a challenging and complex tax compliance environment. These circumstances also create some risk that we could be challenged as to the accuracy of our sales tax compliance.
When establishing our sales tax audit reserve, we review our past audit experience and assessments with applicable states to continually determine if we have potential exposure for non-compliance. Any estimated liability is based on an initial assessment of compliance risk as well as our historical experience with each respective state.
| | We continually reassess the exposure based on historical audit results, changes in policies, preliminary and final assessments made by state sales tax auditors and additional documentation that may be provided to reduce the assessment.
Our sales tax audit reserve contains uncertainties because management is required to make assumptions and to apply judgment regarding the complexity of agricultural-based exemptions, the ambiguity in state tax regulations, the number of ongoing audits and the length of time required to settle with the state taxing authorities.
| | We have not made any material changes to our sales tax audit assessment methodology in the financial periods presented.
We do not believe there is a reasonable likelihood that there will be a material change in the future estimates or assumptions we use to calculate the sales tax liability reserve. However, if our estimates regarding the ultimate sales tax liability are inaccurate, we may be exposed to losses or gains that could be material.
A 10% change in our sales tax audit reserve as of December 30, 2017, would have affected net income by approximately $0.9 million in fiscal 2017.
|
|
| | | | |
Description | | Judgments and Uncertainties | | Effect if Actual Results Differ from Assumptions |
Tax Contingencies: | | | | |
Our income tax returns are periodically audited by U.S. federal and state tax authorities. These audits include questions regarding our tax filing positions, including the timing and amount of deductions and the allocation of income among various tax jurisdictions. At any time, multiple tax years are subject to audit by the various tax authorities. In evaluating the exposures associated with our various tax filing positions, we record a liability for uncertain tax positions taken or expected to be taken in a tax return. A number of years may elapse before a particular matter, for which we have established a reserve, is audited and fully resolved or clarified. We recognize the effect of income tax positions only if those positions are more likely than not of being sustained. Recognized income tax positions are measured at the largest amount that is greater than 50% likely of being realized. Changes in recognition or measurement are reflected in the period in which the change in judgment occurs. We adjust our tax contingencies reserve and income tax provision in the period in which actual results of a settlement with tax authorities differs from our established reserve, the statute of limitations expires for the relevant tax authority to examine the tax position or when more information becomes available. | | Our tax contingencies reserve contains uncertainties because management is required to make assumptions and to apply judgment to estimate the exposures associated with our various filing positions and whether or not the minimum requirements for recognition of tax benefits have been met.
The effective income tax rate is also affected by changes in tax law, the tax jurisdiction of new stores or business ventures, the level of earnings and the results of tax audits.
| | We have not made any material changes in the accounting methodology used to establish our tax contingencies in the financial periods presented.
We do not believe there is a reasonable likelihood that there will be a material change in the reserves established for tax benefits not recognized.
Although management believes that the judgments and estimates discussed herein are reasonable, actual results could differ, and we may be exposed to losses or gains that could be material.
To the extent we prevail in matters for which reserves have been established, or are required to pay amounts in excess of our reserves, our effective income tax rate in a given financial statement period could be materially affected. An unfavorable tax settlement would require use of our cash and would result in an increase in our effective income tax rate in the period of resolution. A favorable tax settlement would be recognized as a reduction in our effective income tax rate in the period of resolution.
A 10% change in our uncertain tax position reserve as of December 30, 2017, would have affected net income by approximately $0.1 million in fiscal 2017.
|
|
| | | | |
Description | | Judgments and Uncertainties | | Effect if Actual Results Differ from Assumptions |
Impairment of Long-Lived Assets: | | | | |
Long-lived assets are evaluated for impairment whenever events or changes in circumstances indicate that the carrying value may not be recoverable.
When evaluating long-lived assets for potential impairment, we first compare the carrying value of the asset to the asset’s estimated future cash flows (undiscounted and without interest charges). The evaluation for long-lived assets is performed at the lowest level of identifiable cash flows, which is generally the individual store level. The significant assumptions used to determine estimated undiscounted cash flows include cash inflows and outflows directly resulting from the use of those assets in operations, including margin on net sales, payroll and related items, occupancy costs, insurance allocations and other costs to operate a store.
If the estimated future cash flows are less than the carrying value of the asset, we calculate an impairment loss. The impairment loss calculation compares the carrying value of the asset to the asset’s estimated fair value, which may be based on an estimated future cash flow model. We recognize an impairment loss if the amount of the asset’s carrying value exceeds the asset’s estimated fair value. If we recognize an impairment loss, the adjusted carrying amount of the asset becomes its new cost basis. For a depreciable long-lived asset, the new cost basis will be depreciated (amortized) over the remaining estimated useful life of that asset.
| | Our impairment loss calculations contain uncertainties because they require management to make assumptions and to apply judgment to estimate future cash flows and asset fair values.
| | We have not made any material changes in our impairment loss assessment methodology in the financial periods presented.
We do not believe there is a reasonable likelihood that there will be a material change in the estimates or assumptions we use to calculate long-lived asset impairment losses. None of these estimates and assumptions are significantly sensitive, and a 10% change in any of these estimates would not have a material impact on our analysis. However, if actual results are not consistent with our estimates and assumptions used in estimating future cash flows and asset fair values, we may be exposed to losses that could be material.
|
|
| | | | |
Description | | Judgments and Uncertainties | | Effect if Actual Results Differ from Assumptions |
Impairment of Goodwill and Other Indefinite-Lived Intangible Assets: | | | | |
Goodwill and other indefinite-lived intangible assets are evaluated for impairment annually, or whenever events or changes in circumstances indicate that the carrying value may not be recoverable.
In accordance with the accounting standards, an entity has the option first to assess qualitative factors to determine whether events and circumstances indicate that it is more likely than not that goodwill or an indefinite-lived intangible asset is impaired. If after such assessment an entity concludes that the asset is not impaired, then the entity is not required to take further action. However, if an entity concludes otherwise, then it is required to determine the fair value of the asset using a quantitative impairment test, and if impaired, the associated assets must be written down to fair value.
The quantitative impairment test for goodwill compares the fair value of a reporting unit with the carrying value of its net assets, including goodwill. If the fair value of the reporting unit is less than the carrying value of the reporting unit, an impairment charge would be recorded to the Company’s operations, for the amount, if any, in which the carrying amount exceeds the reporting unit’s fair value. We determine fair values for each reporting unit using the market approach, when available and appropriate, or the income approach, or a combination of both. If multiple valuation methodologies are used, the results are weighted appropriately.
The quantitative impairment test for other indefinite-lived intangible assets involves comparing the carrying amount of the asset to the sum of the discounted cash flows expected to be generated by the asset. If the implied fair value of the indefinite-lived intangible asset is less than the carrying value, an impairment charge would be recorded to the Company’s operations.
| | Our impairment loss calculation contains uncertainties because they require management to make assumptions and to apply judgment to qualitative factors as well as estimate future cash flows and asset fair values, including forecasting prospective financial information and selecting the discount rate that reflects the risk inherent in future cash flows.
| | The valuation approaches utilized to estimate fair value for the purposes of the impairment tests of goodwill and other indefinite-lived intangible assets require the use of assumptions and estimates, which involve a degree of uncertainty. If actual results are not consistent with our estimates and assumptions used in estimating future cash flows and asset fair values, we may be exposed to non-cash impairment losses that could be material.
|
Quarterly Financial Data
Our unaudited quarterly operating results for each fiscal quarter of 2017 and 2016 are shown below (in thousands, except per share amounts):
|
| | | | | | | | | | | | | | | | | | | | |
| | | First
Quarter | | Second
Quarter
| | Third
Quarter
| | Fourth Quarter | | Total |
| 2017 | | (13 weeks) | | (13 weeks) | | (13 weeks) | | (13 weeks) | | (52 weeks) |
| Net sales | | $ | 1,564,078 |
| | $ | 2,017,762 |
| | $ | 1,721,704 |
| | $ | 1,952,838 |
| | $ | 7,256,382 |
|
| Gross profit | | 518,203 |
| | 704,708 |
| | 600,456 |
| | 668,598 |
| | 2,491,965 |
|
| Operating income | | 96,362 |
| | 257,925 |
| | 148,253 |
| | 183,842 |
| | 686,382 |
|
| Net income | | 60,311 |
| | 160,649 |
| | 91,896 |
| | 109,743 |
| | 422,599 |
|
| | | | | | | | | | | |
| Net income per share: | | |
| | |
| | |
| | |
| | |
|
| Basic | | $ | 0.46 |
| | $ | 1.25 |
| | $ | 0.73 |
| | $ | 0.87 |
| | $ | 3.31 |
|
| Diluted | | $ | 0.46 |
| | $ | 1.25 |
| | $ | 0.72 |
| | $ | 0.87 |
| | $ | 3.30 |
|
| | | | | | | | | | | |
Comparable store sales (decrease) increase (a) | | (2.2 | )% | | 2.2 | % | | 6.6 | % | | 4.0 | % | | 2.7 | % |
|
| | | | | | | | | | | | | | | | | | | | |
| | | First
Quarter | | Second
Quarter
| | Third
Quarter
| | Fourth
Quarter
| | Total |
2016 (b) | | (13 weeks) | | (13 weeks) | | (13 weeks) | | (14 weeks) | | (53 weeks) |
| Net sales | | $ | 1,467,797 |
| | $ | 1,852,534 |
| | $ | 1,542,706 |
| | $ | 1,916,542 |
| | $ | 6,779,579 |
|
| Gross profit | | 494,444 |
| | 649,222 |
| | 535,274 |
| | 646,262 |
| | 2,325,202 |
|
| Operating income | | 108,195 |
| | 249,249 |
| | 142,020 |
| | 194,616 |
| | 694,080 |
|
| Net income | | 67,668 |
| | 156,425 |
| | 89,444 |
| | 123,583 |
| | 437,120 |
|
| | | | | | | | | | | |
| Net income per share: | | |
| | |
| | |
| | |
| | |
|
| Basic | | $ | 0.51 |
| | $ | 1.17 |
| | $ | 0.67 |
| | $ | 0.94 |
| | $ | 3.29 |
|
| Diluted | | $ | 0.50 |
| | $ | 1.16 |
| | $ | 0.67 |
| | $ | 0.94 |
| | $ | 3.27 |
|
| | | | | | | | | | | |
Comparable store sales increase (decrease) (a) | | 4.9 | % | | (0.5 | )% | | (0.6 | )% | | 3.1 | % | | 1.6 | % |
(a)Comparable store metrics are calculated using sales generated from all stores open at least one year and all online sales, excluding certain adjustments to net sales. Closed stores are removed from our comparable store metrics calculations. Stores relocated during the periods being compared are not removed from our comparable store metrics. If the effect of relocated storesloss prevention measures and merchandising strategies.
For vendor funding, we estimate the purchase volume (and related vendor funding) based on our comparablecurrent knowledge of inventory levels, sales trends and expected customer demand, as well as planned new store metrics becomesopenings and relocations. Although we believe we can reasonably estimate purchase volume and related volume rebates at interim periods, it is possible that actual year-end results could be different from previously estimated amounts. Our allocation methodology contains uncertainties because the calculation requires management to make assumptions and to apply judgment regarding customer demand, purchasing activity, target thresholds, vendor attrition and collectability.
We have not made any material changes in the accounting methodology used to recognize inventory impairment reserves or shrinkage in the financial periods presented. We do not believe there is a reasonable likelihood that there will be a material change in the future estimates or assumptions we use to calculate impairment or shrinkage. However, if assumptions regarding consumer demand, clearance potential or inventory loss for certain products are inaccurate, we may be exposed to losses or gains that could be material. A 10% change in our inventory impairment reserve as of December 25, 2021, would remove relocated storeshave affected net income by approximately $1.3 million in fiscal 2021. A 10% change in our shrinkage reserve as of December 25, 2021, would have affected net income by approximately $4.2 million in fiscal 2021.
We have not made any material changes in the accounting methodology used to establish our vendor funding reserves in the financial periods presented. At the end of each fiscal year, a significant portion of the actual purchase activity is known. Thus, we do not believe there is a reasonable likelihood that there will be a material change in the amounts recorded as vendor funding. We do not believe there is a significant collectability risk related to vendor funding amounts due to us at the end of fiscal 2021. If a 10% reserve had been applied against our outstanding vendor funding due as of December 25, 2021, net income would have been affected by approximately $2.3 million in fiscal 2021. Although it is unlikely that there will be any significant reduction in historical levels of vendor funding, if such a reduction were to occur in future periods, the Company could experience a higher inventory balance and higher cost of sales.
Self-Insurance Reserves:
We self-insure a significant portion of our workers’ compensation insurance and general liability (including product liability) insurance plans. We have stop-loss insurance policies to protect from individual losses over specified dollar values. Provisions for losses related to our self-insured liabilities are based upon periodic independent actuarially determined estimates that consider a number of factors including historical claims experience, loss development factors, and severity factors.
The full extent of certain workers’ compensation and general liability claims may not become fully determined for several years. Our self-insured liabilities contain uncertainties because management is required to make assumptions and to apply judgment to estimate the ultimate cost to settle reported claims and claims incurred but not reported as of the balance sheet date based upon historical data and experience, including actuarial calculations.
We have not made any material changes in the accounting methodology used to establish our self-insurance reserves in the financial periods presented. We do not believe there is a reasonable likelihood that there will be a material change in the assumptions we use to calculate insurance reserves. However, if we experience a significant increase in the number of claims or the cost associated with these claims, we may be exposed to losses that could be material. A 10% change in our self-insurance reserves as of December 25, 2021, would have affected net income by approximately $8.4 million in fiscal 2021.
Impairment of Long-Lived Assets:
Long-lived assets, including lease right-of-use assets, are evaluated for impairment whenever events or changes in circumstances indicate that the carrying value may not be recoverable. When evaluating long-lived assets for potential impairment, we first compare the carrying value of the asset or asset group to its estimated undiscounted future cash flows. The evaluation for long-lived assets is performed at the lowest level of identifiable cash flows, which is generally the individual store level. The significant assumptions used to determine estimated undiscounted cash flows include cash inflows and outflows directly resulting from the calculations. Acquired Petsense storesuse of those assets in operations, including margin on net sales, payroll and related items, occupancy costs, insurance allocations, and other costs to operate a store. If the estimated future cash flows are considered comparable stores beginningless than the carrying value of the related asset, we calculate an impairment loss. The impairment loss calculation compares the carrying value of the related asset or asset group to its estimated fair value, which may be based on an estimated future cash flow model, market valuation, or other valuation technique, as appropriate. We recognize an impairment loss if the amount of the asset’s carrying value exceeds the asset’s estimated fair value. If we recognize an impairment loss, the adjusted carrying amount of the asset becomes its new cost basis. For a depreciable long-lived asset, the new cost basis will be depreciated (amortized) over the remaining estimated useful life of that asset.
Our impairment loss calculations contain uncertainties because they require management to make assumptions and to apply judgment to estimate future cash flows and asset fair values.
We have not made any material changes in our impairment loss assessment methodology in the fourth quarter of fiscal 2017.financial periods presented.
(b)Beginning
We do not believe there is a reasonable likelihood that there will be a material change in the fourth quarter ended December 31, 2016, selectedestimates or assumptions we use to calculate long-lived asset impairment losses. None of these estimates and assumptions are significantly sensitive, and a 10%
change in any of these estimates would not have a material impact on our analysis. However, if actual results are not consistent with our estimates and assumptions used in estimating future cash flows and asset fair values, we may be exposed to losses that could be material.
There were no significant long-lived assets impairment charges recognized in fiscal 2021.
Impairment of Goodwill and Other Indefinite-Lived Intangible Assets:
Goodwill and other indefinite-lived intangible assets are evaluated for impairment annually, or whenever events or changes in circumstances indicate that the carrying value may not be recoverable. In accordance with the accounting standards, an entity has the option first to assess qualitative factors to determine whether events and circumstances indicate that it is more likely than not that goodwill or an indefinite-lived intangible asset is impaired. If after such assessment an entity concludes that the asset is not impaired, then the entity is not required to take further action. However, if an entity concludes otherwise, then it is required to determine the fair value of the asset using a quantitative impairment test, and if impaired, the associated assets must be written down to fair value.
The quantitative impairment test for goodwill compares the fair value of a reporting unit with the carrying value of its net assets, including goodwill. If the fair value of the reporting unit is less than the carrying value of the reporting unit, an impairment charge would be recorded to the Company’s operations, for the amount in which the carrying amount exceeds the reporting unit’s fair value. We determine fair values for each reporting unit using the market approach, when available and appropriate, the income approach, or a combination of both. The income approach involves forecasting projected financial information (such as revenue growth rates, profit margins, tax rates, and operatingcapital expenditures) and selecting a discount rate that reflects the risk inherent in estimated future cash flows. Under the market approach, the fair value is based on observed market data. If multiple valuation methodologies are used, the results are weighted appropriately.
The quantitative impairment test for other indefinite-lived intangible assets involves comparing the carrying amount of the asset to the sum of the discounted cash flows expected to be generated by the asset. If the implied fair value of the indefinite-lived intangible asset is less than the carrying value, an impairment charge would be recorded to the Company’s operations.
Our impairment loss calculation contains uncertainties because they require management to make assumptions and to apply judgment to qualitative factors as well as estimate future cash flows and asset fair values, including forecasting projected financial information includesand selecting the consolidationdiscount rate that reflects the risk inherent in future cash flows.
The valuation approaches utilized to estimate fair value for the purposes of Petsense, unless otherwise noted.the impairment tests of goodwill and other indefinite-lived intangible assets require the use of assumptions and estimates, which involve a degree of uncertainty. If actual results are not consistent with our estimates and assumptions used in estimating future cash flows and asset fair values, we may be exposed to non-cash impairment losses that could be material.
There were no goodwill or other indefinite-lived intangible assets impairment charges recognized in fiscal 2021.
Results of Operations
The following table sets forth, for the periods indicated, certain items in ourthe Consolidated Statements of Income expressed as a percentage of net sales.
| | | | | | | | | | | | | |
| Fiscal Year |
|
| | 2021 | | 2020 | | |
| Net sales | 100.00 | % | | 100.00 | % | | |
Cost of merchandise sold (a) | 64.83 | | | 64.58 | | | |
Gross margin (a) | 35.17 | | | 35.42 | | | |
Selling, general and administrative expenses (a) | 22.78 | | | 23.34 | | | |
| Depreciation and amortization | 2.12 | | | 2.04 | | | |
| Impairment of goodwill and other intangible assets | — | | | 0.65 | | | |
| Operating income | 10.26 | | | 9.39 | | | |
| Interest expense, net | 0.21 | | | 0.27 | | | |
| Income before income taxes | 10.05 | | | 9.12 | | | |
| Income tax expense | 2.22 | | | 2.07 | | | |
| Net income | 7.83 | % | | 7.05 | % | | |
|
| | | | | | | | |
| | 2017 | | 2016 | | 2015 |
| Net sales | 100.0 | % | | 100.0 | % | | 100.0 | % |
Cost of merchandise sold (a) | 65.7 |
| | 65.7 |
| | 65.6 |
|
Gross margin (a) | 34.3 |
| | 34.3 |
| | 34.4 |
|
Selling, general and administrative expenses (a) | 22.6 |
| | 22.0 |
| | 22.0 |
|
| Depreciation and amortization | 2.3 |
| | 2.1 |
| | 2.0 |
|
| Operating income | 9.4 |
| | 10.2 |
| | 10.4 |
|
| Interest expense, net | 0.2 |
| | 0.1 |
| | — |
|
| Income before income taxes | 9.2 |
| | 10.1 |
| | 10.4 |
|
| Income tax provision | 3.4 |
| | 3.7 |
| | 3.8 |
|
| Net income | 5.8 | % | | 6.4 | % | | 6.6 | % |
(a)Our gross margin amounts may not be comparable to those of other retailers since some retailers include all of the costs related to their distribution facility network in cost of merchandise sold and others (like our Company) exclude a portion of these distribution facility network costs from gross margin and instead include them in selling, general, and administrative expenses; refer to Note 1 – Significant Accounting Policies of the Notes to the Consolidated Financial Statements, included in Item 8 Financial Statements and Supplementary Data, of this Annual Report on Form 10-K.
Fiscal 20172021 Compared to Fiscal 20162020
Net sales increased 7.0%19.9% to $7.26$12.73 billion in fiscal 20172021 from $6.78$10.62 billion in fiscal 2016. The prior year included an extra sales week as a part of the Company’s 53-week calendar in 2016, which negatively impacted the overall sales increase by approximately 1.6 percentage points.2020. Comparable store sales for fiscal 2017 were $6.85increased 16.9% to $12.43 billion versus a 2.7% increase over fiscal 2016. This compares to a 1.6% comparable store sales23.1% increase in the prior year.fiscal 2020. The comparable store average transaction countvalue increased 2.2%9.8% and comparable store average tickettransaction count increased 0.5%7.1% for fiscal 2017.2021, as compared to an increase of 12.2% and 10.9% in fiscal 2020, respectively.
Comparable store metrics are calculated on an annual basis usingOur sales generated from all stores open at least one year and all online sales, excluding certain adjustmentsperformance continued to net sales. Stores closed during the year are removed from our comparable store metrics calculations. Stores relocated during the years being compared are not removed from our comparable store metrics. If the effect of relocated stores on our comparable store metrics becomes material, we would remove relocated storesbenefit from the calculations. Acquired Petsense stores are considered comparable beginningshift of consumer behavior trends due to the COVID-19 pandemic as customers focused on the care of their homes, land, and animals, targeted investments in marketing to increase our unaided brand awareness, and other key initiatives to enhance customers' shopping experience, including the fourth quarterrelaunch of fiscal 2017.
Thethe Neighbor's Club loyalty program. These factors led to growth in new customer acquisition and increased spend from existing customers, which further resulted in an increase in comparable store sales increase was driven by an increase in traffic counts and the year-round strength of consumable, usable and edible ("C.U.E.") products, primarily animal- and pet-related merchandise. Warmer than normal weather patterns early in the first quarter negatively impacted the sales of winter seasonal items and winter storms in March had an unfavorable impact on the start to the spring selling season. Beginning in the second quarter, we experienced broad-based improvement through the remainder of the year inacross all geographic regions and major product categories, driven by strengthrobust growth for everyday merchandise, including C.U.E. products, and solid demand for seasonal categories. In addition, the Company’s e-commerce sales experienced double-digit percentage growth in sales of everyday basic items in C.U.E. and year-round products. The third quarter experienced an additional benefit from an extended spring and summer selling season and strong sales of emergency response products relatedfiscal 2021 as compared to hurricanes during the quarter while the fourth quarter experienced an additional benefit from solid sales in cold weather and other seasonal products.fiscal 2020.
In addition to comparable store sales growth in fiscal 2017,2021, sales from stores opened less than one year including Petsense, were $405.0$324.6 million in fiscal 2017,2021, which represented 6.03.1 percentage points of the 7.0%19.9% increase over fiscal 2016 net sales. Sales from stores opened less than one year, including Petsense, were $378.9 million in fiscal 2016, which represented 6.1 percentage points of the 8.9% increase over fiscal 2015 net sales.
The following table summarizes our store growth during fiscal 2017 and 2016:
|
| | | | | |
| Tractor Supply | 2017 | | 2016 |
| Store count, beginning of period | 1,595 |
| | 1,488 |
|
| New stores opened | 101 |
| | 113 |
|
| Stores closed | (11 | ) | | (6 | ) |
| Store count, end of period | 1,685 |
| | 1,595 |
|
| Petsense | | | |
| Beginning of period | 143 |
| | — |
|
| Stores acquired | — |
| | 136 |
|
| New stores opened | 25 |
| | 8 |
|
| Stores closed | — |
| | (1 | ) |
| End of period | 168 |
| | 143 |
|
| Consolidated end of period | 1,853 |
| | 1,738 |
|
| | | | |
| Stores relocated | 3 |
| | 3 |
|
The following table indicates the percentage of net sales represented by each of our major product categories during fiscal 2017 and 2016:
|
| | | | | |
| | Percent of Net Sales |
| Product Category: | 2017 | | 2016 |
| Livestock and Pet | 47 | % | | 46 | % |
| Hardware, Tools and Truck | 22 |
| | 22 |
|
| Seasonal, Gift and Toy Products | 19 |
| | 19 |
|
| Clothing and Footwear | 8 |
| | 8 |
|
| Agriculture | 4 |
| | 5 |
|
| Total | 100 | % | | 100 | % |
Gross profit increased 7.2% to $2.49 billion in fiscal 2017 compared to $2.33 billion in fiscal 2016. As a percent of net sales, gross margin remained flat to prior year at 34.3%. Gross margin percentage was negatively impacted by higher markdowns on cold weather merchandise and targeted promotional activity in the first quarter, as well as a higher freight expense throughout the year due to higher carrier costs, increased average fuel costs and a shift in product mix towards more freight intensive products. These declines in gross margin were offset by strong sell-through rates and solid price and inventory management, particularly in the back half of the year.
Total selling, general and administrative (“SG&A”) expenses, including depreciation and amortization, for fiscal 2017 increased 10.7% to $1.81 billion from $1.63 billion in fiscal 2016. SG&A expenses, as a percent of net sales, increased 80 basis points to 24.9% in fiscal 2017 from 24.1% in fiscal 2016. The increase in SG&A as a percent of net sales was primarily attributable to higher store payroll from wage inflation and our continued effort to enhance customer service, increased incentive compensation at the store level from the strong year-over-year growth in comparable store sales, the deleverage of occupancy and other fixed costs resulting from the integration of Petsense expenses and the 53rd week of sales in fiscal 2016 that did not reoccur in fiscal 2017, and investments in infrastructure and technology to support our strategic long-term growth initiatives.
Our effective tax rate increased to 37.2% for fiscal 2017 compared to 36.5% in fiscal 2016. On December 22, 2017, the U.S. government enacted comprehensive tax legislation commonly referred to as the Tax Cut and Jobs Act (the “Act”). The Act makes broad and complex changes to the U.S. tax code including, but not limited to, a reduction of the federal income tax rate from 35% to 21% effective for tax years beginning after December 31, 2017. We have made a reasonable estimate of the effects of the Act on our existing deferred tax balances as of December 30, 2017, and recognized a provisional amount of $4.9 million, which is included as a component of income tax expense from continuing operations. However, we are still analyzing certain aspects of the Act and refining our calculations, which could potentially affect the measurement of these balances in future periods. Excluding the impacts of the Act, our effective income tax rate in 2017 would have been 36.4%.
For fiscal 2017, net income was $422.6 million, or $3.30 per diluted share, compared to $437.1 million, or $3.27 per diluted share, in fiscal 2016. Excluding the impact of the revaluation of the Company’s net deferred tax asset resulting in a one-time, non-cash charge of approximately $4.9 million, or $0.03 per diluted share, adjusted net income for fiscal 2017 was $427.5 million, or $3.33 per diluted share. Adjusted net income is a non-GAAP measure which has been provided in order to enhance comparability for the periods presented.
During fiscal 2017, we repurchased approximately 5.9 million shares of the Company’s common stock at a total cost of $369.4 million as part of our $3 billion share repurchase program. In fiscal 2016, we repurchased approximately 4.4 million shares at a total cost of $331.7 million.
Fiscal 2016 Compared to Fiscal 2015
Net sales increased 8.9% to $6.78 billion in fiscal 2016 from $6.23 billion in fiscal 2015. The fourth quarter included an extra sales week as a part of the Company’s 53-week calendar in 2016, which represented 1.6 percentage points of the overall 8.9% sales increase over prior year. Comparable store sales for fiscal 2016 were $6.41 billion, a 1.6% increase over fiscal 2015. This compares to a 3.1% comparable store sales increase in the prior year. The comparable store transaction count increased 2.6%, while comparable store average ticket decreased 0.9% for fiscal 2016.
Comparable store metrics are calculated on an annual basis using sales generated from all stores open at least one year and all online sales, excluding certain adjustments to net sales. Stores closed during the year are removed from our comparable store metrics calculations. Stores relocated during the years being compared are not removed from our comparable store metrics. If
the effect of relocated stores on our comparable store metrics becomes material, we would remove relocated stores from the calculations. Petsense stores are not considered comparable stores until 12 months after the date of acquisition.
The comparable store sales increase was driven by an increase in traffic counts and the year-round strength of C.U.E. products, principally animal- and pet-related merchandise. Livestock equipment and hardline products such as fencing and trailers also performed well throughout the year. The full year sales performance was negatively impacted by unpredictable weather patterns during the spring selling season and unseasonably warm weather in the key cold months of the year which drove softness in cold weather seasonal categories and big ticket items such as log splitters and stoves. Additionally, the Company believes that economic conditions in the energy producing markets negatively impacted consumer spending primarily in the Midwest and South Central regions.
In addition to comparable store sales growth in fiscal 2016, sales from stores opened less than one year, including Petsense, were $378.9 million in fiscal 2016, which represented 6.1 percentage points of the 8.9% increase over fiscal 20152020 net sales. Sales from stores opened less than one year were $351.0$355.3 million in fiscal 2015,2020, which represented 6.14.3 percentage points of the 9.0%27.2% increase over fiscal 20142019 net sales.
The following table summarizes our store growth during fiscal 20162021 and 2015:2020:
| | | | | | | | | | | | | | |
| | Fiscal Year |
| |
| Store Count Information: | | 2021 | | 2020 |
| Tractor Supply | | | | |
| Beginning of period | | 1,923 | | | 1,844 | |
| New stores opened | | 80 | | | 80 | |
| Stores closed | | — | | | (1) | |
| End of period | | 2,003 | | | 1,923 | |
| Petsense | | | | |
| Beginning of period | | 182 | | | 180 | |
| New stores opened | | 7 | | | 9 | |
| Stores closed | | (11) | | | (7) | |
| End of period | | 178 | | | 182 | |
| Consolidated end of period | | 2,181 | | | 2,105 | |
| | | | |
| Stores relocated | | 3 | | | 1 | |
|
| | | | | |
| Tractor Supply | 2016 | | 2015 |
| Store count, beginning of period | 1,488 |
| | 1,382 |
|
| New stores opened | 113 |
| | 114 |
|
| Stores closed | (6 | ) | | (8 | ) |
| Store count, end of period | 1,595 |
| | 1,488 |
|
| Petsense | | | |
| Beginning of period | — |
| | — |
|
| Stores acquired | 136 |
| | — |
|
| New stores opened | 8 |
| | — |
|
| Stores closed | (1 | ) | | — |
|
| End of period | 143 |
| | — |
|
| Consolidated end of period | 1,738 |
| | 1,488 |
|
| | | | |
| Stores relocated | 3 |
| | 6 |
|
The following table indicates the percentage of net sales represented by each of our major product categories during fiscal 20162021 and 2015:2020:
| | | | | | | | | | | | | | |
| | | Percent of Net Sales |
| | Fiscal Year |
| Product Category: | | 2021 | | 2020 |
| Livestock and Pet | | 47 | % | | 47 | % |
| Hardware, Tools and Truck | | 21 | | | 21 | |
| Seasonal, Gift and Toy Products | | 21 | | | 21 | |
| Clothing and Footwear | | 8 | | | 7 | |
| Agriculture | | 3 | | | 4 | |
| Total | | 100 | % | | 100 | % |
|
| | | | | |
| | Percent of Net Sales |
| Product Category: | 2016 | | 2015 |
| Livestock and Pet | 46 | % | | 44 | % |
| Hardware, Tools and Truck | 22 |
| | 23 |
|
| Seasonal, Gift and Toy Products | 19 |
| | 20 |
|
| Clothing and Footwear | 8 |
| | 8 |
|
| Agriculture | 5 |
| | 5 |
|
| Total | 100 | % | | 100 | % |
Gross profit increased 8.5%19.0% to $2.33$4.48 billion in fiscal 20162021 compared to $2.14$3.76 billion in fiscal 2015.2020. As a percent of net sales, gross margin decreased 1025 basis points to 34.3%35.2% for fiscal 20162021 compared to 34.4%35.4% for fiscal 2015. This2020. The decrease in gross margin as a percentage principally reflects aof net sales was primarily driven by higher product cost inflation, higher transportation costs driven by increased pressures on domestic freight, import freight, and rising fuel prices, and product mix ofshift towards C.U.E. products, which generally carry below chain average grossrun at a slightly lower margin partiallyrate. Partially offsetting the decrease was the Company's price management program and limited promotional and clearance activity, which effectively offset by benefits from our key margin driving initiatives. Freight expense as a percentsignificant portion of net sales experienced a marginal increase in fiscal 2016 as compared to the prior year due principally to an increase in inbound milesinflation and domestic transportation costs, partially offset by lower diesel fuel pricespressures.
Total selling, general and import container costs.
administrative (“SG&A&A”) expenses, including depreciation and amortization as a percent of net salesand asset impairment, increased 10 basis points14.7% to 24.1%$3.17 billion in fiscal 20162021 from 24.0%$2.76 billion in fiscal 2015.2020. SG&A expenses, as a percent of net sales, increased dueimproved 113 basis points to incremental costs associated with our
new distribution facilities that began operations24.9% in late fiscal 2015, as well as acquisition and operating2021 from 26.0% in fiscal 2020. The SG&A expenses associated within fiscal 2020 were impacted by discrete non-cash impairment charges for the Petsense purchase. These increases werebusiness of $74.1 million due primarily to a strategic reassessment of the business and a decision to reduce the number of new store openings planned over the long term and, to a lesser extent, the impairment of long-lived assets at underperforming locations.On an adjusted basis, excluding the impact of the discrete impairment charges in the prior year, SG&A expenses increased 17.8% to $3.17 billion in fiscal 2021 from $2.69 billion in fiscal 2020. On an adjusted basis, SG&A expenses, as a percent of net sales, improved 43 basis points to 24.9% in fiscal 2021 from 25.3% in fiscal 2020. The improvement in SG&A as a percent as net sales was primarily attributable to strong leverage in occupancy and other fixed costs from the increase in comparable store sales and lower COVID-19 pandemic response costs. COVID-19 pandemic response costs in fiscal 2021 of $63.3 million consisted of sick pay, benefits, and other health and safety related expenses, as compared to $117.1 million in fiscal 2020. The leverage from these SG&A expenses was partially offset by leverage of occupancy costs fromhigher store wage rates, additional store labor hours, and investment in the 53rd week of sales in fiscal 2016, as well as lower year-over-year incentive compensation expense. Total SG&A expenses, including depreciation and amortization, for fiscal 2016 increased 9.3% to $1.63 billion from $1.49 billion in fiscal 2015. The increase in SG&A expenses primarily reflects new store growth, incremental costs from operating the new distribution facilities, variable costs associated with our comparable store sales growth and the extra sales week during the year and incremental expenses associated with the Petsense acquisition and its operations.Company's strategic initiatives.
Our effective income tax rate decreased to 36.5%22.1% for fiscal 20162021 compared to 36.6%22.6% in fiscal 2015.2020. The primary drivers for the decrease in the Company's effective income tax rate were additional benefits from share-based compensation, a reduction in
disallowed executive compensation, and increases in available tax credits, partially offset by a small increase in the Company's provision for state taxes.
Net income in fiscal 2021 was due principally to the availability of federal and state tax incentives.
As a result of the foregoing factors, net income for fiscal 2016 increased 6.5% to $437.1$997.1 million, or $3.27$8.61 per diluted share, as compared to net income of $410.4$749.0 million, or $3.00$6.38 per diluted share, in fiscal 2015.2020. The aforementioned non-cash impairment expense related to the Petsense business had an after-tax impact on fiscal 2020 net income of approximately $57.3 million or $0.49 per diluted share. On an adjusted basis, considering the after-tax impact of the non-cash impairment charges related to the Petsense business, net income was $806.2 million, or $6.87 per diluted share, for fiscal 2020. Adjusted net income and adjusted net income per diluted share are non-GAAP measures which have been provided in order to enhance comparability for the periods presented given that the impairment charges related to the Petsense business are non-recurring in nature. A reconciliation of these non-GAAP financial measures is included in the following table.
Reconciliation of Non-GAAP Financial Measures
(in thousands, except per share amounts)
| | | | | | | | | | | | | | | | | |
| Fiscal 2020 | Impairment (a) | Fiscal 2020 |
| (As Reported) | | (Adjustment) | | (As Adjusted) |
| | | | | |
| SG&A (including depreciation and amortization and asset impairment) | $ | 2,764,621 | | | $ | (74,051) | | | $ | 2,690,570 | |
| | | | | |
| Operating income | $ | 996,928 | | | $ | 74,051 | | | $ | 1,070,979 | |
| | | | | |
| Income before income taxes | $ | 968,147 | | | $ | 74,051 | | | $ | 1,042,198 | |
| | | | | |
| Income tax expense | $ | 219,189 | | | $ | 16,765 | | | $ | 235,954 | |
| | | | | |
| Net income | $ | 748,958 | | | $ | 57,286 | | | $ | 806,244 | |
| | | | | |
| Diluted net income per share | $ | 6.38 | | | $ | 0.49 | | | $ | 6.87 | |
(a) Comprised of $68.97 million of impairment of goodwill and other intangible assets along with $5.08 million of impairment of other long-lived assets related to the Petsense reporting unit
During fiscal 2016,2021, we repurchased approximately 4.4 million shares of the Company’s common stock at a total cost of $331.7$798.9 million as part of our $3 billion share repurchase program. In fiscal 2015,2020, we repurchased approximately 3.4 million shares at a total cost of $292.7$343.0 million. Shares repurchased in fiscal 2020 were impacted by the temporary suspension of our share repurchase program from March 12, 2020 until November 5, 2020, in order to strengthen our liquidity and preserve cash while navigating the COVID-19 pandemic.
Fiscal 2018 Outlook2020 Compared to Fiscal 2019
Our guidance for fiscal 2018 anticipates net sales of $7.69 billion to $7.77 billion, reflectingFor a comparable store sales increase of 2.0% to 3.0% as well as the opening of approximately 80 Tractor Supply stores and 20 Petsense stores. At the mid-pointcomparison of our guidance range, we anticipate that operating profit as a percentageperformance and financial metrics for the fiscal years ended December 26, 2020 and December 28, 2019, see “Part II, Item 7. Management’s Discussion and Analysis of net sales will decrease from 9.4% inFinancial Condition and Results of Operations” of our Annual Report on Form 10-K for the fiscal 2017 to 8.8% in fiscal 2018. Included in this estimate are anticipated cost pressures associatedyear ended December 26, 2020, filed with rising diesel fuel prices and transportation costs, wage investments for our team members in our stores and distribution centers, investments to support our growth strategy, and incremental pre-opening and other operating expenses from our new distribution center which is currently under construction in Frankfort, New York. Lastly, as a result of the Act reducing the statutory federal income tax rate from 35% to 21%, our effective tax rate in fiscal 2018 is expected to range from 23.0% to 23.5%. As a result of the foregoing factors, we estimate net income for fiscal 2018 of $490 million to $515 million, or $3.95 to $4.15 per diluted share.SEC on February 18, 2021.
Liquidity and Capital Resources
In addition to normal operating expenses and expenses associated with COVID-19, our primary ongoing cash requirements are for new store expansion, existing store remodeling and relocation programs,improvements, store relocations, distribution facility capacity and improvements, information technology, inventory purchases, repayment of
existing borrowings under our debt facilities, share repurchases, cash dividends, and selective acquisitions as opportunities arise.
Our primary ongoing sources of liquidity are existing cash balances, cash provided from operations, remaining funds available under our debt facilities, capitaloperating and operatingfinance leases, and normal trade credit. Our inventory and accounts payable levels typically build in the first and third fiscal quarters to support the higher sales volume of the spring and cold-weather selling seasons, respectively.
We believe that our existing cash balances, expected cash flow from future operations, funds available under our debt facilities, operating and capitalfinance leases, and normal trade credit will be sufficient to fund our operations, including expenses associated with COVID-19, and our capital expenditure needs, including new store openings, existing store acquisitions,remodeling and improvements,
store relocations, and renovations and distribution facility capacity and improvements, and information technology improvements through the end of fiscal 2018.2022. We are not aware of any trends or events that would materially affect our capital requirements or liquidity.
Working Capital
At December 30, 2017,25, 2021, the Company had working capital of $806.2 million,$1.19 billion, which increased $65.6decreased $329.3 million from December 31, 2016.fiscal 2020. The shifts in working capital were attributable to changes in the following components of current assets and current liabilities (in millions):
| | | | | | | | | | | | | | | | | |
| | December 25, 2021 | | December 26, 2020 | | Variance |
| Current assets: | | | | | |
| Cash and cash equivalents | $ | 878.0 | | | $ | 1,341.8 | | | $ | (463.8) | |
| | | | | |
| Inventories | 2,191.2 | | | 1,783.3 | | | 407.9 | |
| Prepaid expenses and other current assets | 164.1 | | | 133.6 | | | 30.5 | |
| Income taxes receivable | 17.1 | | | — | | | 17.1 | |
| | | | | |
| Total current assets | 3,250.4 | | | 3,258.7 | | | (8.3) | |
| Current liabilities: | | | | | |
| Accounts payable | 1,155.6 | | | 976.1 | | | 179.5 | |
| Accrued employee compensation | 109.6 | | | 119.7 | | | (10.1) | |
| Other accrued expenses | 474.4 | | | 324.8 | | | 149.6 | |
| | | | | |
| Current portion of finance lease obligations | 3.9 | | | 4.6 | | | (0.7) | |
| Current portion of operating lease obligations | 321.3 | | | 298.7 | | | 22.6 | |
| Income taxes payable | — | | | 19.9 | | | (19.9) | |
| | | | | |
| Total current liabilities | 2,064.8 | | | 1,743.8 | | | 321.0 | |
| Working capital | $ | 1,185.6 | | | $ | 1,514.9 | | | $ | (329.3) | |
|
| | | | | | | | | | | |
| | 2017 | | 2016 | | Variance |
| Current assets: | | | | | |
| Cash and cash equivalents | $ | 109.1 |
| | $ | 53.9 |
| | $ | 55.2 |
|
| Inventories | 1,453.2 |
| | 1,369.7 |
| | 83.5 |
|
| Prepaid expenses and other current assets | 88.3 |
| | 90.6 |
| | (2.3 | ) |
| Income taxes receivable | 4.8 |
| | 3.6 |
| | 1.2 |
|
| Total current assets | 1,655.4 |
| | 1,517.8 |
| | 137.6 |
|
| Current liabilities: | |
| | |
| | |
|
| Accounts payable | 576.6 |
| | 519.5 |
| | 57.1 |
|
| Accrued employee compensation | 31.6 |
| | 25.2 |
| | 6.4 |
|
| Other accrued expenses | 201.7 |
| | 215.7 |
| | (14.0 | ) |
| Current portion of long-term debt | 25.0 |
| | 10.0 |
| | 15.0 |
|
| Current portion of capital lease obligation | 3.5 |
| | 1.3 |
| | 2.2 |
|
| Income taxes payable | 10.8 |
| | 5.5 |
| | 5.3 |
|
| Total current liabilities | 849.2 |
| | 777.2 |
| | 72.0 |
|
| Working capital | $ | 806.2 |
| | $ | 740.6 |
| | $ | 65.6 |
|
In comparison to December 31, 2016,26, 2020, working capital as of December 30, 201725, 2021 was impacted most significantly by changes in our cash inventory and cash equivalents, inventories, accounts payable.payable and other accrued expenses.
•The decrease in cash balance increasedand cash equivalents was primarily duedriven by share repurchases, capital expenditures to strong inventory turns at the end of fiscal 2017 stemming from the sale of cold weather seasonal merchandise.support strategic growth, and cash dividends to stockholders.
•The increase in inventories resulted from an increase in average inventory per store driven by our commitment to support our strong sales trends, along with the impact of inflation and the purchase of additional inventory to support new store growth.
•The increase in accounts payable resulted from the purchase of additional inventory to support new store growth. We actively manage our inventory balancesgrowth and in-stock levels at our stores. Average inventory per store decreased slightly year-over-year principallystrong sales volume trends.
•Other accrued expenses increased primarily due to an improvementincreases in inventory turns of seasonalfreight and cold-weather merchandise atother payables due to the end of fiscal 2017 as compared to fiscal 2016.growth in sales.
Accounts payable increased primarily as a result of new store growth along with timing of payments to vendors.
Debt
The following table summarizes the Company’s outstanding debt as of the dates indicated (in millions):
| | | | | | | | | | | | | | | | |
| | December 25,
2021 | | December 26,
2020 | | |
| 1.75% Senior Notes due 2030 | | $ | 650.0 | | | $ | 650.0 | | | |
| 3.70% Senior Notes due 2029 | | 150.0 | | | 150.0 | | | |
| Senior Credit Facility: | | | | | | |
| November 2020 Term Loan | | 200.0 | | | 200.0 | | | |
| Revolving credit loans | | — | | | — | | | |
| Total outstanding borrowings | | 1,000.0 | | | 1,000.0 | | | |
| Less: unamortized debt issuance costs | | (13.6) | | | (15.7) | | | |
| Total debt | | 986.4 | | | 984.3 | | | |
| Less: current portion of long-term debt | | — | | | — | | | |
| Long-term debt | | $ | 986.4 | | | $ | 984.3 | | | |
| | | | | | |
| Outstanding letters of credit | | $ | 52.9 | | | $ | 48.7 | | | |
|
| | | | | | | | |
| | | December 30,
2017 | | December 31,
2016 |
| Senior Notes | | $ | 150.0 |
| | $ | — |
|
| Senior Credit Facility: | | | | |
| February 2016 Term Loan | | 180.0 |
| | 190.0 |
|
| June 2017 Term Loan | | 97.5 |
| | — |
|
| Revolving credit loans | | — |
| | 85.0 |
|
| Total outstanding borrowings | | 427.5 |
| | 275.0 |
|
| Less: unamortized debt issuance costs | | (1.4 | ) | | (1.1 | ) |
| Total debt | | 426.1 |
| | 273.9 |
|
| Less: current portion of long-term debt | | (25.0 | ) | | (10.0 | ) |
| Long-term debt | | $ | 401.1 |
| | $ | 263.9 |
|
| | | | | |
| Outstanding letters of credit | | $ | 39.6 |
| | $ | 44.3 |
|
Senior Notes
On August 14, 2017,October 30, 2020, the Company entered intoissued and sold, in a note purchase and private shelf agreement (the “Note Purchase Agreement”), pursuant to which the Company agreed to sell $150public offering, $650 million in aggregate principal amount of senior unsecured notes due August 14, 2029 (the “2029 Notes”) in a private placement. The 2029 Notes bearNovember 1, 2030 bearing interest at 3.70%1.75% per annum with interest payable semi-annually in arrears on each annual and semi-annual anniversary(the “1.75% Senior Notes”). In support of the issuance date. The obligations under the Note Purchase Agreement are unsecured, but guaranteed by each of the Company’s material subsidiaries.1.75% Senior Notes, we obtained credit ratings from Moody's Investor Services and Standard & Poor's.
The Company may from timeWe manage our business and financial ratios to time issuetarget an investment-grade bond rating, which has historically allowed flexible access to financing at reasonable market costs. As of December 25, 2021, and sell additional senior unsecured notes (the “Shelf Notes”) pursuant to the Note Purchase Agreement, in an aggregate principal amount of up to $150 million. The Shelf Notes will have a maturity date of no more than 12 years after the date of original issuancethis filing, February 17, 2022, the Company's senior unsecured debt is rated “Baa1,” by Moody’s Investor Services with a stable outlook and “BBB” by Standard & Poor’s with a stable outlook. These ratings have been obtained with the understanding that Moody’s Investors Services and Standard & Poor’s will continue to monitor our credit and make future adjustments to these ratings to the extent warranted. The ratings are not a recommendation to buy, sell or hold our securities, may be issued through August 14, 2020, unless earlier terminated in accordance with the terms of the Note Purchase Agreement.
Pursuant to the Note Purchase Agreement, the 2029 Notes and any Shelf Notes (collectively, the "Notes") are redeemable by the Company, in wholechanged, superseded or withdrawn at any time and should be evaluated independently of any other rating.
Our current ratings, as well as future rating agency actions, could impact our ability to finance our operations on satisfactory terms and affect our financing costs. There can be no assurance that we will maintain or in part from time to time, at 100% of the principal amount of the Notes being redeemed, together with accrued and unpaid interest thereon and a make whole amount calculated by discounting all remaining scheduled payments on the Notes by the yield on the U.S. Treasury security with a maturity equal to the remaining average life of the Notes plus 0.50%.improve our current credit ratings.
Senior Credit Facility
On February 19, 2016, the Company entered into a senior credit facility (the “2016 Senior Credit Facility”) consisting of a $200 million term loan (the “February 2016 Term Loan”) andWe also maintain a $500 million revolving credit facility (the “Revolver”) under the senior credit facility (the "Senior Credit Facility") with a sublimit of $50 million for swingline loans. This agreement is unsecured. On February 16, 2018, the maturity date was extended from February 19, 2021 to February 19, 2022.
On June 15, 2017, pursuant to an accordion feature available under the 2016 Senior Credit Facility, the Company entered into an incremental term loan agreement (the “June 2017 Term Loan”) which increased the term loan capacity under the 2016 Senior Credit Facility by $100 million. This agreement is unsecuredloans and matures on June 15, 2022.
The February 2016 Term Loan of $200 million requires quarterly payments totaling $10 million per year in years one and two and $20 million per year in years three through the maturity date, with the remaining balance due in full on the maturity date of February 19, 2022. The June 2017 Term Loan of $100 million requires quarterly payments totaling $5 million per year in years one and two and $10 million per year in years three through the maturity date, with the remaining balance due in full on the maturity date of June 15, 2022. The 2016 Senior Credit Facility also contains a $500 million revolving credit facility (with a sublimit of $50$150 million for swingline loans).letters of credit.
Borrowings under the February 2016 Term Loan and Revolver bear interest at either the bank’s base rate (4.500% at December 30, 2017) or the London Inter-Bank Offer Rate (“LIBOR”) (1.564% at December 30, 2017) plus anFor additional amount ranging from 0.500% to 1.125% per annum (0.750% at December 30, 2017), adjusted quarterly based on our leverage ratio. The Company is also required to pay, quarterly in arrears, a commitment fee for unused capacity ranging from 0.075% to 0.200% per annum (0.125% at December 30, 2017), adjusted quarterly based oninformation about the Company’s leverage ratio. Borrowings under the June 2017 Term Loan bear interest at either the bank’s base rate (4.500% at December 30, 2017) or LIBOR (1.564% at December 30, 2017) plus an additional 1.000% per annum. As further described indebt and credit facilities, refer to Note 64 to the Consolidated Financial Statements, the Company has entered into interest rate swap agreements in order to hedge our exposure to variable rate interest payments associated with each of the term loans under the 2016 Senior Credit Facility.Statements.
Proceeds from the 2016 Senior Credit Facility may be used for working capital, capital expenditures, dividends, share repurchases, and other matters. There are no compensating balance requirements associated with the 2016 Senior Credit Facility.
Covenants and Default Provisions of the Debt Agreements
The 2016 Senior Credit Facility and the Note Purchase Agreement (collectively, the “Debt Agreements”) require quarterly compliance with respect to two material covenants: a fixed charge coverage ratio and a leverage ratio. Both ratios are calculated on a trailing twelve-month basis at the end of each fiscal quarter. The fixed charge coverage ratio compares earnings before interest, taxes, depreciation, amortization, share-based compensation and rent expense (“consolidated EBITDAR”) to the sum of interest paid and rental expense (excluding any straight-line rent adjustments). The fixed charge coverage ratio shall be greater than or equal to 2.00 to 1.0 as of the last day of each fiscal quarter. The leverage ratio compares rental expense (excluding any straight-line rent adjustments) multiplied by a factor of six plus total debt to consolidated EBITDAR. The leverage ratio shall be less than
or equal to 4.00 to 1.0 as of the last day of each fiscal quarter. The Debt Agreements also contain certain other restrictions regarding additional indebtedness, capital expenditures, business operations, guarantees, investments, mergers, consolidations and sales of assets, transactions with subsidiaries or affiliates, and liens. As of December 30, 2017, the Company was in compliance with all debt covenants.
The Debt Agreements contain customary events of default, including payment defaults, breaches of representations and warranties, covenant defaults, cross-defaults to other material indebtedness, certain events of bankruptcy and insolvency, material judgments, certain ERISA events and invalidity of loan documents. Upon certain changes of control, payment under the Debt Agreements could become due and payable. In addition, under the Note Purchase Agreement, upon an event of default or change of control, the make whole payment described above may become due and payable.
The Note Purchase Agreement also requires that, in the event the Company amends its 2016 Senior Credit Facility, or any subsequent credit facility of $100 million or greater, such that it contains covenant or default provisions that are not provided in the Note Purchase Agreement or that are similar to those contained in the Note Purchase Agreement but which contain percentages, amounts, formulas or grace periods that are more restrictive than those set forth in the Note Purchase Agreement or are otherwise more beneficial to the lenders thereunder, the Note Purchase Agreement shall be automatically amended to include such additional or amended covenants and/or default provisions.
Interest Rate Swaps
The Company entered into an interest rate swap agreement which became effective on March 31, 2016, with a maturity date of February 19, 2021. The notional amount of this swap agreement began at $197.5 million (the principal amount of the February 2016 Term Loan borrowings as of March 31, 2016) and will amortize at the same time and in the same amount as the February 2016 Term Loan borrowings as described in Note 5 to the Consolidated Financial Statements, up to the maturity date of the interest rate swap agreement on February 19, 2021. As of December 30, 2017, the notional amount of the interest rate swap was $180.0 million.
The Company entered into a second interest rate swap agreement which became effective on June 30, 2017, with a maturity date of June 15, 2022. The notional amount of this swap agreement began at $100 million (the principal amount of the June 2017 Term Loan borrowings as of June 30, 2017) and will amortize at the same time and in the same amount as the June 2017 Term Loan borrowings as described in Note 5 to the Consolidated Financial Statements. As of December 30, 2017, the notional amount of the interest rate swap was $97.5 million.
The Company’s interest rate swap agreements are executed for risk management and are not held for trading purposes. The objective of the interest rate swap agreements is to mitigate interest rate risk associated with future changes in interest rates. To accomplish this objective, the interest rate swap agreements are intended to hedge the variable cash flows associated with the variable rate term loan borrowings under the 2016 Senior Credit Facility. Both interest rate swap agreements entitle the Company to receive, at specified intervals, a variable rate of interest based on LIBOR in exchange for the payment of a fixed rate of interest throughout the life of the agreement, without exchange of the underlying notional amount.
Sources and Uses of Cash
Our primary source of liquidity is cash provided by operations and funds available under our debt facilities. Principal uses of cash for investing activities are capital expenditures and selective acquisitions, while principal uses of cash for financing activities are repurchase of the Company’s common stock and cash dividends paid to stockholders.
The following table presents a summary of cash flows provided by or used in operating, investing, and financing activities for the last three fiscal years 2021 and 2020 (in millions):
| | | | | | | | | | | |
| Fiscal Year |
| | 2021 | | 2020 |
| (52 weeks) | | (52 weeks) |
| Net cash provided by operating activities | $ | 1,138.7 | | | $ | 1,394.5 | |
| Net cash used in investing activities | (627.3) | | | (292.2) | |
| Net cash (used in)/provided by financing activities | (975.1) | | | 155.2 | |
| Net (decrease)/increase in cash and cash equivalents | $ | (463.7) | | | $ | 1,257.5 | |
|
| | | | | | | | | | | |
| | 2017 | | 2016(a) | | 2015(a) |
| | (52 weeks) | | (53 weeks) | | (52 weeks) |
| Net cash provided by operating activities | $ | 631.5 |
| | $ | 650.7 |
| | $ | 456.2 |
|
| Net cash used in investing activities | (238.0 | ) | | (369.3 | ) | | (235.9 | ) |
| Net cash used in financing activities | (338.3 | ) | | (291.3 | ) | | (207.6 | ) |
| Net increase (decrease) in cash and cash equivalents | $ | 55.2 |
| | $ | (9.9 | ) | | $ | 12.7 |
|
(a) As a result of the adoption of ASU 2016-09 (discussed in Note 15 to the Consolidated Financial Statements), excess tax benefits on stock options exercised are no longer presented as a separate line item in the statement of cash flows. The presentation of fiscal 2016 and fiscal 2015 have been adjusted to conform to the current presentation.
Operating Activities
Operating activities provided net cash of $631.5 million, $650.7 million$1.14 billion and $456.2 million$1.39 billion in fiscal 2017, 20162021 and 2015,2020, respectively. The $19.2$255.8 million decrease in net cash provided by operating activities in fiscal 20172021, compared to fiscal 20162020, was due to changes in the following (in millions):
| | | | | | | | | | | | | | | | | |
| Fiscal Year | | Variance |
| |
| | 2021 | | 2020 | |
| (52 weeks) | | (52 weeks) | |
| Net income | $ | 997.1 | | | $ | 749.0 | | | $ | 248.1 | |
| Depreciation and amortization | 270.2 | | | 217.1 | | | 53.1 | |
| Impairment expense | — | | | 74.1 | | | (74.1) | |
| Share-based compensation expense | 47.6 | | | 37.3 | | | 10.3 | |
| Deferred income taxes | 29.1 | | | (31.7) | | | 60.8 | |
| Inventories and accounts payable | (228.4) | | | 152.6 | | | (381.0) | |
| Prepaid expenses and other current assets | (30.5) | | | (32.8) | | | 2.3 | |
| Accrued expenses | 127.8 | | | 152.4 | | | (24.6) | |
| Income taxes | (37.0) | | | 14.0 | | | (51.0) | |
| Other, net | (37.2) | | | 62.5 | | | (99.7) | |
| Net cash provided by operating activities | $ | 1,138.7 | | | $ | 1,394.5 | | | $ | (255.8) | |
|
| | | | | | | | | | | |
| | 2017 | | 2016(a) | | Variance |
| | (52 weeks) | | (53 weeks) | | |
| Net income | $ | 422.6 |
| | $ | 437.1 |
| | $ | (14.5 | ) |
| Depreciation and amortization | 165.8 |
| | 143.0 |
| | 22.8 |
|
| Share-based compensation expense | 29.2 |
| | 23.6 |
| | 5.6 |
|
| Deferred income taxes | 26.7 |
| | 10.0 |
| | 16.7 |
|
| Inventories and accounts payable | (26.5 | ) | | 14.8 |
| | (41.3 | ) |
| Prepaid expenses and other current assets | 2.3 |
| | 1.8 |
| | 0.5 |
|
| Accrued expenses | (3.9 | ) | | 2.1 |
| | (6.0 | ) |
| Income taxes | 4.2 |
| | 11.8 |
| | (7.6 | ) |
| Other, net | 11.1 |
| | 6.5 |
| | 4.6 |
|
| Net cash provided by operating activities | $ | 631.5 |
|
| $ | 650.7 |
| | $ | (19.2 | ) |
(a) As a result of the adoption of ASU 2016-09 (discussed in Note 15 to the Consolidated Financial Statements), excess tax benefits on stock options exercised are no longer presented as a separate line item in the statement of cash flows. The presentation of fiscal 2016 has been adjusted to conform to the current presentation.
The $19.2$255.8 million decrease in net cash provided by operating activities in fiscal 20172021, compared withto fiscal 20162020, is primarily reflects thedriven by a significant increase in inventory and timing of receiptspayments and payments in relation to inventory and accounts payableaccruals, partially offset by increased depreciation and amortization due to new store growth and investments in information technology and infrastructure.
The $194.5 millionan increase in our net cash provided by operating activities in fiscal 2016 over fiscal 2015 was due to changes in the following (in millions):income.
|
| | | | | | | | | | | |
| | 2016(a) | | 2015(a) | | Variance |
| | (53 weeks) | | (52 weeks) | | |
| Net income | $ | 437.1 |
| | $ | 410.4 |
| | $ | 26.7 |
|
| Depreciation and amortization | 143.0 |
| | 123.6 |
| | 19.4 |
|
| Stock compensation expense | 23.6 |
| | 19.4 |
| | 4.2 |
|
| Deferred income taxes | 10.0 |
| | (5.5 | ) | | 15.5 |
|
| Inventories and accounts payable | 14.8 |
| | (112.5 | ) | | 127.3 |
|
| Prepaid expenses and other current assets | 1.8 |
| | (21.1 | ) | | 22.9 |
|
| Accrued expenses | 2.1 |
| | 16.9 |
| | (14.8 | ) |
| Income taxes payable | 11.8 |
| | 16.3 |
| | (4.5 | ) |
| Other, net | 6.5 |
| | 8.7 |
| | (2.2 | ) |
| Net cash provided by operating activities | $ | 650.7 |
| | $ | 456.2 |
| | $ | 194.5 |
|
(a) As a result of the adoption of ASU 2016-09 (discussed in Note 15 to the Consolidated Financial Statements), excess tax benefits on stock options exercised are no longer presented as a separate line item in the statement of cash flows. The presentation of fiscal 2016 and fiscal 2015 has been adjusted to conform to the current presentation.
The $194.5 million increase in net cash provided by operating activities in fiscal 2016 compared with fiscal 2015 primarily reflects incremental profitability and the impact of effective management of inventory and accounts payable levels. Average inventory per store decreased year-over-year principally due to an improvement in inventory turns of seasonal and cold-weather merchandise at the end of fiscal 2016 compared to fiscal 2015. Additionally, the timing of payments to vendors more closely aligned with receipt of inventory at the end of fiscal 2016 in comparison with the end of fiscal 2015, resulting in an improvement in cash flow year-over-year.
Investing Activities
Investing activities used cash of $238.0 million, $369.3$627.3 million and $235.9$292.2 million in fiscal 2017, 20162021 and 2015,2020, respectively. Fiscal 2016 had a significantThe $335.1 million increase in net cash outflow fromused in investing activities relatedprimarily reflects an increase in capital expenditures in fiscal 2021 compared to the acquisition of Petsense. Other than cash flows related to the acquisition of Petsense, cash flows from investingfiscal 2020.
Investing activities, in the years presented are primarily composed ofincluding capital expenditures. Capital expenditures, for fiscal 2017, 20162021 and 20152020 were as follows (in millions):
| | | | | | | | | | Fiscal Year | | Variance |
| | 2017 | | 2016 | | 2015 | |
| | (52 weeks) | | (53 weeks) | | (52 weeks) | | 2021 | | 2020 | |
| | | (52 weeks) | | (52 weeks) | |
| Existing stores | | Existing stores | $ | 326.9 | | | $ | 73.7 | | | $ | 253.2 | |
| Information technology | $ | 82.1 |
| | $ | 40.5 |
| | $ | 35.8 |
| Information technology | 124.8 | | | 133.0 | | | (8.2) | |
| Distribution center capacity and improvements | | Distribution center capacity and improvements | 93.3 | | | 23.4 | | | 69.9 | |
| New and relocated stores and stores not yet opened | 79.3 |
| | 111.2 |
| | 96.7 |
| New and relocated stores and stores not yet opened | 73.0 | | | 58.8 | | | 14.2 | |
| Distribution center capacity and improvements | 45.8 |
| | 21.0 |
| | 80.2 |
| |
| Existing stores | 43.0 |
| | 53.1 |
| | 23.1 |
| |
| Corporate and other | 0.2 |
| | 0.2 |
| | 0.7 |
| Corporate and other | 10.4 | | | 5.1 | | | 5.3 | |
| | Total capital expenditures | $ | 250.4 |
| | $ | 226.0 |
| | $ | 236.5 |
| Total capital expenditures | $ | 628.4 | | | $ | 294.0 | | | $ | 334.4 | |
| Proceeds from sale of property and equipment | | Proceeds from sale of property and equipment | (1.1) | | | (1.8) | | | 0.7 | |
| Net cash used in investing activities | | Net cash used in investing activities | $ | 627.3 | | | $ | 292.2 | | | $ | 335.1 | |