Review
UNITED STATES SECURITIES AND EXCHANGE COMMISSION
WASHINGTON, D.C. 20549
FORM 10-K
☒ ANNUAL REPORT PURSUANT TO SECTION 13 OR 15(d) OF THE SECURITIES EXCHANGE ACT OF 1934
For the fiscal year ended December 31, 20212023
OR
☐ TRANSITION REPORT PURSUANT TO SECTION 13 OR 15(d) OF THE SECURITIES EXCHANGE ACT OF 1934
Commission File Number 0-24000
| | | | | | | | |
| ERIE INDEMNITY COMPANY | |
| (Exact name of registrant as specified in its charter) | |
| | | | | | | | | | | | | | |
| Pennsylvania | | 25-0466020 | |
| (State or other jurisdiction of | | (IRS Employer | |
| incorporation or organization) | | Identification No.) | |
| | | | | | | | | | | | | | | | | | | | |
| 100 Erie Insurance Place, | Erie, | Pennsylvania | | 16530 | |
| (Address of principal executive offices) | | (Zip Code) | |
| | | | | | | | | | | |
| 814 | 870-2000 | |
| (Registrant’s telephone number, including area code) | |
Securities registered pursuant to Section 12(b) of the Act:
| | | | | | | | | | | | | | | | | |
| Class A common stock, | stated value $0.0292 per share | | ERIE | | NASDAQ Stock Market, LLC |
| (Title of each class) | | (Trading Symbol) | | (Name of each exchange on which registered) |
Securities registered pursuant to Section 12(g) of the Act: None
Indicate by check mark if the registrant is a well-known seasoned issuer, as defined in Rule 405 of the Securities Act. Yes ☒ No ☐
Indicate by check mark if the registrant is not required to file reports pursuant to Section 13 or Section 15(d) of the Act. Yes ☐ No ☒
No ☒
Indicate by check mark whether the registrant (1) has filed all reports required to be filed by Section 13 or 15(d) of the Securities Exchange Act of 1934 during the preceding 12 months (or for such shorter period that the registrant was required to file such reports), and (2) has been subject to such filing requirements for the past 90 days. Yes ☒ No ☐
Indicate by check mark whether the registrant has submitted electronically every Interactive Data File required to be submitted pursuant to Rule 405 of Regulation S-T during the preceding 12 months (or for such shorter period that the registrant was required to submit such files). Yes ☒ No ☐
Indicate by check mark whether the registrant is a large accelerated filer, an accelerated filer, a non-accelerated filer, smaller reporting company, or an emerging growth company. See the definitions of "large accelerated filer," "accelerated filer," "smaller reporting company," and "emerging growth company" in Rule 12b-2 of the Exchange Act. (Check one):
| | | | | | | | | | | | | | | | | | | | | | | | | | |
| Large accelerated filer | ☒ | | Accelerated filer | ☐ | | Non-accelerated filer | ☐ | |
| | | | | | | | |
| Smaller reporting company | ☐ | | Emerging growth company | ☐ | | | | |
If an emerging growth company, indicate by check mark if the registrant has elected not to use the extended transition period for complying with any new or revised financial accounting standards provided pursuant to Section 13(a) of the Exchange Act. ☐
☐
Indicate by check mark whether the registrant has filed a report on and attestation to its management’s assessment of the effectiveness of its internal control over financial reporting under Section 404(b) of the Sarbanes-Oxley Act (15 U.S.C. 7262(b)) by the registered public accounting firm that prepared or issued its audit report. ☒
☒
If securities are registered pursuant to Section 12(b) of the Act, indicate by check mark whether the financial statements of the registrant included in the filing reflect the correction of an error to previously issued financial statements. ☐
Indicate by check mark whether any of those error corrections are restatements that required a recovery analysis of incentive-based compensation received by any of the registrant's executive officers during the relevant recovery period pursuant to §240.10D-1 (b). ☐
Indicate by check mark whether the registrant is a shell company (as defined in Rule 12b-2 of the Exchange Act). Yes ☐ No ☒
Aggregate market value of voting and non-voting common stock held by non-affiliates as of the last business day of the registrant's most recently completed second fiscal quarter: $4.9$5.3 billion of Class A non-voting common stock as of June 30, 2021.2023. There is no active market for the Class B voting common stock. The Class B common stock is closely held by few shareholders.
Indicate the number of shares outstanding of each of the registrant's classes of common stock, as of the latest practicable date:
46,189,068 shares of Class A common stock and 2,542 shares of Class B common stock outstanding on February 18, 2022.20, 2024.
DOCUMENTS INCORPORATED BY REFERENCE
Portions of Part III of this Form 10-K (Items 10, 11, 12, 13, and 14) are incorporated by reference to the information statement on Schedule 14C to be filed with the Securities and Exchange Commission no later than 120 days after December 31, 2021.2023.
INDEX
| | | | | | | | | | | |
| PART | ITEM NUMBER AND CAPTION | PAGE |
| | | | |
| | | | |
| | | |
| | | | |
| | | | |
| | | |
| | | | |
| | | | |
| | | | |
| | | | |
| | | | |
| | | |
| | | | |
| | | | |
| | | | |
| | | | |
| | | | |
| | | | |
| | | | |
| | | | |
| | | | |
| | | |
| | | | |
| | | | |
| | | | |
| | | | |
| | | | |
| | | | |
| | | |
| | | | |
| | | | |
| | | | |
PART I
ITEM 1. BUSINESS
General
Erie Indemnity Company ("Indemnity", "we", "us", "our") is a publicly held Pennsylvania business corporation that has since its incorporation in 1925 served as the attorney-in-fact for the subscribers (policyholders) at the Erie Insurance Exchange ("Exchange"). The Exchange, which also commenced business in 1925, is a Pennsylvania-domiciled reciprocal insurer that writes property and casualty insurance. The Exchange has wholly owned property and casualty subsidiaries including: Erie Insurance Company, Erie Insurance Company of New York, Erie Insurance Property & Casualty Company and Flagship City Insurance Company, and a wholly owned life insurance company, Erie Family Life Insurance Company ("EFL").
Our primary function as attorney-in-fact is to perform policy issuance and renewal services on behalf of the subscribers at the Exchange. We also act as attorney-in-fact on behalf of the subscribers at the Exchange with respect to all claims handling and investment management services, as well as the service provider for all claims handling, life insurance, and investment management services for itsthe Exchange's insurance subsidiaries, collectively referred to as "administrative services". Acting as attorney-in-fact in these two capacities is done in accordance with a subscriber's agreement (a limited power of attorney) executed individually by each subscriber (policyholder), which appoints usIndemnity as their commoneach subscriber's attorney-in-fact to transact certain business on their behalf. Pursuant toIn accordance with the subscriber’s agreement for acting as attorney-in-fact in these two capacities, we earnretain a management fee calculated as a percentage, not to exceed 25%, of the direct and affiliated assumed premiums written by the Exchange. The management fee rate is set at least annually by our Board of Directors. The process of setting the management fee rate includes, but is not limited to, the evaluation of current year operating results compared to both prior year and industry estimated results for both Indemnity and the Exchange, and consideration of several factors for both entities including:including, but not limited to: their relative financial strength and capital position; projected revenue, expense and earnings for the subsequent year; future capital needs; as well as competitive position.
Services
The policy issuance and renewal services we provide toon behalf of the subscribers at the Exchange are related to the sales, underwriting and issuance of policies. The sales related services we provide include agent compensation and certain sales and advertising support services. Agent compensation includes scheduled commissions to agents based upon premiums written as well as additional commissions and bonuses to agents,incentive compensation, which areis earned by achieving targeted measures. Agent compensation comprised approximately 66%67% of our 20212023 policy issuance and renewal expenses. The underwriting services we provide include underwriting and policy processing and comprised approximately 10%9% of our 20212023 policy issuance and renewal expenses. The remaining services we provide include customer service and administrative support. We also provide information technology services that support all the functions listed above that comprised approximately 11% of our 20212023 policy issuance and renewal expenses. Included in these expenses are allocations of costs for departments that support these policy issuance and renewal functions.
By virtue ofConsistent with its legal structure as a reciprocal insurer, the Exchange does not have any employees or officers. Therefore, it enters into contractual relationships by and through anthe subscribers' attorney-in-fact. Indemnity serves as the attorney-in-fact on behalf of the subscribers at the Exchange with respect to its administrative services.services as enumerated in the subscriber's agreement. The Exchange's insurance subsidiaries also utilize Indemnity for these services in accordance with the service agreements between each of the subsidiaries and Indemnity. Claims handling services include costs incurred in the claims process, including the adjustment, investigation, defense, recording and payment functions. Life insurance management services include costs incurred in the management and processing of life insurance business. Investment management services are related to investment trading activity, accounting and all other functions attributable to the investment of funds. Included in these expenses are allocations of costs for departments that support these administrative functions. The subscriber's agreement and service agreements provide for reimbursement of amounts incurred for these services to Indemnity. Reimbursements are reimbursed to Indemnitysettled at cost in accordance with the subscriber's agreement and the service agreements.cost. State insurance regulations require that intercompany service agreements and any material amendments be approved in advance by the state insurance department.
Erie Insurance Exchange
As our primary purpose is to manage the affairs at the Exchange for the benefit of the subscribers (policyholders) through the policy issuance and renewal services and administrative services, the Exchange is our sole customer. Our earnings are largely generated from management fees based on the direct and affiliated assumed premiums written by the Exchange. We have no direct competition in providing these services to the Exchange.
The Exchange generates revenue by insuring preferred and standard risks, with personal lines comprising 70% of the 20212023 direct and affiliated assumed written premiums and commercial lines comprising the remaining 30%. The principal personal
lines products are private passenger automobile and homeowners. The principal commercial lines products are commercial multi-peril, commercial automobile and workers compensation. Historically, due to policy renewal and sales patterns, the Exchange's direct and affiliated assumed written premiums aretend to be greater in the second and third quarters than in the first and fourth quarters of the calendar year.
The Exchange is represented by independent agencies that serve as its sole distribution channel. In addition to their principal role as salespersons, the independent agents play a significant role as underwriting and service providers and are an integral part of the Exchange's success.
Our results of operations are tied to the growth and financial condition of the Exchange. If any events occurred that impaired the Exchange's ability to grow or sustain its financial condition, including but not limited to reduced financial strength ratings, disruption in the independent agency relationships, significant catastrophe losses, or products not meeting customer demands, the Exchange could find it more difficult to retain its existing business and attract new business. A decline in the business of the Exchange almost certainly wouldcould have as a consequence a decline in the total premiums paid and a correspondingly adverse effect on the amount of the management fees we receive. We also have an exposure to a concentration of credit risk related to the unsecured receivables due from the Exchange for itsnet management fee and costother reimbursements. See Part II, Item 8. "Financial Statements and Supplementary Data - Note 15, Concentrations of Credit Risk, of Notes to Financial Statements" contained within this report. See the risk factors related to our dependency on the growth and financial condition of the Exchange in Item 1A. "Risk Factors" contained within this report.
Competition
Our primary function as attorney-in-fact is to perform policy issuance and renewal services on behalf of the subscribers at the Exchange. We also act as attorney-in-fact on behalf of the subscribers at the Exchange, as well as the service provider for itsthe Exchange's insurance subsidiaries, with respect to all administrative services. There are a limited number of companies that provide services under a reciprocal insurance exchange structure. We do not directly compete against other such companies, given we are appointed by the subscribers at the Exchange to provide these services.
The direct and affiliated assumed premiums written by the Exchange drive our management fee, which is our primary source of revenue. The property and casualty insurance industry is highly competitive. Property and casualty insurers generally compete on the basis of customer service, price, consumer recognition, coverages offered, claims handling, financial stability and geographic coverage. Vigorous competition, particularly in the personal lines automobile and homeowners lines of business, is provided byexists from large, well-capitalized national companies, some of which have broad distribution networks of employed or captive agents, by smaller regional insurers, and by large companies who market and sell personal lines products directly to consumers. Innovations by competitors or other market participants may also increase the level of competition in the industry. In addition, because the insurance products of the Exchange are marketed exclusively through independent insurance agents, the Exchange faces competition within its appointed agencies based upon ease of doing business, product, price, and service
relationships.
Market competition bears directly on the price charged for insurance products and services subject to regulatory limitations. Industry capital levels can also significantly affect prices charged for coverage. Growth is driven by a company's ability to provide insurance services and competitive prices while maintaining target profit margins. Growth is a product of a company's ability to retain existing customers and to attract new customers, as well as movement in the average premium per policy.
The Exchange's business model is designed to provide the advantages of localized marketing and claims servicing with the economies of scale and low cost of operations from centralized support services. TheIndemnity, as part of its role managing and conducting the business and affairs of the Exchange, also carefully selects the independent agencies that represent it andthe Exchange, which seeks to be the lead insurer with its agents in order to enhance the agency relationship and the likelihood of receiving the most desirable underwriting opportunities from its agents.
The Exchange’s strategic focus as a reciprocal insurer is to employ a disciplined underwriting philosophy and to leverage its strong surplus position to generate higher risk adjusted investment returns. The goal is to produce acceptable returns, on a long-term basis, through careful risk selection, rationalappropriate pricing and superior investment returns. This focus allows the Exchange to accomplish its mission of providing as near perfect protection, as near perfect service as is humanly possible at the lowest possible costs.cost.
See the risk factors related to our dependency on the growth and financial condition of the Exchange in Item 1A. "Risk Factors" contained within this report for further discussion on competition in the insurance industry.
Human Capital Management
Our success is largely dependent upon our ability to attract, retain, and develop diverse talent while maintaining our service-based culture. We strive to create a value proposition for our employees through trust and collaboration while providing competitive compensation, benefits, and other reward programs. Our low turnover and high tenure are reflective of our culture and the mutual commitment that exists between employees and the company.
Our human capital management strategy, including initiatives to shape our workforce and workplace, is designed to attract, retain, and develop talent to ensure we are well positioned for the future. Areas of focus include talent acquisition, performance management, succession planning, learning and development, and diversity and inclusion. Our investments in human capital include comprehensive total rewards and programs aimed at developingpartnership with our employees is one of the cornerstones of our success.
Our employee value proposition includes a culture that focuses on physical, financial, and emotional well-being. In 2023, we were Certified™ by Great Place To Work® for our positive employee experience. We offer competitive pay with a signature and affordable benefits package including options designed to be successful inmeet the unique needs of our employees and their currentfamilies. Employees have access to an employee assistance plan, emergency child and future roles.elder care providers, adoption assistance, and infertility assistance, among others. We hold a shared responsibility view of retirement planning whereby the company provideswe provide tools and resources that employees are expected to use to achieve their retirement goals. We set ourselves apart by offering both a 401(k) savings plan and a noncontributory defined benefit pension plan. We encourage a work/life balance for all employees and recognize the need for employee flexibility by offering an allowance of remote work days to use throughout the year.
An engaged workforce is necessary for accomplishing organizational objectives and our portfolio of employee experience initiatives demonstrates our commitment to provide employees an engaging environment throughout all stages of their careers. We offer professional development opportunities that are designed to prepare employees for future career growth. Employees have access to skills enhancement training and programs as well as a generous tuition reimbursement program for higher education. We also grow and develop our employees by offering talent mobility opportunities such as expanded leadership experience, job shadowing, cross-training, stretch assignments, and formal career development programs.
Our employees also share in our values to give back and make a positive difference in their communities. We offer a volunteer program that provides employees with an allotment of paid hours annually to volunteer with eligible nonprofit organizations. We also offer a matching gifts program for donations to eligible nonprofit organizations.
Diversity, Equity & Inclusion
Diversity, equity, and inclusion ("DEI") is integral to our business success. Our DEI efforts are led by a Chief Diversity Officer who reports directly to the Chief Executive Officer, affirming our commitment to DEI from executive leadership. These efforts are further supported by a dedicated team of professionals including a Vice President of Diversity, Equity, and Inclusion.
We recognize the importance of diverse backgrounds and experiences. Our recruiting strategy includes access to multiple talent channels. We work to expand our pool of potential talent to include an array of skills, backgrounds, and experiences. We also offer a Future Focus internship program that provides opportunities for college students to gain relevant and real-world business experience in the insurance industry as well as an apprentice program to create a bridge for talent from high schools and community colleges into our workforce. We are also intentional about leveraging talent from the neuro diverse population, engaging individuals to support various enterprise initiatives.
We foster an inclusive workplace through the endorsement of nine affinity networks and five business resource groups. Affinity networks are employee-driven groups that focus on particular dimensions of diversity and are designed to foster greater awareness and a culture of inclusion. In support of our recruiting strategy, members of these networks engage with various colleges and universities throughout the country, including Historically Black Colleges and Universities. Business resource groups address business issues using a DEI lens. Through these groups, we are taking a broader approach to problem-solving and innovation by aligning cross-functional teams of employees to our business strategy.
Workforce Metrics
We useused the following human capital metrics as part of managing our business: for the years ended December 31:
| | Years ended December 31, |
| 2021 | | 2020 | | 2019 |
| | 2023 | | | | 2023 | | 2022 | | 2021 |
| | Workforce size | Workforce size | | |
| | Workforce size | |
| | Workforce size | |
Full-time (1) | |
Full-time (1) | |
Full-time (1) | Full-time (1) | | 5,805 | | | 5,849 | | | 5,772 | |
| Part-time | Part-time | | 30 | | | 31 | | | 41 | |
Temporary (2) | Temporary (2) | | 41 | | | 34 | | | 32 | |
Turnover (3) | Turnover (3) | | 8.0 | % | | 5.3 | % | | 5.6 | % | Turnover (3) | | 9.0 | % | | 11.2 | % | | 8.0 | % |
| Voluntary | | Voluntary | | 4.8 | % | | 6.9 | % | | 4.8 | % |
| Retirements | | Retirements | | 2.8 | % | | 3.6 | % | | 2.2 | % |
Average tenure (4) | Average tenure (4) | | 12.6 | | | 12.5 | | | 12.3 | |
(1) Includes 50% of employees who provide claims and life insurance management services exclusively for the Exchange and its subsidiaries.subsidiaries for all periods presented. The Exchange and its subsidiaries reimburse us monthly for the cost of these services.
(2) Temporary employees are hired for short-term work and paid directly by us.
(3) The percentage of employees who left voluntarily or involuntarily, including retirements. CalculatedTurnover is calculated using the number of employees who exited, divided by the average headcount of the period.period and represents the percentage of employees who left voluntarily or involuntarily, including retirements.
(4) TheAverage tenure is calculated using the total number of years of employment, divided by average headcount of full-time and part-time employees for the period and represents the average number of years employees have been employed with the organization. Total number of years divided by average headcount of full-time and part-time employees for the period.
The tightening labor market during the COVID-19 pandemic has increased competition to attract and retain talent. In 2021, a largelargest portion of the increase in our turnover cancontinues to be attributed to voluntary turnover, which increased from 3.0%excluding retirements, and 2.4% in 2019 and 2020, respectively,remains lower than industry benchmark data. We continue to 4.8% in 2021. ERIE continues to monitor its turnover trends to determine the appropriate actions to ensure we are well positioned for the future.
As we recognize the importance of employee engagement on the outcomes we achieve as an organization, we also work with independent external partners to administer confidential surveys to collect feedback on the employee experience. We have partnered with the Great Place to Work® ("GPTW") Institute since 2012. We received the honor of being Great Place to Work-Certified™ in 2020 and 2017, and Great-rated in 2014. Our overall GPTW score has trended upwards over the last three surveys and is favorable compared to the benchmark of the companies ranked on the Great Place to Work® Top 100 Companies List. Since our last full survey in 2020, we have conducted several employee pulse surveys to continue to monitor employee engagement.
Government Regulation
Most states have enacted legislation that regulates insurance holding company systems, defined as two or more affiliated persons, one or more of which is an insurer. Indemnity and the Exchange, and its wholly owned subsidiaries, meet the definition of an insurance holding company system.
Each insurance company in the holding company system is required to register with the insurance supervisory authority of its state of domicile and furnish information regarding the operations of companies within the holding company system that may materially affect the operations, management, or financial condition of the insurers within the system. Pursuant to these laws, the respective insurance departments may examine us and the Exchange and its wholly owned subsidiaries at any time, and may require disclosure and/or prior approval of certain transactions with the insurers and us, as an insurance holding company.
All transactions within a holding company system affecting the member insurers of the holding company system must be fair and reasonable and any charges or fees for services performed must be reasonable. Approval by the applicable insurance commissioner is required prior to the consummation of transactions affecting the members within a holding company system.
Website Access
Our annual reports on Form 10-K, quarterly reports on Form 10-Q, current reports on Form 8-K, and any amendments to those reports are available free of charge on our website at www.erieinsurance.com as soon as reasonably practicable after such material is filed electronically with the Securities and Exchange Commission. Additionally, copies of our annual report on Form 10-K are available free of charge, upon written request, by contacting Investor Relations, Erie Indemnity Company, 100 Erie Insurance Place, Erie, PA 16530, or calling (800) 458-0811.
ITEM 1A. RISK FACTORS
Our business involves various risks and uncertainties, including, but not limited to those discussed in this section. The risks and uncertainties described in the risk factors below, or any additional risk outside of those discussed below, could have a material adverse effect on our business, financial condition, operating results, cash flows, or liquidity if they were to develop into actual events. This information should be considered carefully together with the other information contained in this report and in other reports and materials we file periodically with the Securities and Exchange Commission.
Our risks have been divided into the following categories:
Risks related to Erie Insurance Exchange – risks related to our dependence on our relationship with the Exchange associated with management fees, premium growth, and financial condition, as the Exchange is our sole customer and principal source of revenue
Operating risks – risks stemming from events or circumstances that directly or indirectly affect our operations, including our operations as attorney-in-fact for the subscribers at the Exchange
Market, Capital, and Liquidity risks – risks that may impact the values or results of our investment portfolio, ability to meet financial obligations or covenants, or obtain capital as necessary
Although we have organized risks generally according to these categories in the discussion below, risks may have impacts in more than one category and are included where the impact is most significant.
Risks related to Erie Insurance Exchange
If the management fee rate paidretained by the ExchangeIndemnity is reduced or if there is a significant decrease in the amount of direct and affiliated assumed premiums written by the Exchange, revenues and profitability could be materially adversely affected.
We are dependent upon management fees paid by the Exchange,we retain, which represent our principal source of revenue. Pursuant toIn accordance with the subscriber's agreement with the subscribers at the Exchange, we may retain up to 25% of all direct and affiliated assumed premiums written by the Exchange. Therefore, management fee revenue from the Exchange is calculated by multiplying the management fee rate by the direct and affiliated assumed premiums written by the Exchange. Accordingly, any reduction in direct and affiliated assumed premiums written by the Exchange and/or the management fee rate wouldcould have a negative effect on our revenues and net income.
The management fee rate is determined by our Board of Directors and may not exceed 25% of the direct and affiliated assumed premiums written by the Exchange. The Board of Directors sets the management fee rate each December for the following year. At their discretion, the rate can be changed at any time. The process of setting the management fee rate includes, but is not limited to, the evaluation of current year operating results compared to both prior year and industry estimated results for both Indemnity and the Exchange, and consideration of several factors for both entities including:including, but not limited to: their relative financial strength and capital position; projected revenue, expense and earnings for the subsequent year; future capital needs; as well as competitive position. The evaluation of these factors could result in a reduction to the management fee rate and our revenues and profitability could be materially adversely affected.
Serving as the attorney-in-fact for subscribers in the reciprocal insurance exchange structure results inwith the Exchange being our sole customer. We have an interest incustomer, the growth of the Exchange ascould directly affect our earnings areoperating revenue, which is largely generated from management fees based on the direct and affiliated assumed premiums written by the Exchange. If the Exchange's ability to grow or renew policies were adversely impacted, the premium revenue of the Exchange wouldcould be adversely affected, which wouldcould reduce our management fee revenue. The circumstances or events that might impair the Exchange's ability to grow include, but are not limited to, the items discussed below.
Unfavorable changes in macroeconomic conditions for any reason, including declining consumer confidence, inflation, high unemployment, lower demand for certain services, reduced personal income, and recession, among others, may lead the Exchange's customers to modify coverage, not renew policies, or even cancel policies, which could adversely affect the premium revenue of the Exchange, and consequently our management fee.
The Exchange faces significant competition from other regional and national insurance companies. The property and casualty insurance industry is highly competitive on the basis of product, price and service. If the Exchange's competitors offer property and casualty products with more coverage, or offer lower rates, or introduce innovative services in response to evolving customer
preferences, and the Exchange is unable to implement product or service improvements quickly enough to keep pace, its ability to grow and renew its business may be adversely impacted. In addition, due to the Exchange's premium concentration in the automobile and homeowners insurance markets, it may be more sensitive to trends that could affect auto and home insurance coverages and rates over time, for example changing vehicle types or usage, usage-based methods of determining premiums, ownership and driving patterns such as ride sharing or remote work, advancements in vehicle or home technology or safety features such as accident and loss prevention technologies, the development of autonomous vehicles, or residential occupancy patterns, among other factors. Innovations, including the use of artificial intelligence and machine learning to support underwriting or other decisions, by competitors or other market participants may increase the level of competition in the industry. If the Exchange fails to respond to those innovations on a timely basis, its competitive position and results may be materially adversely affected.
The Exchange markets and sells its insurance products through independent, non-exclusive insurance agencies. These agencies are not obligated to sell only the Exchange's insurance products, and generally also sell products of the Exchange's competitors. If agencies do not maintain their current levels of marketing efforts, bind the Exchange to unacceptable risks, or place business with competing insurers, or if the Exchange is unsuccessful in attracting or retaining agencies in its distribution system or maintaining its relationships with those agencies, the Exchange's ability to grow and renew its business may be adversely impacted. More broadly, if independent agents face challenges sustaining their own business operations due to unfavorable economic conditions or staffing constraints, it could result in the sale or closure of their businesses, thereby reducing the agency force of the Exchange. Additionally, shifting consumer behaviors toward increased digital interactions may cause the insurance industry as a whole to migrate to a delivery system other than independent agencies.
The Exchange maintains a brand recognized for customer service.service, which is the result of Indemnity's management of the Exchange in accordance with the subscriber's agreement. The perceived performance, actions, conduct and behaviors of employees, independent insurance agency representatives, and third-party service partnersproviders may result in reputational harm to the Exchange's brand. Specific incidents which may cause harm include but are not limited to disputes, long customer wait times, errors in processing a claim, failure to protect sensitive customer data, and negative or inaccurate social media or traditional media communications. Likewise, an inability to match or exceed the service provided by competitors, which iswho are increasingly relying on digital delivery and enhanced distribution technology, may impede the Exchange'sExchange’s ability to maintain and/or grow its customer base. If third-party service providers fail to perform as anticipated, the Exchange may experience operational difficulties, increased costs and reputational damage. If an extreme catastrophic event were to occur in a heavily concentrated geographic area of subscribers/policyholders, an extraordinarily high number of claims could have the potential to strain claims processing and affect the Exchange's ability to satisfyservice its customers. Also, we, orIf third-party service providers fail to perform as anticipated, the Exchange may failexperience operational difficulties, increased costs, and reputational damage. Similarly, the Exchange’s brand could be tarnished by reactions to meetbusiness practices, adverse financial developments, perceptions of our corporate governance, how we address employee matters and concerns, environmental, social and governance (ESG) expectationsinitiatives, or the conduct of our customers or other interested parties.employees, officers and directors. Failure to satisfy expectations in these areas may result in negative publicity or other adverse outcomes.outcomes, which could be aggravated as the expectations of consumers, regulators and other stakeholders evolve and as social media and other forms of modern communication rapidly magnify reactions. Any reputational harm to the Exchange could have the potential to impair its ability to grow and renew its business.
We have an interest inAs the financial condition of the Exchange based on serving as the attorney-in-fact for subscribers in the reciprocal insurance exchange structure andwith the Exchange beingas our sole customer.customer, we are dependent on the financial condition of the Exchange. If the Exchange were to fail to maintain acceptable financial strength ratings, its competitive position in the insurance industry wouldcould be adversely affected. If a rating downgrade led to customers not renewing or canceling policies, or impacted the Exchange's ability to attract new customers, the premium revenue of the Exchange wouldcould be adversely affected, which wouldcould reduce our management fee revenue. The circumstances or events that might impair the Exchange's financial condition include, but are not limited to, the items discussed below.
Financial strength ratings are an important factor in establishing the competitive position of insurance companies such as the Exchange. Higher ratings generally indicate greater financial stability and a stronger ability to meet ongoing obligations to policyholders. The Exchange's A.M. Best rating is currently A+ ("Superior"). A.M. Best periodically reviews the Exchange’s ratings and changes their rating criteria; therefore, the Exchange's current rating may not be maintained in the future. A significant downgrade in the A.M. Best rating could reduce the competitive position of the Exchange, making it more difficult to attract profitable business in the highly competitive property and casualty insurance market and potentially result in reduced sales of its products and lower premium revenue.
The performance of the Exchange's investment portfolio is subject to a variety of investment risks. The Exchange's investment portfolio is comprised principally of fixed income securities, equity securities and limited partnerships. The fixed income portfolio is subject to a number of risks including, but not limited to, interest rate risk, investment credit risk, sector/concentration risk and liquidity risk. The Exchange's common stock and preferred equity securities have exposure to price risk, the risk of potential loss in estimated fair value resulting from an adverse change in prices. Limited partnerships are
significantly less liquid and generally involve higher degrees of price risk than publicly traded securities. Limited partnerships, like publicly traded securities, have exposure to market volatility; but unlike fixed income securities, cash flows and return expectations are less predictable. Additionally, a portion of the Exchange’s common stock and limited partnership portfolios are exposed to foreign exchange rate risk, or the potential loss in estimated fair value resulting from adverse changes in foreign currency exchange rates. If any investments in the Exchange's investment portfolio were to suffer a substantial decrease in value, the Exchange's financial position could be materially adversely affected through increased unrealized losses or impairments. A significant decrease in the Exchange's portfolio could also put it, or its subsidiaries, at risk of failing to satisfy regulatory or rating agency minimum capital requirements.
Property and casualty insurers are subject to extensive regulatory supervision in the states in which they do business. This regulatory oversight includes, by way of example, matters relating to licensing, examination, rate setting, market conduct, policy forms, limitations on the nature and amount of certain investments, claims practices, mandated participation in involuntary markets and guaranty funds, reserve adequacy, insurer solvency, restrictions on underwriting standards, accounting standards, and transactions between affiliates.affiliates, risk management, cybersecurity and data privacy, and ESG practices. Such regulation and supervision are primarily for the benefit and protection of policyholders. Changes in applicable insurance laws, tax statutes, cyber, privacy, and other laws and regulations, or changes in the way regulators administer those laws, tax statutes, or regulations could adversely impact the Exchange's business, cash flows, results of operations, financial condition, or operating environment and increase its exposure to loss or put it at a competitive disadvantage, which could result in reduced sales of its products and lower premium revenue.
Property and casualty insurers face a significant risk of litigation and state and federal regulatory investigations, inquiries and actions in the ordinary course of operating their businesses, including the risk of class action lawsuits. The Exchange and its subsidiaries have also been named as defendants in a number of pandemic-related lawsuits and, therefore, are subject to the risks and uncertainties of such litigation. Plaintiffs in class action and other lawsuits against the Exchange may seek large or indeterminate amounts of damages, including punitive and treble damages, which may remain unknown for substantial periods of time. The Exchange is also subject to various regulatory inquiries, such as information requests, subpoenas, and books and record examinations from state and federal regulators and authorities.
The uncertainty of risks that emerge upon the occurrence of significant unexpected events, such as pandemics, or unexpected economic or social inflation caused by supply chain issues, societal trends, or otherwise, may cause additional challenges in the process of estimating loss and loss adjustment expense reserves.reserves or premiums to accommodate future claims and expenses. For example, the behavior of claimants and policyholders may change in unexpected ways, the disruption to the court system may impactand the timing and amounts of claims settlements and themay change in unexpected ways. Furthermore, actions taken by governmental bodies, both legislative and regulatory, in reaction to a pandemic or other significant unexpected events, and their related impacts, are hard to predict. Among other things, thisTechnology advancements, such as electric and autonomous vehicles, could impact frequency or severity of losses. The models that are used to determine appropriate premium levels, forecast future losses and expenses, estimate loss and loss adjustment expense reserves, and assess financial strength may be created or deployed in a manner that results in inaccurate predictions. This may result in changes to the Exchange's estimated level of loss and loss adjustment expense reserves.reserves or impact the adequacy of premiums to accommodate future claims and expenses.
As insurance industry practices and legal, judicial, social and other environmental conditions change, unexpected and unintended issues related to claims and coverage may emerge. In some instances, these emerging issues may not become apparent for some time after the Exchange has issued the affected insurance policies. As a result, the full extent of liability under the Exchange's insurance policies may not be known for many years after the policies are issued. These issues may adversely affect the Exchange's business by either extending coverage beyond its underwriting intent or by increasing the number or size of claims. If there were legislative action in response to a pandemic or other significant unexpected event that retroactively mandated coverage irrespective of terms, exclusions or other conditions included in policies, such as business interruption, that would otherwise preclude coverage, it could have a material impact on the financial condition, results of operations and cash flows of the Exchange.
The Exchange's insurance operations are exposed to claims arising out of catastrophes. Common natural catastrophic events include hurricanes, earthquakes, tornadoes, hail storms, and severe winter weather. The frequency and severity of these catastrophes is inherently unpredictable. Changing climate conditions have added to the unpredictability of the frequency and severity of natural disasters and have created additional uncertainty as to future trends and exposures. A single catastrophic occurrence or aggregation of multiple smaller occurrences within the geographical region of the Exchange or its assumed property reinsurance portfolio could adversely affect the financial condition of the Exchange. Man-made disasters such as terrorist attacks and riots could also cause losses from insurance claims related to the property and casualty insurance operations, which could adversely affect its financial condition.
Operating risks
If the costs of providing services to the Exchange are not controlled, our profitability could be materially adversely affected.
Pursuant toIn accordance with the subscriber's agreement, we perform policy issuance and renewal services for the subscribers at the Exchange and we serve as the attorney-in-fact on behalf of the subscribers at the Exchange with respect to its administrative services. The most significant costs we incur in providing policy issuance and renewal services are commissions, employee costs, and technology costs.
Commissions to independent agents are our largest expense. Commissions include scheduled commissions to agents based upon premiums written as well as additional commissions and bonuses to agents,incentive compensation, which areis earned by achieving certain targeted measures. Changes to commission rates or bonusincentive programs may result in increased future costs and lower profitability. Our agent incentive bonuses includecompensation includes a profitability component. If claims frequency and loss expenses were to decrease significantly as a result of an unexpected event, such as a pandemic, the profitability component of our agent incentive bonusescompensation would improve, and our agent compensation costs would increase. Our second largest expense is employee costs, including salaries, healthcare, pension, and other benefit costs. Regulatory developments, provider relationships, pandemics and demographic and economic factors that are beyond our control, indicatesuch as inflation, are indicators that employee healthcare costs could continue to increase, which could reduce our profitability. The defined benefit pension plan we offer to our employees is affected by variable factors such as the interest rate used to discount pension liabilities, asset performance, and changes in retirement patterns, which are beyond our control, and any related future costscost increases wouldcould reduce our profitability.
Technological development is necessary to facilitate ease of doing business for employees, agents, and customers. Our technological developments are focused on simplifying and improving the employee, agent, and customer experiences, increasing efficiencies, redesigning products, and addressing other potentially disruptive changes in the insurance industry.industry, including the use of artificial intelligence. As we continue to develop technology initiatives in order to remain competitive, our profitability could be negatively impacted as we invest in system development. We may also experience increased technology costs as we re-design hybrid work models for our employees.
If we are unable to attract, develop, and retain talented executives, key managers, and employees our financial conditionscondition and results of operations could be adversely affected.
Our success is largely dependent upon our ability to attract and retain talented executives and other key management. Talent is defined as people with the right skills, knowledge, abilities, character, and motivation. The loss of the services and leadership of certain key officers and the failure to plan for turnover or retirement or to attract and develop talented new executives and managers could prevent us from successfully communicating, implementing, and executing business strategies.
Our success also depends on our ability to attract, develop, and retain a talented employee base. The inability to staff all functions of our business with employees possessing the appropriate talent or failure to instill appropriate cultural expectations and behavioral norms within our employees could have an adverse effect on our business performance. Additionally, failure to recognize, evaluate, and respond to changing workforce trends including current labor market conditions and new ways of managing in hybrid work environments, or failure to execute proactive retention and replacement strategies could also have an adverse effect on our business performance. Furthermore, failure to instill appropriate cultural expectations and behavioral norms within our employees, particularly in a hybrid work environment, could damage our reputation. Staffing appropriately talented employees for the handling of claims and servicing of customers, rendering of disciplined underwriting, and effective sales and marketing are critical to the core functions of our business. In addition, talented employees in the actuarial, finance, human resources, information technology, law, and risk management areas are also essential to support our core functions.
If we are unable to ensureeffectively maintain system availability or effectively manage technology initiatives, we may experience adverse financial consequences and/or may be unable to compete effectively.
Our business is highly dependent upon the effectiveness of our technology and information systems which support key functions of our core business operations, including processing applications and premium payments, providing customer support, performing actuarial and financial analysis, and maintaining key data. Additionally, the Exchange relies heavily on technology systems for processing claims. In order to support our business processes and strategic initiatives in a cost and resource efficient manner, we must maintain the effectiveness of existing technology systems and continue to identify and develop new, and enhance existing, technology systems. As we invest in the development of our systems, costs and completion times could exceed original estimates, and/or the project may not deliver the anticipated benefit or perform as expected. If we do not effectively and efficiently manage and upgrade our technology systems, or attract and retain qualified information technology employees and contract personnel to support those systems, our ability to serve our customers and implement our strategic initiatives could be adversely impacted.
Additionally, we depend on a large amount of data to price policies appropriately, track exposures, perform financial analysis, report to regulatory bodies, and ultimately make business decisions. Should this data be inaccurate or insufficient, risk exposure may be underestimated and/or poor business decisions may be made. This may in turn lead to adverse operational or financial performance and adverse customer or investor confidence.
If we experience difficulties with technology, data and network security, including as athose that could result offrom cyber attacks, third-party relationships or cloud-based relationships, our ability to conduct our business could be adversely impacted.
In the normal course of business, we collect, use, store and where appropriate, disclose data concerning individuals and businesses. We also conduct business using third parties who may provide software, data storage, cloud-based computing and other technology services. We have on occasion experienced, and will continue to experience, cyber threats to our data and systems. Cyber threats can create significant risks such as destruction of systems or data, denial or interruption of service, disruption of transaction execution, loss or exposure of customer data, theft or exposure of our intellectual property, theft of funds or disruption of other important business functions. Even with appropriate governance and controls, the use of artificial intelligence may increase our exposure to cyber threats. Our interactions with, and reliance upon, third parties may also expose us to increased risk related to data security, service disruptions or effectiveness of our control system.system, particularly as we increase our reliance on cloud-based computing and software-as-a-service from third parties to operate our business.
In addition, we are subject to numerous federal and state data privacy laws relating to the privacy and security of the nonpublic personal information and other sensitive information of our customers, employees and others. The improper access, disclosure, or misuse or mishandling of such information sent to or received from a customer, employee or third party could result in legal liability, regulatory action and reputational damage. Third parties on whom we rely for certain business processing functions are also subject to these risks, and their failure to adhere to these laws and regulations could negatively impact us.
Our Board of Directors oversees our activities with respect to managing cyber risk through its Risk Committee. Management regularly reports on our cybersecurity risk management program including our risk evaluation and the results of independent third-party security assessments, and our efforts to manage cyber related risks.
We employ a company-wide cybersecurity program of technical, administrative, physical and disclosure controls intended to reduce the risk of cyber threats and protect our information, as well as to communicate potential material threats and incidents. Our cybersecurity philosophy and approach align to the National Institute of Standards and Technology Cybersecurity Framework and its core elements to identify, protect, detect, respond and recover from the various forms of cyber threats. Our practices include, but are not limited to, cybersecurity protocols and controls, system monitoring and detection, communication of incidents to appropriate management, third-party risk management, including assessments of emerging threats and vulnerabilities, and ongoing privacy and cybersecurity training for employees and contractors concerning cyber risk. We periodically assess the effectiveness of our cybersecurity efforts including independent validation and verification and security assessments conducted by independent third parties.
The number, complexity, and sophistication of cyber threats continue to increase over time. While we maintain cyber liability insurance to mitigate the financial risk around cyber incidents, such insurance may not cover all costs associated with the consequences of information or systems being compromised.compromised, and such insurance may become prohibitively expensive to maintain. Additionally, while we have dedicated resources with security incident response capabilities, our response process may not be adequate, may fail to accurately assess the severity of an incident, may not respond quickly enough or may fail to sufficiently remediate an incident. Similarly, if our third-party service providers experience a cyber incident, they may fail to report, or timely report, the incident to us. As a result, we may suffer significant legal, reputational, or financial losses, which could adversely affect our business, cash flows, financial condition or results of operations.
To date, we are not aware of any material cybersecurity breach with respect to our systems or data. Additionally, we are not aware of any cybersecurity breach experienced by anyone with whom we have a third-party relationship that has had a material impact on our systems or data.
If events occurred causing interruption of our operations, facilities, systems or business functions, it could have a material adverse effect on our operations and financial results.
We have established business continuity and disaster recovery plans to ensureprovide for the continuation of core business operations in the event that normal business operations could not be performed due to catastrophic or other events, including pandemics. While we continue to test and assess our business continuity and disaster recovery plans to validate they meet the needs of our core business operations and addressesaddress multiple business interruption events, there is no assurance that core business operations could be performed upon the occurrence of such an event. Employee absence, physical premises damage, systems failures or outages could compromise our ability to perform our business functions in a timely manner, which could harm our ability to conduct business and hurt our relationships with our business partners and customers.customer relationships. Our operational resiliency is also dependent on third-party personnel, infrastructure and systems on which we rely.rely, including cloud-based technologies and software-as-a-service applications. Our operations and those of our third parties may become vulnerable to damage or disruption due to circumstances beyond our or their control, such as from catastrophic events, power anomalies or outages, natural disasters, pandemics, supply chain interruptions, network failures, and cyber attacks. Additionally, we are more dependent on internet and telecommunications access and capabilities. Indemnity’sOur workforce is largely concentrated in Erie, Pennsylvania. If a significant event affects the labor force in this area, it could impact the policy acquisition, underwriting, claims and/or support services provided to the policyholders and/or independent agents of the Exchange. Disruptions to our workforce or our operations for any reason could result in a material adverse effect on our business, cash flows, financial condition, or results of operations.
We are subject to applicable insurance laws, tax statutes, and numerous other federal and state laws and regulations, as well as claims and legal proceedings, which, if determined unfavorably, could have a material adverse effect on our business, results of operations, or financial condition.
Our activities are subject to extensive regulation under federal and state laws on matters as diverse as internal control over financial reporting and disclosure controls, securities regulation, data privacy and protection, cybersecurity, taxation, immigration, wage-and-hour standards and employment and labor relations. These laws and regulations are complex and
evolving, and compliance with these laws requires significant resources. In some cases, these laws and regulations may increase our costs, negatively impact revenues, or impose operational limitations on our business. Further, there can be no assurance that we, our third-party service providers and our independent agents are in full compliance with all applicable laws and regulations at all times. Efforts at compliance with all laws and regulations are further complicated by new and evolving regulations regarding cybersecurity, artificial intelligence and ESG matters.
We face a significant risk of litigation and regulatory investigations and actions in the ordinary course of operating our businesses including the risk of class action lawsuits. We are, have been, or may become subject to class actions and individual suits alleging breach of fiduciary or other duties, including our obligations to indemnify directors and officers in connection with certain legal matters. We are also subject to litigation arising out of our general business activities such as contractual and employment relationships and claims regarding the infringement of the intellectual property of others. Plaintiffs in class action and other lawsuits against us may seek large or indeterminate amounts of damages, including punitive and treble damages, which may remain unknown for substantial periods of time. We are also subject to various regulatory inquiries, such as information requests, subpoenas, and books and record examinations from state and federal regulators and authorities. In addition, changes in the way regulators administer applicable laws, tax statutes, or regulations could adversely impact our business, cash flows, results of operations, or financial condition. It is also possible that changes in economic conditions and steps taken by federal, state, and local governments in response to a pandemic or other significant events could cause an increase in taxes at the federal, state, and local levels, which wouldcould adversely impact our results of operations.
Market, Capital, and Liquidity risks
The performance of our investment portfolio is subject to a variety of investment risks, which may in turn have a material adverse effect on our results of operations or financial condition.
At December 31, 2021,2023, our investment portfolio consisted of approximately 83%85% fixed maturity securities, with the remaining 17%15% invested in equity securities and other investments.
General economic conditions and other factors beyond our control can adversely affect the value of our investments and the realization of net investment income or result in realized investment losses. In addition, downward economic trends also may have an adverse effect on our investment results by negatively impacting the business conditions and impairing credit for the issuers of securities held in our respective investment portfolios. This could reduce fair values of investments and generate significant unrealized losses or impairment charges which may adversely affect our financial results.
The performance of the fixed income portfolio is subject to a number of risks including, but not limited to:
•Interest rate risk - the risk of adverse changes in the value of fixed income securities as a result of increases in market interest rates.
•Investment credit risk - the risk that the value of certain investments may decrease due to the deterioration in financial condition of, or the liquidity available to, one or more issuers of those securities or, in the case of structured securities, due to the deterioration of the loans or other assets that underlie the securities, which, in each case, also includes the risk of permanent loss.
•Sector/Concentration risk - the risk that the portfolio may be too heavily concentrated in the securities of one or more issuers, sectors, or industries. Events or developments that have a negative impact on any particular industry, group of related industries, or geographic region may have a greater adverse effect on our investment portfolio to the extent that the portfolio is concentrated within those issuers, sectors, or industries.
•Liquidity risk - the risk that we will not be able to convert investment securities into cash on favorable terms and on a timely basis, or that we will not be able to sell them at all, when desired. Disruptions in the financial markets or a lack of buyers for the specific securities that we are trying to sell could prevent us from liquidating securities or cause a reduction in prices to levels that are not acceptable to us.
•Reinvestment risk - the possibility that the cash flows produced by an investment will have to be reinvested at a reduced rate of return. Approximately 42%36% of our fixed maturity portfolio is expected to mature over the next three years.
Our equity securities have exposure to price risk. Equity markets, sectors, industries, and individual securities may also be subject to some of the same risks that affect our fixed income portfolio, as discussed above.
All of our fixed income and equity securities are subject to market volatility. To the extent that future market volatility negatively impacts our investments, our financial condition will be negatively impacted. We review the fixed income portfolio on a continuousperiodic basis to evaluate positions that are in an unrealized loss position to determine whether impairments are a result of credit loss or other factors. Inherent in management's evaluation of a security are assumptions and estimates about the operations of the issuer and its future earnings potential. The primary factors considered in our review of investment valuation include the extent to which fair value is less than cost, historical operating performance and financial condition of the issuer, short- and long-term prospects of the issuer and its industry, specific events that occurred affecting the issuer, including rating downgrades, and, depending on the type of security, our intent to sell or our ability and intent to retain the investment for a period of time sufficient to allow for a recovery in value. As the process for determining impairments is highly subjective, changes in our assessments may have a material effect on our operating results and financial condition. See also Part II, Item 7A. "Quantitative and Qualitative Disclosures about Market Risk".
In July 2017, the United Kingdom’s Financial Conduct Authority ("FCA"), which regulates the London Interbank Offered Rate (“LIBOR”), announced that it intends to phase out LIBOR by the end of 2021. After this date, the FCA would no longer require banks to make LIBOR submissions. Following discussions with the FCA and other official sector bodies, the Intercontinental Exchange Benchmark Administration announced in March 2021 the publication of certain USD LIBOR settings will continue through June 30, 2023. The Alternative Reference Rates Committee of the Federal Reserve Board (ARRC), a group of market participants convened to help ensure a successful transition away from LIBOR, has recommended the Secured Overnight Financing Rate (SOFR) as its preferred alternative reference rate and has proposed a transition plan and timeline designed to encourage the adoption of SOFR from LIBOR. Volume in SOFR-linked products has increased significantly during 2021; however, LIBOR continues to be the dominant reference rate in use in the market today.
We have identified our population of contracts that contain a LIBOR reference and have determined that our primary exposure is in fixed income securities within our investment portfolio. Approximately 23% of our investment portfolio includes securities with LIBOR exposure where the stated final maturity date extends beyond June 30, 2023. Many of our LIBOR indexed securities have fallback provisions that provide for an alternative reference rate when LIBOR ceases to exist. For securities without adequate fallback provisions already in place, legislation governing securities under New York law has been enacted to provide a safe harbor for transition to the recommended alternative reference rate. In addition, federal legislation has been introduced to provide the same protection for securities not governed by New York law.
While our preliminary analysis does not indicate that the transition of our investments to alternative reference rates will result in adverse changes to the net investment income, fair market value and return on those investments, we are still in the process of evaluation. We continually monitor the risks associated with the LIBOR transition which include identifying and monitoring our exposure to LIBOR, monitoring the market adoption of alternative reference rates and ensuring operational processes are updated to accommodate alternative rates. Due to uncertainty surrounding alternative rates, we are unable to predict the overall impact of this change at this time.
Deteriorating capital and credit market conditions or a failure to accurately estimate capital needs may significantly affect our ability to meet liquidity needs and access capital.
Sufficient liquidity and capital levels are required to pay operating expenses, income taxes, and to provide the necessary resources to fund future growth opportunities, satisfy certain financial covenants, pay dividends on common stock, and repurchase common stock. Management estimates the appropriate level of capital necessary based upon current and projected results, which includes evaluating potential risks. Failure to accurately estimate our capital needs may have a material adverse effect on our financial condition until additional sources of capital can be obtained. Further, a deteriorating financial condition may create a negative perception of us by third parties, including investors, and financial institutions, which could impact our ability to access additional capital in the debt or equity markets.
Our primary sources of liquidity are management fee revenue and cash flows generated from our investment portfolio. In the event our current sources do not satisfy our liquidity needs, we have the ability to access our $100 million bank revolving line of credit, from which there were no borrowings as of December 31, 2021, or liquidate assets in our investment portfolio. Volatility in the financial markets could also limit our ability to sell certain fixed income securities or cause such investments to sell at deep discounts.
Our primary sources of liquidity are management fee revenue and cash flows generated from our investment portfolio. In the event these traditional sources of liquidity are not available, we may have to seek additional financing. Our access to funds will depend upon a number of factors including current market conditions, the availability of credit, market liquidity, and the timing of obtaining credit ratings. In deteriorating market conditions, there can be no assurance that we will obtain additional financing, or, if available, that the cost of financing will not substantially increase and affect our overall profitability.
ITEM 1B. UNRESOLVED STAFF COMMENTS
None.
ITEM 1C. CYBERSECURITY
Cybersecurity Risk Management
Our Privacy and Information Security Committee, comprised of officers and senior leaders, is responsible for overseeing the development and maintenance of information privacy and security policies and effective operation of our corporate information security and cybersecurity program in compliance with applicable state insurance regulations and other legal and regulatory requirements. This committee is sponsored by and reports directly to our Executive Council, which includes our Chief Executive Officer and executive vice presidents.
As part of our overall Enterprise Risk Management ("ERM") program, we employ a cybersecurity program of technical, administrative, and physical controls intended to reduce the risk of cyber threats and protect our information, as well as documented processes to determine and make appropriate disclosures regarding potential material threats and incidents. Our cybersecurity philosophy and approach align to the National Institute of Standards and Technology Cybersecurity Framework and its core elements to identify, protect, detect, respond, and recover from the various forms of cyber threats. Our practices include, but are not limited to, cybersecurity protocols and controls, system monitoring and detection, communication of incidents to appropriate management, third-party risk management, including assessments of emerging threats and vulnerabilities, and ongoing privacy and cybersecurity training for employees and contractors concerning cyber risk. A foundational element of our cybersecurity risk management processes is the annual Cybersecurity and Information Security Risk Assessment (CSRA), which includes an analysis of cybersecurity risks facing us and associated recommendations and action items to mitigate identified risks. We periodically utilize third parties to assess the effectiveness of our cybersecurity efforts through independent validations, verifications, and security assessments.
Our Board of Directors has a process in place to monitor management’s oversight of cybersecurity. This is done primarily through regular reports to its Risk Committee as well as the full Board of Directors. Management provides reports on our
cybersecurity risk management program, including our risk evaluation, the results of independent third-party security assessments, and our efforts to manage cyber related risks.
We have a core incident response team (Core Team) consisting of dedicated, skilled leadership representatives from our Information Security, Privacy and Law teams, responsible for analyzing and assessing cyber incidents and leading response efforts. Our Chief Information Security Officer (CISO), responsible for overseeing and managing information security incidents, has over 25 years of experience in information technology (IT), including over 20 years dedicated to practicing or leading cybersecurity functions. Our CISO is also a Certified Information Systems Security Professional (CISSP). Our Privacy leader, responsible for managing privacy incidents, has over 20 years of experience in IT risk management, including over 10 years in IT risk and control functions and the remaining time focused on privacy and cybersecurity related functions and holds several information privacy and risk certifications. Our Legal leader, responsible for providing guidance on legal and other regulatory obligations in the areas of privacy, cybersecurity, technology, data use and third-party risk management, holds a Juris Doctor degree, is licensed to practice law, and has over 20 years of legal experience, including 10 years focused on privacy and cybersecurity and holds several information security and privacy certifications, including the CISSP. The Core Team leaders are members of various organizations that support cybersecurity or privacy intelligence, education, information sharing and networking, including among others the Financial Services Information Sharing and Analysis Center (FS-ISAC), Domestic Security Alliance Council (DSAC), InfraGard, and International Association of Privacy Professionals (IAPP).
The Core Team members are augmented as needed by representatives from other internal groups, including subject matter experts from Information Security, Privacy, Finance and Law, as well as certain third parties that may need to participate in the incident response process. Depending on the severity and impact of the incident, third parties engaged may include outside counsel, forensics investigators, public relation firms, data breach resolution providers, and cyber insurance brokers and carriers. In conjunction with legal counsel, the Core Team evaluates notification requirements and as necessary will notify stakeholders depending on the nature and severity of the incident, including law enforcement, state attorneys general, regulators, external auditors, third party providers, and impacted individuals.
The Core Team is informed of cyber incidents from diverse sources, including for example, internal monitoring systems, information sharing organizations, employees, and other external information sources. Depending upon the levels of access to our information and/or information systems, third party service providers are contractually obligated to report cybersecurity incidents within their environments. The Core Team performs incident analysis and triage to determine scope, severity, prioritization and required response plans to address an incident in a manner that is intended to minimize the impact to us, our assets, and our operations. In accordance with applicable legal and regulatory requirements, this analysis and triage step includes an assessment of the potential for material impact to us from a cybersecurity incident or a series of individually immaterial related incidents that are material when aggregated.
To date, we are not aware of any cybersecurity breach or other incident with respect to our systems or data that would have a material impact to our business strategy, results of operations or financial condition. Additionally, we are not aware of any cybersecurity breach or other incident experienced by anyone with whom we have a third-party relationship that has had a material impact on our systems or data. However, there can be no guarantee that we will not experience any such incidents in the future. See Item 1A. "Risk Factors" for a discussion of cybersecurity risks.
ITEM 2. PROPERTIES
Indemnity and the Exchange share a corporate home office campus in Erie, Pennsylvania, which comprises approximately 996,000 square feet. Additionally, we lease two office buildings and one warehouse facility from third parties. Weparties and are charged rent for the related square footage we occupy.
Indemnity and the Exchange also operateown or lease 25 field offices in 12 states used to perform primarily support claims-related activities. The Exchange owns seven field offices and leases another 16 from third parties. Indemnity owns property, a portion of which houses one field office and leases the remaining field officesanother from a third parties.party. Commitments for properties leased from otherthird parties expire periodically through 2027.2029. We expect that most leases will be renewed or replaced upon expiration. Rental costs of shared facilities are allocated based upon usage or square footage occupied.
Due to the uncertainty of the COVID-19 pandemic, approximately 90% of our workforce has been working remote since March 2020. We have a dedicated team responsible for the development and implementation of a return to office plan. We began returning some employees to our offices in July 2021, but paused as a result of the national increase in infections. We plan to resume returning employees to our offices in phases when we consider it appropriate.
ITEM 3. LEGAL PROCEEDINGS
Erie Indemnity Company ("Indemnity") was named as a defendant in a complaint filed on August 24, 2021, by alleged subscribers of the Erie Insurance Exchange (the "Exchange") in the Court of Common Pleas Civil Division of Allegheny County, Pennsylvania captioned TROY STEPHENSON, CHRISTINA STEPHENSON, SUSAN RUBEL, and STEVEN BARNETT, individually and on behalf of all others similarly situated (Plaintiffs) v. Erie Indemnity Company (Defendant).
The complaint seeks relief for alleged breaches of fiduciary duty by Indemnity in connection with the setting of the management fee it receives, pursuant toin accordance with the terms of the Subscribers Agreement executed between Indemnity and all policyholders of the Exchange, as compensation for acting as the attorney-in-fact in the management of the Exchange.The relief sought is for the period beginning two years prior to the date of the filing of the complaint and continuing through 2021.
The complaint seeks (i) a finding that Indemnity has breached its fiduciary duties; (ii) an award of damages in an amount to be determined at trial; and (iii) such other relief, including disgorgement of profits or other injunctive relief, that the Court deems just and proper.
Service of the complaint was effectuated on September 20, 2021. A Notice of Removal to the United States District Court for the Western District of Pennsylvania was filed on October 20, 2021. On November 2, 2021, Plaintiffs filed a Notice of Voluntary Dismissal. As a result, the action was dismissed without prejudice.
On December 6, 2021, another Complaint was filed in the Court of Common Pleas of Allegheny County, Pennsylvania captioned ERIE INSURANCE EXCHANGE, an unincorporated association, by TROY STEPHENSON, CHRISTINA STEPHENSON, and STEVEN BARNETT, trustees ad litem, and alternatively, ERIE INSURANCE EXCHANGE, by TROY STEPHENSON, CHRISTINA STEPHENSON, and STEVEN BARNETT, (Plaintiff), v. ERIE INDEMNITY COMPANY, (Defendant).
This most recent complaint has the same allegation of breach of fiduciary duty by Indemnity in connection with the setting of the management fee it receives, pursuant toin accordance with the terms of the Subscribers Agreement executed between Indemnity and all policyholders of the Exchange, as compensation for acting as the attorney-in-fact in the management of the Exchange.
This most recent complaint seeks the same relief, specifically, (i) a finding that Indemnity has breached its fiduciary duties; (ii) an award of damages in an amount to be determined at trial; and (iii) such other relief, including disgorgement of profits or other injunctive relief, that the Court deems just and proper.
A Notice of Removal to the United States District Court for the Western District of Pennsylvania was filed on January 27, 2022. Indemnity intends to vigorously defend against all of the allegations and requests for relief in the complaint.
By Memorandum Opinion and Order dated September 28, 2022, the Court granted the Motion for Remand and directed the case be remanded to the Court of Common Pleas of Allegheny County, Pennsylvania. On September 30, 2022, Indemnity filed a Motion to Stay the Remand Order pending an appeal to the United States Court of Appeals for the Third Circuit. On October 3, 2022, the Court granted the Stay. On October 11, 2022, Indemnity filed a Petition for Permission to Appeal the Remand Order with the Third Circuit. By Order dated November 7, 2022, a three judge panel of the Court denied the Petition to Appeal.
On November 21, 2022, Indemnity filed a Petition for Rehearing requesting that the Third Circuit permit the appeal. By Order dated January 9, 2023, the Court granted the petition for rehearing and vacated the prior Order of October 7, 2022, denying permission to appeal. On April 20, 2023, argument was held before a three-judge panel of the Third Circuit. By Opinion dated May 22, 2023, the Court affirmed the decision of the District Court finding that there was no basis for federal court jurisdiction and that the matter had been properly remanded to state court. On June 5, 2023, Indemnity filed a Petition for Panel Rehearing or Rehearing En Banc. By Order dated June 22, 2023, the Court denied the Petition.The United States District Court thereafter extended its stay of the issuance of the remand order through the conclusion of any proceedings in the United States Supreme Court challenging the decision of the United States Court of Appeals for the Third Circuit that no federal jurisdiction exists in this case.
On October 20, 2023, Indemnity filed a Petition for Writ of Certiorari with the Supreme Court of the United States. The Petition seeks a determination from the Court that the lower courts improperly denied federal jurisdiction. The Petition is currently pending before the Court.
Indemnity intends to vigorously defend against all of the allegations and requests for relief in the complaint.
Separately, Indemnity filed a Complaint in Federal Court to invoke certain provisions of the "All Writs Act" and the "Anti-Injunction Act."By filing this complaint, Indemnity seeks to protect the federal court’s prior binding, final judgments in favor of Indemnity and thereby foreclose further litigation of the claims and issues pertaining to the compensation practices that were the subject of the prior judgments.
For additional information on contingencies, see Part II, Item 8. "Financial Statements and Supplementary Data - Note 16, Commitment and Contingencies, of Notes to Financial Statements".
ITEM 4. MINE SAFETY DISCLOSURES
Not applicable.
PART II
ITEM 5. MARKET FOR REGISTRANT'S COMMON EQUITY, RELATED STOCKHOLDER MATTERS AND ISSUER PURCHASES OF EQUITY SECURITIES
Common Stock Market Prices and Dividends
Our Class A, non-voting common stock trades on The NASDAQ Stock MarketSM LLC under the symbol "ERIE". No established trading market exists for the Class B voting common stock. Broadridge Corporate Issuer Solutions, Inc. serves as our transfer agent and registrar. As of February 18, 2022,20, 2024, there were approximately 542504 shareholders of record for the Class A non-voting common stock and 98 shareholders of record for the Class B voting common stock.
Historically, we have declared and paid cash dividends on a quarterly basis at the discretion of the Board of Directors. The payment and amount of future dividends on the common stock will be determined by the Board of Directors and will depend upon, among other things, our operating results, financial condition, cash requirements, and general business conditions at the time such payment is considered.
Stock Performance
The following graph depicts the cumulative total shareholder return, assuming reinvestment of dividends, for the periods indicated for our Class A common stock compared to the Standard & Poor's 500 Stock Index and the Standard & Poor's Supercomposite Insurance Industry Group Index. The Standard & Poor's Supercomposite Insurance Industry Group Index is made up of 5756 constituent members represented by property and casualty insurers, insurance brokers, and life insurers, and is a capitalization weighted index.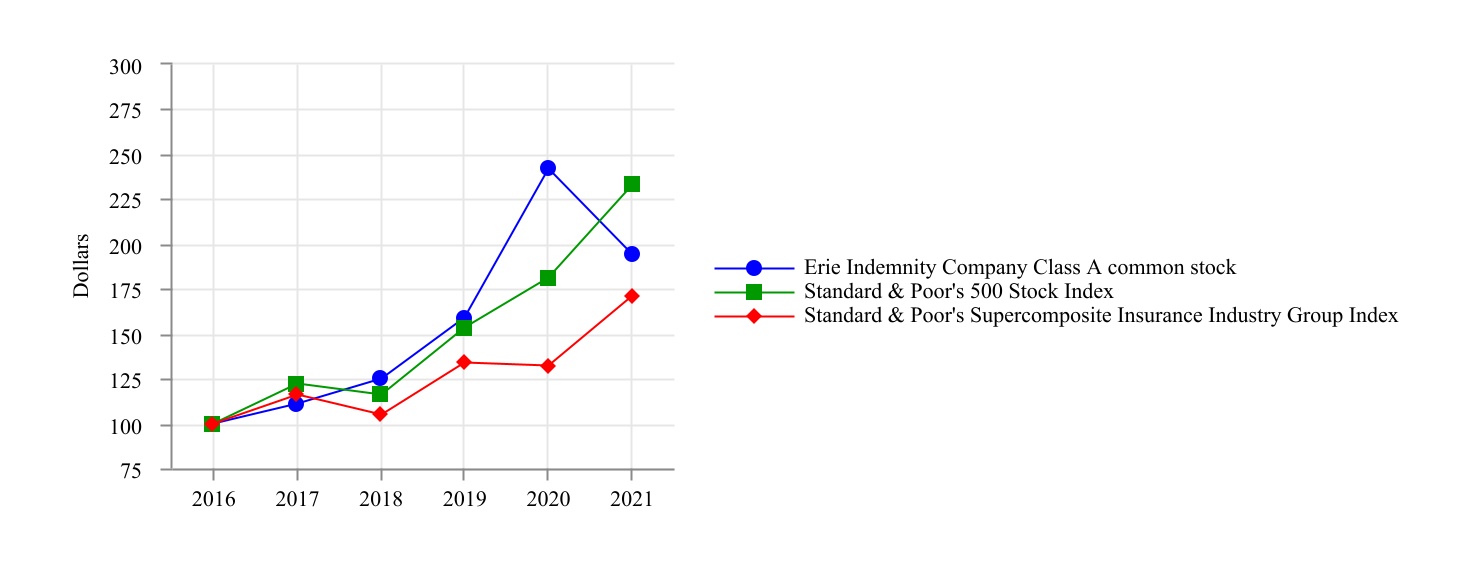
| | | | | | | | | | | | | | | | | | | | | | | | | | | | | | | | | | | | | | |
| | 2016 | | 2017 | | 2018 | | 2019 | | 2020 | | 2021 |
| Erie Indemnity Company Class A common stock | | $ | 100 | | (1) | $ | 111 | | | $ | 125 | | | $ | 159 | | | $ | 242 | | | $ | 194 | |
| Standard & Poor's 500 Stock Index | | 100 | | (1) | 122 | | | 116 | | | 153 | | | 181 | | | 233 | |
| Standard & Poor's Supercomposite Insurance Industry Group Index | | 100 | | (1) | 116 | | | 105 | | | 134 | | | 132 | | | 171 | |

| | | | | | | | | | | | | | | | | | | | | | | | | | | | | | | | | | | | | | |
| | 2018 | | 2019 | | 2020 | | 2021 | | 2022 | | 2023 |
| Erie Indemnity Company Class A common stock | | $ | 100 | | (1) | $ | 127 | | | $ | 194 | | | $ | 155 | | | $ | 205 | | | $ | 281 | |
| Standard & Poor's 500 Stock Index | | 100 | | (1) | 131 | | | 156 | | | 200 | | | 164 | | | 207 | |
| Standard & Poor's Supercomposite Insurance Industry Group Index | | 100 | | (1) | 128 | | | 127 | | | 163 | | | 178 | | | 196 | |
(1) Assumes $100 invested at the close of trading, including reinvestment of dividends, on the last trading day preceding the first day of the fifth preceding fiscal year, in our Class A common stock, the Standard & Poor's 500 Stock Index, and the Standard & Poor's Supercomposite Insurance Industry Group Index.
Issuer Purchases of Equity Securities
We may purchase shares, from time-to-time, in the open market, through trading plans entered into with one or more brokerage firms pursuant to Rule 10b5-1 under the Securities Exchange Act of 1934, or through privately negotiated transactions. The purchase of shares is dependent upon prevailing market conditions and alternate uses of capital, and at times and in a manner that is deemed appropriate.
Our Board of Directors authorized a stock repurchase program effective January 1, 1999, allowing the repurchase of our outstanding Class A nonvoting common stock. Various approvals for continuation of this program have since been authorized, with the most recent occurring in 2011 for $150 million, which was authorized with no time limitation. There were no repurchases
The following table presents the number and average price of our outstanding Class A nonvoting common stock under this programshares purchased during the quarter ending December 31, 2021. We had approximately $17.8 million of repurchase authority remaining under this program, based upon trade date, at both December 31, 2021 and February 18, 2022.2023:
| | | | | | | | | | | | | | | | | | | | | | | | | | |
| (dollars in thousands, except per share data) | | | | | | |
| Period | | Total number of shares purchased | | Average price paid per share | | Total number of shares purchased as part of publicly announced program | | Dollar value of shares that may yet be purchased under the program |
| | | | | | | | |
| October 1–31, 2023 | | — | | $ | — | | | — | | $ | 17,754 | |
November 1–30, 2023 (1) | | 1,258 | | 277.03 | | — | | 17,754 | |
| December 1–31, 2023 | | — | | — | | | — | | 17,754 | |
| Total | | 1,258 | | 277.03 | | | — | | |
| | | | | | | | |
(1)Represents shares purchased on the open market to fund the rabbi trust for the outside director deferred stock compensation plan.
See Item 8. "Financial Statements and Supplementary Data –- Note 12, Capital Stock,10, Incentive and Deferred Compensation Plans, of Notes to Financial Statements" contained within this report for discussion of additional information on shares purchased outside of this program.
ITEM 6. SELECTED FINANCIAL DATA
Not applicable.
ITEM 7. MANAGEMENT'S DISCUSSION AND ANALYSIS OF FINANCIAL CONDITION AND RESULTS OF OPERATIONS
The following discussion of financial condition and results of operations highlights significant factors influencing Erie Indemnity Company ("Indemnity", "we", "us", "our"). This discussion should be read in conjunction with the audited financial statements and related notes and all other items contained within this Annual Report on Form 10-K as these contain important information helpful in evaluating our financial condition and results of operations.
INDEX
CAUTIONARY STATEMENT REGARDING FORWARD-LOOKING INFORMATION
"Safe Harbor" Statement under the Private Securities Litigation Reform Act of 1995:
Statements contained herein that are not historical fact are forward-looking statements and, as such, are subject to risks and uncertainties that could cause actual events and results to differ, perhaps materially, from those discussed herein. Forward-looking statements relate to future trends, events or results and include, without limitation, statements and assumptions on which such statements are based that are related to our plans, strategies, objectives, expectations, intentions, and adequacy of resources. Examples of forward-looking statements are discussions relating to premium and investment income, expenses, operating results, and compliance with contractual and regulatory requirements. Forward-looking statements are not guarantees of future performance and involve risks and uncertainties that are difficult to predict. Therefore, actual outcomes and results may differ materially from what is expressed or forecasted in such forward-looking statements. Among the risks and
uncertainties, in addition to those set forth in our filings with the Securities and Exchange Commission, that could cause actual results and future events to differ from those set forth or contemplated in the forward-looking statements include the following:
•dependence upon our relationship with the Erie Insurance Exchange ("Exchange") and the management fee under the agreement with the subscribers at the Exchange;
•dependence upon our relationship with the Exchange and the growth of the Exchange, including:
◦general business and economic conditions;
◦factors affecting insurance industry competition;competition, including technological innovations;
◦dependence upon the independent agency system; and
◦ability to maintain our brand, including our reputation for customer service;
•dependence upon our relationship with the Exchange and the financial condition of the Exchange, including:
◦the Exchange's ability to maintain acceptable financial strength ratings;
◦factors affecting the quality and liquidity of the Exchange's investment portfolio;
◦changes in government regulation of the insurance industry;
◦litigation and regulatory actions;
◦emergence of significant unexpected events, including pandemics;pandemics and economic or social inflation;
◦emerging claims and coverage issues in the industry; and
◦severe weather conditions or other catastrophic losses, including terrorism;
•costs of providing policy issuance and renewal services to the subscribers at the Exchange under the subscriber's agreement;
•ability to attract and retain talented management and employees;
•ability to ensure system availability and effectively manage technology initiatives;
•difficulties with technology or data security breaches, including cyber attacks;
•ability to maintain uninterrupted business operations;
•compliance with complex and evolving laws and regulations and outcome of pending and potential litigation;
•factors affecting the quality and liquidity of our investment portfolio; and
•our ability to meet liquidity needs and access capital.
A forward-looking statement speaks only as of the date on which it is made and reflects our analysis only as of that date. We undertake no obligation to publicly update or revise any forward-looking statement, whether as a result of new information, future events, changes in assumptions, or otherwise.
RECENT ACCOUNTING STANDARDS
See Item 8. "Financial Statements and Supplementary Data - Note 2, Significant Accounting Policies, of Notes to Financial Statements" contained within this report for a discussion of recently adoptedissued accounting standards and the impact on our financial statements.statements if known.
OPERATING OVERVIEW
Overview
We are a Pennsylvania business corporation that since 1925 has been the managing attorney-in-fact for the subscribers (policyholders) at the Exchange, a reciprocal insurer that writes property and casualty insurance. Our primary function as attorney-in-fact is to perform policy issuance and renewal services on behalf of the subscribers at the Exchange. We also act as attorney-in-fact on behalf of the subscribers at the Exchange, as well as the service provider for itsthe Exchange's insurance subsidiaries, with respect to all administrative services.
The Exchange is a reciprocal insurance exchange, which is an unincorporated association of individuals, partnerships and corporations that agree to insure one another. Each applicant for insurance (a subscriber) to the Exchange signs a subscriber's agreement, which contains an appointment of Indemnity as their attorney-in-fact to transact the business of the Exchange on their behalf.
Pursuant toIn accordance with the subscriber’s agreement for acting as attorney-in-fact in these two capacities, we earnretain a management fee. Management fee revenue is based upon all direct and affiliated assumed premiums written by the Exchange and the management fee rate, which is not to exceed 25%. Our Board of Directors establishes the management fee rate at least annually, generally in December for the following year. The process of setting the management fee rate includes, but is not limited to, the evaluation of current year operating results compared to both prior year and industry estimated results for both Indemnity and the Exchange, and consideration of several factors for both entities including:including, but not limited to: their relative financial strength and capital position; projected revenue, expense and earnings for the subsequent year; future capital needs; as well as competitive position. The management fee rate was set at 25% for 2021, 20202023, 2022 and 2019. Our2021. Based on analysis of the foregoing factors, our Board of Directors set the 20222024 management fee rate again at 25%, its maximum level..
Our earnings are primarily driven by the management fee revenue generated for the services we provide toon behalf of the subscribers at the Exchange. The policy issuance and renewal services we provide to the Exchange are related to the sales, underwriting and issuance of policies. The sales related services we provide include agent compensation and certain sales and advertising support services. Agent compensation includes scheduled commissions to agents based upon premiums written as well as additional commissions and bonuses to agents,incentive compensation, which areis earned by achieving targeted measures. Agent compensation comprised approximately 66%67% of our 20212023 policy issuance and renewal expenses. The underwriting services we provide include underwriting and policy processing and comprised approximately 10%9% of our 20212023 policy issuance and renewal expenses. The remaining services we provide include customer service and administrative support. We also provide information technology services that support all the functions listed above that comprised approximately 11% of our 20212023 policy issuance and renewal expenses. Included in these expenses are allocations of costs for departments that support these policy issuance and renewal functions.
By virtue ofConsistent with its legal structure as a reciprocal insurer, the Exchange does not have any employees or officers. Therefore, it enters into contractual relationships by and through anthe subscribers' attorney-in-fact. Indemnity serves as the attorney-in-fact on behalf of the subscribers at the Exchange with respect to its administrative services.services as enumerated in the subscriber's agreement. The Exchange's insurance subsidiaries also utilize Indemnity for these services in accordance with the service agreements between each of the subsidiaries and Indemnity. Claims handling services include costs incurred in the claims process, including the adjustment, investigation, defense, recording and payment functions. Life insurance management services include costs incurred in the management and processing of life insurance business. Investment management services are related to
investment trading activity, accounting and all other functions attributable to the investment of funds. Included inIn 2023, approximately 71% of the administrative services expenses were entirely attributable to the respective administrative functions (claims handling, life insurance management and investment management), while the remaining 29% of these expenses arewere allocations of costs for departments that support these administrative functions. The expenses we incur and related reimbursements we receive for administrative services are presented gross in our Statements of Operations. The subscriber's agreement and service agreements provide for reimbursement of amounts incurred for these services to Indemnity. Reimbursements are reimbursed to Indemnitysettled at cost in accordance with the subscriber's agreement and the service agreements.on a monthly basis. State insurance regulations require that intercompany service agreements and any material amendments be approved in advance by the state insurance department.
Our results of operations are tied to the growth and financial condition of the Exchange as the Exchange is our sole customer, and our earnings are largely generated from management fees based on the direct and affiliated assumed premiums written by the Exchange. The Exchange generates revenue by insuring preferred and standard risks, with personal lines comprising 70% of the 20212023 direct and affiliated assumed written premiums and commercial lines comprising the remaining 30%. The principal personal lines products are private passenger automobile and homeowners. The principal commercial lines products are commercial multi-peril, commercial automobile and workers compensation.
We generate investment income from our fixed maturity and equity security portfolios. Our portfolio is managed with the objective of maximizing after-tax returns on a risk-adjusted basis. We actively evaluate the fixed maturity portfolios for securities in an unrealized loss position and record impairment write-downs on investments in instances where we have the intent to sell or it's more likely than not that we would be required to sell the security. Impairments resulting from a credit loss are recognized in earnings with a corresponding allowance on the balance sheet.Statement of Financial Position.
Coronavirus ("COVID-19") Pandemic
In March 2020, the outbreak of the coronavirus ("COVID-19") was declared a global pandemic and pandemic conditions have influenced various economic factors, including a more inflationary environment in recent months. As the uncertainty resulting from the COVID-19 pandemic and subsequent resulting conditions continues to evolve, the ultimate impact and duration remain uncertain at this time. The following sections provide a summary of the more relevant financial impacts, risk monitoring activities, and operational considerations for Indemnity and the Exchange.
The impact the COVID-19 pandemic has on the premiums written by the Exchange, our sole customer, affects our management fee revenue. The uncertainty of the ongoing impacts of the COVID-19 pandemic will likely continue until such time as the spread of the virus is contained or reaches endemic status. In response to reduced driving conditions in 2020 resulting from the COVID-19 pandemic, the Exchange implemented $200 million in personal and commercial auto rate reductions on policies written between July 1, 2020 and June 30, 2021. These rate reductions resulted in a decrease to Exchange’s written premium of approximately $110 million and $90 million for 2021 and 2020, respectively, and a corresponding decrease in our management fee revenue of approximately $27.5 million and $22.5 million in 2021 and 2020, respectively. As driving activity returned to near pre-pandemic levels in 2021, increased claim frequency and severity negatively impacted Exchange’s operations and may continue to impact future premium rates. There may also be other market and/or regulatory pressures that could impact the Exchange’s operations. While financial markets remained generally strong in 2021, we could experience future losses and/or impairments to the portfolio due to the ongoing pandemic and inflationary pressures. We have provided additional disclosure of these impacted areas throughout our Management’s Discussion and Analysis that follows. A broader discussion of the potential future impacts has also been disclosed in Financial Condition and Liquidity and Capital Resources contained within this report, as well as Part I. Item 1A. "Risk Factors" contained within this report.
From March of 2020 through the end of 2021 we had a dedicated internal committee comprised of management from various finance disciplines reviewing our risk positions and emerging trends on an ongoing basis as circumstances were evolving. The committee reviewed risk scenarios and performed stress tests, including the review of cash flow trends, liquidity requirements and other forms of risk quantification. This provided tools for management, as well as our Risk Committee of the Board of Directors, to assess risks and prioritize key issues.
While we were not required to close our physical locations under the state mandated closure of nonessential services, out of concern for the health and safety of our employees, over 90% of our workforce has been working remote since March 2020. We have had no significant interruption to our core business processes or systems to date. We have had no significant changes to our financial close or reporting processes or related internal controls, nor do we anticipate any significant future challenges at this time. We have a dedicated team responsible for the development and implementation of a return to office plan. We began returning some employees to our offices in July 2021, but paused as a result of the national increase in infections. We plan to resume returning employees to our offices in phases when we consider it appropriate.
Financial Overview
| | Years ended December 31, |
| | Years ended December 31, | | | | Years ended December 31, |
| (dollars in thousands, except per share data) | (dollars in thousands, except per share data) | | 2021 | | % Change | | 2020 | | % Change | | 2019 | (dollars in thousands, except per share data) | | 2023 | | % Change | | 2022 | | % Change | | 2021 |
| | | Operating income | Operating income | | $ | 318,097 | | | (5.9) | | % | | $ | 338,157 | | | (5.4) | | % | | $ | 357,339 | |
| | Operating income | |
| | Operating income | |
| Total investment income | Total investment income | | 67,332 | | | NM | | 32,867 | | | (17.8) | | | 39,967 | |
| Interest expense, net | Interest expense, net | | 4,132 | | | NM | | 731 | | | (14.7) | | | 856 | |
| Other (expense) income | | (4,893) | | | NM | | (1,778) | | | NM | | 255 | |
| Other income (expense) | |
| Income before income taxes | Income before income taxes | | 376,404 | | | 2.1 | | | 368,515 | | | (7.1) | | | 396,705 | |
| Income tax expense | Income tax expense | | 78,544 | | | 4.4 | | | 75,211 | | | (5.8) | | | 79,884 | |
| Net income | Net income | | $ | 297,860 | | | 1.6 | | % | | $ | 293,304 | | | (7.4) | | % | | $ | 316,821 | |
| Net income per share - diluted | Net income per share - diluted | | $ | 5.69 | | | 1.6 | | % | | $ | 5.61 | | | (7.4) | | % | | $ | 6.06 | |
NM = not meaningful
Operating income decreasedincreased in 20212023 compared to 20202022 as growth in operating expensesrevenue outpaced the growth in operating revenues.expenses. Management fee revenue is based upon the management fee rate we charge and the direct and affiliated assumed premiums written by the Exchange. The management fee rate was 25% for 2021, 2020,2023, 2022, and 2019.2021. The direct and affiliated assumed premiums written by the Exchange increased 3.3%17.0% to $7.9$10.1 billion in 20212023 and 1.7%9.2% to $7.6$8.6 billion in 2020.2022.
Cost of operations for policy issuance and renewal services increased 5.6%12.0% to $1.7$2.0 billion in 20212023 primarily due to higher scheduled commissions driven by direct and affiliated assumed written premium growth, as well as increased employee compensation and technology costs, increased administrative and other costs, and higher agent incentive compensation from profitable growth.costs. Cost of operations for policy issuance and renewal services increased 3.3%7.0% to $1.6$1.8 billion in 20202022 primarily due to higher scheduled commissions driven by direct and affiliated assumed written premium growth, higheras well as increased professional fees and technology costs. Increases in the cost of operations for policy issuance and renewal services in both periods were partially offset by decreased agent incentive compensation driven by lower automobilehigher claims frequencyseverity and related loss costs experienced by the Exchange, and higher personnel costs.Exchange.
Management fee revenue for administrative services decreased 2.0%increased 9.2% to $58.3$63.7 million in 20212023 compared to an increase of 4.0% to $59.5 million0.1% in 2020.2022. The administrative services reimbursement revenue and corresponding cost of operations increased both total operating revenue and total operating expenses to $638.5by $737.1 million in 20212023 and $609.4$668.3 million in 2020,2022, but had no net impact on operating income.
Total investment income increased $34.5$28.3 million in 20212023 primarily due to lower net realized and unrealized investment losses and an increase in net investment income which was driven by favorable results in our limited partnership portfolio.compared to 2022. Total investment income decreased $7.1$66.7 million in 2020 2022
primarily driven by higher impairments and lowerdue to a decrease in net investment income reflecting lower interest rates dueas well as net realized and unrealized investment losses in 2022 compared to market volatility caused by the COVID-19 pandemic.
General Conditions and Trends Affecting Our Business
Economic conditions
Unfavorable changes in economic conditions, including declining consumer confidence, inflation, high unemployment, and the threat of recession, among others, may lead the Exchange’s customers to modify coverage, not renew policies, or even cancel policies, which could adversely affect the premium revenue of the Exchange, and consequently our management fee. The extent to which economic conditionsfee revenue. Inflation remained elevated from historical levels during 2023. Continued elevated inflation or supply chain disruptions could impact the Exchange’sExchange's operations and our management fee was exacerbated with the COVID-19 pandemic. Further, pandemic conditions have created an inflationary environment in recent months.fees. In particular, unanticipated increased inflation costs including medical cost inflation, building material cost inflation, auto repair and replacement cost inflation, and tort issuessocial inflation may impact adequacy of estimated loss reserves and future premium rates.rates of the Exchange. The extent and duration of the impacts to economic conditions remain uncertain as the pandemic and subsequent resulting conditions continue to evolve.uncertain. If any of these items impacted the financial condition or operations of the Exchange, it could have an impact on our financial results. See Financial Condition, Liquidity and Capital Resources, and Part I, Item 1A. "Risk Factors" contained within this report for a discussion of potential impacts to our operations or those of the Exchange, including pandemics.Exchange.
Financial market volatility
Our portfolio of fixed maturity and equity security investments is subject to market volatility especially in periods of instability in the worldwide financial markets. Over time, net investment income could also be impacted by volatility and by the general level of interest rates, which impact reinvested cash flow from the portfolio and business operations. Depending upon market conditions, which are unpredictable and remain uncertain, considerable fluctuation could existoccur in the fair value of our investment portfolio and reported total investment income, which could have an adverse impact on our financial condition,
results of operations, and cash flows. Significant volatility was seen inVarious ongoing geopolitical events, the uncertain inflationary and interest rate environments, and a potential economic slowdown could have a significant impact on the global financial markets atwith the onset of the COVID-19 pandemic and pandemic related events potential for future losses and/or subsequent resulting conditions, including inflation, may create future volatility. The extent of the impactimpairments on our invested assets cannot be estimated with a high degree of certainty at this time given the ongoing developments of this pandemic and the related impacts on the financial markets.investment portfolio.
CRITICAL ACCOUNTING ESTIMATES
The financial statements include amounts based upon estimates and assumptions that have a significant effect on reported amounts of assets and liabilities at the date of the financial statements and the reported amounts of revenues and expenses during the reporting period and related disclosures. We consider an accounting estimate to be critical if 1) it requires assumptions to be made that were uncertain at the time the estimate was made, and 2) different estimates that could have been used, or changes in the estimate that are likely to occur from period-to-period, could have a material impact on our Statements of Operations or Financial Position.
The following presents a discussion of those accounting policies surrounding estimates that we believe are the most critical to our reported amounts and require the most subjective and complex judgment. If actual events differ significantly from the underlying assumptions, there could be material adjustments to prior estimates that could potentially adversely affect our results of operations, financial condition, and cash flows. The estimates and the estimating methods used are reviewed continually, and any adjustments considered necessary are reflected in current earnings.
Investment Valuation
Fair Value Measurements
We make estimates concerning the fair value of our investments using valuation techniques to derive the fair value of the fixed maturity and equity investments we hold. Fair value is the price that would be received to sell an asset in an orderly transaction between willing market participants at the measurement date.
Fair value measurements are based upon observable and unobservable inputs. Observable inputs reflect market data obtained from independent sources, while unobservable inputs reflect our view of market assumptions in the absence of observable market information. We utilize valuation techniques that maximize the use of observable inputs and minimize the use of unobservable inputs. Our investments are categorized into a three-level fair value hierarchy which assigns a Level 1 for highly observable inputs and a Level 3 to unobservable inputs. We continually assess whether or not an active market exists for all of our investments and as of each reporting date we re-evaluate their classification in the fair value hierarchy.
As of each reporting period, financial instruments recorded at fair value are classified based upon the lowest level of input that is significant to the fair value measurement. The presence of at least one unobservable input that has significant impact to the fair value measurement would result in classification as a Level 3 instrument. Our assessment of the significance of a particular input to the fair value measurement requires judgment, and considers factors specific to the asset, such as the relative impact on
the fair value as a result of including a particular input and market conditions. While estimates of the fair values of our investment portfolio are obtained from outside pricing services, we ultimately determine whether the inputs used are observable or unobservable.
As of December 31,2021,31, 2023, substantially all of the securities measured at fair value in our investment portfolio are classified as Level 2. Level 2 securities are valued using industry-standard models that consider various inputs, such as the interest rate and credit spread for the underlying financial instruments. All significant inputs are observable, or derived from observable information in the marketplace, or are supported by observable levels at which transactions are executed in the marketplace. At December 31, 2021,2023, our investments classified as Level 3 were not significant.
See Item 8. "Financial Statements and Supplementary Data - Note 5, Fair Value, of Notes to Financial Statements" contained within this report for additional details on the fair value measurement of our investments.
Impairments
Our fixed maturity portfolio experienced unrealized losses in 2023 and 2022 as a result of the higher interest rate environment compared to prior years. We regularly monitor our fixed maturity and equity security portfolios for price changes and perform detailed reviews of securities in an unrealized loss position that may indicate that credit-related or other impairments exist.
As of December 31, 2021, we do not have significant unrealized losses2023, our intent to sell and our credit-related or other impairments were not material to our financial condition or results of operations.
See Item 8. "Financial Statements and Supplementary Data - Note 2, Significant Accounting Policies, of Notes to Financial Statements" contained within this report for additional details on impairments of available-for-sale securities.
Retirement Benefit Plans for Employees
Our pension plans consist of a noncontributory defined benefit pension plan covering substantially all employees and an unfunded supplemental employee retirement plan ("SERP") for certain members of executive and senior management. Although we are the sponsor of these postretirement plans and record the funded status of these plans, there are reimbursements between us and the Exchange and its subsidiaries reimburse us for approximately 58% of the annual benefit expense of these plans, which includes pension benefits for employees performing administrative services and the Exchange'stheir allocated share of costspension income or cost. See Item 8. "Financial Statements and Supplementary Data - Note 9, Postretirement Benefits, of Notes to Financial Statements" contained within this report for employees in departments that support the administrative functions.additional details on these reimbursements.
Our pension obligation is developed from actuarial estimates. Several statistical and other factors, which attempt to anticipate future events, are used in calculating the expense and liability related to the plans. Key factors include assumptions about the discount rates and expected rates of return on plan assets. We review these assumptions annually and modify them considering historical experience, current market conditions, including changes in investment returns and interest rates, and expected future trends.
Accumulated and projected benefit obligations are expressed as the present value of future cash payments. We discount those cash payments based upon a yield curve developed from corporate bond yield information with maturities that correspond to the payment of benefits. Lower discount rates increase present values and subsequent year pension expense, while higher discount rates decrease present values and subsequent year pension expense. The construction of the yield curve is based upon yields of corporate bonds rated AA or equivalent quality. Target yields are developed from bonds at various maturity points and a curve is fitted to those targets. Spot rates (zero coupon bond yields) are developed from the yield curve and used to discount benefit payment amounts associated with each future year. The present value of plan benefits is calculated by applying the spot/discount rates to projected benefit cash flows. A single discount rate is then developed to produce the same present value. The cash flows from the yield curve were matched against our projected benefit payments in the pension plan, which have a duration of about 1915 years. This yield curve supported the selection of a 3.16%5.34% discount rate for the projected benefit obligation at December 31, 20212023 and for the 20222024 pension expense.income. The same methodology was used to develop the 2.96%5.67% and 3.59%3.16% discount rates used to determine the projected benefit obligation for 20202022 and 2019,2021, respectively, and the pension income for 2023 and expense for 2021 and 2020,2022, respectively. A 25 basis point decrease in the discount rate assumption, with other assumptions held constant, would increase pension cost in the following year by $6.4$4.1 million, of which our share would be approximately $2.7$1.6 million, and would increase the pension benefit obligation by $59.2$37.2 million.
Unrecognized actuarial gains and losses arise from several factors, including experience and assumption changes in the obligations and from the difference between expected returns and actual returns on plan assets. These unrecognized gains and losses are recorded in the pension plan obligation and accumulated other comprehensive income (loss). These amounts are systematically recognized to net periodic pension expense in future periods, with gains decreasing and losses increasing future pension expense. If actuarial net gains or losses exceed 5% of the greater of the projected benefit obligation and the market-relatedmarket-
related value of plan assets, the excess is recognized through the net periodic pension expense equally over the estimated service period of the employee group, which is currently 14 years.
The expected long-term rate of return for the pension plan represents the average rate of return to be earned on plan assets over the period the benefits included in the benefit obligation are to be paid. To determine the expected long-term rate of return assumption, we utilized models based upon rigorous historical analysis and forward-looking views of the financial markets based upon key factors such as historical returns for the asset class' applicable indices, the correlations of the asset classes under various market conditions and consensus views on future real economic growth and inflation. The expected future return for each asset class is then combined by considering correlations between asset classes and the volatilities of each asset class to produce a reasonable range of asset return results within which our expected long-term rate of return assumption falls. TheWhile the expected long-term rate of return is generally less susceptible to annual revisions as there are typically no significant changes in the asset mix. Basedmix, we increased the expected return on asset assumption from 6.50% to 7.00% in 2024 based on the current asset allocation and considering a review of the key factors and expectations of future asset performance as well as the expected return on asset assumption remained at 5.50% for 2022.current market environment. A change of 25 basis points in the expected long-term rate of return assumption, with other assumptions held constant, would have an estimated $2.4$2.9 million impact on net pension benefit cost in the following year, of which our share would be approximately $1.0$1.2 million.
We use a four-year averaging method to determine the market-related value of plan assets, which is used to determine the expected return component of pension expense. Under this methodology, asset gains or losses that result from returns that differ from our long-term rate of return assumption are recognized in the market-related value of assets on a level basis over a four-year period. The market-related asset experience during 20212023 that related to the actual investment return being different from that assumed during the prior year was a gain of $36.7$36.8 million. Recognition of this gain will be deferred and recognized over a four-year period, consistent with the market-related asset value methodology. Once factored into the market-related asset value, these experience gains and losses will be amortized over a period of 14 years, which is the remaining service period of the employee group.
We expect ourIn 2023, we recognized net pension benefit costsincome of $3.8 million primarily driven by higher discount rates and expected return on assets, partially offset by lower than expected returns during 2022. We continue to decrease from $57.1project net pension benefit income in 2024 as opposed to expense. While our discount rate assumptions decreased for 2024, the estimated increase in net pension benefit income to $4.3 million in 2021 to $45.9 million in 20222024 is primarily resulting from anticipated plan progression and liability gains due to the higher discount rate.an anticipated one-time SERP settlement credit of $1.0 million. Our share of the net pension benefit costsincome after reimbursements was $24.0$0.9 million in 2021.2023. We expect our share of the net pension benefit costsincome to be approximately $19.3$1.4 million in 2022.2024, of which expense of $13.0 million will be recorded in operating expense and income of $14.4 million will be recorded in other income.
The actuarial assumptions we used in determining our pension obligation may differ materially from actual results due to changing market and economic conditions, higher or lower withdrawal rates, or longer or shorter life spans of participants. While we believe that the assumptions used are appropriate, differences in actual experience or changes in assumptions may materially affect our financial position, results of operations, or cash flows. See Item 8. "Financial Statements and Supplementary Data - Note 9, Postretirement Benefits, of Notes to Financial Statements" contained within this report for additional details on the pension plans.
RESULTS OF OPERATIONS
Management fee revenue
We have two performance obligations in the subscriber’s agreement, providing policy issuance and renewal services and acting as attorney-in-fact for the subscribers at the Exchange, as well as the service provider for itsthe Exchange's insurance subsidiaries, with respect to all administrative services. We earnretain management fees for acting as the attorney-in-fact for the subscribers at the Exchange in these two capacities. Ourcapacities and allocate our revenues are allocated between the twoour performance obligations.
Management fee rate
The management fee is calculated by multiplying all direct and affiliated assumed premiums written by the Exchange by the management fee rate, which is determined by our Board of Directors at least annually. The management fee rate was set at 25%, the maximum rate, for 2021, 20202023, 2022 and 2019.2021. Changes in the management fee rate can affect our revenue and net income significantly. The transaction price, including management fee revenue and administrative services reimbursement revenue, includes variable consideration and is allocated based on the estimated standalone selling prices developed using industry information and other available information for similar services. We update the transaction price and the related allocation at least annually based upon the most recent information available or more frequently if there have been significant changes in any components considered in the transaction price. Our current transaction price allocation review resulted in a minor change in the allocation between the two performance obligations in 2021 compared to prior years, which did not have a material impact on our financial statements.
The following table presents the allocation and disaggregation of revenue for our two performance obligations:
| | Years ended December 31, |
| | Years ended December 31, | | | | Years ended December 31, |
| (dollars in thousands) | (dollars in thousands) | | 2021 | | % Change | | 2020 | | % Change | | 2019 | (dollars in thousands) | | 2023 | | % Change | | 2022 | | % Change | | 2021 |
| | Policy issuance and renewal services | Policy issuance and renewal services | |
| Policy issuance and renewal services | |
| Policy issuance and renewal services | |
| Direct and affiliated assumed premiums written by the Exchange | |
| Direct and affiliated assumed premiums written by the Exchange | |
| Direct and affiliated assumed premiums written by the Exchange | Direct and affiliated assumed premiums written by the Exchange | | $ | 7,868,311 | | | 3.3 | | % | | $ | 7,613,519 | | | 1.7 | | % | | $ | 7,486,030 | |
| Management fee rate | Management fee rate | | 24.3 | % | | 24.2 | % | | 24.2 | % | Management fee rate | | 24.30 | % | | | | | 24.30 | % | | | | | 24.30 | % |
| Management fee revenue | Management fee revenue | | 1,912,000 | | | 3.8 | | | 1,842,472 | | | 1.7 | | | 1,811,619 | |
Change in estimate for management fee returned on cancelled policies (1) | Change in estimate for management fee returned on cancelled policies (1) | | 1,166 | | | NM | | (678) | | | 41.7 | | | (1,162) | |
| Management fee revenue - policy issuance and renewal services | Management fee revenue - policy issuance and renewal services | | $ | 1,913,166 | | | 3.9 | | % | | $ | 1,841,794 | | | 1.7 | | % | | $ | 1,810,457 | |
| | Administrative services | Administrative services | |
| Administrative services | |
| Administrative services | |
| Direct and affiliated assumed premiums written by the Exchange | |
| Direct and affiliated assumed premiums written by the Exchange | |
| Direct and affiliated assumed premiums written by the Exchange | Direct and affiliated assumed premiums written by the Exchange | | $ | 7,868,311 | | | 3.3 | | % | | $ | 7,613,519 | | | 1.7 | | % | | $ | 7,486,030 | |
| Management fee rate | Management fee rate | | 0.7 | % | | 0.8 | % | | 0.8 | % | Management fee rate | | 0.70 | % | | | | | 0.70 | % | | | | | 0.70 | % |
| Management fee revenue | Management fee revenue | | 55,078 | | | (9.6) | | | 60,908 | | | 1.7 | | | 59,888 | |
Change in contract liability (2) | Change in contract liability (2) | | 3,195 | | | NM | | (1,376) | | | 47.8 | | | (2,633) | |
Change in estimate for management fee returned on cancelled policies (1) | Change in estimate for management fee returned on cancelled policies (1) | | 13 | | | NM | | (69) | | | (34.6) | | | (51) | |
| | Management fee revenue - administrative services | Management fee revenue - administrative services | | 58,286 | | | (2.0) | | | 59,463 | | | 4.0 | | | 57,204 | |
| Management fee revenue - administrative services | |
| Management fee revenue - administrative services | |
| Administrative services reimbursement revenue | Administrative services reimbursement revenue | | 638,483 | | | 4.8 | | | 609,435 | | | 4.7 | | | 582,010 | |
| Total revenue from administrative services | Total revenue from administrative services | | $ | 696,769 | | | 4.2 | | % | | $ | 668,898 | | | 4.6 | | % | | $ | 639,214 | |
NM = not meaningful
(1) A constraining estimate of variable consideration exists related to the potential for management fees to be returned if a policy were to be cancelled mid-term. Management fees are returned to the Exchange when policies are cancelled mid-term and unearned premiums are refunded.
(2) Management fee revenue - administrative services is recognized over time as the services are performed.provided. See Item 8. "Financial Statements - Note 3, Revenue, of Notes to Financial Statements" contained within this report.
Direct and affiliated assumed premiums written by the Exchange
Direct and affiliated assumed premiums include premiums written directly by the Exchange and premiums assumed from its wholly owned property and casualty subsidiaries. Direct and affiliated assumed premiums written by the Exchange increased 3.3%17.0% to $7.9$10.1 billion in 2021,2023, from $7.6$8.6 billion in 2020,2022, primarily driven by increased homeownerspersonal lines and commercial multi-peril premiums written. Year-over-year policies in force for all lines of business increased 3.2%6.9% in 20212023 as the result of continuing strong policyholder retention and an increase in new policies written, compared to 2.1%3.6% in 2020.2022. The year-over-year average premium per policy for all lines of business increased 0.1%9.4% at December 31, 2021,2023, compared to a decrease of 0.4%5.4% at December 31, 2020. The year-over-year average premium per policy at both December 31, 2021 and 2020 was impacted by the rate reductions for personal and commercial auto policies written between July 1, 2020 and June 30, 2021, in response to the lower driving activity and to provide financial relief as a result of the COVID-19 pandemic.2022.
Premiums generated from new business increased 13.2%37.9% to $965 million$1.5 billion in 2021. New2023. Contributing to this change was a 23.7% increase in new business policies written increased 9.0%and a 11.5% increase in 2021 and year-over-year average premium per policy on new business increased 3.9% at December 31, 2021.2023. Premiums generated from new business decreased 1.2%increased 14.5% to $852 million$1.1 billion in 2020. While new business policies written increased 5.0% in 2020, year-over-year2022. Year-over-year average premium per policy on new business decreased 5.9%increased 10.4% at December 31, 2020.2022 and new business policies written increased 3.7% in 2022.
Premiums generated from renewal business increased 2.1%13.9% to $6.9$8.5 billion in 2021, compared2023, and increased 8.5% to 2.1%, or $6.8$7.5 billion, in 2020.2022. Underlying the trend in renewal business premiums was steady policy retention ratios, partially offset by a 0.3% decreasein both periods were increases in year-over-year average premium per policy of 9.0% at December 31, 2021, compared to an increase of 0.4%2023 and 4.7% at December 31, 2020. 2022, as well as an increase in year-over-year policies in force of 4.5% and 3.6% in 2023 and 2022, respectively, driven by a slight increase in policy retention ratios.
The Exchange implements rate changes in order to meet loss cost expectations. In response to reduced driving conditions in 2020 resulting from the COVID-19 pandemic, the Exchange implemented $200 million in personal and commercial auto rate reductions on policies written between July 1, 2020 and June 30, 2021, which negatively impacted Exchange's written premium in 2021 by approximately $110 million. The Exchange began implementing rate increases in 2021 primarily due to increased claims frequency as driving activity returned to near pre-pandemic levels and continued to implement rate increases in 2022 and 2023 primarily as a result of inflation-driven severity increases.
As the Exchange writes policies with annual terms only, rate actions take 12 months to be fully recognized in written premium and 24 months to be recognized in earned premiums. Since rate changes are realized at renewal, it takes 12 months to implement a rate change to all policyholders and another 12 months to earn the increased or decreased premiums in full. As a result, certain rate changes approved in 2020, including those in response to reduced driving conditions resulting from the COVID-19 pandemic,2022 were reflected in 2021,2023, and a portion of the rate actions approved in 20212023 will be reflected in 2022.2024. Furthermore, the Exchange writes certain personal auto policies with a rate locking feature, which generally extends the amount of time it takes for rate actions to be recognized. The Exchange continuously evaluates pricing and product offerings to meet consumer demands.
Personal lines – Total personal lines premiums written increased 2.5%18.7% to $5.5$7.1 billion in 2021,2023, from $5.4$6.0 billion in 2020,2022, driven by ana 10.5% increase in total personal lines year-over-year average premium per policy and a 7.4% increase in total personal lines policies in force of 3.1%.force. Total personal lines year-over-year average premium per policy decreased 0.6%increased 4.4% at December 31, 2021, compared to the prior year, driven by personal auto rate reductions. Total personal lines2022 and policies in force increased 2.2%3.9% in 2020 and year-over-year average premium per policy decreased 0.8% at December 31, 2020.2022.
Commercial lines – Total commercial lines premiums written increased 5.4%13.0% to $2.4$3.0 billion in 2021,2023, compared to 2020,2022, driven by a 3.6% increase in total commercial lines policies in force and a 1.7%9.5% increase in the total commercial lines year-over-year average premium per policy. Total commercial lines premiums written increased 2.6% in 2020, compared to 2019, driven bypolicy and a 1.6%3.2% increase in total commercial lines policies in force andforce. Total commercial lines premiums written increased 11.2% in 2022, compared to 2021, driven by a 0.9%9.0% increase in the total commercial lines year-over-year average premium per policy.policy and a 2.0% increase in total commercial lines policies in force.
Future trends-premium revenue – Through a careful agency selection and monitoring process, the Exchange plans to continue its effortefforts to expand the size ofutilize its agency force to increase market penetration in existing operating territories to contribute to future growth.
Changes in premium levels attributable to the growth in policies in force directly affect the profitability of the Exchange and have a direct bearing on our management fee. Our continued focus on underwriting discipline and the maturing of pricing sophistication models have contributed to the Exchange's steady policy retention ratios. The continued growth of its policy base is dependent upon the Exchange's ability to retain existing and attract new subscribers/policyholders. A lack of new policy growth or the inability to retain existing customers could have an adverse effect on the Exchange's premium level growth, and consequently our management fee.
Changes in premium levels attributable to rate changes also directly affect the profitability of the Exchange and have a direct bearing on our management fee. Pricing actions contemplated or taken by the Exchange are subject to various regulatory requirements of the states in which it operates. The pricing actions already implemented, or to be implemented, have an effect on the market competitiveness of the Exchange's insurance products. Such pricing actions, and those of the Exchange's
competitors, could affect the ability of the Exchange's agents to retain and attract new business; additionally,business. We expect the Exchange's pricing actions in 2023 to result in an increase in direct written premiums in 2024; however, exposure reductions and/or changes in mix of business as a result of economic conditions due to the COVID-19 pandemic or other significant unexpected events could impact the average premium writtendirect and affiliated assumed premium written by the Exchange, as customers may reduce coverages. Future premiums could also be impacted by potential regulatory changes resulting from the COVID-19 pandemic. Longer-term, increased driving activity may result in increased future rates due to higher claims and severity. We expect the Exchange's pricing actions to result in a net increase in direct written premium in 2022; however, the extent of the impact to the Exchange's premiums and our management fee cannot be estimated with a high degree of certainty at this time given the ongoing developments related to this pandemic and current inflationary trends. See also Part I, Item 1A. "Risk Factors" contained within this report.
Policy issuance and renewal services
| | Years ended December 31, |
| | Years ended December 31, | | | | Years ended December 31, |
| (dollars in thousands) | (dollars in thousands) | | 2021 | | % Change | | 2020 | | % Change | | 2019 | (dollars in thousands) | | 2023 | | % Change | | 2022 | | % Change | | 2021 |
| | Management fee revenue - policy issuance and renewal services | Management fee revenue - policy issuance and renewal services | | $ | 1,913,166 | | | 3.9 | | % | | $ | 1,841,794 | | | 1.7 | | % | | $ | 1,810,457 | |
| Management fee revenue - policy issuance and renewal services | |
| Management fee revenue - policy issuance and renewal services | |
| Service agreement revenue | Service agreement revenue | | 24,042 | | | (6.8) | | | 25,797 | | | (6.6) | | | 27,627 | |
| 1,937,208 | | | 3.7 | | | 1,867,591 | | | 1.6 | | | 1,838,084 | |
| Cost of policy issuance and renewal services | | 1,677,397 | | | 5.6 | | | 1,588,897 | | | 3.3 | | | 1,537,949 | |
| | 2,468,132 | |
| Cost of operations - policy issuance and renewal services | |
| Operating income - policy issuance and renewal services | Operating income - policy issuance and renewal services | | $ | 259,811 | | | (6.8) | | % | | $ | 278,694 | | | (7.1) | | % | | $ | 300,135 | |
|
Policy issuance and renewal services
We allocate a portion of theThe management fee which currently equates to 24.3%revenue allocated for providing policy issuance and renewal services was 24.30% of the direct and affiliated assumed premiums written by the Exchange for providing policy issuance2023, 2022, and renewal services. The allocation of management fee for these services was 24.2% in both 2020 and 2019.2021. This portion of the management fee is recognized as revenue when the policy is issued or renewed because it is at that time that the services we provide are substantially complete and the executed insurance policy is transferred to the customer. The increase in management fee revenue for policy issuance and renewal services was driven by the increase in the direct and affiliated assumed premiums written by the Exchange discussed previously.
Service agreement revenue
Service agreement revenue primarily consists of service charges we collect from subscribers/policyholders for providing multiple payment plans on policies written by the Exchange and its property and casualty subsidiaries and also includes late payment and policy reinstatement fees. The service charges are fixed dollar amounts per billed installment. Service agreement revenue also includes fees received from the Exchange for the use of shared office space. The decreaseincrease in service agreement revenue reflects the continued shiftin 2023 and 2022 is primarily due to payment plans that do not incur service charges or offer a premium discount for certain payment methods.an increase in shared office space revenue.
Cost of policy issuance and renewal services
| | Years ended December 31, |
| | Years ended December 31, | | | | Years ended December 31, |
| (dollars in thousands) | (dollars in thousands) | | 2021 | | % Change | | 2020 | | % Change | | 2019 | (dollars in thousands) | | 2023 | | % Change | | 2022 | | % Change | | 2021 |
| | Commissions: | Commissions: | |
| Commissions: | |
| Commissions: | |
| Total commissions | |
| Total commissions | |
| Total commissions | Total commissions | | $ | 1,108,426 | | | 5.4 | | % | | $ | 1,051,272 | | | 2.6 | | % | | $ | 1,024,654 | |
| Non-commission expense: | Non-commission expense: | | | | | | |
| Underwriting and policy processing | |
| Underwriting and policy processing | |
| Underwriting and policy processing | Underwriting and policy processing | | $ | 165,183 | | | 2.8 | | % | | $ | 160,646 | | | 3.7 | | % | | $ | 154,934 | |
| Information technology | Information technology | | 185,096 | | | 6.5 | | | 173,827 | | | 3.7 | | | 167,600 | |
| Sales and advertising | Sales and advertising | | 52,511 | | | (1.3) | | | 53,212 | | | 1.6 | | | 52,362 | |
| Customer service | Customer service | | 36,720 | | | 6.0 | | | 34,638 | | | 7.1 | | | 32,353 | |
| Administrative and other | Administrative and other | | 129,461 | | | 12.3 | | | 115,302 | | | 8.7 | | | 106,046 | |
| Total non-commission expense | Total non-commission expense | | 568,971 | | | 5.8 | | | 537,625 | | | 4.7 | | | 513,295 | |
| Total cost of policy issuance and renewal services | Total cost of policy issuance and renewal services | | $ | 1,677,397 | | | 5.6 | | % | | $ | 1,588,897 | | | 3.3 | | % | | $ | 1,537,949 | |
|
Commissions – Commissions increased $57.2$169.0 million in 20212023 compared to 2020 resulting from higher2022, primarily driven by the growth in direct and affiliated assumed premiums written premium, partially offset by the Exchange, primarily in lines of business that pay a higher commission rate. To a lesser extent, there was also an increasedecrease in agent incentive compensation. The profitability component of agent incentive compensation decreased due to higher claims severity and related loss costs in 2021the three-year period ended 2023 compared to 2020 related to profitable growth.the three-year period ended 2022. Commissions increased $26.6$71.1 million in 20202022 compared to 2019 resulting from higher2021, primarily driven by the growth in direct and affiliated assumed premiums written premium, partially offset by the Exchange and higher agent incentive compensation. The Exchange experienced a significant decrease in automobile claims frequency and related loss expense beginning March 2020 that continued through May 2020 driven by the COVID-19 pandemic, which contributed to an increase in the profitability component of the agent incentive bonuses.
incentive compensation. The profitability component of agent incentive compensation decreased due to higher claims severity and related loss costs experienced primarily in 2022.
Non-commission expense – Non-commission expense increased $31.3$46.9 million in 20212023 compared to 2020.2022. Underwriting and policy processing costs increased $4.5$9.4 million primarily due to increased personnel costs and underwriting report costs.policies in force growth. Information technology costs increased $11.3 million primarily due to increased hardware and software costs and personnel costs. Administrative and other expenses increased $14.2$18.6 million primarily due to increased professional fees, and building and equipment depreciation. Personnel costs in all categories were impacted by higher medical costs compared to the prior year as the COVID-19 pandemic reduced elective procedures in 2020.
In 2020, non-commission expense increased $24.3 million compared to 2019. Underwriting and policy processing costs increased $5.7 million primarily due to increased personnel costs and underwriting report costs. Information technology costs increased $6.2 million primarily due to increased personnel costs, and hardware and software costs. Administrative and other expenses increased $9.3$20.0 million primarily due to an increase in personnel costs. Personnel costs in 2023 were impacted by increased compensation including higher estimated costs for incentive plan awards, partially offset by lower pension costs due to an increase in the discount rate compared to 2022. Increases in incentive plan costs were driven by improved direct written premium and policies in force growth and Indemnity's higher stock price at year-end 2023 compared to 2022.
In 2022, non-commission expense increased $47.1 million compared to 2021. Underwriting and policy processing costs increased $6.4 million primarily due to increased underwriting report, printing, and personnel costs. IncreasedInformation technology costs increased $13.1 million primarily due to increased hardware and software costs and professional fees, partially offset by decreased personnel costs. Sales and advertising costs increased $7.5 million primarily due to increased advertising and agent-related expenses. Administrative and other expenses increased $22.5 million primarily due to an increase in personnel costs in all categories included higher incentive plan award accruals related to underwriting performance in 2020 compared to targetscompensation and higher vacation accruals as employees took less vacation in 2020 as a result of the COVID-19 pandemic.increased professional fees.
Administrative services
| | Years ended December 31, |
| | Years ended December 31, | | | | Years ended December 31, |
| (dollars in thousands) | (dollars in thousands) | | 2021 | | % Change | | 2020 | | % Change | | 2019 | (dollars in thousands) | | 2023 | | % Change | | 2022 | | % Change | | 2021 |
| | Management fee revenue - administrative services | |
| Management fee revenue - administrative services | |
| Management fee revenue - administrative services | Management fee revenue - administrative services | | $ | 58,286 | | | (2.0) | | % | | $ | 59,463 | | | 4.0 | | % | | $ | 57,204 | |
| Administrative services reimbursement revenue | Administrative services reimbursement revenue | | 638,483 | | | 4.8 | | | 609,435 | | | 4.7 | | | 582,010 | |
| Total revenue allocated to administrative services | Total revenue allocated to administrative services | | 696,769 | | | 4.2 | | | 668,898 | | | 4.6 | | | 639,214 | |
| Administrative services expenses | Administrative services expenses | |
| Claims handling services | Claims handling services | | 546,962 | | | 4.2 | | | 525,072 | | | 3.7 | | | 506,491 | |
| Claims handling services | |
| Claims handling services | |
| Investment management services | Investment management services | | 38,862 | | | 5.5 | | | 36,835 | | | 9.5 | | | 33,640 | |
| Life management services | Life management services | | 52,659 | | | 10.8 | | | 47,528 | | | 13.5 | | | 41,879 | |
| Operating income - administrative services | Operating income - administrative services | | $ | 58,286 | | | (2.0) | | % | | $ | 59,463 | | | 4.0 | | % | | $ | 57,204 | |
Administrative services
We allocate a portion of theThe management fee which currently equatesrevenue allocated to 0.7%administrative services was 0.70% of the direct and affiliated assumed premiums written by the Exchange to the administrative services. The allocation of management fee for these services was 0.8% in both 20202023, 2022, and 2019.2021. This portion of the management fee is recognized as revenue over a four-year period representing the time over which the services are provided. We also report reimbursed costs as revenues, which are recognized monthly as services are provided. The administrative services expenses we incur and the related reimbursements we receive are recorded gross in the Statements of Operations.
Cost of administrative services
By virtue ofConsistent with its legal structure as a reciprocal insurer, the Exchange does not have any employees or officers. Therefore, it enters into contractual relationships by and through anthe subscribers' attorney-in-fact. Indemnity serves as the attorney-in-fact on behalf of the subscribers at the Exchange with respect to its administrative services as enumerated in accordance with the subscriber's agreement. The Exchange's insurance subsidiaries also utilize Indemnity for these services in accordance with the service agreements between each of the subsidiaries and Indemnity. The subscriber's agreement and service agreements provide for reimbursement of amounts incurred for these services are reimbursed to Indemnity at cost in accordance with the subscriber's agreement and the service agreements. We record these reimbursementsIndemnity. Reimbursements due from the Exchange and its insurance subsidiaries are recorded as a receivable.receivable and settled at cost.
Total investment income
A summary of the results of our investment operations is as follows for the years ended December 31:
| | | (dollars in thousands) | (dollars in thousands) | | 2021 | | % Change | | 2020 | | % Change | | 2019 |
| | (dollars in thousands) | |
| | (dollars in thousands) | | | 2023 | | % Change | | 2022 | | % Change | | 2021 |
| | Net investment income | Net investment income | | $ | 62,177 | | | NM | | $ | 29,753 | | | (12.6) | | % | | $ | 34,059 | |
| Net realized and unrealized investment gains | | 4,946 | | | (22.6) | | | 6,392 | | | 4.7 | | | 6,103 | |
| Net impairment recoveries (losses) recognized in earnings | | 209 | | | NM | | (3,278) | | | NM | | (195) | |
| Net investment income | |
| Net investment income | |
| Net realized and unrealized investment (losses) gains | |
| Net impairment (losses) recoveries recognized in earnings | |
| | Total investment income | |
| Total investment income | |
| Total investment income | Total investment income | | $ | 67,332 | | | NM | | $ | 32,867 | | | (17.8) | | % | | $ | 39,967 | |
|
NM = not meaningful
Net investment income
Net investment income includes interest and dividends on our fixed maturity and equity security portfolios and the results of our limited partnership investments, net of investment expenses. Net investment income increased by $32.4$16.0 million in 2021,2023, compared to 2020,2022, primarily due to an increase in bond and cash and cash equivalent income as a result of higher yields and increased rates. Net investment income decreased $33.6 million in 2022, compared to 2021, primarily due to equity in (losses) earnings of limited partnerships. Net investment income includes equity in losses of limited partnerships of $11.3 million and $10.4 million in 2023 and 2022, respectively, and equity in earnings of limited partnerships of $31.7 million in 2021 compared to equity in losses of limited partnerships of $0.6 million in 2020. Net investment income decreased by $4.3 million in 2020, compared to 2019, primarily due to decreased income from cash and cash equivalents driven by lower rates and invested balances, somewhat offset by increased preferred stock income resulting from higher invested balances.2021.
Net realized and unrealized investment (losses) gains (losses)
A breakdown of our net realized and unrealized investment (losses) gains (losses) is as follows for the years ended December 31:
| | | (in thousands) | (in thousands) | | 2021 | | 2020 | | 2019 |
| | (in thousands) | |
| | (in thousands) | | | 2023 | | 2022 | | 2021 |
| | Securities sold: | Securities sold: | | |
| Securities sold: | |
| Securities sold: | |
| Available-for-sale securities | |
| Available-for-sale securities | |
| Available-for-sale securities | Available-for-sale securities | | $ | 5,131 | | | $ | 1,335 | | | $ | 4,619 | |
| Equity securities | Equity securities | | (76) | | | (469) | | | 360 | |
| | Equity securities change in fair value | | (110) | | | 5,525 | | | 1,124 | |
| Change in fair value on remaining equity securities | |
| Change in fair value on remaining equity securities | |
| Change in fair value on remaining equity securities | |
| | Miscellaneous | Miscellaneous | | 1 | | | 1 | | | 0 | |
| Net realized and unrealized investment gains | | $ | 4,946 | | | $ | 6,392 | | | $ | 6,103 | |
| Miscellaneous | |
| Miscellaneous | |
| Net realized and unrealized investment (losses) gains | |
|
Net realized and unrealized losses of $5.8 million in 2023 were primarily due to disposals of available-for-sale and equity securities, partially offset by market value adjustment gains on equity securities. Net realized and unrealized losses of $27.3 million in 2022 were primarily due to disposals of available-for-sale securities and market value adjustments on equity securities, while gains of $4.9 million in 2021 were primarily due to disposals of available-for-sale securities. Net realized and unrealized gains of $6.4 million in 2020 were primarily due to market value adjustments on equity securities and from the sale of available-for-sale securities, while gains of $6.1 million in 2019 were primarily due to sales of available-for-sale securities and increases in fair value of equity securities.
Net impairment (losses) recoveries (losses) recognized in earnings
Net impairment recoverieslosses of $0.2$9.8 million in 2021 were primarily a result2023 include $7.3 million of the change in the current expected credit loss allowance related to our agent loans. Net impairment losses recognized on loans receivable related to real estate development projects supporting the revitalization efforts in our community. See "Other assets" in Item 8. "Financial Statements and Supplementary Data - Note 2, Significant Accounting Policies, of Notes to Financial Statements" for additional information. Impairment losses in 2023 also include $2.4 million related to available-for-sale securities, in 2020 include $2.3including $1.8 million of securities in an unrealized loss position where we had intent to sell prior to recovery of our amortized cost basis and $0.7 million of credit impairment losses. The remaining 2020 impairmentsNet impairment losses of $0.7 million in 2022 were related to available-for-sale securities and include $0.5 million of credit impairment losses and $0.2 million of securities in an unrealized loss position where we had intent to sell prior to recovery of our amortized cost basis. Net impairment recoveries of $0.2 million in 2021 were primarily the result of a change in the current expected credit loss allowance related to our agent loans. The COVID-19 pandemic's impact on financial markets contributed to higher impairment losses on our available-for-sale securities during 2020 compared to other years presented. Net impairment losses recognized in 2019 included securities in an unrealized loss position that we intended to sell prior to expected recovery of our amortized cost basis as well as securities in an unrealized loss position where we determined the loss was other-than-temporary based on credit factors.
Financial Condition of Erie Insurance Exchange
Serving in the capacity of attorney-in-fact for the subscribers at the Exchange, we are dependent on the growth and financial condition of the Exchange, who is our sole customer. The strength of the Exchange and its wholly owned subsidiaries is rated annually by A.M. Best Company through assessing its financial stability and ability to pay claims. The ratings are generally based upon factors relevant to policyholders and are not directed toward return to investors. The Exchange and each of its property and casualty subsidiaries are rated A+ "Superior", the second highest financial strength rating, which is assigned to companies that have achieved superior overall performance when compared to the standards established by A.M. Best and have a superior ability to meet obligations to policyholders over the long term. On July 27, 2021,August 10, 2023, the outlook for the financial strength rating was affirmed as stable. As of December 31, 2021,2023, only approximately 12% of insurance groups, in which the Exchange is included, are rated A+ or higher.
The financial statements of the Exchange are prepared in accordance with statutory accounting principles prescribed by the Commonwealth of Pennsylvania. Financial statements prepared under statutory accounting principles focus on the solvency of the insurer and generally provide a more conservative approach than under U.S. generally accepted accounting principles. Statutory direct written premiums of the Exchange and its wholly owned property and casualty subsidiaries grew 3.3%17.0% to $7.9$10.1 billion in 20212023 from $7.6$8.6 billion in 2020.2022. These premiums, along with investment income, are the major sources of cash that support the operations of the Exchange. Policyholders' surplus, determined under statutory accounting principles, was $11.7$9.3 billion and $10.7$10.1 billion at December 31, 20212023 and 2020,2022, respectively. The Exchange and its wholly owned property and casualty subsidiaries' year-over-year policy retention ratio continues to be high at 90.1%91.2% at December 31, 20212023 and 89.9%90.5% at December 31, 2020.2022.
We have prepared our financial statements considering the financial strength of the Exchange based on its A.M. Best rating and strong level of surplus. We are monitoring risks related to the COVID-19 pandemic on an ongoing basis and believe that the Exchange falls within established risk tolerances. However, seeSee Part I, Item 1A. "Risk Factors" for possible outcomes that could impact that determination.
FINANCIAL CONDITION
Investments
Our investment portfolio is managed with the objective of maximizing after-tax returns on a risk-adjusted basis. The following table presents the carrying value of our investments as of December 31:
| | (dollars in thousands) | (dollars in thousands) | | 2021 | | % to total | | 2020 | | % to total | (dollars in thousands) | | 2023 | | % to total | | 2022 | | % to total |
| Fixed maturities | Fixed maturities | | $ | 946,085 | | | 83 | % | | $ | 928,236 | | | 84 | % | Fixed maturities | | $ | 961,241 | | | 85 | | 85 | % | | $ | 894,661 | | | 84 | | 84 | % |
| Equity securities | Equity securities | | 87,743 | | | 8 | | | 94,090 | | | 9 | |
Agent Loans (1) | | 66,368 | | | 6 | | | 69,212 | | | 6 | |
| Other investments | | 36,846 | | | 3 | | | 14,325 | | | 1 | |
Agent loans (1) | |
Other investments (2) | |
| Total investments | Total investments | | $ | 1,137,042 | | | 100 | % | | $ | 1,105,863 | | | 100 | % | Total investments | | $ | 1,136,307 | | | 100 | | 100 | % | | $ | 1,067,208 | | | 100 | | 100 | % |
(1)The current portion of agent loans is included with prepaidin the line item "Prepaid expenses and other current assets" in the Statements of Financial Position.
(2)The current and long-term portions of other investments are included in the line items "Prepaid expenses and other current assets" and "Other assets, net", respectively, in the Statements of Financial Position.
We continually review our investment portfolio for impairment and determine whether the impairment is a result of credit loss or other factors. We individually analyze all positions with an emphasis on those in a significant unrealized loss position. If we have the intent to sell or it's more likely than not that we would be required to sell the security before recovery of the amortized cost basis, the entire impairment is recognized in earnings. Factors considered in the evaluation of credit loss include the extent to which fair value is less than cost and fundamental factors specific to the issuer such as financial condition, changes in credit ratings, near and long-term business prospects and other factors, as well as the likelihood of recovery of the amortized cost of the security. Impairment resulting from credit loss is recognized in earnings with a corresponding allowance on the balance sheet.Statement of Financial Position. We believe our investment valuation philosophy and accounting practices result in appropriate and timely measurement of fair value and recognition of impairment.
Fixed maturities
Under our investment strategy, we maintain a fixed maturity portfolio that is of high quality and well diversified within each market sector. This investment strategy also achieves a balanced maturity schedule. Our fixed maturity portfolio is managed with the goal of achieving reasonable returns while limiting exposure to risk.
Fixed maturities are carried at fair value with unrealized gains and losses, net of deferred taxes, included in shareholders' equity. Net unrealized gainslosses on fixed maturities, net of deferred taxes, totaled $6.2$24.7 million at December 31, 2021,2023, compared to net unrealized gains of $23.3$52.5 million at December 31, 2020.2022. Our evaluation of deferred tax assets and the need for a valuation allowance included available tax planning strategies that could be implemented, if necessary, to support the realizability of deferred tax assets. We believe those tax strategies are feasible and prudent.
The following table presents a breakdown of the fair value of our fixed maturity portfolio by industry sector and rating as of December 31, 2021:2023: (1)
| | | (in thousands) | (in thousands) | | Non-investment | | Fair |
| | AAA | | AA | | A | | BBB | | grade | | value |
| (in thousands) | |
| | (in thousands) | | | AAA | | AA | | A | | BBB | | Non-investment
grade | | Fair
value |
| Basic materials | Basic materials | | $ | 0 | | | $ | 0 | | | $ | 3,155 | | | $ | 0 | | | $ | 7,937 | | | $ | 11,092 | |
| Communications | Communications | | 0 | | | 8,659 | | | 8,361 | | | 17,283 | | | 17,038 | | | 51,341 | |
| Consumer | Consumer | | 0 | | | 3,138 | | | 17,849 | | | 70,598 | | | 41,639 | | | 133,224 | |
| Diversified | Diversified | | 0 | | | 0 | | | 0 | | | 0 | | | 1,200 | | | 1,200 | |
| Energy | Energy | | 0 | | | 4,116 | | | 7,729 | | | 20,336 | | | 8,501 | | | 40,682 | |
| Financial | Financial | | 0 | | | 1,007 | | | 74,082 | | | 121,559 | | | 17,243 | | | 213,891 | |
| | Industrial | Industrial | | 0 | | | 0 | | | 9,861 | | | 16,794 | | | 26,914 | | | 53,569 | |
| | Industrial | |
| | Industrial | |
Structured securities (2) | Structured securities (2) | | 141,897 | | | 180,935 | | | 26,945 | | | 18,851 | | | 0 | | | 368,628 | |
| Technology | Technology | | 5,150 | | | 0 | | | 7,727 | | | 20,937 | | | 13,908 | | | 47,722 | |
| U.S. Treasury | | 0 | | | 4,292 | | | 0 | | | 0 | | | 0 | | | 4,292 | |
| | Utilities | |
| Utilities | |
| Utilities | Utilities | | 0 | | | 0 | | | 3,707 | | | 12,912 | | | 3,825 | | | 20,444 | |
| Total | Total | | $ | 147,047 | | | $ | 202,147 | | | $ | 159,416 | | | $ | 299,270 | | | $ | 138,205 | | | $ | 946,085 | |
|
(1) Ratings are supplied by S&P, Moody’s, and Fitch. The table is based upon the lowest rating for each security.
(2) Structured securities include residential and commercial mortgage-backed securities, collateralized debt obligations, and asset-backed securities.
Equity Securitiessecurities
Equity securities primarily include nonredeemable preferred stocks and are carried at fair value in the Statements of Financial Position with all changes in unrealized gains and losses reflected in the Statements of Operations.
The following table presents an analysis of the fair value of our equity securities by sector as of December 31: | | | | | | | | | | | | | | | | | | |
| (in thousands) | | 2021 | | 2020 |
| | | | | | | | |
| | | | | | | | |
| Communications | | $ | 0 | | | | | $ | 2,699 | | | |
| Consumer | | 3,314 | | | | | 3,068 | | | |
| | | | | | | | |
| Energy | | 6,448 | | | | | 2,206 | | | |
| Financial services | | 71,722 | | | | | 76,575 | | | |
| | | | | | | | |
| | | | | | | | |
| Industrial | | 0 | | | | | 800 | | | |
| | | | | | | | |
| Utilities | | 6,259 | | | | | 8,742 | | | |
| Total | | $ | 87,743 | | | | | $ | 94,090 | | | |
| | | | | | | | | | | | | | | | | | |
| (in thousands) | | 2023 | | 2022 |
| | | | | | | | |
| | | | | | | | |
| Financial services | | $ | 69,900 | | | | | $ | 61,084 | | | |
| Utilities | | 5,810 | | | | | 5,708 | | | |
| Energy | | 3,901 | | | | | 3,576 | | | |
| Consumer | | 3,915 | | | | | 1,854 | | | |
| Technology | | 500 | | | | | 0 | | | |
| Industrial | | 180 | | | | | 0 | | | |
| Communications | | 47 | | | | | 338 | | | |
| | | | | | | | |
| | | | | | | | |
| | | | | | | | |
| Total | | $ | 84,253 | | | | | $ | 72,560 | | | |
Shareholders' Equity
Postretirement benefit plans
The funded status of our postretirement benefit plans is recognized in the Statements of Financial Position, with a corresponding adjustment to accumulated other comprehensive income (loss), net of tax. At December 31, 2021,2023, shareholders' equity amounts related to these postretirement plans decreased by $33.8 million, net of tax, of which $11.0 million represents amortization of the prior service cost and net actuarial gain and $22.8 million represents the current period actuarial loss. The 2023 actuarial loss was driven primarily by the lower discount rate used to measure the future benefit obligations, partially offset by higher than expected return on plan assets. At December 31, 2022, shareholders' equity amounts related to these postretirement plans increased by $70.0$76.5 million, net of tax, of which $13.9$6.9 million represents amortization of the prior service cost and net actuarial loss and $56.1$69.6 million represents the current period actuarial gain. The 2021 actuarial gain was primarily due to higher than expected returns on plan assets. At December 31, 2020, shareholders' equity amounts related to these postretirement plans increased by $20.0 million, net of tax, of which $10.6 million represents amortization of the prior service cost and net actuarial loss and $9.4 million of current period actuarial gain. The 20202022 actuarial gain was driven by the higher discount rate, offset by lower than expected returnsreturn on assets which exceeded losses incurred as a result of the lower discount rate in 2020.plan assets. Although we are the sponsor of these postretirement plans and record the funded status of these plans, there are reimbursements between us and the Exchange and its subsidiaries reimburse us for approximately 58% of the annual benefit expense of these plans, which includes pension benefits for employees performing administrative services and their allocated share of costspension income or cost. See Item 8. "Financial Statements and Supplementary Data - Note 9, Postretirement Benefits, of Notes to Financial Statements" contained within this report for employees in departments that support the administrative functions.additional details on these reimbursements.
LIQUIDITY AND CAPITAL RESOURCES
We continue to monitor the sufficiency of our liquidity and capital resources given the potential impact of the COVID-19 pandemic and subsequent resulting current economic
conditions, including the uncertain inflationary costs.and interest rate environment. While we did not see a significant impact on our sources or uses of cash in 2021,2023, future disruptions in the markets could occur which may affect our liquidity position. If our normal operating and investing cash activities were to become insufficient to meet future funding requirements, we believe we have sufficient access to liquidity through our cash position, diverse liquid marketable securities, and our $100 million bank revolving line of credit that does not expire until October 2026. See broader discussions of potential risks to our operations in the Operating Overview and Part I, Item 1A. "Risk Factors" contained within this report.
Sources and Uses of Cash
Liquidity is a measure of a company's ability to generate sufficient cash flows to meet the short- and long-term cash requirements of its business operations and growth needs. Our liquidity requirements have been met primarily by funds generated from management fee revenue and income from investments. Cash provided from these sources is used primarily to fund the costs of our management operations including commissions, salaries and wages, pension plans, share repurchases, dividends to shareholders, the purchase and development of information technology, and other capital expenditures. We expect that our operating cash needs will be met by funds generated from operations. Cash in excess of our operating needs is primarily invested in investment grade fixed maturities. As part of our liquidity review, we regularly evaluate our capital needs based on current and projected results and consider the potential impacts to our liquidity, borrowing capacity, financial covenants and capital availability.
We have certain obligations and commitments to make future payments under various agreements. Cash requirements within the next twelve months include accounts payable, and accrued liabilities, the current portion of long-term borrowings, and other current obligations.
Our long-term cash requirements under various contractual obligations and commitments include:
•Debt and interest payments – See Part II, Item 8. "Financial Statements and Supplementary Data - Note 8. Borrowing Arrangements, of Notes to Financial Statements" for details of our obligations and the timing of expected future payments.
•Pension – We have a funded noncontributory defined benefit pension plan covering substantially all employees and an unfunded supplemental employee retirement plan ("SERP")SERP for certain members of executive and senior management. See Part II, Item 8. "Financial Statements and Supplementary Data –- Note 9.9, Postretirement Benefits, of Notes to Financial Statements" for the funding policy and related contributions for our defined benefit pension plan, and accumulated benefit obligation for our unfunded SERP.
•Deferred compensation – We have two deferred compensation plans for our executives, senior vice presidents, and other selected officers and two deferred compensation plans for our outside directors. See Part II, Item 8. "Financial Statements and Supplementary Data –- Note 10.10, Incentive and Deferred Compensation Plans, of Notes to Financial Statements" for additional details of these obligations and estimated future payments.
•Home office renovations – We have an agreement with an external contracting firm for renovations to an office building that is part of our principal headquarters. Remaining commitments related to the underlying contracts due in the next 12 months totaled $30.8 million at December 31, 2023. Additional contracts will be executed as we begin each new phase of the overall renovation project and will be funded using our working capital. See Item 8. "Financial Statements and Supplementary Data - Note 7, Fixed Assets, of Notes to Financial Statements" for additional details on construction in progress costs and expected completion date.
•Other commitments – We have commitments for approximately $424$531 million which include agreements for various services, including information technology, support and maintenance obligations, operating leases for equipment, vehicles and real estate, and other obligations in the ordinary course of business. We expect to make future cash payments according to the contract terms. These agreements are enforceable and legally binding and specify fixed amounts or minimum quantities to be purchased. Some agreements may contain cancellation provisions, some of which may require us to pay a termination fee. Over half of these commitments are due in the next 12 months. We are reimbursed from the Exchange and its subsidiaries for the portion of these costs related to administrative services.
We maintain relationships and cash balances at diversified and well-capitalized financial institutions and have established processes to monitor them. We believe that our current cash, cash equivalents and marketable securities and cash generated from operations will be sufficient to meet our current and future cash requirements.
Volatility in the financial markets presents challenges to us as we do occasionally access our investment portfolio as a source of cash. Some of our fixed income investments, despite being publicly traded, may be illiquid. Volatility in these markets could impair our ability to sell certain of our fixed income securities or cause such securities to sell at deep discounts. We believe we have sufficient liquidity to meet our needs from sources other than the liquidation of securities.
Cash flow activities
The following table provides condensed cash flow information for the years ended December 31:
| | | (in thousands) | |
| (in thousands) | |
| (in thousands) | (in thousands) | | 2021 | | 2020 | | 2019 | | 2023 | | 2022 | | 2021 |
| Net cash provided by operating activities | Net cash provided by operating activities | | $ | 402,794 | | | $ | 342,595 | | | $ | 364,527 | |
| Net cash used in investing activities | Net cash used in investing activities | | (185,490) | | | (243,225) | | | (124,634) | |
| Net cash used in financing activities | Net cash used in financing activities | | (194,842) | | | (274,869) | | | (169,571) | |
| Net increase (decrease) in cash | | $ | 22,462 | | | $ | (175,499) | | | $ | 70,322 | |
| Net increase (decrease) in cash, cash equivalents, and restricted cash | |
Net cash provided by operating activities was $381.2 million in 2023, compared to $366.2 million in 2022 and $402.8 million in 2021, compared to $342.6 million in 2020 and $364.5 million in 2019.2021. Increased cash provided by operating activities in 20212023, compared to 2022, was primarily due to an increase in management fees received of $319.2 million driven by growth in direct and affiliated assumed premiums written by the ExchangeExchange. This was partially offset by increases in cash paid for agent commissions of $94.6$157.9 million driven by premium growth, pension and employee benefits paid of $101.3 million primarily due to a $95.0 million pension contribution in 2023, and general operating expenses paid of $30.3 million primarily driven by higher information technology-related professional fees and hardware and software costs. Decreased cash provided by operating activities in 2022, compared to 2021, was primarily due to increases in cash paid for agent commissions of $75.9 million driven by premium growth, administrative services expenses paid of $35.0 million and an increase in administrative service reimbursements receiveda pension contribution of $46.9$25.0 million. Partially offsetting the increasethis decrease in cash provided by operating activities was an increase in cash paid for agent commissionsmanagement fees received of $37.4$118.9 million due to higher scheduled commission driven by premium growth, an increase in administrative services expenses paid of $33.8 million and an increase in agent bonuses of $15.4 million, compared to 2020. Decreased cash provided by operating activities in 2020 was primarily due to an increase in cash paid for agent commissions of $33.3 million due to higher scheduled commissions driven by premium growth, increased general operating expenses paid of $17.4 million and increased administrative services expenses paid of $16.2 million. Offsetting the decrease in cash provided by operating activities was an increase of $42.5 million in management fee received driven by growth in direct and affiliated assumed premiums written by the Exchange, compared to 2019.Exchange.
Net cash used in investing activities totaled $157.6 million in 2023, compared to $106.9 million in 2022 and $185.5 million in 2021, compared2021. In 2023 and 2022, net cash used in investing activities was primarily driven by fixed asset purchases of $92.6 million and $67.2 million, respectively, mostly related to $243.2software and home office renovations. Additionally, purchases of investments exceeded proceeds generated from sales and maturities/calls of investments in both periods, while 2023 also included $13.6 million in 2020 and $124.6 millionloans issued to fund real estate development projects supporting revitalization efforts in 2019.our community. In 2021, net cash used in investing activities was primarilymainly driven by fixed asset purchases of $148.8 million, which included the purchase of the home office from the Exchange. To a lesser extent, purchases of investments exceeded proceeds generated from sales and maturities/calls of investments. In 2020, net cash used in investing activities was primarily driven by purchases of investments exceeding proceeds generated from sales and maturities/calls of investments. In 2019, net cash used in investing activities was primarily driven by fixed asset purchases of $102.0 million primarily related to the new home office building which was funded primarily by the senior secured draw term loan facility.
Net cash used in financing activities totaled $221.7 million in 2023, compared to $300.8 million in 2022 and $194.8 million in 2021, compared to $274.9 million in 2020 and $169.6 million in 2019. The decrease2021. Changes in cash used in 2021, comparedrelated to 2020, wasfinancing activities were primarily due to a decrease in dividends paid to shareholders by $80.1 million, compared to 2020. The increase in cash used in 2020, compared to 2019, was due to an increase in dividends paid to shareholders. In addition to the normal quarterly dividends paid in 2020, the Board also declared a special one-time cash dividend of $2.00 on each Class A share and $300 on each Class B share totaling $93.1 million, which was paid in December 2020.
No shares of our Class A nonvoting common stock were repurchased in 2021, 2020 and 2019 in conjunction with our stock repurchase program. In 2011, our Board of Directors approved a continuationrepayment of the current stock repurchase program for a total of $150remaining $93.2 million with no time limitation. This repurchase authority includes, and is notbalance on the term loan in addition to, any unspent amounts remaining under the prior authorization. We had approximately $17.8 million of repurchase authority remaining under this program at December 31, 2021, based upon trade date.
We purchase shares of our outstanding Class A nonvoting common stock outside of our publicly announced share repurchase program for certain stock-based incentive plans. We purchased 26,667 shares for $5.3 million in 2021, 31,248 shares for $5.8 million in 2020 and 15,003 shares for $2.6 million in 2019 to settle awards for our equity compensation plan and to fund the rabbi trust for the outside director deferred stock compensation plan and the incentive compensation deferral plan. All shares were delivered in the year they were purchased.2022.
Capital Outlook
We regularly prepare forecasts evaluating the current and future cash requirements for both normal and extreme risk events, including theunder current COVID-19 pandemic.inflationary conditions and a higher interest rate environment. Should an extreme risk event result in a cash requirement exceeding normal cash flows, we have the ability to meet our future funding requirements through various alternatives available to us.
Outside of our normal operating and investing cash activities, future funding requirements could be met through: 1) unrestricted and unpledged cash and cash equivalents, which total approximately $183.7$128.7 million at December 31, 2021,2023, 2) a $100 million available bank revolving line of credit, and 3) liquidation of unpledged assets held in our investment portfolio, including equity securities and investment grade bonds which totaled approximately $658.8$799.0 million at December 31, 2021.2023. Volatility in the financial markets could impair our
ability to sell certain fixed income securities or cause such securities to sell at deep discounts. Additionally, we have the ability to curtail or modify discretionary cash outlays such as those related to shareholder dividends and share repurchase activities.
As of December 31, 2021,2023, we have access to a $100 million bank revolving line of credit withcredit. See Item 8. "Financial Statements and Supplementary Data - Note 8, Bank Line of Credit, of Notes to Financial Statements" for additional information.
Off-Balance Sheet Arrangements
We have entered into certain contingent obligations for guarantees. See Item 8. "Financial Statements and Supplementary Data - Note 16, Commitments and Contingencies, of Notes to Financial Statements" for additional information. We do not believe that these obligations will have a $25 million letter of credit sublimit that expires on October 29, 2026. As of December 31, 2021, a total of $99.1 million remains available under the facility due to $0.9 million outstanding letters of credit, which reduce the availability for letters of credit to $24.1 million. We had no borrowings outstandingmaterial current or future effect on our linefinancial condition, results of credit as of December 31, 2021. Investments with a fair value of $120.9 million were pledged as collateral on the line at December 31, 2021. These securities have no trading restrictions and are reported as available-for-sale securities andoperations, or cash and cash equivalents in the Statements of Financial Position. The bank requires compliance with certain covenants, which include leverage ratios and debt restrictions. We were in compliance with our bank covenants at December 31, 2021.flows.
Enterprise Risk Management
The role of our Enterprise Risk Management ("ERM") function is to ensure that all significant risks are clearly identified, understood, proactively managed and consistently monitored to achieve strategic objectives for all stakeholders. Our ERM program views risk holistically across our entire group of companies. It ensures implementation of risk responses to mitigate potential impacts. See Part I, Item 1A. "Risk Factors" contained in this report for a list of risk factors.
Our ERM process is founded on a governance framework that includes oversight at multiple levels of our organization, including our Board of Directors and executive management. Accountability to identify, manage, and mitigate risk is embedded within all functions and areas of our business. We have defined risk tolerances to monitor and manage significant risks within acceptable levels. In addition to identifying, evaluating, prioritizing, monitoring, and mitigating significant risks, our ERM process includes extreme event analyses and scenario testing. Given our defined tolerance for risk, risk model output is used to quantify the potential variability of future performance and the sufficiency of capital and liquidity levels.
TRANSACTIONS/AGREEMENTS WITH RELATED PARTIES
Board Oversight
Our Board of Directors has a broad oversight responsibility over our intercompany relationships with the Exchange. As a consequence,Thus, our Board of Directors may be required to make decisions or take actions that may not be solely in the interest of our shareholders, such as setting the management fee rate paid bybenefit subscribers at the Exchange to us and ratifying any other significant activity.the overall health of the Exchange. These actions may ultimately benefit our shareholders.
Insurance Holding Company System
Most states have enacted legislation that regulates insurance holding company systems, defined as two or more affiliated persons, one or more of which is an insurer. The Exchange has the following wholly owned property and casualty subsidiaries: Erie Insurance Company, Erie Insurance Company of New York, Erie Insurance Property & Casualty Company and Flagship City Insurance Company, and a wholly owned life insurance company, Erie Family Life Insurance Company. Indemnity and the Exchange, and its wholly owned subsidiaries, meet the definition of an insurance holding company system.
All transactionsTransactions within a holding company system affecting the member insurers of the holding company system must be fair and reasonable and any charges or fees for services performed must be reasonable. Approval by the applicable insurance commissioner is required prior to the consummation of certain transactions affecting the members within a holding company system.
Intercompany Agreements
Subscriber's and services agreements
We serve as attorney-in-fact for the subscribers at the Exchange, a reciprocal insurance exchange. Each applicant for insurance to a reciprocal insurance exchange (a subscriber) signs a subscriber's agreement that contains an appointment of an attorney-in-fact. Through the designation of attorney-in-fact, we are required to provide policy issuance and renewal services and act as the attorney-in-fact for the subscribers at the Exchange with respect to all administrative services, as discussed previously. Pursuant toIn accordance with the subscriber's agreement, we earnretain a management fee for these services calculated as a percentage of the direct and affiliated assumed premiums written by the Exchange. By virtue ofConsistent with its legal structure as a reciprocal insurer, the Exchange does not have any employees or officers. Therefore, it enters into contractual relationships by and through the subscribers' attorney-in-fact. The Exchange's insurance subsidiaries also utilize Indemnity for all administrative services in accordance with the service agreements between each of the subsidiaries and Indemnity. The subscriber's agreement and service agreements provide for reimbursement of amounts incurred for all administrativethese services to Indemnity. Reimbursements are reimbursed to Indemnitysettled at cost in accordance with the subscriber's agreement and the service agreements. These reimbursements are settled on a monthly basis. State insurance regulations require that intercompany service agreements and any material amendments be approved in advance by the state insurance department.
Shared Facilitiesfacilities
We previously leased the home office from the Exchange. Rent was based on rental rates of like propertyThe Exchange and its subsidiaries have a service agreement with Indemnity to use space in Erie, Pennsylvania and all operating expenses including utilities, cleaning, repairs, real estate taxes, property insurance, and leasehold improvements were the responsibility of the tenant (Indemnity). Rental costs of shared facilities under this lease were allocated based upon usage or square footage occupied. On December 31, 2021, we purchased the home office from the Exchange.Indemnity-owned properties. See Part II, Item 8. "Financial Statements and Supplementary Data - Note 14.14, Related Party, of Notes to Financial Statements" for additional details.
Effective July 1, 2021, the Exchange and its subsidiaries entered into a contractual agreement with Indemnity to use space in Indemnity-owned properties. The amount charged is based on rates of like property in Erie, Pennsylvania and the usage or square footage occupied. Operating expenses including utilities, cleaning, repairs, real estate taxes, property insurance and leasehold improvements are allocated based upon usage or square footage occupied. The home office was added to this agreement effective January 1, 2022.
Cost Allocation
The allocation of costs affects our financial condition and that of the Exchange and its wholly owned subsidiaries. Management's role is to determine that allocations are consistently made in accordance with the subscriber's agreement with the subscribers at the Exchange, intercompany service agreements, and applicable insurance laws and regulations. Allocation of costs under these various agreements requires judgment and interpretation by Indemnity, and such allocations are performed using a consistent methodology, which is intended to adhere to the terms and intentions of the underlying agreements.
Intercompany Receivables
We have significant receivables from the Exchange and its affiliates that result in a concentration of credit risk. Net receivables from the Exchange and other affiliates were $479.1$625.3 million, or 21.4%25.3% of total assets, at December 31, 20212023 and $494.6$524.9 million, or 23.4% of total assets, at December 31, 2020.2022. These receivables include management fees due for policy issuance and
renewal services performed by us under the subscriber's agreement, and certain costs we incur acting as the attorney-in-fact on behalf of the subscribers at the Exchange as well as the service provider for itsthe Exchange's insurance subsidiaries with respect to all administrative services, as discussed previously. These receivables from the Exchange and itsother affiliates are settled monthly. We continually monitor the financial strength of the Exchange.
Other Loans Receivable
In December 2023, we issued two senior secured loans totaling $13.6 million to fund a real estate development project supporting revitalization efforts in our community. Ownership in the project includes related party and unrelated investors. See Item 8. "Financial Statements and Supplementary Data - Note 14, Related Party, of Notes to Financial Statements" for additional details.
ITEM 7A. QUANTITATIVE AND QUALITATIVE DISCLOSURES ABOUT MARKET RISK
The significant volatility in the financial markets and uncertainty resulting from the COVID-19 pandemic continues to evolve and the pandemic’s ultimate impact and duration remain uncertain. We could experience future losses and/or impairments to the portfolio given the pandemic’s impact on market conditions.
Market Risk
Market risk is the risk of loss arising from adverse changes in interest rates, credit spreads, equity prices, or foreign exchange rates, as well as other relevant market rate or price changes. The volatility and liquidity in the markets in which the underlying assets are traded directly influence market risk. The following is a discussion of our primary risk exposures, including interest rate risk, investment credit risk, concentration risk, liquidity risk, and equity price risk, and how those exposures are currently managed as of December 31, 2021.2023.
Interest Rate Risk
We invest primarily in fixed maturity investments, which comprised 83%85% of our invested assets at December 31, 2021.2023. The value of the fixed maturity portfolio is subject to interest rate risk. As market interest rates decrease, the value of the portfolio increases with the opposite holding true in rising interest rate environments. We do not hedge our exposure to interest rate risk. A common measure of the interest sensitivity of fixed maturity assets is effective duration, a calculation that utilizes maturity, coupon rate, yield, and call terms to calculate an expected change in fair value given a change in interest rates. The longer the duration, the more sensitive the asset is to market interest rate fluctuations. Duration is analyzed at least quarterly to ensure that it remains in the targeted range.
A sensitivity analysis is used to measure the potential loss in future earnings, fair values, or cash flows of interest-sensitive instruments resulting from one or more selected hypothetical changes in interest rates and other market rates or prices over a selected period. The following pro forma information is presented assuming a 100-basis point parallel increase in interest rates across the yield curve at December 31 of each year and reflects the estimated effect on the fair value of our fixed maturity portfolio.
Fixed maturities interest-rate sensitivity analysis
| | | (dollars in thousands) | (dollars in thousands) | | At December 31, |
| (dollars in thousands) | |
| (dollars in thousands) | | | At December 31, |
| | 2023 | | | | 2023 | | 2022 |
| | 2021 | | 2020 |
| | Fair value of fixed maturity portfolio | |
| Fair value of fixed maturity portfolio | |
| Fair value of fixed maturity portfolio | Fair value of fixed maturity portfolio | | $ | 946,085 | | | $ | 928,236 | |
| Fair value assuming 100-basis point rise in interest rates | Fair value assuming 100-basis point rise in interest rates | | $ | 921,642 | | | $ | 904,287 | |
| Effective duration (as a percentage) | Effective duration (as a percentage) | | 2.6 | | 2.7 | Effective duration (as a percentage) | | 2.7 | | 2.9 |
|
While the fixed maturity portfolio is sensitive to interest rates, the future principal cash flows that will be received by contractual maturity date are presented below at December 31, 20212023 and 2020.2022. Actual cash flows may differ from those stated as a result of calls, prepayments, or defaults.
Contractual repayments of principal by maturity date
| | (in thousands) | (in thousands) | | |
| (in thousands) | |
| (in thousands) | |
| Fixed maturities: | Fixed maturities: | | December 31, 2021 | |
| 2022 | | $ | 38,122 | | |
| 2023 | | 89,184 | | |
| Fixed maturities: | |
| Fixed maturities: | |
| 2024 | |
| 2024 | |
| 2024 | 2024 | | 131,577 | | |
| 2025 | 2025 | | 108,165 | | |
| 2025 | |
| 2025 | |
| 2026 | 2026 | | 71,375 | | |
| 2026 | |
| 2026 | |
| 2027 | |
| 2027 | |
| 2027 | |
| 2028 | |
| 2028 | |
| 2028 | |
| Thereafter | |
| Thereafter | |
| Thereafter | Thereafter | | 472,350 | | |
| Total | Total | | $ | 910,773 | | |
| Total | |
| Total | |
| Fair value | Fair value | | $ | 946,085 | | |
| Fair value | |
| Fair value | |
| | (in thousands) | (in thousands) | | |
| (in thousands) | |
| (in thousands) | |
| Fixed maturities: | Fixed maturities: | | December 31, 2020 | |
| 2021 | | $ | 17,403 | | |
| 2022 | | 48,958 | | |
| Fixed maturities: | |
| Fixed maturities: | |
| 2023 | |
| 2023 | |
| 2023 | 2023 | | 107,507 | | |
| 2024 | 2024 | | 142,707 | | |
| 2024 | |
| 2024 | |
| 2025 | 2025 | | 110,105 | | |
| 2025 | |
| 2025 | |
| 2026 | |
| 2026 | |
| 2026 | |
| 2027 | |
| 2027 | |
| 2027 | |
| Thereafter | |
| Thereafter | |
| Thereafter | Thereafter | | 452,168 | | |
| Total | Total | | $ | 878,848 | | |
| Total | |
| Total | |
| Fair value | Fair value | | $ | 928,236 | | |
| Fair value | |
| Fair value | |
Investment Credit Risk
Our objective is to earn competitive returns by investing in a diversified portfolio of securities. Our portfolios of fixed maturity securities, equity securities and, to a lesser extent, short-term investments are subject to credit risk. This risk is defined as the potential loss in fair value resulting from adverse changes in the borrower's ability to repay the debt. We manage this risk by performing upfront underwriting analysis and ongoing reviews of credit quality by position and for the portfolio in total. We do not hedge the credit risk inherent in our fixed maturity and equity securities investments.
Generally, the fixed maturities in our portfolio are rated by external rating agencies. If not externally rated, we rate them internally on a basis consistent with that used by the rating agencies. We classify all fixed maturities as available-for-sale securities, allowing us to meet our liquidity needs and provide greater flexibility to appropriately respond to changes in market conditions.
The following tables show our fixed maturity investments by rating(1):
| | At December 31, 2021 |
| | At December 31, 2023 | | | | At December 31, 2023 |
| (dollars in thousands) | (dollars in thousands) | | Amortized cost | | Fair value | | Percent of total | (dollars in thousands) | | Amortized cost | | Fair value | | Percent of total |
| | AAA, AA, A | |
| AAA, AA, A | |
| AAA, AA, A | AAA, AA, A | | $ | 506,271 | | | $ | 508,610 | | | 54 | % | | $ | 537,751 | | | $ | | $ | 515,175 | | | 54 | | 54 | % |
| BBB | BBB | | 295,681 | | | 299,270 | | | 31 | |
| Total investment grade | Total investment grade | | 801,952 | | | 807,880 | | | 85 | |
| BB | BB | | 45,541 | | | 46,922 | | | 5 | |
| B | B | | 76,144 | | | 76,913 | | | 8 | |
| CCC, CC, C, and below | CCC, CC, C, and below | | 14,642 | | | 14,370 | | | 2 | |
| Total non-investment grade | Total non-investment grade | | 136,327 | | | 138,205 | | | 15 | |
| Total | Total | | $ | 938,279 | | | $ | 946,085 | | | 100 | % | Total | | $ | 992,553 | | | $ | | $ | 961,241 | | | 100 | | 100 | % |
|
| | | At December 31, 2020 |
| | | | | | | At December 31, 2022 | |
| | | | | | | At December 31, 2022 | |
| | | | | | | At December 31, 2022 | |
| (dollars in thousands) | (dollars in thousands) | | | Amortized cost | | Fair value | | Percent of total | (dollars in thousands) | | | | | | | Amortized cost | | Fair value | | Percent of total |
| AAA, AA, A | AAA, AA, A | | | $ | 487,752 | | | $ | 502,408 | | | 54 | % | AAA, AA, A | | | | | | | $ | 518,088 | | | $ | | $ | 479,413 | | | 54 | | 54 | % |
| BBB | BBB | | | 283,219 | | | 294,917 | | | 32 | |
| Total investment grade | Total investment grade | | | 770,971 | | | 797,325 | | | 86 | |
| BB | BB | | | 47,870 | | | 50,399 | | | 5 | |
| B | B | | | 63,397 | | | 64,611 | | | 7 | |
| CCC, CC, C, and below | CCC, CC, C, and below | | | 16,552 | | | 15,901 | | | 2 | |
| Total non-investment grade | Total non-investment grade | | | 127,819 | | | 130,911 | | | 14 | |
| Total | Total | | | $ | 898,790 | | | $ | 928,236 | | | 100 | % | Total | | | | | | | $ | 961,135 | | | $ | | $ | 894,661 | | | 100 | | 100 | % |
(1) Ratings are supplied by S&P, Moody's, and Fitch. The table is based upon the lowest rating for each security.
We are also exposed to a concentration of credit risk with the Exchange. See the "Transactions/Agreements with Related Parties, Intercompany Receivables" section of Item 7. "Management's Discussion and Analysis of Financial Condition and Results of Operations" contained within this report for further discussion of this risk.
Concentration Risk
While our portfolio is well diversified within each market sector, there is an inherent risk of concentration in a particular industry or sector. We continually monitor our level of exposure to individual issuers as well as our allocation to each industry and market sector against internally established policies. See the "Financial Condition" section of Item 7. "Management's Discussion and Analysis of Financial Condition and Results of Operations" contained within this report for details of investment holdings by sector.
Liquidity Risk
Periods of volatility in the financial markets can create conditions where fixed maturity investments, despite being publicly traded, can become illiquid. However, we actively manage the maturity profile of our fixed maturity portfolio such that scheduled repayments of principal occur on a regular basis.
Equity Price Risk
Our portfolio of equity securities, which primarily includes nonredeemable preferred stock, is carried on the Statements of Financial Position at estimated fair value. Equity securities are exposed to the risk of potential loss in estimated fair value resulting from an adverse change in prices ("price risk"). We do not hedge our exposure to price risk inherent in our equity investments.
ITEM 8. FINANCIAL STATEMENTS AND SUPPLEMENTARY DATA
INDEX TO FINANCIAL STATEMENTS
Report of Independent Registered Public Accounting Firm
To the Shareholders and the Board of Directors of Erie Indemnity Company
Opinion on the Financial Statements
We have audited the accompanying statements of financial position of Erie Indemnity Company (the Company) as of December 31, 20212023 and 2020,2022, the related statements of operations, comprehensive income, shareholders’ equity and cash flows for each of the three years in the period ended December 31, 2021,2023, and the related notes (collectively referred to as the “financial statements”). In our opinion, the financial statements present fairly, in all material respects, the financial position of the Company as ofat December 31, 20212023 and 2020,2022, and the results of its operations and its cash flows for each of the three years in the period ended December 31, 2021,2023, in conformity with U.S. generally accepted accounting principles.
We also have audited, in accordance with the standards of the Public Company Accounting Oversight Board (United States) (PCAOB), the Company’s internal control over financial reporting as of December 31, 2021,2023, based on criteria established in Internal Control-IntegratedControl—Integrated Framework issued by the Committee of Sponsoring Organizations of the Treadway Commission (2013 framework), and our report dated February 24, 202226, 2024 expressed an unqualified opinion thereon.
Basis for Opinion
These financial statements are the responsibility of the Company’s management. Our responsibility is to express an opinion on the Company’s financial statements based on our audits. We are a public accounting firm registered with the PCAOB and are required to be independent with respect to the Company in accordance with the U.S. federal securities laws and the applicable rules and regulations of the Securities and Exchange Commission and the PCAOB.
We conducted our audits in accordance with the standards of the PCAOB. Those standards require that we plan and perform the audit to obtain reasonable assurance about whether the financial statements are free of material misstatement, whether due to error or fraud. Our audits included performing procedures to assess the risks of material misstatement of the financial statements, whether due to error or fraud, and performing procedures that respond to those risks. Such procedures includeincluded examining, on a test basis, evidence regarding the amounts and disclosures in the financial statements. Our audits also included evaluating the accounting principles used and significant estimates made by management, as well as evaluating the overall presentation of the financial statements. We believe that our audits provide a reasonable basis for our opinion.
Critical Audit Matter
The critical audit matter communicated below is a matter arising from the current period audit of the financial statements that was communicated or required to be communicated to the audit committee and that: (1) relates to accounts or disclosures that are material to the financial statements and (2) involved our especially challenging, subjective or complex judgments. The communication of the critical audit matter does not alter in any way our opinion on the financial statements, taken as a whole, and we are not, by communicating the critical audit matter below, providing a separate opinion on the critical audit matter or on the accounts or disclosures to which it relates.
| | | | | | | | |
| | Proportional Cost Allocation
|
| Description of the Matter | | For the year ended December 31, 2021,2023, the Company’s administrative services reimbursement revenue totaled $638.5$737.1 million. The Company’s primary function, as attorney-in-fact, is to perform certain services on behalf of the subscribers at the Erie Insurance Exchange (Exchange) and its insurance subsidiaries, in accordance with the Subscriber’s Agreementsubscriber’s agreement and the service agreements with each of the Exchange’s insurance subsidiaries. As explained in Note 2 of the financial statements, pursuant toin accordance with the approved subscriber’s agreement and service agreements, administrative services, which include costs associated with claims handling services, life insurance related operating activities, investment management, and operating overhead incurred by the Company on behalf of the Exchange and its insurance subsidiaries, are reimbursed to the Company at cost and recorded as administrative services reimbursement revenue. To determinerevenue, based on the proportionalnature of the cost allocation to each entity, the Company determinesor relevant utilization statistics using numerous variables including, among others, employee count, square footage, vehicle count, and project hours.statistic.
Auditing management’s proportional cost allocations was complex due to the number ofmultiple costs that are included inallocated, the allocationsextensiveness of the allocation process, and the judgment applied in determiningdegree of auditor judgement needed to design the utilization statistics usednature and extent of audit procedures required to determineaddress the proportional allocations to each entity.matter.
|
| How We Addressed the Matter in Our Audit | | We obtained an understanding, evaluated the design and tested the operating effectiveness of controls over the Company’s proportional cost allocations process. This included, among others, testing management’s review controls over the determination of the utilization statistics and ultimate allocation of costs to the Exchange and its insurance subsidiaries.
To test the Company’s proportional cost allocations, our procedures included, among others, evaluating that the costs included in the allocations are in accordance with the Subscriber’s Agreementsubscriber’s agreement and the service agreements with each of the Exchange’s insurance subsidiaries. We tested the completeness and accuracy of the costs subjected to allocation through testing of the reconciliation of the costs recorded in the source systems to the costs that are allocated.allocated, testing a sample of cost allocations, and testing the reconciliation of the cost allocation output to the general ledger. We evaluated the allocation of costs to the Exchange and its insurance subsidiaries with the costs allocated in prior periods.
|
/s/ Ernst & Young LLP
We have served as the Company's auditor since 2003.
Cleveland, OHIndianapolis, Indiana
February 24, 202226, 2024
ERIE INDEMNITY COMPANY
STATEMENTS OF OPERATIONS
Years ended December 31, 2021, 20202023, 2022 and 20192021
(dollars in thousands, except per share data)
| | 2021 | | 2020 | | 2019 |
| | 2023 | | | | 2023 | | 2022 | | 2021 |
| Operating revenue | Operating revenue | | |
| Management fee revenue - policy issuance and renewal services | |
| Management fee revenue - policy issuance and renewal services | |
| Management fee revenue - policy issuance and renewal services | Management fee revenue - policy issuance and renewal services | | $ | 1,913,166 | | | $ | 1,841,794 | | | $ | 1,810,457 | |
| Management fee revenue - administrative services | Management fee revenue - administrative services | | 58,286 | | | 59,463 | | | 57,204 | |
| Administrative services reimbursement revenue | Administrative services reimbursement revenue | | 638,483 | | | 609,435 | | | 582,010 | |
| Service agreement revenue | Service agreement revenue | | 24,042 | | | 25,797 | | | 27,627 | |
| Total operating revenue | Total operating revenue | | 2,633,977 | | | 2,536,489 | | | 2,477,298 | |
| | Operating expenses | Operating expenses | |
| Operating expenses | |
| Operating expenses | |
| Cost of operations - policy issuance and renewal services | |
| Cost of operations - policy issuance and renewal services | |
| Cost of operations - policy issuance and renewal services | Cost of operations - policy issuance and renewal services | | 1,677,397 | | | 1,588,897 | | | 1,537,949 | |
| Cost of operations - administrative services | Cost of operations - administrative services | | 638,483 | | | 609,435 | | | 582,010 | |
| Total operating expenses | Total operating expenses | | 2,315,880 | | | 2,198,332 | | | 2,119,959 | |
| Operating income | Operating income | | 318,097 | | | 338,157 | | | 357,339 | |
| | Investment income | Investment income | |
| Investment income | |
| Investment income | |
| Net investment income | Net investment income | | 62,177 | | | 29,753 | | | 34,059 | |
| Net realized and unrealized investment gains | | 4,946 | | | 6,392 | | | 6,103 | |
| Net impairment recoveries (losses) recognized in earnings | | 209 | | | (3,278) | | | (195) | |
| Net investment income | |
| Net investment income | |
| Net realized and unrealized investment (losses) gains | |
| Net impairment (losses) recoveries recognized in earnings | |
| | Total investment income | |
| Total investment income | |
| Total investment income | Total investment income | | 67,332 | | | 32,867 | | | 39,967 | |
| | Interest expense, net | Interest expense, net | | 4,132 | | | 731 | | | 856 | |
| Other (expense) income | | (4,893) | | | (1,778) | | | 255 | |
| Interest expense, net | |
| Interest expense, net | |
| Other income (expense) | |
| Income before income taxes | Income before income taxes | | 376,404 | | | 368,515 | | | 396,705 | |
| Income tax expense | Income tax expense | | 78,544 | | | 75,211 | | | 79,884 | |
| Net income | Net income | | $ | 297,860 | | | $ | 293,304 | | | $ | 316,821 | |
| | Earnings Per Share | Earnings Per Share | |
| | Earnings Per Share | |
| | Earnings Per Share | |
| Net income per share | Net income per share | |
| Net income per share | |
| Net income per share | |
| Class A common stock – basic | |
| Class A common stock – basic | |
| Class A common stock – basic | Class A common stock – basic | | $ | 6.40 | | | $ | 6.30 | | | $ | 6.80 | |
| Class A common stock – diluted | Class A common stock – diluted | | $ | 5.69 | | | $ | 5.61 | | | $ | 6.06 | |
| Class B common stock – basic and diluted | Class B common stock – basic and diluted | | $ | 959 | | | $ | 945 | | | $ | 1,020 | |
| | | Weighted average shares outstanding – Basic | Weighted average shares outstanding – Basic | |
| | Weighted average shares outstanding – Basic | |
| | Weighted average shares outstanding – Basic | |
| Class A common stock | |
| Class A common stock | |
| Class A common stock | Class A common stock | | 46,188,806 | | | 46,188,659 | | | 46,188,836 | |
| Class B common stock | Class B common stock | | 2,542 | | | 2,542 | | | 2,542 | |
| | Weighted average shares outstanding – Diluted | Weighted average shares outstanding – Diluted | |
| Weighted average shares outstanding – Diluted | |
| Weighted average shares outstanding – Diluted | |
| Class A common stock | |
| Class A common stock | |
| Class A common stock | Class A common stock | | 52,307,302 | | | 52,313,360 | | | 52,319,860 | |
| Class B common stock | Class B common stock | | 2,542 | | | 2,542 | | | 2,542 | |
See accompanying notes to Financial Statements. See Note 13, "Accumulated Other Comprehensive Income (Loss)", for amounts reclassified out of accumulated other comprehensive income (loss) into the Statements of Operations.
ERIE INDEMNITY COMPANY
STATEMENTS OF COMPREHENSIVE INCOME
Years ended December 31, 2021, 20202023, 2022 and 20192021
(in thousands)
| | 2021 | | 2020 | | 2019 |
| | 2023 | | | | 2023 | | 2022 | | 2021 |
| Net income | Net income | | $ | 297,860 | | | $ | 293,304 | | | $ | 316,821 | |
| | Other comprehensive income, net of tax | | | | | | |
| Change in unrealized holding (losses) gains on available-for-sale securities | | (17,112) | | | 18,738 | | | 11,718 | |
| Other comprehensive (loss) income, net of tax | |
| Other comprehensive (loss) income, net of tax | |
| Other comprehensive (loss) income, net of tax | | | |
| Change in unrealized holding gains (losses) on available-for-sale securities | |
| Pension and other postretirement plans | Pension and other postretirement plans | | 69,967 | | | 19,987 | | | 1,698 | |
| Total other comprehensive income, net of tax | | 52,855 | | | 38,725 | | | 13,416 | |
| Total other comprehensive (loss) income, net of tax | |
| | Comprehensive income | Comprehensive income | | $ | 350,715 | | | $ | 332,029 | | | $ | 330,237 | |
| Comprehensive income | |
| Comprehensive income | |
See accompanying notes to Financial Statements. See Note 13, "Accumulated Other Comprehensive Income (Loss)", for amounts reclassified out of accumulated other comprehensive income (loss) into the Statements of Operations.
ERIE INDEMNITY COMPANY
STATEMENTS OF FINANCIAL POSITION
At December 31, 20212023 and 20202022
(dollars in thousands, except per share data)
| | 2021 | | 2020 |
| | 2023 | | | | 2023 | | 2022 |
| Assets | Assets | | |
| Current assets: | Current assets: | |
| Cash and cash equivalents | | $ | 183,702 | | | $ | 161,240 | |
| Current assets: | |
| Current assets: | |
| Cash and cash equivalents (includes restricted cash of $12,542 and $11,932, respectively) | |
| Cash and cash equivalents (includes restricted cash of $12,542 and $11,932, respectively) | |
| Cash and cash equivalents (includes restricted cash of $12,542 and $11,932, respectively) | |
| Available-for-sale securities | Available-for-sale securities | | 38,396 | | | 17,697 | |
| Equity securities | | 0 | | | 19 | |
| | Receivables from Erie Insurance Exchange and affiliates, net | |
| Receivables from Erie Insurance Exchange and affiliates, net | |
| Receivables from Erie Insurance Exchange and affiliates, net | Receivables from Erie Insurance Exchange and affiliates, net | | 479,123 | | | 494,637 | |
| Prepaid expenses and other current assets | Prepaid expenses and other current assets | | 56,206 | | | 52,561 | |
| | Accrued investment income | Accrued investment income | | 6,303 | | | 6,146 | |
| | Accrued investment income | |
| | Accrued investment income | |
| Total current assets | Total current assets | | 763,730 | | | 732,300 | |
| | Available-for-sale securities, net | |
| Available-for-sale securities, net | |
| Available-for-sale securities, net | Available-for-sale securities, net | | 907,689 | | | 910,539 | |
| Equity securities | Equity securities | | 87,743 | | | 94,071 | |
| | Fixed assets, net | Fixed assets, net | | 374,802 | | | 265,341 | |
| Fixed assets, net | |
| Fixed assets, net | |
| Agent loans, net | Agent loans, net | | 58,683 | | | 62,449 | |
| Deferred income taxes, net | | 145 | | | 12,341 | |
| Other assets | | 49,265 | | | 40,081 | |
| | Defined benefit pension plan | |
| Defined benefit pension plan | |
| Defined benefit pension plan | |
| Other assets, net | |
| Total assets | Total assets | | $ | 2,242,057 | | | $ | 2,117,122 | |
| | Liabilities and shareholders' equity | Liabilities and shareholders' equity | |
| Liabilities and shareholders' equity | |
| Liabilities and shareholders' equity | |
| Current liabilities: | |
| Current liabilities: | |
| Current liabilities: | Current liabilities: | |
| Commissions payable | Commissions payable | | $ | 270,746 | | | $ | 262,338 | |
| Agent bonuses | | 120,437 | | | 110,158 | |
| Commissions payable | |
| Commissions payable | |
| Agent incentive compensation | |
| Accounts payable and accrued liabilities | Accounts payable and accrued liabilities | | 138,317 | | | 150,706 | |
| Dividends payable | Dividends payable | | 51,693 | | | 48,200 | |
| Contract liability | Contract liability | | 34,935 | | | 36,917 | |
| Deferred executive compensation | Deferred executive compensation | | 12,637 | | | 17,319 | |
| Current portion of long-term borrowings | | 2,098 | | | 2,031 | |
| | Total current liabilities | |
| Total current liabilities | |
| Total current liabilities | Total current liabilities | | 630,863 | | | 627,669 | |
| | Defined benefit pension plans | Defined benefit pension plans | | 130,383 | | | 164,346 | |
| Long-term borrowings | | 91,734 | | | 93,833 | |
| Defined benefit pension plans | |
| Defined benefit pension plans | |
| | Contract liability | |
| Contract liability | |
| Contract liability | Contract liability | | 17,686 | | | 18,878 | |
| Deferred executive compensation | Deferred executive compensation | | 14,571 | | | 14,904 | |
| | Deferred income taxes, net | |
| Other long-term liabilities | Other long-term liabilities | | 14,342 | | | 9,444 | |
| Total liabilities | Total liabilities | | 899,579 | | | 929,074 | |
| | Shareholders' equity | Shareholders' equity | |
| Shareholders' equity | |
| Shareholders' equity | |
| Class A common stock, stated value $0.0292 per share; 74,996,930 shares authorized; 68,299,200 shares issued; 46,189,068 shares outstanding | |
| Class A common stock, stated value $0.0292 per share; 74,996,930 shares authorized; 68,299,200 shares issued; 46,189,068 shares outstanding | |
| Class A common stock, stated value $0.0292 per share; 74,996,930 shares authorized; 68,299,200 shares issued; 46,189,068 shares outstanding | Class A common stock, stated value $0.0292 per share; 74,996,930 shares authorized; 68,299,200 shares issued; 46,189,068 shares outstanding | | 1,992 | | | 1,992 | |
| Class B common stock, convertible at a rate of 2,400 Class A shares for one Class B share, stated value $70 per share; 3,070 shares authorized; 2,542 shares issued and outstanding | Class B common stock, convertible at a rate of 2,400 Class A shares for one Class B share, stated value $70 per share; 3,070 shares authorized; 2,542 shares issued and outstanding | | 178 | | | 178 | |
| Additional paid-in-capital | Additional paid-in-capital | | 16,496 | | | 16,487 | |
| Accumulated other comprehensive loss | Accumulated other comprehensive loss | | (25,288) | | | (78,143) | |
| Retained earnings | Retained earnings | | 2,495,190 | | | 2,393,624 | |
| Total contributed capital and retained earnings | Total contributed capital and retained earnings | | 2,488,568 | | | 2,334,138 | |
| Treasury stock, at cost; 22,110,132 shares held | Treasury stock, at cost; 22,110,132 shares held | | (1,167,828) | | | (1,163,670) | |
| Deferred compensation | Deferred compensation | | 21,738 | | | 17,580 | |
| Total shareholders' equity | Total shareholders' equity | | 1,342,478 | | | 1,188,048 | |
| Total liabilities and shareholders' equity | Total liabilities and shareholders' equity | | $ | 2,242,057 | | | $ | 2,117,122 | |
See accompanying notes to Financial Statements.
ERIE INDEMNITY COMPANY
STATEMENTS OF SHAREHOLDERS' EQUITY
Years ended December 31, 2021, 20202023, 2022 and 20192021
(dollars in thousands, except per share data)
| | Class A common stock | | | Class A common stock | Class B common stock | Additional paid-in-capital | Accumulated other comprehensive (loss) income | Retained earnings | Treasury stock | Deferred compensation | Total shareholders' equity |
| Balance, December 31, 2020 | |
| | Class A common stock | Class B common stock | Additional paid-in-capital | Accumulated other comprehensive (loss) income | Retained earnings | Treasury stock | Deferred compensation | Total shareholders' equity |
| Balance, December 31, 2018 | $ | 1,992 | | $ | 178 | | $ | 16,459 | | $ | (130,284) | | $ | 2,231,417 | | $ | (1,157,625) | | $ | 11,535 | | $ | 973,672 | |
| | Net income | |
| Net income | |
| Net income | Net income | | 316,821 | | | 316,821 | |
| Other comprehensive income | Other comprehensive income | | 13,416 | | | 13,416 | |
| Dividends declared: | Dividends declared: | |
| Class A $3.665 per share | | (169,283) | | | (169,283) | |
| Class B $549.75 per share | | (1,397) | | | (1,397) | |
Net purchase of treasury stock (1) | | 24 | | | 0 | | | 24 | |
| Deferred compensation | | (2,208) | | 2,208 | | 0 | |
Rabbi trust distribution (2) | | 923 | | (923) | | 0 | |
| | Balance, December 31, 2019 | $ | 1,992 | | $ | 178 | | $ | 16,483 | | $ | (116,868) | | $ | 2,377,558 | | $ | (1,158,910) | | $ | 12,820 | | $ | 1,133,253 | |
Cumulative effect adjustment (3) | | (1,075) | | | (1,075) | |
| Net income | | 293,304 | | | 293,304 | |
| Other comprehensive income | | 38,725 | | | 38,725 | |
| Dividends declared: | |
| Class A $5.93 per share | | (273,902) | | | (273,902) | |
| Class B $889.50 per share | | (2,261) | | | (2,261) | |
Net purchase of treasury stock (1) | | 4 | | | 0 | | | 4 | |
| Deferred compensation | | (5,465) | | 5,465 | | 0 | |
Rabbi trust distribution (2) | | 705 | | (705) | | 0 | |
| Balance, December 31, 2020 | $ | 1,992 | | $ | 178 | | $ | 16,487 | | $ | (78,143) | | $ | 2,393,624 | | $ | (1,163,670) | | $ | 17,580 | | $ | 1,188,048 | |
| Net income | | 297,860 | | | 297,860 | |
| Other comprehensive income | | 52,855 | | | 52,855 | |
| Dividends declared: | |
| Class A $4.215 per share | |
| Class A $4.215 per share | |
| Class A $4.215 per share | Class A $4.215 per share | | (194,687) | | | (194,687) | |
| Class B $632.25 per share | Class B $632.25 per share | | (1,607) | | | (1,607) | |
Net purchase of treasury stock (1) | Net purchase of treasury stock (1) | | 9 | | | 0 | | | 9 | |
| Deferred compensation | Deferred compensation | | (5,131) | | 5,131 | | 0 | |
Rabbi trust distribution (2) | Rabbi trust distribution (2) | | 973 | | (973) | | 0 | |
| | | Balance, December 31, 2021 | Balance, December 31, 2021 | $ | 1,992 | | $ | 178 | | $ | 16,496 | | $ | (25,288) | | $ | 2,495,190 | | $ | (1,167,828) | | $ | 21,738 | | $ | 1,342,478 | |
| | Balance, December 31, 2021 | |
| | Balance, December 31, 2021 | |
| | Net income | |
| Net income | |
| Net income | |
| Other comprehensive income | |
| Dividends declared: | |
| Class A $4.52 per share | |
| Class A $4.52 per share | |
| Class A $4.52 per share | |
| Class B $678.00 per share | |
Net purchase of treasury stock (1) | |
| Deferred compensation | |
Rabbi trust distribution (2) | |
| Balance, December 31, 2022 | |
| Net income | |
| Other comprehensive loss | |
| Dividends declared: | |
| Class A $4.845 per share | |
| Class A $4.845 per share | |
| Class A $4.845 per share | |
| Class B $726.75 per share | |
Net purchase of treasury stock (1) | |
| Deferred compensation | |
Rabbi trust distribution (2) | |
| | Balance, December 31, 2023 | |
| Balance, December 31, 2023 | |
| Balance, December 31, 2023 | |
(1) Net purchases of treasury stock in 2019, 20202021, 2022 and 2021 includes2023 include the repurchase of our Class A common stock in the open market that were subsequently distributed to satisfy stock basedstock-based compensation awards. See Note 10, "Incentive and Deferred Compensation Plans".
(2) Distributions of our Class A shares were made from the rabbi trust to a retired director and an incentive compensation deferral plan participant in 2019, 20202021, four incentive compensation deferral plan participants in 2022, and 2021.five incentive compensation plan deferral plan participants in 2023 . See Note 10, "Incentive and Deferred Compensation Plans".
(3) The Cumulative effect adjustment in 2020 is related to the implementation of credit loss allowance accounting guidance effective January 1, 2020. See Note 2, "Significant Accounting Policies."
See accompanying notes to Financial Statements.
ERIE INDEMNITY COMPANY
STATEMENTS OF CASH FLOWS
Years ended December 31, 2021, 20202023, 2022 and 20192021
(in thousands)
| | 2021 | | 2020 | | 2019 |
| | 2023 | | | | 2023 | | 2022 | | 2021 |
| Cash flows from operating activities | Cash flows from operating activities | | |
| Management fee received | |
| Management fee received | |
| Management fee received | Management fee received | | $ | 1,982,092 | | | $ | 1,887,537 | | | $ | 1,845,075 | |
| Administrative services reimbursements received | Administrative services reimbursements received | | 634,300 | | | 587,347 | | | 588,255 | |
| Service agreement revenue received | Service agreement revenue received | | 24,014 | | | 25,797 | | | 27,627 | |
| Net investment income received | Net investment income received | | 45,830 | | | 35,740 | | | 36,442 | |
| | Commissions paid to agents | Commissions paid to agents | | (966,285) | | | (928,864) | | | (895,563) | |
| Agents bonuses paid | | (123,583) | | | (108,227) | | | (115,795) | |
| | Commissions paid to agents | |
| | Commissions paid to agents | |
| Incentive compensation paid to agents | |
| Salaries and wages paid | Salaries and wages paid | | (204,279) | | | (188,070) | | | (186,460) | |
| Employee benefits paid | | (32,836) | | | (33,098) | | | (42,728) | |
| Pension contribution and employee benefits paid | |
| General operating expenses paid | General operating expenses paid | | (235,294) | | | (253,545) | | | (236,128) | |
| Administrative services expenses paid | Administrative services expenses paid | | (632,530) | | | (598,753) | | | (582,528) | |
| Income taxes paid | Income taxes paid | | (84,494) | | | (82,576) | | | (72,817) | |
| Interest paid | Interest paid | | (4,141) | | | (693) | | | (853) | |
| Net cash provided by operating activities | Net cash provided by operating activities | | 402,794 | | | 342,595 | | | 364,527 | |
| | Cash flows from investing activities | Cash flows from investing activities | |
| Cash flows from investing activities | |
| Cash flows from investing activities | |
| Purchase of investments: | Purchase of investments: | |
| Purchase of investments: | |
| Purchase of investments: | |
| Available-for-sale securities | |
| Available-for-sale securities | |
| Available-for-sale securities | Available-for-sale securities | | (380,017) | | | (396,014) | | | (956,818) | |
| Equity securities | Equity securities | | (58,191) | | | (79,518) | | | (66,760) | |
| | Other investments | Other investments | | (1,646) | | | (1,142) | | | (1,080) | |
| Other investments | |
| Other investments | |
| Proceeds from investments: | Proceeds from investments: | |
| Available-for-sale securities sales | |
| Available-for-sale securities sales | |
| Available-for-sale securities sales | Available-for-sale securities sales | | 150,153 | | | 101,718 | | | 687,347 | |
| Available-for-sale securities maturities/calls | Available-for-sale securities maturities/calls | | 184,820 | | | 118,852 | | | 303,798 | |
| Equity securities | Equity securities | | 64,118 | | | 70,405 | | | 16,109 | |
| | Other investments | Other investments | | 1,076 | | | 613 | | | 3,722 | |
| Other investments | |
| Other investments | |
| Purchase of fixed assets | Purchase of fixed assets | | (148,800) | | | (55,528) | | | (102,039) | |
| Proceeds from disposal of fixed assets | Proceeds from disposal of fixed assets | | — | | | 15 | | | 777 | |
| Loans to agents | | (6,382) | | | (10,098) | | | (17,611) | |
| Collections on agent loans | | 9,379 | | | 7,472 | | | 7,921 | |
| Loans to agents and other | |
| Collections on agent and other loans | |
| | Net cash used in investing activities | Net cash used in investing activities | | (185,490) | | | (243,225) | | | (124,634) | |
| Net cash used in investing activities | |
| Net cash used in investing activities | |
| | Cash flows from financing activities | |
| Cash flows from financing activities | |
| Cash flows from financing activities | Cash flows from financing activities | |
| | Dividends paid to shareholders | Dividends paid to shareholders | | (192,801) | | | (272,902) | | | (167,651) | |
| | Net payments on long-term borrowings | | (2,041) | | | (1,967) | | | (1,920) | |
| Dividends paid to shareholders | |
| | Dividends paid to shareholders | |
| | Proceeds from short-term borrowings | |
| Proceeds from short-term borrowings | |
| Proceeds from short-term borrowings | |
| Payments on short-term borrowings | |
| Payments on long-term borrowings | |
| Net cash used in financing activities | Net cash used in financing activities | | (194,842) | | | (274,869) | | | (169,571) | |
| | Net increase (decrease) in cash and cash equivalents | | 22,462 | | | (175,499) | | | 70,322 | |
| Cash and cash equivalents, beginning of year | | 161,240 | | | 336,739 | | | 266,417 | |
| Cash and cash equivalents, end of year | | $ | 183,702 | | | $ | 161,240 | | | $ | 336,739 | |
| Net increase (decrease) in cash, cash equivalents, and restricted cash | |
| Net increase (decrease) in cash, cash equivalents, and restricted cash | |
| Net increase (decrease) in cash, cash equivalents, and restricted cash | |
| Cash, cash equivalents, and restricted cash, beginning of year | |
| Cash, cash equivalents, and restricted cash, end of year | |
| | Supplemental disclosure of noncash transactions | Supplemental disclosure of noncash transactions | |
| Supplemental disclosure of noncash transactions | |
| Supplemental disclosure of noncash transactions | |
| Liability incurred to purchase fixed assets | Liability incurred to purchase fixed assets | | $ | 12,802 | | | $ | 14,214 | | | $ | 6,800 | |
| Operating lease assets obtained in exchange for new operating lease liabilities | | $ | 3,447 | | | $ | 4,943 | | | $ | 35,483 | |
| Transfer of investments from other investments to equity securities | | $ | — | | | $ | 13,041 | | | $ | 3,310 | |
| Liability incurred to purchase fixed assets | |
| Liability incurred to purchase fixed assets | |
| Operating lease assets obtained in exchange for lease liabilities | |
|
See accompanying notes to Financial Statements. See Note 17, "Supplementary Data on Cash Flows", for additional supplemental cash flow information.
ERIE INDEMNITY COMPANY
NOTES TO FINANCIAL STATEMENTS
Note 1. Nature of Operations
Erie Indemnity Company ("Indemnity", "we", "us", "our") is a publicly held Pennsylvania business corporation that has since its incorporation in 1925 served as the attorney-in-fact for the subscribers (policyholders) at the Erie Insurance Exchange ("Exchange"). The Exchange, which also commenced business in 1925, is a Pennsylvania-domiciled reciprocal insurer that writes property and casualty insurance.
Our primary function as attorney-in-fact is to perform policy issuance and renewal services on behalf of the subscribers at the Exchange. We also act as attorney-in-fact on behalf of the subscribers at the Exchange with respect to all claims handling and investment management services, as well as the service provider for all claims handling, life insurance, and investment management services for itsthe Exchange's insurance subsidiaries, collectively referred to as "administrative services". Acting as attorney-in-fact in these 2two capacities is done in accordance with a subscriber's agreement (a limited power of attorney) executed individually by each subscriber (policyholder), which appoints usIndemnity as their commoneach subscriber's attorney-in-fact to transact certain business on their behalf. Pursuant toIn accordance with the subscriber's agreement for acting as attorney-in-fact in these 2two capacities, we earnretain a management fee calculated as a percentage of the direct and affiliated assumed premiums written by the Exchange.
The policy issuance and renewal services we provide toon behalf of the subscribers at the Exchange are related to the sales, underwriting and issuance of policies. The sales related services we provide include agent compensation and certain sales and advertising support services. Agent compensation includes scheduled commissions to agents based upon premiums written as well as additional commissions and bonuses to agents,incentive compensation, which areis earned by achieving targeted measures. Agent compensation comprised approximately 66%67% of our 20212023 policy issuance and renewal expenses. The underwriting services we provide include underwriting and policy processing and comprised approximately 10%9% of our 20212023 policy issuance and renewal expenses. The remaining services we provide include customer service and administrative support. We also provide information technology services that support all the functions listed above that comprised approximately 11% of our 20212023 policy issuance and renewal expenses. Included in these expenses are allocations of costs for departments that support these policy issuance and renewal functions.
By virtue ofConsistent with its legal structure as a reciprocal insurer, the Exchange does not have any employees or officers. Therefore, it enters into contractual relationships by and through anthe subscribers' attorney-in-fact. Indemnity serves as the attorney-in-fact on behalf of the subscribers at the Exchange with respect to its administrative services.services as enumerated in the subscriber's agreement. The Exchange's insurance subsidiaries also utilize Indemnity for these services in accordance with the service agreements between each of the subsidiaries and Indemnity. Claims handling services include costs incurred in the claims process, including the adjustment, investigation, defense, recording and payment functions. Life insurance management services include costs incurred in the management and processing of life insurance business. Investment management services are related to investment trading activity, accounting and all other functions attributable to the investment of funds. Included in these expenses are allocations of costs for departments that support these administrative functions. The subscriber's agreement and service agreements provide for reimbursement of amounts incurred for these services to Indemnity. Reimbursements are reimbursed to Indemnitysettled at cost in accordance with the subscriber's agreement and the service agreements.cost. State insurance regulations require that intercompany service agreements and any material amendments be approved in advance by the state insurance department.
Our results of operations are tied to the growth and financial condition of the Exchange. If any events occurred that impaired the Exchange’s ability to grow or sustain its financial condition, including but not limited to reduced financial strength ratings, disruption in the independent agency relationships, significant catastrophe losses, or products not meeting customer demands, the Exchange could find it more difficult to retain its existing business and attract new business. A decline in the business of the Exchange almost certainly wouldcould have as a consequence a decline in the total premiums paid and a correspondingly adverse effect on the amount of the management fees we receive. We also have an exposure to a concentration of credit risk related to the unsecured receivables due from the Exchange for itsnet management fee and costother reimbursements. See Note 15, "Concentrations of Credit Risk".
Coronavirus ("COVID-19") pandemic
In March 2020, the outbreak of the coronavirus ("COVID-19") was declared a global pandemic and pandemic conditions have created an inflationary environment which may impact estimated loss reserves and future premium rates of the Exchange. The uncertainty resulting from COVID-19 and subsequent resulting conditions continues to evolve and the ultimate impact and duration remain uncertain at this time. We are unable to predict the duration or extent of the business disruption or the financial impact given the ongoing development of the pandemic and its impacts on the economy and financial markets.
Note 2. Significant Accounting Policies
Basis of presentation
The accompanying financial statements have been prepared in conformity with U.S. generally accepted accounting principles ("GAAP").
Use of estimates
The preparation of financial statements in conformity with GAAP requires us to make estimates and assumptions that affect the reported amounts of assets and liabilities and disclosure of contingent assets and liabilities at the date of the financial statements and the reported amounts of revenues and expenses during the reporting period. Actual results could differ from those estimates.
Recently adoptedissued accounting standards
We adoptedIn November 2023, the Financial Accounting Standards Board ("FASB") issued Accounting Standards Update ("ASU") 2016-13,2023-07, "Financial Instruments-Credit Losses"Segment Reporting (Topic 280): Improvements to Reportable Segment Disclosures", which appliesrequires entities to our receivable from Erie Insurance Exchangedisclose significant segment expenses that are regularly provided to the chief operating decision maker and affiliates, agent loans,included within each reported period of profit or loss, and investments, on January 1, 2020.requires entities with a single reporting segment to provide all disclosures required by Topic 280. The guidance requires financial assets measured at amortized costamendments in this ASU are required to be presented at the net amount expectedadopted for fiscal years beginning after December 15, 2023, and interim periods within fiscal years beginning after December 15, 2024. Early adoption is permitted. The update is required to be collected throughapplied retrospectively to prior periods presented in the usefinancial statements, based on the significant segment expense categories identified and disclosed in the period of a new forward-looking current expected credit loss model and credit losses relating to available-for-sale debt securities to be recognized through an allowance for credit losses.adoption. This will have no impact on our financial statements. We are currently evaluating the impact of adoption on our disclosures.
For assets measured at amortized costIn December 2023, the FASB issued ASU 2023-09, "Income Taxes (Topic 740): Improvements to Income Tax Disclosures", which requires entities to disclose specific categories in an effective tax rate reconciliation, additional information for whichreconciling items that meet a current expected credit loss allowance was required, we adopted the guidance using the modified-retrospective approach. At January 1, 2020, we recorded current expected credit loss allowances related to agent loans of $0.8 millionquantitative threshold, and receivables from Erie Insurance Exchange and affiliates of $0.6 million. This resultedcertain information about income taxes paid. The amendments in the recording of a cumulative effect adjustment, net of taxes, to retained earnings of $1.1 million. Our available-for-sale investments are not measured at amortized cost, and therefore do not require the use of a current expected credit loss model. Any credit losses, however,this ASU are required to be recorded as an allowanceadopted for credit losses rather thanfiscal years beginning after December 15, 2024. Early adoption is permitted. The amendments can be applied on either a reductionprospective or retrospective basis. This will have no impact on our financial statements. We are currently evaluating the impact of the carrying value of the asset. For available-for-sale securities, we adopted the guidance using the prospective approach and recorded an initial allowance for credit losses of $0.6 million at March 31, 2020.adoption on our disclosures.
Cash and cash equivalents – Cash, money market accounts and other short-term, highly liquid investments with a maturity of three months or less at the date of purchase, are considered cash and cash equivalents.
Restricted cash – Restricted cash represents deposits held for the benefit of third parties related primarily to our agent loan participation program. These restricted funds are invested in bank deposits, contractually restricted as to withdrawal or usage, and included with "Cash and cash equivalents" in our Statements of Financial Position.
Investments
Available-for-sale securities – Fixed maturity debt securities and redeemable preferred stock are classified as available-for-sale and reported at fair value with unrealized investment gains and losses, net of income taxes, recognized in other comprehensive income. Available-for-sale securities with a remaining maturity of 12 months or less and any security that we intend to sell as of the reporting date are classified as current assets.
Available-for-sale securities in an unrealized loss position are evaluated to determine whether the impairment is a result of credit loss or other factors. If we have the intent to sell or it's more likely than not that we would be required to sell the security before recovery of the amortized cost basis, the entire impairment is recognized in earnings. Securities that have experienced a decline in fair value that we do not intend to sell, and that we will not be required to sell before recovery, are evaluated to determine if the decline in fair value is credit related. Impairment resulting from a credit loss is recognized in earnings with a corresponding allowance on the balance sheet.Statement of Financial Position. Future recoveries of credit loss result in an adjustment to the allowance and earnings in the period the credit conditions improve. Factors considered in the evaluation of credit loss include the extent to which fair value is less than cost and fundamental factors specific to the issuer such as financial condition, changes in credit ratings, near and long-term business prospects and other factors, as well as the likelihood of recovery of the amortized cost of the security. If the qualitative review indicates credit impairment, the allowance for credit loss is measured as the amount that the security’s amortized cost exceeds the present value of cash flows expected to be collected and is limited to the amount that fair value is below amortized cost.
Equity securities – Equity securities primarily include non-redeemable preferred stocks andthat are reported at fair value with changes in the fair value recognized in net realized and unrealized investment gains (losses). Securities that we intend to sell as of the reporting date are classified as current assets.
Realized gains and losses and investment income – Realized gains and losses on sales of available-for-sale and equity securities are recognized in income based upon the specific identification method and reported in net realized and unrealized investment gains (losses). Interest income is recognized as earned and includes amortization of premium and accretion of discount. Income is recognized based on the constant effective yield method, which includes periodically updated prepayment assumptions obtained from third party data sources on our prepaying securities. The effective yield for prepaying securities is
recalculated on a retrospective basis. Dividend income is recognized at the ex-dividend date. Interest and dividend income and the results of our limited partnership investments are reported as net investment income. We do not record an allowance for credit losses on accrued investment income on our available-for-sale securities as any amount deemed uncollectible is reversed from interest income in the period the expected payment defaults.
Deferred taxes
Deferred tax assets and liabilities are recorded for temporary differences between the tax basis of assets and liabilities and the reported amounts in the financial statements, using the statutory tax rates in effect for the year in which the differences are expected to settle or be realized. The effect on deferred tax assets and liabilities of a change in tax rates is recognized in the results of operations in the period that includes the enactment date under the law. The need for valuation allowances on deferred tax assets are estimated based upon our assessment of the realizability of such amounts.
Fixed assets
Fixed assets are stated at cost less accumulated depreciation and amortization. Fixed assets are primarily comprised of software, which includes internally used capitalized software and development costs, as well as building and building improvements, equipment, furniture and fixtures, and leasehold improvements. Assets in use are depreciated using the straight-line method over the estimated useful life except for leasehold improvements, which are depreciated over the shorter of their economic useful life or the lease term. Software is depreciated over periods ranging from 3-7 years, buildings and building improvements are depreciated over 20-45 years, equipment is depreciated over 3-10 years, and furniture and fixtures are depreciated over 7 years. We review long-lived assets for impairment whenever events or changes indicate that the carrying value may not be recoverable. Under these circumstances, if the fair value were less than the carrying amount of the asset, we would recognize a loss for the difference. We capitalize applicable interest charges incurred during the construction period of significant long-term building projects as part of the historical cost of the asset.
Agent loans
Agent loans, the majority of which are senior secured, are carried at unpaid principal balance net of a current expected credit loss allowance with interest recorded in investment income as earned. The allowance is estimated using available loss history and/or external loss rates based on comparable loan losses and considers current market conditions and forecasted information. Changes to the allowance are recognized in earnings as adjustments to net impairment losses. Therecoveries (losses). Any current portion of agent loans is recorded in prepaid expenses and other current assets.
Other assets
Other assets primarily include limited partnership investments, whichother loans receivable, operating lease assets, and other long-term prepaid assets. Limited partnership investments are recorded using the equity method of accounting. Other assets alsoloans receivable include operating lease assetsloans issued to fund real estate development projects supporting revitalization efforts in our community. The loans are carried at unpaid principal balance, including any paid-in-kind interest capitalized as additional principal, if applicable, net of a current expected credit loss allowance. The allowances are calculated using the estimated value of, and priority rights to, collateral in the event of default or external loss rates based on comparable loan losses, and considers current market conditions and forecasted information. Changes to the allowances are recognized in earnings as adjustments to net impairment recoveries (losses) or other income (expense) depending on the nature of the loan. Interest on these loans is recorded primarily in investment income as earned. Any current portion of other loans receivable is recorded in prepaid expenses and other long-term prepaidcurrent assets.
Agent bonusincentive compensation liability
Our more significant agent bonusincentive compensation plan is based upon an individual agency's property and casualty underwriting profitability and also includes a component for growth in agency property and casualty premiums if the agency's underwriting profitability targets for the book of business are met. The estimated liability for this agent bonusincentive compensation plan is based upon the performance over 36 months, and is modeled on a monthly basis using actual underwriting results for the two prior years and current year-to-date actual results and forecasted results for the remainder of the year. Our second agent bonusincentive compensation plan is based on an agency's one-year underwriting profitability and uses a similar model but considers actual and forecasted results for a calendar year only. At December 31 of each year, we use actual data available and record an accrual based upon the expected payment amount. These costs are included in cost of operations - policy issuance and renewal services.
Recognition of management fee revenue
We earnretain management fees from the Exchange under the subscriber’s agreement for services provided. Pursuant toIn accordance with the subscriber’s agreement, we may retain up to 25% of all direct and affiliated assumed premiums written by the Exchange. The management fee rate is set at least annually by our Board of Directors. The management fee revenue is calculated by multiplying the management fee rate by the direct and affiliated assumed premiums written by the Exchange and is allocated between the 2two performance obligations we have under the subscriber's agreement. The first performance obligation is to provide policy issuance and renewal services. The second performance obligation is acting as the attorney-in-fact with respect to various administrative services as enumerated in the administrative services.subscriber's agreement.
Management fee revenue allocated to the policy issuance and renewal services is recognized at the time of policy issuance or renewal, because it is at the time of policy issuance or renewal when the economic benefit of the service we provide (the substantially completed policy issuance or renewal service) and the control of the promised asset (the executed insurance policy) transfers to the customer.
Management fee revenue allocated to the second performance obligation relates to us acting as the attorney-in-fact on behalf of the subscribers at the Exchange, as well as the service provider for itsthe Exchange's insurance subsidiaries, with respect to the administrative services and is recognized over a four-year period representing the time over which the economic benefit of the services provided (i.e. management of the administrative services) transfers to the customer.
Administrative services
By virtue ofConsistent with its legal structure as a reciprocal insurer, the Exchange does not have any employees or officers. Therefore, it enters into contractual relationships by and through anthe subscribers' attorney-in-fact. Indemnity serves as the attorney-in-fact on behalf of the subscribers at the Exchange with respect to its administrative services as enumerated in accordance with the subscriber's agreement. The Exchange's insurance subsidiaries also utilize Indemnity for these services in accordance with the service agreements between each of the subsidiaries and Indemnity. Claims handling services include costs incurred in the claims process, including the adjustment, investigation, defense, recording and payment functions. Life insurance management services include costs incurred in the management and processing of life insurance business. Investment management services are related to investment trading activity, accounting and all other functions attributable to the investment of funds. Included in these expenses are allocations of costs for departments that support these administrative functions. Common overhead expenses and certain service department costs incurred by us on behalf of the subscribers at the Exchange and its insurance subsidiaries are reimbursed by the proper entity based upon relevant utilization statistics (employee count, square footage, vehicle count, project hours, etc.) specifically measured to accomplish proportional allocations, which we believe are reasonable. In 2023, approximately 71% of the administrative services expenses were entirely attributable to the respective administrative functions (claims handling, life insurance management and investment management), while the remaining 29% of these expenses were allocations of costs for departments that support these administrative functions. The expenses we incur and related reimbursements we receive for administrative services are presented gross in our StatementStatements of Operations. Reimbursements are settled on a monthly basis. The subscriber's agreement and service agreements provide for reimbursement of amounts incurred for these services to Indemnity. Reimbursements are reimbursed to Indemnitysettled at cost in accordance with the subscriber's agreement and the service agreements.on a monthly basis. State insurance regulations require that intercompany service agreements and any material amendments be approved in advance by the state insurance department.
Recognition of service agreement revenue
Service agreement revenue primarily consists of service charges we collect from policyholders for providing multiple payment plans on policies written by the Exchange and its property and casualty subsidiaries. Service charges, which are flatfixed dollar charges for each installment billed beyond the first installment, are recognized as revenue when bills are rendered to the policyholder. Service agreement revenue also includes late payment and policy reinstatement fees, which are also recognized as revenue when bills are rendered to the policyholder. We also have a service agreement with the Exchange for the use of shared office space. Revenue related to this agreement is recognized at the time the space is used based on relevant utilization statistics.
Reclassification
Certain amounts previously reported in the 2020 financial statements have been reclassified for comparative purposes to conform to the current period’s presentation. "Federal income taxes recoverable" is now included in "Prepaid expenses and other current assets" in the Statements of Financial Position.
Note 3. Revenue
The majority of our revenue is derived from the subscriber’s agreement between us and the subscribers (policyholders) at the Exchange. Pursuant toIn accordance with the subscriber’s agreement, we earnretain a management fee calculated as a percentage, not to exceed 25%, of all direct and affiliated assumed written premiums of the Exchange. We allocate a portion of our management fee revenue, currently 25% of the direct and affiliated assumed written premiums of the Exchange, between the 2two performance obligations we have under the subscriber’s agreement. The first performance obligation is to provide policy issuance and renewal services to the subscribers (policyholders) at the Exchange, and the second is to act as attorney-in-fact on behalf of the subscribers at the Exchange, as well as the service provider for itsthe Exchange's insurance subsidiaries, with respect to all administrative services.
The transaction price, including management fee revenue and administrative serviceservices reimbursement revenue, includes variable consideration and is allocated based on the estimated standalone selling prices developed using industry information and other available information for similar services. A constraining estimate of variable consideration exists related to the potential for management fees to be returned if a policy were to be cancelled mid-term. Management fees are returned to the Exchange when policyholders cancel their insurance coverage mid-term and premiums are refunded to them. The constraining estimate is determined using the expected value method, based on both historical and current information. The estimated transaction price, as reduced by the constraint, reflects consideration expected for performance of our services. We update the transaction price and the related allocation at least annually based upon the most recent information available or more frequently if there have been significant changes in any components considered in the transaction price.
The first performance obligation is to provide policy issuance and renewal services that result in executed insurance policies between the Exchange or one of its insurance subsidiaries and the subscriber (policyholder). The subscriber (policyholder), receives economic benefits when substantially all the policy issuance or renewal services are complete and an insurance policy is issued or renewed by the Exchange or one of its insurance subsidiaries. It is at the time of policy issuance or renewal that the allocated portion of revenue is recognized.
The Exchange, by virtue ofConsistent with its legal structure as a reciprocal insurer, the Exchange does not have any employees or officers. Therefore, it enters into contractual relationships by and through anthe subscribers' attorney-in-fact. Indemnity serves as the attorney-in-fact on behalf of the subscribers at the Exchange with respect to its administrative services as enumerated in accordance with the subscriber's agreement. The Exchange's insurance subsidiaries also utilize Indemnity for these services in accordance with the service agreements between each of the subsidiaries and Indemnity. Collectively, these services represent a second performance obligation under the subscriber’s agreement and the service agreements. The revenue allocated to this performance obligation is recognized over a four yearfour-year period representing the time over which these services are provided. The portion of revenue not yet earned is recorded as a contract liability in the Statements of Financial Position. For the years ended December 31, 2023, 2022, and 2021, 2020, and 2019, Indemnitywe recognized revenue of $36.9$36.5 million, $35.9$34.9 million, and $33.9$36.9 million, respectively, that was included in the contract liability balance at the beginning of the respective periods. The administrative services expenses we incur and the related reimbursements we receive are recorded gross in the StatementStatements of Operations.
Indemnity records a receivable from the Exchange for management fee revenue when the premium is written or assumed from affiliates by the Exchange. Indemnity collects the management fee from the Exchange when the Exchange collects the premiums from the subscribers (policyholders). As the Exchange issues policies with annual terms only, cash collections generally occur within one year.
The following table disaggregates revenue by our 2two performance obligations for the years ended December 31:
| | (in thousands) | (in thousands) | | 2021 | | 2020 | | 2019 | (in thousands) | | 2023 | | 2022 | | 2021 |
| Management fee revenue - policy issuance and renewal services | Management fee revenue - policy issuance and renewal services | | $ | 1,913,166 | | | $ | 1,841,794 | | | $ | 1,810,457 | |
| | Management fee revenue - administrative services | Management fee revenue - administrative services | | 58,286 | | | 59,463 | | | 57,204 | |
| Management fee revenue - administrative services | |
| Management fee revenue - administrative services | |
| Administrative services reimbursement revenue | Administrative services reimbursement revenue | | 638,483 | | | 609,435 | | | 582,010 | |
| Total administrative services | | $ | 696,769 | | | $ | 668,898 | | | $ | 639,214 | |
| Total revenue from administrative services | |
|
Note 4. Earnings Per Share
Class A and Class B basic earnings per share and Class B diluted earnings per share are calculated under the two-class method. The two-class method allocates earnings to each class of stock based upon its dividend rights. Class B shares are convertible into Class A shares at a conversion ratio of 2,400 to 1. See Note 12, "Capital Stock".
Class A diluted earnings per share are calculated under the if-converted method, which reflects the conversion of Class B shares to Class A shares. Diluted earnings per share calculations include the dilutive effect of assumed issuance of stock-based awards under compensation plans that have the option to be paid in stock using the treasury stock method. See Note 10, "Incentive and Deferred Compensation Plans".
A reconciliation of the numerators and denominators used in the basic and diluted per-share computations is presented as follows for each class of common stock:
| | | (dollars in thousands, except per share data) | (dollars in thousands, except per share data) | | For the years ended December 31, | |
| 2021 | | 2020 | | 2019 |
| Allocated net income (numerator) | | Weighted shares (denominator) | | Per- share amount | | Allocated net income (numerator) | | Weighted shares (denominator) | | Per- share amount | | Allocated net income (numerator) | | Weighted shares (denominator) | | Per- share amount |
| (dollars in thousands, except per share data) | |
| (dollars in thousands, except per share data) | |
| | 2023 | |
| | 2023 | |
| | 2023 | | | 2022 | | 2021 |
| | Allocated net income (numerator) | | | | Allocated net income (numerator) | | Weighted shares (denominator) | | Per- share amount | | Allocated net income (numerator) | | Weighted shares (denominator) | | Per- share amount | | Allocated net income (numerator) | | Weighted shares (denominator) | | Per- share amount |
| Class A – Basic EPS: | Class A – Basic EPS: | | | | | | |
| Income available to Class A stockholders | |
| Income available to Class A stockholders | |
| Income available to Class A stockholders | Income available to Class A stockholders | | $ | 295,421 | | | 46,188,806 | | | $ | 6.40 | | | $ | 290,902 | | | 46,188,659 | | | $ | 6.30 | | | $ | 314,227 | | | 46,188,836 | | | $ | 6.80 | |
| Dilutive effect of stock-based awards | Dilutive effect of stock-based awards | | 0 | | | 17,696 | | | — | | | 0 | | | 23,901 | | | — | | | 0 | | | 30,224 | | | — | |
| Assumed conversion of Class B shares | Assumed conversion of Class B shares | | 2,439 | | | 6,100,800 | | | — | | | 2,402 | | | 6,100,800 | | | — | | | 2,594 | | | 6,100,800 | | | — | |
| Class A – Diluted EPS: | Class A – Diluted EPS: | | | | | | | | | | |
| Income available to Class A stockholders on Class A equivalent shares | Income available to Class A stockholders on Class A equivalent shares | | $ | 297,860 | | | 52,307,302 | | | $ | 5.69 | | | $ | 293,304 | | | 52,313,360 | | | $ | 5.61 | | | $ | 316,821 | | | 52,319,860 | | | $ | 6.06 | |
| Income available to Class A stockholders on Class A equivalent shares | |
| Income available to Class A stockholders on Class A equivalent shares | |
| Class B – Basic EPS: | Class B – Basic EPS: | | | | | | | | | | |
| Income available to Class B stockholders | |
| Income available to Class B stockholders | |
| Income available to Class B stockholders | Income available to Class B stockholders | | $ | 2,439 | | | 2,542 | | | $ | 959 | | | $ | 2,402 | | | 2,542 | | | $ | 945 | | | $ | 2,594 | | | 2,542 | | | $ | 1,020 | |
| Class B – Diluted EPS: | Class B – Diluted EPS: | | | | | | | | | | |
| Income available to Class B stockholders | Income available to Class B stockholders | | $ | 2,438 | | | 2,542 | | | $ | 959 | | | $ | 2,401 | | | 2,542 | | | $ | 945 | | | $ | 2,593 | | | 2,542 | | | $ | 1,020 | |
| Income available to Class B stockholders | |
| Income available to Class B stockholders | |
Note 5. Fair Value
Financial instruments carried at fair value
Our available-for-sale and equity securities are recorded at fair value, which is the price that would be received to sell the asset in an orderly transaction between willing market participants as of the measurement date.
Valuation techniques used to derive the fair value of our available-for-sale and equity securities are based upon observable and unobservable inputs. Observable inputs reflect market data obtained from independent sources. Unobservable inputs reflect our own assumptions regarding fair market value for these securities. Financial instruments are categorized based upon the following characteristics or inputs to the valuation techniques:
•Level 1 – Quoted prices (unadjusted) in active markets for identical assets or liabilities that the reporting entity can access at the measurement date.
•Level 2 – Inputs other than quoted prices included within Level 1 that are observable for the asset or liability, either directly or indirectly.
•Level 3 – Unobservable inputs for the asset or liability.
Estimates of fair values for our investment portfolio are obtained primarily from a nationally recognized pricing service. Our Level 1 securities are valued using an exchange traded price provided by the pricing service. Pricing service valuations for Level 2 securities include multiple verifiable, observable inputs including benchmark yields, reported trades, broker/dealer quotes, issuer spreads, two-sided markets, benchmark securities, bids, offers, and reference data. Pricing service valuations for Level 3 securities are based upon proprietary models and are used when observable inputs are not available or in illiquid markets.
Although virtually all of our prices are obtained from third party sources, we also perform internal pricing reviews, including evaluating the methodology and inputs used to ensure that we determine the proper classification level of the financial instrument and reviewing securities with price changes that vary significantly from current market conditions or independent price sources. Price variances are investigated and corroborated by market data and transaction volumes. We have reviewed the pricing methodologies of our pricing service as well as other observable inputs and believe that the prices adequately consider market activity in determining fair value.
In limited circumstances we adjust the price received from the pricing service when, in our judgment, a better reflection of fair value is available based upon corroborating information and our knowledge and monitoring of market conditions such as a disparity in price of comparable securities and/or non-binding broker quotes. In other circumstances, certain securities are internally priced because prices are not provided by the pricing service.
When a price from the pricing service is not available, values are determined by obtaining broker/dealer quotes and/or market comparables. When available, we obtain multiple quotes for the same security. The ultimate value for these securities is determined based upon our best estimate of fair value using corroborating market information. As of December 31, 2021,2023, nearly all of our available-for-sale and equity securities were priced using a third party pricing service.
The following tables present our fair value measurements on a recurring basis by asset class and level of input as of:
| | | December 31, 2023 | |
| | December 31, 2023 | |
| | December 31, 2023 | |
| | (in thousands) | |
| (in thousands) | |
| (in thousands) | | | Total | | Level 1 | | Level 2 | | Level 3 |
| | Available-for-sale securities: | |
| Available-for-sale securities: | |
| Available-for-sale securities: | |
| | | | December 31, 2021 |
| Corporate debt securities | |
| | (in thousands) | | Total | | Level 1 | | Level 2 | | Level 3 |
| | Available-for-sale securities: | | |
| | Corporate debt securities | |
| | Corporate debt securities | Corporate debt securities | | $ | 573,165 | | | $ | 0 | | | $ | 567,909 | | | $ | 5,256 | |
| Collateralized debt obligations | Collateralized debt obligations | | 115,462 | | | 0 | | | 115,462 | | | 0 | |
| Commercial mortgage-backed securities | Commercial mortgage-backed securities | | 89,324 | | | 0 | | | 73,596 | | | 15,728 | |
| Residential mortgage-backed securities | Residential mortgage-backed securities | | 139,922 | | | 0 | | | 131,108 | | | 8,814 | |
| Other debt securities | Other debt securities | | 23,920 | | | 0 | | | 23,920 | | | 0 | |
| U.S. Treasury | | 4,292 | | | 0 | | | 4,292 | | | 0 | |
| | Total available-for-sale securities | |
| Total available-for-sale securities | |
| Total available-for-sale securities | Total available-for-sale securities | | 946,085 | | | 0 | | | 916,287 | | | 29,798 | |
| Equity securities: | Equity securities: | | |
| Financial services sector | |
| Financial services sector | |
| Financial services sector | Financial services sector | | 71,722 | | | 1,624 | | | 68,015 | | | 2,083 | |
| Utilities sector | Utilities sector | | 6,259 | | | 0 | | | 6,259 | | | 0 | |
| Energy sector | Energy sector | | 6,448 | | | 10 | | | 6,438 | | | 0 | |
| Consumer sector | Consumer sector | | 3,314 | | | 0 | | | 3,314 | | | 0 | |
| | Technology sector | |
| Industrial sector | |
| Communications sector | |
| Total equity securities | Total equity securities | | 87,743 | | | 1,634 | | | 84,026 | | | 2,083 | |
| Total | Total | | $ | 1,033,828 | | | $ | 1,634 | | | $ | 1,000,313 | | | $ | 31,881 | |
| | | December 31, 2022 | |
| | December 31, 2022 | |
| | December 31, 2022 | |
| | (in thousands) | |
| (in thousands) | |
| (in thousands) | | | Total | | Level 1 | | Level 2 | | Level 3 |
| | Available-for-sale securities: | |
| Available-for-sale securities: | |
| Available-for-sale securities: | |
| | | | December 31, 2020 |
| Corporate debt securities | |
| | (in thousands) | | Total | | Level 1 | | Level 2 | | Level 3 |
| | Available-for-sale securities: | | |
| | Corporate debt securities | |
| | Corporate debt securities | Corporate debt securities | | $ | 566,425 | | | $ | 1,281 | | | $ | 559,319 | | | $ | 5,825 | |
| Collateralized debt obligations | Collateralized debt obligations | | 110,447 | | | 0 | | | 110,447 | | | 0 | |
| Commercial mortgage-backed securities | Commercial mortgage-backed securities | | 120,201 | | | 0 | | | 100,739 | | | 19,462 | |
| Residential mortgage-backed securities | Residential mortgage-backed securities | | 112,179 | | | 0 | | | 111,242 | | | 937 | |
| Other debt securities | Other debt securities | | 18,984 | | | 0 | | | 18,984 | | | 0 | |
| | Total available-for-sale securities | Total available-for-sale securities | | 928,236 | | | 1,281 | | | 900,731 | | | 26,224 | |
| Total available-for-sale securities | |
| Total available-for-sale securities | |
| Equity securities: | Equity securities: | | |
| Financial services sector | |
| Financial services sector | |
| Financial services sector | Financial services sector | | 76,575 | | | 24,981 | | | 51,594 | | | 0 | |
| Utilities sector | Utilities sector | | 8,742 | | | 3,957 | | | 4,785 | | | 0 | |
| Energy sector | Energy sector | | 2,206 | | | 676 | | | 1,530 | | | 0 | |
| Consumer sector | Consumer sector | | 3,068 | | | 576 | | | 2,492 | | | 0 | |
| Communications sector | Communications sector | | 2,699 | | | 2,699 | | | 0 | | | 0 | |
| Industrial sector | | 800 | | | 800 | | | 0 | | | 0 | |
| | Total equity securities | |
| Total equity securities | |
| Total equity securities | Total equity securities | | 94,090 | | | 33,689 | | | 60,401 | | | 0 | |
| Total | Total | | $ | 1,022,326 | | | $ | 34,970 | | | $ | 961,132 | | | $ | 26,224 | |
We review the fair value hierarchy classifications each reporting period. Transfers between hierarchy levels may occur due to changes in available market observable inputs.
Level 3 Assets – 2023 Year-to-Date Change:
| | | (in thousands) | |
| (in thousands) | |
| (in thousands) | (in thousands) | | Beginning balance at December 31, 2020 | | Included in earnings(1) | | Included
in other
comprehensive
income | | Purchases | | Sales | | Transfers into Level 3(2) | | Transfers out of Level 3(2) | | Ending balance at December 31, 2021 | | Beginning balance at December 31, 2022 | | Included in earnings(1) | | Included
in other
comprehensive
income (loss) | | Purchases | | Sales | | Transfers into Level 3(2) | | Transfers out of Level 3(2) | | Ending balance at December 31, 2023 |
| Available-for-sale securities: | Available-for-sale securities: | | |
| | Corporate debt securities | Corporate debt securities | | $ | 5,825 | | | $ | 34 | | | $ | 68 | | | $ | 5,502 | | | $ | (2,681) | | | $ | 4,290 | | | $ | (7,782) | | | $ | 5,256 | |
| Collateralized debt obligations | | 0 | | | 0 | | | 0 | | | 750 | | | 0 | | | 0 | | | (750) | | | 0 | |
| | Corporate debt securities | |
| | Corporate debt securities | |
| | Commercial mortgage-backed securities | |
| Commercial mortgage-backed securities | |
| Commercial mortgage-backed securities | Commercial mortgage-backed securities | | 19,462 | | | (375) | | | (782) | | | 3,073 | | | (5,378) | | | 11,933 | | | (12,205) | | | 15,728 | |
| Residential mortgage-backed securities | Residential mortgage-backed securities | | 937 | | | (5) | | | (69) | | | 576 | | | (2,229) | | | 12,692 | | | (3,088) | | | 8,814 | |
| Other debt securities | | 0 | | | 0 | | | 0 | | | 2,588 | | | (832) | | | 0 | | | (1,756) | | | 0 | |
| | Total available-for-sale securities | |
| Total available-for-sale securities | |
| Total available-for-sale securities | Total available-for-sale securities | | 26,224 | | | (346) | | | (783) | | | 12,489 | | | (11,120) | | | 28,915 | | | (25,581) | | | 29,798 | |
| Equity securities | Equity securities | | 0 | | | (5) | | | 0 | | | 1,000 | | | 0 | | | 2,183 | | | (1,095) | | | 2,083 | |
| Total Level 3 securities | Total Level 3 securities | | $ | 26,224 | | | $ | (351) | | | $ | (783) | | | $ | 13,489 | | | $ | (11,120) | | | $ | 31,098 | | | $ | (26,676) | | | $ | 31,881 | |
Level 3 Assets – 2022 Year-to-Date Change:
| | | (in thousands) | |
| (in thousands) | |
| (in thousands) | (in thousands) | | Beginning balance at December 31, 2019 | | Included in
earnings(1) | | Included
in other
comprehensive
income | | Purchases | | Sales | | Transfers into Level 3(2) | | Transfers out of Level 3(2) | | Ending balance at December 31, 2020 | | Beginning balance at December 31, 2021 | | Included in
earnings(1) | | Included
in other
comprehensive
income (loss) | | Purchases | | Sales | | Transfers into Level 3(2) | | Transfers out of Level 3(2) | | Ending balance at December 31, 2022 |
| Available-for-sale securities: | Available-for-sale securities: | | |
| | Corporate debt securities | Corporate debt securities | | $ | 8,324 | | | $ | (2) | | | $ | (156) | | | $ | 7,180 | | | $ | (1,405) | | | $ | 10,526 | | | $ | (18,642) | | | $ | 5,825 | |
| Collateralized debt obligations | | 0 | | | 0 | | | 3 | | | 247 | | | 0 | | | 0 | | | (250) | | | 0 | |
| | Corporate debt securities | |
| | Corporate debt securities | |
| | Commercial mortgage-backed securities | |
| Commercial mortgage-backed securities | |
| Commercial mortgage-backed securities | Commercial mortgage-backed securities | | 3,321 | | | (183) | | | 913 | | | 12,281 | | | (2,334) | | | 39,591 | | | (34,127) | | | 19,462 | |
| Residential mortgage-backed securities | Residential mortgage-backed securities | | 0 | | | (19) | | | (48) | | | 287 | | | (1,539) | | | 11,496 | | | (9,240) | | | 937 | |
| | Total available-for-sale securities | Total available-for-sale securities | | 11,645 | | | (204) | | | 712 | | | 19,995 | | | (5,278) | | | 61,613 | | | (62,259) | | | 26,224 | |
| Total available-for-sale securities | |
| Total available-for-sale securities | |
| Equity securities | Equity securities | | 0 | | | 151 | | | 0 | | | 2,836 | | | 0 | | | 0 | | | (2,987) | | | 0 | |
| Total Level 3 securities | Total Level 3 securities | | $ | 11,645 | | | $ | (53) | | | $ | 712 | | | $ | 22,831 | | | $ | (5,278) | | | $ | 61,613 | | | $ | (65,246) | | | $ | 26,224 | |
(1) These amounts are reported as net investment income and net realized and unrealized investment (losses) gains (losses) for each of the periods presented above.
(2) Transfers into and/or (out) of Level 3 are primarily attributable to the availability of market observable information and the re-evaluation of the observability of pricing inputs.
Financial instruments not carried at fair value
The following table presents the carrying values and fair values of financial instruments categorized as Level 3 in the fair value hierarchy that are recorded at carrying value as of:
| | | | | | | | | | | | | | | | | | | | | | | | | | |
| | | | | | |
| | December 31, 2021 | | December 31, 2020 |
| (in thousands) | | Carrying Value | | Fair Value | | Carrying Value | | Fair Value |
| | | | | | | | |
Agent loans (1) | | $ | 66,368 | | | $ | 68,957 | | | $ | 69,212 | | | $ | 73,854 | |
Long-term borrowings (2) | | 94,070 | | | 103,981 | | | 96,113 | | | 113,054 | |
| | | | | | | | | | | | | | | | | | | | | | | | | | |
| | | | | | |
| | December 31, 2023 | | December 31, 2022 |
| (in thousands) | | Carrying Value | | Fair Value | | Carrying Value | | Fair Value |
| | | | | | | | |
Agent loans, net (1) | | $ | 67,787 | | | $ | 66,445 | | | $ | 69,476 | | | $ | 62,954 | |
Other loans receivable, net (2) | | 10,713 | | | 10,713 | | | 5,199 | | | 5,199 | |
| | | | | | | | |
(1)The discount rate used to calculate fair value at December 31, 20212023 is reflective of a decrease in the BB+ financial yield curve.
(2)The discount rate used to calculate fair value atcurve from December 31, 2021 is reflective2022.
(2) The current and long-term portions of an increaseother loans receivable are included in U.S. Treasury bond yields.
Note 6. Investments
Available-for-sale securities
See Note 5, "Fair Value" for additional fair value disclosures. The following tables summarize the amortized cost and estimated fair value, net of credit loss allowance, of our available-for-sale securities as of:
| | | December 31, 2023 | |
| | December 31, 2023 | |
| | December 31, 2023 | |
| (in thousands) | | (in thousands) | | Amortized cost | | Gross unrealized gains | | Gross unrealized losses | | Estimated fair value |
| | | | December 31, 2021 |
| (in thousands) | | Amortized cost | | Gross unrealized gains | | Gross unrealized losses | | Estimated fair value |
| Corporate debt securities | |
| | | Corporate debt securities | |
| | Corporate debt securities | Corporate debt securities | | $ | 565,997 | | | $ | 9,663 | | | $ | 2,495 | | | $ | 573,165 | |
| Collateralized debt obligations | Collateralized debt obligations | | 115,344 | | | 456 | | | 338 | | | 115,462 | |
| Commercial mortgage-backed securities | Commercial mortgage-backed securities | | 88,636 | | | 1,465 | | | 777 | | | 89,324 | |
| Residential mortgage-backed securities | Residential mortgage-backed securities | | 140,217 | | | 1,007 | | | 1,302 | | | 139,922 | |
| Other debt securities | Other debt securities | | 23,859 | | | 197 | | | 136 | | | 23,920 | |
| U.S. Treasury | | 4,226 | | | 73 | | | 7 | | | 4,292 | |
| | Total available-for-sale securities, net | Total available-for-sale securities, net | | $ | 938,279 | | | $ | 12,861 | | | $ | 5,055 | | | $ | 946,085 | |
| Total available-for-sale securities, net | |
| Total available-for-sale securities, net | |
| | | December 31, 2022 | |
| | December 31, 2022 | |
| | December 31, 2022 | |
| (in thousands) | | (in thousands) | | Amortized cost | | Gross unrealized gains | | Gross unrealized losses | | Estimated fair value |
| | | | December 31, 2020 |
| (in thousands) | | Amortized cost | | Gross unrealized gains | | Gross unrealized losses | | Estimated fair value |
| Corporate debt securities | |
| | | Corporate debt securities | |
| | Corporate debt securities | Corporate debt securities | | $ | 546,096 | | | $ | 21,843 | | | $ | 1,514 | | | $ | 566,425 | |
| Collateralized debt obligations | Collateralized debt obligations | | 110,121 | | | 657 | | | 331 | | | 110,447 | |
| Commercial mortgage-backed securities | Commercial mortgage-backed securities | | 115,346 | | | 5,090 | | | 235 | | | 120,201 | |
| Residential mortgage-backed securities | Residential mortgage-backed securities | | 108,840 | | | 3,373 | | | 34 | | | 112,179 | |
| Other debt securities | Other debt securities | | 18,387 | | | 606 | | | 9 | | | 18,984 | |
| | Total available-for-sale securities, net | Total available-for-sale securities, net | | $ | 898,790 | | | $ | 31,569 | | | $ | 2,123 | | | $ | 928,236 | |
| Total available-for-sale securities, net | |
| Total available-for-sale securities, net | |
The amortized cost and estimated fair value of available-for-sale securities at December 31, 2021,2023 are shown below by remaining contractual term to maturity. Expected maturities may differ from contractual maturities because borrowers may have the right to call or prepay obligations with or without call or prepayment penalties.
| | | December 31, 2021 |
| Amortized | | Estimated |
| | December 31, 2023 | |
| | December 31, 2023 | |
| | December 31, 2023 | |
| | Amortized | | | | Amortized | | Estimated |
| (in thousands) | (in thousands) | | cost | | fair value | (in thousands) | | cost | | fair value |
| | Due in one year or less | |
| Due in one year or less | |
| Due in one year or less | Due in one year or less | | $ | 38,061 | | | $ | 38,396 | |
| Due after one year through five years | Due after one year through five years | | 409,379 | | | 414,588 | |
| Due after five years through ten years | Due after five years through ten years | | 195,937 | | | 197,733 | |
| Due after ten years | Due after ten years | | 294,902 | | | 295,368 | |
| Total available-for-sale securities | | $ | 938,279 | | | $ | 946,085 | |
Total available-for-sale securities, net (1) | |
|
The below securities have been evaluated and determined to be temporary declines in fair value for which we expect to recover our entire principal plus interest. The following tables present available-for-sale securities based on length of time in a gross unrealized loss position as of:
| | | | December 31, 2023 | |
| | December 31, 2023 | |
| | December 31, 2023 | |
| | Less than 12 months | | | | Less than 12 months | | 12 months or longer | | Total |
| (dollars in thousands) | | (dollars in thousands) | | Fair
value | | Unrealized losses | | Fair
value | | Unrealized losses | | Fair
value | | Unrealized losses | | No. of holdings |
| | December 31, 2021 |
| | Less than 12 months | | 12 months or longer | | Total |
| Corporate debt securities | |
| | Fair | | Unrealized | | Fair | | Unrealized | | Fair | | Unrealized | | No. of |
| (dollars in thousands) | | value | | losses | | value | | losses | | value | | losses | | holdings |
| | Corporate debt securities | |
| | Corporate debt securities | Corporate debt securities | | $ | 179,281 | | | $ | 1,912 | | | $ | 12,494 | | | $ | 583 | | | $ | 191,775 | | | $ | 2,495 | | | 441 | |
| Collateralized debt obligations | Collateralized debt obligations | | 64,270 | | | 278 | | | 9,370 | | | 60 | | | 73,640 | | | 338 | | | 104 | |
| Commercial mortgage-backed securities | Commercial mortgage-backed securities | | 28,001 | | | 595 | | | 917 | | | 182 | | | 28,918 | | | 777 | | | 61 | |
| Residential mortgage-backed securities | Residential mortgage-backed securities | | 89,460 | | | 1,278 | | | 441 | | | 24 | | | 89,901 | | | 1,302 | | | 98 | |
| Other debt securities | Other debt securities | | 14,576 | | | 136 | | | 0 | | | 0 | | | 14,576 | | | 136 | | | 24 | |
| U.S. Treasury | | 388 | | | 7 | | | 0 | | | 0 | | | 388 | | | 7 | | | 1 | |
| | Total available-for-sale securities | |
| Total available-for-sale securities | |
| Total available-for-sale securities | Total available-for-sale securities | | $ | 375,976 | | | $ | 4,206 | | | $ | 23,222 | | | $ | 849 | | | $ | 399,198 | | | $ | 5,055 | | | 729 | |
| Quality breakdown of available-for-sale securities: | Quality breakdown of available-for-sale securities: | | | | | | | | | | | | | | | Quality breakdown of available-for-sale securities: | | | | | | | | | | | | | | |
| Investment grade | Investment grade | | $ | 330,697 | | | $ | 3,801 | | | $ | 17,112 | | | $ | 434 | | | $ | 347,809 | | | $ | 4,235 | | | 366 | |
| Non-investment grade | Non-investment grade | | 45,279 | | | 405 | | | 6,110 | | | 415 | | | 51,389 | | | 820 | | | 363 | |
| Total available-for-sale securities | Total available-for-sale securities | | $ | 375,976 | | | $ | 4,206 | | | $ | 23,222 | | | $ | 849 | | | $ | 399,198 | | | $ | 5,055 | | | 729 | |
| | | | December 31, 2022 | |
| | December 31, 2022 | |
| | December 31, 2022 | |
| | Less than 12 months | | | | Less than 12 months | | 12 months or longer | | Total |
| (dollars in thousands) | | (dollars in thousands) | | Fair
value | | Unrealized losses | | Fair
value | | Unrealized losses | | Fair
value | | Unrealized losses | | No. of holdings |
| | December 31, 2020 |
| | Less than 12 months | | 12 months or longer | | Total |
| Corporate debt securities | |
| | Fair | | Unrealized | | Fair | | Unrealized | | Fair | | Unrealized | | No. of |
| (dollars in thousands) | | value | | losses | | value | | losses | | value | | losses | | holdings |
| | Corporate debt securities | |
| | Corporate debt securities | Corporate debt securities | | $ | 39,693 | | | $ | 644 | | | $ | 7,952 | | | $ | 870 | | | $ | 47,645 | | | $ | 1,514 | | | 257 | |
| Collateralized debt obligations | Collateralized debt obligations | | 50,036 | | | 232 | | | 10,899 | | | 99 | | | 60,935 | | | 331 | | | 65 | |
| Commercial mortgage-backed securities | Commercial mortgage-backed securities | | 16,582 | | | 235 | | | 0 | | | 0 | | | 16,582 | | | 235 | | | 31 | |
| Residential mortgage-backed securities | Residential mortgage-backed securities | | 8,163 | | | 34 | | | 0 | | | 0 | | | 8,163 | | | 34 | | | 13 | |
| Other debt securities | Other debt securities | | 1,019 | | | 9 | | | 0 | | | 0 | | | 1,019 | | | 9 | | | 4 | |
| | Total available-for-sale securities | Total available-for-sale securities | | $ | 115,493 | | | $ | 1,154 | | | $ | 18,851 | | | $ | 969 | | | $ | 134,344 | | | $ | 2,123 | | | 370 | |
| Total available-for-sale securities | |
| Total available-for-sale securities | |
| Quality breakdown of available-for-sale securities: | Quality breakdown of available-for-sale securities: | | | | | | | | | | | | | | | Quality breakdown of available-for-sale securities: | | | | | | | | | | | | | | |
| Investment grade | Investment grade | | $ | 86,807 | | | $ | 561 | | | $ | 10,899 | | | $ | 99 | | | $ | 97,706 | | | $ | 660 | | | 119 | |
| Non-investment grade | Non-investment grade | | 28,686 | | | 593 | | | 7,952 | | | 870 | | | 36,638 | | | 1,463 | | | 251 | |
| Total available-for-sale securities | Total available-for-sale securities | | $ | 115,493 | | | $ | 1,154 | | | $ | 18,851 | | | $ | 969 | | | $ | 134,344 | | | $ | 2,123 | | | 370 | |
Credit loss allowance on investmentsallowances
The current expectedfollowing table presents a roll-forward of the allowances for credit loss allowance on agent loans was $1.0 million and $1.1 million as of December 31, 2021 and 2020, respectively. The current expected credit losslosses on available-for-sale securities was less than $0.1 million and $0.2 million asfinancing receivables for the years ended December 31:
| | | | | | | | | | | | | | |
| (in thousands) | | 2023 | | 2022 |
| Available-for-sale securities: | | | | |
| Allowance for credit losses, beginning of year | | $ | 249 | | | $ | 21 | |
| Provision and recoveries | | 670 | | | 500 | |
| Sales/collections and write-offs | | (322) | | | (272) | |
| Allowance for credit losses, end of year | | $ | 597 | | | $ | 249 | |
| Other loans receivable: | | | | |
| Allowance for credit losses, beginning of year | | $ | 3,775 | | | $ | 3,564 | |
| Provision and recoveries | | 7,404 | | | 211 | |
| Sales/collections and write-offs | | (98) | | | 0 |
| Allowance for credit losses, end of year | | $ | 11,081 | | | $ | 3,775 | |
| Agent loans: | | | | |
| Allowance for credit losses, beginning of year | | $ | 957 | | | $ | 957 | |
| Provision and recoveries | | 0 | | 0 |
| Sales/collections and write-offs | | 0 | | 0 |
| Allowance for credit losses, end of year | | $ | 957 | | | $ | 957 | |
Net investment income
Investment income (loss), net of expenses, was generated from the following portfolios for the years ended December 31:
| | | (in thousands) | (in thousands) | | 2021 | | 2020 | | 2019 |
| | (in thousands) | |
| | (in thousands) | | | 2023 | | 2022 | | 2021 |
| | Available-for-sale securities | |
| Available-for-sale securities | |
| Available-for-sale securities | Available-for-sale securities | | $ | 23,795 | | | $ | 22,631 | | | $ | 22,496 | |
| Equity securities | Equity securities | | 4,321 | | | 4,147 | | | 1,418 | |
Limited partnerships (1) | Limited partnerships (1) | | 31,701 | | | (602) | | | 660 | |
| Cash equivalents and other | Cash equivalents and other | | 3,609 | | | 5,038 | | | 10,546 | |
| Total investment income | Total investment income | | 63,426 | | | 31,214 | | | 35,120 | |
| Less: investment expenses | Less: investment expenses | | 1,249 | | | 1,461 | | | 1,061 | |
| Investment income, net of expenses | | $ | 62,177 | | | $ | 29,753 | | | $ | 34,059 | |
| Net investment income | |
|
(1)Equity in earnings (losses) of limited partnerships includes Limited partnership losses include both realized gains (losses) and unrealized valuation changes. Our limited partnership investments are included in the line item "Other assets" in the Statements of Financial Position. We have made no new significant limited partnership commitments since 2006, and the balance of limited partnership investments is expected to decline over time as additional distributions are received.
RealizedNet realized and unrealized investment (losses) gains (losses)
Realized and unrealized gains (losses) on investments were as follows for the years ended December 31:
| | | | (in thousands) | |
| | (in thousands) | |
| | (in thousands) | (in thousands) | | 2021 | | 2020 | | 2019 | | 2023 | | 2022 | | 2021 |
| Available-for-sale securities: | Available-for-sale securities: | | |
| | Gross realized gains | Gross realized gains | | $ | 6,884 | | | $ | 3,920 | | | $ | 6,258 | |
| | Gross realized gains | |
| | Gross realized gains | |
| Gross realized losses | Gross realized losses | | (1,753) | | | (2,585) | | | (1,639) | |
| Net realized gains on available-for-sale securities | | 5,131 | | | 1,335 | | | 4,619 | |
| Net realized (losses) gains on available-for-sale securities | |
| | | Equity securities | |
| | Equity securities | |
| | Equity securities | Equity securities | | (186) | | | 5,056 | | | 1,484 | |
| | Miscellaneous | Miscellaneous | | 1 | | | 1 | | | 0 | |
| | Net realized and unrealized investment gains | | $ | 4,946 | | | $ | 6,392 | | | $ | 6,103 | |
| | Miscellaneous | |
| | Miscellaneous | |
| | Net realized and unrealized investment (losses) gains | |
| | Net realized and unrealized investment (losses) gains | |
| | Net realized and unrealized investment (losses) gains | |
|
The portion of net unrealized gains and losses(losses) recognized during the reporting period related to equity securities held at the reporting date is calculated as follows for the years ended December 31:
| | | | | | | | | | | | | | | | | | | | | | |
| | | | |
| (in thousands) | | 2021 | | 2020 | | 2019 | | |
| Equity securities: | | | | | | | | |
| Net (losses) gains recognized during the period | | $ | (186) | | | $ | 5,056 | | | $ | 1,484 | | | |
| Less: net (losses) gains recognized on securities sold | | (76) | | | (469) | | | 360 | | | |
| Net unrealized (losses) gains recognized on securities held at reporting date | | $ | (110) | | | $ | 5,525 | | | $ | 1,124 | | | |
| | | | | | | | | | | | | | | | | | | | | | |
| | | | |
| (in thousands) | | 2023 | | 2022 | | 2021 | | |
| Equity securities: | | | | | | | | |
| Net gains (losses) recognized during the period | | $ | 871 | | | $ | (13,238) | | | $ | (186) | | | |
| Less: net losses recognized on securities sold | | (2,328) | | | (1,866) | | | (76) | | | |
| Net unrealized gains (losses) recognized on securities held at reporting date | | $ | 3,199 | | | $ | (11,372) | | | $ | (110) | | | |
Net impairment (losses) recoveries (losses) recognized in earnings
Upon adoption of ASU 2016-13Impairment (losses) recoveries on January 1, 2020, impairments on available-for-sale securities that are deemed to be credit related are recognized in earnings with a corresponding available-for-sale security allowance. All unrealized losses related to factors other than credit are recorded in other comprehensive income. Prior to January 1, 2020, we had the intent to sell all credit-impaired available-for-sale securities; therefore, the entire amount of the impairment charges was included in earnings and no impairments were recognized in other comprehensive income. See also Note 2, "Significant Accounting Policies".
Impairments on available-for-sale securities and agent loansinvestments were as follows for the years ended December 31:
| | | (in thousands) | (in thousands) | | 2021 | | 2020 | | 2019 |
| (in thousands) | |
| (in thousands) | | | 2023 | | 2022 | | 2021 |
| Available-for-sale securities: | Available-for-sale securities: | | |
| Intent to sell | Intent to sell | | $ | (10) | | | $ | (2,274) | | | $ | (195) | |
| Credit recovered (impaired) | | 67 | | | (707) | | | — | |
| Intent to sell | |
| Intent to sell | |
| Credit (impaired) recovered | |
| Total available-for-sale securities | Total available-for-sale securities | | 57 | | | (2,981) | | | (195) | |
| Agent loans - expected credit recoveries (losses) | | 152 | | | (297) | | | — | |
| Net impairment recoveries (losses) recognized in earnings | | $ | 209 | | | $ | (3,278) | | | $ | (195) | |
| | Agent loans - expected credit recoveries | |
| Agent loans - expected credit recoveries | |
| Agent loans - expected credit recoveries | |
| Other loans receivable - expected credit losses | | Other loans receivable - expected credit losses | | (7,337) | | | 0 |
| Net impairment (losses) recoveries recognized in earnings | |
|
Note 7. Fixed Assets
The following table summarizes our fixed assets by category as of December 31:
| | (in thousands) | (in thousands) | | 2021 | | 2020 | (in thousands) | | 2023 | | 2022 |
| Software | Software | | $ | 259,586 | | | $ | 196,139 | |
| Land, buildings, and building improvements | Land, buildings, and building improvements | | 211,624 | | | 121,332 | |
| Equipment | Equipment | | 42,295 | | | 37,426 | |
| Furniture and fixtures | Furniture and fixtures | | 21,694 | | | 20,998 | |
| Leasehold improvements | Leasehold improvements | | 1,342 | | | 1,313 | |
Construction in progress (1) | |
Projects in progress | Projects in progress | | 34,569 | | | 47,277 | |
| | Total fixed assets, gross | Total fixed assets, gross | | 571,110 | | | 424,485 | |
| Less: Accumulated depreciation and amortization | Less: Accumulated depreciation and amortization | | (196,308) | | | (159,144) | |
| Fixed assets, net | Fixed assets, net | | $ | 374,802 | | | $ | 265,341 | |
(1) 2022 amounts have been reclassified to conform to the current period presentation.
Software increased primarily dueConstruction in progress includes ongoing renovations to internally developed software projects completed and placed in production related to providing commercial lines new product processing capabilities as well as mainframe and billing software.
On December 31, 2021, we purchased the home office properties from the Exchange at the current appraised value of $97.5 million in order to align the ownership interest of these facilities with the functions being performed at the home office campus which are mainly Indemnity's management operations. See Note 14, "Related Party". In 2020, the construction of a newan office building serving asthat is part of our principal headquarters was completed.and not yet subject to depreciation. The building was financed using a senior secured draw term loan credit facility. See Note 8, "Borrowing Arrangements". Interest capitalized during construction was $3.5 million and $3.4 million, for the years ended December 31, 2020 and 2019, respectively.renovation is expected to be completed in phases, starting in 2025, with full completion expected in 2027.
Projects in progress include certain computer software and software developmentsdevelopment costs for internal use that are not yet subject to amortization.
Depreciation and amortization of fixed assetsexpense totaled $37.2$47.4 million, $21.2$45.9 million and $16.8$37.2 million for the years ended December 31, 2021, 20202023, 2022 and 2019,2021, respectively, and is included in cost of operations - policy issuance and renewal services. Accumulated depreciation and amortization decreased due to disposals of fully depreciated assets, primarily software, partially offset by current year depreciation and amortization expense.
Note 8. Borrowing Arrangements
Bank Line of Credit
As of December 31, 2021, we
We have access to a $100 million bank revolving line of credit with a $25 million letter of credit sublimit that expires on October 29, 2026. As of December 31, 2021,2023, a total of $99.1 million remains available under the facility due to $0.9 million outstanding letters of credit, which reducesreduce the availability for letters of credit to $24.1 million. We had no borrowings outstanding on our line of credit as of December 31, 2021.2023. Investments with a fair value of $120.9$117.6 million were pledged as collateral on the line of credit at December 31, 2021. The2023. These investments pledged as collateral have no trading restrictions and are reported as available-for-sale securities and cash and cash equivalents on our StatementsStatement of Financial Position as of December 31, 2021.2023. The bank requires compliance with certain covenants, which include leverage ratios and debt restrictions, for our line of credit.restrictions. We are in compliance with all covenants at December 31, 2021.2023.
Term Loan Credit Facility
In 2016, we entered into a credit agreement for a $100 million senior secured draw term loan credit facility ("Credit Facility") for the acquisition of real property and construction of an office building that now serves as part of our principal headquarters. On January 1, 2019, the Credit Facility converted to a fully-amortized term loan with monthly payments of principal and interest at a fixed rate of 4.35% over a period of 28 years. Investments with a fair value of $120.3 million were pledged as collateral for the facility and are reported as available-for-sale securities and cash and cash equivalents on our Statements of Financial Position as of December 31, 2021. The bank requires compliance with certain covenants, which include leverage ratios, debt restrictions and minimum net worth, for our Credit Facility. We are in compliance with all covenants at December 31, 2021.
The remaining unpaid balance from the Credit Facility is reported at carrying value, net of unamortized loan origination and commitment fees, as long-term borrowings on our Statements of Financial Position. See Note 5, "Fair Value" for the estimated fair value of these borrowings.
Annual principal payments
The following table sets forth future principal and interest payments:
| | | | | | | | | | | | | | |
| (in thousands) | | | | |
| Year | | Principal payments | Interest payments | Total |
| 2022 | $ | 2,098 | | $ | 4,085 | | $ | 6,183 | |
| 2023 | | 2,226 | | 3,957 | | 6,183 | |
| 2024 | | 2,302 | | 3,881 | | 6,183 | |
| 2025 | | 2,448 | | 3,735 | | 6,183 | |
| 2026 | | 2,556 | | 3,627 | | 6,183 | |
| Thereafter | | 82,440 | | 41,108 | | 123,548 | |
Note 9. Postretirement Benefits
Pension plans
Our pension plans consist of a noncontributory defined benefit pension plan covering substantially all employees and an unfunded supplemental employee retirement plan ("SERP") for certain members of executive and senior management. The pension plans provideplan provides benefits to covered individuals satisfying certain age and service requirements. The defined benefit pension plan and SERP each provide benefits through a final average earnings formula.
Although we are the sponsor of these postretirement plans and record the funded status of these plans, there are reimbursements between us and the Exchange and its subsidiaries reimburse us for approximately 58%their allocated share of the annual benefit expense of these plans, which representspension income or cost. These reimbursements represent pension benefits for employees performing administrative services and theiran allocated share of costsplan (income) cost for employees in departments that support the administrative functions. In 2023, we reimbursed the Exchange and its subsidiaries for approximately 60% of the annual defined benefit pension income, and the Exchange and its subsidiaries reimbursed us for approximately 36% of the annual SERP cost. For our funded pension plan, amounts are settled in cash for the portion of pension costs(income) cost allocated to the Exchange and its subsidiaries. For our unfunded plans,SERP, we pay the obligations when due and amounts are settled in cash between entities when there is a payout.
Cost of pension plansPension plan (income) cost
Pension plan (income) cost includes the following components:components for the years ended December 31:
| | (in thousands) | (in thousands) | | | |
| 2021 | | 2020 | | 2019 | |
| | 2023 | |
| | 2023 | |
| | 2023 | |
| Service cost for benefits earned | |
| Service cost for benefits earned | |
| Service cost for benefits earned | Service cost for benefits earned | | $ | 53,041 | | | $ | 43,492 | | | $ | 33,854 | | |
| Interest cost on benefit obligation | Interest cost on benefit obligation | | 36,824 | | | 37,578 | | | 39,306 | | |
| Interest cost on benefit obligation | |
| Interest cost on benefit obligation | |
| Expected return on plan assets | |
| Expected return on plan assets | |
| Expected return on plan assets | Expected return on plan assets | | (50,275) | | | (49,411) | | | (47,484) | | |
| Prior service cost amortization | Prior service cost amortization | | 1,428 | | | 1,343 | | | 1,394 | | |
| Net actuarial loss amortization | | 16,106 | | | 12,125 | | | 5,113 | | |
| Prior service cost amortization | |
| Prior service cost amortization | |
| Net actuarial (gain) loss amortization | |
| Net actuarial (gain) loss amortization | |
| Net actuarial (gain) loss amortization | |
| Pension plan cost (1) | | $ | 57,124 | | | $ | 45,127 | | | $ | 32,183 | | |
Pension plan (income) cost (1) | |
| Pension plan (income) cost (1) | |
| Pension plan (income) cost (1) | |
(1) Pension plan costs represent the(income) cost represents total plan (income) cost before reimbursements tobetween Indemnity fromand the Exchange and its subsidiaries. The components of pension plan costs(income) cost other than the service cost components are included in the line item "Other"Other income (expense) income"" in the Statements of Operations, afternet of reimbursements frombetween Indemnity and the Exchange and its subsidiaries.
Actuarial assumptions
The following table describes the weighted-average assumptions at December 31 used to measure the year-endbenefit obligations and the net periodic benefit costs for the subsequent year:at December 31:
| | | 2023 | |
| | 2021 | | 2020 | | 2019 | | 2018 | |
| Employee pension plan: | |
| | Employee pension plan: | |
| | Employee pension plan: | Employee pension plan: | | | |
| Discount rate | Discount rate | | 3.16 | % | | 2.96 | % | | 3.59 | % | | 4.47 | % | |
| Discount rate | |
| Discount rate | |
| Expected return on assets | Expected return on assets | | 5.50 | | | 6.00 | | | 6.00 | | | 6.75 | | |
Compensation increases (1) | | 3.21 | | | 3.21 | | | 3.21 | | | 3.32 | | |
| Expected return on assets | |
| Expected return on assets | |
Rate of compensation increase (1) | |
Rate of compensation increase (1) | |
Rate of compensation increase (1) | |
| | SERP: | SERP: | | | |
Discount rate – pre-retirement/post-retirement (2) | | 3.11 | | | 2.86 | | | 3.59/3.09 | | 4.47/3.97 | |
| | SERP: | |
| | SERP: | |
| Discount rate | |
| Discount rate | |
| Discount rate | |
| Rate of compensation increase | Rate of compensation increase | | 5.00 | | | 5.00 | | | 5.00 | | | 5.00 | | |
| Rate of compensation increase | |
| Rate of compensation increase | |
(1) The rate of compensation increase for the employee plan is age-graded. An equivalent single compensation increase rate of 3.25% in 2023 and 3.21% in 2021, 2020 and 20192022 would produce similar results.
(2) In 2020,
The following table describes the SERP discountweighted-average assumptions used to measure net periodic benefit costs for the years ended December 31:
| | | | | | | | | | | | | | | | | | | | | | | |
| | 2023 | | 2022 | | 2021 | |
| | | | | | | |
| Employee pension plan: | | | | | | | |
| Discount rate | | 5.67 | % | | 3.16 | % | | 2.96 | % | |
| Expected return on assets | | 6.50 | | | 5.50 | | | 5.50 | | |
Rate of compensation increase (1) | | 3.30 | | | 3.21 | | | 3.21 | | |
| | | | | | | |
| SERP: | | | | | | | |
| Discount rate | | 5.46 | % | | 3.11 | % | | 2.86 | % | |
| Rate of compensation increase | | 5.00 | | | 5.00 | | | 5.00 | | |
(1) The rate methodology was revised to utilize SERP specific cash outflows independent of compensation increase for the employee pension plan discountis age-graded. An equivalent single compensation increase rate eliminating a difference between pre-retirementof 3.30% in 2023 and post-retirement rates.3.21% in 2022 and 2021 would produce similar results.
The economic assumptions that have the most impact on the postretirement benefits expense are the discount rate and the long-term rate of return on plan assets. The discount rate assumption used to determine the benefit obligation for all periods presented was based upon a yield curve developed from corporate bond yield information.
The pension plan's expected long-term rate of return represents the average rate of return to be earned on plan assets over the period the benefits included in the benefit obligation are to be paid. To determine the expected long-term rate of return assumption, we utilized models based upon historical analysis and forward-looking views of the financial markets based upon key factors such as historical returns for the asset class' applicable indices, the correlations of the asset classes under various market conditions and consensus views on future real economic growth and inflation. The expected future return for each asset
class is then combined by considering correlations between asset classes and the volatilities of each asset class to produce a reasonable range of asset return results within which our expected long-term rate of return assumption falls.
Funding policy/funded status
In 2018, we made acceleratedOur defined benefit pension contributions totaling $80 million. Following our 2018 contributions, we would not expect to make a subsequent contribution until the sum of the target normal costs for plan years beginning on and after December 31, 2017 exceeds $80 million, or earlier if a contribution is necessary to fund the plan to 100%. At that time, our funding policy will againis generally be to contribute an amount equal to the greater of the target normal cost for the plan year, or the amount necessary to fund the plan to 100%. Additional contributions may be necessary or desirable due to futureAccordingly, we made a $25 million contribution during 2022 and a $95 million contribution during 2023. We also made a contribution of $33 million in January 2024. The 2023 contribution generated a net benefit asset of $34.3 million and is presented separately from the unfunded plan changes, our particular business or investment strategy, or pending law changes.as a non-current asset on the Statement of Financial Position at December 31, 2023. The following table sets forth the funded status of the pension plans and the amounts recognized in the Statements of Financial Position at December 31:
| | (in thousands) | (in thousands) | | | | |
| 2021 | | 2020 | | |
| (in thousands) | |
| (in thousands) | |
| | 2023 | |
| | 2023 | |
| | 2023 | |
| | Funded status at end of year | Funded status at end of year | | $ | (132,411) | | | $ | (165,098) | | | |
| | Funded status at end of year | |
| | Funded status at end of year | |
| | Pension asset | |
| | Pension asset | |
| | Pension asset | |
Pension liabilities – due within one year (1) | |
Pension liabilities – due within one year (1) | |
Pension liabilities – due within one year (1) | Pension liabilities – due within one year (1) | | $ | (2,028) | | | $ | (752) | | | |
| Pension liabilities – due after one year | Pension liabilities – due after one year | | (130,383) | | | (164,346) | | | |
| Pension liabilities – due after one year | |
| Pension liabilities – due after one year | |
| Net amount recognized | Net amount recognized | | $ | (132,411) | | | $ | (165,098) | | | |
| Net amount recognized | |
| Net amount recognized | |
(1) The current portion of pension liabilities for the unfunded plan is included in accounts payable and accrued liabilities.
Benefit obligations
Benefit obligations are described in the following tables. Accumulated and projected benefit obligations represent the obligations of a pension plan for past service as of the measurement date. The accumulated benefit obligation is the present value of pension benefits earned as of the measurement date based on employee service and compensation prior to that date. It differs from the projected benefit obligation in that the accumulated benefit obligation includes no assumptions to reflect expected future compensation. The following table sets forth a reconciliation of beginning and ending balances of the projected benefit obligation, as well as the accumulated benefit obligation at December 31:
| | (in thousands) | (in thousands) | | | | |
| 2021 | | 2020 | | |
| (in thousands) | |
| (in thousands) | |
| | 2023 | |
| | 2023 | |
| | 2023 | |
| Projected benefit obligation, beginning of year | |
| Projected benefit obligation, beginning of year | |
| Projected benefit obligation, beginning of year | Projected benefit obligation, beginning of year | | $ | 1,246,159 | | | $ | 1,054,467 | | | |
| Service cost for benefits earned | Service cost for benefits earned | | 53,041 | | | 43,492 | | | |
| Service cost for benefits earned | |
| Service cost for benefits earned | |
| Interest cost on benefit obligation | |
| Interest cost on benefit obligation | |
| Interest cost on benefit obligation | Interest cost on benefit obligation | | 36,824 | | | 37,578 | | | |
| Plan amendments | Plan amendments | | 4,059 | | | — | | | |
| Actuarial (gain) loss | | (38,400) | | | 134,470 | | | |
| Plan amendments | |
| Plan amendments | |
| Actuarial loss (gain) | |
| Actuarial loss (gain) | |
| Actuarial loss (gain) | |
| Benefits paid | |
| Benefits paid | |
| Benefits paid | Benefits paid | | (29,029) | | | (23,848) | | | |
| | Projected benefit obligation, end of year | Projected benefit obligation, end of year | | $ | 1,272,654 | | | $ | 1,246,159 | | | |
| | Projected benefit obligation, end of year | |
| | Projected benefit obligation, end of year | |
| | Accumulated benefit obligation, end of year | Accumulated benefit obligation, end of year | | $ | 1,037,820 | | | $ | 1,006,884 | | | |
| | Accumulated benefit obligation, end of year | |
| | Accumulated benefit obligation, end of year | |
Projected benefit obligations increased $26.5$109.7 million at December 31, 20212023 compared to December 31, 20202022 primarily due primarily to anticipated plan progression partially offset by actuarial gains resulting from the higherlower discount rate used to measure the future benefit obligations. The discount rate increasedfor the employee pension plan decreased to 3.16%5.34% in 20212023 from 2.96%5.67% in 2020. The plan amendments during 2021 are due to the addition of four new participants to the SERP since December 31, 2020.2022.
61The following table describes plans with projected benefit obligations in excess of plan assets at December 31:
| | | | | | | | | | | | | | | | | |
| (in thousands) | | | |
| | 2023 | | 2022 | |
| Projected benefit obligation | | $ | 30,995 | | | $ | 883,814 | | |
| | | | | |
| Plan assets | | — | | | 829,866 | | |
Bothplan assets. At December 31, 2022, both the defined benefit pension plan and the SERP had projected benefit obligations in excess of plan assets at December 31:
| | | | | | | | | | | | | | | | | |
| (in thousands) | | Projected Benefit Obligation in Excess of Plan Assets | |
| | 2021 | | 2020 | |
| Projected benefit obligation | | $ | 1,272,654 | | | $ | 1,246,159 | | |
| | | | | |
| Plan assets | | 1,140,243 | | | 1,081,061 | | |
The SERP had accumulated benefit obligations in excess of plan assets at December 31:
| | (in thousands) | (in thousands) | | Accumulated Benefit Obligation in Excess of Plan Assets | |
| | 2023 | |
| | 2023 | |
| | 2023 | |
| | 2021 | | 2020 | |
| Accumulated benefit obligation | |
| | Accumulated benefit obligation | |
| | Accumulated benefit obligation | Accumulated benefit obligation | | $ | 29,190 | | | $ | 26,462 | | |
| Plan assets | Plan assets | | — | | | — | | |
| Plan assets | |
| Plan assets | |
PensionPlan assets
The following table sets forth a reconciliation of beginning and ending balances of the fair value of plan assets at December 31:
| | (in thousands) | (in thousands) | | | | |
| 2021 | | 2020 | | |
| (in thousands) | |
| (in thousands) | |
| | 2023 | |
| | 2023 | |
| | 2023 | |
| Fair value of plan assets, beginning of year | Fair value of plan assets, beginning of year | | $ | 1,081,061 | | | $ | 907,625 | | | |
| Actual gain on plan assets | | 86,966 | | | 195,713 | | | |
| Fair value of plan assets, beginning of year | |
| Fair value of plan assets, beginning of year | |
| Actual return on plan assets | |
| Actual return on plan assets | |
| Actual return on plan assets | |
| Employer contributions | Employer contributions | | 1,245 | | | 1,571 | | | |
| Employer contributions | |
| Employer contributions | |
| Benefits paid | |
| Benefits paid | |
| Benefits paid | Benefits paid | | (29,029) | | | (23,848) | | | |
| | Fair value of plan assets, end of year | Fair value of plan assets, end of year | | $ | 1,140,243 | | | $ | 1,081,061 | | | |
| | Fair value of plan assets, end of year | |
| | Fair value of plan assets, end of year | |
Accumulated other comprehensive lossincome
Net actuarial lossgain and prior service cost included in accumulated other comprehensive lossincome that were not yet recognized as components of net benefit costs were as follows:follows at December 31:
| | (in thousands) | (in thousands) | | | | |
| 2021 | | 2020 | | |
| Net actuarial loss | | $ | 27,524 | | | $ | 118,721 | | | |
| (in thousands) | |
| (in thousands) | |
| | 2023 | |
| | 2023 | |
| | 2023 | |
| Net actuarial gain | |
| Net actuarial gain | |
| Net actuarial gain | |
| Prior service cost | |
| Prior service cost | |
| Prior service cost | Prior service cost | | 12,201 | | | 9,570 | | | |
| Net amount not yet recognized | Net amount not yet recognized | | $ | 39,725 | | | $ | 128,291 | | | |
| Net amount not yet recognized | |
| Net amount not yet recognized | |
Other comprehensive incomeloss (income)
Amounts recognized in other comprehensive incomeloss (income) for pension plans were as follows:follows for the years ended December 31:
| | | | | | | | | | | | | | | | | |
| (in thousands) | | | |
| | 2021 | | 2020 | |
| Net actuarial gain arising during the year | | $ | (75,091) | | | $ | (11,832) | | |
| Amortization of net actuarial loss | | (16,106) | | | (12,125) | | |
| Amortization of prior service cost | | (1,428) | | | (1,343) | | |
Amendments (1) | | 4,059 | | | — | | |
| | | | | |
| Total recognized in other comprehensive income | | $ | (88,566) | | | $ | (25,300) | | |
| | | | | | | | | | | | | | | | | | | | | | | |
| (in thousands) | | | | | |
| | 2023 | | 2022 | | 2021 | |
| Net actuarial loss (gain) arising during the year | | $ | 28,279 | | | $ | (89,768) | | | $ | (75,091) | | |
| Amortization of net actuarial gain (loss) | | 15,331 | | | (7,320) | | | (16,106) | | |
| Amortization of prior service cost | | (1,446) | | | (1,443) | | | (1,428) | | |
Plan amendments (1) | | 583 | | | 1,620 | | | 4,059 | | |
| | | | | | | |
| Total recognized in other comprehensive loss (income) | | $ | 42,747 | | | $ | (96,911) | | | $ | (88,566) | | |
(1) In 2021, there were 4Plan amendments relate to new SERP participants.
Asset allocation
The employee pension plan utilizes a return seeking and a liability asset matching allocation strategy. It is based upon the understanding that 1) equity investments are expected to outperform debt investments over the long-term, 2) the potential volatility of short-term returns from equities is acceptable in exchange for the larger expected long-term returns, and 3) a portfolio structured across investment styles and markets (both domestic and foreign) reduces volatility. As a result, the employee pension plan's investment portfolio utilizes a broadly diversified asset allocation across domestic and foreign equity and debt markets. The investment portfolio is composed of commingled pools, an exchange traded fund, and a separate account that are dedicated exclusively to the management of employee benefit plan assets.
The target and actual asset allocations for the portfolio are as follows for the years ended December 31:
| | | Target asset
allocation | | Target asset
allocation | | Actual asset
allocation | | Actual asset
allocation | |
| | Target asset
allocation | |
| | Target asset
allocation | |
| | Target asset
allocation | |
| Asset allocation: | |
| Asset allocation: | |
| Asset allocation: | Asset allocation: | | 2021 | | 2020 | | 2021 | | 2020 | |
| Equity securities: | Equity securities: | | | |
| Equity securities: | |
| Equity securities: | |
| U.S. equity securities | |
| U.S. equity securities | |
| U.S. equity securities | U.S. equity securities | | 27 | % | (1) | 27 | % | | 27 | % | | 28 | % | |
| Non-U.S. equity securities | Non-U.S. equity securities | | 18 | | (2) | 18 | | | 18 | | | 18 | | |
| Non-U.S. equity securities | |
| Non-U.S. equity securities | |
| Total equity securities | |
| Total equity securities | |
| Total equity securities | Total equity securities | | 45 | | | 45 | | | 45 | | | 46 | | |
| Debt securities | Debt securities | | 54 | | (3) | 54 | | | 54 | | | 53 | | |
| Debt securities | |
| Debt securities | |
| Other | |
| Other | |
| Other | Other | | 1 | | (4) | 1 | | | 1 | | | 1 | | |
| Total | Total | | 100 | % | | 100 | % | | 100 | % | | 100 | % | |
| Total | |
| Total | |
(1) U.S. equity securities – 21%100% seek to achieve excess returns relative to the Russell 20003000 Index. The remaining 79% of the allocation to U.S. equity securities are comprised of equity index funds that track the S&P 500.
(2) Non-U.S. equity securities – 11% are allocated to international small cap investments, while another 20%19% are allocated to international emerging market investments. The remaining 69%70% of the Non-U.S. equity securities are allocated to investments seeking to achieve excess returns relative to an international market index.
(3) Debt securities – 34%60% are allocated to long U.S. Treasury Strips, 66%40% are allocated to U.S. corporate bonds with an emphasis on long duration bonds rated A or better.
(4) Institutional money market fund.
The following tables present fair value measurements for the pension plan assets by major category and level of input as of:
| | | December 31, 2021 | |
| | December 31, 2023 | |
| | December 31, 2023 | |
| | December 31, 2023 | |
| | Fair value measurements of plan assets using: | |
| (in thousands) | (in thousands) | | Total | | Level 1 | | Level 2 | | Level 3 | |
| (in thousands) | |
| (in thousands) | | | Total | | Level 1
Fair Value | | Level 2
Fair Value | | Level 3
Fair Value | | Net Asset
Value (NAV) |
| Equity securities: | Equity securities: | | | |
| U.S. equity securities | |
| U.S. equity securities | |
| U.S. equity securities | U.S. equity securities | | $ | 305,440 | | | $ | 0 | | | $ | 305,440 | | | $ | 0 | | |
| Non-U.S. equity securities | Non-U.S. equity securities | | 200,949 | | | 139,688 | | | 61,261 | | | 0 | | |
| Total equity securities | Total equity securities | | 506,389 | | | 139,688 | | | 366,701 | | | 0 | | |
| Debt securities | Debt securities | | 620,337 | | | 0 | | | 620,337 | | | 0 | | |
| Other | Other | | 13,517 | | | 13,517 | | | 0 | | | 0 | | |
| Total | Total | | $ | 1,140,243 | | | $ | 153,205 | | | $ | 987,038 | | | $ | 0 | | |
| | | December 31, 2020 | |
| | December 31, 2022 | |
| | December 31, 2022 | |
| | December 31, 2022 | |
| | Fair value measurements of plan assets using: | |
| (in thousands) | (in thousands) | | Total | | Level 1 | | Level 2 | | Level 3 | |
| (in thousands) | |
| (in thousands) | | | Total | | Level 1
Fair Value | | Level 2
Fair Value | | Level 3
Fair Value | | Net Asset
Value (NAV) |
| Equity securities: | Equity securities: | | | |
| U.S. equity securities | |
| U.S. equity securities | |
| U.S. equity securities | U.S. equity securities | | $ | 296,624 | | | $ | 0 | | | $ | 296,624 | | | $ | 0 | | |
| Non-U.S. equity securities | Non-U.S. equity securities | | 196,971 | | | 134,841 | | | 62,130 | | | 0 | | |
| Total equity securities | Total equity securities | | 493,595 | | | 134,841 | | | 358,754 | | | 0 | | |
| Debt securities | Debt securities | | 574,910 | | | 0 | | | 574,910 | | | 0 | | |
| Other | Other | | 12,556 | | | 12,556 | | | 0 | | | 0 | | |
| Total | Total | | $ | 1,081,061 | | | $ | 147,397 | | | $ | 933,664 | | | $ | 0 | | |
Estimates of fair values of the pension plan assets are obtained primarily from the trustee and custodian of our pension plan. Our Level 1 category includes a money market mutual fund, an exchange traded fund, and a separate account for which the fair value is determined using an exchange traded price provided by the trustee and custodian. Our Level 2 category includes commingled pools. Estimates of fair values for securities held by our commingledCommingled pools are obtained primarilyvalued based on NAV per share or unit as a practical expedient as reported by the fund manager, multiplied by the number of shares or units held as of the measurement date. Accordingly, these NAV-based investments have been excluded from the trusteefair value hierarchy. These investments have minimal redemption notice periods and custodian. Trustee and custodian valuation methodologies for Level 2 securities include multiple verifiable, observable inputs including benchmark yields, reported trades, broker/dealer quotes, issuers spreads, two-sided markets, benchmark securities, bids, offers, and reference data.are redeemable daily at the NAV, less transaction fees, without significant restrictions. There are no significant unfunded commitments related to these investments.
Estimated future benefit payments
The following table sets forth amounts of benefits expected to be paid over the next 10 years from our pension plans as of:
| | (in thousands) | (in thousands) | |
Year ending
December 31, | Year ending
December 31, | | Expected future
benefit payments |
| 2022 | $ | 29,730 | |
| 2023 | | 33,975 | |
Year ending
December 31, | |
Year ending
December 31, | | | Expected future
benefit payments |
| 2024 | 2024 | | 36,025 | |
| 2025 | 2025 | | 39,813 | |
| 2026 | 2026 | | 42,218 | |
| 2027 - 2031 | | 265,680 | |
| 2027 | |
| 2028 | |
| 2029 - 2033 | |
Employee savings plan
All full-time and regular part-time employees are eligible to participate in a qualified 401(k) savings plan. We match 100% of the participant contributions up to 3% of compensation and 50% of participant contributions over 3% and up to 5% of compensation. Matching contributions paid to the plan were $18.4 million in 2023, $16.7 million in 2022, and $16.1 million in 2021, $15.8 million in 2020, and $14.9 million in 2019.2021. The Exchange and its subsidiaries reimbursed us for approximately 59% of the matching contributions. Employees are permitted to invest the employer-matching contributions in our Class A common stock. Employees, other than executive and senior officers, may sell the shares at any time without restriction, provided they are in compliance with applicable insider trading laws; sales by executive and senior officers are subject to additional pre-clearance restrictions imposed by our insider trading policies. The plan acquires shares in the open market necessary to meet the obligations of the plan. Plan participants held 0.20.1 million shares of our Class A common stock at December 31, 20212023 and 2020.2022.
Note 10. Incentive and Deferred Compensation Plans
We have 2two incentive plans and 2two deferred compensation plans for our executives, senior vice presidents and other selected officers, and 2two deferred compensation plans for our outside directors. Executives, senior vice presidents and other selected officers and key employees are also eligible to receive awards under an equity compensation plan, subject to the discretion of the Executive Compensation and Development Committee of our Board of Directors ("ECDC") or the chief executive officer.
Annual incentive plan
Our annual incentive plan ("AIP") is a bonus plan that pays cash to our executives, senior vice presidents and other selected officers annually. Participants can elect to defer up to 100% of the award under either the deferred compensation plan or the incentive compensation deferral plan. If the funding qualifier is met, plan participants are eligible to receive the incentive based upon attainment of corporate and individual performance measures, which can include various financial measures. The measures are established at the beginning of each year by the Executive Compensation and Development Committee of our Board of Directors ("ECDC"),ECDC, with ultimate approval by the full Board of Directors. The corporate performance measures included the reported growth in direct written premium and policies in force, and statutory combined ratio of the Exchange and its property and casualty subsidiaries for all periods presented.
Long-term incentive plan
Our long-term incentive plan ("LTIP") is a performance based incentive plan designed to reward executives, senior vice presidents and other selected officers who can have a significant impact on our long-term performance, and to further align the interests of such employees with those of our shareholders. The LTIP permits grants of performance shares or units, or phantom shares, to be satisfied with shares of our Class A common stock or cash payment as determined by the ECDC. Participants can elect to defer up to 100% of the award under the incentive compensation deferral plan. The ECDC determines the form of the award to be granted at the beginning of each performance period, which is generally a three-year period. The number of shares of the Company'sour common stock authorized for grant under the LTIP is 1.5 million shares, with no one person able to receive more than 250,000 shares or the equivalent of $5 million during any one performance period.shares. We repurchase our Class A common stock on the open market to settle stock awards under the plan. We do not issue new shares of common stock to settle stock awards. LTIP awards are considered vested at the end of each applicable performance period.
The LTIP provides the recipient the right to earn performance shares or units, or phantom stock, based on the level of achievement of performance goals as defined by us. Performance measures and a peer group of property and casualty companies to be used for comparison are determined by the ECDC. The performance measures for all periods presented were the reported growth in direct written premium and statutory combined ratio of the Exchange and its property and casualty subsidiaries and return on invested assets over a three-year performance period as compared to the results of the peer group over the same period. Because the award is based upon a comparison to results of a peer group over a three-year period, the award accrual is based upon estimates of probable results for the remaining performance period. This estimate is subject to variability if our results or the results of the peer group are substantially different than the results we project.
The fair value of LTIP awards is measured at each reporting date at the current share price of our Class A common stock. A liability is recorded and compensation expense is recognized ratably over the performance period.
At December 31, 2021,2023, the plan awards for the 2019-20212021-2023 performance period, which will be granted as a cash award, were fully vested. Distributions will be made in 20222024 once peer group financial information becomes available. The total estimated plan award based upon the peer group information as of September 30, 2023 is $1.9 million. At December 31, 2022, the fully vested plan awards for the 2020-2022 performance period totaled $3.8 million and were awarded to participants in June 2023. At December 31, 2021, is $5.4 million.the fully vested plan awards for the 2019-2021 performance period totaled $3.8 million and were awarded to participants in June 2022. At December 31, 2020, the fully vested cashplan awards for the 2018-2020 performance period that were not deferred totaled $10.9 million and were paidawarded to participants in June 2021. At December 31, 2019, the fully vested cash awards for the 2017-2019 performance period that were not deferred totaled $7.4 million and were paid to participants in June 2020. At December 31, 2018, the awards paid in cash for the 2016-2018 performance period were fully vested and resulted in a $8.2 million payment to plan participants in June 2019. The ECDC has determined that the plan awards for the 2020-20222022-2024 and 2021-20232023-2025 performance periods will be paid in cash.
The Exchange and its subsidiaries reimburse us for compensation costs of employees performing administrative services. Earned compensation costs are allocated to these entities and reimbursed to us in cash once the payout is made. The total compensation cost charged to operations related to these LTIP awards, net of forfeitures, was $7.3 million in 2023, $3.4 million in 2022, and $3.0 million in 2021, $12.0 million in 2020, and $7.3 million in 2019.2021. The related tax benefits recognized in income were $1.5 million in 2023, $0.7 million in 2022, and $0.6 million in 2021, $2.5 million in 2020, and $1.5 million in 2019. The2021. In 2023, the Exchange and its subsidiaries reimbursereimbursed us for approximately 46%35% of the annual compensation cost of these plans. At December 31, 2021,2023, there was $3.8$12.0 million of total unrecognized compensation cost for non-vested LTIP awards related to open performance periods. Unrecognized compensation is expected to be recognized over a period of two years.
Deferred compensation plan
Our deferred compensation plan allows executives, senior vice presidents and other selected officers to elect to defer receipt of a portion of their compensation and AIP cash awards until a later date. Employer 401(k) matching contributions that are in excess of the annual contribution or compensation limits are also credited to the participant accounts for those who elected to defer receipt of some portion of their base salary. Participants select hypothetical investment funds for their deferrals, which are credited with the hypothetical returns generated.
Incentive compensation deferral plan
We have an unfunded, non-qualified incentive compensation deferral plan for participants of the AIP and LTIP. Participants can elect to defer up to 100% of their annual AIP award and/or up to 100% of their LTIP award for each performance period. Deferred awards will be credited to a deferred stock account as credits denominated in shares of our Class A shares of the Companycommon stock until retirement or other separation from service from the Company.service. Participants are 100% vested at date of deferral. The shares are then held in a rabbi trust, which was established to hold the shares earned under both the incentive compensation deferral plan and the deferred stock compensation plan for outside directors. The rabbi trust is classified and accounted for as equity in a manner consistent with the accounting for treasury stock. Dividends received on the shares in the rabbi trust are used to purchase additional shares. Vested share credits will be paid to participants from the rabbi trust upon separation from service in approximate equal annual installments of Class A shares for a period of three years. In 2021,2023, the rabbi trust purchased 2,5701,608 shares of our common stock in the open market at an average price of $232.81$230.71 for $0.6$0.4 million to satisfy the liability for the 20202022 AIP awards and 17,881 shares at an average price of $191.25 for $3.4 million to satisfy the liability for the 2018-20202020-2022 LTIP performance period awards deferred under the incentive compensation deferral plan.plan, and dividend equivalent credits on rabbi trust shares. In 2020,2022, the rabbi trust purchased 3,9347,046 shares of our common stock in the open market at an average price of $155.92$176.44 for $0.6$1.2 million to satisfy the liability for the 20192021 AIP awards and 18,126 shares at an average share price of $185.31 for $3.4 million to satisfy the liability for the 2017-20192019-2021 LTIP performance period awards deferred under the incentive compensation deferral plan.plan, and dividend equivalent credits on rabbi trust shares. In 2019,2021, the rabbi trust purchased 4,38720,451 shares of our common stock in the open market at an average price of $176.34$196.48 for $0.8$4.0 million to satisfy the liability for the 20182020 AIP and 2018-2020 LTIP performance period awards deferred under the incentive compensation deferral plan.plan, and dividend equivalent credits on rabbi trust shares.
Deferred compensation plans for outside directors
We have a deferred compensation plan for our outside directors that allows participants to defer receipt of a portion of their annual compensation until a later date. Participants select hypothetical investment funds for their deferrals, which are credited with the hypothetical returns generated.
We also have a deferred stock compensation plan for our outside directors to further align the interests of directors with those of our shareholders that provides for payment of a portion of the directors' annual compensation in shares of our Class A common stock. Each director vests in the grant 25% every three months over the course of a year. Dividends paid by us are credited to each director's account whichand vest immediately. We do not issue new shares of common stock to directors. Our practice is toWe repurchase shares of our Class A common stock in the open market to satisfy these awards, which are then held in the rabbi trust. Effective April 25, 2023, the plan was amended to include a maximum of 250,000 shares that may be issued under the plan, and to stipulate that no shares may be credited later than ten years from the date our shareholders last approved the plan.
The rabbi trust purchased 5,2385,894 shares of our common stock on the open market at an average price of $212.41$238.73 for $1.1$1.4 million in 2021, 7,4012023, 6,048 shares at an average price of $201.78$201.93 for $1.5$1.2 million in 2020,2022, and 7,3705,238 shares at an average price of $194.62 $212.41
for $1.4$1.1 million in 20192021 to satisfy the liability of the stock compensation plan for outside directors.directors, and dividend equivalent credits on rabbi trust shares. The shares are distributed to the outside director from the rabbi trust upon ending board service. The totalDirector compensation charged to operations related to these awards totaled $0.9 million in 2023 and $0.8 million $0.9 millionin both 2022 and $1.1 million in 2021, 2020 and 2019, respectively.2021.
The following table sets forth a reconciliation of beginning and ending balances of our deferred executive compensation liability as of December 31:
| | (in thousands) | (in thousands) | | |
| | 2023 | |
| | 2023 | |
| | 2023 | | | 2022 | | 2021 |
| | 2021 | | 2020 | | 2019 |
| | Deferred executive compensation, beginning of the year | |
| Deferred executive compensation, beginning of the year | |
| Deferred executive compensation, beginning of the year | Deferred executive compensation, beginning of the year | | $ | 32,223 | | | $ | 24,616 | | | $ | 26,182 | |
| Annual incentive plan awards | Annual incentive plan awards | | 6,768 | | | 5,619 | | | 2,745 | |
| Long-term incentive plan awards | Long-term incentive plan awards | | 3,471 | | | 12,381 | | | 7,267 | |
| | Employer match and hypothetical earnings on deferred compensation | |
| Employer match and hypothetical earnings on deferred compensation | |
| Employer match and hypothetical earnings on deferred compensation | Employer match and hypothetical earnings on deferred compensation | | 3,043 | | | 2,962 | | | 2,700 | |
| Total plan awards and earnings | Total plan awards and earnings | | 13,282 | | | 20,962 | | | 12,712 | |
| Total plan awards paid | Total plan awards paid | | (16,647) | | | (10,121) | | | (12,852) | |
| Compensation deferred | Compensation deferred | | 4,765 | | | 4,668 | | | 1,579 | |
| Distributions from the deferred compensation plans | Distributions from the deferred compensation plans | | (811) | | | (2,081) | | | (797) | |
Forfeitures (1) | Forfeitures (1) | | (473) | | | (356) | | | — | |
| Funding of rabbi trust for deferred stock compensation plan for outside directors | Funding of rabbi trust for deferred stock compensation plan for outside directors | | (1,113) | | | (1,493) | | | (1,434) | |
| Funding of rabbi trust for incentive compensation deferral plan | | (4,018) | | | (3,972) | | | (774) | |
Funding of rabbi trust for incentive compensation deferral plan (2) | |
| Deferred executive compensation, end of the year | Deferred executive compensation, end of the year | | $ | 27,208 | | | $ | 32,223 | | | $ | 24,616 | |
(1) Forfeitures are the result of plan participants who separated from service with the Company and are recognized in the year they occur.
(2) In 2023 and 2022, funding includes $0.9 million and $0.5 million, respectively, representing shares held back to satisfy tax withholding on rabbi trust distributions that reduced funding requirements for performance award deferrals.
Equity compensation plan
We also have anOur equity compensation plan ("ECP") which is designed to reward executives, senior vice presidents and other selected officers and key employees as determined by the ECDC or the chief executive officer, who can have a significant impact on our long-term performance, and to further align the interests of such employees with those of our shareholders. The ECP permits grants of restricted shares, restricted share units and other share based awards, to be satisfied with shares of our Class A common stock or cash. The ECDC determines the form of the award to be granted at the beginning of each performance period. The number of shares of the Company'sour Class A common stock authorized for grant under the ECP is 100,000 shares, with no one person able to receive more than 5,00010,000 shares in a calendar year. We do not issue new shares of common stock to satisfy plan awards. Share awards are settled through the repurchase of our Class A common stock on the open market. Restricted share awards may be entitled to receive dividends payable during the performance period, or, if subject to performance goals, to receive dividend equivalents payable upon vesting. Dividend equivalents may provide for the crediting of interest or hypothetical reinvestmentinvestment experience, payable after expiration of the performance period. Vesting conditions are determined at the time the award is granted and may include continuation of employment for a specific period, satisfaction of performance goals and thewithin a defined performance period, and the satisfaction of any other terms and conditions as determined to be appropriate. The ECP expires December 31, 2022,2031, unless earlier amended or terminated by our Board of Directors. To address the impending expiration of the ECP, on February 17, 2022, our Board of Directors approved an Amendment and Restatement of the ECP (the "Amended and Restated ECP") that would extend the expiration date of the plan to December 31, 2031, unless further amended or earlier terminated by the Board. The terms of the Amended and Restated ECP are substantially similar to the current ECP and are subject to the approval of shareholders at our 2022 Annual Meeting.
To date, all awards have been satisfied with shares of our Class A common stock. In 2023, we purchased 1,610 Class A shares with an average share price of $252.32 and a market value of $0.4 million to satisfy the liability for the 2020 plan year. In 2022, we purchased 1,786 Class A shares with an average share price of $190.68 and a market value of $0.3 million to satisfy the liability for the 2019 plan year. In 2021, we purchased 978 Class A shares with an average share price of $242.01 and a market value of $0.2 million to satisfy the liability for the 2018 plan year. In 2020, we purchased 1,787 Class A shares with an average share price of $165.82 and a market value of $0.3 million to satisfy the liability for the 2017 plan year. In 2019, we purchased 3,246 shares with an average share price of $132.35 and a market value of $0.4 million to satisfy the liability for the 2016 plan year. The total compensation charged to operations related to these ECP awards was $4.0 million in 2023, $0.8 million in 2022, and $0.2 million in 2021, $0.7 million2021. The increases in 2020,2023 and $0.5 million2022 compared to the respective prior periods resulted from increases in 2019.plan participants and our stock price. The Exchange and its subsidiaries reimburse us for earned compensation costs of employees performing administrative services, which can fluctuate each year based on the plan participants. The Exchange and its subsidiaries reimbursed us for approximately 33%35%, 59%3%, and 49%33% of the awards paid in 2021, 2020,2023, 2022, and 20192021 respectively. Unearned compensation expense of $0.2$2.9 million is expected to be recognized over a period of threetwo years.
Note 11. Income Taxes
The provision for income taxes consists of the following for the years ended December 31:
| | (in thousands) | (in thousands) | | |
| | 2023 | |
| | 2023 | |
| | 2023 | | | 2022 | | 2021 |
| | 2021 | | 2020 | | 2019 |
| | Current income tax expense | |
| Current income tax expense | |
| Current income tax expense | Current income tax expense | | $ | 80,398 | | | $ | 80,373 | | | $ | 76,535 | |
| Deferred income tax (benefit) expense | Deferred income tax (benefit) expense | | (1,854) | | | (5,162) | | | 3,349 | |
| | Income tax expense | Income tax expense | | $ | 78,544 | | | $ | 75,211 | | | $ | 79,884 | |
| Income tax expense | |
| Income tax expense | |
A reconciliation of the provision for income taxes, with amounts determined by applying the statutory federal income tax rate to pre-tax income, is as follows for the years ended December 31:
| | (in thousands) | (in thousands) | | |
| 2021 | | 2020 | | 2019 |
| | 2023 | |
| | 2023 | |
| | 2023 | | | 2022 | | 2021 |
| Income tax at statutory rate | Income tax at statutory rate | | $ | 79,045 | | | $ | 77,388 | | | $ | 83,308 | |
| | Tax-exempt interest | | — | | | — | | | (123) | |
| | Decrease in unrecognized tax benefits | | — | | | — | | | (3,088) | |
| Other, net | |
| | Other, net | |
| | Other, net | Other, net | | (501) | | | (2,177) | | | (213) | |
| Income tax expense | Income tax expense | | $ | 78,544 | | | $ | 75,211 | | | $ | 79,884 | |
|
Temporary differences and carry-forwards, which give rise to deferred tax assets and liabilities, are as follows as of December 31:
| | (in thousands) | (in thousands) | | |
| 2021 | | 2020 |
| | 2023 | |
| | 2023 | |
| | 2023 | | | 2022 |
| Deferred tax assets: | Deferred tax assets: | | |
| Pension and other postretirement benefits | | $ | 21,545 | | | $ | 29,065 | |
| Other employee benefits | Other employee benefits | | 15,273 | | | 14,544 | |
| Other employee benefits | |
| Other employee benefits | |
| Unrealized losses on investments | |
| Deferred revenue | Deferred revenue | | 3,963 | | | 3,872 | |
| Allowance for management fee returned on cancelled policies | Allowance for management fee returned on cancelled policies | | 3,330 | | | 3,515 | |
| | Unrealized losses on investments | | — | | | 1,083 | |
| Other | | 3,484 | | | 2,692 | |
Current expected credit loss allowance (1) | |
| Current expected credit loss allowance (1) | |
| Current expected credit loss allowance (1) | |
Other (1) | |
| Total deferred tax assets | Total deferred tax assets | | 47,595 | | | 54,771 | |
| Deferred tax liabilities: | Deferred tax liabilities: | | |
| Depreciation | Depreciation | | 35,204 | | | 29,978 | |
| Unrealized gains on investments | | 8,713 | | | 7,540 | |
| Depreciation | |
| Depreciation | |
| Pension and other postretirement benefits | |
| Prepaid expenses | Prepaid expenses | | 2,458 | | | 3,800 | |
| | Other | |
| | Other | |
| | Other | Other | | 1,075 | | | 1,112 | |
| Total deferred tax liabilities | Total deferred tax liabilities | | 47,450 | | | 42,430 | |
| Net deferred tax asset | | $ | 145 | | | $ | 12,341 | |
| Net deferred tax liability | |
If we determine that any of our deferred tax assets will not result in future tax benefits, a valuation allowance must be established for the portion of the assets that are not expected to be realized. We had no valuation allowance recorded at December 31, 20212023 or 2020.2022.
A reconciliation ofWe do not have any unrecognized tax benefits for the years ended December 31 is as follows:
| | | | | | | | | | | | | | | | | | | | |
| (in thousands) | | | | | | |
| | 2021 | | 2020 | | 2019 |
| Balance at the beginning of the year | | $ | 0 | | | $ | 0 | | | $ | 3,088 | |
| Additions for prior year tax positions | | — | | | — | | | 4,631 | |
| Reductions for prior year tax positions | | — | | | — | | | (7,719) | |
| Balance at the end of the year | | $ | 0 | | | $ | 0 | | | $ | 0 | |
The uncertain tax position including $3.1 million of tax expense and $0.9 million of interest expense recorded in a prior year was settled during 2019. This settlement reducedbenefit that, if recognized, would affect our effective tax rate by 1.0%as of December 31, 2023 and 2022. Any interest expense related to uncertain tax positions would be recognized in 2019. The amounts recorded in a prior year resulted from the difference in measuring theincome tax liability at the previous tax rate and the current enacted tax rate.expense.
Tax years ending December 31, 2020, 20192022, 2021 and 20182020 remain open to IRS examination. We are not currently under IRS audit, nor have we been notified of an upcoming IRS audit.
We are the attorney-in-fact for the subscribers (policyholders) at the Exchange, a reciprocal insurance exchange. In that capacity, we provide all services and facilities necessary to conduct the Exchange's insurance business. Indemnity and the Exchange together constitute a single insurance business. Consequently, we are not subject to state corporate income or franchise taxes in states where the Exchange conducts its business and the states collect premium tax in lieu of corporate income or franchise tax, as a result of the Exchange's remittance of premium taxes in those states.
Note 12. Capital Stock
Class A and B common stock
We have 2two classes of common stock: Class A, which has a dividend preference, and Class B, which has voting power and a conversion right. Each share of Class A common stock outstanding at the time of the declaration of any dividend upon shares of Class B common stock shall be entitled to a dividend payable at the same time, at the same record date, and in an amount at least equal to 2/3 of 1.0% of any dividend declared on each share of Class B common stock. We may declare and pay a dividend in respect to Class A common stock without any requirement that any dividend be declared and paid in respect to Class B common stock. Sole shareholder voting power is vested in Class B common stock except insofar as any applicable law shall permit Class A common shareholders to vote as a class in regards to any changes in the rights, preferences, and privileges attaching to Class A common stock. Holders of Class B shares may, at their option, convert their shares into Class A shares at the rate of 2,400 Class A shares per Class B share. There were no shares of Class B common stock converted into Class A common stock in 2021, 20202023, 2022 or 2019.2021.
Stock repurchases
Our Board of Directors authorized a stock repurchase program effective January 1, 1999 allowing the repurchase of our outstanding Class A nonvoting common stock. In 2011, our Board of Directors approved a continuation of the current stock repurchase program for a total of $150 million, with no time limitation. Treasury shares are recorded in the Statements of Financial Position at total cost based upon trade date. There were no shares repurchased under this program during 2021, 20202023, 2022 or 2019.2021. We had approximately $17.8 million of repurchase authority remaining under this program at December 31, 2021,2023, based upon trade date.
We made stock repurchases in 2021, 2020,2023, 2022, and 20192021 outside of our publicly announced share repurchase program related to stock-based awards. See Note 10, "Incentive and Deferred Compensation Plans" for additional information.
Note 13. Accumulated Other Comprehensive Income (Loss)
Changes in accumulated other comprehensive income ("AOCI") (loss) by component, including amounts reclassified to other comprehensive income ("OCI") (loss) and the related line item in the Statements of Operations where net income is presented, are as follows for the year ended December 31:
| | (in thousands) | (in thousands) | | 2021 | | 2020 | | 2019 | (in thousands) | | 2023 | | 2022 | | 2021 |
| Before Tax | Income Tax | Net | | Before Tax | Income Tax | Net | | Before Tax | Income Tax | Net |
| | Before Tax | | | | Before Tax | Income Tax | Net | | Before Tax | Income Tax | Net | | Before Tax | Income Tax | Net |
| Investment securities: | Investment securities: | | | | | | |
| AOCI (loss), beginning of year | AOCI (loss), beginning of year | | $ | 29,384 | | $ | 6,171 | | $ | 23,213 | | | $ | 5,664 | | $ | 1,189 | | $ | 4,475 | | | $ | (9,169) | | $ | (1,926) | | $ | (7,243) | |
| AOCI (loss), beginning of year | |
| AOCI (loss), beginning of year | |
| OCI (loss) before reclassifications | OCI (loss) before reclassifications | | (16,474) | | (3,460) | | (13,014) | | | 22,074 | | 4,636 | | 17,438 | | | 19,257 | | 4,044 | | 15,213 | |
| Realized investment gains | | (5,131) | | (1,078) | | (4,053) | | | (1,335) | | (280) | | (1,055) | | | (4,619) | | (970) | | (3,649) | |
| Impairment (recoveries) losses | | (57) | | (12) | | (45) | | | 2,981 | | 626 | | 2,355 | | | 195 | | 41 | | 154 | |
| Realized investment losses (gains) | |
| Impairment losses (recoveries) | |
| | OCI (loss) | OCI (loss) | | (21,662) | | (4,550) | | (17,112) | | | 23,720 | | 4,982 | | 18,738 | | | 14,833 | | 3,115 | | 11,718 | |
| AOCI, end of year | | $ | 7,722 | | $ | 1,621 | | $ | 6,101 | | | $ | 29,384 | | $ | 6,171 | | $ | 23,213 | | | $ | 5,664 | | $ | 1,189 | | $ | 4,475 | |
| OCI (loss) | |
| OCI (loss) | |
| AOCI (loss), end of year | |
| | Pension and other postretirement plans: | Pension and other postretirement plans: | |
| Pension and other postretirement plans: | |
| Pension and other postretirement plans: | |
| AOCI (loss), beginning of year | |
| AOCI (loss), beginning of year | |
| AOCI (loss), beginning of year | AOCI (loss), beginning of year | | $ | (128,300) | | $ | (26,944) | | $ | (101,356) | | | $ | (153,600) | | $ | (32,257) | | $ | (121,343) | | | $ | (155,749) | | $ | (32,708) | | $ | (123,041) | |
| OCI (loss) before reclassifications | OCI (loss) before reclassifications | | 71,032 | | 14,917 | | 56,115 | | | 11,832 | | 2,485 | | 9,347 | | | (4,085) | | (858) | | (3,227) | |
Amortization of prior service costs (1) | Amortization of prior service costs (1) | | 1,428 | | 300 | | 1,128 | | | 1,343 | | 282 | | 1,061 | | | 1,394 | | 293 | | 1,101 | |
Amortization of net actuarial loss (1) | | 16,106 | | 3,382 | | 12,724 | | | 12,125 | | 2,546 | | 9,579 | | | 4,840 | | 1,016 | | 3,824 | |
| OCI | | 88,566 | | 18,599 | | 69,967 | | | 25,300 | | 5,313 | | 19,987 | | | 2,149 | | 451 | | 1,698 | |
Amortization of net actuarial (gain) loss (1) | |
| OCI (loss) | |
| AOCI (loss), end of year | AOCI (loss), end of year | | $ | (39,734) | | $ | (8,345) | | $ | (31,389) | | | $ | (128,300) | | $ | (26,944) | | $ | (101,356) | | | $ | (153,600) | | $ | (32,257) | | $ | (121,343) | |
| | Total | Total | |
| Total | |
| Total | |
| AOCI (loss), beginning of year | |
| AOCI (loss), beginning of year | |
| AOCI (loss), beginning of year | AOCI (loss), beginning of year | | $ | (98,916) | | $ | (20,773) | | $ | (78,143) | | | $ | (147,936) | | $ | (31,068) | | $ | (116,868) | | | $ | (164,918) | | $ | (34,634) | | $ | (130,284) | |
| Investment securities | Investment securities | | (21,662) | | (4,550) | | (17,112) | | | 23,720 | | 4,982 | | 18,738 | | | 14,833 | | 3,115 | | 11,718 | |
| Pension and other postretirement plans | Pension and other postretirement plans | | 88,566 | | 18,599 | | 69,967 | | | 25,300 | | 5,313 | | 19,987 | | | 2,149 | | 451 | | 1,698 | |
| OCI | | 66,904 | | 14,049 | | 52,855 | | | 49,020 | | 10,295 | | 38,725 | | | 16,982 | | 3,566 | | 13,416 | |
| OCI (loss) | |
| AOCI (loss), end of year | AOCI (loss), end of year | | $ | (32,012) | | $ | (6,724) | | $ | (25,288) | | | $ | (98,916) | | $ | (20,773) | | $ | (78,143) | | | $ | (147,936) | | $ | (31,068) | | $ | (116,868) | |
(1)These components of AOCI (loss) are included in the computation of net periodic pension (income) cost. See Note 9, "Postretirement Benefits", for additional information.
Note 14. Related Party
Management fee
A management fee is charged to the Exchangeretained for services we provide under the subscriber's agreement with subscribers at the Exchange. The fee is a percentage of direct and affiliated assumed premiums written by the Exchange. This percentage rate is determined at least annually by our Board of Directors but cannot exceed 25%. The management fee rate charged the Exchange was 25% in 2021, 20202023, 2022 and 2019.2021. The Board of Directors elected to maintain the fee at 25% beginning January 1, 2022.2024.
There is no provision in the subscriber's agreement for termination of our appointment as attorney-in-fact by the subscribers at the Exchange and the appointment is not affected by a policyholder's disability or incapacity.
Insurance holding company system
Most states have enacted legislation that regulates insurance holding company systems, defined as 2two or more affiliated persons, 1one or more of which is an insurer. The Exchange has the following wholly owned property and casualty subsidiaries: Erie Insurance Company, Erie Insurance Company of New York, Erie Insurance Property & Casualty Company and Flagship City Insurance Company, and a wholly owned life insurance company, Erie Family Life Insurance Company. Indemnity and the Exchange, and its wholly owned subsidiaries, meet the definition of an insurance holding company system.
All transactionsTransactions within a holding company system affecting the member insurers of the holding company system must be fair and reasonable and any charges or fees for services performed must be reasonable. Approval by the applicable insurance commissioner is required prior to the consummation of certain transactions affecting the members within a holding company system.
Shared facilities
We leased the home office from the Exchange until December 31, 2021, at which time we purchased the home office properties from the Exchange at the appraised value of $97.5 million to align the ownership interest of these facilities with the functions being performed at the home office campus, which are mainly Indemnity's management operations. See Note 7, "Fixed Assets" for additional information. Lease expense totaled $6.1 million in 2021, 2020 and 2019, respectively.2021. Operating expenses, including utilities, cleaning, repairs, real estate taxes, property insurance, and leasehold improvements totaled $15.7 million in both 2021 and 2020, respectively, and $16.7 million in 2019.2021. The Exchange and its subsidiaries reimbursed us for rent costs and related operating expenses of shared facilities used to perform administrative services, which are allocated based upon usage or square footage occupied. Reimbursements related to the use of this space totaled $4.8 million $4.6 million, and $4.2 million in 2021, 2020, and 2019, respectively.2021.
Effective July 1, 2021, the Exchange and its subsidiaries entered into a service agreement with Indemnity to use space in Indemnity-owned properties. The home office was added to this agreement effective January 1, 2022. The amount charged is based on rental rates of like property in Erie, Pennsylvania and the usage or square footage occupied. In 2021, incomeIncome earned from the Exchange and its subsidiaries for the use of space totaled $2.6 million, $2.2 million and $0.2 million.million in 2023, 2022, and 2021, respectively. Operating expenses includingfor Indemnity-owned properties under this service agreement include utilities, cleaning, repairs, real estate taxes, property insurance, and leasehold improvementsimprovements. These expenses totaled $20.0 million, $19.5 million, and $0.8 million in 2023, 2022, and 2021, respectively. The Exchange and its subsidiaries reimbursed us for operating expenses of shared facilities used to perform administrative services, which are allocated based upon usage or square footage occupied. Reimbursements related to the use of this space totaled $5.2 million, $4.1 million, and $0.1 million in 2023, 2022, and 2021, respectively.
Other loans receivable
In December 2023, we issued two senior secured loans totaling $13.6 million to fund a real estate development project supporting revitalization efforts in our community. Ownership in the project consists of related party investors, including affiliate entities and two Indemnity directors, as well as other unrelated investors. The home office was added to this agreement effective January 1, 2022.loans, net of current expected credit loss allowances, are reported in "Other assets" in our Statement of Financial Position, with changes in credit loss allowances totaling $7.3 million reported in "Net impairment (losses) recoveries recognized in earnings" in our Statement of Operations.
The first loan issued for $4.6 million accrues paid-in-kind interest at a fixed rate of 5% and matures December 15, 2027, with both principal and accrued interest due at maturity. The second loan issued for $9.0 million accrues paid-in-kind interest at a fixed rate of 5% and matures December 15, 2033, with both principal and accrued interest due at maturity.
Note 15. Concentrations of Credit Risk
Financial instruments could potentially expose us to concentrations of credit risk, including our unsecured receivables from the Exchange. A largeThe majority of our revenue and receivables are from the Exchange and its affiliates. See also Note 1, "Nature of Operations". Net management fee amounts and other reimbursements due from the Exchange and its affiliates were $479.1$625.3 million and $494.6$524.9 million at December 31, 20212023 and 2020, respectively. Upon adoption of ASU 2016-13, we recorded an allowance for current expected credit losses of $0.6 million related to the receivables from the Exchange and affiliates. See also Note 2, "Significant Accounting Policies". The2022, respectively, which includes a current expected credit loss allowance was $0.5 million andof $0.6 million at December 31, 2021 and 2020, respectively.
Note 16. Commitments and Contingencies
In 2020, we entered intoWe have an agreement with a bank for the establishment of aan agent loan participation program for agent loans.program. The maximum amount of loans to be funded through this program is $100 million. We have committed to fund a minimum of 30% of each loan executed through this program. As of December 31, 2021, the total2023, loans executed under this agreement totaled $25.8$59.1 million, of which our portion of the loans is $9.6$20.6 million. Additionally, we have agreed to guarantee a portion of the funding provided by the other participants in the program in the event of default. As of December 31, 2021,2023, our maximum potential amount of future payments on the guaranteed portion is $2.9$6.7 million. All loan payments under the participation program are current as of December 31, 2021.2023.
We also have contingent obligations for guarantees related to certain real estate development projects supporting revitalization efforts in our community. As of December 31, 2023, our maximum potential obligation related to the guarantees is $7.0 million.
We are involved in litigation arising in the ordinary course of conducting business. In accordance with current accounting standards for loss contingencies and based upon information currently known to us, we establish reserves for litigation when it is probable that a loss associated with a claim or proceeding has been incurred and the amount of the loss or range of loss can be reasonably estimated. When no amount within the range of loss is a better estimate than any other amount, we accrue the minimum amount of the estimable loss. To the extent that such litigation against us may have an exposure to a loss in excess of the amount we have accrued, we believe that such excess would not be material to our financial condition, results of operations, or cash flows. Legal fees are expensed as incurred. We believe that our accruals for legal proceedings are appropriate and, individually and in the aggregate, are not expected to be material to our financial condition, results of operations, or cash flows.
We review all litigation on an ongoing basis when making accrual and disclosure decisions. For certain legal proceedings, we cannot reasonably estimate losses or a range of loss, if any, particularly for proceedings that are in their early stages of development or where the plaintiffs seek indeterminate damages. Various factors, including, but not limited to, the outcome of potentially lengthy discovery and the resolution of important factual questions, may need to be determined before probability can be established or before a loss or range of loss can be reasonably estimated. If the loss contingency in question is not both probable and reasonably estimable, we do not establish an accrual and the matter will continue to be monitored for any developments that would make the loss contingency both probable and reasonably estimable. In the event that a legal proceeding results in a substantial judgment against, or settlement by, us, there can be no assurance that any resulting liability or financial commitment would not have a material adverse effect on our financial condition, results of operations, or cash flows.
Note 17. Supplementary Data on Cash Flows
A reconciliation of net income to net cash provided by operating activities as presented in the Statements of Cash Flows is as follows for the years ended December 31: | | (in thousands) | (in thousands) | | 2021 | | 2020 | | 2019 | (in thousands) | | 2023 | | 2022 | | 2021 |
| | Cash flows from operating activities: | Cash flows from operating activities: | |
| Cash flows from operating activities: | |
| Cash flows from operating activities: | |
| Net income | |
| Net income | |
| Net income | Net income | | $ | 297,860 | | | $ | 293,304 | | | $ | 316,821 | |
| Adjustments to reconcile net income to net cash provided by operating activities: | Adjustments to reconcile net income to net cash provided by operating activities: | |
| Depreciation and amortization | |
| Depreciation and amortization | |
| Depreciation and amortization | Depreciation and amortization | | 37,210 | | | 21,195 | | | 16,813 | |
| Deferred income tax (benefit) expense | Deferred income tax (benefit) expense | | (1,854) | | | (5,162) | | | 3,349 | |
| | Lease amortization expense | Lease amortization expense | | 11,887 | | | 13,108 | | | 13,959 | |
| Realized (gains) and impairment (recoveries) losses on investments | | (2,307) | | | (3,114) | | | (5,908) | |
| Lease amortization expense | |
| Lease amortization expense | |
| Losses (gains) and impairment losses (recoveries) on investments | |
| | (Gain) loss on disposal of fixed assets | | (13) | | | (15) | | | 75 | |
| Net investment (income) loss | | (25,944) | | | 5,878 | | | 543 | |
| (Decrease) increase in deferred compensation | | (5,006) | | | 7,611 | | | (1,541) | |
| Loss (gain) on disposal of fixed assets | |
| Loss (gain) on disposal of fixed assets | |
| Loss (gain) on disposal of fixed assets | |
| Net investment loss (income) | |
| Increase (decrease) in deferred compensation | |
| | Decrease (increase) in receivables from affiliates | | 15,514 | | | (26,548) | | | (19,505) | |
| (Increase) decrease in receivables from affiliates | |
| (Increase) decrease in receivables from affiliates | |
| (Increase) decrease in receivables from affiliates | |
| Increase in accrued investment income | Increase in accrued investment income | | (157) | | | (713) | | | (170) | |
| | Decrease in prepaid pension | | 52,755 | | | 41,227 | | | 28,798 | |
| Increase in pension asset | |
| Increase in pension asset | |
| Increase in pension asset | |
| Increase in pension liability | |
| Decrease (increase) in prepaid expenses and other assets | Decrease (increase) in prepaid expenses and other assets | | 12,161 | | | (4,771) | | | (1,707) | |
| Decrease in accounts payable and accrued expenses | | (4,823) | | | (14,307) | | | (3,627) | |
| Increase (decrease) in commissions payable | | 8,408 | | | (625) | | | 21,390 | |
| Increase (decrease) in accrued agent bonuses | | 10,279 | | | 14,105 | | | (7,409) | |
| (Decrease) increase in contract liability | | (3,176) | | | 1,422 | | | 2,646 | |
| Increase (decrease) in accounts payable and accrued expenses | |
| Increase in commissions payable | |
| (Decrease) increase in accrued agent incentive compensation | |
| Increase (decrease) in contract liability | |
| Net cash provided by operating activities | Net cash provided by operating activities | | $ | 402,794 | | | $ | 342,595 | | | $ | 364,527 | |
Note 18. Subsequent Events
No items were identified in this period subsequent to the financial statement date that required adjustment or additional disclosure.disclosure, other than the disclosure made in Note 9, "Postretirement Benefits" regarding the January 2024 pension contribution.
ITEM 9. CHANGES IN AND DISAGREEMENTS WITH ACCOUNTANTS ON ACCOUNTING AND FINANCIAL DISCLOSURE
None.
ITEM 9A. CONTROLS AND PROCEDURES
Evaluation of Disclosure Controls and Procedures
We maintain disclosure controls and procedures designed to ensure that information required to be disclosed in our reports filed under the Securities Exchange Act of 1934, as amended, is recorded, processed, summarized and reported within the time periods specified in the Securities and Exchange Commission rules and forms, and that such information is accumulated and communicated to management, including our Chief Executive Officer and Chief Financial Officer, as appropriate, to allow for timely decisions regarding required disclosures.
As required by the Securities and Exchange Commission Rule 13a-15(e), we carried out an evaluation, under the supervision and with the participation of management, including our Chief Executive Officer and Chief Financial Officer, of the effectiveness of the design and operation of our disclosure controls and procedures as of December 31, 2021.2023. Based upon the foregoing, our Chief Executive Officer and Chief Financial Officer concluded that our disclosure controls and procedures were effective.
Changes in Internal Control over Financial Reporting
There has been no change in our internal controls over financial reporting during our most recent fiscal quarter that has materially affected, or is reasonably likely to materially affect our internal controls over financial reporting. Our process for evaluating controls and procedures is continuous and encompasses constant improvement of the design and effectiveness of established controls and procedures.
Management's Report on Internal Control over Financial Reporting
Management is responsible for establishing and maintaining adequate internal control over financial reporting of Erie Indemnity Company, as defined in Rules 13a-15(f) under the Exchange Act. Under the supervision and with the participation of our management, including our Chief Executive Officer and Chief Financial Officer, we conducted an evaluation of the effectiveness of the Erie Indemnity Company's internal control over financial reporting based upon the framework in the Internal Control-Integrated Framework issued in 2013 by the Committee of Sponsoring Organizations of the Treadway Commission. Based upon our evaluation under the framework in the Internal Control-Integrated Framework issued in 2013, management has concluded that Erie Indemnity Company's internal control over financial reporting was effective as of December 31, 2021.2023.
| | | | | | | | | | | | | | | | | |
| /s/ Timothy G. NeCastro | | /s/ Gregory J. GuttingJulie M. Pelkowski | | /s/ Julie M. PelkowskiJorie L. Novacek | |
| Timothy G. NeCastro | | Gregory J. GuttingJulie M. Pelkowski | | Julie M. PelkowskiJorie L. Novacek | |
| President and | | Executive Vice President | | Senior Vice President | |
| Chief Executive Officer | | and Chief Financial Officer | | and Controller | |
February 24, 202226, 2024 | | February 24, 202226, 2024 | | February 24, 202226, 2024 | |
Our independent auditor, Ernst & Young LLP, a registered public accounting firm, has issued an attestation report on our internal control over financial reporting. This report appears on the following page.
ITEM 9B. OTHER INFORMATION
There was no additional information in the fourth quarter of 20212023 that has not already been filed in a Form 8-K.
Report of Independent Registered Public Accounting Firm
To the Shareholders and the Board of Directors of Erie Indemnity Company
Opinion on Internal Control overOver Financial Reporting
We have audited Erie Indemnity Company’s internal control over financial reporting as of December 31, 2021,2023, based on criteria established in Internal Control-IntegratedControl—Integrated Framework issued by the Committee of Sponsoring Organizations of the Treadway Commission (2013 framework) (the COSO criteria). In our opinion, Erie Indemnity Company (the Company) maintained, in all material respects, effective internal control over financial reporting as of December 31, 2021,2023, based onthe COSO criteria.criteria.
We also have audited, in accordance with the standards of the Public Company Accounting Oversight Board (United States) (PCAOB), the statements of financial position of the Company as of December 31, 20212023 and 2020, and2022, the related statements of operations, comprehensive income, shareholders’ equity and cash flows for each of the three years in the period ended December 31, 20212023, and the related notes of the Company and our report dated February 24, 202226, 2024 expressed an unqualified opinion thereon.
Basis for Opinion
The Company’s management is responsible for maintaining effective internal control over financial reporting and for its assessment of the effectiveness of internal control over financial reporting included in the accompanying Management’s Report on Internal Control over Financial Reporting. Our responsibility is to express an opinion on the Company’s internal control over financial reporting based on our audit. We are a public accounting firm registered with the PCAOB and are required to be independent with respect to the Company in accordance with the U.S. federal securities laws and the applicable rules and regulations of the Securities and Exchange Commission and the PCAOB.
We conducted our audit in accordance with the standards of the PCAOB. Those standards require that we plan and perform the audit to obtain reasonable assurance about whether effective internal control over financial reporting was maintained in all material respects.
Our audit included obtaining an understanding of internal control over financial reporting, assessing the risk that a material weakness exists, testing and evaluating the design and operating effectiveness of internal control based on the assessed risk, and performing such other procedures as we considered necessary in the circumstances. We believe that our audit provides a reasonable basis for our opinion.
Definition and Limitations of Internal Control Over Financial Reporting
A company’s internal control over financial reporting is a process designed to provide reasonable assurance regarding the reliability of financial reporting and the preparation of financial statements for external purposes in accordance with generally accepted accounting principles. A company’s internal control over financial reporting includes those policies and procedures that (1) pertain to the maintenance of records that, in reasonable detail, accurately and fairly reflect the transactions and dispositions of the assets of the company; (2) provide reasonable assurance that transactions are recorded as necessary to permit preparation of financial statements in accordance with generally accepted accounting principles, and that receipts and expenditures of the company are being made only in accordance with authorizations of management and directors of the company; and (3) provide reasonable assurance regarding prevention or timely detection of unauthorized acquisition, use, or disposition of the company’s assets that could have a material effect on the financial statements.
Because of its inherent limitations, internal control over financial reporting may not prevent or detect misstatements. Also, projections of any evaluation of effectiveness to future periods are subject to the risk that controls may become inadequate because of changes in conditions, or that the degree of compliance with the policies or procedures may deteriorate.
/s/ Ernst & Young LLP
Cleveland, OHIndianapolis, Indiana
February 24, 202226, 2024
PART III
ITEM 10. DIRECTORS, EXECUTIVE OFFICERS AND CORPORATE GOVERNANCE
The information with respect to our outside directors, audit committee and audit committee financial experts, and Section 16(a) beneficial ownership reporting compliance, and insider trading policy is incorporated herein by reference to the information statement on Schedule 14C to be filed with the Securities and Exchange Commission no later than 120 days after December 31, 2021.2023.
We have adopted a Code of Conduct that applies to all of our outside directors, officers and employees. We have previously filed a copy of the Code of Conduct as Exhibit 14.314.1 to the Registrant's Form 10-K8-K filed with the Securities and Exchange Commission on February 25, 2016.October 26, 2023. In addition to this, we have adopted a Code of Ethics for Senior Financial Officers that also applies to our Chief Executive Officer, Chief Financial Officer, Chief Accounting Officer and any other person performing similar functions. We have previously filed a copy of the Code of Ethics for Senior Financial Officers as Exhibit 14.4 to the Registrant's Form 8-K filed with the Securities and Exchange Commission on June 1, 2016. Our Code of Conduct and Code of Ethics for Senior Financial Officers are also available on our website at www.erieinsurance.com.
Executive Officers of the Registrant
| | | | | | | | | | | | | | |
| Name | | Age as of 12/31/20212023 | | Principal Occupation and Positions for Past Five Years |
| | | | |
| President & Chief Executive Officer: | | | | |
| Timothy G. NeCastro | | 6163 | | President and Chief Executive Officer of the Company since January 2017; Chief Executive Officer, August 2016 through December 2016; President and Chief Executive Officer Designate, June 2016 through July 2016; Senior Vice President, West Region, February 2010 through June 2016; Director, Erie Family Life Insurance Company ("EFL"), Erie Insurance Company ("EIC"), Flagship City Insurance Company ("Flagship"), Erie Insurance Company of New York ("ENY") and Erie Insurance Property & Casualty Company ("EPC"). |
| Executive Vice Presidents: | | | | |
| Brian W. Bolash | | 58 | | Executive Vice President, Secretary and General Counsel since January 2022; Senior Vice President, Secretary and General Counsel, October 2018 through December 2021; Senior Counsel and Corporate Secretary, January 2016 through September 2018; Director, EFL, EIC, Flagship, ENY and EPC. |
| | | | |
| Sean D. Dugan | | 55 | | Executive Vice President, Human Resources and Corporate Services since January 2023; Senior Vice President, Human Resources, March 2020 through December 2022; Corporate Human Resources Officer, October 2018 through March 2020; Director, EFL, EIC, Flagship, ENY and EPC. |
| | | | |
| Lorianne Feltz | | 5254 | | Executive Vice President, Claims & Customer Service since November 2016; Senior Vice President, Customer Service, January 2011 through October 2016. |
| | | | |
Gregory J. GuttingJulie M. Pelkowski | | 5854 | | Executive Vice President and Chief Financial Officer since August 2016; Interim ExecutiveMay 2023; Senior Vice President, and Chief Financial Officer, October 2015Enterprise Office, March 2022 through July 2016;April 2023; Senior Vice President and Controller, March 2009August 2016 through September 2015;February 2022; Director, EFL, EIC, Flagship, ENY and EPC. |
| | | | |
| Douglas E. Smith | | 49 | | | Executive Vice President, Sales & Products since November 2016. |
| | | | |
Robert C. Ingram, III *Parthasarathy Srinivasa | | 6352 | | Executive Vice President and Chief Information Officer since August 2012; Director, EFL, EIC, Flagship, ENY and EPC. |
| | | | |
Douglas E. Smith | | 47 | | Executive Vice President, Sales & Products since November 2016;joining the Company in April 2022. Prior to joining the Company: Senior Vice President Personal Lines, November 2008and Chief Data and Insurance Information Officer Verisk Analytics, 2019 through October 2016.April 2022; Chief Information and Operations Officer Safe Auto Insurance (now Allstate Corporation), 2016 through 2019. |
| | | | |
| | | | |
* Retired effective December 31, 2021
ITEM 11. EXECUTIVE COMPENSATION
The information required by this item with respect to executive compensation is incorporated by reference to the information statement on Schedule 14C to be filed with the Securities and Exchange Commission no later than 120 days after December 31, 2021.2023.
ITEM 12. SECURITY OWNERSHIP OF CERTAIN BENEFICIAL OWNERS AND MANAGEMENT AND RELATED STOCKHOLDER MATTERS
The information with respect to security ownership of certain beneficial owners and management and securities authorized for issuance under equity compensation plans, is incorporated by reference to the information statement on Schedule 14C to be filed with the Securities and Exchange Commission no later than 120 days after December 31, 2021.2023.
ITEM 13. CERTAIN RELATIONSHIPS AND RELATED TRANSACTIONS, AND DIRECTOR INDEPENDENCE
Information with respect to certain relationships with our outside directors is incorporated by reference to the information statement on Schedule 14C to be filed with the Securities and Exchange Commission no later than 120 days after December 31, 2021.2023.
ITEM 14. PRINCIPAL ACCOUNTANT FEES AND SERVICES
The information required by this item is incorporated by reference to the information statement on Schedule 14C to be filed with the Securities and Exchange Commission no later than 120 days after December 31, 2021.2023.
PART IV
ITEM 15. EXHIBITS AND FINANCIAL STATEMENT SCHEDULES
(a) The following documents are filed as part of this report:
1. Financial Statements
Included in Part II, Item 8. "Financial Statements and Supplementary Data" contained in this report.
Erie Indemnity Company:
•Report of Independent Registered Public Accounting Firm on the Effectiveness of Internal Control over Financial Reporting
•Report of Independent Registered Public Accounting Firm on the Financial Statements
•Statements of Operations for the three years ended December 31, 2021, 20202023, 2022 and 20192021
•Statements of Comprehensive Income for the three years ended December 31, 2021, 20202023, 2022 and 20192021
•Statements of Financial Position as of December 31, 20212023 and 20202022
•Statements of Shareholders' Equity for the three years ended December 31, 2021, 20202023, 2022 and 20192021
•Statements of Cash Flows for the three years ended December 31, 2021, 20202023, 2022 and 20192021
•Notes to Financial Statements
2. Financial Statement Schedules
All schedules are not required, not applicable, or the information is included in the financial statements or notes thereto.
ITEM 16. FORM 10-K SUMMARY
None.
EXHIBIT INDEX
(Pursuant to Item 601 of Regulation S-K)
| | | | | | | | |
| Exhibit | | |
| Number | | Description of Exhibit |
| | | |
3.83.1 | | |
| | |
3.103.2 | | |
| | |
| 4.1 | | |
| | |
10.1210.1 | | |
| | |
10.104 | | |
| | |
10.145 | | |
| | |
10.153 | | |
| | |
10.154 | | |
| | |
| 10.2 | | |
| | |
10.15610.3 | | |
| | |
10.15710.4* | | |
| | |
10.158 | | |
| | |
10.159 | | |
| | |
10.162 | | |
| | |
10.163 | | |
| | |
10.166 | | |
| | |
10.169 | | |
| | |
| | | | | | | | |
Exhibit | | |
Number | | Description of Exhibit |
| | |
10.170 | | |
| | |
10.171 | | |
| | |
10.173 | | |
| | |
10.174 | | |
| | |
10.175 | | |
| | |
10.177 | | |
| | |
10.178 | | |
| | |
10.183 | | |
| | |
10.185 | | |
| | |
10.186 | | |
| | |
10.187 | | |
| | |
10.188 | | |
| | |
10.190 | | |
| | |
10.193 | | |
| | |
10.194 | | |
| | |
10.195 | | |
| | |
10.196 | | |
| | |
| | | | | | | | |
Exhibit | | |
Number | | Description of Exhibit |
| | |
10.197 | | |
| | |
10.198 | | |
| | |
10.199 | | |
| | |
10.200 | | |
| | |
10.201 | | |
| | |
10.202 | | |
| | |
10.203 | | |
| | |
10.204 | | |
| | |
10.20510.5* | | |
| | |
10.20610.6* | | |
| | |
10.207 | | |
| | |
10.208 | | |
| | |
10.209 | | |
| | |
10.210 | | |
| | |
10.211 | | |
| | |
10.212 | | |
| | |
10.213 | | |
| | |
| | | | | | | | |
Exhibit | | |
Number | | Description of Exhibit |
10.214 | | |
| | |
10.215 | | |
| | |
10.216*10.7 | | |
| | |
10.217* | | |
| | |
10.218* | | |
| | |
10.219* | | |
| | |
10.220* | | |
| | |
10.221* | | |
| | |
10.222* | | |
| | |
10.223* | | |
| | |
10.224* | | |
| | |
| 10.8* | | |
| | |
10.225*10.9* | | |
| | |
| 10.10* | | |
| | |
| 10.11* | | |
| | |
| 10.12* | | |
| | |
| 10.13* | | |
| | | | | | | | |
| Exhibit | | |
| Number | | Description of Exhibit |
| | |
| 10.14* | | |
| | |
| 10.15* | | |
| | |
| 10.16* | | |
| | |
| 10.17* | | |
| | |
| 10.18* | | |
| | |
| 10.19* | | |
| | |
| 10.20* | | |
| | |
| 10.21+* | | |
| | |
| 10.22* | | |
| | |
| 10.23* | | |
| | |
| 10.24 | | |
| | |
| 10.25 | | |
| | |
| 10.26 | | |
| | |
| 10.27 | | |
| | |
| 10.28 | | |
| | |
| 10.29 | | |
| | |
10.226*10.30 | | |
| | |
| | |
| | | | | | | | |
| Exhibit | | |
| Number | | Description of Exhibit |
| | |
| 10.31 | | |
| | |
| 10.32 | | |
| | |
| 10.33 | | |
| | |
| 10.34 | | |
| | |
14.314.1 | | |
| | |
14.414.2 | | |
| | |
| 19.1+ | | |
| | |
23*23+ | | |
| | |
31.1*31.1+ | | |
| | |
31.2*31.2+ | | |
| | |
32*32++ | | |
| | |
| 97.1+ | | |
| | |
101.INS*101.INS+ | | Inline XBRL Instance Document - the instance document does not appear in the Interactive Data File
|
| | |
101.SCH*101.SCH+ | | Inline XBRL Taxonomy Extension Schema Document. |
| | |
101.CAL*101.CAL+ | | Inline XBRL Taxonomy Extension Calculation Linkbase Document. |
| | |
| | | | | | | | |
Exhibit101.DEF+ | | |
Number | | Description of Exhibit |
101.DEF* | | Inline XBRL Taxonomy Extension Definition Linkbase Document. |
| | |
101.LAB*101.LAB+ | | Inline XBRL Taxonomy Extension Label Linkbase Document. |
| | |
101.PRE*101.PRE+ | | Inline XBRL Taxonomy Extension Presentation Linkbase Document. |
| | |
104*104+ | | Cover Page Interactive Data File (formatted as Inline XBRL and contained in Exhibit 101). |
| | |
* Indicates management compensatory plan, contract, or arrangement.
+ Filed herewith.
++ Furnished herewith.
|
* Filed herewith.
SIGNATURES
Pursuant to the requirements of Section 13 or 15(d) of the Securities Exchange Act of 1934, the Registrant has duly caused this report to be signed on its behalf by the undersigned, thereunto duly authorized.
| | | | | | | | |
February 24, 202226, 2024 | ERIE INDEMNITY COMPANY | |
| | (Registrant) | |
| | | |
| By: | /s/ Timothy G. NeCastro | |
| | Timothy G. NeCastro, President and CEO | |
| | (Principal Executive Officer) | |
Pursuant to the requirements of the Securities Exchange Act of 1934, this report has been signed below by the following persons on behalf of the Registrant and in the capacities and on the date indicated.
| | | | | | | | | | | | | | |
February 24, 202226, 2024 | /s/ Timothy G. NeCastro | |
| | Timothy G. NeCastro, President and CEO | |
| | (Principal Executive Officer) | |
| | | | | |
| | | /s/ Gregory J. GuttingJulie M. Pelkowski | | |
| | Gregory J. Gutting,Julie M. Pelkowski, Executive Vice President and CFO | |
| | (Principal Financial Officer) | |
| | | |
| | /s/ Julie M. PelkowskiJorie L. Novacek | |
| | Julie M. Pelkowski,Jorie L. Novacek, Senior Vice President and Controller | |
| | (Principal Accounting Officer) | |
Board of Directors:
| | | | | | | | |
| /s/ J. Ralph Borneman, Jr. | | /s/ C. Scott Hartz |
| J. Ralph Borneman, Jr. | | C. Scott Hartz |
| | | |
| /s/ Eugene C. Connell | | /s/ Brian A. Hudson, Sr. |
| Eugene C. Connell | | Brian A. Hudson, Sr. |
| | |
| /s/ Salvatore Correnti | | /s/ George R. Lucore |
| Salvatore Correnti | | George R. Lucore |
| | |
| /s/ LuAnn Datesh | | /s/ Thomas W. Palmer |
| LuAnn Datesh | | Thomas W. Palmer |
| | | |
| /s/ Jonathan Hirt Hagen | | |
| Jonathan Hirt Hagen | | Elizabeth Hirt Vorsheck |
| | | |
| /s/ Thomas B. Hagen | | |
| Thomas B. Hagen, Chairman | | |
| | | |
| | |
| | |