UNITED STATES
SECURITIES AND EXCHANGE COMMISSION
Washington, D.C. 20549
FORM 10-K
x☒ ANNUAL REPORT PURSUANT TO SECTION 13 OR 15(d) OF THE SECURITIES EXCHANGE ACT OF 1934
For the fiscal year ended December 31, 20172019
o☐ TRANSITION REPORT PURSUANT TO SECTION 13 OR 15(d) OF THE SECURITIES EXCHANGE ACT OF 1934
For the transition period from __________ to __________
Commission File Number: 0-24796
CENTRAL EUROPEAN MEDIA ENTERPRISES LTD.
(Exact name of registrant as specified in its charter)
|
| | | | |
BERMUDABermuda | | | 98-0438382 |
(State or other jurisdiction of incorporation or organizationorganization) | | | (I.R.S. Employer Identification No.) |
| | | | | |
| O'Hara House, | | | |
3 Bermudiana Road, Hamilton, Bermuda | | | HM 08 |
| Hamilton, | Bermuda | | | (Zip Code) |
| (Address of principal executive offices) | | (Zip Code) | |
Registrant's telephone number, including area code: (441) 296-1431
|
| | |
Title of each class | | Name of each exchange on which registered |
| Securities registered pursuant to Section 12(b) of the Act: |
| Title of each class | Trading Symbol(s) | Name of each exchange on which registered |
| CLASS A COMMON STOCK, $0.08 PAR VALUE | CETV | NASDAQ Global Select Market Prague Stock Exchange |
| | | |
Securities registered pursuant to Section 12(g) of the Act: |
UNIT WARRANTS TO PURCHASE SHARES OF CLASS A COMMON STOCK | | None. |
Indicate by check mark if the registrant is a well knownwell-known seasoned issuer, as defined in Rule 405 of the Securities Act. Yes ☐ No ☒
Indicate by check mark if the registrant is not required to file reports pursuant to Section 13 or Section 15(d) of the Act. Yes ☐No ☒
Indicate by check mark whether registrant: (1) has filed all reports required to be filed by Section 13 or 15 (d) of the Securities Exchange Act of 1934 during the preceding 12 months (or for each shorter period that the registrant was required to file such reports), and (2) has been subject to such filing requirements for the past 90 days. Yes ☒ No ☐
Indicate by check mark whether the registrant has submitted electronically and posted on its corporate Web site, if any, every Interactive Data File required to be submitted and posted pursuant to Rule 405 of Regulation S-T (§232.405) during the preceding 12 months (or for such shorter period that the registrant was required to submit and post such files). Yes ☒ No ☐
Indicate by check mark if disclosure of delinquent filers pursuant to Item 405 of Regulation S-K (§229.405)is not contained herein, and will not be contained, to the best of the registrants knowledge, in definitive proxy or information statements incorporated by reference in Part III of this Form 10-K or any amendment to this Form 10-K. ☒
Indicate by check mark whether the registrant is a large accelerated filer, an accelerated filer, a non-accelerated filer or a smaller reporting company. See definition of “accelerated filer”, “large accelerated filer” or “smaller reporting company” in Rule 12b-2 of the Exchange Act.
|
| | | | | |
Large accelerated filer ☐ Filer | ☐ | | | Accelerated filer ☒Filer | ☒ |
Non-accelerated filer ☐Filer | ☐ | | | Smaller reporting company☐ | ☐ |
| | | | Emerging growth company | ☐ |
If an emerging growth company, indicate by check mark if the registrant has elected not to use the extended transition period for complying with any new or revised financial accounting standards provided pursuant to Section 13(a) of the Exchange Act. ☐
Indicate by check mark whether the registrant is a shell company (as defined by Rule 12b-2 of the Exchange Act) Yes £☐ No T☒
The aggregate market value of the voting stock held by non-affiliates of the registrant as of June 30, 20172019 (based on the closing price of US$ 4.004.36 of the registrant's Class A Common Stock, as reported by the NASDAQ Global Select Market on June 30, 2017)2019) was US$ 250.0383.6 million.
Number of shares of Class A Common Stock outstanding as of February 5, 2018: 145,498,4884, 2020: 253,607,026
DOCUMENTS INCORPORATED BY REFERENCE
|
| | |
| Document | | Location in 10-K in Which Document is Incorporated |
Registrant's Proxy Statement for the 20182020 Annual General Meeting of Shareholders | | Part III |
CENTRAL EUROPEAN MEDIA ENTERPRISES LTD.
FORM 10-K
For the year ended December 31, 20172019
|
| | | |
| TABLE OF CONTENTS | Page |
| | |
| PART I | |
| | | | |
| | | | |
| | | | |
| | | | |
| | | | |
| | | | |
| | | | |
| PART II | |
| | | | |
| | | |
| | | | |
| | | |
| | | | |
| | | | |
| | | | |
| | | | |
| | | | |
| | | | |
| PART III | |
| | | | |
| | | | |
| | | | |
| | | | |
| | | | |
| | | | |
| PART IV | |
| | | | |
| | | | |
| |
| | | | |
| | | | |
I. Forward-looking Statements
This report contains forward-looking statements within the meaning of Section 27A of the Securities Act of 1933 and Section 22E of the Securities Exchange Act of 1934 (the "Exchange Act"), including those relating to our capital needs, business strategy, expectations and intentions. Statements that use the terms “believe”, “anticipate”, “trend”, “expect”, “plan”, “estimate”, “forecast”, “should”, “intend” and similar expressions of a future or forward-looking nature identify forward-looking statements for purposes of the U.S. federal securities laws or otherwise. In particular, information appearing under the sections entitled "Business," "Risk Factors" and "Management's Discussion and Analysis of Financial Condition and Results of Operations" includes forward looking-statements. For these statements and all other forward-looking statements, we claim the protection of the safe harbor for forward-looking statements contained in the Private Securities Litigation Reform Act of 1995.
Forward-looking statements are inherently subject to risks and uncertainties, many of which cannot be predicted with accuracy or are otherwise beyond our control and some of which might not even be anticipated. Forward-looking statements reflect our current views with respect to future events and because our business is subject to such risks and uncertainties, actual results, our strategic plan, our financial position, results of operations and cash flows could differ materially from those described in or contemplated by the forward-looking statements contained in this report.
Important factors that contribute to such risks include, but are not limited to, those factors set forth under "Risk Factors” as well as the following: the effect of the proposed Merger on our business; the risks that the closing conditions to the proposed Merger may not be satisfied or that necessary governmental approvals are not obtained or are obtained with conditions; the impact of any failure to complete the proposed Merger on our business; the effect of changes in global and regional economic conditions and the extent, timing and durationincluding as a result of the recovery in our markets;quantitative easing program implemented by the European Central Bank; the economic, political and monetary impacts of Brexit; levels of television advertising spending and the rate of development of the advertising markets in the countries in which we operate; our ability to refinance our existing indebtedness; the extent to which our debt service obligations and covenants may restrict our business; our exposure to additional tax liabilities as well as liabilities resulting from regulatory or legal proceedings initiated against us; our ability to refinance our existing indebtedness; our success in continuing our initiatives to diversify and enhance our revenue streams; our ability to make cost-effective investments in our television businesses, including investments in programming; our ability to develop and acquire necessary programming and attract audiences; our ability to consummate the Divestment Transaction; and changes in the political and regulatory environments where we operate and in the application of relevant laws and regulations. The foregoing review of important factors should not be construed as exhaustive and should be read in conjunction with other cautionary statements that are included in this report. All forward-looking statements speak only as of the date of this report. We undertake no obligation to publicly update or review any forward-looking statements, whether as a result of new information, future developments or otherwise, except as required by law.
Defined Terms
Unless the context otherwise requires, references in this report to the “Company”"Company", “CME”"CME", “we”"we", “us”"us" or “our”"our" refer to Central European Media Enterprises Ltd. (“("CME Ltd.”") or CME Ltd. and its consolidated subsidiaries listed in Exhibit 21.01 hereto. Unless otherwise noted, all statistical and financial information presented in this report has been converted into U.S. dollars using period-end exchange rates or average rates where applicable. All references in this report to “US$”"US$" or “dollars”"dollars" are to U.S. dollars, all references to “BGN”"BGN" are to Bulgarian leva, all references to “CZK”"CZK" are to Czech koruna, all references to “RON”"RON" are to the New Romanian lei and all references to “Euro”"Euro" or “EUR”"EUR" are to the European Union Euro. The exchange rates as at December 31, 20172019 used in this report are US$/BGN 1.63;1.74; US$/CZK 21.29;22.62; US$/RON 3.89;4.26; and US$/EUR 0.83.0.89.
The following defined terms are used in this Annual Report on Form 10-K:
| |
| • | "2019 Euro Loan" refers to our floating rate senior unsecured term credit facility guaranteed by Warner Media (as defined below), dated as of November 14, 2014, as amended on March 9, 2015, February 19, 2016, June 22, 2017 and February 5, 2018 which was repaid in full on July 31, 2018; |
| |
| • | "2021 Euro Loan" refers to our floating rate senior unsecured term credit facility due November 1, 2021, guaranteed by Warner Media, dated as of September 30, 2015, as amended on February 19, 2016, June 22, 2017 and April 25, 2018; |
| |
| • | "2023 Euro Loan" refers to our floating rate senior unsecured term credit facility due April 26, 2023, entered into by CME BV (as defined below), guaranteed by Warner Media and CME Ltd., dated as of February 19, 2016, as amended on June 22, 2017 and April 25, 2018; |
| |
| • | "Euro Loans" refers collectively to the 2019 Euro Loan (when outstanding), 2021 Euro Loan and 2023 Euro Loan; |
| |
| • | "2023 Revolving Credit Facility" refers to our revolving credit facility due April 26, 2023, dated as of May 2, 2014, as amended and restated as of February 19, 2016, and as further amended and restated on April 25, 2018; |
| |
| • | "Guarantee Fees" refers to amounts accrued and payable to Warner Media as consideration for Warner Media's guarantees of the Euro Loans; |
| |
| • | "Reimbursement Agreement" refers to our reimbursement agreement with Warner Media which provides that we will reimburse Warner Media for any amounts paid by them under any guarantee or through any loan purchase right exercised by Warner Media, dated as of November 14, 2014, as amended and restated on February 19, 2016, and as further amended and restated on April 25, 2018; |
| |
| • | "CME BV" refers to CME Media Enterprises B.V., our 100% owned subsidiary; |
| |
| • | "AT&T" refers to AT&T, Inc. |
| |
| • | "TW Investor" refers to Time Warner Media Holdings B.V., a wholly owned subsidiary of Warner Media; |
| |
| • | "Warner Media" refers to Warner Media, LLC. (formerly Time Warner, Inc.), a wholly owned subsidiary of AT&T. |
| |
| • | "Merger" refers to the merger of Merger Sub (as defined below) with and into the Company pursuant to the Merger Agreement (as defined below); |
| |
| • | "Merger Agreement" refers to the agreement and plan of merger dated October 27, 2019 by and among the Company, Parent (as defined below) and Merger Sub (as defined below); |
"2015 Convertible Notes" refers to our 5.0% senior convertible notes due November 2015, redeemed in November 2015;Index"2017 PIK Notes" refers to our 15.0% senior secured notes due 2017, redeemed in April 2016;
"2017 Term Loan" refers to our 15.0% term loan facility due 2017, repaid in April 2016;
"2018 Euro Term Loan" refers to our floating rate senior unsecured term credit facility guaranteed by Time Warner, dated as of November 14, 2014 and amended on March 9, 2015, February 19, 2016, June 22, 2017 and February 5, 2018 which matures on May 1, 2019 (see Part II, Item 8, Note 24, "Subsequent Events" for further information);
"2019 Euro Term Loan" refers to our floating rate senior unsecured term credit facility due 2019 guaranteed by Time Warner, dated as of September 30, 2015 and amended on February 19, 2016 and June 22, 2017;
"2021 Euro Term Loan" refers to our floating rate senior unsecured term credit facility due 2021 entered into by CME BV (as defined below), guaranteed by Time Warner and CME Ltd., dated as of February 19, 2016 and amended on June 22, 2017;
"Euro Term Loans" refers collectively to the 2018 Euro Term Loan, 2019 Euro Term Loan and 2021 Euro Term Loan;
"2021 Revolving Credit Facility" refers to our amended and restated revolving credit facility dated as of February 28, 2014, as amended and restated as of November 14, 2014, further amended and restated on February 19, 2016 and amended on June 22, 2017;
"Divestment Transaction" refers to the framework agreement dated July 9, 2017 with Slovenia Broadband S.à r.l. for the sale of our Croatia and Slovenia operations (see Part II, Item 8, Note 3, "Discontinued Operations and Assets Held for Sale" for further information)
"Guarantee Fees" refers to amounts accrued and payable to Time Warner as consideration for Time Warner's guarantees of the Euro Term Loans;
"Reimbursement Agreement" refers to an agreement with Time Warner which provides that we will reimburse Time Warner for any amounts paid by them under any guarantee or through any loan purchase right exercised by Time Warner, dated as of November 14, 2014, amended and restated on February 19, 2016 and amended on March 2, 2017 and June 22, 2017;
"CME BV" refers to CME Media Enterprises B.V., our 100% owned subsidiary;
"CME NV" refers to Central European Media Enterprises N.V., our 100% owned subsidiary;
"Time Warner" refers to Time Warner Inc.; and
"TW Investor" refers to Time Warner Media Holdings B.V.
| |
| • | "Merger Sub" refers TV Bermuda Ltd., a Bermuda exempted company limited by shares and a wholly-owned subsidiary of Parent (as defined below); |
| |
| • | "Parent" refers TV Bidco B.V., a Netherlands private limited liability company; and |
| |
| • | "PPF" refers PPF Group N.V., a Netherlands public limited liability company. |
PART I
ITEM 1. BUSINESS
Central European Media Enterprises Ltd., a Bermuda company limited by shares, is a media and entertainment company operating in Central and Eastern Europe. Our assets are held through a series of Dutch and Curaçao holding companies.company. We manage our business on a geographical basis, with fourfive operating segments, Bulgaria, the Czech Republic, Romania, and the Slovak Republic and Slovenia, which are also our reportable segments and our main operating countries. We own 94% of our Bulgaria operations and 100% of our companies in our remaining countries.
On July 9, 2017, we entered into a framework agreement with Slovenia Broadband S.à r.l., a wholly owned subsidiary of United Group B.V., relating to the sale of our Croatia and Slovenia operations. Accordingly, these operations are classified as held for sale and they are presented as discontinued operations for all periods in this report; and the discussion below relates to our continuing operations in the four remaining operating segments. See Part II, Item 8, Note 3, "Discontinued Operations and Assets Held for Sale" for further information.
Our main operating countries are members of the European Union (the “EU”"EU"). However, as emerging economies, they have adopted Western-style democratic forms of government and have economic structures, political and legal systems, systems ofand corporate governance and business practices that continue to evolve. As the economies of our operating countries converge with more developed nations and their economic and commercial infrastructures continue to develop,mature, we believe the business risks of operating in these countries will continue to decline.
Merger
On October 27, 2019, the Company entered into the Merger Agreement with Parent and Merger Sub. Parent and Merger Sub are affiliates of PPF. Pursuant to the Merger Agreement, Merger Sub will merge with and into the Company, with the Company continuing as the surviving company in the Merger as a wholly-owned subsidiary of Parent.
The closing of the proposed Merger is subject to several conditions, including, but not limited to, the requisite vote of the Company’s shareholders in favor of the Merger Agreement and the proposed Merger, the receipt of certain competition and other regulatory approvals, compliance with covenants and agreements in the Merger Agreement (subject to certain materiality qualifications), and the absence of any governmental order prohibiting completion of the proposed Merger. A special general meeting of shareholders of the Company will be held on February 27, 2020, where shareholders will be asked to vote on a proposal to approve the Merger Agreement, the related statutory merger agreement and the Merger contemplated under such agreements.
Under the Merger Agreement, at the effective time of the Merger (the “Effective Time”), without any action required by the Company, Parent, Merger Sub or any shareholder of the Company or any other person, each Class A Share issued and outstanding immediately prior to the Effective Time will be canceled and cease to exist automatically and each such Class A Share (other than shares owned by the Company, Parent, Merger Sub or any of their respective direct or indirect wholly-owned subsidiaries, in each case not held on behalf of third parties) will be converted into the right to receive $4.58 in cash.
Under the Merger Agreement, at the Effective Time, without any action required by the Company, Parent, Merger Sub or any shareholder of the Company or any other person, the Series A Preferred Share issued and outstanding immediately prior to the Effective Time will be canceled and cease to exist automatically and will be converted into the right to receive the $32,900,000 in cash, without interest, and each Series B Preferred Share issued and outstanding immediately prior to the Effective Time will be canceled and cease to exist automatically and will be converted into the right to receive the $1,630.875 in cash, without interest; provided that, among other things, any conversion of the Series A Preferred Share or any Series B Preferred Shares into Class A Shares on or after October 27, 2019 will be deemed to be null and void.
For further details on the proposed Merger, refer to Part II, Item 7, “Management’s Discussion and Analysis of Financial Condition and Results of Operations”.
Operating Strategy
We operate market leading television networks in each of these fourfive countries, broadcasting a total of 2630 television channels to more than 40approximately 45 million people living in the region. Each segment also develops and produces content for their television channels.channels and digital properties. We generate advertising revenues in our country operations primarily through entering intofrom agreements with advertisers, advertising agencies and sponsors to place advertising on the television channels and websites that we operate. We generate additional revenues by collecting fees from cable, direct-to-home (“DTH”("DTH") and internet protocol television ("IPTV") operators for carriage of our channels.
Our strategy is to maintain or increase our audience leadership in each of our operating countries and to pursue sales strategies designed to maximize our revenues in order to provide additional financial resources to invest in popular local content. We have built our audience leadership in each of our markets by operating a multi-channel business model with a diversified portfolio of television channels which appeal to a broad audience.
Content that consistently generates high audience shares is crucial to maintaining the success of each of our country operations. While content acquired from the Hollywood studios remains popular, our audiences increasingly demand content that is produced in their local language and reflects their society, attitudes and culture. We believe developing and producing local content is key to being successful in prime time and supporting market-leading television channels, particularly in prime time, and that maintaining a regular stream of popular local content at the lowest possible cost is operationally importanta key strength over the long term.
As the distribution platforms in our region develop and become more diversified, our television channels and digital content will increasingly reach viewers through new distribution offerings such as internet TV and smarton mobile devices. We offer viewers the choice of watching premiumour television content through a seriesvariety of portals,platforms, including through Voyo, our subscription video-on-demand service, and advertising supported catch-up services on our websites. Additionally, we operate a portfolio of digital media products that complement our news programming and other television station-related brands.
Sales
We generate advertising revenues primarily through entering into agreements with advertisers, advertising agencies and sponsors to place advertising on our television channels.
Our main unit of inventory is the commercial gross rating point (“GRP”("GRP"), a measure of the number of people watching television when an advertisement is aired. We generally contract with a client to provide an agreed number of GRPs for an agreed price (“cost per point” or ��CPP”"CPP"). The CPP varies depending on the season and time of day during which the advertisement is aired, the volume of GRPs purchased, requests for special positioning of the advertisement, the demographic group that the advertisement is targeting and other factors. Much less frequently, and usually only for small niche channels, we may sell on a fixed spot basis where an advertisement is placed at an agreed time for a negotiated price that is independent of the number of viewers. The CPP varies depending on the season and time of day the advertisement is aired, the volume of GRPs purchased, requests for special positioning of the advertisement, the demographic group that the advertisement is targeting and other factors. Our larger advertising customers generally commit to specified amounts of advertising on an annual basis, which sets the pricing for a minimum volume of GRPs.
We operate our television networks based on a business model of audience leadership, brand strength and popular local content. Our sales strategy is to maximize the monetization of our advertising time by leveraging our high brand power and applying an optimal mix of pricing and sell-out rate. The effectiveness of our sales strategy is measured by our share of the television advertising market, which represents the proportion of our television advertising revenues compared to the total television advertising market.
We also generate additionala growing proportion of revenues by collecting carriage fees from cable, satellite and IPTV operators for broadcasting our television channels. This fee revenue is generally based on the number of subscribers to offerings from these operators that include our channels.
Programming
Our programming strategy in each country is tailored to match the expectations of key audience demographics by scheduling and marketing an optimal mix of programs in a cost effective manner. The programming that we provide drives our audience shares and ratings (see "Audience Share, Ratings and Ratings"Competition" below) and consists of locally-produced news, current affairs, fiction, and reality and entertainment shows as well as acquired foreign movies, series and sports programming.
We focus our programming investments on securing leading audience share positions during prime time, where the majority of advertising revenues are delivered,derived, and improving our cost efficiency through optimizing the programming mix and limiting the cost of programming scheduled off-prime time while maintaining all day audience shares.
Audience Share, Ratings and RatingsCompetition
Audience share represents the viewers watching a channel inas a proportion toof the total audience watching television at thethat time. Ratings represent the number of people watching a channel in proportion to the total population. Audience share and ratings information are measured in each market by independent agencies using peoplemeters, which measure audiences for different demographics and subgeographies of the population throughout the day. Our channels schedule programming intended to attract audiences within specific target demographics that we believe will be attractive to advertisers.advertisers and television distributors. The tables below provide a comparison of all day and prime time audience shares for 20172019 in the target demographic of each of our leading channels to the primary channels of our main competitors.
Bulgaria
We operate one general entertainment channel, BTV, and five other channels, BTV CINEMA, BTV COMEDY, BTV ACTION, BTV LADY and RING.
| | | Target Demographic | | Channel | | Ownership | | All day audience share | | Prime time audience share | | Channel | | Ownership | | All day audience share | | Prime time audience share |
| | | 2017 | | 2016 | | 2017 | | 2016 | | 2019 | | 2018 | | 2019 | | 2018 |
| 18-49 | | BTV | | CME | | 31.8% | | 30.5% | | 34.8% | | 33.6% | | BTV | | CME | | 27.3% | | 29.7% | | 31.6% | | 32.4% |
| | | NOVA TV | | MTG | | 16.7% | | 19.2% | | 18.5% | | 21.1% | | NOVA TV | | Advance Media Group | | 20.8% | | 17.7% | | 22.7% | | 19.3% |
| | | BNT 1 | | Public television | | 6.0% | | 7.0% | | 7.4% | | 8.9% | | BNT 1 | | Public television | | 5.7% | | 6.6% | | 7.1% | | 8.9% |
| | | |
Source: GARB
The combined all day and prime time audience shares of our Bulgaria operations in 20172019 were 41.9%38.0% and 45.3%41.9%, respectively.
Czech Republic
We operate one general entertainment channel, TV NOVA, and seven other channels, NOVA 2, NOVA CINEMA, NOVA SPORT 1, NOVA SPORT 2, NOVA ACTION, NOVA GOLD and NOVA INTERNATIONAL, a general entertainment channel broadcasting in the Slovak Republic.
| | | Target Demographic | | Channel | | Ownership | | All day audience share | | Prime time audience share | | Channel | | Ownership | | All day audience share | | Prime time audience share |
| | | 2017 | | 2016 | | 2017 | | 2016 | | 2019 | | 2018 | | 2019 | | 2018 |
| 15-54 | | TV NOVA | | CME | | 23.7% | | 23.7% | | 27.9% | | 28.2% | | TV NOVA | | CME | | 23.0% | | 22.4% | | 27.0% | | 25.8% |
| | | Prima | | MTG / GME | | 10.7% | | 10.8% | | 13.5% | | 13.2% | | Prima | | GME | | 11.1% | | 10.8% | | 13.3% | | 13.1% |
| | | CT 1 | | Public television | | 12.2% | | 12.3% | | 14.1% | | 14.7% | | CT 1 | | Public television | | 13.3% | | 12.8% | | 15.8% | | 15.5% |
| | | |
Source: ATO - Nielsen Admosphere; Mediaresearch
The combined all day and prime time audience shares of our Czech Republic operations in 2017,2019, excluding NOVA SPORT 1, NOVA SPORT 2 and NOVA INTERNATIONAL, were 36.9%34.8% and 39.3%36.9%, respectively.
Romania
We operate one general entertainment channel, PRO TV, and sevensix other channels, PRO 2, (formerly ACASA), PRO X, (formerly SPORT.RO), PRO GOLD, (formerly ACASA GOLD), PRO CINEMA, PRO TV INTERNATIONAL, MTV ROMANIA, as well as PRO TV CHISINAU, a general entertainment channel broadcasting in Moldova.
| | | Target Demographic | | Channel | | Ownership | | All day audience share | | Prime time audience share | | Channel | | Ownership | | All day audience share | | Prime time audience share |
| | | 2017 | | 2016 | | 2017 | | 2016 | | 2019 | | 2018 | | 2019 | | 2018 |
| 18-49 Urban | | PRO TV | | CME | | 23.3% | | 20.6% | | 27.0% | | 25.0% | | PRO TV | | CME | | 22.5% | | 22.5% | | 25.5% | | 24.7% |
| | | Antena 1 | | Intact group | | 14.9% | | 15.7% | | 15.9% | | 15.9% | | Antena 1 | | Intact group | | 14.6% | | 14.5% | | 15.9% | | 15.6% |
| | | TVR 1 | | Public television | | 1.4% | | 1.3% | | 1.5% | | 1.5% | | TVR 1 | | Public television | | 1.3% | | 2.2% | | 1.3% | | 2.7% |
| | | |
Source: Kantar Media
The combined all day and prime time audience shares of our Romania operations in 2017,2019, excluding PRO TV INTERNATIONAL and PRO TV CHISINAU, were 26.3% and ACASA IN MOLDOVA (which ceased broadcasting in October 2017) were 27.4% and 30.3%29.5%, respectively.
Slovak Republic
We operate one general entertainment channel, TV MARKIZA, and three other channels, DOMA, DAJTO and MARKIZA INTERNATIONAL, a general entertainment channel broadcasting in the Czech Republic.
| | | Target Demographic | | Channel | | Ownership | | All day audience share | | Prime time audience share | | Channel | | Ownership | | All day audience share | | Prime time audience share |
| | | 2017 | | 2016 | | 2017 | | 2016 | | 2019 | | 2018 | | 2019 | | 2018 |
| 12-54 | | TV MARKIZA | | CME | | 19.5% | | 22.2% | | 20.3% | | 23.3% | | TV MARKIZA | | CME | | 21.2% | | 21.3% | | 22.3% | | 21.8% |
| | | TV JOJ | | J&T Media Enterprises | | 16.5% | | 15.4% | | 20.2% | | 18.8% | | TV JOJ | | J&T Media Enterprises | | 14.5% | | 13.9% | | 18.3% | | 17.7% |
| | | Jednotka | | Public Television | | 8.6% | | 8.0% | | 10.8% | | 9.7% | | Jednotka | | Public Television | | 8.2% | | 8.4% | | 10.1% | | 10.2% |
| | | |
Source: PMT/ TNS SK
The combined all day and prime time audience shares of our Slovak Republic operations in 2017,2019, excluding MARKIZA INTERNATIONAL, were 27.0%28.4% and 28.3%29.7%, respectively.
Slovenia
We operate two general entertainment channels, POP TV and KANAL A, and three other channels, KINO, BRIO and OTO.
|
| | | | | | | | | | | | |
| Target Demographic | | Channel | | Ownership | | All day audience share | | Prime time audience share |
| | | | | | | 2019 | | 2018 | | 2019 | | 2018 |
| 18-54 | | POP TV | | CME | | 20.6% | | 21.0% | | 31.6% | | 32.8% |
| | | Planet TV | | TSmedia | | 5.2% | | 5.4% | | 6.3% | | 6.8% |
| | | SLO 1 | | Public Television | | 9.2% | | 9.1% | | 10.1% | | 9.9% |
| | | | | | | | | | | | | |
Source: AGB Nielsen Media Research
The combined all day and prime time audience shares of our Slovenia operations in 2019 were 39.0% and 49.9%, respectively.
Seasonality
We experience seasonality, with advertising sales tending to be highest during the fourth quarter of each calendar year due to the holiday season, and lowest during the third quarter of each calendar year due to the summer vacation period (typically July and August). Our non-advertising sales are not affected by seasonality.
Regulation of Television Broadcasting
Television broadcasting in each of the countries in which we operate is regulated by a governmental authority or agency. In this report, we refer to such agencies individually as a “Media Council”"Media Council" and collectively as “Media Councils”"Media Councils". Media Councils generally supervise broadcasters and their compliance with national broadcasting legislation, as well as control access to the available frequencies through licensing regimes.
Programming and Advertising Regulation
Our main operating countries are member states of the EU, and as such, our broadcast operations in such countries are subject to relevant EU legislation relating to media.
The EU Audiovisual Media Services Directive (the “AVMS Directive”"AVMS Directive"), which came into force in March 2010, and provides the legal framework for audiovisual media services generally in the EU. On November 6, 2018, the European Council adopted amendments to the AVMS Directive, which formally entered into force on December 18, 2018. European Member States, including the territories in which CME operates, have until September 19, 2020, to transpose the amendments to the AVMS Directive into national legislation. The original AVMS Directive remains in force until new legislation incorporating the amendments to the AVMS Directive (described below) are implemented in the countries in which we operate. The AVMS Directive covers both linear (i.e., broadcasting) and non-linear (e.g., video-on-demand and catch-up) transmissions of audiovisual media services, with the latter subject to significantly less stringent regulation. Among other things, the AVMS Directive requires broadcasters to comply with rules related to, but not limited to, program content, advertising content and quotas, product placement, sponsorship, teleshopping, the protection of minors, accessibility by persons with a visual or hearing disability, and minimum quotas with respect to “European works”"European works" (defined as originating from an EU member state or a signatory to the Council of Europe's Convention on Transfrontier Television as well as being written and produced mainly by residents of the EU or Council of Europe member states or pursuant to co-production agreements between such states and other countries). In addition, the AVMS Directive requires that at least 10% of either broadcast time or programming budget is dedicated to programs made by European producers who are independent of broadcasters. News, sports, games, advertising, teletext services and teleshopping are excluded from the calculation of these quotas. In respect of advertising, the AVMS Directive currently provides that the proportion of television advertising spots and teleshopping spots within a givenany hour of broadcasting shall not exceed 20% (what is commonly referred to as the ‘12 minute per hour rule’). The current AVMS Directive does not otherwise restrict when programming may be interrupted by advertising in linear broadcasting, except in the case of films and news programming (where programming may be interrupted once every thirty minutes or more) and children’s programming (where the same restriction applies providing that the program is greater than thirty minutes) and religious programming (where no advertising or teleshopping shall be inserted). Under the current AVMS Directive, there is also a general prohibition on product placement, is prohibited subject to certain exceptions (for example it is permitted in films and series, sports programs and light entertainment programs) and providing that the use of product placement is not ‘unduly’ prominent, is not promotional and is appropriately identified to viewers. Legislation implementing
The amendments to the AVMS Directive has been adopted across our operating countries.
On May 25, 2016, the European Commission adopted a proposal to amend the AVMS Directive. As proposed, the legislation liberalizes manyliberalize some of the AVMS Directive requirements including,and extend some rules that currently apply to broadcasters to video-on-demand services (such as program content, advertising content, and quotas and prominence requirements for example,European works). The amendments also introduce more stringent rules related to the protection of minors as well as bringing video-sharing platforms that target audiences in the EU (such as YouTube, Facebook, Instagram) within its the scope.
In respect of hourly advertising, limits, product placement, teleshopping and sponsorship. The proposal is subject to consultation, review by the European Commission committees and a vote by the European Parliament in order to be adopted. Following adoption, any amendments to the AVMS Directive would then needprovide greater flexibility to linear broadcasters on the timing of advertising so that the share of television commercials and teleshopping spots between 6am and 6pm and between 6pm and midnight may not exceed 20% of the total broadcasting time in each respective time slot (rather than the 20% hourly limit that currently exists). This means that broadcasters are able to allocate up to 144 minutes of advertising in total during the period between 6am and 6pm, and 72 minutes in total between 6pm and midnight, with no specific restrictions on the amount of advertising between midnight and 6am. The amendments to the AVMS Directive permit product placement in all audiovisual media services except in news and current affairs programs, consumer affairs programs, religious programs and children’s programs while maintaining the requirements that the use of product placement is not unduly prominent, is not promotional and is appropriately identified to viewers and imposing restrictions on the type of products which may be implemented by our operating countries.placed (e.g., no cigarettes or alcohol). In addition, the amended AVMS Directive imposes a ban on advertising, sponsorship and product placement of electronic cigarettes in any audiovisual service.
In respect of the protection of minors, the amended AVMS Directive imposes a ban on teleshopping during the broadcast of children’s programs, provides Member States with the option of banning the sponsorship of children’s programs, and limits the uses of personal data of children.
Under the amendments to the AVMS Directive, Member States also have the option of imposing on their audiovisual service providers (including broadcasters and video-on-demand services providers whose operations target their service to an audience within a different Member State) a financial contribution towards the European production of Europeans works). There is also a requirement that broadcasters and other audiovisual service providers ensure that at least 30% of their video-on-demand service catalog is dedicated to European works and that such works are given due prominence.
Please see below for more detailed information on programming and advertising regulations that impact our channels.
Bulgaria: In Bulgaria, privately owned broadcasters are permitted to broadcast advertising for up to 12 minutes per hour. The public broadcaster, BNT, which is financed through a compulsory television license fee and by the government, is restricted to broadcasting advertising for four minutes per hour and no more than 15 minutes per day, of which only five minutes may be in prime time. There are also restrictions on the frequency of advertising breaks (for example, news and children's programs shorter than 30 minutes cannot be interrupted). These restrictions apply to both publicly and privately ownedprivately-owned broadcasters. Further restrictions relate to advertising content, including a ban on tobacco advertising and restrictions on alcohol advertising, regulations on medical products advertising and regulations on advertising targeted at children or during children's programming. In addition, members of the news department of our channels are prohibited from appearing in advertisements. Our channels in Bulgaria are required to comply with several restrictions on programming, including regulations on the origin of programming. These channels must ensure that 50% of a channel's total annual broadcast time consists of EU- or locally-produced programming and 12% of such broadcast time consists of programming produced by independent producers in the EU. News, sports, games and teleshopping programs, as well as advertising and teletext services, are excluded from these restrictions.
Czech Republic: Privately owned broadcasters in the Czech Republic are permitted to broadcast advertising for up to 12 minutes per hour. In September 2011, legislation was implemented in the Czech Republic which restricts the amount of advertising that may be shown on channels of the public broadcaster, CT. Pursuant to the regulation, no advertising may be shown on the public channels CT 1 and CT 24, while the channels CT 2 and CT 4 may show a limited amount of advertising.advertising up to 0.5% of the total daily broadcasting time on each channel, of which only 6 minutes per hour may be in prime time. No advertising may be shown on the other public TV channels, except where broadcasting an advertisement is a necessary condition for the acquisition of rights to broadcast cultural or sport events on such public channels. Where such broadcasting advertisement conditions apply, the same limitations on advertising time applicable to CT 2 and CT 4 shall apply to any advertising on the other public TV channels. Also included in the legislation is the requirement that national private broadcasters must contribute annually to a Czech cinematography fund in an amount equal to 2% of their net advertising revenues. We are entitled to apply for financing from the fund. In the Czech Republic, all broadcasters are restricted with respect to the frequency of advertising breaks during and between programs, as well as being subject to restrictions that relate to advertising content, including a ban on tobacco advertising and limitations on advertisements of alcoholic beverages, pharmaceuticals, firearms and munitions.
Romania: Privately owned broadcasters in Romania are permitted to broadcast advertising and direct sales advertising for up to 12 minutes per hour. There are also restrictions on the frequency of advertising breaks (for example, news and children's programs shorter than 30 minutes cannot be interrupted). Broadcasters are also required that from the total broadcasting time (except for the time allocated to news, sports events, games, advertising and teleshopping) (a) at least 50% must be European-origin audio-visual works and (b) at least 10% (or, alternatively, at least 10% of their programming budget) must be European audio-visual works produced by independent producers. The public broadcaster, TVR, is restricted to broadcasting advertising for eight minutes per hour and only between programs. Further restrictions relate to advertising content, including a ban on tobacco advertising and restrictions on alcohol advertising, and regulations on advertising targeted at children or during children's programming. In addition, news anchors of all channels are prohibited from appearing in advertisements and teleshopping programming. A new Audiovisual Code was enacted in March 2017 providing additional safeguards in connection with the protection of minors and privacy rights.
Slovak Republic: Privately owned broadcasters in the Slovak Republic are permitted to broadcast advertising for up to 12 minutes per hour but not for more than 20% of their total daily broadcast time. Since January 2013,2020, the public broadcaster RTVS, which is financed through a compulsory license fee, can broadcast advertising for up to 0.5% of its total broadcast time on a given calendar day (up to 2.5% of total broadcast time including teleshopping programming), but between 7:00 p.m. and 10:00 p.m. may broadcast only eight minutes of advertising per hour. The restriction regarding total broadcast advertising time does not apply to the broadcasting of advertising in direct connection with the broadcasting of a sporting or cultural event, in which the broadcasting of advertising is a necessary condition for the acquisition of rights to broadcast such event. The broadcasting of advertising in direct connection with the broadcasting of a sporting or cultural event cannot exceed 15% of the daily total broadcast time. There are also restrictions on the frequency of advertising breaks during and between programs. RTVSThe public broadcaster is not permitted to broadcast advertising breaks during programs. There are also restrictions that relate to advertising content, including a ban on tobacco, pharmaceuticals, firearms and munitions advertising and a ban on advertisements of alcoholic beverages (excluding beer and wine) between 6:00 a.m. and 10:00 p.m. Our operations in the Slovak Republic are also required to comply with several restrictions on programming, including regulations on the origin of programming. These include the requirement that 50% of the station's monthly broadcast time must be European-origin audio-visual works and at least 10% of a station's monthly broadcast time must be European audio-visual works produced by independent producers, at least 10% of which must be broadcast within five years of production. National private broadcasters must also contribute annually to an audiovisual fund in the amount equal to 2% of their net advertising revenues and public broadcasters must contribute annually to the audiovisual fund in the amount equal to 5% of its net advertising revenue. Both public and private broadcasters are entitled to apply for financing from the fund.
Slovenia: Privately owned broadcasters in Slovenia are allowed to broadcast advertising for up to 12 minutes in any hour. The public broadcaster, SLO, which is financed through a compulsory television license fee and commercial activities, is allowed to broadcast advertising for up to 10 minutes per hour, but is only permitted up to seven minutes per hour between the hours of 6:00 p.m. and 11:00 p.m. There are also restrictions on the frequency of advertising breaks during programs and restrictions that relate to advertising content, including restrictions on food advertising during children's programming and a ban on tobacco advertising and a prohibition on the advertising of any alcoholic beverages from 7:00 a.m. to 9:30 p.m. and generally for alcoholic beverages with an alcoholic content of more than 15%. Our Slovenian operations are required to comply with several restrictions on programming, including regulations on the origin of programming. These include the requirement that 20% of a station's daily programming consist of locally produced programming, of which at least 60 minutes must be broadcast between 6:00 p.m. and 10:00 p.m. In addition, 50% of our niche channels' annual broadcast time must be European-origin audio-visual works and at least 10% of such stations' annual broadcast time must be European audio-visual works produced by independent producers.
Licensing Regulation
The license granting and renewal process in our operating countries varies by jurisdiction and by type of broadcast permitted by the license (i.e., terrestrial, cable, satellite). Depending on the country, terrestrial licenses may be valid for an unlimited time period, may be renewed automatically upon application or may require a more lengthy renewal procedure, such as a tender process. Generally cable and satellite licenses are granted or renewed upon application. We expect all of our licenses will continue to be renewed or new licenses to be granted as required to continue to operate our business. All of the countries in which we operate have transitioned from analog to digital terrestrial broadcasting and we have obtained digital licenses where requested. In January 2017, we ceased terrestrial distribution of our channels in the Slovak Republic and Slovenia, and channels are now available exclusively on cable, satellite and IPTV platforms. We will apply for additional digital licenses where such applications are prudent and permissible. Please see below for more detailed information on licenses for our channels.
Bulgaria: BTV operates pursuant to a national digital terrestrial license issued by the Council for Electronic Media, the Bulgarian Media Council, that expires in July 2024. BTV ACTION broadcasts pursuant to a national cable and satellite registration that is valid for an indefinite time period and also has a digital terrestrial license that expires in January 2025 which is not currently in use. BTV CINEMA, BTV COMEDY, RING and BTV LADY, as well as BTV, each broadcast pursuant to a national cable and satellite registration that is valid for an indefinite time period.
Czech Republic: Our channels in the Czech Republic operate under a variety of licenses granted by the Czech Republic Media Council, The Council for Radio and Television Broadcasting. TV NOVA broadcasts under a national terrestrial license that expires in January 2025. TV NOVA may also broadcast pursuant to a satellite license that expires in December 2020. NOVA CINEMA broadcasts pursuant to a national terrestrial digital license that expires in September 2023. NOVA CINEMA also broadcasts via satellite pursuant to a license that is valid until November 2019.October 2031. NOVA SPORT 1 broadcasts pursuant to a license that allows for both satellite and cable transmission that expires in October 2020. NOVA SPORT 2 broadcasts pursuant to a satellite license that expires in August 2027. In addition, NOVA SPORT 1 and NOVA SPORT 2 each have a license that permits internet transmission which expires in August 2027. NOVA ACTION broadcasts pursuant to a satellite license that expires in July 2024, and a national terrestrial license that expires in September 2023. NOVA 2 broadcasts pursuant to a national terrestrial license that expires in December 2024 and a satellite license that expires in February 2025. NOVA GOLD broadcasts pursuant to a national terrestrial license and a satellite license that each expire in February 2025. In addition, each channel has a license that permits internet transmission that expires in June 2030, other than NOVA SPORT 1 and NOVA SPORT2 which expires in August 2027. NOVA INTERNATIONAL broadcasts pursuant to a license that permits internet transmission which expires in January 2028.
Romania: PRO TV broadcasts pursuant to a national satellite license granted by the Romanian Media Council, the National Audio-Visual Council, that expires in May 2023. PRO 2 broadcasts pursuant to a national satellite license that expires in January 2025. PRO GOLD broadcasts pursuant to a national satellite license that expires in April 2021. PRO CINEMA broadcasts pursuant to a national satellite license that expires in April 2022. PRO X broadcasts pursuant to a national satellite license that expires in July 2021. MTV ROMANIA broadcasts pursuant to a national satellite license that expires in April 2018 and PRO TV INTERNATIONAL broadcasts pursuant to a national satellite license that expires in May 2018.2027. PRO TV also broadcasts through the electronic communications networks pursuant to a series of local licenses and PRO 2 broadcasts in high-definition pursuant to a written consent from the Media Council.national cable license that expires in September 2024. PRO 2 also broadcasts in high-definition pursuant to a national cable license that expires in October 2028. PRO X also broadcasts in high-definition pursuant to a national cable license that expires in October 2028. PRO TV CHISINAU broadcasts pursuant to a cable license granted by the Audio-Visual Coordinating Council of the Republic of Moldova (the "AVCC") that expires in November 2023. In September 2017 we applied to the AVCC to discontinue the ACASA IN MOLDOVA channel from October 2017.
Slovak Republic: TV MARKIZA, DOMA and DAJTO each broadcast pursuant to a national license for digital broadcasting granted by the Council for Broadcasting and Retransmission, the Media Council of the Slovak Republic, which is valid for an indefinite period. MARKIZA INTERNATIONAL is broadcast pursuant to the license granted to TV MARKIZA.
Slovenia: Our Slovenian channels POP TV, KANAL A, KINO, BRIO and OTO each have licenses granted by the Agency for Communication Networks and Services of the Republic of Slovenia and the Ministry of Culture, that allow for broadcasting on any platform, including digital, cable and satellite. These licenses are valid for an indefinite time period.
OTHER INFORMATION
Employees
As of December 31, 20172019, we had a total of approximately 2,2002,550 employees (including contractors).
Corporate Information
CME Ltd. was incorporated in 1994 under the laws of Bermuda. Our registered offices are located at O'Hara House, 3 Bermudiana Road, Hamilton HM 08, Bermuda, and our telephone number is +1-441-296-1431. Communications can also be sent c/o CME Media Services Ltd. at Krizeneckeho nam. 1078/5, 152 00 Praha 5, Czech Republic, telephone number +420-242-465-605. CME's Class A common stock is listed on the NASDAQ Global Select Market and the Prague Stock Exchange under the ticker symbol “CETV”.
Available Information
Our Annual Report on Form 10-K, Quarterly Reports on Form 10-Q and Current Reports on Form 8-K and amendments to those reports filed or furnished pursuant to Sections 13(a) or 15(d) of the Exchange Act are available on our website, free of charge, as soon as reasonably practicable after the reports are electronically filed with or furnished to the SEC. These reports together with press releases, public conference calls, webcasts and posts to the "Investors" section of our website are available at www.cme.net and we encourage investors to use our website. The information contained on our website is not included as a part of, or incorporated by reference into, this Report.
Financial Information by Operating Segment and by Geographical Area
For financial information by operating segment and geographic area, see Part II, Item 8, Note 20, "Segment Data".
ITEM 1A RISK FACTORSRisk Factors
This report and the following discussion of risk factors contain forward-looking statements as discussed on page 1 of this report. Our actual results may differ materially from those anticipated in these forward-looking statements as a result of certain factors, including the risks and uncertainties described below and elsewhere in this report. These risks and uncertainties are not the only ones we may face. Additional risks and uncertainties of which we are not aware, or that we currently deem immaterial, may also become important factors that affect our financial condition, results of operations and cash flows.
Risks Relating to Our Financial Position
Changes in global or regional economic conditions may adversely affect our financial position and results of operations.
The results of our operations depend heavily on advertising revenue, and demand for advertising is affected by general economic conditions in the region and globally. Our markets have experienced overall growth in real GDP (as adjusted for inflation) and advertising spending since 2014;over the last several years; however, we cannot predict if the current growth trends will continue in the future. Analyst estimates for 2020 of real GDP in the countries in which we operate forecast a slower rate of growth overall compared to 2019. Recessions or periods of low or negative growth in the region or globally in the future may cause a deterioration of general economic conditions in one or more of our markets, which would have an adverse economic impact on our advertising revenues. The United States has imposed tariffs on certain products from many of its trading partners, including Europe and China, and has previously threatened to impose additional tariffs on cars and auto part exports from Europe. Such tariffs could have a significant adverse impact on the economies of our countries of operation. Additionally, a slowdown in China resulting from existing tariffs on Chinese products may have an adverse impact on the global economy, which may ultimately reduce demand for European exports and the rate of GDP growth in the countries in which we operate. Other factors that may affect general economic conditions in our markets include defaults by sovereigns or systemically important companies, austerity programs, natural disasters, acts of terrorism, civil or military conflicts or general political instability and responses to it, any of which may also reduce advertising spending. In addition, although we believe the advertising spend per capita of the countries in which we operate and advertising intensity (the ratio of total advertising spend per capita to nominal GDP per capita) will eventually converge with developed markets in Europe, such convergence may not occur in the time frame we expect, or at all. Any of these developments would have a significant negative effect on our financial position, results of operations and cash flows.
Changes to the quantitative easing program implemented by the European Central Bank ("ECB") and the impact on the region of the United Kingdom’s exit from the European Union (“EU”) may adversely affect our financial position and results of operations.
The ECB embarked upon quantitative easing in 2015 to address economic softness and a slowdown in growth of consumer prices in the Eurozone. The ECB also created funding and stability mechanisms to provide liquidity and financial assistance to Eurozone member states and financial institutions. Economic growth in recent years in the Eurozone including strong growth in 2017, has been helped by the ECB’s quantitative easing program. Citingprogram which was recalibrated in January 2018. Although the ECB, citing improved economic conditions, ended its original quantitative easing program at the ECB has announced that from Januaryend of December 2018, it will be reducingresumed its quantitative easing program from a ratein November 2019. While the duration of EUR 60 billion a month to EUR 30 billion a month for an initial nine-month period. The ECB may decide to take further steps to reduce or exitthe current quantitative easing program is not known, the cessation of quantitative easing in the future. The tapering of quantitative easingfuture may adversely impact future growth in Eurozone countries, including the countries in which we operate, in whichand would negatively impact our business.
Our financial position and results of operations may be adversely affected as a result of the United Kingdom’s decision to end its membership in the European Union.
The United Kingdom is in the process of negotiating its exit from the European Union (generally referred to as “Brexit”). On March 29, 2017,January 31, 2020, the United Kingdom formally initiatedleft the processEuropean Union; however, it will remain in the single market and be subject to leave the EU, commonly referred to as "Brexit", triggeringEU’s rules and regulations during a two-yeartransition period to finalize the terms for its leaving the EU.ending December 31, 2020. It is expected that economic conditions in the EU will be impacted by Brexit. WhileThe impact on our business from a result of Brexit will depend, in part, on the outcome of tariff, trade, regulatory and other negotiations during this transition period and on the ultimate manner and terms of the U.K.’s withdrawal from the EU. Given the ongoing uncertainty over the final terms of Brexit to be negotiated during the transition period, the overall economic impact of Brexit on the EU and the Euro iscontinues to be difficult to estimate at present,as decisions to conserve cash and reduce spending by consumers and businesses in the United Kingdom would have a negative impact on economic growth rates in the United Kingdom and, to a lesser extent, in the EU, in particular those countries that are significant exporters to the United Kingdom. There is also significant uncertainty regarding the terms on which the United Kingdom will leave the EU, and it is expected that a more protracted process to set those terms would have a more prolonged economic impact. In addition, if other countries seek to leave the EU, that would increase uncertainty in the region, which may have a further negative impact on investment and economic growth rates. Furthermore, the departure of the United Kingdom from the EU may further affect the budgetary contributions and allocations among the EU member states in the medium term, including the countries in which we operate, which arehave historically been net recipients of EU funding. Economic uncertainty caused by Brexit or other instability in the EU resulting from Brexit could cause significant volatility in EU markets and reduce economic growth rates in the countries in which we operate, which would negatively impact the demand for advertising and consequently our business.financial position, results of operations and cash flows.
Our operating results will be adversely affected if we cannot generate strong advertising sales.
We generate the majority of our revenues from the sale of advertising airtime on our television channels. While we have implemented pricing strategies to increase sales and television advertising spending, the success of these strategies has varied from market to market and continues to be challenged by pressure from advertisers and discounting by competitors. In addition to advertising pricing, other factors that may affect our advertising sales include general economic conditions (described above), competition from other broadcasters and operators of other distribution platforms, changes in programming strategy, changes in distribution strategy, our ability to secure distribution on cable, satellite or IPTV operators, our channels’ technical reach, technological developments relating to media and broadcasting, seasonal trends in the advertising market, changing audience preferences and in how and when people view content and the accompanying advertising, increased competition for the leisure time of audiences and shifts in population and other demographics. Our advertising revenues also depend on our ability to maintain audience ratings and to generate GRPs. This requires us to have a distribution strategy that reaches a significant audience as well as to maintain investments in programming at a sufficient level to continue to attract audiences. Changes in the distribution of our channels, such as our decision to cease broadcasting on DTTdigital terrestrial television ("DTT") in the Slovak Republic and Slovenia in 2017, may reduce the number of people who can view our channels, which may negatively impact our audience share and GRPs generated. Furthermore, significant or sustained reductions in investments in programming or other operating costs in response to reduced advertising revenues had and, if repeated, may have an adverse impact on our television viewing levels. Reductions in advertising spending in our markets and resistance to price increases as well as competition for ratings from broadcasters seeking to attract similar audiences may have an adverse impact on our ability to maintain our advertising sales. A failure to maintain and increase advertising sales could have a material adverse effect on our financial position, results of operations and cash flows.
Our debt service obligations and covenants may restrict our ability to conduct our operations.
We have significant debt service obligations under the Euro Term Loans as well as the 2021 Revolving Credit Facility (when drawn), including the Guarantee Fees to Time Warner as consideration for its guarantees of the Euro Term Loans (collectively, the "TW Guarantees"). Although a portion of the Guarantee Fees in respect of each of the Euro Term Loans can be non-cash pay at our option, accruing such fees will further increase the amounts to be repaid at the maturity of these facilities. In addition, if the Divestment Transaction does not close, the warrants are not exercised in full or cash flows from operations do not meet our forecasts, we would not be able to reduce our indebtedness as planned and would continue to bear higher average borrowing costs on our senior debt and pay more interest and Guarantee Fees. As a result of our debt service obligations and covenants contained in the related loan agreements, we are restricted under the Reimbursement Agreement and the 2021 Revolving Credit Facility (when drawn) in the manner in which our business is conducted, including but not limited to our ability to obtain additional debt financing to refinance existing indebtedness or to fund future working capital, capital expenditures, business opportunities or other corporate requirements. We may have a proportionally higher level of debt and debt service obligations than our competitors, which may put us at a competitive disadvantage by limiting our flexibility in planning for, or reacting to, changes in our business, economic conditions or our industry. For additional information regarding the Reimbursement Agreement, the 2021 Revolving Credit Facility and the TW Guarantees, see Part II, Item 8, Note 5, "Long-term Debt and Other Financing Arrangements".
We may be unable to repay or refinance our existing indebtedness and may not be able to obtain favorable refinancing terms.
We have a substantial amount of indebtedness. Under the Reimbursement Agreement and the 2021 Revolving Credit Facility (when drawn), we can incur only limited amounts of additional indebtedness, other than indebtedness incurred to refinance existing indebtedness. In addition, pursuant to the Reimbursement Agreement, the all-in rates on each of the Euro Term Loans increase to a maximum of 10.0% (or 3.5% above the then-current all-in rate, if lower), on the date that is 180 days following a change of control of CME Ltd. (as defined therein); and pursuant to the 2021 Revolving Credit Facility, all commitments terminate following a change of control (as defined therein) and the interest rate on amounts outstanding increases to 13% on the date that is 180 days following such change of control. We intend to repay the 2018 Euro Term Loan at or prior to maturity on May 1, 2019 with cash flows from operations and the expected proceeds from the Divestment Transaction or if the Divestment Transaction does not close, the expected proceeds from warrant exercises. In the event the Divestment Transaction doesproposed Merger is not close, the warrants are not exercised in full or cash flows from operations do not meet our forecasts,completed, we would be required to refinance the 2018 Euro Term Loan in whole or in part. Pursuant to the Reimbursement Agreement, all commitments under the 2021 Revolving Credit Facility terminate on the refinancing of any Euro Term Loan. We face the risk that we will not be able to renew, repay or refinance our indebtedness when due, or that the terms of any renewal or refinancing will not be on better terms than those of such indebtedness being refinanced. Furthermore, pursuant to the Reimbursement Agreement, the all-in rates on each of the Euro Loans increase to a maximum of 10.0% (or 3.5% above the then-current all-in rate, if lower), on the date that is 365 days following a change of control of CME Ltd. (as defined therein); and pursuant to the 2023 Revolving Credit Facility, all commitments terminate following a change of control (as defined therein) and the interest rate on amounts outstanding increases to 10% plus LIBOR or 9% plus the alternate base rate on the date that is 365 days following such change of control. In the event we are not able to refinance our indebtedness, we might be forced to dispose of assets on disadvantageous terms or reduce or suspend operations, any of which would materially and adversely affect our financial condition, results of operations and cash flows.
IfOur debt service obligations and covenants may restrict our ability to conduct our operations.
We have debt service obligations under the Divestment Transaction failsEuro Loans as well as the 2023 Revolving Credit Facility (when drawn), including the Guarantee Fees to complete or is terminated,Warner Media as consideration for its guarantees of the Euro Loans (collectively, the "WM Guarantees"). In addition, if our financial performance does not meet our forecasts, we may need to find alternative sources of funds to repay certainbear higher average borrowing costs on our senior debt and pay more interest and Guarantee Fees. As a result of our indebtedness
On July 9, 2017,debt service obligations and covenants contained in the related loan agreements, we entered into a framework agreement (the “Framework Agreement”) with Slovenia Broadband S.à r.l. (the "Purchaser"), a wholly owned subsidiary of United Group B.V., relatingare restricted under the Reimbursement Agreement and the 2023 Revolving Credit Facility (when drawn) in the manner in which our business is conducted, including but not limited to the sale of our Croatia and Slovenia operations for cash consideration of EUR 230.0 million (approximately US$ 275.8 million), subjectability to customaryobtain additional debt financing to refinance existing indebtedness or to fund future working capital, adjustments (the "Divestment Transaction"). The closing ofcapital expenditures, business opportunities or other corporate requirements, which may limit our flexibility in planning for, or reacting to, changes in our business, economic conditions or our industry. For additional information regarding the Divestment Transaction is subject to obtaining regulatory approvals and other customary closing conditions. On November 15, 2017 the Croatian Agency for Electronic Media ("CAEM") published a decision that the acquisition by the Purchaser is not permitted under the Croatian Act on Electronic Media due to certain cross ownership restrictions that CAEM believes to be applicable to the Divestment Transaction. Following the sale by the United Group of certain assets in Croatia to address this cross ownership restriction, the Purchaser has reapplied for approval from CAEM. Under the terms of the FrameworkReimbursement Agreement, the Purchaser has the right to extend the closing date of the transaction until March 31, 2018 (the "Long Stop Date"). There is no guarantee that the CAEM regulatory approval or any other regulatory approvals will be obtained by the Long Stop Date. In the event the required regulatory approvals are not obtained by the Long Stop Date or the parties have not otherwise agreed to extend that date, both we2023 Revolving Credit Facility and the Purchaser have the right to terminate the Framework Agreement on notice to the other party. If the Divestment Transaction does not close or is terminated, we would not be able to repay indebtedness we planned to repay with expected proceeds of the Divestment TransactionWM Guarantees, see Part II, Item 8, Note 4, "Long-term Debt and would need to find alternative sources of funds to repay such indebtedness (see "We may be unable to refinance our existing indebtedness and may not be able to obtain favourable refinancing terms" above)Other Financing Arrangements".
We may be subject to changes in tax rates and exposure to additional tax liabilities.
We are subject to taxes in a number of foreign jurisdictions, including in respect of our operations as well as capital transactions undertaken by us. We are subject to regular review and audit by tax authorities, and in the ordinary course of our business there are transactions and calculations where the ultimate tax determination is unknown. Significant judgment is required in determining our provision for taxes. The final determination of our tax liabilities resulting from tax audits, related proceedings or otherwise could be materially different from our tax provisions. Economic and political pressures to increase receipts in various jurisdictions may make taxation and tax rates subject to significant change and the satisfactory resolution of any tax disputes more difficult. The occurrence of any of these events could have a material adverse effect on our financial position, results of operations and cash flows.
A default by us in connection with our obligations under our outstanding indebtedness could result in our inability to continue to conduct our business.
Pursuant to the Reimbursement Agreement and the 20212023 Revolving Credit Facility, we pledged all of the shares of CME NV and of CME BV, which together ownowns all of our interests in our operating subsidiaries, in favor of Time Warner Media as security for this indebtedness. If we or these subsidiariesCME BV were to default under the terms of any of the relevant agreements, Time Warner Media would have the ability to sell all or a portion of the assets pledged to it in order to pay amounts outstanding under such debt instruments. This could result in our inability to conduct our business.
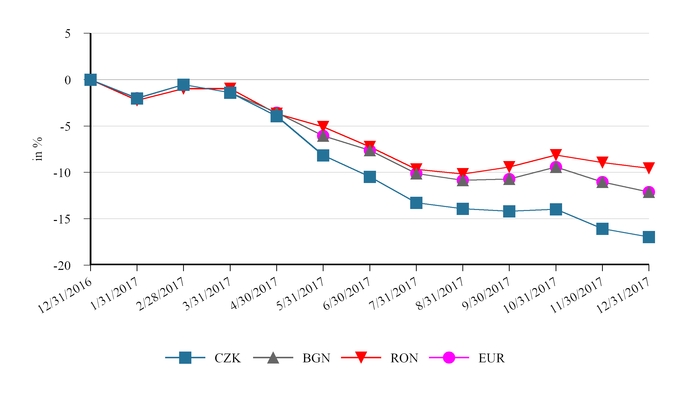
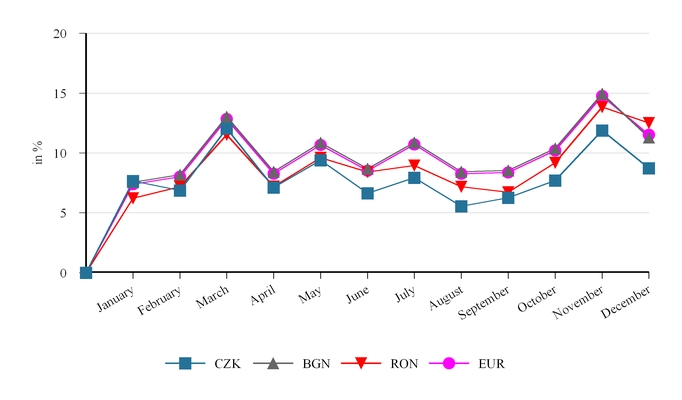
Fluctuations in exchange rates may continue to adversely affect our results of operations.
Our reporting currency is the dollar and CME Ltd.'s functional currency is the Euro. Our consolidated revenues and costs are divided across a range of European currencies. In 2017, the weakening of the dollar had a positive impact on reported revenues when translated from the functional currencies of our operations. Any future strengthening of the dollar will have a negative impact on our reported revenues. Furthermore, fluctuations in exchange rates may negatively impact programming costs. While local programming is generally purchased in local currencies, a significant portion of our content costs relates to foreign programming purchased pursuant to dollar-denominated agreements. If the dollar appreciates against the functional currencies of our operating segments, the cost of acquiring such content would be adversely affected, which could have a material adverse effect on our results of operations and cash flows.
Our strategies to enhance our carriage fees and diversify our revenues may not be successful.
We are focused on creating additional revenue streams from our broadcast operations as well as increasing revenues generated from television advertising, which is how we generate most of our revenues. Our main efforts with respect to this strategy are on increasing carriage fees from cable, satellite and IPTV operators for carriage of our channels as well as continuing to seek improvements in advertising pricing. Agreements with operators generally have a term of one or more years, at which time agreements must be renewed. There can be no assurance that we will be successful in renewing carriage fee agreements on similar or better terms. During negotiations to implement our carriage fees strategy in prior years, some cable and satellite operators suspended the broadcast of our channels, which negatively affected the reach and audience shares of those operations and, as a result, advertising revenues. There is a risk that operators may refuse to carry our channels while carriage fee negotiations are ongoing, which would temporarily reduce the reach of those channels and may result in clients withdrawing advertising from our channels. The occurrence of any of these events may have an adverse impact on our financial position, results of operations and cash flows. If we are ineffective in negotiations with carriers or in achieving further carriage fee increases, our profitability will continue to be dependent primarily on television advertising revenues, which increases the importance placed on our ability to improve advertising pricing and generate advertising revenues. In addition to carriage fees, we are also working to build-out our offerings of advertising video-on-demand products and other opportunities for advertising online. There can be no assurances that our revenue diversification initiatives will ultimately be successful, and if unsuccessful, this may have an adverse impact on our financial position, results of operations and cash flows.
A downgrading of our corporate credit ratings may adversely affect our ability to raise additional financing.
Moody’s Investors Service rates our corporate credit as B2B1 with a positive outlook. Standard & Poor’s rates our corporate credit B+ currently on CreditWatch(on watch with developingnegative implications due to the Divestment Transaction.proposed Merger). Our ratings show each agency's opinion of our financial strength, operating performance and ability to meet our debt obligations as they become due.due, as well as the proposed Merger. These ratings take into account the particular emphasis the ratings agencies place on metrics such as leverage ratio and cash flow, which they use as measurements of a company's liquidity and financial strength. They also reflect an emphasis placed by the ratings agencies on a track record ofthe historically strong financial support from Time Warner.Warner Media. We may be subject to downgrades if our operating performance deteriorates or we fail to maintain adequate levels of liquidity. In addition, our ratings may be downgraded if the agencies form a view that material support from Time Warner is not as strong, or the strategic importance of CME to Time Warner is not as significant as it has been in the past. In the event our corporate credit ratings are lowered by the rating agencies, we may not be able to refinance our existing indebtedness or raise new indebtedness that may be permitted under the Reimbursement Agreement and the 20212023 Revolving Credit Facility (when drawn), and we will have to pay higher interest rates, all of which would have an adverse effect on our financial position, results of operations and cash flows.
If our goodwill, other intangible assets and long-lived assets become impaired, we may be required to record significant charges to earnings.
We review our long-lived assets for impairment when events or changes in circumstances indicate the carrying amount may not be recoverable. Goodwill and indefinite-lived intangible assets are required to be assessed for impairment at least annually. Factors that may be considered a change in circumstances indicating that the carrying amount of our goodwill, indefinite-lived intangible assets or long-lived assets may not be recoverable include slower growth rates in our markets, reduced expected future cash flows, increased country risk premium as a result of political uncertainty and a decline in stock price and market capitalization. We consider available current information when calculating our impairment charge. If there are indicators of impairment, our long-term cash flow forecasts for our operations deteriorate or discount rates increase, we may be required to recognize additional impairment charges in later periods. See Part II, Item 8, Note 4,3, "Goodwill and Intangible Assets" for the carrying amounts of goodwill in each of our reporting units.
Risks Relating to Our Operations
Content may become more expensive to produce or acquire or we may not be able to develop or acquire content that is attractive to our audiences.
Television programming is one of the most significant components of our operating costs. The ability of our programming to generate advertising revenues depends substantially on our ability to develop, produce or acquire programming that matches audience tastes and attracts high audience shares, which is difficult to predict. The commercial success of a program depends on several tangible and intangible factors, including the impact of competing programs, the availability of alternate forms of entertainment and leisure time activities, our ability to anticipate and adapt to changes in consumer tastes and behavior, and general economic conditions. While we have been successful in reducing content costs in prior periods, the cost of acquiring content attractive to our viewers, such as feature films and popular television series and formats, is likely to increase in the future. Our expenditures in respect of locally produced programming may also increase due to competition for talent and other resources, changes in audience tastes in our markets or from the implementation of any new laws and regulations mandating the broadcast of a greater number of locally produced programs. In addition, we typically acquire syndicated programming rights under multi-year commitments before knowing how such programming will perform in our markets. In the event any such programming does not attract adequate audience share, it may be necessary to increase our expenditures by investing in additional programming, subject to the availability of adequate financial resources, as well as to write down the value of any underperforming programming. Any material increase in content costs could have a material adverse effect on our financial condition, results of operations or cash flows.
Our operations are vulnerable to significant changes in viewing habits and technology that could adversely affect us.
The television broadcasting industry is affected by rapid innovations in technology. The implementation of these new technologies and the introduction of non-traditional content distribution systems have increased competition for audiences and advertisers. Platforms such as direct-to-home cable and satellite distribution systems, the internet, subscription and advertising video-on-demand, user-generated content sites and the availability of content on portable digital devices have changed consumer behavior by increasing the number of entertainment choices available to audiences and the methods for the distribution, storage and consumption of content. This development has fragmented television audiences in more developed markets and could adversely affect our ability to retain audience share and attract advertisers as such technologies penetrate our markets. As we adapt to changing viewing patterns, it may be necessary to expend substantial financial and managerial resources to ensure necessary access to new technologies or distribution systems. Such initiatives may not develop into profitable business models. Furthermore, technologies that enable viewers to choose when, how, where and what content to watch, as well as to fast-forward or skip advertisements, may cause changes in consumer behavior that could have a negative impact on our advertising revenues. In addition, compression techniques and other technological developments allow for an increase in the number of channels that may be broadcast in our markets and expanded programming offerings that may be offered to highly targeted audiences. Reductions in the cost of launching new channels could lower entry barriers and encourage the development of increasingly targeted niche programming on various distribution platforms. This could increase the competitive demand for popular programming, resulting in an increase in content costs as we compete for audiences and advertising revenues. A failure to successfully adapt to changes in our industry as a result of technological advances may have an adverse effect on our financial position, results of operations and cash flows.
Content may become more expensive to produce or acquire or we may not be able to develop or acquire content that is attractive to our audiences.
Television programming is one of the most significant components of our operating costs. The ability of our programming to generate advertising revenues depends substantially on our ability to develop, produce or acquire programming that matches audience tastes and attracts high audience shares, which is difficult to predict. The commercial success of a program depends on several tangible and intangible factors, including the impact of competing programs, the availability of alternate forms of entertainment and leisure time activities, our ability to anticipate and adapt to changes in consumer tastes and behavior, and general economic conditions. The cost of acquiring content attractive to our viewers, such as feature films and popular television series and formats, is likely to increase in the future. Our expenditures in respect of locally produced programming may also increase due to competition for talent and other resources, wage inflation, changes in audience tastes in our markets or from the implementation of any new laws and regulations mandating the broadcast of a greater number of locally produced programs. In addition, we typically acquire syndicated programming rights under multi-year commitments before knowing how such programming will perform in our markets. In the event any such programming does not attract adequate audience share, it may be necessary to increase our expenditures by investing in additional programming, subject to the availability of adequate financial resources, as well as to write down the value of any underperforming programming. Any material increase in content costs could have a material adverse effect on our financial condition, results of operations or cash flows.
Our operating results are dependent on the importance of television as an advertising medium.
We generate most of our revenues from the sale of our advertising airtime on television channels in our markets. Television competes with various other media, such as print, radio, the internet and outdoor advertising, for advertising spending. In all of the countries in which we operate, television constitutes the single largest component of all advertising spending. There can be no assurancesassurance that the television advertising market will maintain its current position among advertising media in our markets. Furthermore, there can be no assurances that changes in the regulatory environment or improvements in technology will not favor other advertising media or other television broadcasters. Increases in competition among advertising media arising from the development of new forms of advertising media and distribution could result in a decline in the appeal of television as an advertising medium generally or of our channels specifically. A decline in television advertising spending as a component of total advertising spending in any period or in specific markets would have an adverse effect on our financial position, results of operations and cash flows.
We are subject to legal compliance risks and the risk of legal or regulatory proceedings being initiated against us.
We are required to comply with a wide variety of laws and other regulatory obligations in the jurisdictions in which we operate and compliance by our businesses is subject to scrutiny by regulators and other government authorities in these jurisdictions. Compliance with foreign as well as applicable U.S. laws and regulations related to our businesses, such as broadcasting content and advertising regulations, competition regulations, tax laws (including the Economic Substance Act in Bermuda which came into force in July 2019), employment laws, data protection requirements including the new EU General Data Protection Regulation, and anti-corruption laws, increases the costs and risks of doing business in these jurisdictions. We believe we have implemented appropriate risk management and compliance policies and procedures that are designed to ensure our employees, contractors and agents comply with these laws and regulations; however, a violation of such laws and regulations or the Company’s policies and procedures could occur. A failure or alleged failure to comply with applicable laws and regulations, whether inadvertent or otherwise, may result in legal or regulatory proceedings being initiated against us and fines or other penalties being levied against us.
We have become aware of provisions inIn Slovenia, the tax regulations of one of our markets that shift the liability for taxes on gains resulting from certain capital transactions from the seller to the buyer. This provision may have been applicable to an acquisition made by us, although we do not believe we have any liability connected to this transaction. In addition, in 2016, the prosecutingcompetition law authorities in Romania requested information in respect oflaunched an investigation in 2017 into certain transactions entered into by Pro TVwhether our Slovenia subsidiary is dominant and abused its dominant position when concluding carriage fee agreements with platform operators in 2014 primarilyconnection with certain related parties. We believeits decision to cease broadcasting on DTT there. To date there has been no determination that the transactions under review are fully supported and have cooperated with the authorities in responding to the information request.a breach of competition law has occurred. If these or other contingencies result in legal or regulatory proceedings being initiated against us, or if developments occur in respect of our compliance with existing laws or regulations, or there are changes in the interpretation or application of such laws or regulations, we may incur substantial costs, be required to change our business practices (including on what terms and conditions we offer our channels under carriage agreements), our reputation may be damaged or we may be exposed to unanticipated civil or criminal liability, including fines and other penalties that may be substantial. This could have a material adverse effect on our business, financial position, results of operations and cash flows.
Our operations are in developing markets where there are additional risks related to political and economic uncertainty, biased treatment and compliance with evolving legal and regulatory systems.
Our revenue-generating operations are located in Central and Eastern Europe and we may be significantly affected by risks that may be different to those posed by investments in more developed markets. These risks include, but are not limited to, social and political instability, changes in local regulatory requirements including restrictions on foreign ownership, inconsistent regulatory or judicial practice, corruption and increased taxes and other costs. The economic and political systems, legal and tax regimes, regulatory practices, standards of corporate governance and business practices of countries in this region continue to develop. Policies and practices may be subject to significant adjustments, including following changes in political leadership.leadership, as well as to the influence of commercial and governmental actors. This may result in inconsistent application of tax and legal regulations, arbitrary or biased treatment, and other general business risks as well as social or political instability or disruptions and the potential for political influence on the media as well as inconsistent applicationmedia. The relative level of taxdevelopment of our markets, the risk of corruption, and legal regulations, arbitrarythe influence of local commercial and governmental actors also present a potential for biased or unfair treatment of us before regulatoryregulators or judicial authorities and other general business risks.courts in the event of disputes. If such a dispute occurs, those regulators or courts may not act with integrity or may favor local interests over our interests. Other potential risks inherent in markets with evolving economic and political environments include exchange controls, higher taxes, tariffs and other levies as well as longer payment cycles. The relative levelUltimately, the occurrence of developmentany of our markets and the influence of local politics also present a potential for biased treatment of us before regulators or courts in the event of disputes. If such a dispute occurs, those regulators or courts might favor local interests over our interests. Ultimately, thisthese could have a material adverse impact on our business, financial position, results of operations and cash flows.
Piracy of our content may decrease revenues we can earn from our content and adversely impact our business and profitability.
Piracy of our content poses significant challenges in our markets. Technological developments, including digital copying, file compressing, the use of international proxies and the growing penetration of high bandwidth internet connections, have made it easier to create, transmit and distribute high quality unauthorized copies of content in unprotected digital formats. Furthermore, there are a growing number of video streaming sites, increasing the risk of online transmission of our content without consent. The proliferation of such sites broadcasting content pirated from us could result in a reduction of revenues that we receive from the legitimate distribution of our content, including through video-on-demand and other services. Protection of our intellectual property is in large part dependent on the manner in which applicable intellectual property laws in the countries in which we operate are construed and enforced. We seek to limit the threat of content piracy. However, detecting and policing the unauthorized use of our intellectual property is often difficult and remedies may be limited under applicable law. Steps we take may not prevent the infringement by third parties. There can be no assurance that our efforts to enforce our rights and protect our intellectual property will be successful in preventing piracy, which limits our ability to generate revenues from our content.
We rely on network and information systems and other technology that may be subject to disruption, security breaches or misuse, which could harm our business or our reputation.
We make extensive use of network and information systems and other technologies, including those related to our internal network management as well as our broadcasting operations. These systems are central to many of our business activities. Network and information systems-related events, such as computer hackings, computer viruses, worms or other destructive or disruptive software, process breakdowns, malicious activities or other security breaches could result in a disruption or degradation of our services, the loss of information or the improper disclosure of personal data. The occurrence of any of these events could negatively impact our business if we are required to expend resources to remedy such a security breach or if they result in legal claims or proceedings or our reputation is harmed. In addition, improper disclosure of personal data could subject us to liability under laws, including the new EU General Data Protection Regulation, that protect personal data in the countries in which we operate. The development and maintenance of systems to prevent these events from occurring requires ongoing monitoring and updating as efforts to overcome security measures become more sophisticated. As technologies evolve, we will need to expend additional resources to protect our technology and information systems, which could have an adverse impact on our results of operations and cash flows.
Our broadcasting licenses may not be renewed and may be subject to revocation.
We require broadcasting and, in some cases, other operating licenses as well as other authorizations from national regulatory authorities in our markets in order to conduct our broadcasting business. While our broadcasting licenses for our operations in the Slovak Republic and Slovenia are valid for indefinite time periods, our other broadcasting licenses expire at various times from October 2020 through 2028. While we expect that our material licenses and authorizations will continue to be renewed or extended as required, to continue to operate our business, we cannot guarantee that this will occur or that they will not be subject to revocation, particularly in markets where there is relatively greater political risk as a result of less developed political and legal institutions. The failure to comply in all material respects with the terms of broadcasting licenses or other authorizations or with applications filed in respect thereto may result in such licenses or other authorizations not being renewed or otherwise being terminated. Furthermore, no assurances can be given that renewals or extensions of existing licenses will be issued on the same terms as existing licenses or that further restrictions or conditions will not be imposed in the future. Any non-renewal or termination of any other broadcasting or operating licenses or other authorizations or material modification of the terms of any renewed licenses may have a material adverse effect on our financial position, results of operations and cash flows.
Our success depends on attracting and retaining key personnel.
Our success depends partly upon the efforts and abilities of our key personnel and our ability to attract and retain key personnel. Our management teams have significant experience in the media industry and have made important contributions to our growth and success. Although we have been successful in attracting and retaining such people in the past, competition for highly skilled individuals is intense. There can be no assurance that we will continue to be successful in attracting and retaining such individuals in the future. In particular, the proposed Merger may adversely impact our ability to attract and retain such individuals. The loss of the services of any of these individuals could have an adverse effect on our businesses, results of operations and cash flows.
Risks Relating to Enforcement Rights
We are a Bermuda company and enforcement of civil liabilities and judgments may be difficult.
We are a Bermuda company. Substantially all of our assets and all of our operations are located, and all of our revenues are derived, outside the United States. In addition, several of our directors and officers are non-residents of the United States, and all or a substantial portion of the assets of such persons are or may be located outside the United States. As a result, investors may be unable to effect service of process within the United States upon such persons, or to enforce against them judgments obtained in the United States courts, including judgments predicated upon the civil liability provisions of the United States federal and state securities laws. There is uncertainty as to whether the courts of Bermuda and the countries in which we operate would enforce (a) judgments of United States courts obtained against us or such persons predicated upon the civil liability provisions of the United States federal and state securities laws or (b) in original actions brought in such countries, liabilities against us or such persons predicated upon the United States federal and state securities laws.
Our Bye-laws restrict shareholders from bringing legal action against our officers and directors.
Our Bye-laws contain a broad waiver by our shareholders of any claim or right of action in Bermuda, both individually and on our behalf, against any of our officers or directors. The waiver applies to any action taken or concurred in by an officer or director, or the failure of an officer or director to take any action, in the performance of his or her duties, except with respect to any matter involving any fraud or dishonesty on the part of the officer or director. This waiver limits the right of shareholders to assert claims against our officers and directors unless the act or failure to act involves fraud or dishonesty.
Risks Relating to our Common Stock
Our share price may be adversely affected by sales of unregistered shares or future issuances of our shares.
Time Warner is the largest holder of shares of our Class A common stock, holding 61,407,775 unregistered shares of Class A common stock, one share of Series A preferred stock, 200,000 shares of Series B preferred stock and warrants to acquire 100,926,996 shares of our Class A common stock (the "TW Warrants"). The share of Series A preferred stock is convertible into 11,211,449 shares of Class A common stock and the shares of Series B preferred stock are convertible into shares of Class A common stock at the option of Time Warner (subject to certain exceptions). As of December 31, 2017, the 200,000 shares of Series B preferred stock were convertible into approximately 109.2 million shares of Class A common stock. The TW Warrants are exercisable for shares of Class A common stock until May 2, 2018 at an exercise price of US$ 1.00 per share. Time Warner has registration rights with respect to all its shares of Class A common stock now held or hereafter acquired. Furthermore, there are additional unregistered shares of our Class A common stock outstanding that we may be obligated to register and shares of Class A common stock underlying other warrants that may enter into trading. For additional information on the Series A preferred stock, Series B preferred stock and TW Warrants, see Part II, Item 8, Note 12, "Convertible Redeemable Preferred Shares" and Note 13, "Equity". In October 2016, Time Warner announced it has entered into a definitive merger agreement with AT&T Inc. under which AT&T Inc. will acquire Time Warner. The merger is subject to approval by a number of regulatory authorities, including the U.S. Department of Justice. If completion of the merger is successful, AT&T Inc. will become the beneficial owner of equity securities currently beneficially owned by Time Warner and the successor to rights related to such securities granted to Time Warner.
We cannot predict what effect, if any, the entry into trading of previously issued unregistered shares of Class A common stock will have on the market price of our shares. We may also issue additional shares of Class A common stock or securities convertible into our equity in the future. If more shares of our Class A common stock (or securities convertible into or exchangeable for shares of our Class A common stock) are issued to Time Warner, the economic interests of current shareholders may be diluted and the price of our shares may be adversely affected.
The interests of Time WarnerAT&T may conflict with the interests of other investors.
TimeThrough its wholly owned subsidiaries Warner Media and TW Investor, the aggregate beneficial ownership interest of AT&T in the Company is able toapproximately 75.7%. In connection with the exercise voting power in us with respect to 46.3% of our outstanding shares of Class A common stock. As such, Time Warner is in a position to exercise significant influence over the outcome of corporate actions requiring shareholder approval, such as the election of directors or certain transactions. Following the issuance of the warrants by Warner Media and TW Warrants,Investor in April 2018, each of them issued standing proxies to the aggregate economic interestindependent directors of Timethe Company, pursuant to which it granted the independent directors the right to vote the 100,926,996 shares received on the exercise of those warrants (the “Warrant Shares”) on all matters other than at any meeting where the agenda includes a change in control transaction. In accordance with these proxies, the Warrant Shares will be voted in proportion to votes cast at such a meeting of the Company, excluding such Warrant Shares. Warner in us is approximately 76.1% (withoutMedia and TW Investor have undertaken to maintain this proxy arrangement until April 2020 and may extend it for an additional year at their option. After giving effect to the accretionits ownership of the Series B preferred stock after December 31, 2017).A Preferred Share, AT&T has a 44.3% voting interest in the Company at any meeting where the Warrant Shares are voted pursuant to the standing proxies. Furthermore, Time WarnerAT&T has the right to appoint one less than the number required to constitute a majority of our board of directors, provided that Time WarnerAT&T continues to own not less than 40% of the voting power of the Company. As such, AT&T is in a position to exercise significant influence over the outcome of corporate actions requiring shareholder approval, such as the proposed Merger, the election of directors, amendments to our Bye-laws, or certain transactions, including transactions resulting in a change of control.
We are also party to an amended investor rights agreement with Time Warner Media and the other parties thereto under which, among other things, Time Warner Media was granted a contractual preemptivepre-emptive right (subject to certain exclusions) with respect to issuances of the Company’s equity securities, which permits it to maintain its pro rata economic interest as well as a right to top any offer that would result in a change of control of the Company. Under Bermuda law, there is no takeover code or similar legislation requiring an acquirer of a certain percentage of our Class A common stock to tender for the remaining publicallypublicly held shares. In addition to being our largest shareholder, Time Warner Media is also our largest secured creditor, as it guarantees 100% of our outstanding senior indebtedness and is the lender under the 20212023 Revolving Credit Facility. The 20212023 Revolving Credit Facility (when drawn) and the Reimbursement Agreement contain maintenance covenants in respect of interest cover, cash flow cover and total leverage ratios and includes covenants in respect of the incurrence of indebtedness (including refinancing indebtedness), the provision of guarantees, acquisitions and disposal and granting security. As such, Time Warner Media may be in a position to determine whether to permit transactions, waive defaults or accelerate such indebtedness or take other steps in its capacity as a secured creditor in a manner that might not be consistent with the interests of the holders of our Class A common stock. Furthermore, in certain circumstances, the interests of Time WarnerAT&T as our largest shareholderbeneficial owner could be in conflict with the interests of minority shareholders.
The price of our Class A common stock is likely to remainmay be volatile.
The market price of shares of our Class A common stock may be influenced by many factors, some of which are beyond our control, including but not limited to those described above under "Risks Relating to Our Operations" and “Risks Relating to Our Operations”the Proposed Merger - The failure to complete the proposed Merger within the expected time frame or at all could adversely affect our business, financial condition, results of operations, liquidity and the price of our Class A common stock” as well as the following: general economic and business trends, variations in quarterly operating results, license renewals, regulatory developments in our operating countries and the European Union, the condition of the media industry in our operating countries, the volume of trading in shares of our Class A common stock, future issuances of shares of our Class A common stock and investors’ and securities analysts’ perception of us and other companies that investors or securities analysts deem comparable in the television broadcasting industry. In addition, stock markets in general have experienced extreme price and volume fluctuations that have often been unrelated to and disproportionate to the operating performance of broadcasting companies. These broad market and industry factors may materially reduceimpact the market price of shares of our Class A common stock, regardless of our operating performance.
OurRisks Relating to the Proposed Merger
The proposed Merger may cause disruption to our business.
The Merger Agreement generally requires CME to operate its business in the ordinary course during the pendency of the proposed Merger and contains customary covenants which restrict CME, without Parent’s consent, from taking certain specified actions until the proposed Merger closes or the Merger Agreement terminates. These restrictions may prevent us from taking actions or making changes with respect to the Company that we may otherwise consider to be advantageous and could result in our inability to respond effectively to competitive pressures, industry developments and future opportunities, which may adversely affect our business, financial condition, results of operations and cash flows.
The proposed Merger could cause disruptions to our business or business relationships. Uncertainty associated with the proposed Merger may cause business partners, customers and other counterparties to delay or defer decisions concerning our business or seek alternative relationships with third parties. Any delay or deferral of those decisions or changes to our business relationships could adversely affect our financial conditions, results of operations and cash flows, regardless of whether the proposed Merger is ultimately completed.
We have allocated, and expect to continue to allocate, significant management and financial resources towards the proposed Merger and its completion. The diversion of management’s attention away from day-to-day operations and other opportunities could adversely affect our business and results of operations. In addition, employee retention, recruitment and motivation may be challenging before the completion of the proposed Merger, as employees may experience uncertainty about their future roles following the proposed Merger. If, despite our retention and recruiting efforts, key employees depart because of issues relating to the uncertainty and potential outcome of the proposed Merger or a desire not to remain following the proposed Merger, our business and results of operations could be negatively impactedadversely affected.
Completion of the proposed Merger is subject to conditions, including the receipt of certain competition and other regulatory approvals, and if these conditions are not satisfied or waived or if the required approvals are not granted or are subject to conditions, completion of the proposed Merger may not occur.
Completion of the proposed Merger is subject to several conditions, including, but not limited to, the receipt of certain competition and other regulatory approvals, the requisite vote of the Company's shareholders, compliance with covenants and agreements in the Merger Agreement (subject to certain materiality qualifications), and the absence of any governmental order prohibiting completion of the proposed Merger, some of which are beyond our control. We cannot predict with certainty whether and when any of these conditions will be satisfied or waived, which may prevent, delay or otherwise adversely affect the completion of the proposed Merger in a material way. In addition, Parent’s obligation to complete the proposed Merger is subject to the receipt of certain governmental approvals without the requirement that Parent agree to take any action or commit to any condition or restriction necessary to secure such approval that would constitute a “burdensome condition” as defined in the Merger Agreement. There can be no assurance that regulators will not seek to impose conditions, terms, obligations or restrictions that would constitute burdensome conditions or that such conditions, terms, obligations or restrictions would not result in the termination of the Merger Agreement.
The failure to complete the proposed Merger within the expected time frame or at all could adversely affect our business, financial condition, results of operations, liquidity and the price of our Class A common stock.
If the proposed Merger is not completed by October 27, 2020, which date may be extended under certain circumstances to January 27, 2021, CME or Parent may choose not to proceed with the proposed Merger. Each of CME and Parent may also elect to terminate the Merger Agreement in certain other circumstances. If the Merger Agreement is terminated, CME may be required to pay to Parent a termination fee of $50 million. The termination of the Merger Agreement may also result of shareholder activism.
On January 17, 2017, TCS Capital Management, LLC ("TCS Capital"), a beneficial owner of approximately 7.0%in the share price of our Class A common stock filed an amendmentdeclining. Additionally, we have already incurred, and we expect to its Schedule 13Dcontinue to incur, significant costs in connection with the proposed Merger for which it disclosed its opinionwe will receive little or no benefit if the completion of the proposed Merger does not occur. In the event the proposed Merger is not completed, CME could also be subject to litigation related to any failure to complete the proposed Merger.
Therefore, if the proposed Merger is not completed, our business, financial condition, results of operations and cash flows may be adversely affected, and the share price of our Class A common stock may decline. Moreover, if the Merger Agreement is terminated and we decide to seek another business combination, we may not be able to negotiate or consummate a transaction with another party on terms comparable to, or better than, the terms of the Merger Agreement.
The Merger Agreement contains provisions that could discourage a potential competing acquirer.
The Merger Agreement contains certain provisions that restrict our ability to, among other things, solicit, knowingly encourage, knowingly facilitate, knowingly induce or initiate the submission of, enter into, or participate in any discussions or any negotiations regarding any "competing proposal" as defined in the Merger Agreement or the announcement of a competing proposal. The Merger Agreement also provides that the Company should hire an investment bank to run a process to sell the Company as well as replace the Company's Board of Directors with new directors recommended by TCS Capital. In recent years, shareholder activists have become involved in numerous public companies. Shareholder activists frequently propose to involve themselves(or any committee thereof, including the Special Committee) will not make a "change of recommendation" as defined in the governance, strategic direction and operationsMerger Agreement except as permitted by the terms of the Company. Such proposalsMerger Agreement. In addition, CME may disrupt our businessbe required to pay a termination fee of $50 million to Parent if the proposed Merger is not consummated under specified circumstances.
CME believes these provisions are reasonable, customary and divertnot preclusive of other offers. Nevertheless, these provisions might discourage a third party that has an interest in acquiring all or a significant part of CME from considering or proposing such acquisition, even if such party were prepared to pay consideration with a higher value than the attention of our management and employees, and any perceived uncertainties as to our future direction resulting from suchcurrently proposed aggregate merger consideration. Furthermore, the requirement that CME pay a situation couldtermination fee under certain circumstances may result in a third party proposing to pay a lower per-share price to acquire CME, than it might otherwise have proposed to pay because of the lossadded expense of potential business opportunities, be exploitedthe termination fee that may become payable by our competitors, cause concern to our current or potential customers, and make it more difficult to attract and retain qualified personnel and business partners, all of which could adversely affect our business. In addition, actions of activist shareholders may cause significant fluctuationsCME in our stock price based on temporary or speculative market perceptions or other factors that do not necessarily reflect the underlying fundamentals and prospects of our business.certain circumstances.
ITEM 1B. UNRESOLVED STAFF COMMENTS
None.
ITEM 2. PROPERTIES
We own and lease properties in the countries in which we operate. These facilities are fully utilized for current ongoing operations, are in good condition and are adequately equipped for purposes of conducting broadcasting, content production or such other operations as we require. We believe that suitable additional space is available on acceptable terms in the event of an expansion of our businesses. The table below provides a brief description of our significant properties.
|
| | | | |
| Location | | Property | | Use |
| Hamilton, Bermuda | | Leased office | | Registered office, Corporate |
| Amsterdam, The Netherlands | | Leased office | | Corporate office, Corporate |
| Sofia, Bulgaria | | Leased buildings | | Office and studio space (Bulgaria segment) |
| Prague, Czech Republic | | Owned and leased buildings | | Administrative center, Corporate; Office and studio space (Czech Republic segment) |
| Bucharest, Romania | | Owned and leased buildings | | Office and studio space (Romania segment) |
| Bratislava, Slovak Republic | | Owned buildings | | Office and studio space (Slovak Republic segment) |
| Ljubljana, Slovenia | | Owned and leased buildings | | Office and studio space (Slovenia segment) |
| London, United Kingdom | | Leased office | | Administrative center, Corporate |
For further information on the cash resources that fund these facility-related costs, see Part II, Item 7, III, "Liquidity and Capital Resources".
ITEM 3. LEGAL PROCEEDINGS
General
We are from time to time party to legal proceedings, arbitrationsSee Part II, Item 8, Note 21, "Commitments and regulatory proceedings arising in the normal courseContingencies" for a discussion of our business operations, including the proceeding described below. We evaluate, on a quarterly basis, developments in such matters and provide accruals for such matters, as appropriate. In making such decisions, we consider the degree of probability of an unfavorable outcome and our ability to make a reasonable estimate of the amount of a loss. An unfavorable outcome in any such proceedings, if material, could have an adverse effect on our business or consolidated financial statements.
In the fourth quarter of 2016, our Slovak subsidiary MARKIZA-SLOVAKIA, spol. s.r.o. (“Markiza”) was notified of claims that were filed in June 2016 in a court of first instance in Bratislava, the Slovak Republic to collect amounts allegedly owing under four promissory notes. These four promissory notes were purportedly issued in June 2000 by Pavol Rusko in his personal capacity and were purportedly guaranteed by Markiza under the signature of Mr. Rusko, who was an executive director of Markiza at that time as well as one of its shareholders. The notes purport to be issued in favor of Marian Kocner, a controversial Slovak businessman, and to a former associate of Mr. Kocner, and were supposedly assigned several times, ultimately to Sprava a inkaso zmeniek, s.r.o., a company owned by Mr. Kocner that is the plaintiff in these proceedings. Two of the notes allegedly matured in 2015 and the other two in 2016. The four notes purport to be in the aggregate amount of approximately EUR 69.0 million.
Despite a random case assignment system in the Slovak Republic, claims in respect of three of the notes were initially assigned to the same judge. The judge who was assigned the claim in respect of the fourth promissory note (in the amount of approximately EUR 26.0 million) terminated proceedings in January 2017 because the plaintiff failed to pay court fees. The plaintiff refiled this claim in June 2017; the judge who was assigned the refiled claim terminated proceedings in September after the plaintiff again failed to pay court fees. In responses to the claims in respect of the other three promissory notes that were filed in August 2017, Mr. Rusko asserted that he signed the three notes in June 2000. We do not believe that the notes were signed in June 2000 or that any of the notes are authentic. We are vigorously defending the claims.ongoing litigation.
ITEM 4. MINE SAFETY DISCLOSURES
Not applicable.
PART II
| |
| ITEM 5. | MARKET FOR REGISTRANT'S COMMON EQUITY, RELATED STOCKHOLDER MATTERS AND ISSUER PURCHASES OF EQUITY SECURITIES |
Shares of Class A common stock of Central European Media Enterprises Ltd. began trading on the NASDAQ National Market (since renamed the NASDAQ Global Select Market) on October 13, 1994 and began trading on the Prague Stock Exchange on June 27, 2005. On each market, the shares are traded under the ticker symbol "CETV".
On February 5, 20184, 2020, the last reported sales price for shares of our Class A common stock was US$ 4.60.
The following table sets forth the high4.50 and low prices for shares of our Class A common stock for each quarterly period during the last two fiscal years as reported by NASDAQ.
|
| | | | | | | | | | | | | | | |
| | 2017 | | 2016 |
| | High (US$ / Share) | | Low (US$ / Share) | | High (US$ / Share) | | Low (US$ / Share) |
| Fourth Quarter | $ | 5.20 |
| | $ | 4.00 |
| | $ | 2.88 |
| | $ | 2.15 |
|
| Third Quarter | 4.55 |
| | 3.90 |
| | 2.48 |
| | 2.05 |
|
| Second Quarter | 4.45 |
| | 2.90 |
| | 2.96 |
| | 2.03 |
|
| First Quarter | 3.15 |
| | 2.40 |
| | 2.71 |
| | 2.17 |
|
At February 5, 2018, there were approximately 5246 holders of record (including brokerage firms and other nominees) of shares of Class A common stock.record.
Under our 2015 Stock Incentive Plan (the "2015 Plan"), 6,000,00016,000,000 shares of Class A are authorized for issuance in respect of equity awards. In addition, any shares available under our Amended and Restated Stock Incentive Plan (which expired on June 1, 2015), including in respect of any awards that expire, terminate or are forfeited, will be available for awards under the 2015 Plan (see Item 8, Note 17, "Stock-based Compensation"). See Part III, Item 12, "Security Ownership of Certain Beneficial Owners and Management and Related Stockholder Matters" for further information.
DIVIDEND POLICY
We have not declared or paid and have no present intention to declare or pay in the foreseeable future any cash dividends in respect to any class of our shares of common stock.
PURCHASE OF OWN STOCK
We did not purchase any of our own stock in 2017.2019.
RECENT SALES OF UNREGISTERED SECURITIES
We did not make any sales of any unregistered securities in 2019.
PERFORMANCE GRAPH
The following performance graph is a line graph comparing the change in the cumulative total shareholder return of the Class A common stock against the cumulative total return of the NASDAQ Composite Index and the Dow Jones Europe Stock Index between December 31, 20122014 and December 31, 2017.2019. The graph below assumes the investment of US$ 100 on December 31, 20122014 in our Class A common stock, the NASDAQ Composite and the Dow Jones Europe Stock Index, assuming dividends, if any, are reinvested.
Value of US$ 100 invested at December 31, 20122014 as of December 31, 20172019:
| | | Central European Media Enterprises Ltd. | $ | 75.24 |
| $ | 141.12 |
|
| NASDAQ Composite Index | $ | 228.63 |
| |
| NASDAQ Composite Total Return Index | | $ | 200.49 |
|
| Dow Jones Europe Stock Index | $ | 129.34 |
| $ | 113.76 |
|
ITEM 6. SELECTED FINANCIAL DATA
Our selected consolidated financial data should be read together with our consolidated financial statements and related notes included in Item 8, “Financial"Financial Statements and Supplementary Data”Data" of this Annual Report on Form 10-K.
The following tables set forth the selected consolidated financial data for each of the years in the five-year period ended December 31, 20172019. The selected consolidated financial data is qualified in its entirety and should be read in conjunction with Item 7, “Management's"Management's Discussion and Analysis of Financial Condition and Results of Operations”Operations" and Item 8, “Financial"Financial Statements and Supplementary Data”Data". We have derived the consolidated statements of operations and comprehensive income / loss data for the years ended December 31, 20172019, 20162018 and 20152017 and the consolidated balance sheet data as of December 31, 20172019 and 20162018 from the audited consolidated financial statements included elsewhere in this Annual Report on Form 10-K. The consolidated statements of operations and comprehensive income / loss data for the years ended December 31, 20142016 and 20132015 and the balance sheet data as of December 31, 2015, 20142017, 2016 and 20132015 were derived from consolidated financial statements that are not included in this Annual Report on Form 10-K. The selected financial data for all periods presented has been recast due to the impact of our Croatia and Slovenia segments which are presented as discontinued operations (see Item 8, Note 3, "Discontinued Operations and Assets Held for Sale").
| | | | For The Year Ended December 31, | For The Year Ended December 31, |
| | (US$ 000's, except per share data) | (US$ 000's, except per share data) |
| | 2017 |
| | 2016 |
| | 2015 |
| | 2014 |
| | 2013 |
| 2019 |
| | 2018 |
| | 2017 |
| | 2016 |
| | 2015 |
|
| CONSOLIDATED STATEMENTS OF OPERATIONS AND COMPREHENSIVE INCOME / LOSS DATA: | | | | | | | | | | | | | | | | | | |
| Net revenues | $ | 574,212 |
| | $ | 526,174 |
| | $ | 496,195 |
| | $ | 557,273 |
| | $ | 504,401 |
| $ | 694,804 |
| | $ | 703,906 |
| | $ | 642,868 |
| | $ | 583,006 |
| | $ | 550,337 |
|
| Operating income / (loss) | 129,949 |
| | 105,532 |
| | 88,047 |
| | 32,599 |
| | (179,045 | ) | |
| Operating income | | 187,336 |
| | 177,587 |
| | 139,914 |
| | 105,748 |
| | 89,645 |
|
| Income / (loss) from continuing operations | 54,053 |
| | (164,425 | ) | | (86,176 | ) | | (154,912 | ) | | (277,421 | ) | 119,208 |
| | 97,065 |
| | 51,063 |
| | (179,679 | ) | | (83,501 | ) |
| Loss from discontinued operations, net of tax | (4,626 | ) | | (16,172 | ) | | (29,396 | ) | | (76,990 | ) | | (4,127 | ) | |
| Income / (loss) from discontinued operations, net of tax | | — |
| | 60,548 |
| | (1,636 | ) | | (918 | ) | | (32,071 | ) |
| Net income / (loss) attributable to CME Ltd. | $ | 49,768 |
| | $ | (180,291 | ) | | $ | (114,901 | ) | | $ | (227,428 | ) | | $ | (277,651 | ) | $ | 119,134 |
| | $ | 157,692 |
| | $ | 49,768 |
| | $ | (180,291 | ) | | $ | (114,901 | ) |
| | | | | | | | | | | | | | | | | | | |
| PER SHARE DATA: | | | | | | | | | | | | | | | | | | |
| Net income / (loss) per common share from: | | | | | | | | | | | | | | | | | | |
| Continuing operations — basic | $ | 0.17 |
| | $ | (1.18 | ) | | $ | (0.70 | ) | | $ | (1.14 | ) | | $ | (2.24 | ) | $ | 0.32 |
| | $ | 0.27 |
| | $ | 0.16 |
| | $ | (1.28 | ) | | $ | (0.68 | ) |
| Continuing operations — diluted | 0.15 |
| | (1.18 | ) | | (0.70 | ) | | (1.14 | ) | | (2.24 | ) | 0.32 |
| | 0.25 |
| | 0.12 |
| | (1.28 | ) | | (0.68 | ) |
| Discontinued operations — basic | (0.03 | ) | | (0.10 | ) | | (0.20 | ) | | (0.52 | ) | | (0.03 | ) | — |
| | 0.18 |
| | (0.01 | ) | | 0.00 |
| | (0.22 | ) |
| Discontinued operations — diluted | (0.03 | ) | | (0.10 | ) | | (0.20 | ) | | (0.52 | ) | | (0.03 | ) | — |
| | 0.17 |
| | 0.00 |
| | 0.00 |
| | (0.22 | ) |
| Net income / (loss) attributable to CME Ltd. — basic | 0.14 |
| | (1.28 | ) | | (0.90 | ) | | (1.66 | ) | | (2.27 | ) | |
| Net income / (loss) attributable to CME Ltd. — diluted | 0.12 |
| | (1.28 | ) | | (0.90 | ) | | (1.66 | ) | | (2.27 | ) | |
| Attributable to CME Ltd. — basic | | 0.32 |
| | 0.45 |
| | 0.15 |
| | (1.28 | ) | | (0.90 | ) |
| Attributable to CME Ltd. — diluted | | 0.32 |
| | 0.42 |
| | 0.12 |
| | (1.28 | ) | | (0.90 | ) |
| | | | | | | | | | | | | | | | | | | |
| Weighted average common shares used in computing per share amounts (000’s): | | | | | | | | | | | | | | | | | | |
| Basic | 155,846 |
| | 151,017 |
| | 146,866 |
| | 146,509 |
| | 125,723 |
| 264,611 |
| | 230,562 |
| | 155,846 |
| | 151,017 |
| | 146,866 |
|
| Diluted | 236,404 |
| | 151,017 |
| | 146,866 |
| | 146,509 |
| | 125,723 |
| 266,198 |
| | 257,694 |
| | 236,404 |
| | 151,017 |
| | 146,866 |
|
| | | | | | | | | | | | | | | | | | | |
| | As at December 31, | As at December 31, |
| | (US$ 000's) | (US$ 000's) |
| | 2017 |
| | 2016 |
| | 2015 |
| | 2014 |
| | 2013 |
| 2019 |
| | 2018 |
| | 2017 |
| | 2016 |
| | 2015 |
|
| CONSOLIDATED BALANCE SHEET DATA: | | | | | | | | | | | | | | | | | | |
| Cash and cash equivalents | $ | 54,903 |
| | $ | 40,606 |
| | $ | 59,120 |
| | $ | 28,844 |
| | $ | 90,921 |
| $ | 36,621 |
| | $ | 62,031 |
| | $ | 58,748 |
| | $ | 40,954 |
| | $ | 59,441 |
|
Other current assets (1) | 409,871 |
| | 299,814 |
| | 299,164 |
| | 345,784 |
| | 432,609 |
| 313,359 |
| | 312,062 |
| | 362,491 |
| | 299,466 |
| | 298,843 |
|
| Non-current assets | 1,163,281 |
| | 1,050,297 |
| | 1,082,133 |
| | 1,230,200 |
| | 1,425,321 |
| 1,097,882 |
| | 1,114,268 |
| | 1,206,816 |
| | 1,050,297 |
| | 1,082,133 |
|
| Total assets | $ | 1,628,055 |
| | $ | 1,390,717 |
| | $ | 1,440,417 |
| | $ | 1,604,828 |
| | $ | 1,948,851 |
| $ | 1,447,862 |
| | $ | 1,488,361 |
| | $ | 1,628,055 |
| | $ | 1,390,717 |
| | $ | 1,440,417 |
|
| | | | | | | | | | | | | | | | | | | |
Current liabilities (1) | $ | 188,264 |
| | $ | 171,564 |
| | $ | 146,308 |
| | $ | 450,286 |
| | $ | 318,931 |
| $ | 156,001 |
| | $ | 139,692 |
| | $ | 186,946 |
| | $ | 171,564 |
| | $ | 146,308 |
|
| Non-current liabilities | 1,180,968 |
| | 1,070,786 |
| | 974,270 |
| | 653,434 |
| | 981,029 |
| 680,273 |
| | 849,978 |
| | 1,182,286 |
| | 1,070,786 |
| | 974,270 |
|
| Temporary equity | 264,593 |
| | 254,899 |
| | 241,198 |
| | 223,926 |
| | 207,890 |
| 269,370 |
| | 269,370 |
| | 264,593 |
| | 254,899 |
| | 241,198 |
|
| CME Ltd. shareholders' (deficit) / equity | (5,788 | ) | | (107,804 | ) | | 77,260 |
| | 279,794 |
| | 440,108 |
| |
| CME Ltd. shareholders' equity / (deficit) | | 341,705 |
| | 229,020 |
| | (5,788 | ) | | (107,804 | ) | | 77,260 |
|
| Noncontrolling interests | 18 |
| | 1,272 |
| | 1,381 |
| | (2,612 | ) | | 893 |
| 513 |
| | 301 |
| | 18 |
| | 1,272 |
| | 1,381 |
|
| Total liabilities and equity | $ | 1,628,055 |
| | $ | 1,390,717 |
| | $ | 1,440,417 |
| | $ | 1,604,828 |
| | $ | 1,948,851 |
| $ | 1,447,862 |
| | $ | 1,488,361 |
| | $ | 1,628,055 |
| | $ | 1,390,717 |
| | $ | 1,440,417 |
|
| |
(1) | Other current assets and current liabilities as at December 31, 2017 include total assets held for sale and total liabilities held for sale respectively.of our Croatian operations. |
ITEM 7. MANAGEMENT'S DISCUSSION AND ANALYSIS OF FINANCIAL CONDITION AND RESULTS OF OPERATIONS
Please refer to page 21 of this Annual Report on Form 10-K for a list of defined terms used herein. The following discussion and analysis should be read in conjunction with the other sections in this Annual Report, including Part I, Item 1. Business, Part II, Item 6. Selected Financial Data, and Part II, Item 8. Financial Statements and Supplementary Data. The exchange rates used in this report are as at December 31, 2017,2019, unless otherwise indicated.
I. Overview
CME Strategy
Our operations comprise a unique collection of television networks across Central and Eastern Europe, each of which enjoys a strong competitive position due to audience share leadership, brand strength, strongpopular local content, and the depth and experience of country management. The reach and affinity we provide advertisers supports our model of pricing inventory at a premium to our competition, and we pursue sales strategies designedseek to maximize our revenues in order to provide additional financial resources to invest in original local content. We believe these competitive advantages position us to benefit if forecast economic growth leads to continued growth of the television advertising markets in the countries in which we operate.
We are focused on enhancing the performance of our television networks in each country, which we expect will continue improving operating marginsprofitability and cash generation over the short-generation. Our operating and medium-term. The main elements of our strategyfinancial priorities are as follows:
leveraging content popular with our target demographics to maintain or increase our television audience share leadership and advertising market shares;
driving growth in television advertising revenues through our pricing strategies;
increasing carriage fees and subscription revenues as well as expanding our online content offerings to provide more diversified and predictable income;
expanding our online content offerings to further diversify revenues; and
maintaining a strict cost discipline and identifying cost synergies while safeguarding our brands and competitive strengths.strengths to increase profitability; and
completing the previously announced Merger with PPF.
As market leaders with experienced management teams in each country, we believe we are well positioned to identify new challenges in a timely manner and adjust our strategy as new opportunities or threats arise.
We manage our business on a geographical basis with fourfive operating segments: Bulgaria, the Czech Republic, Romania, and the Slovak Republic.Republic and Slovenia. These operating segments, which are also our reportable segments, reflect how our operating performance is evaluated by our chief operating decision makers, who we have identified as our co-Chief Executive Officers; how our operations are managed by segment managers; and the structure of our internal financial reporting.
On July 9, 2017, weOctober 27, 2019, the Company entered into the Merger Agreement with Parent and Merger Sub, pursuant to which Merger Sub will merge with and into the Company, with the Company continuing as the surviving company in the proposed Merger as a framework agreement with Slovenia Broadband S.à r.l., a wholly ownedwholly-owned subsidiary of United Group B.V., relatingParent. The closing of the proposed Merger is subject to several conditions, including, but not limited to, the salerequisite vote of our Croatia and Slovenia operations. Accordingly, these operations are classified as held for sale and they are presented as discontinued operations for all periodsthe Company’s shareholders in this report;favor of the Merger Agreement and the discussion below relates to our continuing operationsproposed Merger, the receipt of certain competition and other regulatory approvals, compliance with covenants and agreements in the four remaining operating segments.Merger Agreement (subject to certain materiality qualifications), and the absence of any governmental order prohibiting completion of the proposed Merger. We expect the proposed Merger to be completed in the middle of 2020.
Non-GAAP Financial Measures
In this report we refer to several non-GAAP financial measures, including OIBDA, OIBDA margin, free cash flow and unlevered free cash flow. We believe that each of these metrics is useful to investors for the reasons outlined below. Non-GAAP financial measures may not be comparable to similar measures reported by other companies. Non-GAAP financial measures should be evaluated in conjunction with, and are not a substitute for, US GAAP financial measures.
We evaluate our consolidated results and the performance of our segments based on net revenues and OIBDA. We believe OIBDA is useful to investors because it provides a meaningful representation of our performance, as it excludes certain items that do not impact either our cash flows or the operating results of our operations. OIBDA and unlevered free cash flow are also used as components in determining management bonuses.
OIBDA includes amortization and impairment of program rights and is calculated as operating income / loss before depreciation, amortization of intangible assets and impairments of assets and certain unusual or infrequent items that are not considered by our co-Chief Executive Officers when evaluating our performance. Stock-based compensation and certain other items are not allocated to our segments for purposes of evaluating their performance and therefore are not included in their respective OIBDA. Our key performance measure of the efficiency of our consolidated operations and our segments is OIBDA margin. We define OIBDA margin as the ratio of OIBDA to net revenues.
Following a repricing of our Guarantee Fees in March 2017 the proportion ofand April 2018, we pay interest and related Guarantee Fees on our outstanding indebtedness that must be paid in cash has increased.cash. In addition to this obligation to pay more Guarantee Fees in cash, we expect to use cash generated by the business to pay certain Guarantee Fees that are payablewere previously paid in kind. These cash payments are all reflected in free cash flow; accordingly, we believe unlevered free cash flow, defined as free cash flow before cash payments for interest and Guarantee Fees, best illustrates the cash generated by our operations when comparing periods. We define free cash flow as net cash generated from continuing operating activities less purchases of property, plant and equipment, net of disposals of property, plant and equipment and excluding the cash impact of certain unusual or infrequent items that are not included in costs charged in arriving at OIBDA because they are not considered by our co-Chief Executive Officers when evaluating performance.
For additional information regarding our business segments, including a reconciliation of OIBDA to US GAAP financial measures, see Item 8, Note 20, "Segment Data". For a reconciliation of free cash flow and unlevered free cash flow to a US GAAP financial measure, see "Free Cash Flow and Unlevered Free Cash Flow" below.
While our reporting currency is the dollar, our consolidated revenues and costs are divided across a range of European currencies and CME Ltd.’s functional currency is the Euro. Given the significant movement of the currencies in the markets in which we operate against the dollar, we believe that it is useful to provide percentage movements based on actual (“% Act”) percentage movements, which includes the effect of foreign exchange, as well as like-for-like percentage movements (“% Lfl”). The like-for-like percentage movement references reflect the impact of applying the current period average exchange rates to the prior period revenues and costs. Since the difference between like-for-like and actual percentage movements is solely the impact of movements in foreign exchange rates, our discussion in the following analysis is focused on constant currency percentage movements in order to highlight those factors influencing operational performance. The incremental impact of foreign exchange rates is presented in the tables preceding such analysis.
Executive Summary
The following tables provide a summary of our consolidated results for the years ended December 31, 20172019, 20162018 and 2015:2017:
| | | | For The Year Ended December 31, (US$ 000's) | For The Year Ended December 31, (US$ 000's) |
| | | | | | Movement | | | | | | Movement | | | | | Movement | | | | | | Movement |
| | 2017 |
| | 2016 |
| | % Act |
| | % Lfl |
| | 2016 |
| | 2015 |
| | % Act |
| | % Lfl |
| 2019 |
| | 2018 |
| | % Act |
| | % Lfl |
| | 2018 |
| | 2017 |
| | % Act |
| | % Lfl |
|
| Net revenues | $ | 574,212 |
| | $ | 526,174 |
| | 9.1 | % | | 5.5 | % | | $ | 526,174 |
| | $ | 496,195 |
| | 6.0 | % | | 6.3 | % | $ | 694,804 |
| | $ | 703,906 |
| | (1.3 | )% | | 4.5 | % | | $ | 703,906 |
| | $ | 642,868 |
| | 9.5 | % | | 5.3 | % |
| Operating income | 129,949 |
| | 105,532 |
| | 23.1 | % | | 18.8 | % | | 105,532 |
| | 88,047 |
| | 19.9 | % | | 19.4 | % | 187,336 |
| | 177,587 |
| | 5.5 | % | | 11.4 | % | | 177,587 |
| | 139,914 |
| | 26.9 | % | | 25.1 | % |
| Operating margin | 22.6 | % | | 20.1 | % | | 2.5 p.p. | | 2.5 p.p. | | 20.1 | % | | 17.7 | % | | 2.4 p.p. | | 2.2 p.p. | 27.0 | % | | 25.2 | % | | 1.8 p.p. | | 1.7 p.p. | | 25.2 | % | | 21.8 | % | | 3.4 p.p. | | 4.0 p.p. |
| OIBDA | $ | 165,532 |
| | $ | 136,908 |
| | 20.9 | % | | 16.5 | % | | $ | 136,908 |
| | $ | 109,442 |
| | 25.1 | % | | 24.4 | % | $ | 247,924 |
| | $ | 222,674 |
| | 11.3 | % | | 17.6 | % | | $ | 222,674 |
| | $ | 179,767 |
| | 23.9 | % | | 20.9 | % |
| OIBDA margin | 28.8 | % | | 26.0 | % | | 2.8 p.p. | | 2.7 p.p. | | 26.0 | % | | 22.1 | % | | 3.9 p.p. | | 3.8 p.p. | 35.7 | % | | 31.6 | % | | 4.1 p.p. | | 4.0 p.p. | | 31.6 | % | | 28.0 | % | | 3.6 p.p. | | 4.0 p.p. |
Our consolidated net revenues increased 9%decreased 1% at actual exchange rates and 6% atin 2019 compared to 2018. At constant rates, in 2017 compared to 2016net revenues increased 5% due to an increase in both television advertising revenues and carriage fee and subscription revenues. Television advertising spending in the countries in which we operate grew an estimated 6%3% at constant rates in 20172019 compared to 2016.2018. Our consolidated television advertising revenues grew 8%declined by 3% at actual rates and 5%but increased 3% at constant rates due primarily to significant year-on-year growth in Romania, as well asfour of our operating segments and higher levelsaverage prices in each of advertising spendingthe countries in Bulgaria and the Czech Republic.which we operate. Carriage fees and subscription revenues increased 17%3% at actual rates and 15%10% at constant rates primarily due to additional carriage fees from overall higher prices in contracts with cable, satellite and internet protocol television ("IPTV") operators in the Slovak Republic since January 2017, when those operations ceased broadcasting on DTT.as well as higher subscribers overall.
Costs charged in arriving at OIBDA increased 5%decreased 7% at actual rates and 2% at constant rates in 20172019 compared to 2016. We controlled2018. Content costs overall, while spendingdecreased 2% at constant rates due to broadcasting fewer hours and more on popular localcost effective foreign content, by offsetting this with savings in foreign acquired content and sports rights as well as reducing other operating costs. We made targeted investments in our programming line-up to satisfy additional demand for GRPs in Romania, to improve our competitive positioning in Bulgaria and the Czech Republic, and to support the changea planned reduction in the way our channels are distributedvolume of sports rights. There was also a decrease in the Slovak Republic. Other operatingother costs decreased due to savingsresulting from transmission costs,lower legal and professional fees as well as lower bad debt charges, which were partially offset by higher marketing and staffpersonnel costs.
Our focus on controlling costs while improving revenues led to another year of OIBDA margin expansion, which increased to 29%36% in 20172019 from 26%32% in 2016. We expect2018. This dynamic also drove an increase in operating income, although the trend of revenues growing at a faster pace than costs will continue in 2018 and for the next several years, leading to furtheroperating margin expansion yearwas lower than for OIBDA because costs incurred related to our strategic review announced on year although trends may vary from quarter to quarter.March 25, 2019 and the resulting proposed Merger are not included within OIBDA.
We remained audience share leaders during 20172019 in all of the countries in which we operate, and improved our competitive position in bothwith higher full year prime time and all day audience share in three out of four countries. These audience shares give us a strong offering for advertisers, and wecompared to 2018 in four operating segments. We believe television continues to provide the most efficient medium to reach consumers in our markets. During 2017markets, and we rebrandedbelieve our niche channels in the Czech Republic and Romania to bring them under the umbrella of our flagship brands in each respective country.
Looking ahead to 2018 and beyond:
Following significant GDP growth in Romania during 2017, which saw the highest GDP growth rate in the European Union for a second year, expansion is expected to moderate in 2018. However, analysts estimate that GDP growth in the countries in which we operate will continue to outpace that of the developed markets (as defined below). We anticipate the television advertising market in each of our operating countries will grow in 2018.
Television continues to be the strongest medium for advertising in our operating countries, and demand for television advertising remains robust. This is particularly true in Romania and the Slovak Republic, as both our operations and the respective markets were largely sold-out in 2017. As a result, we have introduced higher list prices in our sales policies for all of our operating countries for 2018. Average realized prices for the year will ultimately depend on a number of factors, including the timing of commitments made for spending in 2018, the portion of those commitments that is prepaid, the volume of those commitments relative to the previous year, and the seasonality of advertisements actually placed.
We expect to continue growing non-advertising based carriage fees and subscription revenues. Following the successful transition from DTT broadcasting of our channels in the Slovak Republic, we expect growth in these consolidated revenues will be driven by contract renewals and increases in the number of subscribers to cable, satellite and IPTV platforms, which would benefit profitability in all countries.
The production of local content remains a key pillar of our strategy as it generally attracts larger audiences. We continually refine our program grids and intend to maintain targeted investments in local content in a cost effective manner. This is particularly true in the Slovak Republic, where we will maintain a strong line-up of local content as we seek to regain audience share and television advertising market share lostmakes us the best partner for advertisers in 2017 during the change in the way our channels were distributed.those territories.
Local content also continues to be important for attracting audiences that consume content through alternatives to linear television. Increased investments in content will also be utilized to expand our offerings on subscription video on demand ("SVOD") platforms as well as advertising based video on demand ("AVOD") platforms to further diversify our revenues.
We believe increased investments in local content will be mostly offset by cost savings on foreign content, as well as savings in other operating costs, including cost synergies from optimizing certain elements of our operations.
Our cash paid for income taxes will continue to increase as the operating companies in each jurisdiction return to generating profits and previous net operating losses are fully utilized.
The dollar is currently weaker than it was, on average, in 2017, and if this persists for the duration of 2018 our local currency results compared to the prior year will be even higher when translated into dollars, further improving our overall results at actual exchange rates.
In 2018 we anticipate using increasedUsing cash generated by the business, expected proceeds fromwe paid a total of EUR 150.0 million (approximately US$ 168.9 million at transaction date rates) of the sale2021 Euro Loan in 2019. Following these payments, there is now EUR 60.3 million (approximately US$ 67.8 million) outstanding on our nearest debt maturity in November 2021. Unlevered free cash flow was US$ 188.0 million in 2019, an increase of 21% compared to 2018.
Together with the increased profitability of our operations, in Croatia and Slovenia, any proceeds from warrant exercises, and savings from lower debt service obligations to repay a significant balance of principal on our outstanding long-term debt. If we are able to reach a net leverage ratio near 3x as a result of these transactions, we expect to review our capital allocation strategy to ensure we are appropriately balancing the benefits of further deleveraging with other uses for excess cash.
Lower Debt Service Obligations
In March 2017, the Guarantee Fees payable to Time Warner as credit guarantor of our currently outstanding Euro Term Loans have been reduced. As a result of the transaction:
Our weighted average borrowing cost immediately decreased 150 basis points to 7.25%, and decreased another 125 basis points to 6.00% in October 2017 when the net leverage ratio decreased below 6x.
The all-in rate now applicable to all currently outstanding senior term credit facilities automatically improves to 5.0% when our net leverage ratio is less than 5x.
was 2.4x at the end of 2019 compared to 3.5x at the end of 2018. Our weighted average cost of borrowing will decrease 50 basis points if the total of outstanding senior term credit facilities is reduced below €815 million, subject to certain adjustments for specified debt repayments, by September 30, 2018.
There is a minimum level of cash-pay interest and related Guarantee Fees totaling 5% applicable to all Euro Term Loans.
There were no changes to our existing debt prepayment rights and no changes to the 2021 Revolving Credit Facility.
On February 5, 2018 we entered into an amendment to the 2018 Euro Term Loan that extended the maturity date from November 1, 2018 to May 1, 2019.
Divestment Transaction to Accelerate Deleveraging
On July 9, 2017, we agreed to sell our operations in Croatia and Slovenia to Slovenia Broadband S.à r.l., a subsidiary of United Group B.V. (“United Group”), subject to obtaining regulatory approvals and other customary closing conditions. On November 14, 2017 the Croatian Agency for Electronic Media (“CAEM”) published a decision that the acquisition by the Purchaser is not permitted under the Croatian Act on Electronic Media due to certain cross ownership restrictions that CAEM believes to be applicable to the Divestment Transaction. Following a sale byEuro Loans and Guarantee Fees was approximately 3.4% at the United Groupend of certain assets in Croatia to address this cross ownership restriction cited by CAEM, it has reapplied for approval from CAEM.
Total2019, down 10 basis points during the year, and the annual run-rate of our cash consideration for the transaction is EUR 230.0 million (approximately US$ 275.8 million), subject to customary working capital adjustments. Upon closing, the proceeds will be used to repay the remaining balance of the 2018 Euro Term Loan in full, and we expect to use the remaining proceeds to repay the Commitment Fee and a portion of the 2019 Euro Term Loan and related accrued Guarantee Fees. These repayments would significantly decrease our indebtedness and our net leverage ratio, and upon repayment of debt following the closing of this transaction, we expect our average borrowing cost on our senior debt would decrease to 4.5%. Had the transaction closed onservice obligations at December 31, 2017, CME’s net leverage ratio would have fallen from 5.4x2019 was approximately US$ 21.3 million, a decrease of approximately 26% compared to 4.6x as a result of the repayment of debt.2018.
Free Cash Flow and Unlevered Free Cash Flow from Continuing Operations
| | | | For The Year Ended December 31, (US$ 000's) | For The Year Ended December 31, (US$ 000's) |
| | 2017 |
| | 2016 |
| | Movement |
| | 2016 |
| | 2015 |
| | Movement |
| 2019 |
| | 2018 |
| | Movement |
| | 2018 |
| | 2017 |
| | Movement |
|
| Net cash generated from continuing operating activities | $ | 95,321 |
| | $ | 59,387 |
| | 60.5 | % | | $ | 59,387 |
| | $ | 79,580 |
| | (25.4 | )% | $ | 179,652 |
| | $ | 109,024 |
| | 64.8 | % | | $ | 109,024 |
| | $ | 93,301 |
| | 16.9 | % |
| Capital expenditures, net | (24,742 | ) | | (22,201 | ) | | (11.4 | )% | | (22,201 | ) | | (23,563 | ) | | 5.8 | % | (24,375 | ) | | (24,540 | ) | | 0.7 | % | | (24,540 | ) | | (27,947 | ) | | 12.2 | % |
Other items (1) | | 6,092 |
| | — |
| | NM (2) |
| | — |
| | — |
| | — | % |
| Free cash flow | 70,579 |
| | 37,186 |
| | 89.8 | % | | 37,186 |
| | 56,017 |
| | (33.6 | )% | 161,369 |
| | 84,484 |
| | 91.0 | % | | 84,484 |
| | 65,354 |
| | 29.3 | % |
| Cash paid for interest (including mandatory cash-pay Guarantee Fees) | 40,619 |
| | 50,611 |
| | (19.7 | )% | | 50,611 |
| | 14,976 |
| | NM (1) |
| |
| Cash paid for Guarantee Fees that may be paid in kind | 1,735 |
| | 7,464 |
| | (76.8 | )% | | 7,464 |
| | — |
| | NM (1) |
| |
| Unlevered free cash flow from continuing operations | $ | 112,933 |
| | $ | 95,261 |
| | 18.6 | % | | $ | 95,261 |
| | $ | 70,993 |
| | 34.2 | % | |
| Cash paid for interest (including Guarantee Fees) | | 26,651 |
| | 43,350 |
| | (38.5 | )% | | 43,350 |
| | 47,197 |
| | (8.2 | )% |
| Cash paid for Guarantee Fees previously paid in kind | | — |
| | 27,328 |
| | (100.0 | )% | | 27,328 |
| | — |
| | NM (2) |
|
| Cash paid for Guarantee Fees that previously could be paid in kind | | — |
| | 812 |
| | (100.0 | )% | | 812 |
| | 8,343 |
| | (90.3 | )% |
| Unlevered free cash flow | | $ | 188,020 |
| | $ | 155,974 |
| | 20.5 | % | | $ | 155,974 |
| | $ | 120,894 |
| | 29.0 | % |
(1) Number is not meaningful. | |
(1) | Other items during the year ended December 31, 2019 reflects costs relating to the strategic review and resulting proposed Merger. |
| |
(2) | Number is not meaningful. |
|
| | | | | | | | | | |
| | December 31, 2017 |
| | December 31, 2016 |
| | Movement |
|
| Cash and cash equivalents | $ | 54,903 |
| | $ | 40,606 |
| | 35.2 | % |
|
| | | | | | | | | | |
| | December 31, 2019 |
| | December 31, 2018 |
| | Movement |
|
| Cash and cash equivalents | $ | 36,621 |
| | $ | 62,031 |
| | (41.0 | )% |
OurThe increase in unlevered free cash flow increased in 2017 reflecting higherat actual rates during 2019 was due primarily to lower cash collections from revenue growth,payments for acquired programming and production costs, which was partially offset by higher cash spending on content as well as higher cash paidpayments for income taxes and capital expenditures. Freetaxes. Net cash flow increased significantly more than unlevered free cash flow due to a significant decrease ingenerated from continuing operating activities also benefited from lower cash paid for interest and accrued Guarantee Fees.
DueFees, which was partially offset by payments related to the significant increase in cash generated by the business, on August 1, 2017, we elected to repay EUR 50.0 million (approximately US$ 59.1 million at August 1, 2017 rates) of the outstanding principal balance of the 2018 Euro Term Loan, and on February 6, 2018 we repaid an additional EUR 50.0 million (approximately US$ 61.6 million at February 6, 2018 rates). strategic review.
We ended 20172019 with cash of US$ 54.936.6 million and from the beginning of 2018 we have access to another US$ 50.075.0 million of liquidity provided by the 20212023 Revolving Credit Facility, which remains undrawn.
Market Information
After adjusting for inflation, we estimate that during 2017,2019 GDP grew in each of the countries in which we operate at a rate that exceeded the average growth rate of the developed markets. In this respect, "developed markets" refers to a combined group of 11 countries from within the European Union, predominantly fromfor Western Europe, and the United States. Romania continued to be one of the fastest growing economies in the European Union as increases to average wages have provided support for higher disposable income, however higher inflation and uncertainty regarding fiscal policy there are expected to slightly reduce growth in 2018. Similar to the last few years, it has been reported thatEurope. Overall GDP growth in our markets has been less reliant on growth2019 was lower than in 2018, as exports and domestic demand has playedweakened slightly in certain countries, which is reported to be connected to a larger role in economic expansion. Consumer confidence remains strongslowdown in the CzechGerman economy, and Slovak Republics, reflecting historically low ratesuncertainty around the impact of unemployment in those countries.
On March 29, 2017,tariffs on global trade as well as the United Kingdom formally initiated the process to leave the European Union, commonly referred to as “Brexit”, triggering a two-year period to finalize thefinal terms of that separation. While the negotiations over the exact terms of Brexit may negatively impact economic growth inunder which the UK and Europe,will exit the contributionEU (see Part I, Item 1A, "Risk Factors"). Analyst estimates for 2020 of domestic demand as a component of GDP growth has reduced the sensitivity of our markets to external shocks affecting exports. Additionally, we have not seen an appreciable impact on the behavior of advertisers in the countries in which we operate since the UK electorate voted in favorforecast a slower rate of Brexit in June 2016.
On April 6, 2017, the Czech National Bank determined that the recent increase in inflation in the country was sustainablegrowth overall compared to 2019. However, domestic private consumption remains generally robust, supported by historically low unemployment and its mandate for price stability had been met. As a result, it ended its commitment to intervene in currency markets and withdrew the floor related to the EUR/CZK exchange rate. Following the announcement, the Czech Koruna has since strengthened more than 15% against the dollar, also reflecting appreciation of the Euro versus the dollar. If the currency continues to appreciate, this will improve the results of our largest operation in dollar terms.
Moderate inflationary pressures are expected in 2018 due to tighter labor market conditions, and the ECB is expected to begin winding down quantitative easing measures. As a result, incremental interest rate rises are expected in the Czech Republic and Romania. Even with this, analysts estimate that GDP growth in the countries in which we operate will continue to outpace that of the developed markets in 2018.higher average wages. We believe the growth in real private consumption forecast for 20182020 in the countries where we operate will support overallsustain growth in the television advertising markets acrossmarkets.
The following table sets out our estimates of television advertising spending, net of discounts, by country (in US$ millions) for the four countries whereyears set forth below:
|
| | | | | | | | | | | |
| Country | 2019 |
| | 2018 |
| | 2017 |
|
| Bulgaria | $ | 109 |
| | $ | 109 |
| | $ | 104 |
|
| Czech Republic | 340 |
| | 325 |
| | 315 |
|
| Romania* | 241 |
| | 241 |
| | 232 |
|
| Slovak Republic | 157 |
| | 147 |
| | 142 |
|
| Slovenia | 69 |
| | 67 |
| | 68 |
|
| Total CME Markets | $ | 916 |
| | $ | 889 |
| | $ | 861 |
|
| Growth rate | 3 | % | | 3 | % | | 6 | % |
* Romania market excludes Moldova.
Source: CME estimates, using the 2019 average exchange rate for all periods presented above.
On a constant currency basis, we continue to operate.
Over the long-term, we believe that the convergence of GDP per capitaestimate television advertising spending overall in our markets with that of the developed markets will continue as economic conditions improve and sustained periods of higher growth continue. The higher rates of economic growthincreased an estimated 3% in 2019 compared to the developed markets should resultprevious year. In Bulgaria, the market was estimated to be broadly flat as an increase in GRPs sold offset a decline in average market prices, even higher rates ofthough our average prices increased. Market growth in advertisingthe Czech Republic, the Slovak Republic and Slovenia all resulted from higher average prices that more than offset lower demand for GRPs. The market in the Slovak Republic also benefited from higher sponsorship. In Romania, the market was broadly flat as average market prices increased, but this was more than offset by selling fewer GRPs as there was less inventory available to sell. It also reflected reduced spending which is driven by a numberadvertisers, primarily in the first quarter of factors:
Per capita nominal GDP at purchasing power parity2019, who were directly impacted by new incremental taxes imposed early in our markets remains approximately half that2019 on certain sectors of the developed markets;
Total advertising spend per capita remains around 10%economy, including telecommunications and banking. Even though spending from these clients recovered during the course of levels2019, overall spending from the affected sectors was lower than in the developed markets;
The ratio of total advertising spend per capita to nominal GDP per capita, also known as advertising intensity, was approximately a third that of the developed markets in 2017; and2018.
In the markets in whichshort-term, we operate, basic products such as food, beverages and household cleaning supplies comprise the main source of advertising revenues, whereas in the developed markets, the marketing of premium products, including finance, automotive, entertainment and travel products, makes up the majority of current television advertising spending.
Since television was commercialized in our markets at the same time as other forms of media, television advertising generally accounts for a higher proportion of total advertising spend than in the developed markets, where newspapers, magazines and radio were established as advertising media well before the advent of television. And contrary to trends in developed markets, television advertising spend as a percentage of total advertising spend has grown in our markets during recent years.
We believe that television advertising will continue to hold its share of total advertising spend in our markets because of its greater reach and effective measurement, which makes this medium more appealing to advertisers. TelevisionWe believe television is especially attractive to advertisers because it delivers high reach at lowlower cost compared tothan other forms of media. More recently, internet advertising has grown at the expense of print and outdoor advertising, and we offer additional advertising opportunities when clients seek to complement their television campaigns with campaigns online. While spending for digital advertising is expected to overtakehas overtaken spending on television in the near-term in themore developed markets, this is not the case in our markets and we believe the strength of television as an advertising medium in our markets will continue for the foreseeable future.
There is increased competition for audience share in all our markets. The following table sets outproduction of original local content remains a key pillar of our estimatesstrategy, as it is an important factor in attracting large audiences to both television as well as other non-linear sources of entertainment. While subscription video-on-demand ("SVOD") platforms do not compete with television for spending on advertising, spending netthey do compete in terms of discounts by country (in US$ millions) for the years set forth below:
|
| | | | | | | | | | | |
| Country | 2017 |
| | 2016 |
| | 2015 |
|
| Bulgaria | $ | 105 |
| | $ | 101 |
| | $ | 97 |
|
| Czech Republic | 313 |
| | 303 |
| | 292 |
|
| Romania* | 245 |
| | 218 |
| | 193 |
|
| Slovak Republic | 144 |
| | 138 |
| | 128 |
|
| Total CME Markets | $ | 807 |
| | $ | 760 |
| | $ | 710 |
|
| Growth rate | 6 | % | | 7 | % | | 7 | % |
*amount of time that viewers spend consuming content, which can negatively impact our ratings. Netflix launched an English-language platform across Central and Eastern Europe in early 2016, primarily with foreign titles in its library. The service was offered with a user interface in local language in Romania market excludes Moldova.
Source: CME estimates, usingin the middle of 2017, average exchange rate for all periods presented above.
On a constant currency basis, we estimate television advertising spendingalong with Romanian subtitles and dubbing of content. In the fourth quarter of 2019 it similarly introduced local language in our markets increased by 6%its user interface in 2017 compared to the previous year. In Bulgaria, the market increased 4% as we estimate all broadcasters increased their average prices, while overall GRPs sold were flat. In the Czech Republic, market growth of 4% was driven by higher average prices. In Romania, the market grew 12% because the increase in demand for advertising that started in 2016which is also led to significant increases in average prices in 2017. In the Slovak Republic, the market grew 4% due to higher average prices while inventory sold in 2017 was flat compared to last year following the end of spending on informational and political campaigns that took place during the first half of 2016. If this spending on informational and political campaigns is excluded, we estimate the market grew 9%available in the Slovak Republic, and expanded its offering to include significantly more local content. We have not yet seen an appreciable impact on viewer behavior resulting from this; however, if this trend of SVOD platforms in 2017.local language with local content spreads further and viewership habits change over the medium-term, this could reduce the amount of television advertising inventory we have to sell.
Segment Performance
| | | | NET REVENUES | NET REVENUES |
| | For The Year Ended December 31, (US$ 000's) | For The Year Ended December 31, (US$ 000's) |
| | | | | | Movement | | | | | | Movement | | | | | Movement | | | | | | Movement |
| | 2017 |
| | 2016 |
| | % Act |
| | % Lfl |
| | 2016 |
| | 2015 |
| | % Act |
| | % Lfl |
| 2019 |
| | 2018 |
| | % Act |
| | % Lfl |
| | 2018 |
| | 2017 |
| | % Act |
| | % Lfl |
|
| Bulgaria | $ | 77,341 |
| | $ | 72,651 |
| | 6.5 | % | | 3.7 | % | | $ | 72,651 |
| | $ | 73,090 |
| | (0.6 | )% | | (0.3 | )% | $ | 83,406 |
| | $ | 84,593 |
| | (1.4 | )% | | 3.9 | % | | $ | 84,593 |
| | $ | 77,341 |
| | 9.4 | % | | 5.3 | % |
| Czech Republic | 209,041 |
| | 190,372 |
| | 9.8 | % | | 3.5 | % | | 190,372 |
| | 182,636 |
| | 4.2 | % | | 3.5 | % | 237,320 |
| | 233,991 |
| | 1.4 | % | | 6.8 | % | | 233,991 |
| | 209,041 |
| | 11.9 | % | | 5.6 | % |
| Romania | 191,244 |
| | 172,951 |
| | 10.6 | % | | 9.5 | % | | 172,951 |
| | 157,578 |
| | 9.8 | % | | 11.3 | % | 188,251 |
| | 201,505 |
| | (6.6 | )% | | 0.3 | % | | 201,505 |
| | 191,244 |
| | 5.4 | % | | 3.2 | % |
| Slovak Republic | 97,721 |
| | 90,549 |
| | 7.9 | % | | 4.7 | % | | 90,549 |
| | 84,434 |
| | 7.2 | % | | 7.5 | % | 108,003 |
| | 106,834 |
| | 1.1 | % | | 6.4 | % | | 106,834 |
| | 97,721 |
| | 9.3 | % | | 5.5 | % |
| Slovenia | | 80,809 |
| | 79,587 |
| | 1.5 | % | | 6.9 | % | | 79,587 |
| | 68,696 |
| | 15.9 | % | | 12.0 | % |
| Intersegment revenues | (1,135 | ) | | (349 | ) | | NM (1) |
| | NM (1) |
| | (349 | ) | | (1,543 | ) | | NM (1) |
| | NM (1) |
| (2,985 | ) | | (2,604 | ) | | NM (1) |
| | NM (1) |
| | (2,604 | ) | | (1,175 | ) | | NM (1) |
| | NM (1) |
|
| Total Net Revenues | $ | 574,212 |
| | $ | 526,174 |
| | 9.1 | % | | 5.5 | % | | $ | 526,174 |
| | $ | 496,195 |
| | 6.0 | % | | 6.3 | % | $ | 694,804 |
| | $ | 703,906 |
| | (1.3 | )% | | 4.5 | % | | $ | 703,906 |
| | $ | 642,868 |
| | 9.5 | % | | 5.3 | % |
(1) Number is not meaningful.
| | | | OIBDA | OIBDA |
| | For The Year Ended December 31, (US$ 000's) | For The Year Ended December 31, (US$ 000's) |
| | | | | | Movement | | | | | | Movement | | | | | Movement | | | | | | Movement |
| | 2017 |
| | 2016 |
| | % Act |
| | % Lfl |
| | 2016 |
| | 2015 |
| | % Act |
| | % Lfl |
| 2019 |
| | 2018 |
| | % Act |
| | % Lfl |
| | 2018 |
| | 2017 |
| | % Act |
| | % Lfl |
|
| Bulgaria | $ | 16,841 |
| | $ | 12,242 |
| | 37.6 | % | | 34.9 | % | | $ | 12,242 |
| | $ | 15,479 |
| | (20.9 | )% | | (20.7 | )% | $ | 25,720 |
| | $ | 21,620 |
| | 19.0 | % | | 24.3 | % | | $ | 21,620 |
| | $ | 16,241 |
| | 33.1 | % | | 33.0 | % |
| Czech Republic | 83,600 |
| | 77,018 |
| | 8.5 | % | | 1.3 | % | | 77,018 |
| | 71,697 |
| | 7.4 | % | | 6.2 | % | 101,617 |
| | 94,576 |
| | 7.4 | % | | 12.8 | % | | 94,576 |
| | 82,652 |
| | 14.4 | % | | 9.2 | % |
| Romania | 74,435 |
| | 62,016 |
| | 20.0 | % | | 19.7 | % | | 62,016 |
| | 41,176 |
| | 50.6 | % | | 51.7 | % | 87,727 |
| | 85,737 |
| | 2.3 | % | | 9.8 | % | | 85,737 |
| | 73,418 |
| | 16.8 | % | | 14.0 | % |
| Slovak Republic | 24,742 |
| | 15,947 |
| | 55.2 | % | | 47.4 | % | | 15,947 |
| | 10,585 |
| | 50.7 | % | | 47.8 | % | 35,350 |
| | 27,941 |
| | 26.5 | % | | 31.5 | % | | 27,941 |
| | 23,845 |
| | 17.2 | % | | 16.2 | % |
| Slovenia | | 26,395 |
| | 22,516 |
| | 17.2 | % | | 22.9 | % | | 22,516 |
| | 14,263 |
| | 57.9 | % | | 57.9 | % |
| Eliminations | (8 | ) | | 5 |
| | NM (1) |
| | NM (1) |
| | 5 |
| | 26 |
| | NM (1) |
| | NM (1) |
| 15 |
| | 34 |
| | NM (1) |
| | NM (1) |
| | 34 |
| | (3 | ) | | NM (1) |
| | NM (1) |
|
| Total operating segments | 199,610 |
| | 167,228 |
|
| 19.4 | % |
| 14.9 | % |
| 167,228 |
|
| 138,963 |
|
| 20.3 | % |
| 19.8 | % | 276,824 |
| | 252,424 |
|
| 9.7 | % |
| 15.8 | % |
| 252,424 |
|
| 210,416 |
|
| 20.0 | % |
| 16.7 | % |
| Corporate | (34,078 | ) | | (30,320 | ) | | (12.4 | )% | | (7.5 | )% | | (30,320 | ) | | (29,521 | ) | | (2.7 | )% | | (2.7 | )% | (28,900 | ) | | (29,750 | ) | | 2.9 | % | | (2.4 | )% | | (29,750 | ) | | (30,649 | ) | | 2.9 | % | | 7.8 | % |
| Total OIBDA | $ | 165,532 |
| | $ | 136,908 |
| | 20.9 | % | | 16.5 | % | | $ | 136,908 |
| | $ | 109,442 |
| | 25.1 | % | | 24.4 | % | $ | 247,924 |
| | $ | 222,674 |
| | 11.3 | % | | 17.6 | % | | $ | 222,674 |
| | $ | 179,767 |
| | 23.9 | % | | 20.9 | % |
(1) Number is not meaningful.
Bulgaria
| | | | For the Year Ended December 31, (US$ 000's) | For the Year Ended December 31, (US$ 000's) |
| | | | | | Movement | | | | | | Movement | | | | | Movement | | | | | | Movement |
| | 2017 |
| | 2016 |
| | % Act |
| | % Lfl |
| | 2016 |
| | 2015 |
| | % Act |
| | % Lfl |
| 2019 |
| | 2018 |
| | % Act |
| | % Lfl |
| | 2018 |
| | 2017 |
| | % Act |
| | % Lfl |
|
| Television advertising | $ | 53,446 |
| | $ | 49,111 |
| | 8.8 | % | | 6.0 | % | | $ | 49,111 |
| | $ | 50,717 |
| | (3.2 | )% | | (3.0 | )% | $ | 56,276 |
| | $ | 58,350 |
| | (3.6 | )% | | 1.6 | % | | $ | 58,350 |
| | $ | 53,446 |
| | 9.2 | % | | 5.4 | % |
| Carriage fees and subscriptions | 19,462 |
| | 18,703 |
| | 4.1 | % | | 1.5 | % | | 18,703 |
| | 17,853 |
| | 4.8 | % | | 5.3 | % | 21,404 |
| | 20,989 |
| | 2.0 | % | | 7.5 | % | | 20,989 |
| | 19,462 |
| | 7.8 | % | | 3.1 | % |
| Other | 4,433 |
| | 4,837 |
| | (8.4 | )% | | (10.8 | )% | | 4,837 |
| | 4,520 |
| | 7.0 | % | | 7.2 | % | 5,726 |
| | 5,254 |
| | 9.0 | % | | 14.5 | % | | 5,254 |
| | 4,433 |
| | 18.5 | % | | 13.8 | % |
| Net revenues | 77,341 |
| | 72,651 |
| | 6.5 | % | | 3.7 | % | | 72,651 |
| | 73,090 |
| | (0.6 | )% | | (0.3 | )% | 83,406 |
| | 84,593 |
| | (1.4 | )% | | 3.9 | % | | 84,593 |
| | 77,341 |
| | 9.4 | % | | 5.3 | % |
| Costs charged in arriving at OIBDA | 60,500 |
| | 60,409 |
| | 0.2 | % | | (2.6 | )% | | 60,409 |
| | 57,611 |
| | 4.9 | % | | 5.1 | % | 57,686 |
| | 62,973 |
| | (8.4 | )% | | (3.3 | )% | | 62,973 |
| | 61,100 |
| | 3.1 | % | | (1.7 | )% |
| OIBDA | $ | 16,841 |
| | $ | 12,242 |
| | 37.6 | % | | 34.9 | % | | $ | 12,242 |
| | $ | 15,479 |
| | (20.9 | )% | | (20.7 | )% | $ | 25,720 |
| | $ | 21,620 |
| | 19.0 | % | | 24.3 | % | | $ | 21,620 |
| | $ | 16,241 |
| | 33.1 | % | | 33.0 | % |
| | | | | | | | | | | | | | | | | | | | | | | | | | | | | | | |
| OIBDA margin | 21.8 | % | | 16.9 | % | | 4.9 p.p. |
| | 5.1 p.p. |
| | 16.9 | % | | 21.2 | % | | (4.3) p.p. |
| | (4.3) p.p. |
| 30.8 | % | | 25.6 | % | | 5.2 p.p. |
| | 5.0 p.p. |
| | 25.6 | % | | 21.0 | % | | 4.6 p.p. |
| | 5.4 p.p. |
|
The television advertising market in Bulgaria increased anwas estimated 4%to be broadly flat at constant rates in 2017 compared to 2016.2019, after having increased an estimated 5% in 2018.
Our television advertising revenues increased at constant rates in 2017 compared to 2016 due to higher2019, as an increase in our average prices for the year.more than offset selling fewer GRPs. Carriage fees and subscription revenues increased slightlyprimarily due to price inflation in existing contracts, as well as a slight increase in the overall number of subscribers.
In 2018, our television advertising revenues increased at constant rates due to continued effortsselling more GRPs at higher average prices, as significant growth in private consumption encouraged advertisers to secure new contracts with cable, satellite and IPTV operators with improved pricing. The decrease in other revenues related to lower spending placed with the radio business.
Television advertising revenues declined slightly in 2016 compared to 2015 asincrease their spending. There was also an increase in the volume of GRPs sold was more than offset by lower average prices, which were negatively impacted due to significant discounting by the competition seeking market share.revenue from sponsorship and product placement. Carriage fees and subscription revenues increased becausein 2018 due to an increase in the number of cable, satellite and IPTV subscribers grew during the course of the yearaverage cost per subscriber.
On a constant currency basis, costs charged in arriving at OIBDA decreased in 2019 due to lower bad debt charges and a distribution agreement was renewed at higher prices duringdecrease in content costs. We generated savings in local production from replacing last year's successful locally produced telenovela with entertainment formats, and also implemented a reduction in the third quartervolume of 2016.sports rights in our schedule.
Costs charged in arriving at OIBDA decreased at constant rates in 2017 compared2018 due to 2016 due primarilylower bad debt charges as well as decreases in professional fees and personnel costs. These were partially offset by an increase in content costs related to a significant bad debt chargenew telenovela on our main channel in the comparative period. Content costs were flat, as higher spending on popular programming was offset by savingsaccess-prime time slot in sports rights.
On a constant currency basis, costs increased at constant rates in 2016 compared to 2015 due primarily to a US$ 3.4 million bad debt charge related to our decision to cease cooperation with one agency duringboth the fourth quarter of 2016spring and instead started working directly with the clients that agency represented. Content costs decreased, which was driven by savings in foreign acquired programming that more than offset a slight increase in sports rights.fall seasons.
Czech Republic
| | | | For the Year Ended December 31, (US$ 000's) | For the Year Ended December 31, (US$ 000's) |
| | | | | | Movement | | | | | | Movement | | | | | Movement | | | | | | Movement |
| | 2017 |
| | 2016 |
| | % Act |
| | % Lfl |
| | 2016 |
| | 2015 |
| | % Act |
| | % Lfl |
| 2019 |
| | 2018 |
| | % Act |
| | % Lfl |
| | 2018 |
| | 2017 |
| | % Act |
| | % Lfl |
|
| Television advertising | $ | 188,373 |
| | $ | 172,392 |
| | 9.3 | % | | 3.0 | % | | $ | 172,392 |
| | $ | 166,158 |
| | 3.8 | % | | 3.0 | % | $ | 206,335 |
| | $ | 206,203 |
| | 0.1 | % | | 5.4 | % | | $ | 206,203 |
| | $ | 188,373 |
| | 9.5 | % | | 3.3 | % |
| Carriage fees and subscriptions | 12,141 |
| | 10,325 |
| | 17.6 | % | | 11.6 | % | | 10,325 |
| | 7,176 |
| | 43.9 | % | | 43.0 | % | 17,580 |
| | 15,962 |
| | 10.1 | % | | 16.2 | % | | 15,962 |
| | 12,141 |
| | 31.5 | % | | 23.0 | % |
| Other | 8,527 |
| | 7,655 |
| | 11.4 | % | | 3.1 | % | | 7,655 |
| | 9,302 |
| | (17.7 | )% | | (18.1 | )% | 13,405 |
| | 11,826 |
| | 13.4 | % | | 18.8 | % | | 11,826 |
| | 8,527 |
| | 38.7 | % | | 31.7 | % |
| Net revenues | 209,041 |
| | 190,372 |
| | 9.8 | % | | 3.5 | % | | 190,372 |
| | 182,636 |
| | 4.2 | % | | 3.5 | % | 237,320 |
| | 233,991 |
| | 1.4 | % | | 6.8 | % | | 233,991 |
| | 209,041 |
| | 11.9 | % | | 5.6 | % |
| Costs charged in arriving at OIBDA | 125,441 |
| | 113,354 |
| | 10.7 | % | | 5.0 | % | | 113,354 |
| | 110,939 |
| | 2.2 | % | | 1.7 | % | 135,703 |
| | 139,415 |
| | (2.7 | )% | | 2.7 | % | | 139,415 |
| | 126,389 |
| | 10.3 | % | | 3.3 | % |
| OIBDA | $ | 83,600 |
| | $ | 77,018 |
| | 8.5 | % | | 1.3 | % | | $ | 77,018 |
| | $ | 71,697 |
| | 7.4 | % | | 6.2 | % | $ | 101,617 |
| | $ | 94,576 |
| | 7.4 | % | | 12.8 | % | | $ | 94,576 |
| | $ | 82,652 |
| | 14.4 | % | | 9.2 | % |
| | | | | | | | | | | | | | | | | | | | | | | | | | | | | | | |
| OIBDA margin | 40.0 | % | | 40.5 | % | | (0.5) p.p. |
| | (0.9) p.p. |
| | 40.5 | % | | 39.3 | % | | 1.2 p.p. |
| | 1.1 p.p. |
| 42.8 | % | | 40.4 | % | | 2.4 p.p. |
| | 2.3 p.p. |
| | 40.4 | % | | 39.5 | % | | 0.9 p.p. |
| | 1.3 p.p. |
|
The television advertising market in the Czech Republic increased an estimated 4%5% at constant rates in 2017 compared to 2016.2019, after having grown an estimated 3% in 2018.
Our television advertising revenues increased at constant rates in 2017 compared2019 due to 2016 due tosignificantly higher average prices, which more than offset a slight decrease in GRPs sold.selling fewer GRPs. Carriage fees and subscription revenues increased on a constant currency basis due primarily to additionalprice increases in existing contracts for Nova International that became effective lateas well as an increase in 2016.the number of subscribers.
In 2016, advertisers bought more GRPs compared to 2015 resulting in higher2018, our television advertising revenues however our average priceincreased at constant rates from selling more GRPs, reflecting overall increased demand for advertising was lowerin the market, particularly due to significant discounting bymore spending being placed when list prices are lower outside the competition to sell incremental inventory provided by channels they launched late in 2015.peak seasons of spring and fall. Carriage fees and subscription revenues increased due to high definition versionsan increase in the number of our channels that were available exclusively on cable and satellite platforms for the entire year,subscribers as well as the contribution from launching NOVA SPORT 2 in late 2015 and NOVA INTERNATIONAL in early 2016.contracts with higher prices.
Costs charged in arriving at OIBDA increased at constant rates in 20172019 due to increased on a constant currency basis compared to 2016 due primarily to an increase in contentstaff-related costs, as higher quality productionslicensing costs, and additional local fictionmarketing activities in the schedule this year comparedfirst quarter to 2016 was partially offset by less expensive acquired content as well as lower transmission and consultancy costs.celebrate the 25th anniversary of TV Nova broadcasting in the Czech Republic.
On a constant currency basis, costs increased slightlycharged in 2016 on a constant currency basis compared to 2015arriving at OIBDA in 2018 increased due to investments in additional local content during the spring and fall seasons on the main channel, with more episodes of returning series as well as an increase in content costs. Additional spending to introduce several entertainment formatsadditional local title in the program grid during 2016 was mostly offset by savings in local fiction, foreign acquired programming,fall season. There were also higher salary and other non-programmingstaff costs.
Romania
| | | | For the Year Ended December 31, (US$ 000's) | For the Year Ended December 31, (US$ 000's) |
| | | | | | Movement | | | | | | Movement | | | | | Movement | | | | | | Movement |
| | 2017 |
| | 2016 |
| | % Act |
| | % Lfl |
| | 2016 |
| | 2015 |
| | % Act |
| | % Lfl |
| 2019 |
| | 2018 |
| | % Act |
| | % Lfl |
| | 2018 |
| | 2017 |
| | % Act |
| | % Lfl |
|
| Television advertising | $ | 143,693 |
| | $ | 128,814 |
| | 11.6 | % | | 10.3 | % | | $ | 128,814 |
| | $ | 113,460 |
| | 13.5 | % | | 14.9 | % | $ | 139,300 |
| | $ | 150,084 |
| | (7.2 | )% | | (0.4 | )% | | $ | 150,084 |
| | $ | 143,693 |
| | 4.4 | % | | 2.4 | % |
| Carriage fees and subscriptions | 44,032 |
| | 40,202 |
| | 9.5 | % | | 8.8 | % | | 40,202 |
| | 40,292 |
| | (0.2 | )% | | 1.5 | % | 44,243 |
| | 46,704 |
| | (5.3 | )% | | 1.8 | % | | 46,704 |
| | 44,032 |
| | 6.1 | % | | 3.4 | % |
| Other | 3,519 |
| | 3,935 |
| | (10.6 | )% | | (12.0 | )% | | 3,935 |
| | 3,826 |
| | 2.8 | % | | 4.2 | % | 4,708 |
| | 4,717 |
| | (0.2 | )% | | 6.5 | % | | 4,717 |
| | 3,519 |
| | 34.0 | % | | 30.8 | % |
| Net revenues | 191,244 |
| | 172,951 |
| | 10.6 | % | | 9.5 | % | | 172,951 |
| | 157,578 |
| | 9.8 | % | | 11.3 | % | 188,251 |
| | 201,505 |
| | (6.6 | )% | | 0.3 | % | | 201,505 |
| | 191,244 |
| | 5.4 | % | | 3.2 | % |
| Costs charged in arriving at OIBDA | 116,809 |
| | 110,935 |
| | 5.3 | % | | 3.8 | % | | 110,935 |
| | 116,402 |
| | (4.7 | )% | | (3.2 | )% | 100,524 |
| | 115,768 |
| | (13.2 | )% | | (6.7 | )% | | 115,768 |
| | 117,826 |
| | (1.7 | )% | | (3.6 | )% |
| OIBDA | $ | 74,435 |
| | $ | 62,016 |
| | 20.0 | % | | 19.7 | % | | $ | 62,016 |
| | $ | 41,176 |
| | 50.6 | % | | 51.7 | % | $ | 87,727 |
| | $ | 85,737 |
| | 2.3 | % | | 9.8 | % | | $ | 85,737 |
| | $ | 73,418 |
| | 16.8 | % | | 14.0 | % |
| | | | | | | | | | | | | | | | | | | | | | | | | | | | | | | |
| OIBDA margin | 38.9 | % | | 35.9 | % | | 3.0 p.p. |
| | 3.3 p.p. |
| | 35.9 | % | | 26.1 | % | | 9.8 p.p. |
| | 9.6 p.p. |
| 46.6 | % | | 42.5 | % | | 4.1 p.p. |
| | 4.0 p.p. |
| | 42.5 | % | | 38.4 | % | | 4.1 p.p. |
| | 4.0 p.p. |
|
The television advertising market in Romania was estimated to be broadly flat at constant rates 2019, after having increased an estimated 12% at constant rates4% in 2017 compared to 2016.2018.
Our television advertising revenues increasedwere broadly flat at constant rates in 2017 compared to 2016 due to higher prices. The market continued to be largely sold out2019 as a significant increase in 2017, reflecting sustained strong demand for advertising asour average prices was offset by selling fewer GRPs. There was also reduced spending, primarily in the first quarter of 2019, by advertisers who were directly impacted by new incremental taxes imposed early in 2019 on certain sectors of the economy, including telecommunications and banking. Even though spending from these clients invested morerecovered during the course of 2019, overall spending from the affected sectors was lower than in campaigns to improve their competitive positions.2018. Carriage fees and subscription revenues grew on a constant currency basis during 2017 due to an increase in the number of reported subscribers.
In 2016, fiscal stimulus was believed to have improved consumer confidence and spending, which helped increase demand for advertising on television during the course of the year. We fully monetized additional inventory generated by our main channel compared to 2015, which led to a higher sell-out rate in 2016. Contributing to this was the broadcasting of UEFA European Championship matches in the second and third quarters. Since we sold more GRPs at significantly higher prices, our television advertising revenues increased. Carriage fees and subscription revenues grew slightlyincreased on a constant currency basis due to an increase in the average number of cablesubscribers, even though we ceased broadcasting MTV ROMANIA on March 1, 2019.
In 2018, our television advertising revenues increased at constant rates from higher prices, which were partially offset by selling fewer GRPs due to lower ratings. Carriage fees and satellitesubscription revenues increased due to an increase in the number of subscribers.
Costs charged in arriving at OIBDA decreased in 2017 increased at constant rates compared2019 primarily due to 2016. Contenta decrease in content costs increased, as we investedutilized fewer hours and more cost-effective foreign content. We also had decreased costs due to fewer sport rights in the first half of the year since we no longer broadcast UEFA Champions League matches. We also recorded lower bad debt charges stemming from changes in local productions of entertainment formats as well as local fiction, which more than offset savings from sports rights. Non-programming costs also increased, primarily as a result of higher staff costs and professional fees, which more than offset lower transmission costs.VAT legislation.
On a constant currency basis, costs charged in arriving at OIBDA in 2018 decreased at constant rates due to savings in 2016production costs for locally produced formats in the spring season when compared to 2015 as non-programming costs declinedthe schedule in 2017. Costs were also lower due to lower bad debts and professional fees, savings from restructuring efforts,a reversal of a legal accrual and lower transmission costs. This more than offset an increase in content costs as we invested more in the schedule to generate additional inventory, which included the costs associated with broadcasting UEFA European Championship matches.professional fees.
Slovak Republic
| | | | For the Year Ended December 31, (US$ 000's) | For the Year Ended December 31, (US$ 000's) |
| | | | | | Movement | | | | | | Movement | | | | | Movement | | | | | | Movement |
| | 2017 |
| | 2016 |
| | % Act |
| | % Lfl |
| | 2016 |
| | 2015 |
| | % Act |
| | % Lfl |
| 2019 |
| | 2018 |
| | % Act |
| | % Lfl |
| | 2018 |
| | 2017 |
| | % Act |
| | % Lfl |
|
| Television advertising | $ | 85,715 |
| | $ | 84,779 |
| | 1.1 | % | | (1.9 | )% | | $ | 84,779 |
| | $ | 79,135 |
| | 7.1 | % | | 7.4 | % | $ | 94,091 |
| | $ | 94,030 |
| | 0.1 | % | | 5.3 | % | | $ | 94,030 |
| | $ | 85,715 |
| | 9.7 | % | | 6.0 | % |
| Carriage fees and subscriptions | 7,597 |
| | 2,101 |
| | NM (1) |
| | NM (1) |
| | 2,101 |
| | 1,324 |
| | 58.7 | % | | 59.0 | % | 8,923 |
| | 8,550 |
| | 4.4 | % | | 10.1 | % | | 8,550 |
| | 7,597 |
| | 12.5 | % | | 8.1 | % |
| Other | 4,409 |
| | 3,669 |
| | 20.2 | % | | 15.2 | % | | 3,669 |
| | 3,975 |
| | (7.7 | )% | | (7.5 | )% | 4,989 |
| | 4,254 |
| | 17.3 | % | | 23.4 | % | | 4,254 |
| | 4,409 |
| | (3.5 | )% | | (8.5 | )% |
| Net revenues | 97,721 |
| | 90,549 |
| | 7.9 | % | | 4.7 | % | | 90,549 |
| | 84,434 |
| | 7.2 | % | | 7.5 | % | 108,003 |
| | 106,834 |
| | 1.1 | % | | 6.4 | % | | 106,834 |
| | 97,721 |
| | 9.3 | % | | 5.5 | % |
| Costs charged in arriving at OIBDA | 72,979 |
| | 74,602 |
| | (2.2 | )% | | (4.7 | )% | | 74,602 |
| | 73,849 |
| | 1.0 | % | | 1.6 | % | 72,653 |
| | 78,893 |
| | (7.9 | )% | | (2.7 | )% | | 78,893 |
| | 73,876 |
| | 6.8 | % | | 2.2 | % |
| OIBDA | $ | 24,742 |
| | $ | 15,947 |
| | 55.2 | % | | 47.4 | % | | $ | 15,947 |
| | $ | 10,585 |
| | 50.7 | % | | 47.8 | % | $ | 35,350 |
| | $ | 27,941 |
| | 26.5 | % | | 31.5 | % | | $ | 27,941 |
| | $ | 23,845 |
| | 17.2 | % | | 16.2 | % |
| | | | | | | | | | | | | | | | | | | | | | | | | | | | | | | |
| OIBDA margin | 25.3 | % | | 17.6 | % | | 7.7 p.p. |
| | 7.3 p.p. |
| | 17.6 | % | | 12.5 | % | | 5.1 p.p. |
| | 4.8 p.p. |
| 32.7 | % | | 26.2 | % | | 6.5 p.p. |
| | 6.2 p.p. |
| | 26.2 | % | | 24.4 | % | | 1.8 p.p. |
| | 2.4 p.p. |
|
(1) Number is not meaningful.
The television advertising market in the Slovak Republic increased an estimated 4%7% at constant rates in 20172019, after having grown an estimated 4% in 2018.
Our television advertising revenues increased on a constant currency basis in 2019 as an increase in our average prices more than offset selling fewer GRPs. There was also a higher level of sponsorship reflecting additional spending on government informational campaigns. Carriage fees and subscriptions revenue increased in 2019 from higher prices in new contracts in effect from the start of 2019.
In 2018, our television advertising revenues increased on a constant currency basis due to higher average prices, and we regained market share lost in 2017. There was also higher spending on sponsorship compared to 2016.2017, as sell-out rates remained elevated. Following our exit from digital terrestrial transmission of our channels at the beginning of 2017, carriage fees and subscription revenues increased significantly in 2018 as certain contracts were signed in the first half of 2017.
Costs charged in arriving at OIBDA decreased at constant rates in 2019 due to savings from legal and professional fees and lower transmission costs.
On a constant currency basis, costs charged in arriving at OIBDA in 2018 increased due primarily to an increase in legal and professional fees, which were mostly offset by lower personnel costs and transmission fees.
Slovenia
|
| | | | | | | | | | | | | | | | | | | | | | | | | | | |
| | For the Year Ended December 31, (US$ 000's) |
| | | | | | Movement | | | | | | Movement |
| | 2019 |
| | 2018 |
| | % Act |
| | % Lfl |
| | 2018 |
| | 2017 |
| | % Act |
| | % Lfl |
|
| Television advertising | $ | 51,522 |
| | $ | 53,783 |
| | (4.2 | )% | | 0.8 | % | | $ | 53,783 |
| | $ | 52,289 |
| | 2.9 | % | | (0.8 | )% |
| Carriage fees and subscriptions | 25,502 |
| | 21,541 |
| | 18.4 | % | | 24.8 | % | | 21,541 |
| | 12,591 |
| | 71.1 | % | | 66.8 | % |
| Other | 3,785 |
| | 4,263 |
| | (11.2 | )% | | (6.8 | )% | | 4,263 |
| | 3,816 |
| | 11.7 | % | | 8.3 | % |
| Net revenues | 80,809 |
| | 79,587 |
| | 1.5 | % | | 6.9 | % | | 79,587 |
| | 68,696 |
| | 15.9 | % | | 12.0 | % |
| Costs charged in arriving at OIBDA | 54,414 |
| | 57,071 |
| | (4.7 | )% | | 0.5 | % | | 57,071 |
| | 54,433 |
| | 4.8 | % | | 0.5 | % |
| OIBDA | $ | 26,395 |
| | $ | 22,516 |
| | 17.2 | % | | 22.9 | % | | $ | 22,516 |
| | $ | 14,263 |
| | 57.9 | % | | 57.9 | % |
| | | | | | | | | | | | | | | | |
| OIBDA margin | 32.7 | % | | 28.3 | % | | 4.4 p.p. |
| | 4.3 p.p. |
| | 28.3 | % | | 20.8 | % | | 7.5 p.p. |
| | 8.2 p.p. |
|
The television advertising market in Slovenia increased an estimated 3% at constant rates in 2019, after having decreased an estimated 1% in 2018.
Our television advertising revenues increased on a constant currency basis in 2019 as higher average prices were mostly offset by selling fewer GRPs. The lower spending from larger multinationals and telecommunications operators, which we saw in the first half of 2019, reversed in the second half of the year so spending in certain sectors was higher overall than in 2018. Carriage fees and subscription revenues increased due to price inflation in existing agreements as well as growth in subscribers.
In 2018, our television advertising revenues decreased on a constant currency basis during 2017 compareddue to 2016 from selling fewer GRPs, as our audience sharewhich was affectedmostly offset by the lower reach for our channels, which have been distributed exclusively on cable, satellite and IPTV platforms since the start of 2017. Demand for GRPs was also lower in 2017 compared to 2016 due to spending on informational and political campaigns in the first half of 2016 that was not repeated in 2017. If this spending is excluded, our television advertising revenues were flat at constant rates in 2017 as higher prices offset fewer GRPs sold. The change in the way our channels are distributed resulted in a significant increase in carriage fees and subscriptions revenue, as well as a cost reduction from significantly lower transmission costs.
In 2016, television advertising revenues grew compared to 2015 due primarily to higher prices, reflecting strong demand for advertising on television while the market remained largely sold-out. Fewer GRPs were sold in 2016 compared to 2015, which reduced the benefit of the increase in prices. Carriage fees and subscription revenues increased following our exit from DTT, since prices increased and certain contracts took effect in 2016 as we entered into new agreements with a number of carriers and launched MARKIZA INTERNATIONAL during the firstsecond quarter of 2016.2017.
Costs charged in arriving at OIBDA were broadly flat at constant rates in 2017 decreased2019 as savings from fewer hours of local fiction in the fall schedule compared to 2016 due to lower transmission costs, which were partially2018 was offset by an increase in content costs as we made targeted adjustments in the programming line-up since we changed the way our channels are distributed.higher personnel costs.
On a constant currency basis, costs increasedcharged in arriving at OIBDA in 2018 were broadly flat at constant rates as content costs decreased slightly in 2016 compared to 2015 due to increases in various non-programming costs. Content costs were flat year-on-year as investments in local content were offset by savings from foreign acquired programming.fewer sports rights, which was offset primarily by higher personnel costs.
II. Analysis of the Results of Operations and Financial Position
| | | | For The Year Ended December 31, (US$ 000's) | For The Year Ended December 31, (US$ 000's) |
| | | | | | Movement | | | | | | Movement | | | | | Movement | | | | | | Movement |
| | 2017 |
| | 2016 |
| | % Act |
| | % Lfl |
| | 2016 |
| | 2015 |
| | % Act |
| | % Lfl |
| 2019 |
| | 2018 |
| | % Act |
| | % Lfl |
| | 2018 |
| | 2017 |
| | % Act |
| | % Lfl |
|
| Revenue: | | | | | | | | | | | | | | | | | | | | | | | | | | | | | | |
| Television advertising | $ | 471,227 |
| | $ | 435,096 |
| | 8.3 | % | | 4.5 | % | | $ | 435,096 |
| | $ | 409,469 |
| | 6.3 | % | | 6.4 | % | $ | 547,524 |
| | $ | 562,450 |
| | (2.7 | )% | | 3.0 | % | | $ | 562,450 |
| | $ | 523,516 |
| | 7.4 | % | | 3.3 | % |
| Carriage fees and subscriptions | 83,232 |
| | 71,331 |
| | 16.7 | % | | 14.5 | % | | 71,331 |
| | 66,644 |
| | 7.0 | % | | 8.2 | % | 117,652 |
| | 113,746 |
| | 3.4 | % | | 9.9 | % | | 113,746 |
| | 95,823 |
| | 18.7 | % | | 14.5 | % |
| Other revenue | 19,753 |
| | 19,747 |
| | 0.0 | % | | (4.6 | )% | | 19,747 |
| | 20,082 |
| | (1.7 | )% | | (1.5 | )% | 29,628 |
| | 27,710 |
| | 6.9 | % | | 12.4 | % | | 27,710 |
| | 23,529 |
| | 17.8 | % | | 13.1 | % |
| Net Revenues | 574,212 |
| | 526,174 |
| | 9.1 | % | | 5.5 | % | | 526,174 |
| | 496,195 |
| | 6.0 | % | | 6.3 | % | 694,804 |
| | 703,906 |
| | (1.3 | )% | | 4.5 | % | | 703,906 |
| | 642,868 |
| | 9.5 | % | | 5.3 | % |
| Operating expenses: | | | | | | | | | | | | | | | | | | | | | | | | | | | | | | |
| Content costs | 254,061 |
| | 238,063 |
| | 6.7 | % | | 3.8 | % | | 238,063 |
| | 227,510 |
| | 4.6 | % | | 5.2 | % | 284,715 |
| | 309,439 |
| | (8.0 | )% | | (2.4 | )% | | 309,439 |
| | 293,728 |
| | 5.3 | % | | 0.8 | % |
| Other operating costs | 49,864 |
| | 54,949 |
| | (9.3 | )% | | (12.2 | )% | | 54,949 |
| | 55,731 |
| | (1.4 | )% | | (1.1 | )% | 54,826 |
| | 56,731 |
| | (3.4 | )% | | 2.2 | % | | 56,731 |
| | 55,924 |
| | 1.4 | % | | (3.5 | )% |
| Depreciation of property, plant and equipment | 26,991 |
| | 23,106 |
| | 16.8 | % | | 12.5 | % | | 23,106 |
| | 21,327 |
| | 8.3 | % | | 8.5 | % | 33,536 |
| | 32,933 |
| | 1.8 | % | | 7.9 | % | | 32,933 |
| | 31,261 |
| | 5.3 | % | | 0.2 | % |
| Amortization of intangibles | 8,592 |
| | 8,270 |
| | 3.9 | % | | (1.0 | )% | | 8,270 |
| | 12,050 |
| | (31.4 | )% | | (31.4 | )% | 8,457 |
| | 9,002 |
| | (6.1 | )% | | (0.8 | )% | | 9,002 |
| | 8,592 |
| | 4.8 | % | | (2.5 | )% |
| Cost of revenues | 339,508 |
| | 324,388 |
| | 4.7 | % | | 1.6 | % | | 324,388 |
| | 316,618 |
| | 2.5 | % | | 2.9 | % | 381,534 |
| | 408,105 |
| | (6.5 | )% | | (0.9 | )% | | 408,105 |
| | 389,505 |
| | 4.8 | % | | 0.1 | % |
| Selling, general and administrative expenses | 104,755 |
| | 96,254 |
| | 8.8 | % | | 4.1 | % | | 96,254 |
| | 89,816 |
| | 7.2 | % | | 7.3 | % | 125,934 |
| | 118,214 |
| | 6.5 | % | | 12.5 | % | | 118,214 |
| | 113,449 |
| | 4.2 | % | | (0.1 | )% |
| Restructuring costs | — |
| | — |
| | — | % | | — | % | | — |
| | 1,714 |
| | (100.0 | )% | | (100.0 | )% | |
| Operating income | $ | 129,949 |
| | $ | 105,532 |
| | 23.1 | % | | 18.8 | % | | $ | 105,532 |
| | $ | 88,047 |
| | 19.9 | % | | 19.4 | % | $ | 187,336 |
| | $ | 177,587 |
| | 5.5 | % | | 11.4 | % | | $ | 177,587 |
| | $ | 139,914 |
| | 26.9 | % | | 25.1 | % |
Revenue:
Television advertising revenues: On a constant currency basis, television advertising revenues increased by 5%3% in 2017 compared to 2016, whileboth 2019 and 2018, in line with the increase in television advertising spending in our markets is estimated to have increased by 6%. On a constant currency basis, television advertising revenues increased by 6% in 2016 compared to 2015, while television advertising spending in our markets is estimated to have increased by 7%.markets.
Carriage fees and subscriptions: Carriage fees and subscription revenues increased during 2017 compared to 2016, primarily in the Slovak Republic where our channels have been exclusively available on cable, satellite and IPTV platforms since January 2017 and in Romania due to higher subscriber counts. Carriage fees and subscription revenues increased in 2016 compared to 2015,2019, primarily due to the inclusion of high definition versions of certain of our channels in our offering and the launch of additional channels inSlovenia, the Czech Republic. Carriage fees revenues also increased across a number of other segmentsRepublic and Bulgaria due to higher cable, satelliteprices and IPTVincreases in the number of subscribers. Carriage fees and subscription revenues increased in 2018, primarily in Slovenia, the Czech Republic and Romania due to new contracts with higher prices and higher subscriber counts.
Other revenues: Other revenues include primarily internet advertising revenues and revenues generated through the licensing of our own productions. Other revenues decreased during 2017 compared to 2016increased in 2019 due to lower internet and radio advertising andhigher online revenues, primarily in 2016 compared to 2015 primarilythe Czech Republic. Other revenues increased during 2018 due to higher online revenues in the Czech Republic and Romania, partly offset by lower license and sublicense revenues.production services revenue in the Slovak Republic.
See "Segment Performance" above for additional information on trends in revenues.
Operating Expenses:
Content costs: Content costs (including production costs and amortization of programming rights) increased during 2017 compared to 2016decreased in 2019 primarily due to the use of more cost-effective acquired programming and fewer sporting rights in Romania. Content costs increased slightly at constant rates during 2018 primarily due to the inclusion of both more hours of local productionsfiction in our broadcast schedules and higher quality acquired programming. Contentin all segments.
Other operating costs: On a constant currency basis, other operating costs increased in 2016 compared to 2015during 2019 primarily due to including an increased volume of local programminghigher salaries and staff related costs, licenses and rights costs in our broadcast schedules as well as our broadcasting of UEFA European Championship matchesthe Czech Republic and software licenses and related support costs in Romania.
Other operating costs: OtherBulgaria. On a constant currency basis, other operating costs decreased during 2017 compared to 20162018 primarily due to payroll and related cost savings in the Slovak Republic following our decision not to renew our contract for the terrestrial distribution of our channels there. Other operating costs for 2016 were broadlyand Bulgaria and reductions in line with 2015 as cost savings from lower transmission costs in the Slovak Republic, which were partly offset by higher authors’fees for author's rights association charges.in Romania.
Depreciation of property, plant and equipment: Depreciation of property, plant and equipment increased during 2017 compared to 2016 and in 2016 compared to 20152019 due to higher capital expenditures.depreciation of studio facilities and related equipment placed in service during 2018 and 2019 primarily in Romania and Bulgaria, respectively. Depreciation of property, plant and equipment increased in 2018 primarily due to depreciation of machinery and equipment placed in service during 2017.
Amortization of intangibles: On a constant currency basis, total amortization of broadcast licenses and other intangibles decreased slightly during 2017 compared to 2016in 2019 primarily due to certain intangiblesof our customer relationships in Romaniathe Czech Republic becoming fully amortized partly offset by an increase in 2019. On a constant currency basis, total amortization of broadcast licenses and other intangibles decreased during 2018 primarily due to certain of our trademarks in the Czech Republic. Amortization of intangibles decreased in 2016 compared to 2015, primarily due to higher amortization expense in 2015 for certain of our trademarksRepublic and customer relationships in Romania that we determined were no longer indefinite-lived and began amortizing from January 1, 2015 which were subsequently divested with the sale of our Romanian studios in the fourth quarter of 2015. The lower amortization expense also reflects certain intangible assets in Bulgaria which werebecoming fully amortized in the fourth quarter of 2015.2017. For additional information, see Item 8, Note 3, "Goodwill and Intangible Assets".
Selling, general and administrative expenses: Selling, general and administrative expenses increased during 2017 compared to 20162019 primarily due to increased levels of staffcosts related to the strategic review and the resulting proposed Merger as well as higher salaries and staff-related costs in the Slovak Republic and the Czech Republic. The increase was partly offset by a decrease in professional fees particularlyrelated to the promissory notes litigation in the Slovak Republic (see Item 8, Note 21, "Commitments and Contingencies") and the release of bed debt charges in Bulgaria due to the collection of overdue amounts and in Romania offset by decreased bad debt expensedue to changes in Bulgaria. Selling,local VAT legislation.
On a constant currency basis, selling, general and administrative expenses increased in 2016 compared to 2015,decreased slightly during 2018 primarily due to lower bad debt charges in Bulgaria and the reversalrevision of a charge related to certain tax auditslegal provision in Romania due to a change in the third quarter of 2015 and increased bad debt in Bulgaria as we ceased cooperation with one agency during the fourth quarter of 2016 and instead started working directly with the clients that agency represented. These increases wereour estimated exposure, partly offset by lower professional fees, particularly in Romania and in Corporate.
Selling, general and administrative expenses in 2017 include a charge of US$ 4.3 millionhigher charges in respect of non-cash stock-based compensation an increase of US$ 0.9 million compared to 2016 (see Item 8, Note 17, "Stock-based Compensation"). and higher legal fees in the Slovak Republic.
Non-cash stock-based compensation charges for the years ended December 31, 2019, 2018 and 2017 were US$ 2.34.2 million, US$ 7.1 million and US$ 4.4 million, respectively. Stock-based compensation expense recognized during 2018 includes US$ 2.9 million related to the accelerated vesting of RSUs with performance conditions in 2015.accordance with the terms of the corresponding award agreement following the completion of sale of the Company's Croatian operations on July 31, 2018.
Restructuring costs: There were no restructuring charges during 2017 or 2016. The restructuring charges in 2015 relate to the elimination of positions according to our 2015 plan.
Operating income: Operating income increased from 20152017 through 2017 largely2019 due to increased television advertising and carriage fee revenues while maintainingand effective cost control efforts. Our operating margin, which is determined as operating income divided by net revenues, was 22.6%27.0% in 2017,2019, compared to 20.1%25.2% in 20162018 and 17.7%21.8% in 2015.2017.
Other income / expense items for the years ended December 31, 20172019, 20162018 and 2015:2017:
| | | | For The Year Ended December 31, (US$ 000's) | For The Year Ended December 31, (US$ 000's) |
| | 2017 |
| | 2016 |
| | % Act |
| | 2016 |
| | 2015 |
| | % Act |
| 2019 |
| | 2018 |
| | % Act |
| | 2018 |
| | 2017 |
| | % Act |
|
| Interest expense | $ | (70,633 | ) | | $ | (111,389 | ) | | 36.6 | % | | $ | (111,389 | ) | | $ | (151,767 | ) | | 26.6 | % | $ | (30,694 | ) | | $ | (49,106 | ) | | 37.5 | % | | $ | (49,106 | ) | | $ | (83,188 | ) | | 41.0 | % |
| Loss on extinguishment of debt | (101 | ) | | (150,158 | ) | | 99.9 | % | | (150,158 | ) | | — |
| | NM (1) |
| |
| Other non-operating income / (expense), net: | | | | | | | | | | | | | | | | | | | | | | |
| Interest income | 523 |
| | 573 |
| | (8.7 | )% | | 573 |
| | 426 |
| | 34.5 | % | 467 |
| | 725 |
| | (35.6 | )% | | 725 |
| | 536 |
| | 35.3 | % |
| Foreign currency exchange gain / (loss), net | 17,185 |
| | 7,149 |
| | 140.4 | % | | 7,149 |
| | (11,550 | ) | | NM (1) |
| |
| Foreign currency exchange (loss) / gain, net | | (2,376 | ) | | (2,691 | ) | | 11.7 | % | | (2,691 | ) | | 17,761 |
| | NM (1) |
|
| Change in fair value of derivatives | (1,783 | ) | | (10,213 | ) | | 82.5 | % | | (10,213 | ) | | 4,848 |
| | NM (1) |
| (201 | ) | | (1,715 | ) | | 88.3 | % | | (1,715 | ) | | (1,783 | ) | | 3.8 | % |
| Other income / (expense), net | 396 |
| | 417 |
| | (5.0 | )% | | 417 |
| | (17,333 | ) | | NM (1) |
| |
| (Provision) / credit for income taxes | (21,483 | ) | | (6,336 | ) | | NM (1) |
| | (6,336 | ) | | 1,153 |
| | NM (1) |
| |
| Loss from discontinued operations, net of tax | (4,626 | ) | | (16,172 | ) | | 71.4 | % | | (16,172 | ) | | (29,396 | ) | | 45.0 | % | |
| Net loss attributable to noncontrolling interests | 341 |
| | 306 |
| | 11.4 | % | | 306 |
| | 671 |
| | (54.4 | )% | |
| Loss on extinguishment of debt | | (340 | ) | | (415 | ) | | 18.1 | % | | (415 | ) | | (101 | ) | | (310.9 | )% |
| Other income, net | | 242 |
| | 508 |
| | (52.4 | )% | | 508 |
| | 428 |
| | 18.7 | % |
| Provision for income taxes | | (35,226 | ) | | (27,828 | ) | | (26.6 | )% | | (27,828 | ) | | (22,504 | ) | | (23.7 | )% |
| Income / (loss) from discontinued operations, net of tax | | — |
| | 60,548 |
| | NM (1) |
| | 60,548 |
| | (1,636 | ) | | NM (1) |
|
| Net (income) / loss attributable to noncontrolling interests | | (74 | ) | | 79 |
| | (193.7 | )% | | 79 |
| | 341 |
| | (76.8 | )% |
| |
(1) | Number is not meaningful. |
Interest expense: Interest expense decreased in 2017 compared to 20162018 and in 2016 compared to 2015, primarily due to lower amortization of debt discount and issuance costs following the extinguishment of the 2017 PIK Notes and 2017 Term Loan in April 2016 and due to a lower effective interest rate on the replacement facility. Additional reductions to interest expense in 2017 compared to 2016 are due to2019. This reflects the repricing of our Guarantee Fees in March 2017April 2018, the repayment of the 2019 Euro Loan and improvements tothe partial repayment of the 2021 Euro Loan, as well as reduced borrowing costs following reductions in our net leverage (seeratio as defined within the Reimbursement Agreement. See Item 8, Note 5,4, "Long-term Debt and Other Financing Arrangements" and Note 15, "Interest Expense").
Loss on extinguishment of debt: In 2017, we recognized a loss on extinguishment of debt related to our prepayment of EUR 50 million (approximately US$ 59.1 million at August 1, 2017 rates) of the 2018 Euro Term Loan. In 2016, we recognized a loss on extinguishment of debt related to the redemption and discharge of the 2017 PIK Notes, repayment of the 2017 Term Loan and modifications of the 2018 Euro Term Loan and the 2019 Euro Term Loan, which were accounted for in a similar manner as a debt extinguishment.
Interest income: Interest income primarily reflects earnings on our cash balances and was not material.material in any year presented.
Foreign currency exchange (loss) / gain, / (loss), net: We are exposed to fluctuations in foreign exchange rates on the revaluation of monetary assets and liabilities denominated in currencies other than the local functional currency of the relevant subsidiary. This includes third party receivables and payables, as well as certain of our intercompany loans which are not considered to be of a long-term investment nature. Our subsidiaries generally receive funding via loans that are denominated in currencies other than the functional currency of the lender, therefore any change in the relevant exchange rate will require us to recognize a transaction gain or loss on revaluation. Certain of our intercompany loans are classified as long-term in nature, and therefore gains or losses on revaluation of those loans are not recorded through the statement of operations and comprehensive income / loss. See the discussion under "Currency translation adjustment, net" below.
In 2017,2019, we recognized a net gainloss of US$ 17.22.4 million, comprised of transaction gains of US$ 3.50.8 million relating to the revaluation of intercompany loans, transaction gainslosses of approximately US$ 8.80.8 million on our long-term debt and other financing arrangements and transaction gainslosses of US$ 4.92.4 million relating to the revaluation of monetary assets and liabilities denominated in currencies other than the local functional currency of the relevant subsidiary.
In 2016,2018, we recognized a net gainloss of US$ 7.12.7 million, comprised of transaction gainslosses of US$ 38.10.3 million relating to the revaluation of intercompany loans, transaction losses of approximately US$ 28.43.2 million on our long-term debt and other financing arrangements and transaction lossesgains of US$ 2.60.8 million relating to the revaluation of monetary assets and liabilities denominated in currencies other than the local functional currency of the relevant subsidiary.
In 2015,2017, we recognized a net lossgain of US$ 11.617.8 million, comprised of transaction lossesgains of US$ 29.73.5 million relating to the revaluation of intercompany loans, transaction gains of approximately US$ 31.58.8 million on our long-term debt and other financing arrangements and transaction lossesgains of US$ 13.45.5 million relating to the revaluation of monetary assets and liabilities denominated in currencies other than the local functional currency of the relevant subsidiary.
Change in fair value of derivatives: During 2019, we recognized losses as a result of the partial settlement of our interest rate swaps in connection with the repayment of debt. See Item 8, Note 12, "Financial Instruments and Fair Value Measurements".
During 2018, we recognized a loss as a result of the change in the fair value of our interest rate swaps that were not designated as hedging instruments.
During 2017, we recognized losses as a result of the change in fair value of our USD/EUR foreign currency forward contracts entered into on January 31, 2017, May 16, 2017 and July 21, 2017 as well as the interest rate swaps we use as hedging instruments for interest payments on the 20182019 Euro Term Loan. During 2016,
Loss on extinguishment of debt: In 2019, we recognized a net loss primarily duelosses on extinguishment of debt related to a loss on USD/EUR foreign currency forward contracts entered into in connection with the refinancingour partial repayments of the 2017 PIK Notes and 2017 Term2021 Euro Loan. During 2015,In 2018, we recognized a net gain primarily as a resultlosses on extinguishment of a gain on a foreign currency forward contract entered into in connection with the refinancingdebt related to our full repayment of the 2015 Convertible Notes at maturity, which was partly offset by losses on certain other foreign currency forward contracts relating to certain dollar-denominated programming payments made in 2015. See Item 8, Note 14, "Financial Instruments2019 Euro Loan and Fair Value Measurements".partial repayment of the 2021 Euro Loan.
Other income, / (expense), net: Other Our other income / expense, net was not material in 2017 or 2016. Otherany year presented.
Provision for income / expensetaxes: The provision for income taxes during 2019 reflects income tax charges on profits in 2015 was primarily due to the loss on sale of the parent companyeach of our former Romanian studio operation,operating segments and the impact of losses on which did not meetno tax benefit has been received.
The provision for income taxes during 2018 reflects income tax charges on profits in the definitionCzech Republic, Romania and the Slovak Republic and the impact of tax losses on which no tax benefit has been recognized offset by the release of a discontinued operation, and on the loss on sale of an excess facilityvaluation allowance in Bulgaria.Slovenia.
(Provision) / credit for income taxes:The provision for income taxes during 2017 is principally comprised of tax charges on profits in the Czech Republic, Romania and the Slovak Republic.
The provision for income taxes during 2016 reflects tax charges on profits in the Czech Republic and Romania offset by the release of the valuation allowances in Bulgaria and the Slovak Republic.
The credit for income taxes during 2015 reflects the release of a valuation allowance in Romania offset by deferred tax charges on profits in the Czech Republic.
Our operating subsidiaries are subject to income taxes at statutory rates of 10.0%10% in Bulgaria, 16% in Romania, 19% in the Czech Republic and 21.0%Slovenia and 21% in the Slovak Republic (see Item 8, Note 18, "Income Taxes").
Income / (loss) from discontinued operations, net of tax: tax: Income from discontinued operations, net of tax for 2018 is comprised of the gain on sale of our Croatian operations, the results of the Croatian operations through the date of sale and the allocation of interest expense and Guarantee Fees and transaction costs. Loss from discontinued operations, net of tax for 2017 2016 and 2015 is primarily comprised of the operational results of the Croatia and Slovenia segmentssegment including the allocation of interest expense and Guarantee Fees from the 20182019 Euro Term Loan and transaction costs. Additional impact in 2015 is the result of the sale of our Romanian studios, cinema, music, radio and distribution businesses. See Item 8, Note 3, "Discontinued Operations and Assets Held for Sale".
Net (income) / loss attributable to noncontrolling interests:interests: The results attributable to noncontrolling interests relate to the noncontrolling interest share of the comprehensive profits and losses in our Bulgaria operations.
Other comprehensive income / loss:
| | | | For The Year Ended December 31, (US$ 000's) | For The Year Ended December 31, (US$ 000's) |
| | 2017 |
| | 2016 |
| | % Act | | 2016 |
| | 2015 |
| | % Act | 2019 |
| | 2018 |
| | % Act |
| | 2018 |
| | 2017 |
| | % Act |
| Currency translation adjustment, net | $ | 54,368 |
| | $ | 1,649 |
| | NM (1) | | $ | 1,649 |
| | $ | (89,714 | ) | | NM (1) | $ | (6,149 | ) | | $ | (23,050 | ) | | 73.3 | % | | $ | (23,050 | ) | | $ | 54,368 |
| | NM (1) |
| Unrealized gain / (loss) on derivative instruments | 1,269 |
| | (3,031 | ) | | NM (1) | | (3,031 | ) | | (839 | ) | | NM (1) | |
| Unrealized (loss) / gain on derivative instruments | | (3,979 | ) | | (5,800 | ) | | 31.4 | % | | (5,800 | ) | | 1,269 |
| | NM (1) |
| |
(1) | Number is not meaningful. |
Currency translation adjustment, net: The underlying equity value of our investments (which are denominated in the functional currency of the relevant entity) are converted into dollars at each balance sheet date, with any change in value of the underlying assets and liabilities being recorded as a currency translation adjustment to the balance sheet rather than net income / loss. Other comprehensive income / loss due to currency translation adjustment, net comprised the following for the years ended December 31, 2017, 2016 and 2015:
|
| | | | | | | | | | | | | | | | | | | | |
| | For The Year Ended December 31, (US$ 000's) |
| | 2017 |
| | 2016 |
| | % Act |
| | 2016 |
| | 2015 |
| | % Act |
| Foreign exchange gain on intercompany loans | $ | 11,326 |
| | $ | 8,848 |
| | 28.0 | % | | $ | 8,848 |
| | $ | (88,997 | ) | | NM (1) |
| Foreign exchange gain / (loss) on the Series B Preferred Shares | 33,444 |
| | (19,412 | ) | | NM (1) |
| | (19,412 | ) | | — |
| | NM (1) |
| Currency translation adjustment | 9,598 |
| | 12,213 |
| | (21.4 | )% | | 12,213 |
| | (717 | ) | | NM (1) |
| Currency translation adjustment, net | $ | 54,368 |
| | $ | 1,649 |
| | NM (1) |
| | $ | 1,649 |
| | $ | (89,714 | ) | | NM (1) |
| |
(1)
| Number is not meaningful. |
Certain of our intercompany loans are denominated in currencies other than the functional currency of the lender and are considered to be of a long-term investment nature as the repayment of these loans is neither planned nor anticipated for the foreseeable future. The foreign exchange gains(loss) / (losses)gain on the remeasurement of these intercompany loans to the lender's functional currency are treated in the same manner as currency translation adjustments. Other comprehensive income / loss due to currency translation adjustment, net comprised the following for the years ended December 31, 2019, 2018 and 2017:
|
| | | | | | | | | | | | | | | | | | | | |
| | For The Year Ended December 31, (US$ 000's) |
| | 2019 |
| | 2018 |
| | % Act |
| | 2018 |
| | 2017 |
| | % Act |
| Foreign exchange gain / (loss) on intercompany transactions | $ | 2,519 |
| | $ | (1,061 | ) | | NM (1) |
| | $ | (1,061 | ) | | $ | 11,326 |
| | NM (1) |
| Foreign exchange (loss) / gain on the Series B Preferred Shares | (5,129 | ) | | (12,527 | ) | | 59.1 | % | | (12,527 | ) | | 33,444 |
| | NM (1) |
| Currency translation adjustment | (3,539 | ) | | (9,462 | ) | | 62.6 | % | | (9,462 | ) | | 9,598 |
| | NM (1) |
| Currency translation adjustment, net | $ | (6,149 | ) | | $ | (23,050 | ) | | 73.3 | % | | $ | (23,050 | ) | | $ | 54,368 |
| | NM (1) |
| |
(1) | Number is not meaningful. |
The following charts depict the movement of the dollar versus the functional currencies of our operations, based on monthly closing rates, during 2017, 20162019, 2018 and 2015.2017.
Percent Change During the Year Ended December 31, 2019
Percent Change During the Year Ended December 31, 2018
Percent Change During the Year Ended December 31, 2017
Percent Change During the Year Ended December 31, 2016
Percent Change During the Year Ended December 31, 2015
Unrealized gain(loss) / (loss)gain on derivative instruments:instruments: The unrealized gain(loss) / (loss)gain on derivatives is due to the effective portion of changes in the fair value of our interest rate swaps classifieddesignated as cash flow hedges and recognized in accumulated other comprehensive income / loss. See Item 8, Note 14,12, "Financial Instruments and Fair Value Measurements".
Summarized consolidated balance sheets as at December 31, 20172019 and December 31, 2016:2018:
| | | | December 31, 2017 |
| | December 31, 2016 |
| | % Act |
| | % Lfl |
| December 31, 2019 |
| | December 31, 2018 |
| | % Act |
| | % Lfl |
|
| Current assets | $ | 464,774 |
| | $ | 340,420 |
| | 36.5 | % | | 19.2 | % | $ | 349,980 |
| | $ | 374,093 |
| | (6.4 | )% | | (4.2 | )% |
| Non-current assets | 1,163,281 |
| | 1,050,297 |
| | 10.8 | % | | (5.5 | )% | 1,097,882 |
| | 1,114,268 |
| | (1.5 | )% | | 0.1 | % |
| Current liabilities | 188,264 |
| | 171,564 |
| | 9.7 | % | | (4.6 | )% | 156,001 |
| | 139,692 |
| | 11.7 | % | | 14.0 | % |
| Non-current liabilities | 1,180,968 |
| | 1,070,786 |
| | 10.3 | % | | (2.7 | )% | 680,273 |
| | 849,978 |
| | (20.0 | )% | | (18.5 | )% |
| Temporary equity | 264,593 |
| | 254,899 |
| | 3.8 | % | | 3.8 | % | 269,370 |
| | 269,370 |
| | — | % | | — | % |
| CME Ltd. shareholders’ deficit | (5,788 | ) | | (107,804 | ) | | 94.6 | % | | 87.1 | % | |
| CME Ltd. shareholders’ equity | | 341,705 |
| | 229,020 |
| | NM (1) |
| | NM (1) |
|
| Noncontrolling interests in consolidated subsidiaries | 18 |
| | 1,272 |
| | (98.6 | )% | | (95.5 | )% | 513 |
| | 301 |
| | NM (1) |
| | (16.9 | )% |
| |
(1) | Number is not meaningful. |
Note: The analysis below is intended to highlight the key factors that led to the movements from December 31, 2016,2018, excluding the impact of foreign currency translation.
Current assets: Excluding the impact of Current assets held for sale, current assets at December 31, 2017 increased compared to December 31, 2016decreased primarily due to higherthe use of cash and receivables generated fromby our operations and higher prepaid production expenses. The increases are partly offset by decreasedto pay down amounts owed in respect of the 2021 Euro Loan.
Non-current assets: Non-current assets remained in line with 2018, as a reduction in acquired program rights classified as current.
Non-current assets: Excludingand the impact of assets held for sale and foreign currency translation, non-current assets at December 31, 2017 remained broadly in line compared to December 31, 2016, as increases in both acquired and local program rights were offset by amortization of debt issuance costs, amortization of our finite-lived intangible assets andbroadcast license in the utilization of deferred tax assets.
Current liabilities: Excluding the impact of liabilities held for sale and foreign currency translation, current liabilities at December 31, 2017 decreased compared to December 31, 2016, primarily as a result of lower accrued interest (including Guarantee Fees) payable and programming payables. The decreaseCzech Republic was partly offset by increased income taxes payableproduction of local content and production-related accruals.the recognition of operating lease right-of-use assets following the adoption of a new accounting standard.
Current liabilities: Current liabilities increased, primarily due to accruals for the costs related to the proposed Merger and the recognition of operating lease liabilities following the adoption of a new accounting standard.
Non-current liabilities: Excluding the impact of Non-current liabilities held for sale and foreign currency translation, non-current liabilities at December 31, 2017decreased, compared to December 31, 2016, primarily due to the partial repayment of EUR 50.0 million (approximately US$ 59.1 million at August 1, 2017 rates) ofamounts outstanding under the 20182021 Euro Term Loan, which is partly offset by increases in Guarantee Fees for both the 2019 and 2021 Euro Term Loans which we elected to pay in kind (see Item 8, Note 5, "Long-term Debt and Other Financing Arrangements").recognition of operating lease liabilities following the adoption of a new accounting standard.
Temporary equity: Temporary equity at December 31, 20172019 and 20162018 represents the accreted value of the Series B Preferred Shares issued to TW Investor on June 25, 2013.Shares.
CME Ltd. shareholders’ deficit: CME Ltd.equity: The increase in shareholders’ deficit decreased in 2017. This primarilyequity reflects a decrease in accumulated other comprehensive loss due to currency translation adjustments and the net income attributable to CME Ltd. which was partly, partially offset by accretionthe impact of the preferred dividend paidcurrency translation adjustments recognized in kind on our Series B Preferred Shares.accumulated other comprehensive loss.
Noncontrolling interests in consolidated subsidiaries: The noncontrolling interests in consolidated subsidiaries representsrepresent the noncontrolling interest share ofin our Bulgaria operations.
III. Liquidity and Capital Resources
III(a) Summary of Cash Flows
Cash and cash equivalents increaseddecreased by US$ 14.325.4 million during 2017.2019. The change in cash and cash equivalents for the periods presented below is summarized as follows:
| | | | For The Year Ended December 31, (US$ 000's) | For The Year Ended December 31, (US$ 000's) |
| | 2017 |
| | 2016 |
| | 2015 |
| 2019 |
| | 2018 |
| | 2017 |
|
| Net cash generated from continuing operating activities | $ | 95,321 |
| | $ | 59,387 |
| | $ | 79,580 |
| $ | 179,652 |
| | $ | 109,024 |
| | $ | 93,301 |
|
| Net cash used in continuing investing activities | (24,742 | ) | | (22,201 | ) | | (23,563 | ) | (24,375 | ) | | (24,540 | ) | | (27,947 | ) |
| Net cash used in continuing financing activities | (58,154 | ) | | (22,472 | ) | | (28,643 | ) | (178,089 | ) | | (182,362 | ) | | (58,439 | ) |
| Net cash (used in) / provided by discontinued operations | (8,573 | ) | | (32,108 | ) | | 4,753 |
| |
| Net cash provided by / (used in) discontinued operations | | — |
| | 102,566 |
| | (141 | ) |
| Impact of exchange rate fluctuations on cash | 10,445 |
| | (1,120 | ) | | (1,851 | ) | (2,598 | ) | | (1,405 | ) | | 11,020 |
|
| Net increase / (decrease) in cash and cash equivalents | $ | 14,297 |
| | $ | (18,514 | ) | | $ | 30,276 |
| |
| Net (decrease) / increase in cash and cash equivalents | | $ | (25,410 | ) | | $ | 3,283 |
| | $ | 17,794 |
|
Operating Activities
The increases in cash generated from continuing operations during 2019 was due primarily to lower cash payments for acquired programming and production costs and for interest and Guarantee Fees, which were partially offset by higher payments for income taxes.
The increase in cash generated from continuing operations during 2017 as compared to 2016 reflects2018 reflected higher cash collections from revenue growth and a significant decrease in cash paid for interest, and Guarantee Fees which are partly offset by higheran increase in cash paid for programming and taxes. In 2016, we paid accrued interest related to the 2017 PIK Notes and 2017 Term Loan when they were refinanced in April 2016 and we also repaid US$ 5.5 million of accrued Guarantee Fees which were previously paid in kind.
The decrease in cash generated from continuing operations during 2016in-kind as compared to 2015 reflects higher revenue and OIBDA offset by higher cash payments for interest and for Guarantee Fees including Guarantee Fees previouslywell as taxes paid in kind.as a direct result of our improved operating performance.
We paid cash interest (including in respect ofand Guarantee Fees)Fees of US$ 42.326.7 million, US$ 58.171.5 million (including US$ 27.3 million that was previously paid in kind) and US$ 15.055.5 million on our long-term debt and credit facilities in 2019, 2018 and 2017, 2016respectively. The decreases in cash paid for interest and 2015,Guarantee Fees are due to the repricing of our Guarantee Fees, payments on the 2019 Euro Loan and 2021 Euro Loan, and reductions in our net leverage ratio due to improved performance.
We paid cash for taxes of US$ 36.0 million, US$ 28.4 million and US$ 15.1 million in 2019, 2018 and 2017, respectively.
Investing Activities
Net cash used in continuing investing activities consists primarily of capital expenditures for property, plant and equipment.equipment, primarily in the Czech Republic and Bulgaria.
Financing Activities
The net cash used in continuing financing activities in 2019, 2018 and 2017, primarily reflectedreflects principal repayments made on our 2018obligations under the 2019 and 2021 Euro Term Loan.Loans, offset by proceeds from the issuance of warrants in 2018.
Discontinued Operations
The net cash used in continuing financing activities in 2016provided by discontinued operations during 2018 primarily reflected the refinancing of the 2017 PIK Notes and the 2017 Term Loan with the proceeds of the 2021 Euro Term Loan and cash on hand, including payments for transaction fees and to settle a foreign currency forward contract we entered into in connection with the refinancing. We received proceeds of US$ 7.0 million from the exercisesale of common stock warrants.
The net cash used in continuing financing activities in 2015 primarily reflectedour Croatian operations, offset by the repaymentpayment of the amounts outstanding under the 2021 Revolving Credit FacilityGuarantee Fees and the refinancing of the 2015 Convertible Notes withinterest related to the 2019 Euro Term Loan. We also received net proceeds of US$ 8.0 million from a foreign currency forward contract we entered into in connection with the refinancing of the 2015 Convertible Notes.
Discontinued Operations
The net cash used in discontinued operations during 2017 and 2016 primarily reflected the cash flowsresults of our Croatia and SloveniaCroatian operations, including the payment of Guarantee Fees and interest related to the 20182019 Euro Term Loan. The net cash provided by discontinued operations during 2015 primarily reflected proceeds from the divestiture of our non-core businesses in Romania. See Item 8, Note 3, "Discontinued Operations and Assets Held for Sale".
III(b) Sources and Uses of Cash
Our ongoing source of cash is primarily the receipt of payments from advertisers, advertising agencies and distributors of our television channels. WeAs at December 31, 2019, we also havehad available the 2021aggregate principal amount under the 2023 Revolving Credit Facility of US$ 75.0 million (see Item 8, Note 5,4, "Long-term Debt and Other Financing Arrangements"). As at December 31, 2017, the aggregate principal amount available under the 2021 Revolving Credit Facility, which was undrawn, was US$ 115.0 million, which was reduced to US$ 50.0 million on January 1, 2018. Surplus cash, after funding ongoing operations, may be remitted to us, where appropriate, by our subsidiaries in the form of debt interest payments, and capitalprincipal repayments, dividends, and other distributions and loans from our subsidiaries.
Corporate law in the Central and Eastern European countries in which we operate stipulates generally that dividends may be declared by the partners or shareholders out of yearly profits subject to the maintenance of registered capital, required reserves (if applicable) and after the recovery of accumulated losses. The reserve requirement restriction generally provides that before dividends may be distributed, a portion of annual net profits (typically at least 5%) be allocated to a reserve, which reserve is capped at a proportion of the registered capital of a company (ranging from 5% to 20%). There are no third-party restrictions that limit our subsidiaries' ability to transfer amounts to us in the form of loans or advances.
III(c) Contractual Obligations, Commitments and Off-Balance Sheet Arrangements
Our future contractual obligations as at December 31, 20172019 were as follows:
| | | | Payments due by period (US$ 000’s) | Payments due by period (US$ 000’s) |
| | Total |
| | Less than 1 year |
| | 1-3 years |
| | 3-5 years |
| | More than 5 years |
| Total |
| | Less than 1 year |
| | 1-3 years |
| | 3-5 years |
| | More than 5 years |
|
| Long-term debt – principal | $ | 1,085,289 |
| | $ | 240,819 |
| (1) | $ | 282,238 |
| | $ | 562,232 |
| | $ | — |
| $ | 594,431 |
| | $ | — |
| | $ | 67,781 |
| | $ | 526,650 |
| | $ | — |
|
| Long-term debt – interest | 229,723 |
| | 58,699 |
| | 112,411 |
| | 58,613 |
| | — |
| 105,418 |
| | 21,899 |
| | 40,412 |
| | 43,107 |
| | — |
|
| Unconditional purchase obligations | 100,413 |
| | 34,581 |
| | 46,610 |
| | 15,664 |
| | 3,558 |
| 103,506 |
| | 36,932 |
| | 47,993 |
| | 17,129 |
| | 1,452 |
|
| Operating leases | 6,385 |
| | 2,830 |
| | 1,132 |
| | 695 |
| | 1,728 |
| 13,136 |
| | 3,659 |
| | 5,263 |
| | 2,355 |
| | 1,859 |
|
| Capital lease obligations | 9,878 |
| | 3,238 |
| | 5,344 |
| | 1,296 |
| | — |
| |
| Finance lease obligations | | 16,805 |
| | 7,109 |
| | 8,559 |
| | 1,137 |
| | — |
|
| Other long-term obligations | 29,152 |
| | 14,983 |
| | 13,857 |
| | 300 |
| | 12 |
| 30,120 |
| | 12,740 |
| | 11,480 |
| | 5,900 |
| | — |
|
| Total contractual obligations | $ | 1,460,840 |
| | $ | 355,150 |
| | $ | 461,592 |
| | $ | 638,800 |
| | $ | 5,298 |
| $ | 863,416 |
| | $ | 82,339 |
| | $ | 181,488 |
| | $ | 596,278 |
| | $ | 3,311 |
|
| |
(1)
| On February 5, 2018, we entered into an amendment to extend the maturity date of the 2018 Euro Term Loan from November 1, 2018 to May 1, 2019. On February 6, 2018, we paid EUR 50.0 million (approximately US$ 61.6 million at February 6, 2018 rates) of the outstanding principal balance of the 2018 Euro Term Loan (see Item 8, Note 24, "Subsequent Events"). |
Long-Term Debt
For more information on our long-term debt, see Item 8, Note 5,4, "Long-term Debt and Other Financing Arrangements". Interest payable on our long-term debt is calculated using interest rates and exchange rates as at December 31, 20172019. For the purposes of the above table, it is assumed that the Guarantee Fees will be paid in kind at each interest payment date until the maturity dates of the related Euro Term Loan. However, we intend to allocate a portion of excess cash towards paying the Guarantee Fees related to the 2018 Euro Term Loan in cash rather than electing to pay any portion in kind. Amounts paid in kind are included under "Long-term debt - interest".
Unconditional Purchase Obligations
Unconditional purchase obligations primarily comprise future programming commitments. At December 31, 20172019, we had commitments in respect of future programming of US$ 99.1103.5 million. This includes contracts signed with license periods starting after December 31, 20172019.
Operating and Finance Leases
For more information on our operating and finance lease commitments see Item 8, Note 21, "Commitments and Contingencies"11, "Leases".
Other Long-Term Obligations
Other long-term obligations are primarily comprised of digital transmission commitments.
Other
Top Tone Media Holdings Limited has exercised its right to acquire additional equity in CME Bulgaria.Bulgaria B.V. However, the closing of this transaction has not yet occurred because purchaser financing is still pending. If consummated, we would own 90.0% of our Bulgaria broadcast operations. The option strike price is the fair value of the equity in CME Bulgaria, as determined by an independent valuation.
III(d) Cash Outlook
BecauseFor the year ending December 31, 2019, net cash flowsgenerated from operating activities were negative from 2012 to 2014, we relied on equitycontinuing operations and debt financings to ensure adequate funding for our operations. Our cash flow from operating activities has been positive since 2015 and improved further year-on-year in 2017. We expect our unlevered free cash flow were US$ 179.7 million and US$ 188.0 million, respectively, compared to grow inUS$ 109.0 million and US$ 156.0 million for the year ended December 31, 2018 as a result of further improvement in our operating results. Following the refinancing and repricing transactions in 2016 and 2017, our cost of borrowing has continued to decrease. In 2016, there were also non-repeating payments that were made when(see Section I, "Overview"). As at December 31, 2019, we elected to repayhad US$ 36.6 million in cash accrued Guarantee Fees related toand cash equivalents and our nearest debt maturity is November 1, 2021.
In 2019, we repaid US$ 168.9 million of debt exclusively from cash generated by our operations. Following these payments, the 2018 Euro Term Loan that were previously paidprincipal amount of EUR 60.3 million (US$ 67.8 million) is outstanding on our nearest debt maturity in kind and the payment of accrued interest on the 2017 PIK Notes and 2017 Term Loan when they were refinanced. As a result, the total amount ofNovember 2021. We expect cash paid for interest and Guarantee Fees (including payments allocated to discontinued operations) decreased by US$ 31.7 milliondecline in 2017.
We are obliged2020 compared to pay 5.0% of the all-in rate comprising interest and Guarantee Fees related2019 due to the 2018 Euro Term Loan, 2019 Euro Term Loanreduction in our overall indebtedness and 2021 Euro Term Loan in cash and have the option to pay the remainder of any Guarantee Fees in kind. When our net leverage (as defined in the Reimbursement Agreement) falls below 5.0x, oura lower weighted average all-in rate will be 5.0%, which will be payable in cash. As at December 31, 2017, we have repaid in cash all accrued Guarantee Fees related to the 2018 Euro Term Loan that were previously paid in kind and intend to continue to make payments of such Guarantee Fees in cash when due, rather than electing to pay in kind. To maximize our near term cash flow, we may continue to pay a portion of Guarantee Fees related to 2019 Euro Term Loan and 2021Euro Term Loan in kind, where possible.rate.
As at December 31, 2017, we had US$ 54.9 million in cash and cash equivalents. In August 2017, we repaid EUR 50.0 million (approximately US$ 59.1 million at August 1, 2017 rates) of the outstanding principal balance of the 2018 Euro Term Loan with cash on hand. On February 5, 2018, we entered into an amendment to extend the maturity date of the 2018 Euro Term Loan from November 1, 2018 to May 1, 2019. Consequently, our nearest debt maturity is now May 1, 2019. On February 6, 2018, we paid EUR 50.0 million (approximately US$ 61.6 million at February 6, 2018 rates) of the outstanding principal balance of the 2018 Euro Term Loan (see Item 8, Note 24, "Subsequent Events"). We anticipate using excess cash, including free cash flow from the business, expected proceeds from the Divestment Transaction and expected proceeds from warrant exercises, to repay the remaining principal balance of the 2018 Euro Term Loan in full before it matures in May 2019 and start repaying the accrued Guarantee Fees and the Commitment Fee, previously paid in kind, as well as the principal balance related to the 2019 Euro Term Loan. In the event that the Divestment Transaction does not close or we do not receive the expected warrant proceeds, we expect to be able to substantially repay the 2018 Euro Term Loan from cash generated from the business and available liquidity upon maturity. We are also continuing to evaluate possibilities to further deleverage the business and may also seek public or private debt financing transactions to further improve our capital structure.
In addition, while we expect our unlevered free cash flow to grow due to continuousfurther improvement in our operating results, weresults. We anticipate the amounts of cash paid for income taxes willto continue to increase in 20182020 and to further converge with local statutory tax rates as our operating companies in each jurisdiction have returned to generating profits and previous tax losses were utilized.
As at December 31, 2019, the weighted average all-in rate applicable to the Euro Loans and Guarantee Fees was approximately 3.4%. As at December 31, 2019, our net operating losses are utilized.leverage ratio improved to 2.4x from 3.5x at December 31, 2018.
Credit ratings and future debt issuances
Our corporate credit is rated B2B1 by Moody's Investors Service with a positive outlook and B+ by Standard & Poor's, (currently on CreditWatchwatch with developingnegative implications due to the Divestment Transaction).proposed Merger. Our ratings show each agency's opinion of our financial strength, operating performance and ability to meet our debt obligations as they become due.due, as well as the proposed Merger. These ratings take into account the particular emphasis the ratings agencies place on metrics such as leverage ratio and cash flow, which they use as measurements of a company's liquidity and financial strength. They also reflect an emphasis by the ratings agencies on the track record of strong financial support from Time Warner.Warner Media. We may be subject to downgrades if our operating performance deteriorates or we fail to maintain adequate levels of liquidity. In addition, our ratings may be downgraded if the agencies form a view that material support from Time Warner Media is not as strong, or the strategic importance of CME to Time Warner Media is not as significant as it has been in the past.
Credit risk of financial counterparties
We have entered into a number of significant contracts with financial counterparties as follows:
Interest Rate Swap
We are party to interest rate swap agreements to mitigate our exposure to interest rate fluctuations on our Euro Term Loans. These interest rate swaps, certain of which are designated as cash flow hedges, provide the Company with variable-rate cash receipts in exchange for fixed-rate payments over the lives of the agreements, with no exchange of the underlying notional amount.
Foreign Exchange Forwards
We are exposed to movements in the USD to EUR exchange rates related to contractual payments under dollar-denominated agreements. To reduce this exposure, from time to time we may enter into pay-Euro receive-dollar forward foreign exchange contracts. We had no such agreements outstanding at December 31, 2017.2019.
Cash Deposits
We may deposit cash in the global money markets with a range of bank counterparties and review the counterparties we choose regularly. The maximum period of deposit is three months but we have more recently held amounts on deposit for shorter periods, mainly overnight. The credit rating of a bank is a critical factor in determining the size of cash deposits and we will only deposit cash with banks of investment grade rating. In addition, we also closely monitor the credit default swap spreads and other market information for each of the banks with which we consider depositing or have deposited funds.
III(e) Off-Balance Sheet Arrangements
None.
IV. Critical Accounting Policies and Estimates
Our accounting policies affecting our financial condition and results of operations are more fully described in Item 8, Note 2, "Basis of Presentation and Summary of Significant Accounting Policies". The preparation of these financial statements requires us to make judgments in selecting appropriate assumptions for calculating financial estimates, which inherently contain some degree of uncertainty. We base our estimates on historical experience and on various other assumptions that we believe to be reasonable. Using these estimates we make judgments about the carrying amounts of assets and liabilities and the reported amounts of revenues and expenses that are not readily apparent from other sources. Actual results may differ from these estimates under different assumptions or conditions.
We believe the following critical accounting policies affect our more significant judgments and estimates used in the preparation of our consolidated financial statements.
Program Rights
Program rights consist of programming (film and television) acquired from third parties and produced locally, which together form an important component of our station broadcasting schedules. Acquired program rights and the related liabilities are recorded at their gross value when the license period begins and the programs are available for use. Where the initial airing of content allowed by a license is expected to provide more value than subsequent airings, program rights are amortized over their expected useful lives in a manner which reflects the pattern we expect to use and benefit from the programming. These films and series are amortized with the amortization charged in respect of each airing calculated in accordance with a schedule that reflects our estimate of the relative economic value of each run. We review our programming amortization policy when events occur or circumstances change that would so require.
The program library is evaluated at least quarterly to determine if expected revenues are sufficient to cover the unamortized portion of each program. To the extent that the revenues we expect to earn from broadcasting a program are lower than the book value, the program rights are written down to their net realizable value by recording an impairment charge. Accordingly, our estimates of future advertising and other revenues, and our future broadcasting schedules have a significant impact on the value of our program rights on the consolidated balance sheet and the annual programming amortization charge recorded in the consolidated statements of operations and comprehensive income / loss.
Produced Program Rights
We also produce and license a variety of filmed content. The majority of this is television series and movies which are predominantly expected to be utilized by transmission on our broadcast stations. Produced program rights, which include direct costs, production overhead and development costs, are stated at the lower of cost, net of accumulated amortization, or net realizable value.
When we recognize revenue on a title, we also recognize a proportion of the capitalized film costs in the respective statements of operations using the individual film forecast model. The proportion of costs recognized is equal to the proportion of the revenue recognized compared to the total revenue expected to be generated throughout the title's life cycle (the "ultimate revenues").
The process of evaluating a title's ultimate revenues requires management judgment and is inherently subjective. The calculation of ultimate revenue can be a complex one, however, the level of complexity and subjectivity is correlated to the number of revenue streams that management believes will be earned. Our process for evaluating ultimate revenues is tailored to the potential we believe a title has for generating multiple types of revenues. As already mentioned, the majority of our production is intended primarily for exploitation by our own broadcasters and we have few supportable expectations of generating revenue from other sources. In such cases, we consider mainly the free television window in our calculation of the ultimate revenue. Changes in estimates of ultimate revenues from period to period affect the amount of film costs amortized in a given period and, therefore, could have an impact on our results for that period.
When the estimated ultimate revenues, less additional costs to be incurred (including exploitation costs), are less than the carrying amount of the film costs, the value of a film is deemed to be not recoverable and thus, an immediate write-off of unrecoverable film costs is recorded in the consolidated statements of operations and comprehensive income / loss.
Impairment of goodwill, indefinite-lived intangible assets and long-lived assets
We assess the carrying amount of goodwill and other intangible assets with indefinite lives on an annual basis, or more frequently if events or changes in circumstances indicate that such carrying amount may not be recoverable. Other than our annual review, factors we consider important which could trigger an impairment review include: under-performance of reporting units or changes in projected results, changes in the manner of utilization of the asset, a severe and sustained decline in the price of our shares that is not attributable to factors other than the underlying value of our assets, negative market conditions or economic trends or specific events such as new legislation, new market entrants, changes in technology, as well as adverse legal judgments that we believe could have a negative impact on our business. Therefore, our judgment as to the future prospects of each business has a significant impact on our results and financial condition. We believe that our assumptions are appropriate. If future cash flows do not materialize as expected or there is a future adverse change in market conditions, we may be unable to recover the carrying amount of an asset, resulting in future impairment losses.
Impairment tests of our goodwill are performed at the reporting unit level. The fair value of the reporting unit is compared to its carrying value, including goodwill. An impairment loss is recognized for any excess of the carrying amount of the reporting unit over its fair value. If goodwill and another asset or asset group are tested for impairment at the same time, the other assets are tested for impairment before goodwill. If the other asset or asset group is impaired, this impairment loss is recognized prior to goodwill being tested for impairment. Impairment tests of other intangible assets with indefinite lives are performed at the asset level. An impairment loss is recognized for any excess of the carrying amount of the intangible asset over the fair value.
The fair value of each reporting unit is determined using an income methodology estimating projected future cash flows related to each reporting unit. These projected future cash flows are discounted back to the valuation date. Significant assumptions inherent in the methodology used include estimates of discount rates, future revenue growth rates, operating margins and a number of other factors, all of which are based on our assessment of the future prospects and the risks inherent at the respective reporting units. We have identified fourfive reporting units which consist of our fourfive geographic operating segments: Bulgaria, the Czech Republic, Romania, and the Slovak Republic.Republic and Slovenia.
Recoverability of assets to be held and used is measured by a comparison of the carrying amount of an asset to estimated undiscounted future cash flows expected to be generated by the respective asset. The same estimates are also used in planning for our long- and short-range business planning and forecasting. We assess the reasonableness of the inputs and outcomes of our undiscounted cash flow analysis against available comparable market data. If the carrying amount of an asset exceeds its estimated undiscounted future cash flows, an impairment charge is recognized for the amount by which the carrying amount exceeds the fair value of the respective asset.
The table below shows the key measurements involved and the valuation methods applied:
|
| | |
| Measurement | | Valuation Method |
| Recoverability of carrying amounts | | Undiscounted future cash flows |
| Fair value of broadcast licenses | | Build-out method |
| Fair value of indefinite-lived trademarks | | Relief from royalty method |
| Fair value of reporting units | | Discounted cash flow model |
Our estimate of the cash flows our operations will generate in future periods forms the basis for most of the significant assumptions inherent in our impairment reviews. Our expectations of these cash flows are developed during our long- and short-range business planning processes, which are designed to address the uncertainties inherent in the forecasting process by capturing a range of possible views about key trends which govern future cash flow growth.
Each method noted above involves a number of significant assumptions over an extended period of time which could materially change our decision as to whether assets are impaired. The most significant of these assumptions include: the discount rate applied, the total advertising market size, achievable levels of market share, forecast OIBDA and capital expenditure and the rate of growth into perpetuity, each described in more detail below:
Cost of capital: The cost of capital reflects the return a hypothetical market participant would require for a long-term investment in an asset and can be viewed as a proxy for the risk of that asset. We calculate the cost of capital according to the Capital Asset Pricing Model using a number of assumptions, the most significant of which is a Country Risk Premium (“CRP”("CRP"). The CRP reflects the excess risk to an investor of investing in markets other than the United States and generally fluctuates with expectations of changes in a country's macro-economic environment. The costs of capital that we have applied to cash flows for our 20172019 annual impairment test are generally lower than those we had used in the 20162018 impairment test due to a decrease in country specific risk factors.long term yields of US government bonds.
Total advertising market: The size of the television advertising market effectively places an upper limit on the advertising revenue we can expect to earn in each country. Our estimate of the total advertising market is developed from a number of external sources, in combination with a process of on-going consultation with our segment management teams. In our 20172019 annual impairment review, we increased or slightly decreased our medium- and long-term view of the size of most of our individual television advertising markets compared to the estimates used in the 20162018 annual impairment review based on our estimate of the macro-economic outlook of each of our operating markets.
Market share: This is a function of the audience share we expect our stations to generate, and the relative price at which we can sell advertising. Our estimate of the total advertising market is developed from a number of external sources, in combination with a process of on-going consultation with our segment management teams. Our estimates for our market share in our 20172019 annual impairment review decreased fromremained consistent when compared with those in our 20162018 impairment review, however, revenues are expected to increase due to the estimated growth in the total advertising market.review.
Forecast OIBDA: The level of cash flow generated by each operation is ultimately governed by the extent to which we manage the relationship between revenues and costs. We forecast the level of operating costs by reference to (a) the historical absolute and relative levels of costs we have incurred in generating revenue in each reporting unit, (b) the operating strategy of each business and (c) specific forecast costs to be incurred. Our annual impairment review includes assumptions to reflect benefits of cost control measures taken to date and contemplated furtheranticipated future cost control efforts.
Forecast capital expenditure: The size and phasing of capital expenditure, both recurring expenditure to replace retired assets and investments in new projects, has a significant impact on cash flows. We forecast the level of future capital expenditure based on current strategies and specific forecast costs to be incurred. The absolute levels of capital expenditure forecast for our segments have generallyeither increased or decreased since the prior year impairment review due to shifting strategies for the replacement of end of life production equipment.
Growth rate into perpetuity: This reflects the level of economic growth in each of our markets from the final year in our discrete forecast period into perpetuity and is the sum of an estimated real growth rate, which reflects our belief that macro-economic growth in our markets will ultimately converge to Western European markets, and long-term expectations for inflation. Our estimates of these rates are based on observable market data and, in most operating countries, have increasedslightly decreased since the prior year impairment review due to improvedstabilizing economic outlook.outlooks.
Assessing goodwill and indefinite-lived intangible assets for impairment is a complex process that requires significant judgment and involves a great deal of detailed quantitative and qualitative business-specific analysis and many individual assumptions which fluctuate with the passage of time. We have observed over many years a strong positive correlation between the macro-economic performance of our markets and the size of the television advertising market and the cash flows we generate. With this in mind, we have considered macro-economic trends in determining our cash flow forecasts. If our cash flow forecasts for our operations deteriorate, or if costs of capital increase, we may be required to recognize impairment charges in later periods.
Upon conclusion of our 20172019 annual review, we determined that the fair values of our reporting units and indefinite-lived intangible assets were substantially in excess of their respective carrying values. We concluded that the total estimated fair values used for purposes of the test are reasonable by comparing our market capitalization to the results of the discounted cash flow analysis of our reporting units, as adjusted for unallocated corporate assets and liabilities. Upon announcement of the Merger Agreement, we assessed the impact by allocating the Merger Agreement consideration to each reporting unit in proportion to the value determined in the discounted cash flow analysis in the annual review. Under these assumptions, the fair values of our reporting units were substantially in excess of their respective carrying values. The balance of goodwill allocated to each reporting unit is presented in Item 8, Note 4,3, "Goodwill and Intangible Assets".
Revenue Recognition
Net revenues predominantly comprise revenues from the sale of advertising time less discounts and agency commissions, and fees charged to cable and satellite operators for carriage of our channels. Net revenuesRevenues are recognized upon satisfaction of our performance obligations to our customers, in an amount that reflects the consideration to which we expect to be entitled in exchange for those goods or services, net of taxes assessed by a government authority that are both imposed on and concurrent with the specific revenue-producing transaction and collected from the customer.
We defer the recognition of revenues when the advertisement is aired as long as there is persuasive evidence that an arrangement withcash payments are received or due in advance of our performance, including amounts which are refundable. We record a customer exists, the price of the delivered advertising time is fixed or determinable, and collection of the arrangement fee is reasonably assured. In the event that a customer falls significantly behind its contractual payment terms,receivable when revenue is recognized prior to invoicing, or deferred untilrevenue when revenue is recognized subsequent to invoicing. Invoicing typically occurs on a monthly basis and customers are obliged to pay within 30 to 60 days of issuance. For certain services and customer types, we require payment before the customer has resumed normal payment terms.services are provided.
In instances where the timing of revenue recognition differs from the timing of invoicing, we have determined our contracts do not include a significant financing component. The primary purpose of our invoicing terms is to provide customers with simplified and predictable ways of purchasing our products and services, not to receive financing from our customers or to provide customers with financing.
We maintain a bad debt provision for estimated losses resulting from the inability of our customers to make required payments. If the financial condition of our customers were to deteriorate, additional allowances may be required in future periods. We review the accounts receivable balances periodically and our historical bad debt, customer concentrations and customer creditworthiness when evaluating the adequacy of our provision.
In the event we recover amounts previously written off, we release the specific allowance to bad debt expense.
Income Taxes
The provision for income taxes includes local and foreign taxes. Deferred tax assets and liabilities are recognized for the estimated future tax consequences of temporary differences between the financial statement carrying amounts and their respective tax bases. Deferred tax assets and liabilities are measured using enacted tax rates expected to apply to taxable income in the year in which the temporary differences are expected to be recovered or settled. We evaluate the realizability of our deferred tax assets and establish a valuation allowance when it is more likely than not that all or a portion of a deferred tax assetsasset will not be realized.
In evaluating the realizability of our deferred tax assets, we consider all available positive and negative evidence, including future reversals of existing taxable temporary differences, projected future taxable income, tax planning strategies and recent financial operations. Any reduction in estimated forecasted results may require that we record additional valuation allowances against our deferred tax assets. Once a valuation allowance has been established, it will be maintained until there is sufficient positive evidence to conclude that it is more likely than not that such assets will be realized. An ongoing pattern of sustained profitability will generally be considered as sufficient positive evidence. If the allowance is reversed in a future period, our income tax provision will be reduced to the extent of the reversal. Accordingly, the establishment and reversal of valuation allowances has had and could continue to have a significant negative or positive impact on our future earnings.
We measure deferred tax assets and liabilities using enacted tax rates that, if changed, would result in either an increase or decrease in the provision for income taxes in the period of change.change except where the deferred tax assets are covered by a valuation allowance which gives rise to an offsetting adjustment.
From time to time, we engage in transactions, such as business combinations and dispositions, in which the tax consequences may be subject to uncertainty. Significant judgment is required in assessing and estimating the tax consequences of these transactions. We prepare and file tax returns based on the interpretation of tax laws and regulations. In the normal course of business, our tax returns are subject to examination by various taxing authorities. Such examinations may result in future tax and interest assessments by these taxing authorities. We only recognize tax benefits taken on tax returns when we believe they are “more"more likely than not”not" of being sustained upon examination based on their technical merits. There is considerable judgment involved in determining whether positions taken on the tax return are “more"more likely than not”not" of being sustained.
We recognize, when applicable, both accrued interest and penalties related to unrecognized benefits in income tax expense in the accompanying consolidated statements of operations and comprehensive income / loss.
Foreign exchange
Our reporting currency is the dollar but a significant portion of our consolidated revenues and costs are in other currencies, including programming rights expenses and interest on all of our long-term debt. CME Ltd.'s income, expenses and cash flows are primarily denominated in Euro. Our other operations have functional currencies other than the dollar.
We record assets and liabilities denominated in a currency other than our functional currency using the exchange rate prevailing at each balance sheet date, with any change in value between reporting periods being recognized as a transaction gain or loss in our consolidated statements of operations and comprehensive income / loss. We are exposed to foreign currency on the revaluation of monetary assets and liabilities denominated in currencies other than the local functional currency of the relevant subsidiary. This includes third party receivables and payables, as well as certain intercompany loans, which are generally provided in currencies other than the dollar.
Certain of our intercompany loans are considered to be of a long-term investment nature as the repayment of these loans is neither planned nor anticipated for the foreseeable future. For the years ended December 31, 2017, 20162019, 2018 and 2015,2017, we recorded gainsa gain of US$ 11.32.5 million, and US$ 8.8 million and a loss of US$ 89.01.1 million and a gain of US$ 11.3 million, respectively, on the retranslation of these intercompany loans as an adjustment to accumulated other comprehensive income / loss, a component of shareholders' equity.
The financial statements of our operations are translated to dollars at the exchange rates in effect at the balance sheet date for assets and liabilities, and at weighted average rates for the period for revenues and expenses, including gains and losses. Translational gains and losses are charged or credited to accumulated other comprehensive income / loss.
Determination of the functional currency of an entity requires considerable management judgment. This includes our assessment of a series of indicators, such as the currency in which a majority of sales transactions are negotiated, expense incurred or financing secured. If the nature of our business operations changes, such as by changing the currency in which sales transactions are denominated or by incurring significantly more expenditure in a different currency, we may be required to change the functional currency of some of our operations, potentially changing the amounts we report as transaction gains and losses in the consolidated statements of operations and comprehensive income / loss as well as the translational gains and losses charged or credited to accumulated other comprehensive income / loss. In establishing functional currency, specific facts and circumstances are considered carefully, and judgment is exercised as to what types of information might be most useful to investors.
Contingencies
We are, from time to time, involved in certain legal proceedings and, as required, accrue our estimate of the probable costs for the resolution for these claims. These estimates are developed in consultation with legal counsel and are based upon an analysis of potential results, assuming a combination of litigation and settlement strategies. It is possible, however, that future results of operations for any particular period could be materially affected by changes in our assumptions or the effectiveness of our strategies related to these proceedings. See Item 8, Note 21, "Commitments and Contingencies" for more detailed information on our litigation and other contingencies.
Recent Accounting Pronouncements
See Item 8, Note 2, "Basis of Presentation and Summary of Significant Accounting Policies" for a discussion of accounting standards adopted and recently issued accounting standards not yet adopted.
V. Related Party Matters
We consider our related parties to be our officers, directors and shareholders who have direct control and/or influence over the Company as well as other parties that can significantly influence management. As stated in Financial Accounting Standards Board Accounting Standards Codification Topic 850, Related"Related Party Disclosures, Disclosures", transactions involving related parties cannot necessarily be presumed to be carried out on an arm's-length basis, as the requisite conditions of competitive, free-market dealings may not exist. We have entered into related party transactions in all of our markets, mainly for the purchase of program rights. In addition, Time Warner Media guarantees 100% of our outstanding senior indebtedness and is the lender under the 20212023 Revolving Credit Facility. For a detailed discussion of all such transactions, see Item 8, Note 22, "Related Party Transactions" and Part III, Item 13, "Certain Relationships and Related Transactions, and Director Independence".
ITEM 7A. QUANTITATIVE AND QUALITATIVE DISCLOSURES ABOUT MARKET RISK
We engage in activities that expose us to various market risks, including the effect of changes in foreign currency exchange rates and interest rates. We do not engage in speculative transactions, nor do we hold or issue financial instruments for trading purposes. The table below sets forth our market risk sensitive instruments as at the following dates:
December 31, 2017:2019:
| | | Expected Maturity Dates | | 2018 | | 2019 |
| | 2020 |
| | 2021 |
| | 2022 |
| | Thereafter |
| | 2020 |
| | 2021 |
| | 2022 |
| | 2023 | | 2024 |
| | Thereafter |
|
| Long-term Debt (000's): | | | | | | | | | | | | | | | | | | | | | | | | |
| Variable rate (EUR) | | 200,800 |
| (1) | | 235,335 |
| | — |
| | 468,800 |
| | — |
| | — |
| | — |
| | 60,335 |
| | — |
| | 468,800 |
| | — |
| | — |
|
Average interest rate (2)(1) | | 1.50 | % | | 1.50 | % | | — |
| | 1.50 | % | | — |
| | — |
| | — |
| | 1.28 | % | | — |
| | 1.28 | % | | — |
| | — |
|
| | | | | | | | | | | | | | | | | | | | | | | | | |
| Interest Rate Swaps (000's): | | | | | | | | | | | | | | | | | | | | | | | | |
| Variable to fixed (EUR) | | 200,800 |
| | 235,335 |
| | — |
| | 468,800 |
| | — |
| | — |
| | — |
| | 529,135 |
| | — |
| | 468,800 |
| (2) | | — |
| | — |
|
| Average pay rate | | 0.14 | % | | 0.31 | % | | — |
| | 0.28 | % | | — |
| | — |
| | — |
| | 0.30 | % | | — |
| | 0.97 | % | | — |
| | — |
|
| Average receive rate | | — | % | | — | % | | — |
| | — | % | | — |
| | — |
| | — |
| | — | % | | — |
| | — | % | | — |
| | — |
|
| |
(1) | On February 5, 2018, we entered into an amendment to extend the maturity date of the 2018 Euro Term Loan from November 1, 2018 to May 1, 2019. On February 6, 2018, we paid EUR 50.0 million (approximately US$ 61.6 million at February 6, 2018 rates) of the outstanding principal balance of the 2018 Euro Term Loan (see Item 8, Note 24, "Subsequent Events"). |
| |
(2)
| As discussed in Item 8, Note 5,4, "Long-term Debt and Other Financing Arrangements", as consideration for Time Warner'sWarner Media's guarantee of the Euro Term Loans, we pay Guarantee Fees to Time Warner Media based on the amounts outstanding on the Euro Term Loans. As of December 31, 2017,Loans, each calculated such that the all-in borrowing rate on each of the 2021 Euro Term Loans was 6.0% per annum. |
December 31, 2016:
|
| | | | | | | | | | | | | | | | | | | |
| Expected Maturity Dates | | 2017 |
| | 2018 | | 2019 |
| | 2020 |
| | 2021 |
| | Thereafter |
|
| Long-term Debt (000's): | | | | | | | | | | | | |
| Variable rate (EUR) | | — |
| | 250,800 |
| | | 235,335 |
| | — |
| | 468,800 |
| | — |
|
Average interest rate (1) | | — |
| | 1.50 | % | | | 1.50 | % | | — |
| | 1.50 | % | | — |
|
| | | | | | | | | | | | | | |
| Interest Rate Swaps (000's): | | | | | | | | | | | | | |
| Variable to fixed (EUR) | | 250,800 |
| | 250,800 |
| (2) | | 235,335 |
| | — |
| | 468,800 |
| | — |
|
| Average pay rate | | 0.21 | % | | 0.14 | % | | | 0.31 | % | | — |
| | 0.28 | % | | — |
|
| Average receive rate | | — | % | | — | % | | | — | % | | — |
| | — | % | | — |
|
| |
(1)
| We pay Guarantee Fees to Time Warner based on the amounts outstanding on the Euro Term Loans. As of December 31, 2016, the all-in borrowing rate on each the 2018 Euro Term Loan and the 2019 Euro Term Loan was 8.5%3.25% per annum and the all-in borrowing rate on the 20212023 Euro Term Loan was 9.0%3.50% per annum.annum as of December 31, 2019. |
| |
(2) | The interest rate swaps related to the 2023 Euro Loan maturing in 2018 were2023 are forward starting to coincide with the maturity date of the interest rate swaps maturing in 2017.2021. See Item 8, Note 14,12, "Financial Instruments and Fair Value Measurements". |
December 31, 2018:
|
| | | | | | | | | | | | | | | | | | | | |
| Expected Maturity Dates | | 2019 |
| | 2020 |
| | 2021 | | 2022 |
| | 2023 | | Thereafter |
|
| Long-term Debt (000's): | | | | | | | | | | | | | | |
| Variable rate (EUR) | | — |
| | — |
| | 210,335 |
| | | — |
| | 468,800 |
| | | — |
|
Average interest rate (1) | | — |
| | — |
| | 1.28 | % | | | — |
| | 1.28 | % | | | — |
|
| | | | | | | | | | | | | | | |
| Interest Rate Swaps (000's): | | | | | | | | | | | | | | |
| Variable to fixed (EUR) | | 210,335 |
| | — |
| | 679,135 |
| (2) | | — |
| | 468,800 |
| (3) | | — |
|
| Average pay rate | | 0.31 | % | | — |
| | 0.33 | % | | | — |
| | 0.97 | % | | | — |
|
| Average receive rate | | — | % | | — |
| | — | % | | | — |
| | — | % | | | — |
|
| |
(1) | As discussed in Item 8, Note 4, "Long-term Debt and Other Financing Arrangements", as consideration for Warner Media's guarantee of the Euro Loans, we pay Guarantee Fees to Warner Media based on the amounts outstanding on the Euro Loans, each calculated such that the all-in borrowing rate on the 2021 Euro Loan was 3.25% per annum and the all-in borrowing rate on the 2023 Euro Loan was 3.75% per annum as of December 31, 2018. |
| |
(2) | The interest rate swaps related to the 2021 Euro Loan maturing in 2021 were forward starting to coincide with the maturity date of the interest rate swaps which matured in 2019. See Item 8, Note 12, "Financial Instruments and Fair Value Measurements". |
| |
(3) | The interest rate swaps related to the 2023 Euro Loan maturing in 2023 are forward starting to coincide with the maturity date of the interest rate swaps maturing in 2021. See Item 8, Note 12, "Financial Instruments and Fair Value Measurements". |
Foreign Currency Exchange Risk Management
We conduct business in a number of currencies other than our functional currencies. As a result, we are subject to foreign currency exchange rate risk due to the effects that foreign exchange rate movements of these currencies have on our costs and on the cash flows we receive from our subsidiaries. In limited instances, we enter into forward foreign exchange contracts to minimize foreign currency exchange rate risk (see Item 8, Note 14,12, "Financial Instruments and Fair Value Measurements").
Interest Rate Risk Management
The Euro Term Loans each bear interest at a variable rate based on EURIBOR plus an applicable margin. We are party to a number of interest rate swap agreements intended to reduce our exposure to interest rate movements (see Item 8, Note 14,12, "Financial Instruments and Fair Value Measurements").
ITEM 8. FINANCIAL STATEMENTS AND SUPPLEMENTARY DATA
Financial Statements and Supplementary data begin on the following page and end on the page immediately preceding Item 9.
REPORT OF INDEPENDENT REGISTERED PUBLIC ACCOUNTING FIRM
To the Board of Directors and the Shareholders of Central European Media Enterprises Ltd.
Opinion on the Financial Statements
We have audited the accompanying consolidated balance sheets of Central European Media Enterprises Ltd. (the Company) as of December 31, 20172019 and 2016,2018, the related consolidated statements of operations and comprehensive income / loss, equity and cash flows for each of the twothree years in the period ended December 31, 2017,2019, and the related notes and the financial statement schedule listed in the Index at Item 15(a) (collectively referred to as the “financial statements”). In our opinion, the financial statements present fairly, in all material respects, the consolidated financial position of the Company at December 31, 20172019 and 2016,2018, and the consolidated results of its operations and its cash flows for each of the twothree years in the period ended December 31, 2017,2019, in conformity with U.S. generally accepted accounting principles.
We also audited the retrospective adjustments for the discontinued operations described in Note 3a that were applied to the 2015 consolidated financial statements. In our opinion, such retrospective adjustments are appropriate and have been properly applied. However, we were not engaged to audit, review or apply any procedures to the 2015 consolidated financial statements of the Company other than with respect to the retrospective adjustments and, accordingly, we do not express an opinion or any other form of assurance on the 2015 consolidated financial statements taken as a whole.
We also have audited, in accordance with the standards of the Public Company Accounting Oversight Board (United States) (PCAOB), the Company's internal control over financial reporting as of December 31, 2017,2019, based on criteria established in Internal Control-Integrated Framework issued by the Committee of Sponsoring Organizations of the Treadway Commission (2013 framework) and our report dated February 8, 20186, 2020 expressed an unqualified opinion thereon.
Basis for Opinion
These financial statements are the responsibility of the Company's management. Our responsibility is to express an opinion on the Company’s financial statements based on our audits. We are a public accounting firm registered with the PCAOB and are required to be independent with respect to the Company in accordance with the U.S. federal securities laws and the applicable rules and regulations of the Securities and Exchange Commission and the PCAOB.
We conducted our audits in accordance with the standards of the PCAOB. Those standards require that we plan and perform the audit to obtain reasonable assurance about whether the financial statements are free of material misstatement, whether due to error or fraud. Our audits included performing procedures to assess the risks of material misstatement of the financial statements, whether due to error or fraud, and performing procedures that respond to those risks. Such procedures included examining, on a test basis, evidence regarding the amounts and disclosures in the financial statements. Our audits also included evaluating the accounting principles used and significant estimates made by management, as well as evaluating the overall presentation of the financial statements. We believe that our audits provide a reasonable basis for our opinion.
/s/ Ernst & Young LLP
We have served as the Company’s auditor since 2016.
London, United Kingdom
February 8, 20186, 2020
REPORT OF INDEPENDENT REGISTERED PUBLIC ACCOUNTING FIRM
To the Board of Directors and Shareholders of Central European Media Enterprises Ltd.
We have audited, before the effects of the retrospective adjustments for the discontinued operations discussed in Note 3a to the consolidated financial statements, the consolidated statements of operations and comprehensive income/loss, equity, and cash flows of Central European Media Enterprises Ltd. and subsidiaries (the "Company") for the year ended December 31, 2015 (the 2015 consolidated financial statements before the effects of the retrospective adjustments discussed in Note 3a to the consolidated financial statements are not presented herein). Our audit also included the financial statement schedule listed in the Index at Item 15 as it relates to 2015. These financial statements and the financial statement schedule are the responsibility of the Company’s management. Our responsibility is to express an opinion on the financial statements and the financial statement schedule based on our audit.
We conducted our audit in accordance with the standards of the Public Company Accounting Oversight Board (United States). Those standards require that we plan and perform the audit to obtain reasonable assurance about whether the financial statements are free of material misstatement. An audit includes examining, on a test basis, evidence supporting the amounts and disclosures in the financial statements. An audit also includes assessing the accounting principles used and significant estimates made by management, as well as evaluating the overall financial statement presentation. We believe that our audit provides a reasonable basis for our opinion.
In our opinion, such 2015 consolidated financial statements, before the effects of the retrospective adjustments for the discontinued operations discussed in Note 3a to the consolidated financial statements, present fairly, in all material respects, the results of the Company’s operations and cash flows for the year ended December 31, 2015, in conformity with accounting principles generally accepted in the United States of America. Also, in our opinion, the financial statement schedule, as it relates to 2015, when considered in relation to the basic consolidated financial statements taken as a whole, presents fairly, in all material respects, the information set forth therein.
We were not engaged to audit, review, or apply any procedures to the retrospective adjustments for the discontinued operations discussed in Note 3a to the consolidated financial statements and, accordingly, we do not express an opinion or any other form of assurance about whether such retrospective adjustments are appropriate and have been properly applied. Those retrospective adjustments were audited by other auditors.
/s/ Deloitte LLP
London, United Kingdom
February 22, 2016
CENTRAL EUROPEAN MEDIA ENTERPRISES LTD.
CONSOLIDATED BALANCE SHEETS
(US$ 000’s, except share and per share data)
|
| | | | | | | |
| | December 31, 2017 |
| | December 31, 2016 |
|
| ASSETS | | | |
| Current assets | | | |
| Cash and cash equivalents | $ | 54,903 |
| | $ | 40,606 |
|
| Accounts receivable, net (Note 7) | 158,903 |
| | 141,371 |
|
| Program rights, net (Note 6) | 69,706 |
| | 69,662 |
|
| Other current assets (Note 8) | 33,106 |
| | 27,541 |
|
| Current assets held for sale (Note 3) | 148,156 |
| | 61,240 |
|
| Total current assets | 464,774 |
| | 340,420 |
|
| Non-current assets | | | |
| Property, plant and equipment, net (Note 9) | 103,648 |
| | 89,080 |
|
| Program rights, net (Note 6) | 182,170 |
| | 143,428 |
|
| Goodwill (Note 4) | 712,359 |
| | 601,535 |
|
| Other intangible assets, net (Note 4) | 148,235 |
| | 134,705 |
|
| Other non-current assets (Note 8) | 16,869 |
| | 21,273 |
|
| Non-current assets held for sale (Note 3) | — |
| | 60,276 |
|
| Total non-current assets | 1,163,281 |
| | 1,050,297 |
|
| Total assets | $ | 1,628,055 |
| | $ | 1,390,717 |
|
|
| | | | | | | |
| | December 31, 2019 |
| | December 31, 2018 |
|
| ASSETS | | | |
| Current assets | | | |
| Cash and cash equivalents | $ | 36,621 |
| | $ | 62,031 |
|
| Accounts receivable, net (Note 6) | 188,618 |
| | 193,371 |
|
| Program rights, net (Note 5) | 75,909 |
| | 77,624 |
|
| Other current assets (Note 7) | 48,832 |
| | 41,067 |
|
| Total current assets | 349,980 |
| | 374,093 |
|
| Non-current assets | | | |
| Property, plant and equipment, net (Note 8) | 113,901 |
| | 117,604 |
|
| Program rights, net (Note 5) | 166,237 |
| | 171,871 |
|
| Goodwill (Note 3) | 667,988 |
| | 676,333 |
|
| Other intangible assets, net (Note 3) | 127,589 |
| | 136,052 |
|
| Other non-current assets (Note 7) | 22,167 |
| | 12,408 |
|
| Total non-current assets | 1,097,882 |
| | 1,114,268 |
|
| Total assets | $ | 1,447,862 |
| | $ | 1,488,361 |
|
|
| | | | | | | |
| LIABILITIES AND EQUITY | | | |
| Current liabilities | | | |
| Accounts payable and accrued liabilities (Note 10) | $ | 143,893 |
| | $ | 134,378 |
|
| Current portion of long-term debt and other financing arrangements (Note 5) | 2,960 |
| | 1,228 |
|
| Other current liabilities (Note 11) | 9,280 |
| | 8,467 |
|
| Current liabilities held for sale (Note 3) | 32,131 |
| | 27,491 |
|
| Total current liabilities | 188,264 |
| | 171,564 |
|
| Non-current liabilities | |
| | |
|
| Long-term debt and other financing arrangements (Note 5) | 1,085,714 |
| | 1,001,408 |
|
| Other non-current liabilities (Note 11) | 95,254 |
| | 67,963 |
|
| Non-current liabilities held for sale (Note 3) | — |
| | 1,415 |
|
| Total non-current liabilities | 1,180,968 |
| | 1,070,786 |
|
| Commitments and contingencies (Note 21) |
|
| |
|
|
| TEMPORARY EQUITY | | | |
| 200,000 shares of Series B Convertible Redeemable Preferred Stock of $0.08 each (December 31, 2016 - 200,000) (Note 12) | 264,593 |
| | 254,899 |
|
| EQUITY | |
| | |
|
| CME Ltd. shareholders’ equity (Note 13): | |
| | |
|
| One share of Series A Convertible Preferred Stock of $0.08 each (December 31, 2016 – one) | — |
| | — |
|
| 145,486,497 shares of Class A Common Stock of $0.08 each (December 31, 2016 – 143,449,913) | 11,639 |
| | 11,476 |
|
| Nil shares of Class B Common Stock of $0.08 each (December 31, 2016 – nil) | — |
| | — |
|
| Additional paid-in capital | 1,905,779 |
| | 1,910,244 |
|
| Accumulated deficit | (1,735,768 | ) | | (1,785,536 | ) |
| Accumulated other comprehensive loss | (187,438 | ) | | (243,988 | ) |
| Total CME Ltd. shareholders’ deficit | (5,788 | ) | | (107,804 | ) |
| Noncontrolling interests | 18 |
| | 1,272 |
|
| Total deficit | (5,770 | ) | | (106,532 | ) |
| Total liabilities and equity | $ | 1,628,055 |
| | $ | 1,390,717 |
|
|
| | | | | | | |
| LIABILITIES AND EQUITY | | | |
| Current liabilities | | | |
| Accounts payable and accrued liabilities (Note 9) | $ | 135,650 |
| | $ | 120,468 |
|
| Current portion of long-term debt and other financing arrangements (Note 4) | 6,836 |
| | 5,545 |
|
| Other current liabilities (Note 10) | 13,515 |
| | 13,679 |
|
| Total current liabilities | 156,001 |
| | 139,692 |
|
| Non-current liabilities | |
| | |
|
| Long-term debt and other financing arrangements (Note 4) | 600,273 |
| | 782,685 |
|
| Other non-current liabilities (Note 10) | 80,000 |
| | 67,293 |
|
| Total non-current liabilities | 680,273 |
| | 849,978 |
|
| Commitments and contingencies (Note 21) |
|
| |
|
|
| TEMPORARY EQUITY | | | |
| 200,000 shares of Series B Convertible Redeemable Preferred Stock of $0.08 each (December 31, 2018 - 200,000) (Note 13) | 269,370 |
| | 269,370 |
|
| EQUITY | |
| | |
|
| CME Ltd. shareholders’ equity (Note 14): | |
| | |
|
| One share of Series A Convertible Preferred Stock of $0.08 each (December 31, 2018 – one) | — |
| | — |
|
| 253,607,026 shares of Class A Common Stock of $0.08 each (December 31, 2018 – 252,853,554) | 20,288 |
| | 20,228 |
|
| Nil shares of Class B Common Stock of $0.08 each (December 31, 2018 – nil) | — |
| | — |
|
| Additional paid-in capital | 2,007,275 |
| | 2,003,518 |
|
| Accumulated deficit | (1,458,942 | ) | | (1,578,076 | ) |
| Accumulated other comprehensive loss | (226,916 | ) | | (216,650 | ) |
| Total CME Ltd. shareholders’ equity | 341,705 |
| | 229,020 |
|
| Noncontrolling interests | 513 |
| | 301 |
|
| Total equity | 342,218 |
| | 229,321 |
|
| Total liabilities and equity | $ | 1,447,862 |
| | $ | 1,488,361 |
|
The accompanying notes are an integral part of these consolidated financial statements.
CENTRAL EUROPEAN MEDIA ENTERPRISES LTD.
CONSOLIDATED STATEMENTS OF OPERATIONS AND COMPREHENSIVE INCOME / LOSS
(US$ 000’s, except share and per share data)
|
| | | | | | | | | | | |
| | For The Year Ended December 31, |
| | 2017 |
|
| 2016 |
| | 2015 |
|
| Net revenues | $ | 574,212 |
| | $ | 526,174 |
| | $ | 496,195 |
|
| Operating expenses: | | | | | |
| Content costs | 254,061 |
| | 238,063 |
| | 227,510 |
|
| Other operating costs | 49,864 |
| | 54,949 |
| | 55,731 |
|
| Depreciation of property, plant and equipment | 26,991 |
|
| 23,106 |
|
| 21,327 |
|
| Amortization of intangibles | 8,592 |
|
| 8,270 |
|
| 12,050 |
|
| Cost of revenues | 339,508 |
| | 324,388 |
| | 316,618 |
|
| Selling, general and administrative expenses | 104,755 |
| | 96,254 |
| | 89,816 |
|
| Restructuring costs | — |
| | — |
| | 1,714 |
|
| Operating income | 129,949 |
|
| 105,532 |
| | 88,047 |
|
| Interest expense (Note 15) | (70,633 | ) | | (111,389 | ) | | (151,767 | ) |
| Loss on extinguishment of debt (Note 5) | (101 | ) |
| (150,158 | ) |
| — |
|
| Other non-operating income / (expense), net (Note 16) | 16,321 |
| | (2,074 | ) | | (23,609 | ) |
| Income / (loss) before tax | 75,536 |
| | (158,089 | ) | | (87,329 | ) |
| (Provision) / credit for income taxes (Note 18) | (21,483 | ) | | (6,336 | ) | | 1,153 |
|
| Income / (loss) from continuing operations | 54,053 |
| | (164,425 | ) | | (86,176 | ) |
| Loss from discontinued operations, net of tax (Note 3) | (4,626 | ) | | (16,172 | ) | | (29,396 | ) |
| Net income / (loss) | 49,427 |
| | (180,597 | ) | | (115,572 | ) |
| Net loss attributable to noncontrolling interests | 341 |
| | 306 |
| | 671 |
|
| Net income / (loss) attributable to CME Ltd. | $ | 49,768 |
| | $ | (180,291 | ) | | $ | (114,901 | ) |
| | | | | | |
| Net income / (loss) | $ | 49,427 |
| | $ | (180,597 | ) | | $ | (115,572 | ) |
| Other comprehensive income / (loss) | | | | | |
| Currency translation adjustment (Note 13) | 54,368 |
| | 1,649 |
| | (89,714 | ) |
| Gain / (loss) on derivative instruments (Note 14) | 1,269 |
| | (3,031 | ) | | (839 | ) |
| Total other comprehensive income / (loss) | 55,637 |
| | (1,382 | ) | | (90,553 | ) |
| Comprehensive income / (loss) | 105,064 |
| | (181,979 | ) | | (206,125 | ) |
| Comprehensive loss / (income) attributable to noncontrolling interests | 1,254 |
| | 109 |
| | (712 | ) |
| Comprehensive income / (loss) attributable to CME Ltd. | $ | 106,318 |
| | $ | (181,870 | ) | | $ | (206,837 | ) |
|
| | | | | | | | | | | |
| | For The Year Ended December 31, |
| | 2019 |
|
| 2018 |
| | 2017 |
|
| Net revenues | $ | 694,804 |
| | $ | 703,906 |
| | $ | 642,868 |
|
| Operating expenses: | | | | | |
| Content costs | 284,715 |
| | 309,439 |
| | 293,728 |
|
| Other operating costs | 54,826 |
| | 56,731 |
| | 55,924 |
|
| Depreciation of property, plant and equipment | 33,536 |
|
| 32,933 |
|
| 31,261 |
|
| Amortization of intangibles | 8,457 |
|
| 9,002 |
|
| 8,592 |
|
| Cost of revenues | 381,534 |
| | 408,105 |
| | 389,505 |
|
| Selling, general and administrative expenses | 125,934 |
| | 118,214 |
| | 113,449 |
|
| Operating income | 187,336 |
|
| 177,587 |
| | 139,914 |
|
| Interest expense (Note 15) | (30,694 | ) | | (49,106 | ) | | (83,188 | ) |
| Other non-operating (expense) / income, net (Note 16) | (2,208 | ) | | (3,588 | ) | | 16,841 |
|
| Income before tax | 154,434 |
| | 124,893 |
| | 73,567 |
|
| Provision for income taxes | (35,226 | ) | | (27,828 | ) | | (22,504 | ) |
| Income from continuing operations | 119,208 |
| | 97,065 |
| | 51,063 |
|
| Income / (loss) from discontinued operations, net of tax | — |
| | 60,548 |
| | (1,636 | ) |
| Net income | 119,208 |
| | 157,613 |
| | 49,427 |
|
| Net (income) / loss attributable to noncontrolling interests | (74 | ) | | 79 |
| | 341 |
|
| Net income attributable to CME Ltd. | $ | 119,134 |
| | $ | 157,692 |
| | $ | 49,768 |
|
| | | | | | |
| Net income | $ | 119,208 |
| | $ | 157,613 |
| | $ | 49,427 |
|
| Other comprehensive (loss) / income | | | | | |
| Currency translation adjustment (Note 14) | (6,149 | ) | | (23,050 | ) | | 54,368 |
|
| Unrealized (loss) / gain on derivative instruments (Note 14) | (3,979 | ) | | (5,800 | ) | | 1,269 |
|
| Total other comprehensive (loss) / income | (10,128 | ) | | (28,850 | ) | | 55,637 |
|
| Comprehensive income | 109,080 |
| | 128,763 |
| | 105,064 |
|
| Comprehensive (income) / loss attributable to noncontrolling interests | (212 | ) | | (283 | ) | | 1,254 |
|
| Comprehensive income attributable to CME Ltd. | $ | 108,868 |
| | $ | 128,480 |
| | $ | 106,318 |
|
| | | PER SHARE DATA (Note 19): | | | | | | | | | | |
| Net income / (loss) per share: | | | | | | | | | | |
| Continuing operations — basic | $ | 0.17 |
| | $ | (1.18 | ) | | $ | (0.70 | ) | $ | 0.32 |
| | $ | 0.27 |
| | $ | 0.16 |
|
| Continuing operations — diluted | 0.15 |
| | (1.18 | ) | | (0.70 | ) | 0.32 |
| | 0.25 |
| | 0.12 |
|
| Discontinued operations — basic | (0.03 | ) | | (0.10 | ) | | (0.20 | ) | — |
| | 0.18 |
| | (0.01 | ) |
| Discontinued operations — diluted | (0.03 | ) | | (0.10 | ) | | (0.20 | ) | — |
| | 0.17 |
| | 0.00 |
|
| Net income / (loss) attributable to CME Ltd. — basic | 0.14 |
| | (1.28 | ) | | (0.90 | ) | |
| Net income / (loss) attributable to CME Ltd. — diluted | 0.12 |
| | (1.28 | ) | | (0.90 | ) | |
| Attributable to CME Ltd. — basic | | 0.32 |
| | 0.45 |
| | 0.15 |
|
| Attributable to CME Ltd. — diluted | | 0.32 |
| | 0.42 |
| | 0.12 |
|
| | | | | | | | | | | |
| Weighted average common shares used in computing per share amounts (000’s): | | | | | | | | | | |
| Basic | 155,846 |
| | 151,017 |
| | 146,866 |
| 264,611 |
| | 230,562 |
| | 155,846 |
|
| Diluted | 236,404 |
| | 151,017 |
| | 146,866 |
| 266,198 |
| | 257,694 |
| | 236,404 |
|
The accompanying notes are an integral part of these consolidated financial statements.
CENTRAL EUROPEAN MEDIA ENTERPRISES LTD.
CONSOLIDATED STATEMENTS OF EQUITY
(US$ 000’s, except share data)
| | | | CME Ltd. | | |
| | |
| CME Ltd. | | |
| | |
|
| | Series A Convertible Preferred Stock | | Class A Common Stock | | Class B Common Stock | |
| |
| |
| | |
| | |
| Series A Convertible Preferred Stock | | Class A Common Stock | | Class B Common Stock | |
| |
| |
| | |
| | |
|
| | Number of shares | Par value | | Number of shares | Par value | | Number of shares | Par value | Additional Paid-In Capital |
| Accumulated Deficit |
| Accumulated Other Comprehensive Loss |
| | Noncontrolling Interest |
| | Total Equity / (Deficit) |
| Number of shares | Par value | | Number of shares | Par value | | Number of shares | Par value | Additional Paid-In Capital |
| Accumulated Deficit |
| Accumulated Other Comprehensive Loss |
| | Noncontrolling Interest |
| | Total (Deficit) / Equity |
|
BALANCE December 31, 2014 | 1 |
| $ | — |
| | 135,335,258 |
| $ | 10,827 |
| | — |
| $ | — |
| $ | 1,928,920 |
| $ | (1,490,344 | ) | $ | (169,609 | ) | | $ | (2,612 | ) | | $ | 277,182 |
| |
| Stock-based compensation | — |
| — |
| | — |
| — |
| | — |
| — |
| 2,439 |
| — |
| — |
| | — |
| | 2,439 |
| |
| Share issuance, stock based compensation | — |
| — |
| | 468,963 |
| 37 |
| | — |
| — |
| (37 | ) | — |
| — |
| | — |
| | — |
| |
| Preferred dividend paid in kind | — |
| — |
| | — |
| — |
| | — |
| — |
| (17,272 | ) | — |
| — |
| | — |
| | (17,272 | ) | |
| Net loss | — |
| — |
| | — |
| — |
| | — |
| — |
| — |
| (114,901 | ) | — |
| | (671 | ) | | (115,572 | ) | |
| Unrealized loss on derivative instruments | — |
| — |
| | — |
| — |
| | — |
| — |
| — |
| — |
| (839 | ) | | — |
| | (839 | ) | |
| Currency translation adjustment | — |
| — |
| | — |
| — |
| | — |
| — |
| — |
| — |
| (91,097 | ) | | 1,383 |
| | (89,714 | ) | |
| Reclassified to net income upon sale of subsidiaries | — |
| — |
| | — |
| — |
| | — |
| — |
| — |
| — |
| 19,136 |
| | 3,281 |
| | 22,417 |
| |
BALANCE December 31, 2015 | 1 |
| $ | — |
| | 135,804,221 |
| $ | 10,864 |
| | — |
| $ | — |
| $ | 1,914,050 |
| $ | (1,605,245 | ) | $ | (242,409 | ) | | $ | 1,381 |
| | $ | 78,641 |
| |
| Stock-based compensation | — |
| — |
| | — |
| — |
| | — |
| — |
| 3,510 |
| — |
| — |
| | — |
| | 3,510 |
| |
| Exercise of warrants (Note 13) | — |
| — |
| | 6,996,955 |
| 560 |
| | — |
| — |
| 6,437 |
| — |
| — |
| | — |
| | 6,997 |
| |
| Share issuance, stock based compensation | — |
| — |
| | 648,737 |
| 52 |
| | — |
| — |
| (52 | ) | — |
| — |
| | — |
| | — |
| |
| Preferred dividend paid in kind | — |
| — |
| | — |
| — |
| | — |
| — |
| (13,701 | ) | — |
| — |
| | — |
| | (13,701 | ) | |
| Net loss | — |
| — |
| | — |
| — |
| | — |
| — |
| — |
| (180,291 | ) | — |
| | (306 | ) | | (180,597 | ) | |
| Unrealized loss on derivative instruments | — |
| — |
| | — |
| — |
| | — |
| — |
| — |
| — |
| (3,031 | ) | | — |
| | (3,031 | ) | |
| Currency translation adjustment | — |
| — |
| | — |
| — |
| | — |
| — |
| — |
| — |
| 1,452 |
| | 197 |
| | 1,649 |
| |
BALANCE December 31, 2016 | 1 |
| $ | — |
| | 143,449,913 |
| $ | 11,476 |
| | — |
| $ | — |
| $ | 1,910,244 |
| $ | (1,785,536 | ) | $ | (243,988 | ) | | $ | 1,272 |
| | $ | (106,532 | ) | 1 |
| $ | — |
| | 143,449,913 |
| $ | 11,476 |
| | — |
| $ | — |
| $ | 1,910,244 |
| $ | (1,785,536 | ) | $ | (243,988 | ) | | $ | 1,272 |
| | $ | (106,532 | ) |
| Stock-based compensation | — |
| — |
| | — |
| — |
| | — |
| — |
| 4,412 |
| — |
| — |
| | — |
| | 4,412 |
| — |
| — |
| | — |
| — |
| | — |
| — |
| 4,412 |
| — |
| — |
| | — |
| | 4,412 |
|
| Exercise of warrants (Note 13) | — |
| — |
| | 1,148,469 |
| 92 |
| | — |
| — |
| 1,056 |
| — |
| — |
| | — |
| | 1,148 |
| |
| Share issuance, stock-based compensation | — |
| — |
| | 888,115 |
| 71 |
| | — |
| — |
| (71 | ) | — |
| — |
| | — |
| | — |
| |
| Exercise of warrants | | — |
| — |
| | 1,148,469 |
| 92 |
| | — |
| — |
| 1,056 |
| — |
| — |
| | — |
| | 1,148 |
|
| Share issuance, stock based compensation | | — |
| — |
| | 888,115 |
| 71 |
| | — |
| — |
| (71 | ) | — |
| — |
| | — |
| | — |
|
| Withholding tax on net share settlement of stock-based compensation | — |
| — |
| | — |
| — |
| | — |
| — |
| (168 | ) | — |
| — |
| | — |
| | (168 | ) | — |
| — |
| | — |
| — |
| | — |
| — |
| (168 | ) | — |
| — |
| | — |
| | (168 | ) |
| Preferred dividend paid in kind | — |
| — |
| | — |
| — |
| | — |
| — |
| (9,694 | ) | — |
| — |
| | — |
| | (9,694 | ) | — |
| — |
| | — |
| — |
| | — |
| — |
| (9,694 | ) | — |
| — |
| | — |
| | (9,694 | ) |
| Net income / (loss) | — |
| — |
| | — |
| — |
| | — |
| — |
| — |
| 49,768 |
| — |
| | (341 | ) | | 49,427 |
| — |
| — |
| | — |
| — |
| | — |
| — |
| — |
| 49,768 |
| — |
| | (341 | ) | | 49,427 |
|
| Unrealized gain on derivative instruments | — |
| — |
| | — |
| — |
| | — |
| — |
| — |
| — |
| 1,269 |
| | — |
| | 1,269 |
| — |
| — |
| | — |
| — |
| | — |
| — |
| — |
| — |
| 1,269 |
| | — |
| | 1,269 |
|
| Currency translation adjustment | — |
| — |
| | — |
| — |
| | — |
| — |
| — |
| — |
| 55,281 |
| | (913 | ) | | 54,368 |
| — |
| — |
| | — |
| — |
| | — |
| — |
| — |
| — |
| 55,281 |
| | (913 | ) | | 54,368 |
|
BALANCE December 31, 2017 | 1 |
| $ | — |
| | 145,486,497 |
| $ | 11,639 |
| | — |
| $ | — |
| $ | 1,905,779 |
| $ | (1,735,768 | ) | $ | (187,438 | ) | | $ | 18 |
| | $ | (5,770 | ) | 1 |
| $ | — |
| | 145,486,497 |
| $ | 11,639 |
| | — |
| $ | — |
| $ | 1,905,779 |
| $ | (1,735,768 | ) | $ | (187,438 | ) | | $ | 18 |
| | $ | (5,770 | ) |
| Stock-based compensation | | — |
| — |
| | — |
| — |
| | — |
| — |
| 7,083 |
| — |
| — |
| | — |
| | 7,083 |
|
| Exercise of warrants | | — |
| — |
| | 105,652,401 |
| 8,452 |
| | — |
| — |
| 97,200 |
| — |
| — |
| | — |
| | 105,652 |
|
| Share issuance, stock based compensation | | — |
| — |
| | 1,714,656 |
| 137 |
| | — |
| — |
| (137 | ) | — |
| — |
| | — |
| | — |
|
| Withholding tax on net share settlement of stock-based compensation | | — |
| — |
| | — |
| — |
| | — |
| — |
| (1,630 | ) | — |
| — |
| | — |
| | (1,630 | ) |
| Preferred dividend paid in kind | | — |
| — |
| | — |
| — |
| | — |
| — |
| (4,777 | ) | — |
| — |
| | — |
| | (4,777 | ) |
| Net income / (loss) | | — |
| — |
| | — |
| — |
| | — |
| — |
| — |
| 157,692 |
| — |
| | (79 | ) | | 157,613 |
|
| Unrealized loss on derivative instruments | | — |
| — |
| | — |
| — |
| | — |
| — |
| — |
| — |
| (5,800 | ) | | — |
| | (5,800 | ) |
| Currency translation adjustment | | — |
| — |
| | — |
| — |
| | — |
| — |
| — |
| — |
| (23,412 | ) | | 362 |
| | (23,050 | ) |
BALANCE December 31, 2018 | | 1 |
| $ | — |
| | 252,853,554 |
| $ | 20,228 |
| | — |
| $ | — |
| $ | 2,003,518 |
| $ | (1,578,076 | ) | $ | (216,650 | ) | | $ | 301 |
| | $ | 229,321 |
|
| Stock-based compensation | | — |
| — |
| | — |
| — |
| | — |
| — |
| 4,184 |
| — |
| — |
| | — |
| | 4,184 |
|
| Share issuance, stock-based compensation | | — |
| — |
| | 753,472 |
| 60 |
| | — |
| — |
| (60 | ) | — |
| — |
| | — |
| | — |
|
| Withholding tax on net share settlement of stock-based compensation | | — |
| — |
| | — |
| — |
| | — |
| — |
| (367 | ) | — |
| — |
| | — |
| | (367 | ) |
| Net income | | — |
| — |
| | — |
| — |
| | — |
| — |
| — |
| 119,134 |
| — |
| | 74 |
| | 119,208 |
|
| Unrealized loss on derivative instruments | | — |
| — |
| | — |
| — |
| | — |
| — |
| — |
| — |
| (3,979 | ) | | — |
| | (3,979 | ) |
| Currency translation adjustment | | — |
| — |
| | — |
| — |
| | — |
| — |
| — |
| — |
| (6,287 | ) | | 138 |
| | (6,149 | ) |
BALANCE December 31, 2019 | | 1 |
| $ | — |
| | 253,607,026 |
| $ | 20,288 |
| | — |
| $ | — |
| $ | 2,007,275 |
| $ | (1,458,942 | ) | $ | (226,916 | ) |
| $ | 513 |
|
| $ | 342,218 |
|
The accompanying notes are an integral part of these consolidated financial statements.
CENTRAL EUROPEAN MEDIA ENTERPRISES LTD.
CONSOLIDATED STATEMENTS OF CASH FLOWS
(US$ 000’s)
| | | | For The Year Ended December 31, | For The Year Ended December 31, |
| | 2017 |
| | 2016 |
| | 2015 |
| 2019 |
| | 2018 |
| | 2017 |
|
| CASH FLOWS FROM OPERATING ACTIVITIES: | | | | | | | | | | |
| Net income / (loss) | $ | 49,427 |
| | $ | (180,597 | ) | | $ | (115,572 | ) | |
| Adjustments to reconcile net income / (loss) to net cash generated from continuing operating activities: | |
| | | | | |
| Loss from discontinued operations, net of tax | 4,626 |
| | 16,172 |
| | 29,396 |
| |
| Net income | | $ | 119,208 |
| | $ | 157,613 |
| | $ | 49,427 |
|
| Adjustments to reconcile net income to net cash generated from continuing operating activities: | | |
| | | | |
| (Income) / loss from discontinued operations, net of tax | | — |
| | (60,548 | ) | | 1,636 |
|
| Amortization of program rights | 254,061 |
| | 238,063 |
| | 227,510 |
| 284,715 |
| | 309,439 |
| | 293,728 |
|
| Depreciation and other amortization | 41,361 |
| | 53,163 |
| | 89,725 |
| 45,379 |
| | 46,437 |
| | 45,871 |
|
| Interest and related Guarantee Fees paid in kind | 23,137 |
| | 36,491 |
| | 75,426 |
| — |
| | 3,783 |
| | 23,331 |
|
| Loss on extinguishment of debt (Note 5) | 101 |
| | 150,158 |
| | — |
| |
| (Gain) / loss on disposal of fixed assets | (73 | ) | | (268 | ) | | 17,371 |
| |
| Loss on extinguishment of debt | | 340 |
| | 415 |
| | 101 |
|
| Gain on disposal of fixed assets | | (84 | ) | | (90 | ) | | (108 | ) |
| Deferred income taxes | (483 | ) | | 1,360 |
| | (1,768 | ) | (742 | ) | | 2,734 |
| | (483 | ) |
| Stock-based compensation (Note 17) | 4,280 |
| | 3,383 |
| | 2,311 |
| 4,184 |
| | 7,083 |
| | 4,412 |
|
| Change in fair value of derivatives | 231 |
| | 11,473 |
| | (7,333 | ) | 201 |
| | 1,322 |
| | 231 |
|
| Foreign currency exchange (gain) / loss, net | (13,425 | ) | | (8,683 | ) | | 1,517 |
| |
| Foreign currency exchange loss / (gain), net | | 661 |
| | 2,376 |
| | (13,773 | ) |
| Changes in assets and liabilities: | | | |
| | | | | |
| | |
| Accounts receivable, net | 1,555 |
| | (17,459 | ) | | (7,430 | ) | 2,356 |
| | (16,461 | ) | | (325 | ) |
| Accounts payable and accrued liabilities | (1,264 | ) | | 2,911 |
| | 4,588 |
| 11,892 |
| | (8,597 | ) | | (1,588 | ) |
| Program rights | (269,573 | ) | | (245,099 | ) | | (235,618 | ) | (278,453 | ) | | (307,490 | ) | | (310,798 | ) |
| Other assets and liabilities | 2,503 |
| | (111 | ) | | (6,686 | ) | (4,107 | ) | | 587 |
| | 3,385 |
|
| Accrued interest | (2,624 | ) | | (5,560 | ) | | 4,407 |
| (768 | ) | | (31,338 | ) | | (3,727 | ) |
| Income taxes payable | 6,387 |
| | 4,445 |
| | (845 | ) | (7 | ) | | (2,878 | ) | | 7,554 |
|
| Deferred revenue | (2,316 | ) | | (680 | ) | | 3,459 |
| 476 |
| | 6,293 |
| | (2,272 | ) |
| VAT and other taxes payable | (2,590 | ) | | 225 |
| | (878 | ) | (5,599 | ) | | (1,656 | ) | | (3,301 | ) |
| Net cash generated from continuing operating activities | $ | 95,321 |
| | $ | 59,387 |
| | $ | 79,580 |
| $ | 179,652 |
| | $ | 109,024 |
| | $ | 93,301 |
|
| | | | | | | | | | | |
| CASH FLOWS FROM INVESTING ACTIVITIES: | |
| | |
| | | |
| | |
| | |
| Purchase of property, plant and equipment | $ | (24,905 | ) | | $ | (22,379 | ) | | $ | (26,654 | ) | $ | (24,423 | ) | | $ | (24,583 | ) | | $ | (28,115 | ) |
| Proceeds from disposal of property, plant and equipment | 163 |
| | 178 |
| | 3,091 |
| 48 |
| | 43 |
| | 168 |
|
| Net cash used in continuing investing activities | $ | (24,742 | ) | | $ | (22,201 | ) | | $ | (23,563 | ) | $ | (24,375 | ) | | $ | (24,540 | ) | | $ | (27,947 | ) |
| | | | | | | | | | | |
| CASH FLOWS FROM FINANCING ACTIVITIES: | |
| | |
| | | |
| | |
| | |
| Proceeds from debt | $ | — |
| | $ | 533,963 |
| | $ | 253,051 |
| |
| Repayments of debt | (59,060 | ) | | (540,699 | ) | | (261,034 | ) | $ | (168,913 | ) | | $ | (270,780 | ) | | $ | (59,060 | ) |
| Debt transactions costs | (106 | ) | | (9,541 | ) | | (1,541 | ) | — |
| | (10,746 | ) | | (106 | ) |
| Settlement of derivative instruments | | (1,712 | ) | | — |
| | — |
|
| Payment of credit facilities and capital leases | (2,714 | ) | | (1,086 | ) | | (27,102 | ) | (7,097 | ) | | (4,858 | ) | | (2,999 | ) |
| Settlement of forward currency swaps | — |
| | (12,106 | ) | | 7,983 |
| |
| Proceeds from exercise of warrants | 1,148 |
| | 6,997 |
| | — |
| — |
| | 105,652 |
| | 1,148 |
|
| Proceeds from sale-leaseback transactions | 2,746 |
| | — |
| | — |
| — |
| | — |
| | 2,746 |
|
| Payments of withholding tax on net share settlement of share-based compensation | (168 | ) | | — |
| | — |
| |
| Payments of withholding tax on net share settlement of stock-based compensation | | (367 | ) | | (1,630 | ) | | (168 | ) |
| Net cash used in continuing financing activities | $ | (58,154 | ) | | $ | (22,472 | ) | | $ | (28,643 | ) | $ | (178,089 | ) | | $ | (182,362 | ) | | $ | (58,439 | ) |
| | | | | | | | | | | |
| Net cash (used in) / provided by discontinued operations - operating activities | (4,206 | ) | | (25,900 | ) | | 5,347 |
| |
| Net cash used in discontinued operations - investing activities | (4,082 | ) | | (5,961 | ) | | (265 | ) | |
| Net cash used in discontinued operations - financing activities | (285 | ) | | (247 | ) | | (329 | ) | |
| Net cash provided by discontinued operations - operating activities | | — |
| | 1,842 |
| | 736 |
|
| Net cash provided by / (used in) discontinued operations - investing activities | | — |
| | 100,724 |
| | (877 | ) |
| | | | | | | | | | | |
| Impact of exchange rate fluctuations on cash | 10,445 |
| | (1,120 | ) | | (1,851 | ) | (2,598 | ) | | (1,405 | ) | | 11,020 |
|
| Net increase / (decrease) in cash and cash equivalents | $ | 14,297 |
| | $ | (18,514 | ) | | $ | 30,276 |
| |
| CASH AND CASH EQUIVALENTS, beginning of period | 40,606 |
| | 59,120 |
| | 28,844 |
| |
| CASH AND CASH EQUIVALENTS, end of period | $ | 54,903 |
| | $ | 40,606 |
| | $ | 59,120 |
| |
| Net (decrease) / increase in cash and cash equivalents | | $ | (25,410 | ) | | $ | 3,283 |
| | $ | 17,794 |
|
| CASH AND CASH EQUIVALENTS, beginning of year | | 62,031 |
| | 58,748 |
| | 40,954 |
|
| CASH AND CASH EQUIVALENTS, end of year | | $ | 36,621 |
| | $ | 62,031 |
| | $ | 58,748 |
|
The accompanying notes are an integral part of these consolidated financial statements.
CENTRAL EUROPEAN MEDIA ENTERPRISES LTD.
CONSOLIDATED STATEMENTS OF CASH FLOWS
(US$ 000’s)
| | | SUPPLEMENTAL DISCLOSURE OF CASH FLOW INFORMATION: | | | | | | | | | | |
| Cash paid for interest (including mandatory cash-pay Guarantee Fees) | $ | 40,619 |
| | $ | 50,611 |
| | $ | 14,976 |
| |
| Cash paid for Guarantee Fees that may be paid in kind | 1,735 |
| | 7,464 |
| | — |
| |
| Cash paid for interest (including Guarantee Fees) | | $ | 26,651 |
| | $ | 43,350 |
| | $ | 47,197 |
|
| Cash paid for Guarantee Fees previously paid in kind | | — |
| | 27,328 |
| | — |
|
| Cash paid for Guarantee Fees that previously could be paid in kind | | — |
| | 812 |
| | 8,343 |
|
| Cash paid for income taxes, net of refunds | 14,839 |
| | 290 |
| | 807 |
| 35,998 |
| | 28,365 |
| | 15,143 |
|
| | | | | | | | | | | |
| SUPPLEMENTAL DISCLOSURE OF NON-CASH FINANCING AND INVESTING ACTIVITIES: | | | | | | | | | | |
| Accretion on Series B Convertible Redeemable Preferred Stock | $ | 9,694 |
| | $ | 13,701 |
| | $ | 17,272 |
| $ | — |
| | $ | 4,777 |
| | $ | 9,694 |
|
| Acquisition of property, plant and equipment under capital lease | 8,824 |
| | 983 |
| | 844 |
| |
| Acquisition of property, plant and equipment under finance lease | | 5,753 |
| | 13,419 |
| | 8,811 |
|
The accompanying notes are an integral part of these consolidated financial statements.
CENTRAL EUROPEAN MEDIA ENTERPRISES LTD.
NOTES TO CONSOLIDATED FINANCIAL STATEMENTS
(Tabular amounts in US$ 000’s, except share and per share data)
1. ORGANIZATION AND BUSINESS
Central European Media Enterprises Ltd., a Bermuda company limited by shares, is a media and entertainment company operating in Central and Eastern Europe. Our assets are held through a series of Dutch and Curaçao holding companies.company. We manage our business on a geographical basis, with four5 operating segments; Bulgaria, the Czech Republic, Romania, and the Slovak Republic and Slovenia, which are also our reportable segments and our main operating countries. See Note 20, "Segment Data" for financial information by segment. Our previously held Croatian operations, which were sold during 2018, are classified as discontinued operations in our consolidated statements of operations for the years ended December 31, 2018 and December 31, 2017.
We are the market-leading broadcasters in each of our four5 operating countries with a combined portfolio of 2630 television channels. Each country also develops and produces content for their television channels. We generate advertising revenues in our country operations primarily through entering into agreements with advertisers, advertising agencies and sponsors to place advertising on the television channels that we operate. We generate additional revenues by collecting fees from cable, DTHdirect-to-home and IPTVinternet protocol television ("IPTV") operators for carriage of our channels.channels as well as from advertising related to our digital initiatives. Unless otherwise indicated, we own 100% of our broadcast operating and license companies in each country.
Bulgaria
We operate one1 general entertainment channel, BTV, and five5 other channels, BTV CINEMA, BTV COMEDY, BTV ACTION, BTV LADY and RING. We own 94% of CME Bulgaria B.V. ("CME Bulgaria"), the subsidiary that owns our Bulgaria operations.
Czech Republic
We operate one1 general entertainment channel, TV NOVA, and seven7 other channels, NOVA 2, NOVA CINEMA, NOVA SPORT 1, NOVA SPORT 2, NOVA ACTION, NOVA GOLD and NOVA INTERNATIONAL, a general entertainment channel broadcasting in the Slovak Republic.
Romania
We operate one1 general entertainment channel, PRO TV, and seven6 other channels, PRO 2, (formerly ACASA), PRO X, (formerly SPORT.RO), PRO GOLD, (formerly ACASA GOLD), PRO CINEMA, PRO TV INTERNATIONAL, MTV ROMANIA, as well as PRO TV CHISINAU, a general entertainment channel broadcasting in Moldova.
Slovak Republic
We operate one1 general entertainment channel, TV MARKIZA, and three3 other channels, DOMA, DAJTO, and MARKIZA INTERNATIONAL, a general entertainment channel broadcasting in the Czech Republic.
Slovenia
We operate 2 general entertainment channels, POP TV and KANAL A, and 3 other channels, KINO, BRIO and OTO.
Merger
On October 27, 2019, the Company entered into an Agreement and Plan of Merger (the "Merger Agreement") with TV Bidco B.V. ("Parent") and TV Bermuda Ltd. ("Merger Sub"). Parent and Merger Sub are affiliates of PPF Group N.V. Pursuant to the Merger Agreement, Merger Sub will merge with and into the Company (the "Merger"), with the Company continuing as the surviving company in the proposed Merger as a wholly-owned subsidiary of Parent.
The closing of the proposed Merger is subject to several conditions, including, but not limited to, the requisite vote of the Company’s shareholders in favor of the Merger Agreement and the proposed Merger, the receipt of certain competition and other regulatory approvals, compliance with covenants and agreements in the Merger Agreement (subject to certain materiality qualifications), and the absence of any governmental order prohibiting completion of the proposed Merger. A special general meeting of shareholders of the Company will be held on February 27, 2020, where shareholders will be asked to vote on a proposal to approve the Merger Agreement, the related statutory merger agreement and the Merger contemplated under such agreements.
Under the Merger Agreement, at the effective time of the proposed Merger (the “Effective Time”), without any action required by the Company, Parent, Merger Sub or any shareholder of the Company or any other person, each Class A Share issued and outstanding immediately prior to the Effective Time will be canceled and cease to exist automatically and each such Class A Share (other than shares owned by the Company, Parent, Merger Sub or any of their respective direct or indirect wholly-owned subsidiaries, in each case not held on behalf of third parties) will be converted into the right to receive $4.58 in cash.
Under the Merger Agreement, at the Effective Time, without any action required by the Company, Parent, Merger Sub or any shareholder of the Company or any other person, the Series A Preferred Share issued and outstanding immediately prior to the Effective Time will be canceled and cease to exist automatically and will be converted into the right to receive the $32,900,000 in cash, without interest and each Series B Preferred Share issued and outstanding immediately prior to the Effective Time will be canceled and cease to exist automatically and will be converted into the right to receive the $1,630.875 in cash, without interest; provided that, among other things, any conversion of the Series A Preferred Share or any Series B Preferred Shares into Class A Shares on or after October 27, 2019 will be deemed to be null and void.
2. BASIS OF PRESENTATION AND SUMMARY OF SIGNIFICANT ACCOUNTING POLICIES
The terms the “Company”"Company", “we”"we", “us”"us", and “our”"our" are used in this Form 10-K to refer collectively to the parent company, Central European Media Enterprises Ltd. (“("CME Ltd.”"), and the subsidiaries through which our various businesses are conducted. Unless otherwise noted, all statistical and financial information presented in this report has been converted into U.S. dollars using period-end exchange rates. All references to “US$”"US$", “USD”"USD" or “dollars”"dollars" are to U.S. dollars, all references to “BGN”"BGN" are to the Bulgarian leva, all references to “CZK”"CZK" are to the Czech koruna, all references to “RON”"RON" are to the New Romanian lei, and all references to “Euro”"Euro" or “EUR”"EUR" are to the European Union Euro. Where applicable, prior period presentation has been modified to conform to current year presentation.
Basis of Consolidation
The consolidated financial statements include the accounts of CME Ltd. and our subsidiaries, after the elimination of intercompany accounts and transactions. Entities in which we hold less than a majority voting interest but over which we have the ability to exercise significant influence are accounted for using the equity method. Other investments are accounted for using the cost method.
CENTRAL EUROPEAN MEDIA ENTERPRISES LTD.
NOTES TO CONSOLIDATED FINANCIAL STATEMENTS
(Tabular amounts in US$ 000’s, except share and per share data)
Use of Estimates
The preparation of financial statements in conformity with US GAAPGenerally Accepted Accounting Principles ("US GAAP") requires management to make estimates and assumptions that affect the reported amounts of assets and liabilities and disclosure of contingent assets and liabilities at the date of the financial statements and the reported amounts of revenues and expenses during the reporting periods. Actual results could differ from those estimates and assumptions.
CENTRAL EUROPEAN MEDIA ENTERPRISES LTD.
NOTES TO CONSOLIDATED FINANCIAL STATEMENTS
(Tabular amounts in US$ 000’s, except share and per share data)
Summary of Critical and Significant Accounting Policies
The following is a discussion of each of the Company’s critical accounting policies, including information and analysis of estimates and assumptions involved in their application, and other significant accounting policies.
Revenue Recognition
Revenue Recognition
Revenues are recognized upon satisfaction of our performance obligations to our customers, in an amount that reflects the consideration to which we expect to be entitled in exchange for those goods or services, net of taxes assessed by a government authority that are both imposed on and concurrent with the specific revenue-producing transaction and collected from the customer.
The timing of revenue recognition may differ from the timing of invoicing to customers. We defer the recognition of revenues when cash payments are received or due in advance of our performance, including amounts which are refundable. We record a receivable when revenue is recognized prior to invoicing, or deferred revenue when thererevenue is persuasive evidencerecognized subsequent to invoicing. Invoicing typically occurs on a monthly basis and customers are obliged to pay within 30 to 60 days of an arrangement, delivery of products has occurred orissuance. For certain services have been rendered,and customer types, we require payment before the price is fixed or determinable and collectibility is reasonably assured. Aservices are provided.
We maintain a bad debt provision is maintained for estimated losses resulting from the inability of our customers' subsequent inabilitycustomers to make required payments. Without evidenceIf the financial condition of our customers were to deteriorate, additional allowances may be required in future periods. We review the contrary, amounts that are past due in excess of one year are written-off in their entirety.
Revenues are recognized net of discountsaccounts receivable balances periodically and our historical bad debt, customer concentrations and customer sales incentives. creditworthiness when evaluating the adequacy of our provision. In the event we recover amounts previously written off, we release the specific allowance to bad debt expense.
In instances where the timing of revenue recognition differs from the timing of invoicing, we have determined our contracts do not include a significant financing component. The primary purpose of our invoicing terms is to provide customers with simplified and predictable ways of purchasing our products and services, not to receive financing from or to provide financing to our customers.
Our principal revenue streams and their respective accounting treatments are discussed below:
Advertising revenue
RevenuesTelevision advertising revenues primarily result from the sale of advertising time. Television advertising revenue is recognizedrevenues are earned as the commercials are aired. In many countries, we commit to provide advertisers with certain rating levels in connection with their advertising. Revenue is recorded based on a charge per Gross Rating Point ("GRP") ordered during the month, net of estimated shortfalls, which are usually settled by providing the advertiser additional advertising time.shortfalls. Discounts and agency commissions on television advertising revenue are recognized at the point when the advertising is broadcaston a monthly basis and are reflected as a reduction to gross revenue. Display advertising on our websites is recognized as impressions are delivered. Impressions are delivered when an advertisement appears in pages viewed by users.
Carriage fees and subscription revenues
Carriage include revenues from cable operators and direct-to-home broadcasters and fees from subscriptions to our streaming services. Revenues from cable operators and direct-to-home broadcasters are recognized as revenue over the period for which the channels are provided and to which the fees relate. SubscriberThis fee revenue is recognized as contracted,generally based uponon the number of subscribers.subscribers to offerings from these operators and broadcasters that include our channels. The impacts of future changes in subscriber levels are recognized when they occur as estimates of future subscribers are constrained. Revenues from subscriptions to our streaming services are recognized over the period of the subscription.
Other revenues primarily include revenues from our internet display advertising, as well as revenues from the licensing of our content. Internet display advertising revenues are recognized on a cost-per-impression basis based on the number of times a customer's advertisement is displayed on our websites. Revenues from the licensing of our content are recognized upon delivery or reasonable access to the content.
Our revenue streams involve significant judgment with respect to the discounts and agency commissions we provide to certain customers based on the amount of advertising purchased. Such discounts are based on estimates of the total amount expected to be earned and reduce revenue based on a systematic and rational allocation of the cost of honoring the discounts earned and claimed to each of the underlying revenue transactions that result in progress by the customer towards earning the discount. Due to the timing of the information provided by the rating agencies, significant judgment may be necessary to estimate the total volume of GRPs delivered within the contract period.
Cash and Cash Equivalents
Cash and cash equivalents consist of cash on hand and marketable securities, if applicable, with original maturities of three months or less. Cash that is subject to restrictions is classified as restricted cash, if applicable.
Program Rights
Purchased program rights
Purchased program rights and the related liabilities are recorded at their gross value when the license period begins and the programs are available for broadcast.
Purchased program rights are classified as current or non-current assets based on anticipated usage, while the related program rights liability is classified as current or non-current according to the payment terms of the license agreement.
Program rights are evaluated to determine if expected revenues are sufficient to cover the unamortized portion of the program. To the extent that expected revenues are insufficient, the program rights are written down to their expected net realizable value. These programming impairment charges, along with programming impairment charges related to own-produced content, are presented as a component of content costs in our consolidated statements of operations and comprehensive income / loss.
CENTRAL EUROPEAN MEDIA ENTERPRISES LTD.
NOTES TO CONSOLIDATED FINANCIAL STATEMENTS
(Tabular amounts in US$ 000’s, except share and per share data)
The costs incurred to acquire program rights are capitalized and amortized over their expected useful lives in a manner which reflects the pattern we expect to use and benefit from the programming. If the initial airing of content allowed by a license is expected to provide more value than subsequent airings, we apply an accelerated method of amortization. These accelerated methods of amortization depend on the estimated number of runs the content is expected to receive, and are determined based on a study of historical results for similar programming. For programming that is not advertising supported, each program's costs are amortized on a straight-line basis over the license period. For content that is expected to be aired only once, the entire cost is expensed on the first run.
Produced program rights
Program rights that are produced by us consist of deferred film and television costs including direct costs, production overhead and development costs. The costs are stated at the lower of cost, net of accumulated amortization, or fairnet realizable value. The amount of capitalized production costs recognized as cost of revenues for a given production as it is exhibited in various markets is determined using the individual film forecast method. The proportion of costs recognized is equal to the proportion of the revenue recognized compared to the total revenue expected to be generated throughout the product's life cycle (the “ultimate revenues”"ultimate revenues"). Our process for evaluating ultimate revenues is tailored to the potential we believe a title has for generating multiple revenues. The majority of our production is intended primarily for exploitation by our own broadcasters. In such cases, we consider mainly the free television window in our calculation of the ultimate revenues. Changes in estimates of ultimate revenues from period to period affect the amount of film costs amortized in a given period and, therefore, could have an impact on our results for that period.
Produced program rights are amortized on an individual production basis using the ratio of the current period's gross revenues to estimated remaining total ultimate revenues from such programs. Produced program rights are evaluated to determine if expected revenues, less additional costs to be incurred (including exploitation costs) are sufficient to cover the unamortized portion of the program. To the extent that expected revenues are insufficient, the program rights are written down to their fairnet realizable value.
CENTRAL EUROPEAN MEDIA ENTERPRISES LTD.
NOTES TO CONSOLIDATED FINANCIAL STATEMENTS
(Tabular amounts in US$ 000’s, except share and per share data)
Property, Plant and Equipment
Property, plant and equipment is carried at cost, less accumulated depreciation. Depreciation is computed using the straight-line method over the estimated useful lives assigned to each major asset category as below:
|
| |
| Asset category | Estimated useful life |
| Land | Indefinite |
| Buildings | 25 years |
| Machinery, fixtures and equipment | 4 - 8 years |
| Other equipment | 3 - 8 years |
| Software | 3 - 5 years |
Construction-in-progress is not depreciated until put into use. CapitalAssets under finance leases are depreciated on a straight-line basis over the shorter of the estimated useful life of the asset or the lease term. Leasehold improvements are depreciated over the shorter of the related lease term or the life of the asset. Assets to be disposed of are reported at the lower of carrying amount or fair value, less expected costs of disposal.
Long-Lived Assets Including Intangible Assets with Finite Lives
Long-lived assets include property, plant, equipment and intangible assets with finite lives. We evaluate the remaining useful life of intangible assets with finite lives each reporting period. We review long-lived assets for impairment whenever events or changes in circumstances indicate that the carrying amount of an asset may not be recoverable. Long-lived assets are evaluated at the asset group level when there is an indication that they may be impaired. The carrying amounts of long-lived assets are considered impaired when the anticipated undiscounted cash flows from such assets are less than their carrying amounts. In that event, a loss is recognized based on the amount by which the carrying amount exceeds the fair value.
Goodwill and Indefinite-Lived Intangible Assets
We evaluate goodwill and indefinite-lived intangible assets for impairment annually as of October 1, or more frequently if events or changes in circumstances indicate that the asset might be impaired. Such events and changes in circumstances include:
under-performance of operating segments or changes in projected results;
changes in the manner of utilization of an asset;
severe and sustained declines in the trading price of shares of our Class A common stock that are not attributable to factors other than the underlying value of our assets;
negative market conditions or economic trends; and
specific events, such as new legislation, new market entrants, changes in technology or adverse legal judgments that we believe could have a negative impact on our business.
Goodwill is evaluated at the reporting unit level, which we have determined is each of our four5 operating segments. We elected to bypass the qualitative assessment for all of our reporting units in 20172019 and proceedproceeded directly to performing the quantitative goodwill impairment test. The fair valuevalues of our reporting units iswere determined based on the present value of expected future cash flows, including terminal value, discounted at appropriate rates, determined separately for each reporting unit, and on publicly available information, where appropriate. The determination of fair value involves the use of significant estimates and assumptions, including: revenue growth rates, operating margins, capital expenditures, working capital requirements, tax rates, terminal growth rates, discount rates, management's long-term plan and a discount rate selected with reference to the relevant cost of capital. An impairment exists when the carrying amount of a reporting unit (including its goodwill), exceeds its fair value.
We evaluate whether the remaining useful life of each indefinite-lived intangible asset each reporting period.remains indefinite. Each indefinite-lived intangible asset is evaluated for impairment individually. The fair valuevalues of our indefinite-lived intangible assets are determined using the relief from royalty method. An impairment loss is recognized if the carrying amount of an indefinite-lived intangible asset exceeds its fair value.
CENTRAL EUROPEAN MEDIA ENTERPRISES LTD.
NOTES TO CONSOLIDATED FINANCIAL STATEMENTS
(Tabular amounts in US$ 000’s, except share and per share data)
Income Taxes
We account for income taxes under the asset and liability method. Deferred tax assets and liabilities are recognized for the expected tax consequences of temporary differences between the tax bases of assets and liabilities and their reported amounts. Deferred tax assets and liabilities are measured using enacted tax rates expected to apply to taxable income in the year in which the temporary differences are expected to be recovered or settled. Valuation allowances are established when necessary to reduce deferred tax assets to amounts which are more likely than not to be realized. In evaluating the realizability of our deferred tax assets, we consider all available positive and negative evidence, including future reversals of existing taxable temporary differences, projected future taxable income, tax planning strategies and recent financial operations.
We recognize in the consolidated financial statements those tax positions determined to be “more"more likely than not”not" of being sustained upon examination, based on the technical merits of the positions and we recognize, when applicable, both accrued interest and penalties related to uncertain tax positions in income tax expense in the accompanying consolidated statements of operations and comprehensive income / loss.
CENTRAL EUROPEAN MEDIA ENTERPRISES LTD.
NOTES TO CONSOLIDATED FINANCIAL STATEMENTS
(Tabular amounts in US$ 000’s, except share and per share data)
Foreign Currency
Translation of financial statements
Our reporting currency is the dollar. The financial statements of our operations whose functional currency is other than the dollar are translated from such functional currency to dollars at the exchange rates in effect at the balance sheet date for assets and liabilities, and at weighted average rates for the period for revenues and expenses, including gains and losses. Translational gains and losses are charged or credited to accumulated other comprehensive income / loss, a component of equity.
Certain of our intercompany loans to our subsidiaries are of a long-term investment nature. We recorded gainsthe results of US$ 11.3 million and US$ 8.8 million and a loss of US$ 89.0 million for the years ended December 31, 2017, 2016, and 2015, respectively, on the retranslation of these intercompany loans as an adjustment to accumulated other comprehensive income / loss, a component of shareholders' equity, as settlement of these loans is not planned or anticipated in the foreseeable future.
Transactions in foreign currencies
Gains and losses from foreign currency transactions are included in foreign currency exchange gain / loss, net in the consolidated statements of operations and comprehensive income / loss in the period during which they arise.
Leases
LeasesWe determine if an arrangement includes a lease at inception. A right-of-use asset ("ROU") represents our right to use an underlying asset for the lease term and the corresponding lease liability represents our obligation to make periodic payments arising from that lease. ROUs and liabilities are classifiedrecognized at their commencement date based on the present value of the lease payments over the lease term. As most of our leases do not provide an implicit rate, we use an incremental borrowing rate based on the information available at the commencement date of a lease in determining the present value of the lease payments. An ROU also includes any lease payments made prior to commencement and excludes any lease incentives received or to be received under the agreement. Our determination of the lease term may include options to extend or terminate the lease when it is reasonably certain that we will exercise such option.
Where lease agreements include both lease and non-lease components, we generally account for each separately. For certain equipment leases, such as either capital or operating. Thosevehicles, we account for the lease and non-lease components as a single lease component. We consider operating leases that transfer substantially all benefits and risksare for a period less than 12 months, inclusive of ownership of the propertyoptions to usextend that we are accounted forreasonably certain to exercise, as capital leases. All othershort-term. Short-term leases are accounted for as operating leases.
Capital leases are accounted for as assets and are depreciatednot recognized on the balance sheet. Short-term lease cost is recognized on a straight-line basis over the shorter of the estimated useful life of the asset or the lease term. Commitments to repay the principal amounts arising under capital
ROUs and related operating lease obligationsliabilities are included in other non-current assets, other current liabilities to the extent that the amount is repayable within one year; otherwise the principal is included inand other non-current liabilities. The capitalized lease obligation reflects the present value of future lease payments. The financing element of the lease payments is charged to interest expense over the term of the lease.
liabilities, respectively on our consolidated balance sheets. Operating lease costs are expensedrecognized on a straight-line basis over the lease term within content costs, other operating costs or sales, general and administrative expenses based on the use of the lease.related ROU. ROUs and related finance lease liabilities are included in property and equipment, and long-term debt and other financing arrangements, respectively, on our consolidated balance sheets. Depreciation of an asset held under a finance lease is recognized in depreciation of property, plant and equipment.
See below "Recent Accounting Pronouncements" for information on the adoption of Financial Accounting Standards Board ("FASB") Accounting Standards Codification Topic 842, "Leases" as at January 1, 2019.
Financial Instruments
Fair value of financial instruments
The carrying amount of financial instruments, including cash, accounts receivable, and accounts payable and accrued liabilities, approximate their fair value due to the short-term nature of these items. The fair value of our long-term debt (as defined hereinafter) is included in Note 5,4, "Long-term Debt and Other Financing Arrangements".
Fair value is the price that would be received to sell an asset or paid to transfer a liability could be exchanged in an arm’s-length orderly transaction between knowledgeable, able and willing parties that is not a forced sale or liquidation.market participants at the measurement date. US GAAP requires significant management estimates in determining fair value. The extent of management’s judgments is highly dependent on the valuation model employed and the observability of inputs to the fair value model. The level of management judgment required in establishing fair value of financial instruments is more significant where there is no active market in which the instrument is traded. For financial instruments that are not remeasured through net income, we estimate fair value at issuance and account for the instrument at amortized cost. For financial instruments that are remeasured through net income, we assess the fair value of the instrument at each period end or earlier when events occur or circumstances change that would so require (see Note 14,12, "Financial Instruments and Fair Value Measurements").
Derivative financial instruments
We use derivative financial instruments for the purpose of mitigating currency and interest rate risks, which exist as part of ongoing business operations and financing activities. As a policy, we do not engage in speculative or leveraged transactions, nor do we hold or issue derivative financial instruments for trading purposes.
CENTRAL EUROPEAN MEDIA ENTERPRISES LTD.
NOTES TO CONSOLIDATED FINANCIAL STATEMENTS
(Tabular amounts in US$ 000’s, except share and per share data)
Forward exchange contracts and currency swaps are used to mitigate exposures to currency fluctuations on certain short-term transactions generally denominated in currencies other than our functional currency. These contracts are marked to market at the balance sheet date, and the resultant unrealized gains and losses are recorded in the consolidated statements of operations and comprehensive income / loss, together with realized gains and losses arising on settlement of these contracts.
Interest rate swaps and other instruments may be used to mitigate exposures to interest rate fluctuations on certain of our long-term debt instruments with variable interest rates. These contracts are marked to market at the balance sheet date, and the resultant unrealized gains and losses are recorded in the consolidated statements of operations and comprehensive income / loss, together with realized gains and losses arising on settlement of these contracts. From time to time, we may designate certain of these instruments as hedges and apply hedge accounting as discussed in Note 14,12, "Financial Instruments and Fair Value Measurements".
Stock-Based Compensation
Stock-based compensation is recognized at fair value. We calculate the fair value of stock option awards using the Black-Scholes option pricing model on the grant date. The grant date fair value of restricted stock units ("RSUs") is calculated as the closing price of our Class A common stock on the date of grant. Stock-based compensation expenseThe fair value of stock awards is recognized on a straight-line basis over the vesting period of the award.award as a component of selling, general and administrative expenses.
For awards with performance conditions, recognition of compensation expense over the vesting period depends on our assessment of the probability that the performance targets will be met. We update our assessments of the probability of achieving performance targets at each reporting period. Changes in our assessments of such probability may result in recording additional expense or reversing previously recorded expense in the current period reported.
Upon vesting of shares or exercise of options, shares of Class A common stock are issued from authorized but unissued shares. Stock-based compensation awards are accounted for as equity-settled transactions. Forfeitures of awards are recognized as they occur.
Contingencies
The estimated loss from a loss contingency such as a legal proceeding or other claim is recorded in the consolidated statements of operations and comprehensive income / loss if it is probable that an asset has been impaired or a liability has been incurred and the amount of the loss can be reasonably estimated. Disclosure of a loss contingency is made if there is at least a reasonable possibility that a loss has been incurred.
CENTRAL EUROPEAN MEDIA ENTERPRISES LTD.
NOTES TO CONSOLIDATED FINANCIAL STATEMENTS
(Tabular amounts in US$ 000’s, except share and per share data)
Advertising Costs
Advertising costs are expensed as incurred. Advertising expense incurred for the years ended December 31, 20172019, 20162018 and 20152017 totaled US$ 5.26.4 million, US$ 4.66.2 million and US$ 2.15.4 million, respectively.
Earnings Per Share
Basic and diluted net income / loss per share is calculated using the two-class method. Under the two-class method, basic net income / loss per common share is computed by dividing the net income available to common shareholders after deducting contractual amounts of accretion on our Series B Preferred Shares, as well as income allocated to these shares, by the weighted-average number of common shares outstanding during the period including the common stock underlying the Series A Preferred Shares. Diluted net income / loss per share is computed by dividing the adjusted net income by the weighted-average number of dilutive shares outstanding during the period.
Discontinued Operations
We present our resultsperiod after adjusting for the impact of those dilutive shares on the allocation of income to the Series B Preferred Shares. For further information on how to calculate basic and diluted earnings per share for continuing operations financial position and cash flows of operations that have either been sold or that meet the criteria for "held-for-sale accounting" as discontinued operations, if the disposal represents a strategic shift that will have a major effect on our operations and financial results. At the time an operation qualifies for held-for-sale accounting, the operation is evaluated to determine whether or not the carrying amount exceeds its fair value less cost to sell. Any loss as a result of carrying amounts in excess of fair value less cost to sell is recorded in the period the operation qualifies for held-for-sale accounting. Management judgment is required to (1) assess the criteria required to meet held-for-sale accounting, and (2) estimate fair value. Our Croatia and Slovenia operations are classified as discontinued operations and assets held for sale for all periods presented. Certain of our Romania operations, which were sold in 2015, are presented as discontinued operations in the year ended December 31, 2015. Seesee Note 3, "Discontinued Operations and Assets Held for Sale"19, "Earnings per-share".
Recent Accounting Pronouncements
Accounting Pronouncements Adopted
On January 1, 2017 we adopted guidance issued by the Financial Accounting Standards Board (the “FASB”) which is intended to improve the accounting for the income tax consequences of intercompany transfers of assets other than inventory. The guidance requires an entity to recognize the income tax consequences of such transfers in the period in which the transfer occurs, rather than defer recognition of current and deferred income taxes for the transfer until the asset is sold to a third party. The adoption of this guidance did not have a material impact on our consolidated financial statements.
On October 1, 2017 we adopted guidance issued by the FASB which is intended to simplify goodwill impairment testing by eliminating Step 2, and instead recognize an impairment charge for the amount by which the carrying amount of the reporting unit exceeds the fair value of the reporting unit. The guidance also eliminates the requirement to perform a qualitative analysis for reporting units with a negative carrying value. The adoption of this guidance did not have any material impacts on our consolidated financial statements or disclosures.
In May 2017, the FASB issued guidance which is intended to provide clarity on which types of modifications to the terms or conditions of a share-based payment award are expected to have an accounting impact. We have early adopted this guidance during the fourth quarter of 2017. There were no impacts as a result of our adopting this guidance for the periods presented and all future impacts are not reasonably estimable.
In August 2017, the FASB issued guidance which is intended to simplify the application of hedge accounting and increase transparency of information about an entity's risk management activities. The guidance changes both the designation and measurement guidance for qualifying hedging relationships and the presentation of hedge results in the financial statements. We have early adopted this guidance during the fourth quarter of 2017. There were no impacts as a result of our adopting this guidance for the periods presented and all future impacts are not reasonably estimable.
Recent Accounting Pronouncements Issued
In May 2014, the FASB issued guidance which is intended to improve the comparability of revenue recognition practices across entities, industries, jurisdictions, and capital markets. The guidance supersedes existing revenue recognition guidance and requires an entity to recognize revenue to depict the transfer of promised goods or services to customers in an amount that reflects the consideration to which the entity expects to be entitled in exchange for those goods or services. The guidance is effective for our fiscal year beginning January 1, 2018. We have completed our evaluation of the impact of adoption and determined that no adjustment or significant changes to our current processes will be necessary. Our television advertising revenues, which comprised approximately 82% of our 2017 revenues are short-term in nature (contracted on a calendar month basis) with transaction price consideration and discounts determined or determinable in advance. Carriage fee and subscription revenues, which comprised approximately 14% of our 2017 revenues, will be recognized under the licensing of intellectual property guidance in the standard, which will not have a material change to our current revenue recognition. Other revenues generally contain elements similar to television advertising or carriage fees. We adopted the guidance beginning January 1, 2018 under the modified retrospective method, in which the cumulative effect of applying the guidance is recognized at the date of initial application.
In February 2016, the FASB issued new guidance to increase transparency and comparability among organizations by recognizing leasing assets and liabilities on the balance sheet and requiring additional disclosures about an entity's leasing arrangements. The guidance requires that a lessee recognize a liability to make lease payments and a right-of-use asset,an ROU, with an available exception for leases with an initial term shorter than twelve months. TheAdoption of the guidance is effectivechanged our accounting for operating leases while the accounting for our fiscal year beginningfinance leases (previously called capital leases) remained substantially unchanged.
We adopted this guidance as of the transition date of January 1, 2019. We are currently2019, using the modified retrospective approach and have elected the transition option which allows us to continue to apply the legacy guidance for comparative periods, including disclosure requirements, in the processyear of evaluatingadoption. We have elected to use the impactpackage of practical expedients available to us, including the adoptionshort-term lease exception, however we have not elected the use of this guidance onhindsight and have not elected to combine lease and non-lease components for our consolidated financial statements.main classes of assets.
IndexOn transition, we recorded US$ 11.9 million in operating lease liabilities and related ROUs.CENTRAL EUROPEAN MEDIA ENTERPRISES LTD.
NOTES TO CONSOLIDATED FINANCIAL STATEMENTS
(Tabular amounts in US$ 000’s, except share and per share data)
Recent Accounting Pronouncements Issued
In June 2016, the FASB issued new guidance to provide financial statement users with more decision-useful information about the expected credit losses on financial instruments and other commitments to extend credit held by a reporting entity at each reporting date. The amendments in this replace the incurred loss impairment methodology in the current guidance with a methodology that reflects expected credit losses and requires consideration of a broader range of reasonable and supportable information to inform credit loss estimates. The guidance is effective for our fiscal year beginning January 1, 2020 with early adoption permitted2020. Based on our assessment, the guidance primarily applies to our accounts receivable and is not expected to substantially change our procedures for estimating our fiscal year beginningbad debt expense or the anticipated results of those procedures. We adopted this guidance on January 1, 2019. We are in the process of assessing the potential impacts of this guidance.2020.
In August 2016,March 2019, the FASB issued new guidance whichthat aligns the accounting for production costs of an episodic television series with the accounting for production costs of films. The guidance further requires that an entity test a film or license agreement or program material for impairment at a film group level and under a fair value model when the film or license agreement is intendedpredominantly monetized with other films and/or license agreements. Further, content acquired under a license agreement is not required to reducebe separately presented on the existing diversity in practice related to specific cash flow issues. As applicable to CME,balance sheet based on the estimated time of usage. Additional disclosures are required. We adopted this guidance on January 1, 2020. Based on our assessment of the guidance, requireseach operating segment predominantly monetizes its content as a film group and we anticipate classifying all our acquired content as non-current on our consolidated balance sheets. We do not anticipate that cash flows at the settlement of zero-coupon debt instruments or debt instruments with coupon interest rates that are insignificant in relation to the effective interest rate of the borrowing be bifurcated between cash outflows for operating activities for the portion attributable to accrued interest, and cash outflows for financing activities for the portion attributable to the principal. The guidance requires a retrospective transition method and is effective for our fiscal year beginning January 1, 2018, with early adoption permitted. Upon adoption, our net cash flows generated from / used in continuing operating activities will decrease by US$ 110.7 million and US$ 1.1 million for the years ended December 31, 2016 and 2015, respectively, with a corresponding increase in net cash used in / provided by continuing financing activities. The adoption of this guidance will have nosignificantly impact on our net cash flows generated from continuing operating activitiesthe impairment we recognize in 2017.the consolidated statement of operations.
3. DISCONTINUED OPERATIONS AND ASSETS HELD FOR SALE
On July 9, 2017, we entered into a framework agreement with Slovenia Broadband S.à r.l. (the "Purchaser"), a wholly owned subsidiary of United Group B.V., relating to the sale of our Croatia and Slovenia operations for cash consideration of EUR 230.0 million (approximately US$ 275.8 million) (the "Divestment Transaction"), subject to customary working capital adjustments. The closing of the Divestment Transaction is subject to obtaining regulatory approvals and other customary closing conditions. On November 15, 2017 the Croatian Agency for Electronic Media ("CAEM") published a decision that the acquisition by the Purchaser is not permitted under the Croatian Act on Electronic Media due to certain cross ownership restrictions that CAEM believes to be applicable to the Divestment Transaction. Following the sale by United Group of certain assets in Croatia to address this cross ownership restriction cited by CAEM, the Purchaser has reapplied for approval from CAEM. We expect the transaction to close subject to obtaining the remaining regulatory approval and other customary closing conditions being satisfied. If the transaction is terminated by either party because the transaction has not closed as of March 31, 2018, we would receive a termination fee of EUR 7.0 million (approximately US$ 8.4 million), subject to certain exceptions, including if the requisite regulatory approvals have not been obtained as a result of the Purchaser being required to make specified material divestitures as a condition to any requisite regulatory approvals or if a notification has not been declared complete by a relevant regulatory authority.
Loss from discontinued operations, net of tax for the year ended December 31, 2015 includes the results of our Romania operations sold during 2015. Separate analysis of the impact of discontinued operations arising in 2017 (Croatia and Slovenia) and 2015 (Romania) is given in Notes 3a and 3b below.
The carrying amounts of the major classes of assets and liabilities of our discontinued operations that are classified as held for sale in the consolidated balance sheets at December 31, 2017 and December 31, 2016 were:
|
| | | | | | | |
| | December 31, 2017 |
| | December 31, 2016 |
|
| Assets held for sale | | | |
| Current assets held for sale | | | |
| Cash and cash equivalents | $ | 8,784 |
| | $ | 2,853 |
|
| Accounts receivable, net | 43,540 |
| | 36,969 |
|
| Program rights, net | 62,017 |
| | 16,489 |
|
| Property, plant and equipment, net | 22,870 |
| | — |
|
| Other current assets | 10,945 |
| | 4,929 |
|
| Total current assets held for sale | $ | 148,156 |
| | $ | 61,240 |
|
| Non-current assets held for sale | | | |
| Program rights, net | $ | — |
| | $ | 35,927 |
|
| Property, plant and equipment, net | — |
| | 20,010 |
|
| Other non-current assets | — |
| | 4,339 |
|
| Total non-current assets held for sale | $ | — |
| | $ | 60,276 |
|
| | | | |
| Liabilities held for sale | | | |
| Current liabilities held for sale | | | |
| Accounts payable and accrued liabilities | $ | 30,073 |
| | $ | 26,603 |
|
| Other current liabilities | 2,058 |
| | 888 |
|
| Total current liabilities held for sale | $ | 32,131 |
| | $ | 27,491 |
|
| Non-current liabilities held for sale | | | |
| Other non-current liabilities | $ | — |
| | $ | 1,415 |
|
| Total non-current liabilities held for sale | $ | — |
| | $ | 1,415 |
|
CENTRAL EUROPEAN MEDIA ENTERPRISES LTD.
NOTES TO CONSOLIDATED FINANCIAL STATEMENTS
(Tabular amounts in US$ 000’s, except share and per share data)
Loss from discontinued operations, net of tax comprised the following for the years ended December 31, 2017, 2016 and 2015:
|
| | | | | | | | | | | |
| | For The Year Ended December 31, |
| | 2017 |
| | 2016 |
| | 2015 |
|
| Net revenues | $ | 126,499 |
| | $ | 111,839 |
| | $ | 116,931 |
|
| Cost of revenues | 88,763 |
| | 89,438 |
| | 92,605 |
|
| Selling, general and administrative expenses | 22,265 |
| | 16,344 |
| | 19,718 |
|
| Operating income | 15,471 |
| | 6,057 |
| | 4,608 |
|
Interest expense (1) | (18,579 | ) | | (20,835 | ) | | (19,699 | ) |
| Other non-operating income / (expense), net | 729 |
| | (413 | ) | | (2,370 | ) |
| Loss from discontinued operations, before tax | (2,379 | ) | | (15,191 | ) | | (17,461 | ) |
| Provision for income taxes | (2,247 | ) | | (981 | ) | | (547 | ) |
| Loss from discontinued operations, net of tax, before loss on sale | (4,626 | ) | | (16,172 | ) | | (18,008 | ) |
| Loss on sale of divested businesses, net of tax | — |
| | — |
| | (11,388 | ) |
| Loss from discontinued operations, net of tax | $ | (4,626 | ) | | $ | (16,172 | ) | | $ | (29,396 | ) |
| |
(1)
| For the years ended December 31, 2017, 2016 and 2015, we paid US$ 17.4 million, US$ 33.3 million and US$ 3.5 million, respectively, of interest and Guarantee Fees associated with the 2018 Euro Term Loan, both as defined in Note 5, "Long-term Debt and Other Financing Arrangements". These payments were allocated to net cash (used in) / provided by discontinued operations - operating activities in our Consolidated Statements of Cash Flows as we are required to apply the expected proceeds from the sale of our Croatia and Slovenia operations towards the repayment of the remaining principal amounts owing in respect of the 2018 Euro Term Loan (see Note 5, "Long-term Debt and Other Financing Arrangements"). |
3a. Discontinued Operations - Croatia and Slovenia
Loss from discontinued operations, net of tax related to the sale of our Croatia and Slovenia operations classified as held for sale and discontinued operations during 2017 comprised the following for the years ended December 31, 2017, 2016 and 2015:
|
| | | | | | | | | | | |
| | For The Year Ended December 31, |
| | 2017 |
| | 2016 |
| | 2015 |
|
| Net revenues | $ | 126,499 |
| | $ | 111,839 |
| | $ | 109,646 |
|
| Cost of revenues | 88,763 |
| | 89,438 |
| | 85,925 |
|
| Selling, general and administrative expenses | 22,265 |
| | 16,344 |
| | 17,185 |
|
| Operating income | 15,471 |
| | 6,057 |
| | 6,536 |
|
| Interest expense | (18,579 | ) | | (20,835 | ) | | (19,677 | ) |
| Other non-operating income / (expense), net | 729 |
| | (413 | ) | | (2,330 | ) |
| Loss from discontinued operations, before tax | (2,379 | ) | | (15,191 | ) | | (15,471 | ) |
| Provision for income taxes | (2,247 | ) | | (981 | ) | | (638 | ) |
| Loss from discontinued operations, net of tax | $ | (4,626 | ) | | $ | (16,172 | ) | | $ | (16,109 | ) |
|
| | | | | | | | | | | |
| PER SHARE DATA: | | | | | |
| Loss from discontinued operations, net of tax per share: | | | | | |
| Basic | $ | (0.03 | ) | | $ | (0.10 | ) | | $ | (0.11 | ) |
| Diluted | (0.03 | ) | | (0.10 | ) | | (0.11 | ) |
Net cash (used in) / provided by discontinued operations classified as held for sale and discontinued operations during 2017 comprised the following for the years ended December 31, 2017, 2016 and 2015:
|
| | | | | | | | | | | |
| | For The Year Ended December 31, |
| | 2017 |
| | 2016 |
| | 2015 |
|
| Net cash (used in) / provided by discontinued operations - operating activities | $ | (4,206 | ) | | $ | (25,900 | ) | | $ | 8,366 |
|
| Net cash used in discontinued operations - investing activities | (6,128 | ) | | (7,155 | ) | | (6,863 | ) |
| Net cash used in discontinued operations - financing activities | (285 | ) | | (247 | ) | | (253 | ) |
CENTRAL EUROPEAN MEDIA ENTERPRISES LTD.
NOTES TO CONSOLIDATED FINANCIAL STATEMENTS
(Tabular amounts in US$ 000’s, except share and per share data)
3b. Discontinued Operations - Romania
During 2015, we completed our non-core divestiture plans with the sale of our Romanian studios, cinema, music, radio and distribution businesses.
Loss from discontinued operations, net of tax related to discontinued operations classified as discontinued during 2015 comprised the following for the year ended December 31, 2015:
|
| | | |
| | For The Year Ended December 31, |
| | 2015 |
|
| Net revenues | $ | 7,285 |
|
| Cost of revenues | 6,680 |
|
| Selling, general and administrative expenses | 2,533 |
|
| Operating loss | (1,928 | ) |
| Interest expense | (22 | ) |
| Other non-operating expense, net | (40 | ) |
| Loss from discontinued operations, before tax | (1,990 | ) |
| Credit for income taxes | 91 |
|
| Loss from discontinued operations, net of tax, before loss on sale | (1,899 | ) |
Loss on sale of divested businesses, net of tax (1) | (11,388 | ) |
| Loss from discontinued operations, net of tax | $ | (13,287 | ) |
| |
(1)
| Amount includes realized gains / losses on completed disposal transactions in 2015. The amount includes losses related to the reclassification of the cumulative translation adjustment into net income of US$ 7.7 million and the reclassification of accumulated losses attributable to noncontrolling interest of US$ 3.7 million. |
|
| | | |
| PER SHARE DATA: | |
| Loss from discontinued operations, net of tax per share: | |
| Basic | $ | (0.09 | ) |
| Diluted | (0.09 | ) |
Net cash provided by discontinued operations classified as discontinued during 2015 comprised the following for the years ended December 31, 2017, 2016 and 2015:
|
| | | | | | | | | | | |
| | For The Year Ended December 31, |
| | 2017 |
| | 2016 |
| | 2015 |
|
| Net cash used in discontinued operations - operating activities | $ | — |
| | $ | — |
| | $ | (3,019 | ) |
| Net cash provided by discontinued operations - investing activities | 2,046 |
| | 1,194 |
| | 6,598 |
|
| Net cash used in discontinued operations - financing activities | — |
| | — |
| | (76 | ) |
CENTRAL EUROPEAN MEDIA ENTERPRISES LTD.
NOTES TO CONSOLIDATED FINANCIAL STATEMENTS
(Tabular amounts in US$ 000’s, except share and per share data)
4.3. GOODWILL AND INTANGIBLE ASSETS
Goodwill:
Goodwill by reporting unit as at December 31, 20172019 and December 31, 2016 is summarized2018 was as follows:
|
| | | | | | | | | | | | | | | | | | | | | | | |
| | Bulgaria | | Czech Republic | | Romania | | Slovak Republic | | Slovenia | | Total |
| Gross Balance, December 31, 2017 | $ | 175,071 |
| | $ | 837,732 |
| | $ | 90,305 |
| | $ | 52,463 |
| | $ | 19,400 |
| | $ | 1,174,971 |
|
| Accumulated impairment losses | (144,639 | ) | | (287,545 | ) | | (11,028 | ) | | — |
| | (19,400 | ) | | (462,612 | ) |
| Balance, December 31, 2017 | 30,432 |
| | 550,187 |
| | 79,277 |
| | 52,463 |
| | — |
| | 712,359 |
|
| Foreign currency | (1,377 | ) | | (28,762 | ) | | (3,505 | ) | | (2,382 | ) | | — |
| | (36,026 | ) |
| Balance, December 31, 2018 | 29,055 |
| | 521,425 |
| | 75,772 |
| | 50,081 |
| | — |
| | 676,333 |
|
| Accumulated impairment losses | (144,639 | ) | | (287,545 | ) | | (11,028 | ) | | — |
| | (19,400 | ) | | (462,612 | ) |
| Gross Balance, December 31, 2018 | $ | 173,694 |
| | $ | 808,970 |
| | $ | 86,800 |
| | $ | 50,081 |
| | $ | 19,400 |
| | $ | 1,138,945 |
|
|
| | | | | | | | | | | | | | | | | | | |
| | Bulgaria | | Czech Republic | | Romania | | Slovak Republic | | Total |
| Gross Balance, December 31, 2015 | $ | 172,365 |
| | $ | 759,491 |
| | $ | 85,443 |
| | $ | 47,605 |
| | $ | 1,064,904 |
|
| Accumulated impairment losses | (144,639 | ) | | (287,545 | ) | | (11,028 | ) | | — |
| | (443,212 | ) |
| Balance, December 31, 2015 | 27,726 |
| | 471,946 |
| | 74,415 |
| | 47,605 |
| | 621,692 |
|
| Foreign currency | (976 | ) | | (15,008 | ) | | (2,657 | ) | | (1,516 | ) | | (20,157 | ) |
| Balance, December 31, 2016 | 26,750 |
| | 456,938 |
| | 71,758 |
| | 46,089 |
| | 601,535 |
|
| Accumulated impairment losses | (144,639 | ) | | (287,545 | ) | | (11,028 | ) | | — |
| | (443,212 | ) |
| Gross Balance, December 31, 2016 | $ | 171,389 |
| | $ | 744,483 |
| | $ | 82,786 |
| | $ | 46,089 |
| | $ | 1,044,747 |
|
|
| | | | | | | | | | | | | | | | | | | | | | | |
| | Bulgaria | | Czech Republic | | Romania | | Slovak Republic | | Slovenia | | Total |
| Gross Balance, December 31, 2018 | $ | 173,694 |
| | $ | 808,970 |
| | $ | 86,800 |
| | $ | 50,081 |
| | $ | 19,400 |
| | $ | 1,138,945 |
|
| Accumulated impairment losses | (144,639 | ) | | (287,545 | ) | | (11,028 | ) | | — |
| | (19,400 | ) | | (462,612 | ) |
| Balance, December 31, 2018 | 29,055 |
| | 521,425 |
| | 75,772 |
| | 50,081 |
| | — |
| | 676,333 |
|
| Foreign currency | (548 | ) | | (3,574 | ) | | (3,279 | ) | | (944 | ) | | — |
| | (8,345 | ) |
| Balance, December 31, 2019 | 28,507 |
| | 517,851 |
| | 72,493 |
| | 49,137 |
| | — |
| | 667,988 |
|
| Accumulated impairment losses | (144,639 | ) | | (287,545 | ) | | (11,028 | ) | | — |
| | (19,400 | ) | | (462,612 | ) |
| Gross Balance, December 31, 2019 | $ | 173,146 |
| | $ | 805,396 |
| | $ | 83,521 |
| | $ | 49,137 |
| | $ | 19,400 |
| | $ | 1,130,600 |
|
|
| | | | | | | | | | | | | | | | | | | |
| | Bulgaria | | Czech Republic | | Romania | | Slovak Republic | | Total |
| Gross Balance, December 31, 2016 | $ | 171,389 |
| | $ | 744,483 |
| | $ | 82,786 |
| | $ | 46,089 |
| | $ | 1,044,747 |
|
| Accumulated impairment losses | (144,639 | ) | | (287,545 | ) | | (11,028 | ) | | — |
| | (443,212 | ) |
| Balance, December 31, 2016 | 26,750 |
| | 456,938 |
| | 71,758 |
| | 46,089 |
| | 601,535 |
|
| Foreign currency | 3,682 |
| | 93,249 |
| | 7,519 |
| | 6,374 |
| | 110,824 |
|
| Balance, December 31, 2017 | 30,432 |
| | 550,187 |
| | 79,277 |
| | 52,463 |
| | 712,359 |
|
| Accumulated impairment losses | (144,639 | ) | | (287,545 | ) | | (11,028 | ) | | — |
| | (443,212 | ) |
| Gross Balance, December 31, 2017 | $ | 175,071 |
| | $ | 837,732 |
| | $ | 90,305 |
| | $ | 52,463 |
| | $ | 1,155,571 |
|
Other intangible assets:
Changes in theThe net book valuevalues of our other intangible assets as at December 31, 20172019 and December 31, 2016 is summarized2018 were as follows:
| | | | December 31, 2017 | | December 31, 2016 | December 31, 2019 | | December 31, 2018 |
| | Gross | | Accumulated Amortization | | Net | | Gross | | Accumulated Amortization | | Net | Gross | | Accumulated Amortization | | Net | | Gross | | Accumulated Amortization | | Net |
| Indefinite-lived: | | | | | | | | | | | | | | | | | | | | | | |
| Trademarks | $ | 87,900 |
| | $ | — |
| | $ | 87,900 |
| | $ | 76,731 |
| | $ | — |
| | $ | 76,731 |
| $ | 85,484 |
| | $ | — |
| | $ | 85,484 |
| | $ | 87,356 |
| | $ | — |
| | $ | 87,356 |
|
| Amortized: | | | | | | | | | | | | | | | | | | | | | | |
| Broadcast licenses | 220,194 |
| | (161,820 | ) | | 58,374 |
| | 184,195 |
| | (128,876 | ) | | 55,319 |
| 208,669 |
| | (169,239 | ) | | $ | 39,430 |
| | 210,447 |
| | (162,936 | ) | | 47,511 |
|
| Trademarks | 421 |
| | (421 | ) | | — |
| | 380 |
| | (380 | ) | | — |
| 609 |
| | (609 | ) | | — |
| | 631 |
| | (631 | ) | | — |
|
| Customer relationships | 58,771 |
| | (56,996 | ) | | 1,775 |
| | 51,338 |
| | (48,997 | ) | | 2,341 |
| 54,807 |
| | (54,288 | ) | | $ | 519 |
| | 56,024 |
| | (55,158 | ) | | 866 |
|
| Other | 1,753 |
| | (1,567 | ) | | 186 |
| | 1,522 |
| | (1,208 | ) | | 314 |
| 4,033 |
| | (1,877 | ) | | 2,156 |
| | 1,868 |
| | (1,549 | ) | | 319 |
|
| Total | $ | 369,039 |
| | $ | (220,804 | ) | | $ | 148,235 |
| | $ | 314,166 |
| | $ | (179,461 | ) | | $ | 134,705 |
| $ | 353,602 |
| | $ | (226,013 | ) | | $ | 127,589 |
| | $ | 356,326 |
| | $ | (220,274 | ) | | $ | 136,052 |
|
BroadcastNet broadcast licenses consist solely of our TV NOVA license in the Czech Republic, which is amortized on a straight-line basis through theits expiration date of the license in 2025. Our customer relationships are deemed to have an economic useful life of, and are amortized on a straight-line basis, over five years to fifteen years. Other intangibles primarily consist of non-cloud based software licenses which are typically amortized on a straight-line basis over the shorter of the contractual term or a period of up to five years.
The estimated amortization expense for the succeeding five years for our intangible assets with finite lives as of December 31, 20172019 is as follows:
|
| | | |
| 2020 | $ | 8,638 |
|
| 2021 | 8,622 |
|
| 2022 | 8,313 |
|
| 2023 | 7,912 |
|
| 2024 | 7,855 |
|
|
| | | |
| 2018 | $ | 9,273 |
|
| 2019 | 8,725 |
|
| 2020 | 8,455 |
|
| 2021 | 8,405 |
|
| 2022 | 8,261 |
|
Impairment of goodwill and other intangible assets:
Our annual assessment of impairment includes the allocation of corporate debt to individual reporting units based on their relative fair values. This allocation resulted in negative carrying values for the Romania and the Slovak Republic segments forFor the purpose of the impairment assessment, this allocation resulted in a negative carrying value for the Slovak Republic and Slovenia segments, however, neither segment wasthese segments were not determined to be impaired.
CENTRAL EUROPEAN MEDIA ENTERPRISES LTD.
NOTES TO CONSOLIDATED FINANCIAL STATEMENTS
(Tabular amounts in US$ 000’s, except share and per share data)
Upon conclusion of our annual impairment assessment, we determined that the fair value of our goodwillreporting units and other intangible assets were substantially in excess of their respective carrying values. We did not recognize any impairment charges in respect of goodwill and other intangible assets during the years ended December 31, 2017, 20162019, 2018 or 2015.2017. See Note 2, "Basis of Presentation and Summary of Significant Accounting Policies" for further information.
CENTRAL EUROPEAN MEDIA ENTERPRISES LTD.
NOTES TO CONSOLIDATED FINANCIAL STATEMENTS
(Tabular amounts in US$ 000’s, except share and per share data)
5.4. LONG-TERM DEBT AND OTHER FINANCING ARRANGEMENTS
Summary
|
| | | | | | | |
| | December 31, 2019 |
| | December 31, 2018 |
|
| Long-term debt | $ | 590,777 |
| | $ | 772,339 |
|
Other credit facilities and finance leases(1) | 16,332 |
| | 15,891 |
|
| Total long-term debt and other financing arrangements | 607,109 |
| | 788,230 |
|
Less: current maturities(1) | (6,836 | ) | | (5,545 | ) |
| Total non-current long-term debt and other financing arrangements | $ | 600,273 |
| | $ | 782,685 |
|
|
| | | | | | | |
| | December 31, 2017 |
| | December 31, 2016 |
|
| Long-term debt | $ | 1,079,187 |
| | $ | 999,209 |
|
| Other credit facilities and capital leases | 9,487 |
| | 3,427 |
|
| Total long-term debt and other financing arrangements | 1,088,674 |
| | 1,002,636 |
|
| Less: current maturities | (2,960 | ) | | (1,228 | ) |
| Total non-current long-term debt and other financing arrangements | $ | 1,085,714 |
| | $ | 1,001,408 |
|
Financing Transactions
Pursuant to an amendment in March 2017 to the Reimbursement Agreement (as defined below) with Time Warner Inc. ("Time Warner"), as guarantor(1) Balance consists entirely of our obligations under the Euro Term Loans (as defined below), the grid pricing structurefinance leases. For more information on the all-in rate that applied only to the 2021 Euro Term Loan (as defined below) was extended to the 2018 Euro Term Loan (as defined below) and the 2019 Euro Term Loan (as defined below), with a reduction in the pricing under the grid for each of the Euro Term Loans resulting in an all-in rate ranging from 8.5% (if our net leverage, as defined in the Reimbursement Agreement, is greater than or equal to seven times) to 5.0% (if our net leverage is less than five times). In addition, we can achieve a further 50 basis point reduction in the all-in rate if we reduce our long-term debt to less than EUR 815.0 million, subject to certain adjustments in respect of specified debt repayments, on or prior to September 30, 2018. As at December 31, 2017, our net leverage ratio was 5.4 times and the all-in interest rate was 6.0% (effective from the end of October 2017). We are required to pay the first 5.0% of the all-in rate (including the base rate and the rate paid pursuant to customary hedging arrangements) on the Euro Term Loans in cash and the remainder may be paid in cash or in kind, at our option. For details,finance leases, see the table below under the heading "Reimbursement Agreement and Guarantee Fees".
On August 1, 2017, we elected to repay EUR 50.0 million (approximately US$ 59.1 million at August 1, 2017 rates) of the outstanding principal balance of the 2018 Euro Term Loan on which we recognized a loss on extinguishment of US$ 0.1 million.
On February 5, 2018, we entered into an amendment to extend the maturity date of the 2018 Euro Term Loan from November 1, 2018 to May 1, 2019. On February 6, 2018, we paid EUR 50.0 million (approximately US$ 61.6 million at February 6, 2018 rates) of the outstanding principal balance of the 2018 Euro Term Loan (see Note 24, "Subsequent Events")11, "Leases".
We are required to apply the proceeds from the sale of our Croatia and Slovenia operations to the repayment of the remaining principal amounts owing in respect of the 2018 Euro Term Loan. Any excess amounts will then be applied to pay fees related to the 2019 Euro Term Loan, including Guarantee Fees and the Commitment Fee which we have previously paid in kind pursuant to the Reimbursement Agreement (see Note 3, "Discontinued Operations and Assets Held for Sale").
Overview
Total long-term debt and credit facilities comprised the following at December 31, 20172019:
|
| | | | | | | | | | | |
| | Principal Amount of Liability Component |
| | Debt Issuance Costs (1) |
| | Net Carrying Amount |
|
| 2021 Euro Loan | $ | 67,781 |
| | $ | (98 | ) | | $ | 67,683 |
|
| 2023 Euro Loan | 526,650 |
| | (3,556 | ) | | 523,094 |
|
| 2023 Revolving Credit Facility | — |
| | — |
| | — |
|
| Total long-term debt and credit facilities | $ | 594,431 |
| | $ | (3,654 | ) | | $ | 590,777 |
|
|
| | | | | | | | | | | |
| | Principal Amount of Liability Component |
| | Debt Issuance Costs (1) |
| | Net Carrying Amount |
|
| 2018 Euro Term Loan | $ | 240,819 |
| | $ | (274 | ) | | $ | 240,545 |
|
| 2019 Euro Term Loan | 282,238 |
| | (367 | ) | | 281,871 |
|
| 2021 Euro Term Loan | 562,232 |
| | (5,461 | ) | | 556,771 |
|
| 2021 Revolving Credit Facility | — |
| | — |
| | — |
|
| Total long-term debt and credit facilities | $ | 1,085,289 |
| | $ | (6,102 | ) | | $ | 1,079,187 |
|
| |
(1) | Debt issuance costs related to the 20182021 Euro Term Loan, 2019the 2023 Euro Term Loan and 2021 Euro Term Loanthe 2023 Revolving Credit Facility (each as defined below) are being amortized on a straight-line basis, which approximates the effective interest method, over the life of the respective instruments. Debt issuance costs related to the 20212023 Revolving Credit Facility are classified as non-current assets in our consolidated balance sheet and are being amortized on a straight-line basis over the life of the 2021 Revolving Credit Facility.sheet. |
On January 31, 2019, June 14, 2019 and September 23, 2019, we paid EUR 60.0 million (approximately US$ 68.9 million at January 31, 2019 rates), EUR 40.0 million (approximately US$ 45.1 million at June 14, 2019 rates) and EUR 50.0 million (approximately US$ 54.9 million at September 23, 2019 rates), respectively, of the outstanding principal balance of the 2021 Euro Loan.
At December 31, 2019, the maturity of our long-term debt and credit facilities was as follows:
|
| | | |
| 2020 | — |
|
| 2021 | 67,781 |
|
| 2022 | — |
|
| 2023 | 526,650 |
|
| 2024 | — |
|
| 2025 and thereafter | — |
|
| Total long-term debt and credit facilities | 594,431 |
|
| Debt issuance costs | (3,654 | ) |
| Carrying amount of long-term debt and credit facilities | $ | 590,777 |
|
Long-term Debt
Our long-term debt comprised the following at December 31, 20172019 and December 31, 2016:2018:
|
| | | | | | | | | | | | | | | |
| | Carrying Amount | | Fair Value |
| | December 31, 2019 |
| | December 31, 2018 |
| | December 31, 2019 |
| | December 31, 2018 |
|
| 2021 Euro Loan | $ | 67,683 |
| | $ | 240,296 |
| | $ | 68,120 |
| | $ | 233,058 |
|
| 2023 Euro Loan | 523,094 |
| | 532,043 |
| | 529,303 |
| | 502,617 |
|
| | $ | 590,777 |
| | $ | 772,339 |
| | $ | 597,423 |
| | $ | 735,675 |
|
|
| | | | | | | | | | | | | | | |
| | Carrying Amount | | Fair Value |
| | December 31, 2017 |
| | December 31, 2016 |
| | December 31, 2017 |
| | December 31, 2016 |
|
| 2018 Euro Term Loan | $ | 240,545 |
| | $ | 263,734 |
| | $ | 236,337 |
| | $ | 233,297 |
|
| 2019 Euro Term Loan | 281,871 |
| | 247,594 |
| | 268,858 |
| | 203,314 |
|
| 2021 Euro Term Loan | 556,771 |
| | 487,881 |
| | 510,882 |
| | 369,738 |
|
| | $ | 1,079,187 |
| | $ | 999,209 |
| | $ | 1,016,077 |
| | $ | 806,349 |
|
The estimated fair values of the Euro Term Loans (as defined below) as at December 31, 20172019 and December 31, 20162018 were determined based onusing the average yield curve of comparable instruments that trade in active markets. This measurement of estimated fair value usesbonds with equivalent credit ratings which is a Level 2 inputsinput as described in Note 14,12, "Financial Instruments and Fair Value Measurements". Certain derivative instruments, including contingent event of default and change of control put options, have been identified as being embedded in each of the Euro Term Loans. The embedded derivatives are considered clearly and closely related to their respective Euro Term Loan, and as such are not required to be accounted for separately.
CENTRAL EUROPEAN MEDIA ENTERPRISES LTD.
NOTES TO CONSOLIDATED FINANCIAL STATEMENTS
(Tabular amounts in US$ 000’s, except share and per share data)
2018 Euro Term Loan
As at December 31, 2017, the principal amount of our floating rate senior unsecured term credit facility (as amended, the "2018 Euro Term Loan") outstanding was EUR 200.8 million (approximately US$ 240.8 million). The 2018 Euro Term Loan bears interest at three-month EURIBOR (fixed pursuant to customary hedging arrangements (see Note 14, "Financial Instruments and Fair Value Measurements")) plus a margin of between 1.1% and 1.9% depending on the credit rating of Time Warner Inc. ("Time Warner"). As at December 31, 2017, the all-in borrowing rate on amounts outstanding under the 2018 Euro Term Loan was 6.0% (the components of which are shown in the table below under the heading "Interest Rate Summary").
Interest on the 2018 Euro Term Loan is payable quarterly in arrears on each March 12, June 12, September 12 and December 12. Pursuant to an amendment entered into on February 5, 2018, the maturity date of the 2018 Euro Term Loan was extended to May 1, 2019. See Note 24, "Subsequent Events". The 2018 Euro Term Loan may currently be prepaid at our option, in whole or in part, without premium or penalty. The 2018 Euro Term Loan is a senior unsecured obligation of CME Ltd., and is unconditionally guaranteed by our 100% owned subsidiary CME Media Enterprises B.V. ("CME BV") and by Time Warner and certain of its subsidiaries.
2019 Euro Term Loan
As at December 31, 2017, the principal amount of our floating rate senior unsecured term credit facility (the "2019 Euro Term Loan") outstanding was EUR 235.3 million (approximately US$ 282.2 million). The 2019 Euro Term Loan bears interest at three-month EURIBOR (fixed pursuant to customary hedging arrangements (see Note 14, "Financial Instruments and Fair Value Measurements")) plus a margin of between 1.1% and 1.9% depending on the credit rating of Time Warner. As at December 31, 2017, the all-in borrowing rate on amounts outstanding under the 2019 Euro Term Loan was 6.0% (the components of which are shown in the table below under the heading "Interest Rate Summary").
Interest on the 2019 Euro Term Loan is payable quarterly in arrears on each February 13, May 13, August 13 and November 13. The 2019 Euro Term Loan matures on November 1, 2019 and may currently be prepaid at our option, in whole or in part, without premium or penalty. The 2019 Euro Term Loan is a senior unsecured obligation of CME Ltd., and is unconditionally guaranteed by CME BV and by Time Warner and certain of its subsidiaries.
2021 Euro Term Loan
As at December 31, 2017,2019, the principal amount of our floating rate senior unsecured term credit facility (the "2021 Euro Term Loan") outstanding was EUR 468.860.3 million (approximately US$ 562.267.8 million). The 2021 Euro Term Loan bears interest at three-month EURIBOR (fixed pursuant to customary hedging arrangements (see Note 14,12, "Financial Instruments and Fair Value Measurements")) plus a margin of between 1.1% and 1.9% depending on the credit rating of Time Warner.Warner Media. As at December 31, 2017,2019, the all-in borrowing rate on amounts outstanding under the 2021 Euro Term Loan was 6.0%3.25% (the components of which are shown in the table below under the heading "Interest Rate Summary").
Interest on the 2021 Euro Term Loan is payable quarterly in arrears on each April 7, July 7, October 7February 13, May 13, August 13 and January 7.November 13. The 2021 Euro Term Loan matures on February 19,November 1, 2021 and may be prepaid at our option, in whole or in part, without premium or penalty uponfrom cash generated from our operations. From April 26, 2020, the earlier of the occurrence of certain events, including if2021 Euro Loan may be refinanced at our net leverage (as defined in the Reimbursement Agreement) decreases to below five times for two consecutive quarters, or at any time from February 19, 2020.option. The 2021 Euro TermLoan is a senior unsecured obligation of CME Ltd. and is unconditionally guaranteed by CME Media Enterprises B.V. ("CME BV") and by Warner Media, LLC ("Warner Media") and certain of its subsidiaries.
2023 Euro Loan
As at December 31, 2019, the principal amount of our floating rate senior unsecured term credit facility (the "2023 Euro Loan") outstanding was EUR 468.8 million (approximately US$ 526.7 million). The 2023 Euro Loan bears interest at three-month EURIBOR (fixed pursuant to customary hedging arrangements (see Note 12, "Financial Instruments and Fair Value Measurements")) plus a margin of between 1.1% and 1.9% depending on the credit rating of Warner Media. As at December 31, 2019, the all-in borrowing rate on amounts outstanding under the 2023 Euro Loan was 3.50% (the components of which are shown in the table below under the heading "Interest Rate Summary").
Interest on the 2023 Euro Loan is payable quarterly in arrears on each January 7, April 7, July 7 and October 7. The 2023 Euro Loan matures on April 26, 2023 and may be prepaid at our option, in whole or in part, without premium or penalty from cash generated from our operations. From April 26, 2020, the 2023 Euro Loan may be refinanced at our option. The 2023 Euro Loan is a senior unsecured obligation of CME BV and is unconditionally guaranteed by CME Ltd. and by Time Warner Media and certain of its subsidiaries.
Reimbursement Agreement and Guarantee Fees
In connection with Time Warner’sWarner Media’s guarantees of the 20182021 Euro Term Loan, the 2019 Euro Term Loan and 20212023 Euro Term Loan (collectively, the “Euro Term Loans”"Euro Loans"), we entered into a reimbursement agreement (as amended, the “Reimbursement Agreement") with Time Warner.Warner Media. The Reimbursement Agreement provides for the payment of guarantee fees (collectively, the "Guarantee Fees") to Time Warner Media as consideration for those guarantees, and the reimbursement to Time Warner Media of any amounts paid by them under any guarantee or through any loan purchase right exercised by it. The loan purchase right allows Time Warner Media to purchase any amount outstanding under the Euro Term Loans from the lenders following an event of default under the Euro Term Loans or the Reimbursement Agreement. The Reimbursement Agreement is jointly and severally guaranteed by both our 100%wholly owned subsidiary Central European Media Enterprises N.V. ("CME NV") and CME BV and is secured by a pledge over 100% of the outstanding shares of each of CME NV and CME BV. The covenants and events of default under the Reimbursement Agreement are substantially the same as under the 20212023 Revolving Credit Facility (described below).
We pay Guarantee Fees to Time Warner Media based on the amounts outstanding on the Euro Term Loans calculated on a per annum basis and on our consolidated net leverage (as defined in the Reimbursement Agreement) as shown in the tabletables below:
| | | Consolidated Net Leverage | Consolidated Net Leverage | Cash Rate (1) |
| | PIK Fee Rate |
| | Total Rate (2) |
| Consolidated Net Leverage | 2021 Euro Loan |
| | 2023 Euro Loan |
|
| ≥ | 7.0x | | 5.00 | % | | 3.50 | % | | 8.50 | % | 7.0x | | 6.00 | % | | 6.50 | % |
| < | 7.0x | - | 6.0x | | 5.00 | % | | 2.25 | % | | 7.25 | % | 7.0x | - | 6.0x | | 5.00 | % | | 5.50 | % |
| < | 6.0x | - | 5.0x | | 5.00 | % | | 1.00 | % | | 6.00 | % | 6.0x | - | 5.0x | | 4.25 | % | | 4.75 | % |
| < | 5.0x | | 5.00 | % | | — | % | | 5.00 | % | 5.0x | - | 4.0x | | 3.75 | % | | 4.25 | % |
| < | | 4.0x | - | 3.0x | | 3.25 | % | | 3.75 | % |
| < | | 3.0x | | 3.25 | % | | 3.50 | % |
| |
(1)
| Includes cash paid for interest for the Euro Term Loans and the related customary hedging arrangements. |
| |
(2)
| If we reduce our long-term debt to less than EUR 815.0 million, subject to certain adjustments in respect of specified debt repayments, prior to September 30, 2018, a 50 basis point reduction in the all-in rate would be applied. |
Our consolidated net leverage as at December 31, 20172019 and December 31, 20162018 was 5.4x2.4x and 6.9x,3.5x, respectively. For the years ended December 31, 2017, 20162019, 2018 and 2015,2017, we recognized US$ 46.013.4 million, US$ 52.7 million26.7 million; and US$ 6.155.7 million, respectively, of Guarantee Fees as interest expense in our consolidated statements of operations and comprehensive income / loss.
The Guarantee Fees relating to the 20182021 Euro Term Loan and the 2019 Euro Term Loan are payable semi-annually in arrears on each May 1 and November 1. The Guarantee Fees relating to the 20212023 Euro Term Loan are payable semi-annually in arrears on each June 1 and December 1.
The first 5.0% ofGuarantee Fees on the all-in rate for each facility (including the base rate and the rate paid pursuant to the hedging arrangements) must be2023 Euro Loan that were previously paid in cashkind are presented as a component of other non-current liabilities (see Note 10, "Other Liabilities") and bear interest per annum at the remainder is payable at our electionapplicable Guarantee Fee rate (as set forth in the table below). Guarantee Fees are included in cash orflows from operating activities in kind.our consolidated statements of cash flows.
CENTRAL EUROPEAN MEDIA ENTERPRISES LTD.
NOTES TO CONSOLIDATED FINANCIAL STATEMENTS
(Tabular amounts in US$ 000’s, except share and per share data)
The Guarantee Fees paid in kind are presented as a component of other non-current liabilities (see Note 11, "Other Liabilities") and bear interest per annum at their respective Guarantee Fee rate (as set forth in the table below). Guarantee Fees paid in cash are included in cash flows from operating activities in our consolidated statements of cash flows.
Interest Rate Summary |
| | | | | | | | | | | |
| | Base Rate |
| | Rate Fixed Pursuant to Interest Rate Hedges |
| | Guarantee Fee Rate |
| | All-in Borrowing Rate |
|
| 2021 Euro Loan | 1.28 | % | | 0.47 | % | | 1.50 | % | | 3.25 | % |
| 2023 Euro Loan | 1.28 | % | | 0.28 | % | (1) | 1.94 | % | | 3.50 | % |
| 2023 Revolving Credit Facility (if drawn) | 5.16 | % | (2) | — |
| | — |
| | 5.16 | % |
|
| | | | | | | | | | | |
| | Base Rate |
| | Rate Fixed Pursuant to Interest Rate Hedges |
| | Guarantee Fee Rate |
| | All-in Borrowing Rate |
|
| 2018 Euro Term Loan | 1.50 | % | | 0.14 | % | | 4.36 | % | | 6.00 | % |
| 2019 Euro Term Loan | 1.50 | % | | 0.31 | % | | 4.19 | % | | 6.00 | % |
| 2021 Euro Term Loan | 1.50 | % | | 0.28 | % | | 4.22 | % | | 6.00 | % |
2021 Revolving Credit Facility (1) | 8.69 | % | (2) | — |
| | — |
| | 8.69 | % |
| |
(1) | As at December 31, 2017,Effective until February 19, 2021. From February 19, 2021 through maturity on April 26, 2023, the 2021 Revolving Credit Facility was undrawn.rate fixed pursuant to interest rate hedges will increase to 0.97%, with a corresponding decrease in the Guarantee Fee rate, such that the all-in borrowing rate remains 3.50% if our net leverage ratio remains unchanged. |
| |
(2) | Based on the three month LIBOR of 1.69%1.91% as at December 31, 2017.2019. |
20212023 Revolving Credit Facility
We had no0 balance outstanding under the US$ 115.075.0 million revolving credit facility (the “2021“2023 Revolving Credit Facility”) as at December 31, 2017. The available amount decreased to US$ 50.0 million from January 1, 2018.2019.
The 20212023 Revolving Credit Facility bears interest at a rate per annum based on, at our option, an alternate base rate ("ABR Loans" as defined in the 2023 Revolving Credit Facility Agreement) plus 6.0%the spread applicable to ABR Loans based on our consolidated net leverage or an amount equal to the greater of (i) an adjusted LIBO rate and (ii) 1.0%, plus in each case, 7.0%, with the first 5.0% paid in cash and the remainder payable at our election in cash or in kind by adding such accrued interestspread applicable to the applicable principal amount outstanding underEurodollar Loans (as defined in the 2021 Revolving Credit Facility. The interest rate on the 20212023 Revolving Credit Facility is determinedAgreement) based on the basis of our consolidated net leverage ratio (as defined in the Reimbursement Agreement) and ranges from LIBOR (subject to a floor of 1.0%) plus 9.0% if our net leverage is greater than or equal to seven times, to LIBOR (subject to a floor of 1.0%) plus 6.0% per annum if our net leverage ratio is less than five times., with all amounts payable in cash. The maturity date of the 20212023 Revolving Credit Facility is February 19, 2021.April 26, 2023. When drawn, the 20212023 Revolving Credit Facility permits prepayment at our option in whole or in part without penalty.
As at December 31, 2019, the following spreads were applicable:
|
| | | | | | | | | |
| Consolidated Net Leverage | Alternate Base Rate Loans |
| | Eurodollar Loans |
|
| ≥ | 7.0x | | | | 5.25 | % | | 6.25 | % |
| < | 7.0x | - | 6.0x | | 4.25 | % | | 5.25 | % |
| < | 6.0x | - | 5.0x | | 3.50 | % | | 4.50 | % |
| < | 5.0x | - | 4.0x | | 3.00 | % | | 4.00 | % |
| < | 4.0x | - | 3.0x | | 2.50 | % | | 3.50 | % |
| < | 3.0x | | | | 2.25 | % | | 3.25 | % |
The 20212023 Revolving Credit Facility is jointly and severally guaranteed by CME NV and CME BV and is secured by a pledge over 100% of the outstanding shares of each of CME NV and CME BV. The 20212023 Revolving Credit Facility agreement contains limitations on CME’s ability to incur indebtedness, incur guarantees, grant liens, pay dividends or make other distributions, enter into certain affiliate transactions, consolidate, merge or effect a corporate reconstruction, make certain investments acquisitions and loans, and conduct certain asset sales. The agreement also contains maintenance covenants in respect of interest cover cash flow cover and total leverage ratios, and has covenants in respect of incurring indebtedness, the provision of guarantees, making investments and disposals, granting security and certain events of defaults.
Other Credit Facilities and CapitalFinance Lease Obligations
Other
Cash Pooling
We have a cash pooling arrangement with Bank Mendes Gans (“BMG”), a subsidiary of ING Bank N.V. (“ING”), which enables us to receive credit facilities and capital lease obligations comprisedthroughout the following at December 31, 2017 and December 31, 2016:group in respect of cash balances which our subsidiaries deposit with BMG. Cash deposited by our subsidiaries with BMG is pledged as security against the drawings of other subsidiaries up to the amount deposited.
|
| | | | | | | |
| | December 31, 2017 |
| | December 31, 2016 |
|
Credit facilities (1) – (3) | $ | — |
| | $ | — |
|
| Capital leases | 9,487 |
| | 3,427 |
|
| Total credit facilities and capital leases | 9,487 |
| | 3,427 |
|
| Less: current maturities | (2,960 | ) | | (1,228 | ) |
| Total non-current credit facilities and capital leases | $ | 6,527 |
| | $ | 2,199 |
|
| |
(1)
| We have a cash pooling arrangement with Bank Mendes Gans (“BMG”), a subsidiary of ING Bank N.V. (“ING”), which enables us to receive credit throughout the group in respect of cash balances which our subsidiaries deposit with BMG. Cash deposited by our subsidiaries with BMG is pledged as security against the drawings of other subsidiaries up to the amount deposited. |
As at December 31, 2017,2019, we had deposits of US$ 12.411.6 million in and no0 drawings on the BMG cash pool. Interest is earned on deposits at the relevant money market rate. As at December 31, 2016,2018, we had deposits of US$ 16.436.8 million in and no0 drawings on the BMG cash pool.
| |
(2)Factoring Arrangements Under a factoring framework agreement with Factoring Česka spořitelna, a.s., up to CZK 475.0 million (approximately US$ 21.0 million) of receivables from certain customers in the Czech Republic may be factored on a recourse or non-recourse basis. The facility has a factoring fee of 0.19% of any factored receivable and bears interest at one-month PRIBOR plus 0.95% per annum for the period that receivables are factored and outstanding. Under a factoring framework agreement with Factoring KB, a.s., certain receivables in the Czech Republic may be factored on a non-recourse basis. The facility has a factoring fee of 0.11% of any factored receivable and bears interest at one-month PRIBOR plus 0.95% per annum for the period that receivables are factored and outstanding up to a maximum of 60 days from the due date. Under a factoring framework agreement with Global Funds IFN S.A., receivables from certain customers in Romania may be factored on a non-recourse basis. The facility has a factoring fee of 4.0% of any factored receivable and bears interest at 6.0% per annum from the date the receivables are factored to the due date of the factored receivable. As at December 31, 2019, and December 31, 2018, we had no outstanding liability balances on any of our factoring arrangements. Finance Leases For additional information on finance leases, see Note 11, "Leases" | As at December 31, 2017, there were CZK 127.2 million (approximately US$ 6.0 million) of receivables factored on a non-recourse basis under a CZK 575.0 million (approximately US$ 27.0 million) factoring framework agreement with Factoring Ceska Sporitelna (“FCS”) that were derecognized from the consolidated balance sheet. Under this facility, up to CZK 575.0 million (approximately US$ 27.0 million) of receivables from certain customers in the Czech Republic may be factored on a recourse or non-recourse basis. The facility has a factoring fee of 0.19% of any factored receivable and bears interest at one-month PRIBOR plus 0.95% per annum for the period that receivables are factored and outstanding. |
| |
(3)
| As at December 31, 2017 there were RON 99.8 million (approximately US$ 25.6 million) of receivables factored under a factoring framework agreement with Global Funds IFN S.A that were derecognized from the consolidated balance sheet. Under this facility, receivables from certain customers in Romania may be factored on a non-recourse basis. The facility has a factoring fee of 4.0% of any factored receivable and bears interest at 6.0% per annum from the date the receivables are factored to the due date of the factored receivable. |
CENTRAL EUROPEAN MEDIA ENTERPRISES LTD.
NOTES TO CONSOLIDATED FINANCIAL STATEMENTS
(Tabular amounts in US$ 000’s, except share and per share data)
Total Group
At December 31, 2017, the maturity of our long-term and credit facilities was as follows:
|
| | | |
2018 (1) | $ | 240,819 |
|
| 2019 | 282,238 |
|
| 2020 | — |
|
| 2021 | 562,232 |
|
| 2022 | — |
|
| 2023 and thereafter | — |
|
| Total long-debt and credit facilities | 1,085,289 |
|
| Debt issuance costs | (6,102 | ) |
| Carrying amount of long-debt and credit facilities | $ | 1,079,187 |
|
| |
(1)
| On February 5, 2018, we entered into an amendment to extend the maturity date of the 2018 Euro Term Loan from November 1, 2018 to May 1, 2019. On February 6, 2018, we paid EUR 50.0 million (approximately US$ 61.6 million as at February 6, 2018 rates) of the outstanding principal balance of the 2018 Euro Term Loan (see Note 24, "Subsequent Events"). |
Capital Lease Commitments
We lease certain of our office and broadcast facilities as well as machinery and equipment under various leasing arrangements. The future minimum lease payments, by year and in the aggregate, under capital leases with initial or remaining non-cancellable lease terms in excess of one year, consisted of the following at December 31, 2017:
|
| | | |
| 2018 | $ | 3,238 |
|
| 2019 | 2,828 |
|
| 2020 | 2,516 |
|
| 2021 | 1,294 |
|
| 2022 | 2 |
|
| 2023 and thereafter | — |
|
| Total undiscounted payments | 9,878 |
|
| Less: amount representing interest | (391 | ) |
| Present value of net minimum lease payments | $ | 9,487 |
|
6.5. PROGRAM RIGHTS
Program rights comprised the following at December 31, 20172019 and December 31, 20162018:
|
| | | | | | | |
| | December 31, 2019 |
| | December 31, 2018 |
|
| Program rights: | | | |
| Acquired program rights, net of amortization | $ | 135,352 |
| | $ | 153,761 |
|
| Less: current portion of acquired program rights | (75,909 | ) | | (77,624 | ) |
| Total non-current acquired program rights | 59,443 |
| | 76,137 |
|
| Produced program rights – Feature Films: | | | |
| Released, net of amortization | 504 |
| | 653 |
|
| Produced program rights – Television Programs: | | | |
| Released, net of amortization | 57,190 |
| | 55,220 |
|
| Completed and not released | 16,578 |
| | 8,347 |
|
| In production | 32,248 |
| | 30,904 |
|
| Development and pre-production | 274 |
| | 610 |
|
| Total produced program rights | 106,794 |
| | 95,734 |
|
| Total non-current acquired program rights and produced program rights | $ | 166,237 |
| | $ | 171,871 |
|
|
| | | | | | | |
| | December 31, 2017 |
| | December 31, 2016 |
|
| Program rights: | | | |
| Acquired program rights, net of amortization | $ | 161,929 |
| | $ | 146,070 |
|
| Less: current portion of acquired program rights | (69,706 | ) | | (69,662 | ) |
| Total non-current acquired program rights | 92,223 |
| | 76,408 |
|
| Produced program rights – Feature Films: | | | |
| Released, net of amortization | 939 |
| | 1,039 |
|
| Produced program rights – Television Programs: | | | |
| Released, net of amortization | 49,888 |
| | 43,970 |
|
| Completed and not released | 9,987 |
| | 2,592 |
|
| In production | 28,971 |
| | 19,109 |
|
| Development and pre-production | 162 |
| | 310 |
|
| Total produced program rights | 89,947 |
| | 67,020 |
|
| Total non-current acquired program rights and produced program rights | $ | 182,170 |
| | $ | 143,428 |
|
6. ACCOUNTS RECEIVABLE
Accounts receivable comprised the following at December 31, 2019 and December 31, 2018:
|
| | | | | | | |
| | December 31, 2019 |
| | December 31, 2018 |
|
| Third-party customers | $ | 197,166 |
| | $ | 203,068 |
|
| Less: allowance for bad debts and credit notes | (8,548 | ) | | (9,697 | ) |
| Total accounts receivable | $ | 188,618 |
| | $ | 193,371 |
|
Bad debt (release) / expense for the years ended December 31, 2019, 2018 and 2017 was US$ (2.5) million, US$ 0.8 million, and US$ 1.9 million, respectively.
7. OTHER ASSETS
Other current and non-current assets comprised the following at December 31, 2019 and December 31, 2018:
|
| | | | | | | |
| | December 31, 2019 |
| | December 31, 2018 |
|
Current: | | | |
| Prepaid acquired programming | $ | 27,237 |
| | $ | 29,918 |
|
| Other prepaid expenses | 12,775 |
| | 9,119 |
|
| VAT recoverable | 7,775 |
| | 1,702 |
|
| Other | 1,045 |
| | 328 |
|
| Total other current assets | $ | 48,832 |
| | $ | 41,067 |
|
| | | | |
| | December 31, 2019 |
| | December 31, 2018 |
|
| Non-current: | |
| | |
|
| Capitalized debt costs (Note 4) | $ | 7,277 |
| | $ | 9,660 |
|
| Deferred tax | 2,261 |
| | 2,411 |
|
| Operating lease - right-of-use assets (Note 11) | 11,682 |
| | — |
|
| Other | 947 |
| | 337 |
|
| Total other non-current assets | $ | 22,167 |
| | $ | 12,408 |
|
Capitalized debt costs are being amortized over the term of the 2023 Revolving Credit Facility using the straight-line method, which approximates the effective interest method.
8. PROPERTY, PLANT AND EQUIPMENT
Property, plant and equipment comprised the following at December 31, 2019 and December 31, 2018:
|
| | | | | | | |
| | December 31, 2019 |
| | December 31, 2018 |
|
| Land and buildings | $ | 100,502 |
| | $ | 100,574 |
|
| Machinery, fixtures and equipment | 212,810 |
| | 206,491 |
|
| Other equipment | 36,007 |
| | 35,022 |
|
| Software | 70,294 |
| | 68,239 |
|
| Construction in progress | 4,774 |
| | 4,663 |
|
| Total cost | 424,387 |
| | 414,989 |
|
| Less: accumulated depreciation | (310,486 | ) | | (297,385 | ) |
| Total net book value | $ | 113,901 |
| | $ | 117,604 |
|
| | | | |
| Assets held under finance leases (included in the above) | |
| | |
|
| Land and buildings | $ | 3,914 |
| | $ | 3,989 |
|
| Machinery, fixtures and equipment | 31,961 |
| | 25,414 |
|
| Total cost | 35,875 |
| | 29,403 |
|
| Less: accumulated depreciation | (15,799 | ) | | (10,705 | ) |
| Total net book value | $ | 20,076 |
| | $ | 18,698 |
|
Depreciation expense for the years ended December 31, 2019, 2018 and 2017 was US$ 33.5 million, US$ 32.9 million and US$ 31.3 million, respectively.
The movement in the net book value of property, plant and equipment during the years ended December 31, 2019 and 2018 was comprised of:
|
| | | | | | | |
| | For The Year Ended December 31, |
| | 2019 |
| | 2018 |
|
| Opening balance | $ | 117,604 |
| | $ | 119,349 |
|
Additions (1) | 32,348 |
| | 36,737 |
|
| Disposals | (29 | ) | | (42 | ) |
| Depreciation | (33,536 | ) | | (32,933 | ) |
| Foreign currency movements | (2,486 | ) | | (5,507 | ) |
| Ending balance | $ | 113,901 |
| | $ | 117,604 |
|
(1) Includes assets acquired under finance leases. For additional information, see Note 11, "Leases"
9. ACCOUNTS PAYABLE AND ACCRUED LIABILITIES
Accounts payable and accrued liabilities comprised the following at December 31, 2019 and December 31, 2018:
|
| | | | | | | |
| | December 31, 2019 |
| | December 31, 2018 |
|
| Accounts payable and accrued expenses | $ | 56,343 |
| | $ | 48,708 |
|
| Related party accounts payable | 267 |
| | 292 |
|
| Programming liabilities | 17,293 |
| | 16,072 |
|
| Related party programming liabilities | 10,553 |
| | 12,171 |
|
| Duties and other taxes payable | 9,426 |
| | 9,014 |
|
Accrued staff costs(1) | 24,027 |
| | 17,425 |
|
| Accrued interest payable | 2,104 |
| | 2,456 |
|
| Related party accrued interest payable (including Guarantee Fees) | 1,103 |
| | 1,749 |
|
| Income taxes payable | 10,304 |
| | 10,415 |
|
| Other accrued liabilities | 4,230 |
| | 2,166 |
|
| Total accounts payable and accrued liabilities | $ | 135,650 |
| | $ | 120,468 |
|
(1) Includes certain retention bonuses related to the proposed Merger agreed in 2019.
10. OTHER LIABILITIES
Other current and non-current liabilities comprised the following at December 31, 2019and December 31, 2018:
|
| | | | | | | |
| | December 31, 2019 |
| | December 31, 2018 |
|
| Current: | | | |
| Deferred revenue | $ | 9,451 |
| | $ | 9,906 |
|
| Legal provisions | 635 |
| | 1,978 |
|
| Operating lease liabilities (Note 11) | 3,203 |
| | — |
|
| Other | 226 |
| | 1,795 |
|
| Total other current liabilities | $ | 13,515 |
| | $ | 13,679 |
|
| | | | |
| | December 31, 2019 |
| | December 31, 2018 |
|
| Non-current: | |
| | |
|
| Deferred tax | $ | 21,294 |
| | $ | 22,545 |
|
| Derivative instruments (Note 12) | 12,670 |
| | 9,817 |
|
| Related party Guarantee Fee payable (Note 4) | 33,465 |
| | 33,465 |
|
| Operating lease liabilities (Note 11) | 8,434 |
| | — |
|
| Other | 4,137 |
| | 1,466 |
|
| Total other non-current liabilities | $ | 80,000 |
| | $ | 67,293 |
|
During the years ended December 31, 2019, 2018 and 2017, we recognized revenue of US$ 9.7 million, US$ 5.4 million and US$ 4.9 million which we had deferred as at December 31, 2018, 2017 and 2016, respectively.
CENTRAL EUROPEAN MEDIA ENTERPRISES LTD.
NOTES TO CONSOLIDATED FINANCIAL STATEMENTS
(Tabular amounts in US$ 000’s, except share and per share data)
7. ACCOUNTS RECEIVABLE11. LEASES
Accounts receivable comprised the following at December 31, 2017We enter into operating and December 31, 2016:finance leases for offices, production and related facilities, cars and certain equipment. Our leases have remaining lease terms up to ten years.
|
| | | | | | | |
| | December 31, 2017 |
| | December 31, 2016 |
|
| Third-party customers | $ | 168,805 |
| | $ | 149,957 |
|
| Less: allowance for bad debts and credit notes | (9,902 | ) | | (8,586 | ) |
| Total accounts receivable | $ | 158,903 |
| | $ | 141,371 |
|
Bad debt expenseThe components of lease cost for the yearsyear ended December 31, 2017, 2016 and 2015 was US$ 1.9 million, US$ 3.7 million, and US$ 2.3 million, respectively.2019 were as follows:
|
| | | |
| Operating lease cost: | |
| Short-term operating lease cost | $ | 6,046 |
|
| Long-term operating lease cost | 4,600 |
|
| Total operating lease cost | $ | 10,646 |
|
| | |
| Finance lease cost: | |
| Amortization of right-of-use asset | $ | 5,894 |
|
| Interest on lease liabilities | 355 |
|
| Total finance lease cost | $ | 6,249 |
|
8. OTHER ASSETS
Other current and non-current assets comprisedThe classification of cash flows related to our leases for the following at year ended December 31, 2017 and December 31, 2016:2019 was as follows:
|
| | | |
| Cash paid for amounts included in the measurement of lease liabilities: | |
| Operating cash flows from operating leases | $ | 4,432 |
|
| Operating cash flows from finance leases | 362 |
|
| Financing cash flows from finance leases | 7,097 |
|
| | |
| Right-of-use assets obtained in exchange for lease obligations: | |
| Operating leases | $ | 3,802 |
|
| Finance leases | 5,753 |
|
|
| | | | | | | |
| | December 31, 2017 |
| | December 31, 2016 |
|
Current: | | | |
| Prepaid acquired programming | $ | 22,579 |
| | $ | 19,123 |
|
| Other prepaid expenses | 7,616 |
| | 4,610 |
|
| VAT recoverable | 650 |
| | 635 |
|
| Income taxes recoverable | 109 |
| | 166 |
|
| Other | 2,152 |
| | 3,007 |
|
| Total other current assets | $ | 33,106 |
| | $ | 27,541 |
|
| | | | |
| | December 31, 2017 |
| | December 31, 2016 |
|
| Non-current: | |
| | |
|
| Capitalized debt costs | $ | 12,947 |
| | $ | 15,019 |
|
| Deferred tax | 2,964 |
| | 4,550 |
|
| Other | 958 |
| | 1,704 |
|
| Total other non-current assets | $ | 16,869 |
| | $ | 21,273 |
|
Capitalized debt costs are being amortized over the term of the 2021 Revolving Credit Facility using the straight-line method, which approximates the effective interest method.
9. PROPERTY, PLANT AND EQUIPMENT
Property, plant and equipment comprised the following at December 31, 2017 and December 31, 2016:
|
| | | | | | | |
| | December 31, 2017 |
| | December 31, 2016 |
|
| Land and buildings | $ | 86,480 |
| | $ | 72,820 |
|
| Machinery, fixtures and equipment | 195,682 |
| | 160,097 |
|
| Other equipment | 16,121 |
| | 13,682 |
|
| Software | 53,143 |
| | 40,627 |
|
| Construction in progress | 3,026 |
| | 5,311 |
|
| Total cost | 354,452 |
| | 292,537 |
|
| Less: accumulated depreciation | (250,804 | ) | | (203,457 | ) |
| Total net book value | $ | 103,648 |
| | $ | 89,080 |
|
| | | | |
| Assets held under capital leases (included in the above) | |
| | |
|
| Machinery, fixtures and equipment | $ | 14,193 |
| | $ | 6,338 |
|
| Total cost | 14,193 |
| | 6,338 |
|
| Less: accumulated depreciation | (5,151 | ) | | (2,579 | ) |
| Total net book value | $ | 9,042 |
| | $ | 3,759 |
|
Depreciation expense for the years ended December 31, 2017, 2016 and 2015 was US$ 27.0 million, US$ 23.1 million and US$ 21.3 million, respectively.
CENTRAL EUROPEAN MEDIA ENTERPRISES LTD.
NOTES TO CONSOLIDATED FINANCIAL STATEMENTS
(Tabular amounts in US$ 000’s, except share and per share data)
The movement in the net book value of property, plantOur current and equipment during the years ended December 31, 2017non-current assets and 2016 is comprised of:
|
| | | | | | | |
| | For The Year Ended December 31, |
| | 2017 |
| | 2016 |
|
| Opening balance | $ | 89,080 |
| | $ | 87,943 |
|
| Additions | 27,442 |
| | 27,203 |
|
| Disposals | (32 | ) | | (88 | ) |
| Depreciation | (26,991 | ) | | (23,106 | ) |
| Foreign currency movements | 14,149 |
| | (2,872 | ) |
| Ending balance | $ | 103,648 |
| | $ | 89,080 |
|
10. ACCOUNTS PAYABLE AND ACCRUED LIABILITIES
Accounts payable and accrued liabilities related to our leasing arrangements comprised the following at December 31, 2017 and 2019: |
| | | |
| Operating Leases | |
| Operating lease right-of-use-assets, gross | $ | 15,396 |
|
| Accumulated amortization | (3,714 | ) |
| Operating lease right-of-use-assets, net | $ | 11,682 |
|
| | |
| Other current liabilities | $ | 3,203 |
|
| Other non-current liabilities | 8,434 |
|
| Total operating lease liabilities | $ | 11,637 |
|
| | |
| Finance Leases | |
| Property, plant and equipment, gross | $ | 35,875 |
|
| Accumulated depreciation | (15,799 | ) |
| Property, plant and equipment, net | $ | 20,076 |
|
| | |
| Current portion of long-term debt and other financing arrangements | $ | 6,836 |
|
| Long-term debt and other financing arrangements | 9,496 |
|
| Total finance lease liabilities | $ | 16,332 |
|
| | |
| Weighted Average Remaining Lease Term | Years |
|
| Operating leases | 4.9 |
|
| Finance leases | 2.7 |
|
| | |
| Weighted Average Discount Rate | Discount Rate |
|
| Operating leases | 4.7 | % |
| Finance leases | 2.1 | % |
Our lease liabilities had the following maturities at December 31, 2016:2019: |
| | | | | | | |
| | Operating Leases |
| | Finance Leases |
|
| 2020 | $ | 3,659 |
| | $ | 7,109 |
|
| 2021 | 3,015 |
| | 5,645 |
|
| 2022 | 2,248 |
| | 2,914 |
|
| 2023 | 1,467 |
| | 1,137 |
|
| 2024 | 888 |
| | — |
|
| 2025 and thereafter | 1,859 |
| | — |
|
| Total undiscounted payments | 13,136 |
| | 16,805 |
|
| Less: amount representing interest | (1,499 | ) | | (473 | ) |
| Present value of net minimum lease payments | $ | 11,637 |
| | $ | 16,332 |
|
|
| | | | | | | |
| | December 31, 2017 |
| | December 31, 2016 |
|
| Accounts payable and accrued expenses | $ | 53,408 |
| | $ | 45,037 |
|
| Related party accounts payable | 252 |
| | 194 |
|
| Programming liabilities | 16,923 |
| | 26,603 |
|
| Related party programming liabilities | 20,027 |
| | 17,126 |
|
| Duties and other taxes payable | 8,769 |
| | 10,325 |
|
| Accrued staff costs | 18,430 |
| | 16,476 |
|
| Accrued interest payable | 3,326 |
| | 2,935 |
|
| Related party accrued interest payable (including Guarantee Fees) | 6,273 |
| | 9,588 |
|
| Income taxes payable | 14,018 |
| | 5,091 |
|
| Other accrued liabilities | 2,467 |
| | 1,003 |
|
| Total accounts payable and accrued liabilities | $ | 143,893 |
| | $ | 134,378 |
|
11. OTHER LIABILITIES
Other current and non-current liabilities comprised the following at December 31, 2017and December 31, 2016:
|
| | | | | | | |
| | December 31, 2017 |
| | December 31, 2016 |
|
| Current: | | | |
| Deferred revenue | $ | 5,675 |
| | $ | 4,979 |
|
| Legal provisions | 2,907 |
| | 2,412 |
|
| Other | 698 |
| | 1,076 |
|
| Total other current liabilities | $ | 9,280 |
| | $ | 8,467 |
|
| | | | |
| | December 31, 2017 |
| | December 31, 2016 |
|
| Non-current: | |
| | |
|
| Deferred tax | $ | 20,569 |
| | $ | 19,710 |
|
Related party commitment fee payable (1) | 10,765 |
| | 9,905 |
|
| Related party Guarantee Fee payable (Note 5) | 58,855 |
| | 34,492 |
|
| Other | 5,065 |
| | 3,856 |
|
| Total other non-current liabilities | $ | 95,254 |
| | $ | 67,963 |
|
| |
(1)
| Represents the commitment fee ("Commitment Fee") payable to Time Warner, including accrued interest, in respect of its obligation under a commitment letter dated November 14, 2014 between Time Warner and us whereby Time Warner agreed to provide or assist with arranging a loan facility to repay our 5.0% senior convertible notes at maturity in November 2015. The Commitment Fee is payable by November 1, 2019, the maturity date of the 2019 Euro Term Loan, or earlier if the repayment of the 2019 Euro Term Loan is accelerated. The Commitment Fee bears interest at 8.5% per annum and such interest is payable in arrears on each May 1 and November 1, and may be paid in cash or in kind, at our election. |
CENTRAL EUROPEAN MEDIA ENTERPRISES LTD.
NOTES TO CONSOLIDATED FINANCIAL STATEMENTS
(Tabular amounts in US$ 000’s, except share and per share data)
12. CONVERTIBLE REDEEMABLE PREFERRED SHARES
200,000 shares of our Series B Convertible Redeemable Preferred Stock, par value US$ 0.08 per share (the “Series B Preferred Shares”) were issued and outstanding as at December 31, 2017 and 2016. As at December 31, 2017 and 2016, the carrying value of the Series B Preferred Shares was US$ 264.6 million and US$ 254.9 million, respectively. The Series B Preferred Shares are held by Time Warner Media Holdings B.V. ("TW Investor"). As of December 31, 2017, the 200,000 shares of Series B preferred stock were convertible into approximately 109.2 million shares of Class A common stock.
The initial stated value of the Series B Preferred Shares of US$ 1,000 per share accretes at an annual rate of 3.75%, compounded quarterly, from June 25, 2016 to June 24, 2018. We have the right to pay cash to the holder in lieu of any further accretion. Each Series B Preferred Share may, at the holder's option, be converted into the number of shares of our Class A common stock determined by dividing (i) the accreted stated value plus accrued but unpaid dividends, if any, in each case as of the conversion date, by (ii) the conversion price, which was approximately US$ 2.42 at December 31, 2017, but is subject to adjustment from time to time pursuant to customary weighted-average anti-dilution provisions with respect to our issuances of equity or equity-linked securities at a price below the then-applicable conversion price (excluding any securities issued under our benefit plans at or above fair market value). We have the right to redeem the Series B Preferred Shares in whole or in part upon 30 days' written notice. The redemption price of each outstanding Series B Preferred Share is equal to its accreted stated value plus accrued but unpaid dividends, if any, in each case as of the redemption date specified in the redemption notice. After receipt of a redemption notice, each holder of Series B Preferred Shares will have the right to convert, prior to the date of redemption, all or part of such Series B Preferred Shares to be redeemed by us into shares of our Class A common stock in accordance with the terms of conversion described above.
Holders of the Series B Preferred Shares have no voting rights on any matter presented to holders of any class of our capital stock, with the exception that they may vote with holders of shares of our Class A common stock (i) with respect to a change of control event or (ii) as provided by our Bye-laws or applicable Bermuda law. Holders of Series B Preferred Shares will participate in any dividends declared or paid on our Class A common stock on an as-converted basis. The Series B Preferred Shares will rank pari passu with our Series A Convertible Preferred Stock and senior to all other equity securities of the Company in respect of payment of dividends and distribution of assets upon liquidation. The Series B Preferred Shares have such other rights, powers and preferences as are set forth in the Certificate of Designation for the Series B Preferred Shares.
We concluded that the Series B Preferred Shares were not considered a liability and that the embedded conversion feature in the Series B Preferred Shares was clearly and closely related to the host contract and therefore did not need to be bifurcated. The Series B Preferred Shares are required to be classified outside of permanent equity because such shares can be redeemed for cash in certain circumstances. The Series B Preferred Shares are carried on the balance sheet at redemption value. As the Series B Preferred Shares are redeemable, we have accreted changes in the redemption value since issuance. For the years ended December 31, 2017, 2016 and 2015, we recognized accretion on the Series B Preferred Shares of US$ 9.7 million, US$ 13.7 million and US$ 17.3 million, respectively, with corresponding decreases in additional paid-in capital.
13. EQUITY
Preferred Stock
5,000,000 shares of Preferred Stock were authorized as at December 31, 2017 and 2016.
One share of Series A Convertible Preferred Stock (the “Series A Preferred Share”) was issued and outstanding as at December 31, 2017 and 2016. The Series A Preferred Share is convertible into 11,211,449 shares of Class A common stock on the date that is 61 days after the date on which the ownership of our outstanding shares of Class A common stock by a group that includes TW Investor and its affiliates would not be greater than 49.9%. The Series A Preferred Share is entitled to one vote per each share of Class A common stock into which it is convertible and has such other rights, powers and preferences, including potential adjustments to the number of shares of Class A common stock to be issued upon conversion, as are set forth in the Certificate of Designation for the Series A Preferred Share.
200,000 shares of Series B Preferred Shares were issued and outstanding as at December 31, 2017 and 2016. (see Note 12, "Convertible Redeemable Preferred Shares"). As of December 31, 2017, the 200,000 Series B Preferred Shares were convertible into approximately 109.2 million shares of Class A common stock.
Class A and B Common Stock
440,000,000 shares of Class A common stock and 15,000,000 shares of Class B common stock were authorized as at December 31, 2017 and 2016. The rights of the holders of Class A common stock and Class B common stock are identical except for voting rights. The shares of Class A common stock are entitled to one vote per share and the shares of Class B common stock are entitled to ten votes per share. Shares of Class B common stock are convertible into shares of Class A common stock on a one-for-one basis for no additional consideration. Holders of each class of shares are entitled to receive dividends and upon liquidation or dissolution are entitled to receive all assets available for distribution to holders of our common stock. Under our bye-laws, the holders of each class have no preemptive or other subscription rights and there are no redemption or sinking fund provisions with respect to such shares.
There were 145.5 million and 143.4 million shares of Class A common stock outstanding at December 31, 2017 and 2016, respectively, and no shares of Class B common stock outstanding at December 31, 2017 or 2016.
As at December 31, 2017, TW Investor owns 42.2% of the outstanding shares of Class A common stock and has a 46.3% voting interest in the Company due to its ownership of the Series A Preferred Share.
Warrants
On May 2, 2014, we issued 114,000,000 warrants in connection with a rights offering. Each warrant may be exercised until May 2, 2018 and entitles the holder thereof to receive one share of our Class A common stock at an exercise price of US$ 1.00 per share in cash. During the year ended December 31, 2017, 1,148,469 warrants were exercised resulting in net proceeds to us of approximately US$ 1.1 million. As at December 31, 2017, 105,854,576 warrants remained outstanding. Time Warner and TW Investor collectively hold 100,926,996 of these warrants. The warrants are classified in additional paid-in capital, a component of equity, and are not subject to subsequent revaluation.
CENTRAL EUROPEAN MEDIA ENTERPRISES LTD.
NOTES TO CONSOLIDATED FINANCIAL STATEMENTS
(Tabular amounts in US$ 000’s, except share and per share data)
Accumulated Other Comprehensive Loss
The movement in accumulated other comprehensive loss during the years ended December 31, 2017, 2016 and 2015 comprised the following:
|
| | | | | | | | | | | |
| | Currency translation adjustment, net |
| | Unrealized (loss) / gain on derivative instruments designated as hedging instruments |
| | TOTAL Accumulated Other Comprehensive Loss |
|
| BALANCE December 31, 2014 | $ | (169,028 | ) | | $ | (581 | ) | | $ | (169,609 | ) |
| Other comprehensive income / (loss) before reclassifications: | | | | | |
Foreign exchange loss on intercompany loans (1) | (88,997 | ) | | — |
| | (88,997 | ) |
| Reclassified to net income upon sale of subsidiaries | 19,136 |
| | — |
| | 19,136 |
|
| Currency translation adjustment | (2,100 | ) | | — |
| | (2,100 | ) |
| Change in the fair value of hedging instruments | — |
| | (1,418 | ) | | (1,418 | ) |
| Amounts reclassified from accumulated other comprehensive loss: | | | | | |
| Changes in fair value reclassified to interest expense | — |
| | 579 |
| | 579 |
|
| Net other comprehensive loss | (71,961 | ) | | (839 | ) | | (72,800 | ) |
| BALANCE December 31, 2015 | $ | (240,989 | ) | | $ | (1,420 | ) | | $ | (242,409 | ) |
| Other comprehensive income / (loss) before reclassifications: | | | | | |
Foreign exchange gain on intercompany loans (1) | 8,848 |
| | — |
| | 8,848 |
|
| Foreign exchange loss on the Series B Preferred Shares | (19,412 | ) | | — |
| | (19,412 | ) |
| Currency translation adjustment | 12,016 |
| | — |
| | 12,016 |
|
| Change in the fair value of hedging instruments | — |
| | (5,447 | ) | | (5,447 | ) |
| Amounts reclassified from accumulated other comprehensive loss: | | | | | |
| Changes in fair value reclassified to interest expense | — |
| | 2,416 |
| | 2,416 |
|
| Net other comprehensive income / (loss) | 1,452 |
| | (3,031 | ) | | (1,579 | ) |
| BALANCE December 31, 2016 | $ | (239,537 | ) | | $ | (4,451 | ) | | $ | (243,988 | ) |
| Other comprehensive income / (loss) before reclassifications: | | | | | |
Foreign exchange gain on intercompany loans (1) | 11,326 |
| | — |
| | 11,326 |
|
| Foreign exchange gain on the Series B Preferred Shares | 33,444 |
| | — |
| | 33,444 |
|
| Currency translation adjustment | 10,511 |
| | — |
| | 10,511 |
|
| Change in the fair value of hedging instruments | — |
| | (1,942 | ) | | (1,942 | ) |
| Amounts reclassified from accumulated other comprehensive loss: | | | | | |
| Changes in fair value reclassified to interest expense | — |
| | 2,764 |
| | 2,764 |
|
Changes in fair value reclassified to other non-operating income, net (2) | — |
| | 447 |
| | 447 |
|
| Net other comprehensive income | 55,281 |
| | 1,269 |
| | 56,550 |
|
| BALANCE December 31, 2017 | $ | (184,256 | ) | | $ | (3,182 | ) | | $ | (187,438 | ) |
| |
(1)
| Represents foreign exchange gains on intercompany loans that are of a long-term investment nature which are reported in the same manner as translation adjustments. |
| |
(2)
| We expect to repay the 2018 Euro Term Loan with the expected proceeds from the Divestment Transaction and have dedesignated the related hedging instruments during the third quarter of 2017. Dedesignation precludes recognition of the effective portion of the changes in fair value within accumulated other comprehensive income / loss. All related changes in fair value and those previously recognized in accumulated other comprehensive income / loss are recognized in other non-operating income, net in our consolidated statements of operations and comprehensive income / loss. See Note 14, "Financial Instruments and Fair Value Measurements". |
CENTRAL EUROPEAN MEDIA ENTERPRISES LTD.
NOTES TO CONSOLIDATED FINANCIAL STATEMENTS
(Tabular amounts in US$ 000’s, except share and per share data)
14. FINANCIAL INSTRUMENTS AND FAIR VALUE MEASUREMENTS
ASC 820, “Fair"Fair Value Measurements and Disclosure”Disclosure", establishes a hierarchy that prioritizes the inputs to those valuation techniques used to measure fair value. The hierarchy gives the highest priority to unadjusted quoted prices in active markets for identical assets or liabilities (Level 1 measurements) and the lowest priority to unobservable inputs (Level 3 measurements). The three levels of the fair value hierarchy are:
Basis of Fair Value Measurement
| |
| Level 1 | Unadjusted quoted prices in active markets that are accessible at the measurement date for identical, unrestricted instruments. |
| |
| Level 2 | Quoted prices in markets that are not considered to be active or financial instruments for which all significant inputs are observable, either directly or indirectly. |
| |
| Level 3 | Prices or valuations that require inputs that are both significant to the fair value measurement and unobservable. |
A financial instrument’s level within the fair value hierarchy is based on the lowest level of any input that is significant to the fair value measurement.
We evaluate the position of each financial instrument measured at fair value in the hierarchy individually based on the valuation methodology we apply. The carrying amount of financial instruments, including cash and cash equivalents, accounts receivable, and accounts payable and accrued liabilities, approximate their fair value due to the short-term nature of these items. The fair value of our long-term debt is included in Note 5,4, "Long-term Debt and Other Financing Arrangements".
CENTRAL EUROPEAN MEDIA ENTERPRISES LTD.
NOTES TO CONSOLIDATED FINANCIAL STATEMENTS
(Tabular amounts in US$ 000’s, except share and per share data)
Hedging Activities
Cash Flow Hedges of Interest Rate Risk
We are party to interest rate swap agreements to mitigate our exposure to interest rate fluctuations on the outstanding principal amount of the Euro Term Loans. These interest rate swaps designated as cash flow hedges, provide us with variable-rate cash receipts in exchange for fixed-rate payments over the lives of the agreements, with no exchange of the underlying notional amount. These instruments are carried at fair value on our consolidated balance sheets as other current and other non-current liabilities based on their maturity, and the effective portion of the changes in the fair value is recorded in accumulated other comprehensive income / loss and subsequently reclassified to interest expense when the hedged item affects earnings. The ineffective portion of changes in the fair value is recognized immediately in other non-operating income, net in our consolidated statements of operations and comprehensive income / loss. For the years ended December 31, 2017 and 2016 and 2015, we did not recognize any charges related to hedge ineffectiveness.
Information relating to financial instruments is as follows: |
| | | | | | | | | | | | | | | | | |
| Trade Date | | Number of Contracts |
| | Description | | Aggregate Notional Amount |
| | Maturity Date | | Objective | | Fair Value as at December 31, 2017 |
|
| April 5, 2016 | | 5 |
| | Interest rate swap | | EUR | 468,800 |
| | February 21, 2021 | | Interest rate hedge underlying 2021 Euro Term Loan | | $ | (1,795 | ) |
| April 5, 2016 | | 4 |
| | Interest rate swap | | EUR | 200,800 |
| | November 1, 2018 | | Interest rate hedge underlying 2018 Euro Term Loan | | $ | (292 | ) |
| November 10, 2015 | | 3 |
| | Interest rate swap | | EUR | 235,335 |
| | November 1, 2019 | | Interest rate hedge underlying 2019 Euro Term Loan | | $ | (1,512 | ) |
We value the interest rate swap agreements using a valuation model which calculates the fair value on the basis of the net present value of the estimated future cash flows. The most significant input used in the valuation model is the expected EURIBOR-based yield curve. These instruments were allocated to Level 2 of the fair value hierarchy because the critical inputs to this model, including current interest rates, relevant yield curves and the known contractual terms of the instruments, were readily observable.
In August 2017, we settledAs at December 31, 2019, each instrument is fully designated as a cash flow hedge. All changes in part the interest rate swaps underlying the 2018 Euro Term Loan to align with the EUR 50.0 million reduction of the principal balance of that loan following the repayment on August 1, 2017 (see Note 5, "Long-term Debt and Other Financing Arrangements"). Changes in fair value for the settled portion of these interest rate swaps is recognized within other non-operating income, net in our consolidated statements of operations and comprehensive income / loss.
The expected proceeds from the sale of the Croatia and Slovenia segments will be used to satisfy amounts owing in respect of the 2018 Euro Term Loan (see Note 5, "Long-term Debt and Other Financing Arrangements"). The related interest rate swap maturing November 1, 2018 was dedesignated which precludes recognition of the effective portion of the changes in fair value within accumulated other comprehensive income / loss. All related fair value adjustments, including those previously recognizedinstruments are recorded in accumulated other comprehensive income / loss are recognized in other non-operating income, net in our consolidated statements of operations and comprehensive income / loss (see Note 13, "Equity").subsequently reclassified to interest expense when the hedged item affects earnings.
Information relating to financial instruments is as follows: |
| | | | | | | | | | | | | | | |
| Trade Date | | Number of Contracts |
| | Aggregate Notional Amount |
| | Maturity Date | | Objective | | Fair Value as at December 31, 2019 |
|
| April 26, 2018 | | 3 |
| | EUR | 60,335 |
| | November 1, 2021 | | Interest rate hedge underlying 2021 Euro Loan | | $ | (585 | ) |
| April 5, 2016 | | 5 |
| | EUR | 468,800 |
| | February 19, 2021 | | Interest rate hedge underlying 2023 Euro Loan | | $ | (1,672 | ) |
| April 26, 2018 | | 4 |
| | EUR | 468,800 |
| | April 26, 2023 | | Interest rate hedge underlying 2023 Euro Loan, forward starting on February 19, 2021 | | $ | (10,413 | ) |
Foreign Currency Risk
From time to time, we have entered into forward foreign exchange contracts to reduce our exposure to movements in foreign exchange rates related to contractual payments under certain dollar-denominated agreements. We had 0 such agreements outstanding during the year ended December 31, 2019.
Fair Value of Derivatives
The change in fair value of derivatives not recognized within accumulated other comprehensive income / loss comprised the following for the years ended December 31, 2019, 2018 and 2017:
|
| | | | | | | | | | | |
| | For The Year Ended December 31, |
| | 2019 |
| | 2018 |
| | 2017 |
|
| Loss on currency swaps | $ | — |
| | $ | — |
| | $ | (1,380 | ) |
| Loss on interest rate swaps | (201 | ) | | (1,715 | ) | | (403 | ) |
| Change in fair value of derivatives | $ | (201 | ) | | $ | (1,715 | ) | | $ | (1,783 | ) |
13. CONVERTIBLE REDEEMABLE PREFERRED SHARES
200,000 shares of our Series B Convertible Redeemable Preferred Stock, par value US$ 0.08 per share (the “Series B Preferred Shares”) were issued and outstanding as at December 31, 2019 and 2018. The Series B Preferred Shares are held by Time Warner Media Holdings B.V. ("TW Investor"), a wholly owned subsidiary of AT&T. As at December 31, 2019 and 2018, the accreted value of the Series B Preferred Shares was US$ 269.4 million. The Series B Preferred Shares have a stated value of US$ 1,000 per share and no longer accrete subsequent to June 24, 2018. As of December 31, 2019, the 200,000 shares of Series B preferred stock were convertible into approximately 111.1 million shares of Class A common stock.
Pursuant to the Certificate of Designation of the Series B Preferred Shares, each Series B Preferred Share may, at the holder's option, be converted into the number of shares of our Class A common stock determined by dividing (i) the accreted stated value plus accrued but unpaid dividends, if any, in each case as of the conversion date, by (ii) the conversion price, which was approximately US$ 2.42 at December 31, 2019, but is subject to adjustment from time to time pursuant to customary weighted-average anti-dilution provisions with respect to our issuances of equity or equity-linked securities at a price below the then-applicable conversion price (excluding any securities issued under our benefit plans at or above fair market value). We have the right to redeem the Series B Preferred Shares in whole or in part upon 30 days' written notice. The redemption price of each outstanding Series B Preferred Share is equal to its accreted stated value plus accrued but unpaid dividends, if any, in each case as of the redemption date specified in the redemption notice. After receipt of a redemption notice, each holder of Series B Preferred Shares will have the right to convert, prior to the date of redemption, all or part of such Series B Preferred Shares to be redeemed by us into shares of our Class A common stock in accordance with the terms of conversion described above.
Holders of the Series B Preferred Shares have no voting rights on any matter presented to holders of any class of our capital stock, with the exception that they may vote with holders of shares of our Class A common stock (i) with respect to a change of control event or (ii) as provided by our Bye-laws or applicable Bermuda law. Holders of Series B Preferred Shares will participate in any dividends declared or paid on our Class A common stock on an as-converted basis. The Series B Preferred Shares will rank pari passu with our Series A Convertible Preferred Stock and senior to all other equity securities of the Company in respect of payment of dividends and distribution of assets upon liquidation. The Series B Preferred Shares have such other rights, powers and preferences as are set forth in the Certificate of Designation for the Series B Preferred Shares.
The Series B Preferred Shares are not considered a liability and the embedded conversion feature does not require bifurcation. The Series B Preferred Shares are classified outside of permanent equity at redemption value. For the years ended December 31, 2018 and 2017, we had no forward foreign exchange contracts outstanding.recognized accretion on the Series B Preferred Shares of US$ 4.8 million and US$ 9.7 million, respectively, with corresponding decreases in additional paid-in capital.
CENTRAL EUROPEAN MEDIA ENTERPRISES LTD.
NOTES TO CONSOLIDATED FINANCIAL STATEMENTS
(Tabular amounts in US$ 000’s, except share and per share data)
Fair Value14. EQUITY
Preferred Stock
5,000,000 shares of DerivativesPreferred Stock were authorized as at December 31, 2019 and 2018.
NaN share of Series A Convertible Preferred Stock (the "Series A Preferred Share") was issued and outstanding as at December 31, 2019 and 2018. Pursuant to the Certificate of Designation, the Series A Preferred Share is convertible into 11,211,449 shares of Class A common stock on the date that is 61 days after the date on which the ownership of our outstanding shares of Class A common stock by a group that includes TW Investor and its affiliates would not be greater than 49.9%. The changeSeries A Preferred Share is entitled to one vote per each share of Class A common stock into which it is convertible and has such other rights, powers and preferences, including potential adjustments to the number of shares of Class A common stock to be issued upon conversion, as are set forth in fair valuethe Certificate of derivatives not recognized within accumulated other comprehensive income / loss comprised the followingDesignation for the years ended Series A Preferred Share.
200,000 shares of Series B Preferred Shares were issued and outstanding as at December 31, 2017, 20162019 and 2015:
|
| | | | | | | | | | | |
| | For The Year Ended December 31, |
| | 2017 |
| | 2016 |
| | 2015 |
|
| (Loss) / gain on currency swaps | $ | (1,380 | ) | | $ | (10,213 | ) | | $ | 4,848 |
|
| Loss on interest rate swaps | (403 | ) | | — |
| | — |
|
| Change in fair value of derivatives | $ | (1,783 | ) | | $ | (10,213 | ) | | $ | 4,848 |
|
15. INTEREST EXPENSE
Interest expense comprised the following for the years ended 2018 (see Note 13, "Convertible Redeemable Preferred Shares"). As of December 31, 2017, 20162019, the 200,000 Series B Preferred Shares were convertible into approximately 111.1 million shares of Class A common stock.
Class A and 2015:Class B Common Stock
|
| | | | | | | | | | | |
| | For The Year Ended December 31, |
| | 2017 |
| | 2016 |
| | 2015 |
|
| Interest on long-term debt and other financing arrangements | $ | 64,855 |
| | $ | 89,602 |
| | $ | 95,419 |
|
| Amortization of capitalized debt issuance costs | 5,778 |
| | 8,842 |
| | 15,118 |
|
| Amortization of debt issuance discount | — |
| | 12,945 |
| | 41,230 |
|
| Total interest expense | $ | 70,633 |
| | $ | 111,389 |
| | $ | 151,767 |
|
We paid cash interest (including mandatory cash-pay Guarantee Fees)440,000,000 shares of US$ 40.6 million, US$ 50.6 millionClass A common stock andUS$15.0 million during the years ended 15,000,000 shares of Class B common stock were authorized as at December 31, 2017, 20162019 and 2015, respectively. In addition, we paid US$ 1.7 million and US$ 7.5 million of Guarantee Fees in cash during the years ended December 31, 2017 and 2016, respectively, for which we had the option to pay in kind. Interest expense related to a portion2018. The rights of the 2018 Euro Term Loan has been allocated to results from discontinued operations (see Note 3, "Discontinued Operationsholders of Class A common stock and Assets HeldClass B common stock are identical except for Sale").
16. OTHER NON-OPERATING INCOME / EXPENSE
Other non-operating income / expense comprised the following for the years ended December 31, 2017, 2016 and 2015:
|
| | | | | | | | | | | |
| | For The Year Ended December 31, |
| | 2017 |
| | 2016 |
| | 2015 |
|
| Interest income | $ | 523 |
| | $ | 573 |
| | $ | 426 |
|
| Foreign currency exchange gain / (loss), net | 17,185 |
| | 7,149 |
| | (11,550 | ) |
| Change in fair value of derivatives (Note 14) | (1,783 | ) | | (10,213 | ) | | 4,848 |
|
| Other income / (expense), net | 396 |
| | 417 |
| | (17,333 | ) |
| Total other non-operating income / (expense) | $ | 16,321 |
|
| $ | (2,074 | ) |
| $ | (23,609 | ) |
17. STOCK-BASED COMPENSATION
Under our 2015 Stock Incentive Plan (the "2015 Plan"), 6,000,000voting rights. The shares of Class A common stock are authorizedentitled to one vote per share and the shares of Class B common stock are entitled to ten votes per share. Shares of Class B common stock are convertible into shares of Class A common stock on a 1-for-1 basis for grantsno additional consideration and automatically convert into shares of Class A common stock options, restrictedon a one-for-one basis when the number of shares of Class B common stock units ("RSU")is less than 10% of the total number of shares of common stock outstanding. Holders of each class of shares are entitled to receive dividends and upon liquidation or dissolution are entitled to receive all assets available for distribution to holders of our common stock. Under our Bye-laws, the holders of each class have no pre-emptive or other subscription rights and there are no redemption or sinking fund provisions with respect to such shares.
There were 253.6 million and 252.9 million shares of Class A common stock outstanding at December 31, 2019 and 2018, respectively, and 0 shares of Class B common stock outstanding at December 31, 2019 or 2018.
As at December 31, 2019, restrictedTW Investor owns 64% of the outstanding shares of Class A common stock. In connection with the exercise of warrants (described below) by Warner Media and TW Investor in April 2018, each of them issued standing proxies to the independent directors of the Company, pursuant to which they granted the independent directors the right to vote the approximately 100.9 million shares of Class A common stock and stock appreciation rights to employees and non-employee directors.received on the exercise of those warrants (the “Warrant Shares”) on all matters other than at any general meeting where the agenda includes a change in control transaction. In addition, any shares available under our Amended and Restated Stock Incentive Plan (which expired on June 1, 2015), including in respect of any awards that expire, terminate or are forfeited,accordance with these proxies, the Warrant Shares will be available for awards under the 2015 Plan. Under the 2015 Plan, awards are madevoted in proportion to employees and directorsvotes cast at the discretionsuch a general meeting of the Compensation Committee. Any awards previously issued underCompany, excluding such Warrant Shares. Warner Media and TW Investor have undertaken to maintain this proxy arrangement in effect until April 2020 and may at their option extend it for an additional year from that date. After giving effect to its ownership of the AmendedSeries A Preferred Share, Warner Media has a 44.3% voting interest in the Company at any meeting where the Warrant Shares are voted pursuant to the standing proxies.
Accumulated Other Comprehensive Loss
The movement in accumulated other comprehensive loss during the years ended December 31, 2019, 2018 and Restated Stock Incentive Plan will continue to be governed by2017 comprised the terms of that plan.following:
The charge for stock-based compensation in our consolidated statements of operations and comprehensive income / loss was as follows: |
| | | | | | | | | | | |
| | For The Year Ended December 31, |
| | 2017 |
| | 2016 |
| | 2015 |
|
| Stock-based compensation expense from continuing operations | $ | 4,280 |
| | $ | 3,383 |
| | $ | 2,311 |
|
Stock-based compensation expense from discontinued operations (1) | 132 |
| | 127 |
| | 128 |
|
|
| | | | | | | | | | | |
| | For The Year Ended December 31, |
| | 2019 |
| | 2018 |
| | 2017 |
|
| BALANCE, beginning of year | $ | (216,650 | ) | | $ | (187,438 | ) | | $ | (243,988 | ) |
| | | | | | |
| Currency translation adjustment, net | | | | | |
| Balance, beginning of year | $ | (207,668 | ) | | $ | (184,256 | ) | | $ | (239,537 | ) |
Foreign exchange gain / (loss) on intercompany loans (1) | 2,519 |
| | (1,061 | ) | | 11,326 |
|
| Foreign exchange (loss) / gain on the Series B Preferred Shares | (5,129 | ) | | (12,527 | ) | | 33,444 |
|
| Currency translation adjustments | (3,677 | ) | | (9,824 | ) | | 10,511 |
|
| Balance, end of year | $ | (213,955 | ) | | $ | (207,668 | ) | | $ | (184,256 | ) |
| | | | | | |
| Unrealized loss on derivative instruments designated as hedging instruments | | | | | |
| Balance, beginning of year | $ | (8,982 | ) | | $ | (3,182 | ) | | $ | (4,451 | ) |
| Change in the fair value of hedging instruments | (5,870 | ) | | (9,455 | ) | | (1,942 | ) |
| Amounts reclassified from accumulated other comprehensive loss: | | | | | |
| Changes in fair value of hedging instruments reclassified to interest expense | 1,726 |
| | 2,220 |
| | 2,764 |
|
| Changes in fair value of hedging instruments reclassified to other non-operating expense, net | 165 |
| | 1,435 |
| | 447 |
|
| Balance, end of year | $ | (12,961 | ) | | $ | (8,982 | ) | | $ | (3,182 | ) |
| | | | | | |
| BALANCE, end of year | $ | (226,916 | ) | | $ | (216,650 | ) | | $ | (187,438 | ) |
| |
(1) | All stock-based compensation expense from discontinued operations relate to employeesRepresents foreign exchange gains and losses on intercompany loans that are of Croatia and Slovenia.a long-term investment nature which are reported in the same manner as translation adjustments. |
CENTRAL EUROPEAN MEDIA ENTERPRISES LTD.
NOTES TO CONSOLIDATED FINANCIAL STATEMENTS
(Tabular amounts in US$ 000’s, except share and per share data)
15. INTEREST EXPENSE
Interest expense comprised the following for the years ended December 31, 2019, 2018 and 2017:
|
| | | | | | | | | | | |
| | For The Year Ended December 31, |
| | 2019 |
| | 2018 |
| | 2017 |
|
| Interest on long-term debt and other financing arrangements | $ | 27,308 |
| | $ | 44,604 |
| | $ | 77,170 |
|
| Amortization of capitalized debt issuance costs | 3,386 |
| | 4,502 |
| | 6,018 |
|
| Total interest expense | $ | 30,694 |
| | $ | 49,106 |
| | $ | 83,188 |
|
We paid cash interest (including mandatory cash-pay Guarantee Fees) of US$ 26.7 million, US$ 43.4 millionandUS$47.2 million during the years ended December 31, 2019, 2018 and 2017, respectively.
16. OTHER NON-OPERATING INCOME / EXPENSE, NET
Other non-operating income / expense, net comprised the following for the years ended December 31, 2019, 2018 and 2017:
|
| | | | | | | | | | | |
| | For The Year Ended December 31, |
| | 2019 |
| | 2018 |
| | 2017 |
|
| Interest income | $ | 467 |
| | $ | 725 |
| | $ | 536 |
|
| Foreign currency exchange (loss) / gain, net | (2,376 | ) | | (2,691 | ) | | 17,761 |
|
| Change in fair value of derivatives (Note 12) | (201 | ) | | (1,715 | ) | | (1,783 | ) |
| Loss on extinguishment of debt | (340 | ) | | (415 | ) | | (101 | ) |
| Other income, net | 242 |
| | 508 |
| | 428 |
|
| Total other non-operating (expense) / income, net | $ | (2,208 | ) |
| $ | (3,588 | ) |
| $ | 16,841 |
|
17. STOCK-BASED COMPENSATION
Subsequent to the amendment approved at our Annual General Meeting on May 20, 2019, our 2015 Stock Incentive Plan (the "2015 Plan") has 16,000,000 shares of Class A common stock authorized for grants of stock options, restricted stock units ("RSU"), restricted stock and stock appreciation rights to employees and non-employee directors. Under the 2015 Plan, awards are made to employees and directors at the discretion of the Compensation Committee.
For the years ended December 31, 2019, 2018 and 2017, we recognized charges for stock-based compensation of US$ 4.2 million, US$ 7.1 million and US$ 4.4 million, respectively, presented as a component of selling, general and administrative expenses in our consolidated statements of operations and comprehensive income / loss. Stock-based compensation expense recognized during the year ended December 31, 2018 includes US$ 2.9 million related to the accelerated vesting of RSUs with performance conditions in accordance with the terms of the corresponding award agreement following the completion of sale of the Company's Croatian operations on July 31, 2018.
Stock Options
Grants of options allow the holders to purchase shares of Class A common stock at an exercise price, which is generally the market price prevailing at the date of the grant, with vesting between one and four years after the awards are granted. AThere was no option activity during the years ended December 31, 2019, 2018 and 2017. The summary of option activity for the year ended stock options outstanding as at December 31, 20172019 and December 31, 2018 is presented below:
|
| | | | | | | | | | | | |
| | Shares |
| | Weighted Average Exercise Price per Share |
| | Weighted Average Remaining Contractual Term (years) | | Aggregate Intrinsic Value |
|
| Outstanding at December 31, 2018 | 2,011,392 |
| | $ | 2.32 |
| | 6.58 | | $ | 916 |
|
| Outstanding at December 31, 2019 | 2,011,392 |
| | $ | 2.32 |
| | 5.58 | | $ | 4,436 |
|
| Vested or expected to vest at December 31, 2019 | 2,011,392 |
| | $ | 2.32 |
| | 5.58 | | $ | 4,436 |
|
| Exercisable at December 31, 2019 | 1,908,544 |
| | $ | 2.32 |
| | 5.55 | | $ | 4,223 |
|
|
| | | | | | | | | | | | |
| | Shares |
| | Weighted Average Exercise Price per Share |
| | Weighted Average Remaining Contractual Term (years) | | Aggregate Intrinsic Value |
|
| Outstanding at December 31, 2016 | 2,011,392 |
| | $ | 2.32 |
| | 8.58 | | $ | 453 |
|
| Outstanding at December 31, 2017 | 2,011,392 |
| | $ | 2.32 |
| | 7.58 | | $ | 4,677 |
|
| Vested or expected to vest at December 31, 2017 | 2,011,392 |
| | $ | 2.32 |
| | 7.58 | | $ | 4,677 |
|
| Exercisable at December 31, 2017 | 902,848 |
| | $ | 2.31 |
| | 7.51 | | $ | 2,113 |
|
When options are vested, holders may exercise them at any time up to the maximum contractual life of the instrument which is specified in the option agreement. At December 31, 2017,2019, the maximum life of options that were issued under the 2015 Plan was ten years. Upon providing the appropriate written notification, holders pay the exercise price and receive shares. Shares delivered in respect of stock option exercisesoptions are newly issued shares.
The fair value of stock options is estimated on the grant date using the Black-Scholes option-pricing model and recognized ratably over the requisite service period as a component of selling, general and administrative expenses. The aggregate intrinsic value (the difference between the stock price on the last day of trading of the fourth quarter of 20172019 and the exercise prices multiplied by the number of in-the-money options) represents the total intrinsic value that would have been received by the option holders had they exercised all in-the-money options as at December 31, 20172019. This amount changes based on the fair value of our Class A common stock.
There were no All unvested stock options granted during the year ended at December 31, 2017.
As at December 31, 2017, there was US$ 1.2 million unrecognized compensation expense related to stock options which is expected to be recognized over a weighted-average period of 1.6 years.
The following table summarizes information about stock option activity during 2017, 2016, and 2015:2019 will vest in March 2020.
CENTRAL EUROPEAN MEDIA ENTERPRISES LTD.
NOTES TO CONSOLIDATED FINANCIAL STATEMENTS
(Tabular amounts in US$ 000’s, except share and per share data)
|
| | | | | | | | | | | | | | | | | | | | |
| | 2017 | | 2016 | | 2015 |
| | Shares |
| | Weighted Average Exercise Price (per share) |
| | Shares |
| | Weighted Average Exercise Price (per share) |
| | Shares |
| | Weighted Average Exercise Price (per share) |
|
| Outstanding at January 1 | 2,011,392 |
| | $ | 2.32 |
| | 1,666,000 |
| | $ | 3.53 |
| | 155,000 |
| | $ | 29.88 |
|
| Awards granted | — |
| | — |
| | 411,392 |
| | 2.46 |
| | 1,600,000 |
| | 2.29 |
|
| Awards forfeited | — |
| | — |
| | — |
| | — |
| | (20,000 | ) | | 23.12 |
|
| Awards expired | — |
| | — |
| | (66,000 | ) | | 33.66 |
| | (69,000 | ) | | 28.23 |
|
| Outstanding at December 31 | 2,011,392 |
| | $ | 2.32 |
| | 2,011,392 |
| | $ | 2.32 |
| | 1,666,000 |
| | $ | 3.53 |
|
Restricted Stock Units with Time-Based Vesting
Each RSU represents a right to receive one share of Class A common stock of the Company for each RSU that vests in accordance with a time-based vesting schedule, generally between one to four years from the date of grant. Upon vesting, shares of Class A common stock are issued from authorized but unissued shares. Holders of RSU awards are not entitled to receive cash dividend equivalents prior to the vesting of awards and are not entitled to vote. The grant date fair value of RSUs is calculated as the closing price of our Class A commonvote shares on the date of grant and presented as a component of selling, general and administrative expenses.underlying awards.
The following table summarizes information about unvested RSUs as at December 31, 20172019:
|
| | | | | | |
| | Number of Shares / Units |
| | Weighted-Average Grant Date Fair Value |
|
| Unvested at December 31, 2018 | 1,996,355 |
| | $ | 3.68 |
|
| Granted | 1,191,586 |
| | 3.57 |
|
| Vested | (855,260 | ) | | 3.49 |
|
| Unvested at December 31, 2019 | 2,332,681 |
| | $ | 3.69 |
|
|
| | | | | | |
| | Number of Shares / Units |
| | Weighted-Average Grant Date Fair Value |
|
| Unvested at December 31, 2016 | 2,542,625 |
| | $ | 2.61 |
|
| Granted | 1,158,887 |
| | 3.62 |
|
| Vested | (931,867 | ) | | 2.69 |
|
| Forfeited | (75,582 | ) | | 1.53 |
|
| Unvested at December 31, 2017 | 2,694,063 |
| | $ | 3.07 |
|
As at December 31, 2017 and December 31, 2016 there were 719,109 and 958,812, respectively, of unvested RSUs with performance conditions. No RSUs with performance conditions were granted or forfeited during the year ended December 31, 2017. As at December 31, 2017, theThe intrinsic value of unvested RSUs was US$ 12.510.6 million as at December 31, 2019. Total unrecognized compensation cost related to unvested RSUs as at December 31, 20172019 was US$ 4.65.9 million and is expected to be recognized over a weighted-average period of 1.8 years.2.2 years.
Restricted Stock Units with Performance Conditions
Each RSU with performance conditions (“PRSU”) represents a right to receive one share of Class A common stock of the Company for each PRSU that vests in accordance with a performance-based vesting schedule. The performance-based vesting schedule sets forth specified objectives for unlevered free cash flow and OIBDA over defined periods and by defined dates. Holders of PRSU awards are not entitled to receive cash dividend equivalents prior to the vesting of awards and are not entitled to vote shares underlying awards.
On December 4, 2018, the 2018 PRSU Award was granted with unlevered free cash flow and OIBDA targets corresponding to two, three and four-year performance periods ended December 31, 2020, 2021 and 2022, respectively. The maximum achievement under the 2018 PRSU Award is 200% of the shares allotted to the corresponding target. At December 31, 2019 and 2018, there were 501,572 unvested shares with a weighted-average grant date fair value of US$ 3.19. There were no new awards granted or vested and we recognized US$ 0.2 million of related compensation cost during the year ended December 31, 2019 in respect of performance targets considered probable of being achieved.
The intrinsic value of unvested PRSUs was US$ 2.3 million as at December 31, 2019. Total unrecognized compensation cost related to unvested PRSUs as at December 31, 2019 was US$ 1.4 million of which US$ 0.2 million is related to performance targets currently considered probable of being achieved and will be recognized over a period of 1.2 years.
CENTRAL EUROPEAN MEDIA ENTERPRISES LTD.
NOTES TO CONSOLIDATED FINANCIAL STATEMENTS
(Tabular amounts in US$ 000’s, except share and per share data)
18. INCOME TAXES
As our investments are predominantly owned by Dutch holding companies, the components of the (provision) / creditprovision for income taxes and of the income / (loss) before tax have been analyzed between their Netherlands and non-Netherlands components. Similarly, the Dutch corporate income tax rates have been used in the reconciliation of income taxes.
Income / (loss) from continuing operations before income taxes
The Netherlands and non-Netherlands components of income / (loss) from continuing operations before income taxes are:
|
| | | | | | | | | | | |
| | For The Year Ended December 31, |
| | 2019 |
| | 2018 |
| | 2017 |
|
| Domestic | $ | (19,557 | ) | | $ | (38,434 | ) | | $ | (50,344 | ) |
| Foreign | 173,991 |
| | 163,327 |
| | 123,911 |
|
| Total | $ | 154,434 |
| | $ | 124,893 |
| | $ | 73,567 |
|
|
| | | | | | | | | | | |
| | For The Year Ended December 31, |
| | 2017 |
| | 2016 |
| | 2015 |
|
| Domestic | $ | (50,344 | ) | | $ | (66,540 | ) | | $ | (73,736 | ) |
| Foreign | 125,880 |
| | (91,549 | ) | | (13,593 | ) |
| Total | $ | 75,536 |
| | $ | (158,089 | ) | | $ | (87,329 | ) |
Total tax (provision) / creditprovision for the years ended December 31, 2017, 20162019, 2018 and 20152017 was allocated as follows:
|
| | | | | | | | | | | |
| | For The Year Ended December 31, |
| | 2019 |
| | 2018 |
| | 2017 |
|
| Income tax provision from continuing operations | $ | (35,226 | ) | | $ | (27,828 | ) | | $ | (22,504 | ) |
| Income tax provision from discontinued operations | — |
| | (1,423 | ) | | (1,226 | ) |
| Total tax provision | $ | (35,226 | ) | | $ | (29,251 | ) | | $ | (23,730 | ) |
|
| | | | | | | | | | | |
| | For The Year Ended December 31, |
| | 2017 |
| | 2016 |
| | 2015 |
|
| Income tax (provision) / credit from continuing operations | $ | (21,483 | ) | | $ | (6,336 | ) | | $ | 1,153 |
|
| Income tax provision from discontinued operations | (2,247 | ) | | (981 | ) | | (547 | ) |
| Total tax (provision) / credit | $ | (23,730 | ) | | $ | (7,317 | ) | | $ | 606 |
|
(Provision) / Credit for Income Taxes
The Netherlands and non-Netherlands components of the (provision) / credit for income taxes from continuing operations consist of:
|
| | | | | | | | | | | |
| | For The Year Ended December 31, |
| | 2017 |
| | 2016 |
| | 2015 |
|
| Current income tax provision: | | | | | |
| Domestic | $ | — |
| | $ | — |
| | $ | — |
|
| Foreign | (21,252 | ) | | (4,542 | ) | | (10 | ) |
| | (21,252 | ) | | (4,542 | ) | | (10 | ) |
| Deferred tax (provision) / credit: | | | | | |
| Domestic | — |
| | — |
| | — |
|
| Foreign | (231 | ) | | (1,794 | ) | | 1,163 |
|
| | (231 | ) | | (1,794 | ) | | 1,163 |
|
| (Provision) / credit for income taxes | $ | (21,483 | ) | | $ | (6,336 | ) | | $ | 1,153 |
|
In 2017, the net (provision) / credit for income taxes was more than the (provision) / credit computed at statutory rates primarily due to the expiration of tax loss carry-forwards and changes to the valuation allowance for prior period losses where a future benefit is no longer expected. In 2016 and 2015, the net (provision) / credit for income taxes is less than the (provision) / credit computed at statutory tax rates primarily due to losses on which no tax benefit has been received.
Reconciliation of Effective Income Tax Rate
The following is a reconciliation of income taxes, calculated at statutory Netherlands rates, to the (provision) / credit for income taxes included in the accompanying consolidated statements of operations and comprehensive income / loss for the years ended December 31, 2017, 2016 and 2015:
|
| | | | | | | | | | | |
| | For The Year Ended December 31, |
| | 2017 |
| | 2016 |
| | 2015 |
|
| Income taxes at Netherlands rates (25%) | $ | (18,871 | ) | | $ | 39,515 |
| | $ | 21,821 |
|
| Jurisdictional differences in tax rates | 10,018 |
| | (38,176 | ) | | (12,440 | ) |
| Losses expired | (7,583 | ) | | (1,813 | ) | | (2,890 | ) |
| Change in valuation allowance | (5,384 | ) | | (5,249 | ) | | 2,496 |
|
| Non-deductible expenses | (73 | ) | | 288 |
| | (1,731 | ) |
| Other | 410 |
| | (901 | ) | | (6,103 | ) |
| (Provision) / credit for income taxes | $ | (21,483 | ) | | $ | (6,336 | ) | | $ | 1,153 |
|
CENTRAL EUROPEAN MEDIA ENTERPRISES LTD.
NOTES TO CONSOLIDATED FINANCIAL STATEMENTS
(Tabular amounts in US$ 000’s, except share and per share data)
Provision for Income Taxes
The Netherlands and non-Netherlands components of the provision for income taxes from continuing operations consist of:
|
| | | | | | | | | | | |
| | For The Year Ended December 31, |
| | 2019 |
| | 2018 |
| | 2017 |
|
| Current income tax provision: | | | | | |
| Domestic | $ | — |
| | $ | — |
| | $ | — |
|
| Foreign | (35,973 | ) | | (25,308 | ) | | (22,273 | ) |
| | (35,973 | ) | | (25,308 | ) | | (22,273 | ) |
| Deferred tax provision: | | | | | |
| Domestic | — |
| | — |
| | — |
|
| Foreign | 747 |
| | (2,520 | ) | | (231 | ) |
| | 747 |
| | (2,520 | ) | | (231 | ) |
| Provision for income taxes | $ | (35,226 | ) | | $ | (27,828 | ) | | $ | (22,504 | ) |
Reconciliation of Effective Income Tax Rate
The following is a reconciliation of income taxes, calculated at statutory Netherlands rates, to the provision for income taxes included in the accompanying consolidated statements of operations and comprehensive income / loss for the years ended December 31, 2019, 2018 and 2017:
|
| | | | | | | | | | | |
| | For The Year Ended December 31, |
| | 2019 |
| | 2018 |
| | 2017 |
|
| Income taxes at Netherlands rates (25%) | $ | (38,596 | ) | | $ | (31,206 | ) | | $ | (18,378 | ) |
| Jurisdictional differences in tax rates | 7,863 |
| | 10,384 |
| | 7,303 |
|
| Non-deductible interest | — |
| | (2,455 | ) | | (248 | ) |
| Losses expired | (12,196 | ) | | (7,111 | ) | | (7,583 | ) |
Change in valuation allowance (1) | 3,139 |
| | 26,042 |
| | (6,242 | ) |
| Unrecognized tax benefits | — |
| | 1,077 |
| | — |
|
Effect of change in tax rate (1) | 5,000 |
| | (21,982 | ) | | — |
|
| Non-deductible expenses | (872 | ) | | (879 | ) | | 207 |
|
| Other | 436 |
| | (1,698 | ) | | 2,437 |
|
| Provision for income taxes | $ | (35,226 | ) | | $ | (27,828 | ) | | $ | (22,504 | ) |
| |
(1) | The effect of change in tax rate in 2019 and 2018 is the impact of tax rates enacted in the Netherlands on the tax benefit of loss carry-forwards. |
In 2017, the net provision for income taxes was more than the provision computed at statutory tax rates primarily due to losses on which no tax benefit has been received.
CENTRAL EUROPEAN MEDIA ENTERPRISES LTD.
NOTES TO CONSOLIDATED FINANCIAL STATEMENTS
(Tabular amounts in US$ 000’s, except share and per share data)
Components of Deferred Tax Assets and Liabilities
The following table shows the significant components included in deferred income taxes as at December 31, 20172019 and 2016:2018:
|
| | | | | | | |
| | December 31, 2019 |
| | December 31, 2018 |
|
| Assets: | | | |
| Tax benefit of loss carry-forwards and other tax credits | $ | 92,895 |
| | $ | 103,468 |
|
| Programming rights | 2,510 |
| | 2,211 |
|
| Property, plant and equipment | 2,989 |
| | 3,088 |
|
| Accrued expenses | 4,607 |
| | 3,922 |
|
| Other | 7,101 |
| | 2,997 |
|
| Gross deferred tax assets | 110,102 |
| | 115,686 |
|
| Valuation allowance | (98,915 | ) | | (103,126 | ) |
| Net deferred tax assets | $ | 11,187 |
| | $ | 12,560 |
|
| | | | |
| Liabilities: | | | |
| Broadcast licenses, trademarks and customer relationships | $ | (20,156 | ) | | $ | (21,979 | ) |
| Property, plant and equipment | (542 | ) | | (293 | ) |
| Programming rights | (4,491 | ) | | (5,123 | ) |
| Tax payable on potential distribution of reserves | (5,031 | ) | | (4,379 | ) |
| Other | — |
| | (920 | ) |
| Total deferred tax liabilities | (30,220 | ) | | (32,694 | ) |
| Net deferred income tax liability | $ | (19,033 | ) | | $ | (20,134 | ) |
|
| | | | | | | |
| | December 31, 2017 |
| | December 31, 2016 |
|
| Assets: | | | |
| Tax benefit of loss carry-forwards and other tax credits | $ | 127,599 |
| | $ | 108,424 |
|
| Programming rights | 3,189 |
| | 2,935 |
|
| Property, plant and equipment | 2,713 |
| | 2,691 |
|
| Accrued expenses | 4,087 |
| | 4,556 |
|
| Other | 2,445 |
| | 1,587 |
|
| Gross deferred tax assets | 140,033 |
| | 120,193 |
|
| Valuation allowance | (127,794 | ) | | (106,601 | ) |
| Net deferred tax assets | $ | 12,239 |
| | $ | 13,592 |
|
| | | | |
| Liabilities: | | | |
| Broadcast licenses, trademarks and customer relationships | $ | (24,078 | ) | | $ | (22,017 | ) |
| Property, plant and equipment | (166 | ) | | (142 | ) |
| Programming rights | (5,431 | ) | | (6,508 | ) |
| Other | (169 | ) | | (85 | ) |
| Total deferred tax liabilities | (29,844 | ) | | (28,752 | ) |
| Net deferred income tax liability | $ | (17,605 | ) | | $ | (15,160 | ) |
Deferred tax is recognized on the consolidated balance sheet as follows:
|
| | | | | | | |
| | December 31, 2019 |
| | December 31, 2018 |
|
| Net non-current deferred tax assets | $ | 2,261 |
| | $ | 2,411 |
|
| Net non-current deferred tax liabilities | (21,294 | ) | | (22,545 | ) |
| Net deferred income tax liability | $ | (19,033 | ) | | $ | (20,134 | ) |
|
| | | | | | | |
| | December 31, 2017 |
| | December 31, 2016 |
|
| Net non-current deferred tax assets | $ | 2,964 |
| | $ | 4,550 |
|
| | | | |
| Net non-current deferred tax liabilities | (20,569 | ) | | (19,710 | ) |
| | | | |
| Net deferred income tax liability | $ | (17,605 | ) | | $ | (15,160 | ) |
We provided a valuation allowance against potential deferred tax assets of US$ 127.898.9 million and US$ 106.6103.1 million as at December 31, 20172019 and 2016,2018, respectively, since it has been determined by management, based on the weight of all available evidence, that it is more likely than not that the benefits associated with these assets will not be realized.
During 2017,2019 and 2018, we had the following movements on valuation allowances:
|
| | | |
| Balance at December 31, 2017 | $ | 133,477 |
|
| Created during the period | 100 |
|
| Utilized | (26,142 | ) |
| Foreign exchange | (5,569 | ) |
| Other | 1,260 |
|
| Balance at December 31, 2018 | 103,126 |
|
| Created during the period | 3,773 |
|
| Utilized | (6,912 | ) |
| Foreign exchange | (1,936 | ) |
| Other | 864 |
|
| Balance at December 31, 2019 | $ | 98,915 |
|
|
| | | |
| Balance at December 31, 2016 | $ | 106,601 |
|
| Created during the period | 6,343 |
|
| Utilized | (959 | ) |
| Foreign exchange | 15,260 |
|
| Other | 549 |
|
| Balance at December 31, 2017 | $ | 127,794 |
|
As of December 31, 20172019 we had operating loss carry-forwards that will expire in the following periods:
|
| | | | | | | | | | | | | | | | | | | | | | | |
| | 2020 |
| | 2021 |
| | 2022 |
| | 2023 |
| | 2024-27 |
| | Indefinite |
|
| The Netherlands | $ | 47,688 |
| | $ | 50,014 |
| | $ | 53,674 |
| | $ | 57,042 |
| | $ | 209,378 |
| | $ | — |
|
| Slovenia | — |
| | — |
| | — |
| | — |
| | — |
| | 9,810 |
|
| United Kingdom | — |
| | — |
| | — |
| | — |
| | — |
| | 1,960 |
|
| Total | $ | 47,688 |
| | $ | 50,014 |
| | $ | 53,674 |
| | $ | 57,042 |
| | $ | 209,378 |
| | $ | 11,770 |
|
|
| | | | | | | | | | | | | | | | | | | | | | | |
| | 2018 |
| | 2019 |
| | 2020 |
| | 2021 |
| | 2022-26 |
| | Indefinite |
|
| Bulgaria | $ | — |
| | $ | — |
| | $ | 2,586 |
| | $ | — |
| | $ | — |
| | $ | — |
|
| Czech Republic | 627 |
| | 3 |
| | — |
| | — |
| | — |
| | — |
|
| The Netherlands | 29,158 |
| | 64,290 |
| | 50,911 |
| | 53,392 |
| | 309,861 |
| | — |
|
| United Kingdom | — |
| | — |
| | — |
| | — |
| | — |
| | 1,726 |
|
| Total | $ | 29,785 |
| | $ | 64,293 |
| | $ | 53,497 |
| | $ | 53,392 |
| | $ | 309,861 |
| | $ | 1,726 |
|
The losses are subject to examination by the tax authorities and to restriction on their utilization. In particular, the losses can only be utilized against profits arising in the legal entity in which they arose.
We have provided valuation allowances against most The utilization of the above loss carry-forwards. However,losses may also be restricted following a valuation allowance has not been provided against the loss carry-forwards in our main operating company in Bulgaria on the basischange of future reversals of existing taxable temporary differences and taxable income from future trading. The tax benefits associated with the tax losses in the United Kingdom were recognized following the adoption of the FASB guidance simplifying accounting for share-based payment transactions. However, a valuation allowance was also recognized due to a lack of foreseeable future UK income.business activity.
CENTRAL EUROPEAN MEDIA ENTERPRISES LTD.
NOTES TO CONSOLIDATED FINANCIAL STATEMENTS
(Tabular amounts in US$ 000’s, except share and per share data)
We have provided valuation allowances against substantially all of the above loss carry-forwards.
As at December 31, 20172019 and 2016,2018, we had no undistributed0 permanently reinvested earnings in subsidiaries giving rise to a temporary difference.
A reconciliation of the beginning and ending amount of unrecognized tax benefits is as follows:
|
| | | |
| Balance at December 31, 2017 | $ | 1,052 |
|
| Settlement | (1,077 | ) |
| Foreign exchange | 25 |
|
| Balance at December 31, 2018 | $ | — |
|
|
| | | |
| Balance at December 31, 2014 | $ | 53 |
|
| Decreases resulting from the expiry of the statute of limitations | (53 | ) |
| Balance at December 31, 2015 | — |
|
| Balance at December 31, 2016 | — |
|
| Balance at December 31, 2017 | $ | — |
|
We do not have any unrecognized tax benefits activity during the year ended December 31, 2019 and do not anticipate a material increase or decrease in unrecognized tax benefits within the next 12 months.
Our subsidiaries file income tax returns in the Netherlands and various other tax jurisdictions. As at December 31, 20172019, our subsidiaries are generally no longer subject to income tax examinations for years before:
|
| |
| Tax Jurisdiction | Year |
| Bulgaria | 20132015 |
| Czech Republic | 2012 |
| The Netherlands | 20152018 |
| Romania | 2014 |
| Slovak Republic | 20102012 |
| Slovenia | 2014 |
| United Kingdom | 20162018 |
We recognize, when applicable, both accrued interest and penalties related to unrecognized tax benefits in income tax expense in the accompanying consolidated statements of operations and comprehensive income / loss. There were no0 significant interest or penalties accrued in the years ended December 31, 2017, 20162019, 2018 and 2015.2017.
CENTRAL EUROPEAN MEDIA ENTERPRISES LTD.
NOTES TO CONSOLIDATED FINANCIAL STATEMENTS
(Tabular amounts in US$ 000’s, except share and per share data)
19. EARNINGS PER SHARE
We determined that the Series B Preferred Shares are a participating security, and accordingly, our basic and diluted net income / loss per share is calculated using the two-class method. Under the two-class method, basic net income / loss per common share is computed by dividing the net income available to common shareholders after deducting contractual amounts of accretion on ourthe Series B Preferred Shares and the income allocated to these shares by the weighted-average number of common shares outstanding during the period. Diluted net income / loss per share is computed by dividing the adjusted net income by the weighted-average number of dilutive shares outstanding during the period.period after adjusting for the impact of those dilutive shares on the allocation of income to the Series B Preferred Shares.
The components of basic and diluted earnings per share are as follows:
| | | | For The Year Ended December 31, | For The Year Ended December 31, |
| | 2017 |
| | 2016 |
| | 2015 |
| 2019 |
| | 2018 |
| | 2017 |
|
| Income / (loss) from continuing operations | $ | 54,053 |
| | $ | (164,425 | ) | | $ | (86,176 | ) | |
| Net loss attributable to noncontrolling interests | 341 |
| | 306 |
| | 671 |
| |
| Less: preferred share accretion paid in kind (Note 12) | (9,694 | ) | | (13,701 | ) | | (17,272 | ) | |
| Income from continuing operations | | $ | 119,208 |
| | $ | 97,065 |
| | $ | 51,063 |
|
| Net (income) / loss attributable to noncontrolling interests | | (74 | ) | | 79 |
| | 341 |
|
| Less: preferred share accretion paid in kind (Note 13) | | — |
| | (4,777 | ) | | (9,694 | ) |
| Less: income allocated to Series B Preferred Shares | (18,213 | ) | | — |
| | — |
| (35,237 | ) | | (29,956 | ) | | (16,994 | ) |
| Income / (loss) from continuing operations available to common shareholders, net of noncontrolling interest | 26,487 |
| | (177,820 | ) | | (102,777 | ) | 83,897 |
| | 62,411 |
| | 24,716 |
|
| Loss from discontinued operations, net of tax (Note 3) | (4,626 | ) | | (16,172 | ) | | (29,396 | ) | |
| Net income / (loss) attributable to CME Ltd. available to common shareholders — basic | 21,861 |
| | (193,992 | ) | | (132,173 | ) | |
| Income / (loss) from discontinued operations, net of tax | | — |
| | 60,548 |
| | (1,636 | ) |
| Less: (income) / loss allocated to Series B Preferred Shares | | — |
| | (19,637 | ) | | 667 |
|
| Net income attributable to CME Ltd. available to common shareholders — basic | | 83,897 |
| | 103,322 |
| | 23,747 |
|
| | | | | | | | | | | |
| Effect of dilutive securities | | | | | | | | | | |
| Dilutive effect of Series B Preferred Shares | 5,713 |
| | — |
| | — |
| |
| Net income / (loss) attributable to CME Ltd. available to common shareholders — diluted | $ | 27,574 |
| | $ | (193,992 | ) | | $ | (132,173 | ) | |
| Dilutive effect of employee stock options, RSUs and common stock warrants | | 148 |
| | 3,653 |
| | 3,829 |
|
| Net income attributable to CME Ltd. available to common shareholders — diluted | | $ | 84,045 |
| | $ | 106,975 |
| | $ | 27,576 |
|
| | | | | | | | | | | |
Weighted average outstanding shares of common stock — basic (1) | 155,846 |
| | 151,017 |
| | 146,866 |
| 264,611 |
| | 230,562 |
| | 155,846 |
|
| Dilutive effect of common stock warrants, employee stock options and RSUs | 80,558 |
| | — |
| | — |
| |
| Dilutive effect of employee stock awards and common stock warrants | | 1,587 |
| | 27,132 |
| | 80,558 |
|
| Weighted average outstanding shares of common stock — diluted | 236,404 |
| | 151,017 |
| | 146,866 |
| 266,198 |
| | 257,694 |
| | 236,404 |
|
| | | | | | | | | | | |
| Net income / (loss) per share: | | | | | | | | | | |
| Continuing operations — basic | $ | 0.17 |
| | $ | (1.18 | ) | | $ | (0.70 | ) | $ | 0.32 |
| | $ | 0.27 |
| | $ | 0.16 |
|
| Continuing operations — diluted | 0.15 |
| | (1.18 | ) | | (0.70 | ) | 0.32 |
| | 0.25 |
| | 0.12 |
|
| Discontinued operations — basic | (0.03 | ) | | (0.10 | ) | | (0.20 | ) | — |
| | 0.18 |
| | (0.01 | ) |
| Discontinued operations — diluted | (0.03 | ) | | (0.10 | ) | | (0.20 | ) | — |
| | 0.17 |
| | 0.00 |
|
| Net income / (loss) attributable to CME Ltd. — basic | 0.14 |
| | (1.28 | ) | | (0.90 | ) | |
| Net income / (loss) attributable to CME Ltd. — diluted | 0.12 |
| | (1.28 | ) | | (0.90 | ) | |
| Attributable to CME Ltd. — basic | | 0.32 |
| | 0.45 |
| | 0.15 |
|
| Attributable to CME Ltd. — diluted | | 0.32 |
| | 0.42 |
| | 0.12 |
|
| |
(1) | For the purpose of computing basic earnings per share, the 11,211,449 shares of Class A common stock underlying the Series A Preferred Share are included in the weighted average outstanding shares of common stock - basic, because the holderrights of the Series A Preferred Share is entitledare considered substantially similar to receive any dividends payable when dividends are declared by the Boardthat of Directors with respect to any shares of theour Class A common stock. |
The following weighted-average,Weighted-average, equity awards and convertible shares wereare excluded from the calculation of diluted earnings per share becauseif their effect would have beenbe anti-dilutive. The following instruments were anti-dilutive for the periods presented:presented, but may be dilutive in future periods:
| | | | For The Year Ended December 31, | For The Year Ended December 31, |
| | 2017 |
| | 2016 |
| | 2015 |
| 2019 |
| | 2018 |
| | 2017 |
|
| Employee stock options | — |
| | 2,011 |
| | 1,666 |
| |
| RSUs | 144 |
| | 1,219 |
| | 1,556 |
| 376 |
| | 1,506 |
| | 144 |
|
| Series B Preferred Shares | — |
| | 105,167 |
| | — |
| |
| Total | 144 |
| | 108,397 |
| | 3,222 |
| 376 |
| | 1,506 |
| | 144 |
|
These instruments may become dilutive in the future. As set forth in the Certificate of Designation for the Series B Preferred Shares, the holders of our Series B Preferred Shares are not contractually obligated to share in our losses.
CENTRAL EUROPEAN MEDIA ENTERPRISES LTD.
NOTES TO CONSOLIDATED FINANCIAL STATEMENTS
(Tabular amounts in US$ 000’s, except share and per share data)
20. SEGMENT DATA
We manage our business on a geographical basis, with four5 operating segments: Bulgaria, the Czech Republic, Romania, and the Slovak Republic and Slovenia, which are also our reportable segments and our main operating countries. These segments reflect how CME Ltd.’s operating performance is evaluated by our chief operating decision makers, who we have identified as our co-Chief Executive Officers; how operations are managed by segment managers; and the structure of our internal financial reporting.
Our segments generate revenues primarily from the sale of advertising and sponsorship on our channels.channels and digital properties. This is supplemented by revenues from cable and satellite television service providers tothat carry our channels on their platforms and from revenues through the sale of distribution rights to third parties. We do not rely on any single major customer or group of major customers. Intersegment revenues and profits have been eliminated in consolidation.
We evaluate our consolidated results and the performance of our segments based on net revenues and OIBDA (as defined below). We believe OIBDA is useful to investors because it provides a meaningful representation of our performance as it excludes certain items that either do not impact our cash flows or do not impact the operating results of our operations. OIBDA is also used as a component in determining management bonuses.
OIBDA includes amortization and impairment of program rights and is calculated as operating income / loss before depreciation, amortization of intangible assets, impairments of assets and certain unusual or infrequent items that are not considered by our chief operating decision makers when evaluating our performance. Stock-based compensation and certain other items are not allocated to our segments for purposes of evaluating their performance and therefore are not included in their respective OIBDA.
Below are tables showing our net revenues, OIBDA, total assets, capital expenditures and long-lived assets for our continuing operations by segment for the years ended December 31, 20172019, 20162018 and 20152017 for consolidated statements of operations and comprehensive income / loss data and consolidated statements of cash flow data; and as at December 31, 20172019 and 20162018 for consolidated balance sheet data.
| | | Net revenues: | For The Year Ended December 31, | For The Year Ended December 31, |
| | 2017 |
| | 2016 |
| | 2015 |
| 2019 |
| | 2018 |
| | 2017 |
|
| Bulgaria | $ | 77,341 |
| | $ | 72,651 |
| | $ | 73,090 |
| $ | 83,406 |
| | $ | 84,593 |
| | $ | 77,341 |
|
| Czech Republic | 209,041 |
| | 190,372 |
| | 182,636 |
| 237,320 |
| | 233,991 |
| | 209,041 |
|
| Romania | 191,244 |
| | 172,951 |
| | 157,578 |
| 188,251 |
| | 201,505 |
| | 191,244 |
|
| Slovak Republic | 97,721 |
| | 90,549 |
| | 84,434 |
| 108,003 |
| | 106,834 |
| | 97,721 |
|
| Slovenia | | 80,809 |
| | 79,587 |
| | 68,696 |
|
Intersegment revenues (1) | (1,135 | ) | | (349 | ) | | (1,543 | ) | (2,985 | ) | | (2,604 | ) | | (1,175 | ) |
| Total net revenues | $ | 574,212 |
| | $ | 526,174 |
| | $ | 496,195 |
| $ | 694,804 |
| | $ | 703,906 |
| | $ | 642,868 |
|
| |
(1) | Reflects revenues earned from the sale of content to other country segments in CME Ltd. All other revenues are third party revenues. |
|
| | | | | | | | | | | |
| OIBDA: | For The Year Ended December 31, |
| | 2019 |
| | 2018 |
| | 2017 |
|
| Bulgaria | $ | 25,720 |
| | $ | 21,620 |
| | $ | 16,241 |
|
| Czech Republic | 101,617 |
| | 94,576 |
| | 82,652 |
|
| Romania | 87,727 |
| | 85,737 |
| | 73,418 |
|
| Slovak Republic | 35,350 |
| | 27,941 |
| | 23,845 |
|
| Slovenia | 26,395 |
| | 22,516 |
| | 14,263 |
|
| Elimination | 15 |
| | 34 |
| | (3 | ) |
| Total operating segments | 276,824 |
| | 252,424 |
| | 210,416 |
|
| Corporate | (28,900 | ) | | (29,750 | ) | | (30,649 | ) |
| Total OIBDA | 247,924 |
|
| 222,674 |
|
| 179,767 |
|
| Depreciation of property, plant and equipment | (33,536 | ) | | (32,933 | ) | | (31,261 | ) |
| Amortization of broadcast licenses and other intangibles | (8,457 | ) | | (9,002 | ) | | (8,592 | ) |
Other items (1) | (18,595 | ) | | (3,152 | ) | | — |
|
| Operating income | 187,336 |
| | 177,587 |
| | 139,914 |
|
| Interest expense (Note 15) | (30,694 | ) | | (49,106 | ) | | (83,188 | ) |
| Other non-operating (expense) / income, net (Note 16) | (2,208 | ) | | (3,588 | ) | | 16,841 |
|
| Income before tax | $ | 154,434 |
| | $ | 124,893 |
| | $ | 73,567 |
|
|
| | | | | | | | | | | |
| OIBDA: | For The Year Ended December 31, |
| | 2017 |
| | 2016 |
| | 2015 |
|
| Bulgaria | $ | 16,841 |
| | $ | 12,242 |
| | $ | 15,479 |
|
| Czech Republic | 83,600 |
| | 77,018 |
| | 71,697 |
|
| Romania | 74,435 |
| | 62,016 |
| | 41,176 |
|
| Slovak Republic | 24,742 |
| | 15,947 |
| | 10,585 |
|
| Elimination | (8 | ) | | 5 |
| | 26 |
|
| Total operating segments | 199,610 |
| | 167,228 |
| | 138,963 |
|
| Corporate | (34,078 | ) | | (30,320 | ) | | (29,521 | ) |
| Total OIBDA | 165,532 |
|
| 136,908 |
|
| 109,442 |
|
| Depreciation of property, plant and equipment | (26,991 | ) | | (23,106 | ) | | (21,327 | ) |
| Amortization of intangibles | (8,592 | ) | | (8,270 | ) | | (12,050 | ) |
Other items (1) | — |
| | — |
| | 11,982 |
|
| Operating income | 129,949 |
| | 105,532 |
| | 88,047 |
|
| Interest expense (Note 15) | (70,633 | ) | | (111,389 | ) | | (151,767 | ) |
| Loss on extinguishment of debt (Note 5) | (101 | ) | | (150,158 | ) | | — |
|
| Other non-operating income / (expense), net (Note 16) | 16,321 |
| | (2,074 | ) | | (23,609 | ) |
| Income / (loss) before tax | $ | 75,536 |
| | $ | (158,089 | ) | | $ | (87,329 | ) |
| |
(1) | Other items during the year ended December 31, 2019 reflects costs relating to the strategic review and resulting proposed Merger, primarily the full recognition of executive employee retention agreements and financial and professional fees and is reflected in selling, general and administrative expenses in our consolidated statements of operations. Other items during the year ended December 31, 2018 consists solely of the chargesexpense related to tax auditsthe accelerated vesting of our RomanianRSUs with performance conditions in accordance with the terms of the corresponding award agreement following the completion of sale of the Company's Croatian operations which were accrued in the fourth quarter of 2014 and fully released in the third quarter of 2015.on July 31, 2018. |
CENTRAL EUROPEAN MEDIA ENTERPRISES LTD.
NOTES TO CONSOLIDATED FINANCIAL STATEMENTS
(Tabular amounts in US$ 000’s, except share and per share data)
|
| | | | | | | |
Total assets: (1) | December 31, 2019 |
| | December 31, 2018 |
|
| Bulgaria | $ | 135,593 |
| | $ | 142,165 |
|
| Czech Republic | 758,479 |
| | 771,286 |
|
| Romania | 289,968 |
| | 297,937 |
|
| Slovak Republic | 150,806 |
| | 146,252 |
|
| Slovenia | 92,144 |
| | 89,440 |
|
| Total operating segments | 1,426,990 |
| | 1,447,080 |
|
| Corporate | 20,872 |
| | 41,281 |
|
| Total assets | $ | 1,447,862 |
| | $ | 1,488,361 |
|
|
| | | | | | | |
Total assets: (1) | December 31, 2017 |
| | December 31, 2016 |
|
| Bulgaria | $ | 155,885 |
| | $ | 130,873 |
|
| Czech Republic | 842,716 |
| | 700,190 |
|
| Romania | 307,286 |
| | 266,132 |
|
| Slovak Republic | 149,866 |
| | 131,220 |
|
| Total operating segments | 1,455,753 |
| | 1,228,415 |
|
| Corporate | 24,146 |
| | 40,786 |
|
| Assets held for sale | 148,156 |
| | 121,516 |
|
| Total assets | $ | 1,628,055 |
| | $ | 1,390,717 |
|
| |
(1) | Segment assets exclude any intercompany balances. |
|
| | | | | | | | | | | |
| Capital expenditures: | For The Year Ended December 31, |
| | 2019 |
|
| 2018 |
|
| 2017 |
|
| Bulgaria | $ | 6,023 |
| | $ | 4,222 |
| | $ | 4,584 |
|
| Czech Republic | 8,212 |
| | 9,012 |
| | 10,449 |
|
| Romania | 4,628 |
| | 4,767 |
| | 6,639 |
|
| Slovak Republic | 1,754 |
| | 1,601 |
| | 1,963 |
|
| Slovenia | 3,496 |
| | 4,200 |
| | 3,171 |
|
| Total operating segments | 24,113 |
| | 23,802 |
| | 26,806 |
|
| Corporate | 310 |
| | 781 |
| | 1,309 |
|
| Total capital expenditures | $ | 24,423 |
| | $ | 24,583 |
| | $ | 28,115 |
|
|
| | | | | | | | | | | |
| Capital Expenditures: | For The Year Ended December 31, |
| | 2017 |
|
| 2016 |
|
| 2015 |
|
| Bulgaria | $ | 4,584 |
| | $ | 3,304 |
| | $ | 3,517 |
|
| Czech Republic | 10,449 |
| | 8,043 |
| | 10,982 |
|
| Romania | 6,639 |
| | 6,863 |
| | 5,794 |
|
| Slovak Republic | 1,963 |
| | 1,693 |
| | 2,921 |
|
| Total operating segments | 23,635 |
| | 19,903 |
| | 23,214 |
|
| Corporate | 1,270 |
| | 2,476 |
| | 3,440 |
|
| Total capital expenditures | $ | 24,905 |
| | $ | 22,379 |
| | $ | 26,654 |
|
| | Long-lived assets: (1) | December 31, 2017 |
| | December 31, 2016 |
| December 31, 2019 |
| | December 31, 2018 |
|
| Bulgaria | $ | 7,863 |
| | $ | 6,280 |
| $ | 13,538 |
| | $ | 10,627 |
|
| Czech Republic | 46,146 |
| | 39,529 |
| 36,760 |
| | 39,314 |
|
| Romania | 28,515 |
| | 22,796 |
| 31,115 |
| | 33,368 |
|
| Slovak Republic | 17,450 |
| | 15,326 |
| 16,201 |
| | 16,376 |
|
| Slovenia | | 15,207 |
| | 15,955 |
|
| Total operating segments | 99,974 |
| | 83,931 |
| 112,821 |
| | 115,640 |
|
| Corporate | 3,674 |
| | 5,149 |
| 1,080 |
| | 1,964 |
|
| Total long-lived assets | $ | 103,648 |
| | $ | 89,080 |
| $ | 113,901 |
| | $ | 117,604 |
|
| |
(1) | Reflects property, plant and equipment, net. |
Revenues from contracts with customers comprised the following: | | | Revenue by type: | For The Year Ended December 31, | |
| Consolidated revenue by type: | | For The Year Ended December 31, |
| | 2017 |
| | 2016 |
| | 2015 |
| 2019 |
| | 2018 |
| | 2017 |
|
| Television advertising | $ | 471,227 |
| | $ | 435,096 |
| | $ | 409,469 |
| $ | 547,524 |
| | $ | 562,450 |
| | $ | 523,516 |
|
| Carriage fees and subscriptions | 83,232 |
| | 71,331 |
| | 66,644 |
| 117,652 |
| | 113,746 |
| | 95,823 |
|
| Other | 19,753 |
| | 19,747 |
| | 20,082 |
| 29,628 |
| | 27,710 |
| | 23,529 |
|
| Total net revenues | $ | 574,212 |
| | $ | 526,174 |
| | $ | 496,195 |
| $ | 694,804 |
| | $ | 703,906 |
| | $ | 642,868 |
|
We doManagement reviews the performance of our operations based on the above revenue types as well as on a geographic basis as described above. Management does not rely on any single major customer or groupreview other disaggregations of majorrevenues from contracts with customers.
CENTRAL EUROPEAN MEDIA ENTERPRISES LTD.
NOTES TO CONSOLIDATED FINANCIAL STATEMENTS
(Tabular amounts in US$ 000’s, except share and per share data)
21. COMMITMENTS AND CONTINGENCIES
Commitments
a) Programming Rights Agreements and Other Commitments
At December 31, 20172019, we had total commitments of US$ 99.1103.5 million (December 31, 20162018: US$ 114.362.8 million) in respect of future programming, including contracts signed with license periods starting after the balance sheet date. In addition, we have digital transmission obligations future minimum operating lease payments for non-cancellable operating leases with remaining terms in excess of one year (net of any sublease income) and other commitments as follows:
|
| | | | | | | |
| | Programming purchase obligations |
| | Other commitments |
|
| 2020 | $ | 36,932 |
| | $ | 12,740 |
|
| 2021 | 24,944 |
| | 5,705 |
|
| 2022 | 23,049 |
| | 5,775 |
|
| 2023 | 11,601 |
| | 5,900 |
|
| 2024 | 5,528 |
| | — |
|
| 2025 and thereafter | 1,452 |
| | — |
|
| Total | $ | 103,506 |
| | $ | 30,120 |
|
|
| | | | | | | | | | | | | | | |
| | Programming purchase obligations |
| | Other commitments (1) |
| | Operating leases |
| | Capital expenditures |
|
| 2018 | $ | 33,308 |
| | $ | 14,983 |
| | $ | 2,830 |
| | $ | 1,273 |
|
| 2019 | 28,700 |
| | 11,827 |
| | 761 |
| | — |
|
| 2020 | 17,910 |
| | 2,030 |
| | 371 |
| | — |
|
| 2021 | 13,077 |
| | 161 |
| | 349 |
| | — |
|
| 2022 | 2,587 |
| | 139 |
| | 346 |
| | — |
|
| 2023 and thereafter | 3,558 |
| | 12 |
| | 1,728 |
| | — |
|
| Total | $ | 99,140 |
| | $ | 29,152 |
| | $ | 6,385 |
| | $ | 1,273 |
|
| |
(1)
| Other commitments are primarily comprised of digital transmission commitments. |
For the years ended December 31, 2017, 2016 and 2015, we incurred aggregate rent expense on all facilities of US$ 8.1 million, US$ 7.0 million and US$ 5.8 million, respectively.
Contingencies
Litigation
We are from time to time party to legal proceedings, arbitrations and regulatory proceedings arising in the normal course of our business operations, including the proceeding described below. We evaluate, on a quarterly basis, developments in such matters and provide accruals for such matters, as appropriate. In making such decisions, we consider the degree of probability of an unfavorable outcome and our ability to make a reasonable estimate of the amount of a loss. An unfavorable outcome in any such proceedings, if material, could have an adverse effect on our business or consolidated financial statements.
In the fourth quarter of 2016, our Slovak subsidiary MARKIZA-SLOVAKIA, spol. s.r.o. (“Markiza”("Markiza") was notified of claims that were filed in June 2016 in a court of first instance in Bratislava, the Slovak Republic to collect amounts allegedly owing under four4 promissory notes.notes that have a collective face value of approximately EUR 69.0 million. These four4 promissory notes were purportedly issued in June 2000 by Pavol Rusko in his personal capacity and were purportedly guaranteed by Markiza under the signature of Mr. Rusko, who was an executive director of Markiza at that time as well as one of its shareholders. TheNaN of the notes purport to be issued in favor of Marian Kocner, a controversial Slovak businessman, and the other 2 to a formerlong-time associate of Mr. Kocner, andKocner. All 4 notes were supposedly assigned several times, for no apparent consideration, to companies owned by or associated with Mr. Kocner and ultimately to Sprava a inkaso zmeniek, s.r.o., a company owned by Mr. Kocner that isinitiated the plaintiffclaims for payment in these proceedings. Two
NaN of the notes, each of which purportedly has a face value of approximately EUR 8.3 million, allegedly matured in 2015 and the2015. The other two2 notes, which were purportedly issued in 2016. The four notes purport to be in the aggregate amount of approximately EUR 69.0 million.
Despite a random case assignment system in the Slovak Republic, claims in respect of three of the notes were initially assigned to the same judge. The judge who was assigned the claim in respect of the fourth promissory note (inblank, had the amount of approximately EUR 26.0 million) terminated proceedings26.2 million inserted on each of them by Mr. Kocner or someone associated with him in January 2017 because the plaintiff failed to pay court fees.mid-2016, shortly before their alleged maturity. The plaintiff refiled this claim in June 2017; the judge who was assigned the refiled claim terminated proceedings in September after the plaintiff again failed to pay court fees. In responses to the claims in respect of the other three promissory4 notes that were filed in August 2017,accrue interest from their purported maturity dates. Although Mr. Rusko has asserted in testimony in the civil proceedings that he signed the three notes in June 2000. We2000, we do not believe that the notes were signed in June 2000 or that any of the notes are authentic. We
Despite a random case assignment system in the Slovak Republic, claims in respect of 3 of the notes were initially assigned to the same judge. NaN of those claims, concerning 1 of the promissory notes having a face value of approximately EUR 8.3 million (the "First PN Case"), was subsequently reassigned. Proceedings on the claim in respect of the fourth promissory note (in the amount of approximately EUR 26.2 million) (the "Fourth PN Case") were initially terminated in January 2017 by the presiding judge because the plaintiff failed to pay court fees and were terminated a second time by a different presiding judge in September 2017 after the plaintiff refiled but failed to pay court fees a second time.
During the first quarter of 2018, the court of first instance began to schedule hearings in respect of the First PN Case in respect of the claims relating to the second promissory note having a face value of approximately EUR 8.3 million (the "Second PN Case") and one of the promissory notes having a face value of approximately EUR 26.2 million (the "Third PN Case").
On April 26, 2018, the judge in the First PN Case ruled in favor of the plaintiff. Markiza appealed that decision.
On May 14, 2018, Markiza filed a criminal complaint with the Special Prosecutor's Office of the Slovak Republic (the "Special Prosecutor’s Office") alleging that Mr. Kocner and Mr. Rusko committed the offenses of (1) counterfeiting, falsification, and illegal production of money and securities and (2) obstruction or perversion of justice. The Special Prosecutor’s Office opened criminal proceedings in the matter at that time.
On June 20, 2018, the Special Prosecutor’s Office issued a decision to formally charge Mr. Kocner and Mr. Rusko with counterfeiting, falsification, and illegal production of money and securities and with obstruction or perversion of justice. Following this decision, Mr. Kocner has been taken into pre-trial custody by the Slovak authorities, where he has remained. Subsequently, the Special Prosecutor’s Office has charged Mr. Kocner’s long-time associate, who received two of the alleged promissory notes as the original beneficial owner and purported to endorse those notes to a company controlled by Mr. Kocner, with counterfeiting, falsification, and illegal production of money and securities.
On October 12, 2018, the court of first instance terminated proceedings in respect of the Second PN Case because the plaintiff failed to pursue the claim, which the plaintiff appealed.
On December 14, 2018, the appellate court suspended proceedings in respect of the First PN Case until a final and enforceable decision has been rendered in the criminal proceedings.
On December 21, 2018, the appellate court reversed the decision of the court of first instance to terminate the Second PN Case and directed the case be tried on the merits.
CENTRAL EUROPEAN MEDIA ENTERPRISES LTD.
NOTES TO CONSOLIDATED FINANCIAL STATEMENTS
(Tabular amounts in US$ 000’s, except share and per share data)
On March 19, 2019, following the conclusion of the pre-trial investigation, the Special Prosecutor’s Office formally indicted Mr. Kocner and Mr. Rusko with counterfeiting, falsification, and illegal production of money and securities and with obstruction or perversion of justice and filed the indictment with the Special Criminal Court of the Slovak Republic.
On March 25, 2019, Markiza filed a complaint with the Slovak Constitutional Court in respect of the appellate court decision in the Second PN Case, which was accepted on October 2, 2019.
On May 14, 2019, the court of first instance decided to suspend proceedings in respect of the Second PN Case until a final and enforceable decision has been rendered in the criminal proceedings.
There have been no hearings held in respect of the Third PN Case since the initiation of the criminal proceedings. On May 14, 2019, the court of first instance decided to suspend proceedings in respect of the Third PN Case until a final and enforceable decision has been rendered in the criminal proceedings.
The plaintiff re-filed its claim with respect to the Fourth PN Case, which purportedly has a face value of approximately EUR 26.2 million, on May 13, 2019 and subsequently paid the requisite court fees. On June 6, 2019, the court of first instance decided to suspend proceedings in respect of the Fourth PN Case until a final and enforceable decision has been rendered in the criminal proceedings.
Accordingly, civil proceedings in respect of all four promissory notes have now been suspended until a final and enforceable decision is rendered in the criminal proceedings. Criminal proceedings commenced in July 2019 and are ongoing. The Special Criminal Court overseeing the criminal proceedings has scheduled hearing dates into mid-February 2020.
In the event any of the civil proceedings are not dismissed as a result of the successful conclusion of the criminal proceedings, Markiza will continue to vigorously defendingdefend the claims.
Based on the facts and circumstances of these cases, we have not accrued any amounts in respect of these claims.
22. RELATED PARTY TRANSACTIONS
We consider our related parties to be our officers, directors and shareholders who have direct control and/or influence over the Company as well as other parties that can significantly influence management. We have identified transactions with individuals or entities associated with Time Warner,AT&T, which is represented on our Board of Directors and holds a 46.3%44.3% voting interest in CME Ltd. (see Note 14, "Equity") as at December 31, 20172019, as material related party transactions.
Time WarnerAT&T
|
| | | | | | | | | | | |
| | For The Year Ended December 31, |
| | 2019 |
| | 2018 |
| | 2017 |
|
| Cost of revenues | $ | 20,666 |
| | $ | 22,609 |
| | $ | 22,373 |
|
| Interest expense | 17,380 |
| | 31,867 |
| | 62,501 |
|
|
| | | | | | | | | | | |
| | For The Year Ended December 31, |
| | 2017 |
| | 2016 |
| | 2015 |
|
| Net revenues | $ | — |
| | $ | — |
| | $ | 198 |
|
| Cost of revenues | 18,870 |
| | 17,362 |
| | 22,437 |
|
| Interest expense | 51,952 |
| | 91,134 |
| | 112,144 |
|
Index |
| | | | | | | |
| | December 31, 2019 |
| | December 31, 2018 |
|
| Programming liabilities | $ | 10,553 |
| | $ | 12,171 |
|
| Other accounts payable and accrued liabilities | 267 |
| | 292 |
|
Accrued interest payable (1) | 1,103 |
| | 1,749 |
|
Other non-current liabilities (2) | 33,465 |
| | 33,465 |
|
CENTRAL EUROPEAN MEDIA ENTERPRISES LTD.
NOTES TO CONSOLIDATED FINANCIAL STATEMENTS
(Tabular amounts in US$ 000’s, except share and per share data)
|
| | | | | | | |
| | December 31, 2017 |
| | December 31, 2016 |
|
| Programming liabilities | $ | 20,027 |
| | $ | 17,126 |
|
| Other accounts payable and accrued liabilities | 252 |
| | 194 |
|
Accrued interest payable (1) | 6,273 |
| | 9,588 |
|
Other non-current liabilities (2) | 69,620 |
| | 44,397 |
|
| |
(1) | Amount represents accrued Guarantee Fees for which we have not yet paid in cash or made an election to pay in kind.paid. See Note 5,4, "Long-term Debt and Other Financing Arrangements". |
| |
(2) | Amount represents the Commitment Fee, as well as the Guarantee Fees for which we havehad previously made an election to pay in kind. See Note 5,4, "Long-term Debt and Other Financing Arrangements". |
See Part III, Item 13, "Certain Relationships and Related Transactions, and Director Independence".
23. QUARTERLY FINANCIAL DATA
Selected quarterly financial data for the years ended December 31, 20172019 and 20162018 is as follows:
|
| | | | | | | | | | | | | | | |
| | For the Year Ended December 31, 2019 |
| | First Quarter (Unaudited) | | Second Quarter (Unaudited) | | Third Quarter (Unaudited) | | Fourth Quarter (Unaudited) |
| Consolidated Statements of Operations and Comprehensive Income / Loss Data: | | | | | | | |
| Net revenues | $ | 146,559 |
| | $ | 183,599 |
| | $ | 138,851 |
| | $ | 225,795 |
|
| Cost of revenues | 94,028 |
| | 94,429 |
| | 82,510 |
| | 110,567 |
|
| Operating income | 27,637 |
| | 60,462 |
| | 30,783 |
| | 68,454 |
|
| Income from continuing operations | 11,751 |
| | 44,078 |
| | 13,522 |
| | 49,857 |
|
| Net income | 11,751 |
| | 44,078 |
| | 13,522 |
| | 49,857 |
|
| Net income attributable to CME Ltd. | 11,758 |
| | 43,959 |
| | 13,745 |
| | 49,672 |
|
| | | | | | | | |
| Net income per share: | | | | | | | |
| Continuing operations — basic | $ | 0.03 |
| | $ | 0.12 |
| | $ | 0.04 |
| | $ | 0.13 |
|
| Continuing operations — diluted | 0.03 |
| | 0.12 |
| | 0.04 |
| | 0.13 |
|
| Attributable to CME Ltd. — basic | 0.03 |
| | 0.12 |
| | 0.04 |
| | 0.13 |
|
| Attributable to CME Ltd. — diluted | 0.03 |
| | 0.12 |
| | 0.04 |
| | 0.13 |
|
|
| | | | | | | | | | | | | | | |
| | For the Year Ended December 31, 2017 |
| | First Quarter (Unaudited) | | Second Quarter (Unaudited) | | Third Quarter (Unaudited) | | Fourth Quarter (Unaudited) |
| Consolidated Statements of Operations and Comprehensive Income / Loss Data: | | | | | | | |
| Net revenues | $ | 111,732 |
| | $ | 146,895 |
| | $ | 119,431 |
| | $ | 196,154 |
|
| Cost of revenues | 77,968 |
| | 80,081 |
| | 77,606 |
| | 103,853 |
|
| Operating income | 13,024 |
| | 43,153 |
| | 16,022 |
| | 57,750 |
|
| (Loss) / income from continuing operations | (5,982 | ) | | 25,265 |
| | (1,945 | ) | | 36,715 |
|
| (Loss) / income from discontinued operations, net of tax | (5,292 | ) | | 2,533 |
| | (5,988 | ) | | 4,121 |
|
| Net (loss) / income | (11,274 | ) | | 27,798 |
| | (7,933 | ) | | 40,836 |
|
| Net (loss) / income attributable to CME Ltd. | (11,065 | ) | | 27,935 |
| | (7,745 | ) | | 40,643 |
|
| | | | | | | | |
| Net (loss) / income per share: | | | | | | | |
| Continuing operations — basic | $ | (0.05 | ) | | $ | 0.09 |
| | $ | (0.03 | ) | | $ | 0.13 |
|
| Continuing operations — diluted | (0.05 | ) | | 0.07 |
| | (0.03 | ) | | 0.10 |
|
| Discontinued operations — basic | (0.04 | ) | | 0.01 |
| | (0.04 | ) | | 0.02 |
|
| Discontinued operations — diluted | (0.04 | ) | | 0.00 |
| | (0.04 | ) | | 0.01 |
|
| Net (loss) / income attributable to CME Ltd. — basic | (0.09 | ) | | 0.10 |
| | (0.07 | ) | | 0.15 |
|
| Net (loss) / income attributable to CME Ltd. — diluted | (0.09 | ) | | 0.07 |
| | (0.07 | ) | | 0.11 |
|
|
| | | | | | | | | | | | | | | |
| | For the Year Ended December 31, 2018 |
| | First Quarter (Unaudited) | | Second Quarter (Unaudited) | | Third Quarter (Unaudited) | | Fourth Quarter (Unaudited) |
| Consolidated Statements of Operations and Comprehensive Income / Loss Data: | | | | | | | |
| Net revenues | $ | 156,709 |
| | $ | 181,908 |
| | $ | 137,038 |
| | $ | 228,251 |
|
| Cost of revenues | 103,670 |
| | 104,997 |
| | 84,588 |
| | 114,850 |
|
| Operating income | 24,581 |
| | 50,017 |
| | 22,197 |
| | 80,792 |
|
| Income from continuing operations | 6,756 |
| | 23,675 |
| | 10,609 |
| | 56,025 |
|
| Income from discontinued operations, net of tax | 316 |
| | 2,350 |
| | 57,882 |
| | — |
|
| Net income | 7,072 |
| | 26,025 |
| | 68,491 |
| | 56,025 |
|
| Net income attributable to CME Ltd. | 7,250 |
| | 26,041 |
| | 68,571 |
| | 55,830 |
|
| | | | | | | | |
| Net (loss) / income per share (as adjusted): | | | | | | | |
| Continuing operations — basic | $ | 0.02 |
| | $ | 0.06 |
| | $ | 0.03 |
| | $ | 0.15 |
|
| Continuing operations — diluted | 0.01 |
| | 0.06 |
| | 0.03 |
| | 0.15 |
|
| Discontinued operations — basic | 0.00 |
| | 0.01 |
| | 0.15 |
| | — |
|
| Discontinued operations — diluted | 0.00 |
| | 0.00 |
| | 0.15 |
| | — |
|
| Attributable to CME Ltd. — basic | 0.02 |
| | 0.07 |
| | 0.18 |
| | 0.15 |
|
| Attributable to CME Ltd. — diluted | 0.01 |
| | 0.06 |
| | 0.18 |
| | 0.15 |
|
|
| | | | | | | | | | | | | | | |
| | For the Year Ended December 31, 2016 |
| | First Quarter (Unaudited) | | Second Quarter (Unaudited) | | Third Quarter (Unaudited) | | Fourth Quarter (Unaudited) |
| Consolidated Statements of Operations and Comprehensive Income / Loss Data: | | | | | | | |
| Net revenues | $ | 105,817 |
| | $ | 142,803 |
| | $ | 107,527 |
| | $ | 170,027 |
|
| Cost of revenues | 77,125 |
| | 80,691 |
| | 73,276 |
| | 93,296 |
|
| Operating income | 8,903 |
| | 39,718 |
| | 11,450 |
| | 45,461 |
|
| (Loss) / income from continuing operations | (34,878 | ) | | (139,148 | ) | | (11,769 | ) | | 21,370 |
|
| Loss from discontinued operations, net of tax | (5,816 | ) | | (2,101 | ) | | (8,054 | ) | | (201 | ) |
| Net (loss) / income | (40,694 | ) | | (141,249 | ) | | (19,823 | ) | | 21,169 |
|
| Net (loss) / income attributable to CME Ltd. | (40,435 | ) | | (141,317 | ) | | (19,627 | ) | | 21,088 |
|
| | | | | | | | |
| Net (loss) / income per share: | | | | | | | |
| Continuing operations — basic | $ | (0.27 | ) | | $ | (0.96 | ) | | $ | (0.09 | ) | | $ | 0.07 |
|
| Continuing operations — diluted | (0.27 | ) | | (0.96 | ) | | (0.09 | ) | | 0.06 |
|
| Discontinued operations — basic | (0.04 | ) | | (0.02 | ) | | (0.05 | ) | | 0.00 |
|
| Discontinued operations — diluted | (0.04 | ) | | (0.02 | ) | | (0.05 | ) | | 0.00 |
|
| Net (loss) / income attributable to CME Ltd. — basic | (0.31 | ) | | (0.98 | ) | | (0.14 | ) | | 0.07 |
|
| Net (loss) / income attributable to CME Ltd. — diluted | (0.31 | ) | | (0.98 | ) | | (0.14 | ) | | 0.06 |
|
CENTRAL EUROPEAN MEDIA ENTERPRISES LTD.
NOTES TO CONSOLIDATED FINANCIAL STATEMENTS
(Tabular amounts in US$ 000’s, except share and per share data)
24. SUBSEQUENT EVENTS
On February 5, 2018, we entered into an amendment to the 2018 Euro Term Loan agreement with BNP Paribas, as administrative agent, Time Warner, as guarantor, and the lenders thereto in order to extend the maturity date of the 2018 Euro Term Loan from November 1, 2018 to May 1, 2019. We have presented the amended 2018 Euro Term Loan under Long-term debt and other financing arrangements on the 2017 balance sheet.
On February 6, 2018, we paid EUR 50.0 million (approximately US$ 61.6 million at February 6, 2018 rates) of the outstanding principal balance of the 2018 Euro Term Loan.
ITEM 9 CHANGES IN AND DISAGREEMENTS WITH ACCOUNTANTS ON ACCOUNTING AND FINANCIAL DISCLOSURE
None.
ITEM 9A. CONTROLS AND PROCEDURES
Evaluation of Disclosure Controls and Procedures
We have established disclosure controls and procedures designed to ensure that information required to be disclosed in our Annual Report on Form 10-K is recorded, processed, summarized and reported within the specified time periods and is designed to ensure that information required to be disclosed is accumulated and communicated to management, including the co-Chief Executive Officers and the Chief Financial Officer to allow timely decisions regarding required disclosure.
Our co-Chief Executive Officers and our Chief Financial Officer evaluated the effectiveness of the design and operation of our disclosure controls and procedures as defined in Rules 13a-15(e) and 15d-15(e) under the Exchange Act as of December 31, 20172019 and concluded that our disclosure controls and procedures were effective as of that date.
Management’s Report on Internal Control Over Financial Reporting
Our management is responsible for establishing and maintaining adequate internal control over financial reporting. We have performed an assessment of the design and operating effectiveness of our internal control over financial reporting as of December 31, 2017.2019. This assessment was performed under the direction and supervision of our co-Chief Executive Officers and our Chief Financial Officer, and utilized the framework established in “Internal Control - Integrated Framework (2013)” issued by the Committee of Sponsoring Organizations of the Treadway Commission (COSO).
Based on that evaluation, we concluded that as of December 31, 2017,2019, our internal control over financial reporting was effective. Our independent registered public accounting firm, Ernst & Young LLP, has audited our financial statements and issued a report on the effectiveness of internal control over financial reporting, which is included herein.
Changes in Internal Controls
There were no changes in our internal controls over financial reporting during the three month period ended December 31, 20172019 that have materially affected, or are reasonably likely to materially affect, our internal control over financial reporting.
REPORT OF INDEPENDENT REGISTERED PUBLIC ACCOUNTING FIRM
To the Board of Directors and the Shareholders of Central European Media Enterprises Ltd.
Opinion on Internal Control over Financial Reporting
We have audited Central European Media Enterprises Ltd.’s internal control over financial reporting as of December 31, 2017,2019, based on criteria established in Internal Control-Integrated Framework issued by the Committee of Sponsoring Organizations of the Treadway Commission (2013 framework) (the COSO criteria). In our opinion, Central European Media Enterprises Ltd.’s (the Company) maintained, in all material respects, effective internal control over financial reporting as of December 31, 2017,2019, based on the COSO criteria.
We also have audited, in accordance with the standards of the Public Company Accounting Oversight Board (United States) (PCAOB), the consolidated balance sheets of Central European Media Enterprises Ltd. as of December 31, 20172019 and 2016,2018, the related consolidated statements of operations and comprehensive income / loss, equity and cash flows for each of the twothree years in the period ended December 31, 2017,2019, of the Company and our report dated February 8, 20186, 2020 expressed an unqualified opinion thereon.
Basis for Opinion
The Company’s management is responsible for maintaining effective internal control over financial reporting and for its assessment of the effectiveness of internal control over financial reporting included in the accompanying Annual Report on Form 10-K. Our responsibility is to express an opinion on the Company’s internal control over financial reporting based on our audit. We are a public accounting firm registered with the PCAOB and are required to be independent with respect to the Company in accordance with the U.S. federal securities laws and the applicable rules and regulations of the Securities and Exchange Commission and the PCAOB.
We conducted our audit in accordance with the standards of the PCAOB. Those standards require that we plan and perform the audit to obtain reasonable assurance about whether effective internal control over financial reporting was maintained in all material respects.
Our audit included obtaining an understanding of internal control over financial reporting, assessing the risk that a material weakness exists, testing and evaluating the design and operating effectiveness of internal control based on the assessed risk, and performing such other procedures as we considered necessary in the circumstances. We believe that our audit provides a reasonable basis for our opinion.
Definition and Limitations of Internal Control Over Financial Reporting
A company’s internal control over financial reporting is a process designed to provide reasonable assurance regarding the reliability of financial reporting and the preparation of financial statements for external purposes in accordance with generally accepted accounting principles. A company’s internal control over financial reporting includes those policies and procedures that (1) pertain to the maintenance of records that, in reasonable detail, accurately and fairly reflect the transactions and dispositions of the assets of the company; (2) provide reasonable assurance that transactions are recorded as necessary to permit preparation of financial statements in accordance with generally accepted accounting principles, and that receipts and expenditures of the company are being made only in accordance with authorizations of management and directors of the company; and (3) provide reasonable assurance regarding prevention or timely detection of unauthorized acquisition, use, or disposition of the company’s assets that could have a material effect on the financial statements.
Because of its inherent limitations, internal control over financial reporting may not prevent or detect misstatements. Also, projections of any evaluation of effectiveness to future periods are subject to the risk that controls may become inadequate because of changes in conditions, or that the degree of compliance with the policies or procedures may deteriorate.
/s/ Ernst & Young LLP
London, United Kingdom
February 8, 20186, 2020
ITEM 9B. OTHER INFORMATION
On February 5, 2018, CME Ltd. entered into an amendment to the senior unsecured term credit facility agreement among CME Ltd., as borrower, BNP Paribas, as administrative agent, Time Warner, as guarantor, and the lenders party thereto originally dated November 14, 2014 (included as Exhibit 10.27 to this Form 10-K), as amended (including by an amendment agreement dated February 19, 2016 (included as Exhibit 10.31 to this Form 10-K) and a consent waiver and amendment agreement dated June 22, 2017 (included as Exhibit 10.41 to this Form 10-K)), to extend the maturity date from November 1, 2018 to May 1, 2019.None.
PART III
ITEM 10. DIRECTORS, EXECUTIVE OFFICERS AND CORPORATE GOVERNANCE
The information required by Item 10 is incorporated herein by reference to the sections entitled “Election of Directors,” “Executive Officers,” “Corporate Governance and Board of Director Matters” and “Section“Delinquent Section 16(a) Beneficial Ownership Reporting Compliance”Reports” in our Proxy Statement for the 20182020 Annual General Meeting of Shareholders.
ITEM 11. EXECUTIVE COMPENSATION
The information required by Item 11 is incorporated herein by reference to the sections entitled “Compensation Discussion and Analysis”, “Summary Compensation Table”, “Compensation Committee Report” and “Compensation Committee Interlocks and Insider Participation” in our Proxy Statement for the 20182020 Annual General Meeting of Shareholders.
| |
| ITEM 12. | SECURITY OWNERSHIP OF CERTAIN BENEFICIAL OWNERS AND MANAGEMENT AND RELATED STOCKHOLDER MATTERS |
The information required by Item 12 relating to the security ownership of certain beneficial owners and management is incorporated herein by reference to the section entitled “Security Ownership of Certain Beneficial Owners and Management" in our Proxy Statement for the 20182020 Annual General Meeting of Shareholders.
Equity Compensation Plan Information
The following table provides information as of December 31, 20172019 about common stock that may be issued upon the exercise of options, warrants and rights under all of our existing equity compensation plans.
| | Equity Compensation Plan Information | | | (a) | | (b) | | (c) | (a) | | (b) | | (c) |
| Plan Category | Number of securities to be issued upon exercise of outstanding options, warrants and rights | | Weighted average exercise price of outstanding options, warrants and rights | | Number of securities remaining available for future issuance under equity compensation plans (excluding securities reflected in column (a)) | Number of securities to be issued upon exercise of outstanding options, warrants and rights | | Weighted average exercise price of outstanding options, warrants and rights | | Number of securities remaining available for future issuance under equity compensation plans (excluding securities reflected in column (a)) |
| Equity compensation plans approved by security holders: | | | | | |
| Stock options | 2,011,392 |
| | $2.32 | | (1) | 2,011,392 |
| | $2.32 | | (1) |
| Restricted stock units | 2,694,063 |
| | n/a | | (1) | 2,834,253 |
| | n/a | | (1) |
| Equity compensation plans not approved by security holders | — |
| | — | | — | — |
| | — | | — |
| Total | 4,705,455 |
| | $2.32 | | 2,229,531 | 4,845,645 |
| | $2.32 | | 10,078,617 |
|
| |
(1) | There were 2,229,53110,078,617 shares available for issuance under CME’s 2015 Stock Incentive Plan at December 31, 20172019 after reflecting both stock options and restricted stock units in column (a). |
ITEM 13. CERTAIN RELATIONSHIPS AND RELATED TRANSACTIONS, AND DIRECTOR INDEPENDENCE
The information required by Item 13 is incorporated herein by reference to the sections entitled “Certain Relationships and Related Party Transactions” and “Corporate Governance and Board of Director Matters” in our Proxy Statement for the 20182020 Annual General Meeting of Shareholders.
ITEM 14. PRINCIPAL ACCOUNTANT FEES AND SERVICES
The information required by Item 14 is incorporated herein by reference to the section entitled “Selection of Auditors” in our Proxy Statement for the 20182020 Annual General Meeting of Shareholders.
PART IV
ITEM 15. EXHIBITS AND FINANCIAL STATEMENT SCHEDULES
(a)(1) The following financial statements of Central European Media Enterprises Ltd. are included in Part II, Item 8 of this Report:
ReportsReport of Independent Registered Public Accounting Firms;Firm;
Consolidated Balance Sheets as of December 31, 2017 and 2016;
Consolidated Statements of Operations and Comprehensive Income / Loss for the years ended December 31, 2017, 2016 and 2015;
Consolidated Statements of Equity for the years ended December 31, 2017, 2016 and 2015;
Consolidated Statements of Cash Flows for the years ended December 31, 2017, 2016 and 2015; and
| |
| • | Consolidated Balance Sheets as of December 31, 2019 and 2018; |
| |
| • | Consolidated Statements of Operations and Comprehensive Income / Loss for the years ended December 31, 2019, 2018 and 2017; |
| |
| • | Consolidated Statements of Equity for the years ended December 31, 2019, 2018 and 2017; |
| |
| • | Consolidated Statements of Cash Flows for the years ended December 31, 2019, 2018 and 2017; and |
Notes to Consolidated Financial Statements.
(a)(2) Financial Statement Schedule (included at page S-1 of this Annual Report on Form 10-K).
(a)(3) The following exhibits are included in this report:
EXHIBIT INDEX
|
| | |
| Exhibit Number | | Description |
| 3.01* | | Memorandum of Association (incorporated by reference to Exhibit 3.01 to the Company's Registration Statement No. 3380344 on Form S-1 filed June 17, 1994). |
| | | |
| 3.02* | | Memorandum of Increase of Share Capital (incorporated by reference Exhibit 3.03 to Amendment No. 1 to the Company's Registration Statement No. 33-80344 on Form S-1, filed August 19, 1994). |
| | | |
| 3.03* | | Memorandum of Reduction of Share Capital (incorporated by reference to Exhibit 3.04 to Amendment No. 2 to the Company's Registration Statement No. 33-80344 on Form S-1, filed September 14, 1994). |
| | | |
| 3.04* | | |
| | | |
| 3.05* | | |
| | | |
| 3.06* | | |
| | | |
| 3.07* | | |
| | | |
| 3.08*+ | | |
| | | |
| 4.01* | | Specimen Class A Common Stock Certificate (incorporated by reference to Exhibit 4.01 to Amendment No. 1 to the Company's Registration Statement No. 33-80344 on Form S-1, filed August 19, 1994). |
| | | |
| 4.02* | | |
| | |
4.03* | | |
| | |
4.04* | | |
| | |
4.05* | | |
| | |
4.06* | | |
| | | |
4.07*4.03* | | |
| | |
4.08* | | |
| | | |
4.09*4.04* | | |
| | |
| 4.05 | | |
| | | |
| 10.01*+ | | |
| | |
10.02*+ | | |
| | | |
10.03*10.02*+ | | |
| | |
|
| | |
Exhibit Number | | Description |
10.04*+ | | |
| | |
10.05*+ | | |
| | |
10.06*+ | | |
| | | |
10.07*10.03*+ | | |
| | | |
10.08*10.04*+ | | |
| | |
10.09*+ | | |
| | | |
10.10*10.05*+ | | |
| | | |
10.11*10.06*+ | | |
| | |
| 10.07*+ | | |
| | |
| 10.08*+ | | |
|
| | |
| Exhibit Number | | Description |
| | |
| 10.09*+ | | |
| | |
| 10.10*+ | | |
| | |
| 10.11*+ | | |
| | | |
| 10.12*+ | | |
| | |
| 10.13* | | |
| | | |
10.13*10.14* | | |
| | |
10.14* | | |
| | | |
| 10.15* | | |
| | | |
| 10.16* | | |
| | | |
| 10.17* | | |
| | |
10.18* | | |
| | |
10.19* | | |
| | | |
10.20*10.18* | | |
| | | |
10.21*10.19* | | |
| | | |
10.22*10.20* | | |
| | | |
|
| | |
Exhibit Number | | Description |
10.23*10.21* | | |
| | | |
10.24*10.22* | | |
| | |
10.25* | | |
| | |
10.26* | | |
| | | |
10.27*10.23* | | |
| | |
10.28* | | |
| | |
10.29* | | |
| | | |
10.30*10.24* | | Credit Agreement dated as of February 19, 2016 among CME Media Enterprises B.V., as borrower, Central European Media Enterprises Ltd., as guarantor, BNP Paribas, as administrative agent, Time Warner Inc., as guarantor, and the lenders party thereto (incorporated by reference to Exhibit 10.1 to the Company’s Current Report on Form 8-K filed on February 22, 2016). |
| | | |
10.31*10.25* | | Amendment dated as of February 19, 2016 to the Credit Agreement dated as of November 14, 2014, among Central European Media Enterprises Ltd., as borrower, BNP Paribas, as administrative agent, Time Warner Inc., as guarantor, and the lenders party thereto (incorporated by reference to Exhibit 10.3 to the Company’s Current Report on Form 8-K filed on February 22, 2016). |
| | |
10.32* | | Amendment dated as of February 19, 2016 to the Credit Agreement dated as of September 30, 2015, among Central European Media Enterprises Ltd., as borrower, BNP Paribas, as administrative agent, Time Warner Inc., as guarantor, and the lenders party thereto (incorporated by reference to Exhibit 10.4 to the Company’s Current Report on Form 8-K filed on February 22, 2016). |
| | | |
10.33*10.26* | | |
| | |
10.34* | | |
| | |
10.35* | | |
| | | |
10.36* |
| | |
| Exhibit Number | | Description |
| 10.27* | | |
| | |
10.37* | | |
| | | |
10.38*10.28* | | |
| | | |
10.39*10.29* | |
|
|
| | |
Exhibit Number | | Description |
| | |
10.40* | | |
| | | |
10.41*10.30* | | Consent, Waiver and Third Amendment as of June 22, 2017No. 1 to the CreditFramework Agreement, dated as of November 14, 2014, as amended, among Central EuropeanApril 10, 2018, between CME Media Enterprises Ltd., as borrower, BNP Paribas, as administrative agent, Time Warner Inc., as guarantor,B.V. and the lenders party theretoSlovenia Broadband S.à r.l. (incorporated by reference to Exhibit 10.0110.1 to the Company's QuarterlyCurrent Report in Form 8-K filed on Form 10-Q for the quarterly period ended June 30, 2017)April 12, 2018). |
| | | |
10.42*10.31* | | |
| | |
| 10.32* | | |
| | |
| 10.33* | | |
| | |
| 10.34* | | |
| | |
| 10.35* | | Consent, Waiver and Second Amendment as of June 22, 2017 to the Credit Agreement dated as of September 30, 2015, as amended, among Central European Media Enterprises Ltd., as borrower, BNP Paribas, as administrative agent, Time Warner Inc., as guarantor, and the lenders party thereto (incorporated by reference to Exhibit 10.02 to the Company's Quarterly Report on Form 10-Q for the quarterly period ended June 30, 2017). |
| | | |
10.43*10.36* | | Consent, Waiver and First Amendment as of June 22, 2017 to the Credit Agreement dated as of February 19, 2016 among CME Media Enterprises B.V., as borrower, Central European Media Enterprises Ltd., as guarantor, BNP Paribas, as administrative agent, Time Warner Inc., as guarantor, and the lenders party thereto (incorporated by reference to Exhibit 10.03 to the Company's Quarterly Report on Form 10-Q for the quarterly period ended June 30, 2017). |
| | | |
10.44*10.37* | | Third Amendment, dated as of April 25, 2018, to the Credit Agreement dated as of September 30, 2015, among Central European Media Enterprises Ltd., as borrower, Time Warner Inc., as guarantor, BNP Paribas, as administrative agent, and the lenders party thereto (incorporated by reference to Exhibit 10.1 to the Company's Current Report in Form 8-K filed on April 26, 2018). |
| | |
| 10.38* | | Second Amendment, dated June 22, 2017,as of April 25, 2018, to the Credit Agreement dated as of February 19, 2016, among CME Media Enterprises B.V., as borrower, Central European Media Enterprises Ltd., as guarantor, Time Warner Inc., as guarantor, BNP Paribas, as administrative agent, and the lenders party thereto (incorporated by reference to Exhibit 10.2 to the Company's Current Report in Form 8-K filed on April 26, 2018). |
| | |
| 10.39* | | Amendment and Restatement Agreement, dated April 25, 2018, in respect of the Amended and Restated Reimbursement Agreement, dated as of November 14, 2014, as amended and restated as of February 19, 2016, as amended, among Central European Media Enterprises Ltd., CME Media Enterprises B.V., and Time Warner Inc., as credit guarantor (incorporated by reference to Exhibit 10.0410.3 to the Company's QuarterlyCurrent Report in Form 8-K filed on Form 10-Q for the quarterly period ended June 30, 2017)April 26, 2018). |
| | | |
10.45*10.40* | | First Second Amended and Restated Reimbursement Agreement, dated as of November 14, 2014, as amended and restated as of February 19, 2016, and as further amended and restated as of April 26, 2018, among Central European Media Enterprises Ltd., CME Media Enterprises B.V., and Time Warner Inc., as credit guarantor (incorporated by reference to Exhibit 10.4 to the Company's Current Report in Form 8-K filed on April 26, 2018). |
| | |
| 10.41* | | Amendment and Restatement Agreement, dated June 22, 2017, toApril 25, 2018, in respect of the Amended and Restated Revolving Loan Facility Credit Agreement, dated as of May 2, 2014, as amended and restated as of November 14, 2014, and as further amended and restated as of February 19, 2016, as amended, among Central European Media Enterprises Ltd., as borrower, Time Warner Inc., as administrative agent, and the lenders party thereto (incorporated by reference to Exhibit 10.0510.5 to the Company's QuarterlyCurrent Report in Form 8-K filed on Form 10-Q for the quarterly period ended June 30, 2017)April 26, 2018). |
| | | |
10.4610.42* | | Fourth Amendment as of February 5, 2018 to theSecond Amended and Restated Revolving Loan Facility Credit Agreement, dated as of November 14,May 2, 2014, as amended and restated as of February 19, 2016, and as further amended and restated as of April 26, 2018, among Central European Media Enterprises Ltd., as borrower, BNP Paribas, as administrative agent, Time Warner Inc., as guarantor,administrative agent, and the lenders party thereto.thereto (incorporated by reference to Exhibit 10.6 to the Company's Current Report in Form 8-K filed on April 26, 2018). |
| | | |
10.47*10.43* | |
|
| | |
|
| | |
| Exhibit Number | | Description |
| 10.44* | | |
| | |
| 10.45*+ | | |
| | | |
10.48*10.46*+ | | |
| | | |
10.49*10.47*+ | | |
| | | |
10.50*10.48*+ | | |
| | |
10.51*+ | | |
| | |
10.52*+ | | |
| | | |
| 21.01 | | |
| | | |
| 23.01 | | |
| | |
23.02 | | |
| | | |
| 24.01 | | |
| | | |
| 31.01 | | |
| | | |
| 31.02 | | |
| | | |
| 31.03 | | |
|
| | |
Exhibit Number | | Description |
| | | |
| 32.01 | | |
| | |
| 99.01* | | |
| | |
| 99.02* | | |
| | |
| 99.03* | | |
| | | |
| 101.INS | | XBRL Instance Document |
| | | |
| 101.SCH | | XBRL Taxonomy Schema Document |
| | | |
| 101.CAL | | XBRL Taxonomy Calculation Linkbase Document |
| | | |
| 101.DEF | | XBRL Taxonomy Definition Linkbase Document |
| | | |
| 101.LAB | | XBRL Taxonomy Label Linkbase Document |
| | | |
| 101.PRE | | XBRL Taxonomy Presentation Linkbase Document |
* Previously filed exhibits.
+ Exhibit is a management contract or compensatory plan.
b) Exhibits: See (a)(3) above for a listing of the exhibits included as part of this report.
c) Report of Independent Registered Public Accountants on Schedule II - Schedule of Valuation Allowances. (See page S-1 of this Annual Report on Form 10-K).
SIGNATURES
Pursuant to the requirements of Section 13 or 15(d) of the Securities Exchange Act of 1934, the Registrant has duly caused this report to be signed on its behalf by the undersigned, thereunto duly authorized.
|
| | |
| | | Central European Media Enterprises Ltd. |
| Date: | February 8, 20186, 2020 | /s/ David Sturgeon David Sturgeon Executive Vice President and Chief Financial Officer Principal Financial Officer and Principal Accounting Officer |
Pursuant to the requirements of the Securities Exchange Act of 1934, this report has been signed below by the following persons on behalf of the Registrant and in the capacities and on the dates indicated.
|
| | | | |
| Signature | | Title | | Date |
| | | | | |
| * | | Chairman of the Board of Directors | | February 8, 20186, 2020 |
| John K. Billock | | | | |
| | | | | |
| /s/ Michael Del Nin | | co-Chief Executive Officer | | February 8, 20186, 2020 |
| Michael Del Nin | | (co-Principal Executive Officer) | | |
| | | | | |
| /s/ Christoph Mainusch | | co-Chief Executive Officer | | February 8, 20186, 2020 |
| Christoph Mainusch | | (co-Principal Executive Officer) | | |
| | | | | |
| /s/ David Sturgeon | | Chief Financial Officer | | February 8, 20186, 2020 |
David Sturgeon
| | (Principal Financial Officer and Principal Accounting Officer) | | |
| | | | | |
| * | | Director | | February 8, 20186, 2020 |
Paul T. CappuccioPeter Knag | | | | |
| | | | | |
| * | | Director | | February 8, 2018 |
Iris Knobloch | | | | |
| | | | |
* | | Director | | February 8, 20186, 2020 |
| Alfred W. Langer | | | | |
| | | | | |
| * | | Director | | February 8, 20186, 2020 |
Bruce MagginParm Sandhu | | | | |
| | | | | |
| * | | Director | | February 8, 2018 |
Parm Sandhu | | | | |
| | | | |
| | | | |
|
| | | | |
Signature | | Title | | Date |
| | | | |
* | | Director | | February 8, 2018 |
Doug Shapiro | | | | |
| | | | |
* | | Director | | February 8, 20186, 2020 |
| Kelli Turner | | | | |
| | | | | |
| * | | Director | | February 8, 20186, 2020 |
Gerhard ZeilerTrey Turner | | | | |
|
| | | |
| | * | By: | /s/ David Sturgeon |
| | | | David Sturgeon |
| | | | Attorney-in-fact ** |
| | | | |
| | ** | By authority of the power of attorney filed herewith |
| | | |
INDEX TO SCHEDULES
Schedule II
Schedule of Valuation Allowances
(US$ 000's)
| | | | Bad debt and credit note provision | | Deferred tax allowance | Bad debt and credit note provision | | Deferred tax allowance |
| BALANCE December 31, 2014 | $ | 8,586 |
| | $ | 119,088 |
| |
| Charged to costs and expenses | 2,260 |
| | (2,496 | ) | |
Deductions (1) | (2,037 | ) | | — |
| |
| Foreign exchange | (979 | ) | | (10,983 | ) | |
| BALANCE December 31, 2015 | 7,830 |
| | 105,609 |
| |
| Charged to costs and expenses | 3,662 |
| | 5,249 |
| |
Deductions (1) | (2,615 | ) | | 250 |
| |
| Foreign exchange | (291 | ) | | (4,507 | ) | |
| BALANCE December 31, 2016 | 8,586 |
| | 106,601 |
| $ | 9,229 |
| | $ | 110,920 |
|
| Charged to costs and expenses | 1,910 |
| | 5,384 |
| 1,913 |
| | 6,242 |
|
Deductions (1) | (1,689 | ) | | 549 |
| (1,886 | ) | | 471 |
|
| Foreign exchange | 1,095 |
| | 15,260 |
| 1,180 |
| | 15,844 |
|
| BALANCE December 31, 2017 | $ | 9,902 |
| | $ | 127,794 |
| 10,436 |
| | 133,477 |
|
| Charged to costs and expenses | | 811 |
| | (26,042 | ) |
Deductions (1) | | (1,079 | ) | | 1,260 |
|
| Foreign exchange | | (471 | ) | | (5,569 | ) |
| BALANCE December 31, 2018 | | 9,697 |
| | 103,126 |
|
| Charged to costs and expenses | | (2,514 | ) | | (3,139 | ) |
Deductions (1) | | 1,592 |
| | 864 |
|
| Foreign exchange | | (227 | ) | | (1,936 | ) |
| BALANCE December 31, 2019 | | $ | 8,548 |
| | $ | 98,915 |
|
| |
(1) | Charged to other accounts for the bad debt and credit note provision consist primarily of accounts receivable written off. |