Securities registered pursuant to Section 12(b) of the Act:
Name of each exchange | ||
Title of each class | on which registered | |
Common stock, par value $1 per share | New York Stock Exchange |
Securities registered pursuant to Section 12(g) of the Act: None
Indicate by check mark if the registrant is a well-known seasoned issuer, as defined in Rule 405 of the Securities Act. Yes [X]x No [ ]o
Indicate by check mark if the registrant is not required to file reports pursuant to Section 13 or Section 15(d) of the Act. Yes [ ]o No [X]x
Indicate by check mark whether the Registrant (1) has filed all reports required to be filed by Section 13 or 15(d) of the Securities Exchange Act of 1934 during the preceding 12 months (or for such shorter period that the registrant was required to file such reports), and (2) has been subject to such filing requirements for the past 90 days. Yes [X]x No [ ]o
Indicate by check mark if disclosure of delinquent filers pursuant to Item 405 of Regulation S-K (§ 229.405 of this chapter) is not contained herein, and will not be contained, to the best of registrant'sregistrant’s knowledge, in definitive proxy or information statements incorporated by reference in Part III of this Form 10-K or any amendment to this Form 10-K. [ ]o
Indicate by check mark whether the registrant is a large accelerated filer, an accelerated filer, a non-accelerated filer, or a non-accelerated filer.smaller reporting company. See definitionthe definitions of “large accelerated filer,” “accelerated filerfiler” and large accelerated filer”“smaller reporting company” in Rule 12b-2 of the Exchange Act. (Check one):Large accelerated filer [X] Accelerated filer [ ] Non-accelerated filer [ ]
Large accelerated filer | x | Accelerated filer | o |
Non-accelerated filer | o | Smaller reporting company | o |
Indicate by check mark whether the registrant is a shell company (as defined in Rule 12b-2 of the Exchange Act). [ ]
o Yes [X]x No
The aggregate market value of the voting stock held by non-affiliates of the Registrant as of June 30, 2006,2008, was approximately $1.4$2.0 billion.
The number of shares outstanding of each of the Registrant'sRegistrant’s classes of Common stock as of January 31, 2007:2009:
Class | Number of shares | |
Common stock, par value $1 per share | 45,211,436 |
Page 2
INDEX TO FORM 10-K
Page | |||||
4 | |||||
18 | |||||
25 | |||||
26 | |||||
27 | |||||
27 | |||||
Market for the | |||||
| Purchases of Securities | 27 | ||||
28 | |||||
Management’s Discussion and Analysis of Financial Condition and Results of Operations | 29 | ||||
49 | |||||
50 | |||||
Changes in and Disagreements with Accountants on Accounting and Financial Disclosure | 94 | ||||
94 | |||||
95 | |||||
96 | |||||
96 | |||||
Security Ownership of Certain Beneficial Owners and Management and Related Stockholder Matters | 96 | ||||
Certain Relationships and Related Transactions, and Director Independence | 96 | ||||
96 | |||||
96 | |||||
101 | |||||
102 | |||||
Page 3
FORWARD-LOOKING INFORMATIONSTATEMENTS
Except for historical information, this Annual Report on Form 10-K may be deemed to contain "forward-looking" information.“forward-looking” statements within the meaning of the Private Litigation Reform Act of 1995. Examples of forward-looking informationstatements include but are not limited to: (a) projections of or statements regarding return on investment, future earnings, interest income, other income, earnings or loss per share, growth prospects, capital structure, and other financial terms, (b) statements of plans and objectives of management, (c) statements of future economic performance, and (d) statements of assumptions, such as economic conditions underlying other statements. Such forward-looking information maystatement can be identified by the use of forward-looking terminology such as "believes," "expects," "may," "should," "anticipates,"“believes,” “expects,” “may,” “will,” “should,” “could,” “anticipates,” as well as the negative of any of the foregoing or variations of such terms or comparable terminology, or by discussion of strategy. No assurance may be given that the future results described by the forward-looking informationstatements will be achieved. Such statements are subject to risks, uncertainties, and other factors, which could cause actual results to differ materially from future results expressed or implied by such forward-looking information.statements. Such statements in this Annual Report on Form 10-K include, without limitation, those contained in Item 1. Business, Item 7. Management'sManagement’s Discussion and Analysis of Financial Condition and Results of Operations, Item 8. Financial Statements and Supplementary Data including, without limitation, the Notes To Consolidated Financial Statements, and Item 11. Executive Compensation. Important factors that could cause the actual results to differ materially from those in these forward-looking statements include, among other items:
•
the Corporation’s successful execution of internal performance plans and performance in accordance with estimates to complete;
•
performance issues with key suppliers, subcontractors, and business partners;
•
the ability to negotiate financing arrangements with lenders;
•
legal proceedings;
•
changes in the need for additional machinery and equipment and/or in the cost for the expansion of the Corporation’s operations;
•
ability of outside third parties to comply with their commitments;
•
product demand and market acceptance risks;
•
the effect of economic conditions;
•
the impact of competitive products and pricing, product development, commercialization, and technological difficulties;
•
social and economic conditions and local regulations in the countries in which the Corporation conducts its businesses;
•
unanticipated environmental remediation expenses or claims;
•
capacity and supply constraints or difficulties;
•
an inability to perform customer contracts at anticipated cost levels;
•
changing priorities or reductions in the U.S. and Foreign Government defense budgets;
•
contract continuation and future contract awards;
•
the other factors discussed under the caption “Risk Factors” in Item 1A below;
•
and other factors that generally affect the business of companies operating in the Corporation’s markets and/or industries.
These forward-looking statements speak only as of the
Corporation's successful execution of internal performance plans;performance issues with key suppliers, subcontractors,date they were made andbusiness partners;the
ability to negotiate financing arrangements with lenders;legal proceedings;changes in the need for additional machinery and equipment and/or in the cost for the expansion of theCorporation's operations;ability of outside third parties to comply with their commitments;product demand and market acceptance risks;the effect of economic conditions;the impact of competitive products and pricing;product development, commercialization, and technological difficulties;social and economic conditions and local regulations in the countries in which the Corporation conducts itsbusinesses;unanticipated environmental remediation expenses or claims;capacity and supply constraints or difficulties;an inability to perform customer contracts at anticipated cost levels;changing priorities or reductions in the U.S. Government defense budget;contract continuation and future contract awards;U.S. and international military budget constraints and determinations;the factors discussed under the caption “Risk Factors” in Item 1A below;and other factors that generally affect the business of companies operating in the Corporation's marketsand/or industries.
The Corporation assumes no obligation to update forward-looking statements to reflect actual results or changes in or additions to the factors affecting such forward-looking statements.
Page 4
BUSINESS DESCRIPTION
TheCurtiss-Wright Corporation manageswas incorporated in 1929 under the laws of the State of Delaware. We design and evaluates itsmanufacture highly engineered, advanced technologies that perform critical functions in demanding conditions in the defense, energy, commercial aerospace, and general industrial markets, where performance and reliability are essential. Our general industrial markets include high-performance automotive, construction, marine, and simulation and test equipment.
Our core competence is providing advanced technologies with superior reliability for customers operating in harsh environments. In addition to meeting demanding performance requirements, our technologies significantly improve worker safety, minimize environmental impact, and improve operating efficiency. Our products and services include critical-function pumps, valves, motors, generators, and electronics; aircraft flight controls, landing systems, ordnance handling, stabilization and utility actuation; as well as metallurgical enhancement of highly stressed components. We compete globally based on technology and pricing, however, significant engineering expertise is a limiting factor to competition, particularly in the U.S. government market. Our business success is challenged by price pressure, environmental impact, and geopolitical events, such as the global war on terrorism and diplomatic accords. Our ability to provide high-performance, advanced technologies on a cost-effective basis is fundamental to our strategy for meeting customer demand.
We manage and evaluate our operations based on the products and services it offerswe offer and the different markets it serves.we serve. Based on this approach, the Corporation haswe operate through three reportable segments: Flow Control, Motion Control, and Metal Treatment. Our principal manufacturing facilities are located in the United States in New York, North Carolina, and Pennsylvania, and internationally in Canada and the United Kingdom.
In 2008, we generated $1.8 billion in sales, an increase of 15% over 2007, which is a continuation of our double-digit sales rate growth in recent years. In the five years since 2003, we have attained a cumulative sales increase of 145%, or $1.1 billion, representing a compounded annual growth rate (CAGR) of 20%. This sales growth was achieved primarily through the acquisition of more than 20 businesses, with an aggregate purchase price of approximately $700 million, while producing organic sales growth each year ranging from 6% to 13%. During the same time period, operating income grew at an 17% CAGR, increasing from $89 million in 2003 to $197 million in 2008. We believe our ability to consistently grow operating income during this period of rapid growth illustrates our ability to integrate acquisitions quickly and profitability. We intend to continue to execute our growth strategy which focuses on diversification in complementary markets that demand high performance and highly engineered products and services.
Our strategy, initiated in 2000, was to minimize our dependence on the commercial aerospace market and expand into other key markets. The rebalancing of our business portfolio was the result of focusing growth initiatives in two robust markets: energy and defense. As a result of our growth, we have achieved a balanced business portfolio with revenues generated from defense, energy, commercial aerospace and general industrial markets. While we have diversified our business portfolio, we have also developed a new core competence in electronics technology. We believe our ability to design and develop future generations of advanced electronics systems is a strategic growth area for the high performance platforms in our served markets.
Flow Control
Our Flow Control segment primarily designs, manufactures, and distributes and services a broad rangeportfolio of highly engineered, flow-controlcritical-function products used in severe serviceincluding valves, pumps, motors, generators, instrumentation, and control electronics. These products manage the flow of liquids and gases, generate power, provide electronic operating systems, and monitor critical functions. Our primary markets are naval defense, and commercial markets including power generation, oil and gas and general industrial. The Motion Control segment primarily designs, develops, and manufactures high-performance mechanical systems, drive systems, embedded computing solutions, and electronic controls and sensors for the defense, aerospace,processing, and general industrial markets. Metal Treatment providesapplications. In the naval defense market, we are a variety of metallurgical services, principally shot peening, laser peening, heat treating, and specialty coatings, for various markets, including military and commercial aerospace, automotive, construction equipment, oil and gas, power generation, and general industrial.
Flow Control
Curtiss-Wright Flow Control specializesglobal leader in the design and manufacture of highly engineered valves, pumps, motors, generators, electronics, and related products for the commercial nuclear power industry, oil and gas processing facilities,propulsion technologies and a range of critical national defense programs. Flow control products are mainly used bypreferred supplier to the U.S. Navy nuclear power plants, the oilfor their aircraft carrier and gas industry, and other commercial applications. While our markets are defined by advanced technology and significant engineering expertise, competition, especially in the U.S. governments’ market, is increasingly impacted by price concerns and geopolitical events, such as the war on terrorism. The ability to provide quality products with excellent performance coupled with our response to downward pricing pressure have become integral to meeting customer demand.submarine programs. Government sales, primarily to the U.S. Navy as a subcontractor, comprised 43%23%, 48%29%, and 50%43% of segment sales in 2008, 2007, and 2006, 2005,respectively. Revenues derived from the sales of valves during 2008, 2007 and 2004, respectively.2006 represented 20%, 22%, and 18%, respectively, of our consolidated revenue.
The Flow Control segment is made upconsists of 19 companies that are organized and21 business units managed through fourfive operating divisions: Electro-Mechanical Systems, Valve Systems, Control Systems, Commercial Power and Services, Electromechanical Systems, and ControlsOil and Gas Systems. The segment has a global customer base with principal manufacturing operations in the United States, Canada, and the United Kingdom.
The ValvePage 5
Our Electro-Mechanical Systems division produces high performance, specialized valveadvanced electro-mechanical solutions for the defense,U.S. Navy, Army, Coast Guard, commercial nuclear power generation, oil and gas processing, and other general industrial markets. The division designs and manufactures advanced critical function pumps, motors, generators, ship propulsors, mechanical seals, control rod drive mechanisms, power conditioning electronics, pulse power supplies, integrated motor-controls, composite materials applications, and protection technologies solutions.
This division develops, designs, manufactures, and performs qualification testing of critical-function, electro-dynamic solutions for its primary customer, the U.S. Nuclear Navy, including main coolant pumps, various other critical-function pumps, extremely power-dense compact motors, main and ship service generators, secondary propulsion systems, and design engineering and testing services. The division has served the U.S. Navy for over 60 years and is a sole source provider for various products. The division also overhauls and provides critical spares for units serving the fleet on operational platforms. Current platforms include the Nimitz and Ford class aircraft carriers, and Virginia, Los Angeles, Seawolf, and Ohio class submarines.
In addition, the division provides propulsion motors and main generators to the non-nuclear U.S. Navy, including the DDG1000 destroyer program. We are strengthening our relationship with the U.S. Navy by participating in the design and development of major subsystems for the U.S. Navy’s Electro-Mechanical Aircraft Launch System (EMALS), Advanced Arresting Gear (AAG) for installation in its future aircraft carrier fleet, and advanced condensate and feed systems designs for the next generation submarine fleet. We expanded our offerings to the military to now include advanced electro-magnetic product development for the U.S. Army as pulsed power technology continues to advance in the military weapons segment.
Electro-Mechanical Systems’ products are also sold to complementary commercial markets, primarily power generation and oil and gas. We have been a supplier to the nuclear power market since its inception more than 50 years ago. We provide reactor coolant pumps, pump seals, and control rod drive mechanisms for commercial nuclear power plants. In 2008, we announced our first domestic new construction contract for three Westinghouse AP1000 power plants to be built in the United States. In 2007, we announced our first award for reactor coolant pumps for for four new AP1000 nuclear power plants to be built in China. Combined, these awards are a significant milestone for both the nuclear power renaissance and the globalization of nuclear power technology. While the nuclear power supply base dwindled considerably during the last two decades due to limited new construction projects, we believe this new ramp up will result in increased competition from other nuclear component suppliers globally. We believe awards will be based on a combination of preferred systems designs, historical performance, and price.
In the oil and gas market, we are utilizing our canned motor and pumping system expertise and partnering with industry leaders to develop advanced systems for offshore recovery, production, and transmission. Current programs encompass sub-sea pumping and power-dense motors for compact, integrated compressor systems. This division has also expanded its offerings to include hazardous waste pumps for the Department of Energy (DOE) and in-line pumps for the hydrocarbon processing industry.
In the general industrial market, this division is a market leader in the design, development, and manufacture of integrated motor-controls and protection technologies solutions for leading original equipment manufacturers (OEMs) and industrial customers. We engineer and manufacture a full range of rugged, reliable, and internationally compliant products that smoothly control the amount of electrical current provided to motors. Custom panel solutions include a variety of low and medium voltage components, such as starters, drives, contactors, breakers, and other related devices. While this is a highly competitive market, our installed base of over 100,000 control units with hundreds of custom designed systems support customers in the industrial heating, ventilation, and air conditioning (HVAC) market, as well as providing engineering, testing, repair,in the energy processing market, including petrochemicals, power generation, mining, and consulting services throughout the world. Thetransportation.
Our Valve Systems division offers a diverse line of products and servicesproduces high-performance specialized valve solutions that control the flow of liquids and gases and provide safety relief in high-pressure, severe-service applications. Becauseprevent over-pressurization of the critical nature of these applications, our products are highly engineered to meet stringent performancevessels, pipelines, and reliability requirements. These products and services include customized critical valve components for the defense industry, a unique and revolutionary coker unheading device, boltless slide valves, fluidic catalytic cracking unit (FCCU) devices, and web-enabled software for the management of pressure relief systems. Revenues derived from the sales of valves during 2006, 2005, and 2004 represented 18%, 16%, and 14%, respectively, of the Corporation’s consolidated revenue.equipment. This division operates facilities in the U.S., Canada, and the U.K. To enhance our global competitiveness, we have made a small investment in Korea and Russia and plan to establish a manufacturing facility in China in the near future.
This division’s sales to the U.S. Government, primarily the U.S. Navy, include valves that are installed on every nuclear submarine and aircraft carrier commissioned by the U.S. Navy. It also currently supplies all the relief valves utilized by the Navy’s nuclear propulsion systems. Key programs include the Virginia class submarine and CVN aircraft carriers. Other programs include various Navy submarine classes, such as Los Angeles and Trident, as well as the Nimitz aircraft carriers. Additional growth in this sector has been generated through development programs for aircraft launch and arrest systems and non-nuclear control valves for aircraft carriers and ball valves for submarines. Valve Systems continues to leverage its long-standing relationship and proven engineering expertise with the U.S. Navy to identify new opportunities for additional products on all of its platforms.
Page 5
The Valve Systems division also provides products for the commercial markets, mainly nuclear power. The Valve Systems Group provides its valves to owners and operators of commercial power utilities who use them in new and existing nuclear and fossil fuel power plants. Recently, the product line has been enhanced to include instrumentation accessories for air operated valves. The division expects a resurgence of demand for commercial nuclear power both in the U.S. and abroad and is positioning itself to participate in the new construction for both domestic and international nuclear power plants. In recent years, all newly built nuclear power plants have been outside the U.S., and segment sales for such plants have been mainly to South Korea and Taiwan. As the nuclear market picks up momentum, we expect increased competition in the market. However, we believe our long standing reputation, strong customer relationships, and proven technologies should provide us with good opportunities.
Within the petroleum, petrochemical, chemical, and oil and gas processing markets, the Valve Systems division designs, engineers, and manufactures spring-loaded, pilot-operated pressure-relief valves and pilot operated pressure-reliefsolenoid-operated valves, as well as metal-seated industrial gate, butterfly boltless slide, plug, angle, diverter, and ball valves used in standard and advanced applications, including high-cycle, high-pressure, extreme temperature, and corrosive plant environments. Included in this portfolio of products is the recent commercializationBecause of the DeltaGuard™ coke-drum unheading device, which represents a significant advancement in coke-drum unheading technology. This patented technology is remotely operated, therefore inherently safe, easycritical nature of these applications, our products are highly engineered to operate, reliable, cost effective,meet stringent performance and can be configured for any coke-drum application. There are patents for The DeltaGuard coke-drum which are significant to the sales ofreliability requirements. In addition, this product as they require new entrants to develop new technological approaches in order to enter the market. The division also provides inspection, installation,engineering support, testing, repair, and maintenance, and other fieldconsulting services for harsh environment flow control systems.
Enhancing ourglobally. Key markets include defense, power generation, oil and gas market position, this division recently purchased Enpro Systemsprocessing, and general industrial markets.
Page 6
This division’s valves are utilized in April 2006the nuclear propulsion system of every nuclear submarine and subsequently integrated it with an existing business, Tapco International, creating TapcoEnpro International. The acquisition expanded our product portfolio toaircraft carrier commissioned by the U.S. Navy. Current programs include engineered pressure vessels, FCCUs, ethylene cracking processing equipment,the Virginia class submarine and related field services. TapcoEnpro International offers custom-designed valvesFord class aircraft carriers. In addition, we provide spares and complementary components that operate in industrial process applications including fluid, residual,repair work for various submarine classes, such as Los Angeles and millisecond catalytic cracking unitsTrident, as well as the Nimitz class aircraft carriers. Despite a relatively flat naval defense budget in recent years, growth has been generated in this market through long-standing customer relationships and successful development programs for non-nuclear control valves and flight critical applications aboard the nation’s aircraft carriers. Although there is strong competition for these awards, competition is limited by significant qualifications and performance requirements. In commercial markets, this division provides valves to commercial nuclear power generation, steel manufacture,plants, oil and ore reduction. TapcoEnpro International also manufactures, repairs,gas refineries, production platforms and modifies orifice chambers, hydrotreaters,pipelines, and American Society of Mechanical Engineers (ASME) code pressure vessels.general processing industries worldwide. In addition, TapcoEnpro International can provide a wide array of field services, including equipment repair, modification or replacement, inspection of valves, controls, pipeswe are integrating our core hardware technology with engineering software to enhance product selection and refractory linings, maintenance planning and scheduling for valves or control systems, diagnostic assistance with troubleshooting problems in critical components, and on-site system training.
inventory management. General industryindustrial products within the Valve Systems division include hydraulic power units and components primarily for the automotive and entertainment industries, specialty hydraulic and pneumatic valves, air-driven pumps, gas boosters, and directional control valves used in various industrial applications includingsuch as truck transmissiontransmissions and car transport carriers. Competition is based upon quality of technology, price, installed base, and delivery times.
The Commercial Power and Services division designs, manufactures, distributes, and qualifies flow control products for nuclear power plants, hydroelectric energy producers, the Department of Energy (DOE), and the Department of Defense. This division offers a wide range of fasteners, fastening systems, specialized containment doors, airlock hatches, electrical units, bolting solutions, machined products, consulting, and enterprise resource planning for the nuclear power. In addition, this division provides distribution and servicing of original equipment manufacturers (OEM) spare parts and valve components, training, on-site services, staff augmentation, and engineering programs relating to nuclear power plants, as well as diamond wire cutting services used to create large, thick cuts from concrete structures.
During the last decade, numerous competitors have exited this market due the stringent qualification requirements. Our operations have maintained all of the regulatory certifications required to provide and /or qualify value-added representations and certification of nuclear-grade products and are well positioned to benefit from a commercial nuclear power renaissance both domestically and internationally. The key will be to remain competitive and continue to offer excellent performance and quality products. This division has locations in Brea, California, Middleburgh, Ohio and Cincinnati, Ohio.
Page 6
The Electro-Mechanical Systems division produces advanced electro-mechanical solutions for the U.S. Navy, commercial nuclear power, and the oil and gas processing markets. The division designs and manufactures advanced pumps, motors, generators, propulsors, mechanicals seals, control rod drive mechanisms, and power conditioning electronics. This division develops, designs, manufactures, and performs qualification testing of critical-function, electro-dynamic solutions for their main customer, the U.S. Nuclear Navy, including reactor and main coolant pumps, other critical-function pumps, various advanced motors, generators, secondary propulsion systems, and design engineering services. Specific applications include the Los Angeles, Virginia, Trident, Ohio, and Seawolf class submarines, and the CVN aircraft carrier.
In addition, the segment provides ship service generators and secondary propulsion systems to the non-nuclear U.S. Navy, including the Destroyer program. The division is strengthening its relationship with the Navy by participating in the design and development of major subsystems for the Navy’s Electro-Mechanical Aircraft Launch System (EMALS) as well as the Advanced Arresting Gear (AAG) for installation in its aircraft carrier fleet. This division expanded its offerings to the military to now include advanced electromagnetic product development to the U.S. Army as pulsed power supply continues to advance in the military weapons segment.
The Electro-Mechanical Systems’ products are also sold to complementary commercial markets, primarily nuclear power generation and oil and gas. We provide reactor coolant pumps, advanced motors, control rod drive mechanisms to the nuclear power markets. In the oil and gas market, we are partnering with industry leaders to develop advanced systems for exploration and production. Current programs encompass subsea pumping and power-dense motors for compact, integrated compression systems. This division has also expanded its offerings to include hazardous waste pumps to the DOE.
The commercial nuclear power markets and the oil and gas processing industries are experiencing pricing increases of materials due to increase in the demand. The increase in the pricing of the materials as well as pricing concerns and the effect of the war remain key competitive factors. As a renaissance is expected both domestically and in the increasing market overseas, the key will be to remain competitive and continue to offer excellent performance and quality products. This division has locations in Cheswick, Pennsylvania, and Phillipsburg, New Jersey.
The Controls Systems division develops, manufactures, tests, and services specialized electronic instrumentation and control equipment which includes instrumentation for primary and secondary controls, steam generator control equipment, valve actuators, and valve and heater controls. This division provides custom designed and commercial-off-the-shelf (COTS) electronic circuit boards and systems to the U.S. Nuclear Navy. Sales toThere is strong competition in the U.S. Navy are madeCOTS market, but competition is limited by responding directly to requests for proposals from customers. significant qualification and performance requirements.
The Controls Systems division also designs and manufactures advanced valve controllers and predictive maintenance systems for the oil and gas and general industrial markets.
The Controls Systems division’s products also include plant instrumentation, primary and secondary controls, steam generator control equipment, valve actuators, valve and heater controls, calorimetric instrumentation, generic digital signal processor cards, digital and numeric readout meters, response time test instrumentation, reactor plant control equipment, Stress Wave Analysis (SWAN) technology, and COTS power supply units. The division also provides engineering and support services which include embedded system design, shipboard automation and valve networking, microprocessor, Field Programmable Gate Arrayfield programmable gate array (FPGA), and analog design, system integration, software design and qualification, and factory acceptance testing. The
Our Commercial Power and Services division encounters strong competitiondesigns, manufactures, distributes, and qualifies flow control products for nuclear power plants, nuclear equipment manufacturers, hydroelectric energy producers, the DOE, and the Department of Defense (DoD). This division offers a wide range of critical hardware, including fastening systems, specialized containment doors, airlock hatches, electrical units, bolting solutions, machined products, valves, pumps, and enterprise resource planning, as well as plant process controls, including electrical instrumentation, specialty hardware and proprietary database solutions, aimed at improving safety and plant performance, efficiency, reliability, and reducing costs. In addition, the division provides distribution and servicing of OEM spare parts and valve components, training, on-site services, staff augmentation, and engineering programs relating to nuclear power plants.
As new construction of nuclear power plants continues to ramp up, we anticipate a growing number of new customers and some increased competition. We are already beginning to receive requests for newly designed components for next-generation plants expected to be built, and we are currently providing third-party nuclear-grade certification of other suppliers’ components. Many of the suppliers that participated in the Navyconstruction of first and second generation nuclear power plants retired their nuclear Quality Assurance (QA) programs and exited the business during the past twenty years. More recently, some suppliers have announced plans to re-establish their nuclear manufacturing and QA programs. As an established provider of these services, these companies represent a new market from a limited number of competitors. This division is located in East Farmingdale, New York.opportunity for us to provide nuclear QA program start-up, harsh environment qualification, innovative installation technologies, such as HydraNut and PlasmaBond, and inventory management software.
This division acquired Techswan, Inc., which conducted business as Swantech, in September 2006has maintained all of the regulatory certifications required to enhance its portfolioprovide and/or qualify value-added representations and certification of advanced electronicsnuclear-grade products and are well positioned to benefit from a commercial nuclear renaissance both domestically and internationally. Our continued success will require us to remain competitive and continue to offer excellent performance and quality products. We believe we maintain a competitive advantage by virtue of our breadth of nuclear technology, industry-benchmarked QA programs, large
Page 7
installed base, strategic alliances, resident expertise, and customer recognition of the important nature of our long-term commitment to servicing the unique challenges of the nuclear market.
Our Oil and Gas Systems division designs and manufactures valves and vessel products for the oil and gas refining market. Primary products include coke deheading systems, fluidic catalytic cracking unit (FCCU) components, and generalweb-enabled software for the FCCU process control.
This division is a leader in turnkey coker systems globally, as well as oil production platforms and storage facilities, liquefied natural gas (LNG) terminals and storage facilities, natural gas pipeline operations, and power generation facilities. Our coke deheading system, which includes top and bottom un-heading valves, isolation valves, cutting tools, and valve automation, process control, and protection systems, enable safe coke drums operation during the refining process. Included in this portfolio of products is the DeltaGuard™ coke-drum unheading valve, a revolutionary advancement in coke-drum unheading technology. Our patented technology is remotely operated, therefore inherently safe, easy to operate, reliable, cost effective, and can be configured for any coke-drum application.
We also offer a delayed coker operations optimization system featuring process control, interlocks, valve control solutions, batch process data acquisition, interactive operator batch sequence procedures, batch scheduler, batch sequence editor, risk management, asset protection, and predictive maintenance capabilities. In addition, we provide inspection, installation, repair and maintenance, and other field services for harsh environment flow control systems. Competition is mitigated by our superior technical expertise, proven technology and extraordinary service.
Our FCCU product portfolio includes custom-designed valves, engineered pressure vessels, and complementary components that operate in industrial markets. Swantech has patentedprocess applications including fluid, residual, and catalytic cracking units as well as power generation, steel manufacture, and ore reduction. We manufacture, repair, and modify orifice chambers, hydrotreaters, and American Society of Mechanical Engineers (ASME) code pressure vessels. In addition, we provide a unique technology called Stress Wave Analysis (SWAN) that provides vibrationwide array of field services, including equipment repair, modification or replacement, inspection of valves, controls, pipes and oil/lubrication analysis solutions. SWAN has shownrefractory linings, maintenance planning and scheduling for valves or control systems, diagnostic assistance with troubleshooting problems in critical components, and on-site system training. Due to be an effective, non-invasive methodthe critical and severe service applications requiring highly engineered solutions, competition is limited to identify early stage mechanical damagea few major competitors. While we face price competition on most major projects, our large installed base product suite, integrated systems capability, and equipment setup issues, such as imbalance and alignment, far sooner than the existing technologies. SWAN is an order of magnitude more sensitive than the presently installed technologies and provides the only continuous measurement of machine condition. The technology acquired in the purchase will enhance our existing product line.aftermarket service attracts a significant customer base.
Page 7
The following list defines our principle products and the markets served by the Flow Control segment.
Naval Defense | |||
• | Nuclear propulsion system components | ||
Valves (butterfly, globe, gate, control, safety, relief, solenoid, hydraulic operated gate) | |||
Pumps | |||
Motors | |||
Instrumentation and controls | |||
• | Non-nuclear products | ||
Smart leakless valves | |||
Sub-safe ball valves | |||
Jet-fuel pumping valves | |||
Steam generator control equipment | |||
Air driven fluid pumps | |||
Engineering, inspection, and testing services | |||
• | Aircraft carrier launch and retrieval equipment | ||
Advanced electromagnetic systems | |||
Flight critical components (aircraft shuttle components, holdback bars, capacity selector valves) | |||
• | Instrumentation and control systems | ||
Ground Defense | |||
• | Electromagnetic gun | ||
Page 8
Oil & Gas Processing | |||||
• | Critical process valves | ||||
DeltaGuard coker unheading valve | |||||
Boltless catalyst control slide valves | |||||
Butterfly and triple offset butterfly valves | |||||
Pilot-operated relief valves | |||||
Pressure relief valves | |||||
Safety valves | |||||
Solenoid, gate, and globe valves | |||||
Steam valves | |||||
• |
| ||||
Air grids and cyclones | |||||
Risers, headers, and wye sections | |||||
• | Engineered process vessels | ||||
Cat cracker reactors and | |||||
Hydrotreators | |||||
• | Advanced | ||||
Digital valve controller with redundant technology | |||||
Signature recognition for fault and leak detection | |||||
Integrated valve, automation, safety, and control systems | |||||
• | Web-enabled process control software | ||||
| |||||
• | |||||
Advanced motors and generators | |||||
• |
| ||||
Reactor coolant and process | |||||
• | Valves | ||||
Solenoid, ball, butterfly, check, pressure relief, safety and | |||||
• | Control rod drive mechanisms | ||||
• | Design, fabrication of nuclear facility airlocks, doors, hatches | ||||
• | Instrumentation | ||||
• | Diagnostic and test equipment | ||||
• | Fluid sealing technologies | ||||
• | Actuators | ||||
Pneumatic and hydraulic | |||||
• | Plate heat exchangers | ||||
• | Separation technologies | ||||
• | Fasteners | ||||
• | Advanced bolting technologies | ||||
• | Diamond wire concrete cutting | ||||
• | Engineering services | ||||
Page 8
• | Equipment qualification, commercial grade dedication | ||||
• | Inventory management systems | ||||
General Industrial | |||||
• | Valves | ||||
Directional control and pneumatic | |||||
• | Power Control Systems | ||||
Integrated motor-control systems | |||||
Variable frequency drives | |||||
Pump control panels | |||||
Low voltage solid state starters | |||||
Medium voltage controls | |||||
Protective technology solutions | |||||
• | Critical machinery fault detection and prognostics systems | ||||
Page 9
The Flow Control segment experiences strong competition from a large number of domestic and foreign sources. Competition occurscompetes globally on the basis of technical expertise, price, delivery, contractual terms, previous installation history, and globally renowned reputation for quality. Delivery speed and the proximity of service centers are important with respect to aftermarket products. Sales to commercial end users are accomplished primarily by a combination of direct sales employees and, in certain instances, by manufacturers’ representatives located in the segment’s primary market areas. This representation provides sales coverage ofareas, such as nuclear power utilities, principal boiler and reactor builders, processing plants, and architectural engineers, and hydrocarbon processing industry and chemical processing industry plants worldwide.engineers. For its military contracts, the segment receives requests for quotes from prime contractors as a result of being an approved supplier for naval propulsion system pumps and valves. SalesIn addition, sales engineers support non-nuclear sales activities. The segment uses the direct distribution basis for military and commercial valves and associated spare parts. In addition, the sales associated with the power plants follow the cycles associated with the power outages that are more prevalent in the spring and fall and bi-annual plant updates.
Backlog for this segment at December 31, 2006,2008, was $434.9$1,102 million, of which 22%44% will be shipped after one year, compared with $429.3$776 million at December 31, 2005. Additionally, 38%2007. Approximately 50% of this segment'ssegment’s backlog as of December 31, 2008 is comprised of commercial nuclear orders with Westinghouse Electric Company LLC (“Westinghouse”). Sales to Westinghouse represented approximately 12%, 6%, and 10% of total segment sales in 2008, 2007, and 2006, respectively. Additionally, 22% of this segment’s backlog as of December 31, 2008 is comprised of orders with the U.S. Navy, the majority of which is through itsa prime contractor, Bechtel Group, Inc. Sales by this segment to Bechtel accounted for 21%11%, 24%15%, and 33%21% of this segment’s total segment sales in 2006, 2005,2008, 2007, and 2004,2006, respectively, or 9%5%, 10%, and 13% of the Corporation’s consolidated revenue. Additionally, sales to one of the segment’s commercial customers represented approximately 10%, 8%7%, and 9% of total segment sales in 2006, 2005, and 2004, respectively.our consolidated revenue. The loss of these customers would have a material adverse effect on the business of this segment and the Corporation.in total. None of thethis segment’s business of this segment is seasonal. Raw materials are generally available in adequate quantities.quantities, although pricing of raw materials is impacted by commodity prices.
Motion Control
Curtiss-Wright’sOur Motion Control segment designs, develops, manufactures, and maintains sophisticated, high-performance mechanical actuation and drive systems, mission-critical electronic component and control systems, and sensors for the aerospace, defense, and general industrial equipment markets. This segment consists of 1422 business units that are organized and managed as three core technology groups: Engineered Systems, Integrated Sensing, and Embedded Computing.
Our Engineered Systems division’s product offerings to the commercial and defense aerospace industrymarkets consist of electro-mechanical and hydro-mechanical actuation control components and systems that are designed to position aircraft control surfaces or to operate flaps, slats, and utility systems such as canopies, cargo doors, weapons bay doors, or other moving devices used on aircraft. Aircraft applications include actuators and electronic control systems and sensors for the Boeing 737, 747, 757, 767, 777, Airbus A320, A330, A340, and future Boeing 787 civil air transports, Airbus A320, A330, A340, A380, the Lockheed Martin F-16 Falcon fighter jet, the Boeing F/A-18 Hornet fighter jet, the F-22 Raptor fighter jet, the Bell Boeing V-22 Osprey, and the Sikorsky Black Hawk and Seahawk helicopters. The Engineered Systems division is also developing flight control actuators and weapons handling systems for the engineering and manufacturing development phase of Lockheed Martin'sMartin’s F-35 Lightning II Joint Strike Fighter (JSF)(F-35 JSF) program. The F-35 JSF is the next-generation fighter aircraft being designed for use by all three branches of the U.S. military as well as by several foreign governments. The division also provides electric motors, rotary sensors, controllers, and smaller electromechanical actuation subsystems for flight, engine, and environmental control applications on various commercial transports, regional aircraft, business aircraft, military aircraft, and spacecraft.
As a related service within the Engineered Systems division, we also provide commercial airlines, the military, and general aviation customers with component overhaul and repair services.services in support of our manufactured products. These services include the overhaul and repair of hydraulic, pneumatic, mechanical, electro-mechanical, and electronic components, aircraft parts sourcing, and component exchange services for a wide array of aircraft.
Page 9
In addition, Engineered Systems designs, manufactures, and distributes electro-mechanical and electro-hydraulic actuation components and systems, and electronic controls for military tracked and wheeled vehicles and, high-speed tilting trains, andwithin the ground defense market as well as for commercial markets utilizing drive technology. These products consist of turret aiming and stabilization, weapons handling systems, suspension systems for armored military vehicles sold to foreign defense equipment manufacturers, tilting systems for high-speed train applications, fuel control valves for large commercial transport ships, camera head stabilization for the entertainment industry, and a variety of commercial servo valves.
Through its marine defenseMarine Defense unit, the Engineered Systems division designs and manufactures electro-mechanical and hydro-mechanical systems for landing helicopters aboard naval vessels. The shipboard helicopter handling systems are used by the U.S. Navy, U.S. Coast Guard, and more than ten other navies around the world. The
Page 10
division also designs and builds the elements of the ship’s aircraft storage structures, including telescopic hangars and hangar doors. Specialized handling systems are provided for towing sonar and mine sweep systems for submarines and surface ships.
Engineered Systems products are sold primarily through both a domestic sales force and international sales force. In addition, we have a marketing distribution facility in Singapore.network of representatives. A direct sales force is utilized with assistance from commissioned agents. Sales to Japan are made through Mitsubishi Trading Corporation, and certain sales to the U.S. Navy are made through the Canadian Commercial Corporation. All other sales are made directly to OEM’s,OEMs, airlines, and government agencies as well as to aircraft and ship builders around the world.
Our Engineered Systems products are sold in competition with a number of other suppliers, some of whom have broader product lines and greater financial, technical, and human resources. The competitive environment for these products is focused on a short list of companies, with recent strategic trends at the prime contractor level resulting in a smaller market of vertically integrated suppliers, while prime contractors specialize in integration and final assembly. Price, technical capability, performance, service, investment, and “overall value” are the primary forces of competition together with an ability to offer solutions to perform control and actuation functions on a limited number of new production programs. Our overhaul and repair services are sold in competition with a number of other overhaul and repair providers with a focus on quality, delivery, and price. The division provides these services from facilities in Gastonia and Shelby, North Carolina, Miami, Florida, and Stratford, Ontario.
Our Integrated Sensing division develops and manufactures a range of sensors, controllers, and electronic control units for militarycommercial and commercialdefense aerospace and general industrial markets. These products include position, pressure, and temperature sensors, solenoids and solenoid valves, smoke detection sensors, torque sensing, ice detection and protection equipment, air data computers, flight data recorders, joysticks, and electronic signal conditioning and control equipment. We sell this division’s products primarily to prime contractors and system integrators, both directly and through a network of independent sales representatives on a worldwide basis. Position sensors are used on primary flight control systems and engine controls on Airbus and Boeing aircraft, regional and business aircraft, and on many U.S. and European military aircraft. Air data, flight recorder, and ice detection and protection equipment are supplied to many helicopter applications. We also sell our products for use in a wide range of industrial applications such as off-highway vehicles, powered wheelchairs, process control,controls, and motorsport.motorsports.
Competition within the IntegratedCompetitive discriminators for Integrating Sensing division, especially in the aerospace market, is increasingly being driven byinclude technical support and product price concerns. The ability to service the customer with superior performanceas well as quality and quality is expected of all vendors, but downward pricing pressure is emerging as a key discriminator.delivery. For that reason Integrated Sensing products are marketed through facilities in the United Kingdom, Germany and the United States.States, and manufacturing facilities have now been established in Mexico and China.
In 2008, this division acquired Mechetronics Ltd., a United Kingdom supplier of solenoids and solenoid valves for global general industrial markets. A solenoid is an electromagnetic actuator used as a mechanical switch or integrated with a valve to provide control in pneumatic or hydraulic systems. Mechetronics products are supplied to OEMs and are used in a variety of applications including business machines, switchgear and vehicle braking systems. Originally founded in 1918, today Mechetronics is a leading industrial solenoid supplier with headquarters in Bishop Auckland, United Kingdom, and a new production facility in Zhuhai, China which opened in 2007. Mechetronics employs 72 people.
Our Embedded Computing division designs, develops, and manufactures rugged embedded computing board-level modules and integrated subsystems primarily for the aerospace and ground defense markets. Using standard, commercially available electronics technologies, coupled with application domain specific knowledge, this division offers COTS hardware and software modules based on open industry standards, referred to as COTS.standards. Our advanced subsystems are integrated subsystems include both in-houseusing our standard modules and third party modules as well as custom modules based on in-house intellectual property content.content as well as third-party technology. We also offer a supportingbroad array of support services that include:include life-cycle management, technical support, training, and developmentcustom engineering of custom module variants based on COTS modules.modules and fully integrated subsystems. Our Embedded Computing division is considered one of the embedded computing industry’s most comprehensive and experienced single sourcesources for processing, data communications, digital signal processing, and video and graphics, computing solutions.recording and storage, analog acquisition and reconstruction, radar, and integrated subsystems. Our COTS modules and integrated subsystems are designed to perform reliably in harsh conditions where space, weight, and power constraints are critical. Our rugged conditions, such asproducts excel in extreme temperatures terrain and/or speed which result inand environments, enduring high shock and vibration, as well as in commercial environments for use in laboratory and benign environment applications.
Page 10
Embedded Computing’s subsystem products are used in a wide variety of mission-critical military applications, including fire control, aiming and stabilization, munitions loading, and environmental processors for military ground vehicles. These products are used on demanding combat platforms such as the Bradley fighting vehicle, the Abrams M1A2/A3 tank, and the Brigade Combat Team Interim Armored Vehicle, which is part of the U.S.
Page 11
Army’s modernization and transformation efforts. This division also provides the mission management, flight control computers, and the sensor management units for advanced aerospace platforms including Global Hawk, the U.S. Air Force Global Hawk, which is aForce’s high-altitude and high-endurance unmanned aerial vehicle.
Embedded Computing’s modules are used in hundreds ofnumerous active programs today, including leading-edge military platforms such as the Improved Bradley Acquisition System and the Improved Tow Acquisition System. The modules feature highthe highest performance chipscommercial processors on open standard board architectures. The division has taken a leadership position in the drafting and definition of the newest embedded standards, which are designed to address the more demanding performance and data bandwidth requirements of emerging applications. Embedded Computing is frequently the first embedded computingCOTS vendor to announce forthcoming boards and systems based on these new architectures. Embedded Computing is also committedhas been selected to supply technology for some of the most advanced future military platforms including the F-22, F-35 JSF, P-8 Poseidon, and Future Combat System.
This division’s products are manufactured at its operations located in North America and the United Kingdom. Our products are sold primarily to prime contractors and subsystem suppliers located primarily in the United States, United Kingdom, and Canada, both directly and through a network of independent sales representatives. In recent years, competition in the embedded electronic systems market has migrated away from traditional board competitors toward fully integrated subsystem and system providers selling to prime and second-tier defense and aerospace companies. Competition in this market is based on quality of technology, price, and delivery times.time to market.
In 2008, this division enhanced its portfolio of high-performance embedded computing products with the acquisition of VMETRO ASA. Founded in 1986, VMETRO is a leading supplier of COTS board- and system-level embedded computing products for applications in aerospace, defense, and industrial markets. Key products provide real-time computing capabilities, high-density radar processing, data recording, and network storage systems. Application of these products as components or subsystems enables improved response time and critical protection in server and storage appliances, utility mapping, and ground penetrating radar. VMETRO operates globally with headquarters and principal engineering in Oslo, Norway. Additional sales, engineering and distribution networks are established in the United States, Europe, and Asia. VMETRO employs approximately 200 people.
The following list defines our principle products and the markets served by the Motion Control segment.
Commercial Aerospace | |||
• | Commercial Jet Transports | ||
Secondary flight control actuation systems and electromechanical trim actuators | |||
Aircraft cargo door and utility actuation systems | |||
Fire detection and suppression control systems | |||
Position sensors | |||
Solenoids and solenoid valves | |||
• | Business/Regional Jets | ||
Throttle quadrants | |||
Position Sensors | |||
• | Helicopters | ||
Rotor Ice Protection Systems | |||
• | Repair & Overhaul Services | ||
Component overhaul and logistics support services | |||
Defense Aerospace | |||
• | Transport and fighter aircraft | ||
Weapons bay door actuation systems | |||
Secondary flight control actuation | |||
Rotary actuation for environmental control systems | |||
Weapons handling systems | |||
• | Helicopters | ||
Radar warning systems | |||
Acoustic processing systems | |||
Flight data recorders | |||
Air data computers | |||
Position Sensors | |||
Page 12
• | Unmanned aerial vehicles | ||
Integrated mission management and flight control computers | |||
Weapons handling systems | |||
Page 11
Ground Defense | |||
• | Tanks and light armored vehicles | ||
Digital electromechanical aiming and stabilization systems | |||
Fire control, sight head, and environmental control processors | |||
Single Board Computers for target acquisition systems | |||
Hydropneumatic suspension systems | |||
Ammunition handling systems | |||
Naval Defense | |||
• | Surface ships | ||
Helicopter handling and traverse systems | |||
Tie-down components | |||
• | Marine Propulsion | ||
Marine engine diesel valve injection systems | |||
• | Submarines | ||
Cable handling systems for towed arrays | |||
Other Military & Government | |||
• | High performance data communication products | ||
Power conversion products | |||
• | Space programs | ||
Control electronics and sensors | |||
• | Security systems | ||
Perimeter intrusion detection equipment | |||
• | FAA | ||
Airport surface detection equipment radar video processing | |||
General Industrial Markets | |||
• | Automated industrial equipment | ||
Air, sea, and ground simulation | |||
Fractional horse power (HP) specialty motors | |||
Force transducers | |||
Joysticks | |||
Sensors | |||
Sales by our Motion Control segment to its largest customer in 2006, 2005,2008, 2007, and 20042006 accounted for 10% of Motion Control revenue and 4% of our consolidated revenue for each year. The loss of this customer would have a material adverse effect on Motion Control. Direct and end use sales of this segment to government agencies, primarily the U.S. Government, in 2006, 2005,2008, 2007, and 2004,2006, accounted for 63%66%, 64%62%, and 62%63%, respectively, of total Motion Control sales. Although the loss of this business would also have a material adverse affect on Motion Control, no single prime contractor to the U.S. Government to which we are a subcontractor provided greater than 10% of Motion Control revenue during any of the last three years.
Backlog for our Motion Control segment at December 31, 2006,2008, was $438.6$575 million, of which 33%64% is expected to be shipped after one year, compared with $374.5$526 million at December 31, 2005.2007. None of the businesses of our Motion Control segment is seasonal. Raw materials are generally available in adequate quantities from a number of suppliers. However, we utilize sole source suppliers in this segment. Thus, the failure and/or inability of a sole source supplier to provide product to Motion Control could have an adverse impact on our financial performance. While alternatives could be identified to replace a sole source supplier, a transition could result in increased costs and manufacturing delays.
Page 13
Metal Treatment
Curtiss-Wright’sOur Metal Treatment segment provides various metallurgical processes that are used principallyprimarily to improve the service life, strength, and durability of highly stressed, critical-function metal parts. Metal Treatment provides these services to a broad spectrum of customers in various industries, includingcommercial and defense aerospace, automotive, construction equipment, oil and gas, power generation, and general industrial markets, including automotive/transportation, construction equipment, and metal working.
Page 12
This segment consists of several business units that are organized into three principal services that the segment offers which include peening, specialty coatings, and heat treating.
Shot peening is a process by which the durability of metal parts is enhanced by the bombardment of the part’s surface with spherical media, such as steel shot or ceramic or glass beads, to compress the outer layer of the metal. In addition, shot peen forming enables metal panels to be shaped with aerodynamic curvatures that are assembled as wing skins of commercial and military aircraft. Revenue of shot peening services in 2006, 2005,2008, 2007, and 20042006 accounted for 10%8%, 10%9%, and 12%10%, respectively, of our consolidated revenues.
Laser peening is an advanced metal surface treatment process that utilizes a unique high energy laser developed by the Lawrence Livermore National Laboratory. The laser peening process is being used in production to extend the life of critical industrial and flight turbine engine components. Laser peening is also utilized to form the wing skins of the Boeing 747-8 aircraft in an on-site facility within the Boeing Frederickson, Washington complex. Future applications include high value, extreme service components in aircraft structures, oil and gas, medical implant, and marine applications. We retain the exclusive worldwide rights to the intellectual property necessary for the use of this laser architecture on laser peening of commercial products. Currently, the patents associated with the laser peening technology are not material to our operations. However, we believe that this technology has significant potential and, thus, these patents may become material to our future operations.
Specialty coatings primarily consist of the application of solid film lubricant coatings, which are designed to enhance the performance of metal components used in high-stress applications for a broad range of industries. We apply our coatings by air spray or by a dipping and spinning process for bulk applications. We have diversified this service with the acquisition of new capabilities, such as the ability to manufacture our own bulk coatings, and new international facilities in Canada and United Kingdom.
Heat treating is a metallurgical process of subjecting metal objects to heat and/or cold or otherwise treating the material to change the physical and/or chemical characteristics or properties of the material. In addition to shot peening, heat treating, and specialty coatings, other metal treatment services that are provided on a job shop basis include shot peen forming, laser peening, wet finishing, chemical milling, and feedreed valve manufacturing.
Working in conjunction with Lawrence Livermore National Laboratory, Metal Treatment has developed an advanced metal surface treatmentIn 2008, we acquired Parylene Coating Services (“PCS”) which further expands our coating services business into the growing medical market. PCS utilizes a vapor deposition process utilizing laser technology. The laser peening process is beingto apply parylene coatings to medical devices, including coronary artery stents, rubber/silicone seals and wire forming mandrels used in productionthe manufacture of catheters. The conformal coating provides lubricity; resistance to extend the life of critical turbine engine components. Futuresolvents, radiation and bacteria; and is also biocompatible. In addition to medical applications, include additional turbine engine components as well as other high value, extreme service componentsparylene coatings are uniquely suited for use in aircraft structures,niche electronic, oil and gas, medical implant, and marinegeneral industrial applications. Laser peening also shows potential to augment the segment’s wing skin forming capabilities, allowing for placement of more extreme aerodynamic curvatures of wing skins of greater thickness. We operate a laser peeningPCS’s facility in the United StatesKaty, Texas is ISO 9001 registered and another in the United Kingdom. We currently have seven operational lasers and are in the process of building two additional lasers, with mobile capability. We retain the exclusive worldwide rights to the intellectual property necessary for the use of this laser architecture on laser peening of commercial products. Currently, the patents associated with the laser peening technology are not material to our operations. However, we believe that this technology has significant potential and, thus, these patents may become material to our future operations.
In May, 2006 we acquired, two coating application facilities of Diversified Coatings, Inc. (Allegheny), located in Fremont, Indiana and Ingersoll, Ontario. These additions provided an entry into the Ontario, Canada coatings market and increased the segment’s number of coating facilities to ten. During 2004, we increased Metal Treatment’s coatings capabilities with the acquisitions of selected assets of Evesham and Everlube, located in Evesham, United Kingdom and Peachtree City, Georgia, respectively. These acquisitions provided an entry into the European coatings market and added the capability to manufacture our own bulk coatings.18 employees.
The following list defines our principle products and the markets served by the Metal Treatment segment.
Commercial Aerospace | |||
• | Shot peen forming | ||
Wing skins | |||
• | Shot peening | ||
Aircraft structural components | |||
Landing gear components | |||
Turbine engine rotating components | |||
• | Laser peening | ||
Turbine engine rotating components | |||
• | Coatings | ||
Fasteners | |||
Sliding components | |||
Page 1314
• | Heat Treating | ||
Aluminum structural components | |||
General Industrial | |||
• | Shot Peening | ||
Highly stressed metal components susceptible to fatigue | |||
Welded components subject to distortion | |||
Architectural structures | |||
Engine and transmission components | |||
• | Heat Treating | ||
Miscellaneous engine, transmission and structural components | |||
Miscellaneous aluminum and steel components | |||
• | Coatings | ||
Fasteners | |||
Brake and suspension components | |||
Sliding components | |||
Miscellaneous components subject to corrosion and sliding wear | |||
Defense | |||
• | Shot Peening | ||
Helicopter and fighter aircraft structural and turbine engine components | |||
Through a combination of acquisitions and new plant openings, we continue to increase Metal Treatment’s network of regional facilities. Metal Treatment operations are now conducted from 5965 facilities located in the United States, Canada, United Kingdom, France, Germany, Sweden, Belgium, Italy, Spain, Austria, and Italy, with new facilities in Spain, Sweden, and France scheduled to open in the second half of 2007.China. Our Metal Treatment services are marketed directly by our employees. Although numerous companies compete in this field and many customers have the resources to perform such services themselves, we believe that our technical knowledge and quality of workmanship provide a competitive advantage. We compete in this segment on the basis of quality, service, and price.
The business of this segment is not seasonal. Raw materials are generally available in adequate quantities from a number of suppliers, and we are not materially dependent upon any single source of supply in this segment. We have no significant working capital requirements outside of normal industry accounts receivable and inventory turnover. Our largest customer in this segment accounted for 9%, 10%, and 8% of Metal Treatment sales during 2006, 2005,2008, 2007, and 2004, respectively.2006. Although the active customer base is in excess of 5,000, the loss of this customer would have a material adverse effect on our Metal Treatment segment.
The backlog of Metal Treatment was $2 million as of December 31, 2006, was $2.1 million,2008 and 2007, all of which is expected to be recognized in the first quarter of 2007, compared with $1.9 million as of December 31, 2005.2009. Due to the nature of our metal treatment services, we operate with a very limited backlog of orders and services that are provided primarily on newlynew manufactured parts. Thus, the backlog of this segment is not indicative of our future sales, and as a result, this segment’s sales and profitability are closely aligned with general industrial economic conditions and, in particular, the commercial aerospace market.
OTHER INFORMATION
Certain Financial Information
For information regarding sales by geographic region, see Note 16 to the Consolidated Financial Statements contained in Part II, Item 8, of this Annual Report on Form 10-K.
In 2006, 2005,2008, 2007, and 2004,2006, our foreign operations generated 37%57%, 35%42%, and 33%37%, respectively, of our pre-tax earnings. We do not regard the risks associated with these foreign operations to be materially greater than those applicable to our U.S. businesses.
Government Sales
Our direct sales to the U.S. Government and sales for U.S. Government and foreign government end use represented 45%36%, 48%38%, and 47%45% of consolidated revenue during 2006, 2005,2008, 2007, and 2004,2006, respectively. U.S.
Page 15
Government sales, both direct and indirect, are generally made under standard types of government contracts, including fixed price, fixed price-redeterminable, and fixed price-redeterminable.cost plus.
In accordance with normal practice in the case of U.S. Government business, contracts and orders are subject to partial or complete termination at any time, at the option of the customer. In the event of a termination for convenience by the government, there generally are provisions for recovery by us of our allowable incurred costs and a proportionate share of the profit or fee on the work completed, consistent with regulations of the U.S.
Page 14
Government. Fixed-price redeterminable contracts, generally on naval programs, usually provide that we absorb the majority of any cost overrun. In the event that there is a cost underrun, the customer recoups a portion of the underrun based upon a formula in which the customer'scustomer’s portion increases as the underrun exceeds certain established levels.
Generally, long-term contracts with the U.S. Government require us to invest in and carry significant levels of inventoriable costs. However, where allowable, we utilize progress payments and other interim billing practices on nearly all of these contracts, thus reducing the overall working capital requirements. It is our policy to seek customary progress payments on certain of our contracts. Where we obtain such payments under U.S. Government prime contracts or subcontracts, the U.S. Government has either title to or a secured interest in the materials and work in process allocable or chargeable to the respective contracts. (See Notes 1.F, 3, and 4 to the Consolidated Financial Statements, contained in Part II, Item 8, of this Annual Report on Form 10-K). In the case of most motion controlMotion Control and flow controlFlow Control segment products for U.S. Government end use, the contracts typically provide for the retention by the customer of stipulated percentages of the contract price, pending completion of contract closeout conditions.
Patents
We own and are licensed under a number of United States and foreign patents and patent applications, which have been obtained or filed over a period of years. We also license intellectual property to and from third parties. Specifically, the U.S. Government has licenses in our patents that are developed in performance of government contracts, and it may use or authorize others to use the inventions covered by such patents for government purposes. Additionally, unpatented research, development, and engineering skills, some of which have been acquired by us through business acquisitions, make an important contribution to our business. While our intellectual property rights in the aggregate are important to the operation of our business, we do not consider the successful conduct of our business or business segments to be materially dependent upon the protection of any one of the patents, patent applications, or patent license agreements under which we now operate.
Research and Development
We conduct research and development activities under customer-sponsored contracts, shared development contracts, and our own independent research and development activities. Customer-sponsored research and development costs are charged to costs of goods sold when the associated revenue has been recognized, fundsrecognized. Funds received under shared development contracts are a reduction of the total development expenditures under the shared contract and are shown net as research and development costs, while corporation-sponsoredcosts. Corporation-sponsored research and development costs are charged to expense when incurred. Customer-sponsored research and development activity amounted to $35.7$32 million, $28.3$45 million, and $26.5$36 million, in 2006, 2005,2008, 2007, and 2004,2006, respectively, and were attributed to customers within our Flow Control and Motion Control segments. Research and development expenses incurred by the Corporationus amounted to $38.8$50 million in 20062008 as compared with $39.7$48 million in 20052007 and $33.8$39 million in 2004.2006.
Environmental Protection
We are subject to federal, state, local, and foreign laws, regulations, and ordinances that govern activities or operations that may have adverse environmental effects, such as discharges to air and water. These laws, regulations, and ordinances may also apply to handling and disposal practices for solid and hazardous waste and impose liability for the costs of cleaning up and for certain damages resulting from sites of past spills, disposals, or other releases of hazardous substances.
At various times, we have been identified as a potentially responsible party pursuant to the Comprehensive Environmental Response, Compensation, and Liability Act of 1980 (CERCLA), and analogous state environmental laws, for the cleanup of contamination resulting from past disposals of hazardous wastes at certain current and former facilities and at sites to which we, among others, sent wastes in the past. CERCLA requires potentially responsible persons to pay for cleanup of sites from which there has been a release or threatened release of hazardous substances. Courts have interpreted CERCLA to impose strict joint and several liability on
Page 16
all persons liable for cleanup costs. As a practical matter, however, at sites where there are multiple potentially responsible persons, the costs of cleanup typically are allocated among the parties according to a volumetric or other standard.
Information concerning our specific environmental liabilities is described in Notes 1.M1.N and 13 to the Consolidated Financial Statements contained in Part II, Item 8, of this Annual Report on Form 10-K.
Page 15
Executive Officers
Martin R. Benante, age 54,56, has served as the Chairman of the Board of Directors and Chief Executive Officer of the Corporation since April 2000; President and Chief Operating Officer of the Corporation from April 1999 to April 2000; Vice President of the Corporation from April 1996 to April 1999; and President of Curtiss-Wright Flow Control Corporation from March 1995 to April 1999.2000. He has been a Director of the Corporation since 1999.
B. Parker Miller III, age 61, has served as Senior Vice President – Government Relations of the Corporation since June 2005 and was elected an officer of the Corporation in February 2006; Director of Business and Strategic Development, Northrop Grumman from January 2005 to June 2005; Director of Business and Strategic Development, Unmanned Systems Group, Integrated Systems Sector, Northrop Grumman from June 2003 to January 2005; Manager, Legislative Affairs, Northrop Grumman from January 1997 to June 2003. In February 1994, after 25 years of service Mr. Miller retired from the Marine Corps with the rank of Colonel.
Edward Bloom, age 65,67, has served as Vice President of the Corporation and President of Metal Improvement Company, LLC since June 2002; Executive Vice President of Metal Improvement Company, Inc. from December 1995 to June 2002.
David J. Linton, age 51,53, has served as Vice PresidentCo-Chief Operating Officer of the Corporation since November 2008 and President of Curtiss-Wright Flow Control Corporation since May 2004; prior to his promotion to Co-Chief Operating Officer served as Vice President of the Corporation from May 2004, Vice President of Program Management, Raytheon Network Centric Systems from November 2003 to April 2004; Chief Executive Officer, Cordiem, Inc. from April 2001 to March 2002; Vice President and General Manager of Electric Systems, Hamilton Sundstrand Corporation, June 1998 to April 2001.
David C. Adams, age 52,54, has served as Co-Chief Operating Officer since November 2008 and prior to his promotion served as Vice President of the Corporation sincefrom November 2005 and President of Curtiss-Wright Controls sincefrom June, 2005;2005 Senior Vice President, Electronic Systems of Curtiss-Wright Controls from February 2004 to June 2005; Group Vice President, Integrated Sensing from April 2002 to February 2004; Vice President, Business Development of Curtiss-Wright Controls, September 2000 to April 2002; and Director, Business Development of Curtiss-Wright Controls from March 2000 to September 2000.2004.
Glenn E. Tynan, age 48,50, has served as Vice President of Finance and Chief Financial Officer of the Corporation since June 2002; Controller of the Corporation from June 2000 to May 2002; Vice President and Corporate Controller of the Movado Group from 1999 to 2000.2002.
Michael J. Denton, age 51,53, has served as Vice President, Secretary, and General Counsel of the Corporation since August 2001; Corporate Counsel of Honeywell International, Inc. (formerly AlliedSignal Inc.) from 1993 to 2001.
Kevin McClurg,Glenn Coleman, age 43,41, has served as theVice President and Corporate Controller of the Corporation since September 2002; AssistantMay 2008. Prior to his appointment, Mr. Coleman spent the past 10 years with Alcatel Lucent (formerly Lucent Technologies) in various positions, including Finance Vice President, Wireless Business Group from June 2007 to December 2007 and Finance Vice President, Americas Controller from FebruaryJanuary 2002 to September 2002; Director of Accounting of Toys R Us, Inc. until January 2002; Director of International Reporting of Random House from January 1998 to May 2001.2007.
Harry Jakubowitz, age 54,56, has served as Vice President of the Corporation since May 2007 and as Treasurer of the Corporation since September 2005; Director of Taxes of the Corporation from June 2002 to September 2005; Vice President, Taxes and Assistant Secretary of General Semiconductor, Inc. from 1997 to 2002, and also its Treasurer from 2000 to 2002.2005.
Employees
At the end of 20062008 we had 6,233approximately 8,000 employees, approximately 12%9% of which are represented by labor unions and covered by collective bargaining agreements.
Available information
We file annual reports on Form 10-K, quarterly reports on Form 10-Q, current reports on Form 8-K, and proxy statements for our annual shareholders’stockholders’ meetings, as well as any amendments to those reports, with the Securities and Exchange Commission (“SEC”). The public may read and copy any of our materials filed with the SEC at the SEC'sSEC’s Public Reference Room at 100 F Street, NE, Washington, DC 20549. The public may obtain information on the operation of the Public Reference Room by calling the SEC at 1-800-SEC-0330. The SEC also maintains an Internet site at www.sec.gov that contains reports, proxy and information statements, and other information regarding issuers that file electronically with the SEC, including our filings. These reports are also available free of
Page 16
charge through our web site atwww.curtisswright.com as soon as reasonably practicable after we electronically file that material with, or furnish it to, the SEC.
Page 17
You should carefully consider the risks described below and other information in this Annual Report on Form 10-K. Our business, financial condition, and results of operations could be materially and adversely impacted if any of these risks materialize. Additional risk factors not currently known to us or that we believe are immaterial also may impair our business, financial condition, and results of operations. The trading price of our common stock may also decline as a result of these risks.
A substantial portion of our revenues and earnings is dependentdepends upon the continued willingness of the U.S. Government and our other customers in the defense industry to buy our products and services.
In 2006,2008, approximately 45%36% of our revenues were derived from or related to defense programs, with approximately 21%16% attributable to U.S. Navy procurements. The lossU.S. defense spending has historically been cyclical, and defense budgets rise when perceived threats to national security increase the level of a significant defense program or customer could have a material adverse effectconcern over the country’s safety. At other times, spending on our operating results. Therethe military can bedecrease. While Department of Defense funding has grown rapidly over the past few years, there is no assurance that our significant customersthis trend will continue to buy our products and services at currentcontinue. Competing demands for federal funds can put pressure on all areas of discretionary spending, which could ultimately impact the defense budget. A decrease in U.S. government defense spending or increased levels.
Our business with the U.S. Government and defense contractors is subject to risks including: termination, reduction,changes in spending allocation could result in one or modificationmore of our contracts, subcontracts, and backlog in the event of changes in the U.S. Government’s requirements, spending priorities,programs being reduced, delayed, or defense-related budgets; when we are a subcontractor, the failure or inability of the prime contractor to perform its prime contract; in some contracts the final price per unit may be deferred; adjustment of contract costs and fees as a result of government audits; the frequent need to bid on programs in advance of design completion that may result in unforeseen technological difficulties and cost overruns; our contracts are for varying fixed terms that may not be renewed or followed by follow-on contracts upon expiration; and cancellation of the follow-on production phase of contracts if program requirements are not met in the development phase.
terminated. Reductions in defense industry spending may or may not have an adverse effect on programs for which we provide products and services. In the event expenditures are reduced for products we manufacture or services we provide and are not offset by revenues from foreign sales, new programs, or products or services that we currently manufacture or provide, we may experience a reduction in our revenues and earnings and a material adverse effect on our business, financial condition, and results of operations. Further, there can be no assurance that our significant customers will continue to buy our products and services at current or increased levels.
As a U.S. Government contractor, we are subject to a number of procurement rules and regulations.
We must comply with and are affected by laws and regulations relating to the award, administration, and performance of U.S. Government contracts. Government contract laws and regulations affect how we do business with our customers and, in some instances, impose added costs on our business. A violation of specific laws and regulations could result in the imposition of fines and penalties or the termination of our contracts or debarment from bidding on contracts. These fines and penalties could be imposed for failing to follow procurement integrity and bidding rules, employing improper billing practices or otherwise failing to follow cost accounting standards, receiving or paying kickbacks, or filing false claims. We have been, and expect to continue to be, subjected to audits and investigations by government agencies. The failure to comply with the terms of our government contracts could harm our business reputation. It could also result in our progress payments being withheld.
In some instances, these laws and regulations impose terms or rights that are more favorable to the government than those typically available to commercial parties in negotiated transactions. For example, the U.S. Government may terminate any of our government contracts and, in general, subcontracts, at its convenience as well as for default based on performance. Upon termination for convenience of a fixed-price type contract, we normally are entitled to receive the purchase price for delivered items, reimbursement for allowable costs for work-in-process, and an allowance for profit on the contract or adjustment for loss if completion of performance would have resulted in a loss. Upon termination for convenience of a cost reimbursement contract, we normally are entitled to reimbursement of allowable costs plus a portion of the fee. Such allowable costs would normally include our cost to terminate agreements with our suppliers and subcontractors. The amount of the fee recovered, if any, is related to the portion of the work accomplished prior to termination and is determined by negotiation.
A termination arising out of our default could expose us to liability and have a material adverse effect on our ability to compete for future contracts and orders. In addition, on those contracts for which we are teamed with others and are not the prime contractor, the U.S. Government could terminate a prime contract under which we are a subcontractor, irrespective of the quality of our services as a subcontractor.
In addition, our U.S. Government contracts typically span one or more base years and multiple option years. The U.S. Government generally has the right to not exercise option periods and may not exercise an option period if the agency is not satisfied with our performance on the contract.
Page 18
U.S. Government Procurement may adversely affect our cash flow or program profitability.
A significant reduction in the purchase of our products by the U.S. government would have a material adverse effect on our business. The risk that governmental purchases of our products may decline stems from the nature of our business with the U.S. government, in which the U.S. government may:
• | terminate, reduce or modify contracts or subcontracts if its requirements or budgetary constraints change; | |
• | cancel multi-year contracts and related orders if funds become unavailable; and | |
• | shift its spending priorities. | |
In addition, as a defense business, we are subject to risks in connection with government contracts, including without limitation: | ||
• | the frequent need to bid on programs prior to completing the necessary design, which may result in unforeseen technological difficulties and/or cost overruns; | |
• | the difficulty in forecasting long-term costs and schedules and the potential obsolescence of products related to long-term, fixed price contracts; | |
• | our contracts are for varying fixed terms that may not be renewed or followed by follow-on contracts upon expiration; | |
• | cancellation of the follow-on production phase of contracts if program requirements are not met in the development phase; and | |
• | the failure of a prime contractor customer to perform on a contract. | |
Our business could be adversely affected by a negative audit by the U.S. Government.
We operate in a highly regulated environment and have been, and expect to continue to be, routinely audited by the U.S. Government and others. On a regular basis, we monitor our policies and procedures with respect to our contracts to ensure consistent application under similar terms and conditions and to assess compliance with all applicable government regulations. Negative audit findings could result in termination of a contract, forfeiture of profits, or suspension of payments. From time to time we are subject to U.S. Government investigations relating to our operations. Government contractors that are found to have violated the law, such as the False Claims Act or the Arms Export Control Act, or are indicted or convicted for violations of other federal laws, or are found not to have acted responsibly as defined by the law, may be subject to significant fines. Such convictions could also result in suspension or debarment from government contracting for some period of time. Given our dependence on government contracting, suspension or debarment could have a material adverse effect on our business.
Failure to comply with certain U.S. Government sourcing requirements may adversely affect our cash flow.
We, like others in the defense industry, are aware of a potential problem presented by strict compliance with the Defense Federal Acquisition Regulation Supplement preference for enumerated specialty metals sourced domestically or from certain foreign countries. Subcontractors and lower-tier suppliers may make disclosures indicating inability to comply with the rule as written, particularly for low-value parts such as washers, screws, nuts, bolts, resistors, and capacitors. Subject to limitations, inability to certify that all enumerated specialty metals in a product comply with sourcing requirements can lead to U.S. Government customers withholding a portion of a payment on delivery or may prevent delivery altogether of material and products critical to national defense.
Our operating results are subject to fluctuations.
Defense industry procurement involves seasonality and economic cycles and as a result our annual and quarterly operating results may fluctuate. It is possible that our operating results for a particular quarter may not meet the expectations of securities analysts or investors. Similarly, securities analysts may issue reports downgrading our common stock. These events could cause the market price of our common stock to decline.
Page 19
Future terror attacks, war, natural disasters, or other events beyond our control could adversely impact our commercial aerospace and other businesses.
Despite our concerted effort to minimize risk to our production capabilities and corporate information systems and to reduce the effect of unforeseen interruptions to us through business continuity planning and disaster recovery plans, terrorist attacks, war, natural disasters, such as hurricanes, floods, tornados, or other events such as strikes by a significant customer’s or supplier’s workforce could adversely impact demand for or supply of our products and could also cause disruption to our facilities or systems which could also interrupt operational processes and adversely impact our ability to manufacture our products and provide services and support to our customers. We operate facilities in areas of the world that are exposed to natural disasters, such as but not limited to hurricanes, floods, and tornados. For example, Hurricanes Ike and Gustav in 2008 caused disruption to the oil and gas market for our products and services. Similarly, the terrorist attacks of September 11, 2001 and subsequent terrorist attacks worldwide caused decreased demand in the commercial aerospace market for our products and commercial overhaul and repair services. During 2006, approximately 18% of our business was related to commercial aerospace. The commercial aerospace industry is cyclical and subject to factors beyond our control. A number of commercial airline carriers have recently experienced large losses and filed for bankruptcy. Financial difficulties of our customers, delays by our customers in production of their products, high fuel prices, the concern of another major terrorist attack, and the overall decreased demand for new aircraft and continued use of existing aircraftour customers’ products could adversely affect our operating results and financial position.
Page 17
The success of our growth strategy is dependent upon our ability to complete acquisitions and integrate acquired businesses.
Our strategy includes growth through acquisitions. As a result, our future growth depends in large part on our ability to implement our acquisition strategy and successfully integrate acquired businesses into our existing operations. If we are unable to identify suitable candidates, negotiate appropriate acquisition terms, obtain financing, and successfully integrate acquired businesses into our existing operations, our growth strategy may not be successful. In addition, acquisitions involve numerous risks, including difficulties in the assimilation of the operations, technologies, services, and products of the acquired company, the potential loss of key employees of the acquired company, and the diversion of our management’s attention from other business concerns. This is the case particularly in the fiscal quarters immediately following the completion of an acquisition because the operations of the acquired business are integrated into the acquiring businesses’ operations during this period. We cannot be sure that we will accurately anticipate all of the changing demands that any future growthacquisition may impose on our management, our operational and management information systems, and our financial systems. Once integrated, acquired operations may not achieve levels of revenue, profitability, or productivity comparable to those of our existing operations or may otherwise not perform as we expected. We may fail to discover liabilities relating to a pending acquisition during the due diligence investigation, liabilities for which we, as the successor owner, might be responsible. Although we seek to minimize the impact of potential undiscovered liabilities by structuring acquisitions to minimize liabilities and obtaining indemnities and warranties from the selling party, these methods may not fully protect us from the impact of undiscovered liabilities. For example, indemnities or warranties are often limited in scope, amount, or duration, and may not fully cover the liabilities for which they were intended. If indemnities or warranties are limited, the liabilities that are not covered by the limited indemnities or warranties could have a material adverse effect on our business and financial condition.
We use estimates when accounting for contracts. Changes in estimates could affect our profitability and overall financial position.
Contract accounting requires judgment relative to assessing risks, estimating contract revenues and costs, and making assumptions for schedule and technical issues. Due to the size and nature of many of our contracts, the estimation of total revenues and costs at completion is complicated and subject to many variables. For example, assumptions have to be made regarding the length of time to complete the contract because costs also include expected increases in wages and prices for materials. Similarly, assumptions have to be made regarding the future impact of efficiency initiatives and cost reduction efforts. Incentives, awards, or penalties related to performance on contracts are considered in estimating revenue and profit rates and are recorded when there is sufficient information to assess anticipated performance. Because of the significance of the judgments and estimation processes described above, it is possible that materially different amounts could be obtained if different assumptions were used or if the underlying circumstances were to change. Changes in underlying assumptions, circumstances, or estimates may have a material adverse effect upon future period financial reporting and performance. See “Critical Accounting Estimates and Policies” in Part II, Item 7.
Page 20
New accounting standards could result in changes to our methods of quantifying and recording accounting transactions, and could affect our financial results and financial position.
Changes to Generally Accepted Accounting Principles in the United States (GAAP) arise from new and revised standards, interpretations, and other guidance issued by the Financial Accounting Standards Board, the SEC, and others. In addition, the U.S. Government may issue new or revised Cost Accounting Standards or Cost Principles. The effects of such changes may include prescribing an accounting method where none had been previously specified, prescribing a single acceptable method of accounting from among several acceptable methods that currently exist, or revoking the acceptability of a current method and replacing it with an entirely different method, among others. Such changes could result in unanticipated effects on our results of operations, financial position, and other financial measures.
Our earnings and margins may vary based on the mix of our contracts and programs.
At December 31, 2008, our backlog included both cost reimbursable and fixed-price contracts. Cost reimbursable contracts generally have lower profit margins than fixed-price contracts. Production contracts are mainly fixed-price contracts, and developmental contracts are generally cost reimbursable contracts. Our earnings and margins may vary materially depending on the types of long-term government and commercial contracts undertaken, the nature of the products produced or services performed under those contracts, the costs incurred in performing the work, the achievement of other performance objectives, and the stage of performance at which the right to receive fees, particularly under incentive and award fee contracts, is finally determined.
Under fixed-price contracts, we receive a fixed price irrespective of the actual costs we incur and, consequently, any costs in excess of the fixed price are generally absorbed by us. Under time-and-materials contracts, we are paid for labor at negotiated hourly billing rates and for certain expenses. Under cost-reimbursable contracts, subject to a contract-ceiling amount in certain cases, we are reimbursed for allowable costs and paid a fee, which may be fixed or performance based. However, if our costs exceed the contract ceiling or are not allowable under the provisions of the contract or applicable regulations, we may not be able to obtain reimbursement for all such costs and may have our fees reduced or eliminated. The failure to perform to customer expectations and contract requirements can result in reduced fees and may affect our financial performance for the affected period. Under each type of contract, if we are unable to control costs we incur in performing under the contract, our financial condition and operating results could be materially adversely impacted.affected. Cost over-runs also may adversely affect our ability to sustain existing programs and obtain future contract awards.
We operate in highly competitive markets.
We compete against companies that often have greater sales volumes and financial, research, human, and marketing resources than we have. In addition, some of our largest customers could develop the capability to manufacture products or provide services similar to products that we manufacture or services that we provide. This would result in these customers supplying their own products or services and competing directly with us for sales of these products or services, all of which could significantly reduce our revenues. Furthermore, we are facing increased international competition and cross-border consolidation of competition. Our management believes that the principal points of competition in our markets are product quality, performance, price, design and engineering capabilities, product development, conformity to customer specifications, quality of post-sale support,service, contractual terms, previous installation history, technical expertise, investment “overall value”, and timeliness of delivery, and effectiveness of the distribution organization.delivery. If we are unable to compete successfully with existing or new competitors in these areas, our business, financial condition, and results of operations could be materially and adversely impacted.
Our future growth and continued success is dependent upon our key personnel.
Our success is dependent upon the efforts of our senior management personnel and our ability to attract and retain other highly qualified management personnel. We face competition for management from other companies and organizations. Therefore, we may not be able to retain our existing management personnel or fill new management positions or vacancies created by expansion or turnover at our existing compensation levels. Although we have entered into change of control agreements with some members of senior management, we do not have employment contracts with our key executives. We have made a concerted effort to reduce the effect of the loss of our senior management personnel through management succession planning. The loss of members of our senior management group could have a material and adverse effect on our business. In addition, competition
Page 21
for qualified technical personnel in our industries is intense, and we believe that our future growth and success will depend upon our ability to attract, train, and retain such personnel.
Our international operations are subject to risks and volatility in foreign currency exchange rates.volatility.
During 2006,2008, approximately 25%27% of our consolidated revenue was from customers outside of the United States, and we have operating facilities in foreign countries. Doing business in foreign countries is subject to numerous risks, including:including without limitation: political and economic instability,instability; the uncertainty of the ability of non-U.S. customers to finance purchases; restrictive trade policies,policies; and complying with foreign regulatory and tax requirements that are subject to change. While these factors or the impact of these factors are difficult to predict, any one or more of these factors could adversely affect our operations in the future. To the extent that foreign sales are transacted in foreign currencies and we do not enter into currency hedge transactions, we are exposed to risk of losses due to fluctuations in foreign currency exchange rates, particularly for the Canadian dollar, the euro, Swiss franc, and the British pound. Significant fluctuations in the value of the currencies of the countries in which we do business could have an adverse effect on our results of operations.
We may be unable to protect the value of our intellectual property.
Our success depends in part on obtaining, maintaining, and enforcing our intellectual property rights and avoiding infringing on the intellectual property rights of others. While we take precautionary steps to protect our technological advantages and intellectual property and rely in part on patent, trademark, trade secret, and copyright laws, we cannot assure that the precautionary steps we have taken will completely protect our intellectual property rights. Because patent applications in the United States are maintained in secrecy until either the patent application is published or a patent is issued, we may not be aware of third-party patents, patent applications, and other intellectual property relevant to our products that may block our use of our intellectual property or may be used in third-party products that compete with our products and processes. When others infringe on our intellectual property rights, the value of our products is diminished, and we may incur substantial litigation costs to enforce our rights. Similarly, we may incur substantial litigation costs and the obligation to pay royalties if others claim we infringed on their intellectual property rights. When we develop intellectual property and technologies in connection with U.S. Government contracts, the government has the royalty-free right to use that property.
In addition to our patent rights, we also rely on unpatented technology, trade secrets, and confidential information. Others may independently develop substantially equivalent information and techniques or otherwise gain access to or disclose our technology. We may not be able to protect our rights in unpatented technology, trade secrets, and confidential information effectively. We require each of our employees and consultants to execute a confidentiality agreement at the commencement of an employment or consulting relationship with us. However, these agreements may not provide effective protection of our information or, in the event of unauthorized use or disclosure, they may not provide adequate remedies.
Our business is subject to substantial regulation.
Weoperations are subject to numerous domestic and international laws, regulations, including but not limited to those relating to federal government contracting and export compliance. Our failure to complyrestrictions, and noncompliance with these laws, regulations, and other lawsrestrictions could result in contract termination andexpose us to fines, penalties, suspension, or debarment, civil fines and damages, and criminal prosecution and penalties, any of which could have a material adverse effect on our businessprofitability and operating results.overall financial condition.
We have contracts and operations in many parts of the world subject to U.S. and foreign laws and regulations, including the False Claims Act, regulations relating to import-export control (including the International Traffic in Arms Regulation promulgated under the Arms Export Control Act), technology transfer restrictions, repatriation of earnings, exchange controls, the Foreign Corrupt Practices Act, and the anti-boycott provisions of the U.S. Export Administration Act. Failure by us or our sales representatives or consultants to comply with these laws and regulations could result in administrative, civil, or criminal liabilities and could, in the extreme case, result in suspension or debarment from government contracts or suspension of our export privileges, which could have a material adverse effect on our business.
We are subject to liability under environmental laws.
Our business and facilities are subject to numerous federal, state, local, and foreign laws and regulations relating to the use, manufacture, storage, handling, and disposal of hazardous materials and other waste products. Environmental laws generally impose liability for investigation, remediation, and removal of hazardous materials and other waste products on property owners and those who dispose of materials at waste sites whether or not the
Page 18
waste was disposed of legally at the time in question. We are currently addressing environmental remediation at certain current and former facilities, and we have been named as a potentially responsible party along with other
Page 22
organizations in a number of environmental clean-up sites and may be named in connection with future sites. We are required to contribute to the costs of the investigation and remediation and to take reserves in our financial statements for future costs deemed probable and estimable. Although we have estimated and reserved for future environmental remediation costs, the final resolution of these liabilities may significantly vary from our estimates and could potentially have an adverse effect on our results of operations and financial position.
Unanticipated changes in our tax provisions or exposure to additional income tax liabilities could affect our profitability.
Our business operates in many locations under government jurisdictions that impose income taxes. Changes in domestic or foreign income tax laws and regulations, or their interpretation, could result in higher or lower income tax rates assessed or changes in the taxability of certain revenues or the deductibility of certain expenses, thereby affecting our income tax expense and profitability. In addition, audits by income tax authorities could result in unanticipated increases in our income tax expense.
Our current debt, and debt we may incur in the future, could adversely affect our business and financial position.
As of December 31, 2006,2008, we had $364.9$517 million of debt outstanding, of which $359.0$513 million is long-term debt. Our debt consists primarily of principal payable under our fixed rate senior notes.notes and principal payable at a variable rate of interest under our revolving line of credit. Our level of debt could have significant consequences for our business including: requiring us to use our cash flow to pay principal and interest on our debt, reducing funds available for acquisitions and other investments in our business; making us vulnerable to economic downturns and increases in interest rates; limiting us from obtaining additional debt; and impacting our ability to pay dividends.
A percentage of our workforce is employed under collective bargaining agreements.
Approximately 12%9% of our workforce is employed under collective bargaining agreements, which from time to time are subject to renewal and negotiation. We cannot assure you that we will be successful in negotiating new collective bargaining agreements, that such negotiations will not result in significant increases in the cost of labor, or that a breakdown in such negotiations will not result in the disruption of our operations. Although we have generally enjoyed good relations with both our unionized and non-unionized employees, if we are subject to labor actions, we may experience an adverse impact on our operating results.
Substantial defaults by our customers related to accounts receivable or the loss of significant customers could have a significant negative impact on our business, results of operations, financial condition or liquidity.
A significant portion of our working capital consists of accounts receivable from customers. If customers responsible for a significant amount of accounts receivable were to become insolvent or otherwise unable to pay for products and services, or were to become unwilling or unable to make payments in a timely manner, our business, results of operations, financial condition or liquidity could be adversely affected. An economic or industry downturn could adversely and materially affect the servicing of these accounts receivable, which could result in longer payment cycles, increased collection costs, and defaults in excess of management’s expectations.
We rely on certain suppliers as a sole source of components for some of our products.
Our manufacturing processes for our products often consist of the assembly of purchased components that are generally available from a number of different suppliers, though several suppliers are our sole source of certain components. If a sole sourcesole-source supplier should cease or otherwise be unable to deliver such components, our operating results could be adversely impacted.
Our future performance is influenced by costs incurred by In addition, if our suppliers are unable to keep up with our demand for purchased components and we are unable to locate additional sources of supply, our operating companies including, for example, the costs ofresults could be adversely impacted.
Our earnings and margins depend in part on subcontractor performance, as well as raw materialsmaterial and component availability and pricing.
Our businesses depend on suppliers and subcontractors for raw materials and components. At times subcontractors perform services that we provide to our customers. We depend on these subcontractors and vendors to meet their contractual obligations in full compliance with customer requirements. These supply networks can sometimes experience price fluctuations. Our ability to perform our obligations as a prime contractor may be adversely affected if one or more of these suppliers is unable to provide the agreed-upon supplies or perform the agreed-upon services in a timely and cost-effective manner. While we have attempted to
Page 23
mitigate the effects of increased costs through price increases, there are no assurances that higher prices can effectively be passed through to our customers or that we will be able to offset fully or on a timely basis the effects of higher raw materials costs through price increases.
Our business involves risks associated with complex manufacturing processes.
Our manufacturing processes depend on certain sophisticated and high-value equipment. Unexpected failures of this equipment may result in production delays, revenue loss, and significant repair costs. In addition, equipment failures could result in injuries to our employees. Moreover, the competitive nature of our businesses requires us continuously to implement process changes intended to achieve product improvements and manufacturing efficiencies. These process changes may at times result in production delays, quality concerns, and increased costs. Any disruption of operations at our facilities due to equipment failures or process interruptions could have a material adverse effect on our business.
Our future success will depend, in part, on our ability to develop new technologies.
Virtually all of the products produced and sold by us are highly engineered and require sophisticated manufacturing and system-integration techniques and capabilities. The commercial and government markets in which we operate are characterized by rapidly changing technologies. The product and program needs of our government and commercial customers change and evolve regularly. Accordingly, our future performance depends in part on our ability to identify emerging technological trends, develop and manufacture competitive products, and bring those products to market quickly at cost-effective prices.
Potential product liability risks exist from the products that we sell.
Our businesses expose us to potential product liability risks that are inherent in the design, manufacture, and sale of our products and the products of third-party vendors that we use or resell. We currently maintain what we believe to be suitable and adequate product liability insurance. There can be no assurance, however, that we will be able to maintain our product liability insurance on acceptable terms or that our product liability insurance will provide adequate protection against potential liabilities. In the event of a claim against us, a lack of sufficient insurance coverage could have a material adverse effect on our business, financial condition, and results of operations. Moreover, even if we maintain adequate insurance, any successful claim could have a material adverse effect on our business, financial condition, results of operations, and on the ability to obtain suitable or adequate insurance.
Page 19
Increasing costs of certain employee and retiree benefits could adversely affect our results of operations.
TheOur earnings may be positively or negatively impacted by the amount of expenses recordedincome or expense we record for our definedpension and other postretirement benefit plans. GAAP requires that we calculate income or expense for the plans using actuarial valuations. These valuations reflect assumptions relating to financial market and other economic conditions. Changes in key economic indicators can change the assumptions. The most significant year-end assumptions used to estimate pension plans is dependentor other postretirement benefit expense for the following year are the discount rate, the expected long-term rate of return on changes in market interest rates and the value of plan assets, whichand expected future medical cost inflation. In addition, we are dependent on actual plan asset returns. Significant changes in market interest rates and decreases in the fair valuerequired to make an annual measurement of plan assets and investment losses on plan assetsliabilities, which may adverselyresult in a significant change to equity through a reduction or increase to other comprehensive income. For a discussion regarding how our financial statements can be affected by pension and other postretirement benefit plans accounting policies, see “Management’s Discussion and Analysis—Critical Accounting Estimates and Policies—Pension and Other Postretirement Benefits” in Part II, Item 7. Although GAAP expense and pension or other postretirement contributions are not directly related, the key economic factors that affect our future resultsGAAP expense would also likely affect the amount of operations.cash the company would contribute to the pension or other postretirement plans. Potential pension contributions include both mandatory amounts required under federal law Employee Retirement Income Security Act (ERISA) and discretionary contributions to improve the plans’ funded status.
While we believe our control systems are effective, there are inherent limitations in all control systems, and misstatements due to error or fraud may occur and not be detected.
We continue to take action to assure compliance with the internal controls, disclosure controls, and other requirements of the Sarbanes-Oxley Act of 2002. Our management, including our Chief Executive Officer and Chief Financial Officer, cannot guarantee that our internal controls and disclosure controls will prevent all possible errors or all fraud. A control system, no matter how well conceived and operated, can provide only reasonable, not absolute, assurance that the objectives of the control system are met. In addition, the design of a
Page 24
control system must reflect the fact that there are resource constraints and the benefit of controls must be relative to their costs. Because of the inherent limitations in all control systems, no system of controls can provide absolute assurance that all control issues and instances of fraud, if any, within the Corporation have been detected. These inherent limitations include the realities that judgments in decision-making can be faulty and that breakdowns can occur because of simple error or mistake. Further, controls can be circumvented by individual acts of some persons, by collusion of two or more persons, or by management override of the controls. The design of any system of controls also is based in part upon certain assumptions about the likelihood of future events, and there can be no assurance that any design will succeed in achieving its stated goals under all potential future conditions. Over time, a control may become inadequate because of changes in conditions or the degree of compliance with policies or procedures may deteriorate. Because of inherent limitations in a cost-effective control system, misstatements due to error or fraud may occur and may not be detecteddetected.
.Our operating results and financial condition may be adversely impacted by the current worldwide economic conditions.
We currently generate significant operating cash flows, which combined with access to the credit markets provides us with significant discretionary funding capacity. However, current uncertainty in the global economic conditions resulting from the recent disruption in credit markets poses a risk to the overall economy that could impact consumer and customer demand for our products, as well as our ability to manage normal commercial relationships with our customers, suppliers and creditors. If the current situation deteriorates significantly, our business could be negatively impacted, including such areas as reduced demand for our products from a slow-down in the general economy, or supplier or customer disruptions resulting from tighter credit markets.
There are risks associated with owning our common stock.
Like any equity security, our common stock is subject to a number of risks that may adversely impact our share price including: there is a limited trading market in our common stock; we may not in the future be able to pay dividends on our common stock; we may issue common stock for acquisitions or other purposes that could be dilutive to current stockholders; and we have various anti-takeover defenses such as our rights plan and our ability to issue preferred stock that may discourage a potential acquirer.
Item 1B. Unresolved Staff Comments.
None.
Page 2025
At December 31, 2006,2008, we had 120170 facilities worldwide, including manufacturing, metal treatment service, aerospace component overhaul, engineering, selling, and other facilities and administrative offices. Of these, we owned 4145 locations and leased the remaining 79125 facilities.
| Our principal physical properties as of December 31, 2006, are described below: | ||||||
| Location | Description | Segment | Total Sq. Ft. Owned(1) | |||
| Cheswick, | Manufacturing | Flow Control | 630,000 | |||
| Pennsylvania | ||||||
| East Farmingdale, | Manufacturing | Flow Control | 270,000 | |||
| New York(2) | ||||||
| Mississauga, Ontario, | Manufacturing | Motion Control | 220,000 | |||
| Canada | ||||||
| Chester, Wales | Metal Treatment Services – Shot | Metal Treatment | 200,000 | |||
| United Kingdom | Peening and Wing Forming | |||||
| Shelby, | Manufacturing | Motion Control | 168,000 | |||
| North Carolina | ||||||
| The aggregate remaining properties leased and owned, by each business segment, are as follows: | ||||||
| Segment | Description | Total Sq. Ft. Owned(1) | Total Sq. Ft. Leased(1) | |||
| Metal Treatment | Metal treatment service and other | 904,000 | 876,000 | |||
| facilities and administrative offices | ||||||
| Motion Control | Manufacturing, aerospace component | 139,000 | 583,000 | |||
| overhaul, engineering, and other | ||||||
| facilities | ||||||
| Flow Control | Manufacturing, engineering, and | 338,000 | 509,000 | |||
| other facilities | ||||||
Our principal physical properties as of December 31, 2008, are described below:
Location | Description | Segment | Total Sq. Ft. Owned(1) | |||
Cheswick, | Manufacturing | Flow Control | 688,000 | |||
East Farmingdale, | Manufacturing | Flow Control | 270,000 | |||
Mississauga, Ontario, | Manufacturing | Motion Control | 220,000 | |||
Chester, Wales | Metal Treatment Services – Shot | Metal Treatment | 200,000 | |||
Shelby, | Manufacturing | Motion Control | 168,000 |
The aggregate remaining properties leased and owned, by each business segment, are as follows:
|
|
|
|
|
|
|
Segment |
| Description |
| Total Sq. Ft. Owned(1) |
| Total Sq. Ft. Leased(1) |
Metal Treatment |
| Metal treatment service and other facilities and administrative offices |
| 919,000 |
| 961,000 |
Motion Control |
| Manufacturing, aerospace component overhaul, engineering, and other facilities |
| 139,000 |
| 951,000 |
Flow Control |
| Manufacturing, engineering, and other facilities |
| 408,000 |
| 1,030,000 |
(1) | Sizes are approximate. Unless otherwise indicated, all owned properties are owned in fee, are not subject to any major encumbrance, and are occupied primarily by factory and/or warehouse operations. |
(2) | In February 2003, we entered into a non-traditional sale – leaseback transaction with the Town of Babylon Industrial Development Agency for our property located in E. Farmingdale, New York. Pursuant to the terms of the Lease, the Agency acquired fee simple title to the property, and we are obligated to make lease payments through 2014 to the Agency in lieu of paying real estate taxes on said property. The Lease is subject to cancellation without penalty on 90 days notice, and title reverts back to us upon the repayment of any tax savings realized by us. |
The Corporation also leases 25,70023,500 square feet of office space for its corporate headquarters located in Roseland, New Jersey.
None of the properties listed above are individually material to our business. The buildings on the properties referred to in this Item are well maintained, in good condition, and are suitable and adequate for the uses presently being made of them. Management believes the productive capacity of our properties is adequate to meet our anticipated volume for the foreseeable future.
On March 17, 2005, we completed the sale of our Fairfield, New Jersey property, a former operating property, for $10.5 million. The property encompassed approximately 39 acres and was formerly an operating facility for our Motion Control segment now located in Shelby, North Carolina.
Page 2126
In the ordinary course of business, we and our subsidiaries are subject to various pending claims, lawsuits, and contingent liabilities. We do not believe that the disposition of any of these matters, individually or in the aggregate, will have a material adverse effect on our consolidated financial position or results of operations.
We have been named in approximately 120148 pending lawsuits that allege injury from exposure to asbestos. ToIn addition, to date, we have secured dismissals with prejudice and without prejudice in approximately 19103 and 95110 lawsuits, respectively, and are currently in discussions for similar dismissal of several other lawsuits, and have not been found liable or paid any material sum of money in settlement in any case. We believe that the minimal use of asbestos in our past and current operations and the relatively non-friable condition of asbestos in our products makes it unlikely that we will face material liability in any asbestos litigation, whether individually or in the aggregate. We do maintain insurance coverage for these lawsuitspotential liabilities and we believe adequate coverage exists to cover any unanticipated asbestos liability.
Item 4. Submission of Matters to a Vote of Security Holders.
Not applicable.
Page 22
Item 5. Market for the Registrant'sRegistrant’s Common Equity And Related Stockholder Matters And Issuer Purchases of Securities.
MARKET INFORMATION
Our Common stock is listed and traded on the New York Stock Exchange under the symbol CW. On May 24, 2005, we completed a recapitalization that resulted in the combination of our two classes of common stock into a single new class by converting all outstanding shares of Common stock and Class B common stock into a single new class of common stock. The recapitalization was accomplished through a merger with a wholly owned subsidiary, in which the outstanding shares of Common stock and Class B common stock were exchanged for shares of the single class of Common stock. The ownership of the new class of Common stock was the same immediately after the merger as it was immediately prior. Prior to May 24, 2005, Class B common stock was listed and traded on the New York Stock Exchange under the symbol CW.B.
|
|
|
|
|
|
|
|
|
|
|
|
|
| ||||||||||
| Stock Price Range |
| 2008 |
| 2007 |
| ||||||||||||||||||
|
|
| |||||||||||||||||||||
|
| High |
| Low |
| High |
| Low |
| ||||||||||||||
|
|
|
|
|
| ||||||||||||||||||
| Common | High | Low | High | Low |
|
|
|
|
|
|
|
|
| ||||||||||
| First Quarter | $33.65 | $26.82 | $29.93 | $24.41 |
| $ | 50.16 |
| $ | 37.65 |
| $ | 40.44 |
| $ | 32.79 |
| ||||||
| Second Quarter | 35.07 | 30.52 | 31.34 | 25.07 |
| 52.96 |
| 41.30 |
| 48.46 |
| 37.77 |
| ||||||||||
| Third Quarter | 31.74 | 26.61 | 33.70 | 26.18 |
| 56.07 |
| 41.62 |
| 50.26 |
| 42.55 |
| ||||||||||
| Fourth Quarter | 38.40 | 29.99 | 31.94 | 27.08 |
| 45.37 |
| 24.80 |
| 56.79 |
| 47.15 |
| ||||||||||
| Class B(1) | High | Low | High | Low | |||||||||||||||||||
| First Quarter | N/A | N/A | $29.33 | $24.12 | |||||||||||||||||||
| Second Quarter | N/A | N/A | 31.11 | 26.71 | |||||||||||||||||||
| Third Quarter | N/A | N/A | N/A | N/A | |||||||||||||||||||
| Fourth Quarter | N/A | N/A | N/A | N/A | |||||||||||||||||||
| (1)Class B shares were converted to Common shares on May 24, 2005. | |||||||||||||||||||||||
We had approximately 6,762 holders of record6,200 registered shareholders of Common stock, $1.00 par value, as of January 31, 2007.2009.
DIVIDENDS
In the fourththird quarter of 2005,2007, we increased our quarterly dividend payment to $0.06$0.08 per share, a 33% increase over the prior dividend of $0.045$0.06 per share and the thirdfourth increase in the dividend since 2000.
| 2006 | 2005 | |||||
| Common | ||||||
| First Quarter | $ 0.06 | $ 0.05 | ||||
| Second Quarter | 0.06 | 0.05 | ||||
| Third Quarter | 0.06 | 0.05 | ||||
| Fourth Quarter | 0.06 | 0.06 | ||||
| Class B(1) | ||||||
| First Quarter | N/A | $ 0.05 | ||||
| Second Quarter | N/A | 0.05 | ||||
| Third Quarter | N/A | N/A | ||||
| Fourth Quarter | N/A | N/A | ||||
| (1)Class B shares were converted to Common shares on May 24, 2005. | ||||||
All per share amounts have been adjusted to reflect our 2-for-1 stock splits on April 21, 2006. See notes to the consolidated financial statements for additional financial information.
|
|
|
|
|
|
|
|
|
| 2008 |
| 2007 |
| ||
|
|
|
| ||||
Common |
|
|
|
|
|
|
|
First Quarter |
| $ | 0.08 |
| $ | 0.06 |
|
Second Quarter |
|
| 0.08 |
|
| 0.06 |
|
Third Quarter |
|
| 0.08 |
|
| 0.08 |
|
Fourth Quarter |
|
| 0.08 |
|
| 0.08 |
|
Page 2327
SECURITIES AUTHORIZED FOR ISSUANCE UNDER EQUITY COMPENSATION PLANS
The following table sets forth information regarding our equity compensation plans as of December 31, 2006,2008, the end of our most recently completed fiscal year:
Plan category | Number of | |||||
securities to be | ||||||
issued upon exercise of outstanding options, warrants, and rights | Weighted average | |||||
outstanding options, | ||||||
warrants, and rights | Number of options | |||||
Equity compensation plans | ||||||
| approved by security holders | 3,726,573(a) | $30.50 | 3,518,825(b) | |||
Equity compensation plans | ||||||
| not approved by security holders | None | |||||
Not applicable | Not applicable |
(a) | Consists of |
(b) | Consists of |
Item 6. Selected Financial Data.
| CONSOLIDATED SELECTED FINANCIAL DATA | ||||||||||||||||
| (In thousands, except per share | ||||||||||||||||
| data) | 2005 | |||||||||||||||
| Net sales | $ | 1,282,155 | $ | 1,130,928 | $ | 955,039 | $ | 746,071 | $ | 513,278 | ||||||
| Net earnings | 80,569 | 75,280 | 65,066 | 52,268 | 45,136 | |||||||||||
| Total assets | 1,592,156 | 1,400,285 | 1,278,440 | 973,665 | 810,102 | |||||||||||
| Long-term debt | 359,000 | 364,017 | 340,860 | 224,151 | 119,041 | |||||||||||
| Basic earnings per share | $ | 1.84 | $ | 1.74 | $ | 1.53 | $ | 1.27 | $ | 1.11 | ||||||
| Diluted earnings per share | $ | 1.82 | $ | 1.72 | $ | 1.51 | $ | 1.25 | $ | 1.08 | ||||||
| Cash dividends per share | $ | 0.24 | $ | 0.20 | $ | 0.18 | $ | 0.16 | $ | 0.15 | ||||||
The data presented in the following table is derived from the audited financial statements.
|
|
|
|
|
|
|
|
|
|
|
|
|
|
|
|
|
CONSOLIDATED SELECTED FINANCIAL DATA |
|
|
|
|
|
|
|
|
| |||||||
(In thousands, except per share data) |
| 2008 |
| 2007 |
| 2006 |
| 2005 |
| 2004 |
| |||||
Net sales |
| $ | 1,830,140 |
| $ | 1,592,124 |
| $ | 1,282,155 |
| $ | 1,130,928 |
| $ | 955,039 |
|
Net earnings |
|
| 109,390 |
|
| 104,328 |
|
| 80,569 |
|
| 75,280 |
|
| 65,066 |
|
Total assets |
|
| 2,042,030 |
|
| 1,985,560 |
|
| 1,592,156 |
|
| 1,400,285 |
|
| 1,278,440 |
|
Long-term debt |
|
| 513,460 |
| $ | 510,981 |
|
| 359,000 |
|
| 364,017 |
|
| 340,860 |
|
Basic earnings per share |
| $ | 2.45 |
| $ | 2.35 |
| $ | 1.84 |
| $ | 1.74 |
| $ | 1.53 |
|
Diluted earnings per share |
| $ | 2.41 |
| $ | 2.32 |
| $ | 1.82 |
| $ | 1.72 |
| $ | 1.51 |
|
Cash dividends per share |
| $ | 0.32 |
| $ | 0.28 |
| $ | 0.24 |
| $ | 0.20 |
| $ | 0.18 |
|
All per share amounts have been adjusted to reflect our 2-for-1 stock splitssplit on April 21, 2006 and December 17, 2003. 2006.
See notes to the consolidated financial statements for additional financial information.
Page 2428
Item 7. Management'sManagement’s Discussion and Analysis of Financial Condition and Results of Operations.
Analytical Definitions
Throughout management’s discussion and analysis of financial condition and results of operations, the terms “incremental” and “base” are used to explain changes from period to period. The term “incremental” is used to highlight the impact acquisitions had on the current year results, for which there was no comparable prior-year period. Therefore, the results of operations for acquisitions are “incremental” for the first twelve months from the date of acquisition. The remaining businesses are referred to as the “base” businesses, and growth in these base businesses is referred to as “organic.” Additionally, on May 9, 2008, we sold our commercial aerospace repair and overhaul business located in Miami, Florida. The results of operations for this business have been removed from the comparable prior year periods for purposes of calculating organic growth figures and are included as a reduction of our incremental results of operations from our acquisitions.
Therefore, for the year ended December 31, 2008, our organic growth calculation does not include the operating results related to our 2008 acquisitions: Parylene Coatings, Mechetronics, and VMETRO. Similarly, our organic growth calculation for the year ended December 31, 2008 excludes a portion of our 2007 acquisitions, including four months of operating results for Scientech, five months of operating results of Valve Systems and Controls, seven months of operating results of Benshaw Inc., and eight months of operating results of IMC Magnetics. Additionally, the organic growth calculations exclude five months of our 2007 operating results from our commercial aerospace repair and overhaul business, as noted above, and these amounts are included as a reduction of our incremental results of operations.
COMPANY ORGANIZATION
Our Management’s Discussion and Analysis of Financial Condition and Results of Operations begins with an overview of our company, followed by economic and industry-wide factors impacting our company and the markets we serve, a discussion of the overall results of operations, and finally a more detailed discussion of those results within each of our reportable operating segments.
Curtiss-Wright Corporation is a diversified, multinational provider of highly engineered, technologically advanced, value-added products and services to a broad range of industries in the motion control, flow control, and metal treatment markets. We are positioned as a market leader across a diversified array of niche markets through engineering and technological leadership, precision manufacturing, and strong relationships with our customers. We provide products and services to a number of global markets, such as defense, commercial aerospace, commercial power, oil and gas, automotive, and general industrial. We have achieved balanced growth through the successful application of our core competencies in engineering and precision manufacturing, adapting these competencies to new markets through internal product development, and a disciplined program of strategic acquisitions. Our overall strategy is to be a balanced and diversified company, less vulnerable to cycles or downturns in any one business sector, and to establish strong positions in profitable niche markets. Approximately 45% of our revenues are generated from defense-related markets.
We manage and evaluate our operations based on the products and services we offer and the different industries and markets we serve. Based on this approach, we have three reportable segments: Flow Control, Motion Control, and Metal Treatment. For further information on our products and services and the major markets served by our three segments, see Item 1 Business Description above. The following charts represent our sales by market for 20062008 and 2005:2007:
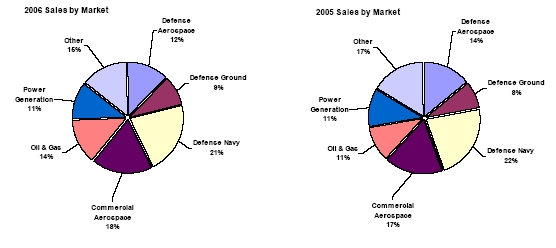
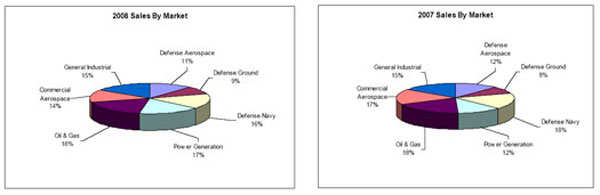
Market Analysis and Economic and Industry-wide Factors
By most measures, 2006 was another good year for Curtiss-Wright. OurIn 2008, Curtiss-Wright generated strong financial performance due to continuing demand for our advanced products, improved operating performance, and the diversification of our core markets: defense, energy, commercial aerospace, and general industry. Despite the macro-economic impacts of a significant U.S. financial market decline as well as a volatile energy market that substantially impacted global demand, Curtiss-Wright produced healthy sales and profit growth due to the contributions from each of its three segments and its highly diversified product portfolio.
Page 29
Our organic sales growth was a resultbalanced between defense and commercial market growth, including solid performances in each of successfulour segments, as well as contributions from our 2007 acquisitions. In particular, we experienced robust organic growth combined with efficient acquisition execution. Continued strength in the U.S. economy provided a solid foundation on which our commercial business thrived. Manypower generation market of the key drivers of our business, such as the U.S. economy, U.S. Department of Defense (DoD) funding, global energy demand and the globalnearly 50%. This growth was partially offset by lower growth in commercial aerospace industry, continued to improve. In addition, U.S. military spending levels remained steady, and lower sales in our automotive and oil and gas markets. Overall, our commercial markets strengthened, particularlyprovided 8% organic growth and 20% total growth, including incremental revenues from our 2007 acquisitions.
Our defense markets were equally strong in 2008, providing 6% organic growth, driven by our aerospace and ground programs with 13% and 23%, respectively, while our naval market was essentially flat, primarily due to timing of the energy sectors. Overall our sales grew at double digit pace in 2006. We generated cash flow from operations of over $140 million, while free cash flow, which is our cash provided by operating activities less capital expenditures, was over $100 million and our strong year end backlog should provide us with great momentum heading into 2007.
Most of our salesshipbuilding procurement cycle. Our growth was organic withdriven by a combination of ongoing programs, developmental programs, and current force repair and upgrades. In our naval market, ongoing production programs provide a long-term revenue base. In addition, we increased our non-nuclear content on the next-generation DDG1000 destroyer, and we have been awarded funding for additional research and development programs. In aerospace, we benefited from solid performance by each of our segments. From a markets standpoint we experienced very strongpositions on nearly every U.S. fighter jet program, as well as increased content on helicopters and unmanned aerial vehicles. Ground defense growth in our energy markets, including 45% growth in oil and gas and 13% growth in commercial nuclear power. Our ground defense business rose 26% in 2006was fueled primarily by increased need for upgrades and new technology insertions in support of our troops stationed around the world. There are indications this spending will continue in the near-term as worn equipment is being refurbished and replaced and next-generation programs are entering full production.
Page 25Economic Factors Impacting Our Markets
Looking forward, we see modest growthbelieve that our commercial markets will experience pressure from a global economic downturn, but our unique and highly engineered products, which are typically provided through long-term programs, will continue to be in the U.S. economy in 2007. The overalldemand. U.S. defense spending levels willare expected to continue to grow at their current moderate pace,moderately, as evidenced by the Fiscal Year 2010 budget proposal submitted in February which requests a 4% increase. We expect the commercial aerospace market to remain stable in the near-term, despite announced delays in new program deliveries, due to the long-term goal for more fuel efficient designs, a globally balanced order backlog, and the global commercial aerospace industry continues to flourish. Energyimproved health of legacy U.S. airlines. We expect continued demand in our energy markets, will remain strong, fueled by increased demandglobal nuclear power construction, as well as the focus on resource independence and limited supply. However, many factors could impact our future performance, including the timing and level of future defense spending in the U.S., volatility of the geopolitical landscape, and the pace of global economic activity.environmental issues.
General Economy
Many of our industrial businesses are driven in large part by global economic growth, especially in the U.S.United States. In 2006,2008, the U.S. economy, grew modestly, and inflation and interest rates remained fairly stable. The overall healthy globalas measured by real gross domestic product (GDP), began to decline in the second half of the year reflecting the onset of an economic environmentrecession sparked by continued declines in 2006 is supported by solid overall growth in our commercial/industrial markets of 19%. Based upon certain economic reports, the U.S. economy is expected to grow at a modest rate in 2007, similar to 2006, assuming that oil prices and the housing market, a massive downward correction in the financial markets, stabilizeand dramatic swings in 2007. Inflation and interest rates are expectedenergy prices. As a stabilizing mechanism, Congress enacted the Treasury Department’s Troubled Asset Relief Program (TARP) in late September as a $700 billion fund to remain stable in 2007. However, if these conditions were not to occur, it may prompt the U.S. Federal Reserve to return to its program of raising interest rates in 2007. At December 31, 2006 the vast majority of our debt carried fixed rates. A significant rise in interest rates could result in increased interest expenseprovide limited liquidity to the extent we borrow under our revolving credit agreement, which carries a floating interest rate. Stabilized interest rates should lead to increased spending and investment in the business sector. Unemployment is expected to remain below 5% in 2007. Also, global Gross Domestic Product (“GDP”) growth is expected to be moderate in 2007, primarily because of higher energy prices and tighter monetary policies.
Approximately 25% of our business is outside the U.S. and subject to currency fluctuations in both transactions in foreign currenciesmarket as well as translation from local country currenciesstabilize interest rates and mitigate inflation risk. Despite the government intervention, considerable softness in the 2009 economic outlook remains, because of the severely restricted access to capital, volatile energy prices which impact airline industry operational flexibility and energy capital spending projects, and a decline in industrial production and capacity utilization rates. While our commercial businesses will experience significant challenges in the U.S. dollar. In 2006upcoming year, we were negatively impacted primarily bybelieve the Canadian dollar, as severalstrong position of our business units have revenues primarily in U.S. dollarsdefense programs, substantial backlog for our commercial nuclear power solutions and expenses primarily in Canadian dollars. We have a global foreign currency hedging program in place, however although we seek to mitigate these fluctuations through such hedging programs, there is no guarantee that our hedging efforts will offset the possible adverse impacts of the currency fluctuations.
It appears that, at leasthealthy demand for commercial aircraft deliveries in the U.S., 2007 is expected to mark the sixth consecutive year of economic expansion, fueled primarily by strong spending in the business sector. We remain cautiously optimistic that this expansion will continue in the near term. To the extent that it does, our businesses that are largely economic driven and serve the commercial aerospace, oil and gas, and general industrial markets, particularly our Metal Treatment segment, are well positioned to benefit from increased economic strength.near-term should generate stable, profitable returns.
Defense
Approximately 45%36% of our business is in the military sector, predominantly in the U.S.,United States, and characterized by long-term programs and contracts driven primarily by the U.S. DoDDepartment of Defense (DoD) budgets and funding levels. In 2008, U.S. military spending levels, as measured by the U.S. DoD funding, provided solid growth. The U.S. defense budget, a leading indicator of our defense market, grew approximately 11% in 2008, including supplemental spending of approximately $170 billion. We have a well-diversified portfolio of products and services that supply product to all branches of the U.S. military and also participate in several non-U.S.foreign military programs, although they do not represent a significant portion of our military business.
In 2006, we achieved 9% growth in our defense markets overall, including strong growth in our ground defense business of 26% and naval platforms of 9%. The growth in the ground defense business was driven by strong demand for our embedded computing products. Our aerospace business was down slightly from the prior year. Our growth was achieved through a combination of ongoing platforms, developmental programs, and current force repair and upgrades. We expect our 2007 defense market growth to be in line with the DoD fiscal 2007 budget growth of approximately 5%.
The DoD fiscal 2007 budget continues investment in key programs, funding in support of transformation initiatives, and increased spending for the modernization and upgrading of our current fleet as well as the global war on terror (GWOT). Our Flow Control and Motion Control segments are well positioned on many high performance defense platforms including: the CVN-21 next-generation aircraft carrier, the Virginia Class nuclear submarine program,carriers, submarines, destroyers, and the DDG-1000 destroyerF-18 Hornet for the U.S. Navy; the U.S. Coast Guard Deepwater program; the F-16 F-18,Falcon, F-22
Page 30
Raptor, V-22 Osprey, and Unmanned Aerial Vehicle programs, such as the Global Hawk, for the U.S. Air Force; and the UH-60 Black Hawk, AH-64 Apache, and CH-47 Chinook helicopters, the Abrams Tank, the Bradley Fighting Vehicle, and the Stryker Mobile Gun System for the U.S. Army. Our Motion Control segmentWe also providesprovide a variety of products to non-U.S. military programs in Europe, the Asia Pacific region, the Middle East, South America, and Canada. In addition, we are involved in many of the future military systems that are currently in development, such as the F-35 Lightning II,JSF, P-8 Poseidon, the Expeditionary Fighting Vehicle, the Future Combat System, the CVN aircraft carrier shipboard aircraft launching and arresting systems, and the Electromagnetic (EM) Gun program.program, and a next-generation advanced motor.
Page 26The Fiscal Year 2009 Defense bill continued on the path toward funding two Virginia class submarines per year by 2011. In addition, the U.S. Navy awarded General Dynamics Electric Boat a $14 billion contract for the construction of eight Virginia-class submarines, reaffirming its commitment to provide stability to the submarine program, its workforce, and supplier base for the next decade after achieving significant cost and construction schedule reductions. This increase resulted in an initial $114 million in orders for Curtiss-Wright from the U.S. Navy and should generate a long-term revenue stream.
Building on the 2008 Defense bill requirement that all future U.S. Navy surface combatant ships be nuclear powered, the 2009 Defense Authorization added amphibious ships to the list of future ship classes which must be nuclear powered, unless the U.S. Navy determines building additional nuclear ships is not feasible. While we do not expect funding for nuclear powered surface ships in any near-term budgets, this new requirement sustains a viable option which could ultimately lead to an increase in nuclear-powered ships. Support for this provision stemmed from anticipated fuel cost efficiency and enhanced mobility due to reduced requirements for refueling, as well as improvement in design efficiency and safety due to lower signature visibility. As a preferred supplier to the U.S. Navy of nuclear propulsion equipment, additional nuclear-powered ships could have a favorable impact on our business. However, the timing and financial impact remain uncertain.
In defense aerospace, F-22 funding continues on a limited basis, but the new administration will make a definitive decision on future production. We anticipate incremental funding on programs such as the F-35, Global Hawk, and P-8 as they transition from development to production programs, as well as strong demand for helicopters, such as the Black Hawk, Seahawk, and Night Hawks, which continue to be in high utilization in both Iraq and Afghanistan.
There are now indications that the new Administration is the possibility thatlooking carefully at defense spending may decrease inand is considering future reductions to address growing deficits. In the future, which could adversely affect our operationsnear-term, however, the global war on terror, emerging security challenges around the globe, and financial condition.the need to replace worn-out equipment make precipitous reductions unlikely. While DoD funding fluctuates year-by-year and program-by-program, the primary risk facing us would be the termination of a major program. We are not aware of any potential materialnuclear program, termination for which we have content. If a material program were to be terminated,such as the termination process takes several years to wind down, which should provide us ample time to react before any potential impact occurs.aircraft carrier or submarine. Although we monitor the budget process as it relates to programs in which we participate, we cannot predict the ultimate impact of future DoD budgets on us. In addition, there are other risks associated with our defense businesses, such as failure of a prime contractor customer to perform on a contract, pricing and/or design specifications that may not always be finalized at the time the contract is bid, and the failure and/or inability of certain sole source suppliers to provide us product, any of which could have an adverse impact on our financial performance. While alternatives could be identified to replace a sole source supplier, a transition could result in increased costs and manufacturing delays.budgets.
Commercial Aerospace
Approximately 18%14% of our revenues arerevenue is derived from the global commercial aerospace industry.market. Our primary focus in this market is OEMOriginal Equipment Manufacturer (OEM) products and services for commercial jets. However, we have expanded into the regional and business jet sectors with new content on the EclipseCessna, Embraer, and Embraer platforms.Learjet platforms, and we are providing increasing content to commercial helicopters. Our Motion Control segment primarily provides flight control and utility actuation control systems, sensors, and other electronics to Boeing as well as electronic products to Airbus. Our Metal Treatment segment forms all of the wing skins for Airbus aircraft and also treatsservices highly stressed components on a variety of turbine engines, and landing gear, systems primarily through third party machine shops. Ourand aircraft structures. Demand for our commercial aerospace business grew approximately 19% in 2006products and 2005. This growth has come fromservices is primarily driven by increased customer production levels, but alsoincluding new platforms for both Boeing and Airbus, strongincreased demand for Sikorsky helicopters, and our overhaul and repair services, as well assuccessful introduction of new products for existing programs.
Our commercial aerospace business is expected to remain healthystable in 20072009 as we are well positioned on a numberall of the commercial aerospace platforms in production and should benefit from continued growthdevelopment. The largest driver of our commercial aerospace business is OEM parts, which is highly dependent on new aircraft production. Industry data reported a 44% decline in this industry over2008 in commercial aircraft sales, primarily due to the next couplesignificant volume of years.orders already in backlog. Global airline traffic is one of the primary driversanother indicator for long-term growth in the commercial aerospace industry, and economic growth is one of the primary drivers of global airline traffic demand. Based on industry reports,Economic growth slowed in 2008 due to the burgeoning financial crisis, and global passenger traffic grew approximately 6% in 2006, which was higher than expected, fueled mainly by strong traffic growthparticular softened in Asia and2008 due to a dramatic rise in
Page 31
fuel prices during the Middle East. Global traffic growth in 2007 is expected to be similar to 2006. Traffic growth, largely stimulated by the healthfirst half of the generalyear. While energy prices began to recede late in the year, escalation of the financial crisis and its impact on the global economy and an aging fleet of existing commercial aircraft contribute to the need for more aircraft, which has generated increased new aircraft orders over the past two years. This healthy backlog of orders is expected to lead to higher OEM production levels, a key driver of our commercial aerospace business. Wewill likely result in slower traffic in 2009 as well. However, we expect to see healthy growthsolid orders in 2009, led by our strong positions on commercial jet programs and the significant backlogs for the production of new aircraft. In addition, our diversification into business, regional, and helicopter markets should provide expanded opportunities in our Boeing business offset somewhat by lower Airbus business because the delay in the A380 program will not totally be offset by other Airbus programs.aerospace business.
While improved economic conditions have contributed to this industry’s recovery, concerns still exist regarding the financial weakness of many of the airlines, continued high fuel prices, and the threat of another major terrorist attack, any of which could have an adverse impact on this industry and our operating results and financial position.
Oil and Gas
Approximately 14%18% of our revenues arerevenue is derived from the oil and gas industry.market. We provide primarily critical-function pumps, valves, process vessels, and control electronics to this industrymarket through our Flow Control segment.segment as well as metal treatment services on highly stressed metal components. Our significant portfolio of advanced technologies for this market resultedincludes integrated systems technologies developed for secondary refining processes such as delayed coking, catalytic cracking, and hydrotreating, as well as a large portfolio of safety-related valve technologies and digital process control electronics, which provide protection throughout the entire refinery, as well as in a record 45% sales growth in 2006, driven mainly by new orders for our revolutionary coker valve productpetrochemical and incremental sales from the acquisition of Enpro Systems. We expect continued strong growth in 2007.other processing plants.
The most prevalent driver impacting ourthis market is capital spending by refiners for maintenance, upgrades, capacity expansion, safety improvements, and compliance with environmental regulations. Refiner profitability and global crude oil prices in general will impact their capital spending levels. RefiningIn 2008, refining margins have remained relatively high despite higher crudewere negatively impacted by a dramatic rise in oil costs, which was not offset by slower rising costs for gasoline. While oil prices later plummeted, it was primarily due to a significant global economic recession which combined with increased global petrochemicalin turn slowed demand for energy.
The dramatic shift in oil prices in 2008 and the anticipated near term impact on exploration, production, and continued global economic growth, have generated and should continue to generate increased investment andrefining markets, suggest weaker demand in these markets in 2009. However, we believe a base level of maintenance capital spending by thewill result in continued demand for our products, in particular for our pressure-relief valve technologies and field services, as refineries opportunistically service or upgrade equipment which has been operating at full capacity in 2007 and beyond. Newrecent years. Additionally, globally environmental regulations in the U.S. are prompting additionalconcerns will drive incremental spending to comply with more stringent emissions standards. The proposed and enacted environmental regulations in the U.S. and other developed countries could drive increased demand for flow control products by as much as 8% to 10% over the next few years. Finally, as the world continues to dependglobal dependence on natural resources persists, oil exploration deepens, and transport requirements widen, we anticipate additional opportunities to provide our flow control products to meet
Page 27
these challenges. For instance, increased crude oil prices has increased refinery focus on throughput and has resulted in the delayed coking and catalytic cracking processes becoming more profitable and safer, leading to increased demand for our related products, which are inherently safer than existing products and, because of their significantly reduced maintenance requirements, increase throughput for the refinery.
In 2006 we announced two important partnerships with industry leaders that will unite our combined technical expertise in creating advanced pumps and motors. While these programs have just been launched, we are confident the continued high demand for natural resources production should result in significant market growth for us over the next few years. However, we temper our outlook for the petroleum marketsoil and gas market based on a number of potentialcurrent market and unforeseeable events. Many of the same factorsgeopolitical events, we take a long term view that drove world oil markets in prior years, such as lowenergy and energy production, capacitytransmission, and rapid demand growth, are expected toconsumption will continue to constrain this market in 2007. Other factors, such as the frequency and intensityprovide a foundation of hurricanes, other extreme weather, and geopolitical instability, may also continue to affect this market. While global demand is expected to increase in 2007, primarily from economic growth in developing Asian countries, global production capacity is also expected to increase in 2007, which should moderate the global oil price increases experienced over the past two years. Finally, we cannot predict how long global economic growth can be sustained, whether proposed environmental and energy legislation will be enacted, the impact of further geopolitical disruption of energy supply, or to the extent such factors may impact this industry.strength domestically.
Power Generation
Approximately 11%17% of our revenues are derived from the commercial nuclear power market, where we supply a variety of highly engineered products and services, including reactor coolant pumps, control rod drive mechanisms, valves, motors, and bolting solutions through our Flow Control segment. In addition, we are one of a small number of companies which provides N-stamp quality assurance certification necessary for supplying nuclear plant equipment. Many of the companies that originally participated in the nuclear power plant construction market years ago have since exited this market.
We experienced 13%Our strong growth in this market in 2006 and our outlook continues to be strong. Our recent growth has come primarily fromyears is a result of the U.S. plant recertification process because mostprocess. Nearly all of the 103 existing nuclear104 operating U.S. nuclsear power plants have applied for or will be applying for plant life extensions, as required bythey reach the end of their current regulations.40-year operating lives. As of December 31, 2006,2008, approximately 4751 plants have received plant life extensions, applications from 817 additional plants have been submitted and are pending approval, and letters of intent to apply have been receivedsubmitted from 3031 more plants with expected application submittal dates from March 2007December 2008 through August 2013.
In addition to plant recertifications, there are several emerging factors that could precipitate an expansion in commercial nuclear power demand over the next several years. Continued growth in global demand for electricity, especially in developing countries with limited supply, will require increased capacity. The Nuclear Energy Institute forecasts that electricity demand will increase by 1% annually through 2030. In order to meet this projected demand the Department of Energy estimates that an averagethe United States must increase electricity production by 25%, which is the equivalent of 34adding approximately 260 new reactors would need to be built every five years over1,000 megawatt power plants. Nuclear power is the period 2010 through 2030 to meet projected demand.most economical source for generating electricity. Instability in the world petroleum markets, where we have seen unprecedented historically high oil prices, have fostered support for seeking alternative, economical fuel sources globally. Nuclear power is the most economical source for generating electricity. There is also increased attention to environmental issues, and nuclear power has proven to have minimal impact on the environment as compared to the majority of current sources. In addition,Finally, the U.S. has indicated that it wants to decrease its dependence on foreign oil imports, which accounts for almostmore than half of its current supply.
Longer term,Page 32
The continued supply constraints and environmental concerns attributed to the current dependence on fossil fuels have led to a reassessment of the value of nuclear technology as the most efficient and environmentally friendly source of energy available today. As a result, we see excellentexpect growth opportunity due to planned new plant constructionopportunities both domestically and internationally. Domestically, 14 energy-related companiesplant life extensions are ongoing and applications for approximately 30 new power plants have announced their intentions to applybeen submitted to the Nuclear Regulatory Commission (NRC) for a combined construction and operating license (COL) for new nuclear power plants in the U.S.. Thus far, the Westinghouse AP1000 reactor design has been selected for 1014 of the potential new reactors. Curtiss-Wright’sOur Flow Control segment has significant content on the AP1000 reactor, the only generation IIIGeneration III+ advanced design certified by the NRC. COL application submittals are expectedNuclear Regulatory Commission. In May, we were awarded a contract to beginprovide reactor coolant pumps (RCPs) for three AP1000 power plants to be built in the fourth quarter of 2007 and, if approved, construction could begin as early as 2010. United States.
Internationally, new nuclear plant construction is ongoing.active. Currently there are 25approximately 40 new reactors under construction, 18100 more planned, and another 51270 proposed. In particular, China intends to expand its nuclear power capabilities significantly through the construction of new nuclear power plants over the next several years. In December 2006, China announced its selection of theSeptember 2007, we were awarded contracts with Westinghouse Electric Company and China’s State Nuclear Power Technology Corporation (SNPTC) to provide RCPs and associated technology for four AP1000 advanced reactor design for two new power plants. Contract negotiations are currently underway and are expectedplants to be completedbuilt in 2007.
Page 28
China. With these developments underway, our Flow Control segment is well positioned to take advantage of the expansion in this industry over the next decade. The recent history of plant life extension approvals in the U.S. and continued strong build programs in Asia are encouraging. However, there is no guarantee that the nuclear alternative will continue to be fully endorsed in the U.S. and other parts of the world, or that the NRC will authorize the construction of new facilities in the U.S. In addition, the geopolitical climate is volatile and could impact future nuclear plant construction levels around the world.
RESULTS OF OPERATIONSAnalytical Definitions
Throughout management’s discussion and analysis of financial condition and results of operations, the terms “incremental” and “base” are used to explain changes from period to period. The term “incremental” is used to highlight the impact acquisitions had on the current year results, for which there was no comparable prior-year period.
During 2006, we redefined the method of calculating organic growth by including the results of operations for acquisitions in the base business after twelve full months of ownership. This change was made to conform to more common practice within our industry. Therefore, the 2006 results of operations for acquisitions are “incremental” for the first twelve months from the date of acquisition. The remaining businesses are referred to as the “base” businesses, and growth in these base businesses is referred to as “organic.” As such, for the year ended December 31, 2006, our organic growth calculations exclude the operations of the 2006 acquisitions as well as the first two months of operations during 2006 of Indal Technologies, which was acquired in March 2005. These excluded results of operations from the organic calculation are considered “incremental”.
The 2005 results of operation continue to present the results based upon the 2005 methodology. As such, an acquisition is considered base when the reporting period includes fully comparable current and prior-year data. Therefore, for the year ended December 31, 2005, our organic growth of the base businesses excludes all acquisitions since January 1, 2004. The term “incremental” is used to highlight the impact acquisitions had on the current year results, for which there was no comparable prior-year period.
Year Ended December 31, 20062008 Compared with Year Ended December 31, 20052007
For the year ended December 31, 2006,2008, we recorded consolidated net sales of $1,282.2$1,830 million and net earnings of $80.6$109 million, or $1.82$2.41 per diluted share. Sales for 20062008 increased 13%15% over 20052007 sales of $1,130.9$1,592 million. Net earnings for 20062008 increased 7%5% from 20052007 net earnings of $75.3$104 million, or $1.72$2.32 per diluted share.
The increase in revenues was driven mainly driven by incremental sales of $152 million, while our base businesses which experiencedcontributed solid organic sales growth of 11%6% in 2006,2008, led by the Flow Control segment, which grew organically by 15%. Our9%, followed by our Motion Control and Metal Treatment and Motion Control segments, which experienced solid organic sales growth of 9%4% and 8%3%, respectively. Additionally, sales in 2006 benefited from an additional two months of revenue generated from our 2005 acquisition of Indal and the sales contribution from the 2006 acquisitions of Enpro Systems, Allegheny, and Swantech, which contributed $27.6 million in incremental sales in 2006.respectively over 2007. See Note 2 to the Consolidated Financial Statements for further information regarding acquisitions.
In our base businesses, all of our segments experienced organic growth in ourhigher sales to the power generation and defense markets whichdrove our organic sales growth, partially offset by lower sales to the general industrial and oil and gas markets. Higher organic sales of $91 million to the power generation market were primarily driven by our Flow Control segment as a result of a $75 million increase in sales for our next generation reactor coolant pumps for the AP1000 nuclear reactors for China and the United States. Sales to the defense markets increased 2006$34 million, with increased sales to the ground and aerospace defense markets of $21 million and $16 million, respectively, driven primarily by $36.9 million over 2005.our Motion Control segment’s embedded computing products. The increase was due primarily to higherincreased sales to the ground defense market relates primarily to content on the Bradley Fighting Vehicle, driven by the Improved Bradley Acquisition System (“IBAS”) program, while the increases in supportsales to the aerospace defense markets was mainly due to increased demand for our embedded computing products used in various U.S. Air Force and U.S. Army programs. Partially offsetting these increases was a decline in sales to the general industrial and oil and gas markets of $11 million each. The decrease in sales to the war effortgeneral industrial market was driven by a decline in Iraqdemand for shot peening services in our Metal Treatment segment resulting from depressed sales in the automotive industry. The decrease in the oil and Afghanistan andgas market was due to a delay in the timing of new order placement for our coke deheading systems and fluidic catalytic cracking units in our Flow Control segment as a result of a significant hurricane season, which shut down or limited operations in a number of refineries along the Gulf Coast, followed by tightening of the financing markets and general economic conditions during the fourth quarter. In addition, foreign currency translation had an unfavorable impact on sales of $5 million in 2008 as compared to 2007.
Operating income for 2008 totaled $197 million, an increase of 10% from $179 million in 2007. Overall organic operating income, which includes non-segment corporate expenses, increased 8% over the prior period driven primarily by our Flow Control segment, which experienced organic operating income growth of 26%. Our Motion Control and Metal Treatment segments experienced organic operating income growth of 3% and 2%, respectively. In addition, 2008 operating income benefited from $3 million of incremental operating income from our 2007 and 2008 acquisitions, net of our 2008 divestiture.
Page 33
Overall operating income margins declined 60 basis points to 10.7% in 2008 from 11.3% in the prior year. Our base businesses experienced 11.4% organic operating income margins in 2008, while our 2007 and 2008 acquisitions experienced operating income margins of 3.1% during the same time period. Operating margins for our 2007 and 2008 acquisitions were negatively impacted by inventory purchase accounting adjustments and intangible amortization expense, which generally run higher in the earlier years. In our base businesses, the organic operating income growth is primarily attributable to the higher sales volume noted above and better cost performance and improved profitability on several long-term contracts. In addition, the 2007 cost overruns on fixed price development contracts for the U.S. Navy procurement programs.and competitively bid development contracts did not recur in 2008. Partially offsetting these favorable impacts were delays in certain commercial aerospace programs, a write-off of deferred contract costs after receipt of a contract cancellation in the fourth quarter of 2008, and a increase in our inventory reserve due to the change in status of the Eclipse bankruptcy.
Our organic selling, general, and administrative costs increased by 11% in 2008, ahead of our organic sales growth of 6%. Organically, our research and development costs were down $2 million in 2008 when compared to 2007, as we completed the design phase of the reactor coolant pumps for the AP1000 nuclear reactors. Selling expenses increased 5% organically, essentially in line with our organic sales growth for the period. Overall, our 2008 general and administrative expenses increased $58 million over 2007, primarily due to incremental expenses of $27 million. The remaining $31 million increase represents an organic growth of 15%, resulting from higher labor and benefit costs to support our growing infrastructure. In addition, foreign currency translation had a favorable impact on operating income of $2 million.
Interest expense was higher in 2008 compared to 2007 due to higher average outstanding debt associated with the funding of our acquisitions, which was partially offset by a decrease in interest rates. Tax expense increased $10 million in 2008 as the prior year included certain nonrecurring tax benefits totaling $4 million.
Backlog at December 31, 2008 reached $1,679 million compared with $1,304 million at December 31, 2007, and $876 million at December 31, 2006. Acquisitions made during 2008 represented $15 million of the backlog at December 31, 2008. New orders received in 2008 totaled $2,232 million, which represents a 19% increase over 2007 new orders of $1,870 million and a 67% increase over new orders received in 2006. Acquisitions made during 2007 and 2008 contributed $119 million in incremental new orders received in 2008. In 2008, we received a $355 million award from Westinghouse for reactor coolant pumps for three new AP1000 power plants to be built domestically. In addition, we received new orders in our Flow Control segment for the Virginia class submarine and aircraft carrier programs and strong orders in our Motion Control segment for embedded computing products.
Year Ended December 31, 2007 Compared with Year Ended December 31, 2006
For the year ended December 31, 2007, we recorded consolidated net sales of $1,592 million and net earnings of $104 million, or $2.32 per diluted share. Sales for 2007 increased 24% over 2006 sales of $1,282 million. Net earnings for 2007 increased 30% from 2006 net earnings of $81 million, or $1.82 per diluted share.
The increase in revenues in 2007 was mainly driven by our base businesses, which experienced organic sales growth of 13% in 2007, led by the Motion Control segment, which grew organically by 14%, followed by our Flow Control and Metal Treatment segments, which experienced solid organic sales growth of 13% and 12%, respectively, over 2006. Additionally, sales in 2007 benefited from our 2006 and 2007 acquisitions, which contributed $142 million in incremental sales in 2007. See Note 2 to the Consolidated Financial Statements for further information regarding acquisitions.
In our base businesses, higher commercial sales to the oil and gas, commercial aerospace, and power generation markets drove our organic sales growth in 2007. Organic sales to the oil and gas market increased $37.8$75 million, asmainly due to demand for our flow controlFlow Control coker valve product, continueswhich continued to penetrate the market and gain customer acceptance fromas the performance of initial product installsinstallations continued to perform well. The remaining increase resulted from strong sales of other valves, actuators, and engineering and field services as they reach the five yearoil and gas market continued to increase capital spending to expand capacity and improve plant efficiencies in service mark.2007. Sales from our base businesses to the commercial aerospace market increased $34.6$27 million in 20062007 because of the overall growth of the market, leading todriven by increased production requirements from our customers in our Motion Control and Metal Treatment segments and content on new programs in our Motion Control segment. Organic sales to the power generation market increased $11 million, mainly due to higher sales of our flow control valves, fasteners, and engineering design and support services resulting from the timing of refurbishment cycles and plant outages.
Page 34
Our defense businesses provided stable growth of 5% with contributions from each of our markets: aerospace, naval, and ground. The primary driver was organic growth in the defense aerospace sector, which increased $20 million in 2007. This market improvement was mainly due to higher sales of our Motion Control’s embedded computing products, which have gained additional market share and benefited from a stronger backlog. In addition, our flight control actuator sales increased due to increased spares, engineering services, and production requirements on existing and new platforms. Lastly, foreign currency translation had a favorable impact on sales of $5.0$17 million in 20062007 as compared to 2005.2006.
Page 29
Operating income for 20062007 totaled $140.6$179 million, an increase of 2%27% from operating income of $138.0$141 million in 2005. In the fourth quarter of 2006, we established a reserve in the amount of $6.5 million to reflect potential liabilities arising from a jury verdict returned against us in a lawsuit filed by a former employee.2006. Overall organic operating income growth, which includes nonsegment expense,non-segment corporate expenses, was 3%20% for 2006,2007 compared to the prior year. Strong segment growth was driven by our Metal Treatment and FlowMotion Control segments, which experienced organic growth of 21%19% and 14%18%, respectively, from the prior year.in 2007 as compared to 2006. Organic operating income growth in our MotionFlow Control segment was 11%5% in 2006.2007. The 20052006 and 20062007 acquisitions experienced ancontributed $10 million of incremental loss of $1.3 millionoperating income during 2006 mainly due to integration costs, lowering the overall operating segment margin in 2006 as compared to 2005.2007.
In our base businesses, the 2007 organic operating income growth increase iswas primarily attributed to higher sales volume and cost reduction initiatives, even though gross margins slipped from 34.5%33.6% to 33.7% 32.9%. The gross margin percentage decline occurred in our Flow Control and Motion Control segments and iswas mainly due to increased work on development contracts and new programs, which are priced at lower margins to capture potential follow-on long-term production and spares orders,orders; cost overruns on certain development contracts and new programs; and higher material and other production costs on fixed-price long-term contracts, and cost overruns on certain new programs and development contracts. Our overall operating income margins were up 30 basis points to 11.3% as lower non-segment operating expenses were partially offset by lower operating segment margins. The gross margins from the higher sales volume were further reduced by highera 21% increase in our organic research and development expenses mainly within our Motion Control and Flow Control segments. In our Motion Control segment, increased spending within our embedded computing business on new product development and product enhancements drove the increase. Higher research and development costs within our Flow Control segment resulted from increased investment in product development in our power generation and oil and gas markets. Our organic selling, general and administrative costs which grew faster than sales at 20%just under 10% in 20062007 as compared to 2005. The increase2006. Cost reduction initiatives across all segments and the decline in general and administrative costs isredundant expenses due primarily to the establishmentcreation of the $6.5a shared service center resulted in operating expense growth less than sales growth. Lower non-segment corporate expenses also helped improve our operating margins. In 2006 we established a $7 million litigation reserve noted above,at the expensing of stock options upon the adoption of Statement of Financial Accounting Standards No. 123 (revised 2004),Share-Based Payment (“SFAS 123(R)”) on January 1, 2006, which totaled $4.9 million, and an increasenon-segment level that did not repeat in pension2007. Pension expense of $4.2 million related to the Curtiss-Wright pension plan due primarily towas down slightly as certain one-time costs in 2006 did not repeat and this savings was partially offset by increased service and interest costs mainly related to head count and salary increases, special termination benefits, and a lump sum payment related to the retirement of a key executive. In addition, we recognized a gain on the sale of property for $2.8 million in 2005, which did not recur in 2006. Selling expenses increased $6.9 million, or 10%, which is slightly behind the sales growth. Research and development costs declined $0.8 million in 2006 as compared to 2005 as more engineering effort was put into development contracts. These costs were classified as cost of goods sold on the statement of income. We also benefited in 2006 from reimbursements of previously expensed research and development costs under joint projects with customers.our acquisitions. Foreign currency translation had an unfavorable impact on operating income of $2.0$3 million for 20062007 as compared to 2005.
We incurred higher interest expense in 2006 compared to 2005. The increase was due to higher interest rates partially offset by lower average outstanding debt. Our average borrowing rate increased 70 basis points in 2006 as compared to 2005 while our average outstanding debt decreased 3% for the comparable periods. Net earnings in 2006 included certain nonrecurring tax benefits totaling $5.1 million.
Backlog at December 31, 2006 remained strong at $875.5 million compared with $805.6 million at December 31, 2005, and $627.7 million at December 31, 2004. Acquisitions made during 2006 represented $23.4 million of the backlog at December 31, 2006. New orders received in 2006 totaled $1,333.0 million, which represents a 6% increase over 2005 new orders of $1,261.2 million and a 33% increase over new orders received in 2004. Acquisitions made during 2005 and 2006 contributed $39.8 million in incremental new orders received in 2006. Record orders for our flow control coker valve and strong orders for our motion control electronic and mechanical products drove the new order improvement. Our metal treatment services, repair and overhaul services, and after-market sales, which represent approximately 20% of our total sales for 2006, are sold with very modest lead times. Accordingly, the backlog for these businesses is less of an indication of future sales than the backlog of the majority of the products and services of our Motion Control and Flow Control segments, in which a significant portion of sales is derived from long-term contracts.
Year Ended December 31, 2005 Compared with Year Ended December 31, 2004
For the year ended December 31, 2005, we recorded consolidated net sales of $1,130.9 million and net earnings of $75.3 million, or $1.72 per diluted share. Sales for 2005 increased 18% over 2004 sales of $955.0 million. Net earnings for 2005 increased 16% from 2004 net earnings of $65.1 million, or $1.51 per diluted share.
The increase in revenues was mainly driven by a complete year of revenues generated from our 2004 acquisitions, primarily Dy 4 Systems, Primagraphics, Nova Machine, Trentec, Groquip, Synergy, and EPD, and the 2005 acquisition of Indal. See Note 2 to the Consolidated Financial Statements for further information regarding acquisitions. These acquisitions contributed $100.5 million in incremental sales in 2005 (or 57% of the total sales increase from 2004). Our base businesses experienced organic sales growth of 8% in 2005, led by the Metal Treatment segment, which grew organically by 11%. Our Flow Control and Motion Control segments experienced solid organic sales growth of 8% and 7%, respectively.
Page 30
In our base businesses, our coker valve products continued to gain customer acceptance, which drove the Flow Control organic sales increase of $22.6 million to the oil and gas market. The Motion Control segment experienced higher sales of our OEM and spares products and repair and overhaul services to the commercial aerospace market of $16.1 million, mainly due to the increased production requirements and the continued improvement in the commercial aerospace market. Metal treatment sales of our global shot peening services increased $13.5 million, primarily in the commercial aerospace and automotive markets, due mainly to the continuing recovery of the global economy and customer production requirements. In addition, we experienced organic growth in our defense markets in both our Motion Control and Flow Control segments, which increased 2005 sales by $7.4 million and $3.6 million, respectively, over 2004. ForeignAlthough foreign currency translation had a favorable impact on sales of $1.2 million in 2005 as comparedfor the segment, the net impact to 2004.
Operating income for 2005 totaled $138.0 million, an increase of 25% from operating income of $110.3 million in 2004. The increase is primarily attributed to higher sales volume, favorable mix, and previously implemented cost reduction initiatives. Operating income in 2005 experienced organic growth of 21% and was driven by our Metal Treatment and Motion Control segments, which experienced organic growth of 21% and 14%, respectively, from 2004. Metal Treatment’s organic operating income growth was mainly the result of higher volume while Motion Control’s organic growth was due to higher volume, favorable sales mix from commercial aerospace spares and aftermarket services, and implemented cost control initiatives. Organic operating income growth in our Flow Control segment was 10% in 2005, due to higher volume. The contributions of the 2004 and 2005 acquisitions amounted to $0.6 million in incremental operating income in 2005 compared to 2004, keeping the overall operating segment margin flat in 2005 compared to 2004. The operating margins of our segments have been somewhat lower than historical levels in recent years, principally related to the large number of acquisitions made since 2002. Although the new acquisitions continue to have a positive effect on operating income, the operating margin of the overall Corporation is lower since the margin levels of the newly acquired companies are below those of our base businesses. We consider this to be a temporary issue that should be more than offset by the benefits of diversification, the implementation of cost control measures, and increased future profitability. The integration of our acquisitions continues to progress as planned. In addition to having improved operating margins for almost all of our recent acquisitions, we have initiated programs to cross-market products and share technologies across our businesses. Foreign currency translation had a favorable impact on operating income of $0.2 million for 2005 as compared to 2004.
In addition to the strong organic growth of the segments, we experienced favorable results in 2005 compared to 2004 from lower environmental remediation costs, which declined $4.5 million, a gain on the sale of property of $2.8 million, and lower costs associated with Sarbanes-Oxley Section 404 compliance of $1.2 million. These favorable impacts were offset by higher research and development, selling, general, and administrative expenses,unfavorable mainly due to the 2004Canadian operations having a significant amount of sales denominated in U.S. dollars and 2005 acquisitions. In addition, we incurred additional infrastructureoperating costs to support our business growth and higher pension expense.in Canadian dollars. Thus, changes in the foreign currency rates directly impact the operating costs with no offsetting impact on sales.
We incurred higher interest expense in 2005 as2007 compared to 20042006. The increase was due to higher interest rates, which accounted for approximately 54% of the increase, and higheraverage outstanding debt levels associated with the funding of our acquisition program.acquisitions and accounted for approximately 80% of the increase. The remaining increase was due to higher interest rates. Our average borrowing rate increased 20 basis points in 2007 as compared to 2006 while our average outstanding debt increased 16% for the comparable periods. Net earnings in 20042007 and 2006 included certain one-timenonrecurring tax benefits of $3.4totaling $4 million which primarily resulted from the change in legal structure of one of our subsidiaries and a favorable IRS Appeals settlement.$5 million, respectively.
Page 3135
Segment Performance
We operate in three principal operating segments on the basis of products and services offered and markets served: Flow Control, Motion Control, and Metal Treatment. See Note 16 to the Consolidated Financial Statements for further segment financial information. The following table sets forth revenues, operating income, operating margin, and the percentage changes on those items, for 20062008 as compared with the prior year periods, by operating segment:
|
|
|
|
|
|
|
|
|
|
|
|
|
|
|
|
| |||||||||||||||||||||
|
| Year Ended December 31, |
| Percent Changes |
| ||||||||||||||||||||||||||||||||
Percent Changes |
|
|
| ||||||||||||||||||||||||||||||||||
| (In thousands, except percentages) | (In thousands, except percentages) | 2006 | 2005 |
| 2008 |
| 2007 |
| 2006 |
| 2008 |
| 2007 |
| |||||||||||||||||||||||
vs. 2005 | vs. 2004 |
|
|
|
|
|
| ||||||||||||||||||||||||||||||
| Sales: |
|
|
|
|
|
|
|
|
|
|
| ||||||||||||||||||||||||||
| Flow Control | $ | 548,121 | $ | 466,546 | $ | 388,139 | 17.5 | % | 20.2 | % |
| $ | 928,052 |
| $ | 746,253 |
| $ | 548,121 |
| 24.4 | % |
| 36.1 | % | ||||||||||||
| Motion Control | 509,462 | 465,451 | 388,576 | 9.5 | % | 19.8 | % |
| 638,068 |
| 591,032 |
| 509,462 |
| 8.0 | % |
| 16.0 | % | ||||||||||||||||||
| Metal Treatment | 224,572 | 198,931 | 178,324 | 12.9 | % | 11.6 | % |
| 264,020 |
| 254,839 |
| 224,572 |
| 3.6 | % |
| 13.5 | % | ||||||||||||||||||
|
|
|
|
|
|
| |||||||||||||||||||||||||||||||
| Total Curtiss-Wright | $ | 1,282,155 | $ | 1,130,928 | $ | 955,039 | 13.4 | % | 18.4 | % |
| $ | 1,830,140 |
| $ | 1,592,124 |
| $ | 1,282,155 |
| 14.9 | % |
| 24.2 | % | ||||||||||||
|
|
|
|
|
|
| |||||||||||||||||||||||||||||||
|
|
|
|
|
|
|
|
|
|
| |||||||||||||||||||||||||||
| Operating Income: |
|
|
|
|
|
|
|
|
|
|
| ||||||||||||||||||||||||||
| Flow Control | $ | 60,542 | $ | 54,509 | $ | 44,451 | 11.1 | % | 22.6 | % |
| $ | 97,214 |
| $ | 73,476 |
| $ | 60,542 |
| 32.3 | % |
| 21.4 | % | ||||||||||||
| Motion Control | 55,242 | 50,485 | 44,893 | 9.4 | % | 12.5 | % |
| 65,539 |
| 64,837 |
| 55,242 |
| 1.1 | % |
| 17.4 | % | ||||||||||||||||||
| Metal Treatment | 42,385 | 34,470 | 28,111 | 23.0 | % | 22.6 | % |
| 52,142 |
| 50,880 |
| 42,385 |
| 2.5 | % |
| 20.0 | % | ||||||||||||||||||
|
|
|
|
|
|
| |||||||||||||||||||||||||||||||
| Total Segments | 158,169 | 139,464 | 117,455 | 13.4 | % | 18.7 | % |
| 214,895 |
| 189,193 |
| 158,169 |
| 13.6 | % |
| 19.6 | % | ||||||||||||||||||
| Corporate & Other | (17,541 | ) | (1,482 | ) | (7,114 | ) | 1,083.6 | % | (79.2 | %) |
| (18,333 | ) |
| (10,009 | ) |
| (17,541 | ) |
| 83.2 | % |
| (42.9 | %) | ||||||||||||
|
|
|
|
|
|
| |||||||||||||||||||||||||||||||
| Total Curtiss-Wright | $ | 140,628 | $ | 137,982 | $ | 110,341 | 1.9 | % | 25.1 | % |
| $ | 196,562 |
| $ | 179,184 |
| $ | 140,628 |
| 9.7 | % |
| 27.4 | % | ||||||||||||
|
|
|
|
|
|
| |||||||||||||||||||||||||||||||
|
|
|
|
|
|
|
|
|
|
| |||||||||||||||||||||||||||
| Operating Margins: |
|
|
|
|
|
|
|
|
|
|
| ||||||||||||||||||||||||||
| Flow Control | 11.0 | % | 11.7 | % | 11.5 | % |
| 10.5 | % |
| 9.8 | % |
| 11.0 | % |
|
|
|
|
| |||||||||||||||||
| Motion Control | 10.8 | % | 10.8 | % | 11.6 | % |
| 10.3 | % |
| 11.0 | % |
| 10.8 | % |
|
|
|
|
| |||||||||||||||||
| Metal Treatment | 18.9 | % | 17.3 | % | 15.8 | % |
| 19.7 | % |
| 20.0 | % |
| 18.9 | % |
|
|
|
|
| |||||||||||||||||
|
|
|
|
|
|
|
|
| |||||||||||||||||||||||||||||
| Total Segments | 12.3 | % | 12.3 | % | 12.3 | % |
| 11.7 | % |
| 11.9 | % |
| 12.3 | % |
|
|
|
|
| |||||||||||||||||
| Total Curtiss-Wright | 11.0 | % | 12.2 | % | 11.6 | % |
| 10.7 | % |
| 11.3 | % |
| 11.0 | % |
|
|
|
|
| |||||||||||||||||
|
|
|
|
|
|
|
|
| |||||||||||||||||||||||||||||
|
|
|
|
|
|
|
|
|
|
|
| ||||||||||||||||||||||||||
Flow Control
Our Flow Control segment reportedSales for 2008 were $928 million, an increase of 24% over 2007 sales of $548.1 million for 2006, an 18% increase over 2005 sales of $466.5$746 million. The sales increase was achieved through organic sales growth of 15%9%, and contributions from our 2007 acquisitions of Scientech, Valve Systems and Controls, and Benshaw which contributed $116 million. Organic sales growth was driven by an increase in sales to the power generation market of $87 million, which was partially offset by a decrease in sales to the oil and gas and defense markets of $12 million and $5 million, respectively.
Higher organic sales to the power generation market were primarily driven by increased sales of $75 million for our next generation reactor coolant pumps for the AP1000 nuclear reactors for China and the United States. The remaining increase in sales to the power generation market resulted from higher demand for our engineering services and fasteners products related mainly to maintenance projects for nuclear power plants that were driven by timing of refurbishment cycles, both scheduled and unscheduled plant outages, which can vary in timing from period to period. The decrease in sales to the oil and gas market resulted from a delay in the timing of new order placement for our coke deheading systems, fluidic catalytic cracking units, and hydrotreating equipment due to a significant hurricane season, which shut down or limited operations in a number of refineries along the Gulf Coast, followed by a tightening in the financing markets and general economic conditions during the fourth quarter. Partially offsetting this decrease in the oil and gas market was increased demand for our traditional valve products, engineering services, and field service work as refineries increased their capital spending and maintenance expenditures.
Within our defense markets, we experienced a decline in sales to the ground defense market of $4 million related to the diversion of funds away from the U.S. Army’s EM Gun program in support of the war effort and a decline
Page 36
in sales of $1 million to the naval and other defense markets. Lower sales to the U.S. Navy of motors and generators for submarines and aircraft carriers related to a wind-down in the funded contracts as well as a delay in funding for development work on the electro-magnetic launching system were partially offset by higher production work on the DDG 1000 Destroyer and an increase in pumps and instrumentation control devices related to the timing of procurement cycles.
Operating income for 2008 was $97 million, an increase of 32% as compared to $73 million for the same period last year. The improvement is mainly driven by organic operating income growth of 26%, while the 2007 acquisitions contributed $4 million in incremental operating income. The increase in the operating income from the base businesses resulted from an increase in gross margins due to the higher sales volume noted above and better cost performance and improved profitability on several long-term contracts in the oil and gas and power generation markets. Additionally, the operating income of the prior year was adversely impacted by a $4 million loss on fixed-price pump development contracts with the U.S. Navy.
Overall operating income margins increased by 70 basis points to 10.5% in 2008 from 9.8% in 2007. The primary driver was the improved gross margins noted above, as 2008 operating expenses from our base business increased 9% over 2007, which was in line with our organic sales growth. The segment benefited from reduced research and development costs of $4 million primarily associated with the AP1000 design completion in 2007. This reduction was offset by increased general and administrative costs associated with the growing infrastructure to support our strategic initiatives. In addition, foreign currency translation had a $1 million unfavorable impact on the segment’s operating income in 2008.
Backlog at December 31, 2008 was $1,102 million compared with $776 million at December 31, 2007 and $435 million at December 31, 2006. New orders received for the Flow Control segment in 2008 totaled $1,262 million, representing an increase of 30% over 2007 new orders of $969 million and an increase of 131% over new orders received in 2006. The acquisitions made in 2007 contributed $100 million in incremental new orders received in 2008. The majority of the increase in new order for 2008 is related to $355 million in new orders for our domestic AP 1000 award as compared to $293 million of new orders received in 2007. In addition, we received $114 million in new orders for the submarine and aircraft carrier programs in 2008.
Sales for 2007 were $746 million, a 36% increase over 2006 sales of $548 million. The sales increase was achieved through organic sales growth of 13% and sales from our 2006 acquisitions of Enpro Systems and Swantech and our 2007 acquisitions of Scientech, Valve Systems and Controls, and Benshaw, which contributed $14.1$130 million in incremental revenue. The increase in organic sales was driven by higher sales to the oil and gas market of $33.9$77 million, higher sales to the power generation market of $15.1$7 million, and higherpartially offset by lower sales to the U.S. Navy of $13.1$17 million.
High demand for our coker valves continued in 20062007 as the products continuecontinued to gain greater market acceptance in the industry asbecause our installed base continuescontinued to perform well. Coker valve sales accounted for 71%44% of the oil and gas industrymarket sales growth in 2006.2007. Additionally, in 2007 refineries continued to invest moneyincrease capital spending to increase capacity and improve plant efficiencies in 2006.and perform more service and maintenance to support their current capacity. As a result, sales of our other products and services to the oil and gas industrymarket, such as valves, actuators, and aftermarket field services were up $10.1$41 million over the prior period. We also benefited from additional repair services associated with turnaround work resulting from the hurricane damage in 2005.increased Gulf Coast turnaround business. Strong product demand for our valves, fasteners, and engineering design and support services from U.S. nuclear power plants drove the increased sales in the power generation market versus 2005.2006. Demand from nuclear power plants iswas driven by the timing of refurbishment cycles and both scheduled and unscheduled plant outages, which can varyvaries in timing and causecaused fluctuations from period to period. In 2006, we expanded our electro-mechanical product line to include reactor vessel heads, which supplemented the control rod drive mechanisms sales. Power generation revenues were driven by higher sales of valves, spare parts, fasteners, and engineering support services, which increased by $8.2$10 million over 2006. In addition, we had $8 million of sales for our new AP1000 reactor coolant pump to be used in future Chinese power plants. These increases to the power generation market were partially offset by lower sales of our control rod drive mechanisms to nuclear power plants, and motor remanufactures, which increased $5.7other reactor coolant pumps of $10 million and $5.0 million, respectively, over the prior year period.These increasesdue to the commercial power generation were partially offset by a $3.9 million decrease in reactor coolant pump sales because of the timing of orders.wind down on some larger contracts. The higherlower sales to the U.S. Navy were mainly driven by increaseddecreased electromechanical generator and pump sales and valvevalves sales of $23.7$30 million due to the timing of procurement cycle on new aircraft carriers and submarines. Lower sales of $6 million for useour JP-5 jet fuel valves used on Nimitz-class aircraft carriers and ball valves used on Virginia-class submarines were caused by delayed funding for these two programs as funds are being diverted to support the CVN aircraft carrier. Sales to the U.S. Navy were also positively impacted by additional engineering, analysis, and development work of $5.0 million, higher sales of electronic power supply products of $2.3 million as we gain additional market share, and higher electro-mechanical spares of $1.6 million, versus the prior year.war efforts. Partially offsetting these declines in 2007 were higher development work for U.S. naval sales was a $19.4 million decrease in generator, pump,surface ships (DDX) and valve sales for submarines.NAVSEA program and production work on the EMALS and AAG programs of $23 million. Sales to the U.S. Navy are dependantdependent on Navy procurement budgets and are subject to
Page 32
fluctuations due to timing of funding releases. In addition, foreign currency translation favorably impacted this segment’s sales by $0.9$1 million in 20062007 compared to 2005.2006.
Page 37
Operating income for 20062007 was $60.5$74 million, an increase of 11%21% over 20052006 operating income of $54.5$61 million. The base business operating income grew a solid 14%5% organically for the full year ended December 31, 2006,2007, while the 2006 and 2007 acquisitions negativelypositively impacted operating income by $1.3$10 million in 20062007 due to business integration costs.strong performance in the oil and gas and power generation markets. The increase in the operating income from the base businesses resulted from higher sales volume, particularly from our coker valve and other valve products and services to the oil and gas industry. market. Favorable sales mix from other non-coker valve products, and engineering services to the oil and gas market for maintenance, repair, and overhaul services which were due to the continued investment by worldwide refineries, also contributed to the higher operating income. In addition, we experienced improved operating performance in our consolidated TapcoEnpro business unit, which commenced its consolidation process in 2006. In the power generation market, our operating income improved due to favorable sales mix with our valve and fastener products and production efficiency improvements with our control rod drive mechanisms, which experienced approximately $3 million of cost overruns in 2006. This segment also received approximately $2 million of recovery from the U.S. Government for environmental remediation costs, which benefited operating income in 2007.
The overall base business operating margin for this segment decreased 70120 basis points in 20062007 versus the prior year period. The lower overall margins resulted mainly from several factors includingcost overruns on fixed-priced development contracts. We experienced a loss of $4 million on pump development contracts with the U.S Navy for three newly designed pumps to be used on CVN aircraft carriers. The other main loss development contract was for first time design airlock doors to be used in Chinese nuclear power plants. Coupled with these overruns were higher material, transportation, and fabrication costs, particularly within the fixed-price coker valve contracts withinin the oil and gas industry. Gross margins in 2006 were alsomarket. Additionally, this segment’s operating margin was impacted by additional testing and qualification costs on newer products such as the control rod drive mechanismscontinued investment in the nuclear power generation market and composite pumps and trim and drain product to the U.S. Navy. Thedevelopment of new product cost overruns are common when undertaking the design, manufacture, and qualification of technically challenging products for the first time. Additionally, we experienced cost overruns on our JP-5 and ball valves servicing U.S. Navy aircraft carriers and submarines, respectively. The cost overruns were associated with improving the design of the products and higher material costs. Partially offsetting these impacts was better labor utilization within our electro-mechanical division and better mixcommercial (mainly in other product sales to the oil and gas industry for maintenance, repair, and overhaul services associated with refinery turnarounds.
Researchpower generation) and military technologies which resulted in an increase of research and development costs increased $1.5of nearly $3 million in 2006 over 2005 as additional investments were madecompared to grow our commercial power business, partially offset bythe prior year, net of reimbursements of costs under joint projects with customers. Selling and administrative costs were up 21%17% organically in 2006 and were2007, driven by increased infrastructure costs incurred to support our organic growth as well as a $1.5 million expense associated with the adoption of SFAS 123(R).growth. In addition, foreign currency translation favorablyunfavorably impacted operating income by $0.2$2 million in 20062007 as compared to 2005.2006.
Backlog at December 31, 2006 is $434.9 million compared with $429.3 million at December 31, 2005 and $396.3 million at December 31, 2004. New orders received in 2006 totaled $545.6 million, a 9% increase over 2005 new orders of $500.1 million and a 25% increase over new orders received in 2004. The increase is mainly due to our new acquisitions, which accounted for $29.5 million in incremental new orders during 2006, and a 40% increase in new orders for our coker valve products to the oil and gas industry. Partially offsetting these increases were lower orders from the U.S. Navy in 2006 compared to 2005.Motion Control
Our FlowMotion Control segment reported sales of $466.5$638 million for 2005, a 20%2008, an 8% increase over 20042007 sales of $388.1$591 million. The sales increase was achieved through organic sales growth of 8%4% and full year sales contributionincremental revenue of our 2004 acquisitions of Nova Machine, Trentec, Groquip, and EPD, which contributed $49.0 million$23 million. The increase in incremental revenue. The organic growth in sales was driven mainly by higher sales to the oilgovernment in the ground and gas industryaerospace defense markets of $22.6$25 million and higher product sales and development work to the defense market of $3.6 million. Coker valve products accounted for approximately 80% of the increased oil and gas market sales due to greater customer acceptance and increased installations, while our other oil and gas valve and field service revenues were higher because of increased maintenance expenditures$14 million, respectively. This was partially offset by refineries worldwide. Higher valvelower sales to the U.S. Navygeneral industrial and commercial aerospace markets of $8.3$4 million and $2 million, respectively.
Ground defense product sales were driven primarily by strong demandhigher sales of embedded computing products for tanks and light armored vehicles. Upgrades on the Bradley Fighting Vehicle platform accounted for the majority of our JP-5 jet fuel transfer valves and ball valves usedsales increase, as we experienced additional volume on Nimitz-class aircraft carriers and Virginia-class submarines, respectively. Electronic instrumentation and digital signal processing cardthe IBAS program, while the remaining increase was due to higher sales on naval platforms increased $7.4 million in 2005 as compared to 2004.the TOW Improved Target Acquisition System, the amphibious Expeditionary Fighting Vehicle, and the Armored Security Vehicle programs. These increased sales to the U.S. Navyincreases were partially offset by anticipated lower revenues from electro-mechanical products because of timing of major programs. Revenues from pump production decreased $26.3 millionreductions in 2005 as compared to 2004ground vehicle subsystems for the Future Combat Systems. The improvement in the aerospace defense market was mainly due to completion of Los Angelesincreased demand on various U.S. Air Force and Virginia class submarine production pump contracts and development prototypeU.S. Army programs, such as the F-22 Raptor, Global Hawk unmanned aerial vehicle, F-35 JSF, V-22 Osprey, F-16 Falcon, and various helicopter programs. Our embedded computing products account for the CVN-21 aircraft carrier,majority of the increase as our COTS market continues to be strong, and our ability to offer a complete embedded computing solution has contributed to this increasing demand. The decline in sales to the general industrial market was related to lower demand for our fuel control valves within the engineered systems division, while lower revenues in the commercial aerospace market were partially offset by sales for development workdue to a realignment of production efforts on the U.S. Army’s electromagnetic gun, which increased $10.7 million, and sales of generators which increased $4.8 million.Eclipse program. In addition, foreign currency translation favorablyunfavorably impacted this segment’s sales by $1.2$1 million in 2005as compared to 2004.the prior year period.
Page 33
Operating income for 20052008 was $54.5$66 million, an increase of 23%1% over 20042007 operating income of $44.5$65 million. The base businessOrganic operating income grew 10% organically for the full year ended December 31, 2005,growth was 3%, while the 2004 acquisitions contributed an additional $3.4 million of incremental operating income in 2005. The improvement inwas a negative $1 million, primarily due to the lost operating income of base businessesthis segment’s 2008 divestiture and minimal contribution from our 2007 and 2008 acquisitions resulting from inventory purchase accounting adjustments and amortization expense, which generally run higher in the early periods of ownership. The increase in this segment’s organic operating income was driven primarily by higherfavorable foreign currency translation, which contributed $3 million. Although foreign currency translation had an unfavorable impact on sales volume. Factors impactingfor this segment, the comparisonnet impact to operating income was favorable mainly due to the Canadian operations having a significant amount of sales denominated in U.S. dollars and operating costs in Canadian dollars. Thus, changes in the 2005 base businesses against 2004 include increased sales and margins from our oil and gas products, notably record orders for our coker valves and the higher margin field service and repairs business. In addition,foreign currency rates directly impact the operating costs with no offsetting impact on sales. The remaining organic operating income benefitgrowth was derived primarily from the higher overallsales volume noted above.
Page 38
Overall, this segment’s operating income margins decreased 70 basis points from 11.0% in 2007 to 10.3% in 2008. Excluding the U.S. Navy wasfavorable impact of foreign currency translation and the net incremental operating loss, our operating margins declined 70 basis points from 10.9% in 2007 to 10.2% in 2008. Gross margin percentages remained essentially flat year over year, as margins in both 2008 and 2007 were negatively impacted by certain key events. In 2008, we experienced lower margins due to delays in commercial aerospace programs such as the Eclipse and Boeing 700 series platforms, a write-off of deferred contract costs after receipt of a contract cancellation in the fourth quarter of 2008, increase in inventory reserve due to a change in status of the Eclipse bankruptcy, and continued investment in development programs which carry lower margins than our recurring business. In 2007, lower gross margins were primarily the result of higher development work on key programs with major suppliers, competitively bid contracts to help us gain entry into several new programs and markets, and higher material and freight costs. Operating expenses remained essentially flat as a percentage of sales as higher legal costs related to an on-going litigation and increased bad debt expense associated with the Eclipse bankruptcy were partially offset by unfavorable mix withincost reduction initiatives implemented through shared service centers.
Backlog at December 31, 2008, was $575 million compared with $526 million at December 31, 2007, and $439 million at December 31, 2006. Acquisitions made during 2008 represented $15 million of the backlog at December 31, 2008. New orders received in 2008 totaled $706 million, up 9% over the 2007 new orders of $646 million and a 25% increase over new orders received in 2006, which was primarily a result of contract wins for our electronic products and lower margin development work performed in anticipationembedded computing products. Incremental new orders accounted for $18 million of follow-on production orders with the U.S. Army. Higher raw material costs, such as the cost of steel, and higher administrative infrastructure costs have adversely impacted our operating margins. In addition, foreign currency translation favorably impacted operating income by $0.2 million in 2005 as compared to 2004.
Motion Controltotal increase for 2008.
Our Motion Control segment reported sales of $509.5$591 million for 2006,2007, a 10%16% increase over 20052006 sales of $465.5$510 million. The sales increase was achieved mainly through organic sales growth of 8%14% and a full year ofpartial-year sales contribution related to our 20052007 acquisition, Indal,IMC Magnetics, which included $5.9added $8 million of incremental revenue. The increase in organic sales was driven mainly by higher sales to the naval defense market of $25 million, higher sales to the commercial aerospace market of $27.6$19 million, higher sales to the aerospace defense market of $19 million, and higher sales to the military marketsground defense market of $18.9$6 million.
The naval defense market improvement was due to higher sales of embedded computing products of approximately $15 million used on various radar, processing, distribution, and display systems and related electronic communication devices on various naval platforms. Additionally, we had increased revenues for our shipboard helicopter handling and door systems, higher spares, and repair and overhaul work, the total of which increased $8 million in 2007. This improvement was partially offset by a decrease in sales to the general industriallower revenue for our marine defense sonar products. The aerospace defense market of $5.7 million. The growth in the commercial aerospace marketimprovement was mainly relateddue to an increase of $20.2 million in commercial aerospace OEM market sales. The OEM sales were driven largely by increased sales of $9.3 milliondemand for contentour embedded computing products used on the Boeing 700 series platforms, due mainly to an increase in ship-setsvarious U.S. Air Force and newU.S. Army programs, and $9.5 million of sensors and components, due mainly to new customer programs, expansion of existing product lines, and new products, such as the recently approved Eclipse aircraft. Commercial aerospace aftermarket sales increased $7.4 million from prior year, with $4.0 million attributableF-15, F-16, F-35 Joint Strike Fighter Lightning II, helicopters, and unmanned aircraft systems. These embedded computing products accounted for the majority of the market increase. The COTS market continues to the repairbe strong, and overhaul business as conditions improve in the industry.our ability to offer a complete embedded computing solution has contributed to this continuing improvement. The remaining increasechange was due to higher spares sales of $3.4 million, mainly related to improving conditions in the industry. There was also an increase in sales of sensor products which was mainly related to smoke detection devices and flight recorders due to improved general economic conditions. Higher sales to the military were driven by a $25.2 million increase in sales to the defense ground market. Higher sales of our embedded computingactuation, air data, and flight recorder products of $14.9 million usedand engineering services. This improvement was driven by higher production ship-set work on variousthe V-22, F-22, F-18, and Blackhawk programs and higher spares for the Blackhawk and F-22 programs, partially offset by the wind down on our F-16 contracts. Our ground defense market revenue was up slightly in 2007 as the higher sales of our ground vehicles subsystems for the Future Combat System were drivenpartially offset by war-related ordersreductions of additional spares and resets for the Bradley Fighting Vehicle, newas well as delays in production orders for the Armored Security Vehicle, and additional orders from other military programs. Vehicle.
The remaining change was caused by growth in the commercial aerospace market was driven largely by increased OEM sales of $9 million for our ruggedized military ground vehicle subsystems to beactuation systems used on the Future Combat System program. These improvementsBoeing 700 series platforms, as assemblies that were partially offsetramping up in 2006 entered full-production rates in 2007. New programs in 2007, such as the cargo door system and aft struts for the 787 program and trailing edge actuation systems used on the 737 series, also contributed to this market growth. The remaining increase of approximately $7 million in this market was driven by a $7.5 million reduction in the defense aerospace market. The decrease is attributable to lower sales of airborne sensor products of $7.6 million resulting from the completion of contracts and lower sales for electronic communication devices of $3.5 million due to reduced customer demand, partially offset by strongerstrong international orders for various helicopterour flight data recorders, other integrated sensors and components, smoke detection devices, and rotary ice protection systems. This improvement can be attributed to new customer programs, especially forexpansion of existing product lines, gaining market share from competitors, and new product offerings into the Blackhawk. The defense navy market remained relatively flat from 2005, while a $6.9 million reduction toregional jet markets, such as the other government agencies related mainly to the completion of the manned space flight contracts. Partially offsetting these improvements were lower sales of other sensor and controller products toEclipse aircraft. We also experienced an increase in the general industrial market resulting from the overhaul of $5.7 million. The decrease is primarilytilting train drives program in our European unit, which began in 2006 and reached normal anticipated levels in 2007. In addition, higher sales of controllers, transformers, faders, and sensors, due to lower sales of controller products of $3.1 million togenerally strong economic conditions in the European manufacturing industry, contributed to this market as a primary customer for these products continued its transition to in-house production.
Operating income for 2006 increased $4.8 million to $55.2 million, an increase of 9% over 2005 operating income of $50.5 million. The base business operating income grew 11% organically for the year ended December 31, 2006, while the 2006 acquisition negatively impacted operating income by $0.8 million in 2006 due to delays in timing of their contracts. The improvement in operating income was driven primarily by the higherimprovement. Commercial aerospace aftermarket sales volume, partially offset by an unfavorable mix of sales to the aerospace defense markets. The lower gross margins were associated with increased development work, which derives lower margins and was performed in anticipation of follow-on production orders, investments in new programs which were competitively bid,repair and slightly higher material costs on the key programs such as the 737 platform. The segment also experienced cost overruns on certain development contracts, the bulk of which related to a fixed price contract for the 767 tanker refueling program. Also negatively impacting gross margins was unfavorable foreignoverhaul services remained flat year-over-year. Foreign currency translation as described in more detail below.
Page 34
The lower gross margin percentages did not have as significant an effect on the overall operating margins of the segment as operating costs in 2006 remained flat as compared to 2005. Research and development costs declined $2.9 million because the increased engineering effort was put into development contracts. As a result, these costs are classified as cost of goods sold on the statement of income. Additionally, we are seeing the benefits of integration efforts as redundant research and development activities are consolidated, especially in our embedded computing division. Selling, general, and administrative costs were up 7% over 2005, which includes overcoming the unfavorable impact of foreign currency translation and the impact of adopting SFAS 123(R), where the expensing of stock options increased general and administrative expensesfavorably impacted sales by $1.5$8 million as compared to the prior year period.
Page 39
Operating cost reductions were experienced through business unit integration efforts, as well as significant cost-cutting initiatives implemented during the current year at all facilities. Overall,income for 2007 was $65 million, an increase of 17% over 2006 operating income of $55 million, all of which was negatively impacted by foreign currency translation of $2.4 million despite the favorable impact currency translation had on sales. This is primarilyorganic. Our 2007 acquisition, IMC Magnetics, experienced a slight loss due to certain Canadian operations whose sales are primarily denominated in U.S. dollars,purchase accounting adjustments and thus, changes in the foreign currency rates directly impact Canadian dollar operating costs with no offsetting effect on sales.
Backlog at December 31, 2006, was $438.6 million compared with $374.5 million at December 31, 2005, and $229.6 million at December 31, 2004. New orders received in 2006 totaled $563.5 million, up slightly over the 2005 new orders of $562.2 million and a 47% increase over new orders received in 2004. The timing of strong ordersnew orders. The increase in operating income for the base business was driven by higher sales volume, cost reduction initiatives, and production efficiencies, mainly within our embedded computing, naval defense, and sensors and controls products were mostly offset by lower orders for our mechanical actuator products.
Our Motion Control segment reported sales of $465.5 million for 2005, a 20% increase over 2004 sales of $388.6 million. The higher sales largely reflect the contributions of our 2005 acquisition of Indal, and the full year contributions of our 2004 acquisitions of Dy 4, Synergy, and Primagraphics. The 2005 incremental sales associated with these acquisitions amounted to $49.9 million. Organic sales increased 7%. Sales in the base business were driven by several factors, including a $7.4 million increase in commercial aerospace OEM market sales. Commercial aerospace OEM sales were driven largely by increased demand for our actuation systems content on the Boeing 737 platform and increased sales of sensors and components. Commercial aerospace aftermarket sales increased $8.8 million during the period, with $4.3 million of that increase in our repair and overhaul business, driven by improving conditions in the commercial airline industry, while spares sales contributed an additional $4.0 million. The remaining change in our commercial markets was highlighted by $3.4 million of higher controller product sales for use in general industrial applications, which was partially offset by the expiration of a tilting train drive systems project in Europe, which contributed $3.7 million in sales in 2004. We also experienced a $3.2 million sales increase in the defense aerospace market, driven by production work on the new AN-APR39 radar warning system for use on various helicopter programs, along with strong sales increases in ruggedized embedded computing. Remaining sales to the military aerospace marketEuropean integrated sensing businesses. This segment’s gross margins were essentially flat year-over-year as increased ship set production of our actuation systems on the F-22 aircraftthese improvements were offset by lower salesgross margins in both the commercial and defense aerospace markets driven by higher development work on key programs with major suppliers and investments in new programs, both of F-16 spares. Sales towhich carry lower margins. We also realized lower margins from the ground defense market as development work on the Future Combat System was competitively bid to gain entry into this program. In addition, we recorded losses on development contracts within our embedded computing business as we endeavor to gain entry into several new market segments. Lastly, this segment was also negatively impacted by higher material and freight costs in 2007.
This segment’s operating income margins were up $1.6 million,slightly in 2007 as higher turret drive stabilization systemscompared to 2006. We continued our operating cost reduction initiatives throughout the segment, which resulted in cost growth less than the sales rates. Shared service centers were developed to reduce redundant operations, resulting in lower operating costs and mobile gun systems sales were largely offsetbetter efficiencies. Research and development expenses in 2007 grew by lower spares sales for25% over 2006 as work moved from product support to new development. Our embedded computing business drove the Bradley Fighting Vehicle.increase as a result of increased spending and additional headcount to support new strategic initiatives. In addition, foreign currency translation negativelyunfavorably impacted salesoperating income by $0.1$4 million in 20052007 as compared to 2004.2006.
Operating income for 2005 increased $5.6 million, 12% over 2004. Operating income in our base businesses increased 14%, driven primarily by higher sales volume and related improvements in gross margin. The operating margins in 2005 decreased 80 basis points to 10.8%. Factors impacting the comparison of the 2005 base businesses against 2004 include increased sales and margins from commercial aerospace programs, notably the Boeing 737 and 747 programs, and favorable industry trends in the markets for commercial aftermarket services and spares leading to higher sales and margins, and cost reduction initiatives. Offsetting these increases are the completion of a tilting train drive systems project in Europe and lower F-16 spares orders, both high margin products that contributed favorably in 2004, continuing integration efforts in the embedded computing business, and lower margins associated with development work performed in anticipation of follow-on production orders, the bulk of which related to cost overruns on a fixed price contract for the 767 tanker refueling program.
The 2005 operating margin associated with businesses acquired in 2004 and 2005 was 6.1%, significantly lower than the base businesses; however, we expect our integration efforts will improve these margins in the future. In the current year, our newly acquired businesses’ operating income was impacted by the delay of orders for our naval systems products, which was anticipated to be realized in 2005, the ongoing integration efforts in the embedded computing business, and margin erosion from changes in foreign exchange rates on certain foreign currency denominated contracts for similar products.
Page 35
Metal Treatment
Our Metal Treatment segment reported sales of $224.6$264 million in 2006,2008, an increase of 13%4% over 20052007 sales of $198.9$255 million. The sales growth was predominately organic and driven by increased sales in all of the segment’s major markets except for the general industrial market. Sales to the commercial aerospace market drove the organic growth with a $9 million increase over the prior year period followed by increased sales to the power generation market of $4 million. In addition, the aerospace defense and oil and gas markets each contributed $2 million to the year-over-year sales growth of the segment. The higher sales to the commercial aerospace market was driven by higher demand for our European shot peening and North American coatings services to OEMs due to increased production requirements. Sales to the power generation market were higher than the prior year due to a shot peening development project and increased demand for our European shot peening services in that market. The increased sales to the aerospace defense and oil and gas markets were driven by higher demand for our North American and European shot peening services, respectively. These sales increases were partially offset by a sales decline of $11 million to the automotive market as a result of depressed sales in the industry. The decline was most prominent in our North American shot peening business. In addition, foreign currency translation had an unfavorable impact on 2008 sales of $2 million when compared to 2007.
Operating income for 2008 increased 2% to $52 million from $51 million in 2007. The growth in operating income was mostly organic and due primarily to the higher sales volume and higher margins generated by the shot peening development project. Overall, this segment’s operating margin decreased 30 basis points to 19.7% primarily due to unfavorable foreign currency translation of $1 million. Excluding the unfavorable foreign currency translation impact, 2008 operating margins were flat as compared to 2007. A slight improvement in gross margin was partially offset by higher operating expenses. The improvement in gross margin was the result of favorable sales mix and productivity gains, partially offset by increased labor costs and start up costs associated with opening new facilities in Austria, China, and Spain. The operating expense increase was primarily due to increased labor costs to support the growth of the business.
Our Metal Treatment segment reported sales of $255 million in 2007, an increase of 14% over 2006 sales of $225 million. Organic sales growth of 9%12% contributed $18.1$26 million to the increase in 2007, while our 2006 acquisition of Allegheny Coatings contributed $7.6$4 million of incremental revenue. The segment experienced organic sales growth in nearly all of its major markets led byand primary service offerings during 2007, with increased sales to the commercial aerospace and general industrialdefense markets of $7.0$11 million and $4.0$4 million, respectively. Meanwhile, salesrespectively over 2006. Sales to the defense, power generation, andgeneral industrial, oil and gas, and power generation markets increased $3.7combined for an additional $11 million $2.1 million, and $1.9 million, respectively, offset by a slight decline in sales to the automotive market of $0.7 millionrevenue during 2007 as compared to 2005. The2006. During 2007, sales growth to the commercial aerospace market was driven by customergrew in each of our major service lines due to higher production requirements forof OEM manufacturers, primarily shot peen forming services primarily on wing components on the Airbus familyand Boeing families of aircraft, coatings services for engine components on Boeing aircraft, and other shot and laser peening, and coating, services on various OEMs. Increased sales of ourfinishing, and heat treating services drovefor various OEMs. Defense sales increased in 2007 primarily from defense aerospace requirements due to the organic growthongoing war on terror. In 2007, the remaining increases over our major markets occurred primarily in the general industrialEuropean markets, as the domestic market while sales increases incontinued to soften, especially the defense, power generation, and oil and gas markets were driven primarily by salesautomotive segment of our shot peening services, due primarily to the continued strengthening of the economy. The slight decline in sales to the automotive market was due to lower demand of our shot peening services in North America partially offset by increased European demand.general
Page 40
industrial market. In addition, foreign currency translation had a favorable impact on sales of $1.3$8 million in 20062007 compared to 2005.2006.
Operating income for 20062007 increased 23%20% to $42.4$51 million from $34.5$42 million during 2005,2006, mainly due to higher sales volume. The base businesses increased 21%Organic growth was 19%, while the 2006 acquisition made in 2006 generated incremental operating income of $0.7 million.$1 million during 2007. Overall, our operating income margin percentagefor 2007 improved 160110 basis points mainly as a result of increases in both gross margins and lower operating costs as a percentage of sales. The improved gross margins frommargin of 60 basis points was a result of the higher sales volume particularly incovering our heat treating division, in addition to cost overruns on certain shot peening jobs incurred at the end of 2004 and beginning of 2005. The higher gross margins were offset by increasedfixed overhead costs. Total operating expenses which in the past have remained relatively flat. Selling, general, and administrative costsfor 2007 increased approximately 10% over 2006 but declined as a percentage of the base businesses increased 15% over the prior year period, driven primarilysales by increased stock-based compensation of $1.1 million associated with the 2006 implementation of SFAS 123(R), increased research and development costs of $0.5 million due to continued development of our laser peening technology, and a normal increase in employee salaries and other operating costs.50 basis points. Foreign currency translation had a nominal positivefavorable impact of $3 million on operating income in 20062007 compared to 2005.2006.
Backlog at December 31, 2006 was $2.1 million compared with $1.9 million at December 31, 2005. New orders received in 2006 totaled $225.5 million, a 13% increase from 2005 new orders of $199.0 million and a 26% increase over new orders received in 2004. The increase is mainly due to the improvement in the global economy, which positively impacted the core shot peening business, and the segment’s recent acquisition.
Our Metal Treatment segment reported sales of $198.9 million in 2005, an increase of 12% over 2004 sales of $178.3 million. Organic sales growth of 11% contributed $18.2 million to the increase. The organic growth was due to solid performance in our global shot peening services, which contributed $13.5 million of additional sales mainly in the European commercial aerospace and global automotive markets. Increases in shot peen forming services, primarily on wing components on the Airbus family of aircraft including the A380, and shot peening services on aircraft engines were both driven by customer production requirements. Sales of shot peening services for the automotive industry increased in both Europe and North America by $2.7 million and $1.1 million, respectively, due to favorable overlap of existing and new programs in the first half of 2005, partially offset by decreased volumes from General Motors and Ford in the second half of 2005. Sales of our heat treating and coatings divisions were up $2.1 million and $1.9 million, respectively, over 2004. The increases were derived primarily from the commercial aerospace market, as customer demand for these services on aircraft component parts increased with the continuing recovery of the aerospace market. In 2005, laser peening sales were essentially flat compared to 2004, as we continue to develop applications for this new technology to be used on highly stressed critical components in the turbine engine, aircraft structures, medical implant, and oil and gas markets. The remaining sales increase in 2005 was due to contributions from our 2004 acquisitions, which contributed $1.7 million of incremental sales during 2005. Foreign currency translation had a nominal positive impact on sales in 2005 compared to 2004.
Operating income for 2005 increased 23% to $34.5 million from $28.1 million during 2004, mainly due to higher sales volume. Gross margins improved slightly on the higher sales volume, partially offset by higher energy costs of $2.3 million, primarily in our heat treating division. However, the impact of the greater sales volume was felt most significantly on operating income, which had margins of 17.3% in 2005 compared to 15.8% in 2004. Selling, general, and administrative costs, which are generally fixed in nature, increased only 4% over 2004, contributing to the higher operating income margin percentage. Foreign currency translation had a nominal impact on operating income in 2005 compared to 2004.
Page 36
Corporate and Other Expenses
Non-segment operating costs consist mainly of pension expense associated with the Curtiss-Wright Pension Plans, environmental remediation and administrative expenses, unallocated medical costs associated with the pooling of self-insurance costs, net foreign transaction gains/losses, and other income and expense not directly associated with the ongoing performance of the segments. We had non-segment operating costs of $17.5$18 million, $1.5$10 million, and $7.1$18 million in 2006, 2005,2008, 2007, and 2004,2006, respectively.
Pension expense associated with the Curtiss-Wright Pension Plans was $6.2$8 million, $2.0$6 million, and $0.5$6 million in 2006, 2005,2008, 2007, and 2004,2006, respectively. The increase in2006 pension expense in 2006 as compared to 2005 and 2004 is due toincluded a settlement charge resulting from the retirement of a key executive and his subsequent election to receive his pension benefit as a single lump sum payout and special termination benefits offered for a limited period of time to certain employees in the Motion Control segment who were subject to a reduction in workforce,workforce. These two items totaled $2 million. Excluding these one-time benefit charges, the increasing pension expense over the three year period was due to increased service and interest costs due to greater headcount,mainly resulting from our acquisitions, as well as higher compensation expense, offset by lower interest costs.service cost.
Environmental remediation and administration costs represented $0.8Net foreign exchange transaction losses amounted to $5 million, $0.8$3 million, and $5.3$1 million in 2006, 20052008, 2007, and 2004,2006, respectively. The higher expense in 20042008 loss was primarily due to a $4.4forward currency transaction to provide downside protection of the cash purchase price for the VMETRO acquisition. As a result of this transaction and the significant strengthening of the U.S. dollar that subsequently occurred, we realized a net cash savings and reduction in the purchase price of approximately $4 million increaseand $7 million, respectively, from the offer date and recorded a pretax charge of $3 million during 2008. Unallocated medical costs associated with our self-insurance plan were $2 million higher in remediation reserve requirements related to the Caldwell Trucking landfill superfund site.2008 than 2007 and $3 million lower than 2006. Litigation reserves were $2 million, $1 million, and $7 million in 2008, 2007, and 2006, respectively. In the fourth quarter of 2006, we established a litigation reserve in the amount of $6.5$7 million to reflect potential liabilities arising from a jury verdict returned against us in a lawsuit filed by a former employee. We also realized a gain of $2.8 million during 2005 on the sale of a former operating property located in Fairfield, New Jersey. In addition, higher unallocated medical costs of $2.0 million associated with the pooling of self-insurance costs accounted for the remaining difference in 2006 as compared to 2005 and 2004.
Interest Expense
Interest expense increased $2.9$2 million in 20062008 compared to 2005.2007. The increase was due to higher interest rates partially offset by lower average outstanding debt. Our average borrowing rate increased 70 basis points in 2006 as compared to 2005 while our average outstanding debt decreased 3% for the comparable periods. Interest expense in 2005 increased $8.0 million from 2004, with higher interest rates accounting for approximately 54% of the increase. The remaining increase was due to higher debt levels associated with the funding of our acquisitions, partially offset by a decrease in our average borrowing interest rate. Our average outstanding debt increased 21% in 2008 as compared to 2007, while our average borrowing rate decreased 80 basis points year over year. Interest expense in 2007 increased $4 million from 2006 due to higher average debt levels, which accounted for approximately 80% of the increase, associated with the funding of our acquisitions. The remaining change in 2007 was due to slightly higher interest rates. Our average borrowing rate increased 20 basis points in 2007 as compared to 2006, while our average outstanding debt increased 16% as compared to prior year.
Page 41
Provision for Income Taxes
Our effective tax rates for 2008, 2007, and 2006, 2005,are 35.3%, 32.3%, and 2004, are 31.5%, 36.4%,respectively. Our 2008 effective tax rate represents a normal blend of our effective income tax rates across our global operations and 34.1%, respectively.did not include any significant tax benefits. Our 2007 effective tax rate included tax benefits of $4 million, including $3 million related to the tax law changes in Canada, the United Kingdom, and Germany, and research and development credits from our U.K. operations of $1 million. Our 2006 effective tax rate included tax benefits of $2.0$5 million including $2 million relating to research and development credits from our Canadian operations, the impact of a Canadian tax law change enacted during the second quarter of 2006, which resulted in a $1.6$2 million favorable adjustment, and the release of a tax reserve associated with the sale of a former facility following the expiration of the statute of limitations, which resulted in a $1.5$2 million favorable adjustment, net of tax. Our 2005 effective tax rate included a charge of $0.3 million from the repatriation of foreign earnings under the American Jobs Creation Act of 2004. Our 2004 effective tax rate included nonrecurring benefits totaling $3.4 million resulting primarily from the change in legal structure of one of our subsidiaries and a favorable IRS appeals settlement.
Page 37
Liquidity and Capital Resources
Sources and Uses of Cash
We derive the majority of our operating cash inflow from receipts on the sale of goods and services and cash outflow for the procurement of materials and labor; cash flow is therefore subject to market fluctuations and conditions. A substantial portion of our business is in the defense sector, which is characterized by long-term contracts. Most of our long-term contracts allow for several billing points (progress or milestone) that provide us with cash receipts as costs are incurred throughout the project rather than upon contract completion, thereby reducing working capital requirements. In some cases, these payments can exceed the costs incurred on a project.
Operating Activities
Our working capital was $330.5$350 million at December 31, 2006, an increase2008, a decrease of $61.5$10 million from the working capital at December 31, 20052007 of $269.0$360 million. Our ratio of current assets to current liabilities was 2.11.8 to 1 at December 31, 20062008 and 2.21.9 to 1 at December 31, 2005.2007. Cash and cash equivalents totaled $124.5$61 million in the aggregate at December 31, 2006, up2008, down from $59.0$67 million at December 31, 2005.2007. Excluding the impact of cash and the working capital changes due to our acquisitions and disposition, our working capital increased $15 million due to increases in inventory and receivables, offset by an increase in deferred income payments. The inventory increases were the result of delayed customer shipments and the stocking of long lead material for our long-term contracts. Accounts receivable increased due to higher sales volume as sales in December 2008 were higher than December 2007. These increases were partially offset by an increase in deferred income mainly due to advance payments received from Westinghouse related to the AP 1000 program.
Our short-term debt was $3 million at December 31, 2008 and $1 million at December 31, 2007. Our long-term debt was $513 million at December 31, 2008, an increase of $2 million from the balance at December 31, 2007. The modest increase of long-term debt is primarily due to funds borrowed to purchase VMETRO and Parylene Coating Services offset by cash generated during 2008. Days sales outstanding at December 31, 2008 improved to 49 days from 51 days at December 31, 2007, while inventory turnover improved to 4.6 turns at December 31, 2008 as compared to 5.3 turns at December 31, 2007.
Cash and cash equivalents totaled $67 million in the aggregate at December 31, 2007, down from $125 million at December 31, 2006. Excluding the impact on cash, working capital decreased $4.0increased $87 million, partiallyprimarily due to 2006the 2007 acquisitions. InventoryThe remainder of the increase during 2007 was driven mainly by increases in inventory balances rose primarily as a result of a build up for expected increases in sales in 20072008, the stocking of material for new programs, increased deferred contract costs, delayed customer shipments and strategic initiatives to lower turn-around time for deliveries.milestone billings, and higher material costs. We also procured additional material to hedge against rising steel prices and the stocking of long lead time materialsmaterial for new programs.our long-term contracts. Accounts receivable increased in 2007 due to higher sales volume, as sales in December 20062007 were 13%22% higher than December 20052006, the timing of milestone billings, and an increase in DSO, partially offset by strong collection efforts of receivables from certain large projects. Unbilled receivables increased due to an increase in long-term contracts accounted for under the percentage-of-completion method as well as increased contracts for which progress billings do not apply. These increases to inventory and receivables were partially offset at that time by an increase in deferred revenue resultingincome mainly due to advance payments received from Westinghouse related to the AP1000 program and higher advance payments from our oil and gas customers. We also experienced an increase in accounts payable and accrued expenses associated with the build upbuild-up of inventories and higher accrued compensation.
Our short-term debt was $5.9 million at December 31, 2006 and $0.9 million at December 31, 2005. Our long-term debt was $359.0 million at December 31, 2006, a decrease of $5.0 million from the balance at December 31, 2005. The decrease is a result of a shift in the classification of one of our Industrial Revenue Bonds from long-term debt to short-term debt; the Industrial Revenue Bond was paid on February 1, 2007. Days sales outstanding at December 31, 2006 increased to 48 days from 43 days at December 31, 2005 while inventory turnover decreased to 5.5 turns at December 31, 2006 as compared to 5.6 turns at December 31, 2005.Page 42
Cash and cash equivalents totaled $59.0 million in the aggregate at December 31, 2005, up from $41.0 million at December 31, 2004. The increase was primarily due to an increase in cash and cash equivalents following the 2005 Senior Note offering and subsequent pay down of our outstanding debt under our revolving credit facilities. Excluding the impact on cash, working capital increased $38.8 million partially due to our Indal acquisition made in the first quarter of 2005. The remainder of the increase was driven mainly by increases in inventory of $26.9 million and accounts receivables of $21.6 million. Inventory balances rose primarily as a result of build up for expected increases in sales in 2006 and strategic initiatives to lower turn-around time for deliveries. Accounts receivable increased due to the timing of contractual billings and industry cycles, partially offset by collection of receivables from certain large projects outstanding at December 31, 2004. Unbilled receivables increased substantially due to funding and other operational delays by certain customers as well as increased contracts for which progress billings do not apply. Partially offsetting these increases in working capital requirements was an increase in accounts payable and accrued expenses associated with the build up of inventories and higher accrued compensation.
Investing Activities
We have acquired twenty-eightforty businesses since 2001 and expect to continue to seek acquisitions that are consistent with our long-term growth strategy. A combination of cash resources, funds available under our credit agreement, and proceeds from our Senior Notes were utilized to fund our acquisitions, net of dispositions, which totaled $39.5$49 million and $73.1$289 million in 20062008 and 2005,2007, respectively. As indicated in Note 2 to the Consolidated Financial Statements, some of our acquisition agreements contain purchase price adjustments, such as potential earn-out payments and working capital adjustments. During 2006,2008, we made approximately $4.4received a net amount of $1 million in such payments relative to prior periodyear acquisitions. Additional acquisitions will depend, in part, on the availability of financial resources at a cost of capital that meetsmeet our stringent criteria. As such, future acquisitions, if any, may be funded through the use of our cash and
Page 38
cash equivalents, through additional financing available under the credit agreement, or through new financing alternatives.
Our capital expenditures were $40.2$104 million in 2006, $42.42008, $54 million in 2005,2007, and $32.5$40 million in 2004.2006. Capital expenditures relate primarily to new and replacement machinery and equipment, and the expansion of new product lines within the business segments.segments, and new facilities. During 2006,2008, we also expanded the reachcontinued expansion of our metal treatment services by adding one new plant in Europe, while in 2005 we relocated onefacilities, with a large portion of our flow control facilitiescapital expenditures made to support the construction of reactor coolant pumps for the AP1000 power plants.
Financing Activities
On August 10, 2007, the Corporation and certain of its subsidiaries amended and refinanced its existing credit facility and entered into a Second Amended and Restated Credit Agreement (“Credit Agreement”). The proceeds available under the Credit Agreement are to be used for working capital, internal growth initiatives, funding of future acquisitions, and general corporate purposes. The Corporation’s available credit under the credit facility increased from $400 million to $425 million from a syndicate of banks, led by Bank of America, N.A. and JP Morgan Chase Bank, N.A. as the co-arrangement banks. The Credit Agreement also contains an accordion feature which can expand the overall credit line to a newmaximum aggregate amount of $600 million. The consortium membership has remained relatively the same. The Credit Agreement extends the maturity from July 23, 2009 to August 10, 2012, at which time all amounts then outstanding under the Credit Agreement will be due and payable. In addition, the Credit Agreement provides for improved pricing and more efficient manufacturing facility.
Financing Activitiesfavorable covenant terms, reduced facility fees, and increased availability of the facility for letters of credit. Borrowings under the Credit Agreement bear interest at a floating rate based on market conditions. In addition, our interest rate and level of facility fees are dependent on certain financial ratio levels, as defined in the Credit Agreement. We are subject to annual facility fees on the commitments under the Credit Agreement. In connection with the Credit Agreement, we paid customary transaction fees that have been deferred and are being amortized over the term of the Credit Agreement. We are required under the Credit Agreement to maintain certain financial ratios and meet certain financial tests, the most restrictive of which is a debt to capitalization limit of 60% and a cross default provision with our other senior indebtedness. The Credit Agreement does not contain any subjective acceleration clauses. As of December 31, 2008, we were in compliance with all covenants and had the flexibility to issue additional debt of approximately $731 million without exceeding the covenant limit defined in the Credit Agreement. We would consider other financing alternatives to maintain capital structure balance and ensure compliance with all debt covenants. We had $155 million and $152 million in borrowings outstanding (excluding letters of credit) under the Credit Agreement at December 31, 2008 and December 31, 2007, respectively. The unused credit available under the Credit Agreement at December 31, 2008 was $208 million. In light of the recent economic conditions and liquidity environment, and given the current volatility within the credit markets, many lenders have presented unattractive terms and conditions by seeking more restrictive lending provisions and higher interest rates that may limit our borrowing capacity and increase our cost of borrowing. However, the Corporation has evaluated its position and believes that its Credit Agreement with the bank consortium provides sufficient short-term access to financing should our operating cash flows be insufficient to fund our operations.
On December 1, 2005, we issued $150.0$150 million of 5.51% Senior Series Notes (the “2005 Notes”). Our 2005 Notes mature on December 1, 2017 and are senior unsecured obligations, equal in right of payment to our existing senior indebtedness. We, at our option, can prepay at any time all or any part of our 2005 Notes, subject to a make-whole payment in accordance with the terms of the Note Purchase Agreement. In connection with our 2005 Notes, we paid customary fees that have been deferred and are being amortized over the term of our 2005 Notes. We are required under the Note Purchase Agreement to maintain certain financial ratios, the most restrictive of which is a debt to capitalization limit of 60%, and. The note also contains a cross default provision with our other senior indebtedness. As of December 31, 2006,2008, we were in compliance with all covenants.
Page 43
In November 2005, we unwound our interest rate swap agreements with notional amounts of $20 million and $60 million, which were originally put in place to convert a portion of our fixed interest on the $75 million 5.13% Senior Notes and $125 million 5.74% Senior Notes, respectively, to variable rates based on specified spreads over six-month LIBOR. The unwinding of these swap agreements resulted in a minimal net loss, of $0.2 million, which has been deferred and is being amortized over the remaining term of the underlying debt.
On September 25, 2003 we issued $200.0$200 million of Senior Notes (the “2003 Notes”). The 2003 Notes consist of $75.0$75 million of 5.13% Senior Notes that mature on September 25, 2010 and $125.0$125 million of 5.74% Senior Notes that mature on September 25, 2013. Our 2003 Notes are senior unsecured obligations and are equal in right of payment to our existing senior indebtedness. We, at our option, can prepay at any time all or any part of our 2003 Notes, subject to a make-whole payment in accordance with the terms of the Note Purchase Agreement. In connection with our 2003 Notes, we paid customary fees that have been deferred and are being amortized over the terms of the 2003 Notes. We are required under the Note Purchase Agreement to maintain certain financial ratios, the most restrictive of which is a debt to capitalization limit of 60% and a cross default provision with our other senior indebtedness. As of December 31, 2006,2008, we were in compliance with all covenants.
At December 31, 2006, we had a $400 million revolving credit agreement (the “Agreement”) with a group of ten banks. The Agreement expires in 2009. Borrowings under the Agreement bear interest at a floating rate based on market conditions. In addition, our interest rate and level of facility fees are dependent on certain financial ratio levels, as defined in the Agreement. We are subject to annual facility fees on the commitments under the Agreement. In connection with the Agreement, we paid customary transaction fees that have been deferred and are being amortized over the term of the Agreement. We are required under the Agreement to maintain certain financial ratios and meet certain financial tests, the most restrictive of which is a debt to capitalization limit of 55% and a cross default provision with our other senior indebtedness. The Agreement does not contain any subjective acceleration clauses. As of December 31, 2006, we were in compliance with all covenants and had the flexibility to issue additional debt of approximately $542 million without exceeding the covenant limit defined in the Agreement. We would consider other financing alternatives to maintain capital structure balance and ensure compliance with all debt covenants. We did not have any cash borrowings outstanding (excluding letters of credit) under the Agreement at December 31, 2006 and December 31, 2005. The unused credit available under the Agreement at December 31, 2006 was $362.2 million.
Our industrial revenue bonds, which are collateralized by real estate, were $14.2$9 million at December 31, 20062008 and December 31, 2005.2007. The loans outstanding under the 2003 and 2005 Notes, Interest Rate Swaps, Revolving Credit Agreement, and Industrial Revenue Bonds had variable interest rates averaging 5.38%4.81% for 20062008 and 4.67%5.58% for 2005.2007.
Page 39
Future Commitments
Cash generated from operations, is considered adequate to meet our operating cash requirements for the upcoming year, including planned capital expenditures of approximately $50 million to $60 million,which includes interest payments of approximately $22$30 million to $24$32 million, estimated income tax payments of approximately $50$60 million to $60 million, dividends of approximately $11 million, pension funding of approximately $5 million to $6$70 million, and additional working capital requirements. We haverequirements should be considered adequate to meet our planned capital expenditures of approximately $3$95 million in short-term environmental liabilities, which is management’s estimationto $105 million and expected dividend payments of cash requirements for 2006.approximately $15 million. Additionally, we are committed to potential earn-out payments on seventhree of our acquisitions dating back to 2001 and an acquired earn-out payment assumed with the purchase of VMETRO, which are estimated to be between approximately $12 million and $14 million and $16 million in 2007.2009. There can be no assurance, however, that we will continue to generate cash flow at the current level. If cash generated from operations is not sufficient to support these operating requirements and investing activities, we may be required to reduce capital expenditures, refinance a portion of our existing debt, or obtain additional financing.
In 2007,2009, our capital expenditures are expected to include the construction of new facilities, expansion of facilities to accommodate new product lines, and new and replacement machinery and equipment, such as additional investment in our laser peening technology.equipment.
The following table quantifies our significant future contractual obligations and commercial commitments as of December 31, 2006:2008:
| (In thousands) | 2007 | 2008 | 2009 | 2010 | 2011 | Thereafter | ||||||||||||||||
| Debt Principal | ||||||||||||||||||||||
| Repayments(1) | $ | 364,994 | $ | 5,874 | $ | 62 | $ | 64 | $ | 75,066 | $ | 68 | $ | 283,860 | ||||||||
| Interest Payments on | ||||||||||||||||||||||
| Fixed Rate Debt | 152,870 | 19,288 | 19,288 | 19,288 | 18,254 | 15,440 | 61,312 | |||||||||||||||
| Operating leases | 79,680 | 16,895 | 15,152 | 12,617 | 9,947 | 7,503 | 17,566 | |||||||||||||||
| Total | 597,544 | $ | 42,057 | $ | 34,502 | $ | 31,969 | $ | 103,267 | $ | 23,011 | $ | 362,738 | |||||||||
|
|
|
|
|
|
|
|
|
|
|
|
|
|
|
|
|
|
|
|
|
|
|
| ||||||||||||||||||||||
(In thousands) |
| Total |
| 2009 |
| 2010 |
| 2011 |
| 2012 |
| 2013 |
| Thereafter |
| |||||||
Debt Principal Repayments (1) |
| $ | 516,743 |
| $ | 3,249 |
| $ | 75,066 |
| $ | 68 |
| $ | 154,570 |
| $ | 125,072 |
| $ | 158,718 |
|
Interest Payments on Fixed Rate Debt |
|
| 114,294 |
|
| 19,288 |
|
| 18,254 |
|
| 15,440 |
|
| 15,440 |
|
| 13,514 |
|
| 32,358 |
|
Operating Leases |
|
| 122,041 |
|
| 22,671 |
|
| 20,079 |
|
| 18,313 |
|
| 14,466 |
|
| 12,176 |
|
| 34,336 |
|
Total |
| $ | 753,078 |
| $ | 45,208 |
| $ | 113,399 |
| $ | 33,821 |
| $ | 184,476 |
| $ | 150,762 |
| $ | 225,412 |
|
(1) | Amounts exclude a $0.1 million adjustment to the fair value of long-term debt relating to the Corporation’s interest rate swap agreements that were settled in cash during 2005. |
We do not have material purchase obligations. Most of our raw material purchase commitments are made directly pursuant to specific contract requirements.
Page 44
We enter into standby letters of credit agreements and guarantees with financial institutions and customers primarily relating to guarantees of repayment on our Industrial Revenue Bonds, future performance on certain contracts to provide products and services, and to secure advance payments we have received from certain international customers. At December 31, 2006,2008, we had contingent liabilities on outstanding letters of credit due as follows:
|
|
|
|
|
|
|
|
|
|
|
|
|
|
|
|
|
|
|
|
|
|
| ||||||||||||||||||||||||
|
|
|
|
|
|
|
|
|
|
|
|
|
|
| ||||||||||||||||||||||||||||||||
| (In thousands) | Total | 2007 | 2008 | 2009 | Thereafter |
| Total |
| 2009 |
| 2010 |
| 2011 |
| 2012 |
| 2013 |
| Thereafter(2) |
| ||||||||||||||||||||||||||
| Letters of Credit(2) | $ | 37,814 | $ | 14,059 | $ | 20,723 | $ | 2,439 | $ | — | $ | — | $ | 593 | ||||||||||||||||||||||||||||||||
Letters of Credit |
| $ | 62,515 |
| $ | 28,242 |
| $ | 6,541 |
| $ | 2,766 |
| $ | 414 |
| $ | 772 |
| $ | 23,780 |
| ||||||||||||||||||||||||
(2) | Amounts indicated as thereafter are letters of credit which expire |
Critical Accounting Estimates and Policies
Our consolidated financial statements and accompanying notes are prepared in accordance with generally accepted accounting principles in the United States of America. Preparing consolidated financial statements requires us to make estimates and assumptions that affect the reported amounts of assets, liabilities, revenues, and expenses. These estimates and assumptions are affected by the application of our accounting policies. Critical accounting policies are those that require application of management’s most difficult, subjective, or complex judgments, often as a result of the need to make estimates about the effects of matters that are inherently uncertain and may change in subsequent periods. We believe that the following are some of the more critical judgment areas in the application of our accounting policies that affect our financial condition and results of operations:
Page 40
Revenue Recognition
The realization of revenue refers to the timing of its recognition in our accounts and is generally considered realized or realizable and earned when the earnings process is substantially complete and all of the following criteria are met: 1) persuasive evidence of an arrangement exists; 2) delivery has occurred or services have been rendered; 3) our price to our customer is fixed or determinable; and 4) collectibilitycollectability is reasonably assured.
We record sales and related profits on production and service type contracts as units are shipped and title and risk of loss have transferred or as services are rendered. This method is used in our Metal Treatment segment and in some of the business units within the Motion Control and Flow Control segments that serve non-military markets.
For certain contracts in our Flow Control and Motion Control segments that require performance over an extended period before deliveries begin, sales and estimated profits are recorded by applying the percentage-of-completion method of accounting. The percentage-of-completion method of accounting is used primarily for our defense contracts and certain long-term commercial contracts. This method recognizes revenue and profit as the contracts progress towards completion. For certain contracts that contain a significant number of performance milestones, as defined by the customer, sales are recorded based upon achievement of these performance milestones. The performance milestone method is an output measure of progress towards completion made in terms of results achieved. For certain fixed price contracts, where none or a limited number of milestones exist, the cost-to-cost method is used, which is an input measure of progress toward completion. Under the cost-to-cost input method, sales and profits are recorded based on the ratio of costs incurred to an estimate of costs at completion. Under our percentage-of-completion methods of accounting, a single estimated total profit margin is used to recognize profit for each contract over its entire period of performance.
Application of percentage-of-completion methods of revenue recognition requires the use of reasonable and dependable estimates of the future material, labor, and overhead costs that will be incurred and a disciplined cost estimating system in which all functions of the business are integrally involved. These estimates are determined based upon industry knowledge and experience of our engineers, project managers, and financial staff. These estimates are significant and reflect changes in cost and operating performance throughout the contract and could have a significant impact on our operating performance. Adjustments to original estimates for contract revenue, estimated costs at completion, and the estimated total profit are often required as work progresses throughout the contract and as experience and more information is obtained, even though the scope of work under the contract may not change. These changes are recorded on a cumulative basis in the period they are determined to be necessary.
Page 45
Under the percentage-of-completion method of accounting, provisions for estimated losses on uncompleted contracts are recognized in the period in which the likelihood of such losses are determined. However, future costs associated with costs deferred in anticipation of future contract sales and certain loss development contracts may be deferred if follow-on production orders are deemed probable. Amounts representing contract change orders are included in revenue only when they can be estimated reliably and their realization is reasonably assured. Certain contracts contain provisions for the redetermination of price and, as such, management defers a portion of the revenue from those contracts until such time as the price has been finalized.
Some of our customers withhold certain amounts from the billings they receive. These retainages are generally not due until the project has been completed and accepted by the customer.
Inventory
Inventory costs include materials, direct labor, and purchasing and manufacturing overhead costs, which are stated at the lower of cost or market, where market is limited to the net realizable value. We estimate the net realizable value of our inventories and establish reserves to reduce the carrying amount of these inventories to net realizable value, as necessary. We continually evaluate the adequacy of the inventory reserves by reviewing historical scrap rates, on-hand quantities as compared with historical and projected usage levels, and other anticipated contractual requirements. The stated inventory costs are also reflective of the estimates used in applying the percentage-of-completion revenue recognition method.
Page 41
We purchase materials for the manufacture of components for sale. The decision to purchase a set quantity of a particular item is influenced by several factors including: current and projected price, future estimated availability, existing and projected contracts to produce certain items, and the estimated needs for our businesses.
For certain of our long-term contracts, we utilize progress billings, which represent amounts billed to customers prior to the delivery of goods and services and are recorded as a reduction to inventory and receivables. Amounts are first applied to unbilled receivables and any remainder is then applied to inventory. Progress billings are generally based on costs incurred, including direct costs, overhead, and general and administrative costs.
Pension and Other Postretirement Benefits
In consultation with our actuaries, we determine the appropriate assumptions for use in determining the liability for future pension and other postretirement benefits. The most significant of these assumptions include the number of employees who will receive benefits, their tenure, their salary levels, the expected return on plan assets, the discount rates used to determine plan obligations, and the trends in the costs of medical and other health care benefits in the case of the postretirement benefit obligations. Changes in these assumptions, if significant in future years, may have an effect on our pension and postretirement expense, associated pension and postretirement assets and liabilities, and our annual cash requirements to fund these plans.
The discount rate used to determine the benefit obligations of the plans as of December 31, 2006,2008, and the annual periodic costs for 2007 was increased in 2006 to2008 remained at 6.0% for all the U.S. pension plans and the EMD postretirement benefit plan to better reflect current economic conditions. The rate wasreflects the hypothetical rate at which the projected benefit obligations could be effectively settled or paid out to participants on that date. We determined our discount rate based on currenta range of factors, including the rates of return on high-quality, fixed-income corporate bonds available at the measurement date and future economic indicators. The increase in the discount rate decreasedrelated expected duration for the benefit obligation of the plans.obligations. The discount rate for the Curtiss-Wright postretirement benefit plan remained at 5.5%increased to 6.0% in 2006. The lower rate in comparison2008 to better reflect current economic conditions. This change caused a decrease to the other plans is because the plan is closed to new entrants, and the expected payouts are shorter in duration than the other plans. We also updated thebenefit obligation. The rate of compensation increase for the pension plans to better reflectremained at 4.0% which reflects the experience over the past years and the Corporation’s expectation of future salary increases. This change caused an increase toWe also utilized the RP 2000 mortality tables for the U.S. pension and postretirement benefit obligation.plans.
The overall expected return on assets assumption is based on a combination of historical performance of the pension fund and expectations of future performance. The historical returns are determined using the market-related value of assets, which is the same value used in the calculation of annual net periodic benefit cost. The market-related value of assets includes the recognition of realized and unrealized gains and losses over a five-year period, which effectively averages the volatility associated with the actual performance of the plan’s assets from year to year. Over the last ten years the market-related value of assets had an average annual yield of 10.2%6.9%, whereas the actual returns averaged 9.5%3.4% during the same period. These averages were significantly impacted by 2008 underperformance. Expected future performance is determined by weighting the expected returns for each
Page 46
asset class by the plan’s asset allocation. The expected returns are based on long-term capital market assumptions utilizing a ten-year time horizon. We have consistently used the 8.5% rate as a long-term overall average return. Givenreturn, and although the uncertainties of the current economic and geopolitical landscapes,financial markets underperformed in 2008, we consider the 8.5% rate to be a reasonable assumption of the future long-term investment returns.
The long-term medical trend assumptions start with a current rate that is in line with expectations for the near future, andfuture. It then grades the rates down over time until it reaches an ultimate rate that is close to expectations for growth in GDP. The reasoning is that medical trends cannot continue to be higher than the rate of GDP growth in the long term. Any change in the expectation of these rates to return to a normal level should have an impact on the amount of expense we recognize.
The timing and amount of future pension income or expense to be recognized each year is dependent on the demographics and expected earnings of the plan participants, the expected interest rates in effect in future years, and the actual and expected investment returns of the assets in the pension trust.
Given the current economic environment and the impact on the financial markets, the funded status of our domestic qualified pension plan was reduced by $146 million. This decline has expedited the future cash funding requirements and increased our future pension expense. We expect to contribute approximately $130 million to this plan over a four year period beginning in 2010. Additionally, we expect the pension expense associated with this plan to increase in 2009 by $2 million to $13 million.
The following table reflects the impact of changes in selected assumptions used to determine the funded status of the Corporation’s pension plans as of December 31, 2006:2008 (in thousands, except for percentage point change):
| Percentage | ||||||||||
| Assumption | Point Change | |||||||||
| Discount rate | (0.25 | %) | $ | 10,361 | $ | 889 | ||||
| Rate of compensation increase | 0.25 | % | 566 | |||||||
| Expected return on assets | (0.25 | %) | 853 | |||||||
Page 42
|
|
|
|
|
|
|
|
|
|
|
Assumption |
| Percentage |
| Increase in |
| Increase in |
| |||
| ||||||||||
Discount rate |
|
| (0.25%) |
| $ | 10,799 |
| $ | 728 |
|
Rate of compensation increase |
|
| 0.25% |
|
| 2,959 |
|
| 544 |
|
Expected return on assets |
|
| (0.25%) |
|
| — |
|
| 890 |
|
See Note 14 to the Consolidated Financial Statements for further information on our pension and postretirement plans, including an estimate of future cash contributions.
Environmental Reserves
We provide for environmental reserves on a site by site basis when, in conjunction with internal and external legal counsel, it is determined that a liability is both probable and estimable. In many cases, the liability is not fixed or capped when we first record a liability for a particular site. If only a range of potential liability can be estimated and no amount within the range is more probable than another, a reserve will be established at the low end of that range. At sites involving multiple parties, we accrue environmental liabilities based upon our expected share of the liability, taking into account the financial viability of our other jointly liable partners. Judgment is required when we make assumptions and estimate costs expected to be incurred for environmental remediation activities because of, among other factors, difficulties in assessing the extent and type of environmental remediation to be performed, the impact of complex environmental regulations and remediation technologies, and agreements between potentially responsible parties to share in the cost of remediation. In estimating the future liability and continually evaluating the sufficiency of such liabilities, we weigh certain factors including our participation percentage due to a settlement by or bankruptcy of other potentially responsible parties, a change in the environmental laws requiring more stringent requirements, an increase or decrease in the estimated time required to remediate, a change in the estimate of future costs that will be incurred to remediate the site, and changes in technology related to environmental remediation. We do not believe that continued compliance with environmental laws applicable to our operations will have a material adverse effect on our financial condition or results of operation. However, given the level of judgment and estimation used in the recording of environmental reserves, it is reasonably possible that materially different amounts could be recorded if different assumptions were used or if circumstances were to change, such as environmental regulations or remediation solution remedies.
Page 47
As of December 31, 2006,2008, our environmental reserves totaled $23.7$22 million, the majority of which is long term. Approximately 75% of the environmental reserves represent the current value of our anticipated remediation costs and are not discounted primarily due to the uncertainty of timing of expenditures. The remaining environmental reserves are discounted to reflect the time value of money since the amount and timing of cash payments for the liability are reasonably determinable. We use a discount rate of 4%, which approximates an amount at which the environmental liability could be settled in an arm’s length transaction with a third party. All environmental reserves exclude any potential recovery from insurance carriers or third-party legal actions.
Purchase Accounting
We apply the purchase method of accounting to our acquisitions. Under this method, the purchase price, including any capitalized acquisition costs, is allocated to the underlying tangible and intangible assets acquired and liabilities assumed based on their respective fair market values, with any excess recorded as goodwill. We determine the fair values of such assets and liabilities, generally in consultation with third-party valuation advisors. Such fair value assessments require significant judgments and estimates such as projected cash flows, discount rates, royalty rates, and remaining useful lives that can differ materially from actual results. The fair value of assets acquired (net of cash) and liabilities assumed of our 20062008 acquisitions were estimated to be $42.4$133 million and $7.4$75 million, respectively. The initial fair values assigned to certain of these acquisitions are preliminary and may be revised prior to finalization, which is to be completed within a reasonable period, generally within one year of acquisition.no later than twelve months from the acquisition date.
See Note 2 to the Consolidated Financial Statements for further information on our purchase accounting.
Goodwill
We have $411.1$609 million in goodwill as of December 31, 2006.2008. The recoverability of goodwill is subject to an annual impairment test based on the estimated fair value of the underlying businesses. The test is performed in the fourth quarter, which coincides with the completion of our five-year strategic operating plan. Additionally, goodwill is tested for impairment when an event occurs or if circumstances change that would more likely than not reduce the fair value of a reporting unit below its carrying amount. Fair value is estimated using an income approach which discounts future net cash flows to their present value at a rate that reflects both the current return requirements of the market and the risks inherent in the reporting unit. These estimated fair values are based on estimates of future cash flows of the businesses. Factors affecting these future cash flows include the continued market acceptance of the products and services offered by the businesses, the development of new products and services by the businesses and the underlying cost of development, the future cost structure of the businesses, and future technological changes. In addition to the income approach, we corroborated our results with the use of market multiples for comparable companies to our reporting units. Estimates are also used for the Corporation’s cost of capital in discounting the projected future cash flows. If it has been determined that impairment has occurred, we may be required to recognize an impairment of our asset, which would be limited to the difference between the book value of the asset and its fair value. Any such impairment would be recognized in full in the reporting period in which it has been identified.
Page 43
Other Intangible Assets
Other intangible assets are generally the result of acquisitions and consist primarily of purchased technology, customer related intangibles, and trademarks. Intangible assets are recorded at their fair values as determined through purchase accounting. Definite-lived intangible assets are amortized ratably to match their cash flow streamson a straight-line basis over their estimated useful lives, which range from 1 to 20 years, while indefinite-lived intangible assets are not amortized. Indefinite-lived intangible assets are reviewed for impairment annually based on the discounted future cash flows. Additionally, we review the recoverability of all intangible assets, including the related useful lives, whenever events or changes in circumstances indicate that the carrying amount might not be recoverable. We would record any impairment in the reporting period in which it has been identified.
Recently Issued Accounting Standards
In February 2006, the Financial Accounting Standards Board (“FASB”) issued Statement of Financial Accounting Standards No. 155,Accounting for Certain Hybrid Financial InstrumentsPronouncements — an amendment of FASB Statements No. 133 and 140 (“SFAS No. 155”). SFAS No. 155 permits a fair value remeasurement for any hybrid financial instrument that contains an embedded derivative that would otherwise require bifurcation. This accounting standard is effective as of the beginning of fiscal years beginning after September 15, 2006. The Corporation does not anticipate that the adoption of this statement will have a material impact on the Corporation’s results of operation or financial condition.
In March 2006,New accounting pronouncements have been issued by the FASB issued SFAS No. 156,Accounting for Servicing of Financial Assets, an amendment of FASB Statement No. 140 (“SFAS No. 156”). SFAS No. 156 requires that servicing assets and servicing liabilities be recognized at fair value, if practicable, when the Corporation enters into a servicing agreement and allows two alternatives, the amortization and fair value measurement methods, as subsequent measurement methods. This accounting standard iswhich are not effective for all new transactions occurring as of the beginning of fiscal years beginning after September 15, 2006. The Corporation does not anticipate that the adoption of this statement will have a material impact on the Corporation’s results of operation or financial condition.
In June 2006, the FASB issued Interpretation No. 48Accounting for Uncertainty in Income Taxes, an interpretation of FAS 109, Accounting for Income Taxes (“FIN 48”), to create a single model to address accounting for uncertainty in tax positions. FIN 48 clarifies the accounting for income taxes, by prescribing a minimum recognition threshold a tax position is required to meet before being recognized in the financial statements. FIN 48 also provides guidance on derecognition, measurement, classification, interest and penalties, accounting in interim periods, disclosure, and transition. FIN 48 is effective for fiscal years beginninguntil after December 15, 2006. The Corporation will adopt FIN 48 as31, 2008. For further discussion of Januarynew accounting standards, see Note 1 2007, as required. The cumulative effect of adopting FIN 48 will be recorded in retained earnings and other accounts as applicable. We are evaluating our tax positions and anticipate thatto the adoption of FIN 48 will not have a significant impact on our results of operations.
In September 2006, the FASB issued SFAS No. 158,Employers’ Accounting for Defined Benefit Pension and Other Postretirement Plans (“SFAS No. 158”). This Statement requires companies to recognize a net liability or asset to report the funded status of their defined benefit pension and other postretirement benefit plans (“the Plans”). The recognition of a net asset or liability will require an offsetting adjustment to accumulated other comprehensive income (“AOCI”) in shareholders’ equity. SFAS No. 158 will not change how the Plans are accounted for and reported in the income statement. Therefore, the amounts to be recognized in AOCI will be the unrecognized gains/losses, prior service costs/credits, and transition assets/obligations, which will continue to be amortized under the existing guidance as net periodic pension cost in the income statement. Companies are required to initially recognize the funded status and provide the required disclosures beginning for fiscal year ends after December 15, 2006. The net impact on the December 31, 2006 balance sheet is to increase prepaid pension costs by $21.1 million, increase other current liabilities $2.3 million, reduce accrued pension and postretirement benefit costs by $4.9 million, increase deferred tax liabilities by $9.0 million, with the offset increasing stockholders’ equity by $14.7 million. Additionally, for fiscal years ending after December 15, 2008, SFAS 158 will require companies to measure the plan assets and obligations as of the date of the employer’s fiscal year end, however earlier adoption of the measurement date provisions is encouraged. The Corporation currently utilizes measurement dates of September 30 and October 31 for its various Plans. The Corporation does not anticipate the change in the fiscal year end measurement date to have a material impact on the Corporation’s results of operation or financial condition.Consolidated Financial Statements.
Page 4448
Item 7A. Quantitative and Qualitative Disclosures About Market Risk.
We are exposed to certain market risks from changes in interest rates and foreign currency exchange rates as a result of our global operating and financing activities. We seek to minimize any material risks from foreign currency exchange rate fluctuations through our normal operating and financing activities and, when deemed appropriate, through the use of derivative financial instruments. We do not use such instruments for trading or other speculative purposes. We used forward foreign currency contracts to manage our currency rate exposures during the year ended December 31, 2006.2008. Information regarding our accounting policy on financial instruments is contained in Note 1-K1-L to the Consolidated Financial Statements.
The market risk for a change in interest rates relates primarily to our debt obligations. Our interest rate exposure was 96%68% and 69% fixed at December 31, 20062008 and December 31, 2005.2007, respectively. The variable rates on the Industrial Revenue Bonds are based on market rates. As of December 31, 2006,2008, a change in interest rates of 1% would have an impact on consolidated interest expense of approximately $0.1$2 million. Information regarding our 2005 and 2003 Notes, Revolving Credit Agreement, and Interest Rates Swaps is contained in Note 10 to the Consolidated Financial Statements.
Financial instruments expose us to counter-party credit risk for non-performance and to market risk for changes in interest and foreign currency rates. We manage exposure to counter-party credit risk through specific minimum credit standards, diversification of counter-parties, and procedures to monitor concentrations of credit risk. We monitor the impact of market risk on the fair value and cash flows of our investments by investing primarily in investment grade interest bearing securities, which have short-term maturities. We attempt to minimize possible changes in interest and currency exchange rates to amounts that are not material to our consolidated results of operations and cash flows.
Our acquisitions of Indal, Dy 4,VMETRO and NovatronicsMechetronics have increased our exposure to foreign currency exchange rate fluctuations related primarily to the Canadian dollar. We currently have a hedging program in place to mitigate the Canadian dollar foreign currency risk.British pound and Norwegian kroner. Although the majority of our sales, expenses, and cash flows are transacted in U.S. dollars, we do have some market risk exposure to changes in foreign currency exchange rates, primarily as it relates to the value of the U.S. dollar versus the Canadian dollar, the British pound, the euro, the Norwegian kroner, and the Swiss franc. Any significant change against the U.S. dollar in the value of the currencies of those countries in which we do business against the U.S. dollar could have an adverse effect on our business, financial condition, and results of operations. We seek to minimize the risk from these foreign currency fluctuations principally through invoicing our customers in the same currency as the functional currency of the revenue producing entity. However, our efforts to minimize these risks may not be successful. If foreign exchange rates were to collectively weaken or strengthen against the dollar by 10%, net earnings would have been reduced or increased, respectively, by approximately $5$3 million as it relates exclusively to foreign currency exchange rate exposures.
Page 4549
Item 8. Financial Statements and Supplementary Data.
| CONSOLIDATED STATEMENTS OF EARNINGS | ||||||||||||
| For the years ended December 31, (In thousands, except per share data) | ||||||||||||
| Net sales | $ | 1,282,155 | $ | 1,130,928 | $ | 955,039 | ||||||
| Cost of sales | 851,076 | 740,416 | 624,536 | |||||||||
| Gross profit | 431,079 | 390,512 | 330,503 | |||||||||
| Research and development costs | (38,841 | ) | (39,681 | ) | (33,825 | ) | ||||||
| Selling expenses | (76,547 | ) | (69,687 | ) | (61,648 | ) | ||||||
| General and administrative expenses | (173,734 | ) | (144,982 | ) | (118,270 | ) | ||||||
| Environmental remediation and administrative expenses | (843 | ) | (818 | ) | (5,285 | ) | ||||||
| (Loss) gain on sale of real estate and fixed assets | (486 | ) | 2,638 | (1,134 | ) | |||||||
| Operating income | 140,628 | 137,982 | 110,341 | |||||||||
| Interest expense | (22,894 | ) | (19,983 | ) | (12,031 | ) | ||||||
| Other (expense) income, net | (112 | ) | 299 | 443 | ||||||||
| Earnings before income taxes | 117,622 | 118,298 | 98,753 | |||||||||
| Provision for income taxes | (37,053 | ) | (43,018 | ) | (33,687 | ) | ||||||
| Net earnings | $ | 80,569 | $ | 75,280 | $ | 65,066 | ||||||
| Net earnings per share: | ||||||||||||
| Basic earnings per share | $ | 1.84 | $ | 1.74 | $ | 1.53 | ||||||
| Diluted earnings per share | $ | 1.82 | $ | 1.72 | $ | 1.51 | ||||||
Shares and per share amounts have been adjusted on a pro forma basis for the April 21, 2006 2-for-1 stock split as further described in Note 1 to the consolidated financial statements.CONSOLIDATED STATEMENTS OF EARNINGS
|
|
|
|
|
|
|
|
|
|
|
For the years ended December 31, (In thousands, except per share data) |
| 2008 |
| 2007 |
| 2006 |
| |||
|
|
|
|
|
|
|
|
|
|
|
Net sales |
| $ | 1,830,140 |
| $ | 1,592,124 |
| $ | 1,282,155 |
|
Cost of sales |
|
| 1,214,061 |
|
| 1,068,500 |
|
| 851,076 |
|
|
|
|
|
|
|
|
|
|
|
|
Gross profit |
|
| 616,079 |
|
| 523,624 |
|
| 431,079 |
|
Research and development costs |
|
| (49,615 | ) |
| (47,929 | ) |
| (38,841 | ) |
Selling expenses |
|
| (107,308 | ) |
| (92,129 | ) |
| (76,547 | ) |
General and administrative expenses |
|
| (262,594 | ) |
| (204,382 | ) |
| (175,063 | ) |
Operating income |
|
| 196,562 |
|
| 179,184 |
|
| 140,628 |
|
Interest expense |
|
| (29,045 | ) |
| (27,382 | ) |
| (22,894 | ) |
Other income (expense), net |
|
| 1,585 |
|
| 2,369 |
|
| (112 | ) |
|
|
|
|
|
|
|
|
|
|
|
Earnings before income taxes |
|
| 169,102 |
|
| 154,171 |
|
| 117,622 |
|
Provision for income taxes |
|
| (59,712 | ) |
| (49,843 | ) |
| (37,053 | ) |
Net earnings |
| $ | 109,390 |
| $ | 104,328 |
| $ | 80,569 |
|
Net earnings per share: |
|
|
|
|
|
|
|
|
|
|
Basic earnings per share |
| $ | 2.45 |
| $ | 2.35 |
| $ | 1.84 |
|
Diluted earnings per share |
| $ | 2.41 |
| $ | 2.32 |
| $ | 1.82 |
|
See notes to consolidated financial statements.
Page 4650
| CONSOLIDATED BALANCE SHEETS | ||||||||
| At December 31, (In thousands) | ||||||||
| Assets: | ||||||||
| Current assets: | ||||||||
| Cash and cash equivalents | $ | 124,517 | $ | 59,021 | ||||
| Receivables, net | 284,774 | 244,689 | ||||||
| Inventories, net | 161,528 | 146,297 | ||||||
| Deferred tax assets, net | 32,485 | 28,844 | ||||||
| Other current assets | 19,341 | 11,615 | ||||||
| Total current assets | 622,645 | 490,466 | ||||||
| Property, plant, and equipment, net | 296,652 | 274,821 | ||||||
| Prepaid pension costs | 92,262 | 76,002 | ||||||
| Goodwill | 411,101 | 388,158 | ||||||
| Other intangible assets, net | 158,080 | 158,267 | ||||||
| Other assets | 11,416 | 12,571 | ||||||
| Total assets | $ | 1,592,156 | $ | 1,400,285 | ||||
| Liabilities: | ||||||||
| Current liabilities: | ||||||||
| Short-term debt | $ | 5,874 | $ | 885 | ||||
| Accounts payable | 96,023 | 80,460 | ||||||
| Accrued expenses | 81,532 | 74,252 | ||||||
| Income taxes payable | 23,003 | 22,855 | ||||||
| Deferred revenue | 57,305 | 21,634 | ||||||
| Other current liabilities | 28,388 | 21,417 | ||||||
| Total current liabilities | 292,125 | 221,503 | ||||||
| Long-term debt | 359,000 | 364,017 | ||||||
| Deferred tax liabilities, net | 57,055 | 53,570 | ||||||
| Accrued pension and other postretirement benefit costs | 71,006 | 74,999 | ||||||
| Long-term portion of environmental reserves | 21,220 | 22,645 | ||||||
| Other liabilities | 29,676 | 25,331 | ||||||
| Total liabilities | 830,082 | 762,065 | ||||||
| Contingencies and Commitments (Notes 10, 13, 15, & 17) | ||||||||
| Stockholders’ Equity: | ||||||||
| Common stock, $1 par value, 100,000,000 shares authorized at December 31, 2006 | ||||||||
| and 2005; 47,533,294 and 25,493,442 shares issued at December 31, 2006 and | ||||||||
| 2005, respectively; outstanding shares were 44,023,410 at December 31, 2006 and | ||||||||
| 21,746,362 at December 31, 2005 | 47,533 | 25,493 | ||||||
| Additional paid-in capital | 69,887 | 59,794 | ||||||
| Retained earnings | 716,030 | 667,892 | ||||||
| Accumulated other comprehensive income | 55,806 | 20,655 | ||||||
| 889,256 | 773,834 | |||||||
| Less: Common treasury stock, at cost (3,509,884 shares at December 31, | ||||||||
| 2006 and 3,747,080 shares at December 31, 2005) | (127,182 | ) | (135,614 | ) | ||||
| Total stockholders’ equity | 762,074 | 638,220 | ||||||
| Total liabilities and stockholders’ equity | $ | 1,592,156 | $ | 1,400,285 | ||||
|
|
|
|
|
|
|
|
At December 31, (In thousands,except share data) |
| 2008 |
| 2007 |
| ||
Assets: |
|
|
|
|
|
|
|
Current assets: |
|
|
|
|
|
|
|
Cash and cash equivalents |
| $ | 60,705 |
| $ | 66,520 |
|
Receivables, net |
|
| 395,659 |
|
| 392,918 |
|
Inventories, net |
|
| 281,508 |
|
| 241,728 |
|
Deferred tax assets, net |
|
| 37,314 |
|
| 30,208 |
|
Other current assets |
|
| 26,833 |
|
| 26,807 |
|
Total current assets |
|
| 802,019 |
|
| 758,181 |
|
|
|
|
|
|
|
|
|
Property, plant, and equipment, net |
|
| 364,032 |
|
| 329,657 |
|
Prepaid pension costs |
|
| — |
|
| 73,947 |
|
Goodwill |
|
| 608,898 |
|
| 570,419 |
|
Other intangible assets, net |
|
| 234,596 |
|
| 240,842 |
|
Deferred tax assets, net |
|
| 23,128 |
|
| 526 |
|
Other assets |
|
| 9,357 |
|
| 11,988 |
|
Total assets |
| $ | 2,042,030 |
| $ | 1,985,560 |
|
|
|
|
|
|
|
|
|
Liabilities: |
|
|
|
|
|
|
|
Current liabilities: |
|
|
|
|
|
|
|
Short-term debt |
| $ | 3,249 |
| $ | 923 |
|
Accounts payable |
|
| 140,954 |
|
| 137,401 |
|
Accrued expenses |
|
| 103,973 |
|
| 103,207 |
|
Income taxes payable |
|
| 8,213 |
|
| 13,260 |
|
Deferred revenue |
|
| 138,753 |
|
| 105,421 |
|
Other current liabilities |
|
| 56,542 |
|
| 38,403 |
|
Total current liabilities |
|
| 451,684 |
|
| 398,615 |
|
Long-term debt |
|
| 513,460 |
|
| 510,981 |
|
Deferred tax liabilities, net |
|
| 26,850 |
|
| 62,416 |
|
Accrued pension and other postretirement benefit costs |
|
| 125,762 |
|
| 39,501 |
|
Long-term portion of environmental reserves |
|
| 20,377 |
|
| 20,856 |
|
Other liabilities |
|
| 37,135 |
|
| 38,406 |
|
Total liabilities |
|
| 1,175,268 |
|
| 1,070,775 |
|
|
|
|
|
|
|
|
|
Contingencies and Commitments (Notes 10, 13, 15, and 17) |
|
|
|
|
|
|
|
Stockholders’ Equity: |
|
|
|
|
|
|
|
| |||||||
Common stock, $1 par value, 100,000,000 shares authorized at December 31, 2008 and 2007; 47,903,187 and 47,714,719 shares issued at December 31, 2008 and 2007, respectively; outstanding shares were 45,064,839 at December 31, 2008 and 44,593,011 at December 31, 2007 |
|
| 47,903 |
|
| 47,715 |
|
Additional paid-in capital |
|
| 94,500 |
|
| 79,550 |
|
Retained earnings |
|
| 899,928 |
|
| 807,413 |
|
Accumulated other comprehensive (loss) income |
|
| (72,551 | ) |
| 93,327 |
|
|
|
| 969,780 |
|
| 1,028,005 |
|
Less: Common treasury stock, at cost (2,838,348 shares at December 31, 2008 and 3,121,708 shares at December 31, 2007) |
|
| (103,018 | ) |
| (113,220 | ) |
Total stockholders’ equity |
|
| 866,762 |
|
| 914,785 |
|
Total liabilities and stockholders’ equity |
| $ | 2,042,030 |
| $ | 1,985,560 |
|
See notes to consolidated financial statements.
Page 4751
| CONSOLIDATED STATEMENTS OF CASH FLOWS | ||||||||||||
| For the years ended December 31, (In thousands) | ||||||||||||
| Cash flows from operating activities: | ||||||||||||
| Net earnings | $ | 80,569 | $ | 75,280 | $ | 65,066 | ||||||
| Adjustments to reconcile net earnings to net cash provided by operating | ||||||||||||
| activities: | ||||||||||||
| Depreciation and amortization | 50,791 | 47,851 | 40,742 | |||||||||
| Net loss (gain) on sales and disposals of real estate and equipment | 486 | (2,638 | ) | 1,134 | ||||||||
| Deferred income taxes | (11,419 | ) | 141 | (3,500 | ) | |||||||
| Stock based compensation | 6,621 | — | — | |||||||||
| Changes in operating assets and liabilities, net of businesses acquired: | ||||||||||||
| Increase in receivables | (20,489 | ) | (21,558 | ) | (39,875 | ) | ||||||
| (Increase) decrease in inventories | (11,245 | ) | (26,908 | ) | 7,578 | |||||||
| (Decrease) increase in progress payments | (7,024 | ) | 9,815 | (4,338 | ) | |||||||
| Increase in accounts payable and accrued expenses | 15,643 | 22,976 | 19,785 | |||||||||
| Increase (decrease) in deferred revenue | 32,647 | (8,049 | ) | 4,849 | ||||||||
| Increase in income taxes payable | 1,207 | 11,266 | 8,403 | |||||||||
| (Increase) decrease in net pension and postretirement assets | 2,982 | (3,813 | ) | 5,054 | ||||||||
| Increase in other current and long-term assets | (2,667 | ) | (912 | ) | (1,830 | ) | ||||||
| Increase in other current and long-term liabilities | 5,769 | 1,727 | 2,279 | |||||||||
| Total adjustments | 63,302 | 29,898 | 40,281 | |||||||||
| Net cash provided by operating activities | 143,871 | 105,178 | 105,347 | |||||||||
| Cash flows from investing activities: | ||||||||||||
| Proceeds from sales and disposals of real estate and equipment | 776 | 11,268 | 1,192 | |||||||||
| Acquisition of intangible assets | (1,664 | ) | (5,086 | ) | (2,100 | ) | ||||||
| Additions to property, plant, and equipment | (40,202 | ) | (42,444 | ) | (32,452 | ) | ||||||
| Acquisition of new businesses, net of cash acquired | (39,522 | ) | (73,111 | ) | (247,402 | ) | ||||||
| Net cash used for investing activities | (80,612 | ) | (109,373 | ) | (280,762 | ) | ||||||
| Cash flows from financing activities: | ||||||||||||
| Borrowings of debt | 240,000 | 655,000 | 624,106 | |||||||||
| Principal payments on debt | (240,058 | ) | (630,327 | ) | (508,025 | ) | ||||||
| Proceeds from exercise of stock options | 8,616 | 8,492 | 7,458 | |||||||||
| Dividends paid | (10,538 | ) | (8,458 | ) | (7,666 | ) | ||||||
| Excess tax benefits from share-based compensation | 1,885 | — | — | |||||||||
| Net cash (used for) provided by financing activities | (95 | ) | 24,707 | 115,873 | ||||||||
| Effect of exchange-rate changes on cash | 2,332 | (2,529 | ) | 1,908 | ||||||||
| Net increase (decrease) in cash and cash equivalents | 65,496 | 17,983 | (57,634 | ) | ||||||||
| Cash and cash equivalents at beginning of year | 59,021 | 41,038 | 98,672 | |||||||||
| Cash and cash equivalents at end of year | $ | 124,517 | $ | 59,021 | $ | 41,038 | ||||||
| Supplemental disclosure of non-cash investing activities: | ||||||||||||
| Fair value of assets acquired from current year acquisitions | $ | 42,417 | $ | 88,578 | $ | 303,041 | ||||||
| Additional consideration on prior year acquisitions | 4,546 | 8,618 | 3,027 | |||||||||
| Fair value of Common stock issued as consideration for acquisitions | — | — | (14,000 | ) | ||||||||
| Liabilities assumed from current year acquisitions | (7,424 | ) | (23,863 | ) | (42,331 | ) | ||||||
| Cash acquired | (17 | ) | (222 | ) | (2,335 | ) | ||||||
| Acquisition of new businesses, net of cash acquired | $ | 39,522 | $ | 73,111 | $ | 247,402 |
CONSOLIDATED STATEMENTS OF CASH FLOWS
|
|
|
|
|
|
|
|
|
|
|
For the years ended December 31, (In thousands) |
|
| 2008 |
|
| 2007 |
|
| 2006 |
|
Cash flows from operating activities: |
|
|
|
|
|
|
|
|
|
|
Net earnings |
| $ | 109,390 |
| $ | 104,328 |
| $ | 80,569 |
|
Adjustments to reconcile net earnings to net cash provided by operating activities: |
|
|
|
|
|
|
|
|
|
|
Depreciation and amortization |
|
| 74,251 |
|
| 62,699 |
|
| 50,791 |
|
Net loss on sales and disposals of long-lived assets |
|
| 804 |
|
| 388 |
|
| 486 |
|
Deferred income taxes |
|
| (6,370 | ) |
| (8,144 | ) |
| (11,419 | ) |
Share-based compensation |
|
| 13,663 |
|
| 10,912 |
|
| 6,621 |
|
Changes in operating assets and liabilities, net of businesses acquired and disposed of : |
|
|
|
|
|
|
|
|
|
|
Increase in receivables |
|
| (20,230 | ) |
| (63,998 | ) |
| (20,489 | ) |
Increase in inventories |
|
| (46,564 | ) |
| (50,290 | ) |
| (11,245 | ) |
Increase (decrease) in progress payments |
|
| 8,227 |
|
| (2,274 | ) |
| (7,024 | ) |
Increase in accounts payable and accrued expenses |
|
| 8,582 |
|
| 31,078 |
|
| 15,643 |
|
Increase in deferred revenue |
|
| 33,332 |
|
| 53,065 |
|
| 32,647 |
|
(Decrease) increase in income taxes payable |
|
| (4,044 | ) |
| (6,020 | ) |
| 1,207 |
|
Increase in net pension and postretirement liabilities |
|
| 11,416 |
|
| 5,540 |
|
| 2,982 |
|
Decrease (increase) in other current and long-term assets |
|
| 2,250 |
|
| (2,668 | ) |
| (2,667 | ) |
(Decrease) increase in other current and long-term liabilities |
|
| (4,886 | ) |
| 4,520 |
|
| 5,769 |
|
Total adjustments |
|
| 70,431 |
|
| 34,808 |
|
| 63,302 |
|
Net cash provided by operating activities |
|
| 179,821 |
|
| 139,136 |
|
| 143,871 |
|
Cash flows from investing activities: |
|
|
|
|
|
|
|
|
|
|
Proceeds from sales and disposals of long-lived assets |
|
| 8,143 |
|
| 174 |
|
| 776 |
|
Acquisitions of intangible assets |
|
| (311 | ) |
| (3,722 | ) |
| (1,664 | ) |
Additions to property, plant, and equipment |
|
| (103,657 | ) |
| (54,433 | ) |
| (40,202 | ) |
Acquisition of new businesses, net of cash acquired |
|
| (48,557 | ) |
| (289,348 | ) |
| (39,522 | ) |
Net cash used for investing activities |
|
| (144,382 | ) |
| (347,329 | ) |
| (80,612 | ) |
Cash flows from financing activities: |
|
|
|
|
|
|
|
|
|
|
Borrowings of debt |
|
| 598,000 |
|
| 751,500 |
|
| 240,000 |
|
Principal payments on debt |
|
| (622,580 | ) |
| (604,560 | ) |
| (240,058 | ) |
Proceeds from exercise of stock options |
|
| 9,905 |
|
| 9,661 |
|
| 8,616 |
|
Dividends paid |
|
| (14,381 | ) |
| (12,440 | ) |
| (10,538 | ) |
Excess tax benefits from share-based compensation |
|
| 1,544 |
|
| 2,590 |
|
| 1,885 |
|
Net cash (used for) provided by financing activities |
|
| (27,512 | ) |
| 146,751 |
|
| (95 | ) |
Effect of exchange-rate changes on cash |
|
| (13,742 | ) |
| 3,445 |
|
| 2,332 |
|
Net (decrease) increase in cash and cash equivalents |
|
| (5,815 | ) |
| (57,997 | ) |
| 65,496 |
|
Cash and cash equivalents at beginning of year |
|
| 66,520 |
|
| 124,517 |
|
| 59,021 |
|
Cash and cash equivalents at end of year |
| $ | 60,705 |
| $ | 66,520 |
| $ | 124,517 |
|
Supplemental disclosure of investing activities: |
|
|
|
|
|
|
|
|
|
|
Fair value of assets acquired from current year acquisitions |
| $ | 133,159 |
| $ | 315,842 |
| $ | 42,417 |
|
Additional consideration (received) paid on prior year acquisitions |
|
| (1,447 | ) |
| 9,433 |
|
| 4,546 |
|
Liabilities assumed from current year acquisitions |
|
| (75,156 | ) |
| (35,706 | ) |
| (7,424 | ) |
Cash acquired |
|
| (7,999 | ) |
| (221 | ) |
| (17 | ) |
Acquisition of new businesses, net of cash acquired |
| $ | 48,557 |
| $ | 289,348 |
| $ | 39,522 |
|
See notes to consolidated financial statements.
Page 4852
| CONSOLIDATED STATEMENTS OF STOCKHOLDERS’ EQUITY | ||||||||||||||||||||||||||||
| Class B | Additional | |||||||||||||||||||||||||||
| Common | Common | Paid in | Retained | Treasury | ||||||||||||||||||||||||
| (In thousands) | Stock | Stock | Capital | Earnings | ||||||||||||||||||||||||
| January 1, 2004 | $ | 16,611 | $ | 8,765 | $ | 52,943 | $ | 543,670 | $ | 22,634 | $ | (165,742 | ) | |||||||||||||||
| Comprehensive income: | ||||||||||||||||||||||||||||
| Net earnings | - | - | - | 65,066 | - | $ | 65,066 | - | ||||||||||||||||||||
| Translation adjustments, net | - | - | - | - | 14,163 | 14,163 | - | |||||||||||||||||||||
| Total comprehensive income | $ | 79,229 | ||||||||||||||||||||||||||
| Dividends paid | - | - | - | (7,666 | ) | - | - | |||||||||||||||||||||
| Stock options exercised, net | - | - | (1,748 | ) | - | - | 11,345 | |||||||||||||||||||||
| Stock issued under employee stock | ||||||||||||||||||||||||||||
| purchase plan, net | 35 | - | 1,358 | - | - | - | ||||||||||||||||||||||
| Equity issued in connection with | ||||||||||||||||||||||||||||
| acquisitions | - | - | 3,259 | - | - | 10,741 | ||||||||||||||||||||||
| Other | - | - | 39 | - | - | 141 | ||||||||||||||||||||||
| December 31, 2004 | $ | 16,646 | $ | 8,765 | $ | 55,851 | $ | 601,070 | $ | 36,797 | $ | (143,515 | ) | |||||||||||||||
| Comprehensive income: | ||||||||||||||||||||||||||||
| Net earnings | - | - | - | 75,280 | - | $ | 75,280 | - | ||||||||||||||||||||
| Translation adjustments, net | - | - | - | - | (16,142 | ) | (16,142 | ) | - | |||||||||||||||||||
| Total comprehensive income | $ | 59,138 | ||||||||||||||||||||||||||
| Dividends paid | - | - | - | (8,458 | ) | - | - | |||||||||||||||||||||
| Stock options exercised, net | - | - | 42 | - | - | 7,721 | ||||||||||||||||||||||
| Stock issued under employee stock | ||||||||||||||||||||||||||||
| purchase plan, net | 82 | - | 3,863 | - | - | - | ||||||||||||||||||||||
| Recapitalization | 8,765 | (8,765 | ) | - | - | - | - | |||||||||||||||||||||
| Other | - | - | 38 | - | - | 180 | ||||||||||||||||||||||
| December 31, 2005 | $ | 25,493 | - | $ | 59,794 | $ | 667,892 | $ | 20,655 | $ | (135,614 | ) | ||||||||||||||||
| Comprehensive income: | ||||||||||||||||||||||||||||
| Net earnings | - | - | - | 80,569 | - | $ | 80,569 | - | ||||||||||||||||||||
| Minimum pension liability | ||||||||||||||||||||||||||||
| adjustment, net | - | - | - | - | (1,750 | ) | (1,750 | ) | - | |||||||||||||||||||
| Translation adjustments, net | - | - | - | - | 22,215 | 22,215 | - | |||||||||||||||||||||
| Total comprehensive income | $ | 101,034 | ||||||||||||||||||||||||||
| Adjustment for initial application of | ||||||||||||||||||||||||||||
| FAS 158, net | - | - | - | - | 14,686 | - | ||||||||||||||||||||||
| Dividends paid | - | - | - | (10,538 | ) | - | - | |||||||||||||||||||||
| Stock options exercised, net | - | - | (1,521 | ) | - | - | 8,021 | |||||||||||||||||||||
| Stock issued under employee stock | ||||||||||||||||||||||||||||
| purchase plan, net | 147 | - | 4,483 | - | - | - | ||||||||||||||||||||||
| Two-for-one common stock split | ||||||||||||||||||||||||||||
| effected in the form of a 100% | 21,893 | - | (21,893 | ) | - | - | ||||||||||||||||||||||
| stock dividend | ||||||||||||||||||||||||||||
| Stock based compensation | - | - | 6,480 | - | - | 141 | ||||||||||||||||||||||
| Other | - | - | 651 | - | - | 270 | ||||||||||||||||||||||
| December 31, 2006 | $ | 47,533 | - | $ | 69,887 | $ | 716,030 | $ | 55,806 | $ | (127,182 | ) | ||||||||||||||||
CONSOLIDATED STATEMENTS OF STOCKHOLDERS’ EQUITY
|
|
|
|
|
|
|
|
|
|
|
|
|
|
|
|
|
|
|
|
(In thousands) |
| Common |
| Additional |
| Retained |
| Accumulated |
| Comprehensive |
| Treasury |
| ||||||
January 1, 2006 |
| $ | 25,493 |
| $ | 59,794 |
| $ | 667,892 |
| $ | 20,655 |
|
|
|
| $ | (135,614 | ) |
Comprehensive income: |
|
|
|
|
|
|
|
|
|
|
|
|
|
|
|
|
|
|
|
|
|
|
|
|
|
|
|
|
|
|
|
|
|
|
|
|
|
|
|
Net earnings |
|
| — |
|
| — |
|
| 80,569 |
|
| — |
| $ | 80,569 |
|
| — |
|
| |||||||||||||||||||
Minimum pension liability adjustment, net |
|
| — |
|
| — |
|
| — |
|
| (1,750 | ) |
| (1,750 | ) |
| — |
|
Foreign currency translation adjustments, net |
|
| — |
|
| — |
|
| — |
|
| 22,215 |
|
| 22,215 |
|
| — |
|
Total comprehensive income |
|
|
|
|
|
|
|
|
|
|
|
|
| $ | 101,034 |
|
|
|
|
Adjustment for initial application of FAS 158, net |
|
| — |
|
| — |
|
| — |
|
| 14,686 |
|
|
|
|
| — |
|
| |||||||||||||||||||
Dividends paid |
|
| — |
|
| — |
|
| (10,538 | ) |
| — |
|
|
|
|
| — |
|
|
|
|
|
|
|
|
|
|
|
|
|
|
|
|
|
|
|
|
|
Stock options exercised, net |
|
| 147 |
|
| 2,962 |
|
| — |
|
| — |
|
|
|
|
| 8,021 |
|
| |||||||||||||||||||
Two-for-one common stock split effected in the form of a 100% stock dividend |
|
| 21,893 |
|
| — |
|
| (21,893 | ) |
| — |
|
|
|
|
| — |
|
| |||||||||||||||||||
Share-based compensation |
|
| — |
|
| 6,480 |
|
| — |
|
| — |
|
|
|
|
| 141 |
|
|
|
|
|
|
|
|
|
|
|
|
|
|
|
|
|
|
|
|
|
Other |
|
| — |
|
| 651 |
|
| — |
|
| — |
|
|
|
|
| 270 |
|
December 31, 2006 |
| $ | 47,533 |
| $ | 69,887 |
| $ | 716,030 |
| $ | 55,806 |
|
|
|
| $ | (127,182 | ) |
Comprehensive income: |
|
|
|
|
|
|
|
|
|
|
|
|
|
|
|
|
|
|
|
Net earnings |
|
| — |
|
| — |
|
| 104,328 |
|
| — |
| $ | 104,328 |
|
| — |
|
Pension and postretirement adjustments, net |
|
| — |
|
| — |
|
| — |
|
| 11,587 |
|
| 11,587 |
|
| — |
|
Foreign currency translation adjustments, net |
|
| — |
|
| — |
|
| — |
|
| 25,934 |
|
| 25,934 |
|
| — |
|
Total comprehensive income |
|
|
|
|
|
|
|
|
|
|
|
|
| $ | 141,849 |
|
|
|
|
Adjustment for initial application of FIN 48, net |
|
| — |
|
| — |
|
| (505 | ) |
| — |
|
|
|
|
| — |
|
|
|
|
|
|
|
|
|
|
|
|
|
|
|
|
|
|
|
|
|
Dividends paid |
|
| — |
|
| — |
|
| (12,440 | ) |
| — |
|
|
|
|
| — |
|
|
|
|
|
|
|
|
|
|
|
|
|
|
|
|
|
|
|
|
|
Stock options exercised, net |
|
| 182 |
|
| 2,198 |
|
| — |
|
| — |
|
|
|
|
| 10,515 |
|
|
|
|
|
|
|
|
|
|
|
|
|
|
|
|
|
|
|
|
|
Share-based compensation |
|
| — |
|
| 7,816 |
|
| — |
|
| — |
|
|
|
|
| 3,096 |
|
|
|
|
|
|
|
|
|
|
|
|
|
|
|
|
|
|
|
|
|
Other |
|
| — |
|
| (351 | ) |
| — |
|
| — |
|
|
|
|
| 351 |
|
December 31, 2007 |
| $ | 47,715 |
| $ | 79,550 |
| $ | 807,413 |
| $ | 93,327 |
|
|
|
| $ | (113,220 | ) |
Comprehensive income: |
|
|
|
|
|
|
|
|
|
|
|
|
|
|
|
|
|
|
|
Net earnings |
|
| — |
|
| — |
|
| 109,390 |
|
| — |
| $ | 109,390 |
|
| — |
|
Pension and postretirement adjustments, net |
|
| — |
|
| — |
|
| — |
|
| (87,313 | ) |
| (87,313 | ) |
| — |
|
Foreign currency translation adjustments, net |
|
| — |
|
| — |
|
| — |
|
| (78,743 | ) |
| (78,743 | ) |
| — |
|
Total comprehensive loss |
|
|
|
|
|
|
|
|
|
|
|
|
| $ | (56,666 | ) |
|
|
|
Adjustment for SFAS No. 158 measurement date change, net |
|
| — |
|
| — |
|
| (2,494 | ) |
| 178 |
|
|
|
|
| — |
|
|
|
|
|
|
|
|
|
|
|
|
|
|
|
|
|
|
|
|
|
Dividends paid |
|
| — |
|
| — |
|
| (14,381 | ) |
| — |
|
|
|
|
| — |
|
|
|
|
|
|
|
|
|
|
|
|
|
|
|
|
|
|
|
|
|
Stock options exercised, net |
|
| 188 |
|
| 6,050 |
|
| — |
|
| — |
|
|
|
|
| 5,439 |
|
|
|
|
|
|
|
|
|
|
|
|
|
|
|
|
|
|
|
|
|
Share-based compensation |
|
| — |
|
| 9,278 |
|
| — |
|
| — |
|
|
|
|
| 4,385 |
|
|
|
|
|
|
|
|
|
|
|
|
|
|
|
|
|
|
|
|
|
Other |
|
| — |
|
| (378 | ) |
| — |
|
| — |
|
|
|
|
| 378 |
|
December 31, 2008 |
| $ | 47,903 |
| $ | 94,500 |
| $ | 899,928 |
| $ | (72,551 | ) |
|
|
| $ | (103,018 | ) |
See notes to consolidated financial statements.
Page 4953
NOTES TO CONSOLIDATED FINANCIAL STATEMENTS
1. SUMMARY OF SIGNIFICANT ACCOUNTING POLICIES
Curtiss-Wright Corporation and its subsidiaries (the “Corporation”) is a diversified multinational manufacturing and service company that designs, manufactures, and overhauls precision components and systems and provides highly engineered products and services to the aerospace, defense, automotive, shipbuilding, processing, oil, petrochemical, agricultural equipment, railroad, power generation, security, and metalworking industries. Operations are conducted through 3561 manufacturing facilities 59and 65 metal treatment service facilities and 2 aerospace component overhaul and repair locations.
A. Principles of Consolidation
The consolidated financial statements include the accounts of Curtiss-Wright and its majority-owned subsidiaries. All materialsignificant intercompany transactions and accounts have been eliminated.
B. Use of Estimates
The financial statements of the Corporation have been prepared in conformity with accounting principles generally accepted in the United States of America, which requires management to make estimates and judgments that affect the reported amount of assets, liabilities, revenue, and expenses and disclosure of contingent assets and liabilities in the accompanying financial statements. The most significant of these estimates includeincludes the estimate of costs to complete long-term contracts under the percentage-of-completion accounting methods, the estimate of useful lives for property, plant, and equipment, cash flow estimates used for testing the recoverability of assets, pension plan and postretirement obligation assumptions, estimates for inventory obsolescence, estimates for the valuation and useful lives of intangible assets, warranty reserves, legal reserves, and the estimate of future environmental costs. Actual results may differ from these estimates.
C. Revenue Recognition
The realization of revenue refers to the timing of its recognition in the accounts of the Corporation and is generally considered realized or realizable and earned when the earnings process is substantially complete and all of the following criteria are met: 1) persuasive evidence of an arrangement exists; 2) delivery has occurred or services have been rendered; 3) the Corporation’s price to its customer is fixed or determinable; and 4) collectibilitycollectability is reasonably assured.
The Corporation records sales and related profits on production and service type contracts as units are shipped and title and risk of loss have transferred or as services are rendered, net of estimated returns and allowances. Sales and estimated profits under certain long-term contracts are recognized under the percentage-of-completion methods of accounting, whereby profits are recorded pro rata, based upon current estimates of direct and indirect costs to complete such contracts. In addition, the Corporation also records sales under certain long-term government fixed price contracts upon achievement of performance milestones as specified in the related contracts. Losses on contracts are provided for in the period in which the losses become determinable. Revisions in profit estimates are reflected on a cumulative basis in the period in which the basis for such revision becomes known. The excess of the billings over cost and estimated earnings on long-term contracts is included in deferred revenue.
D. Cash and Cash Equivalents
Cash equivalents consist of money market funds and commercial paper that are readily convertible into cash, all with original maturity dates of three months or less.
E. Inventory
Inventories are stated at lower of production cost (principally average cost) or market. Production costs are comprised of direct material and labor and applicable manufacturing overhead.
Page 5054
F. Progress Payments
Certain long-term contracts provide for the interim billings as costs are incurred on the respective contracts. Pursuant to contract provisions, agencies of the U.S. Government and other customers are granted title or a secured interest in the unbilled costs included in unbilled receivables and materials and work-in-process included in inventory to the extent of progress payments. Accordingly, these progress payments received have been reported as a reduction of unbilled receivables and inventories, as presented in Notes 3 and 4.
G. Property, Plant, and Equipment
Property, plant, and equipment are carried at cost less accumulated depreciation. Major renewals and betterments are capitalized, while maintenance and repairs that do not improve or extend the life of the asset are expensed in the period they are incurred. Depreciation is computed using the straight-line method based upon the estimated useful lives of the respective assets.
Average useful lives for property, plant, and equipment are as follows:
Buildings and improvements | 5 to 40 years |
Machinery, equipment, and other | 3 to 15 years |
H. Intangible Assets
Intangible assets are generally the result of acquisitions and consist primarily of purchased technology, customer related intangibles, trademarks and service marks, and technology licenses. Definite lived intangible assets are amortized ratably to match their cash flow streamson a straight-line basis over their estimated useful lives, which range from 1 to 20 years, while indefinite lived intangible assets are not amortized. Indefinite lived intangible assets are reviewed for impairment annually based on the discounted future cash flows. See Note 7 for further information on other intangible assets.
I. Impairment of Long-Lived Assets
The Corporation reviews the recoverability of all long-term assets, including the related useful lives, whenever events or changes in circumstances indicate that the carrying amount of a long-lived asset might not be recoverable. If required, the Corporation compares the estimated undiscounted future net cash flows to the related asset’s carrying value to determine whether there has been an impairment. If an asset is considered impaired, the asset is written down to fair value, which is based either on discounted cash flows or appraised values in the period the impairment becomes known. There were no such write-downs in 2006, 2005,2008, 2007, or 2004.2006.
J. Goodwill
Goodwill results from business acquisitions. The Corporation accounts for business acquisitions by allocating the purchase price to tangible and intangible assets and liabilities. Assets acquired and liabilities assumed are recorded at their fair values, and the excess of the purchase price over the amounts allocated is recorded as goodwill. The recoverability of goodwill is subject to an annual impairment test or whenever an event occurs or circumstances change that would more likely than not result in an impairment. The impairment test is based on the estimated fair value of the underlying businesses. Goodwill impairment tests performed as of October 31, 2008, 2007, and 2006 and July 31, 2006 2005, and 2004 concluded that no impairment charges were required as of those dates. See Note 6 for further information on goodwill.
K. Pre Contract Costs
We may, from time to time, incur costs to begin fulfilling the statement of work under a specific anticipated contract that we have yet to obtain from a customer. If we determine that the recoveries of these costs are probable, we capitalize these costs, excluding any start-up costs which are expensed as incurred. When circumstances change and the contract is no longer deemed probable the capitalized costs will be recognized in earnings. There were $1.6 million in capitalized costs that were deemed not probable and recognized into earnings at December 31, 2008. No costs were written off during 2007 and 2006. Capitalized pre contract costs were $5.3 million and $14.3 million at December 31, 2008 and 2007, respectively.
Page 55
L. Fair Value of Financial Instruments
Statement of Financial Accounting Standards (“SFAS”) No. 107,Disclosure About Fair Value of Financial Instruments, requires certain disclosures regarding the fair value of financial instruments. Due to the short maturities of cash and cash equivalents, accounts receivable, accounts payable, and accrued expenses, the net book value of these financial instruments is deemed to approximate fair value.
Page 51
The estimated fair values of the Corporation’s fixed rate debt instruments at December 31, 20062008 aggregated $350.8$314.0 million compared to a carrying value of $349.9$350.0 million. The carrying amount of the variable interest rate debt approximates fair value because the interest rates are reset periodically to reflect current market conditions. Fair values for the Corporation’s fixed rate debt were estimated by management.
The fair values described above may not be indicative of net realizable value or reflective of future fair values. Furthermore, the use of different methodologies to determine the fair value of certain financial instruments could result in a different estimate of fair value at the reporting date.
L.M. Research and Development
The Corporation funds research and development programs for commercial products and independent research and development and bid and proposal work related to government contracts. Development costs include engineering and field support for new customer requirements. Corporation-sponsored research and development costs are expensed as incurred.
Research and development costs associated with customer-sponsored programs are charged to inventory and are recorded in cost of sales when products are delivered or services performed. Funds received under shared development contracts are a reduction of the total development expenditures under the shared contract and are shown net as research and development costs.
M.N. Environmental Costs
The Corporation establishes a reserve for a potential environmental remediation liability on a site by site basis when it concludes that a determination of legal liability is probable and the amount of the liability can be reasonably estimated based on current law and existing technologies. Such amounts, if quantifiable, reflect the Corporation’s estimate of the amount of that liability. If only a range of potential liability can be estimated and no amount within the range is more probable than another, a reserve will be established at the low end of that range. At sites involving multiple parties, the Corporation accrues environmental liabilities based upon its expected share of the liability, taking into account the financial viability of other jointly liable partners. Such reserves, which are reviewed quarterly, are adjusted as assessment and remediation efforts progress or as additional information becomes available. Approximately 75% of the Corporation’s environmental reserves as of December 31, 20062008 represent the current value of anticipated remediation costs and are not discounted primarily due to the uncertainty of timing of expenditures. The remaining environmental reserves are discounted to reflect the time value of money since the amount and timing of cash payments for the liability are reliably determinable. All environmental reserves exclude any potential recovery from insurance carriers or third-party legal actions. See Note 13 for additional information.
N.O. Accounting for Stock-Based CompensationShare-Based Payments
Prior to January 1, 2006, the Corporation applied the intrinsic value method of Accounting Principles Board Opinion No. 25,Accounting for Stock Issued to Employees, and related interpretations in accounting for stock-based employee awards as allowed under SFAS No. 123,Accounting for Stock-Based Compensation (“SFAS 123”). Accordingly, the Corporation did not recognize compensation expense for the issuance of non-qualified share options with an exercise price equal to the market value of the underlying common stock on the date of grant or for options granted under the employee stock purchase plan. As the requisite service period for performance shares, restricted stock units, and performance restricted shares did not begin until after January 1, 2006, no compensation cost was recorded in prior periods. Effective January 1, 2006, the Corporation adopted SFAS No. 123123R (revised 2004),Share-Based Payment (“SFAS 123(R)”) using the modified prospective transition method and therefore has not restated prior periods. Under this transition method, compensation cost associated with employee stock options recognized in 2008, 2007, and 2006 includes compensation expense related to the remaining unvested portion of non-qualified share options granted prior to January 1, 2006. See Note 12 for further information on this standard.
Page 5256
O.P. Capital Stock
On February 7, 2006, the Board of Directors declared a 2-for-1 stock split in the form of a 100% stock dividend. The split, in the form of 1 share of Common stock for each share of Common stock outstanding was payable on April 21, 2006. To effectuate the stock split, the Corporation issued 21.9 million shares of Common stock, at $1.00 par value from capital surplus, with a corresponding reduction in retained earnings of $21.9 million. Accordingly, all references throughout this Annual Report on Form 10-K to number of shares, per share amounts, stock options data, and market prices of the Corporation’s common stock have been adjusted to reflect the effect of the stock split for all periods presented, where applicable.
On May 24, 2005, the Corporation completed a recapitalization that resulted in the combination of the Corporation’s two classes of common stock into a single new class by converting all outstanding shares of Common stock and Class B common stock into a single new class of common stock. The recapitalization was accomplished through a merger of a wholly owned subsidiary into the Corporation, in which the outstanding shares of Common stock and Class B common stock were exchanged for shares of the single class of Common stock. The relative ownership of the Corporation’s new class of Common stock was the same immediately after the merger as it was immediately prior.
In addition to the recapitalization, in May 2005, shareholders approved a proposal to increase the number of shares of Common stock authorized for issuance from 45 million shares to 100 million shares.
The Corporation is authorized to repurchase 900,000 shares under its existing stock repurchase program. Purchases are authorized to be made from time to time in the open market or privately negotiated transactions depending on market and other conditions, whenever management believes that the market price of the stock does not adequately reflect the true value of the Corporation and, therefore, represents an attractive investment opportunity. The shares are held at cost and reissuance is recorded at the weighted-average cost. Through December 31, 2006,2008, the Corporation had repurchased 210,930 shares under this program. There was no stock repurchased during 2008, 2007, and 2006 2005, and 2004.the Corporation does not intend to repurchase any shares during 2009.
P.Q. Earnings Per Share
The Corporation is required to report both basic earnings per share (“EPS”), based on the weighted-average number of Common and Class B shares outstanding, and diluted earnings per share, based on the basic EPS adjusted for all potentially dilutive shares issuable. The calculation of EPS is disclosed in Note 11.
Q.R. Income Taxes
The Corporation applies SFAS No. 109,Accounting for Income Taxes (“SFAS No. 109”). Under the asset and liability method of SFAS No. 109, deferred tax assets and liabilities are recognized for future tax consequences attributable to differences between the financial statement carrying amounts of existing assets and liabilities and their respective tax bases. The effect on deferred tax assets and liabilities of a change in tax laws is recognized in the results of operations in the period the new laws are enacted. A valuation allowance is recorded to reduce the carrying amounts of deferred tax assets unless it is more likely than not that such assets will be realized.
The Corporation will also apply FASB Interpretation No. 48,Accounting for Uncertainty in Income Taxes — an Interpretation of FASB Statement No. 109 (“FIN 48”). FIN 48 provides guidance on the recognition, measurement, accounting, and disclosure of uncertain tax positions. This Interpretation is effective as of January 1, 2007. See Note 9 for additional information on the effect of FIN 48 on the Corporation.
R.S. Foreign Currency Translation
For operations outside the United States of America that prepare financial statements in currencies other than the U.S. dollar, the Corporation translates assets and liabilities at period-end exchange rates and income statement amounts using weighted-average exchange rates for the period. The cumulative effect of translation adjustments is presented as a component of accumulated other comprehensive income within stockholders’ equity. This balance is affected by foreign currency exchange rate fluctuations and by the acquisition of foreign entities. Gains and lossesGains/(losses) from foreign currency transactions are included in results of operations.operations, which amounted to $14.3 million, $(6.5) million, and $(1.0) million for the years ended December 31, 2008, 2007, and 2006, respectively.
Page 53
S.T. Derivatives
The Corporation has used interest rate swapsuses financial instruments, such as forward exchange and forward foreign currency option contracts, to manage its exposure to fluctuations in interest rates onhedge a portion of its fixed rate debt instrumentsexisting and anticipated foreign currency rates at its foreign subsidiaries.denominated transactions. The purpose of the Corporation’s foreign currency contractsrisk management program, which began in 2007, is to reduce volatility in earning caused by exchange rate fluctuations. All of the derivative financial instruments are marked to market with changes in the fair value reported in income in the period of change. In November 2005, the Corporation unwound the interest rate swap agreements. While the interest rate swap agreements were in effect, they were accounted for as fair value hedges. The interest rate swaps were recorded at fair value based upon quoted market prices for comparable instruments, with the gain or loss on the balance sheet within other non-current assets with changes in fair valuethese transactions recorded currently in earnings. Additionally, the carrying amount of the associated debt was adjusted throughinto earnings for changes in fair value due to change in interest rates. Ineffectiveness was to be recognized to the extent that these two adjustments do not offset. The interest rate swap agreements were assumed to be perfectly effective under the “short cut method” of SFAS 133. The differential to be paid or received based on changes in interest rates was recorded as an adjustment to interest expense in the statementperiod in which they occur. These (losses)/gains are classified as general and administrative expenses in the Consolidated Statements of earnings. Additional information on these swap agreements is presented in Note 10.Earnings and amounted to $(19.1) million and $3.4 million for the years ended December 31, 2008 and 2007, respectively. The Corporation does not use derivative financial instruments for trading or speculative purposes.
T.Page 57
U. Recently Issued Accounting Standards
Adoption of New Standards
Effective January 1, 2008, the Corporation adopted Statement of Financial Accounting Standards No. 157,Fair Value Measurements(“SFAS No. 157”). SFAS No. 157 defines fair value, establishes a framework for measuring fair value in generally accepted accounting principles, and expands disclosures about fair value measurements. In February 2006, theaccordance with Financial Accounting Standards Board (“FASB”)Staff Position No. FAS 157-2,Effective Date of FASB Statement No. 157, the Corporation will delay by one year the effective date of SFAS No. 157 to all non-financial assets and non-financial liabilities, except those recognized or disclosed at fair value in the financial statements on a recurring basis (at least annually). SFAS No. 157 enables the reader of the financial statements to assess the inputs used to develop those measurements by establishing a hierarchy for ranking the quality and reliability of the information used to determine fair values. SFAS No. 157 requires that assets and liabilities carried at fair value be classified and disclosed in one of the following three categories:
Level 1: Quoted market prices in active markets for identical assets or liabilities. | |
Level 2: Observable market based inputs or unobservable inputs that are corroborated by market data. | |
Level 3: Unobservable inputs that are not corroborated by market data. |
As of December 31, 2008, the Corporation has valued its derivative instruments in accordance with SFAS No. 157. The fair value of these instruments is ($2.4) million and $0.4 million, these instruments are classified as other current liabilities and other current assets, respectively, at December 31, 2008. The Corporation utilizes the bid ask pricing that is common in the dealer markets. The dealers are ready to transact at these prices using the mid-market pricing convention and the prices therefore are considered to be at fair market value. Based upon the fair value hierarchy, all of our foreign exchange derivative forwards are classified at a Level 2. The adoption of SFAS No. 157 did not have a material impact on the Corporation’s consolidated financial statements. On January 1, 2009, the company will implement the previously deferred provisions of SFAS No. 157 for nonfinancial assets and liabilities recorded at fair value, as required. The Corporation does not anticipate that the adoption of the previously deferred provisions will have a material impact on the Corporation’s results of operations or financial condition.
In September 2006, the FASB issued SFAS No. 155,158,Employers’ Accounting for Certain HybridDefined Benefit and Pension and Other Postretirement Plans(“SFAS No. 158”). The initial provisions of SFAS No. 158 were adopted for Fiscal Year ended December 31, 2006. On January 1, 2008, the Corporation adopted the measurement date provisions of SFAS No. 158, which is a requirement to measure plan assets and benefit obligations as of the date of the employer’s fiscal year-end statement of financial position. The Corporation has elected to utilize the second approach as provided in SFAS No.158 in implementing this provision. This approach allows an employer to use earlier measurements determined for prior year-end reporting to allocate a proportionate amount of net benefit expense for the transition period. The net transition amount was recorded as a charge to beginning retained earnings of $2.5 million, net of tax. See Note 14 for additional information on the effect of SFAS No. 158 on the Corporation.
In February 2007, the FASB issued SFAS No. 159,The Fair Value Option for Financial Instruments —Assets and Financial Liabilities-Including an amendment of FASB StatementsStatement No. 133 and 140115(“ (“SFAS No. 155”159”). SFAS No. 155159 permits aentities to choose to measure eligible items at fair value remeasurementat specified election dates and report unrealized gains and losses on items for which the fair value option has been elected in earnings at each subsequent reporting date. SFAS No. 159 became effective for the Corporation as of January 1, 2008; however, the Corporation did not elect to measure any hybridadditional financial instrumentinstruments at fair value as a result of this statement. Therefore, the adoption of SFAS No. 159 did not have an effect on the Corporation’s consolidated financial statements.
In May 2008, the FASB issued SFAS No. 162,The Hierarchy of Generally Accepted Accounting Principles (“SFAS No. 162”). SFAS No. 162 identifies the sources of accounting principles and the framework for selecting the principles to be used in the preparation of financial statements of nongovernmental entities that contains an embedded derivative that would otherwise require bifurcation. Thisare presented in conformity with generally accepted accounting standardprinciples. SFAS No. 162 is effective 60 days following the Securities and Exchange Commission’s approval of the Public Company Accounting Oversight Board Auditing amendments to AU Section 411, The Meaning of Present Fairly in Conformity with Generally Accepted Accounting Principles. The adoption of this statement did not have a material impact on the Corporation’s results of operations or financial condition.
Page 58
Standards Issued But Not Yet Effective
In December 2007, the FASB issued Statement of Financial Accounting Standards No. 141(Revised 2007),Business Combinations (“SFAS No. 141(R)”). SFAS No. 141(R) will change the accounting treatment for certain specific items, including, but not limited to: acquisition costs will be generally expensed as incurred; noncontrolling interests will be valued at fair value at the acquisition date; acquired contingent liabilities will be recorded at fair value at the acquisition date and subsequently measured at either the higher of such amount or the amount determined under existing guidance for non-acquired contingencies; in-process research and development will be recorded at fair value as an indefinite-lived intangible asset at the acquisition date; restructuring costs associated with a business combination will be generally expensed subsequent to the acquisition date; and changes in deferred tax asset valuation allowances and income tax uncertainties after the acquisition date generally will affect income tax expense. SFAS No. 141(R) also includes several new disclosure requirements. SFAS No. 141(R) applies prospectively to business combinations for which the acquisition date was on or after the beginning of the first annual reporting period beginning on or after December 15, 2008, as well as recognizing adjustments to uncertain tax positions through earnings on all acquisitions regardless of the acquisition date. The impact that the adoption of this statement will have on the Corporation’s results of operations or financial condition will depend on future acquisitions.
In December 2007, the FASB issued SFAS No. 160,Noncontrolling Interests in Consolidated Financial Statements, an amendment to ARB No. 51 (SFAS No. 160). SFAS No. 160 amends the accounting and reporting for noncontrolling interests in a consolidated subsidiary and the deconsolidation of a subsidiary. Included in this statement is the requirement that noncontrolling interests be reported in the equity section of the balance sheet. SFAS No. 160 is effective for fiscal years, and interim periods within those fiscal years, beginning on or after September 15, 2006.December 31, 2008. Earlier adoption is prohibited. The Corporation does not anticipate that the adoption of this statement will have a material impact on the Corporation’s results of operationoperations or financial condition.
In March 2006,2008, the FASB issued the SFASStatement No. 156,Accounting for Servicing of Financial Assets,161, Disclosure about Derivative Instruments and Hedging Activities, an amendment of FASB StatementsStatement No. 140133 (“SFAS No. 156”161”). SFAS No. 156161 requires that servicing assetsdisclosures of how and servicing liabilitieswhy an entity uses derivative instruments, how derivative instruments and related hedged items are accounted for, and how derivative instruments and related hedged items affect an entity’s financial position, financial performance, and cash flows. SFAS No. 161 will be recognized at fair value, if practicable, when the Corporation enters into a servicing agreement and allows two alternatives, the amortization and fair value measurement methods, as subsequent measurement methods. This accounting standard is effective for all new transactions occurring asfinancial statements issued in 2009, with early adoption permitted. The adoption of this statement will not have an impact on the Corporation’s results of operations or financial condition.
In April 2008, the FASB issued FASB Staff Position (“FSP”) No. 142-3,Determination of the beginningUseful Life of the Intangible Assets(“FSP 142-3”). FSP 142-3 amend the factors an entity should consider in developing renewal or extension assumptions used in determining the useful life of recognized intangible assets under FASB Statement No. 142,Goodwill and Other Intangible Assets. This new guidance applies prospectively to intangible assets that are acquired individually or with a group of other assets in business combinations and asset acquisitions. FSP 142-3 was effective for financial statements issued for fiscal years and interim periods beginning after SeptemberDecember 15, 2006.2008. Early adoption is prohibited. The Corporation does not anticipate that the adoption of this statement will have a material impact on the Corporation’s results of operationoperations or financial condition.
In June 2006,December 2008, the FASB issued FIN 48 to create a single model to address accounting for uncertainty in tax positions. FIN 48 clarifies the accounting for income taxes by prescribing a minimum recognition threshold a tax position is required to meet before being recognized in the financial statements. FIN 48 also provides guidance on derecognition, measurement, classification, interest and penalties, accounting in interim periods, disclosure, and transition. FIN 48 is effective for fiscal years beginning after December 15, 2006. The Corporation will adopt FIN 48 as of January 1, 2007, as required. The cumulative effect of adopting FIN 48 will be recorded in retained earnings and other accounts as applicable. The Corporation is evaluating its tax positions and anticipates that the adoption of FIN 48 will not have a significant impact on its results of operations.
In September 2006, theFSP 132(R)-1,Employers’ Disclosures about Postretirement Benefit Plan Assets(“FSP 132(R)-1”), amending FASB issued SFASStatement No. 158,132(R),Employers’ Accounting for Defined Benefit PensionDisclosures about Pensions and Other Postretirement PlansBenefits (“SFAS No. 158”). This Statement requires companies to recognize a net liability or asset to report the funded status of their defined benefit pension and other postretirement benefit plans (“the Plans”). The recognition of a net asset or liability will require an offsetting adjustment to accumulated other comprehensive income (“AOCI”) in shareholders’ equity. SFAS No. 158 will not change how the Plans are accounted for and reported in the income statement. Therefore, the amounts to be recognized in AOCI will be the unrecognized gains/losses, prior service costs/credits, and transition assets/obligations, which will continue to be amortized under the existing guidance as net periodic pension cost in the income statement. Companies are required to initially recognize the funded status and provide the required disclosures beginning for fiscal year ends after December 15, 2006. The net impact on the December 31, 2006 balance sheet is to increase prepaid pension costs by $21.1 million, increase other current liabilities $2.3 million, reduce accrued pension and postretirement benefit costs by $4.9 million, increase deferred tax liabilities by $9.0 million, with the offset increasing stockholders’ equity by $14.7 million. Additionally,, effective for fiscal years ending after December 15, 2008, SFAS 158 will require companies2009. FSP 132(R)-1 requires an employer to measure thedisclose investment policies and strategies, categories, fair value measurements, and significant concentration risk among its postretirement benefit plan assets and obligations as of the date of the employer’s fiscal year end. However, earlier adoption of the
Page 54
measurement date provisions is encouraged. The Corporation currently utilizes measurement dates of September 30 and October 31 for its various Plans.assets. The Corporation does not anticipate that the change in the fiscal year end measurement date toadoption of this statement will have a material impact on the Corporation’s results of operationoperations or financial condition. See Note 14
V. Correction of Immaterial Error Related to Prior Periods
In the second quarter of 2007, the Corporation recorded an adjustment of $2.8 million to increase its loss reserve associated with certain long-term contracts within the Flow Control segment. The Corporation determined that certain loss contracts were not fully accrued for additional informationin the fourth quarter of 2006. This error resulted in an understatement of approximately $2.8 million in our loss reserves, which are classified in other current liabilities, and cost of goods sold at December 31, 2006.
Page 59
The Corporation reviewed the impact of this error on prior periods in accordance with Statement of Financial Accounting Standards No. 154,Accounting for Changes and Error Corrections, Staff Accounting Bulletin (“SAB”) No. 99, Materiality, and SAB No. 108, Considering the effectEffects of FAS 158 onPrior Year Misstatements when Quantifying Misstatements in current Year Financial Statements, and determined that the Corporation.adjustment was not material to the Corporation’s financial statements for the year ended December 31, 2007 and 2006.
2. ACQUISITIONS AND DISPOSITION OF LONG LIVED ASSET
The Corporation acquired threefour businesses in 2006, as described below. In addition, the Corporation purchasedand disposed of one business in 2005 and eleven businesses in 2004. The 2006 and 2005 acquisitions, as well as nine2008. Three of the 2004 acquisitions,acquired businesses and the disposition are described in more detail below. The remaining two businesses acquired in 2004acquisition had an aggregatea purchase price of $1.1$2.4 million and was purchased by our Motion Control segment. The Corporation also acquired four businesses in 2007 and three businesses in 2006, all of which are not considered material.described in more detail below. All acquisitions have been accounted for as purchases with the excess of the purchase price over the estimated fair value of the net tangible and intangible assets acquired recorded as goodwill. The Corporation makes preliminary estimates of the purchase price allocations, including the value of identifiable intangibles with a finite life, and records amortization based upon the estimated useful life of those intangible assets identified. The Corporation will adjust these estimates based upon analysisinput of third party appraisals, when deemed appropriate, and the determination of fair value, when finalized, generally withinno later than twelve months from acquisition.the acquisition date.
The results of eachthe acquired businessbusinesses have been included in the consolidated financial results of the Corporation from the date of acquisition in the segment indicated as follows:
FLOW CONTROL
Benshaw, Inc.
On July 31, 2007 the Corporation acquired all the issued and outstanding stock of Benshaw, Inc. (“Benshaw”). The purchase price of the acquisition, subject to customary adjustments as provided for in the Stock Purchase Agreement, was for approximately $102.6 million in cash. Under the terms of the Stock Purchase Agreement, the Corporation deposited $7.9 million into escrow as security for potential indemnification claims against the seller. Any amount of holdback remaining after the claims for indemnification have been settled, will be paid as follows: (i) an initial release of one-half of the holdback less amounts held in reserve to cover pending claims for indemnification in 12 months after the closing date and (ii) a final release of the remaining balance of the holdback less amounts held in reserve to cover pending claims for indemnification in 18 months after the closing date. A claim has been made against the full escrow balance pending satisfactory resolution of preacquisition tax liabilities of the seller. Furthermore, the Corporation had deposited an additional $2.5 million into escrow in consideration for the potential receipt of a material sales order within calendar year 2007. This sales order was not received, and the amount in escrow was returned to the Corporation in 2008 as a reduction of purchase price. Management funded the acquisition from the Corporation’s revolving credit facility.
The purchase price of the acquisition has been allocated to the net tangible and intangible assets acquired, with the remainder recorded as goodwill, on the basis of estimated fair values as of December 31, 2008, as follows:
|
|
|
|
|
|
|
|
|
|
(In thousands) |
|
|
|
|
Accounts receivable |
| $ | 16,055 |
|
Inventory |
|
| 13,290 |
|
Property, plant, and equipment |
|
| 7,750 |
|
Other current assets |
|
| 439 |
|
Intangible assets |
|
| 36,647 |
|
Current and non-current liabilities |
|
| (11,859 | ) |
Net tangible and intangible assets |
|
| 62,322 |
|
Purchase price, including capitalized acquisition costs |
|
| 102,698 |
|
Goodwill |
| $ | 40,376 |
|
The excess of the purchase price over the fair value of the net assets acquired is $40.0 million at December 31, 2008, including foreign currency translation adjustment losses of $0.4 million. The Corporation has determined that the goodwill allocated to the U.S. entities of $37.1 million will be tax deductible.
Page 60
Benshaw designs, develops, and manufactures mission critical motor control and protection product solutions for leading OEMs and industrial customers. Benshaw provides turnkey motor and machine control and protection solutions for OEM customers. Benshaw is headquartered in Pittsburgh, Pennsylvania and has nine facilities in the United States and two in Canada. Revenues of the acquired business were $82.0 million for the year ended December 31, 2006.
Valve Systems and Controls
On June 1, 2007, the Corporation acquired certain assets and certain liabilities of Valve Systems and Controls, L.P. (“VSC”). The purchase price of the acquisition, subject to customary adjustments as provided for in the Asset Purchase Agreement, was $78.0 million in cash and the assumption of certain liabilities of VSC. Under the terms of the Asset Purchase Agreement, the Corporation deposited $3.8 million into escrow as security for potential indemnification claims against the seller. Any amount of holdback remaining after the claims for the indemnification have been settled less amounts held in reserve to cover pending claims for indemnification would be paid in 12 months after the closing date. Since no claims were made the funds held in escrow were released to the seller. Management funded the purchase from the Corporation’s available cash and revolving credit facility.
The purchase price of the acquisition has been allocated to the net tangible and intangible assets acquired, with the remainder recorded as goodwill, on the basis of estimated fair values. The excess of the purchase price over the fair value of the net assets acquired is $52.1 million at December 31, 2008. The Corporation has determined that the goodwill will be tax deductible.
VSC, is a provider of critical valve, automation, and controls solutions for all facets of flow control operations to the oil and gas market. VSC is headquartered in Houston, Texas, with satellite offices in Baton Rouge, Louisiana and Seoul, South Korea. Incremental revenues of the acquired business were approximately $40.0 million for the year ended December 31, 2006.
Scientech, LLC
On May 8, 2007, the Corporation acquired certain assets and certain liabilities of Scientech, LLC (“Scientech”). The purchase price of the acquisition, subject to customary adjustments as provided for in the Asset Purchase Agreement, was $62.1 million in cash and the assumption of certain liabilities of Scientech. Under the terms of the Asset Purchase Agreement, the Corporation deposited $5.8 million into escrow as security for potential indemnification claims against the seller. Any amount of holdback remaining after the claims for indemnification have been settled will be paid as follows: (i) an initial release of one-half of the holdback less amounts held in reserve to cover pending claims for indemnification in 12 months after the closing date and (ii) a final release of the remaining balance of the holdback less amounts held in reserve to cover pending claims for indemnification in 18 months after the closing date. Since no claims were made within the initial 12 month holdback period, one-half of the holdback was released to the seller. However, a claim has been made prior to the expiration of the 18 month holdback period against the remaining full amount of the holdback pending satisfactory resolution of such claim with the seller. Management funded the purchase from the Corporation’s available cash and revolving credit facility.
The purchase price of the acquisition has been allocated to the net tangible and intangible assets acquired, with the remainder recorded as goodwill, on the basis of fair values. The estimated excess of the purchase price over the fair value of the net assets acquired is $31.1 million at December 31, 2008. The Corporation has determined that $30.9 million of the goodwill will be tax deductible.
Scientech is a global provider of commercial nuclear power instrumentation, electrical components, specialty hardware, process control systems, and proprietary database solutions which are aimed at improving safety and plant performance, efficiency, reliability, and reducing costs. Scientech is headquartered in Idaho Falls, Idaho and has multiple facilities throughout the United States. Revenues of the acquired business were $45.7 million for the year ended December 31, 2006.
Techswan, Inc.
On September 1, 2006, the Corporation acquired certain assets and liabilities of Techswan, Inc., which business is now operated as Swantech (Swantech).Swantech. The purchase price, subject to customary adjustments provided for in the Asset Purchase Agreement, was $3.6 million in cash and the assumption of certain liabilities to acquire the intellectual
Page 61
property and assets of Swantech. The purchase price was funded from credit available under the Corporation’s revolving credit line.facility. The excess of the purchase price over the fair value of the net assets acquired is $2.9$3.2 million at December 31, 2006. Revenues of the purchased business were $1.1 million for the year ended December 31, 2005.2008.
Swantech is a designer and manufacturer of highly advanced health monitoring and prognostics systems and software for critical servicecritical-service machinery. Swantech is the technology leader in state-of-the-art stress wave analysis based prognostics systems, with the capability to predict critical machinery failure far in advance of conventional vibration and temperature based monitoring systems. The core technology is fully developed, and Swantech is building its applications’ base and channels to market in the commercial maritime, power, oil and gas, and defense and aerospace markets. Swantech has significant and growing penetration in monitoring luxury cruise liner critical systems. Swantech is located in Ft. Lauderdale, Florida.
Enpro Systems, Ltd.
On April 17, 2006, the Corporation acquired certain assets and liabilities of Enpro Systems, Ltd. (Enpro)(“Enpro”), which has subsequently been merged with Tapco International. The combined business operates as TapcoEnpro International. The purchase price, subject to customary adjustments provided for in the Asset Purchase Agreement, was $17.5 million in cash and the assumption of certain liabilities to acquire the assets of Enpro. The purchase price was funded from credit available under the Corporation’s revolving credit line. The excess of the purchase price over the fair value of the net assets acquired is $6.0$6.6 million at December 31, 2006. Revenues of the purchased business were $35.9 million for the year ended December 31, 2005.2008.
Enpro is a designer and manufacturer of highly engineered sliding gate, plug, block, butterfly, diverter, and variable orifice flue gas valves. Enpro also manufactures, repairs, and modifies ASME code pressure vessels, primarily for the petrochemical, refining, and utility markets. Enpro provides engineering services, subcontract manufacturing services, shop repairs, and field services to support customers’ operations. Enpro is headquartered in Channelview, Texas.
Page 55MOTION CONTROL
Engineered Pump DivisionVMETRO ASA
On November 10, 2004,October 15, 2008, the Corporation acquired certain assets and liabilitiescompleted a voluntary cash tender offer for all of the Government Marine Business Unit divisionissued and outstanding capital stock of Flowserve Corporation, subsequently renamed the Engineered Pump DivisionVMETRO ASA (“EPD”VMETRO”). at Norwegian Kroner (“NOK”) 12.06 per share. The effective datepurchase price of the acquisition was November 1, 2004. The purchase price, subject to customary adjustments provided for in the Asset Purchase Agreement, was $28.1NOK 292.3 million ($46.3 million) in cash and the assumption of certain liabilities. The purchase price wasNOK 148 million ($23.5 million) of net debt. Management funded the acquisition from credit available under the Corporation’s revolving credit facilities.facility. VMETRO will become part of the Corporation’s Motion Control segment within the Embedded Computing division. Revenues of the purchased business were 307 million NOK ($52.5 million) for the period ended December 31, 2007.
The purchase price of the acquisition has been preliminarily allocated to the net tangible and intangible assets acquired, with the remainder recorded as goodwill, on the basis of estimated fair values. The excess of the purchase price over the fair value of the net assets acquired is $8.0NOK 344 million ($54.5 million) at December 31, 2006. Revenues2008. The goodwill is not deductible for tax purposes.
As part of the purchased business were $26.4acquired liabilities of VMETRO, we have established a $7.1 million restructuring accrual as of the acquisition date for costs to exit the year ended December 31, 2003.activities of certain facilities, including lease cancellation costs and external legal and consulting fees, as well as severance and relocation costs for certain employees of the acquired business. The major activities of these closed facilities will be integrated into our other existing embedded computing facilities. Employees identified for involuntary termination consist of engineers, sales personnel, and administrative and executive staff. The exit activities are scheduled to be completed by the third quarter of 2009. See Note 8 for further financial information regarding this restructuring accrual.
EPDFounded in 1986, VMETRO is a leading designer and manufacturer of highly engineered, critical function pumps for the U.S. Navy nuclear submarine and aircraft carrier programs and non-nuclear surface ships. EPD is the sole source supplier of maincommercial off-the-shelf (“COTS”) board and auxiliary seawater, fresh water,system-level embedded computing products for applications in aerospace, defense, industrial, communication, and cooling pumps, coolant purification pumps, injection, chilled water,medical markets. Key products provide real-time computing capabilities, high-density radar processing, data recording, and othernetwork storage systems. Application of these products as components or subsystems enables improved response time and critical pumps. The business supports nuclear programs,protection in server and non-nuclear naval surface programs. In addition, EPD has a strongstorage appliances, utility mapping, and growing aftermarket business for repairs, refurbishments,ground penetrating radar.
Page 62
VMETRO operates globally with its headquarters and parts. EPD’s operations areprincipal engineering located in Phillipsburg, New Jersey.Oslo, Norway. Additional sales, engineering, and distribution networks are established in Sweden, Germany, France, Italy, the United States, United Kingdom, and Singapore.
GroquipMechetronics Holdings Limited
On July 12, 2004,October 1, 2008, the Corporation acquired all of the issued and outstanding capital stock of Groth Equipment Corporation of LouisianaMechetronics Holding Ltd. and all subsidiaries (“Groquip”Mechetronics”). The purchase price of the acquisition, subject to customary adjustments provided for in the Stock Purchase Agreement, was $4.5£1.3 million payable($2.3 million) in approximately 18,000 shares of the Corporation’s restricted Common stock valued at $1.0 million, cash of $3.5 million, and the assumption of certain liabilities. Under the terms of the Stock Purchase Agreement, the Corporation deposited £0.2 million ($0.4 million) into escrow as security for potential indemnification claims against the seller. Any amount of the holdback remaining after the claims for the indemnification have been settled less amounts held in reserve to cover pending claims for indemnification will be paid 14 months after the closing date. Management funded the acquisition from the Corporation’s available cash. The cash portionbusiness will become a part of the Corporation’s Motion Control segment within the Integrated Sensing division. Revenues of the purchased business were approximately £5.0 million ($10.0 million) for the period ended July 31, 2008.
The purchase price of the acquisition has been preliminarily allocated to the net tangible and intangible assets acquired, with the remainder recorded as goodwill, on the basis of estimated fair values. The excess of the purchase price was funded from credit available under the Corporation’s revolving credit facilities. The purchase price approximatedover the fair value of the net assets acquired as ofis £2.3 million ($4.0 million) at December 31, 2006.2008. The goodwill is not deductible for tax purposes.
GroquipMechetronics is a market leaderglobal supplier of solenoids and solenoid valves to original equipment manufacturers (OEMs). A solenoid is an electromagnetic actuator used as a mechanical switch or integrated with a valve to provide control in the hydrocarbon and chemical processing industries. Groquip providespneumatic or hydraulic systems. The Mechetronics products and services for various pressure-related processes that ensure safe operation and regulatory compliance. Groquip is a manufacturer's sales representative for rupture discs, conservation vents, fire and gas detectors, and pressure relief valves. They also provide field and in-shop service and repairs for pressure relief valves andare used in a variety of specialty valves. Groquipapplications including business machines, switchgear and vehicle braking systems.
Mechetronics was founded in 1918 and is a leading solenoid supplier in the United Kingdom. Operations are headquartered in a 27,000 square-foot facility in Bishop Auckland, United Kingdom, and include a new production facility opened in Zhuhai, China in 2007.
Curtiss-Wright Accessory Services
On May 9, 2008, the Corporation sold its third-party commercial aerospace repair and overhaul business located in Miami, Florida for $8.0 million. The determination was made to divest the business because third-party repair work was not considered a core business of the Corporation. This business was part of our Motion Control segment and contributed $18.5 million in sales and $1.8 million in pretax income for the year ended December 31, 2007. On the date of sale, the business had assets of $8.7 million and liabilities of $1.1 million, which combined with transaction costs of $0.7 million, resulted in a $0.3 million loss, which is classified as a reduction of Other Income, net on the Condensed Consolidated Statements of Earnings. The Corporation did not report the disposal as discontinued operations as the amounts are not considered significant. On March 31, 2008, the Corporation performed a goodwill impairment test of the portion of the reporting unit that will be retained and concluded that no impairment charges were required.
IMC Magnetics Corporation
On September 1, 2007, the Corporation acquired all the issued and outstanding stock of IMC Magnetics Corporation (“IMC”). The purchase price of the acquisition, subject to customary adjustments as provided for in the Stock Purchase Agreement, was for approximately $37.5 million in cash. Under the terms of the Stock Purchase Agreement, the Corporation deposited $3.8 million into escrow as security for potential indemnification claims against the seller. Any amount of holdback remaining after the claims for indemnification have been settled, will be paid as follows: (i) an initial release of $0.5 million less amounts held in reserve to cover pending claims for indemnification in 12 months after the closing date and (ii) a final release of the remaining balance of the holdback less amounts held in reserve to cover pending claims for indemnification in 24 months after the closing date. However, a claim has been made prior to the expiration of the 18 month holdback period against the remaining full amount of the holdback pending satisfactory resolution of such claim with the seller. Management funded the acquisition from the Corporation’s revolving credit facility.
Page 63
The purchase price of the acquisition has been allocated to the net tangible and intangible assets acquired, with the remainder recorded as goodwill, on the basis of estimated fair values. The excess of the purchase price over the fair value of the net assets acquired is $17.6 million at December 31, 2008. The goodwill is not deductible for tax purposes.
IMC produces solenoids, fans, motors, and specialized products for numerous aerospace, commercial, and industrial applications. IMC’s products are used by leading original equipment manufacturers (OEMs) in a variety of applications such as fuel control systems, engine bleed, landing gear, wheel brake systems, and aircraft hydraulic directional controls. IMC is headquartered in Geismar, LouisianaTempe, Arizona and has a sales and service center locatedproduction facility in Sulphur, Louisiana.Nogales, Mexico. Revenues of the acquired business were $10.1$14.4 million for the twelve monthsyear ended June 30, 2004.December 31, 2006.
NOVAMETAL TREATMENT
Parylene Coating Services
On May 24, 2004,September 4, 2008, the Corporation acquired certain assets and certain liabilities of NOVA Machine Products CorporationParylene Coating Services, Inc. (“NOVA”PCS”). The purchase price of the acquisition, subject to customary adjustments as provided for in the Asset Purchase Agreement (“APA”), was $20.0$7.6 million in cash and the assumption of certain liabilities. Theliabilities of PCS. Under the terms of the APA, the Corporation held back 10% of the sale price as security for potential indemnification claims against the seller. Any amount of the holdback remaining after the claims for the indemnification have been settled less amounts held in reserve to cover pending claims for indemnification will be paid in eighteen months after the closing date. Management funded the purchase price was funded from credit available under the Corporation’s revolving credit facilities. There are provisions infacility.
The purchase price of the agreement for additional payments uponacquisition has been preliminarily allocated to the achievementnet tangible and intangible assets acquired with the remainder recorded as goodwill on the basis of certain financial performance criteria through 2009 up to a maximum additional payment of $9.2 million. Through December 31, 2006, the Corporation has made no payments of additional consideration under these provisions.estimated fair values. The estimated excess of the purchase price over the fair value of the net assets acquired is $5.0 million at December 31, 2006.
NOVA is one of2008. The Corporation has estimated that the largest suppliers of safety-related fasteners to the U.S. nuclear power industrygoodwill will be tax deductible and the DepartmentCorporation will adjust these estimates based upon final input of Energythird party appraisals.
PCS applies parylene coatings primarily for the medical device industry. PCS applies parylene coatings to medical devices, including coronary artery stents, rubber/silicone seals, and wire forming mandrels used in the manufacture of catheters. The conformal coating provides lubricity; resistance to solvents, radiation, and bacteria; and is also provides a wide range of manufacturedbiocompatible. In addition to medical applications, parylene coatings are uniquely suited for use in niche electronic, oil and distributed productsgas, and related services. NOVAgeneral industrial applications. PCS is headquartered and operates one facility in Middleburg Heights, Ohio, with distribution centers in Glendale Heights, Illinois, and Decatur, Alabama, and five sales offices throughout the U.S.Katy, Texas. Revenues of the acquired business were $17.1$2.6 million for the year ended December 31, 2003.2007.
On September 1, 2005, NOVA acquired the HydraNut product line and related intellectual property of Technofast International, a wholly owned subsidiary of Tech Novus Pty. Ltd of Brisbane, Australia (“Technofast”). The acquisition of this product line replaced a licensing agreement between NOVA and Technofast, which was part of the acquired assets of the Corporation’s acquisition of NOVA in 2004.
The purchase price of $8.0 million included an initial cash payment of $4.5 million and will require quarterly cash payments calculated as a percentage of sales of the product line, not to exceed $3.5 million over an eight year period. Any remaining purchase price unpaid at the end of eight years will expire unpaid. The Corporation estimates this liability will be paid down within five years.
Page 56
The acquisition of this technology was accounted for as an acquisition of intangible assets. As such, the Corporation has estimated the fair value of the future payments as of September 1, 2005, to be $3.0 million and has recorded a liability. As of December 31, 2006, the remaining balance on the liability, including accrued interest, was $2.6 million. The intangible asset was capitalized as technology in the amount of $7.5 million and will be amortized over its 20 year useful life.
The HydraNut fastener provides simple and accurate tensioning in safety risk situations and hard to access areas for customers in nuclear power generation, industrial, and other energy markets.
Trentec
On May 24, 2004, the Corporation acquired certain assets of Trentec, Inc. (“Trentec”). The purchase price, subject to customary adjustments provided for in the Asset Purchase Agreement, was $13.9 million, payable in approximately 280,000 shares of the Corporation’s restricted Common stock valued at $13.0 million, cash of $0.9 million, and the assumption of certain liabilities. The excess of the purchase price over the fair value of the net assets acquired is $5.3 million at December 31, 2006.
In August 2005, the Corporation completed negotiations with the sellers of Trentec regarding a post-closing dispute. The settlement resulted in $0.9 million of recovery, which is included in operating income for 2005, and $0.1 million of additional consideration paid under the working capital adjustment, which increased the purchase price of the acquired business. The effect of the settlement was treated as a non-cash transaction for purposes of preparing the statement of cash flows as the net settlement of $0.8 million was effectuated through the forfeiture of the cash holdback in the same amount.
Trentec's services include specialty equipment fabrication, diamond wiresaw cutting, nuclear power plant equipment qualification, and third-party dedication and supply of nuclear components. Trentec’s operations are located in Cincinnati, Ohio. Revenues of the acquired business were $13.5 million for the year ended December 31, 2003.
MOTION CONTROLIndal Technologies, Inc.
On March 1, 2005, the Corporation acquired the outstanding stock of the parent corporation of Indal Technologies, Inc. (“Indal”). The purchase price was 80.3 million Canadian dollars ($64.7 million) in cash and was funded from credit available under the Corporation’s revolving credit facilities. The estimated excess of the purchase price over the fair value of the net assets acquired is $27.2 million at December 31, 2006, including foreign currency translation adjustment gains of $1.7 million.
Indal provides shipboard helicopter handling systems for naval applications with a global installed base on over 200 ships, including more than 100 systems deployed in the U.S. Navy. Indal's highly engineered, proprietary products enable helicopters to land aboard naval vessels in rough sea conditions. Indal also designs and manufactures specialized telescopic hangars that provide protection for helicopters aboard ships and cable handling systems for naval sonar applications. Indal is headquartered in Mississauga, Ontario, Canada. Revenues of the acquired business were 49.4 million Canadian dollars ($38.2 million) for the year ended December 31, 2004.
Synergy
On August 31, 2004, the Corporation acquired the outstanding stock of Synergy Microsystems, Inc (“Synergy”). The purchase price was $49.1 million in cash and was funded from credit available under the Corporation’s revolving credit facilities. The excess of the purchase price over the fair value of the net assets acquired is $31.3 million at December 31, 2006.
Synergy specializes in the design, manufacture, and integration of single- and multi-processor single-board computers for VME and CompactPCI systems to meet the needs of demanding real-time applications in military, aerospace, industrial, and commercial markets. Synergy is headquartered in San Diego, California. Revenues of the acquired business were $17.5 million for the year ended December 31, 2003.
Page 57
Primagraphics
On May 28, 2004, the Corporation acquired the outstanding stock of Primagraphics Holdings Limited (“Primagraphics”). The purchase price, subject to customary adjustments provided for in the Stock Purchase Agreement, was£12.5 million ($22.4 million) in cash. The purchase price was funded from credit available under the Corporation’s revolving credit facilities. The estimated excess of the purchase price over the fair value of the net assets acquired is $15.4 million at December 31, 2006, including foreign currency translation adjustment gains of $1.3 million.
Primagraphics is a market leader in the development of radar processing and graphic display systems used throughout the world for military and commercial applications, such as ship and airborne command and control consoles, vessel tracking, air traffic control, and air defense systems. Primagraphics' products include graphics and imaging technologies, video and sensor processing hardware, and software that can be readily engineered to provide vital components for a wide variety of systems. Primagraphics is headquartered near Cambridge in the United Kingdom, with a worldwide network of dealers and distributors. Revenues of the acquired business were£6.8 million ($10.9 million) for the fiscal year ended June 30, 2003.
Dy 4
On January 31, 2004, the Corporation acquired the outstanding stock of Dy 4 Systems, Inc. and Dy 4 (U.S.) Inc. (collectively “Dy 4”). The purchase price was $110.4 million in cash and the assumption of certain liabilities. Management funded the purchase price with cash on hand and from the Corporation’s revolving credit facilities. The excess of the purchase price over the fair value of the net assets acquired as of December 31, 2006, is $63.2 million.
Dy 4 is considered a market leader in ruggedized embedded computing solutions for the defense and aerospace industries. Using standard, commercially available computing technologies, referred to as commercial-off-the-shelf, Dy 4 customizes the products to perform reliably in rugged conditions, such as extreme temperature, terrain, and speed. The acquisition was made primarily to complement the Corporation’s existing businesses that serve the embedded computing market. Based in Ottawa, Canada, Dy 4 also has a facility in Virginia and a sales office in the United Kingdom. Revenues of the purchased business for the fiscal year ending August 29, 2003 were $72.4 million.
METAL TREATMENT
Allegheny
On May 9, 2006, the Corporation purchased the assets and certain liabilities of two units of Diversified Coatings, Inc. (“Allegheny”). The purchase price was $14.9 million in cash and the assumption of certain liabilities. The purchase price was funded from credit available under the Corporation’s revolving credit facilities. The estimated excess of the purchase price over the fair value of the net assets acquired is $4.6$4.9 million at December 31, 2006.2008.
Allegheny’s services include the spray application of a variety of high performance coatings to automotive metal braking components. There are numerous specialty high performance coatings available on the market, which are specified on a part-by-part basis by the automotive OEMs. These high performance coatings are typically licensed by the coating material manufacturer to qualified applicators on a geographic basis. Allegheny is located in Fremont, Indiana and Ingersoll, Canada. Revenues of the acquired businesses were $12.7 million for the year ended December 31, 2005.
Everlube
On April 2, 2004, the Corporation purchased the assets of the Everlube Products division (“Everlube”) of Morgan Advanced Ceramics, Inc. The purchase price was $6.5 million in cash and the assumption of certain liabilities. The purchase price was funded from credit available under the Corporation’s revolving credit facilities. The estimated excess of the purchase price over the fair value of the net assets acquired is $2.0 million at December 31, 2006.
Page 58
Everlube is a pioneer and leader in manufacturing solid film lubricant (“SFL”) and other specialty engineered coatings with more than 180 formulations available. Everlube’s engineered coatings improve the functional performance of metal components in lubrication, temperature, and corrosion resistance. Everlube is located in Peachtree City, Georgia. Revenues of the acquired business were $3.9 million for the year ended December 31, 2003.
Evesham
On February 24, 2004, the Corporation purchased the assets of the Evesham coatings business located in the United Kingdom (“Evesham”) from Morgan Advanced Ceramics, Ltd. The purchase price was£3.5 million ($6.5 million) in cash and the assumption of certain liabilities. The purchase price was funded from credit available under the Corporation’s revolving credit facilities. The excess of the purchase price over the fair value of the net assets acquired is $2.2 million at December 31, 2006, including foreign currency translation adjustment gains of $0.1 million.
Evesham manufactures and applies an extensive range of SFL coatings, which provide lubrication, corrosion resistance, and enhanced engineering performance. Revenues of the acquired business were£2.6 million ($4.2 million) for the year ended December 31, 2003.
3. RECEIVABLES
Receivables include current notes, amounts billed to customers, claims, other receivables, and unbilled revenue on long-term contracts, consisting of amounts recognized as sales but not billed. Substantially all amounts of unbilled receivables are expected to be billed and collected in the subsequent year.
Page 64
Credit risk is generally diversified due to the large number of entities comprising the Corporation’s customer base and their geographic dispersion. The Corporation is either a prime contractor or subcontractor of various agencies of the U.S. Government. Revenues derived directly and indirectly from government sources (primarily the U.S. Government) were 45%36%, 48%38%, and 47%45% of consolidated revenues in 2006, 2005,2008, 2007, and 2004,2006, respectively. As of December 31, 20062008 and 2005,2007, accounts receivable due directly or indirectly from these government sources represented 43% and 52%34% of net receivables, respectively. Sales to one customer through which the Corporation is a subcontractor to the U.S. Government were 9% of consolidated revenues in 2006, 10% in 2005, and 13% in 2004.receivables. No single customer accounted for more than 10% of the Corporation’s net receivables as of December 31, 20062008 and 2005.2007.
The Corporation performs ongoing credit evaluations of its customers and establishes appropriate allowances for doubtful accounts based upon factors surrounding the credit risk of specific customers, historical trends, and other information.
The composition of receivables is as follows:
|
|
|
|
|
|
|
| |||||||
| (In thousands)December 31, |
| 2008 |
| 2007 |
| |||||||||
| Billed receivables: |
|
|
|
|
| |||||||||
| Trade and other receivables | $ | 199,714 | $ | 171,203 |
| $ | 286,123 |
| $ | 288,661 |
| |||
| Less: Allowance for doubtful accounts | (5,389 | ) | (5,453 | ) |
| (4,824 | ) |
| (5,347 | ) | ||||
| Net billed receivables | 194,325 | 165,750 |
| 281,299 |
| 283,314 |
| |||||||
| Unbilled receivables: |
|
|
|
|
| |||||||||
| Recoverable costs and estimated earnings not billed | 111,112 | 107,618 |
| 135,511 |
| 123,695 |
| |||||||
| Less: Progress payments applied | (20,663 | ) | (28,679 | ) |
| (21,151 | ) |
| (14,091 | ) | ||||
| Net unbilled receivables | 90,449 | 78,939 |
| 114,360 |
| 109,604 |
| |||||||
| Receivables, net | $ | 284,774 | $ | 244,689 |
| $ | 395,659 |
| $ | 392,918 |
| |||
The net receivable balance at December 31, 2006,2008, included $7.3$17.8 million related to the Corporation’s 20062008 acquisitions.
Page 59
4. INVENTORIES
Inventoried costs contain amounts relating to long-term contracts and programs with long production cycles, a portion of which will not be realized within one year. Inventories are valued at the lower of cost (principally average cost) or market. The composition of inventories is as follows:
|
|
|
|
|
|
|
| |||||||
| (In thousands)December 31, |
| 2008 |
| 2007 |
| |||||||||
| Raw material | $ | 67,667 | $ | 59,336 |
| $ | 126,799 |
| $ | 97,580 |
| |||
| Work-in-process | 43,280 | 43,099 |
| 63,195 |
| 58,700 |
| |||||||
| Finshed goods and component parts | 58,483 | 52,825 |
| 82,652 |
| 70,637 |
| |||||||
| Inventoried costs related to U.S. Government and other long-term | ||||||||||||||
| contracts | 30,361 | 27,533 | ||||||||||||
Inventoried costs related to U.S. Government and other long-term contracts |
| 60,721 |
| 62,219 |
| |||||||||
| Gross inventories | 199,791 | 182,793 |
| 333,367 |
| 289,136 |
| |||||||
| Less: Inventory reserves | (26,152 | ) | (25,377 | ) |
| (34,283 | ) |
| (30,999 | ) | ||||
| Progress payments applied, principally related to | ||||||||||||||
| long-term contracts | (12,111 | ) | (11,119 | ) | ||||||||||
Progress payments applied, principally related to long-term contracts |
| (17,576 | ) |
| (16,409 | ) | ||||||||
| Inventories, net | $ | 161,528 | $ | 146,297 |
| $ | 281,508 |
| $ | 241,728 |
| |||
The net inventory balance at December 31, 20062008 included $0.9$9.4 million related to the Corporation’s 20062008 acquisitions.
Page 65
5. PROPERTY, PLANT, AND EQUIPMENT
The composition of property, plant, and equipment is as follows:
|
|
|
|
|
|
|
| |||||||
| (In thousands)December 31, |
| 2008 |
| 2007 |
| |||||||||
| Land | $ | 19,086 | $ | 16,825 |
| $ | 19,620 |
| $ | 21,454 |
| |||
| Buildings and improvements | 125,431 | 111,409 |
| 127,595 |
| 132,647 |
| |||||||
| Machinery, equipment, and other | 403,125 | 362,018 |
| 533,800 |
| 473,584 |
| |||||||
| Property, plant, and equipment, at cost | 547,642 | 490,252 |
| 681,015 |
| 627,685 |
| |||||||
| Less: Accumulated depreciation | (250,990 | ) | (215,431 | ) |
| (316,983 | ) |
| (298,028 | ) | ||||
| Property, plant, and equipment, net | $ | 296,652 | $ | 274,821 |
| $ | 364,032 |
| $ | 329,657 |
| |||
Depreciation expense for the years ended December 31, 2008, 2007, and 2006 2005,was $47.2 million, $43.5 million, and 2004 was $38.8 million, $36.0 million, and $32.4 million, respectively. The net property, plant, and equipment balance at December 31, 2006, included $13.1 million related to the Corporation’s 2006 acquisitions.
Page 60
6. GOODWILL
Goodwill consists primarily of the excess purchase price of acquisitions over the fair value of the net assets acquired.
The changes in the carrying amount of goodwill for 20062008 and 20052007 are as follows:
| (In thousands) | ||||||||||||||||
| December 31, 2004 | $ | 115,202 | $ | 228,579 | $ | 20,532 | $ | 364,313 | ||||||||
| Goodwill from 2005 acquisitions | – | 27,034 | – | 27,034 | ||||||||||||
| Change in estimate to fair value of net assets | ||||||||||||||||
| acquired in prior years | 1,070 | (536 | ) | – | 534 | |||||||||||
| Additional consideration of prior years’ | ||||||||||||||||
| acquisitions | 1,241 | 629 | 60 | 1,930 | ||||||||||||
| Foreign currency translation adjustment | (344 | ) | (4,810 | ) | (499 | ) | (5,653 | ) | ||||||||
| December 31, 2005 | $ | 117,169 | $ | 250,896 | $ | 20,093 | $ | 388,158 | ||||||||
| Goodwill from 2006 acquisitions | 8,910 | – | 4,598 | 13,508 | ||||||||||||
| Change in estimate to fair value of net assets | ||||||||||||||||
| acquired in prior years | 411 | (1,453 | ) | (1,289 | ) | (2,331 | ) | |||||||||
| Additional consideration of prior years’ | ||||||||||||||||
| acquisitions | 2,722 | 1,629 | 13 | 4,364 | ||||||||||||
| Foreign currency translation adjustment | 850 | 6,084 | 468 | 7,402 | ||||||||||||
| December 31, 2006 | $ | 130,062 | $ | 257,156 | $ | 23,883 | $ | 411,101 | ||||||||
Additional consideration of prior years’ acquisitions includes accruals of $0.4 million for the year ended December 31, 2005, related to earn out and other required contractual payments. These amounts are classified in other current liabilities as additional amounts due to sellers.
|
|
|
|
|
|
|
|
|
|
|
|
|
|
|
|
|
|
(In thousands) |
| Flow |
| Motion |
| Metal |
| Consolidated |
| ||||||||
December 31, 2006 |
| $ | 130,062 |
| $ | 257,156 |
| $ | 23,883 |
| $ | 411,101 |
| ||||
Goodwill from 2007 acquisitions |
|
|
| 123,085 |
|
|
| 17,145 |
|
| — |
|
| 140,230 |
| ||
Change in estimate to fair value of net assets acquired in prior years |
|
|
| 875 |
|
|
| (1,303 | ) |
| 304 |
|
| (124 | ) | ||
Additional consideration of prior years’ acquisitions |
|
|
| 8,460 |
|
|
| 903 |
|
| 10 |
|
| 9,373 |
| ||
Foreign currency translation adjustment |
|
|
| 1,965 |
|
|
| 7,667 |
|
| 207 |
|
| 9,839 |
| ||
December 31, 2007 |
| $ | 264,447 |
| $ | 281,568 |
| $ | 24,404 |
| $ | 570,419 |
| ||||
Goodwill from 2008 acquisitions |
|
|
| — |
|
|
| 58,586 |
|
| 5,061 |
|
| 63,647 |
| ||
Change in estimate to fair value of net assets acquired in prior years |
|
|
| 580 |
|
|
| 343 |
|
| — |
|
| 923 |
| ||
Additional consideration of prior years’ acquisitions, net of disposition |
|
|
| 618 |
|
|
| (1,191 | ) |
| — |
|
| (573 | ) | ||
Foreign currency translation adjustment |
|
|
| (4,764 | ) |
|
| (19,759 | ) |
| (995 | ) |
| (25,518 | ) | ||
December 31, 2008 |
| $ | 260,881 |
| $ | 319,547 |
| $ | 28,470 |
| $ | 608,898 |
| ||||
During 2006,2008, the Corporation finalized the allocation of the purchase price for all businesses acquired prior to 2006.2008. Approximately $13$5.0 million and $120 million of the goodwill on acquisitions made during 20062008 and 2007, respectively, is deductible for tax purposes. None of the goodwill on the 2005 acquisition was deductible for tax purposes.
In accordance with SFAS No. 142, the Corporation completed its annual goodwill impairment testing as of October 31, 2008, 2007, and 2006 and July 31, 2006, 2005 and 2004.2006. During the quarter ended December 31, 2006, the Corporation changed the date of its annual goodwill impairment testing to October 31 in order to better align with the Corporation’s normal business process for updating the Corporation’s strategic plan and forecasts. The Corporation believes that the resulting change in accounting principle related to the annual testing date will not delay, accelerate, or avoid an impairment charge. Goodwill impairment tests performed as of October 31, 2008, 2007, and 2006 and July 31, 2006, 2005, and 2004 concluded that no impairment charges were required as of those dates. The Corporation determined that the change in accounting principle related to the annual testing date is preferable under the circumstances and does not result in adjustments to the Corporation’s financial statements when applied retrospectively.
Page 66
7. OTHER INTANGIBLE ASSETS, NET
Intangible assets are generally the result of acquisitions and consist primarily of purchased technology, customer related intangibles, and trademarks. Intangible assets are amortized over useful lives that range between 1 and 20 years.
Page 61
The following table summarizes the intangible assets acquired (including their weighted-average useful lives) by the Corporation during 20062008 and 2005.2007. No indefinite lived intangible assets were purchased in 20062008 or 2005.2007.
|
|
|
|
|
|
|
|
|
|
|
|
|
| |||||||||||
| (In thousands, except years data) |
| 2008 |
| 2007 |
| |||||||||||||||||||
| Amount | Years | Amount | Years |
| Amount |
| Years |
| Amount |
| Years |
| ||||||||||||
| Technology | $ | 2,390 | 12.1 | $ | 18,710 | 19.7 |
| $ | 7,608 |
|
| 11.3 |
| $ | 25,237 |
| 12.5 |
| ||||||
| Customer related intangibles | 6,330 | 8.7 | 11,107 | 17.7 |
| 20,116 |
|
| 10.1 |
| 51,417 |
| 11.8 |
| ||||||||||
Other intangible assets |
| 3,398 |
|
| 9.1 |
| 22,553 |
| 15.3 |
| ||||||||||||||
| Total | $ | 8,720 | 9.7 | $ | 29,817 | 19.0 |
| $ | 31,122 |
|
| 10.3 |
| $ | 99,207 |
| 12.8 |
| ||||||
The following tables present the cumulative composition of the Corporation’s acquired intangible assets as of December 31:
| (In thousands) | |||||||||||
| 2006 | |||||||||||
| Technology | $ | 94,611 | $ | (19,403 | ) | $ | 75,208 | ||||
| Customer related intangibles | 86,205 | (14,400 | ) | 71,805 | |||||||
| Other intangible assets | 12,416 | (1,349 | ) | 11,067 | |||||||
| Total | $ | 193,232 | $ | (35,152 | ) | $ | 158,080 | ||||
| (In thousands) | |||||||||||
| 20051 | |||||||||||
| Technology | $ | 91,583 | $ | (13,445 | ) | $ | 78,138 | ||||
| Customer related intangibles | 79,342 | (10,715 | ) | 68,627 | |||||||
| Other intangible assets | 12,415 | (913 | ) | 11,502 | |||||||
| Total | $ | 183,340 | $ | (25,073 | ) | $ | 158,267 | ||||
|
|
|
|
|
|
|
|
|
|
|
|
|
(In thousands) |
| Gross |
| Accumulated |
| Net |
| |||||
Technology |
| $ | 121,948 |
| $ | (33,867 | ) | $ | 88,081 |
| ||
Customer related intangibles |
|
| 153,113 |
|
| (38,440 | ) |
| 114,673 |
| ||
Other intangible assets |
|
| 37,965 |
|
|
| (6,123 | ) |
| 31,842 |
| |
Total |
| $ | 313,026 |
| $ | (78,430 | ) | $ | 234,596 |
| ||
|
|
|
|
|
|
|
|
|
|
|
|
|
(In thousands) |
| Gross |
| Accumulated |
| Net |
| |||||
Technology |
| $ | 121,029 |
| $ | (26,461 | ) | $ | 94,568 |
| ||
Customer related intangibles |
|
| 140,064 |
|
|
| (25,357 | ) |
| 114,707 |
| |
Other intangible assets |
|
| 34,994 |
|
|
| (3,427 | ) |
| 31,567 |
| |
Total |
| $ | 296,087 |
| $ | (55,245 | ) | $ | 240,842 |
| ||
The following table presents the changes in the net balance of other intangible assets during 2006:2008:
|
|
|
|
|
|
|
|
|
|
|
|
|
|
|
| ||||||||||||||||||||
| (In thousands) |
| Technology |
| Customer |
| Other |
| Total |
| ||||||||||||||||||||||||||
| December 31, 2005 | $ | 78,138 | $ | 68,627 | $ | 11,502 | $ | 158,267 | |||||||||||||||||||||||||||
| Acquired during 2006 | 2,390 | 6,330 | – | 8,720 | |||||||||||||||||||||||||||||||
| Change in estimate of fair value related to | |||||||||||||||||||||||||||||||||||
| purchase price allocation | – | 1,260 | 29 | 1,289 | |||||||||||||||||||||||||||||||
December 31, 2007 |
| $ | 94,568 |
| $ | 114,707 |
| $ | 31,567 |
| $ | 240,842 |
| ||||||||||||||||||||||
Acquired during 2008 |
| 7,608 |
| 20,116 |
| 3,398 |
| 31,122 |
| ||||||||||||||||||||||||||
Change in estimate of fair value related to purchase price allocation |
| 187 |
| 14 |
| (8 | ) |
| 193 |
| |||||||||||||||||||||||||
| Amortization expense | (6,394 | ) | (5,206 | ) | (415 | ) | (12,015 | ) |
| (9,011 | ) |
| (14,934 | ) |
| (3,060 | ) |
| (27,005 | ) | |||||||||||||||
| Net foreign currency translation adjustment | 1,074 | 794 | (49 | ) | 1,819 |
| (5,271 | ) |
| (5,230 | ) |
| (55 | ) |
| (10,556 | ) | ||||||||||||||||||
| Total | $ | 75,208 | $ | 71,805 | $ | 11,067 | $ | 158,080 |
| $ | 88,081 |
| $ | 114,673 |
| $ | 31,842 |
| $ | 234,596 |
| ||||||||||||||
Included in other intangible assets at December 31, 20062008 and 2005,2007, are $9.9 million of intangible assets not subject to amortization. In accordance with SFAS No. 142, the Corporation completed its annual test of impairment of indefinite lived intangible assets during the fourth quarter of each year2008, 2007, and 2006, and concluded there was no impairment of value.
Page 67
Amortization expense for the years ended December 31, 20052008, 2007, and 20042006 was $11.9$27.0 million, $19.2 million, and $8.3$11.9 million, respectively. The estimated future amortization expense of purchased intangible assets is as follows:
|
|
|
|
| |||
| (In thousands) |
|
|
| ||||
| 2007 | $ | 12,362 | |||||
| 2008 | 12,302 | ||||||
| 2009 | 11,280 |
| $ | 23,723 |
| ||
| 2010 | 10,801 |
| 20,420 |
| |||
| 2011 | 10,584 |
| 19,433 |
| |||
2012 |
| 18,141 |
| ||||
2013 |
| 16,717 |
| ||||
Page 62
8. ACCRUED EXPENSES AND OTHER CURRENT LIABILITIES
Accrued expenses consist of the following:
|
|
|
|
|
|
|
| |||||||
| (In thousands)December 31, |
| 2008 |
| 2007 |
| |||||||||
| Accrued compensation | $ | 50,941 | $ | 45,270 |
| $ | 68,915 |
| $ | 61,998 |
| |||
| Accrued commissions | 5,852 | 5,819 |
| 7,883 |
| 9,961 |
| |||||||
Accrued interest |
| 5,405 |
| 5,324 |
| |||||||||
| Accrued taxes other than income taxes | 3,989 | 4,048 |
| 5,318 |
| 5,178 |
| |||||||
| Accrued insurance | 4,116 | 4,053 |
| 4,413 |
| 5,382 |
| |||||||
| Accrued interest | 3,687 | 3,842 | ||||||||||||
| Other | 12,947 | 11,220 |
| 12,039 |
| 15,364 |
| |||||||
| Total accrued expenses | $ | 81,532 | $ | 74,252 |
| $ | 103,973 |
| $ | 103,207 |
| |||
| Other current liabilities consist of the following: | ||||||||||||||
| (In thousands)December 31, | ||||||||||||||
| Warranty reserves | $ | 9,957 | $ | 9,850 | ||||||||||
| Litigation reserves | 6,512 | 713 | ||||||||||||
| Additional amounts due to sellers on acquisitions | 4,678 | 3,274 | ||||||||||||
| Current portion of environmental reserves | 2,441 | 2,677 | ||||||||||||
| Other | 4,800 | 4,903 | ||||||||||||
| Total other current liabilities | $ | 28,388 | $ | 21,417 | ||||||||||
Other current liabilities consist of the following:
|
|
|
|
|
|
|
|
(In thousands) December 31, |
| 2008 |
| 2007 |
| ||
Warranty reserves |
| $ | 10,775 |
| $ | 10,774 |
|
Litigation reserves |
|
| 9,783 |
|
| 8,022 |
|
Additional amounts due to sellers on acquisitions |
|
| 9,536 |
|
| 1,977 |
|
Restructuring accrual |
|
| 6,146 |
|
| — |
|
Reserves on loss contracts |
|
| 4,205 |
|
| 8,791 |
|
Current deferred tax liability |
|
| 3,087 |
|
| 690 |
|
Current portion of pension and other postretirement liabilities |
|
| 2,878 |
|
| 2,356 |
|
Loss on forward foreign currency contracts |
|
| 2,434 |
|
| 421 |
|
Current portion of environmental reserves |
|
| 1,805 |
|
| 2,094 |
|
Other |
|
| 5,893 |
|
| 3,278 |
|
Total other current liabilities |
| $ | 56,542 |
| $ | 38,403 |
|
The accrued expenses and other current liabilities at December 31, 2006,2008 included $1.5$7.5 million and $2.7$12.5 million respectively, related to the Corporation’s 20062008 acquisitions.
The Corporation provides its customers with warranties on certain commercial and governmental products. Estimated warranty costs are charged to expense in the period the related revenue is recognized based on the terms of the product warranty, the related estimated costs, and quantitative historical claims experience. These estimates are adjusted in the period in which actual results are finalized or additional information is obtained. The following table presents the changes in the Corporation’s warranty reserves:
|
|
|
|
|
|
|
| ||||||||
| (In thousands) |
| 2008 |
| 2007 |
| ||||||||||
| Warranty reserves at January 1, | $ | 9,850 | $ | 9,667 |
| $ | 10,774 |
| $ | 9,957 |
| ||||
| Provision for current year sales | 3,208 | 3,188 |
| 7,384 |
| 3,992 |
| ||||||||
| Current year claims | (2,045 | ) | (2,534 | ) |
| (4,691 | ) |
| (3,038 | ) | |||||
| Change in estimates to pre-existing warranties | (1,497 | ) | (1,700 | ) |
| (2,059 | ) |
| (1,516 | ) | |||||
| Increase due to acquisitions | 27 | 1,618 |
| 97 |
| 1,027 |
| ||||||||
| Foreign currency translation adjustment | 414 | (389 | ) |
| (730 | ) |
| 352 |
| ||||||
| Warranty reserves at December 31, | $ | 9,957 | $ | 9,850 |
| $ | 10,775 |
| $ | 10,774 |
| ||||
Page 68
In connection with the acquisition of VMETRO in October 2008, the Corporation established a restructuring accrual of $7.1 million in accordance with EITF No. 95-3 Recognition of Liabilities in Connection with a Purchase Business Combination. The restructuring accrual consists of costs to exit the activities of certain facilities, including lease cancellation costs and external legal and consulting fees, as well as costs to relocate or involuntarily terminate certain employees of the acquired business. As of December 31, 2008, the Corporation has not finalized its plans associated with the restructuring and has estimated the costs noted above. These costs are subject to adjustment upon finalization of the plan, and will be accounted for as an adjustment to the purchase price of the acquisition. We intend to complete these activities by the third quarter of 2009.
The following table shows the details of the restructuring cost accruals included in other current liabilities for the year ended December 31, 2008.
|
|
|
|
|
|
|
|
|
|
|
|
|
|
|
|
|
|
|
|
(In thousands) |
| Severance and |
| Facility |
| Relocation |
| Total |
| ||||||||||
October 15, 2008 |
| $ | 4,422 |
| $ |
| 2,038 |
| $ |
| 628 |
| $ | 7,088 |
| ||||
Cash Paid |
|
| (604 | ) |
|
| — |
|
|
| — |
|
| (604 | ) | ||||
Currency Translation Adjustment |
|
|
| (202 | ) |
|
| (136 | ) |
|
| — |
|
| (338 | ) | |||
December 31, 2008 |
| $ | 3,616 |
| $ |
| 1,902 |
| $ |
| 628 |
| $ | 6,146 |
| ||||
9. INCOME TAXES
Earnings before income taxes for the years ended December 31 consist of:
| (In thousands) | |||||||||
| Domestic | $ | 74,275 | $ | 77,440 | $ | 65,963 | |||
| Foreign | 43,347 | 40,858 | 32,790 | ||||||
| Total | $ | 117,622 | $ | 118,298 | $ | 98,753 | |||
Page 63
|
|
|
|
|
|
|
|
|
|
|
(In thousands) |
| 2008 |
| 2007 |
| 2006 |
| |||
Domestic |
| $ | 71,976 |
| $ | 89,422 |
| $ | 74,275 |
|
Foreign |
|
| 97,126 |
|
| 64,749 |
|
| 43,347 |
|
|
|
| 169,102 |
|
| 154,171 |
|
| 117,622 |
|
The provision for income taxes for the years ended December 31 consist of:
|
|
|
|
|
|
|
|
|
|
| |||||||||||
| (In thousands) |
| 2008 |
| 2007 |
| 2006 |
| ||||||||||||||
| Current: |
|
|
|
|
|
|
| ||||||||||||||
| Federal | $ | 29,640 | $ | 25,362 | $ | 21,158 |
| $ | 28,644 |
| $ | 35,177 |
| $ | 29,640 |
| |||||
| State | 4,726 | 6,028 | 5,481 |
| 8,906 |
| 3,602 |
| 4,726 |
| |||||||||||
| Foreign | 14,106 | 12,791 | 10,548 |
| 28,532 |
| 19,208 |
| 14,106 |
| |||||||||||
|
| 66,082 |
| 57,987 |
| 48,472 |
| ||||||||||||||
| 48,472 | 44,181 | 37,187 | |||||||||||||||||||
|
|
|
|
|
|
| |||||||||||||||
| Deferred: |
|
|
|
|
|
|
| ||||||||||||||
| Federal | (5,397 | ) | (674 | ) | (878 | ) |
| (5,410 | ) |
| (4,109 | ) |
| (5,397 | ) | ||||||
| State | (930 | ) | 472 | (1,969 | ) |
| (1,704 | ) |
| 337 |
| (930 | ) | ||||||||
| Foreign | (5,092 | ) | (961 | ) | (653 | ) |
| 388 |
| (4,372 | ) |
| (5,092 | ) | |||||||
| (11,419 | ) | (1,163 | ) | (3,500 | ) | ||||||||||||||||
|
| (6,726 | ) |
| (8,144 | ) |
| (11,419 | ) | ||||||||||||
Valuation allowance |
| 356 |
| — |
| — |
| ||||||||||||||
| Provision for income taxes | $ | 37,053 | $ | 43,018 | $ | 33,687 |
| $ | 59,712 |
| $ | 49,843 |
| $ | 37,053 |
| |||||
The effective tax rate varies from the U.S. federal statutory tax rate for the years ended December 31, principally:
|
|
|
|
|
|
|
|
|
|
| ||||||||
| 2008 |
| 2007 |
| 2006 |
| ||||||||||||
| 2006 | 2005 | 2004 | ||||||||||||||||
| U.S. federal statutory tax rate | 35.0 | % | 35.0 | % | 35.0 | % |
| 35.0 | % |
| 35.0 | % |
| 35.0 | % | |||
| Add (deduct): |
|
|
|
|
|
|
| |||||||||||
| State and local taxes, net of federal benefit | 2.0 | 3.4 | 1.6 |
| 2.6 |
| 1.8 |
| 2.0 |
| ||||||||
| Enacted future rate changes | (1.4 | ) | – | – |
| 0.1 |
| (2.1 | ) |
| (1.4 | ) | ||||||
| R&D tax credits | (3.0 | ) | (0.4 | ) | (0.1 | ) |
| (1.2 | ) |
| (1.9 | ) |
| (3.0 | ) | |||
| Foreign rate differential | (0.8 | ) | (1.2 | ) | (1.1 | ) |
| (1.3 | ) |
| 0.2 |
| (0.8 | ) | ||||
| All other, net | (0.3 | ) | (0.4 | ) | (1.3 | ) |
| 0.1 |
| (0.7 | ) |
| (0.3 | ) | ||||
| Effective tax rate | 31.5 | % | 36.4 | % | 34.1 | % |
| 35.3 | % |
| 32.3 | % |
| 31.5 | % | |||
Page 69
During 2008, a valuation allowance of $5.0 million was established through purchase accounting as result of a recent acquisition. An additional valuation allowance $0.4 million was established through income tax provision. Our 2007 effective tax rate included tax benefits of $4.1 million, including $3.2 million related to the tax law changes in Canada, the United Kingdom, and Germany and research and development credits from our U.K. operations of $0.9 million. Our 2006 effective tax rate included tax benefits of $5.1 million including $2.0 million relating to research and development credits from our Canadian operations, the impact of a Canadian tax law change enacted during the second quarter of 2006, which resulted in a $1.6 million favorable adjustment, and the release of a tax reserve associated with the sale of a former facility following the expiration of the statute of limitations, which resulted in a $1.5 million favorable adjustment, net of tax.
The components of the Corporation’s deferred tax assets and liabilities at December 31 are as follows:
|
|
|
|
|
|
|
| |||||||
| (In thousands) |
| 2008 |
| 2007 |
| |||||||||
| Deferred tax assets: |
|
|
|
|
| |||||||||
| Environmental reserves | $ | 9,719 | $ | 9,946 |
| $ | 8,970 |
| $ | 9,622 |
| |||
| Inventories | 8,261 | 8,353 |
| 10,834 |
| 9,987 |
| |||||||
| Postretirement/postemployment benefits | 16,488 | 16,453 |
| 16,310 |
| 16,382 |
| |||||||
| Incentive compensation | 10,790 | 9,203 |
| 5,188 |
| 5,198 |
| |||||||
| Accrued vacation pay | 4,928 | 4,570 |
| 4,781 |
| 4,370 |
| |||||||
| Warranty reserve | 2,278 | 2,363 |
| 3,285 |
| 2,359 |
| |||||||
Legal reserves |
| 3,668 |
| 2,797 |
| |||||||||
Share-based payments |
| 4,648 |
| 3,034 |
| |||||||||
Retirement plans |
| 40,675 |
| — |
| |||||||||
| Other | 9,636 | 7,607 |
| 17,701 |
| 9,683 |
| |||||||
| Total deferred tax assets | 62,100 | 58,495 |
| 116,060 |
| 63,432 |
| |||||||
| Deferred tax liabilities: |
|
|
|
|
| |||||||||
| Retirement plans | 15,153 | 10,376 |
| — |
| 19,368 |
| |||||||
| Depreciation | 19,350 | 21,054 |
| 19,936 |
| 18,456 |
| |||||||
| Goodwill amortization | 15,194 | 19,044 |
| 25,337 |
| 20,194 |
| |||||||
| Other intangible amortization | 32,202 | 28,332 |
| 31,970 |
| 31,676 |
| |||||||
| Cumulative translation adjustment | 2,385 | – |
| — |
| 4,087 |
| |||||||
| Other | 2,386 | 4,416 |
| 2,937 |
| 2,023 |
| |||||||
| Total deferred tax liabilities | 86,670 | 83,222 |
| 80,180 |
| 95,804 |
| |||||||
| Net deferred tax liabilities | $ | (24,570 | ) | $ | (24,727 | ) | ||||||||
Valuation allowance |
| 5,375 |
| — |
| |||||||||
Net deferred tax assets (liabilities) |
| $ | 30,505 |
| $ | (32,372 | ) | |||||||
Deferred tax assets and liabilities are reflected on the Corporation’s consolidated balance sheet at December 31 as follows:
(In thousands) | 2006 | 2005 | |||||
| Current deferred tax assets | $ | 32,485 | $ | 28,843 | |||
| Noncurrent deferred tax liabilities | (57,055 | ) | (53,570 | ) | |||
| Net deferred tax liabilities | $ | (24,570 | ) | $ | (24,727 | ) | |
Page 64
|
|
|
|
|
|
|
|
(In thousands) |
| 2008 |
| 2007 |
| ||
Net current deferred tax assets |
| $ | 37,314 |
| $ | 30,208 |
|
Net current deferred tax liabilities |
|
| 3,087 |
|
| 690 |
|
Net noncurrent deferred tax assets |
|
| 23,128 |
|
| 526 |
|
Net noncurrent deferred tax liabilities |
|
| 26,850 |
|
| 62,416 |
|
Net deferred tax assets (liabilities) |
| $ | 30,505 |
| $ | (32,372 | ) |
As of December 31, 2006,2008, the Corporation had state and foreign net operating loss carryforwards of $0.5$2.2 million, after tax. The state net operating loss carryforwards expire through the year 2023. The foreign net operating loss carryforwards havefor Mexico expire through the year 2018 and Norway has no expiration date.
Income tax payments of $45.4$65.3 million were made in 2006, $32.32008, $62.1 million in 2005,2007, and $28.8$45.4 million in 2004.2006.
No provision has been made for U.S. federal or foreign taxes on that portion of certain foreign subsidiaries’ undistributed earnings considered to be permanently reinvested, which at December 31, 2006,2008 was $45.3$111.0 million. It is not practicable to estimate the amount of tax that would be payable if these amounts were repatriated to the U.S.;United States; however, it is expected there would be minimal or no additional tax because of the availability of foreign tax credits.
In June 2006,Page 70
Effective January 1, 2007, the Corporation adopted the provisions of FASB issuedInterpretation No. 48, “Accounting for Uncertainty in Income Taxes – an interpretation of FASB Statement No. 109” (“FIN 48”). FIN 48 to createprescribes a single model to address accounting for uncertainty in tax positions. FIN 48 clarifies the accounting for income taxes, by prescribing a minimum recognition threshold and a measurement attribute for the financial statement recognition and measurement of tax positions taken or expected to be taken in a tax return. For those benefits to be recognized, a tax position is requiredmust be more-likely-than-not to meet before beingbe sustained upon examination by taxing authorities. As a result of the implementation of FIN 48, the Corporation recognized a $0.5 million increase in the financial statements. FIN 48 also provides guidance on derecognition, measurement, classification, interest and penalties, accounting in interim periods, disclosure, and transition. FIN 48 is effectiveliability for fiscal years beginning after December 15, 2006. The Corporation will adopt FIN 48unrecognized tax benefits, which was accounted for as ofa reduction to January 1, 2007 as required. The cumulative effect of adopting FIN 48 will be recordedbalance in retained earningsearnings. At December 31, 2008 and other accounts2007, the Corporation had a liability for unrecognized tax benefits of $4.4 and $4.5 million, respectively (of which $3.4 and $3.3 million, if recognized, would favorably affect the Corporation’s effective tax rate).
Interest costs related to unrecognized tax benefits are classified as applicable. The Corporation is evaluating its tax positionsa component of “Interest expense, net” in the accompanying consolidated statements of operations. Penalties are recognized as a component of “Selling, general and anticipates thatadministrative expenses.” Upon the adoptionimplementation of FIN 48, will not have a significant impact on its resultsthe Corporation recognized $0.2 million of operations.interest expense and $0.2 million of penalties. The Corporation recognized $0.2 and $0.5 million of interest expense for the years ended December 31, 2008 and 2007, respectively, and $0.2 million of penalties related to unrecognized tax benefits for the year ended December 31, 2007.
On October 22, 2004 the American Jobs Creation Act of 2004 (the “Act”) was signed into law. The Act includes a one-time opportunity for a deduction of 85% of certain foreign dividends that are repatriated, as defined in the Act. Pursuant to this provisionA reconciliation of the Act,beginning and ending amount of unrecognized tax benefits is as follows:
|
|
|
|
|
|
|
|
(In thousands) |
| 2008 |
| 2007 |
| ||
Balance at January 1, |
| $ | 4,502 |
| $ | 3,261 |
|
Additions based on tax positions taken during a prior period |
|
| 595 |
|
| 802 |
|
Additions based on tax positions taken during the current period |
|
| 358 |
|
| 581 |
|
Reductions related to settlement of tax matters |
|
| (347 | ) |
| (10 | ) |
Reductions related to a lapse of applicable statute of limitations |
|
| (398 | ) |
| (349 | ) |
Foreign currency translation |
|
| (265 | ) |
| 217 |
|
Balance at December 31, |
| $ | 4,445 |
| $ | 4,502 |
|
In many cases the Corporation has repatriated $9.3 million inCorporation’s uncertain tax positions are related to tax years that remain subject to examination by tax authorities. The following describes the fourth quarteropen tax years, by major tax jurisdiction, as of 2005 with a tax cost of $0.3 million. This tax cost was net of foreign tax credits which were not previously provided. December 31, 2008:
United States – Federal | 2005 - present | |
United States – State | 1998 - present | |
Canada | 2005 – present |
The Corporation should be considered to have satisfied the Section 8.03 “safe harbor” contained in Notice 2005-10 since 100% of the required investments pursuantdoes not expect any significant changes to the Section 965 dividend reinvestment plan have been made byestimated amount of liability associated with its uncertain tax positions through the end of the 2005 tax year.next twelve months.
10. DEBT
Debt consists of the following:
|
|
|
|
|
|
|
| ||||||
| (In thousands) December 31, | 2006 |
| 2008 |
| 2007 |
| |||||||
| Industrial Revenue Bonds, due from 2007 through 2028 | $ | 14,180 | $ | 14,239 | |||||||||
| Revolving Credit Agreement, due 2009 | — | — | |||||||||||
Industrial Revenue Bonds, due from 2008 through 2028 |
| $ | 9,058 |
| $ | 9,120 |
| ||||||
Revolving Credit Agreement, due 2012 |
| 154,500 |
| 152,000 |
| ||||||||
| 5.13% Senior Notes due 2010 | 74,786 | 74,729 |
| 74,900 |
| 74,843 |
| ||||||
| 5.74% Senior Notes due 2013 | 125,094 | 125,108 |
| 125,066 |
| 125,080 |
| ||||||
| 5.51% Senior Notes due 2017 | 150,000 | 150,000 |
| 150,000 |
| 150,000 |
| ||||||
| Other debt | 814 | 826 |
| 3,185 |
| 861 |
| ||||||
| Total debt | 364,874 | 364,902 |
| 516,709 |
| 511,904 |
| ||||||
| Less: Short-term debt | 5,874 | 885 |
| 3,249 |
| 923 |
| ||||||
| Total Long-term debt | $ | 359,000 | $ | 364,017 |
| $ | 513,460 |
| $ | 510,981 |
| ||
The weighted-average interest rate of the Corporation’s Industrial Revenue Bonds was 3.45%2.32% and 2.54%3.58% in 20062008 and 2005,2007, respectively. The weighted-average interest rate of the Corporation’s Revolving Credit Agreement was 6.22%3.80% and 3.97%6.13% in 20062008 and 2005,2007, respectively.
Page 71
The fair value of the Corporation’s debt is prepared in accordance with the requirements of SFAS No. 157, as noted above. The estimated fair value amounts were determined by the Corporation using available market information which is primarily based on quoted market prices for the same or similar issues. The carrying amount of the Industrial Revenue Bonds approximates fair value as the interest rates on this variable debt are reset periodically to reflect market conditions and rates. Fair values for the Corporation’s fixed rate debt totaled $350.8$313.9 million and $357.9$343.9 million at December 31, 20062008 and 2005,2007, respectively. These fair values were estimated by management. The fair values described above may not be indicative of net realizable value or reflective of future fair values. Furthermore, the use of different methodologies to determine the fair value of certain financial instruments could result in a different estimate of fair value at the reporting date.
Page 65
| (In thousands) | ||||
| 2007 | $ | 5,874 | ||
| 2008 | 62 | |||
| 2009 | 64 | |||
| 2010 | 75,066 | |||
| 2011 | 68 | |||
| Thereafter | 283,860 | |||
| Total | $ | 364,994 | ||
|
|
|
|
|
(In thousands) |
|
|
|
|
2009 |
| $ | 3,249 |
|
2010 |
|
| 75,066 |
|
2011 |
|
| 68 |
|
2012 |
|
| 154,570 |
|
2013 |
|
| 125,072 |
|
Thereafter |
|
| 158,718 |
|
Total |
| $ | 516,743 |
|
(1) Amounts exclude a $0.1 million adjustment to the fair value of long-term debt relating to the Corporation’s interest rate swap agreements that were settled in cash during 2005. |
Interest payments of $21.3$26.5 million, $18.3$25.3 million, and $12.1$21.3 million were made in 2008, 2007, and 2006, 2005,respectively.
On August 10, 2007, the Corporation and 2004,certain of its subsidiaries amended and refinanced its existing credit facility and entered into a Second Amended and Restated Credit Agreement (“Credit Agreement”). The proceeds available under the Credit Agreement are to be used for working capital, internal growth initiatives, funding of future acquisitions, and general corporate purposes. The Corporation’s available credit under the credit facility increased from $400.0 million to $425.0 million from a syndicate of banks, led by Bank of America, N.A. and JP Morgan Chase Bank, N.A. as the co-arrangement banks. The Credit Agreement also contains an accordion feature which can expand the overall credit line to a maximum aggregate amount of $600.0 million. The consortium membership has remained relatively the same. The Credit Agreement extends the maturity from July 23, 2009 to August 10, 2012, at which time all amounts then outstanding under the Credit Agreement will be due and payable. In addition, the Credit Agreement provides for improved pricing and more favorable covenant terms, reduced facility fees, and increased availability of the facility for letters of credit. Borrowings under the Credit Agreement bear interest at a floating rate based on market conditions. In addition, our interest rate and level of facility fees are dependent on certain financial ratio levels, as defined in the Credit Agreement. We are subject to annual facility fees on the commitments under the Credit Agreement. In connection with the Credit Agreement, we paid customary transaction fees that have been deferred and are being amortized over the term of the Credit Agreement. We are required under the Credit Agreement to maintain certain financial ratios and meet certain financial tests, the most restrictive of which is a debt to capitalization limit of 60% and a cross default provision with our other senior indebtedness. The Credit Agreement does not contain any subjective acceleration clauses. As of December 31, 2008, the Corporation was in compliance with all covenants and had the flexibility to issue additional debt of approximately $731.0 million without exceeding the covenant limit defined in the Credit Agreement. We would consider other financing alternatives to maintain capital structure balance and ensure compliance with all debt covenants. We had $154.5 million and $152.0 million in borrowings outstanding (excluding letters of credit) under the Credit Agreement at December 31, 2008 and 2007, respectively. The unused credit available under the Credit Agreement at December 31, 2008 and 2007 was $208.0 million and $224.4 million, respectively.
On December 1, 2005, the Corporation issued $150.0 million of 5.51% Senior Notes (the “2005 Notes”). The 2005 Notes mature on December 1, 2017. The Notes are senior unsecured obligations and are equal in right of payment to the Corporation’s existing senior indebtedness. The Corporation, at its option, can prepay at any time all or any part of the 2005 Notes, subject to a make-whole amount in accordance with the terms of the Note Purchase Agreement. In connection with the Notes, the Corporation paid customary fees that have been deferred and will be amortized over the terms of the Notes. The Corporation is required under the Note Purchase
Page 72
Agreement to maintain certain financial ratios, the most restrictive of which is a debt to capitalization limit of 60% and a cross default provision with the Corporation’s other senior indebtedness. As of December 31, 2006,2008, the Corporation was in compliance with all covenants.
In November 2005, the Corporation unwound its interest rate swap agreements with notional amounts of $20 million and $60 million, which were originally put in place to convert a portion of the fixed interest on the $75 million 5.13% Senior Notes and $125 million 5.74% Senior Notes, respectively, to variable rates based on specified spreads over six-month LIBOR. The unwindunwinding of these swap agreements resulted in a net loss of $0.2 million, which has been deferred and is being amortized over the remaining term of the underlying debt.
On July 23, 2004, the Corporation amended its existing credit facility, increasing the available line of credit from $225 million to $400 million with a group of ten banks. The Corporation plans to use the credit line for working capital purposes, internal growth initiatives, funding of future acquisitions, and other general corporate purposes. The credit agreement expires in 2009. Borrowings under the agreement bear interest at a floating rate based on market conditions. In addition, the Corporation’s interest rate and level of facility fees depend on maintaining certain financial ratios defined in the agreement. The Corporation is subject to annual facility fees on the commitments under the Revolving Credit Agreement. In connection with the Revolving Credit Agreement, the Corporation paid customary transaction fees that have been deferred and are being amortized over the term of the agreement. The Corporation is required under the agreement to maintain certain financial ratios and meet certain financial tests as detailed in the agreement, of which the Corporation is in compliance at December 31, 2006. The unused credit available under the Revolving Credit Agreement at December 31, 2006 and 2005, was $362.2 million and $367.9 million, respectively.
On September 25, 2003, the Corporation issued $200.0 million of Senior Notes (the “2003 Notes”). The 2003 Notes consist of $75.0 million of 5.13% Senior Notes that mature on September 25, 2010 and $125.0 million of 5.74% Senior Notes that mature on September 25, 2013. The 2003 Notes are senior unsecured obligations and are equal in right of payment to the Corporation’s existing senior indebtedness. The Corporation, at its option, can prepay at any time all or any part of the 2003 Notes, subject to a make-whole amount in accordance with the Note Purchase Agreement. The Corporation paid customary fees that have been deferred and will be amortized over the terms of the 2003 Notes. The Corporation is required under the Note Purchase Agreement to maintain certain financial ratios, the most restrictive of which is a debt to capitalization limit of 60% and a cross default provision with the Corporation’s other senior indebtedness. As of December 31, 2006,2008, the Corporation was in compliance with allany covenants.
Page 66
At December 31, 2006,2008, substantially all of the industrial revenue bond issues are collateralized by real estate, machinery, and equipment. Certain of these issues are supported by letters of credit, which total $13.7$8.5 million. The Corporation had various other letters of credit totaling $24.1$54.0 million. Substantially all letters of credit are included under the Revolving Credit Agreement.
11. EARNINGS PER SHARE
The Corporation is required to report both basic earnings per share (“EPS”), based on the weighted-average number of Common shares outstanding, and diluted earnings per share, based on the basic EPS adjusted for all potentially dilutive shares issuable. Share and per share amounts presented below have been adjusted on a pro forma basis for the April 21 2006 stock split. See Note 1-O for further information regarding the stock split.
At December 31, 2006,2008 and 2007, the Corporation had stocknon-qualified share options outstanding of 380,7231,078,379 shares thatand 357,984 shares, respectively, which were not included in the computation of diluted EPS because to do so would have been antidilutive. There were no antidilutive options outstanding at December 31, 2005 or December 31, 2004. Earnings per share calculations for the years ended December 31, 2006, 2005,2008, 2007, and 2004,2006, are as follows:
|
|
|
|
|
|
|
|
|
| ||||||||||
| Weighted-Average | |||||||||||||||||||
| (In thousands, except per share data) | Shares Outstanding |
| Net Income |
| Weighted-Average |
| Earnings |
| |||||||||||
2006: | |||||||||||||||||||
2008: |
|
|
|
|
|
|
| ||||||||||||
| Basic earnings per share | $ | 80,569 | 43,826 | $ | 1.84 |
| $ | 109,390 |
| 44,716 |
| $ | 2.45 |
| |||||
| Effect of dilutive securities: |
|
|
|
|
|
|
| ||||||||||||
| Stock options | 445 | ||||||||||||||||||
| Deferred stock compensation | 63 | ||||||||||||||||||
Employee share-based compensation awards |
|
|
| 596 |
|
|
| ||||||||||||
Deferred director share-based compensation |
|
|
| 62 |
|
|
| ||||||||||||
| Diluted earnings per share | $ | 80,569 | 44,334 | $ | 1.82 |
| $ | 109,390 |
| 45,374 |
| $ | 2.41 |
| |||||
2005: | |||||||||||||||||||
|
|
|
|
|
|
|
| ||||||||||||
2007: |
|
|
|
|
|
|
| ||||||||||||
| Basic earnings per share | $ | 75,280 | 43,270 | $ | 1.74 |
| $ | 104,328 |
| 44,313 |
| $ | 2.35 |
| |||||
| Effect of dilutive securities: |
|
|
|
|
|
|
| ||||||||||||
| Stock options | 500 | ||||||||||||||||||
| Deferred stock compensation | 58 | ||||||||||||||||||
Employee share-based compensation awards |
|
|
| 602 |
|
|
| ||||||||||||
Deferred director share-based compensation |
|
|
| 64 |
|
|
| ||||||||||||
| Diluted earnings per share | $ | 75,280 | 43,828 | $ | 1.72 |
| $ | 104,328 |
| 44,979 |
| $ | 2.32 |
| |||||
2004: | |||||||||||||||||||
|
|
|
|
|
|
|
| ||||||||||||
2006: |
|
|
|
|
|
|
| ||||||||||||
| Basic earnings per share | $ | 65,066 | 42,392 | $ | 1.53 |
| $ | 80,569 |
| 43,826 |
| $ | 1.84 |
| |||||
| Effect of dilutive securities: |
|
|
|
|
|
|
| ||||||||||||
| Stock options | 648 | ||||||||||||||||||
| Deferred stock compensation | 54 | ||||||||||||||||||
Employee share-based compensation awards |
|
|
| 445 |
|
|
| ||||||||||||
Deferred director share-based compensation |
|
|
| 63 |
|
|
| ||||||||||||
| Diluted earnings per share | $ | 65,066 | 43,094 | $ | 1.51 |
| $ | 80,569 |
| 44,334 |
| $ | 1.82 |
| |||||
Page 73
12. STOCKSHARE-BASED COMPENSATION PLANS
The Corporation maintains three share-based compensation plans under which it utilizes six different forms of employee and non-employee share-based compensation awards, as explained in further detail below, which include non-qualified share options, employee stock purchase plan options, performance shares, performance restricted shares, restricted stock, and restricted stock units. Certain awards provide for accelerated vesting if there is a change in control. Prior to January 1, 2006, the Corporation applied the intrinsic value method of Accounting Principles Board Opinion No. 25, “Accounting for Stock Issued to Employees,” and related interpretations in accounting for stock-basedshare-based employee awards. Accordingly, the Corporation did not recognize compensation expense for the issuance of non-qualified share options with an exercise price equal to the market value of the underlying common stock on the date of grant or for options granted under the employee stock purchase plan. Effective January 1, 2006, the Corporation adopted SFAS 123(R) using the modified prospective transition method and therefore has not restated prior periods. Under this transition method, compensation cost associated with employee stock options recognized in 2008, 2007, and 2006 includes compensation expense related to the remaining unvested portion of non-qualified share options granted prior to January 1, 2006. The effect of the change in 2006 from applying the original provisions of SFAS 123 on income from continuing operations was $4.9 million, on income before income taxes was $4.9 million, on net income was $3.6 million, and basic and diluted earnings per share was $0.08. As the requisite service period for performance shares, restricted stock units, and performance restricted shares did not begin until after January 1, 2006, no compensation cost was recorded in prior periods.
Page 67
Additionally, SFAS 123(R) requires that cash flows resulting from tax deductions in excess of compensation cost that had been reflected as operating cash flows be reflected as financing cash flows, which amounted to $1.9 million in 2006.
The compensation cost charged against income for employee and non-employee director share-based compensation programs during 2008, 2007, and 2006 is as follows:
|
|
|
|
|
|
|
|
|
|
| ||||
| (In thousands) |
| 2008 |
| 2007 |
| 2006 |
| |||||||
| Non-qualified share options | $ | 3,558 |
| $ | 5,645 |
| $ | 6,259 |
| $ | 3,558 |
| ||
| Employee stock purchase options | 1,387 |
| 2,782 |
| 1,557 |
| 1,387 |
| ||||||
| Performance shares | 1,011 |
| 2,027 |
| 1,630 |
| 1,011 |
| ||||||
| Performance restricted shares | 260 |
| 265 |
| 260 |
| 260 |
| ||||||
| Restricted stock units | 56 | |||||||||||||
Restricted stock and restricted stock units |
| 2,348 |
| 822 |
| 56 |
| |||||||
| Other share-based payments | 349 |
| 596 |
| 384 |
| 349 |
| ||||||
| Total share-based compensation expense before income taxes | 6,621 |
| 13,663 |
| 10,912 |
| 6,621 |
| ||||||
| Income tax benefit | 1,989 |
| 4,297 |
| 3,741 |
| 1,989 |
| ||||||
| Net income impact | $ | 4,632 |
| $ | 9,366 |
| $ | 7,171 |
| $ | 4,632 |
| ||
| EPS Impact: | ||||||||||||||
| Basic | $ | 0.11 | ||||||||||||
| Diluted | $ | 0.10 | ||||||||||||
Other share-based payments include unrestricted share awards to employees and restricted stock awards to non-employee directors, who are treated as employees as prescribed by SFAS 123(R). The compensation cost recognized follows the cost of the employee, which is primarily reflected as general and administrative expenses in the consolidated statements of earnings. No cost was capitalized during 2008, 2007, or 2006.
Pro forma information regarding net earnings and earnings per share is required by SFAS 123(R), and has been determined as if the Corporation had accounted for its employee non-qualified share options and employee stock purchase plan option grants under the fair value method in prior periods. The Corporation’s pro forma information for the years ended December 31, 2005, and 2004 is as follows:
| (In thousands, except per share data) | ||||||||
Net earnings: As reported | $ | 75,280 | $ | 65,066 | ||||
| Add: Total share-based employee compensation cost, net of related tax | ||||||||
| effects, included in net income as reported | – | – | ||||||
| Deduct: Total stock-based employee compensation expense determined | ||||||||
| under fair value based method for all awards, net of related tax | ||||||||
| effects | (2,565 | ) | ( 1,862 | ) | ||||
| Pro forma | $ | 72,715 | $ | 63,204 | ||||
| Net earnings per share: | ||||||||
| As reported: | ||||||||
| Basic | $ | 1.74 | $ | 1.53 | ||||
| Diluted | $ | 1.72 | $ | 1.51 | ||||
| Pro forma: | ||||||||
| Basic | $ | 1.68 | $ | 1.49 | ||||
| Diluted | $ | 1.66 | $ | 1.47 | ||||
Page 68
1995 Long-Term Incentive Plan and 2005 Long-Term Incentive Plan
Awards under the 1995 Long-Term Incentive Plan(the “1995 LTI Plan”)consisted of three components –performance– performance units (cash), non-qualified stock options, and non-employee director grants. Under the 1995 LTI Plan approved by stockholders in 1995 and as amended in 2002 and 2003, an aggregate total of 4,000,000 shares of Common stock were approved for issuance. Issuances of Common stock to satisfy employee option exercises will be made from the Corporation’s treasury stock. The Corporation does not expect to repurchase any shares in 20072009 to replenish treasury stock for issuances made to satisfy stock option exercises.
Effective May 19, 2005, stockholders approved the 2005 Long-Term Incentive Plan(the “2005 LTI Plan”) (collectively with the 1995 LTI Plan, the “LTI Plans”), which superseded the 1995 LTI Plan. The shares that were registered and not yet issued under the 1995 LTI Plan were deregistered and then registered under the 2005 LTI Plan. There are no new awards being granted under the 1995 LTI Plan and no remaining allowable shares for future awards under the 1995 LTI Plan. As of December 31, 20062008 there were options representing a total of 1.20.8 million shares outstanding under the 1995 plan.
Awards under the 2005 LTI Plan consist of six components – performance units (cash), non-qualified stock options, performance shares, performance restricted shares, restricted stock, and restricted stock units. Under the 2005 LTI Plan, an aggregate total of 5,000,000 shares of Common stock were registered. Issuances of Common stock to satisfy employee option exercises will be made from the Corporation’s treasury stock. The Corporation does not expect to repurchase any shares in 20072009 to replenish treasury stock for issuances made to satisfy stock option exercises. No more than 200,000 shares of Common stock or 100,000 shares of restricted stock may be awarded in any year to any one participant in the 2005 LTI Plan.
Page 74
Under the LTI Plans, the Corporation awarded total performance units of 13.6 million, 11.4 million, and 8.5 million 8.0 million,in 2008, 2007, and 6.3 million in 2006, 2005, and 2004, respectively, to certain key employees. The performance units are denominated in dollars and are contingent upon the Corporation’s satisfaction of performance objectives keyed to achieving profitable growth over a period of three fiscal years commencing with the fiscal year following such awards. The anticipated cost of such awards is expensed over the three-year performance period, which amounted to $9.4 million, $7.3 million, and $7.7 million $5.3 million,in 2008, 2007, and $4.3 million in 2006, 2005, and 2004, respectively. The actual cost of the performance units may vary from the total value of the awards depending upon the degree to which the key performance objectives are met.
Under the LTI Plans, the Corporation grants non-qualified stockshare options to key employees in the fourth quarter of each year. Stock options granted under the LTI Plans expire ten years after the date of the grant and are generally exercisable as follows: up to one-third of the grant after one year, up to two-thirds of the grant after two years, and in full three years from the date of grant.
Under the 2005 LTI Plan, the Corporation granted performance shares, performance restricted shares, restricted stock, and restricted stock units to certain of the Corporation’s officers and certain key executives, which are denominated in shares based on the fair market value of the Corporation’s Common stock on the date of grant. The performance shares were granted to certain officers of the Corporation in the fourth quarter of 20062008, 2007, and 20052006 and are contingent upon the satisfaction of performance objectives keyed to achieving profitable growth over a period of three fiscal years commencing with the fiscal year following such award. The performance restricted shares were granted to certain key employees in the first quarter of 2006 and were contingent upon the satisfaction of performance objectives keyed to achieving certain operating income statistics in 2006. For those who satisfied their objectives, that were satisfied, the performance restricted shares arewere issued but restricted for an additional two years. The Corporation granted restricted stock units to two key executivesofficers in September 20062007 and restricted stock to certain key executives in November 2006, which, under the terms of the agreements, will vest in 2016, and restricted stock to officers and certain key executives in November 2008, 2007, and 2006, which, under the terms of the agreements, will completely vest in 2011, 2010, and 2009, respectively.
In May 2003, the Corporation’s Board of Directors and stockholders approved an amendment to the 1995 LTI Plan to authorize non-employee directors to participate in the plan. The amendment provided that each non-employee director could receive the equivalent of $15,000 of the Corporation’s Common stock per year. The Board of Directors approved and issued stock grants of 554 shares and 536 shares in 2005 and 2004, respectively, of the Corporation’s Common stock in 2005 to each of the eight non-employee directors. The stock grants were valued at $15,000 based on the market price of the Corporation’s Common stock on the grant date and were expensed at the time of issuance.
As of December 31, 2006,2008, there are 3.82.3 million remaining allowable shares for issuance under the 2005 LTI Plan.
Page 69
Non-Qualified Share Options
The fair value of the non-qualified share options was estimated at the date of grant using a Black-Scholes option pricing model with the assumptions noted in the following table. Expected volatilities are based on historical volatility of the Corporation’s stock and other factors. The Corporation uses historical data to estimate the expected term of options granted. The risk-free rate for periods within the contractual life of the option is based on the U.S. Treasury yield curve in effect at the time of grant.
|
|
|
|
|
|
|
|
|
|
| ||||||||||||
| 2008 |
| 2007 |
| 2006 |
| ||||||||||||||||
| 2006 | 2005 | 2004 | ||||||||||||||||||||
| Risk-free rate | 4.59 | % | 4.52 | % | 3.89 | % |
| 2.72 | % |
| 3.88 | % |
| 4.59 | % | |||||||
| Expected volatility | 22.15 | % | 23.21 | % | 31.37 | % |
| 29.37 | % |
| 23.68 | % |
| 22.15 | % | |||||||
| Expected dividends | 0.65 | % | 0.86 | % | 0.64 | % |
| 1.06 | % |
| 0.59 | % |
| 0.65 | % | |||||||
| Expected term (in years) | 7 | 7 | 7 |
| 6 |
| 7 |
| 7 |
| ||||||||||||
| Weighted-average grant-date fair value of options | $ | 12.08 | $ | 9.06 | $ | 10.72 |
| $ | 8.99 |
| $ | 17.50 |
| $ | 12.08 |
| ||||||
Page 75
A summary of employee stock option activity under the 2005 and 1995 LTI Plans is as follows:
| Weighted- |
|
|
|
|
|
|
|
|
|
|
|
|
| ||||||||||||
| Average | |||||||||||||||||||||||||
| Remaining |
| Shares |
| Weighted- |
| Weighted- |
| Aggregate |
| ||||||||||||||||
| Contractual Term | |||||||||||||||||||||||||
| in Years | |||||||||||||||||||||||||
| Outstanding at December 31, 2005 | 1,916 | $ | 18.21 | ||||||||||||||||||||||
Outstanding at December 31, 2007 |
| 1,995 |
| $ | 29.26 |
|
|
|
|
| |||||||||||||||
| Granted | 381 | 36.73 |
| 748 |
| 30.17 |
|
|
|
|
| ||||||||||||||
| Exercised | (315 | ) | 12.82 |
| (154 | ) |
| 17.15 |
|
|
|
|
| ||||||||||||
| Forfeited | (33 | ) | 24.06 |
| (25 | ) |
| 40.12 |
|
|
|
|
| ||||||||||||
| Outstanding at December 31, 2006 | 1,949 | $ | 22.60 | 7.1 | $ | 28,229 | |||||||||||||||||||
| Exercisable at December 31, 2006 | 1,249 | $ | 16.92 | 5.8 | $ | 25,171 | |||||||||||||||||||
Outstanding at December 31, 2008 |
| 2,564 |
| $ | 30.15 |
| 7.3 |
| $ | 8,312 |
| ||||||||||||||
Exercisable at December 31, 2008 |
| 1,468 |
| $ | 25.84 |
| 5.6 |
| $ | 11,081 |
| ||||||||||||||
The total intrinsic value of stock options exercised during 2008, 2007, and 2006 2005, and 2004 was $6.4$5.1 million, $8.2$8.7 million, and $9.6$6.4 million, respectively. The table above represents the Corporation’s estimate of options fully vested and/or expected to vest as expected forfeitures are not material to the Corporation and therefore are not reflected in the table above.
As noted above, non-qualified stock option awards have a graded vesting schedule. Compensation cost is recognized on a straight-line basis over the requisite service period for each separately vesting portion of each award as if each award was in-substance, multiple awards. During 2008, 2007, and 2006, compensation cost associated with non-qualified stock options of $5.6 million, $6.3 million, and $3.6 million respectively, was charged to expense. The Corporation has applied a forfeiture assumption of 7% in the calculation of such expense. As of December 31, 2006,2008, there was approximately $4.6$5.7 million of unrecognized compensation cost related to nonvested stock options, which is expected to be recognized over a weighted-average period of 0.91.6 years.
Cash received from option exercises during 2008, 2007, and 2006 2005, and 2004 was $4.1$2.6 million, $4.7$4.4 million, and $6.1$4.1 million, respectively. The total tax benefit generated from options granted prior to December 31, 2006, which were exercised during 2008, 2007, and 2006, 2005,was $1.6 million, $3.0 million, and 2004 was $2.4 million, $3.2 million and $3.5 million, respectively. During 2006, taxTax benefits received on exercised options which were subject to expenditureexpense under SFAS 123(R) have been credited to deferred taxes up to the amount of benefit recorded in the income statement, with the difference charged to additional paid in capital, while tax benefits received on exercised options that were not subject to expenditureexpense have been credited to additional paid in capital. All of the 2005 and 2004 tax benefits were credited to additional paid in capital.
Page 70
Performance Shares, Performance Restricted Shares, Restricted Stock, and Restricted Stock Units
Since 2005, the Corporation granted performance shares and performance restricted shares to certain employees under the 2005 LTI Plan, whose vesting is contingent upon meeting various departmental and company-wide performance goals, including net income targets against budget and as a percentage of sales against a peer group and operating income as a percentage of sales against budget. The nonvested shares are subject to forfeiture if established performance goals are not met, or employment is terminated other than due to death, disability, or retirement, and theretirement. The shares are nontransferable while subject to forfeiture. Restricted stock and restricted stock units have also been granted to key executives during 2008, 2007, and 2006. The nonvested restricted stock and restricted stock units are subject to forfeiture if employment is terminated other than due to death or disability, and the units are nontransferable while subject to forfeiture. A summary of the Corporation’s nonvested performance share, performance restricted share, restricted stock, and restricted stock unit activity for 20062008 is as follows:
| Weighted-Average |
|
|
|
|
|
|
|
|
|
|
|
| |||||||||||||
| Remaining | |||||||||||||||||||||||||
| Contractual Term |
| Shares/ |
| Weighted- |
| Weighted-Average |
| Aggregate |
| ||||||||||||||||
| in Years | |||||||||||||||||||||||||
| Nonvested at December 31, 2005 | 217 | $ | 27.92 | ||||||||||||||||||||||
Nonvested at December 31, 2007 |
| 629 |
| $ | 37.21 |
|
|
|
|
| |||||||||||||||
| Granted | 266 | 33.66 |
| 342 |
| 30.12 |
|
|
|
|
| ||||||||||||||
| Vested | – | – |
| — |
| — |
|
|
|
|
| ||||||||||||||
| Forfeited | (35 | ) | 29.35 |
| (10 | ) |
| 48.75 |
|
|
|
|
| ||||||||||||
| Nonvested at December 31, 2006 | 448 | $ | 31.21 | $ | 16,602 | ||||||||||||||||||||
| Expected to vest at December 31, 2006 | 290 | $ | 31.52 | $ | 10,759 | ||||||||||||||||||||
Nonvested at December 31, 2008 |
| 961 |
| $ | 34.57 |
| 2.8 |
| $ | 32,088 |
| ||||||||||||||
Expected to vest at December 31, 2008 |
| 631 |
| $ | 35.09 |
| 3.7 |
| $ | 21,077 |
| ||||||||||||||
Page 76
The grant-date fair values of performance shares and performance restricted shares are based on the closing market price of the stock on the date of grant, and compensation cost is amortized to expense on a straight-line basis over the three-year requisite service period and assumes that approximately 50% of the performance shares will be forfeited. As forfeiture assumptions change, compensation cost will be adjusted on a cumulative basis in the period of the assumption change. In the fourth quarter ofDuring 2006, it was determined that 27,000 performance restricted shares would eventually vest, and, therefore, the Corporation had expensed $0.3 million associated for such change in forfeiture estimate for2008, 2007, and 2006. These shares will remain under restriction for the next two years, and, as such, the Corporation will have additional compensation expense associated with these grants.vest on January 1, 2009. The grant date fair values of the restricted stock and restricted stock units are based on the closing market price of the stock at the date of grant. The restricted stock and restricted stock units contain only a service condition, and thus compensation cost is amortized to expense on a straight-line basis over the requisite service period, which ranged from 3.0 years to 10.1 years. As of December 31, 2006,2008, there was $7.9$13.6 million of unrecognized compensation cost related to nonvested performance shares, performance restricted shares, restricted stock, and restricted stock units, which is expected to be recognized over a period of 4.33.7 years.
Employee Stock Purchase Plan
The Corporation’s 2003 Employee Stock Purchase Plan (the “ESPP”) enables eligible employees to purchase the Corporation’s Common stock at a price per share equal to 85% of the lower of the fair market value of the Common stock at the beginning or end of each offering period. Each offering period of the ESPP lasts six months, with the first offering period commencing on January 1, 2004. Participation in the offering is limited to 10% of an employee’s base salary (not to exceed amounts allowed under Section 423 of the Internal Revenue Code), may be terminated at any time by the employee, and automatically ends on termination of employment with the Corporation. A total of 2,000,000 shares of Common stock have been reserved for issuance under the ESPP. The Common stock to satisfy the stock purchases under the ESPP will be newly issued shares of Common stock. During 2006, 195,5362008, 188,468 shares were purchased under the ESPP. As of December 31, 2006,2008, there were 1.61.2 million shares available for future offerings and the Corporation has withheld $2.5$1.5 million from employees, the equivalent of 93,000140,000 shares. Compensation cost is recognized on a straight-line basis over the six-month vesting period during which employees perform related services. The Corporation recognized $0.1$0.2 million of tax benefit associated with disqualifying dispositions during 2006,2008, all of which was credited to additional paid in capital.
Page 71
The fair value of the employee stock purchase plan options was estimated at the date of grant using a Black-Scholes option pricing model with the weighted-average assumptions noted in the following table. Expected volatilities are based on historical volatility of the Corporation’s stock. The Corporation uses historical data to estimate the expected term of options granted. The risk-free rate for periods within the contractual life of the option is based on the U.S. Treasury yield curve in effect at the time of grant.
|
|
|
|
|
|
|
|
|
|
| |||||||||||||
| 2008 |
| 2007 |
| 2006 |
| |||||||||||||||||
| 2006 | 2005 | 2004 | |||||||||||||||||||||
| Risk-free interest rate | 4.82 | % | 2.86 | % | 1.33 | % |
| 2.74 | % |
| 4.23 | % |
| 4.82 | % | ||||||||
| Expected volatility | 23.25 | % | 30.98 | % | 23.99 | % |
| 33.94 | % |
| 30.02 | % |
| 23.25 | % | ||||||||
| Expected dividend yield | 0.42 | % | 0.33 | % | 0.35 | % |
| 0.35 | % |
| 0.29 | % |
| 0.42 | % | ||||||||
| Weighted-average option life (in years) | 0.5 | 0.5 | 0.5 |
| 0.5 |
| 0.5 |
| 0.5 |
| |||||||||||||
| Weighted-average grant-date fair value of options | $6.52 | $6.68 | $5.61 |
| $ | 11.50 |
| $ | 11.61 |
| $ | 6.52 |
| ||||||||||
1996 Stock Plan for Non-Employee Directors and 2005 Stock Plan for Non-Employee Directors
The 2005 Stock Plan for Non-Employee Directors (“2005 Stock Plan”), approved by the stockholders in 2005, provided for the grant of stock awards and, at the option of the non-employee directors, the deferred payment of regular stipulated compensation and meeting fees in equivalent shares. Under the 2005 Stock Plan, the Corporation’s non-employee directors each receive an annual restricted stock award, which is subject to a three-year restriction period commencing on the date of the grant. For 2008, 2007, and 2006, the value of the award granted in the first quarter was $50,000.$50,000 per director. These restricted stock awards are subject to forfeiture if the non-employee director resigns or retires by reason of his or her decision not to stand for re-election prior to the lapsing of all restrictions, unless the restrictions are otherwise removed by the Committee on Directors and Governance. The cost of the restricted stock awards will be amortized over the three year restriction period from the date of grant, or such shorter restriction period as determined by the removal of such restrictions. Newly elected non-employee directors also receive a one-time restricted stock award, which during 2008, 2007, and 2006 was valued at $25,000 and awarded in the second quarter.$25,000. The total number of shares of Common stock available for grant under the 2005 Stock Plan may not exceed 100,000 shares. During 2008, 2007 and 2006, the Corporation awarded 11,628, 10,642, and
Page 77
15,320, respectively, shares of restricted stock under the 2005 Stock Plan, of which 6,120, 7,512, and 9,100 shares, respectively, have been deferred by certain directors.
The 1996 Stock Plan for Non-Employee Directors (“1996 Stock Plan”), approved by the stockholders in 1996, authorized the grant of restricted stock awards and, at the option of the non-employee directors, the deferred payment of regular stipulated compensation and meeting fees in equivalent shares. Pursuant to the terms of the 1996 Stock Plan, non-employee directors received an initial restricted stock grant of 7,224 shares in 1996, which became unrestricted in 2001. Additionally, on the fifth anniversary of the initial grant, those non-employee directors who remained a non-employee director received an additional restricted stock grant equal to the product of increasing $13,300 at an annual rate of 2.96%, compounded monthly from the effective date of the 1996 Stock Plan. In 2001, the amount per director was calculated to be $15,419, representing a total additional grant of 3,110 restricted shares. The cost of the restricted stock awards is being amortized over the five-year restriction period from the date of grant. Prior to the effective date of the 2005 Stock Plan, newly elected non-employee directors received similar compensation under the terms of the 1996 Stock Plan upon their election to the Board.
Pursuant to election by non-employee directors to receive shares in lieu of payment for earned and deferred compensation under the 2005 and 1996 Stock Plans, the Corporation had provided for an aggregate additional 62,98862,077 and 63,808 shares at an average price of $20.38$25.51 and $25.96, respectively, as of December 31, 2006.2008 and 2007, respectively. During 2006,2008 and 2007, the Corporation issued 7,51911,407 and 13,002 shares, respectively, in compensation pursuant to such elections.
Page 72
13. ENVIRONMENTAL COSTS
The Corporation has continued the operation of the ground water and soil remediation activities at the Wood-Ridge, New Jersey, site through 2006.2008. The cost of constructing and operating this site was provided for in 1990 when the Corporation established a reserve to remediate the property. Costs for operating and maintaining this site totaled $0.7 million in 2006, $0.8 million in 2005, and $1.5 million in 2004, all of which have been charged against the previously established reserve. The Corporation increased the remediation reserve by $0.3 million, $0.2 million, and $0.3 million in 2006, 2005, and 2004, respectively, based upon revised operating projections. The reserve balance as of December 31, 2006,2008, was $6.0 million.million, which was a slight decrease over the prior year balance due to continuing payments against the established liability. Even though this property was sold in December 2001, the Corporation retained the responsibility for this remediation in accordance with the sale agreement.
The Corporation has been named as a potentially responsible party (“PRP”), as have many other corporations and municipalities, in a number of environmental clean-up sites. The Corporation continues to make progress in resolving these claims through settlement discussions and payments from established reserves. Significant sites remaining open at the end of the year are: Caldwell Trucking landfill superfund site, Fairfield, New Jersey; Sharkey landfill superfund site, Parsippany, New Jersey; Amenia landfill site, Amenia, New York; and Chemsol, Inc. superfund site, Piscataway, New Jersey. The Corporation believes that the outcome for any of these remaining sites will not have a materially adverse effect on the Corporation’s results of operations or financial condition.
In the first quarter of 2005, the Corporation sold its Fairfield, New Jersey, property, which was formerly an operating facility for the Corporation’s Motion Control segment. Under the sale agreement, the Corporation has retained the responsibility to continue the ongoing environmental remediation on the property. At the date of the sale, remediation costs associated with the Fairfield site were anticipated to be incurred over three to five years with an estimated cost of $1.5 million. Costs for operating and maintaining this site totaled $0.7 million in 2006 and $0.4 million in 2005. During 2006, the Corporation increased the remediation reserve by $0.7 million based upon revised operating cost projections. As of December 31, 2006,2008, the reserve balance was $1.1$0.7 million.
In the fourth quarter of 2004, the Corporation increased the remediation reserve related to the Caldwell Trucking landfill superfund site by $4.4 million. The increase related to the estimated groundwater remediation for this site, which could span over 30 years. During 2006, the Corporation increased the remediation reserve by $0.6 million based upon revised operating projections. Through 2006,2007, the majority of the costs for this site have been for the soil remediation.
In 2003, As of December 31, 2008, the Corporation responded to a U.S. EPA Request For Information concerning the Lower Passaic River site. The Corporation subsequently joined a cooperating parties group to share costs relating to the site and in 2004 signed an agreement with the other group members providing for an EPA study of the site. In 2006, the Corporation withdrew from the cooperating parties group after determining that its operations did not contribute materially to the conditions of the Lower Passaic River site.reserve balance was $5.4 million.
The Corporation maintains several Nuclear Regulatory Commission (“NRC”) licenses necessary for the continued operation of one operating facility. In connection with these licenses, the NRC requires financial assurance from the Corporation in the form of a parent company guarantee representing estimated environmental decommissioning and remediation costs associated with the commercial operations covered by the licenses. In addition, the Corporation has obligations for additional environmental remediation costs at this facility, which are ongoing. As of December 31, 2006,2008, the balance in this reserve is $10.7was $9.6 million. In 2007 the Corporation recorded a receivable of $1.9 million for the recovery from the U.S. Government and was based on a pending settlement for environmental remediation costs associated with our EMD facility in Cheswick, Pennsylvania. The Corporation deemed the recovery probable per SOP 96-1 “Environmental Remediation Liabilities,” and subsequently received
Page 78
the funds in the fourth quarter of 2008. The Corporation obtained partial environmental insurance coverage specifically for this facility. The policy provides coverage for losses due to on or off-site pollution conditions, which are pre-existing and unknown.
The Corporation’s aggregate environmental obligation at December 31, 20062008 was $23.7$22.2 million compared to $25.3$23.0 million at December 31, 2005.2007. Approximately 75% of the Corporation’s environmental reserves as of December 31, 20062008 represent the current value of anticipated remediation costs and are not discounted primarily due to the uncertainty of timing of expenditures. The remaining environmental reserves are discounted using a rate of 4% to reflect the time value of money since the amount and timing of cash payments for the liability are reliably determinable. All environmental reserves exclude any potential recovery from insurance carriers or third-party legal actions. As of December 31, 2006,2008, the undiscounted cash flows associated with the discounted reserves were $9.5$9.2 million and are anticipated to be paid over the next 30 years.
Page 73
14. PENSION AND OTHER POSTRETIREMENT BENEFIT PLANS
The Corporation maintains ninethirteen separate and distinct pension and other postretirement benefit plans, consisting of sixfive domestic pension and other postretirement benefit plans and threeeight separate foreign pension plans. The Corporation maintains the following domestic plans: a qualified pension plan, a non-qualified pension plan, and a postretirement health-benefits plan (the “Curtiss-Wright Plans”). As a result of the acquisition of EMD in 2002, the Corporation obtained three unfunded pension and postretirement benefit plans (the “EMD Plans”), similar in nature to those listed above. The EMD qualified plan was subsequently merged into the Curtiss-Wright plan, as described below. The unfunded status of the acquired EMD Plans was recorded as a liability at the date of acquisition. During 2003, the funds associated with the qualified pension plans of both the Curtiss-Wright Plans and EMD Plans were placed under a master trust fund, from which the Corporation directs the investment strategy for both plans.
In February 2007, a plan amendment was executed with an effective date of January 1, 2007 merging the Curtiss-Wright Electro-Mechanical Corporation (“EMD”) Pension Plan into the Curtiss-Wright Pension Plan, hereafter named the Curtiss-Wright Pension Plan (“CW Pension Plan”). The merger has no effect on the level of plan benefits provided to participants or the management of plan assets since the funds for both plans were historically managed under one master trust. As a result of the merger, the assets and liabilities of the respective plans have been combined in the consolidated balance sheet, resulting in a reclassification of accrued EMD pension liability of $32.9 million to reduce the Curtiss-Wright prepaid pension asset.
The foreign plans consist of twothree defined benefit pension plans in the United Kingdom, two in Mexico assumed in a 2007 acquisition, and one plan each in Canada, Switzerland, and Norway. The Norway plan and one of the plans in the United Kingdom were assumed in 2008 acquisitions. The total projected benefit obligation related to all foreign plans is $55.8 million as of December 31, 2008. Each plan is further described below.
In September 2006, the FASB issued SFAS No. 158, “Employers’ Accounting for Defined Benefit Pension and Other Postretirement Plans” (“FAS 158”). This statement requires companies to recognizeDomestic Plans
The Curtiss-Wright Plans
As a net liability or asset to report the funded status of their defined benefit pension and other postretirement benefit plans (“the Plans”), with the offsetting adjustment recorded to Accumulated Other Comprehensive Income, net of tax. The financial statements and accompanying disclosures reflect the initial recognitionresult of the funded status as of December 31, 2006, and include additional disclosures required byqualified plan merger, the statement. The following table is a summary of the effects of the transition to FAS 158:
Incremental Effect of Applying FAS 158on Individual Line Items in the Statement of Financial Positionas of December 31, 2006
Adjustments | ||||||||||
| Prepaid pension costs | $ | 71,115 | $ | 21,147 | $ | 92,262 | ||||
| Total assets | 1,571,009 | 21,147 | 1,592,156 | |||||||
| Other current liabilities | 19,606 | 2,281 | 21,887 | |||||||
| Accrued pension & other postretirement benefit costs | 75,862 | (4,856 | ) | 71,006 | ||||||
| Deferred income taxes | 48,019 | 9,036 | 57,055 | |||||||
| Accumulated other comprehensive income | 41,120 | 14,686 | 55,806 | |||||||
| Total stockholders' equity | 747,388 | 14,686 | 762,074 | |||||||
Domestic PlansThe Curtiss-Wright Plans
The Corporation maintains a non-contributory defined benefit pension plan, the CW Pension Plan, covering substantially all employees other thanunder four benefit formulas: a non-contributory non-union and union formula for all Curtiss-Wright (“CW”) employees except for those employees covered byof the Curtiss-Wright Electro-Mechanical Corporation (“EMD”) and a contributory union and non-union benefit formula for participants of the former EMD Pension Plan described below. Plan.
The Curtiss-Wright Retirement Plan (the “CW Pension Plan”) formula for CW non-union employees is based on years of credited service, and the five highest consecutive years’ compensation during the last ten years of service, and a “cash balance” benefit. UnionCW union employees who have negotiated a benefit under the CW Pension Plan are entitled to a benefit based on years of service multiplied by a monthly pension rate. Employees become participants under the CW Pension Plan after one year of service and, due to recent changes in pension law, are vested after fivethree years of service. The formula for EMD employees covers both union and non-union employees and is designed to satisfy the requirements of relevant collective bargaining agreements. Employee contributions are withheld each pay period and are equal to 1.5% of salary. The benefits for the EMD employees are based on years of service and compensation.
At December 31, 2006,2008, the Corporation had a noncurrent pension liability of $72.5 million, while in 2007 the Corporation had prepaid pension costs of $92.3 million, including the impact of FAS 158. At December 31, 2005, the$73.9 million. The Corporation had prepaid pension costs of $76.0 million. Due to the funded status, the Corporation doesdid not expect to contribute funds to the CW Pension Plan in 2007.2008 and does not expect to make contributions in 2009.
Page 7479
The Corporation also maintains a non-qualified restoration plan (the “CW Restoration Plan”) covering those employees whose compensation or benefits exceed the IRS limitation for pension benefits. Benefits under the CW Restoration Plan are not funded, and, as such, the Corporation had an accrued pension liability of $1.9$11.7 million and $3.8 million as of December 31, 2006 including the impact of FAS 158. At December 31, 2005, the Corporation had an accrued liability of $0.7 million.2008 and 2007, respectively. The Corporation’s contributions to the CW Restoration Plan are not expected to be material$0.9 million in 2007.2009.
The Corporation provides postretirement health benefits to certain employees (the “CW Retirement Plan”). In 2002, the Corporation restructured the postretirement medical benefits for certain active employees, effectively freezing the plan. The obligation associated with these active employees was transferred to the CW Pension Plan. The plan continues to be maintained for retired employees. As of December 31, 2006,2008 and 2007, the Corporation had an accrued postretirement benefit liability of $0.8$0.7 million including the impact of FAS 158. At December 31, 2005, the accrued liability was $1.0 million.and $0.7 million, respectively. Benefits under the plan are not funded. The Corporation’s contributions to the CW Retirement Plan are not expected to be material in 2007.2009.
The EMD Plans
The Corporation maintains the Curtiss-Wright Electro-Mechanical Corporation Pension Plan (the “EMD Pension Plan”), a qualified contributory defined benefit pension plan that covers all Curtiss-Wright Electro-Mechanical Corporation employees. The EMD Pension Plan covers both union and non-union employees and is designed to satisfy the requirements of relevant collective bargaining agreements. Employee contributions are withheld each pay period and are equal to 1.5% of salary. The benefits under the EMD Pension Plan are based on years of service and compensation. At December 31, 2006 the Corporation had an accrued pension liability of $32.9 million, including the impact of FAS 158. At December 31, 2005, the accrued liability for the EMD Pension Plan was $30.5 million. The Corporation expects to contribute $3.2 million, the estimated minimum required amount, to the EMD Pension Plan in 2007.
Contributions are expected to decrease in 2007 due to the anticipated merger of the CW and EMD Pension Plans. The plan amendment was executed in February 2007 with an effective date retroactive to January 1, 2007. The merger has no effect on the level of plan benefits provided to participants or the management of plan assets since the funds for both plans were historically managed under one master trust.
The Corporation maintains the Curtiss-Wright Electro-Mechanical Corporation Non-Qualified Plan (the “EMD Supplemental Plan”), a non-qualified, non-contributory, non-funded supplemental retirement plan for eligible EMD key executives. The EMD Supplemental Plan provides for periodic payments upon retirement that are based on total compensation (including amounts in excess of qualified plan limits) and years of service and are reduced by benefits earned from certain other pension plans in which the executives participate. At December 31, 2006,2008 and 2007, the Corporation had an accrued pension liability of $2.6$2.4 million including the impact of FAS 158. At December 31, 2005, the accrued liability for the EMD Supplemental Plan wasand $2.5 million.million, respectively. The Corporation’s contributions to the EMD Supplemental Plan are not expected to be material in 2007.2009.
The Corporation, through an administration agreement with Westinghouse, maintains the Westinghouse Government Services Group Welfare Benefits Plan (the “EMD Retirement Plan”), a retiree health and life insurance plan for substantially all of the Curtiss-Wright Electro-Mechanical Corporation employees. The EMD Retirement Plan provides basic health and welfare coverage on a non-contributory basis. Benefits are based on years of service and are subject to certain caps. The Corporation had an accrued postretirement benefit liability at December 31, 20062008 and 2007 of $28.8$28.1 million including the impact of FAS 158. At December 31, 2005, the accrued liability of the EMD Retirement Plan was $39.5 million.and $30.5 million, respectively. Pursuant to the Asset Purchase Agreement, the Corporation has a discounted receivable from Washington Group International to reimburse the Corporation for a portion of these postretirement benefit costs. At December 31, 20062008 and 2005,2007, the discounted receivable included in other assets was $4.5$3.5 million and $4.9$4.0 million, respectively. The Corporation expects to contribute $2.0$1.8 million to the EMD Retirement Plan during 2007.2009.
Page 75
Foreign Plans
Indal Technologies Hourly Plan (Canada)
The Pension Plan for Hourly Employees of Indal Technologies, Inc. (“Indal Plan”) commenced on March 1, 2005 in connection with the acquisition of Indal by the Corporation. This non-contributory defined benefit plan provides monthly benefits to eligible members equal to a member’s credited service multiplied by a fixed dollar amount. As of December 31, 2006,2008 and 2007, the Corporation had an accrued pension liability of $0.2 million (including the impact of FAS 158), while at December 31, 2005 the Corporation had a prepaid asset of $0.2 million.and $0.4 million, respectively. The Corporation’s contributions to the Indal Plan are not expected to be material$0.3 million in 2007.2009.
Metal Improvement Company – Salaried Staff Pension Scheme (U.K.)
The Corporation maintains the Salaried Staff Pension scheme (“MIC Plan”) for the benefit of Metal Treatment employees in the U.K. This contributory plan provides defined benefits to eligible members equal to one-sixtieth of final pensionable salary for each year of pensionable service. Members contribute at the rate of 6% of their pensionable salary, and the Corporation funds the balance of the cost to provide benefits. Members are eligible for early retirement with reduced benefits. The plan provides for early retirement at reduced benefits and iswas closed to new entrants.entrants as of January 1, 2004. As of December 31, 2006,2008 and 2007, the Corporation had an accrued pension liability of $4.7$4.6 million including the impact of FAS 158. At December 31, 2005, the accrued liability was $0.3 million.and $3.1 million, respectively. The Corporation’s contributions to the MIC Plan are expected to be approximately $1.5$0.9 million in 2007.2009.
Page 80
Penny & Giles Pension Plan (U.K.)
The Penny & Giles Pension Plan (“P&G Plan”) is a contributory plan that provides for both defined benefit and defined contribution benefits. Defined benefit members are entitled to final salary related benefits equal to one-sixtieth of final pensionable salary for each year of pensionable service. The P&G Plan provides for early retirement at reduced benefits and iswas closed to new entrants.entrants at time of acquisition in 2002. The following disclosures include information for the Penny & Giles defined benefit section only, which represents the majority of the P&G Plan’s costs. As of December 31, 2006,2008 and 2007, the Corporation had an accrued pension liability of $1.4 million including the impact of FAS 158. At December 31, 2005, the accrued liability for the plan was $0.3 million.and $0.8 million, respectively. The Corporation’s contributions to the P&G Plan are expected to be approximately $1.1$1.0 million in 2009.
Mechetronics Limited Retirement Benefits Scheme (UK)
The Corporation assumed defined benefit obligations as a result of the acquisition of Mechetronics on October 1, 2008. The plan, which covers 20 employees as of December 31, 2008 and is closed to new entrants, is based on Final Pensionable Salary and years of service. As of December 31, 2008, the Corporation had an accrued pension liability of $3.8 million. The Corporation’s contributions to the plans are expected to be $0.4 million in 2009.
Curtiss Wright Antriebstechnik GmbH (“CWAT”) Pension Plan (Switzerland)
CWAT sponsors a defined contribution plan covering 84 employees as of December 31, 2008. Under Swiss Law, there is a guaranteed minimum benefit requirement which must be valued as a defined benefit obligation for US GAAP purposes. As of December 31, 2008, the Corporation had an accrued pension liability of $1.3 million, while as of December 31, 2007 the Corporation recognized a pension asset of an immaterial amount. The Corporation’s contributions to the plans are expected to be $0.7 million in 2009.
Power Systems Inc. (“PSI”) de Mexico Pension Plans (subsidiary of IMC Magnetics, Inc.)
The Corporation assumed defined benefit obligations as a result of the acquisition of IMC Magnetics in 2007. Under Federal Labor Law in Mexico, all full-time employees of PSI de Mexico are entitled to benefits under two plans: Seniority Premium and Termination Indemnity. The Seniority Premium plan enables employees to receive benefits in the event of death, disability, dismissal, voluntary separation, and retirement. Benefits under voluntary separation and retirement are subject to certain requirements. The benefit is equal to 12 days of salary per year of accreditable service, payable or in lump sum. The Termination Indemnity enables employees to receive benefits in the event of dismissal or retirement. The benefit is equal to three months of salary plus bonuses, plus twenty days of salary plus bonus per year of accredited service, payable in lump sum. As of December 31, 2008 and 2007, the Corporation had an accrued pension liability of $0.1 million and $0.2 million, respectively. The Corporation’s contributions to the plans are expected to be immaterial in 2009.
VMETRO ASA Pension Plan
The Corporation assumed defined benefit obligations as a result of the acquisition of VMETRO on October 15, 2008. The group pension plan entitles the employees of the Norwegian companies with future benefits based on years of service, the wage level at time of retirement, and benefits from the national insurance plan. As of December 31, 2008, the Corporation had an accrued pension liability of $1.8 million. The Corporation’s contributions to the plan are expected to be approximately $0.4M in 2009.
In the following table, the pension benefits information is a consolidated disclosure of all domestic and foreign plans described above. The postretirement benefits information includes the domestic CW and EMD postretirement benefit plans, as there are no foreign postretirement benefit plans. All plans were valued using a December 31, 2008 measurement date to comply with the requirements of SFAS No.158 to measure plan assets and benefit obligations as of the date of the employer’s fiscal year-end statement of financial position.
Page 7681
|
|
|
|
|
|
|
|
|
|
|
|
|
| ||||||||||||||||
|
| Pension Benefits |
| Postretirement Benefits |
| ||||||||||||||||||||||||
| (In thousands) |
| 2008 |
| 2007 |
| 2008 |
| 2007 |
| ||||||||||||||||||||
| Change in benefit obligation: |
|
|
|
|
|
|
|
|
| ||||||||||||||||||||
| Benefit obligation at beginning of year | $ | 305,599 | $ | 283,234 | $ | 30,680 | $ | 38,320 |
| $ | 368,893 |
| $ | 325,828 |
| $ | 31,146 |
| $ | 29,632 |
| ||||||||
| Service cost | 19,408 | 16,251 | 530 | 569 |
| 23,197 |
| 20,236 |
| 684 |
| 623 |
| ||||||||||||||||
| Interest cost | 17,714 | 17,545 | 1,645 | 1,816 |
| 21,069 |
| 19,085 |
| 1,778 |
| 1,744 |
| ||||||||||||||||
| Plan participants' contributions | 1,595 | 1,564 | 340 | 189 | |||||||||||||||||||||||||
Plan participants’ contributions |
| 2,249 |
| 1,703 |
| 430 |
| 359 |
| ||||||||||||||||||||
| Amendments | 2,086 | 343 | – | – |
| 1,895 |
| 382 |
| — |
| — |
| ||||||||||||||||
| Actuarial loss (gain) | (108 | ) | 9,464 | (1,591 | ) | (8,330 | ) | ||||||||||||||||||||||
Actuarial (gain) loss |
| (11,125 | ) |
| 9,275 |
| (3,201 | ) |
| 1,076 |
| ||||||||||||||||||
| Benefits paid | (23,069 | ) | (20,669 | ) | (1,972 | ) | (1,884 | ) |
| (22,224 | ) |
| (22,532 | ) |
| (2,684 | ) |
| (2,331 | ) | |||||||||
Acquisitions/transferred liabilities |
| 16,466 |
| 14,068 |
| — |
| — |
| ||||||||||||||||||||
Retiree drug subsidy received |
| — |
| — |
| 251 |
| 43 |
| ||||||||||||||||||||
| Settlements | (1,301 | ) | – | – | – |
| (1,176 | ) |
| — |
| — |
| — |
| ||||||||||||||
| Special termination benefits | 723 | – | – | – | |||||||||||||||||||||||||
Plan measurement date change |
| 10,632 |
| — |
| 414 |
| — |
| ||||||||||||||||||||
| Currency translation adjustments | 3,181 | (2,133 | ) | – | – |
| (11,163 | ) |
| 848 |
| — |
| — |
| ||||||||||||||
| Benefit obligation at end of year | 325,828 | 305,599 | 29,632 | 30,680 |
| 398,713 |
| 368,893 |
| 28,818 |
| 31,146 |
| ||||||||||||||||
| |||||||||||||||||||||||||||||
| Change in plan assets: |
|
|
|
|
|
|
|
|
| ||||||||||||||||||||
| Fair value of plan assets at beginning of year | 352,239 | 314,430 | – | – |
| 431,336 |
| 373,678 |
| — |
| — |
| ||||||||||||||||
| Actual return on plan assets | 32,211 | 45,584 | – | – |
| (123,965 | ) |
| 57,439 |
| — |
| — |
| |||||||||||||||
| Employer contribution | 9,632 | 12,787 | 1,632 | 1,695 |
| 3,785 |
| 6,417 |
| 2,254 |
| 1,972 |
| ||||||||||||||||
| Plan participants' contribution | 1,595 | 1,564 | 340 | 189 | |||||||||||||||||||||||||
Plan participants’ contributions |
| 2,249 |
| 1,703 |
| 430 |
| 359 |
| ||||||||||||||||||||
Acquisitions/transferred liabilities |
| 9,707 |
| 13,943 |
| — |
| — |
| ||||||||||||||||||||
| Benefits paid | (23,069 | ) | (20,669 | ) | (1,972 | ) | (1,884 | ) |
| (22,224 | ) |
| (22,532 | ) |
| (2,684 | ) |
| (2,331 | ) | |||||||||
| Settlements | (1,301 | ) | – | – | – |
| (1,176 | ) |
| — |
| — |
| — |
| ||||||||||||||
Plan measurement date change |
| 7,315 |
| — |
| — |
| — |
| ||||||||||||||||||||
| Currency translation adjustments | 2,371 | (1,457 | ) | – | – |
| (8,136 | ) |
| 688 |
| — |
| — |
| ||||||||||||||
| Fair value of plan assets at end of year | 373,678 | 352,239 | – | – |
| 298,891 |
| 431,336 |
| — |
| — |
| ||||||||||||||||
|
|
|
|
|
|
|
|
| |||||||||||||||||||||
| Funded status | 47,850 | 46,640 | (29,632 | ) | (30,680 | ) |
| (99,822 | ) |
| 62,443 |
| (28,818 | ) |
| (31,146 | ) | ||||||||||||
|
|
|
|
|
|
|
|
| |||||||||||||||||||||
| Amounts recognized in the statement of financial | |||||||||||||||||||||||||||||
| position consist of: | |||||||||||||||||||||||||||||
Amounts recognized in the statement of financial position consist of: |
|
|
|
|
|
|
|
|
| ||||||||||||||||||||
| Noncurrent assets | 92,262 | 76,202 | – | – |
| — |
| 73,947 |
| — |
| — |
| ||||||||||||||||
| Current liabilities | (157 | ) | – | (2,124 | ) | – |
| (1,048 | ) |
| (411 | ) |
| (1,830 | ) |
| (1,945 | ) | |||||||||||
| Noncurrent liabilities | (43,494 | ) | (34,283 | ) | (27,508 | ) | (40,509 | ) |
| (98,774 | ) |
| (10,300 | ) |
| (26,988 | ) |
| (29,201 | ) | |||||||||
| Net amount recognized in statement of financial | |||||||||||||||||||||||||||||
| position: | $ | 48,611 | $ | 41,919 | $ | (29,632 | ) | $ | (40,509 | ) | |||||||||||||||||||
| Amounts recognized in accumulated other financial | |||||||||||||||||||||||||||||
| comprehensive income consist of: | |||||||||||||||||||||||||||||
Net amount recognized in statement of financial position: |
| $ | (99,822 | ) | $ | 63,236 |
| $ | (28,818 | ) | $ | (31,146 | ) | ||||||||||||||||
|
| ||||||||||||||||||||||||||||
Amounts recognized in accumulated other comprehensive income (AOCI) consist of: |
|
|
|
|
|
|
|
|
| ||||||||||||||||||||
| Net actuarial loss (gain) | (13,431 | ) | N/A | (10,877 | ) | N/A |
| 107,306 |
| (33,771 | ) |
| (11,720 | ) |
| (9,179 | ) | ||||||||||||
| Prior service cost (credit) | 3,366 | N/A | – | N/A | |||||||||||||||||||||||||
| Net amount recognized in accumulated OCI | $ | (10,065 | ) | N/A | $ | (10,877 | ) | N/A | |||||||||||||||||||||
Prior service cost |
| 4,385 |
| 3,289 |
| — |
| — |
| ||||||||||||||||||||
| Amounts in AOCI expected to be recognized | |||||||||||||||||||||||||||||
| in net periodic cost in the coming year: | |||||||||||||||||||||||||||||
Net amount recognized in AOCI |
| $ | 111,691 |
| $ | (30,482 | ) | $ | (11,720 | ) | $ | (9,179 | ) | ||||||||||||||||
|
| ||||||||||||||||||||||||||||
Amounts in AOCI expected to be recognized in net periodic cost in the coming year: |
|
|
|
|
|
|
|
|
| ||||||||||||||||||||
| Loss (gain) recognition | 421 | N/A | (522 | ) | N/A |
| 685 |
| 175 |
| (763 | ) |
| (526 | ) | ||||||||||||||
| Prior service cost recognition | 452 | N/A | – | N/A |
| 633 |
| 484 |
| — |
| — |
| ||||||||||||||||
| Accumulated benefit obligation | $ | 283,005 | $ | 270,594 | N/A | N/A |
| $ | 349,627 |
| $ | 322,200 |
| N/A |
| N/A |
| ||||||||||||
| Information for pension plans with an accumulated | |||||||||||||||||||||||||||||
| benefit obligation in excess of plan assets | |||||||||||||||||||||||||||||
Information for pension plans with an accumulated benefit obligation in excess of plan assets |
|
|
|
|
|
|
|
|
| ||||||||||||||||||||
| Projected benefit obligation | 171,824 | 159,789 | N/A | N/A |
| 387,441 |
| 27,588 |
| N/A |
| N/A |
| ||||||||||||||||
| Accumulated benefit obligation | 155,457 | 143,227 | N/A | N/A |
| 342,637 |
| 23,784 |
| N/A |
| N/A |
| ||||||||||||||||
| Fair value of plan assets | 129,132 | 114,348 | N/A | N/A |
| 289,051 |
| 17,385 |
| N/A |
| N/A |
| ||||||||||||||||
| Weighted-average assumptions in determination of | |||||||||||||||||||||||||||||
| benefit obligation: | |||||||||||||||||||||||||||||
Weighted-average assumptions in determination of benefit obligation: |
|
|
|
|
|
|
|
|
| ||||||||||||||||||||
| Discount rate | 5.91 | % | 5.70 | % | 5.99 | % | 5.74 | % |
| 5.89 | % |
| 5.87 | % |
| 6.00 | % |
| 5.99 | % | |||||||||
| Rate of compensation increase | 4.00 | % | 3.54 | % | N/A | N/A |
| 4.02 | % |
| 4.03 | % |
| N/A |
| N/A |
| ||||||||||||
| Health care cost trends: |
|
|
|
|
|
|
|
|
| ||||||||||||||||||||
| Rate assumed for subsequent year | N/A | N/A | 11.50 | % | 13.00 | % |
| N/A |
| N/A |
| 8.50 | % |
| 9.50 | % | |||||||||||||
| Ultimate rate reached in 2010 | N/A | N/A | 5.50 | % | 5.50 | % | |||||||||||||||||||||||
| Measurement date | September 30 | October 31 | September 30 | October 31 | |||||||||||||||||||||||||
Ultimate rate reached in 2012 |
| N/A |
| N/A |
| 5.50 | % |
| 5.50 | % | |||||||||||||||||||
Page 7782
The following table details the components of net periodic pension expense for all Pension Plans:
|
|
|
|
|
|
|
|
|
|
| ||||||||||||
| Components of net periodic benefit expense: |
|
|
|
|
|
|
| |||||||||||||||
| (In thousands) |
| 2008 |
| 2007 |
| 2006 |
| |||||||||||||||
| Service cost | $ | 19,408 | $ | 16,251 | $ | 14,419 |
| $ | 23,197 |
| $ | 20,236 |
| $ | 19,408 |
| ||||||
| Interest cost | 17,714 | 17,573 | 15,755 |
| 21,069 |
| 19,085 |
| 17,714 |
| ||||||||||||
| Expected return on plan assets | (26,581 | ) | (25,637 | ) | (25,089 | ) |
| (30,170 | ) |
| (28,213 | ) |
| (26,581 | ) | |||||||
| Amortization of prior service cost | 452 | 151 | 112 |
| 635 |
| 481 |
| 452 |
| ||||||||||||
| Amortization of transition obligation | (4 | ) | (4 | ) | (4 | ) |
| — |
| — |
| (4 | ) | |||||||||
| Recognized net actuarial loss | 510 | 406 | 33 |
| 718 |
| 512 |
| 510 |
| ||||||||||||
| Cost of settlement | 832 | - | 257 |
| 119 |
| — |
| 832 |
| ||||||||||||
| Special termination benefits | 723 | - | - |
| — |
| — |
| 723 |
| ||||||||||||
| Net periodic benefit expense | $ | 13,054 | $ | 8,740 | $ | 5,483 |
| $ | 15,568 |
| $ | 12,101 |
| $ | 13,054 |
| ||||||
| Weighted-average assumptions in determination of net periodic | ||||||||||||||||||||||
| benefit cost: | ||||||||||||||||||||||
|
|
|
|
|
|
|
| |||||||||||||||
Weighted-average assumptions in determination of net periodic benefit cost: |
|
|
|
|
|
|
| |||||||||||||||
| Discount rate | 5.70 | % | 5.98 | % | 6.12 | % |
| 5.87 | % |
| 5.91 | % |
| 5.70 | % | |||||||
| Expected return on plan assets | 8.45 | % | 8.46 | % | 8.49 | % |
| 8.29 | % |
| 8.43 | % |
| 8.45 | % | |||||||
| Rate of compensation increase | 3.54 | % | 3.51 | % | 3.37 | % |
| 4.03 | % |
| 4.00 | % |
| 3.54 | % | |||||||
The “Cost of settlement” and “Special termination benefits” indicated above represent events that are accounted for under SFAS No. 88, "Employers'”Employers” Accounting for Settlements and Curtailments of Defined Benefit Pension Plans and for Termination Benefits"Benefits (“FAS 88”). The settlement charge in 2008 is resulting from the retirement of an employee at CWAT in Switzerland. The 2006 settlement charge is resulting from the retirement of a key executive and his subsequent election to receive his pension benefit as a single lump sum payout. As a result of this single lump sum payout, special settlement requirements under FAS 88 have been triggered. The special termination benefits charge resulted from benefits offered for a limited period of time to certain employees in the Motion Control segment who were subject to a reduction in workforce with the Corporation during 2006. Consistent with the requirements of FAS 88, this liability is to be recognized when the employees accept the offer and the amount can be reasonably estimated.
The following table details the components of net periodic expense for the CW and EMD RetirementPostretirement Benefit Plans:
| (In thousands) | ||||||||||||
| Service cost | $ | 530 | $ | 569 | $ | 789 | ||||||
| Interest cost | 1,645 | 1,816 | 2,395 | |||||||||
| Recognized net actuarial gain | (533 | ) | (397 | ) | (73 | ) | ||||||
| Net periodic benefit expense | $ | 1,642 | $ | 1,988 | $ | 3,111 | ||||||
| Weighted-average assumptions in determination of net periodic benefit | ||||||||||||
| cost: | ||||||||||||
| Discount rate | 5.74 | % | 5.98 | % | 6.24 | % | ||||||
| Health care cost trends: | ||||||||||||
| Current year rate | 13.00 | % | 9.70 | % | 11.40 | % | ||||||
| Ultimate rate reached in 2010, 2010, and 2007, respectively | 5.50 | % | 5.50 | % | 6.16 | % | ||||||
|
|
|
|
|
|
|
|
|
|
|
(In thousands) |
| 2008 |
| 2007 |
| 2006 |
| |||
Service cost |
| $ | 684 |
| $ | 623 |
| $ | 530 |
|
Interest cost |
|
| 1,778 |
|
| 1,744 |
|
| 1,645 |
|
Recognized net actuarial gain |
|
| (575 | ) |
| (632 | ) |
| (533 | ) |
Net periodic benefit expense |
| $ | 1,887 |
| $ | 1,735 |
| $ | 1,642 |
|
Weighted-average assumptions in determination of net periodic benefit cost:
|
|
|
|
|
|
|
|
|
|
|
Discount rate |
|
| 5.99 | % |
| 5.99 | % |
| 5.74 | % |
Health care cost trends: |
|
|
|
|
|
|
|
|
|
|
Current year rate |
|
| 9.50 | % |
| 11.50 | % |
| 13.00 | % |
Ultimate rate reached in 2010, 2011, and 2010, respectively |
|
| 5.50 | % |
| 5.50 | % |
| 5.50 | % |
The effect on the CW and EMD Retirement Plans of a 1% change in the health care cost trend is as follows:
|
|
|
|
|
|
|
|
|
|
| ||||||||||||
|
|
| ||||||||||||||||||||
| (In thousands) |
| 1% Increase |
| 1% Decrease |
|
|
| |||||||||||||||
|
|
| ||||||||||||||||||||
| Total service and interest cost components | $ | 344 | $ | (275 | ) |
| $ | 265 |
| $ | (209 | ) |
|
|
| |||||||
| Postretirement benefit obligation | $ | 3,806 | $ | (3,149 | ) |
| $ | 2,860 |
| $ | (2,313 | ) |
|
|
| |||||||
|
|
| ||||||||||||||||||||
Page 7883
The following benefit payments, which reflect expected future service, as appropriate, are expected to be paid from the plans:
| EMD |
|
|
|
|
|
|
|
|
|
|
|
|
| ||||||||||||
| Pension | Postretirement | Subsidy | |||||||||||||||||||||||
| (In thousands) | Plans | Plans | Receipts | Total |
| Pension |
| Postretirement |
| EMD |
| Total |
| ||||||||||||
| 2007 | $ | 19,180 | $ | 2,275 | $ (108) | $ | 21,347 | ||||||||||||||||||
| 2008 | 19,500 | 2,317 | (113) | 21,704 | |||||||||||||||||||||
| 2009 | 19,898 | 2,248 | (118) | 22,028 |
| $ | 29,542 |
| $ | 2,034 |
| $ | (153 | ) | $ | 31,423 |
| ||||||||
| 2010 | 20,066 | 2,314 | (125) | 22,255 |
| 30,166 |
| 2,117 |
| (169 | ) |
| 32,114 |
| |||||||||||
| 2011 | 20,639 | 2,337 | (131) | 22,845 |
| 32,455 |
| 2,235 |
| (183 | ) |
| 34,507 |
| |||||||||||
| 2012 - 2016 | 114,864 | 11,522 | (759) | 125,627 | |||||||||||||||||||||
2012 |
| 32,259 |
| 2,303 |
| (199 | ) |
| 34,363 |
| |||||||||||||||
2013 |
| 33,505 |
| 2,358 |
| (214 | ) |
| 35,649 |
| |||||||||||||||
2014 - 2017 |
| 186,866 |
| 12,220 |
| (1,310 | ) |
| 197,776 |
| |||||||||||||||
Pension Plan Assets
The Corporation maintains the funds of the CW Pension Plan and the EMD Pension Plan under one master trust. The Corporation’s retirement plansa trust and are diversified across investment classes and among investment managers in order to achieve an optimal balance between risk and return. In accordance with this policy, the Corporation has established target allocations for each asset class and ranges of expected exposure. The Corporation’s retirement assets are invested within this allocation structure in three major categories: domestic equity securities, international equity securities, and debt securities. Below are the Corporation’s actual and established target allocations:
|
|
|
|
|
|
|
|
|
|
|
| ||||||||||
| As of December 31, |
| Target |
| Expected |
| |||||||||||||||
| Asset class | 2006 | 2005 | Exposure | Range |
| 2008 |
| 2007 |
| Exposure |
| Range |
| ||||||||
| Domestic equities | 52% | 54% | 50% |
| 43 | % |
| 51 | % |
| 50 | % |
| 40% - 60 | % | ||||||
| International equities | 20% | 15% | 15% |
| 16 | % |
| 21 | % |
| 15 | % |
| 10% - 20 | % | ||||||
| Total equity | 72% | 69% | 65% |
| 59 | % |
| 72 | % |
| 65 | % |
| 55% - 75 | % | ||||||
| Fixed income | 28% | 31% | 35% |
| 41 | % |
| 28 | % |
| 35 | % |
| 25% - 45 | % | ||||||
| Cash | 0% | 0% | 0% |
| 0 | % |
| 0 | % |
| 0 | % |
| 0% - 10 | % | ||||||
The Corporation may from time to time require the reallocation of assets in order to bring the retirement plans into conformity with these ranges. The Corporation may also authorize alterations or deviations from these ranges where appropriate for achieving the objectives of the retirement plans. The Corporation’s investment policy does not permit its investment manager to invest plan funds in the Corporation’s stock.
The long-term investment objective of the domestic retirement plans is to achieve a total rate of return, net of fees, which exceeds the actuarial overall expected return on assets assumption of 8.5% used for funding purposes and which provides an appropriate premium over inflation. The intermediate-term objective of the domestic retirement plans, defined as three to five years, is to outperform each of the capital markets in which assets are invested, net of fees. During periods of extreme market volatility, preservation of capital takes a higher precedence than outperforming the capital markets.
Page 79
The overall expected return on assets assumption used in the calculation of annual net periodic benefit cost is based on a combination of the historical performance of the pension fund and expectations of future performance. The historical returns are determined using the market-related value of assets, includes the recognition of realized and unrealized gains and losses over a five-year period. Over the last ten years the market-related value of assets had an average annual yield of 10.2%6.93%, whereas the actual returns averaged 9.5%3.42% during the same period. Given the uncertainties of the current economic and geopolitical landscape, the Corporation considers 8.5% to be a reasonable assumption of future long-term investment returns. While the Corporation takes into account historical performance, its assumptions also consider the forward-looking long-term outlook for the capital markets.
Foreign plan assets represent 6.5%14.2% of consolidated plan assets, with the majority of the assets supporting the U.K. plans. The foreign plans follow a similar asset allocation strategy, with a weighted expected return on assets assumption of 7.5%6.07%.
Page 84
Other Pension and Postretirement Plans
The Corporation offers all of its domestic employees the opportunity to participate in a defined contribution plan. Costs incurred by the Corporation in the administration and record keeping of the defined contribution plan are paid for by the Corporation and are not considered material.
In addition, the Corporation had foreign pension costs under various defined contribution plans of $2.6 million, $3.0 million, and $2.8 million $2.3 million,in 2008, 2007, and $1.5 million in 2006, 2005, and 2004, respectively.
15. LEASES
The Corporation conducts a portion of its operations from leased facilities, which include manufacturing and service facilities, administrative offices, and warehouses. In addition, the Corporation leases automobiles,vehicles, machinery, and office equipment under operating leases. The leases expire at various dates and may include renewals and escalations. Rental expenses for all operating leases amounted to $29.0 million in 2008, $21.3 million in 2006,2007, and $21.9 million in 2005, and $18.5 million in 2004.2006.
At December 31, 2006,2008, the approximate future minimum rental commitments under operating leases that have initial or remaining non-cancelable lease terms in excess of one year are as follows:
|
|
|
| ||||
| (In thousands) |
| Rental |
| ||||
| 2007 | $ | 16,895 | |||||
| 2008 | 15,152 | ||||||
| 2009 | 12,617 |
| $ | 22,671 |
| ||
| 2010 | 9,947 |
| 20,079 |
| |||
| 2011 | 7,503 |
| 18,313 |
| |||
2012 |
| 14,466 |
| ||||
2013 |
| 12,176 |
| ||||
| Thereafter | 17,566 |
| 34,336 |
| |||
| Total | $ | 79,680 |
| $ | 122,041 |
| |
16. INDUSTRY SEGMENTS
The Corporation manages and evaluates its operations based on the products and services it offers and the different markets it serves. Based on this approach, the Corporation has three reportable segments: Flow Control, Motion Control, and Metal Treatment. The Flow Control segment primarily designs, manufactures, distributes, and services a broad range of highly engineered flow control products including valves, pumps, motors, generators, instrumentation, and control electronics for severe service military and commercial applications. The Motion Control segment primarily designs, develops, and manufactures mechanical systems, drive systems, and electronic controlsmission-critical embedded computing products and sensors mainly for the aerospace and defense industries. Metal Treatment provides various metallurgical services, principally shot peening, coatings, and heat treating. The segment provides these services to a broad spectrum of customers in various industries, including aerospace, automotive, construction equipment, oil and gas, petrochemical, and metal working.
Page 80
The accounting policies of the operating segments are the same as those described in the summary of significant accounting policies. Interest expense and income taxes are not reported on an operating segment basis because they are not considered in the performance evaluation by the Corporation’s chief operating decision-maker, its Chairman and CEO.
Sales to one customer of the Flow Control segment through which the Corporation is a subcontractor to the U.S. Government were 9% of consolidated revenues inDuring 2008, 2007, and 2006, 10% in 2005, and 13% in 2004. During 2006, 2005, and 2004, the Corporation had no direct defense customer or commercial customer representing more than 10% of consolidated revenue.
| Consolidated Industry Segment | Flow | Motion | Metal | Segment | Corporate | ||||||||||||||
| Information:(In thousands) | Control | Control | Treatment | Total | and Other(1) | ||||||||||||||
| Year Ended December 31, 2006: | |||||||||||||||||||
| Revenue from external customers | $ | 548,121 | $ | 509,462 | $ | 224,572 | $ | 1,282,155 | $ | — | $ | 1,282,155 | |||||||
| Intersegment revenues | 14 | 1,282 | 814 | 2,110 | (2,110 | ) | — | ||||||||||||
| Operating income (expense) | 60,542 | 55,242 | 42,385 | 158,169 | (17,541 | ) | 140,628 | ||||||||||||
| Depreciation and amortization | |||||||||||||||||||
| expense | 18,367 | 20,298 | 12,005 | 50,670 | 121 | 50,791 | |||||||||||||
| Segment assets | 495,000 | 695,219 | 222,745 | 1,412,964 | 179,192 | 1,592,156 | |||||||||||||
| Capital expenditures | 14,017 | 12,333 | 12,694 | 39,044 | 1,158 | 40,202 | |||||||||||||
| Year Ended December 31, 2005: | |||||||||||||||||||
| Revenue from external customers | $ | 466,546 | $ | 465,451 | $ | 198,931 | $ | 1,130,928 | $ | — | $ | 1,130,928 | |||||||
| Intersegment revenues | — | 548 | 545 | 1,093 | (1,093 | ) | „Ÿ | ||||||||||||
| Operating income (expense) | 54,509 | 50,485 | 34,470 | 139,464 | (1,482 | ) | 137,982 | ||||||||||||
| Depreciation and amortization | |||||||||||||||||||
| expense | 17,307 | 19,572 | 10,836 | 47,715 | 136 | 47,851 | |||||||||||||
| Segment assets | 440,550 | 653,037 | 194,279 | 1,287,866 | 112,419 | 1,400,285 | |||||||||||||
| Capital expenditures | 16,459 | 12,966 | 12,919 | 42,344 | 100 | 42,444 | |||||||||||||
| Year Ended December 31, 2004: | |||||||||||||||||||
| Revenue from external customers | $ | 388,139 | $ | 388,576 | $ | 178,324 | $ | 955,039 | $ | — | $ | 955,039 | |||||||
| Intersegment revenues | — | 144 | 555 | 699 | (699 | ) | „Ÿ | ||||||||||||
| Operating income (expense) | 44,451 | 44,893 | 28,111 | 117,455 | (7,114 | ) | 110,341 | ||||||||||||
| Depreciation and amortization | |||||||||||||||||||
| expense | 15,884 | 14,214 | 10,381 | 40,479 | 263 | 40,742 | |||||||||||||
| Segment assets | 415,504 | 576,275 | 194,706 | 1,186,485 | 91,955 | 1,278,440 | |||||||||||||
| Capital expenditures | 10,420 | 10,171 | 11,728 | 32,319 | 133 | 32,452 | |||||||||||||
Page 85
|
|
|
|
|
|
|
|
|
|
|
|
|
|
|
|
|
|
|
|
Consolidated Industry Segment |
| Flow |
| Motion |
| Metal |
| Segment |
| Corporate |
| Consolidated |
| ||||||
Year Ended December 31, 2008: |
|
|
|
|
|
|
|
|
|
|
|
|
|
|
|
|
|
|
|
Revenue from external customers |
| $ | 928,052 |
| $ | 638,068 |
| $ | 264,020 |
| $ | 1,830,140 |
| $ | — |
| $ | 1,830,140 |
|
Intersegment revenues |
|
| — |
|
| 4,654 |
|
| 924 |
|
| 5,578 |
|
| (5,578 | ) |
| — |
|
Operating income (expense) |
|
| 97,214 |
|
| 65,539 |
|
| 52,142 |
|
| 214,895 |
|
| (18,333 | ) |
| 196,562 |
|
Depreciation and amortization expense |
|
| 32,711 |
|
| 26,275 |
|
| 14,176 |
|
| 73,162 |
|
| 1,089 |
|
| 74,251 |
|
Segment assets |
|
| 895,963 |
|
| 861,465 |
|
| 235,413 |
|
| 1,992.841 |
|
| 49,189 |
|
| 2,042,030 |
|
Capital expenditures |
|
| 64,226 |
|
| 18,571 |
|
| 19,436 |
|
| 102,233 |
|
| 750 |
|
| 102,983 |
|
Year Ended December 31, 2007: |
|
|
|
|
|
|
|
|
|
|
|
|
|
|
|
|
|
|
|
Revenue from external customers |
| $ | 746,253 |
| $ | 591,032 |
| $ | 254,839 |
| $ | 1,592,124 |
| $ | — |
| $ | 1,592,124 |
|
Intersegment revenues |
|
| — |
|
| 597 |
|
| 1,103 |
|
| 1,700 |
|
| (1,700 | ) |
| — |
|
Operating income (expense) |
|
| 73,476 |
|
| 64,837 |
|
| 50,880 |
|
| 189,193 |
|
| (10,009 | ) |
| 179,184 |
|
Depreciation and amortization expense |
|
| 26,649 |
|
| 22,460 |
|
| 13,386 |
|
| 62,495 |
|
| 204 |
|
| 62,699 |
|
Segment assets |
|
| 867,075 |
|
| 800,565 |
|
| 234,978 |
|
| 1,902,618 |
|
| 82,942 |
|
| 1,985,560 |
|
Capital expenditures |
|
| 21,100 |
|
| 15,301 |
|
| 16,171 |
|
| 52,572 |
|
| 1,861 |
|
| 54,433 |
|
Year Ended December 31, 2006: |
|
|
|
|
|
|
|
|
|
|
|
|
|
|
|
|
|
|
|
Revenue from external customers |
| $ | 548,121 |
| $ | 509,462 |
| $ | 224,572 |
| $ | 1,282,155 |
| $ | — |
| $ | 1,282,155 |
|
Intersegment revenues |
|
| 14 |
|
| 1,282 |
|
| 814 |
|
| 2,110 |
|
| (2,110 | ) |
| — |
|
Operating income (expense) |
|
| 60,542 |
|
| 55,242 |
|
| 42,385 |
|
| 158,169 |
|
| (17,541 | ) |
| 140,628 |
|
Depreciation and amortization expense |
|
| 18,367 |
|
| 20,298 |
|
| 12,005 |
|
| 50,670 |
|
| 121 |
|
| 50,791 |
|
Segment assets |
|
| 495,000 |
|
| 695,219 |
|
| 222,745 |
|
| 1,412,964 |
|
| 179,192 |
|
| 1,592,156 |
|
Capital expenditures |
|
| 14,017 |
|
| 12,333 |
|
| 12,694 |
|
| 39,044 |
|
| 1,158 |
|
| 40,202 |
|
(1)Operating expense for Corporate and Other includes pension expense, environmental remediation and administrative expenses, legal, and other expenses. Reconciliations For the years ended December 31,(In thousands) Revenues: Total segment revenue $ 1,282,155 $ 1,130,928 $ 955,039 Intersegment revenue 2,110 1,093 699 Elimination of intersegment revenue (2,110 ) (1,093 ) (699 ) Total consolidated revenues $ 1,282,155 $ 1,130,928 $ 955,039 Earnings before taxes: Total segment operating income $ 158,169 $ 139,464 $ 117,455 Corporate and administrative (17,541 ) (1,482 ) (7,114 ) Other income, net (112 ) 299 443 Interest expense (22,894 ) (19,983 ) (12,031 ) Total consolidated earnings before tax $ 117,622 $ 118,298 $ 98,753
|
|
|
|
|
|
|
|
|
|
|
Reconciliations |
| 2008 |
| 2007 |
| 2006 |
| |||
Revenues: |
|
|
|
|
|
|
|
|
|
|
Total segment revenue |
| $ | 1,830,140 |
| $ | 1,592,124 |
| $ | 1,282,155 |
|
Intersegment revenue |
|
| 5,578 |
|
| 1,700 |
|
| 2,110 |
|
Elimination of intersegment revenue |
|
| (5,578 | ) |
| (1,700 | ) |
| (2,110 | ) |
Total consolidated revenues |
| $ | 1,830,140 |
| $ | 1,592,124 |
| $ | 1,282,155 |
|
|
|
|
|
|
|
|
|
|
|
|
Earnings before taxes: |
|
|
|
|
|
|
|
|
|
|
Total segment operating income |
| $ | 214,895 |
| $ | 189,193 |
| $ | 158,169 |
|
Corporate and administrative |
|
| (18,333 | ) |
| (10,009 | ) |
| (17,541 | ) |
Other income, net |
|
| 1,585 |
|
| 2,369 |
|
| (112 | ) |
Interest expense |
|
| (29,045 | ) |
| (27,382 | ) |
| (22,894 | ) |
Total consolidated earnings before tax |
| $ | 169,102 |
| $ | 154,171 |
| $ | 117,622 |
|
|
|
|
|
|
|
|
|
|
|
|
Assets: |
|
|
|
|
|
|
|
|
|
|
Total assets for reportable segments |
| $ | 1,992,841 |
| $ | 1,902,618 |
| $ | 1,412,964 |
|
Pension assets |
|
| — |
|
| 73,914 |
|
| 92,021 |
|
Non-segment cash |
|
| 5,988 |
|
| 2,306 |
|
| 75,068 |
|
Other assets |
|
| 43,201 |
|
| 6,722 |
|
| 12,103 |
|
Total consolidated assets |
| $ | 2,042,030 |
| $ | 1,985,560 |
| $ | 1,592,156 |
|
Page 8186
| Reconciliations | ||||||||||||
| For the years ended December 31,(In thousands) | ||||||||||||
| Assets: | ||||||||||||
| Total assets for reportable segments | $ | 1,412,964 | $ | 1,287,866 | $ | 1,186,485 | ||||||
| Pension assets | 92,021 | 76,002 | 77,802 | |||||||||
| Non-segment cash | 75,068 | 24,995 | 545 | |||||||||
| Other assets | 12,103 | 11,422 | 13,608 | |||||||||
| Total consolidated assets | $ | 1,592,156 | $ | 1,400,285 | $ | 1,278,440 | ||||||
The following table presents geographical information of the Corporation’s revenues and property, plant, and equipment based on the location of the customer and the assets, respectively:
|
|
|
|
|
|
|
|
|
|
|
|
|
|
|
|
|
|
|
| ||||||||||||||||||
| December 31,(In thousands) |
| 2008 |
| 2007 |
| 2006 |
| ||||||||||||||||||||||||||||||
| Revenues |
| Long-Lived |
| Revenues |
| Long-Lived |
| Revenues |
| Long-Lived |
| |||||||||||||||||||||||||
| Geographic Information: |
|
|
|
|
|
|
|
|
|
|
|
|
| ||||||||||||||||||||||||
| United States of America | $ | 966,296 | $ | 189,331 | $ | 864,465 | $ | 182,277 | $ | 735,356 | $ | 181,708 |
| $ | 1,328,071 |
| $ | 262,925 |
| $ | 1,115,779 |
| $ | 211,789 |
| $ | 966,296 |
| $ | 189,331 |
| ||||||
| United Kingdom | 111,678 | 60,426 | 109,659 | 49,796 | 92,541 | 52,568 |
| 164,409 |
| 42,563 |
| 144,031 |
| 59,839 |
| 111,678 |
| 60,426 |
| ||||||||||||||||||
| Canada | 48,995 | 29,055 | 38,595 | 26,286 | 20,675 | 14,136 |
| 62,437 |
| 30,096 |
| 64,110 |
| 33,967 |
| 48,995 |
| 29,055 |
| ||||||||||||||||||
| Other foreign countries | 155,186 | 17,840 | 118,209 | 16,462 | 106,467 | 16,831 |
| 275,223 |
| 28,448 |
| 268,204 |
| 24,062 |
| 155,186 |
| 17,840 |
| ||||||||||||||||||
| Consolidated total | $ | 1,282,155 | $ | 296,652 | $ | 1,130,928 | $ | 274,821 | $ | 955,039 | $ | 265,243 |
| $ | 1,830,140 |
| $ | 364,032 |
| $ | 1,592,124 |
| $ | 329,657 |
| $ | 1,282,155 |
| $ | 296,652 |
| ||||||
17. CONTINGENCIES AND COMMITMENTS
The Corporation, through its Flow Control segment, has several NRC licenses necessary for the continued operation of its commercial nuclear operations. In connection with these licenses, the NRC required financial assurance from the Corporation in the form of a parent company guarantee, representing estimated environmental decommissioning and remediation costs associated with the commercial operations covered by the licenses. The guarantee for the decommissioning costs of the refurbishment facility, which is estimated for 2017, is $3.1$4.2 million. See Note 13 for further information.
The Corporation enters into standby letters of credit agreements and guarantees with financial institutions and customers primarily relating to guarantees of repayment on certain Industrial Revenue Bonds, future performance on certain contracts to provide products and services, and to secure advance payments the Corporation has received from certain international customers. At December 31, 2006, 2005,2008, 2007, and 2004,2006, the Corporation had contingent liabilities on outstanding letters of credit of $37.8$62.5 million, $32.2$40.0 million, and $19.4$37.8 million, respectively.
In January of 2007, a former executive was awarded approximately $9.0 million in punitive and compensatory damages plus legal costs related to a gender bias lawsuit filed in 2003. The Corporation has recorded a $6.5 million reserve related to the lawsuit and intends to appeal the verdict. The Corporation has determined that it is probable that the punitive damages verdict will be reversed on appeal, therefore no reserve has been recorded for that portion.
Consistent with other entities its size, the Corporation is party to a number of legal actions and claims, none of which individually or in the aggregate, in the opinion of management, are expected to have a material adverse effect on the Corporation’s results of operations or financial position.
18. GAIN ON THE SALE OF REAL ESTATEACCUMULATED OTHER COMPREHENSIVE INCOME
Accumulated other comprehensive income (loss) as of December 31, 2008 and 2007 consisted of:
|
|
|
|
|
|
|
|
|
|
|
(In thousands) |
| Pre-tax |
| Deferred tax |
| Net of tax |
| |||
Foreign currency translation adjustments |
| $ | (12,060 | ) | $ | 2,121 |
| $ | (9,939 | ) |
Pension and postretirement adjustments: |
|
|
|
|
|
|
|
|
|
|
Net actuarial loss |
|
| (95,586 | ) |
| 35,725 |
|
| (59,861 | ) |
Prior service cost |
|
| (4,385 | ) |
| 1,634 |
|
| (2,751 | ) |
Total pension and postretirement adjustments |
|
| (99,971 | ) |
| 37,359 |
|
| (62,612 | ) |
Accumulated other comprehensive loss |
| $ | (112,031 | ) | $ | 39,480 |
| $ | (72,551 | ) |
Page 87
|
|
|
|
|
|
|
|
|
|
|
(In thousands) |
| Pre-tax |
| Deferred tax |
| Net of tax |
| |||
Foreign currency translation adjustments |
| $ | 72,891 |
| $ | (4,087 | ) | $ | 68,804 |
|
Pension and postretirement adjustments: |
|
|
|
|
|
|
|
|
|
|
Net actuarial gain |
|
| 42,950 |
|
| (16,371 | ) |
| 26,579 |
|
Prior service cost |
|
| (3,289 | ) |
| 1,233 |
|
| (2,056 | ) |
Total pension and postretirement adjustments |
|
| 39,661 |
|
| (15,138 | ) |
| 24,523 |
|
Accumulated other comprehensive income |
| $ | 112,552 |
| $ | (19,225 | ) | $ | 93,327 |
|
Other comprehensive income (loss) for the periods ending December 31, 2008, 2007 and 2006 were as follows:
|
|
|
|
|
|
|
|
|
|
|
(In thousands) |
| Pre-tax |
| Tax (expense) |
| Net of tax |
| |||
Foreign currency translation adjustments |
| $ | (84,951 | ) | $ | 6,208 |
| $ | (78,743 | ) |
Pension and postretirement adjustments: |
|
|
|
|
|
|
|
|
|
|
Net actuarial loss |
|
| (138,550 | ) |
| 52,040 |
|
| (86,510 | ) |
Prior service cost |
|
| (1,260 | ) |
| 457 |
|
| (803 | ) |
Total pension and postretirement adjustments |
|
| (139,810 | ) |
| 52,497 |
|
| (87,313 | ) |
Other comprehensive loss |
| $ | (224,761 | ) | $ | 58,705 |
| $ | (166,056 | ) |
|
|
|
|
|
|
|
|
|
|
|
(In thousands) |
| Pre-tax |
| Tax (expense) |
| Net of tax |
| |||
Foreign currency translation adjustments |
| $ | 27,636 |
| $ | (1,702 | ) | $ | 25,934 |
|
Pension and postretirement adjustments: |
|
|
|
|
|
|
|
|
|
|
Net actuarial gain |
|
| 18,613 |
|
| (7,071 | ) |
| 11,542 |
|
Prior service cost |
|
| 99 |
|
| (54 | ) |
| 45 |
|
Total pension and postretirement adjustments |
|
| 18,712 |
|
| (7,125 | ) |
| 11,587 |
|
Other comprehensive income |
| $ | 46,348 |
| $ | (8,827 | ) | $ | 37,521 |
|
|
|
|
|
|
|
|
|
|
|
|
(In thousands) |
| Pre-tax |
| Tax (expense) |
| Net of tax |
| |||
Foreign currency translation adjustments |
| $ | 24,600 |
| $ | (2,385 | ) | $ | 22,215 |
|
Pension and postretirement adjustment |
|
| (2,770 | ) |
| 1,020 |
|
| (1,750 | ) |
Other comprehensive income |
| $ | 21,830 |
| $ | (1,365 | ) | $ | 20,465 |
|
19. SUBSEQUENT EVENT
On March 17, 2005,January 19, 2009, the Corporation completedacquired substantially all of the saleassets of its Fairfield, New Jersey property,Nu-Torque. The purchase price of the acquisition, subject to customary adjustments provided for in the Asset Purchase Agreement, was $5.0 million in cash and the assumption of certain liabilities. Management funded the acquisition from credit available under the Credit Agreement. The business will become a former operating property,part of the Corporation’s Flow Control segment.
Nu-Torque, located in Redmond, Washington, is a designer of and manufacturer of electric and hydraulic valve actuation and control devices primarily for $10.5 million. The property encompasses approximately 39 acresU.S. Navy ships. Typical applications for the Nu-Torque’s products are for valve automation of shipboard fluid systems, such as fire main, ballast, and various safety systems on numerous categories of U.S. Navy combatant ships. Nu-Torque was founded in 1980 and was formerly an operating facility for the Corporation's Motionacquired by Tyco Flow Control, segment now located in Shelby, North Carolina. As a resultunit of the sale, the Corporation recognized a pre-tax gain of $2.8 million in the first quarter of 2005, which is recorded in operating income in the Corporation’s Consolidated Statements of Earnings.Tyco International Ltd.
Page 8288
QUARTERLY RESULTS OF OPERATIONS (UNAUDITED)
|
|
|
|
|
|
|
|
|
|
|
|
|
| |||||||||||||
| (In thousands, except per share data) |
| First |
| Second |
| Third |
| Fourth |
| |||||||||||||||||
| 2006 | ||||||||||||||||||||||||||
2008 |
|
|
|
|
|
|
|
|
| |||||||||||||||||
| Net sales | $ | 282,552 | $ | 309,635 | $ | 311,801 | $ | 378,167 |
| $ | 433,379 |
| $ | 453,464 |
| $ | 435,699 |
| $ | 507,598 |
| |||||
| Gross profit | 92,061 | 105,553 | 106,018 | 127,447 |
| 138,469 |
| 157,234 |
| 147,791 |
| 172,585 |
| |||||||||||||
| Net earnings | 12,278 | 21,092 | 20,356 | 26,843 |
| 21,779 |
| 27,077 |
| 27,523 |
| 33,011 |
| |||||||||||||
| Earnings per share: |
|
|
|
|
|
|
|
|
| |||||||||||||||||
| Basic earnings per share | $ | 0.28 | $ | 0.48 | $ | 0.46 | $ | 0.61 |
| $ | 0.49 |
| $ | 0.61 |
| $ | 0.61 |
| $ | 0.74 |
| |||||
| Diluted earnings per share | 0.28 | 0.48 | 0.46 | 0.60 |
| 0.48 |
| 0.60 |
| 0.60 |
| 0.73 |
| |||||||||||||
| Dividends per share | 0.06 | 0.06 | 0.06 | 0.06 |
| 0.08 |
| 0.08 |
| 0.08 |
| 0.08 |
| |||||||||||||
|
|
|
|
|
|
|
|
| ||||||||||||||||||
| 2005 | ||||||||||||||||||||||||||
2007 |
|
|
|
|
|
|
|
|
| |||||||||||||||||
| Net sales | $ | 258,487 | $ | 283,193 | $ | 271,355 | $ | 317,893 |
| $ | 332,609 |
| $ | 365,576 |
| $ | 396,268 |
| $ | 497,671 |
| |||||
| Gross profit | 85,769 | 100,299 | 93,515 | 110,929 |
| 111,387 |
| 118,023 |
| 129,820 |
| 164,394 |
| |||||||||||||
| Net earnings | 14,523 | 17,934 | 17,519 | 25,304 |
| 19,503 |
| 21,390 |
| 25,175 |
| 38,259 |
| |||||||||||||
| Earnings per share: |
|
|
|
|
|
|
|
|
| |||||||||||||||||
| Basic earnings per share | $ | 0.34 | $ | 0.41 | $ | 0.40 | $ | 0.58 |
| $ | 0.44 |
| $ | 0.48 |
| $ | 0.57 |
| $ | 0.86 |
| |||||
| Diluted earnings per share | 0.33 | 0.41 | 0.40 | 0.58 |
| 0.44 |
| 0.48 |
| 0.56 |
| 0.85 |
| |||||||||||||
| Dividends per share | 0.05 | 0.05 | 0.05 | 0.06 |
| 0.06 |
| 0.06 |
| 0.08 |
| 0.08 |
| |||||||||||||
See notes to the consolidated financial statements for additional financial information.
Page 8389
Report of the Corporation
The consolidated financial statements appearing in Item 8 of this Form 10-K have been prepared by the Corporation in conformity with accounting principles generally accepted in the United States of America. The financial statements necessarily include some amounts that are based on the best estimates and judgments of the Corporation. Other financial information in the Annual Report on Form 10-K is consistent with that in the financial statements.
The Corporation maintains accounting systems, procedures, and internal accounting controls designed to provide reasonable assurance that assets are safeguarded and that transactions are executed in accordance with the appropriate corporate authorization and are properly recorded. The accounting systems and internal accounting controls are augmented by written policies and procedures;procedures, organizational structure providing for a division of responsibilities;responsibilities, selection and training of qualified personnel;personnel and an internal audit program. The design, monitoring, and revision of internal accounting control systems involve, among other things, management’s judgment with respect to the relative cost and expected benefits of specific control measures. Management of the Corporation has completed an assessment of the Corporation’s internal controls over financial reporting and has included “Management’s Annual Report on Internal Control Over Financial Reporting” in Item 9A of this Form 10-K.
Deloitte & Touche LLP, independent auditors, performed an audit of the Corporation’s financial statements that also included forming an opinion on management’s assessment ofthe internal controls over financial reporting as well asof the effectiveness of such controlsCorporation for the year ended December 31, 2006.2008. An audit includes examining, on a test basis, evidence supporting the amounts and disclosures in the financial statements. An audit also includes assessing the accounting principles used and significant estimates made by management, as well as evaluating the overall financial statement presentation. The objective of their audit is the expression of an opinion on the fairness of the presentation of the Corporation’s financial statements in conformity with accounting principles generally accepted in the United States of America, in all material respects, on management’s assessment of the effectiveness of internal controls over financial reporting, and on the effectiveness of internal controls over financial reporting as of December 31, 2006.2008.
The Audit Committee of the Board of Directors, composed entirely of directors who are independent of the Corporation, appoints the independent auditors for ratification by stockholders and, among other things, considers the scope of the independent auditors’ examination, the audit results, and the adequacy of internal accounting controls of the Corporation. The independent auditors and the internal auditor have direct access to the Audit Committee, and they meet with the committee from time to time, with and without management present, to discuss accounting, auditing, non-auditnon audit consulting services, internal control, and financial reporting matters.
Page 90
Report of Independent Registered Public Accounting Firm
To the Board of Directors and Stockholders of
Curtiss-Wright Corporation
Roseland, New Jersey
We have audited the accompanying consolidated balance sheets of Curtiss-Wright Corporation and subsidiaries (the “Company”) as of December 31, 20062008 and 2005,2007, and the related consolidated statements of earnings, stockholders’ equity, and cash flows for each of the three years in the period ended December 31, 2006.2008. Our audits also included the financial statement schedule listed in the Index at Item 15. These financial statements and financial statement schedule are the responsibility of the Company’s management. Our responsibility is to express an opinion on these financial statements and financial statement schedule based on our audits.
We conducted our audits in accordance with the standards of the Public Company Accounting Oversight Board (United States). Those standards require that we plan and perform the audit to obtain reasonable assurance about whether the financial statements are free of material misstatement. An audit includes examining, on a test basis, evidence supporting the amounts and disclosures in the financial statements. An audit also includes assessing the accounting principles used and significant estimates made by management, as well as evaluating the overall financial statement presentation. We believe that our audits provide a reasonable basis for our opinion.
Page 84
In our opinion, such consolidated financial statements present fairly, in all material respects, the financial position of the Company at December 31, 20062008 and 2005,2007, and the results of their operations and their cash flows for each of the three years in the period ended December 31, 2006,2008, in conformity with accounting principles generally accepted in the United States of America. Also, in our opinion, such financial statement schedule, when considered in relation to the basic consolidated financial statements taken as a whole, presentpresents fairly, in all material respects, the information set forth therein.
As discussed in Note 1 to the consolidated financial statements, effective January 1, 2006 the Company adopted Statement of Financial Accounting Standard (SFAS) No. 123(R) Share-Based Payment. Also as discussed in Note 1 to the consolidated financial statements, the Company adopted SFAS No. 158, Employers’ Accounting for Defined Benefit Pension and Other Postretirement Plans – an Amendment of FASB Statements No. 87, 88, 106 and 132(R) asand has adopted FASB Interpretation No. 48, Accounting for Uncertainty in Income Taxes – An Interpretation of December 31, 2006.FASB Statement No. 109 on January 1, 2007.
We have also audited, in accordance with the standards of the Public Company Accounting Oversight Board (United States), the effectiveness of the Company'sCompany’s internal control over financial reporting as of December 31, 2006,2008, based on the criteria established in Internal Control—Integrated Framework issued by the Committee of Sponsoring Organizations of the Treadway Commission and our report dated February 26, 2007March 2, 2009 expressed an unqualified opinion on management's assessment of the effectiveness of the Company's internal control over financial reporting and an unqualified opinion on the effectiveness of the Company'sCompany’s internal control over financial reporting.
/s/ DELOITTEDeloitte & TOUCHETouche LLP
Parsippany, New JerseyFebruary 26, 2007March 2, 2009
Page 91
Report of Independent Registered Public Accounting Firm
To the Board of Directors and Stockholders of
Curtiss-Wright Corporation
Roseland, New Jersey
We have audited management's assessment, included in the accompanying Management’s Annual Report On Internal Control Over Financial Reporting, thatinternal control over financial reporting of Curtiss-Wright Corporation and subsidiaries (the "Company"“Company”) maintained effective internal control over financial reporting as of December 31, 2006,2008, based on the criteria established in Internal Control—Control — Integrated Framework issued by the Committee of Sponsoring Organizations of the Treadway Commission. As described in Management’s Annual Report on Internal Control Over Financial Reporting, management excluded from its assessment the internal control over financial reporting at VMETRO, ASA, Mechetronics Holdings Limited and Parylene Coatings, Inc. (collectively the “Acquired Businesses”) which were acquired during the year ended December 31, 2008 and whose financial statements constitute 5.9% of total assets, (0.5%) of equity, 0.9% of revenues, and 0.8% of net income of the consolidated financial statement amounts as of and for the year ended December 31, 2008. Accordingly, our audit did not include the internal control over financial reporting at the Acquired Businesses. The Company'sCompany’s management is responsible for maintaining effective internal control over financial reporting and for its assessment of the effectiveness of internal control over financial reporting.reporting, included in the accompanying Management’s Annual Report on Internal Control Over Financial Reporting. Our responsibility is to express an opinion on management's assessment and an opinion on the effectiveness of the Company'sCompany’s internal control over financial reporting based on our audit.
We conducted our audit in accordance with the standards of the Public Company Accounting Oversight Board (United States). Those standards require that we plan and perform the audit to obtain reasonable assurance about whether effective internal control over financial reporting was maintained in all material respects. Our audit included obtaining an understanding of internal control over financial reporting, evaluating management's assessment,assessing the risk that a material weakness exists, testing and evaluating the design and operating effectiveness of internal control based on the assessed risk, and performing such other procedures as we considered necessary in the circumstances. We believe that our audit provides a reasonable basis for our opinions.opinion.
A company'scompany’s internal control over financial reporting is a process designed by, or under the supervision of, the company'scompany’s principal executive and principal financial officers, or persons performing similar functions, and effected by the company'scompany’s board of directors, management, and other personnel to provide reasonable assurance regarding the reliability of financial reporting and the preparation of financial statements for external purposes in accordance with generally accepted accounting principles. A company'scompany’s internal control over financial reporting includes those policies and procedures that (1) pertain to the maintenance of records that, in reasonable detail, accurately and fairly reflect the transactions and dispositions of the assets of the company; (2) provide reasonable assurance that transactions are recorded as necessary to permit preparation of financial statements in accordance with generally accepted accounting principles, and that receipts and expenditures of the company are being made only in accordance with authorizations of management and directors of the company; and (3) provide reasonable assurance regarding prevention or timely detection of unauthorized acquisition, use, or disposition of the company'scompany’s assets that could have a material effect on the financial statements.
Page 85
Because of the inherent limitations of internal control over financial reporting, including the possibility of collusion or improper management override of controls, material misstatements due to error or fraud may not be prevented or detected on a timely basis. Also, projections of any evaluation of the effectiveness of the internal control over financial reporting to future periods are subject to the risk that the controls may become inadequate because of changes in conditions, or that the degree of compliance with the policies or procedures may deteriorate.
In our opinion, management's assessment that the Company maintained effective internal control over financial reporting as of December 31, 2006, is fairly stated, in all material respects, based on the criteria established in Internal Control—Integrated Framework issued by the Committee of Sponsoring Organizations of the Treadway Commission. Also in our opinion, the Company maintained, in all material respects, effective internal control over financial reporting as of December 31, 2006,2008, based on the criteria established in Internal Control—Control — Integrated Framework issued by the Committee of Sponsoring Organizations of the Treadway Commission.
Page 92
We have also audited, in accordance with the standards of the Public Company Accounting Oversight Board (United States), the consolidated financial statements and financial statement schedule as of and for the year ended December 31, 20062008 of the Company and our report dated February 26, 2007March 2, 2009 expressed an unqualified opinion on those financial statements and financial statement schedule and included an explanatory paragraph regarding the Company’s adoption of Statement of Financial Accounting Standard (SFAS) No. 123(R) Share-Based Payment on January 1, 2006 anda SFAS No. 158, Employers’ Accounting for Defined Benefit Pension and Other Postretirement Plans – an Amendment of FASB Statements No. 87, 88, 106 and 132(R) as of December 31, 2006..
/s/ DELOITTEDeloitte & TOUCHETouche LLP
Parsippany, New JerseyFebruary 26, 2007March 2, 2009
Page 8693
Item 9. Changes in and Disagreements with Accountants on Accounting and Financial Disclosure.
None.
Item 9A. Controls And Procedures.
Disclosure Controls and Procedures
As of December 31, 2006,2008, the Corporation’s management, including the Corporation’s Chief Executive Officer and Chief Financial Officer, conducted an evaluation of the Corporation’s disclosure controls and procedures, as such term is defined in Rules 13a-15(e) and 15d-15(e) under the Securities Exchange Act of 1934, as amended (the “Exchange Act”). Based on such evaluation, the Corporation’s Chief Executive Officer and Chief Financial Officer concluded that the Corporation’s disclosure controls and procedures are effective, in all material respects, to ensure that information required to be disclosed in the reports the Corporation files and submits under the Exchange Act is recorded, processed, summarized, and reported as and when required.effective.
Management’s Annual Report On Internal Control Over Financial Reporting
The Corporation’s management is responsible for establishing and maintaining adequate internal control over financial reporting, as defined in Rules 13a-15(f) and 15d-15(f) under the Securities Exchange Act of 1934, as amended.
Because of its inherent limitations, internal control over financial reporting may not prevent or detect misstatements. Also, projections of the future effectiveness of controls currently deemed effective are subject to the risk that controls may become inadequate because of changes in conditions or deterioration in the degree of compliance with the policies or procedures.
As discussed in Note 2 to the consolidated financial statements, the Corporation acquired VMETRO, ASA, Mechetronics Holdings Limited and Parylene Coatings, Inc. during the year ended December 31, 2008. These acquisitions with combined assets, equity, current year revenues and net income at December 31, 2008, represent 5.9%, (0.5)%, 0.9% and 0.8%, respectively of the consolidated financial statement amounts, and have been excluded from management’s assessment of internal control over financial reporting.
The Corporation’s management assessed the effectiveness of the Corporation’s internal control over financial reporting as of December 31, 2006.2008. In making this assessment, the Corporation’s management used the criteria established by the Committee of Sponsoring Organizations of the Treadway Commission in Internal Control-Integrated Framework.
ManagementBased on management’s assessment, excluding the acquired companies referred to in the third paragraph, management believes that as of December 31, 2006,2008, the Corporation’s internal control over financial reporting is effective based on the established criteria.
The Corporation’s assessment of the effectiveness of internal controls over financial reporting as of December 31, 2006 has2008 have been audited by Deloitte & Touche LLP, an independent registered public accounting firm, and their report thereon is included in Item 8 of this Annual Report on Form 10-K.
Changes in Internal Control over Financial Reporting
There were no changes in the Corporation’s internal control over financial reporting during the most recently completed fiscal quarter that materially affected, or are reasonably likely to materially affect, our internal control over financial reporting.
Page 94
Chief Executive Officer and Chief Financial Officer Certifications
The certifications of our Chief Executive Officer and Chief Financial Officer required under Section 302 of the Sarbanes-Oxley Act have been filed as Exhibits 31.1, 31.2 and 32 to this report. Additionally, on June 30, 2008, our Chief Executive Officer filed with the New York Stock Exchange (“NYSE”) its Domestic Company Section 303A Annual CEO Certification as required by NYSE pursuant to Section 303A.12 of the NYSE Listed Company Manual. The certification confirmed that our Chief Executive Officer was not aware of any violation by the Company of the NYSE’s corporate governance listing standards.
None.
Page 8795
The information required by Items 10, 11, 12, 13, and 14 of Part III of this report, to the extent not set forth herein, is incorporated herein by reference from the registrant'sregistrant’s definitive proxy statement relating to the annual meeting of stockholders to be held on May 4, 2007,8, 2009, which definitive proxy statement shall be filed with the Securities and Exchange Commission within 120 days after the end of the fiscal year to which this report relates. Information required by Item 401(b) of Regulation S-K is included in Part I of this report under the caption “Executive Officers” and information required by Item 201(d) of Regulation S-K is included in Part II of this report under the caption “Securities Authorized For Issuance Under Equity Compensation Plans”.
Item 15. Exhibits, Financial Statement Schedule.
Page | ||||||||
(a) | Financial Statements and Footnotes | |||||||
1. | The following are documents filed as part of this report in Part II, Item 8: | |||||||
50 | ||||||||
51 | ||||||||
52 | ||||||||
53 | ||||||||
54 | ||||||||
2. | Financial Statement Schedule | |||||||
101 | ||||||||
All other financial statement schedules have been omitted because they are either not | ||||||||
| required, not applicable or the required information is shown in the Consolidated Financial | ||||||||
| Statements or Notes thereto. | ||||||||
(b) | Exhibits | |||||||
2.1 | Agreement and Plan of Merger and Recapitalization, dated as of February 1, 2005, by and | |||||||
| between the Registrant and CW Merger Sub, Inc. (incorporated by reference to Exhibit | ||||||||
| 2.1 to Form 8-K filed February 3, 2005). | ||||||||
3.1 | Amended and Restated Certificate of Incorporation (incorporated by reference to Form | |||||||
3.2 | Amended and Restated By-Laws (incorporated by reference to Form | |||||||
3.3 | Form of stock certificate for Common Stock (incorporated by reference to Form | |||||||
4.1 | Agreement to furnish to the Commission upon request a copy of any long-term debt | |||||||
| instrument where the amount of the securities authorized thereunder does not exceed 10% | ||||||||
| of the total assets of the Registrant and its subsidiaries on a consolidated basis | ||||||||
4.2 | ||||||||
Page 88
| Second Amended and Restated Rights Agreement, dated as of May 24, 2005, between the | |||
| Registrant and American Stock Transfer & Trust Company, as Rights Agent | |||
10.1 | Modified Incentive Compensation Plan, as amended November 9, 1989 (incorporated by | ||
| reference to Exhibit 10(a) to Form 10-Q for the quarter ended September 30, 1989).* |
Page 96
10.2 | Curtiss-Wright Corporation 2005 Omnibus Long-Term Incentive Plan (incorporated by | ||
| reference to Appendix B to Proxy Statement filed April 5, 2005).* | |||
10.3 | Form of Long Term Incentive Award Agreement, dated January 1, 2006, between the | ||
| Registrant and the executive officers of the Registrant | |||
| Exhibit 10.3 to Form 10-K for the year ended December 31, 2005).* | |||
10.4 | Revised Standard Employment Severance Agreement with Certain Management of the | ||
| Registrant (incorporated by reference to Exhibit 10 to Form 10-Q for the quarter ended | |||
| June 30, 2001).* | |||
10.5 | Retirement Benefits Restoration Plan as amended April 15, 1997 (incorporated by | ||
| reference to Exhibit 10 to Form 10-Q for quarter ended June 30, 1997).* | |||
10.6 | Restated and Amended Curtiss-Wright Corporation Retirement Plan and Instrument of | ||
| Amendment No. 1, as amended through February 28, 2002 (incorporated by reference to | |||
| Exhibit (10)(v) to Form 10-K for the year ended December 31, 2001), and Instrument of | |||
| Amendment No. 2 (incorporated by reference to Exhibit 10 to Form 10-Q for the quarter | |||
| ended September 30, 2004).* | |||
10.7 | |||
Instruments of Amendment Nos. 2 through 5 to the Curtiss-Wright Corporation | |||
| Retirement Plan (incorporated by reference to Exhibit 10.3 to Form 10-Q for the quarter | |||
| ended June 30, 2005).* | |||
10.8 | |||
Page 89
| Instruments of Amendment Nos. 6 and 7 to the Curtiss-Wright Corporation Retirement | |||
| Plan (incorporated by reference to Exhibit 10 to Form 10-K for the year ended December 31, 2005).* | |||
Page 90
10.9 | Instrument of Amendment | ||
| Corporation Retirement Plan, as amended and restated effective January 1, 2001 (incorporated by reference to Exhibit 10 to Form 10-K for | |||
| the year ended December 31, | |||
10.10 | Instrument of Amendment No. 9 to the Curtiss-Wright Corporation Retirement Plan, as amended and restated effective January 1, 2001 (incorporated by reference to Exhibit 10 to Form 10-K for the year ended December 31, 2006) * | ||
10.11 | Instrument of Amendment No. 10 to the Curtiss-Wright Corporation Retirement Plan, as amended and restated effective January 1, 2001 (incorporated by reference to Exhibit 10 to Form 10-K for the year ended December 31, 2006) * | ||
10.12 | Instrument of Amendment No. 11 to the Curtiss-Wright Corporation Retirement Plan, as amended and restated effective January 1, 2001 (incorporated by reference to Exhibit 10 to Form 10-K for the year ended December 31, 2006) * | ||
10.13 | Instrument of Amendment No. 12 to the Curtiss-Wright Corporation Retirement Plan, as amended and restated effective January 1, 2001 (incorporated by reference to Exhibit 10 to Form 10-Q filed for the quarter ended September 30, 2007) * | ||
10.14 | Instrument of Amendment No. 13 to the Curtiss-Wright Corporation Retirement Plan, as amended and restated effective January 1, 2001 (incorporated by reference to Exhibit 10 to Form 10-K for the year ended December 31, 2007)* |
Page 97
10.15 | Instrument of Amendment No. 14 to the Curtiss-Wright Corporation Retirement Plan, as amended and restated effective January 1, 2001 (filed herewith).* | ||
10.16 | Restated and Amended Curtiss-Wright Corporation Savings and Investment Plan, dated February 28, 2002 (incorporated by reference to Exhibit (10)(v) to Form 10-K for the year ended December 31, 2001).* | ||
10.17 | Instrument of Amendment Nos. 1 and 2 to the Curtiss-Wright Corporation Savings and Investment Plan (incorporated by reference to Exhibit 10.5 to Form 10-Q for the quarter ended June 30, 2005).* | ||
10.18 | Instrument of Amendment Nos. 4 through 11 to the Curtiss-Wright Corporation Savings and Investment Plan (filed herewith).* | ||
10.19 | Instrument of Amendment Nos. 2 and 3 to the Curtiss-Wright Corporation Savings and | ||
| Investment Plan (incorporated by reference to Exhibit 10 to Form 10-K for the year ended December 31, 2005). * | |||
10.20 | Curtiss-Wright Electro-Mechanical Corporation Pension Plan, dated October 29, 2002 (incorporated by reference to Exhibit (10)(vii) to Form 10-K for the year ended December 31, 2002).* | ||
10.21 | Instruments of Amendment Nos. 1 and 2 to the Curtiss-Wright Electro-Mechanical Corporation Pension Plan (incorporated by reference to Exhibit 10.4 to Form 10-Q for the quarter ended June 30, 2005).* | ||
10.22 | Instruments of Amendment Nos. 3 through 6 to the Curtiss-Wright Electro-Mechanical Corporation Pension Plan (incorporated by reference to Exhibit 10 to Form 10-K for the year ended December 31, 2005). * | ||
10.23 | Instrument of Amendment No. 7 to the Curtiss-Wright Electro-Mechanical Division Pension Plan (incorporated by reference to Exhibit 10 to Form 10-K for the year ended December 31, 2006) * | ||
10.24 | Instrument of Amendment No. 8 to the Curtiss-Wright Electro-Mechanical Division Pension Plan (incorporated by reference to Exhibit 10 to Form 10-K for the year ended December 31, 2006) * | ||
| 10.25 | Form of Indemnification Agreement entered into by the Registrant with each of its directors (filed herewith). | ||
10.26 | Curtiss-Wright Electro-Mechanical Corporation Savings Plan, dated January 1, 2004 (incorporated by reference to Exhibit (10)(xviii) to Form 10-K for the year ended December 31, 2003).* | ||
10.27 | Instrument of Amendment No. 1 to the Curtiss-Wright Electro-Mechanical Corporation Savings Plan (incorporated by reference to Exhibit 10.6 to Form 10-Q for the quarter ended June 30, 2005).* |
Page 98
10.28 | Instrument of Amendment Nos. 2 and 3 to the Curtiss-Wright Electro-Mechanical | ||
| Corporation Savings Plan (incorporated by reference to Exhibit 10 to Form 10-K for the | |||
| year ended December 31, 2005). * | |||
10.29 | Instrument of Amendment Nos. 4, 5 and 6 to the Curtiss-Wright Electro-Mechanical Corporation Savings Plan (filed herewith).* | ||
10.30 | Curtiss-Wright Corporation 2005 Stock Plan for Non-Employee Directors (incorporated by reference to Appendix C to Proxy Statement filed April 5, 2005).* | ||
10.31 | Amended and Revised Curtiss-Wright Corporation Executive Deferred Compensation Plan, as amended November 2006 (incorporated by reference to Exhibit 10 to Form 10-K for the year ended December 31, 2006) * | ||
10.32 | Change In Control Severance Protection Agreement, dated July 9, 2001, between the Registrant and Chief Executive Officer of the Registrant (incorporated by reference to Exhibit 10.1 to Form 10-Q for the quarter ended September 30, 2001).* | ||
10.33 | Standard Change In Control Severance Protection Agreement, dated July 9, 2001, between the Registrant and Key Executives of the Registrant (incorporated by reference to Form 10-Q for the quarter ended September 30, 2001).* | ||
10.34 | Trust Agreement, dated January 20, 1998, between the Registrant and PNC Bank, National Association (incorporated by reference to Exhibit 10(a) to Form 10-Q for the quarter ended March 31, 1998).* | ||
10.35 | Consulting Agreement, dated March 1, 2006, between the Registrant and George J. Yohrling (incorporated by reference to Exhibit 10 to Form 10-K for the year ended December 31, 2005).* | ||
10.36 | Curtiss-Wright Corporation 2003 Employee Stock Purchase Plan (incorporated by reference to Appendix VII to Proxy Statement filed March 28, 2003).* | ||
10.37 | Note Purchase Agreement between the Registrant and certain Institutional Investors, dated September 25, 2003 (incorporated by reference to Exhibit 10.1 to Form 8-K filed October 3, 2003). | ||
10.38 | Restrictive Legends on Notes subject to Purchase Agreement between the Registrant and certain Institutional Investors, dated September 25, 2003 (incorporated by reference to Exhibit 10.2 to Form 8-K filed October 3, 2003). | ||
10.39 | Note Purchase Agreement between the Registrant and certain Institutional Investors, dated December 1, 2005 (incorporated by reference to Exhibit 10.1 to Form 8-K filed December 5, 2005). | ||
10.40 | Restrictive Legends on Notes subject to Purchase Agreement between the Registrant and certain Institutional Investors, dated December 1, 2005 (incorporated by reference to Exhibit 10.2 to Form 8-K filed December 5, 2005). | ||
10.41 | 2006 Modified Incentive Compensation Plan (incorporated by reference to Appendix B to Company’s 2006 Definitive Proxy Statement on Schedule 14A filed March 29, 2006). * | ||
10.42 | Restricted Stock Unit Agreement, dated October 9, 2006, by and between the Registrant | ||
| and David Linton (incorporated by reference to Exhibit 10 to Form 8-K filed October 11, 2006). * |
Page 99
10.43 | Restricted Stock Unit Agreement, dated October 23, 2007, by and between the Registrant and David Linton (incorporated by reference to Exhibit 10 to Form 8-K filed October 25, 2007). * | ||
10.44 | Restricted Stock Unit Agreement, dated October 9, 2006, by and between the Registrant | ||
| and David Adams (incorporated by reference to Exhibit 10 to Form 8-K filed October 16, 2006). * | |||
10.45 | Restricted Stock Unit Agreement, dated October 23, 2007, by and between the Registrant and David Adams (incorporated by reference to Exhibit 10 to Form 8-K filed October 25, 2007). * | ||
10.46 | Second Amended and Restated Credit Agreement dated as | ||
21 | |||
Subsidiaries of the Registrant (filed herewith). | |||
23 | Consent of Independent Registered Public Accounting Firm (filed herewith). | ||
31.1 | Certification of Martin R. Benante, Chairman and CEO, Pursuant to Rule 13a – 14(a) (filed herewith). | ||
31.2 | Certification of Glenn E. Tynan, Chief Financial Officer, Pursuant to Rule 13a – 14(a) (filed herewith). | ||
32 | Certification of Martin R. Benante, Chairman and CEO and Glenn E. Tynan, Chief | ||
| Financial Officer, Pursuant to 18 U.S.C. Section 1350 (filed herewith). | |||
Page 91100
CURTISS-WRIGHT CORPORATION and SUBSIDIARIES
SCHEDULE II – VALUATION and QUALIFYING ACCOUNTS
for the years ended December 31, 2006, 2005,2008, 2007, and 20042006
(In thousands)
|
|
|
|
|
|
|
|
|
|
|
|
|
|
|
| |||||||||||||||||||||
| Balance at | Charged to | Charged to | Balance at |
|
|
| Additions |
|
|
|
|
| ||||||||||||||||||||||||
| Beginning | Costs and | Other Accounts | Deductions | End of |
|
|
|
|
|
|
|
| ||||||||||||||||||||||||
| Description | of Period | Expenses | (Describe) | (Describe) | Period |
| Balance at |
| Charged to |
| Charged to |
| Deductions |
| Balance at |
| ||||||||||||||||||||
|
|
|
|
|
| |||||||||||||||||||||||||||||||
|
|
|
|
|
|
|
|
|
|
|
| |||||||||||||||||||||||||
| Deducted from assets to which they apply: | Deducted from assets to which they apply: |
|
|
|
|
|
|
|
|
|
|
| ||||||||||||||||||||||||
|
|
|
|
|
|
|
|
|
|
|
| |||||||||||||||||||||||||
Year-ended December 31,2008 |
|
|
|
|
|
|
|
|
|
|
| |||||||||||||||||||||||||
Reserves for inventory obsolescence |
| $ | 30,999 |
| $ | 9,525 |
| $ | 884 | (A) | $ | 7,125 | (B) | $ | 34,283 |
| ||||||||||||||||||||
Reserves for doubtful accounts and notes |
| 5,347 |
| 4,153 |
| (115 | ) (A) |
| 4,561 | (C) |
| 4,824 |
| |||||||||||||||||||||||
Tax valuation allowance |
| — |
| 356 |
| 5,019 | (A) |
| — |
| 5,375 |
| ||||||||||||||||||||||||
|
|
|
|
|
|
| ||||||||||||||||||||||||||||||
Total |
| $ | 36,346 |
| $ | 14,034 |
| $ | 5,788 |
| $ | 11,686 |
| $ | 44,482 |
| ||||||||||||||||||||
|
|
|
|
|
|
| ||||||||||||||||||||||||||||||
|
|
|
|
|
|
|
|
|
|
|
| |||||||||||||||||||||||||
Year-ended December 31, 2007 |
|
|
|
|
|
|
|
|
|
|
| |||||||||||||||||||||||||
Reserves for inventory obsolescence |
| $ | 26,152 |
| $ | 8,449 |
| $ | 3,450 | (A) | $ | 7,052 | (B) | $ | 30,999 |
| ||||||||||||||||||||
Reserves for doubtful accounts and notes |
| 5,389 |
| 2,320 |
| (689 | ) (A) |
| 1,673 | (C) |
| 5,347 |
| |||||||||||||||||||||||
|
|
|
|
|
|
| ||||||||||||||||||||||||||||||
Total |
| $ | 31,541 |
| $ | 10,769 |
| $ | 2,761 |
| $ | 8,725 |
| $ | 36,346 |
| ||||||||||||||||||||
|
|
|
|
|
|
| ||||||||||||||||||||||||||||||
|
|
|
|
|
|
|
|
|
|
| ||||||||||||||||||||||||||
| Year-ended December 31, 2006 |
|
|
|
|
|
|
|
|
|
|
| |||||||||||||||||||||||||
| Reserves for inventory obsolescence | $ | 25,377 | $ | 5,657 | $ | 338 | (A) | $ | 5,220 | (B) | $ | 26,152 |
| $ | 25,377 |
| $ | 5,657 |
| $ | 338 | (A) | $ | 5,220 | (B) | $ | 26,152 |
| ||||||||
| Reserves for doubtful accounts and | ||||||||||||||||||||||||||||||||||||
| notes | 5,453 | 1,269 | 179 | (A) | 1,512 | (C) | 5,389 | |||||||||||||||||||||||||||||
Reserves for doubtful accounts and notes |
| 5,453 |
| 1,269 |
| 179 | (A) |
| 1,512 | (C) |
| 5,389 |
| |||||||||||||||||||||||
|
|
|
|
|
|
| ||||||||||||||||||||||||||||||
| Total | $ | 30,830 | $ | 6,926 | $ | 517 | $ | 6,732 | $ | 31,541 |
| $ | 30,830 |
| $ | 6,926 |
| $ | 517 |
| $ | 6,732 |
| $ | 31,541 |
| ||||||||||
|
|
|
|
|
| |||||||||||||||||||||||||||||||
| Year-ended December 31, 2005 | ||||||||||||||||||||||||||||||||||||
| Reserves for inventory obsolescence | $ | 26,276 | $ | 3,700 | $ | 772 | (A) | $ | 5,371 | (B) | $ | 25,377 | ||||||||||||||||||||||||
| Reserves for doubtful accounts and | ||||||||||||||||||||||||||||||||||||
| notes | 4,012 | 1,161 | 1,019 | (A) | 739 | (C) | 5,453 | |||||||||||||||||||||||||||||
| Total | $ | 30,288 | $ | 4,861 | $ | 1,791 | $ | 6,110 | $ | 30,830 | ||||||||||||||||||||||||||
| Year-ended December 31, 2004 | ||||||||||||||||||||||||||||||||||||
| Reserves for inventory obsolescence | $ | 22,278 | $ | 4,212 | $ | 6,539 | (A) | $ | 6,753 | (B) | $ | 26,276 | ||||||||||||||||||||||||
| Reserves for doubtful accounts and | ||||||||||||||||||||||||||||||||||||
| notes | 3,449 | 802 | 368 | (A) | 607 | (C) | 4,012 | |||||||||||||||||||||||||||||
| Total | $ | 25,727 | $ | 5,014 | $ | 6,907 | $ | 7,360 | $ | 30,288 | ||||||||||||||||||||||||||
Notes: | ||
(A) | Primarily amounts acquired from business combinations and currency translation adjustments. | |
(B) | Write-off and sale of obsolete inventory. | |
(C) | Write-off of bad debt and collections on previously reserved accounts. | |
Page 92101
Pursuant to the requirements of Section 13 or 15(d) of the Securities Exchange Act of 1934, the Registrant has duly caused this report to be signed on its behalf by the undersigned, thereunto duly authorized.
CURTISS-WRIGHT CORPORATION | |||||||
Date: | March 2, 2009 | By: /s/ Martin R. Benante | |||||
Martin R. Benante | |||||||
Chairman and CEO | |||||||
Pursuant to the requirements of the Securities Exchange Act of 1934, this report has been signed below by the following persons on behalf of the Registrant and in the capacities and on the dates indicated.
Date: | March 2, 2009 | |||
By: /s/ Glenn E. Tynan | ||||
Glenn E. Tynan | ||||
Chief Financial Officer | ||||
Date: | March 2, 2009 | By: /s/ | ||
Glenn Coleman | ||||
Controller | ||||
Date: | March 2, 2009 | By: /s/ Martin R. Benante | ||
Martin R. Benante | ||||
Director | ||||
Date: | March 2, 2009 | |||
By: /s/ S. Marce Fuller | ||||
S. Marce Fuller | ||||
Director | ||||
Date: | March 2, 2009 | By: /s/ Allen A. Kozinski | ||
Allen A. Kozinski | ||||
Director | ||||
Date: | March 2, 2009 | By: /s/ Carl G. Miller | ||
Carl G. Miller | ||||
Director | ||||
Date: | March 2, 2009 | By: /s/ William B. Mitchell | ||
William B. Mitchell | ||||
Director | ||||
Date: | March 2, 2009 | By: /s/ John R. Myers | ||
John R. Myers | ||||
Director | ||||
Date: | March 2, 2009 | By: /s/ John B. Nathman | ||
John B. Nathman | ||||
Director | ||||
Date: | March 2, 2009 | By: /s/ William W. Sihler | ||
William W. Sihler | ||||
Director | ||||
Date: | March 2, 2009 | By: /s/ Albert E. Smith | ||
Albert E. Smith | ||||
Director | ||||
Page 93102