UNITED STATES
SECURITIES AND EXCHANGE COMMISSION
Washington, D.C. 20549
FORM 10-K
(Mark One)
☒ ANNUAL REPORT PURSUANT TO SECTION 13 OR 15(d) OF THE SECURITIES EXCHANGE ACT OF 1934
forFor the fiscal year ended December 31, 20212023
ORor
☐ TRANSITION REPORT PURSUANT TO SECTION 13 OR 15(d) OF THE SECURITIES EXCHANGE ACT OF 1934
forFor the transition period from to .
Commission file number: 1-13888
GRAFTECH INTERNATIONAL LTD.
(Exact name of registrant as specified in its charter)
Delaware 27-2496053
(State or other jurisdiction of (I.R.S. Employer
incorporation or organization) Identification Number)
982 Keynote Circle 44131
Brooklyn Heights, Ohio (Zip Code)44131
(Address of principal executive offices) (Zip Code)
Registrant’s telephone number, including area code: (216) 676-2000
Securities registered pursuant to Section 12(b) of the Act:
| | | | | | | | | | | | | | | | | | | | |
| Title of each class | | Trading Symbol(s) | Name of each exchange on which registered |
| Common Stock, $0.01 par value per share | | EAF | | New York Stock Exchange |
Securities registered pursuant to Section 12(g) of the Act:
None
Indicate by check mark if the registrant is a well-known seasoned issuer, as defined in Rule 405 of the Securities Act.
Yes ☒☐ No ☐☒
Indicate by check mark if the registrant is not required to file reports pursuant to Section 13 or Section 15(d) of the Act. Yes ☐ No ☒
Indicate by check mark whether the registrant: (1) has filed all reports required to be filed by Section 13 or 15(d) of the Securities Exchange Act of 1934 during the preceding 12 months (or for such shorter period that the registrant was required to file such reports), and (2) has been subject to such filing requirements for the past 90 days. Yes ☒ No ☐
Indicate by check mark whether the registrant has submitted electronically every Interactive Data File required to be submitted pursuant to Rule 405 of Regulation S-T (§232.405 of this chapter) during the preceding 12 months (or for such shorter period that the registrant was required to submit such files). Yes ☒ No ☐
Indicate by check mark whether the registrant is a large accelerated filer, an accelerated filer, a non-accelerated filer, a smaller reporting company or an emerging growth company. See the definitions of “large accelerated filer,” “accelerated filer," “smaller reporting company,” and "emerging growth company" in Rule 12b-2 of the Exchange Act.
Large accelerated filer ☒ Accelerated filer ☐ Non-accelerated filer ☐
Smaller reporting company ☐ Emerging growth company ☐
If an emerging growth company, indicate by check mark if the registrant has elected not to use the extended transition period for complying with any new or revised financial accounting standards provided pursuant to Section 13(a) of the Exchange Act. ☐
Indicate by check mark whether the registrant has filed a report on and attestation to its management’s assessment of the effectiveness of its internal control over financial reporting under Section 404(b) of the Sarbanes-Oxley Act (15 U.S.C. 7262(b)) by the registered public accounting firm that prepared or issued its audit report.☒
If securities are registered pursuant to Section 12(b) of the Act, indicate by check mark whether the financial statements of the registrant included in the filing reflect the correction of an error to previously issued financial statements. ☐
Indicate by check mark whether any of those error corrections are restatements that required a recovery analysis of incentive-based compensation received by any of the registrant’s executive officers during the relevant recovery period pursuant to §240.10D-1(b). ☐
Indicate by check mark whether the registrant is a shell company (as defined in Rule 12b-2 of the Exchange Act). Yes ☐ No ☒
The aggregate market value of the voting and non-voting common stock held by non-affiliates of the registrant as of June 30, 20212023 was $2,365.0$970.6 million, based on the closing price of the registrant’s common stock as reported on the New York Stock Exchange as of the last business day of the registrant’s most recently completed second quarter.
On February 11, 2022, 263,255,7082, 2024, 256,831,870 shares of our common stock were outstanding.
DOCUMENTS INCORPORATED BY REFERENCE
Portions of the definitive proxy statement (the “Proxy Statement”) to be filed with the Securities and Exchange Commission relative to the registrant’s 20222024 Annual Meeting of Stockholders are incorporated by reference into Part III of this Report.
Table of Contents
| | | | | | | | |
| |
| |
| | |
| Item 1. | | |
| | |
| | |
| | |
| | |
| | |
| | |
| | |
| | |
| | |
| | |
| | |
| | |
| | |
| | |
| | |
| | |
| | |
| Item 1A. | | |
| Item 1B. | | |
| Item 1C. | | |
| Item 2. | | |
| Item 3. | | |
| Item 4. | | |
| | |
| |
| |
| Item 5. | | |
| | |
| | |
| Item 6. | | |
| Item 7. | | |
| | |
| | |
| | |
| | |
| | |
| | |
| | |
| | |
| | |
| | |
| Item 7A. | | |
| Item 8. | | |
| | |
| | |
| | |
| | |
| | |
| | |
| | |
| | |
| Item 9. | | |
| Item 9A. | | |
| Item 9B. | | |
| Item 9C. | | |
| |
| |
| Item 10. | | |
| Item 11. | | |
| Item 12. | | |
| Item 13. | | |
| Item 14. | | |
| |
| |
| Item 15. | | |
| Item 16. | | |
| | |
PART I
References herein to the "Company", "we", "our",“Company,” “GrafTech,” “we,” “our,” or "us"“us” refer collectively to GrafTech International Ltd. and its subsidiaries.
Presentation of Financial, Market and Industry Data
We present our financial information on a consolidated basis. Unless otherwise noted, when we refer to dollars, we mean U.S. dollars.
Certain market and industry data included in this Annual Report on Form 10-K for the year ended December 31, 20212023 (the “Annual Report” or “Report”) has been obtained from third-party sources that we believe to be reliable. Market estimates are calculated by using independent industry publications, government publications and third-party forecasts in conjunction with our assumptions about our markets. We cannot guarantee the accuracy or completeness of this market and market share data and have not independently verified it. None of the sources has consented to the disclosure or use of data in this Annual Report. While we are not aware of any misstatements regarding any market, industry or similar data presented herein, such data involves risks and uncertainties and is subject to change based on various factors, including those discussed under the headings “Forward-Looking“Cautionary Note Regarding Forward-Looking Statements” and “Risk Factors” in this Annual Report.
Cautionary Note Regarding Forward-Looking Statements
This Report may contain forward-looking statements within the meaning of the safe harbor provisions of the U.S. Private Securities Litigation Reform Act of 1995. Forward-looking statements reflect our current views with respect to, among other things, financial projections, plans and objectives of management for future operations, and future economic performance. Examples of forward-looking statements include, among others, statements we make regarding future estimated revenuesvolume, pricing and volumes derived from our take-or-pay agreements with initial terms of three-to-five years ("LTA"), future pricing of short-term agreements and spot sales ("Non-LTA"),revenue, anticipated levels of capital expenditures and cost of goods sold, anticipated reduction in our costs resulting from our cost rationalization initiatives and one-time costs of implementation and guidance relating to earnings per shareadjusted EBITDA and adjusted EBITDA.free cash flow. You can identify these forward-looking statements by the use of forward-looking words such as “will,” “may,” “plan,” “estimate,” “project,” “believe,” “anticipate,” “expect,” “foresee,” “intend,” “should,” “would,” “could,” “target,” “goal,” “continue to,” “positioned to,” “are confident,” or the negative versions of those words or other comparable words. Any forward-looking statements contained in this Report are based upon our historical performance and on our current plans, estimates and expectations considering information currently available to us. The inclusion of this forward-looking information should not be regarded as a representation by us that the future plans, estimates, or expectations contemplated by us will be achieved. Our expectations and targets are not predictions of actual performance and historically our performance has deviated, often significantly, from our expectations and targets. These forward-looking statements are subject to various risks and uncertainties and assumptions relating to our operations, financial results, financial condition, business, prospects, growth strategy and liquidity. Accordingly, there are or will be important factors that could cause our actual results to differ materially from those indicated in these statements. We believe that these factors include, but are not limited to:
•our dependence on the ultimate impact the COVID-19 pandemic has on our business, results of operations, financial condition and cash flows, including the duration and spread of any variants, the duration and scope of related government orders and restrictions, the impact on our employees,global steel industry generally and the disruptions and inefficiencieselectric arc furnace (“EAF”) steel industry in our supply chain;
•the possibility that we may be unable to implement our business strategies, including our ability to secure and maintain longer-term customer contracts, in an effective manner;particular;
•the cyclical nature of our business and the selling prices of our products, which may continue to decline in the future, and may lead to periods of reduced profitability and net losses in the future;
•the risks and uncertainties associated with litigation, arbitration, and like disputes, including disputes related to contractual commitments;
•the possibility that global graphite electrode overcapacity mayor adversely affect graphite electrode prices;
•our dependence on the global steel industry generally and the electric arc furnace steel industry in particular;impact liquidity;
•the sensitivity of our business and operating results to economic conditions, including any recession, and the possibility others may not be able to fulfill their obligations to us in a timely fashion or at all;
•the possibility that we may be unable to implement our business strategies in an effective manner;
•the possibility that global graphite electrode overcapacity may adversely affect graphite electrode prices;
•the competitiveness of the graphite electrode industry;
•our dependence on the supply of raw materials, including decant oil and petroleum needle coke, and energy, and disruptions in supply chains for these materials;
•our primary reliance on one facility in Monterrey, Mexico for the manufacturing of connecting pins;
•the availability and cost of electric power and natural gas, particularly in Europe;
•our manufacturing operations are subject to hazards;
•changes in, or more stringent enforcement of, health, safety and environmental regulations applicable to our manufacturing operations and facilities;
•the legal, compliance, economic, social and political risks associated with our substantial operations in multiple countries;
•the possibility that fluctuation of foreign currency exchange rates could materially harm our financial results;
•the possibility that our results of operations could further deteriorate if our manufacturing operations were substantially disrupted for an extended period, including as a result of equipment failure, climate change, regulatory issues, natural disasters, public health crises, such as the COVID-19a global pandemic, political crises or other catastrophic events;
•the risks and uncertainties associated with litigation, arbitration, and like disputes, including disputes related to contractual commitments;
•our dependence on third parties for certain construction, maintenance, engineering, transportation, warehousing and logistics services;
•the possibility that we are subject to information technology systems failures, cybersecurity attacks, network disruptions and breaches of data security;
•the possibility that we are unable to recruit or retain key management and plant operating personnel or successfully negotiate with the representatives of our employees, including labor unions;
•the sensitivity of goodwilllong-lived assets on our balance sheet to changes in the market;
•the possibility that we are subject to information technology systems failures, cybersecurity attacks, network disruptions and breaches of data security;
•our dependence on protecting our intellectual property and the possibility that third parties may claim that our products or processes infringe their intellectual property rights;
•the impact of inflation and our ability to mitigate the effect on our costs;
•the impact of macroeconomic and geopolitical events on our business, results of operations, financial condition and cash flows, and the disruptions and inefficiencies in our supply chain that may occur as a result of such events;
•the possibility that our indebtedness could limit our financial and operating activities or that our cash flows may not be sufficient to service our indebtedness;
•the possibility that restrictive covenantsrecent increases in our financing agreements could restrict or limit our operations;
•benchmark interest rates and the fact that any future borrowings under certain of our existing financing agreementsmay subject us to interest rate risk;
•the possibility that disruptions in or our ability to access the capital and credit markets could adversely affect our results of operations, cash flows and financial condition, or those of our customers and suppliers;
•the possibility that the market pricerestrictive covenants in our financing agreements could restrict or limit our operations;
•changes in, or more stringent enforcement of, health, safety and environmental regulations applicable to our common stock could be negatively affected by sales of substantial amounts of our common stock in the public markets, including by Brookfield Asset Management Inc.manufacturing operations and its affiliates;facilities; and
•the possibility that the cash dividends on our common stock, which are currently suspended, will remain suspended and we may not pay cash dividends on our common stock in the future; and
•the fact that our stockholders have the right to engage or invest in the same or similar businesses as us.future.
These factors should not be construed as exhaustive and should be read in conjunction with the risk factorsRisk Factors and other cautionary statements that are included in this Report. The forward-looking statements made in this Report relate only to events as of the date on which the statements are made. Except as required by law, we do not undertake any obligation to publicly update or review any forward-looking statement, whether as a result of new information, future developments or otherwise.
If one or more of these or other risks or uncertainties materialize, or if our underlying assumptions prove to be incorrect, our actual results may vary materially from what we may have expressed or implied by these forward-looking statements. We caution that you should not place undue reliance on any of our forward-looking statements. You should specifically consider the factors identified in this Report that could cause actual results to differ before making an investment decision to purchase our common stock. Furthermore, new risks and uncertainties arise from time to time, and it is impossible for us to predict those events or how they may affect us.
For a more complete discussion of these and other factors, see "Risk Factors"“Risk Factors” in Part I of this Report and "Management's“Management’s Discussion and Analysis of Financial Condition and Results of Operations"Operations” in Part II of this Report.
Item 1.Business
Our companyIntroduction
GrafTech International Ltd., founded in 1886 and incorporated in Delaware, is a leading manufacturer of high-quality graphite electrode products essential to the production of electric arc furnace ("EAF")EAF steel and other ferrous and non-ferrous metals. We believe that we have the mosta competitive portfolio of low-cost ultra-high power (“UHP”) graphite electrode manufacturing facilities, in the industry, including threewith some of the highest capacity facilities in the world. We have graphite electrode manufacturing facilities in Calais, France, Pamplona, Spain, Monterrey, Mexico and St. Marys, Pennsylvania. We are the only large scalelarge-scale graphite electrode producer that is substantially vertically integrated into petroleum needle coke, aour key raw material for graphite electrode manufacturing. This unique position provides us with competitive advantages in product quality and cost. Founded in 1886, we have over 135 years
Our only reportable segment, Industrial Materials, is comprised of experience in the researchtwo major product categories: graphite electrodes and development (“R&D”) of graphite- and carbon-based solutions, and our intellectual property portfolio is extensive. We currently have graphite electrode manufacturing facilities in Calais, France, Pamplona, Spain, Monterrey, Mexico and St. Marys, Pennsylvania. Our customers include major steel producers and other ferrous and non-ferrous metal producers in Europe, Russia and other Commonwealth of Independent States countries, the Middle East and Africa (collectively, “EMEA”), the Americas and Asia-Pacific (“APAC”), which sell their products into the automotive, construction, appliance, machinery, equipment and transportation industries.petroleum needle coke products. Our vision is to provide highly engineered graphite electrode products, services solutions and productssolutions to EAF operators. Based on the high-quality of our graphite electrodes, reliability of our petroleum needle coke supply and our excellent customer service, we believe that we are viewed as a preferred supplier to the global EAF steel producer market.
As of December 31, 2023, our stated production capacity was approximately 202 thousand metric tons (“MT”)1 through our primary manufacturing facilities in Calais, Pamplona and Monterrey. On February 14, 2024, the Company announced a cost rationalization and footprint optimization plan, in response to persistent softness in the commercial environment. This includes an indefinite suspension of production activities at our St. Marys facility, with the exception of graphite electrode and pin machining. We are also indefinitely idling certain assets within our remaining graphite electrode manufacturing footprint. As a result of these initiatives, beginning in 2024, our stated production capacity will be approximately 178 thousand MT1.
Our principal executive offices are located at 982 Keynote Circle, Brooklyn Heights, Ohio 44131 and our telephone number is (216) 676‑2000. Our website address is www.graftech.com. Information on, or accessible through, our website is not part of this Annual Report. We have included our website address only as an inactive textual reference and do not intend it to be an active link to our website.
Products and Raw Materials
Graphite Electrodes
Graphite electrodes are an industrial consumable product used primarily in EAF steel production, one of the two primary methods of steel production and the steelmaking technology used by all “mini‑mills.” Electrodes act as conductors of electricity in the furnace, generating sufficient heat to melt scrap metal, iron oreore-derived products or other raw materials used to produce steel or other metals. We estimate that, on average, the cost of graphite electrodes represents less than 5% of the total production cost of steel in a typical EAF, but they are essential to EAF steel production. Graphite electrodes are currently the only known commercially available products that have the high levels of electrical conductivity and the capability to sustain the high levels of heat generated in EAF steel production. As a result, EAF steel manufacturers require a reliable supply of high-quality graphite electrodes. Graphite electrodes are also used in steel refining in ladle furnaces and in other processes, such as the production of titanium dioxide, stainless steel, silicon metals and other ferrous and non‑ferrous metals.
With the growth of EAF steel production, graphite electrode production has become focused on the manufacturemanufacturing of UHP electrodes.electrodes, which have low electrical resistivity and strong durability to maximize efficient use of electricity in the EAF and minimize electrode consumption. The production of UHP electrodes requires an extensive proprietary manufacturing process and material science knowledge, including the use of higher quality needle coke blends. We primarily competemanufacture graphite electrodes ranging in size up to 30 inches (750 millimeters) in diameter, over 11 feet (3,400 millimeters) in length, and weighing as much as 5,900 pounds (2.6 MT). In 2024, we anticipate expanding our product offerings to include the addition of an 800-millimeter super-sized electrode to our portfolio to serve a small but growing segment of the UHP graphite electrode market.
Petroleum needle coke, We also manufacture corresponding sizes of graphite connecting pins, which are used by customers to connect and fasten graphite electrodes together in a crystalline form of carbon derived from decant oil, is the key raw material wecolumn for use in an EAF. For the past several years, all of our connecting pin production of graphite electrodes. We achieved substantial vertical integration with this critical raw material source throughwas performed at our acquisition of Seadrift Coke L.P. (“Seadrift”) in November 2010, significantly reducingMonterrey, Mexico facility. However, we recently added pin production capabilities at our reliance on other suppliers. The petroleum needle coke industry is highly concentrated. We believe Seadrift is one of the largest petroleum needle coke producers in the world. We also believe that the quality of Seadrift’s petroleum needle coke is superior for graphite electrode production compared to most of the petroleum needle coke available to our peers on the open market, allowing us to produce high-quality electrodes in a cost‑efficient manner. Additionally, we believe that this vertical integration provides a significant cost advantage relative to our competitors.
As a leading producer of graphite electrodes, we believe we are well-positioned to be a key provider to the EAF steel making industry. Our production capacity is approximately 200,000 metric tons ("MT")1 through our primary manufacturing facilities in Calais, France, Pamplona, Spain and Monterrey, Mexico. In 2021, we shifted graphitization and machining of a portion of semi-finished products from Monterrey to St. Marys, Pennsylvania, in order to improve environmental performance, production flexibility and overall cost efficiencies across the two facilities.
Graphite electrodes are an essential consumable in the EAF steel production process and require a long lead time to manufacture, and our strategic customers are highly focused on securing certainty of supply of reliable, high-quality graphite electrodes. We believe we are uniquely capable among graphite electrode producers to pursue our LTA contracting strategy due to our substantial vertical integration into petroleum needle coke production.
On August 15, 2015, we became an indirect wholly owned subsidiary of Brookfield Asset Management Inc. (together with its affiliates, "Brookfield"). In April 2018, we completed our initial public offering ("IPO"). Our common stock is listed
1 Production capacity reflects expected maximum production volume during the period through our Calais, Pamplona and Monterrey facilities depending on product mix and expected maintenance outage. Actual production may vary.
on the New York Stock Exchange ("NYSE") under the symbol “EAF.” Brookfield owned approximately 24%facility to provide alternative sources, if needed, for this critical component. The total manufacturing time of our common stock as of December 31, 2021.
Our executive offices are located at 982 Keynote Circle, Brooklyn Heights, Ohio 44131 and our telephone number is (216) 676‑2000. Our website address is www.graftech.com. Information on, or accessible through, our website is not part of this Annual Report. We have included our website address only as an inactive textual reference and do not intend it to be an active link to our website.
Competitive strengths
We are one of the largest producers of graphite electrodes in the world, accounting for approximately a quarter of global production capacity (excluding China), and we believe our strategically positioned global footprint provides us with competitive advantages.
We believe our facilities are among the most strategically located and lowest cost, large‑scaleUHP graphite electrode manufacturing plants in the world. Of the graphite electrode manufacturing facilities currently operating, we estimate that our three primary operating manufacturing facilities representand its associated connecting pin is, on average and except for special requests, approximately a quarter of estimated production capacity for graphite electrodes outside of China, making us a critical supplier to global EAF steel manufacturers. Our manufacturing facilities are located in the Americas and EMEA, providing us with access to reliable energy sources, logistical and freight advantages in sourcing raw materials and shipping our graphite electrodes to our customers compared to our competitors, and excellent visibility into the large North American and European EAF steelmaking markets. Our experience in producing graphite electrodes for a varied global customer base positions us to meet customer requirements across a range of product types and quality levels, including support and technical services, further distinguishing us from our competitors.six months.
We are a pure‑play provider of an essential consumable for EAF steel producers, the fastest‑growing sector of the steel industry.
According to the World Steel Association (“WSA”), since 2000, EAF steelmaking grew at an annual pace of approximately 2%, compared with 1% for steelmaking overall, excluding China. As a result of the increasing global availability of steel scrap and the more resilient, high‑variable cost and environmentally friendly EAF model, we expect EAF steel producers to continue to grow at a faster rate than blast oxygen furnace ("BOF") producers globally. Additionally, EAF steel producers are increasingly able to utilize higher quality scrap and iron units, their two primary raw materials, to produce higher quality steel grades and capture market share from BOF producers, while maintaining a favorable cost structure. The EAF method produces approximately 25% of the carbon dioxide (“CO2”) emissions of a BOF facility and does not require the smelting of virgin iron ore or the burning of coal. Additionally, as a result of significantly increased steel production in China since 2000, the supply of Chinese scrap is expected to increase substantially, which may result in lower scrap prices and provide the Chinese steel manufacturing industry with local scrap feedstock that was not historically available. We believe these trends will allow EAF steel producers to increase their market share and grow at a faster rate than BOF steel producers resulting in increasing demand for graphite electrodes.
We believe we have the industry’s most efficient production platform of high production capacity assets with substantial vertical integration.
From 2014 to 2016, we rationalized inefficient plants during the downturn and more recently completed a manufacturing footprint optimization program. We believe that the optimization of our graphite electrode plant network will continue to drive improved fixed cost absorption. Moreover, our Calais, Pamplona, Monterrey and St. Marys facilities each provides unique cost advantages given its scale and access to reliable energy sources.
Seadrift provides a substantial portion of our petroleum needle coke supply needs internally at a competitive cost and allows us to maximize capacity utilization more efficiently than competitors, who may be more constrained by a limited or costly petroleum needle coke supply. Seadrift is one of only five petroleum needle coke facilities in the world outside of China, and we believe it is one of the largest petroleum needle coke producers in the world.
We are the only petroleum needle coke producer in the world specifically focused on the production of graphite electrodes.
Our production of petroleum needle coke specifically for graphite electrodes provides us the opportunity to produce super premium petroleum needle coke of the highest quality and allows us to tailor graphite electrodes for customer requirements. Seadrift has approximately 140,000 MT of petroleum needle coke production capacity, which we believe makes it one of the largest petroleum needle coke producers in the world. Sourcing the majority of our petroleum needle coke internally allows us to offer our customers certainty of supply, further enhancing our competitive position and supporting our LTA strategy. To align with our LTA profile, we have hedged the decant oil required to produce substantially all of the graphite electrodes sold under these contracts, providing us with substantial visibility into our raw material costs. We believe our use of petroleum needle coke is a further competitive advantage, as the use of pitch needle coke, an alternative raw material, results in longer bake times during graphite electrode production.
We provide highly engineered graphite electrode products and are competitively positioned to provide services and solutions to EAF operators.
We utilize our own R&D facility as well as process engineers located at plant sites to constantly work at process and product improvements. This work has yielded the development of new products, which have improved our competitive position. In addition, we believe that our ArchiTech Furnace Productivity System (“ArchiTech”) continues to provide a competitive advantage. ArchiTech, which has been installed at customer furnaces around the world, enables our engineers to work with our customers seamlessly to maximize the performance of their furnaces and provide real‑time diagnostics and troubleshooting. This remote functionality has been particularly helpful during the COVID-19 pandemic. We believe our customers value our high-quality products and customer service, which subsequently improves our commercial opportunities.
Our experienced executive leadership and general managers and flexible workforce have positioned us for future earnings growth.
Our seasoned leadership is committed to earnings growth. Our executive and manufacturing leadership have led manufacturing companies through many cycles and are focused on positioning us for profitable growth in any environment. We have undertaken strategic investments to increase our production capacity in a capital‑efficient manner while positively impacting our cost structure.
Graphite electrode industry
EAF steel producers are the primary consumers of graphite electrodes. The size of the electrodes used in EAF steel production varies depending on the size of the furnace, the size of the furnace’s electric transformer and the planned productivity of the furnace. In a typical furnace using alternating electric current and operating at a typical number of production cycles per day, three UHP graphite electrodes are fully consumed (requiring the addition of new electrodes), on average, every eight to ten operating hours. UHP graphite electrodes are consumed at a rate of approximately 1.7 kilograms per MT of steel production, on average, in EAF facilities.
The actual rate of consumption and addition of electrodes for a particular furnace depends primarily on the efficiency and productivity of the furnace. Therefore, demand for graphite electrodes is directly related to the amount and efficiency of EAF steel production. EAF steel production requires significant heat (as high as 5,000° F) to melt the raw materials, primarily scrap metal, in the furnace. Heat is generated as electricity (as much as 150,000 amps) passes through the electrodes and creates an electric arc between the electrodes and the raw materials.
Graphite Electrode Industry - Supply and Demand Trends
Supply trends
We estimate that as of the end of 2023, the graphite electrode industry globally (excluding China) had nameplate capacity to produce approximately 810 thousand MT of graphite electrodes. The industry is fairly consolidated, particularly outside of China. Thewith the five largest global (excluding China) producers in the industry, are Showa Denko K.K., GrafTech, Fangda Carbon New Material Technology Co. LTD,Resonac Holdings Corporation, HEG Limited, Tokai Carbon Co., Ltd. and Graphite India Limited.Limited, collectively, representing over 80% of global (excluding China) graphite electrode production capacity. As of December 31, 2023, our stated production capacity was approximately 202 thousand MT through our Calais, Pamplona and Monterrey facilities and represented approximately one-quarter of the global (excluding China) graphite electrode production capacity. On February 14, 2024, the Company announced a cost rationalization and footprint optimization plan, in response to persistent softness in the commercial environment. As a result, beginning in 2024, our stated production capacity will be approximately 178 thousand MT.
SupplyWe believe that no new graphite electrode production facilities have been built outside of China for several years.In recent years, additional production capacity has been generated by optimization and debottlenecking of existing assets and limited brownfield expansion.
We primarily compete in the UHP segment of the graphite electrode market. We estimate that, as of the end of 2023, global (excluding China) UHP graphite electrode capacity was approximately 690 thousand MT, or approximately 85% of the global (excluding China) graphite electrode capacity.
Although graphite electrode production capacity within China exceeds that of the rest of the world combined, the production landscape in China is fragmented, and the quality of Chinese graphite electrodes varies greatly. We estimate that as of the end of 2023, total production capacity within China for the UHP segment of graphite electrodes was approximately 825 thousand MT. However, we believe that a significant portion of the UHP electrodes produced in China do not meet the quality standards needed to be exported for use in the most demanding EAF applications. In addition, the imposition of customs duties and other tariffs in key EAF steelmaking regions, including the United States and the European Union (“EU”), have further limited the quantity of graphite electrodes exported from China.
Demand trends
We estimate that from 2014 to 2016, the industry closed or repurposed approximately 20% ofannual global production capacity outside of China, consisting of smaller, higher cost facilities. Based on our experience, high capacity manufacturing facilities can have a significant operating cost advantage as compared to low capacity manufacturing facilities, encouraging producers to consolidate facilities in order to reduce costs. The majority of the production capacity reduction was permanent due to the demolition, long-term environmental remediation and repurposing of most of these lower capacity facilities. These consolidation and production capacity reductions in the(excluding China) UHP graphite electrode industry, along withdemand has been approximately 660 thousand MT, on average, over the EAF steel industry’s recovery, lead us to believe that the graphite electrode industry will continue its long-term growth trajectory.
Demand trends
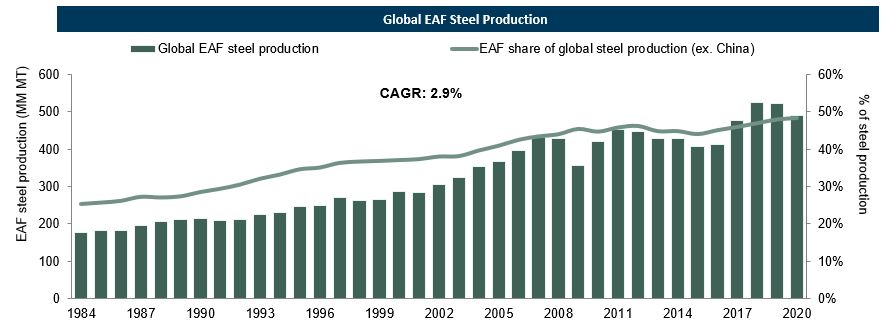
Ourpast three years. UHP graphite electrodes are primarily used in the EAF steelmaking process, and long-term global growth in that marketof EAF steel production has driven increased demand for graphite electrodes.electrodes over time. EAF steelmaking has historically been the fastest-growing segment of the global steel market. According to the WSA,World Steel Association (“WSA”), global (excluding China) EAF steel production grew at 2.9%a 2%-3% compound annual growth rate from 19842015 to 2020, while taking market share from other methods2022, the most recent year for which WSA has published such figures. This compares to a 1% compound annual growth rate for overall global (excluding China) steel production during this same period. As a result, the EAF method of steelmaking in most regionsaccounted for 49% of the world, outsideglobal (excluding China) steel production in 2022, compared to 44% in 2015, with share growth in nearly every region.
EAF steelmaking is more energy efficient and is advantaged in terms of China.its environmental footprint, compared to steel produced through the basic oxygen furnace (“BOF”) steelmaking model. According to the Steel Manufacturers Association (“SMA”), EAF steelmaking produces 75% fewer carbon dioxide emissions compared to BOF steelmaking. Further, SMA notes that the EAF process is a sustainable model for recycling scrap-based raw materials into new steel, which is 100% (and
infinitely) recyclable at the end of its useful life. In addition to these advantages, EAF steel producers benefit from their flexibility in sourcing iron units, being able to make steel from either scrap or alternative sources of iron, likesuch as direct reduced iron and hot briquetted iron, both made directly from iron ore. Most of the growth in EAF steelmaking has taken place in Western Europe
Reflecting these and North America, two regions with substantial amounts of scrap available for use in EAFs.
Source: World Steel Association
EAF Steel Production's Outlook
Since 2016, the EAF steel industry has grown at a 4.5% compound annual rate according to the WSA. This recovery has taken place since China began to restructure its steel industry, encouraging consolidation and shutting down excess capacity. China has also begun to implement environmental regulations to improve air quality impacted by CO2 emissions associated with the burning of coal in BOF steelmaking. Additionally, trade remedies in developed economies such as North America and Western Europe are protecting their domestic steel industries against imports from BOF-steel producing countries, which has resulted in a significant decrease in Chinese steel exports. According to China Customs and Baiinfo, Chinese steel exports declined from 112 million MT in 2015 to 67 million MT in 2021. This resulted in increased steel production outside of China, benefiting EAF steel production.
Weother competitive advantages, we believe there is a particular opportunity for EAF steelmaking to take further market share in China as well. China’s Ministry of Industry and Information Technology's current draft guidelines call for EAF steelmaking to constitute 15% of overall steel production by 2025, doubling its current share of output. If Chinese EAF steelmaking production capacity were to reach 15%, based on 2020 production levels, that would add 62 million MT of additional EAF steel production forwill continue to grow at a totalfaster rate than BOF steel production. Based on industry announcements of 160 million MT, compared to 2020planned incremental EAF capacity additions and factoring in further production increases at existing EAF steel productionplants, we estimate this could result in the next largest regionsglobal (excluding China) UHP graphite electrode demand growing at a compound annual growth rate of 86 million MT in Europe, 71 million MT in North America and 56 million MT in India, accordingapproximately 3% to WSA.4% through 2028.
Pricing trendsPetroleum Needle Coke
Pricing for graphite electrodes is determined through contract negotiations and spot transactions between producers and consumers. Pricing has historically been cyclical, reflecting the demand trends of the global EAF steelmaking industry and supply of graphite electrodes. Moreover, as petroleumPetroleum needle coke, represents a significant percentagecrystalline form of carbon derived from decant oil, is the key raw material cost of graphite electrodes, graphite electrodes have typically been priced at a spread to petroleum needle coke. Over the period from 2007 to 2021, the average graphite electrode spread over petroleum needle coke was approximately $3,600 per MT, on an inflation-adjusted basis using constant 2021 dollars. In tight demand markets, this spread has increased, resultingwe use in higher graphite electrode prices.
There is no widely accepted graphite electrode reference price. Historically, between 2007 and 2021, our weighted average realized price of graphite electrodes, excluding LTAs, was approximately $5,700 per MT (on an inflation-adjusted basis using constant 2021 dollars).
In 2019 and in 2020, market prices declined from the peaks of 2017 and 2018. The prices continued to decline into the first half of 2021 before starting to recover in the second half of the year. During the fourth quarter of 2021, our average price for non-LTA business was approximately $5,000 per MT, 10% higher than in the third quarter of 2021. The non-LTA sales price reflects a mix of annual agreements negotiated in the fourth quarter of the prior year, semi-annual and quarterly agreements negotiated earlier in the year along with spot agreements. There is a lag between the time we negotiate price for non-LTA sales and when our electrodes are delivered and recognized in revenue. We expect our first quarter 2022 non-LTA prices to increase 17 to 20% over the fourth quarter of 2021 as the price of annual and semi-annual agreements have now been reset to the current market conditions.
Needle coke industry
Introduction
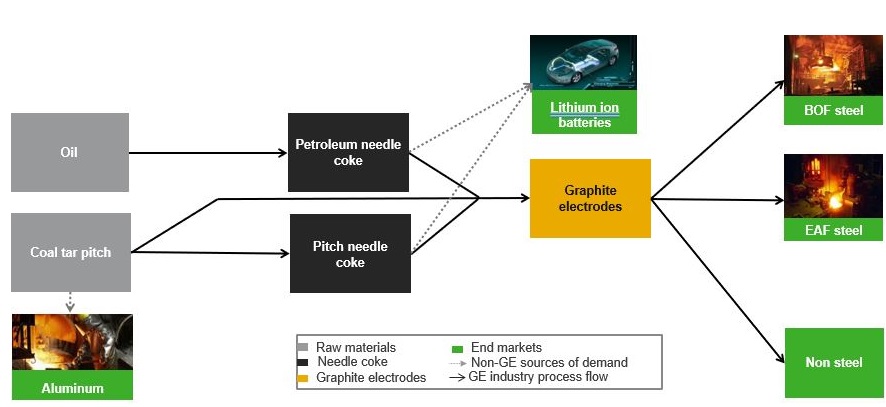
Needle coke is the primary raw material for the production of graphite electrodes used by EAF steelmakers and producers of stainless steel, silicon metals and other ferrous and non-ferrous metals, andelectrodes. It is also a primary raw material utilized in the production of synthetic graphite used in anodes for lithium-ion batteries used tothat power electric vehicles. Needle coke is derived from two carbon sources. vehicles (“EV”).
Petroleum needle coke is produced through a manufacturing process very similar to a refinery. The production process converts decant oil, a byproduct of the gasoline refining process, into petroleum needle coke and generally takes two to three months to produce.coke. Pitch needle coke, used principally by AsianChinese graphite electrode manufacturers, is made from coal tar pitch, a byproduct of coking metallurgical coal used in BOF steelmaking. For the production of our graphite electrodes, we prefer petroleum needle coke because of the meaningfully shorter bake and graphitizing time required, compared to graphite electrodes produced using pitch needle coke.
We are substantially vertically integrated into petroleum needle coke through our Seadrift facility (“Seadrift”), located in Port Lavaca, Texas, which provides the majority of our petroleum needle coke requirements used to produce our graphite electrodes and insulates us from rapid changes in the petroleum needle coke market. In addition, we believe the quality of Seadrift’s petroleum needle coke is superior for graphite electrode production compared to most of the petroleum needle coke available to our peers on the open market, allowing us to produce high-quality electrodes in a cost‑efficient manner. Seadrift sources all of its decant oil requirements from reputable U.S.-based suppliers. Seadrift has developed a well-diversified pool of suppliers, which we believe is sufficient to meet our needs.
Graphite electrode producers combine petroleum needle coke andand/or pitch needle coke with binders and other ingredients to form graphite electrodes. Petroleum needle coke and pitch needle coke, relative to other varieties of coke, are distinguished by their needle-like structure and their quality, which is measured by the presence of impurities, principally sulfur, nitrogen and ash. Petroleum needle coke and pitch needle coke are typically low in these impurities. Additionally, the needle-like structure of petroleum and pitch needle coke creates expansion along the length of the electrode, rather than the width, which reduces the likelihood of fractures. In order to minimize fractures caused by disproportionate expansion over the width of an electrode,
Petroleum Needle Coke Industry - Supply and minimize the effect of impurities, large-diameter graphite electrodes (18 inches to 32 inches) employed in high-intensity EAF applications are comprised almost exclusively of petroleum needle coke and pitch needle coke.Demand Trends
The process map below shows the raw materials required to make graphite electrodes, the various consumers of these raw materials, as well as the consumers of graphite electrodes.Supply Trends
Source: Management estimates
Previously, producers of petroleum needle coke typically agreed to supply petroleum needle coke in 12 month contracts; however, since 2017, producers of petroleum needle coke have typically used three to six month contracts. As a result, our competitors must continually renegotiate supply agreements in response to changing market conditions. We are substantially vertically integrated through our ownership of our Seadrift facility, which provides the majority of our needle coke requirements and insulates us from rapid changes in the needle coke market.
Market size and major producers
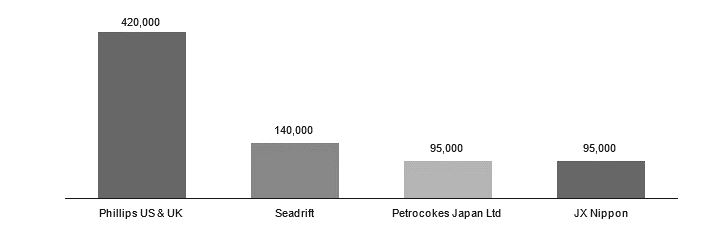
The needle coke industry is concentrated. We estimate that, Seadrift has approximately one-fifthas of the end of 2023, the petroleum needle coke productionindustry globally (excluding China) had capacity outside China.
Graphite electrode manufacturers preferto produce approximately 750 thousand MT of petroleum needle coke. The global (excluding China) industry is highly concentrated as it is comprised of four producers, Phillips 66, GrafTech (via Seadrift), Petrocokes Japan Ltd. (a subsidiary of Sumitomo Corporation) and ENEOS Holdings, Inc. Our Seadrift facility, with nameplate capacity to produce approximately 140 thousand MT of calcined petroleum needle coke, becauserepresents nearly one-fifth of the meaningfully longer bake and graphitizing time required for pitch needle coke. Additionally, the demand for petroleum needle coke in lithium-ion battery manufacturing is growing rapidly. Electric vehicle manufacturers prefer artificial graphite such as petroleum needle coke in lithium-ion batteries because of its greater energy density, providing batteries with longer driving ranges and longevity.
Estimated Petroleum needle coke industry production capacityglobal (excluding China) by company (MT)
Source: Management estimates
Industry trendsproduction capacity.
Petroleum needle coke production capacity outside of China has remained relatively flat for the last severalmany years due to the capital intensity, technical know-how and long permitting lead times required to build greenfield needle coke production facilities and the stringent regulatory process associated with building newfacilities.
Chinese petroleum needle coke production capacity. Furthermore,capacity is expected to grow significantly in the coming years, with a primary focus on serving the EV market, as China is currently the largest producer of EV batteries. Although this may provide sufficient capacity to meet global petroleum needle coke needs for the next several years, as demand from emerging non-Chinese EV battery producers continues to increase, we believe that brownfield expansion opportunitiesregional supply-demand imbalances will occur, particularly in developed countries are generally not available asNorth America and Europe, in the coming years.
Demand Trends
We estimate that global (excluding China) needle coke demand for use in UHP graphite electrode production has been approximately 550 thousand MT, on average, over the past three years with the majority being petroleum needle coke manufacturing iscoke. With demand for UHP graphite electrodes expected to increase at a continuous process with significant costs associated with shutting down and restarting facilities for maintenance or capital investment.compound annual growth rate of approximately 3% to 4%
through 2028 (see “Graphite Electrode” section above), we expect this to result in a similar increase in demand for needle coke used in graphite electrode production.
While the vast majority of petroleum needle coke produced globally (excluding China) is currently used in the production of graphite electrodes, theits use of needle coke in lithium-ion batteries for electric vehiclesthe EV market is growingexpected to grow with the increased production of these vehicles. According to the International Energy Agency ("IEA"), the global electric car fleet exceeded 10 million in 2020, as compared to 17,000 in 2010. The IEA projects that global annual sales of electric cars may range between 13 million and 20 million by 2025. Most electric vehiclesEVs rely on lithium-ion batteries as their key performance component. Some manufacturerscomponent, with graphite being the key material used for the carbon anode portion of the batteries. Although both natural and synthetic graphite are used in anodes for lithium-ion batteries, for electric vehicles useEV manufacturers prefer synthetic graphite, which is produced using needle coke, as a raw material for carbon anodes in their batteries due tobecause of its advantages in terms of charging rate and capacity. According to IEA,capacity, providing batteries with longer driving ranges and longevity.
Based on Benchmark Mineral Intelligence estimates for growth in battery pack capacityanodes, we estimate this could result in global needle coke demand for use in EV applications increasing at a 20% or more compound annual growth rate through 2028. While synthetic graphite can be produced from either petroleum needle coke or pitch needle coke, petroleum needle coke has been increasingsuperior characteristics for EV battery applications, as it does with graphite electrode applications. As a result, demand growth for petroleum needle coke for use in recent years andthe EV market is expected to continue. Based on IEA’s estimates for electric vehicle sales and battery pack size, and management estimates forbe higher than that of overall needle coke used in anodes, demand growth. As noted above, with North American and European EV manufacturers increasing focus on domestic sourcing of battery material needs, we believe that regional supply-demand imbalances will occur for petroleum needle coke from electric vehicles could grow significantly from over 100,000 MT in 2020 to over 650,000 MT in 2025.2the coming years.
Contracts and Customers
Our customers include major steel producers and other ferrous and non-ferrous metal producers in Europe, the Middle East and Africa (collectively, “EMEA”), the Americas, and Asia-Pacific (“APAC”), which sell their products primarily into the automotive, construction, appliance, machinery, equipment and transportation industries.
We sell our products under LTAs and under short-term purchase agreements, multi-year purchase agreements (which includes our take-or-pay agreements with initial term of three-to-five years (“LTAs”)) and spot sales.
Our short-term agreements are either annual, semi-annual or quarterly. We also sell electrodes underBecause of the long production time, the book building process is largely concentrated in the fourth quarter of each year for the annual short-term agreements as well as for the semi-annual agreements related to the first half of the upcoming year. Spot purchase orders are entered into with deliveries usually starting three or more months later. The price of our short-term agreements is determined through contract negotiations with our customers and is influenced by the then-prevailing price on spot purchase orders for limited quantitiesas well as the anticipated supply-demand situation at the time of the planned deliveries. There is a time.
The LTAs were entered intolag between the end of 2017time we negotiate prices for our short-term agreements and early 2019. As graphitewhen our electrodes are an essential consumabledelivered and recognized in revenue.
There is no widely accepted graphite electrode reference price. Pricing has historically been cyclical, reflecting the demand trends of the global EAF steel production processsteelmaking industry and require a long lead time to manufacture, we believe our strategic customers are highly focused on securing certainty of supply of reliable, high-quality graphite electrodes.
We believe we are uniquely capable among graphite electrode producers to pursue our LTA contracting strategy due to our substantial vertical integration into petroleum needle coke production. All of our petroleum needle coke production is used internally and is not sold to external customers. Demand for petroleum needle coke increased due to an increased demand for
2 Source: IEA Global Electric Vehicle Outlook 2020 for electric vehicle sales and battery pack capacity. This also assumes approximately 0.8 kilogram anode material per kilowatt-hour of battery pack capacity. Anode material is assumed to be approximately 50% synthetic and 50% natural graphite, with a yield of 50%.
graphite electrodes and the use of needle coke in lithium-ion batteries for electric vehicles. Consequently, we expect this limited availability of petroleum needle coke will restrict new graphite electrode production. Seadrift, our wholly-owned subsidiary acquired in 2010, provides the majority of our petroleum needle coke requirements and produces sufficient needle coke to supply substantially all of the graphite electrode production that we have contracted under our LTAs. We have also hedged the decant oil required to produce substantially all of the graphite electrodes sold under these contracts, providing us substantial visibility into our raw material costs.
Because the market price of graphite electrodes may be based, in part, on the current or forecasted costs of key raw materials, periods of raw material price volatility may have an impact on the market price. In particular, Moreover, as petroleum needle coke represents a significant percentage of the raw material cost of graphite electrodes, graphite electrodes have typically been priced at a spread to petroleum needle coke. Over the period from 2004 to 2023, the average graphite electrode spread over petroleum needle coke was approximately $3,900 per MT, on an inflation-adjusted basis using constant 2023 dollars. In tight demand markets, this spread has increased, resulting in higher graphite electrode prices. Historically, between 2004 and 2023, our weighted-average realized price of graphite electrodes, has historically been influenced byexcluding volume sold under LTAs, was approximately $6,000 per MT, on an inflation-adjusted basis using constant 2023 dollars.
Our LTAs were entered into between the priceend of petroleum needle coke. See “Risk Factors—Risks related to our business2017 and industry—Pricingearly 2019, which coincided with a period of elevated market prices for graphite electrodes has historically been cyclical, and the price ofelectrodes. As graphite electrodes may declineare an essential consumable in the future.” The fixed prices under our contracts prevent us from passing along changes related to our costsEAF steel production process, the LTAs provided certainty of raw materials to our customers. See “Risk Factors—Risks related to our business and industry—We are dependent on the supply of petroleum needle coke. Our results of operations could deteriorate if recent disruptionsreliable, high-quality graphite electrodes in the supply of petroleum needle coke continue or worsen for an extended period.” However, as described above, we believe our ability to source substantially all of our petroleum needle coke requirements for these contracts from our Seadrift facility and our hedging of our purchases of decant oil mitigates the impact of periodic shortages and price fluctuations of raw materials.
All of ourat-times volatile market. These LTAs have fixed prices. Within thisthe contract, framework, our customers are contractually bound to purchase the specified volume of product at the price under the contract. These fixed prices underSales from our LTAs represented 41%, 68% and 77% of our net sales in 2023, 2022 and 2021, respectively.
As our LTAs are nearing the end of their terms, our mix of business has shifted towards short-term purchase agreements and spot purchase orders (“non-LTAs”). We will continue to offer multi-year agreements, also known as electrode supply agreements, as an important part of our commercialization strategy and value proposition. Our substantial vertical integration into petroleum needle coke supports our ability to offer contracts also prevent us from passing along any changes related to the costs of raw materials to contract customers. As a result of the LTA obligation of the contracts, the customer must purchase the annual contracted volume (or annual volume within the specified range). In the event the customer does not take delivery of the annual volume specified in the contract, our contracts provide for a capacity payment equal to the product of the number of MTs short of the annual volume specified in the contract multiplied by the price under the contract for that contract year.
In addition to defining annual volumes and prices, these LTAs include significant termination payments (typically, 50% to 70% of remaining contracted revenue) and, in certain cases, parent guarantees and collateral arrangements to manage our customer credit risk. In most cases, the customer can terminate the contract unilaterally only: (i) upon certain bankruptcy events; (ii) if we materially breach certain anti-corruption legislation; (iii) if we are affected by a force majeure event that precludes the delivery of the agreed-to graphite electrodes for more than a six-month period; or (iv) if we fail to ship certain minimum levels during a specified period of time. The customer will also be able to temporarily suspend obligations under the contract due to a force majeure event, as will we, with the contract term being extended by a period equal to the duration of such suspension.
Our contracts providevarying durations, providing our customers with certain remedies inflexibility and surety of supply. However, we do not anticipate that multi-year agreements will make up the event that we are unable to deliver the contracted volumesmajority of graphite electrodes on a quarterly basis. Our substantially vertically integrated Seadrift plant is particularly important to our ability to provide our customers with a reliable supply of graphite electrodes. Therefore, the likelihood that we will fail to deliver the contracted volume is significantly reduced due to our substantial vertical integration. For a discussion of certain risks related to our LTA contracting initiative, see “Risk Factors—Risks related to our business and industry—We may be unable to implement our business strategies, including our initiative to secure and maintain LTAs, in an effective manner.”portfolio moving forward.
During the challenging market conditions in 2020, we were able to work with our customers to develop mutually beneficial solutions to their challenges, including volume commitments. We have negotiated LTA modifications with many of these customers. We also worked to preserve our rights under the LTAs in a few arbitrations that arose from some non-performance and other disputes during the year.
In addition to the LTAs, we continue to sell available volumes under annual, semi-annual, quarterly and spot purchase orders.
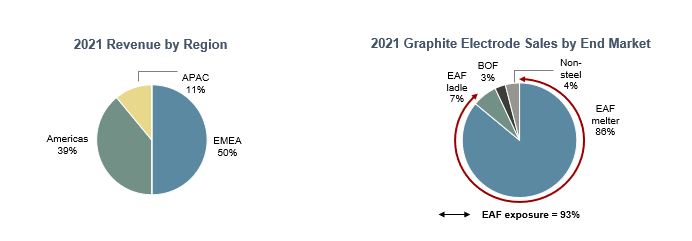
20212023 Revenue and production by region and end marketProduction By Region
Approximately 93%89% of our graphite electrodes were purchased by EAF steel producers in 2021.2023. The remaining portion is primarily used in various other ferrous and non-ferrous melting applications, fused materials, chemical processing, and alloy
metals. We sell our products in every major geographic region globally. Sales of our products to buyers outside the United States accounted for approximately 67%, 73% and 79% of net sales in both2023, 2022 and 2021, and 2020 and 77% in 2019.respectively. Overall, in 2021,2023, we generated 89% of our net sales from EMEA and the Americas.
The charts below show our revenue by region for 2023 and 2022: We believe our LTA contracting strategy provides us with cash flow visibility and has secured a high-quality customer base. We perform financial and credit reviews of all eligible potential customers prior to entering into these contracts. Less creditworthy customers are required to post a bank guarantee, letter of credit or significant cash prepayment. Sales from our LTAs represented 77% and 87% of our net sales in 2021 and 2020, respectively.

Sales and customer serviceCustomer Service
We differentiate and sell the value of our graphite electrodes primarily based on price, product quality and performance, delivery reliability and customer technical service.
We have a large customer technical service organization, with supporting application engineering and scientific groups and approximately 30 engineers and specialists around the world serving in this area. We believe that we are one of the industry leaders in providing value-added technical services to our customers.
Our direct sales force currently operates from 1113 sales offices located around the world. We sell our graphite electrodes primarily through our direct sales force, independent sales representatives, and distributors, all of whom are trained and experienced with our products.
We have customer technical service personnel based around the world to assist customers to maximize their production and minimize their costs. A portion of our engineers and technicians provide technical service and advice to key steel and other metals customers. These services relate to furnace applications and operation, as well as furnace upgrades to reduce energy consumption, improve raw material costs and increase output.
We believe we have a competitive advantage in offering customers ArchiTech® Furnace Productivity System 6.0 (“ArchiTech”), which we believe is an advanced support and technical service platform in the graphite electrode industry. ArchiTech, which has been installed in customer furnaces worldwide, enables our engineers to work with our customers seamlessly to maximize the performance of their furnaces and provide real-time diagnostics and troubleshooting. The arc furnace monitoring system team is continuously listening to our customers’ needs and develops new functionalities for the ArchiTech environment.
Distribution
We deploy various demand management and inventory management techniques to seek to ensure that we can meet our customers’ delivery requirements while still maximizing the capacity utilization of our production capacity. We can experience significant variation in our customers’ delivery requirements as their specific needs vary and change throughout the year. We generally seek to maintain appropriate inventory levels, taking into account these factors as well as the significant differences in manufacturing cycle times for graphite electrode products and our customers’ products.
Finished products are usually stored at our manufacturing facilities. Limited quantities of some finished products are also stored at local warehouses around the world to meet customer needs.
Facilities
We currently manufacture our graphite electrodes in three primary manufacturing facilities strategically located in the Americas and EMEA, two of the largest EAF steelmaking markets. Our locations allow us to serve our customers in the Americas and EMEA efficiently. Our production capacity is approximately 200,000 MT through our primary manufacturing
facilities in Calais, France, Pamplona, Spain, and Monterrey, Mexico3. In 2021, we shifted graphitization and machining of a portion of semi-finished products from Monterrey to St. Marys, Pennsylvania, in order to improve environmental performance, production flexibility and overall cost efficiencies across the two facilities. We believe that our business has the lowest manufacturing cost structure of all of our major competitors, primarily due to the large scale of our manufacturing facilities.
Our manufacturing facilities significantly benefit from their size and scale, work force flexibility, access to reliable sources of power and other key raw materials, and our substantial vertical integration with Seadrift. Our Calais, Pamplona, Monterrey and St. Marys facilities have access to reliable sources of electricity with essential logistical infrastructure in place, which is a significant element of our manufacturing costs. Our Seadrift facility currently produces the majority of our petroleum needle coke requirements for our graphite electrode production, allowing us to source our primary raw material internally and at cost, a significant advantage relative to our peers. Seadrift also produces sufficient needle coke to supply substantially all of the graphite electrode production that we have contracted under our LTAs.
Manufacturing
We manufacture graphite electrodes ranging in size up to 30 inches in diameter, over 11 feet in length, and weighing as much as 5,900 pounds (2.6 MT). The manufacturing process includes six main processes: screening of raw materials (needle coke) and blending with coal tar pitch followed by forming, or extrusion, of the electrode; baking the electrode; impregnating the electrode with a special pitch that improves strength; re-baking the electrode; graphitizing the electrode using electric resistance furnaces; and machining. The first baking process converts the pitch into hard coke. During the baking process, the electrode pitch volatiles are removed, leaving porosities inside. To improve graphite electrode quality, the electrode is then impregnated with additional coal tar pitch to fill the porosities and baked a second time. After impregnation and re-baking, the manufacturing process continues with graphitization as the electrodes are heated at 5,000° F in a special longitudinal furnace to convert the carbon into graphite. The graphitization cycle removes additional impurities and improves the electrodes’ key qualities: thermal and electrical conductivity, thermal shock resistance performance, lubricity, and abrasion resistance.
High-quality graphite electrodes have low electrical resistivity and strong durability. Resistivity is enhanced by removing impurities during the production process, while durability is determined by the coefficient of thermal expansion (“CTE”) of the raw material used to produce the graphite electrode. Lower CTE needle coke produces higher quality electrodes. UHP electrodes used in harsh EAF melter applications have low resistivity and low CTE to maximize efficient use of electricity in the EAF and minimize electrode consumption. The total manufacturing time of a graphite electrode and its associated connecting pin is on average approximately six months from needle coke production to customer delivery. We believe that the period of time required to produce a graphite electrode meaningfully constrains the ability of graphite electrode producers to react to real-time changes in steel market environments and acts as a barrier to entry.
Production of a graphite electrode begins with the production of either petroleum needle coke, our primary raw material, or pitch needle coke. Petroleum needle coke is produced through a manufacturing process very similar to a refinery. The production process converts decant oil, a byproduct of the gasoline refining process, into petroleum needle coke and generally takes two to three months to produce. Needle coke takes its name from the needle-like shape of the coke particles. We produce calcined petroleum needle coke at Seadrift. Seadrift is not dependent on any single refinery for decant oil. While Seadrift has purchased a substantial majority of its raw material inventory from a limited number of suppliers in recent years, we believe that there is a large supply of suitable decant oil in the United States available from a variety of sources. In addition, we use derivatives to hedge the decant oil required to produce substantially all of the graphite electrodes sold under our LTAs, providing us with substantial visibility into our raw material costs.
We purchase the electric power used in our manufacturing processes from local suppliers under contracts with pricing based on rate schedules or price indices. Our electricity costs can vary significantly depending on these rates and usage. Natural gas used in the baking and re-baking processes is purchased from local suppliers primarily under annual volume contracts with pricing based on various natural gas price indices.
Research and developmentDevelopment
We have over 135 years of experience in the research and development (“R&D&D”) of graphite- and carbon-based solutions. By focusing our management’s attention and R&D spending exclusively on the graphite electrode business, we have been able to improve the quality of our graphite electrodes, repositioning ourselvesmaintain our position as an industry leader and improvingimprove our relationships with strategic customers. Our focus on improving the quality of petroleum needle coke through R&D has led to our petroleum needle coke production at Seadrift being best-in-class for use in the manufacturing of highly durable UHP electrodes. Simultaneously, the R&D team helps to evaluate technology in adjacent markets where GrafTech may have technological advantages. We believe that the above strengths and capabilities provide us with a competitive advantage.
3 Production capacity reflects expected maximum production volume during the period depending on product mix and expected maintenance outage. Actual production may vary.
Intellectual propertyProperty
We believe that our intellectual property, consisting primarily of patents and proprietary know-how, provides us with competitive advantages and is important to our growth opportunities. Our intellectual property portfolio is extensive, with over 135approximately 100 U.S. and foreign patents and publishedpending patent applications.
We own, have the right to use or have obtained licenses for various trade names and trademarks used in our businesses. For example, the UCAR trademark is owned by Union Carbide Corporation ("(“Union Carbide"Carbide”) (which was acquired by Dow Chemical Company) and is licensed to us on a worldwide, exclusive and royalty-free basis until 2025.January 2035. This particular license automatically renews for successive 10 year10-year periods. It permits non-renewal by Union Carbide at the end of any renewal period upon five years’years notice of non-renewal.
We rely on patent, trademark, copyright and trade secret laws, as well as appropriate agreements to protect our intellectual property. Among other things, we seek to protect our proprietary know-how and information by requiring employees, consultants, strategic partners and others who have access to such proprietary information and know-how to enter into confidentiality or restricted use agreements.
Insurance
We maintain insurance against civil liabilities relating to personal injuries to third parties, for loss of or damage to property, for business interruptions and for certain environmental matters, that provides coverage, subject to the applicable coverage limits, deductibles and retentions, and exclusions, that we believe areis appropriate upon terms and conditions and for premiums that we consider fair and reasonable in the circumstances. There can be no assurance that we will not incur losses beyond the limits of or outside the coverage of our insurance.
Regulatory Matters
As a company with global operations, we are subject to the laws and regulations of the United States and the multiple foreign jurisdictions in which we operate or conduct business as well as the rules, reporting obligations and interpretations of all such requirements and obligations by various governing bodies, which may differ among jurisdictions. These include federal, state, local and foreign environmental laws and regulations, increasingly complex and changing laws and regulations enacted to protect business and personal data in the United States and other jurisdictions, including the European Union'sEU’s General Data Protection Regulation (“GDPR”), anti-corruption laws, import/export controls, anti-competition laws, U.S. securities laws and a variety of regulations including work-related and community safety laws. We believe we operate in compliance in all material respects with applicable laws and regulations, and maintaining compliance with them is not expected to materially affect our capital expenditures, earnings and competitive position. Estimates of future costs for compliance with U.S. and foreign environmental protection laws and regulations, and for environmental liabilities, are necessarily imprecise due to numerous uncertainties, including the impact of potential new laws and regulations, the availability and application of new and diverse technologies, the extent of insurance coverage, the potential discovery of contaminated properties, or the identification of new hazardous substance disposal sites at which we may be a potentially responsible party ("PRP"(“PRP”) and, in the case of sites subject to the Comprehensive Environmental Response, Compensation and Liability Act and similar state and foreign laws, the final determination of remedial requirements and the ultimate allocation of costs among the PRPs. Subject to the inherent imprecision in estimating such future costs, but taking into consideration our experience to date regarding environmental matters of a similar nature and facts currently known, we estimate that our costs and capital expenditures (in each case, before adjustment for inflation) for environmental protection regulatory compliance programs and for remedial response actions will not be material over the next several years. Furthermore, we establish accruals for environmental liabilities when it is probable that a liability has been or will be incurred, and the amount of the liability can be reasonably estimated. We adjust the accrual as
new remedial actions or other commitments are made, as well as when new information becomes available that changes the prior estimates previously made and we believe our existing accruals are reasonable.
Human Capital Resources
Employment
As of December 31, 2021,2023, we had 1,3531,249 employees (excluding contractors), 867758 of which were hourly employees. A total of 481435 employees were in Europe (including Russia), 573Mexico, 414 were in MexicoEurope and Brazil, two were in South Africa, 290the Middle East, 358 were in the United States, 37 were in Brazil and sevenfive were in the Asia Pacific region.
As of December 31, 2021,2023, approximately 557440 employees, or 41%,35% of our worldwide employees, were covered by collective bargaining or similar agreements that expire, or are subject to renegotiation, at various times through December 31, 2022.2024. We believe that, in general, our relationships with our employees'employees’ unions are good and that we will be able to renew or
extend our collective bargaining or similar agreements on reasonable terms as they expire. We have not had any material work stoppages or strikes initiated by our employees during the past decade.year.
The health and safety of our global team is a top priority and is a core value of the Company. Our comprehensive programs strive to achieve zero injuries and no harm done. Our total recordable incident rate in 2023 was 0.61 per 200,000 work hours, compared to 0.94 per 200,000 work hours in 2022. Our global Health, Safety and Environmental Protection ("(“HS&EP"&EP”) Policypolicy applies to all employees contractors, and visitors, and governs our actions and decisions every day. We also have a Code of Conduct and Ethics for Suppliers and Contractors that includes HS&EP guidelines required for doing business with GrafTech. GrafTech’s focus on HS&EP is a top priority for all employees. We have built risk recognition into our HS&EP programs. From pre-job planning, safety walks and inspections, planned job observations, or training employees on health and safety best practices, we strive to identify and mitigate risks. In the spirit of continuous improvement, regular inspections, internal reviews and corporate audits are conducted to foster compliance with our high standards.
Diversity and Inclusion
Diversity and inclusion are foundational to our culture, and all employees are expected to uphold these values in their day-to-day work. Our recruitment policies and hiring practices support our diversity and inclusion objectives. At both the corporate and site levels, we assign responsibilities for upholding policies, procedures, and practices for diverse and inclusive hiring and talent management. GrafTech affirms its position as an Equal Opportunity Employer and is committed to recruiting, employing, and promoting qualified veterans and disabled individuals, and we aim to ensure our people have equal opportunities related to job promotions, compensation and benefits, and personal development.
Our global footprint lends itself to organic diversity, and our employee base has varied educational backgrounds and life experiences. However, we strive to go beyond this organic diversity and we are currently developing a strategy to better measure our ability to do so. As of December 31, 2023, 40% of our senior leadership team and 14% of our Board members were female. We are committed to intentional talent acquisition, retention, and development practices to support our diversity initiatives and to build a competitive workforce.
Compensation and Total Rewards
We aim to attract and retain top talent from a diverse pool of skilled workers by providing competitive compensation and benefit programs to help meet the needs of our employees. Our programs are designed to support the profitable growth of our business; attract, reward, and retain the talent we need to succeed; support the health and overall well-being of our employees; and reinforce a performance-based culture.
In addition to base compensation, we offer individual and group-based performance bonuses. Benefits packages include, depending on the country, medical, dental, prescription, vision, group life insurance, short- and long-term disability, paid vacation and holidays, and tuition reimbursement. The tuition reimbursement program, in particular, helps employees who want to continue their education or seek specialized job training, and illustrates our commitment to continued learning and focus on professional development.
Employee Engagement
Employee engagement is a priority at GrafTech because we believe that engaged employees help us provide high-quality products and services to our customers. We conducted our last employee engagement survey in October 2022. We expect the next survey will be distributed in 2024 and we intend to conduct our employee engagement surveys every other year moving forward. Approximately 56% of full-time GrafTech employees participated in the October 2022 survey. The survey requested feedback from our employees on a variety of important topics, including safety, pay, communication and training.
Employee Training and Development
As committed stakeholders in the professional development of our employees, we look for opportunities to help employees grow, innovate, and impact our business and industry. Each role within our organization has a detailed job profile, including job-specific competencies. These profiles help us measure performance, and they work in conjunction with our performance management system, which enables employees to create individualized career and growth paths. The performance management system connects employees with job-specific professional development training and continuing education opportunities to help them progress along their career and growth path.
We conduct mid-year and annual performance reviews for all salaried employees to assess both job competencies and performance relative to GrafTech’s core competencies. During annual performance reviews, we discuss progress towards personal career goals, refine career aspirations, and connect employees with specific pathways to achievement. Employees are encouraged to work with their manager or human resources to further refine their career and growth paths at each annual review.
Available Information
We make available, free of charge, on or through our website, our annual reports on Form 10-K, our quarterly reports on Form 10-Q, our current reports on Form 8-K and amendments to those reports filed or furnished pursuant to Section 13(a) or 15(d) of the Securities and Exchange Act of 1934 (the "Exchange Act"“Exchange Act”) as soon as reasonably practicable after we electronically file them with, or furnish them to, the U.S. Securities and Exchange Commission (“SEC”). We maintain our website at http://www.graftech.com. The information containedwww.graftech.com. Information on, or accessible through, our website is not part of this Annual Report. The SEC maintains aWe have included our website that contains reports, proxyaddress only as an interactive textual reference and information statements, and other information regarding issuers that file electronically. Please see http://www.sec.gov for more information.do not intend it to be an active link to our website.
Item 1A.Risk Factors
Our business, financial condition, results of operations, and cash flow can be affected by a number of factors, whether currently known or unknown, including but not limited to those described below. You should carefully read all of the information included in this reportReport and carefully consider, among other matters, the following risk factors, as well as any discussed under Part II, Item 7, “Management’s Discussion and Analysis of Financial Condition and Results of Operations.” Although the risks are organized by headings, and each risk is discussed separately, many are interrelated. Moreover, the risks below are not the only risks we face and additional risks not currently known to us or that we presently deem immaterial may emerge or become material at any time. The occurrence of any of the following risks could materially and adversely affect our business, financial condition, results of operations, and cash flow, in which case, the market price of our securities could decline. You should not interpret the disclosure of any risk factor to imply that the risk has not already materialized.
Risks related to our business and industry
The COVID-19 pandemic has had, and is expected to continue to have, an adverse impact on our business, results of operations, financial position and cash flows.
The COVID-19 pandemic and preventative measures taken to contain or mitigate the pandemic have caused, and are continuing to cause, business slowdowns or shutdowns in affected areas and significant disruption in the financial markets and economy both globally and in the United States. For example, as a result of the COVID-19 pandemic, the average approximate non-LTA price for graphite electrodes delivered and recognized in revenue in the first quarter of 2021 decreased 35% compared to the first quarter in 2020. In addition, we expect some cost increases in 2022, driven by recent global cost pressures, particularly for third-party needle coke, energy and freight. As the pandemic continues, we continue to limit travel and have certain employees working from home on rotations so that all employees are not in our offices at the same time. While these measures have been necessary and appropriate, they have resulted in additional costs and have adversely impacted our business and financial performance.
While the COVID-19 pandemic had begun to subside in certain areas of the world where we operate and serve our customers, the infection rates in some of these areas have experienced a resurgence in the spread of COVID-19 and the infection rates in other areas continue to escalate, including as a result of new variants of the virus. As a result, we are unable to predict the ultimate impact of the COVID-19 pandemic at this time. The pandemic has adversely affected, and is expected to continue to adversely affect, our business, results of operations, financial position and cash flows. Such effects may be material and the potential impacts include, but are not limited to:
•adverse impacts on our customers, and resultant impacts on demand for our products;
•disruptions at our facilities, including reductions in operating hours, labor shortages and changes in operating procedures, including additional cleaning and disinfecting procedures;
•disruptions in our supply chain due to transportation delays, travel restrictions, raw material cost increases and shortages, and closures of businesses or facilities;
•reductions in our operating effectiveness due to workforce disruptions from COVID-19 restrictions and social distancing resulting from, among other things, “shelter in place” and “stay at home” orders, and the unavailability of key personnel necessary to conduct our business activities; and
•volatility in the global financial markets, which could have a negative impact on our ability to access capital and additional sources of financing in the future.
In addition, we cannot predict the impact that the COVID-19 pandemic will have on our customers, employees, suppliers and distributors, and any adverse impacts on these parties may have a material adverse impact on our business. The impact of the COVID-19 pandemic may also exacerbate other risks discussed in this Annual Report, any of which could have a material effect on us. This situation continues to change rapidly and additional impacts may arise that we are not currently aware of.
We may be unable to implement our business strategies, including our initiative to secure and maintain LTAs, in an effective manner.
Our future financial performance and success largely depend on our ability to successfully implement our business strategies for growth. We have undertaken, and will continue to undertake, various business strategies to sell a majority of our production capacity through LTAs, and improve operating efficiencies and generate cost savings. We cannot assure you that we will successfully implement our business strategies or that implementing these strategies will sustain or improve and not harm our results of operations. In particular, our ability to successfully implement our strategy to enter into and maintain LTAs is subject to certain risks, including customers seeking to renegotiate key terms of their contracts, such as pricing and specified volume commitments, in the event market conditions change during the contract term; our inability to extend contracts when they expire; and a disruption in our access to Seadrift‑produced petroleum needle coke, which we will rely on, in part, to deliver the contracted volumes under our LTAs. Under current market conditions where the spot price of graphite electrodes is below our weighted average contract price for LTA contracted volumes, it may be unlikely that customers will commit to extend or re-enter into LTAs at the current prices of our LTAs. As a result, we cannot assure you that we will successfully implement this strategy or realize the anticipated benefits of these contracts. Recently, because of current market conditions, including the effects of the COVID-19 pandemic, certain customers with LTAs have struggled to take their committed volumes, which has resulted in some non-performance and disputes, including a few arbitrations, and we have modified some LTAs. In addition, the costs involved in implementing our strategies may be significantly greater than we currently anticipate.
Our business strategies are based on our assumptions about future demand for our products and on our continuing ability to produce our products profitably. Each of these factors depends, among other things, on our ability to finance our operations, maintain high‑quality and efficient manufacturing operations, effectively manage our customer relationships while enforcing customer commitments, respond to competitive and regulatory changes, access quality raw materials in a cost‑effective and timely manner and retain and attract highly skilled technical, managerial, marketing and finance personnel. Any failure to develop, revise or implement our business strategies in a timely and effective manner may adversely affect our business, financial condition, results of operations or cash flows.
Global graphite electrode overcapacity has adversely affected graphite electrode prices in the past, and may adversely affect them again, which could negatively impact our sales, margins and profitability.
Overcapacity in the graphite electrode industry has adversely affected pricing in the past and may do so again. The rapid growth of Chinese steel production after 2010, which was primarily produced from BOF steelmaking, created a significant global oversupply of steel. Chinese steel exports gained market share from EAF steel producers, creating graphite electrode industry oversupply and inventory de‑stocking in this period. Although Chinese steel exports have decreased since 2016, any significant future growth in Chinese steel exports could once again lead to an oversupply of steel, which would adversely affect the price of graphite electrodes.
An increase in global graphite electrode production capacity that outpaces an increase in demand for graphite electrodes could adversely affect the price of graphite electrodes. We believe worldwide graphite electrode supply will increase in 2022 as a result of Chinese capacity additions. While growth in the Chinese EAF steel market may support some of these capacity additions, the additional graphite electrode capacity may exceed local Chinese requirements. Excess production capacity may result in manufacturers producing and exporting electrodes at prices that are lower than prevailing domestic prices, and sometimes at or below their cost of production. Excessive imports into the Americas and EMEA, which markets collectively make up 89% of our net sales, can also exert downward pressure on graphite electrode prices, which negatively affects our sales, margins and profitability.
Pricing for graphite electrodes has historically been cyclical and the price of graphite electrodes may decline in the future.
Pricing for graphite electrodes has historically been cyclical, reflecting the demand trends of the global EAF steelmaking industry and the supply of graphite electrodes. In addition, as petroleum needle coke reflects a significant percentage of the raw material cost of graphite electrodes, graphite electrodes have historically been priced at a spread to petroleum needle coke, which in the past has increased in tight demand markets. Historically, between 2007 and 2021, our weighted average realized price of graphite electrodes was approximately $5,700 per MT (on an inflation‑adjusted basis using constant 2021 dollars).
During the last demand trough in 2016, our weighted average realized price of graphite electrodes fell to approximately $2,800 per MT, on an inflation‑adjusted basis using constant 2021 dollars. Following the significant rationalization of graphite electrode production globally, the resumption of growth in EAF steel production, falling scrap prices, reductions in Chinese steel exports and constrained supply of needle coke, graphite electrode prices reached record highs in 2018.
Current prices have receded from the highs of 2018, and the price of graphite electrodes may decline in the future. Supply and demand normalized in 2019, tipping towards overcapacity that exerts downward pressure on graphite electrode prices, and spot prices fell 25% during 2019. Spot prices decreased further in 2020, bottoming out in the spring of 2021 before beginning to increase. Despite this increase, current spot prices are below our weighted average contract price for LTA contracted volumes. Our business, financial condition and operating results could be materially and adversely affected to the extent prices for graphite electrodes decline in the future.
We are dependent on the global steel industry generally and the EAF steel industry in particular, which historically have been highly cyclical, and a downturn in these industries may materially adversely affect our business.
We sell our products primarily to the EAF steel production industry. The EAF steel production industry historically has been highly cyclical and is affected significantly by general economic conditions. As a result, we have experienced periods of significant net losses.
Significant customers for the steel industry include companies in the automotive, construction, appliance, machinery, equipment and transportation industries, which are industries that were negatively affected by the general economic downturn and the deterioration in financial markets, including severely restricted liquidity and credit availability, in the recent past. In particular, EAF steel production declined approximately 17% from 2008 to 2009 as a result of that general economic downturn and deterioration in financial markets. In addition, EAF steel production declined approximately 10% from 2011 to 2015 due to global steel production overcapacity driven largely by Chinese BOF steel exports.
Our customers, including major steel producers, have in the past experienced and may again experience downturns or financial distress that could adversely impact our ability to collect our accounts receivable on a timely basis or at all.
Pricing for graphite electrodes has historically been cyclical and the price of graphite electrodes may continue to decline in the future.
Pricing for graphite electrodes has historically been cyclical, reflecting the demand trends of the global EAF steelmaking industry and the supply of graphite electrodes. In addition, as petroleum needle coke reflects a significant percentage of the raw material cost of graphite electrodes, graphite electrodes have historically been priced at a spread to petroleum needle coke, which in the past has increased in tight demand markets. Between 2004 and 2023, our weighted-average realized price of graphite electrodes for non-LTAs was approximately $6,000 per MT (on an inflation‑adjusted basis using constant 2023 dollars).
During the last demand trough in 2016, our weighted-average realized price of graphite electrodes for non-LTAs fell to approximately $3,000 per MT, on an inflation‑adjusted basis using constant 2023 dollars. Following the significant rationalization of graphite electrode production globally, the resumption of growth in EAF steel production, falling scrap prices, reductions in Chinese steel exports and constrained supply of needle coke, graphite electrode prices reached record highs in 2018.
Prices as of December 31, 2023 have receded from the highs of 2018, and the price of graphite electrodes may continue to decline in the future. Supply and demand normalized in 2019, tipping towards overcapacity that exerts downward pressure on graphite electrode prices, and spot prices fell 25% during 2019. Spot prices decreased further in 2020, bottoming out in the spring of 2021 before beginning to increase. However, beginning in 2023, spot prices began decreasing given the softer commercial environment. Spot prices as of December 31, 2023 were below our weighted-average contract price for LTA contracted volume. Our business, financial condition and operating results could be materially and adversely affected to the extent prices for graphite electrodes continue to decline in the future.
Global graphite electrode overcapacity has adversely affected graphite electrode prices in the past, and may adversely affect them again, which could negatively impact our sales, margins and profitability.
Overcapacity in the graphite electrode industry has adversely affected pricing in the past and may do so again. An increase in global graphite electrode production capacity that outpaces an increase in demand for graphite electrodes could adversely affect the price of graphite electrodes. While growth in the EAF steel market may support some of these capacity additions, the additional graphite electrode capacity may exceed demand. Excess production capacity may result in manufacturers producing and exporting electrodes at prices that are lower than prevailing domestic prices, and sometimes at or below their cost of production. Excessive imports into the Americas and EMEA, which markets collectively made up 89% of our net sales for the year ended December 31, 2023, can also exert downward pressure on graphite electrode prices, which negatively affects our sales, margins and profitability.
The graphite industry is highly competitive. Our market share, net sales or net income could decline due to vigorous price and other competition.
Competition in the graphite industry (other than, generally, with respect to new products) is based primarily on price, quality/performance, local presence, product differentiation and quality,portfolio, delivery reliability and customer service. Graphite electrodes, in particular, are subject to rigorous price competition. Competition with respect to new products is, and is expected to continue to be, based primarily on price, performance and cost effectiveness, customer service and product innovation. Competition could prevent implementation of price increases, require price reductions or require increased spending on R&D, marketing and sales that could adversely affect us. In such a competitive market, changes in market conditions, including customer demand and technological development, as well as increased exports by Chinese EAF steel suppliers could adversely affect our competitiveness, sales and/or profitability.
We are dependent on the supply of petroleum needle coke. Our results of operations could deteriorate if recent disruptions in the supply of petroleum needle coke continue or worsenoccur for an extended period.
Petroleum needle coke is our key raw material used in the production of graphite electrodes. At full operating levels, Seadrift currently provides the majoritya substantial portion of our current petroleum needle coke requirements, and we purchasewith third party purchases making up the remainder from external sources. We plan to rely on Seadrift‑produced petroleum needle coke to support the production of substantially all of the contracted volumes of graphite electrodes under our LTAs. As a result, abalance. A disruption in Seadrift’s production of petroleum needle coke like the one that occurred in February 2021 due to a winter storm, could adversely affect our ability to achieve the anticipated benefitsresults of these contractsoperations if we are forced to purchase petroleum needle coke from external sources at a higher cost to supportcost.
We rely primarily on one facility in Monterrey, Mexico for the productionmanufacturing of these contracted volumes. Ifconnecting pins, a market shortagenecessary component of petroleum needle coke occurs, we may beour graphite electrodes. Our results of operations could deteriorate if this facility would become unable to acquire sufficient amountsprovide us with the required volume of petroleum needle coke from external sources to support our remaining needle coke requirements currentlyconnecting pins.
We manufacture graphite connecting pins, which are used in the production ofby customers to connect and fasten graphite electrodes together in a column for saleuse in an EAF. For the spot market. Aspast several years, all of our connecting pin production was performed at our Monterrey, Mexico facility. While we have added capability at our Pamplona, Spain facility, we primarily rely on one production location for this critical component. If our Monterrey, Mexico facility were to become unable to continue to provide us with connecting pins in required volumes, at suitable quality levels, or in a result,cost-effective manner, we would be required to shift production to our Pamplona, Spain facility or identify and obtain additional replacement manufacturing sources. There is no assurance that we would be able to obtain acceptable alternative sources on a disruptioncost-effective or timely basis, or at all. An extended interruption in the supply of petroleum needle cokeconnecting pins would result in the loss of sales, which could have a material adverse effect on our business, financial condition results of operations and cash flows.or operating results.
We are dependent on supplies of raw materials (in addition to petroleum needle coke) and energy.. Our results of operations could deteriorate if those supplies increase in cost or are substantially disrupted for an extended period.
We purchase raw materials and energy from a variety of sources. In many cases, we purchase them under short‑term contracts or on the spot market, in each case at fluctuating prices. The availability and price of raw materials and energy may be subject to curtailment or change due to:
•limitations, which may be imposed under new legislation or regulation;
•suppliers’ allocations to meet demand from other purchasers during periods of shortage (or, in the case of energy suppliers, extended hot or cold weather);shortage;
•interruptions or terminations in production by suppliers; and
•market and other events and conditions.
Petroleum and coal products, including decant oil and coal tar pitch, which are our principal raw materials other than petroleum needle coke, and energy, particularly natural gas, have been subject to significant price fluctuations. For example, Seadrift may not always be able to obtain an adequate quantity of suitable low‑sulfur decant oil for the manufacture of petroleum needle coke, and capital may not be available to install equipment to allow use of higher sulfur decant oil (which is more readily available in the United States) if supplies of low‑sulfur decant oil become more limited in the future. Further, low-sulfur emissions regulations adopted in 2020 by the International Maritime Organization have at times negatively affected pricing for low-sulfur decant oil and they may again in the future cause similar adverse impacts.
We have in the past entered into, and may continue in the future to enter into, derivative contracts and short‑duration fixed-rate purchase contracts to effectively fix a portion of our exposure to certain products. These hedging strategies may not be available or successful in eliminating our exposure. A substantial increase in raw material or energy prices that cannot be mitigated or passed on to customers or a continued interruption in supply, particularly in the supply of decant oil, or energy, would have a material adverse effect on our business, financial condition, results of operations or cash flows. These hedges may be insufficient or ineffective in protecting against the impact of these fluctuations.
Our business and our customers are subject to market changes in the availability and cost of electricity and natural gas that could adversely affect our business.
We are in an energy intensive industry that requires both natural gas and electricity in our manufacturing process. We primarily rely on third parties for the supply of our energy resources consumed in the manufacture of our products. The prices for and availability of third-party electricity and natural gas are subject to volatile market conditions, particularly in Europe. These market conditions often are affected by factors beyond our control and we may be unable to raise the price of our products to mitigate the effects of increased energy costs in our manufacturing processes. In addition, our customers are subject to these same market conditions.
Failure to retain our existing senior management team or the inability to attract and retain qualified personnel could hurt our business and inhibit our ability to operate and grow successfully.
Our success will continue to depend to a significant extent on the continued service of our executive management team and the ability to recruit, hire and retain other key management and plant operating personnel, including factory and production workers and other staff to support our growth and operational initiatives and replace those who retire or resign. Failure to retain our leadership team and workforce and to attract and retain other important management and technical personnel could place a constraint on our global growth and operational initiatives, possibly resulting in inefficient and ineffective management and operations, which would likely harm our revenues, operations and product development efforts and eventually result in a decrease in profitability.
Our operations are subject to hazards which could result in significant liability to us.
Our operations are subject to hazards associated with manufacturing and the related use, storage, transportation and disposal of raw materials, products and wastes. These hazards include explosions, fires, severe weather (including but not limited to hurricanes or other adverse weather that may be increasing as a result of climate change) and natural disasters, industrial accidents, mechanical failures, discharges or releases of toxic or hazardous substances or gases, transportation interruptions, human error and terrorist activities. These hazards can cause personal injury and loss of life, severe damage to or destruction of property and equipment as well as environmental damage, and may result in suspension of operations and the imposition of civil and criminal liabilities, including penalties and damage awards. While we believe our insurance policies are in accordance with customary industry practices, such insurance may not cover all risks associated with the hazards of our business and is subject to limitations, including deductibles and maximum liabilities covered. We may incur losses beyond the limits, or outside the coverage, of our insurance policies. In the future, we may not be able to obtain coverage at current levels, and our premiums may increase significantly on coverage that we maintain. Costs associated with unanticipated events in excess of our insurance coverage could have a material adverse effect on our business, competitive or financial position or our ongoing results of operations.
We are subject to a variety of legal, economic, social and political risks associated with our substantial operations in multiple countries, which could have a material adverse effect on our financial and business operations.
A substantial majority of our net sales are derived from sales outside the United States, and a majority of our operations and our property, plant and equipment and other long‑lived assets are located outside the United States. As a result, we are subject to risks associated with operating in multiple countries, including:
•currency fluctuations and devaluations in currency exchange rates, including impacts of transactions in various currencies, translation of various currencies into dollars for U.S. reporting and financial covenant compliance purposes, and impacts on results of operations due to the fact that the costs of our non‑U.S. operations are primarily incurred in local currencies while their products are primarily sold in dollars and euros;
•imposition of or increase in customs duties and other tariffs;tariffs or the loss of the protection thereof;
•imposition of or increases in currency exchange controls, including imposition of or increases in limitations on conversion of various currencies into dollars, euros, or other currencies, making of intercompany loans by subsidiaries or remittance of dividends, interest or principal payments or other payments by subsidiaries;
•imposition of or increases in revenue, income or earnings taxes and withholdingwithholdings and other taxes on remittances and other payments by subsidiaries;
•inflation, deflation and stagflation in any country in which we have a manufacturing facility;
•imposition of or increases in investment or trade restrictions by the United States or other jurisdictions or trade sanctions adopted by the United States;
•compliance with laws on anti-corruption, export controls, customs, sanctions, environmental and other laws governing our operations, including in challenging jurisdictions;
•inability to determine or satisfy legal requirements, effectively enforce contract or legal rights, including our rights under our LTAs and intellectual property rights, and obtain complete financial or other information under local legal, judicial, regulatory, disclosure and other systems; and
•nationalization or expropriation of assets, and other risks that could result from a change in government or government policy, or from other political, social or economic instability.
Any of these risks could have a material adverse effect on our business, financial condition, results of operations or cash flows, and we may not be able to mitigate these effects.
Our results of operations could deteriorate if our manufacturing operations were substantially disrupted for an extended period for any reason, including equipment failure, legal proceedings, climate change, natural disasters, public health crises, political crises or other catastrophic events.
Our manufacturing operations are subject to disruption due to equipment failure, extreme weather conditions, floods, hurricanes and tropical storms and similar events, major industrial accidents, including fires or explosions, cybersecurity attacks, strikes and lockouts, adoption of new laws or regulations, changes in interpretations of existing laws or regulations or
changes in governmental enforcement policies, civil disruption, riots, terrorist attacks, war, public health crises, such as the COVID-19 pandemic, and other events. These events may also impact the operations of one or more of our suppliers. For example, the potential physical impacts of climate change on our operations are uncertain and will likely be particular to the geographic circumstances. These physical impacts may include changes in rainfall and storm patterns, shortages of water or other natural resources, changing sea levels, and changing global average temperatures. For instance, our Seadrift facility in Texas and our Calais facility in France are located in geographic areas less than 50 feet above sea level. As a result, any future rising sea levels could have an adverse impact on their operations and on their suppliers. In the event manufacturing operations are substantially disrupted at one of our primary operating facilities, such as the September 2022 temporary suspension of our operations located in Monterrey, Mexico, we willmay not have the ability to increase production at our remaining operating facilities in order to compensate.compensate without considerable time and expense. To the extent any of these events occur, our business, financial condition and operating results could be materially and adversely affected.
Plant operational improvements may be delayed or may not achieve the expected benefits.
Our ability to complete future operational improvements including the shift of graphitization and machining of additional volume of semi-finished product from Monterrey to St. Marys, may be delayed, interrupted or otherwise limited by the need to obtain environmental and other regulatory approvals, unexpected cost increases, financial constraints, availability of labor and materials, unforeseen hazards such as weather conditions, and other risks customarily associated with construction projects. Moreover, the costs of these activities could have a negative impact on our results of operations. In addition, these operational improvements may not achieve the expected benefits as a result of changes in market conditions, raw material shortages or other unforeseen contingencies.
We depend on third parties for certain construction, maintenance, engineering, transportation, warehousing and logistics services.
We contract with third parties for certain services relating to the design, construction and maintenance of various components of our production facilities and other systems. If these third parties fail to comply with their obligations, the facilities may not operate as intended, which may result in delays in the production of our products and materially adversely affect our ability to meet our production targets and satisfy customer requirements or we may be required to recognize
impairment charges. In addition, production delays could cause us to miss deliveries and breach our contracts, which could damage our relationships with our customers and subject us to claims for damages under our contracts. Any of these events could have a material adverse effect on our business, financial condition, results of operations or cash flows.
We also rely primarily on third parties for the transportation of the products we manufacture. In particular, a significant portion of the goods we manufacture are transported to different countries, which requires sophisticated warehousing, logistics and other resources. If any of the third parties that we use to transport products are unable to deliver the goods we manufacture in a timely manner, we may be unable to sell these products at full value or at all, which could cause us to miss deliveries and breach our contracts, which could damage our relationships with our customers and subject us to claims for damages under our contracts. Any of these events could have a material adverse effect on our business, financial condition, results of operations or cash flows.
We may be subject to information technology systems failures, cybersecurity attacks, network disruptions and breaches of data security, which could compromise our information and expose us to liability.
Our information technology systems are an important element for effectively operating our business. Information technology systems or processes, and the information technology systems or processes of our customers, our third-party service providers, our vendors or other parties that have been entrusted with our information, including risks associated with any failure to maintain or upgrade our systems, network disruptions and breaches of data security could disrupt our operations by impeding our processing of transactions, our ability to protect customer or company information or our financial reporting, leading to increased costs. It is possible that future technological developments could adversely affect the functionality of our computer systems and require further action and substantial funds to prevent or repair computer malfunctions. Our computer systems, including our back‑up systems, could be damaged or interrupted by power outages, computer and telecommunications failures, computer viruses, cybercrimes, internal or external security breaches, events such as fires, earthquakes, floods, tornadoes and hurricanes, or errors by our employees. Although we have taken steps to address these concerns by implementing network security, back‑up systems and internal control measures, these steps may be insufficient or ineffective. Security and/or privacy breaches, acts of vandalism or terror, computer viruses, misplaced or lost data, programming, and/or human error or other similar events with respect to our information technology systems or processes or the information technology systems or processes of third-parties that have been entrusted with our information expose us to a risk of loss or misuse of this information, litigation and potential liability, which could have a material adverse effect on our business, financial condition, results of operations or cash flows.
If we are unable to successfully negotiate with the representatives of our employees, including labor unions, we may experience strikes and work stoppages.
We are party to collective bargaining agreements and similar agreements with our employees. As of December 31, 2021,2023, approximately 557440 employees, or 41%,35% of our worldwide employees, were covered by collective bargaining or similar agreements, all of which were covered by agreements that expire, or are subject to renegotiation, at various times through December 31, 2022.2024. Although we believe that, in general, our relationships with our employees are good, we cannot predict the outcome of current and future negotiations and consultations with employee representatives, which could have a material adverse effect on our business. We may not succeed in renewing or extending these agreements on terms satisfactory to us. Although we have not had any material work stoppages or strikes initiated by our employees during the past decade, they may occur in the future during renewal or extension negotiations or otherwise. A material work stoppage, strike or other union dispute could adversely affect our business, financial condition, results of operations and cash flows.
We have significant goodwill on our balance sheet that is sensitive to changes in the market, which could result in impairment charges.
We had approximately $171 million of goodwill on our balance sheet as of December 31, 2021. Goodwill is tested for impairment annually in the fourth quarter or more often if events or changes in circumstances indicate a potential impairment may exist. Factors that could indicate that our goodwill is impaired include a decline in our stock price and market capitalization, lower than projected operating results and cash flows, and slower growth rates in our industry. Declines in our stock price, lower operating results and any decline in industry conditions in the future could increase the risk of impairment. Impairment testing incorporates our estimates of future operating results and cash flows, estimates of future growth rates, and our judgment regarding the applicable discount rates used on estimated operating results and cash flows. If we determine at a future time that impairment exists, it may result in a significant non-cash charge to earnings and lower stockholders’ equity.
Our ability to grow and compete effectively depends on protecting our intellectual property. Failure to protect our intellectual property could adversely affect our business.
We believe that our intellectual property, consisting primarily of patents and proprietary know‑how and information, is important to our growth. Our intellectual property portfolio is extensive, with over 135approximately 100 U.S. and foreign patents and publishedpending patent applications, which we believe is more than any of our major competitors in the businesses in which we operate. Failure to protect our intellectual property may result in the loss of the exclusive right to use our technologies. We rely on patent, trademark, copyright and trade secret laws and confidentiality and restricted-use agreements to protect our intellectual property. However, some of our intellectual property is not covered by any patent or patent application or any such agreement. Intellectual property protection does not protect against technological obsolescence due to developments by others or changes in customer needs.
Patents are subject to complex factual and legal considerations. Accordingly, the validity, scope and enforceability of any particular patent can be uncertain. Therefore, we cannot assure you that:
•any of the U.S. or non‑U.S. patents now or hereafter owned by us, or that third parties have licensed to us or may in the future license to us, will not be circumvented, challenged or invalidated;
•any of the U.S. or non‑U.S. patents that third parties have non‑exclusively licensed to us, or may non‑exclusively license to us in the future, will not be licensed to others; or
•any of the patents for which we have applied or may in the future apply will be issued at all or with the breadth of claim coverage we seek.
Moreover, patents, even if valid, only provide protection for a specified limited duration. In addition, effective patent, trademark and trade secret protection may be limited or unavailable or we may not apply for it in the United States or in any of the other countries in which we operate.
The protection of our intellectual property rights may be achieved, in part, by prosecuting claims against others who we believe have misappropriated our technology or have infringed upon our intellectual property rights, as well as by defending against misappropriation or infringement claims brought by others against us. Our involvement in litigation to protect or defend our rights in these areas could result in a significant expense to us, adversely affect the development of sales of the related products, and divert the efforts of our technical and management personnel, regardless of the outcome of such litigation.
We cannot assure you that agreements designed to protect our proprietary know‑how and information will not be breached, that we will have adequate remedies for any such breach, or that our strategic alliance suppliers and customers, consultants, employees or others will not assert rights against us with respect to intellectual property arising out of our relationships with them.
Third parties may claim that our products or processes infringe their intellectual property rights, which may cause us to pay unexpected litigation costs or damages or prevent us from selling our products or services.
From time to time, we may become subject to legal proceedings, including allegations and claims of alleged infringement or misappropriation by us of the patents and other intellectual property rights of third parties. We cannot assure you that the use of our patented technology or proprietary know‑how or information does not infringe the intellectual property rights of others. In addition, attempts to enforce our own intellectual property claims may subject us to counterclaims that our intellectual property rights are invalid, unenforceable or are licensed to the party against whom we are asserting the claim or that we are infringing that party’s alleged intellectual property rights. We may also be obligated to indemnify affiliates or other
partners who are accused of violating third parties’ intellectual property rights by virtue of those affiliates or partners’ agreements with us, and this could increase our costs in defending such claims and our damages.
Legal proceedings involving intellectual property rights, regardless of merit, are highly uncertain and can involve complex legal and scientific analyses, can be time consuming, expensive to litigate or settle and can significantly divert resources, even if resolved in our favor. Our failure to prevail in such matters could result in loss of intellectual property rights or judgments awarding substantial damages and injunctive or other equitable relief against us. If we were to be held liable or discover or be notified that our products or processes potentially infringe or otherwise violate the intellectual property rights of others, we may face a loss of reputation and may not be able to exploit some or all of our intellectual property rights or technology. If necessary, we may seek licenses to intellectual property of others. However, we may not be able to obtain the necessary licenses on terms acceptable to us or at all. Our failure to obtain a license from a third-party for that intellectual property necessary for the production or sale of any of our products could cause us to incur substantial liabilities and/or suspend the production or shipment of products or the use of processes requiring the use of that intellectual property. We may be required to substantially re‑engineer our products or processes to avoid infringement.
Any of the foregoing may require considerable effort and expense, result in substantial increases in operating costs, delay or inhibit sales or preclude us from effectively competing in the marketplace, which in turn could have a material adverse effect on our business and financial results.
Our business, financial condition and results of operations could be adversely impacted by increased costs.
Our business may be negatively impacted by increased costs for manufacturing inputs, including needle coke, energy, and freight. We may not be able to offset or pass on these costs, which could lead to further adverse impacts on our business, financial condition and results of operations.
We currently benefit from U.S. and EU anti-dumping duties and tariffs against certain Chinese and Indian imports that if reduced or not extended could have a material adverse effect on our results of operations, cash flow, liquidity and financial condition.
These anti-dumping duties and tariffs are generally subject to periodic reviews and challenges, which can result in their revocation or reduction. There can be no assurance that these anti-dumping duties and tariffs will be continued in the future or that such anti-dumping duties and tariffs will adequately combat unfairly traded imports. If these anti-dumping duties and tariffs were to be revoked or reduced in the future, our business, financial condition and results would be adversely impacted.
Risks related to our indebtedness
Our indebtedness could limit our financial and operating activities and adversely affect our ability to incur additional debt to fund future needs and our ability to fulfill our obligations under our existing and future indebtedness.
Our credit agreement (as amended, the “2018 Credit Agreement”) currently provides for (i) an aggregate $2,250 million senior secured term loan facility (the “2018 Term Loan Facility”) and (ii) a $250$330 million senior secured revolving credit facility after giving effect to the May 2022 amendment (the “Third Amendment”) that increased the revolving commitments under the 2018 Credit Agreement by $80 million from $250 million (the “2018 Revolving Credit Facility” and, together). As any borrowings under the 2018 Revolving Credit Facility remain subject to compliance with the financial covenant in our 2018 Term LoanRevolving Credit Facility, as amended,our operating performance resulted in a reduction of the “Senior Securedavailability under our 2018 Revolving Credit Facilities”).Facility.
As of December 31, 2021,2023, we had approximately $1,030$925.5 million of secured indebtedness outstanding including borrowings under the Senior Secured Credit Facilities and our 4.625% Senior Secured Notes due 2028 (the “2020 Senior Secured Notes”) and our 9.875% Senior Secured Notes due 2028 (the “2023 Senior Secured Notes”). As of December 31, 2021,2023, we had $246.7$112.4 million available for borrowing under the 2018 Revolving Credit Facility (taking into account approximately $3.3$3.1 million of outstanding letters of credit issued thereunder).
Interest expense for the years ended December 31, 20212023 and December 31, 20202022 was $68.8$58.1 million and $98.1$36.6 million, respectively.
Our indebtedness could:
•require us to dedicate a substantial portion of our cash flow to the payment of principal and interest, thereby reducing the funds available for operations and future business opportunities;
•make it more difficult for us to satisfy our obligations;
•limit our ability to borrow additional money if needed for other purposes, including working capital, capital expenditures, debt service requirements, acquisitions and general corporate or other purposes, on satisfactory terms or at all;
•limit our ability to adjust to changing economic, business and competitive conditions;
•place us at a competitive disadvantage with competitors who may have less indebtedness or greater access to financing;
•require us to reduce or delay capital expenditures or sell assets or operations to meet our scheduled debt service obligations;
•make us more vulnerable to an increase in interest rates, a downturn in our operating performance or a decline in general economic conditions; and
•make us more susceptible to changes in credit ratings, which could impact our ability to obtain financing in the future and increase the cost of such financing.
Compliance with our debt obligations under the Senior Secured2018 Revolving Credit Facilities andFacility, 2020 Senior Secured Notes, and 2023 Senior Secured Notes, and any future indebtedness could materially limit our financial or operating activities, or hinder our ability to adapt to changing industry conditions, which could result in our losing market share, a decline in our revenue or a negative impact on our operating results.
The 2018 Revolving Credit AgreementFacility and the indentureindentures governing the 2020 Senior Secured Notes and 2023 Senior Secured Notes include covenants that could restrict or limit our financial and business operations.
The 2018 Revolving Credit AgreementFacility and the indentureindentures governing the 2020 Senior Secured Notes and the 2023 Senior Secured Notes contain a number of restrictive covenants that, subject to certain exceptions and qualifications, restrict or limit our ability and the ability of our subsidiaries to, among other things:
•incur, repay or refinance indebtedness;
•create liens on or sell our assets;
•engage in certain fundamental corporate changes or changes to our business activities;
•make investments or engage in mergers or acquisitions;
•pay dividends or repurchase stock;
•engage in certain affiliate transactions;
•enter into agreements or otherwise restrict our subsidiaries from making distributions or paying dividends to the borrowers under the Senior Secured2018 Revolving Credit FacilitiesFacility or to us or certain of our subsidiaries, as applicable; and
•repay intercompany indebtedness or make intercompany distributions or pay intercompany dividends.
The 2018 Revolving Credit AgreementFacility also contains certain affirmative covenants and contains a financial covenant that requires us to maintain a senior secured first lien net leverage ratio not greater than 4.00:1.00 when the aggregate principal amount of borrowings under the 2018 Revolving Credit Facility and outstanding letters of credit issued under the 2018 Revolving Credit Facility (except for undrawn letters of credit in an aggregate amount equal to or less than $35 million), taken together, exceed 35% of the total amount of commitments under the 2018 Revolving Credit Facility.
These covenants and restrictions could affect our ability to operate our business and may limit our ability to react to market conditions or take advantage of potential business opportunities as they arise. Additionally, our ability to comply with these covenants may be affected by events beyond our control, including general economic and credit conditions and industry downturns.
If we fail to comply with the covenants in the 2018 Revolving Credit AgreementFacility and the indentureindentures governing the 2020 Senior Secured Notes and the 2023 Senior Secured Notes, and are unable to obtain a waiver or amendment, an event of default would result, and the lenders and noteholders could, among other things, declare outstanding amounts due and payable or, with respect to the 2018 Revolving Credit Agreement,Facility, refuse to lend additional amounts to us or require deposit of cash collateral in respect of outstanding letters of credit. If we were unable to repay or pay the amounts due, the lenders under the 2018 Revolving Credit AgreementFacility and the noteholders could, among other things, proceed against the collateral granted to them to
secure the indebtedness, which includes substantially all of our and our U.S. subsidiaries’ assets and, with respect to the 2018 Revolving Credit Facility, certain assets of certain of our non‑U.S.non-U.S. subsidiaries.
Risks related to tax matters
We are required to make payments under a Tax Receivable Agreement for certain tax benefits we may claim in the future, and the amounts we may pay could be significant.
In connection with the completion of our IPO,initial public offering (“IPO”), we entered into a tax receivable agreement (the(as amended and restated, the “Tax Receivable Agreement”) that provides Brookfield Corporation and its affiliates (together, “Brookfield”) the right to receive future payments from us of 85% of the amount of cash savings, if any, in U.S. federal income tax and Swiss tax that we and our subsidiaries realize as a result of the utilization of certain tax assets attributable to periods prior to our IPO, including certain federal net operating losses (“NOLs”), previously taxed income under Section 959 of the Code, foreign tax credits, and certain NOLs in GrafTech Switzerland S.A. (collectively, the “Pre‑IPO Tax Assets”). In addition, we pay interest on the payments we make to Brookfield with respect to the amount of this cash savings from the due date (without extensions) of our tax return where we realize this savings to the payment date at a rate equal to London Interbank Offered Rate ("LIBOR")the forward looking term rate based on the secured overnight financing rate administered by the Federal Reserve Bank of New York (or a successor administrator of the secured overnight financing rate) for a one-month period plus 1.00% per annum.1.10%. The term of the Tax Receivable Agreement commenced on April 23, 2018 and will continue until there is no potential for any future tax benefit payments.
We have made our initial paymentpayments of approximately $28$58.1 million related to the Tax Receivable Agreement in February 2020 and have since made an additional payment of $22 million.Agreement. We expect that, based on current tax laws, future payments under the Tax Receivable Agreement relating to the Pre-IPO Tax Assets will be approximately $19.3$11.2 million in the aggregate. The maximum amount over the term of the agreement is approximately $70$70.0 million.
Risks related to government regulationour legal and regulatory environment
Stringent health, safety and environmental laws and regulations applicable to our manufacturing operations and facilities could result in substantial costs related to compliance, sanctions or material liabilities and may affect the availability of raw materials.
We are subject to stringent environmental, health and safety laws and regulations relating to our current and former properties (including former onsite landfills over which we have retained ownership), other properties that neighbor ours or to which we sent wastes for treatment or disposal, as well as our current raw materials, products, and operations. Some of our products (including our raw materials) are subject to extensive environmental and industrial hygiene regulations governing the registration and safety analysis of their component substances. Coal tar pitch, which is classified as a substance of very high concern under the EU’s Registration, Evaluation, Authorization and Restriction of Chemical Regulation (“REACH”)
regulations, is used in certain of our processes but in a manner that we believe does not currently require us to obtain a specific authorization under the REACH guidelines. Violations of these laws and regulations, or of the terms and conditions of permits required for our operations, can result in damage claims, reputational harm, the imposition of substantial fines and criminal sanctions and sometimes require the installation of costly pollution control or safety equipment or costly changes in operations to limit pollution or decrease the likelihood of injuries. In addition, we are currently conducting remediation and/or monitoring at certain current and former properties, including at our Monterrey, Mexico facility, and may become subject to material liabilities in the future for the investigation and cleanup of contaminated properties, including with respect to emerging contaminants or for properties on which we have ceased operations. We have been in the past, and could be in the future, subject to claims alleging personal injury, death or property damage resulting from exposure to hazardous substances, accidents or otherwise for conditions creating an unsafe workplace. Further, noncompliance or alleged noncompliance with or stricter enforcement of, or changes in interpretations of, existing laws and regulations, adoption of more stringent new laws and regulations, discovery of previously unknown contamination or imposition of new or increased requirements could require us to incur costs or become the basis of new or increased liabilities or reputational harm that have a material adverse impact on our operations, costs or results of operations. It is also possible that the impact of safety and environmental regulations on our suppliers could affect the availability and cost of our raw materials.
For example, legislators, regulators and others, as well as many companies, are considering ways to reduce emissions of greenhouse gases (“GHGs”) due to scientific, political and public concern that GHG emissions are altering the atmosphere in ways that are affecting, and are expected to continue to affect, the global climate. The EU has established GHG regulations and is revising its emission trading system for the period after 2020 in a manner that may require us to incur additional costs. The United States has required annual reporting of GHG emissions from certain large sources beginning in 2011.2011 and various and regional state efforts to reduce GHG emissions have also been implemented. Further measures, in the United States, EU and many other countries, may be enacted in the future. In particular, in December 2015, more than 190 countries participating in the United Nations Framework Convention on Climate Change (“UNFCC”) reached an international agreement related to curbing GHG
emissions (the “Paris Agreement”). Further GHG regulations under the Paris Agreement or otherwise may take the form of a national or international cap‑and‑trade emissions permit system, a carbon tax, emissions controls, reporting requirements, or other regulatory initiatives. For more information, see the section entitled “Business.”
It is possible that some form ofThe further regulation of GHG emissions will also be introducedor other environmental regulations in the future in other countries in which we operate or market our products. Regulation of GHG emissionsproducts could impose additional costs, both direct and indirect, on our business, and on the businesses of our customers and suppliers, such as increased energy and insurance rates, higher taxes, new environmental compliance program expenses, including capital improvements, environmental monitoring and the purchase of emission credits, and other administrative costs necessary to comply with current and potential future requirements or limitations that may be imposed, as well as other unforeseen or unknown costs. To the extent that similar requirements and limitations are not imposed globally, this regulation may impact our ability to compete with companies located in countries that do not have these requirements or limitations. We may also experience a change in competitive position relative to industry peers, changes in prices received for products sold and changes to profit or loss arising from increased or decreased demand for our products. The impact of any future GHG regulatory requirements on our global business will be dependent upon the design of the regulatory schemes that are ultimately adopted and, as a result, we are unable to predict their significance to our operations at this time.
Global data and privacy protection laws applicable to us require substantial costs related to compliance, and any failure to comply could result in significant liability to us, including fines and penalties.
We collect data, including personally identifiable information of our employees, in the course of our business activities and transfer such data between our affiliated entities, to and from our business partners and to third‑party service providers, which may be subject to global data privacy laws and cross‑border transfer restrictions. While we take steps to comply with these legal requirements, any changes to such laws may impact our ability to effectively transfer data across borders in support of our business operations and any breach of such laws may lead to administrative, civil or criminal liability, as well as reputational harm to the Company and its employees. For example, the EU’s GDPR introduced a number of obligations for subject companies, including obligations relating to data transfers and the security of personal data they process. We take steps to protect the security and integrity of the information we collect, but there is no guarantee that the steps we have taken will prevent inadvertent or unauthorized use or disclosure of such information, or prevent third parties from gaining unauthorized access to this information despite our efforts. Any such incident could result in legal claims or proceedings, liability under laws that protect the privacy of personally identifiable information (including the GDPR) and damage to our reputation.
The cost of ongoing compliance with global data protection and privacy laws and the potential fines and penalties levied in the event of a breach of such laws may have an adverse effect on our business and operations. For example, the GDPR currently provides that supervisory authorities in the EU may impose administrative fines for non‑compliance of up to €20,000,000€20.0 million or 4% of the subject company’s annual, group‑wide turnover (whichever is higher) and individuals who have suffered damage as a result of a subject company’s non‑compliance with the GDPR also have the right to seek compensation
from such company. We will need to continue dedicating financial resources and management time to compliance efforts with respect to global data protection and privacy laws, including the GDPR.
We are involved in certain arbitrations as respondents/counterclaimants with a few customers who, among other things, have failed to perform under their LTAs and in certain instances are seeking to modify or frustrate their contractual commitments to us, and the outcome of these arbitrations could have a material adverse effect on our results of operations, cash flow, liquidity and financial condition.
In particular, Aperam South America LTDA, Aperam Sourcing S.C.A., ArcelorMittal Sourcing S.C.A., and ArcelorMittal Brasil S.A. initiated a single arbitration proceeding against two of the Company’s subsidiaries in the International Chamber of Commerce in June 2020. The claimants argue, among other things, that they should no longer be required to comply with the terms of the LTAs that they signed due to an alleged drop in market prices for graphite electrodes in January 2020. Alternatively, the claimants argue that they should not be required to comply with the LTAs that they signed due to alleged market circumstances at the time of execution. The claimants are alleging damages in the amount of approximately $188.2 million, including interest, for the period covering the first quarter of 2020 through the first quarter of 2023. Although we believe we have valid defenses to these claims, arbitrations, like litigation, are inherently subject to many uncertainties, and we ultimately may not prevail, which would have adverse impacts on our business, financial condition and results of operations.
Risks related to our common stock
If the ownership of our common stock continues to be highly concentrated, it may prevent minority stockholders from influencing significant corporate decisions and may result in conflicts of interest.
As of February 11, 2022, Brookfield owned approximately 24% of our outstanding common stock. Accordingly, Brookfield has significant influence over all matters requiring a stockholder vote, including the election of directors; mergers, consolidations and acquisitions; the sale of all or substantially all of our assets and other decisions affecting our capital structure; the amendment of our Amended and Restated Certificate of Incorporation (“Amended Certificate of Incorporation”) and our Amended and Restated By-Laws (“Amended By-Laws”); and our winding up and dissolution. This concentration of ownership may delay, deter or prevent acts that would be favored by our other stockholders. The interests of Brookfield may not always coincide with our interests or the interests of our other stockholders. This concentration of ownership may also have the effect of delaying, preventing or deterring a change in control. Also, Brookfield may seek to cause us to take courses of action that, in its judgment, could enhance its investment in us, but that might involve risks to our other stockholders or adversely affect us or our other stockholders. As a result, the market price of our common stock could decline or stockholders might not receive a premium over the then-current market price of our common stock upon a change in control. In addition, this concentration of share ownership may adversely affect the trading price of our common stock because investors may perceive disadvantages in owning shares in a company with significant stockholders.
Our largest stockholder, Brookfield, whose representatives serve on our Board of Directors, has the right to engage or invest in the same or similar businesses as us.
Brookfield has other investments and business activities in addition to their ownership of us. Brookfield has the right, and has no duty to abstain from exercising such right, to engage or invest in the same or similar businesses as us, do business with any of our clients, customers or vendors or employ or otherwise engage any of our officers, directors or employees. If Brookfield or any of its officers, directors or employees acquire knowledge of a potential transaction that could be a corporate opportunity, they have no duty, to the fullest extent permitted by law, to offer such corporate opportunity to us, our stockholders or our affiliates.
In the event that any of our directors and officers who is also a director, officer or employee of Brookfield acquires knowledge of a corporate opportunity or is offered a corporate opportunity, provided that this knowledge was not acquired solely in such person’s capacity as our director or officer and such person acts in good faith, then to the fullest extent permitted by law such person is deemed to have fully satisfied such person’s fiduciary duties owed to us and is not liable to us, if Brookfield pursues or acquires the corporate opportunity or if Brookfield does not present the corporate opportunity to us.
Certain provisions, including in our Amended Certificate of Incorporation and our Amended By-Laws, could hinder, delay or prevent a change in control, which could adversely affect the price of our common stock.
Our Amended Certificate of Incorporation and Amended By-Laws contain provisions that could make it more difficult for a third-party to acquire us without the consent of our Board of Directors, or Brookfield, including:
•provisions in our Amended Certificate of Incorporation and Amended By-Laws that prevent stockholders from calling special meetings of our stockholders, except where the Delaware General Corporation Law (“DGCL”) confers the right to fix the date of such meetings upon stockholders;
•advance notice requirements by stockholders with respect to director nominations and actions to be taken at annual meetings;
•provisions in our Amended Certificate of Incorporation provide for a classified Board of Directors such that only one of three classes of directors is elected each year, which prevents our stockholders from replacing the majority our directors at once;
•no provision in our Amended Certificate of Incorporation or Amended By-Laws provides for cumulative voting in the election of directors, which means that the holders of a majority of the outstanding shares of our common stock can elect all the directors standing for election;
•under our Amended Certificate of Incorporation, our Board of Directors have authority to cause the issuance of preferred stock from time to time in one or more series and to establish the terms, preferences and rights of any such series of preferred stock, all without approval of our stockholders; and
•nothing in our Amended Certificate of Incorporation precludes future issuances without stockholder approval of the authorized but unissued shares of our common stock.
These provisions may make it difficult and expensive for a third-party to pursue a tender offer, change in control or takeover attempt that is opposed by Brookfield, our management or our boardBoard of directors. Public stockholdersDirectors. Stockholders who might desire to participate in these types of transactions may not have an opportunity to do so, even if the transaction is favorable to such stockholders. These anti-takeover provisions could substantially impede the ability of public stockholders to benefit from a change in control or to change our management and Board of Directors and, as a result, may adversely affect the market price of our common stock and your ability to realize any potential change of control premium.
Our Amended Certificate of Incorporation provides that the Court of Chancery of the State of Delaware will be the exclusive forum for substantially all disputes between us and our stockholders, which could limit our stockholders’ ability to obtain a favorable judicial forum for disputes with us or our directors, officers, or employees.
Our Amended Certificate of Incorporation provides that the Court of Chancery of the State of Delaware is the exclusive forum for:
•any derivative action or proceeding brought on our behalf;
•any action asserting a breach of fiduciary duty;
•any action asserting a claim against us arising under the DGCL, our Amended Certificate of Incorporation or our Amended By-Laws; and
•any action asserting a claim against us that is governed by the internal-affairs doctrine.
This exclusive forum provision may limit a stockholder’s ability to bring a claim in a judicial forum that it finds favorable for disputes with us or our directors, officers, or other employees, which may discourage lawsuits against us and our directors, officers, and other employees. If a court were to find the exclusive forum provision in our Amended Certificate of Incorporation to be inapplicable or unenforceable in an action, we may incur additional costs associated with resolving the dispute in other jurisdictions, which could harm our business.
The market price of our common stock could be negatively affected by sales of substantial amounts of our common stock in the public markets.
The sale in the public markets of our common stock by Brookfield, which, as of February 11, 2022, owned approximately 24% of our outstanding common stock, or by our officers and directors, or the perception that these sales may occur, could cause the market price of our common stock to decline or cause the market price of our common stock to trade at a discount. Brookfield may from time to time seek to sell or otherwise dispose of some or all of its shares, including by transferring shares to affiliates, distributing shares to its partners, members or beneficiaries, or selling shares in underwritten offerings, block sales, open market transactions or otherwise. Brookfield and our officers and directors may also sell shares into the public markets in accordance with the requirements of Rule 144, and Brookfield is entitled to request that we facilitate SEC registration of their sales of shares pursuant to the terms of a registration rights agreement. A decline in the price of our common stock might impede our ability to raise capital through the issuance of additional common stock or other equity securities.
We cannot guarantee that our stock repurchase program will be fully consummated or that it will enhance long-term stockholder value. Stock repurchases could also increase the volatility of the trading price of our stock and will diminish our cash reserves.
Although our Board of Directors has authorized a stock repurchase program that does not have an expiration date, the program does not obligate us to acquire any particular amount of shares of common stock, and the stock repurchase program may be suspended or discontinued at any time at our discretion. We cannot guarantee that the program will be fully consummated or that it will enhance long-term stockholder value. The program could affect the trading price of our stock, and increase volatility, and any announcement of a termination of this program may result in a decrease in the trading price of our common stock. In addition, our use of this program will diminish our cash.
We may not pay cash dividends on our common stock.
We currently pay cash dividends on our common stock in accordance with our dividend policy. We cannot assure you, however, that we will pay dividends in the future in these amounts or at all. Our Board of Directors may change the timing and
amount of any future dividend payments or eliminate the payment of future dividends in its sole discretion, without any prior notice to our stockholders.
Item 1B.Unresolved Staff Comments
None.
Item 1C. Cybersecurity
Risk Management and Strategy
We have an overarching cybersecurity program for assessing, identifying, and managing material risks from cybersecurity threats that includes documented policies and procedures and incorporates a layered cybersecurity defense. We utilize a variety of technologies that target detection of malicious attempts to infiltrate our information systems. We also maintain an endpoint threat detection and response tool which uses artificial intelligence to alert our managed security service provider. On a regular basis, we hire a third-party cybersecurity service provider that performs a penetration test on our information systems. The Company seeks to address vulnerabilities that are found. We also utilize a third-party cybersecurity training company to educate our employees about cybersecurity threats. On a regular basis, we send out test phishing emails with a follow up email explaining to end users the “red flags” in these emails. Where appropriate, we utilize dual-factor authentication on our information systems. On an annual basis we receive system and organization control reports from many of our key external IT vendors as these will reveal any sort of potential security issues these companies have had in the past year.
We have experienced cybersecurity threats to our information technology infrastructure and have experienced non-material cybersecurity attacks, attempts to breach our systems, fraudulent activity and other similar incidents. As of the filing of this Annual Report, we are not aware of any such incidents that have occurred that have materially affected, or are reasonably likely to materially affect, the Company, including our business strategy, results of operations, or financial condition. However, future security and/or privacy breaches, acts of vandalism or terror, computer viruses, misplaced or lost data, programming, and/or human error or other similar events with respect to our information technology systems or processes or the information technology systems or processes of third-parties that have been entrusted with our information expose us to a risk of loss or misuse of this information, litigation and potential liability, which could have a material adverse effect on our business, financial condition, results of operations or cash flows. Risks related to cybersecurity events are detailed in the section of this Annual Report titled “Risk Factors—Risks related to our business and industry—We may be subject to information technology systems failures, cybersecurity attacks, network disruptions and breaches of data security, which could compromise our information and expose us to liability.”
Governance
The Board oversees risks from cybersecurity threats through the same framework it uses to oversee the management of our risk exposure in general. Cybersecurity risks, including operations disruptions, outdated enterprise software and damage reputation, have been specifically incorporated into our enterprise risk management processes. These risks are scored based on impact, likelihood and established controls. Action plans are then established for each of the risks and are incorporated into objectives. Risks are then tracked and integrated into reporting and disclosure processes. Risks are reviewed at least bi-annually by a committee made up of representatives from finance, internal audit, treasury, operations, legal and others. Management at least annually provides to the Board updated information concerning cybersecurity threats as well as management’s efforts to mitigate such threats. The Board then is responsible for overseeing that management responds appropriately. The Audit Committee, which is made up solely of independent directors, is responsible for overseeing Company policies and practices with respect to cybersecurity issues.
Our Vice President, Information Technology leads our information security program and team, which is comprised of several members devoted to infrastructure and information systems security and management. Our Vice President, Information Technology has over 20 years of industry experience, including over 15 years at our Company, serving in roles throughout his career such as engineer, infrastructure manager, Director of Information Technology Infrastructure, and Global Director of IT.
Item 2.Properties
The Company uses the following principal physical properties in connection with the manufacturing, sales and salesservices of graphite electrodes, pins and corporate administrative operations.operations, all of which serve its only reportable segment, Industrial Materials. The total capacity utilization, reflecting production volume as a percentage of production capacity, of our graphite electrode manufacturing facilities in Calais, France, Monterrey, Mexico and Pamplona, Spain, was 44% and St. Marys, Pennsylvania, was 72% and 58%78% for the years ended December 31, 20212023 and December 31, 2020,2022, respectively. Production capacity reflects expected maximum production volume during the period depending on product mix and expected maintenance outage. Actual production may vary. Our The properties that we ownlocated in St. Marys, Pennsylvania and Port Lavaca, Texas are encumbered by our 2018 Credit Agreement, 2020 Senior Secured Notes and our 20202023 Senior Secured Notes.
| | | | | | | | | | | | | | |
| Location of Facility | | Primary Use | | Owned
or
Leased |
| Americas | | | | |
| | | | |
| Brooklyn Heights, Ohio | | Corporate Headquarters, Innovation and Technology Center and Sales Office | | Leased |
| | | | |
| Monterrey, Mexico | | Graphite Electrode and Pin Manufacturing Facility, Sales and SalesService Office | | Owned |
| | | | |
| St. Marys, Pennsylvania | | Graphite Electrode Manufacturing Facility, Sales and Service Office | | Owned |
| | | | |
| Port Lavaca, Texas | | Petroleum Needle Coke Manufacturing Facility (Seadrift) | | Owned |
| | | | |
| Salvador, Bahia, Brazil | | Graphite Electrode Machine Shop, Sales and SalesService Office | | Owned |
| | | | |
| Europe | | | | |
| | | | |
| Calais, France | | Graphite Electrode Manufacturing Facility, Sales and SalesService Office | | Owned |
| | | | |
| | | | |
| | | | |
| Pamplona, Spain | | Graphite Electrode Manufacturing Facility, Sales and SalesService Office | | Owned |
| | | | |
| Bussigny, Switzerland | | Global Sales and Production Planning Office | | Leased |
| | | | |
| | | | |
| | | | |
| | | | |
| | | | |
| | | | |
| | | | |
| | | | |
Item 3.Legal Proceedings
We are involved in various investigations, lawsuits, claims, demands, labor disputes and other legal proceedings, including with respect to environmental and human exposure or other personal injury matters, arising out of or incidental to the conduct of our business. While it is not possible to determine the ultimate disposition of each of these matters and proceedings, we do not believe that their ultimate disposition will have a material adverse effect on our financial position, results of operations or cash flows. Additionally, we are involved in the following legal proceedings.
Arbitrations
We are involved in variouscertain arbitrations sometimes as claimants and other times as respondents/counterclaimants, pending before the International Chamber of Commerce with severala few customers who, among other things, have failed to perform under their LTAs and in certain instances are seeking to modify or frustrate their contractual commitments to us. In particular, Aperam South America LTDA, Aperam Sourcing S.C.A., ArcelorMittal Sourcing S.C.A., and ArcelorMittal Brasil S.A. (collectively, the “Claimants”) initiated a single arbitration proceeding against two of the Company’s subsidiaries in the International Chamber of Commerce in June 2020. In June 2021, the Claimants filed their statement of claim, seeking approximately $61 million plus interest in monetary relief and/or reimbursement in respect of several fixed price LTAs that were executed between such subsidiaries and the Claimants in 2017 and 2018. The Claimants argue, among other things, that they should no longer be required to comply with the terms of the LTAs that they signed due to an alleged drop in market prices for graphite electrodes in January 2020. Alternatively, the Claimants argue that they should not be required to comply with the LTAs that they signed due to alleged market circumstances at the time of execution. In June 2021, the Claimants filed their statement of claim, seeking approximately $61.0 million plus interest in monetary relief and/or reimbursement in respect of several fixed price LTAs that were executed between such subsidiaries and the Claimants in 2017 and 2018. On December 16, 2022, the Claimants revised their calculation of alleged damages to approximately $178.9 million including interest, with damages covering the period from the first quarter of 2020 through the end of the third quarter of 2022 and interest covering the period from June 2020 through December 16, 2022. In March 2023, an International Chamber of Commerce hearing was held before the party-appointed sole arbitrator with the Claimants, the Company, and witnesses in attendance. On March 31, 2023, the Claimants further revised their calculation of alleged damages to approximately $171.7 million, including interest, for the period covering the first quarter of 2020 through 2022. In June of 2023, the Claimants again revised their calculation of alleged damages to approximately $188.2 million, including interest, for the period covering the first quarter of 2020 through the first quarter of 2023. We believe we have valid defenses to these claims. We intend to vigorously defend them and enforce our rights under the LTAs.
Monterrey, Mexico Suspension of Operations
Background
On September 15, 2022, inspectors from the State Attorney’s Office for the Secretary of Environment of the State of Nuevo León, Mexico visited GrafTech Mexico S.A. De C.V.’s (“GrafTech Mexico”) graphite electrode manufacturing facility located in Monterrey, Mexico to inspect GrafTech Mexico’s facility and certain of the facility’s environmental and operating permits. At the conclusion of the inspection, the inspectors issued a Record of Inspection providing for the results of the inspection, their observations, and the imposition of a temporary suspension of GrafTech Mexico’s facilities within seven days. In parallel, the Director of Comprehensive Atmospheric Management of the Undersecretary of Climate Change and Air Quality of the Ministry of the Environment of the State of Nuevo León formally denied GrafTech Mexico’s previously requested modification to its operating license stating that such license was no longer valid. On September 22, 2022, GrafTech Mexico submitted observations and responses to the Record of Inspection, requested an extension of the shutdown of the facility until October 7, 2022, and requested a clarification of the scope of the shutdown. On September 23, 2022, inspectors from the State Attorney’s Office for the Secretary of Environment visited GrafTech Mexico’s manufacturing facility to verify the information presented in GrafTech Mexico’s observations and responses submitted on September 22, 2022. On October 4, 2022, the State Attorney’s Office for the Secretary of Environment granted an extension of the shutdown of the facility until October 7, 2022 and clarified the suspension permitting GrafTech Mexico to perform several activities, including extracting or withdrawing finished or unfinished product. On November 17, 2022, the State Attorney’s Office for the Secretary of Environment lifted the suspension notice, subject to the completion of certain agreed-upon activities, including the submission of an environmental impact study with respect to the facility’s operations, allowing the Monterrey facility to resume operations. Notwithstanding that the suspension notice has been conditionally lifted and that the Monterrey facility has resumed operations, GrafTech Mexico believes it is prudent to continue to pursue the related legal proceeding set forth below.
Administrative Proceeding
On November 17, 2022, the State Attorney’s Office for the Secretary of Environment issued a summons opening an administrative proceeding against GrafTech Mexico, citing the lack of an environmental impact authorization and environmental risk study with respect to the facility’s operations. The summons ordered GrafTech Mexico to submit an environmental impact authorization and risk study within 30 business days. GrafTech Mexico submitted its environmental impact authorization and risk study for the full site on November 25, 2022, and filed its response to the summons on December 2, 2022. Once the State Attorney’s Office for the Secretary of Environment initiates the summary argument period, GrafTech Mexico will have three business days to provide its summary arguments. A final resolution is expected to be issued within fifteen business days from submission of the summary arguments, but can be extended up to an additional three months and is subject to appeal.
Brazil Clause IV
Pending litigation in Brazil has been brought by employees seeking to recover additional amounts and interest thereon under certain wage increase provisions applicable in 1989 and 1990 under collective bargaining agreements to which employers in the Bahia region of Brazil were a party (including our subsidiary in Brazil). Companies in Brazil have settled claims arising
out of these provisions and, in May 2015, the litigation was remanded by the Brazilian Supreme Court in favor of the employees union. After denying an interim appeal by the Bahia region employers on June 26, 2019, the Brazilian Supreme Court finally ruled in favor of the employees union on September 26, 2019. The employers union has determined not to seek annulment of such decision. Separately, on October 1, 2015, a related action was filed by current and former employees against our subsidiary in Brazil to recover amounts under such provisions, plus interest thereon, which amounts together with interest could be material to us. If the Brazilian Supreme Court proceeding above had been determined in favor of the employers union, it would also have resolved this proceeding in our favor. In the first quarter of 2017, the state court initially ruled in favor of the employees. We appealed this state court ruling, and the appellate court issued a decision in our favor on May 19, 2020. The employees have further appealed and, on December 16, 2020, the court upheld the decision in favor of GrafTech Brazil. On February 22, 2021, the employees filed a further appeal and, on April 28, 2021, the court rejected the employees'employees’ appeal in favor of GrafTech Brazil. The employees filed a further appeal and on September 12, 2022, we filed our response in opposition. We intend to vigorously defend our position. As of December 31, 2021,2023, we are unable to assess the potential loss associated with these proceedings as the claims do not currently specify the number of employees seeking damages or the amount of damages being sought.
Mexico Value-Added Tax (“VAT”)
In July 2019, the Mexican Tax Authority (“MTA”) opened an audit of the VAT filings of GrafTech Comercial de Mexico S. de R.L. de C.V. (“GrafTech Commercial Mexico”) for the period of January 1 to April 30, 2019. In September 2021, the MTA issued a tax assessment, claiming improper use of a certain VAT exemption rule for purchases from a foreign
affiliate. As of December 31, 2023, the tax assessment for the four month period under audit amounted to approximately $28.8 million, including penalties, inflation and interest. Interest will continue to accrue up to five years from the date the corresponding VAT returns were filed and inflation will continue to accrue with the passage of time. GrafTech Commercial Mexico filed an administrative appeal against the tax assessment with the MTA’s appeals office. In November 2022, the MTA’s appeals office concluded its review and confirmed the tax assessment. GrafTech Commercial Mexico believes that the purchases from a foreign affiliate are exempt from VAT back-up withholding, and in December 2022 GrafTech Commercial Mexico filed a Claim for Nullity with the Chamber Specialized in exclusive resolution of substance of the Federal Court of Administrative Justice. On February 17, 2023, the MTA filed the response to the nullity petition. On May 31, 2023, the court held a hearing to determine the scope of the issues to be decided in the proceedings. At the court’s request, GrafTech Commercial Mexico submitted formal pleadings on August 1, 2023. On January 8, 2024, the court ruled in GrafTech Commercial Mexico’s favor and annulled the tax assessment. On January 31, 2024, the MTA filed an appeal for review.
In March 2022, the MTA opened another audit of the VAT filings of GrafTech Commercial Mexico for the period January 1 to December 31, 2018. In the proposed assessment received in January 2023, the MTA is alleging the same improper use of certain VAT exemption rules on purchases from a foreign affiliate and has provided notice of its intent to assess approximately $51.0 million, including penalties, inflation and interest. In Mexico, each tax assessment requires a separate claim. In the first quarter of 2023, GrafTech Commercial Mexico requested a conclusive agreement with the Mexican ombudsman (“PRODECON”) to reach a settlement with the MTA. The MTA responded to GrafTech Commercial Mexico’s request on May 30, 2023. On August 2, 2023, GrafTech Commercial Mexico filed a motion exhibiting additional information and reaffirming its position. On September 22, 2023, the MTA responded to GrafTech Commercial Mexico’s motion. On October 2, 2023, GrafTech Commercial Mexico filed a motion requesting a formal meeting with the MTA and PRODECON, which occurred on November 14, 2023. During the meeting, the parties agreed that GrafTech Commercial Mexico will provide additional documentation and information to be evaluated by the MTA, and, on November 29, 2023, GrafTech Commercial Mexico filed the information requested. On January 24, 2024, the MTA filed its response. On that same day, GrafTech Commerical Mexico submitted before PRODECON the favorable ruling it obtained on January 8, 2024 in connection with the 2019 preceding for the MTA’s consideration. On February 1, 2024, the MTA confirmed its position, holding that GrafTech Commercial Mexico was required to withhold the VAT. GrafTech Commercial Mexico plans to challenge the assessment. The $51.0 million includes interest and inflation. Interest will continue to accrue up to five years from the date the corresponding VAT returns were filed and inflation will continue to accrue with the passage of time.
As evidenced by the favorable court decision issued on January 8, 2024, GrafTech Commercial Mexico’s application of the VAT exemption rules is appropriate and, accordingly, GrafTech Commercial Mexico does not believe that it is probable that it will incur a loss related to this matter for either of the two periods under the MTA's audit. The Company intends to vigorously defend its position in these proceedings.
Stockholder Class Action
On September 30, 2020,January 25, 2024, a stockholder of the Company filed a lawsuitclass action complaint on behalf of all purchasers of GrafTech common stock between February 8, 2019 and August 3, 2023 in the DelawareUnited States District Court of Chancery.the Northern District of Ohio. The stockholder filed an amended complaint on February 5, 2021, in responsenames the Company, certain past and present executive officers, and two entities associated with Brookfield as defendants. The complaint alleges that certain public filings and statements made by the Company contained material misrepresentations or omissions relating to the defendants' motion to dismiss. The amended complaint challengescircumstances before and after the fairnessprior temporary suspension of the Company’s repurchase of shares of its common stock from Brookfield for $250 million pursuantgraphite electrode facility located in Monterrey, Mexico, in September 2022. The plaintiff seeks compensatory damages, which are unquantified at this time, costs and expenses, and unspecified equitable or injunctive relief. We believe we have valid defenses to a December 3, 2019 share repurchase agreement and also a related block trade by Brookfield of shares of the Company’s common stock. The stockholder, on behalf of an alleged class of holders of shares of the Company’s common stock as of December 3, 2019 and also purportedly on behalf of the Company, asserts claims for breach of fiduciary duty against certain members of the Company’s Board of Directors and Brookfield. The stockholder also challenges the appointment of the independent director who was appointed to the Company’s Board of Directors on August 5, 2020, as allegedly in violation of the Company’s Amended and Restated Certificate of Incorporation and the Stockholder Rights Agreement with certain Brookfield entities and affiliates. The stockholder seeks, among other things, an award of monetary relief to the Company and a declaration that the appointment of the independent director to the Board of Directors is invalid. On March 22, 2021, the defendants filed a motion to dismiss the amended complaint. On September 29, 2021, the stockholder voluntarily abandoned the stockholder's direct individual and class action claims challenging the share repurchase. On October 4, 2021, the Delaware Court of Chancery heard oral argument on the defendants' motion to dismiss the stockholder's remainingthese claims and took the matter under advisement. On January 21, 2022, the motionwe intend to dismiss was granted in favor of the defendants.vigorously defend them.
Item 4.Mine Safety Disclosures
Not applicable.
Supplemental Item. Information about our Executive Officers
The following table sets forth information with respect to our current executive officers, including their ages.
| | | | | | | | | | | | | | |
| Name | | Age | | Position |
David J. RintoulTimothy K. Flanagan | | 6446 | | Interim Chief Executive Officer and President |
Timothy K. FlanaganCatherine Hedoux-Delgado | | 4459 | | Interim Chief Financial Officer Vice President of Finance and Treasurer |
Quinn J. Coburn | | 58 | | Senior Vice President |
| Jeremy S. Halford | | 4951 | | Executive Vice President, Chief Operating Officer |
| Gina K. Gunning | | 5557 | | Chief Legal Officer and Corporate Secretary |
| Iñigo Perez Ortiz | | 5052 | | Senior Vice President, Commercial and CTS |
David J. Rintoul became Chief Executive Officer and President and was elected to our Board of Directors in March 2018. Prior to joining the Company, Mr. Rintoul served as President of U.S. Steel Tubular Products, a fully-integrated tubular products manufacturer, and as a Senior Vice President of United States Steel Corporation ("U.S. Steel"), an integrated steel producer, since 2014. Before that, Mr. Rintoul has served in various roles at U.S. Steel since 2007, including oversight of U.S. Steel’s Slovak and Serbian operations. Mr. Rintoul’s career in the steel industry spans 39 years with positions at both integrated and mini mill producers in the United States, Europe and Canada, including extensive mini-mill operational experience at North-Star Bluescope Steel in Delta, Ohio from 2001 to 2005 and from construction through full operations at Acme Steel Company in Riverdale, Illinois from 1995 to 2001. Mr. Rintoul holds an Associate’s degree in Mechanical Engineering Technology from Sault College of Applied Arts and Technology, a Bachelor’s degree in Business Administration from Lake Superior State University and a Master’s degree in Business Administration from the University of Notre Dame.
Timothy K. Flanagan became Interim Chief Executive Officer and President in November 2023. Mr. Flanagan joined the Company as Chief Financial Officer, Senior Vice President of Finance and Treasurer in November 2021. Mr. Flanagan previously served as Executive Vice President, Chief Financial Officer of Cleveland-Cliffs Inc. (NYSE: CLF), a flat-rolled steel producer and supplier of iron ore pellets, from January 2017 to February 2019. Prior to being promoted to Executive Vice President, Chief Financial Officer of Cleveland-Cliffs, he held a variety of financial leadership roles at Cleveland-Cliffs Inc. since joining in 2008, including being responsible for the accounting, reporting, treasury and financial planning and analysis functions and serving as the Vice President, Corporate Controller and Chief Accounting Officer from March 2012 to December 2016. Before joining the Company, Mr. Flanagan served as Chief Financial Officer of Benesch, Friedlander, Coplan & Aronoff LLP, an AmLaw 200 law firm, from June 2019 to November 2021. He has a B.S. in Accounting from the University of Dayton.
Quinn J. CoburnCatherine Hedoux-Delgado became SeniorInterim Chief Financial Officer and Treasurer in November 2023. Ms. Hedoux-Delgado joined the Company as Vice President, Corporate Controller in November 2021.April 2012 where she was responsible for the accounting and financial reporting of the Company. Prior to joining the Company, she spent 20 years at Lexmark International Inc., a multinational printing product and services company, where she most recently served as Director of SEC Reporting and Corporate Consolidation. Prior to that, Mr. Coburn served as Chief Financial Officer, Vice Presidentshe held numerous finance and accounting leadership roles at Lexmark, including Corporate Director of Internal Controls, Finance Director of the Consumer Printing Division for EMEA (Europe, Middle East and Treasurer from September 2015 to November 2021. He became interim Chief Financial Officer beginning in May 2015 after previously serving as Vice PresidentAfrica) and Finance Director of Finance and Treasurer. He joined the Company in August 2010 after working at NCR Corporation from December 1992 until August 2010, including service as NCR Corporation's Vice President and Treasurer. Mr. Coburn graduated withLexmark Canada. Ms. Hedoux-Delgado holds a B.S. in AccountingManagement from Utah State University in 1988. He received a Master ofthe ESCP Business Administration from University of Pennsylvania’s The Wharton School in 1992.France.
Jeremy S. Halford became Executive Vice President, Chief Operating Officer in October 2021. Mr. Halford joined the Company in May 2019 as Senior Vice President, Operations and Development. Mr. Halford previously served as the President of Arconic Engineered Structures, a producer of highly engineered titanium and aluminum components for the aerospace, defense and oil and gas markets, a position he held since January 2017. Mr. Halford also was President of Doncasters Aerospace, a manufacturer of components and assemblies for the civil and military aero engine and airframe markets, from 2014 to 2016, and Vice President, Global Business Development, Doncasters Group Limited from 2013 to 2014. Previously, he also was President of Mayfran International from 2012 to 2013, and spent seven years at Alcoa Corporation (NYSE: AA) ("Alcoa") in a variety of general management and strategy roles. Mr. Halford holds a Master of Business Administration degree from Harvard University and a Bachelor of Science degree in Mechanical Engineering from GMI Engineering and Management Institute (now Kettering University).
Gina K. Gunning joined the Company as Chief Legal Officer and Corporate Secretary in July 2018. She has more than 25 years of law firm and in-house corporate legal experience across multiple industries. Prior to joining GrafTech, she was an Associate General Counsel at FirstEnergy Corp., a distributor and generator of electricity, from 2012 to 2018, where she was responsible for legal matters involving SEC reporting, business development, and capital markets, as well as corporate and executive compensation topics. She also served as a partner at Jones Day. Ms. Gunning holds a Juris Doctor from Notre Dame Law School and a Bachelor of Arts in English from the University of Notre Dame.
Iñigo Perez Ortiz joined the Company as Senior Vice President, Commercial and CTS in February 2020. Mr. Perez most recently served as Vice President, Europe and Asia, Sales and Customer Service at Alcoa, a global industry leader in bauxite, alumina, and aluminum products, a position he held since 2017. Previously at Alcoa, Mr. Perez was Commercial Director, Europe and Asia Pacific from 2011 to 2017, Sales Manager, Europe from 2007 to 2011 and Sales Office Manager from 2002 to 2007. Prior to his career at Alcoa, Mr. Perez served in a variety of senior commercial roles at Autopulit S.A., Warner Electric and Babcock Wilcox Espanola, S.A. Mr. Perez holds a Master in Industrial Plans Management, Lean Manufacturing and Engineering degree from Polytechnic University of Barcelona, an Executive Master of Business Administration degree from Instituto de Empresa and a Mining Engineer degree from the University of the Basque Country.
PART II
Item 5.Market for Registrant’s Common Equity, Related Stockholder Matters and Issuer Purchases of Equity Securities
Market Information
Our common stock is listed on the NYSE under the trading symbol “EAF.”
Holders
As of December 31, 2021,2023, there were 12 seven registered holders of record of our common stock. A substantially greater number of holders of our common stock are “street name” or beneficial holders, whose shares of record are held by banks, brokers, and other financial institutions.
Dividend Policies and Restrictions
We currently payThrough the second quarter of 2023, we paid a quarterly cash dividend of $0.01 per share, or an aggregatecommon share. On August 2, 2023, our Board of $0.04Directors elected to suspend the quarterly cash dividend of $0.01 per share on an annualized basis. We expect to continue to pay this dividend out of cash generated from operations; we do not intend to incur indebtedness to fund regular, quarterly dividend payments.common share.
We cannot assure you, however,There can be no assurance that we will payresume paying dividends in the future in these amounts or at all. Our Board of Directors may change the timing and amount of any future dividend payments, if reinstated, or eliminate the payment of future dividends in its sole discretion, without any prior notice to our stockholders. Our ability to pay dividends will depend upon many factors, including our financial position and liquidity, results of operations, legal requirements, restrictions that may be imposed by the terms of our current and future credit facilities and other debt obligations and other factors deemed relevant by our Board of Directors.
For further discussion of the factors that may affect our business and our ability to pay dividends, see “Risk Factors-RisksFactors—Risks related to our business and industry” and “Risk Factors-Risks related toin Part 1, Item 1A, Risk Factors.
Equity Compensation Plan Information
The information about our common stock-Westock that may not pay cash dividends onbe issued under our common stock.Omnibus Equity Incentive Plan as of December 31, 2023 is set forth in Part III, Item 12, “Security Ownership of Certain Beneficial Owners and Management and Related Stockholder Matters” of this Report under the caption “Equity Compensation Plan Information.”
Repurchases
The table below sets forth the information on a monthly basis regarding GrafTech's purchasesIssuer Purchases of its common stock, par value $0.01 per share, during the fourth quarter of 2021.
| | | | | | | | | | | | | | | | | | | | | | | |
| Issuer Purchases of Equity Securities |
| Period | Total Number of Shares Purchased | | Average Price Paid per Share | | Total Number of Shares Purchased as Part of Publicly Announced Plans or Programs | | Approximate Dollar Value of Shares that May Yet Be Purchased Under the Plans or Programs (1) |
| | | | | | | |
| October 1 through October 31, 2021 | 364,620 | | | $ | 10.32 | | | 364,620 | | | $ | 9,030,314 | |
| November 1 through November 30, 2021 | — | | | — | | | — | | | 159,030,314 | |
| December 1 through December 31, 2021 | — | | | — | | | — | | | 159,030,314 | |
| Total | 364,620 | | | $ | 10.32 | | | 364,620 | | | $ | 159,030,314 | |
(1)On July 31, 2019, we announced that our Board of Directors approved the repurchase of up to $100$100.0 million of our common stock in open market purchases, including under Rule 10b5-1 and/or Rule 10b-18 plans.plans. On November 4, 2021, we announced that our Board of Directors approved the repurchase of up to an additional $150$150.0 million of our common stock iunder this programn open market purchases, including under Rule 10b5-1 and/or Rule 10b-18 plans. As. Approximately $99.0 million of the total $250.0 million authorized remained available for stock repurchases as of December 31, 2021, we are now authorized to repurchase up to $159,030,314 million in shares of our common stock, inclusive of the amount remaining under the previous authorization.2023. The stock repurchase program has no expiration date. During the quarter ended December 31, 2023, there was no share repurchase activity.
Item 6.[Reserved]
Item 7. Management’s Discussion and Analysis of Financial Condition and Results of Operations.Operations
The following discussion and analysis of our financial condition and results of operations should be read together with our Consolidated Financial Statements and the accompanying notes and other financial information appearing elsewhere in this Annual Report. Discussion and analysis regarding our financial condition and results of operations for 20202022 as compared to 20192021 is included in Item 7 of our Annual Report for the year-ended December 31, 2020,2022, filed with the SEC on February 23, 2021.14, 2023. Information in this section is intended to assist the reader in obtaining an understanding of our Consolidated Financial Statements, the changes in certain key items in those financial statements from year-to-year, the primary factors that accounted for those changes, any known trends or uncertainties that we are aware of that may have a material effect on our future performance, as well as how certain accounting principles affect our Consolidated Financial Statements. This discussion and analysis contains forward-looking statements that involve risks, uncertainties and assumptions. See “Cautionary Note Regarding Forward-Looking Statements.” Our actual results could differ materially from those forward-looking statements as a result of many factors, including those discussed in “Risk Factors” and elsewhere in this Annual Report.
Overview
We are a leading manufacturer of high-quality graphite electrode products essential to the production of EAF steelOperational and other ferrous and non‑ferrous metals. We believe that we have the most competitive portfolio of low‑cost UHP graphite electrode manufacturing facilities in the industry, including three of the highest capacity facilities in the world. We are the only large scale graphite electrode producer that is substantially vertically integrated into petroleum needle coke, a key raw materialCommercial Update
Sales volume for graphite electrode manufacturing. Between 1984 and 2011, EAF steelmaking2023 was the fastest‑growing segment of the steel sector, with production increasing at an average rate of 3.5% per year, based on WSA data. Historically, EAF steel production has grown faster than the overall steel market due to the greater resilience, more variable cost structure, lower capital intensity and more environmentally friendly nature of EAF steelmaking. This trend was partially reversed between 2011 and 2015 due to global steel production overcapacity driven largely by Chinese BOF steel production. Beginning in 2016, efforts by the Chinese government to restructure China’s domestic steel industry have led to limits on BOF steel production and lower export levels, and developed economies, which typically have much larger EAF steel industries, have instituted a number of trade policies in support of domestic steel producers. In response to this increased demand, we modified our commercial strategy and executed LTAs with our customers. Since 2000, EAF production has grown at an average rate of 2.7%.
We service customers at over 300 locations across the globe. In the second half of 2020, we began to see a measured recovery in the global steel markets from the initial downturns resulting from the then challenging market conditions, with each region recovering at different rates. This recovery continued through 2021 and had a positive influence on graphite electrode demand. By the first quarter of 2021, both the global (ex-China) and U.S. steel market capacity utilization rates had surpassed 73%. These increased utilization rates continued through 2021, particularly in the United States.
The commercial team has worked diligently in 2021 to achieve solid results in the current environment. Full year 2021sales volumes were 167,000approximately 92 thousand MT, consisting of LTA volumesvolume of 110,00029 thousand MT and non-LTA volumesvolume of 57,00063 thousand MT, representing a decrease of 39% compared to 149 thousand MT in 2022, consisting of LTA volume of 91 thousand MT and non-LTA volume of 58 thousand MT.
During the fourth quarter of 2021,In 2023, our averageweighted-average realized price from LTAs was approximately $9,400$8,800 per MT and our averageweighted-average realized price for non-LTA business sales of graphite electrodes was approximately $5,000$5,400 per MT. Our averageweighted-average realized non-LTA price decreased 10% compared to 2022, reflecting the soft commercial environment. In 2022, our weighted-average realized price from LTAs was approximately $9,500 per MT and our weighted-average realized price for non-LTA business sales of graphite electrodes was approximately $6,000 per MT.
Production volume for 2023 was approximately 88 thousand MT, decreasing 44% compared to 2022, as we proactively reduced our graphite electrode price increased 10% sequentially fromproduction volume to align with our evolving demand outlook and to manage our working capital levels. We also temporarily idled needle coke production at our Seadrift facility for a portion of 2023 to align our needle coke inventory with our graphite electrode production needs.
Capital Structure and Liquidity
As of December 31, 2023, we had liquidity of $289.3 million, consisting of $112.4 million of availability under our 2018 Revolving Credit Facility and cash and cash equivalents of $176.9 million. As of December 31, 2023, we had total debt of approximately $950.1 million. We continue to have adequate liquidity in 2024 to navigate the third quarter of 2021.persistent softness in the commercial environment.
Market pricesOutlook
As we enter 2024, we expect demand for graphite electrodes began to increasein the near term will remain weak, reflecting persistent softness in the commercial environment as steel industry production remains constrained by global economic uncertainty. However, we anticipate a modest year-over-year improvement in our sales volume for 2024, most notably in the first quarter of 2021,2024, as steel producers' capacity utilization rates increased and they worked through carryover graphite electrode inventories from 2020. There is a lag between the time we negotiate price for non-LTA sales and when our electrodes are delivered and recognized in revenue, which depressed our non-LTA prices during 2021. Prices increased during the second quarter and throughout the remainder of 2021. Prices for non-LTA business reset on January 1, 2022 and we expect our average first quarter non-LTA prices to increase an additional 17 to 20% over the fourth quarter.
In parallel, we expect our costs to increase in 2022, driven by recent global inflationary pressures, particularly for third party needle coke, energy and freight. While we are anticipating our first quarter 2022 costs to increase 7 to 9% over the fourth quarter 2021, we expect further increases after the first quarter of 2023 was significantly impacted by the temporary suspension of our Monterrey, Mexico facility in late 2022.
Reflecting industry-wide softness in graphite electrode demand, challenging pricing dynamics have persisted in most regions. As a result, we are being selective in the commercial opportunities we choose to be lower in magnitude as we continuepursue.
In addition, the Company has announced a set of initiatives designed to take stepsreduce our cost structure and optimize our manufacturing footprint while, at the same time, preserving our ability to mitigate these cost increases.deliver excellent customer service and to capitalize on long-term growth opportunities for our Company. Key elements include the following:
•Reducing the Company's overhead structure and expenses.
Capital structure•Operating our remaining graphite electrode production facilities at reduced levels, as needed, to align production with our view on market demand.
These initiatives, most notably the indefinite suspension of production at St. Marys and capital allocationthe reduction in Company overhead, are expected to result in annualized cost savings of approximately $25.0 million once fully implemented, excluding the impact of one-time costs. Of the anticipated cost savings, approximately $15.0 million are expected to be realized in cost of goods sold with the remainder in selling and administrative expenses. One-time costs are expected to be approximately $5.0 million, of which the majority are cash-related.
These actions, combined with the benefit of reduced market pricing for certain raw materials and energy as well as the anticipated improvement in our sales and production volume levels, are expected to result in a low teen percentage point year-over-year decline in our cash cost of goods sold per MT.
As of December 31, 2021, we had cash and cash equivalents2023, our stated graphite electrode production capacity was approximately 202 thousand MT. As a result of $57.5 million and total debtindefinitely idling certain assets, beginning in 2024, our stated production capacity will be approximately 178 thousand MT, a reduction of approximately $1.0 billion. We continue to make progress in reducing our long-term debt, repaying $100 million in the fourth quarter, for a total debt repayment of $400 million in 2021.12%.
We are committed to delivering value to our stockholders through our disciplined capital allocation strategy. In 2022,Further, during 2024, we will continue to focusoperate these facilities at reduced levels, as needed, to align production with our view on investingelectrode demand. In addition to being a key component of the incremental actions we are taking in response to weak market conditions, this will also support our business, strengtheningefforts to further reduce our balance sheetinventory levels and making opportunistic purchases under the remaining $159 million stock repurchase authorization. Ourmanage capital expenditures in 2022 are focused on specific, highly targeted2024. Specific to capital investments in operational improvement activities and are expectedexpenditures, for 2024 we anticipate spending to be in the range of $70 and $80$35.0 million to $40.0 million. This compares to capital expenditures of $54.0 million for the year ended December 31, 2023.
Industry conditions
The graphite electrode industry has historically followedLonger term, we remain confident that the growthsteel industry’s accelerating efforts to decarbonize will lead to increased adoption of the EAF steel industry and, to a lesser extent,method of steelmaking, driving long-term demand growth for graphite electrodes. We also anticipate the steel industry as a whole, which has been highly cyclical and affected significantly by general economic conditions. Historically, EAF steel production has grown faster than the overall steel market due to the greater resilience, more variable cost structure, lower capital intensity and more environmentally friendly nature of EAF steelmaking.
Increased demand for petroleum needle coke, the key raw material we use to produce graphite electrodes, to accelerate driven by its utilization in 2018 and 2019 led to pricing increasesproducing synthetic graphite for use in those years. Needle coke prices began to retreat inlithium-ion batteries for the second half of 2019 and continued to decline over the course of 2020. The price of needle coke increased throughout 2021, and we expect further increases in 2022. Graphite electrodes have typically been priced at a spread to petroleum needle coke.growing electric vehicle market. We believe that the near-term actions we are taking, supported by an industry-leading position and our sustainable competitive advantages, including our substantial vertical integration into petroleum needle coke throughvia our ownershipSeadrift facility, will optimally position GrafTech to benefit from that long-term growth.
The table of Seadrift provides a significant cost advantage relative to our competitors. We currently anticipate utilizing all of our needle coke internally, and will supplement with third-party purchases.
Outlook
Our estimated shipments of graphite electrodes under existing LTAs is as follows, reflecting our current expectations for the final year of the initial term under our LTAs and for the years 2023 through 2024 are as follows:2024:
| | | | | | | | | | | |
| 2022 | | 2023 through 2024 |
Estimated LTA volume(1) | 95-105 | | 35-4513-16 |
Estimated LTA revenue(2) | $910-$1,010 | | $350-100-$450135(3) |
(1) In thousands of MT
(2) In millions
(3) Includes expected termination fees from a few customers that have failed to meet certain obligations under their LTAs
ComponentsThe majority of results of operations
Net sales
Net sales reflect sales of our products, including graphite electrodesthe LTAs are defined as pre-determined fixed annual volume contracts while a small portion are defined with a specified volume range. For 2024, the contractual revenue amounts above are based upon the minimum volume for those contracts with specified ranges. The actual revenue realized from these contracted volumes may vary in timing and associated by‑products. Several factors affect net sales in any period, including general economic conditions, competitive conditions, customer inventory levels, scheduled plant shutdowns by customers, national vacation practices, changes in customer production schedules in responsetotal due to seasonal changes in energy costs, weather conditions, strikes and work stoppages at customer plants and changes in customer order patterns including those in response to the announcement of price increases or price adjustments.
Revenue is recognized when a customer obtains control of promised goods. The amount of revenue recognized reflects the consideration to which the Company expects to be entitled to receive in exchange for these goods. See Note 2, "Revenue from Contracts with Customers" to the Consolidated Financial Statements for more information. Our first quarter is historically the weakest sales quarter.
Cost of sales
Cost of sales includes the costscontract non-performance, force majeure notices, arbitrations, credit risk associated with products invoiced during the period as well as non‑inventoried manufacturing overhead costscertain customers facing financial challenges and outbound transportation costs. Cost of sales includes all costs incurred at our production facilities to make products saleable, such as raw materials, energy costs, direct labor and indirect labor and facilities costs, including purchasing and receiving costs, plant management, inspection costs, product engineering and internal transfer costs. In addition, all depreciation associated with assets used to produce products and make them saleable is included in cost of sales.
Direct labor costs consist of salaries, benefits, the service cost component of our pension and other post-employment benefit ("OPEB") plans and other personnel‑related costs for employees engaged in the manufacturing of our products.
Inventory valuation
Inventories are stated at the lower of cost or market. Cost is principally determined using the “first‑in, first‑out” (“FIFO”) and average cost, which approximates FIFO, methods. Elements of cost in inventory include raw materials, energy costs, direct labor, manufacturing overhead and depreciation of the manufacturing fixed assets. We allocate fixed production overheads to the costs of conversion based on normal capacity of the production facilities. We recognize abnormal amounts of idle facility expense, freight, handling costs, and wasted materials (spoilage) as current period charges. Market, or net realizable value, is the estimated selling price in the ordinary course of business, less reasonably predictable costs of completion, disposal and transportation.
Research and development
We conduct our R&D both independently and in conjunction with our strategic suppliers, customers and others. Expenditures relating to the development of new products and processes, including improvements to existing products, are expensed as incurred.
Selling and administrative expenses
Selling and administrative expenses include salaries, benefits and other personnel-related costs for employees engaged in sales and marketing, customer technical services, engineering, finance, information technology, human resources and executive management. Other costs include outside legal and accounting fees, risk management (insurance), global operational excellence, global supply chain, in‑house legal, the service cost component of our pension and OPEB plans, share‑based compensation and certain other administrative and global resources costs.
Other (income) expense, net
Other (income) expense, net consists of a gaindemand related to the settlement of a value-added tax matter in Brazil, the non-service cost components of our pension and OPEB plans, including a “mark‑to‑market adjustment," whichrepresents actuarial gains and losses that result from the remeasurement of plan assets and obligations due to changes in assumptions or experience.We recognize in earnings these actuarial gains and losses in connection with the annual remeasurement in the fourth quarter of each year. In addition, other (income) expense, net includes the impact of foreign currency on non‑operating assets and liabilities and other miscellaneous non-operating income and expense.
Related party Tax Receivable Agreement expense (benefit)
Related party Tax Receivable Agreement (benefit) expense represents our benefit or expense associated with Brookfield's right, as sole pre-IPO stockholder, to receive future payments from us for 85% of the amount of cash savings, if any, in U.S. federal income tax and Swiss tax that we and our subsidiaries realize as a result of the utilization of certain tax assets attributable to periods prior to our IPO.
Interest expense
Interest expense consists primarily of interest expense on our 2018 Term Loan Facility, 2018 Revolving Credit Facility, 2020 Senior Secured Notes, amortization of debt issuance costs and accretion of original issue discounts, as well as the settlement losses (gains) on our interest rate swaps.
Effects of changes in currency exchange rates
When the currencies of non‑U.S. countries in which we have a manufacturing facility decline (or increase) in value relative to the U.S. dollar, this has the effect of reducing (or increasing) the U.S. dollar equivalent cost of sales and other expenses with respect to those facilities. In certain countries in which we have manufacturing facilities, and in certain export markets, we sell in currencies other than the U.S. dollar. Accordingly, when these currencies increase (or decline) in value relative to the U.S. dollar, this has the effect of increasing (or reducing) net sales. The result of these effects is to increase (or decrease) operating and net income.
The impact of these changes in the average exchange rates of other currencies against the U.S. dollar on our net sales was an increase of $5.5 million for the year ended December 31, 2021, an increase of $3.6 million for the year ended December 31, 2020, and a decrease of $6.9 million for the year ended December 31, 2019.
The impact of these changes in the average exchange rates of other currencies against the U.S. dollar on our cost of sales was an increase of $10.1 million for the year ended December 31, 2021, and decreases of $4.9 million and $9.1 million for the years ended December 31, 2020 and 2019, respectively.
As part of our cash management, we also have intercompany loans between our subsidiaries. These loans are deemed to be temporary and, as a result, remeasurement gains and losses on these loans are recorded as currency gains or losses in other (income) expense, net on the Consolidated Statements of Operations.
We have in the past and may in the future use various financial instruments to manage certain exposures to risks caused by currency exchange rate changes, as described under “Quantitative and Qualitative Disclosures about Market Risk."contracted volume ranges.
Key metrics used by management to measure performance
In addition to measures of financial performance presented in our Consolidated Financial Statements in accordance with generally accepted accounting principles in the United States ("GAAP"), we use certain other financial measures and operating metrics to analyze the performance of our Company. The “non‑GAAP” financial measures consist of EBITDA, adjusted EBITDA, adjusted net (loss) income and adjusted (loss) earnings per share, which help us evaluate growth trends, establish budgets, assess operational efficiencies and evaluate our overall financial performance. The key operating metrics consist of sales volume, production volume, production capacity and capacity utilization.
Key financial measures
| | For the year ended December 31, |
| | Year ended December 31, | | | | Year ended December 31, |
| (in thousands, except per share amounts) | (in thousands, except per share amounts) | | 2021 | | 2020 | (in thousands, except per share amounts) | | 2023 | | 2022 |
| Net sales | Net sales | | $ | 1,345,788 | | | $ | 1,224,361 | |
| Net income | | 388,330 | | | 434,374 | |
Earnings per share(1) | | 1.46 | | | 1.62 | |
| Net (loss) income | |
(Loss) earnings per share(1) | |
EBITDA(2) | EBITDA(2) | | 590,010 | | | 669,332 | |
Adjusted net income(2) | | 464,585 | | | 422,512 | |
Adjusted earnings per share(1)(2) | | 1.74 | | | 1.58 | |
Adjusted net (loss) income(2) | |
Adjusted (loss) earnings per share(1)(2) | |
Adjusted EBITDA(2) | Adjusted EBITDA(2) | | 669,940 | | | 658,946 | |
(1) Earnings(Loss) earnings per share represents diluted (loss) earnings per share. Adjusted (loss) earnings per share represents adjusted diluted (loss) earnings per share.
(2) Non-GAAP financial measures;measure; see below for information and reconciliations of EBITDA, adjusted EBITDA and adjusted net income to net income and adjusted EPS to EPS, the most directly comparable financial measures calculated and presented in accordance with GAAP.
Key operating measures
In addition to measures of financial performance presented in accordance with GAAP, we use certain operating metrics to analyze the performance of our company. The key operating metrics consist of sales volume, production volume, production capacity and capacity utilization. These metrics align with management's assessment of our revenue performance and profit margin, and will help investors understand the factors that drive our profitability.
Sales volume reflects the total volume of graphite electrodes sold for which revenue has been recognized during the period. For a discussion of our revenue recognition policy, see “—Critical accounting policies—Revenue recognition” in this section. Sales volume helps investors understand the factors that drive our net sales.
Production volume reflects graphite electrodes produced during the period. Production capacity reflects expected maximum production volume during the period depending on product mix and expected maintenance outage. Actual production may vary. Capacity utilization reflects production volume as a percentage of production capacity. Production
volume, production capacity and capacity utilization help us understand the efficiency of our production and evaluate cost of sales and consider how to approach our contract initiative.goods sold.
| | | | | | | | | | | | | | |
| | For the year ended December 31, |
| (in thousands) | | 2021 | | 2020 |
Sales volume (MT)(1) | | 167 | | | 135 | |
Production volume (MT)(2) | | 165 | | | 134 | |
Total production capacity(3)(4) | | 230 | | | 230 | |
Total capacity utilization(4)(5) | | 72 | % | | 58 | % |
Production capacity excluding St. Marys (MT)(3)(6) | | 202 | | | 202 | |
Capacity utilization excluding St. Marys(5)(6) | | 82 | % | | 66 | % |
| | | | | | | | | | | | | | |
| | Year ended December 31, |
| (in thousands, except percentages) | | 2023 | | 2022 |
| Sales volume (MT) | | 91.6 | | | 149.1 | |
Production volume (MT)(1) | | 88.1 | | | 157.1 | |
Total production capacity(MT)(2)(3) | | 230.0 | | | 230.0 | |
Total capacity utilization(3)(4) | | 38 | % | | 68 | % |
Production capacity excluding St. Marys (MT)(2)(5) | | 202.0 | | | 202.0 | |
Capacity utilization excluding St. Marys(4)(5) | | 44 | % | | 78 | % |
(1) Sales volume reflects only graphite electrodes manufactured by GrafTech.
(2) Production volume reflects graphite electrodes we produced during the period.
(3)(2) Production capacity reflects expected maximum production volume during the period depending on product mix and expected maintenance outage. Actual production may vary.
(4)(3) Includes graphite electrode facilities in Calais, France; Monterrey, Mexico; Pamplona, Spain; and St. Marys, Pennsylvania. During the periods presented in this table, our St. Marys, Pennsylvania facility graphitized and machined a limited number of electrodes and pins sourced from our Monterrey, Mexico facility. The remaining production processes at St. Marys were restarted beginning in the second quarter of 2023. In the first quarter of 2024, in response to persistent softness in the commercial environment, we announced an indefinite suspension of production activities at St. Marys, with the exception of graphite electrode and pin machining.
(5)(4) Capacity utilization reflects production volume as a percentage of production capacity.
(6)(5) InIncludes graphite electrode facilities in Calais, France; Monterrey, Mexico; and Pamplona, Spain.
As of December 31, 2023, our stated production capacity was approximately 202 thousand MT through our primary manufacturing facilities in Calais, Pamplona and Monterrey. On February 14, 2024, the first quarterCompany announced a cost rationalization and footprint optimization plan, in response to persistent softness in the commercial environment. This includes an indefinite suspension of 2018,production activities at our St. Marys Pennsylvania facility, began graphitizingwith the exception of graphite electrode and pin machining. We are also indefinitely idling certain assets within our remaining graphite electrode manufacturing
footprint. As a limited amountresult of electrodes sourced fromthese initiatives, beginning in 2024, our Monterrey, Mexico facility.stated production capacity will be approximately 178 thousand MT.
Non-GAAP financial measures
In addition to providing results that are determined in accordance with GAAP, we have provided certain financial measures that are not in accordance with GAAP. EBITDA, adjusted EBITDA, adjusted net (loss) income, adjusted (loss) earnings per share, free cash flow, adjusted free cash flow and adjusted EPScash cost of goods sold per MT are non-GAAP financial measures.
We define EBITDA, a non‑GAAP financial measure, as net income or loss plus interest expense, minus interest income, plus income taxes and depreciation and amortization. We define adjusted EBITDA as EBITDA plus any pension and other post-employment benefit (OPEB)(“OPEB”) plan expenses or benefits, adjustments for public offerings and related expenses, non‑cash gains or losses from foreign currency remeasurement of non‑operating assets and liabilities in our foreign subsidiaries where the functional currency is the U.S. dollar, stock-based compensation expense, non-cash fixed asset write-offs, related party payable - tax receivable agreementTax Receivable Agreement adjustments stock-based compensation, non‑cash fixed asset write‑offs, value-added tax credit gains in Brazil and Change in Control charges that were triggered as a result of the ownership of our largest stockholder falling below 30% of our total outstanding shares. For purposes of this section, a "Change in Control" occurred when Brookfield and any affiliates thereof ceased to own stock of the Company that constitutes at least thirty percent (30%) or thirty-five percent (35%), as applicable, of the total fair market value or total voting power of the stock of the Company.goodwill impairment charges. Adjusted EBITDA is the primary metric used by our management and our Board of Directors to establish budgets and operational goals for managing our business and evaluating our performance.
We monitor adjusted EBITDA as a supplement to our GAAP measures, and believe it is useful to present to investors, because we believe that it facilitates evaluation of our period‑to‑period operating performance by eliminating items that are not operational in nature, allowing comparison of our recurring core business operating results over multiple periods unaffected by differences in capital structure, capital investment cycles and fixed asset base. In addition, we believe adjusted EBITDA and similar measures are widely used by investors, securities analysts, ratings agencies, and other parties in evaluating companies in our industry as a measure of financial performance and debt‑service capabilities.
Our use of adjusted EBITDA has limitations as an analytical tool, and you should not consider it in isolation or as a substitute for analysis of our results as reported under GAAP. Some of these limitations are:
•adjusted EBITDA does not reflect changes in, or cash requirements for, our working capital needs;
•adjusted EBITDA does not reflect our cash expenditures for capital equipment or other contractual commitments, including any capital expenditure requirements to augment or replace our capital assets;
•adjusted EBITDA does not reflect the interest expense or the cash requirements necessary to service interest or principal payments on our indebtedness;
•adjusted EBITDA does not reflect tax payments that may represent a reduction in cash available to us;
•adjusted EBITDA does not reflect expenses or benefits relating to our pension and OPEB plans;
•adjusted EBITDA does not reflect public offerings and related expenses;
•adjusted EBITDA does not reflect the non‑cash gains or losses from foreign currency remeasurement of non‑operating assets and liabilities in our foreign subsidiaries where the functional currency is the U.S. dollar;
•adjusted EBITDA does not reflect public offerings and related expenses;the non‑cash write‑off of fixed assets;
•adjusted EBITDA does not reflect related party payable - Tax Receivable Agreement adjustments;
•adjusted EBITDA does not reflect stock-based compensation or the non‑cash write‑off of fixed assets;
•adjusted EBITDA does not reflect gains on a value-added tax matter in Brazil;
•adjusted EBITDA does not reflect the Change in Controlgoodwill impairment charges; and
•other companies, including companies in our industry, may calculate EBITDA and adjusted EBITDA differently, which reduces its usefulness as a comparative measure.
We define adjusted net (loss) income, a non‑GAAP financial measure, as net (loss) income, or loss and excluding the items used to calculate adjusted EBITDA, less the tax effect of those adjustments. We define adjusted EPS,(loss) earnings per share, a non‑GAAP financial measure, as adjusted net (loss) income divided by the weighted average of diluted common shares outstanding during the period. We believe adjusted net (loss) income and adjusted EPS(loss) earnings per share are useful to present to investors because we believe that they assist investors’ understanding of the underlying operational profitability of the Company.
We define free cash flow, a non-GAAP financial measure, as net cash provided by operating activities less capital expenditures. We define adjusted free cash flow, a non-GAAP financial measure, as free cash flow adjusted by payments made or received from the settlement of interest rate swap contracts and payments of the Change in Control charges that were triggered as a result of the ownership of our largest stockholder falling below 30% of our total outstanding shares. We use free cash flow and adjusted free cash flow as critical measures in the evaluation of liquidity in conjunction with related GAAP amounts. We also use these measures when considering available cash, including for decision-making purposes related to dividends and discretionary investments. Further, these measures help management, the audit committee, and investors evaluate the Company's ability to generate liquidity from operating activities. For the purpose of this measure, a Change in Control occurred when Brookfield and any affiliates thereof ceased to own stock of the Company that constitutes at least thirty percent (30%) or thirty-five percent (35%), as applicable, of the total fair market value or total voting power of the stock of the Company (the "Change in Control").
We define cash cost of goods sold per MT, a non-GAAP financial measure, as cost of goods sold less depreciation and amortization and less cost of goods sold associated with the portion of our sales that consists of deliveries of by-products of the manufacturing processes, with this total divided by our sales volume measured in MT. We believe this is an important measure as it is used by our management and Board of Directors to evaluate our costs on a per MT basis.
In evaluating EBITDA, adjusted EBITDA, adjusted net (loss) income, adjusted (loss) earnings per share, free cash flow and adjusted EPS,free cash flow you should be aware that in the future, we will incur expenses similar to the adjustments in the reconciliationreconciliations presented below, other than the Change in Control charges.below. Our presentations of EBITDA, adjusted EBITDA, adjusted net (loss) income adjusted EPS,(loss) earnings per share, free cash flow and adjusted free cash flow should not be construed as suggesting that our future results will be unaffected by these expenses or any unusual or non‑recurring items. When evaluating our performance, you should consider EBITDA, adjusted EBITDA, adjusted net (loss) income, adjusted EPS,(loss) earnings per share, free cash flow and adjusted free cash flow alongside other measures of financial performance and liquidity, including our net (loss) income, (loss), EPS, earnings per share and cash flow from operating activities, respectively, and other GAAP measures.
The following table reconcilestables reconcile our non-GAAP key financial measures to the most directly comparable GAAP measures:
| | | | | | | | | | | | | | |
| Reconciliation of Net Income to Adjusted Net Income | | For the year ended December 31, |
| | 2021 | | 2020 |
| | |
| Net income | | $ | 388,330 | | | $ | 434,374 | |
| | | | |
| Diluted income per common share: | | | | |
| Net income per share | | $ | 1.46 | | | $ | 1.62 | |
| Weighted average shares outstanding | | 266,317,194 | | | 267,930,644 | |
| | | | |
| | | | |
| Net income | | $ | 388,330 | | | $ | 434,374 | |
| Adjustments, pre-tax: | | | | |
Pension and OPEB plan (benefits) expenses(1) | | (2,545) | | | 6,096 | |
Public offerings and related expenses(2) | | 663 | | | 264 | |
Non‑cash (gains) losses on foreign currency remeasurement(3) | | (119) | | | 1,297 | |
Stock-based compensation(4) | | 1,917 | | | 2,669 | |
Non‑cash fixed asset write‑off(5) | | 3,197 | | | 378 | |
Related party Tax Receivable Agreement adjustment(6) | | 231 | | | (21,090) | |
Change in Control LTIP award (7) | | 73,384 | | | — | |
Change in Control stock-based compensation acceleration (7) | | 14,713 | | | — | |
Brazil value-added tax credit (8) | | (11,511) | | | — | |
| Total non-GAAP adjustments pre-tax | | $ | 79,930 | | | $ | (10,386) | |
Income tax impact on non-GAAP adjustments (9) | | 3,675 | | | 1,476 | |
| Adjusted net income | | $ | 464,585 | | | $ | 422,512 | |
| | | | | | | | | | | | | | |
| Reconciliation of Net (Loss) Income to Adjusted Net (Loss) Income | | Year Ended December 31, |
| | 2023 | | 2022 |
| | (Dollars in thousands, except per share data) |
| Net (loss) income | | $ | (255,250) | | | $ | 382,962 | |
| | | | |
| Diluted (loss) income per common share: | | | | |
| Net (loss) income per share | | $ | (0.99) | | | $ | 1.48 | |
| Weighted average common shares outstanding | | 257,042,843 | | | 258,791,228 | |
| | | | |
| | | | |
| Net (loss) income | | $ | (255,250) | | | $ | 382,962 | |
| Adjustments, pre-tax: | | | | |
Pension and OPEB plan expenses (benefits)(1) | | 6,309 | | | (7,355) | |
Public offerings and related expenses(2) | | — | | | 100 | |
Non‑cash losses on foreign currency remeasurement(3) | | 603 | | | 521 | |
Stock-based compensation expense(4) | | 4,433 | | | 2,311 | |
Non‑cash fixed asset write‑off(5) | | — | | | 1,068 | |
Related party Tax Receivable Agreement adjustment(6) | | 249 | | | (83) | |
Goodwill impairment charges(7) | | 171,117 | | | — | |
| Total non-GAAP adjustments pre-tax | | $ | 182,711 | | | $ | (3,438) | |
Income tax impact on non-GAAP adjustments(8) | | 28,213 | | | (142) | |
| Adjusted net (loss) income | | $ | (100,752) | | | $ | 379,666 | |
(1)Net periodic (benefit)benefit cost (credit) for our pension and OPEB plans, including a mark-to-market loss (gain) loss,, representing actuarial gains and losses that result from the remeasurement of plan assets and obligations due to changes in assumptions or experience. We recognize in earnings the actuarial gains and losses in connection with the annual remeasurement in earnings in the fourth quarter of each year.
(2)Legal, accounting, printing and registration fees associated with the public offerings and related expenses.
(3)Non-cash (gains) losses from foreign currency remeasurement of non-operating assets and liabilities of our non-U.S. subsidiaries where the functional currency is the U.S. dollar.
(4)Non-cash expense for stock-based compensation grants.
(5)Non-cash fixed asset write-off recorded for obsolete assets.
(6)Non-cash expense adjustment for future payment to our sole pre-IPO stockholder for tax assets that are expected to be utilized.
(7)In the second quarter of 2021, we incurred Change in Control charges as a result of the ownership of our largest stockholder, Brookfield, moving below 30% of our shares outstanding.Non-cash goodwill impairment charges.
(8)Gain from the settlement of a value-added tax matter in Brazil.
(9)The tax impact on the non-GAAP adjustments is affected by their tax deductibility and the applicable jurisdictional tax rates.
| | | | | | | | | | | | | | |
| Reconciliation of EPS to Adjusted EPS | | | | |
| | For the year ended December 31, |
| | 2021 | | 2020 |
| | | | |
| EPS | | $ | 1.46 | | | $ | 1.62 | |
| Adjustments per share: | | | | |
Pension and OPEB plan (benefits) expenses (1) | | (0.01) | | | 0.03 | |
Public offerings and related expenses (2) | | — | | | — | |
Non-cash losses on foreign currency remeasurement (3) | | — | | | 0.01 | |
Stock-based compensation (4) | | — | | | 0.01 | |
Non-cash fixed asset write-off (5) | | 0.01 | | | — | |
Related party Tax Receivable Agreement adjustment (6) | | — | | | (0.08) | |
Change in Control LTIP award (7) | | 0.27 | | | — | |
Change in Control stock-based compensation acceleration (7) | | 0.06 | | | — | |
Brazil value-added tax credit (8) | | (0.04) | | | — | |
| Total non-GAAP adjustments pre-tax per share | | 0.29 | | | (0.03) | |
Income tax impact on non-GAAP adjustments per share (9) | | 0.01 | | | 0.01 | |
| Adjusted EPS | | $ | 1.74 | | | $ | 1.58 | |
| | | | | | | | | | | | | | |
| Reconciliation of (Loss) Earnings Per Share to Adjusted (Loss) Earnings Per Share | | | | |
| | Year Ended December 31, |
| | 2023 | | 2022 |
| | | | |
| (Loss) Earnings per share | | $ | (0.99) | | | $ | 1.48 | |
| Adjustments per share: | | | | |
Pension and OPEB plan expenses (benefits)(1) | | 0.02 | | | (0.03) | |
Public offerings and related expenses(2) | | — | | | — | |
Non‑cash losses on foreign currency remeasurement(3) | | — | | | — | |
Stock-based compensation expense(4) | | 0.02 | | | 0.01 | |
Non‑cash fixed asset write‑off(5) | | — | | | 0.01 | |
Related party Tax Receivable Agreement adjustment(6) | | — | | | — | |
Goodwill impairment charges(7) | | 0.67 | | | — | |
| Total non-GAAP adjustments pre-tax per share | | 0.71 | | | (0.01) | |
Income tax impact on non-GAAP adjustments per share(8) | | 0.11 | | | — | |
| Adjusted (Loss) Earnings per share | | $ | (0.39) | | | $ | 1.47 | |
(1)Net periodic (benefit)benefit cost (credit) for our pension and OPEB plans, including a mark-to-market loss (gain) loss,, representing actuarial gains and losses that result from the remeasurement of plan assets and obligations due to changes in assumptions or experience. We recognize in earnings the actuarial gains and losses in connection with the annual remeasurement in earnings in the fourth quarter of each year.
(2)Legal, accounting, printing and registration fees associated with the public offerings and related expenses.
(3)Non-cash losses from foreign currency remeasurement of non-operating assets and liabilities of our non-U.S. subsidiaries where the functional currency is the U.S. dollar.
(4)Non-cash expense for stock-based compensation grants.
(5)Non-cash fixed asset write-off recorded for obsolete assets.
(6)Non-cash expense adjustment for future payment to our sole pre-IPO stockholder for tax assets that are expected to be utilized.
(7)In the second quarter of 2021, we incurred Change in Control charges as a result of the ownership of our largest stockholder, Brookfield, moving below 30% of our total shares outstanding.Non-cash goodwill impairment charges.
(8)Gain from the settlement of a value-added tax matter in Brazil.
(9)The tax impact on the non-GAAP adjustments is affected by their tax deductibility and the applicable jurisdictional tax rates.
| | | | | | | | | | | | | | |
| Reconciliation of Net Income to Adjusted EBITDA | | For the year ended December 31, |
| | 2021 | | 2020 |
| | |
| Net income | | $ | 388,330 | | | $ | 434,374 | |
| Add: | | | | |
| | | | |
| Depreciation and amortization | | 65,716 | | | 62,963 | |
| Interest expense | | 68,760 | | | 98,074 | |
| Interest income | | (872) | | | (1,750) | |
| Income taxes | | 68,076 | | | 75,671 | |
| EBITDA | | 590,010 | | | 669,332 | |
| Adjustments: | | | | |
Pension and OPEB plan (benefits) expenses (1) | | (2,545) | | | 6,096 | |
| | | | |
Public offerings and related expenses (2) | | 663 | | | 264 | |
Non-cash (gains) losses on foreign currency remeasurement (3) | | (119) | | | 1,297 | |
Stock-based compensation (4) | | 1,917 | | | 2,669 | |
Non-cash fixed asset write-off (5) | | 3,197 | | | 378 | |
Related party Tax Receivable Agreement adjustment (6) | | 231 | | | (21,090) | |
Change in Control LTIP award (7) | | 73,384 | | | — | |
Change in Control stock-based compensation acceleration (7) | | 14,713 | | | — | |
Brazil value-added tax credit (8) | | (11,511) | | | — | |
| Adjusted EBITDA | | $ | 669,940 | | | $ | 658,946 | |
| | | | | | | | | | | | | | |
| Reconciliation of Net (Loss) Income to Adjusted EBITDA | | Year Ended December 31, |
| | 2023 | | 2022 |
| | (Dollars in thousands) |
| Net (loss) income | | $ | (255,250) | | | $ | 382,962 | |
| Add: | | | | |
| | | | |
| Depreciation and amortization | | 56,889 | | | 55,496 | |
| Interest expense | | 58,087 | | | 36,568 | |
| Interest income | | (3,439) | | | (4,480) | |
| Income taxes | | (18,514) | | | 69,356 | |
| EBITDA | | (162,227) | | | 539,902 | |
| Adjustments: | | | | |
Pension and OPEB plan expenses (benefits)(1) | | 6,309 | | | (7,355) | |
Public offerings and related expenses(2) | | — | | | 100 | |
Non‑cash losses on foreign currency remeasurement(3) | | 603 | | | 521 | |
Stock-based compensation expense(4) | | 4,433 | | | 2,311 | |
Non‑cash fixed asset write‑off(5) | | — | | | 1,068 | |
Related party Tax Receivable Agreement adjustment(6) | | 249 | | | (83) | |
Goodwill impairment charges(7) | | 171,117 | | | — | |
| Adjusted EBITDA | | $ | 20,484 | | | $ | 536,464 | |
(1)Net periodic (benefit)benefit cost (credit) for our pension and OPEB plans, including a mark-to-market loss (gain) loss,, representing actuarial gains and losses that result from the remeasurement of plan assets and obligations due to changes in assumptions or experience. We recognize in earnings the actuarial gains and losses in connection with the annual remeasurement in earnings in the fourth quarter of each year.
(2)Legal, accounting, printing and registration fees associated with the public offerings and related expenses.
(3)Non-cash (gains) losses from foreign currency remeasurement of non-operating assets and liabilities of our non-U.S. subsidiaries where the functional currency is the U.S. dollar.
(4)Non-cash expense for stock-based compensation grants.
(5)Non-cash fixed asset write-off recorded for obsolete assets.
(6)Non-cash expense adjustment for future payment to our sole pre-IPO stockholder for tax assets that are expected to be utilized.
(7)Non-cash goodwill impairment charges.
| | | | | | | | |
| Reconciliation of Net Cash Provided by Operating Activities to Free Cash Flow and Adjusted Free Cash Flow |
| Year Ended December 31, |
| 2023 | 2022 |
| (Dollars in thousands) |
| Net cash provided by operating activities | $ | 76,561 | | $ | 324,628 | |
| Capital expenditures | (54,040) | | (72,165) | |
| Free cash flow | 22,521 | | 252,463 | |
| | |
Interest rate swap settlements(1)(2) | 27,453 | | 6,423 | |
Change in Control payment(3) | — | | 443 | |
| Adjusted free cash flow | $ | 49,974 | | $ | 259,329 | |
(1) Receipt of cash related to the monthly settlement of our outstanding interest rate swap contracts.
(2) The year ended December 31, 2023 includes cash received from the termination of our interest rate swap contracts.
(3) In the second quarter of 2021, we incurred pre-tax Change in Control charges of $88 million as a result of the ownership of our largest stockholder, Brookfield, moving below 30% of our total shares outstanding. Of the $88 million in pre-tax Change in Control charges, $73 million were cash and $15 million were non-cash. An aggregate of $72 million of the cash charges have been paid through the fourth quarter of 2023 and an additional $1 million will be paid in subsequent quarters, as a result of the timing of related payroll tax payments.
(8)
Gain from the settlement of a value-added tax matter in Brazil.
Customer base
We are a global company and sell our products in every major geographic market. Sales of these products to buyers outside the United States accounted for approximately 79% of our net sales in both 2021 and 2020 and 77% in 2019.
In 2021, five of our 10 largest customers were based in Europe, three in the United States, one in Brazil and one in Mexico. However, seven of our 10 largest customers are multi-national operations.
The following table summarizes information as to our operations in different geographical areas:
| | | | | | | | | | | |
| For the year ended December 31, |
| (in thousands) | 2021 | | 2020 |
| Net sales: | | | |
| United States | $ | 285,710 | | | $ | 260,867 | |
| Americas (excluding the United States) | 241,442 | | | 187,779 | |
| Asia Pacific | 154,084 | | | 127,415 | |
| Europe, Middle East, Africa | 664,552 | | | 648,300 | |
| Total | $ | 1,345,788 | | | $ | 1,224,361 | |
| | | | | | | | |
| Reconciliation of Cost of Goods Sold to Cash Cost of Goods Sold per MT |
| Year Ended December 31, |
| 2023 | 2022 |
| (Dollars in thousands) |
| Cost of goods sold | $ | 571,857 | | $ | 726,373 | |
| Less: | | |
Depreciation and amortization(1) | 50,124 | | 48,680 | |
Cost of goods sold - by-products and other(2) | 14,500 | | 41,611 | |
| Cash cost of goods sold | 507,233 | | 636,082 | |
| Sales volume (in thousands of MT) | 91.6 | | 149.1 | |
| Cash cost of goods sold per MT | $ | 5,537 | | $ | 4,266 | |
In 2021,
nocustomer accounted for 10% or more
(1) Reflects the portion of depreciation and amortization that is recognized in cost of goods sold.
(2) Primarily reflects cost of goods sold associated with the portion of our net sales nor do we believe any customer poses a significant concentrationthat consists of risk, as sales to one customer could be replaced by demand from other customers.deliveries of by-products of the manufacturing processes.
Results of operationsOperations
Results of operations for 20212023 as compared to 20202022
The tables presented in our period-over-period comparisons summarize our Consolidated Statements of Operations and illustrate key financial indicators used to assess the consolidated financial results. Throughout our ManagementManagement’s Discussion and Analysis of Financial Condition and Results of Operations ("MD&A"), insignificant changes may be deemed not meaningful and are generally excluded from the discussion.
| | For the Year Ended December 31, | | Increase/ Decrease | | % Change |
| | Year Ended December 31, | | | | Year Ended December 31, | | Increase/ Decrease | | % Change |
| (in thousands) | (in thousands) | | 2021 | | 2020 | | Increase/ Decrease | | % Change |
| Net sales | Net sales | | $ | 1,345,788 | | | $ | 1,224,361 | | |
| Cost of sales | | 701,335 | | | 563,864 | | | 137,471 | | | 24 | % |
| Net sales | |
| Net sales | | | $ | 620,500 | | | $ | 1,281,250 | | | $ | (660,750) | | | (52) | % |
| Cost of goods sold | | Cost of goods sold | | 571,857 | | | 726,373 | | | (154,516) | | | (21) | % |
| Lower of cost or market inventory valuation adjustment | | Lower of cost or market inventory valuation adjustment | | 12,431 | | | — | | | 12,431 | | | NM |
| Gross profit | Gross profit | | 644,453 | | | 660,497 | | | (16,044) | | | (2) | % | Gross profit | | 36,212 | | | 554,877 | | 554,877 | | | (518,665) | | (518,665) | | | (93) | | (93) | % |
| Research and development | Research and development | | 3,771 | | | 3,975 | | | (204) | | | (5) | % | Research and development | | 5,520 | | | 3,641 | | 3,641 | | | 1,879 | | 1,879 | | | 52 | | 52 | % |
| Selling and administrative expenses | Selling and administrative expenses | | 132,608 | | | 67,913 | | | 64,695 | | | 95 | % | Selling and administrative expenses | | 74,012 | | | 76,977 | | 76,977 | | | (2,965) | | (2,965) | | | (4) | | (4) | % |
| Operating income | | 508,074 | | | 588,609 | | | (80,535) | | | (14) | % |
| Other (income) expense, net | | (16,451) | | | 3,330 | | | (19,781) | | | N/A |
| Related party Tax Receivable Agreement expense (benefit) | | 231 | | | (21,090) | | | 21,321 | | | N/A |
| Goodwill impairment charges | | Goodwill impairment charges | | 171,117 | | | — | | | 171,117 | | | NM |
| Operating (loss) income | | Operating (loss) income | | (214,437) | | | 474,259 | | | (688,696) | | | (145) | % |
| Other expense (income), net | | Other expense (income), net | | 4,679 | | | (10,147) | | | (14,826) | | | (146) | % |
| Interest expense | Interest expense | | 68,760 | | | 98,074 | | | (29,314) | | | (30) | % | Interest expense | | 58,087 | | | 36,568 | | 36,568 | | | 21,519 | | 21,519 | | | 59 | | 59 | % |
| Interest income | Interest income | | (872) | | | (1,750) | | | (878) | | | (50) | % | Interest income | | (3,439) | | | (4,480) | | (4,480) | | | (1,041) | | (1,041) | | | (23) | | (23) | % |
| Income before provision for income taxes | | 456,406 | | | 510,045 | | | (53,639) | | | (11) | % |
| Provision for income taxes | | 68,076 | | | 75,671 | | | (7,595) | | | (10) | % |
| Net income | | $ | 388,330 | | | $ | 434,374 | | | $ | (46,044) | | | (11) | % |
| (Loss) income before (benefit) provision for income taxes | | (Loss) income before (benefit) provision for income taxes | | (273,764) | | | 452,318 | | | (726,082) | | | (161) | % |
| (Benefit) provision for income taxes | | (Benefit) provision for income taxes | | (18,514) | | | 69,356 | | | (87,870) | | | (127) | % |
| Net (loss) income | | Net (loss) income | | $ | (255,250) | | | $ | 382,962 | | | $ | (638,212) | | | (167) | % |
NM = Not Meaningful.
Net sales.sales Net sales increased $121.4decreased $660.8 million, or 10%52%, from $1.2 billion in 2020compared to $1.3 billion in 2021. 2020 was impactedthe prior year, primarily reflecting lower sales volume driven by the then challenging market conditions. Stronger demand forresidual impact of the temporary suspension of our productsoperations in 2021 resultedMonterrey, Mexico in a 24% increase in sales volume compared to 2020. Partially offsetting the increased volume was a decrease in average realized sales prices. While the non-LTA prices increased throughout the year, the decrease in average realized sales prices reflects an increased percentage of non-LTA sales versus the prior year. Prices for non-LTA business reset on January 1,late 2022 and we expectindustry-wide softness in graphite electrode demand. A shift in the mix of our average first quarter 2022business from LTA volume to non-LTA volume and lower weighted-average realized prices also contributed to increase an additional 17 to 20% over the fourth quarter 2021.decline in net sales.
Cost of sales.goods sold Cost of sales increased $137.5decreased $154.5 million, or 24%21%, in 20212023 compared to 2020, driven2022, primarily reflecting lower sales volume. Reduced sales volume was partially offset by thean increase in sales volume of manufactured electrodes. Additionally, cost of sales in 2021 was impacted by a one-time long-term incentive plan ("LTIP") charge of $30.8 million resulting from a Change in Control after our largest stockholder's ownership of our common stock was reduced below 30% of our outstanding common stock (see Note 12, "Commitments and Contingencies," to the Consolidated Financial Statements for additional information). We expect our costs to increase in 2022, driven by recent global inflationary pressures, particularly for third party needle coke,on a per MT basis as higher priced inventory was sold during 2023, reflecting the full-year impact of raw material, energy and freight. While we are anticipating our first quarter 2022 costs to increase 7 to 9% over the fourth quarter 2021, we expect furtherfreight cost increases after the first quarter to be lower in magnitude as we continue to take steps to mitigate these cost increases.
Selling and administrative expenses. Selling and administrative expenses increased $64.7 million, or 95%, from $67.9 million in 2020 to $132.6 million in 2021 primarily due to the aforementioned Change in Control resulting in $42.6 million of one-time LTIP expense. Additionally, the Change in Control resulted in $12.9 million of one-time accelerated stock-based compensation expense.
Other (income) expense, net. Other (income) expense, net changed from an expense of $3.3 million in 2020 to an income generation of $16.5 million in 2021. This was primarily the result of an $11.5 million gain on a value-added tax matter in Brazil for which we received a beneficial ruling. Additionally, our annual pension and OPEB mark-to-market adjustment resulted in a benefit in 2021 of $3.9 million in 2021 compared to an expense of $3.2 million in 2020.that occurred throughout
2022. In addition, due to reduced production levels, we recorded fixed manufacturing costs of $62.4 million and $16.0 million that would have otherwise been inventoried for years ended December 31, 2023 and 2022, respectively.
Related party Tax Receivable Agreement expense (benefit).Lower of cost or market (“LCM”) inventory valuation adjustment Related party Tax Receivable Agreement expense (benefit) increased fromrepresents a benefitwrite-down of $21.1inventory recorded in 2023. The net realizable value of certain of our inventories fell below their carrying amounts as of December 31, 2023, and as a result, we recorded a LCM inventory valuation adjustment of $12.4 million in 2020order to anstate our inventories at market.
Selling and administrative expenses decreased $3.0 million, or 4%, in 2023 compared to 2022, primarily due to reduced selling expenses driven by reduced sales volumes.
Goodwill impairment charges includes non-recurring charges relating to goodwill. Refer to Note 6, “Goodwill and Other Intangible Assets,” to the Consolidated Financial Statements for additional discussion.
Other expense (income), net was expense of $0.2$4.7 million in 2021. The benefit recorded2023, compared to income of $10.1 million in 2020 resulted from the revision2022. 2023 included mark-to-market losses on our pension and OPEB plans of U.S. income estimates affecting the future usage$3.0 million, while 2022 included mark-to-market gains of our U.S. tax attributes, which are required to be reimbursed to Brookfield under the Tax Receivable Agreement.$9.6 million.
Interest expense.expense Interest expense decreased by $29.3increased $21.5 million, or 30%59%, from $98.1 million in 20202023 compared to $68.8 million in 2021,2022 primarily due to lower average borrowings as we repaid $400higher interest incurred on debt associated with our 2023 Senior Secured Notes that carry a fixed interest rate of 9.875%. In addition, there was a $6.4 million reduction of net gains recognized on our 2018 Term Loan Facility during 2021.interest rate swaps in 2023, compared to 2022. See Note 7, "Interest Expense," to the Consolidated Financial Statements for additional details.
Provision(Benefit) provision for income taxes.taxes. The following table summarizes the (benefit) provision for income taxes in 20212023 and 2020:2022:
| | | | | | | | | | | |
| | For the Year Ended December 31, 2021 | | For the Year Ended December 31, 2020 |
| | | | |
| Provision for income taxes | $ | 68,076 | | | $ | 75,671 | |
| Income before provision for income taxes | $ | 456,406 | | | $ | 510,045 | |
| Effective income tax rate | 14.9 | % | | 14.8 | % |
| | | | | | | | | | | |
| | Year Ended December 31, 2023 | | Year Ended December 31, 2022 |
| | | | |
| (Benefit) provision for income taxes | $ | (18,514) | | | $ | 69,356 | |
| (Loss) income before (benefit) provision for income taxes | $ | (273,764) | | | $ | 452,318 | |
| Effective income tax rate | 6.8 | % | | 15.3 | % |
The effective tax rateprovision for income taxes represented a benefit for the year ended December 31, 2021 was 14.9% and differs from the U.S. statutory tax rate of 21% primarily due2023 compared to worldwide earnings from various countries taxed at different rates, partially offset by the net combined impact related to the U.S. taxation of Global Intangible Low Tax Income ("GILTI") and Foreign Tax Credits ("FTC's"). As of December 31, 2021, the balance of our valuation allowance against deferred tax assets was $10.6 million and does not limit the Company's ability to utilize these tax assets in the future. We expect the effective tax rate in 2022 to be approximately 14-18%.
The provision for income taxes changed from $75.7 million, with an effective tax rate of 14.8%expense for the year ended December 31, 20202022. Total pre-tax earnings shifted from a profit position to a $68.1 million with a 14.9% effective rate for the year ended December 31, 2021. This change in effective tax rate is primarily due to the reduction in pre-tax incomeloss position and the mix of worldwide earnings from various countries taxed at different ratesCompany recorded a goodwill impairment charge that are offset by the U.S. taxation of GILTI and additionalis not tax on non-deductible compensation due to the Change in Control.deductible.
GrafTech has considered the tax impact of COVID-19 legislation, including the American Rescue Plan Act, and has concluded that there is no material tax impact. The Company continues to monitor the tax effects of any legislative changes.
Currency translationTranslation and transactionsTransactions
We translate the assets and liabilities of our non‑U.S. subsidiaries into U.S. dollars for consolidation and reporting purposes in accordance with the Financial Accounting Standards Board (“FASB”) Accounting Standards Codification (“ASC”) 830, Foreign Currency Matters. Foreign currency translation adjustments are generally recorded as part of stockholders’ equity and identified as part of accumulated other comprehensive loss on the Consolidated Balance Sheets until such time as their operations are sold or substantially or completely liquidated.
We account for our Russian, Swiss, Luxembourg, United Kingdom and Mexican subsidiaries using the U.S. dollar as the functional currency, as sales and purchases are predominantly U.S. dollar‑denominated. Our remaining subsidiaries use their local currency as their functional currency.
We also record foreign currency transaction gains and losses from non‑permanent intercompany balances as part of cost of salesgoods sold and other expense (income) expense,, net.
Significant changes in currency exchange rates impacting us are described under “—Effects of changesChanges in currency exchange rates”Currency Exchange Rates” and “—Results of operations”Operations” in this section.
Effects of Changes in Currency Exchange Rates
When the currencies of non‑U.S. countries in which we have a manufacturing facility decline (or increase) in value relative to the U.S. dollar, this has the effect of reducing (or increasing) the U.S. dollar equivalent cost of goods sold and other expenses with respect to those facilities. In certain countries in which we have manufacturing facilities, and in certain export
markets, we sell in currencies other than the U.S. dollar. Accordingly, when these currencies increase (or decline) in value relative to the U.S. dollar, this has the effect of increasing (or reducing) net sales. The result of these effects is to increase (or decrease) operating and net (loss) income.
Many of the non-U.S. countries in which we have a manufacturing facility have been subject to significant economic and political changes, which have significantly impacted currency exchange rates. We cannot predict changes in currency exchange rates in the future or whether those changes will have net positive or negative impacts on our net sales, cost of goods sold or net (loss) income.
The impact of these changes in the average exchange rates of other currencies against the U.S. dollar on our net sales was an increase of $1.5 million in 2023, a decrease of $11.7 million in 2022 and an increase of $5.5 million in 2021.
The impact of these changes in the average exchange rates of other currencies against the U.S. dollar on our cost of goods sold was an increase of $12.4 million in 2023, a decrease of $20.6 million in 2022 and an increase of $10.1 million in 2021.
As part of our cash management, we also have intercompany loans between our subsidiaries. These loans are deemed to be temporary and, as a result, remeasurement gains and losses on these loans are recorded as currency gains or losses in other expense (income), net on the Consolidated Statements of Operations.
We have in the past and may in the future use various financial instruments to manage certain exposures to risks caused by currency exchange rate changes, as described under “Quantitative and Qualitative Disclosures about Market Risk."
Liquidity and capital resourcesCapital Resources
Our sources of funds have consisted principally of cash flow from operations and debt, including our credit facilities (subject to continued compliance with the financial covenants and representations). Our uses of those funds (other than for operations) have consisted principally of dividends, capital expenditures, scheduled debt repayments, optional debt repayments, stock repurchases and other obligations.general purposes. Disruptions in the U.S. and international financial markets could adversely affect our liquidity and the cost and availability of financing to us in the future.
We believe that we have adequate liquidity to meet our needs for at least the next 12twelve months and for the foreseeable future.future thereafter. As of December 31, 2021,2023, we had liquidity of $304.2$289.3 million, consisting of $246.7$112.4 million of availability under our 2018 Revolving Credit Facility, (subjectafter giving effect to continued$3.1 million of letters of credit, and cash and cash equivalents of $176.9 million. As any borrowings under the 2018 Revolving Credit Facility remain subject to compliance with the financial covenantscovenant thereunder (see below and representations)Note 5, “Debt and cash and
cash equivalentsLiquidity”), our operating performance as of $57.5 million.December 31, 2023 resulted in a reduction of the availability under the facility. We do not anticipate the need to borrow against our 2018 Revolving Credit Facility. We had gross long-term debt of $1.0 billion$950.0 million and short-term debt of $0.1 million as of December 31, 2021.2023. As of December 31, 2020,2022, we had liquidity of $391.8$461.6 million, consisting of $246.4$327.0 million available under our 2018 Revolving Credit Facility, after giving effect to $3.0 million of letters of credit, and cash and cash equivalents of $145.4$134.6 million. We had gross long-term debt of $1.4 billion$933.8 million and short-term debt of $0.1 million as of December 31, 2020.2022.
As of December 31, 20212023 and 2020, $49.12022, $75.3 million and $114.6$92.3 million, respectively, of our cash and cash equivalents were located outside of the U.S. We repatriate funds from our foreign subsidiaries through dividends. All of our subsidiaries face the customary statutory limitation that distributed dividends do not exceed the amount of retained and current earnings. In addition, for our subsidiary in South Africa, the South Africa Central Bank imposes that certain solvency and liquidity ratios remain above defined levels after the dividend distribution, which historically has not materially affected our ability to repatriate cash from this jurisdiction. The cash and cash equivalents balances in South Africa were $0.5 million and $1.6 million as of December 31, 2021 and December 31, 2020, respectively. Upon repatriation to the United States, the foreign source portion of dividends we receive from our foreign subsidiaries is no longernot subject to U.S. federal income tax as a resultbecause the amounts were either previously taxed or are exempted from tax by Section 245A of the Tax Cuts and Jobs Act of 2017 ("Tax Act"Internal Revenue Service Code (the "Code").
Cash flow and plans to manage liquidity. Our cash flow typically fluctuates significantly between quarters due to various factors. These factors include customer order patterns, fluctuations in working capital requirements, timing of tax and interest payments and other factors. During the second quarter of 2023, GrafTech Global Enterprises Inc. issued $450 million of 2023 Senior Secured Notes. This transaction extended our debt maturities to 2028 as the net proceeds from this offering were used to repay the debt outstanding under the 2018 Term Loan Facility that was scheduled to mature in 2025 under our credit agreement. We had positive cash flow from operating activities during 2021, 2020 and 2019. Althougheach of the global economic environment experienced significant swings in these periods, our working capital management and cost‑control initiatives allowed us to remain operating cash‑flow positive in both timeslast three years.
Uses of declining and improving operating results. Cash from operations is expected to remain at positive sustained levels.Liquidity
As of December 31, 2021, we had total availability under the 2018 Revolving Credit Facility of $246.7 million after giving effect to $3.3 million of letters of credit. As of December 31, 2020, we had $3.6 million of letters of credit, for a total availability of $246.4 million under the 2018 Revolving Credit Facility.
We announced onIn July 31, 2019, that our Board of Directors authorized a program to repurchase up to $100$100.0 million of our outstanding common stock. In November 2021, our Board of Directors authorized the repurchase of an additional $150.0 million of stock repurchases under this program. We may purchase shares from time to time on the open market, including under Rule 10b5-1 and/or Rule 10b-18 plans. The amount and timing of repurchases are subject to a variety of factors including liquidity, stock
price, applicable legal requirements, other business objectives and market conditions. We repurchased 4.7 millionIn 2023, we did not repurchase any shares of our common stock. As of December 31, 2023, we had $99.0 million remaining under our stock forrepurchase authorization.
Throughout 2022 and through the second quarter of 2023, we paid a total purchase pricequarterly dividend of $50.0 million under this program during 2021. Additionally, on November 4, 2021, we announced that our$0.01 per share. On August 2, 2023, the Company’s Board of Directors authorized an additional $150 million of stock repurchases, bringing our total stock repurchase availabilityelected to $159.0 million, inclusive ofsuspend the amount remaining under the previous authorization
In December 2020, GrafTech Finance Inc. ("GrafTech Finance") issued $500 million aggregate principal amount the 2020 Senior Secured Notes in a private offering. The 2020 Senior Secured Notes and related guarantees are secured on a pari passu basis by the collateral securing the Senior Secured Credit Facilities. All of the proceeds from the 2020 Senior Secured Notes were used to partially repay borrowings under our 2018 Term Loan Facility.
We repaid an additional $400 million on our 2018 Term Loan Facility in both 2021 and 2020. We are committed to delivering value to our stockholders through our disciplined capital allocation strategy. In 2022, we will continue to focus on investing in our business, strengthening our balance sheet and making opportunistic purchases under the remaining $159.0 million stock repurchase authorization.
In February 2021, the Company entered into a second amendment (the "Second Amendment") to the 2018 Credit Agreement that decreased the Applicable Rate (as defined in the 2018 Credit Agreement) by 0.50% for each pricing level or (ii) the ABR Rate (as defined in the 2018 Credit Agreement), plus an applicable margin equal to 2.00% per annum following the Second Amendment, in each case with one step down of 25 basis points based on achievement of certain public ratings of the 2018 Term Loan Facility. The Second Amendment also decreased the interest rate floor from 1.0% to 0.50% for the 2018 Term Loan Facility.
Prior to April 2020, we had paid a quarterly cash dividend of $0.085 per share, or an aggregate of $0.34 per share on an annualized basis. In April 2020, as a result of the deteriorating economic environment, our Board of Directors reduced our dividend rate to $0.01 per share, or $0.04 per share on an annualized basis.share. There can be no assurance that we will payresume paying dividends in the future in these amounts or at all. Our Board of Directors may change the timing and amount of any future dividend payments, if reinstated, or eliminate the payment of future dividends in its sole discretion, without any prior notice to our stockholders. Our ability to pay dividends will depend upon many factors, including our financial position and liquidity, results of operations, legal requirements, restrictions that may be imposed by the terms of our current and future credit facilities and other debt obligations and other factors deemed relevant by our Board of Directors.
Potential uses of our liquidity (other than operations) include dividends, stock repurchases, capital expenditures, acquisitions, scheduled debt repayments, optional debt repaymentsdividends, share repurchases and other general purposes. Any such potential uses of our liquidity may be funded by existing available liquidity, the incurrence of new secured or unsecured loans or capital market issuances. An improving economy, while resulting in improved results of operations, could increase our cash requirements to purchase inventories, make capital expenditures and fund payables and other obligations until increased accounts receivable are converted into cash. A downturn, including any recession or potential resurgence of a global pandemic, could significantly and negatively impact our results of operations and cash flows, which, coupled with increased borrowings, could negatively impact our credit ratings, our ability to comply with debt covenants, our ability to secure additional financing and the cost and availability of such financing, if available.financing.
In order to seek to minimizereduce our credit risks, we may reduce our sales of, or refuse to sell (except for prepayment, cash on delivery or under letters of credit or parent guarantees), our products to some customers and potential customers. Our unrecovered trade receivables worldwide have not been material during the last two years individually or in the aggregate.
We manage our capital expenditures by taking into account quality, plant reliability, safety, environmental and regulatory requirements, prudent or essential maintenance requirements, global economic conditions, available capital resources, liquidity, long‑term business strategy and return on invested capital for the relevant expenditures, cost of capital and return on invested capital of the Company as a whole among other factors. Capital expenditures totaled $58.3$54.0 million in 2021.2023. We anticipate capital expenditures between $70$35.0 million and $80$40.0 million in 2022.2024.
In the event that operating cash flows fail to provide sufficient liquidity to meet our business needs, including capital expenditures, any such shortfall would needbe expected to be made up by increased borrowings under our 2018 Revolving Credit Facility, to the extent available. The Company also maintains access to credit and capital markets and may incur additional debt or issue equity securities from time to time, which may provide an additional source of liquidity. However, there can be no guarantee that we would be able to access the credit or capital markets on commercially satisfactory terms or at all.
Related Party Transactions
We have engaged in transactions with affiliates or related parties during 20202023 and 2021,2022 and we expect to continue to do so in the future. These transactions include ongoing obligations under the Tax Receivable Agreement, stockholders rights agreement, as amended, and registration rights agreement, each with Brookfield.
Cash flows
The following table summarizes our cash flow activities:
| | | |
| | |
| | |
| 2023 | |
| 2023 | |
| 2023 | |
| | | For the Year Ended December 31, | |
| | 2021 | | 2020 | |
| | | (Dollars in millions) | (Dollars in thousands) |
| Cash flow provided by (used in): | Cash flow provided by (used in): | | | |
| Operating activities | Operating activities | $ | 443.0 | | | $ | 563.6 | | |
| Operating activities | |
| Operating activities | |
| Investing activities | |
| Investing activities | |
| Investing activities | Investing activities | (57.9) | | | (35.7) | | |
| Financing activities | Financing activities | (471.8) | | | (463.7) | | |
| Financing activities | |
| Financing activities | |
| Net change in cash and cash equivalents | Net change in cash and cash equivalents | (86.6) | | | 64.3 | | |
| Net change in cash and cash equivalents | |
| Net change in cash and cash equivalents | |
Operating activities
Cash provided by operating activities totaled $443.0$76.6 million in the year ended December 31, 20212023 versus $563.6$324.6 million in the prior-year period. The decrease in operating cash-flowscash flow was primarily due to higher working capitala $638.2 million decrease in 2021 as compared to the prior year, driven by increased sales and higher production levels. In addition to the working capital change,net income, which included a non-cash goodwill impairment charge of $171.1 million in 2023. Partially offsetting reduced net income was an increase in cash from operating activities was negatively impacted by the $71 million one-time payment of the LTIP award triggered by the May 2021 Change in Control (see Note 12, "Commitments and Contingencies," to the Consolidated Financial Statements for additional information), partially offset by decreases versus the prior year in use of cash totaling $50 million for interest, tax payments, Tax Receivable Agreement payments and pension contributions.
The net impact of the changes in working capital (operating assets and liabilities), which are discussed in more detail below, include the impact of changes in: receivables, inventories, prepaid expenses, accounts payable, accrued liabilities, accrued taxes, interest payable and payments of other current liabilities.
In the year ended December 31, 2021, changes in working capital resulted in a net use of funds of $16.4 million, which was impacted by:
•use of funds in accounts receivable of $28.9 million due to the timing and increased level of sales;provided
•useby working capital of funds from increases in inventory of $28.2$207.1 million. Cash flow provided by inventories increased $261.4 million, compared to 2022, primarily driven by reduced quantities on hand. Cash flow provided by accounts receivable decreased $14.8 million, compared to 2022, primarily due primarily to increases in both the price and quantity of raw materials;
•net use of funds from increases in prepaid expenses and other current assets of $31.9 million resulting primarily from the timing of refunds of value-added taxes in certain foreign jurisdictions, including the receivable associated with the one-time Brazil value-added tax credit;
•source of funds of $5.7 million resulting from an increase in income taxes payable driven primarily by the timing of income tax payments in 2021; and
•source of funds of $66.6 million from increases inreduced sales volume. Cash flow used for accounts payable and other accruals primarily driven by increased purchases of raw materials resulting from higher levels of production and by the timing of payments.
Other useswas $23.9 million in 2023 compared to a source of cash of $7.7 million in the year ended December 31, 2021 included cash paid for interest of $56.3 million, cash paid for taxes of $63.8 million, cash paid for the Tax Receivable Agreement of $21.8 million and contributions to pension and other benefit plans of $4.2 million.
In the year ended December 31, 2020, changes in working capital resulted in a net source of funds of $86.4 million which was impacted by:
•net cash inflows in accounts receivable of $63.6 million from the decrease in accounts receivable2022 primarily due to lower sales;
•sourcea reduced amount of funds from decreasespurchases in inventory of $44.6 million from our efforts to reduce inventory due to the lower demand environment;
•use of funds of $12.4 million resulting from a decrease in income taxes payable driven primarily by the timing of income tax payments in 2020 and lower tax liabilities as a result of lower profitability; and
•use of funds of $12.8 million from decreases in accounts payable and other accruals primarily driven by decreased purchases of raw materials resulting from lower levels of production and timing of payments.
Other uses of cash in the year ended December 31, 2020 included cash paid for interest of $87.0 million, $74.0 million of cash paid for taxes, cash paid for the Tax Receivable Agreement of $27.8 million and contributions to pension and other benefit plans of $6.6 million.2023 versus 2022.
Investing activities
Net cash used in investing activities was $57.9$53.8 million in the year ended December 31, 20212023 compared to $35.7$72.0 million in the year ended December 31, 2020. The change is due to the increase in2022 primarily driven by decreased capital expenditures, as the 2020 spend had been lower due to the slowdown in production activity.expenditures.
Financing activities
Net cash outflow fromprovided by financing activities was $471.8$18.7 million during the year ended December 31, 2021,in 2023 compared to $463.7$176.3 million during the year ended December 31, 2020. Repayments of long-term debt amounted to $400.0 millionnet cash used in 2021, whichfinancing activities in 2022. The change was substantially similar to the amount in the prior year. Repurchases of our common stock were $50.0 million in 2021, compared to $30.1 million in the prior year. Dividends payments were $10.6 million in 2021, compared to $30.9 million in the prior year as the quarterly dividend was decreased from $0.085 to $0.01 per share effective the second quarter of 2020. Other uses of cash were up by approximately $5 million versus the prior year, primarily due to the paymentissuance of $450.0 million of 2023 Senior Secured Notes net of an $11.4 million original issue discount, the absence of $60.0 million of stock repurchases in 20212023 compared to 2022 and $21.0 million of taxes related toincreased cash received from the net share settlement of awards.interest rate swaps, partially offset by a $323.7 million increase in cash used to repay the 2018 Term Loan Facility.
Financing transactions
2018 Term Loan and 2018 Revolving Credit Facility
In February 2018, the Company entered into a credit agreement (as amended, the 2018"2018 Credit Agreement,Agreement"), which providesprovided for (i) the $2.3 billion 2018a $2,250 million senior secured term facility (the "2018 Term Loan FacilityFacility") after giving effect to the June 2018 amendment (the “First Amendment”) that increased the aggregate principal amount of the 2018 Term Loan Facility from $1.5 billion$1,500 million to $2.3 billion$2,250 million and (ii) a $330 million senior secured revolving credit facility after giving effect to the Third Amendment that increased the revolving commitments under the 2018 Credit Agreement by $80 million from $250 million 2018(the "2018 Revolving Credit Facility.Facility"). GrafTech Finance isInc. (“GrafTech Finance”) was the sole borrower under the 2018 Term Loan Facility while GrafTech Finance, GrafTech Switzerland SA (“Swissco”) and GrafTech Luxembourg II S.à.r.l. (“Luxembourg Holdco” and, together with GrafTech Finance and Swissco, the “Co-Borrowers”) are co-borrowers under the 2018 Revolving Credit Facility. The 2018 Revolving Credit Facility matures on May 31, 2027. The net proceeds from the 2023 Senior Secured Notes (as defined below) were used to repay outstanding borrowings under our 2018 Term Loan Facility. As of December 31, 2023 and 2022, the availability under our 2018 Revolving Credit Facility was $112.4 million and $327.0 million, respectively. As any borrowings under the 2018 Revolving Credit Facility matureremain subject to compliance with the financial covenant thereunder, our operating performance as of December 31, 2023 resulted in a reduction of the availability under the facility. As of December 31, 2023 and December 31, 2022, there were no borrowings outstanding on February 12, 2025 and February 12, 2023, respectively.
The 2018 Term Loan Facility bears interest, at our option, at a rate equal to either (i) the Adjusted LIBO Rate (as defined in the 2018 Revolving Credit Agreement), plus an applicable margin equal to 3.00% per annum following an amendment in
February 2021 (the “Second Amendment”) that decreased the Applicable Rate (as defined inFacility and there was $3.1 million and $3.0 million of letters of credit drawn against the 2018 Revolving Credit Agreement) by 0.50% forFacility as of each pricing level or (ii) the ABR Rate (as defined in the 2018 Credit Agreement), plus an applicable margin equal to 2.00% per annum following the Second Amendment, in each case with one step down of 25 basis points based on achievement of certain public ratings of the 2018 Term Loan Facility. The Second Amendment also decreased the interest rate floor from 1.0% to 0.50% for the 2018 Term Loan Facility.date, respectively.
The 2018 Revolving Credit Facility bears interest, at our option, at a rate equal to either (i) the Adjusted LIBOTerm SOFR Rate, and Adjusted EURIBOR Rate (each, as defined in the 2018 Credit Agreement), plus an applicable margin initially equal to 3.75%3.00% per annum or (ii) the ABR Rate, plus an applicable margin initially equal to 2.75%2.00% per annum, in each case with two 25 basis point step downs based on achievement of certain senior secured first lien net leverage ratios. In addition, we are required to pay a quarterly commitment fee on the unused commitments under the 2018 Revolving Credit Facility in an amount equal to 0.25% per annum.
The Senior Secured2018 Revolving Credit Facilities areFacility is guaranteed by each of our domestic subsidiaries, subject to certain customary exceptions, and by GrafTech Luxembourg I S.à.r.l., a Luxembourg société à responsabilité limitée and an indirect wholly owned subsidiary of GrafTech, Luxembourg HoldCo, and Swissco (collectively, the “Guarantors”) with respect to all obligations under the 2018 Revolving Credit AgreementFacility of each of our foreign subsidiaries that is a Controlled Foreign Corporation (within the meaning of Section 956 of the Internal Revenue Code of 1986, as amended from time to time (the “Code”)).
All obligations under the 2018 Revolving Credit AgreementFacility are secured, subject to certain exceptions, by: (i) a pledge of all of the equity securities of each domestic Guarantor and of each other direct, wholly owned domestic subsidiary of GrafTech and any Guarantor, (ii) a pledge on no more than 65% of the equity interests of each subsidiary that is a Controlled Foreign Corporation (within the meaning of Section 956 of the Code), and (iii) security interests in, and mortgages on, personal property and material real property of each domestic Guarantor, subject to permitted liens and certain exceptions specified in the 2018 Revolving Credit Agreement.Facility. The obligations of each foreign subsidiary of GrafTech that is a Controlled Foreign Corporation under the 2018 Revolving Credit Facility are secured by (i) a pledge of all of the equity securities of each Guarantor that is a Controlled Foreign Corporation and of each direct, wholly owned subsidiary of any Guarantor that is a Controlled Foreign
Corporation, and (ii) security interests in certain receivables and personal property of each Guarantor that is a Controlled Foreign Corporation, subject to permitted liens and certain exceptions specified in the 2018 Revolving Credit Agreement.Facility.
The 2018 Term LoanRevolving Credit Facility amortizes at a rate of $112.5 million a year payable in equal quarterly installments, with the remainder due at maturity. The Co-Borrowers are permitted to make voluntary prepayments at any time without premium or penalty. GrafTech Finance is required to make prepayments under the 2018 Term Loan Facility (without payment of a premium) with (i) net cash proceeds from non-ordinary course asset sales (subject to customary reinvestment rights and other customary exceptions and exclusions), and (ii) commencing with the Company’s fiscal year ended December 31, 2019, 75% of Excess Cash Flow (as defined in the 2018 Credit Agreement), subject to step-downs to 50% and 0% of Excess Cash Flow based on achievement of a senior secured first lien net leverage ratio greater than 1.25 to 1.00 but less than or equal to 1.75 to 1.00 and less than or equal to 1.25 to 1.00, respectively. Scheduled quarterly amortization payments of the 2018 Term Loan Facility during any calendar year reduce, on a dollar-for-dollar basis, the amount of the required Excess Cash Flow prepayment for such calendar year, and the aggregate amount of Excess Cash Flow prepayments for any calendar year reduce subsequent quarterly amortization payments of the 2018 Term Loan Facility as directed by GrafTech Finance. As of December 30, 2021, we have satisfied all required amortization installments through the maturity date.
The 2018 Credit Agreement contains customary representations and warranties and customary affirmative and negative covenants applicable to GrafTech and restricted subsidiaries, including, among other things, restrictions on indebtedness, liens, investments, fundamental changes, dispositions, and dividends and other distributions. The 2018 Revolving Credit AgreementFacility contains a financial covenant that requires GrafTech to maintain a senior secured first lien net leverage ratio not greater than 4.00:1.00 when the aggregate principal amount of borrowings under the 2018 Revolving Credit Facility and outstanding letters of credit issued under the 2018 Revolving Credit Facility (except for undrawn letters of credit in an aggregate amount equal to or less than $35 million), taken together, exceed 35% of the total amount of commitments under the 2018 Revolving Credit Facility. The 2018 Revolving Credit AgreementFacility also contains customary events of default. We were in compliance with all of our debt covenants as of December 31, 2023 and 2022.
2020 Senior Secured Notes
OnIn December 22, 2020, GrafTech Finance issued $500$500.0 million aggregate principal amount of the 2020 Senior Secured Notes at an issue price of 100% of the principal amount thereof in a private offering to qualified institutional buyers in accordance with Rule 144A under the Securities Act of 1933 (the "Securities Act") and to non-U.S. persons outside the United States under Regulation S under the Securities Act.
The 2020 Senior Secured Notes were issued pursuant to the indenture among GrafTech Finance, as issuer, the Company, as a guarantor, the other subsidiaries of the Company named therein as guarantors and U.S. Bank National Association, as trustee and notes collateral agent (the "Indenture").
The 2020 Senior Secured Notes are guaranteed on a senior secured basis by the Company and all of its existing and future direct and indirect U.S. subsidiaries that guarantee, or borrow under, the credit facilities under its 2018 Revolving Credit Agreement.Facility, other than GrafTech Finance. The 2020 Senior Secured Notes are secured on a pari passu basis by the collateral securing the term loansdebt under the 2018 Revolving Credit Agreement.Facility and the 2023 Senior Secured Notes. GrafTech Finance, the Company and the other guarantors granted a security interest in such collateral, consisting of substantially all of their respective assets, as security for the obligations of GrafTech Finance, the Company and the other guarantors under the 2020 Senior Secured Notes and the Indentureindenture governing the 2020 Senior Secured Notes (the “2020 Indenture”) pursuant to a collateral agreement, dated as of December 22, 2020 (the “Collateral Agreement”), among GrafTech Finance, the Company, the other subsidiaries of the Company named therein as grantors and U.S. Bank National Association, as collateral agent.
The 2020 Senior Secured Notes bear interest at the rate of 4.625% per annum, which accrues from December 22, 2020 and is payable in arrears on June 15 and December 15 of each year, commencing on June 15, 2021. The 2020 Senior Secured Notes will mature on December 15, 2028, unless earlier redeemed or repurchased, and are subject to the terms and conditions set forth in the 2020 Indenture.
GrafTech Finance may redeem some or all of the 2020 Senior Secured Notes at the redemption prices and on the terms specified in the 2020 Indenture. If the Company or GrafTech Finance experiences specific kinds of changes in control or the Company or any of its restricted subsidiaries sells certain of its assets, then GrafTech Finance must offer to repurchase the 2020 Senior Secured Notes on the terms set forth in the 2020 Indenture.
The 2020 Indenture contains certain covenants that, among other things, limit the Company’s ability, and the ability of certain of its subsidiaries, to incur or guarantee additional indebtedness or issue preferred stock, pay distributions on, redeem or repurchase capital stock or redeem or repurchase subordinated debt, incur or suffer to exist liens securing indebtedness, make certain investments, engage in certain transactions with affiliates, consummate certain asset sales and effect a consolidation or merger, or sell, transfer, lease or otherwise dispose of all or substantially all assets. The 2020 Indenture contains events of default customary for agreements of its type (with customary grace periods, as applicable) and provides that, upon the occurrence of an event of default arising from certain events of bankruptcy or insolvency with respect to the Company or GrafTech Finance, all outstanding 2020 Senior Secured Notes will become due and payable immediately without further action or notice. If any other type of event of default occurs and is continuing, then the trustee or the holders of at least 30% in principal amount of the then outstanding 2020 Senior Secured Notes may declare all of the 2020 Senior Secured Notes to be due and payable immediately. We were in compliance with all of our debt covenants as of December 31, 2023 and 2022.
2023 Senior Secured Notes
In June 2023, GrafTech Global Enterprises Inc. issued $450.0 million aggregate principal amount of 2023 Senior Secured Notes, including $11.4 million of original issue discount. The 2023 Senior Secured Notes were issued at an issue price of 97.456% of the principal amount thereof in a private offering to qualified institutional buyers in accordance with Rule 144A under the Securities Act and to non-U.S. persons outside the United States under Regulation S under the Securities Act.
The 2023 Senior Secured Notes are or will be, as applicable, guaranteed on a senior secured basis by (i) GrafTech Finance, (ii) the Company and all of its direct and indirect U.S. subsidiaries that, as of the date of the 2023 Senior Secured
Notes, guarantee (or are borrowers of) the debt under the 2018 Revolving Credit Facility, other than GrafTech Global Enterprises Inc., and (iii) all of the Company’s future direct and indirect subsidiaries that guarantee (or are borrowers of) debt under the 2018 Revolving Credit Facility, the 2020 Senior Secured Notes proceeds was used to pay downand certain other future indebtedness, in each case, other than certain excluded foreign subsidiaries and GrafTech Global Enterprises Inc. The 2023 Senior Secured Notes and the note guarantees are secured on a portionfirst-priority basis by liens on the collateral of ourGrafTech Global Enterprises Inc. and the U.S. guarantors securing the debt under the 2018 Term Loan Facility.
Fixed-rate obligations
As of December 31, 2021, we had $500 million of fixed-rate debt consisting of ourRevolving Credit Facility and the 2020 Senior Secured Notes, on an equal and $544 millionratable basis with the debt under the 2018 Revolving Credit Facility and 2020 Senior Secured Notes, in each case subject to permitted liens and certain exceptions, pursuant to a collateral agreement, dated as of variable-rate debt. AsJune 26, 2023 among GrafTech Global Enterprises Inc., the Company, the other subsidiaries of the Company named therein as grantors and U.S. Bank Trust Company, National Association, as collateral agent.
The 2023 Senior Secured Notes bear interest at a rate of 9.875% per annum which accrued from June 26, 2023 and is payable in arrears on June 15 and December 31, 2021, we have two remaining $250 million interest rate swap contracts that were modified in 202115 of each year, commencing on December 15, 2023. The 2023 Senior Secured Notes will mature on December 15, 2028, unless earlier redeemed or repurchased, and are subject to align with the terms of the 2018 Term Loan Facility, maturingindenture governing the 2023 Senior Secured Notes (the “2023 Indenture”).
GrafTech Global Enterprises Inc. may redeem some or all of the 2023 Senior Secured Notes at the redemption prices and on the terms specified in third quarterthe 2023 Indenture. If the Company or GrafTech Global Enterprises experiences specific kinds of 2024. Itchanges in control or the Company or any of its restricted subsidiaries sells certain of its assets, then GrafTech Global Enterprises Inc. must offer to repurchase the 2023 Senior Secured Notes on the terms set forth in the 2023 Indenture.
The 2023 Indenture contains certain covenants that, among other things, limit the Company’s ability, and the ability of certain of its subsidiaries, to incur or guarantee additional indebtedness or issue preferred stock, pay distributions on, redeem or repurchase capital stock or redeem or repurchase subordinated debt, incur or suffer to exist liens securing indebtedness, make certain investments, engage in certain transactions with affiliates, consummate certain asset sales and effect a consolidation or merger, or sell, transfer, lease or otherwise dispose of all or substantially all assets. The 2023 Indenture contains events of default customary for agreements of its type (with customary grace periods, as applicable) and provides that, upon the occurrence of an event of default arising from certain events of bankruptcy or insolvency with respect to the Company or GrafTech Global Enterprises Inc., all outstanding 2023 Senior Secured Notes will become due and payable immediately without further action or notice. If any other type of event of default occurs and is expected that these swaps will fixcontinuing, then the cash flows associated withtrustee or the forecasted interest payments on this notionalholders of at least 30% in principal amount of the then outstanding 2023 Senior Secured Notes may declare all of the 2023 Senior Secured Notes to be due and payable immediately. We were in compliance with all of our debt to an effective fixed interest ratecovenants as of 4.2%, which could be lowered to 3.95% depending on credit ratings. See Note 5, "Debt and Liquidity," to the Consolidated Financial Statements for details.December 31, 2023.
Material Cash Requirements. The following tables summarizetable summarizes our long-term contractual and other material cash obligations and commitments as of December 31, 2021:2023:
| | | | Payments Due by Year Ending December 31, | | Payments Due by Year Ending December 31, |
| | | Total | | 2022 | | 2023-2024 | | 2025-2026 | | 2027+ | | Total | | 2024 | | 2025-2026 | | 2027-2028 | | 2029+ |
| | | (Dollars in Thousands) | | (Dollars in Thousands) |
| Contractual and Other Obligations | Contractual and Other Obligations | |
| Long-term debt (a) | Long-term debt (a) | $ | 1,044,137 | | | $ | 143 | | | $ | 286 | | | $ | 543,708 | | | $ | 500,000 | |
| Long-term debt (a) | |
| Long-term debt (a) | |
| Interest on long-term debt (b) | Interest on long-term debt (b) | 236,009 | | | 46,367 | | | 93,930 | | | 49,783 | | | 45,929 | |
| | Total contractual obligations | Total contractual obligations | 1,280,146 | | | 46,510 | | | 94,216 | | | 593,491 | | | 545,929 | |
| Post-employment, pension and related benefits (c) | 120,865 | | | 11,995 | | | 25,401 | | | 24,833 | | | 58,636 | |
| | Related party Tax Receivable Agreement (d) | 19,283 | | | 3,828 | | | 9,808 | | | 5,647 | | | — | |
| Total contractual obligations | |
| Total contractual obligations | |
| Pension plan contributions (c) | |
| Committed purchase obligations (d) | |
| Related party Tax Receivable Agreement (e) | |
| | Total contractual and other obligations (e) | $ | 1,420,294 | | | $ | 62,333 | | | $ | 129,425 | | | $ | 623,971 | | | $ | 604,565 | |
| Total contractual and other obligations (f) | |
| | Total contractual and other obligations (f) | |
| | Total contractual and other obligations (f) | |
|
(a)Represents our total debt from our 2018 Term Loan Facility with an outstanding balance of $544 million, which matures on February 12, 2025, and from our 2020 Senior Secured Notes with an outstanding balance of $500$500.0 million due in 2028 and our 2023 Senior Secured Notes with an outstanding balance of $450.0 million due 2028 (see "Financing transactions" in this section for full details of these obligations).
(b)Represents estimated interest payments required on our 2018 Term Loan Facility using a monthly LIBOR curve through February 2025, net of interest rate swap impacts and estimated interest payments on the 2020 and 2023 Senior Secured Notes through December 15, 2028.
(c)Represents estimated post-employment,contributions under our defined benefit pension plans. Contributions in future periods will be dependent upon regulatory requirements, the plans' funded ratios, plan investment performance, discount rates, actuarial assumptions, plan amendments, our contribution objectives and related benefits obligations basedother factors. We anticipate funding those contributions with cash on actuarial calculations.hand or cash generated from operations. It is not practical to estimate the required contributions beyond 2024 at the present time.
(d)Represents committed purchases of raw materials.
(e)Represents Brookfield's right to receive future payments from us for 85% of the amount of cash savings, if any, in U.S. federal income tax and Swiss tax that we and our subsidiaries realize as a result of the utilization of certain tax assets attributable to periods prior to our IPO, including certain federal NOLs, previously taxed income under Section 959 of the Code, foreign tax credits, and certain NOLs in Swissco. In addition, we will pay interest on the payments we will make to Brookfield with respect to the amount of these cash savings from the due date (without extensions) of our tax return where we realize these savings to the payment date at a rate equal to LIBORthe one-month period secured overnight financing rate administered by the Federal Reserve Bank of New York plus 1.00%1.10% per annum. The term of the Tax Receivable Agreement commenced on April 23, 2018 and will continue until there is no potential for any future tax benefit payments.
(e)(f)In addition, letters of credit of $3.3$3.1 million were issued under the 2018 Revolving Credit Facility as of December 31, 2021.2023.
Costs Relating to Protection of the Environment
We have been and are subject to increasingly stringent environmental protection laws and regulations. In addition, we have an on‑going commitment to rigorous internal environmental protection standards. Environmental considerations are part of all significant operating and capital expenditure decisions. The following table sets forth certain information regarding environmental expenses and capital expenditures.
| | | | For the Year Ended December 31, | |
| 2021 | | 2020 | | 2019 | |
(Dollars in thousands) | | 2023 | |
| 2023 | |
| 2023 | |
| (Dollars in thousands) | |
| (Dollars in thousands) | |
| (Dollars in thousands) | |
| Expenses relating to environmental protection | Expenses relating to environmental protection | $ | 16,914 | | | $ | 11,075 | | | $ | 11,629 | | |
| Capital expenditures related to environmental protection | Capital expenditures related to environmental protection | 7,014 | | | 9,018 | | | 7,251 | | |
| Capital expenditures related to environmental protection | |
| Capital expenditures related to environmental protection | |
Critical accounting policies
Critical accounting policies are those that require difficult, subjective or complex judgments by management, often as a result of the need to make estimates about the effect of matters that are inherently uncertain and may change in subsequent periods. We use and rely on estimates in determining the economic useful lives of our assets, obligations under our employee benefit plans, provisions for doubtful accounts, provisions for restructuring charges and contingencies, tax valuation allowances, evaluation of goodwill, other intangible assets, pension and OPEB and various other recorded or disclosed amounts, including inventory valuations. Estimates require us to use our judgment. While we believe that our estimates for these matters are reasonable, if the actual amount is significantly different than the estimated amount, our assets, liabilities or results of operations may be overstated or understated. The following accounting policies are deemed to be critical.
Goodwill. As a resultGoodwill arises from the purchase price for acquired businesses exceeding the fair value of ourtangible and intangible assets acquired less assumed liabilities. The Company has two reporting units, Graphite Electrodes and Needle Coke. The acquisition of the Company by Brookfield we havein 2015 generated a significantgoodwill amount of goodwill. $171.1 million, which was allocated entirely to the Graphite Electrode reporting unit.
Goodwill is tested for impairment annually as of December 31 and between annual tests whenever events or circumstances indicate that the carrying value of a reporting unit may exceed its fair value. When reviewing goodwill for impairment, we first perform a qualitative assessment to determine whether it is more frequently if an eventlikely than not that the fair value of a reporting unit is less than its carrying value.
In performing a qualitative assessment, we consider business conditions and other factors including, but not limited to (i) adverse industry or circumstance indicateseconomic trends, (ii) lower projections that may impact future operating results, (iii) sustained decline in our share price and (iv) overall financial performance and other events affecting the reporting units. If we conclude that it is more likely than not that the fair value of a reporting unit is less than its carrying amount, then a quantitative impairment test is performed by estimating the fair value of the reporting unit and comparing it to its carrying value. If the carrying value of a reporting unit exceeds its fair value, we would record an impairment loss may have been incurred. charge equal to the excess of the carrying value of the reporting unit over its fair value.
Application of the goodwill impairment test requires judgment, including the identification of reporting units, assignment of assets and liabilities to reporting units, assignment of goodwill to reporting units and determination of the fair value of each reporting unit. We estimate the fair value of each reporting unit using a discounted cash flow methodology under the income approach. This requires us to use significant judgment including estimation of future cash flows, which is based
upon relevant market data, internal forecasts, estimation of the long‑term growth for our business the useful life over which cash flows will occur and determination of the weighted average cost of capital for purposes of establishing a discount rate.
For the 2023 annual impairment testing, the Company performed a quantitative assessment of the fair value of the reporting unit, using a combination of the income approach and the market approach (Level 3 in the fair value hierarchy) from a market participant’s perspective. The valuation of the Graphite Electrode reporting unit is performed with cash flows that are adjusted to present this reporting unit as purchasing petroleum needle coke entirely from third parties at anticipated market prices.
The income approach was based on discounted projected debt-free cash flows for the graphite electrode reporting unit. The forecast of cash flows included several assumptions regarding future sales growth, revenues, earnings before interest, taxes, depreciation and amortization (“EBITDA”), capital expenditures and working capital changes. In addition to the estimates of future cash flows, the income approach involves the determination of the discount rate based upon market participant’s assumptions.
The market approach fair value was based on valuation multiples that were applied to the graphite electrode reporting unit’s actual and projected EBITDA. The multiples were derived under the guideline public company method from analyzing market multiples of EBITDA for a group of comparable public companies. The techniques used in the Company’s assessment incorporate a number of assumptions that the Company believes to be reasonable and to reflect known market conditions at the measurement date.
Key assumptions relate to customer demand and sales growth, graphite electrode and needle coke pricing trends, operating costs and capital expenditures. Assumptions in estimating future cash flows are subject to a degree of judgement.
The testing determined that the fair value of the Graphite Electrode reporting unit was less than its carrying amount by more than the amount of goodwill. As a result, we recorded a full impairment charge of $171.1 million, which was recorded in Goodwill impairment charges in the Consolidated Statements of Income. The goodwill impairment was caused primarily by reduced sales of graphite electrodes due to softening demand and the deterioration of the electrode spot pricing.
For the 2022 and 2021 annual goodwill impairment testing, the Company performed a qualitative assessment first to determine whether it was more likely than not that the fair value of the Graphite Electrode reporting unit was less than its carrying amount. We assessed relevant events and circumstances, including industry, market and macroeconomic conditions, as well as Company and reporting unit-specific factors. Based on this review, we determined that it was not more likely than not that the fair value of the Graphite Electrode reporting unit was less than its carrying amount and concluded that the quantitative goodwill impairment test was not required. No impairment of goodwill resulted from our annual impairment tests in 2022 and 2021.
Refer to Note 1, "Business and Summary of Significant Accounting Policies" and Note 6, "Goodwill and Other Intangible Assets" to the Consolidated Financial Statements for information regarding our goodwill impairment testing.
Employee benefit plans. We sponsor various retirement and pension plans, including defined benefit and defined contribution plans and post-employment benefit plans that cover most employees worldwide. Excluding the defined contribution plans, accounting for these plans requires assumptions as to the discount rate, expected return on plan assets, expected salary increases and health care cost trend rate. See Note 11, "Retirement Plans and Post-employment Benefits," to the Consolidated Financial Statements for further details.
Impairments of long‑lived assets. We may record impairment losses on long‑lived assets used in operations when events and circumstances indicate that the assets might be impaired and the future undiscounted cash flows estimated to be
generated by those assets are less than the carrying amount of those assets. Assets to be disposed are reported at the lower of the carrying amount or fair value less estimated costs to sell. Estimates of the future cash flows are subject to significant uncertainties and assumptions. If the actual value is significantly less than the estimated fair value, our assets may be overstated. Future events and circumstances, some of which are described below, may result in an impairment charge:
•new technological developments that provide significantly enhanced benefits over our current technology;
•significant negative economic or industry trends;
•changes in our business strategy that alter the expected usage of the related assets; and
•future economic results that are below our expectations used in the current assessments.
As of December 31, 2023, we tested our long-lived assets for impairment and determined that their carrying value was recoverable.
Accounting for income taxes. We are required to estimate our income taxes in each of the jurisdictions in which we operate. This process requires us to make the following assessments:
•estimate our actual current tax liability in each jurisdiction;
•estimate our temporary differences resulting from differing treatment of items for tax and accounting purposes (which result in deferred tax assets and liabilities that we include within the Consolidated Balance Sheets); and
•assess the likelihood that our deferred tax assets will be recovered from future taxable income and, if we believe that recovery is not more likely than not, a valuation allowance is established.
If our estimates are incorrect, our deferred tax assets or liabilities may be overstated or understated.
As of December 31, 2021,2023, we had a valuation allowance of $10.6$9.0 million against certain deferred tax assets. Our losses in certain tax jurisdictions in recent periods represented sufficient negative evidence to require a full valuation allowance. We also have a partial valuation allowance related to certain U.S. state net operating losses where realizability is unlikely due to discontinued operations in these states. Until we determine that we will generate sufficient jurisdictional taxable income to realize our net operating losses and deferred tax assets, we continue to maintain a valuation allowance.
Related-party Tax Receivable Agreement. On April 23, 2018, the Company entered into the Tax Receivable Agreement, which provides Brookfield, as the sole pre-IPO stockholder, the right to receive future payments from us for 85% of the amount of cash savings, if any, in U.S. federal income tax and Swiss tax that we and our subsidiaries realize as a result of the utilization of certain tax assets attributable to periods prior to our IPO, including the pre-IPO Tax Assets. In addition, we will pay interest on the payments we will make to Brookfield with respect to the amount of these cash savings from the due date (without extensions) of our tax return where we realize these savings to the payment date at a rate equal to LIBO RateRthe one-month period secured overnight financing rate administered by the Federal Reserve Bank of New York plus 1.00% per annum.1.10%. The term of the Tax Receivable Agreement commenced on April 23, 2018 and will continue until there is no potential for any future tax benefit payments.
The calculation of the Tax Receivable Agreement liability requires significant judgment with regards to the assumptions underlying the forecast of future taxable income, in total and by jurisdiction, as well as their timing.
Revenue recognition. Revenue is recognized when a customer obtains control of promised goods, in an amount that reflects the consideration which we expect to receive in exchange for those goods.
To determine revenue recognition for arrangements that we determine are within the scope of ASC 606, the following five steps are performed: (i) identify the contract(s) with a customer; (ii) identify the performance obligations in the contract; (iii) determine the transaction price; (iv) allocate the transaction price to the performance obligations in the contract; and (v) recognize revenue when (or as) we satisfy a performance obligation. We only apply the five‑step model to contracts when it is probable that we will collect the consideration we are entitled to in exchange for the goods or services we transfer to the customer. At contract inception, once the contract is determined to be within the scope of ASC 606, we assess the goods or services promised within each contract and determine those that are performance obligations, and assess whether each promised good or service is distinct. We then recognize as revenue the amount of the transaction price that is allocated to the respective performance obligation when (or as) the performance obligation is satisfied.
From 2018 to the present, ourOur revenue streams primarily consistedconsist of LTAs and short‑term purchase orders (deliveries within the year) directly with steel manufacturers. The promises of delivery of graphite electrodes represent the distinct performance obligations to which the contract consideration is allocated, based upon the electrode stand‑alone selling prices for the class of customers at the time the agreements are executed. The performance obligations are considered to be satisfied at a point in time when control of the electrodes has been transferred to the customer. The Company has elected to treat the transportation of the electrodes from our premises to the customer’s facilities as a fulfillment activity, and outbound freight cost is accrued when the graphite electrode performance obligation is satisfied. Any variable consideration is recognized up to its
unconstrained amount (i.e., up to the amount for which it is probable that a significant reversal of the variable revenue will not happen).
Revenue recognition requires the estimation of the electrode stand-alone selling price, using a variety of inputs, from market observable information to internal pricing guidelines. The estimate of stand-alone selling price on the various classes of contracts is the basis for the allocation of revenue amongst periods for new and modified contracts. Historically the amount of contract assets and liabilities resulting from these estimates havehas been immaterial. See Note 2, "Revenue from Contracts with Customers," to the Consolidated Financial Statements for additional information.
Item 7A. Quantitative and Qualitative Disclosures About Market Risk
We are exposed to market risks, primarily from changes in interest rates, currency exchange rates, energy commodity prices and commercial energy rates. From time to time, we enter into transactions that have been authorized according to documented policies and procedures in order to manage these risks. These transactions primarily relate primarily to the financial instruments described below. Since the counterparties to these financial instruments are large commercial banks and similar financial institutions, we do not believe that we are exposed to material counterparty credit risk. We do not use financial instruments for trading purposes.
Our exposureIf we utilized our 2018 Revolving Credit Facility, we would be exposed to changes in interest rates results primarily from floatingrates. Our 2018 Revolving Credit Facility bears interest, at our option, at a rate long-term debt tied to LIBOReither (i) the Adjusted Term SOFR Rate and Adjusted EURIBOR Rate (each, as defined in the 2018 Credit Agreement), plus an applicable margin initially equal to 3.00% per annum or Euro London Interbank Offered Rate.(ii) the ABR Rate, plus an applicable margin initially equal to 2.00% per annum, in each case with two 25 basis point step downs based on achievement of certain senior secured first lien net leverage ratios.
Our exposure to changes in currency exchange rates results primarily from:
•sales made by our subsidiaries in currencies other than local currencies;
•raw material purchases made by our foreign subsidiaries in currencies other than local currencies; and
•investments in and intercompany loans to our foreign subsidiaries and our share of the earnings of those subsidiaries, to the extent denominated in currencies other than the U.S. dollar.
Our exposure to changes in energy commodity prices and commercial energy rates results primarily from the purchase or sale of refined oil products and the purchase of natural gas and electricity for use in our manufacturing operations.
Interest rate risk management. We periodically enterhave previously entered into agreements with financial institutions that arewere intended to limit our exposure to additional interest expense due to increases in variable interest rates. These instruments effectively capcapped our interest rate exposure. In 2019,As of December 31, 2023, we entered into fourdid not have any outstanding interest rate swap contracts, and in 2021, we modified three contracts and closed one contract.swaps. As of December 31, 2021,2022, we recorded an unrealized pre-tax gaingains of $5.9$27.4 million and a net unrealized pre-tax losson our interest rate swaps. As of $11.9 million as of December 31, 2020. Additionally, as a result of2023, we no longer had any variable rate debt outstanding and therefore no exposure to variability in interest rates. See Note 8, "Fair Value Measurements and Derivative Instruments" in the February 2021 modification,Notes to the modified swaps are considered hybrid instruments composed of a debt host and an embedded derivative. As of December 31, 2021, the debt host portion amounted to an unrealized pre-tax loss of $7.0 million which is amortized over the remaining life of the swaps.Consolidated Financial Statements for further discussion.
Currency rate management. We enter into foreign currency derivatives from time to time to attempt to manage exposure to changes in currency exchange rates. These foreign currency derivatives, which include, but are not limited to, forward exchange contracts and purchased currency options, attempt to hedge global currency exposures. Forward exchange contracts are agreements to exchange different currencies at a specified future date and at a specified rate. Purchased currency options are instruments which give the holder the right, but not the obligation, to exchange different currencies at a specified rate at a specified date or over a range of specified dates. Forward exchange contracts and purchased currency options are carried at fair value.
TheOur outstanding foreign currency derivatives represented a net unrealized pre-tax gain of $0.4$0.1 million as ofat December 31, 20212023 and a net unrealized pre-tax loss of $0.1$0.2 million as ofat December 31, 2020.2022.
Energy commodity management. We havepreviously entered into commodity derivative contracts to effectively fix some or all of our exposure to refined oil products. The outstandingAs of December 31, 2023 and 2022, there were no commodity derivative contracts represented net unrealized gain of $8.5 million and a net unrealized loss of $2.2 million as of December 31, 2021 and December 31, 2020, respectively.outstanding.
Sensitivity analysis. We use sensitivity analysis to quantify potential impacts that market rate changes may have on the underlying exposures as well as on the fair values of our derivatives. The sensitivity analysis for the derivatives represents the hypothetical changes in value of the hedge position and does not reflect the related gain or loss on the forecasted underlying transaction.
A hypothetical increase in interest rates of 100 basis points (1%) would have increased our interest expense by $0.3 million, net of the impact of our interest rate swap, for the year ended December 31, 2021. The same 100 basis points increase would have resulted in an increase of $11.3 million in fair value of our interest rate swap portfolio.
As of December 31, 2021,2023, a 10% appreciation or depreciation in the value of the U.S. dollar against foreign currencies from the prevailing market rates would result in a corresponding decrease of $7.3$2.0 million or a corresponding increase of $7.3$2.0 million, respectively, in the fair value of the foreign currency hedge portfolio.
A 10% increase or decrease in the value of the underlying commodity prices that we hedge would result in a corresponding increase or decrease of $1.9 million in the fair value of the commodity hedge portfolio as of December 31, 2021. Because of the high correlation between the hedging instrument and the underlying exposure, fluctuations in the value of the instruments are generally offset by reciprocal changes in the value of the underlying exposure.
For further information related to the financial instruments described above, see Note 1, "Business and Summary of Significant Accounting Policies" and Note 8, "Fair Value MeasurementMeasurements and Derivative Instruments" in the Notes to the Consolidated Financial Statements for additional information.
Item 8. Financial Statements and Supplementary Data
(Unless otherwise noted, all dollars are presented in thousands)
See the Table of Contents located at the beginning of this Report for more detailed page references to information contained in this Item.
REPORT OF INDEPENDENT REGISTERED PUBLIC ACCOUNTING FIRM
To the stockholders and the Board of Directors of GrafTech International Ltd.:
Opinions on the Financial Statements and Internal Control over Financial Reporting
We have audited the accompanying consolidated balance sheets of GrafTech International Ltd. and subsidiaries (the "Company") as of December 31, 20212023 and 2020,2022, the related consolidated statements of operations and comprehensive (loss) income, (loss), stockholders' equity (deficit), and cash flows for each of the three years in the period ended December 31, 2021,2023, and the related notes (collectively referred to as the “financial statements”). We also have audited the Company’s internal control over financial reporting as of December 31, 2021,2023, based on criteria established in Internal Control - Integrated Framework (2013) issued by the Committee of Sponsoring Organizations of the Treadway Commission (COSO).
In our opinion, the financial statements referred to above present fairly, in all material respects, the financial position of the Company as of December 31, 20212023 and 2020,2022, and the results of its operations and its cash flows for each of the three years in the period ended December 31, 2021,2023, in conformity with accounting principles generally accepted in the United States of America. Also, in our opinion, the Company maintained, in all material respects, effective internal control over financial reporting as of December 31, 2021,2023, based on criteria established in Internal Control - Integrated Framework (2013) issued by COSO.
Basis for Opinions
The Company’s management is responsible for these financial statements, for maintaining effective internal control over financial reporting, and for its assessment of the effectiveness of internal control over financial reporting, included in the accompanying Management’s Report on Internal Control Over Financial Reporting. Our responsibility is to express an opinion on these financial statements and an opinion on the Company’s internal control over financial reporting based on our audits. We are a public accounting firm registered with the Public Company Accounting Oversight Board (United States) (PCAOB) and are required to be independent with respect to the Company in accordance with the U.S. federal securities laws and the applicable rules and regulations of the Securities and Exchange Commission and the PCAOB.
We conducted our audits in accordance with the standards of the PCAOB. Those standards require that we plan and perform the audits to obtain reasonable assurance about whether the financial statements are free of material misstatement, whether due to error or fraud, and whether effective internal control over financial reporting was maintained in all material respects.
Our audits of the financial statements included performing procedures to assess the risks of material misstatement of the financial statements, whether due to error or fraud, and performing procedures to respond to those risks. Such procedures included examining, on a test basis, evidence regarding the amounts and disclosures in the financial statements. Our audits also included evaluating the accounting principles used and significant estimates made by management, as well as evaluating the overall presentation of the financial statements. Our audit of internal control over financial reporting included obtaining an understanding of internal control over financial reporting, assessing the risk that a material weakness exists, and testing and evaluating the design and operating effectiveness of internal control based on the assessed risk. Our audits also included performing such other procedures as we considered necessary in the circumstances. We believe that our audits provide a reasonable basis for our opinions.
Definition and Limitations of Internal Control over Financial Reporting
A company’s internal control over financial reporting is a process designed to provide reasonable assurance regarding the reliability of financial reporting and the preparation of financial statements for external purposes in accordance with generally accepted accounting principles. A company’s internal control over financial reporting includes those policies and procedures that (1) pertain to the maintenance of records that, in reasonable detail, accurately and fairly reflect the transactions and dispositions of the assets of the company; (2) provide reasonable assurance that transactions are recorded as necessary to permit preparation of financial statements in accordance with generally accepted accounting principles, and that receipts and expenditures of the company are being made only in accordance with authorizations of management and directors of the company; and (3) provide reasonable assurance regarding prevention or timely detection of unauthorized acquisition, use, or disposition of the company’s assets that could have a material effect on the financial statements.
Because of its inherent limitations, internal control over financial reporting may not prevent or detect misstatements. Also, projections of any evaluation of effectiveness to future periods are subject to the risk that controls may become inadequate because of changes in conditions, or that the degree of compliance with the policies or procedures may deteriorate.
Critical Audit Matter
The critical audit matter communicated below is a matter arising from the current-period audit of the financial statements that was communicated or required to be communicated to the audit committee and that (1) relates to accounts or disclosures that are material to the financial statements and (2) involved our especially challenging, subjective, or complex judgments. The communication of critical audit matters does not alter in any way our opinion on the financial statements, taken as a whole, and we are not, by communicating the critical audit matter below, providing a separate opinion on the critical audit matter or on the accounts or disclosures to which it relates.
Related Party Tax Receivable AgreementGoodwill - Refer to Notes 1 and 126 to the financial statements
Critical Audit Matter Description
On April 23, 2018,The Company’s evaluation of goodwill for impairment involves the Company entered into a Tax Receivable Agreement that provides the sole pre-IPO stockholder, the right to receive future payments from the Company for 85%comparison of the amountfair value of cash savings, if any, in U.S. federaleach reporting unit to its carrying value. The Company determines the fair value of its reporting units using the income tax and Swiss Federal and Cantonal tax that the Company and subsidiaries realize as a result of the utilization of certain deferred tax assets attributable to periods prior to the IPO. The Company’s Tax Receivable Agreement liability was $19.3 million as of December 31, 2021.market approaches. The determination of the Tax Receivable Agreement liability requiredfair value using the income approach requires management to make significant estimates and assumptions related to forecastedforecasts of future revenues, earnings before interest, taxes, depreciation, and taxable income in the appropriate taxing jurisdiction, which are the primary drivers of utilizationamortization (EBITDA), capital expenditures, and discount rates. The determination of the deferred tax assets.
Givenfair value using the market approach requires management to make significant estimates and assumptions related to the forecasts of future revenues, EBITDA, and multiples that are applied to management’s forecasted revenuesEBITDA estimates. The goodwill balance of $171.1 million as of December 31, 2023, which entirely related to the Graphite Electrode reporting unit, was fully impaired as part of the Company’s annual assessment and taxable incomean impairment charge of $171.1 million was recorded within the Consolidated Statement of Operations for the year ended December 31, 2023.
Given the nature of the reporting unit’s operations, the sensitivity of the reporting unit to changes in the appropriate jurisdictions,economy, the reporting unit’s historical performance, and the difference between its fair value and the carrying value, auditing management’s judgments regarding forecasts of future revenues, EBITDA, and capital expenditures, as well as the Tax Receivable Agreement liabilityselection of the discount rate and the multiples applied to management’s forecasted EBITDA estimates for the reporting unit, required a high degree of auditor judgment and an increased extent of effort, including the need to involve our income taxfair value specialists.
How the Critical Audit Matter Was Addressed in the Audit
Our audit procedures related to forecastedthe forecasts of future revenues and taxable incomeEBITDA (“forecasts”), and the selection of the discount rate and selection of multiples applied to management’s forecasted EBITDA estimates (“market multiples”) for the Graphite Electrode reporting unit included the following, among others:
•TestedWe tested the effectiveness of controls over management’s goodwill impairment evaluation, such as controls related to management’s forecasts and the calculation and recordingselection of the Tax Receivable Agreement liability, including those over the forecasts of revenuesdiscount rate and taxable income.
•With the assistance of our income tax specialists, we evaluated whether the sources of management’s estimated taxable income were of the appropriate character and sufficient to utilize the deferred tax assets under the relevant tax law and tested the mathematical accuracy of the calculation used to determine the Tax Receivable Agreement liability.market multiples used.
•We evaluated management’s ability to accurately estimate revenues and taxable incomeforecast by comparing actual results to management’s historical estimates and evaluating whether there have been any changes that would affect management’s ability to continue accurately estimating revenues and taxable income.forecasts.
•We testedevaluated the reasonableness of management’s estimates of revenues and taxable income by jurisdictionforecasts by comparing management’s forecast to:
◦Historical revenues and income
◦Schedule of future revenues resulting from contracts with certain customers
◦Internalthe current forecasts to (1) historical results, (2) internal communications to management and the Board of Directors,
◦Industry and (3) forecasted information included in industry reports for the Company andvarious industries the steel industryreporting unit operates within.
•WeWith the assistance of our fair value specialists, we evaluated whether the estimates of future revenuesdiscount rate, including testing the underlying source information and taxable income were consistent with evidence obtained in other areasthe mathematical accuracy of the audit.calculations, and developing a range of independent estimates and comparing those to the discount rate selected by management.
•With the assistance of our fair value specialists, we evaluated the market multiples by evaluating the selected comparable publicly traded companies and the adjustments made for differences in growth prospects and risk profiles between the reporting unit and the comparable publicly traded companies. We tested the underlying source information and mathematical accuracy of the calculations.
/s/ DELOITTE & TOUCHE LLP
Cleveland, Ohio
February 22, 202214, 2024
We have served as the Company’s auditor since 2015.
GRAFTECH INTERNATIONAL LTD. AND SUBSIDIARIES
CONSOLIDATED BALANCE SHEETS
(Dollars in thousands, except share data)
| | As of December 31, |
| 2021 | | 2020 |
| December 31, | | | December 31, |
| 2023 | | | 2023 | | 2022 |
| ASSETS | ASSETS | | | |
| Current assets: | Current assets: | |
| Current assets: | |
| Current assets: | |
| Cash and cash equivalents | Cash and cash equivalents | $ | 57,514 | | | $ | 145,442 | |
| Accounts and notes receivable, net of allowance for doubtful accounts of $6,835 as of December 31, 2021 and $8,243 as of December 31, 2020 | 207,547 | | | 182,647 | |
| Cash and cash equivalents | |
| Cash and cash equivalents | |
| Accounts and notes receivable, net of allowance for doubtful accounts of $7,708 as of December 31, 2023 and $8,019 as of December 31, 2022 | |
| Inventories | Inventories | 289,432 | | | 265,964 | |
| Prepaid expenses and other current assets | Prepaid expenses and other current assets | 73,364 | | | 35,114 | |
| | Total current assets | |
| Total current assets | |
| Total current assets | Total current assets | 627,857 | | | 629,167 | |
| Property, plant and equipment | Property, plant and equipment | 815,298 | | | 784,902 | |
| Less: accumulated depreciation | Less: accumulated depreciation | 313,825 | | | 278,685 | |
| Net property, plant and equipment | Net property, plant and equipment | 501,473 | | | 506,217 | |
| Deferred income taxes | Deferred income taxes | 26,187 | | | 32,551 | |
| Goodwill | Goodwill | 171,117 | | | 171,117 | |
| Other assets | Other assets | 85,684 | | | 93,660 | |
| Total assets | Total assets | $ | 1,412,318 | | | $ | 1,432,712 | |
| LIABILITIES AND STOCKHOLDERS’ EQUITY (DEFICIT) | | | |
| LIABILITIES AND STOCKHOLDERS’ EQUITY | |
| Current liabilities: | |
| Current liabilities: | |
| Current liabilities: | Current liabilities: | |
| Accounts payable | Accounts payable | $ | 117,112 | | | $ | 70,989 | |
| Short-term debt | 127 | | | 131 | |
| Accounts payable | |
| Accounts payable | |
| Long-term debt, current maturities | |
| Accrued income and other taxes | Accrued income and other taxes | 57,097 | | | 48,720 | |
| Other accrued liabilities | Other accrued liabilities | 56,405 | | | 56,501 | |
| | Related party payable - tax receivable agreement | 3,828 | | | 21,752 | |
| Related party payable - Tax Receivable Agreement | |
| Total current liabilities | Total current liabilities | 234,569 | | | 198,093 | |
| Long-term debt | Long-term debt | 1,029,561 | | | 1,420,000 | |
| Other long-term obligations | Other long-term obligations | 68,657 | | | 81,478 | |
| Deferred income taxes | Deferred income taxes | 40,674 | | | 43,428 | |
| Related party payable - tax receivable agreement long-term | 15,455 | | | 19,098 | |
| | Related party payable - Tax Receivable Agreement long-term | |
| Commitments and contingencies – Note 12 | Commitments and contingencies – Note 12 | 0 | | 0 | Commitments and contingencies – Note 12 | | | |
| Stockholders’ equity (deficit): | |
| Stockholders’ equity: | |
| Preferred stock, par value $0.01, 300,000,000 shares authorized, none issued | Preferred stock, par value $0.01, 300,000,000 shares authorized, none issued | — | | | — | |
| Common stock, par value $0.01, 3,000,000,000 shares authorized, 263,255,708 and 267,188,547 shares issued and outstanding as of December 31, 2021 and December 31, 2020, respectively | 2,633 | | | 2,672 | |
| Additional paid – in capital | 761,412 | | | 758,354 | |
| Preferred stock, par value $0.01, 300,000,000 shares authorized, none issued | |
| Preferred stock, par value $0.01, 300,000,000 shares authorized, none issued | |
| Common stock, par value $0.01, 3,000,000,000 shares authorized, 256,831,870 and 256,597,342 shares issued and outstanding as of December 31, 2023 and December 31, 2022, respectively | |
| Additional paid-in capital | |
| Accumulated other comprehensive loss | Accumulated other comprehensive loss | (7,444) | | | (19,641) | |
| Accumulated deficit | Accumulated deficit | (733,199) | | | (1,070,770) | |
| Total stockholders’ equity (deficit) | 23,402 | | | (329,385) | |
| | Total stockholders’ equity | |
| Total liabilities and stockholders’ equity | Total liabilities and stockholders’ equity | $ | 1,412,318 | | | $ | 1,432,712 | |
|
See accompanying Notes to the Consolidated Financial Statements
GRAFTECH INTERNATIONAL LTD. AND SUBSIDIARIES
CONSOLIDATED STATEMENTS OF OPERATIONS AND COMPREHENSIVE (LOSS) INCOME (LOSS)
(Dollars in thousands, except per share data)
| | | | | | | | | | | | | | | | | |
| | For the Year Ended December 31, |
| | 2021 | | 2020 | | 2019 |
| STATEMENTS OF OPERATIONS | | | | |
| Net sales | $ | 1,345,788 | | | $ | 1,224,361 | | | $ | 1,790,793 | |
| Cost of sales | 701,335 | | | 563,864 | | | 750,390 | |
| | | | | |
| Gross profit | 644,453 | | | 660,497 | | | 1,040,403 | |
| Research and development | 3,771 | | | 3,975 | | | 2,684 | |
| Selling and administrative expenses | 132,608 | | | 67,913 | | | 63,674 | |
| | | | | |
| Operating income | 508,074 | | | 588,609 | | | 974,045 | |
| | | | | |
| Other (income) expense, net | (16,451) | | | 3,330 | | | 5,203 | |
| Related party Tax Receivable Agreement expense (benefit) | 231 | | | (21,090) | | | 3,393 | |
| Interest expense | 68,760 | | | 98,074 | | | 127,331 | |
| Interest income | (872) | | | (1,750) | | | (4,709) | |
| Income before provision for income taxes | 456,406 | | | 510,045 | | | 842,827 | |
| Provision for income taxes | 68,076 | | | 75,671 | | | 98,225 | |
| | | | | |
| | | | | |
| | | | | |
| | | | | |
| Net income | $ | 388,330 | | | $ | 434,374 | | | $ | 744,602 | |
| | | | | |
| Basic income per common share: | | | | | |
| Net income per share | $ | 1.46 | | | $ | 1.62 | | | $ | 2.58 | |
| Weighted average common shares outstanding | 266,251,097 | | 267,916,483 | | 289,057,356 |
| Diluted income per common share: | | | | | |
| Net income per share | 1.46 | | | 1.62 | | | 2.58 | |
| | | | | |
| Weighted average common shares outstanding | 266,317,194 | | | 267,930,644 | | | 289,074,601 | |
| | | | | |
| STATEMENTS OF COMPREHENSIVE INCOME (LOSS) | | | | |
| Net income | $ | 388,330 | | | $ | 434,374 | | | $ | 744,602 | |
| Other comprehensive income (loss): | | | | | |
Foreign currency translation adjustments, net of tax of $0, $(162), and $(67), respectively | (19,605) | | | 6,568 | | | (6,371) | |
Commodities and interest rate derivatives, net of tax of $(8,632), $5,399, and $(1,546), respectively | 31,802 | | | (18,848) | | | 4,810 | |
| Other comprehensive income (loss), net of tax: | 12,197 | | | (12,280) | | | (1,561) | |
| Comprehensive income | $ | 400,527 | | | $ | 422,094 | | | $ | 743,041 | |
| | | | | | | | | | | | | | | | | |
| | Year Ended December 31, |
| | 2023 | | 2022 | | 2021 |
| STATEMENTS OF OPERATIONS | | | | |
| Net sales | $ | 620,500 | | | $ | 1,281,250 | | | $ | 1,345,788 | |
| Cost of goods sold | 571,857 | | | 726,373 | | | 701,335 | |
| Lower of cost or market inventory valuation adjustment | 12,431 | | | — | | | — | |
| Gross profit | 36,212 | | | 554,877 | | | 644,453 | |
| Research and development | 5,520 | | | 3,641 | | | 3,771 | |
| Selling and administrative expenses | 74,012 | | | 76,977 | | | 132,608 | |
| Goodwill impairment charges | 171,117 | | | — | | | — | |
| Operating (loss) income | (214,437) | | | 474,259 | | | 508,074 | |
| | | | | |
| Other expense (income), net | 4,679 | | | (10,147) | | | (16,220) | |
| Interest expense | 58,087 | | | 36,568 | | | 68,760 | |
| Interest income | (3,439) | | | (4,480) | | | (872) | |
| (Loss) income before (benefit) provision for income taxes | (273,764) | | | 452,318 | | | 456,406 | |
| (Benefit) provision for income taxes | (18,514) | | | 69,356 | | | 68,076 | |
| Net (loss) income | $ | (255,250) | | | $ | 382,962 | | | $ | 388,330 | |
| | | | | |
| Basic (loss) income per common share: | | | | | |
| Net (loss) income per share | $ | (0.99) | | | $ | 1.48 | | | $ | 1.46 | |
| Weighted average common shares outstanding | 257,042,843 | | 258,781,843 | | 266,251,097 |
| Diluted (loss) income per common share: | | | | | |
| Net (loss) income per share | (0.99) | | | 1.48 | | | 1.46 | |
| Weighted average common shares outstanding | 257,042,843 | | | 258,791,228 | | | 266,317,194 | |
| | | | | |
| STATEMENTS OF COMPREHENSIVE (LOSS) INCOME | | | | |
| Net (loss) income | $ | (255,250) | | | $ | 382,962 | | | $ | 388,330 | |
| Other comprehensive income (loss): | | | | | |
Foreign currency translation adjustments, net of tax of $(8), $0 and $0, respectively | 10,166 | | | (7,024) | | | (19,605) | |
Commodities, interest rate and foreign currency derivatives, net of tax of $4,424, $(2,591) and $(8,632), respectively | (13,554) | | | 6,398 | | | 31,802 | |
| Other comprehensive (loss) income, net of tax: | (3,388) | | | (626) | | | 12,197 | |
| Comprehensive (loss) income | $ | (258,638) | | | $ | 382,336 | | | $ | 400,527 | |
See accompanying Notes to the Consolidated Financial Statements
GRAFTECH INTERNATIONAL LTD. AND SUBSIDIARIES
CONSOLIDATED STATEMENTS OF CASH FLOWS
(Dollars in thousands)
| | | | For the Year Ended December 31, | | Year Ended December 31, |
| 2021 | | 2020 | | 2019 |
| 2023 | | | 2023 | | 2022 | | 2021 |
| Cash flow from operating activities: | Cash flow from operating activities: | | | | | |
| Net income | $ | 388,330 | | | $ | 434,374 | | | $ | 744,602 | |
Adjustments to reconcile net income
to cash provided by operations: | |
| Net (loss) income | |
| Net (loss) income | |
| Net (loss) income | |
| Adjustments to reconcile net (loss) income to cash provided by operations: | |
| Depreciation and amortization | Depreciation and amortization | 65,716 | | | 62,963 | | | 61,819 | |
| | Related party Tax Receivable Agreement Expense (benefit) | 231 | | | (21,090) | | | 3,393 | |
| | Deferred income tax provision | (3,657) | | | 20,241 | | | 17,503 | |
| Loss on extinguishment of debt | — | | | 8,329 | | | — | |
| Stock-based compensation | 16,631 | | | 2,665 | | | 2,146 | |
| Interest expense | 12,051 | | | 6,192 | | | 6,344 | |
| | Other charges, net | 7,107 | | | 7,861 | | | 19,685 | |
| Depreciation and amortization | |
| Depreciation and amortization | |
| Deferred income tax (benefit) provision | |
| Non-cash stock-based compensation expense | |
| Non-cash interest expense | |
| Goodwill impairment charges | |
| Lower of cost or market inventory valuation adjustment | |
| Other adjustments | |
| Net change in working capital* | Net change in working capital* | (16,377) | | | 86,438 | | | (47,687) | |
| Change in related party tax receivable agreement | (21,799) | | | (27,857) | | | — | |
| Change in related party Tax Receivable Agreement | |
| Change in long-term assets and liabilities | Change in long-term assets and liabilities | (5,193) | | | (16,470) | | | (2,489) | |
| Net cash provided by operating activities | Net cash provided by operating activities | 443,040 | | | 563,646 | | | 805,316 | |
| Cash flow from investing activities: | Cash flow from investing activities: | |
| Capital expenditures | Capital expenditures | (58,257) | | | (36,075) | | | (64,103) | |
| | Capital expenditures | |
| Capital expenditures | |
| Proceeds from the sale of fixed assets | Proceeds from the sale of fixed assets | 397 | | | 379 | | | 219 | |
| Net cash used in investing activities | Net cash used in investing activities | (57,860) | | | (35,696) | | | (63,884) | |
| Cash flow from financing activities: | Cash flow from financing activities: | |
| Short-term debt reductions, net | (142) | | | (146) | | | — | |
| | Interest rate swap settlements | |
| Interest rate swap settlements | |
| Interest rate swap settlements | |
| Debt issuance and modification costs | Debt issuance and modification costs | (3,109) | | | (6,278) | | | — | |
| Proceeds from the issuance of long-term debt | — | | | 500,000 | | | — | |
| | Proceeds from the issuance of long-term debt, net of original issuance discount | |
| Principal payments on long-term debt | Principal payments on long-term debt | (400,000) | | | (896,214) | | | (350,140) | |
| Repurchase of common stock - related party | — | | | — | | | (250,000) | |
| Repurchase of common stock - non-related party | (50,000) | | | (30,099) | | | (10,868) | |
| Repurchase of common stock | |
| Payments for taxes related to net share settlement of equity awards | Payments for taxes related to net share settlement of equity awards | (4,077) | | | (71) | | | — | |
| Proceeds from exercise of stock options | |
| Dividends paid to non-related party | Dividends paid to non-related party | (7,439) | | | (8,603) | | | (20,613) | |
| Dividends paid to related party | Dividends paid to related party | (3,206) | | | (22,272) | | | (78,010) | |
| Other - primarily interest rate swap settlements | (3,819) | | | — | | | — | |
| Net cash used in financing activities | (471,792) | | | (463,683) | | | (709,631) | |
| Principal payments under finance lease obligations | |
| Net cash provided by (used in) financing activities | |
| Net change in cash and cash equivalents | Net change in cash and cash equivalents | (86,612) | | | 64,267 | | | 31,801 | |
Effect of exchange rate changes on cash
and cash equivalents | Effect of exchange rate changes on cash
and cash equivalents | (1,316) | | | 240 | | | (746) | |
| Cash and cash equivalents at beginning of period | Cash and cash equivalents at beginning of period | 145,442 | | | 80,935 | | | 49,880 | |
| Cash and cash equivalents at end of period | Cash and cash equivalents at end of period | $ | 57,514 | | | $ | 145,442 | | | $ | 80,935 | |
See accompanying Notes to the Consolidated Financial Statements
GRAFTECH INTERNATIONAL LTD. AND SUBSIDIARIES
CONSOLIDATED STATEMENTS OF CASH FLOWS (Continued)
(Dollars in thousands)
| | | | For the Year Ended December 31, | | Year Ended December 31, |
| | | 2021 | | 2020 | | 2019 | | 2023 | | 2022 | | 2021 |
| Supplemental disclosures of cash flow information: | Supplemental disclosures of cash flow information: | | | | | |
| Net cash paid during the periods for: | Net cash paid during the periods for: | |
| Interest | $ | 56,333 | | | $ | 86,962 | | | $ | 121,075 | |
| Net cash paid during the periods for: | |
| Net cash paid during the periods for: | |
Interest(1) | |
Interest(1) | |
Interest(1) | |
| Income taxes | Income taxes | 63,791 | | | 73,971 | | | 99,278 | |
| | Non-cash investing activities: | |
| Change in capital expenditures in accounts payable | |
| Change in capital expenditures in accounts payable | |
| Change in capital expenditures in accounts payable | |
| * Net change in working capital due to the following components: | * Net change in working capital due to the following components: | |
| Accounts and notes receivable, net | |
| Accounts and notes receivable, net | |
| Accounts and notes receivable, net | Accounts and notes receivable, net | $ | (28,927) | | | $ | 63,557 | | | $ | (404) | |
| Inventories | Inventories | (28,165) | | | 44,633 | | | (21,549) | |
| Prepaid expenses and other current assets | Prepaid expenses and other current assets | (31,921) | | | 3,028 | | | 3,929 | |
| Income taxes payable | Income taxes payable | 5,674 | | | (12,420) | | | (18,174) | |
| Accounts payable and accruals | Accounts payable and accruals | 66,591 | | | (12,790) | | | (11,551) | |
| Interest payable | Interest payable | 371 | | | 430 | | | 62 | |
| Net change in working capital | Net change in working capital | $ | (16,377) | | | $ | 86,438 | | | $ | (47,687) | |
(1)Includes cash received/paid from the monthly settlements and the 2023 termination of our interest rate swaps.
See accompanying Notes to the Consolidated Financial Statements
GRAFTECH INTERNATIONAL LTD. AND SUBSIDIARIES
CONSOLIDATED STATEMENTS OF STOCKHOLDERS’ EQUITY (DEFICIT)
(Dollars in thousands, except share data)
| | Issued
Shares of
Common
Stock | |
| Issued
Shares of
Common
Stock | |
| Issued
Shares of
Common
Stock | | | Common
Stock | | Additional
Paid-in
Capital | | Accumulated
Other
Comprehensive
Loss | | Accumulated Deficit | | | | | | Total
Stockholders’
Equity (Deficit) |
| | Issued
Shares of
Common
Stock | | Common
Stock | | Additional
Paid-in
Capital | | Accumulated
Other
Comprehensive
Income (Loss) | | Retained Earnings (Accumulated
Deficit) | | | Total
Stockholders’
Equity (Deficit) |
| | Balance as of December 31, 2018 | 290,537,612 | | | $ | 2,905 | | | $ | 819,622 | | | $ | (5,800) | | | $ | (1,893,496) | | | | $ | (1,076,769) | |
| Net income | — | | | — | | | — | | | — | | | 744,602 | | | | 744,602 | |
| Other comprehensive income (loss): | | | |
| Commodity derivatives income, net of tax of $(3,418) | — | | | — | | | — | | | 11,830 | | | — | | | | 11,830 | |
| Commodity and foreign currency derivatives reclassification adjustments, net of tax of $1,872 | — | | | — | | | — | | | (7,020) | | | — | | | | (7,020) | |
| Foreign currency translation adjustments, net of tax of $(67) | — | | | — | | | — | | | (6,371) | | | — | | | | (6,371) | |
| Total other comprehensive loss | — | | | — | | | — | | | (1,561) | | | — | | | | (1,561) | |
| Repurchase of common stock - related party | (19,047,619) | | | (190) | | | (53,524) | | | — | | | (196,286) | | | | (250,000) | |
| Repurchase of common stock - non-related party | (1,004,685) | | | (10) | | | (2,825) | | | — | | | (8,033) | | | | (10,868) | |
| Stock-based compensation | — | | | — | | | 2,146 | | | — | | | — | | | | 2,146 | |
| Dividends paid to related party ($0.34 per share) | — | | | — | | | — | | | — | | | (78,010) | | | | (78,010) | |
| Dividends paid to non-related party ($0.34 per share) | — | | | — | | | — | | | — | | | (20,613) | | | | (20,613) | |
| Balance as of December 31, 2019 | 270,485,308 | | | $ | 2,705 | | | $ | 765,419 | | | $ | (7,361) | | | $ | (1,451,836) | | | | (691,073) | |
| Net income | — | | | — | | | — | | | — | | | 434,374 | | | | 434,374 | |
| Other comprehensive (loss) income: | | | |
| Commodity and interest rate derivatives loss, net of tax of $4,250 | — | | | — | | | — | | | (15,594) | | | — | | | | (15,594) | |
| Commodity derivatives reclassification adjustments, net of tax of $879 | — | | | — | | | — | | | (3,254) | | | — | | | | (3,254) | |
| Foreign currency translation adjustments, net of tax of $(162) | — | | | — | | | — | | | 6,568 | | | — | | | | 6,568 | |
| Total other comprehensive loss | — | | | — | | | — | | | (12,280) | | | — | | | | (12,280) | |
| Repurchase of common stock - non-related party | (3,328,574) | | | (33) | | | (9,700) | | | — | | | (20,366) | | | | (30,099) | |
| Stock-based compensation | 42,411 | | | — | | | 2,665 | | | — | | | — | | | | 2,665 | |
| Payments for taxes related to net share settlement of equity awards | (10,598) | | | — | | | (30) | | | — | | | (41) | | | | (71) | |
| Dividends paid to related party ($0.115 per share) | — | | | — | | | — | | | — | | | (22,272) | | | | (22,272) | |
| Dividends paid to non-related party ($0.115 per share) | — | | | — | | | — | | | — | | | (8,603) | | | | (8,603) | |
| Adoption of ASC 326 | — | | | — | | | — | | | — | | | (2,026) | | | | (2,026) | |
| Balance as of December 31, 2020 | |
| Balance as of December 31, 2020 | |
| Balance as of December 31, 2020 | Balance as of December 31, 2020 | 267,188,547 | | | 2,672 | | | 758,354 | | | (19,641) | | | (1,070,770) | | | | (329,385) | |
| Net income | Net income | — | | | — | | | — | | | — | | | 388,330 | | | | 388,330 | |
| Other comprehensive income (loss): | Other comprehensive income (loss): | | | |
| Commodity and interest rate derivatives income, net of tax of $(6,662) | Commodity and interest rate derivatives income, net of tax of $(6,662) | — | | | — | | | — | | | 24,525 | | | — | | | | 24,525 | |
| Commodity derivatives and interest rate swap reclassification adjustments, net of tax of $(1,970) | — | | | — | | | — | | | 7,277 | | | — | | | | 7,277 | |
| Commodity and interest rate derivatives income, net of tax of $(6,662) | |
| Commodity and interest rate derivatives income, net of tax of $(6,662) | |
| Commodity derivatives reclassification adjustments, net of tax of $(1,970) | |
| Foreign currency translation adjustments, net of tax of $0 | Foreign currency translation adjustments, net of tax of $0 | — | | | — | | | — | | | (19,605) | | | — | | | | (19,605) | |
| Total other comprehensive income | Total other comprehensive income | — | | | — | | | — | | | 12,197 | | | — | | | | 12,197 | |
| | Repurchase of common stock - non-related party | (4,658,544) | | | (46) | | | (13,091) | | | — | | | (36,863) | | | | (50,000) | |
| Repurchase of common stock | |
| Stock-based compensation | Stock-based compensation | 1,009,545 | | | 11 | | | 16,620 | | | — | | | — | | | | 16,631 | |
| Options exercised | Options exercised | 33,500 | | | — | | | 351 | | | — | | | — | | | | 351 | |
| Payments for taxes related to net share settlement of equity awards | Payments for taxes related to net share settlement of equity awards | (317,340) | | | (4) | | | (822) | | | — | | | (3,251) | | | | (4,077) | |
| Dividends paid to related party ($0.04 per share) | Dividends paid to related party ($0.04 per share) | — | | | — | | | — | | | — | | | (3,206) | | | | (3,206) | |
| Dividends paid to non-related party ($0.04 per share) | Dividends paid to non-related party ($0.04 per share) | — | | | — | | | — | | | — | | | (7,439) | | | | (7,439) | |
| Balance as of December 31, 2021 | Balance as of December 31, 2021 | 263,255,708 | | | $ | 2,633 | | | $ | 761,412 | | | $ | (7,444) | | | $ | (733,199) | | | | $ | 23,402 | |
| Net income | |
| Other comprehensive income (loss): | |
| Commodity, interest rate and foreign currency derivatives income, net of tax of $(5,060) | |
| Commodity, interest rate and foreign currency derivatives income, net of tax of $(5,060) | |
| Commodity, interest rate and foreign currency derivatives income, net of tax of $(5,060) | |
| Commodity, interest rate and foreign currency derivatives reclassification adjustments, net of tax of $2,469 | |
| Foreign currency translation adjustments, net of tax of $0 | |
| Total other comprehensive loss | |
| Repurchase of common stock | |
| Stock-based compensation | |
| Options exercised | |
| Payments for taxes related to net share settlement of equity awards | |
| Dividends paid to related party ($0.04 per share) | |
| Dividends paid to non-related party ($0.04 per share) | |
| Balance as of December 31, 2022 | |
| Net income | |
| Other comprehensive income (loss): | |
| Commodity, interest rate and foreign currency derivatives income, net of tax of $(474) | |
| Commodity, interest rate and foreign currency derivatives income, net of tax of $(474) | |
| Commodity, interest rate and foreign currency derivatives income, net of tax of $(474) | |
| Commodity, interest rate and foreign currency derivatives reclassification adjustments, net of tax of $4,898 | |
| Foreign currency translation adjustments, net of tax of $(8) | |
| Total other comprehensive loss | |
| | Stock-based compensation | |
| Stock-based compensation | |
| Stock-based compensation | |
| Payments for taxes related to net share settlement of equity awards | |
| Dividends paid to related party ($0.02 per share) | |
| Dividends paid to non-related party ($0.02 per share) | |
| Balance as of December 31, 2023 | |
See accompanying Notes to the Consolidated Financial Statements
GRAFTECH INTERNATIONAL LTD. AND SUBSIDIARIES
NOTES TO THE CONSOLIDATED FINANCIAL STATEMENTS
(Dollars in thousands, except as otherwise noted)
(1)Business and Summary of Significant Accounting Policies
Discussion of Business and Structure
GrafTech International Ltd. (the “Company”) is a leading manufacturer of high-quality graphite electrode products essential to the production of electric arc furnace ("EAF")EAF steel and other ferrous and non-ferrous metals. References herein to “GTI,” “we,” “our,” or “us” refer collectively to the Company.Company and its subsidiaries. On August 15, 2015, GTI became an indirect wholly owned subsidiary of Brookfield Asset Management Inc. (together with its affiliates, “Brookfield”).Brookfield. In April 2018, we completed our initial public offering ("IPO")IPO of 38,097,525 shares of our common stock held by Brookfield at a price of $15.00 per shares.share. We did not receive any proceeds related to the IPO. Our common stock is listed on the NYSE under the symbol “EAF.” Brookfield has since distributed a portion of its GrafTech common stock to the owners in the Brookfield consortium and sold shares of GrafTech common stock in public and private transactions, resulting in a reduction of Brookfield's ownership of outstanding shares of GrafTech common stock decreasing to 55.3%approximately 11.0% and 24.9% as of December 31, 20202023 and 24.3% as of December 31, 2021. See Note 14, "Stockholders Equity (Deficit)," for more information.2022, respectively.
The Company’s only reportable segment, Industrial Materials, is comprised of our 2its two major product categories: graphite electrodes and petroleum needle coke products. Petroleum needle coke is aour key raw material used in the production of graphite electrodes. The Company's vision is to provide highly engineered graphite electrode products, services solutions and productssolutions to electric arc furnace operators.
Summary of Significant Accounting Policies
The Consolidated Financial Statements include the financial statements of the Company and its wholly owned subsidiaries. All intercompany transactions have been eliminated in consolidation.
Cash Equivalents
We consider allCash equivalents consist of short-term, highly liquid financial instrumentsinvestments with an original maturitiesmaturity of three months or less to be cash equivalents.less. Cash equivalents consist of certificates of deposit, money market funds and commercial paper.
Revenue Recognition
Revenue is recognized when a customer obtains control of promised goods. The amount of revenue recognized reflects the consideration to which the Company expects to be entitled to receive in exchange for these goods.
To achieve this core principle, the following five steps are performed: (i) identify the contract(s) with a customer; (ii) identify the performance obligations in the contract; (iii) determine the transaction price; (iv) allocate the transaction price to the performance obligations in the contract; and (v) recognize revenue when (or as) we satisfy a performance obligation.obligation is satisfied.
The Company sells the majority of its products directly to steel manufacturers located in various jurisdictions. The Company’s contracts consist of longer-term take-or-pay sales contracts of graphite electrodes with initial terms of up to five years and short-term purchase orders (deliveries within one year). Collectability is assessed based on the customer’s ability and intention to pay, reviewing a variety of factors including the customer’s historical payment experience and published credit and financial information. Additionally, for multi-year contracts, we may require the customer to post a bank guarantee, guarantee of a parent, a letter of credit or a significant pre-payment.prepayment.
The promises of delivery of graphite electrodes represent the distinct performance obligations of ourthe Company's contracts. A small portion of ourthe Company's sales consist of deliveries of by-products of the manufacturing processes, such as graphite powders, naphta and gasoil.
Given their nature, the Company’s performance obligations are satisfied at a point in time when control of the products has been transferred to the customer. In most cases, control transfer is deemed to happen at the delivery point of the products defined under the incoterms, usually at time of loading the truck or the vessel. The Company has elected to treat the transportation activity as a fulfilmentfulfillment activity instead of as a distinct performance obligation, and outbound freight cost is accrued when the product delivery promises are satisfied.
GRAFTECH INTERNATIONAL LTD. AND SUBSIDIARIES
NOTES TO THE CONSOLIDATED FINANCIAL STATEMENTS
The transaction price is determined based on the consideration to which the Company will be entitled in exchange for transferring goods to the customer. Taxes assessed by a governmental authority that are both imposed on and concurrent with a specific revenue-producing transaction and collected by the Company from a customer are excluded from the transaction price.
Variable consideration is included in the transaction price if, in the Company’s judgment, it is probable that a significant future reversal of cumulative revenue under the contract will not occur. The estimated variable consideration is reflected through revenue reversal accruals that are based on the Company's experience, as well as anticipated performance. Historically, these reversals have been insignificant. Additionally, when termination fees are invoiced under certain provisions of the LTAs, they are accounted for as an element of variable consideration that is constrained, i.e., not recognized, until collected.
Contracts that contain multiple distinct performance obligations require an allocation of the transaction price to each performance obligation based on a relative stand-alone selling price basis. The Company regularly reviews market conditions and internally approved pricing guidelines to determine stand-alone selling prices for the different types of its customer contracts. The stand-alone prices as known at contract inception are utilized as the basis to allocate the transaction price to the distinct performance obligations. The allocation of the transaction price to the performance obligations remains unchanged if stand-alone selling prices change after contract inception.
Changes to LTAs are reviewed to assess whether there has been a change in volume, price or both and whether any additional volumes are at their stand-alone selling price to determine whether the contract modification should be accounted for as (1) part of the existing contract, (2) the termination of the existing contract and the creation of a new contract or (3) a separate contract. Under the most commonly negotiated terms, the accounting is such that it treats these modified contracts as the termination of the existing contract and the creation of a new contract.
Inventories
Inventories are stated at the lower of cost or market.net realizable value. Cost is principally determined using the FIFO andfirst-in, first-out ("FIFO") or average cost, which approximates FIFO, methods. Elements of cost in inventory include raw materials, energy costs, direct labor, manufacturing overhead and depreciation of manufacturing fixed assets. As of December 31, 2023, the market value of our inventories fell below their carrying amounts, and as a result, we recorded a LCM inventory valuation adjustment of $12.4 million in order to state our inventories at market.
We allocateThe Company allocates fixed production overheadsoverhead to the costscost of conversion based on normal capacity utilization of the production facilities. We recognizeThe Company recognizes abnormal amounts of idle facility expense, freight, handling costs, and wasted materials (spoilage) as current period charges. As a result of reduced production levels, we recorded fixed manufacturing costs of $62.4 million and $16.0 million that would have otherwise been inventoried for years ended December 31, 2023 and 2022, respectively.
Property, Plant and Equipment
Expenditures for property, plant and equipment are recorded at cost. Maintenance and repairs of property and equipment are expensed as incurred. Expenditures for replacements and betterments are capitalized and the replaced assets are retired. Gains and losses from the sale of property, plant and equipment are included in cost of salesgoods sold or other (income) expense net. We depreciate our(income), net on the Consolidated Statements of Operations. The Company depreciates its assets using the straight-line method over the estimated useful lives of the assets. The ranges of estimated useful lives are as follows:
| | | | | |
| | Years |
| Buildings | 25-40 |
| Land improvements | 20 |
| Machinery and equipment | 5-20 |
| Furniture and fixtures | 5-10 |
The carrying value of fixed assets is assessed when events and circumstances indicating impairment are present. Recoverability of assets to be held and used is measured by a comparison of the carrying amount of the assets to future undiscounted net cash flows expected to be generated by the assets. If the assets are considered to be impaired, the impairment to be recognized is measured by the amount by which the carrying amount of the assets exceeds the fair value of the assets. Assets to be disposed of are reported at the lower of the carrying amount or fair value less costs to sell.
Depreciation expense was $55.0 million, $51.5 million and $49.7 million in 2021, 2020 and 2019, respectively. Accounts payable associated with capital expenditures totaled $15.7 million and $8.9 million as of December 31, 2021 and 2020, respectively.
GRAFTECH INTERNATIONAL LTD. AND SUBSIDIARIES
NOTES TO THE CONSOLIDATED FINANCIAL STATEMENTS
Depreciation expense was $47.7 million, $45.4 million and $55.0 million in 2023, 2022 and 2021, respectively. Accounts payable associated with capital expenditures totaled $14.0 million and $23.4 million as of December 31, 2023 and 2022, respectively.
Leases
The Company determines if an arrangement is a lease at inception. When an arrangement contains a lease, wethe Company then determinedetermines if it meets any of the criteria to be classified as a finance lease. Leases with a term of 12 months or less are not recorded on the balance sheet.
Right of Use ("RoU") assets represent ourthe Company's right to use an underlying asset for the lease term and lease liabilities represent ourthe Company's obligation to make lease payments arising from the lease. RoU assets and lease liabilities are recognized at the lease commencement date based on the present value of the lease payments over the lease term. In order to compute the lease liability, when the rate implicit in the lease is not readily determinable, we discountthe Company discounts the lease payments using ourits estimated incremental borrowing rate for secured fixed rate debt over the same term, derived from information available at the lease commencement date. OurThe Company's lease term includesterms include the option to extend the lease when it is reasonably certain that weoption will exercise that option.be exercised.
Lease and non-lease components are treated as a single lease component, except for leases of warehouse space where they will be accounted for separately. Leases may include variable lease and variable non-lease components costs, which are accounted for as variable lease expense in the income statement.Consolidated Statements of Operations.
Accounts Receivable
Trade accounts receivable primarily arise from sales of goods to customers and distributors in the normal course of business.
Allowance for Doubtful Accounts
We recognizeThe Company recognizes credit losses at the time the financial assets originate or are acquired using a lifetime of expected credit losses measurement. OurThe Company's expected losses are adjusted each period for changes in expected lifetime credit losses.
Deferred Debt Issuance Costs
We deferDeferred financing costs are amortized over the terms of the related debt issuanceusing the effective interest method. If the terms of renewed or modified debt instruments are deemed to be substantially different, all unamortized financing costs uponassociated with the incurrencemodified debt are charged to earnings in the current period. If the terms are not substantially different, the costs associated with the renewal are capitalized and amortized over the remaining term of the debt instrument. For modifications affecting a line of credit, fees paid to a creditor and record them as a direct reduction against our debt. We hadany third party costs will be capitalized and amortized over the remaining term of the new arrangement. Any unamortized deferred debt issuancefinancing costs of $11.8 millionassociated with the old arrangement are either deferred and $18.1 million as of December 31, 2021 and 2020, respectively. We amortize such amountsamortized over the life of the respective debt instrument using the effective interest method. The estimated life may be adjustednew arrangement or written off, depending upon the occurrencenature of a triggering event. Amortizationthe modification and cost. The balance of any unamortized financing costs on extinguished debt issuance costs amounted to $8.6 million, $9.2 million and $4.1 million in 2021, 2020 and 2019, respectively. Debt issuance costs amortization is included in interest expense.expensed upon extinguishment.
Derivative Financial Instruments
We do not use derivative financial instruments for trading purposes. They are used to manage well-defined commercial risks associated with commodity purchases, interest rates and currency exchange rate risks. On the date that a derivative contract for a hedging instrument is entered into, the Company designates the derivative as either (1) a hedge of the exposure to changes in the fair value of a recognized asset or liability or of an unrecognized firm commitment (a fair value hedge), (2) a hedge of the exposure of a forecasted transaction or of the variability in the cash flows of a recognized asset or liability (a cash flow hedge), (3) a hedge of a net investment in a foreign operation (a net investment hedge) or (4) a contract not designated as a hedging instrument.
For a fair value hedge, both the effective and ineffective portions of the change in the fair value of the derivative are recorded in earnings and reflected in the Consolidated Statement of Operations on the same line as the gain or loss on the hedged item attributable to the hedged risk. For a cash flow hedge, the effective portion of the change in the fair value of the derivative is recorded in accumulated other comprehensive loss ("AOCL") in the Consolidated Balance Sheet. When the underlying hedged transaction is realized, the gain or loss included in accumulated other comprehensive lossAOCL is recorded in earnings and reflected in the Consolidated Statement of Operations on the same line as the gain or loss on the hedged item attributable to the hedged risk.
GRAFTECH INTERNATIONAL LTD. AND SUBSIDIARIES
NOTES TO THE CONSOLIDATED FINANCIAL STATEMENTS
For a net investment hedge, the effective portion of the change in the fair value of the derivative is recorded in cumulative translation adjustment, which is a component of accumulated other comprehensive lossAOCL in the Consolidated Balance Sheet and is de-recognized upon liquidation or sale of the entity. For contracts not designated as hedging instruments, changes in fair value are adjusted through the statement of operations.
We formally document our hedge relationships, including the identification of the hedging instruments and the related hedged items, as well as our risk management objectives and strategies for undertaking the hedge transaction. Derivatives are recorded at fair value in prepaid expenses and other current assets, other long-term assets, other current liabilities and other long-term obligations in the consolidated balance sheets. We also formally assess, both at inception and at least quarterly
GRAFTECH INTERNATIONAL LTD. AND SUBSIDIARIES
NOTES TO THE CONSOLIDATED FINANCIAL STATEMENTS
thereafter, whether a derivative used in a hedging transaction is highly effective in offsetting changes in either the fair value or the cash flows of the hedged item. When it is determined that a derivative ceases to be highly effective or that the hedged transaction is no longer probable of occurring, we discontinue hedge accounting.
Foreign Currency Derivatives
We enter into foreign currency derivatives from time to time to manage exposure to changes in currency exchange rates. These instruments, which include, but are not limited to, forward exchange contracts and purchased currency options, attempt to hedge global currency exposures, relating to non-dollar denominated debt and identifiable foreign currency receivables, payables and commitments held by our foreign and domestic subsidiaries. Forward exchange contracts are agreements to exchange different currencies at a specified future date and at a specified rate. Purchased foreign currency options are instruments which give the holder the right, but not the obligation, to exchange different currencies at a specified rate at a specified date or over a range of specified dates. The result is the creation of a range in which a best and worst price is defined, while minimizing option cost. Forward exchange contracts and purchased currency options are carried at fair value.
These contracts may be designated as cash flow or fair value hedges to the extent that they are effective and are accounted for as described in section above (“Derivative Financial Instruments”). For derivatives that are not designated as a hedge, any gain or loss is immediately recognized in cost of sales on the Consolidated Statements of Operations. Derivatives used in this manner relate to risks resulting from assets or liabilities denominated in a foreign currency.
Commodity Contracts
We have entered into derivative contracts for refined oil products. These contracts are entered into to protect against the risk that eventual cash flows related to these products will be adversely affected by future changes in prices. All commodity contracts are carried at fair value and are treated as cash flow hedges to the extent they are effective. Changes in their fair values are included in accumulated other comprehensive loss in the Consolidated Balance Sheets until settlement. Realized gains and losses resulting from settlement are first recognized in accumulated other comprehensive loss and are recorded in cost of sales on the Consolidated Statements of Operations when the underlying hedged item is realized.
Interest Rate Swap Contracts
We have entered into interest rate swap contracts that are "pay fixed, receive variable" with maturities of either two or five years. The Company’s risk management objective was to fix its cash flows associated with the risk in variability in the one-month USD LIBOR for a portion of our outstanding debt under the 2018 Term Loan Facility (as defined in Note 5, "Debt and Liquidity"). It is expected that these swaps will fix the cash flows associated with the forecasted interest payments on this notional amount of debt. All interest rate swaps are carried at their fair value and are treated as cash flow hedges. Changes in their fair value are included in accumulated other comprehensive loss on the Consolidated Balance Sheets until settlement. Realized gains and losses resulting from the settlement are recognized in interest expense in the period of settlement.
Income Taxes
We file a consolidated U.S. federal income tax return for GTI and its eligible domestic subsidiaries. Our non-U.S. subsidiaries file income tax returns in their respective local jurisdictions. We account for income taxes under the asset and liability method. Deferred tax assets and liabilities are recognized for the future tax consequences attributable to temporary differences between the financial statement carrying amounts of existing assets and liabilities and their respective tax bases and tax benefit carry forwards. Deferred tax assets and liabilities at the end of each period are determined using enacted tax rates. A valuation allowance is established or maintained, when, based on currently available information and other factors, it is more likely than not that all or a portion of a deferred tax asset will not be realized.
Under the guidance on accounting for uncertainty in income taxes, we recognize the benefit from an uncertain tax position only if it is more likely than not that the tax position will be sustained on examination by taxing authorities, based on the technical merits of the position. The tax benefits recognized in the financial statements from such a position are measured based on the largest benefit that has a greater than fifty percent50% likelihood of being realized upon ultimate settlement. The guidance on accounting for uncertainty in income taxes also provides guidance on derecognition, classification, interest and penalties on income taxes, and accounting in interim periods.
The Company treats taxes due on future U.S. inclusions in taxable income related to Global Intangible Low Tax Income ("GILTI") as a current period expense when incurred. See Note 13, "Income Taxes" for more information.
GRAFTECH INTERNATIONAL LTD. AND SUBSIDIARIES
NOTES TO THE CONSOLIDATED FINANCIAL STATEMENTS
Related Party Tax Receivable Agreement
On April 23, 2018, the Company entered into a Tax Receivable Agreement that provides Brookfield, as the sole pre-IPO stockholder, the right to receive future payments from us for 85% of the amount of cash savings, if any, in U.S. federal income tax and Swiss tax that we and our subsidiaries realize as a result of the utilization of certain tax assets attributable to periods prior to our IPO, including certain federal net operating losses ("NOLs"), previously taxed income under Section 959 of the Internal Revenue Code of 1986, as amended from time to time (the "Code"), foreign tax credits, and certain NOLs in Swissco (collectively, the "Pre-IPO Tax Assets"). In addition, we will pay interest on the payments we will make to Brookfield with respect to the amount of these cash savings from the due date (without extensions) of our tax return where we realize these savings to the payment date at a rate equal to LIBORthe one-month period secured overnight financing rate administered by the Federal Reserve Bank of New York plus 1.00% per annum.1.10%. The term of the Tax Receivable Agreement commenced on April 23, 2018 and will continue until there is no potential for any future tax benefit payments.
The Tax Receivable Agreement liability is recorded based on the best estimate of the utilization of Pre-IPO Tax Assets and is revised annually in the fourth quarter or earlier if and when significant changes in the forecast are identified.
Retirement Plans and Post-Employment Benefits
We use actuarial methods and assumptions to account for our defined benefit pension plans and our post-employment benefits. We recognize in earnings the change in the fair value of plan assets and net actuarial gains and losses annually in the fourth quarter of each year with a mark-to-market adjustment ("MTM Adjustment") and whenever a plan is remeasured (e.g., due to a significant curtailment, settlement, etc.). Pension and post-employment benefits expense includes the MTM Adjustment, actuarially computed cost of benefits earned during the current service period, the interest cost on accrued obligations, the expected return on plan assets and adjustments due to plan settlements and curtailments. Contributions to the qualified U.S. retirement plan are made in accordance with the requirements of the Employee Retirement Income Security Act of 1974.
GRAFTECH INTERNATIONAL LTD. AND SUBSIDIARIES
NOTES TO THE CONSOLIDATED FINANCIAL STATEMENTS
Additional information with respect to benefits plans is set forth in Note 11, “Retirement Plans and Post-Employment Benefits.”
Stock-based Compensation
The Company recognizes stock-based compensation expense based on the grant date fair value of the award over the period during which an employee or director is required to provide service in exchange for the award. Stock-based awards include stock options, restricted stock units ("RSUs"), performance-based restricted stock units (“PSUs”) and deferred share units ("DSUs"). The fair value of RSUs and DSUs is primarily based on the closing market price of a share of the Company's common stock on the date of grant, modified as appropriate to take into account the features of such grants. The fair value of PSUs is determined using a Monte Carlo valuation on the date of grant. Stock options are granted with an exercise price equal to the closing price of the Company's common shares on the date of grant. The fair value of stock options is determined using a Black-Scholes option-pricing model, which incorporates assumptions regarding the expected volatility, the expected option life, the risk-free interest rate, and the expected dividend yield. The Company accounts for forfeitures as they occur. See Note 3, "Stock-Based and Other Management Compensation" for additional information.
Environmental, Health and Safety Matters
Our operations are governed by laws addressing protection of the environment and worker safety and health. These laws provide for civil and criminal penalties and fines, as well as injunctive and remedial relief, for noncompliance and require remediation at sites where hazardous substances have been released into the environment.
We have been in the past, and may become in the future, the subject of formal or informal enforcement actions or proceedings regarding noncompliance with these laws or the remediation of company-related substances released into the environment. Historically, such matters have been resolved by negotiation with regulatory authorities resulting in commitments to compliance, abatement or remediation programs and in some cases payment of penalties. Historically, neither the commitments undertaken nor the penalties imposed on us have been material.
Environmental considerations are part of all significant capital expenditure decisions. Environmental remediation, compliance and management expenses were approximately $12.1 million, $22.4 million and $16.9 million $11.1 millionin 2023, 2022 and $11.6 million in 2021, 2020 and 2019, respectively. A charge to income is recorded when it is probable that a liability has been incurred and the cost can be reasonably estimated. When payments are fixed or determinable, the liability is discounted using a rate at which the payments could be effectively settled. The accrued liability relating to environmental remediation was $4.9$4.4 million as of both December 31, 20212023 and 2020.
GRAFTECH INTERNATIONAL LTD. AND SUBSIDIARIES
NOTES TO THE CONSOLIDATED FINANCIAL STATEMENTS
Our environmental liabilities do not take into consideration possible recoveries of insurance proceeds. Because of the uncertainties associated with environmental remediation activities at sites where we may be potentially liable, future expenses to remediate sites could be considerably higher than the accrued liability.
Foreign Currency Translation and Remeasurement
We translate the financial statements of foreign subsidiaries, whose local currency is their functional currency, to U.S. dollars using period-end exchange rates for assets and liabilities and average exchange rates for each period for revenues, expenses, gains and losses. Differences arising from exchange rate changes are included in accumulated other comprehensive lossAOCL on the Consolidated Balance Sheets until such time as the operations of such non-U.S. subsidiaries are sold or substantially or completely liquidated.
For our Mexican,Russian, Swiss, Luxembourg, United Kingdom and RussianMexican subsidiaries, whose functional currency is the U.S. dollar, we remeasure non-monetary balance sheet accounts and the related income statement accounts at historical exchange rates. Resulting gains and losses arising from the fluctuations in currency for monetary accounts are recognized in other expense (income) expense,, net, in the Consolidated Statements of Operations. Gains and losses arising from fluctuations in currency exchange rates on transactions denominated in currencies other than the functional currency are recognized in earnings as incurred.
We have non-dollar denominated intercompany loans between some of our foreign subsidiaries. These loans are subject to remeasurement gains and losses due to changes in currency exchange rates. One of these loans has been deemed to be essentially permanent prior to settlement and, as a result, remeasurement gains and losses on this loan were recorded as a component of accumulated other comprehensive loss in the stockholders’ equity (deficit) section ofAOCL on the Consolidated Balance Sheets. The remaining loans are deemed to be temporary and, as a result, remeasurement gains and losses on these loans are recorded as currency (gains) losses in other expense (income) expense,, net, on the Consolidated Statements of Operations.
GRAFTECH INTERNATIONAL LTD. AND SUBSIDIARIES
NOTES TO THE CONSOLIDATED FINANCIAL STATEMENTS
Goodwill and Other Intangible Assets
Goodwill is the excess of the acquisition cost of businesses over the fair value of the identifiable net assets acquired. We do not recognize deferred income taxes for the difference between the assigned value and the tax basis related to nondeductible goodwill. Goodwill is not amortized; however, impairment testing is performed annually or more frequently if circumstances indicate that impairment may have occurred. We perform the annual goodwill impairment test at December 31.
The annual goodwill impairment testing may begin with a qualitative assessment of potential impairment indicators in order to determine whether it is necessary to perform the quantitative goodwill impairment test.
Other amortizable intangible assets, which consist primarily of trademarks and trade names, technology and know-how and customer-related intangibles, and technological know-how, are amortized over their estimated useful lives using the straight line or sum-of-the-years digits method. The estimated useful lives for each major category of amortizable intangible assets are:
| | | | | |
| | Years |
Trade namenames | 5-20 |
| Technology and know-how | 5-14 |
Customer related intangibleCustomer-related intangibles | 5-15 |
The carrying value of intangible assets is assessed when events and circumstances indicating impairment are present. Recoverability of assets to be held and used is measured by a comparison of the carrying amount of the assets to future undiscounted net cash flows expected to be generated by the assets. If the assets are considered to be impaired, the impairment to be recognized is measured by the amount by which the carrying amount of the assets exceeds the fair value of the assets. Additional information about goodwill and other intangibles is set forth in Note 6, “Goodwill and Other Intangible Assets.”
Major Maintenance and Repair Costs
We perform scheduled major maintenance of the storage and processing units at our Seadrift plant (referred to as “overhaul”). Time periods between overhauls vary by unit. We also perform significant maintenance and repair shutdown of the plant (referred to as “turnaround”) every other year.
Costs of overhauls and turnarounds include plant personnel, contract services, materials and rental equipment. We defer these costs when incurred and use the straight-line method to amortize them over the period of time estimated to lapse until the next scheduled overhaul of the applicable storage or processing unit. Under this policy, $0.7 million was deferred in 20212023 and $10.2$17.2 million of costs werewas deferred in 2020.2022. Amortization of deferred maintenance costs totaled $7.5 million, $4.7 million and $4.6 million $6.0 millionin 2023, 2022 and $5.1 million in 2021, 2020 and 2019, respectively.
GRAFTECH INTERNATIONAL LTD. AND SUBSIDIARIES
NOTES TO THE CONSOLIDATED FINANCIAL STATEMENTS
(Loss) Earnings per share
The calculation of basic (loss) earnings per share is based on the weighted average number of common shares outstanding. Diluted (loss) earnings per share recognizesreflects the dilution that would occur ifassumed conversion of all dilutive common stock options or restricted shares were exercised or converted into common shares.equivalents as appropriate using the treasury stock method. See Note 15, “Earnings“(Loss) Earnings per Share”.Share.”
Use of Estimates
The preparation of financial statements in conformity with U.S. generally accepted accounting principles (“GAAP”) requires us to make estimates and assumptions that affect the reported amounts of assets and liabilities and disclosure of contingent liabilities at the date of the Consolidated Financial Statements and the reported amounts of revenue and expenses. Significant estimates and assumptions are used for, but are not limited to, inventory valuation, pension and other post-employment benefits, allowance for doubtful accounts, contingent liabilities, accruals and valuation allowances, asset impairment, and environmental-related accruals. Actual results could differ from our estimates.
Reclassifications and Adjustments
Certain items previously reported in specific financial statement captions within the Consolidated Statements of Operations have been reclassified between lines to conform to the current presentation. In addition, specific financial statement captions within the Consolidated Statements of Cash Flows have been reclassified between lines within cash flow from operationsoperating activities to conform to the current presentation.
GRAFTECH INTERNATIONAL LTD. AND SUBSIDIARIES
NOTES TO THE CONSOLIDATED FINANCIAL STATEMENTS
Subsequent Events
We evaluate events that occur after the balance sheet date but before financial statements are issued to determine if a material event requires our amending the financial statements or disclosing the event. See Note 17, "Subsequent Events" for further details.
Recently Adopted Accounting Standards
In January 2021,September 2022, the Financial Accounting Standards Board ("FASB")FASB issued Accounting Standards Update ("ASU"(“ASU”) 2021-01,2022-04, Reference Rate Reform (Topic 848)Liabilities - Supplier Finance Programs (Subtopic 405-50): ScopeDisclosure of Supplier Finance Program Obligations, which amended Topic 848 reference rate reformrequires disclosures intended to clarifyenhance the scopetransparency of supplier finance programs. The amendments in this ASU require buyers in a supplier finance program to disclose sufficient information about the program to allow a user of financial statements to understand the program’s nature, activity during the period, changes from period to period, and availabilitypotential magnitude. The amendments are effective for fiscal years beginning after December 15, 2022, including interim periods within those fiscal years, except for the disclosure of expedientsrollforward information, which is effective for certain derivative instruments affected by reference rate reform. We have elected various optional expedientsfiscal years beginning after December 15, 2023. Early adoption is permitted. The amendments should be applied retrospectively to each period in Topic 848 related to hedging relationships and expect to make future elections related to contract modifications and other hedging relationships.which a balance sheet is presented, except for disclosure of rollforward information, which should be applied prospectively. The future election and application of these expedients are not expected to have a material impactCompany adopted this guidance on our financial position, results of operations and cash flows.January 1, 2023.
Recently Issued Accounting Pronouncements Not Yet Adopted
In December 2019,November 2023, the FASB issued ASU No. 2019-12,2023-07, Segment Reporting (Topic 280): Improvements to Reportable Segment Disclosures, which is intended to improve reportable segment disclosure requirements, primarily through enhanced disclosures about significant segment expenses. The guidance is effective for fiscal years beginning after December 15, 2023, and interim periods within fiscal years beginning after December 15, 2024. Early adoption is permitted. The guidance is to be applied retrospectively to all prior periods presented in the financial statements. Upon transition, the segment expense categories and amounts disclosed in the prior periods should be based on the significant segment expense categories identified and disclosed in the period of adoption. We are currently evaluating the potential impact of adopting this new guidance on our consolidated financial statements and related disclosures.
In December 2023, the FASB issued ASU No. 2023-09, Income Taxes (Topic 740): Simplifying the Accounting forImprovements to Income Taxes. Tax DisclosuresASU 2019-12, which is intended to improve consistent applicationenhance the transparency, decision usefulness and effectiveness of Topic 740income tax disclosures. The amendments in this ASU require a public entity to disclose a tabular tax rate reconciliation, using both percentages and simplifycurrency, with specific categories. A public entity is also required to provide a qualitative description of the accountingstates and local jurisdictions that make up the majority of the effect of the state and local income tax category and the net amount of income taxes paid, disaggregated by federal, state and foreign taxes and also disaggregated by individual jurisdictions. The amendments also remove certain disclosures that are no longer considered cost beneficial. The amendments are effective prospectively for income taxes. This pronouncement removes certain exceptions to the general principles in Topic 740 and clarifies and amends existing guidance. ASU 2019-12 is effective for annual and interim reporting periods beginning after December 15, 2020, with2024, and early adoption and retrospective application are permitted. The Company adoptedAlthough the ASU 2019-12only modifies the Corporation's required income tax disclosures, the Corporation is currently evaluating the impact of adopting this guidance on January 1, 2021, with an immaterial effect on ourthe consolidated financial position, results of operations and cash flows.statements.
In June 2016, the FASB issued ASU No. 2016-13, Financial Instruments-Credit Losses (Topic 326), which introduces the Current Expected Credit Losses ("CECL") accounting model. CECL requires earlier recognition of credit losses, while also providing additional transparency about credit risk. CECL utilizes a lifetime expected credit loss measurement objective for the recognition of credit losses at the time the financial asset is originated or acquired. The expected credit losses are adjusted each period for changes in expected lifetime credit losses. ASU No. 2016-13 was effective for the Company on January 1, 2020. The adoption of ASU No. 2016-13 resulted in a cumulative-effect adjustment of $2.0 million included as an adjustment to our accounts receivable reserve and to retained earnings on January 1, 2020.
GRAFTECH INTERNATIONAL LTD. AND SUBSIDIARIES
NOTES TO THE CONSOLIDATED FINANCIAL STATEMENTS
(2) Revenue from Contracts with Customers
Disaggregation of Revenue
The following table provides information about disaggregated revenue by type of product and contract:
| | | | | | | | | | | | | | | | | |
| For the Year Ended December 31, |
| 2021 | | 2020 | | 2019 |
| (Dollars in thousands) |
| Graphite Electrodes - LTAs | $ | 1,040,214 | | | $ | 1,069,772 | | | $ | 1,437,354 | |
| Graphite Electrodes - Non-LTAs | 258,426 | | | 123,845 | | | 260,979 | |
| By-products and other | 47,148 | | | 30,744 | | | 92,460 | |
| Total Revenues | $ | 1,345,788 | | | $ | 1,224,361 | | | $ | 1,790,793 | |
The Graphite Electrodes revenue categories include only graphite electrodes manufactured by GrafTech. The revenue category “By-products and other" also includes re-sales of low-grade electrodes purchased from third-party suppliers, which represent a minimal contribution to our profitability. | | | | | | | | | | | | | | | | | |
| Year Ended December 31, |
| 2023 | | 2022 | | 2021 |
| (Dollars in thousands) |
| Graphite Electrodes - LTAs | $ | 253,262 | | | $ | 870,287 | | | $ | 1,040,214 | |
| Graphite Electrodes - Non-LTAs | 338,746 | | | 351,140 | | | 258,426 | |
| By-products and other | 28,492 | | | 59,823 | | | 47,148 | |
| Total Revenues | $ | 620,500 | | | $ | 1,281,250 | | | $ | 1,345,788 | |
Contract Balances
Substantially all the Company's receivables relate to contracts with customers. Accounts receivablesreceivable are recorded when the right to consideration becomes unconditional. Payment terms on invoices range from 30 to 120 days depending on the customary business practices of the jurisdictions in which we do business.
Certain short-term and longer-term sales contracts require up-front payments prior to the Company’s fulfillment of any performance obligation. These contract liabilities are recorded as current or long-term deferred revenue, depending on the lag between the pre-paymentprepayment and the expected delivery of the related products. Additionally, deferred revenue or contract assets originate from contracts where the allocation of the transaction price to the performance obligations based on their relative stand-alone selling prices results in the timing of revenue recognition being different from the timing of the invoicing. In this case, deferred revenue is amortized into revenue based on the transaction price allocated to the remaining performance obligations and contract assets are realized through the contract invoicing.
Contract assetsThe Company did not have any contract asset balances as of December 31, 2021 were $1.2 million, which are2023 or 2022.
Current deferred revenue is included in "Prepaid expenses and other current assets","Other accrued liabilities" on the Consolidated Balance Sheets. Contract assetsThe following table provides our contract liability balances as of December 31, 2020 were $2.7 million,2023 and 2022.
| | | | | | | | | | | |
| December 31, 2023 | | December 31, 2022 |
| (Dollars in thousands) |
| Current deferred revenue | $ | 31,583 | | | $ | 27,878 | |
The amount of which $1.5 million and $1.2 million arerevenue recognized in 2023 that was included in "Prepaid expensesthe December 31, 2022 current deferred revenue balance was $13.0 million. The increase in the December 31, 2023 current deferred revenue balance versus the prior year was primarily driven by the net difference between up-front payments received and otherthe related shipments. The amount of revenue recognized in 2022 that was included in the December 31, 2021 deferred revenue current assets" and "Other assets," respectively, on the Consolidated Balance Sheets.balance was $2.5 million.
GRAFTECH INTERNATIONAL LTD. AND SUBSIDIARIES
NOTES TO THE CONSOLIDATED FINANCIAL STATEMENTS
The following table provides information about deferred revenue from contracts with customers. Current deferred revenue is included in "Other accrued liabilities" and long-term deferred revenue is included in "Other long-term obligations" on the Consolidated Balance Sheets.
| | | | | | | | | | | |
| Current deferred revenue | | Long-Term deferred revenue |
| (Dollars in thousands) |
| Balance as of December 31, 2019 | $ | 11,776 | | | $ | 3,858 | |
| Increases due to cash received | 10,110 | | | — | |
| Revenue recognized | (6,270) | | | — | |
| | | |
| Reclassification between long-term and current | (1,804) | | | 1,804 | |
| Foreign currency impact | (756) | | | — | |
| Balance as of December 31, 2020 | 13,056 | | | 5,662 | |
| Increases due to cash received | 32,466 | | | — | |
| Revenue recognized | (37,030) | | | — | |
| Reclassification between long-term and current | 1,359 | | | (1,359) | |
| Foreign currency impact | (11) | | | — | |
| Balance as of December 31, 2021 | $ | 9,840 | | | $ | 4,303 | |
Transaction Price Allocated to the Remaining Performance Obligations
The following table presents estimated revenues expected to be recognized in the futurecorresponding period below related to performance obligations that are unsatisfied (or partially unsatisfied) at the end of reporting period. The estimated revenues do not include contracts with original duration of one year or less. The remaining revenue associated with our LTAs is expected to be approximately as follows:
| | | | | | | | | | | |
| 2022 | | 2023 through 2024 |
| (Dollars in millions) |
| Estimated LTA revenue | $910-$1,010 | | $350-100-$450135(1) |
(1) Includes expected termination fees from a few customers that have failed to meet certain obligations under their LTAs.
The majority of the LTAs are defined as pre-determined fixed annual volume contracts while a small portion are defined with a specified volume range. For the year 2022 and beyond,2024, the contractual revenue amounts above are based upon the minimum volume for those contracts with specified ranges. The actual revenue realized from these contracted volumes may vary in timing and total due to contract non-performance, force majeure notices, arbitrations, credit risk associated with certain customers facing financial challenges and customer demand related to contracted volume ranges.
In addition to the expected remaining revenue to be recognized with the LTAs, the Company recorded $1,040.2 million, $1,069.8 million and $1,437.4 million of revenue pursuant to these contracts in the year ended December 31, 2021, 2020 and 2019, respectively.
GRAFTECH INTERNATIONAL LTD. AND SUBSIDIARIES
NOTES TO THE CONSOLIDATED FINANCIAL STATEMENTS
(3) Stock-Based and Other Management Compensation
OurThe Company’s Omnibus Equity Incentive Plan permits the granting of options and other stock-based awards (including restricted stock units ("RSUs"(“RSUs”), deferred restricted stock units (“DRSUs”) performance-based restricted stock units (“PSUs”) and deferred share units ("DSUs"(“DSUs”)). As of December 31, 2021,2023, the aggregate number of shares authorized under the plan since its initial adoption was 15.0 million. Shares issued upon vesting of awards or exercise of options are new share issuances. Upon the vesting or payment of stock awards, an employee may elect receipt of the full share amount and either pay the resulting taxes or have the Company withhold shares to cover the tax obligation. At December 31, 2021, 12.12023, 9.5 million common stock shares were available for future issuance.
Stock-based compensation expense was $4.4 million, $2.3 million and $16.6 million $2.7 millionin 2023, 2022 and $2.1 million in 2021, 2020 and 2019, respectively. A majority of the expense, $4.0 million in 2023, $2.1 million in 2022 and $14.6 million in 2021, $2.3 million in 2020 and $1.9 million in 2019 was recorded as selling and administrative expenses in the Consolidated Statement of Operations, with the remaining expenses incurred as cost of sales.goods sold. Stock-based compensation expense for 2021 includesincluded $14.7 million, recorded in the second quarter of 2021, due to the Change in Control accelerated vesting provisions of certain of ourthe Company’s awards. For the purpose of these grants, a Change in Control occurred when Brookfield and any affiliates thereof ceased to own stock of the Company that constitutesconstituted at least thirty percent (30%) or thirty-five percent (35%), as applicable, of the total fair market value or total voting power of the stock of the Company. Out of the $14.7 million recorded with the Change in Control, $0.9 million accelerated at the 35% ownership level and the remaining $13.8 million accelerated at the 30% ownership level.
The Company derives a tax deduction measured by the excess of the market value over the grant price at the date stock-based compensation awards are exercised or vest. WeThe Company recognized tax expense of $0.2 million in 2023 and tax benefits of less than $0.1 million and $1.8 million of tax benefits in 2022 and 2021, compared to $0.5 million of tax benefits in both 2020 and 2019respectively, relating to the issuance of common stock for the exercise/vesting of equity awards.
Stock Options. Non-qualified stock options may be granted to our employees and directors. Stock options granted in 2023 vest over a five yearthree-year period, with one-third of the award vesting on the anniversary date of the grant in each of the next three years. Stock options granted prior to 2023 vest over a five-year period, with one-fifth of the award vesting on the anniversary date of the grant in each of the next five years andfollowing the grant date. All stock options expire 10 years from the date of grant. OptionStock option exercises are satisfied through the issuance of common shares. Compensation expense for stock options is based on the estimated fair value of the stock option on the date of the grant. We calculate the estimated fair value of the optionstock options using the Black-Scholes option-pricing model. The weighted average assumptions used in our Black-Scholes option pricing model for options granted in 2021, 20202023, 2022 and 20192021 were as follows:
| | 2021 | 2020 | | 2019 |
| | 2023 | | | | 2023 | 2022 | | 2021 |
| Dividend yield | Dividend yield | | 0.32% - 0.35% | 0.44% - 3.77% | | 2.39% - 3.05% | Dividend yield | | 0.71% - 0.83% | 0.40% - 0.56% | | 0.32% - 0.35% |
| Expected volatility | Expected volatility | | 62 | % | 50 | % | | 50 | % | Expected volatility | | 58.16 | % | 58.14 | % | | 61.62 | % |
| Risk-free interest rate | Risk-free interest rate | | 1.1% - 1.21% | 0.37% - 1.22% | | 1.79% - 2.63% | Risk-free interest rate | | 3.60% - 4.10% | 1.93% - 2.89% | | 1.1% - 1.21% |
| Expected term in years | Expected term in years | | 6.5 years | | 6.5 years | Expected term in years | | 6.0 years | 6.5 years | | 6.5 years |
Dividend Yield. Our dividend yield estimate is based on our expected dividends and the stock price on the grant date.
Expected Volatility. For 2021 and 2020, we estimatedWe estimate the volatility of our common stock at the date of grant based on the historical volatility of the Company’s stock. The volatility factor we use is based on our historical closing prices since our stock has been publicly traded. For 2019, we estimated the volatility of our common stock at the date of grant based on the historical volatility of comparable companies over the most recent period commensurate with the expected life of the award.
Risk-Free Interest Rate. We base the risk-free interest rate on the implied yield currently available on U.S. Treasury zero-coupon issues with an equivalent remaining term equal to the expected life of the award.
Expected Term In Years. The expected life of awards granted represents the time period that the awards are expected to be outstanding. We determined the expected term of the grants using the “simplified” method as described by the SEC, since we do not have a history of stock option awards to provide a reliable basis for estimating such term.
GRAFTECH INTERNATIONAL LTD. AND SUBSIDIARIES
NOTES TO THE CONSOLIDATED FINANCIAL STATEMENTS
The following table summarizes activity related to stock options during 2021:2023:
| | | | | | | | | | | | | | | | | | | | | | | | | | |
| | Number
of Options | | Weighted-
Average
Exercise
Price Per Share | | Aggregate Intrinsic Value (thousands) | | Weighted Average Remaining Term (Years) |
| Outstanding at December 31, 2020 | | 1,248,935 | | | $ | 13.66 | | | | | |
| Granted | | 479,500 | | | $ | 11.49 | | | | | |
| Exercised | | (39,700) | | | $ | 10.67 | | | | | |
| Forfeited or expired | | (72,015) | | | $ | 14.02 | | | | | |
| Outstanding at December 31, 2021 | | 1,616,720 | | | $ | 13.08 | | | $ | 972,123 | | | 7.6 years |
| Vested and Expected to vest as of December 31, 2021 | | 1,616,720 | | | $ | 13.08 | | | $ | 972,123 | | | 7.6 years |
| Exercisable at December 31, 2021 | | 1,500,800 | | | $ | 12.79 | | | $ | 972,123 | | | 7.6 years |
| | | | | | | | | | | | | | | | | | | | | | | | | | |
| | Number
of Options | | Weighted-
Average
Exercise
Price Per Share | | Aggregate Intrinsic Value (thousands) | | Weighted Average Remaining Term (Years) |
| Outstanding at December 31, 2022 | | 1,890,167 | | | $ | 12.30 | | | | | |
| Granted | | 519,482 | | | 5.51 | | | | | |
| Exercised | | — | | | — | | | | | |
| Forfeited or expired | | (382,038) | | | 8.56 | | | | | |
| Outstanding at December 31, 2023 | | 2,027,611 | | | $ | 11.27 | | | $ | — | | | 6.5 years |
| Vested and Expected to vest as of December 31, 2023 | | 2,027,611 | | | $ | 11.27 | | | $ | — | | | 6.5 years |
| Exercisable at December 31, 2023 | | 1,444,617 | | | $ | 12.84 | | | $ | — | | | 5.7 years |
Outstanding options have exercise prices ranging from $7.28$4.83 per share to $20.00 per share.
A summary of the status and changes of stock options and the related average price per share follows:
| | Number
of Options | | Weighted-
Average
Grant Date Fair Value |
| Outstanding unvested as of December 31, 2020 | | 906,361 | | | $ | 4.94 | |
| | Number
of Options | | | | Number
of Options | | Weighted-
Average
Grant Date Fair Value |
| Outstanding unvested as of December 31, 2022 | |
| Granted | Granted | | 479,500 | | | 6.50 | |
| Vested | Vested | | (1,227,592) | | | 5.38 | |
| Forfeited | Forfeited | | (42,349) | | | 5.09 | |
| Outstanding unvested as of December 31, 2021 | | 115,920 | | | $ | 6.64 | |
| Outstanding unvested as of December 31, 2023 | |
We recognized stock-based compensation expense of $0.8 million, $0.6 million and $5.9 million $1.1 millionin 2023, 2022 and $1.2 million in 2021, 2020 and 2019, respectively, relating to stock options. As of December 31, 2021,2023, there was $0.5$1.8 million of total unrecognized compensation cost related to unvested stock options, which is expected to be amortized over a weighted average period of 1.42.7 years. The total fair value of sharesoptions vested was $0.7 million in 2023, $0.3 million in 2022 and $6.6 million in 2021 and $1.1 million in both 2020 and 2019.2021. There were 25,000 and 39,700 options exercised during 2021.2022 and 2021, respectively. No options were exercised during 2020 or 2019.2023. Cash received from option exercises during 2022 and 2021 was $0.2 million and $0.4 million. million, respectively.
RSUs.RSUs - Employees. RSUs constitute an agreement to deliver shares of common stock to the participant at the end of a vesting period. Compensation expense for RSUs is based on the closing price of our common stock on the date of grant, less forfeitures or cancellations of awards throughout the vesting period. RSUs granted in 2023 vest over a five yearthree-year period, with one-third of the award vesting on the anniversary date of the grant in each of the next three years. RSUs granted prior to 2023 vest over a five-year period, with one-fifth of the award vesting on the anniversary date of the grant in each of the next five years.years following the grant date. A summary of the status and changes of shares subject to RSU awards for employees and the related average price per share follows:
| | Number
of Shares | | Weighted-
Average
Grant Date
Fair Value |
| Outstanding unvested as of December 31, 2020 | | 502,770 | | | $ | 10.28 | |
| | Number
of Shares | | | | Number
of Shares | | Weighted-
Average
Grant Date
Fair Value |
| Outstanding unvested as of December 31, 2022 | |
| Granted | Granted | | 515,960 | | | 11.49 | |
| Cancelled | Cancelled | | (16,795) | | | 10.78 | |
| Vested | Vested | | (999,239) | | | 10.88 | |
| Outstanding unvested as of December 31, 2021 | | 2,696 | | | $ | 13.96 | |
| Outstanding unvested as of December 31, 2023 | |
During 2021, 2020 and 2019, we recognized stock-based compensation expense of $10.0 million, $1.0 million and $0.5 million, respectively, relating to RSU awards for employees. The total fair value of RSU awards vested during 2021 and 2020 was $10.8 million and $0.6 million, respectively. No RSUs vested in 2019. As of December 31, 2021, less than
GRAFTECH INTERNATIONAL LTD. AND SUBSIDIARIES
NOTES TO THE CONSOLIDATED FINANCIAL STATEMENTS
$0.1During 2023, 2022 and 2021, we recognized stock-based compensation expense of $1.7 million, $0.7 million and $10.0 million, respectively, relating to RSU awards for employees. The total fair value of RSU awards vested during 2023, 2022 and 2021 was $0.9 million, less than $0.1 million and $10.8 million, respectively. As of December 31, 2023, $4.8 million of expense with respect to non-vested RSUs has yet to be recognized and will be amortized into expense over a weighted-average period of approximately 1.32.7 years.
PSUs. Beginning in 2023,executive officers and selected other employees receive PSU awards. Payouts, in the form of unrestricted common stock, vary between 0% and 200% based on the degree to which the Company’s total shareholder return relative to a peer group’s performance exceeds predetermined threshold, target and maximum performance goals over three-year performance periods with measurement periods after 12-, 24-, and 36-months. No payout will occur unless threshold performance is achieved. The following table summarizes the activity related to PSUs during 2023:
| | | | | | | | | | | | | | |
| | Number
of Shares | | Weighted-
Average
Grant Date
Fair Value |
| Outstanding as of December 31, 2022 | | — | | | $ | — | |
| Granted | | 544,801 | | | 7.30 | |
| Vested | | — | | | — | |
| Forfeited | | (196,786) | | | 7.43 | |
| Outstanding as of December 31, 2023 | | 348,015 | | | $ | 7.23 | |
The fair value of grants of PSUs is determined using a Monte Carlo valuation. Total compensation expense for PSUs in 2023 was $0.7 million. As of December 31, 2023, there was $1.8 million of unrecognized compensation cost related to PSUs.
RSUs and DRSUs - Non-Employee Directors. Beginning in 2023, non-employee directors receive annual grants of service-based RSUs that are expected to vest six months after the date of grant, subject generally to a non-employee director’s continued service on the Company’s Board of Directors. Compensation expense for RSUs and DRSUs is based on the closing price of our common stock on the date of grant, less forfeitures or cancellations of awards throughout the vesting period. Non-employee directors have the option to elect to defer receipt of their vested RSUs and instead be granted service-based DRSUs that are equivalent in value to the RSUs. DRSUs will be paid out either as soon as practicable following the date of termination of the director’s service as a director (but in any event no later than the last day of the calendar year in which such termination occurs) in a single lump sum or in substantially equal 20% installments on the first five annual anniversaries of the date of termination of service as a director. The following table summarizes RSU and DRSU activity during 2023 for our non-employee directors:
| | | | | | | | | | | | | | |
| | Number
of Shares | | Weighted-
Average
Grant Date
Fair Value |
| Outstanding as of December 31, 2022 | | — | | | $ | — | |
| Granted | | 154,894 | | | 4.24 | |
| Vested and delivered | | (23,971) | | | 4.18 | |
| Outstanding vested and deferred as of December 31, 2023 | | 130,923 | | | $ | 4.25 | |
The Company recognized $0.6 million of expense related to these awards in 2023.
DSUs. DSUs are primarily granted to our independentnon-employee directors in lieu of cash retainers and vest immediately upon grant. All whole DSUs will be settled in shares of our common stock after the Director's termination of service on the Board and any fractional shares will be settled in cash. The following table summarizes DSU activity during 2023:
GRAFTECH INTERNATIONAL LTD. AND SUBSIDIARIES
NOTES TO THE CONSOLIDATED FINANCIAL STATEMENTS
| | | | | | | | | | | | | | |
| | Number
of Shares | | Weighted-
Average
Grant Date
Fair Value |
| Outstanding as of December 31, 2022 | | 362,640 | | | $ | 8.80 | |
| Granted | | 152,509 | | | 3.59 | |
| Distributed | | (137,609) | | | 9.34 | |
| Outstanding vested and deferred as of December 31, 2023 | | 377,540 | | | $ | 6.52 | |
During 2021, we granted 61,351 DSUs to our independent directors with a weighted-average grant date fair value of $11.48 per share. During 2021, 20202023, 2022 and 2019,2021, we recognized stock-based compensation expense of $0.7 million, $0.6 million, $1.0 million and $0.4$0.7 million, respectively, relating to DSU awards. The total fair value of DSU awards vested during 2021, 2020was $0.5 million in 2023 and 2019 was $1.0 million $0.5 millionin both 2022 and $0.4 million, respectively.2021.
Annual Cash Incentive Plan
We have a global annual cash incentive program for the majority of our worldwide salaried and hourly employees, the Short-Term Incentive Program (the “STIP”). In 2021, the STIP is based primarily on the performance metric of adjusted EBITDA, a non-GAAP financial measure. See Item 7. Management's Discussion and Analysis of Financial Condition and Results of Operations in this Annual Report for additional information, as well as a reconciliation of adjusted EBITDA to net income, the most directly comparable financial measure calculated and presented in accordance with GAAP. The balance of our accrued liability for the STIP was $10.9 million at December 31, 2021 and $8.9 million as of December 31, 2020.
(4) Segment Reporting
Our Industrial Materials segment, our only reportable segment, manufactures high-quality graphite electrodes essential to the production of EAF steel and other ferrous and non-ferrous metals. Petroleum needle coke, a crystalline form of carbon derived from decant oil, is a key raw material used in the production of graphite electrodes. We utilize substantially allthe majority of the needle coke that we produce internally to manufacture our graphite electrodes and as a result approximately 96%95% of our revenues from external customers are derived from the sale of graphite electrodes. In 2021, noNo single customer accounted for 10% or more than 10% of ourthe Company's net sales.sales in 2023, 2022 or 2021.
The following tables summarize information as to ourthe Company's operations in different geographic areas:
| | 2021 | | 2020 | | 2019 |
| Year Ended December 31, | | | Year Ended December 31, |
| 2023 | | | 2023 | | 2022 | | 2021 |
| | | (Dollars in thousands) | | (Dollars in thousands) |
| Net sales: | Net sales: | |
| United States | |
| United States | |
| United States | United States | $ | 285,710 | | | $ | 260,867 | | | $ | 403,916 | |
| Americas (excluding the United States) | Americas (excluding the United States) | 241,442 | | | 187,779 | | | 348,670 | |
| Asia Pacific | Asia Pacific | 154,084 | | | 127,415 | | | 172,439 | |
| Europe, Middle East, Africa | Europe, Middle East, Africa | 664,552 | | | 648,300 | | | 865,768 | |
| Total | Total | $ | 1,345,788 | | | $ | 1,224,361 | | | $ | 1,790,793 | |
| | | | At December 31, | | December 31, |
| 2021 | | 2020 | 2023 | | 2022 |
| (Dollars in thousands) | (Dollars in thousands) |
| Long-lived assets (a): | Long-lived assets (a): | |
| United States | |
| United States | |
| United States | United States | $ | 179,003 | | | $ | 169,208 | |
| Mexico | Mexico | 123,997 | | | 132,867 | |
| Brazil | Brazil | 4,090 | | | 4,309 | |
| France | France | 93,579 | | | 92,805 | |
| Spain | Spain | 100,248 | | | 106,467 | |
| Other countries | Other countries | 556 | | | 561 | |
| Total | Total | $ | 501,473 | | | $ | 506,217 | |
(a)Long-lived assets represent fixed assets, net of accumulated depreciation.
GRAFTECH INTERNATIONAL LTD. AND SUBSIDIARIES
NOTES TO THE CONSOLIDATED FINANCIAL STATEMENTS
(5) Debt and Liquidity
The following table presents our long-term debt:
| | | | | | | | | | | |
| As of
December 31, 2021 | | As of
December 31, 2020 |
| | (Dollars in thousands) |
| 2018 Term Loan Facility | $ | 543,708 | | | $ | 943,708 | |
| 2020 Senior Secured Notes | 500,000 | | | 500,000 | |
| Other Debt | 429 | | | 615 | |
| Unamortized debt discount and issuance costs | (14,449) | | | (24,192) | |
| Total Debt | 1,029,688 | | | 1,420,131 | |
| Less: Short-term Debt | (127) | | | (131) | |
| Long-term Debt | $ | 1,029,561 | | | $ | 1,420,000 | |
| | | | | | | | | | | |
|
December 31, 2023 | |
December 31, 2022 |
| | (Dollars in thousands) |
| 2018 Term Loan Facility | $ | — | | | $ | 433,708 | |
| 2020 Senior Secured Notes | 500,000 | | | 500,000 | |
| 2023 Senior Secured Notes | 450,000 | | | — | |
| Other debt | 139 | | | 268 | |
| Unamortized debt discount and issuance costs | (24,494) | | | (12,049) | |
| Total debt | 925,645 | | | 921,927 | |
| Less: Long-term debt, current portion | (134) | | | (124) | |
| Long-term debt | $ | 925,511 | | | $ | 921,803 | |
2018 Term Loan and 2018 Revolving Credit Facility
In February 2018, the Company entered into a credit agreement (the(as amended, the “2018 Credit Agreement”), which providesprovided for (i) a $2,250 million senior secured term facility (the “2018 Term Loan Facility”) after giving effect to the June 2018 amendment (the “First Amendment”) that increased the aggregate principal amount of the 2018 Term Loan Facility from $1,500 million to $2,250 million and (ii) a $250$330 million senior secured revolving credit facility after giving effect to the May 2022 amendment that increased the revolving commitments under the 2018 Credit Agreement by $80 million from $250 million (the “2018 Revolving Credit Facility” and, together with the 2018 Term Loan Facility, the “Senior Secured Credit Facilities”). GrafTech Finance Inc. (“GrafTech Finance”) iswas the sole borrower under the 2018 Term Loan Facility while GrafTech Finance, GrafTech Switzerland SA (“Swissco”) and GrafTech Luxembourg II S.à.r.l. (“Luxembourg Holdco” and, together with GrafTech Finance and Swissco, the “Co-Borrowers”) are co-borrowers under the 2018 Revolving Credit Facility. The 2018 Revolving Credit Facility matures on May 31, 2027. The net proceeds from the 2023 Senior Secured Notes were used to repay outstanding borrowings under our 2018 Term Loan Facility. As of December 31, 2023 and 2022, the availability under our 2018 Revolving Credit Facility was $112.4 million and $327.0 million, respectively. As any borrowings under the 2018 Revolving Credit Facility mature on February 12, 2025 and February 12,remain subject to compliance with the financial covenant thereunder, our operating performance as of December 31, 2023 respectively.resulted in a reduction under the facility. As of December 31, 20212023 and 2020,2022, there waswere no debtborrowings outstanding on the 2018 Revolving Credit Facility and there was $3.3$3.1 million and $3.6$3.0 million of letters of credit drawn against the 2018 Revolving Credit Facility respectively.
The 2018 Term Loan Facility bears interest, at our option, at a rate equal to either (i) the Adjusted LIBO Rate (as defined in the 2018 Credit Agreement), plus an applicable margin equal to 3.00% per annum following an amendment in February 2021 (the “Second Amendment”) that decreased the Applicable Rate (as defined in the 2018 Credit Agreement) by 0.50% foras of each pricing level or (ii) the ABR Rate (as defined in the 2018 Credit Agreement), plus an applicable margin equal to 2.00% per annum following the Second Amendment, in each case with one step down of 25 basis points based on achievement of certain public ratings of the 2018 Term Loan Facility. The Second Amendment also decreased the interest rate floor from 1.0% to 0.50% for the 2018 Term Loan Facility.date, respectively.
The 2018 Revolving Credit Facility bears interest, at our option, at a rate equal to either (i) the Adjusted LIBOTerm SOFR Rate and Adjusted EURIBOR Rate (each, as defined in the 2018 Credit Agreement), plus an applicable margin initially equal to 3.75%3.00% per annum or (ii) the ABR Rate, plus an applicable margin initially equal to 2.75%2.00% per annum, in each case with two 25 basis point step downs based on achievement of certain senior secured first lien net leverage ratios. In addition, we are required to pay a quarterly commitment fee on the unused commitments under the 2018 Revolving Credit Facility in an amount equal to 0.25% per annum.
The Senior Secured2018 Revolving Credit Facilities areFacility is guaranteed by each of our domestic subsidiaries, subject to certain customary exceptions, and by GrafTech Luxembourg I S.à.r.l., a Luxembourg société à responsabilité limitée and an indirect wholly owned subsidiary of GrafTech, Luxembourg HoldCo, and Swissco (collectively, the “Guarantors”) with respect to all obligations under the 2018 Revolving Credit AgreementFacility of each of our foreign subsidiaries that is a Controlled Foreign Corporation (within the meaning of Section 956 of the Internal Revenue Code of 1986, as amended from time to time (the “Code”)).
AllAny obligations under the 2018 Revolving Credit AgreementFacility are secured, subject to certain exceptions, by: (i) a pledge of all of the equity securities of each domestic Guarantor and of each other direct, wholly owned domestic subsidiary of GrafTech and any Guarantor, (ii) a pledge on no more than 65% of the equity interests of each subsidiary that is a Controlled Foreign Corporation (within the meaning of Section 956 of the Code), and (iii) security interests in, and mortgages on, personal property and material real property of each domestic Guarantor, subject to permitted liens and certain exceptions specified in the 2018 Revolving Credit Agreement.Facility. The obligations of each foreign subsidiary of GrafTech that is a Controlled Foreign Corporation under the 2018 Revolving Credit Facility are secured by (i) a pledge of all of the equity securities of each Guarantor that is a Controlled Foreign Corporation and of each direct, wholly owned subsidiary of any Guarantor that is a Controlled Foreign Corporation,
GRAFTECH INTERNATIONAL LTD. AND SUBSIDIARIES
NOTES TO THE CONSOLIDATED FINANCIAL STATEMENTS
Corporation, and (ii) security interests in certain receivables and personal property of each Guarantor that is a Controlled Foreign Corporation, subject to permitted liens and certain exceptions specified in the 2018 Revolving Credit Agreement.Facility.
The 2018 Term LoanRevolving Credit Facility amortizes at a rate of $112.5 million a year payable in equal quarterly installments, with the remainder due at maturity. The Co-Borrowers are permitted to make voluntary prepayments at any time without premium or penalty. GrafTech Finance is required to make prepayments under the 2018 Term Loan Facility (without payment of a premium) with (i) net cash proceeds from non-ordinary course asset sales (subject to customary reinvestment rights and other customary exceptions and exclusions), and (ii) commencing with the Company’s fiscal year ended December 31, 2019, 75% of Excess Cash Flow (as defined in the 2018 Credit Agreement), subject to step-downs to 50% and 0% of Excess Cash Flow based on achievement of a senior secured first lien net leverage ratio greater than 1.25 to 1.00 but less than or equal to 1.75 to 1.00 and less than or equal to 1.25 to 1.00, respectively. Scheduled quarterly amortization payments of the 2018 Term Loan Facility during any calendar year reduce, on a dollar-for-dollar basis, the amount of the required Excess Cash Flow prepayment for such calendar year, and the aggregate amount of Excess Cash Flow prepayments for any calendar year reduce subsequent quarterly amortization payments of the 2018 Term Loan Facility as directed by GrafTech Finance. As of December 31, 2021, we have satisfied all required amortization installments through the maturity date.
The 2018 Credit Agreement contains customary representations and warranties and customary affirmative and negative covenants applicable to GrafTech and restricted subsidiaries, including, among other things, restrictions on indebtedness, liens, investments, fundamental changes, dispositions, and dividends and other distributions. The 2018 Revolving Credit AgreementFacility contains a financial covenant that requires GrafTech to maintain a senior secured first lien net leverage ratio not greater than 4.00:4.00 to 1.00 when the aggregate principal amount of borrowings under the 2018 Revolving Credit Facility and outstanding letters of credit issued under the 2018 Revolving Credit Facility (except for undrawn letters of credit in an aggregate amount equal to or less than $35$35.0 million), taken together, exceed 35% of the total amount of commitments under the 2018 Revolving Credit Facility. The 2018 Revolving Credit AgreementFacility also contains customary events of default.
2020 Senior Secured Notes
In December 2020, GrafTech Finance issued $500$500.0 million aggregate principal amount of 4.625% senior secured notes due 2028 (the “2020 Senior Secured Notes”) in a private offering. The 2020 Senior Secured Notes and related guarantees are secured on a pari passu basis by the collateral securing the 2018 Revolving Credit Facility and the 2023 Senior Secured Credit Facilities.Notes. All of the net proceeds from the 2020 Senior Secured Notes were used to partially repay borrowings under our 2018 Term Loan Facility.
The 2020 Senior Secured Notes pay interest in arrears on June 15 and December 15 of each year, with the principal due in full on December 15, 2028. Prior to December 15, 2023, up to 40% of the 2020 Senior Secured Notes may be redeemed with the net cash proceeds of certain equity offerings at a price equal to 104.625% of the principal amount thereof, together with accrued and unpaid interest, if any. The 2020 Senior Secured Notes may becould have been redeemed, in whole or in part, at any time prior to December 15, 2023 at a price equal to 100% of the principal amount of the notes redeemed plus a premium together with accrued and unpaid interest, if any, to, but not including, the redemption date. Thereafter, the 2020 Senior Secured Notes may be redeemed, in whole or in part, at various prices depending on the date redeemed.
The indenture governing the 2020 Senior Secured Notes (the “Indenture”“ 2020 Indenture”) contains certain covenants that, among other things, limit the Company’s ability, and the ability of certain of its subsidiaries, to incur or guarantee additional indebtedness or issue preferred stock, pay distributions on, redeem or repurchase capital stock or redeem or repurchase subordinated debt, incur or suffer to exist liens securing indebtedness, make certain investments, engage in certain transactions with affiliates, consummate certain asset sales and effect a consolidation or merger, or sell, transfer, lease or otherwise dispose of all or substantially all assets. Pursuant to the Indenture, if our pro forma consolidated first lien net leverage ratio is no greater than 2.00 to 1.00, we can make restricted payments so long as no default or event of default has occurred and is continuing. If our pro forma consolidated first lien net leverage ratio is greater than 2.00 to 1.00, we can make restricted payments pursuant to certain baskets.
The 2020 Indenture contains events of default customary for agreements of its type (with customary grace periods, as applicable) and provides that, upon the occurrence of an event of default arising from certain events of bankruptcy or insolvency with respect to the Company or GrafTech Finance, all outstanding 2020 Senior Secured Notes will become due and payable immediately without further action or notice. If any other type of event of default occurs and is continuing, then the trustee or the holders of at least 30% in principal amount of the then outstanding 2020 Senior Secured Notes may declare all of the 2020 Senior Secured Notes to be due and payable immediately. We were in compliance with all of our debt covenants as of December 31, 2023 and 2022.
2023 Senior Secured Notes
In June 2023, GrafTech Global Enterprises Inc. issued $450 million aggregate principal amount of 9.875% senior secured notes due 2028 (the “2023 Senior Secured Notes”), including $11.4 million of original issue discount. The 2023 Senior Secured Notes were issued at an issue price of 97.456% of the principal amount thereof in a private offering. The 2023 Senior Secured Notes and related guarantees are secured on a pari passu basis by the collateral securing the 2018 Revolving Credit Facility and the 2020 Senior Secured Notes. The net proceeds from the 2023 Senior Secured Notes were used to repay borrowings under our 2018 Term Loan Facility.
The 2023 Senior Secured Notes pay interest in arrears on June 15 and December 15 of each year, with the principal due in full on December 15, 2028. Prior to December 15, 2025, up to 40% of the 2023 Senior Secured Notes may be redeemed with the net cash proceeds of certain equity offerings at a price equal to 109.875% of the principal amount thereof, together with accrued and unpaid interest, if any. The 2023 Senior Secured Notes may be redeemed, in whole or in part, at any time
GRAFTECH INTERNATIONAL LTD. AND SUBSIDIARIES
NOTES TO THE CONSOLIDATED FINANCIAL STATEMENTS
prior to December 15, 2025 at a price equal to 100% of the principal amount of the notes redeemed plus a premium together with accrued and unpaid interest, if any, to, but not including, the redemption date. Thereafter, the 2023 Senior Secured Notes may be redeemed, in whole or in part, at various prices depending on the date redeemed.
The indenture governing the 2023 Senior Secured Notes (the “2023 Indenture”) contains certain covenants that, among other things, limit the Company’s ability, and the ability of certain of its subsidiaries, to incur or guarantee additional indebtedness or issue preferred stock, pay distributions on, redeem or repurchase capital stock or redeem or repurchase subordinated debt, incur or suffer to exist liens securing indebtedness, make certain investments, engage in certain transactions with affiliates, consummate certain asset sales and effect a consolidation or merger, or sell, transfer, lease or otherwise dispose of all or substantially all assets. Pursuant to the 2023 Indenture, if our pro forma consolidated first lien net leverage ratio is no greater than 2.00 to 1.00, we can make restricted payments so long as no default or event of default has occurred and is continuing. If our pro forma consolidated first lien net leverage ratio is greater than 2.00 to 1.00, we can make restricted payments pursuant to certain baskets.
The 2023 Indenture contains events of default customary for agreements of its type (with customary grace periods, as applicable) and provides that, upon the occurrence of an event of default arising from certain events of bankruptcy or insolvency with respect to the Company or GrafTech Global Enterprises Inc., all outstanding 2023 Senior Secured Notes will become due and payable immediately without further action or notice. If any other type of event of default occurs and is continuing, then the trustee or the holders of at least 30% in principal amount of the then outstanding 2023 Senior Secured Notes may declare all of the 2023 Senior Secured Notes to be due and payable immediately. We were in compliance with all of our debt covenants as of December 31, 2023.
Maturities on long-term debt instruments as of December 31, 2023 are as follows:
| | | | | |
| | (Dollars in thousands) |
| 2024 | $ | 139 | |
| 2025 | — | |
| 2026 | — | |
| 2027 | — | |
| 2028 | 950,000 | |
| 2029 and thereafter | — | |
| Total | $ | 950,139 | |
.
(6) Goodwill and Other Intangible Assets
We are required to review goodwillGoodwill
Goodwill arises from the purchase price for acquired businesses exceeding the fair value of tangible and indefinite-lived intangible assets annually for impairment. acquired less assumed liabilities. The Company has two reporting units, Graphite Electrodes and Needle Coke. The acquisition of the Company by Brookfield in 2015 generated a goodwill amount of $171.1 million, which was allocated entirely to the Graphite Electrode reporting unit.
Goodwill impairment is tested at the reporting unit level on an annual basisfor impairment annually as of December 31 and between annual tests if an event occurswhenever events or circumstances changeindicate that would more likely than not reduce the faircarrying value of a reporting unit belowmay exceed its fair value.
For the 2023 annual impairment testing, the Company performed a quantitative assessment of the fair value of the reporting unit, using a combination of the income approach and the market approach (Level 3 in the fair value hierarchy) from a market participant’s perspective. The valuation of the Graphite Electrode reporting unit is performed with cash flows that are adjusted to present this reporting unit as purchasing petroleum needle coke entirely from third parties at anticipated market prices.
GRAFTECH INTERNATIONAL LTD. AND SUBSIDIARIES
NOTES TO THE CONSOLIDATED FINANCIAL STATEMENTS
The income approach was based on discounted projected debt-free cash flows for the graphite electrode reporting unit. The forecast of cash flows included several assumptions regarding future sales growth, revenues, earnings before interest, taxes, depreciation and amortization (“EBITDA”), capital expenditures and working capital changes. In addition to the estimates of future cash flows, the income approach involves the determination of the discount rate based upon market participant’s assumptions.
The market approach fair value was based on valuation multiples that were applied to the graphite electrode reporting unit’s actual and projected EBITDA. The multiples were derived under the guideline public company method from analyzing market multiples of EBITDA for a group of comparable public companies. The techniques used in the Company’s assessment incorporate a number of assumptions that the Company believes to be reasonable and to reflect known market conditions at the measurement date.
Key assumptions relate to customer demand and sales growth, graphite electrode and needle coke pricing trends, operating costs and capital expenditures. Assumptions in estimating future cash flows are subject to a degree of judgment.
The testing determined that the fair value of the Graphite Electrode reporting unit was less than its carrying value. amount by more than the amount of goodwill. As a result, we recorded a full impairment charge of $171.1 million, which was recorded in Goodwill impairment charges in the Consolidated Statements of Income. The goodwill impairment was caused primarily by reduced sales of graphite electrodes due to softening demand and the deterioration of the electrode spot pricing.
For the years ended December 31,2022 and 2021 annual goodwill impairment testing, the Company performed a qualitative assessment first to determine whether it was more likely than not that the fair value of the Graphite Electrode reporting unit was less than its carrying amount. We assessed relevant events and 2020, an assessment for potentialcircumstances, including industry, market and macroeconomic conditions, as well as Company and reporting unit-specific factors. Based on this review, we determined that it was not more likely than not that the fair value of the Graphite Electrode reporting unit was less than its carrying amount and concluded that the quantitative goodwill impairment was performed and an impairment adjustmenttest was not required. There has been no change in the carrying valueNo impairment of goodwill for the years 2020resulted from our annual impairment tests in 2022 and 2021.
Intangible Assets
The following table summarizes acquired intangible assets with determinable useful lives by major category which are included in "Other assets" on our Consolidated Balance Sheets:
| | | | As of December 31, 2021 | | As of December 31, 2020 | | December 31, 2023 | | December 31, 2022 |
Gross
Carrying
Amount | | Accumulated
Amortization | | Net
Carrying
Amount | | Gross
Carrying
Amount | | Accumulated
Amortization | | Net
Carrying
Amount | Gross
Carrying
Amount | | Accumulated
Amortization | | Net
Carrying
Amount | | Gross
Carrying
Amount | | Accumulated
Amortization | | Net
Carrying
Amount |
| (Dollars in thousands) | (Dollars in thousands) |
| Trade name | $ | 22,500 | | | $ | (13,935) | | | $ | 8,565 | | | $ | 22,500 | | | $ | (11,932) | | | $ | 10,568 | |
| Trade names | |
| Technology and know-how | Technology and know-how | 55,300 | | | (38,486) | | | 16,814 | | | 55,300 | | | (34,091) | | | 21,209 | |
| Customer related intangible | 64,500 | | | (28,195) | | | 36,305 | | | 64,500 | | | (23,848) | | | 40,652 | |
| Customer-related intangibles | |
| Total finite-lived intangible assets | Total finite-lived intangible assets | $ | 142,300 | | | $ | (80,616) | | | $ | 61,684 | | | $ | 142,300 | | | $ | (69,871) | | | $ | 72,429 | |
Amortization expense of intangible assets was $9.2 million, $10.1 million and $10.7 million $11.4 millionin 2023, 2022 and $12.2 million in 2021, 2020 and 2019, respectively. Estimated annual amortization expense for the next five years will approximate $10.1 million in 2022, $9.2 million in 2023, $8.0 million in 2024, $7.3 million in 2025, and $6.7 million in 2026.2026, $6.1 million in 2027 and $5.5 million in 2028.
GRAFTECH INTERNATIONAL LTD. AND SUBSIDIARIES
NOTES TO THE CONSOLIDATED FINANCIAL STATEMENTS
(7) Interest Expense
The following table presents an analysis of interest expense:
| | | | For the Year Ended December 31 | | Year Ended December 31, |
| 2021 | | 2020 | | 2019 |
| 2023 | | | 2023 | | 2022 | | 2021 |
| | | (Dollars in thousands) | | (Dollars in thousands) |
| Interest incurred on debt | Interest incurred on debt | $ | 56,731 | | | $ | 83,555 | | | $ | 121,010 | |
| | Accretion of original issue discount on 2018 Term Loan Facility | 3,387 | | | 5,340 | | | 2,196 | |
| Accretion of original issue discount | |
| Amortization of debt issuance and modification costs | Amortization of debt issuance and modification costs | 8,642 | | | 9,179 | | | 4,125 | |
| Amortization of interest rate swap deferred gains | |
| Unrealized (gain) loss on termination of de-designated interest rate swap | |
| Realized gain on termination of de-designated interest rate swap | |
| Total interest expense | Total interest expense | $ | 68,760 | | | $ | 98,074 | | | $ | 127,331 | |
Interest ratesIn June 2023, the net proceeds from the issuance of the 2023 Senior Secured Notes were used to repay the $433.7 million of principal outstanding on the 2018 Term Loan Facility. The repayment of the 2018 Term Loan Facility was accounted for as a debt extinguishment and triggered $1.2 million of accelerated accretion of the original issue discount and $1.9 million of accelerated amortization of debt issuance costs. The 2023 Senior Secured Notes were accounted for as new debt and the related discount and debt issuance costs were deferred.
In connection with the repayment of the 2018 Term Loan Facility in June 2023, we terminated the outstanding interest rate swap contracts that were in place to fix the cash flows associated with the risk in variability in the one-month USD London Interbank Offered Rate (“USD LIBOR”) for the 2018 Term Loan Facility. As a result of the swaps termination, we recorded in interest expense realized gains of $6.9 million relative to our de-designated swap and we deferred realized gains of $13.5 million in accumulated other comprehensive income (“AOCI”) in connection with our designated swap. The gains deferred into AOCI for the designated swap will amortize into interest expense until August 2024, consistent with the term of the discontinued cash-flow hedging relationship.
The 2023 Senior Secured Notes and the 2020 Senior Secured Notes carry a fixed interest raterates of 9.875% and 4.625%., respectively. The 2018 Term Loan Facility, which was paid off in its entirety in June 2023, had an effective interest rate of 3.50%7.38% as of December 31, 2021, 4.50% as of December 31, 2020 and 5.30% as of December 31, 2019. See Note 5, "Debt and Liquidity" for details of these transactions.2022.
In 2021 we2022, the Company made voluntary prepayments for a total of $400$110.0 million under ourits 2018 Term Loan Facility. In connection with this, wethe Company recorded $0.5 million of accelerated accretion of the original issue discount and $0.8 million of accelerated amortization of the debt issuance cost.
In 2021, the Company made voluntary prepayments of $400.0 million under its 2018 Term Loan Facility. In connection with this, the Company recorded $2.3 million of accelerated accretion of the original issue discount and we recorded $3.7 million of accelerated amortization of the debt issuance costs. WeThe Company also recorded $1.6 million of modification costs related to the 2018 Term Loan Facility repricing in the first quarter of 2021.
See Note 5, "Debt“Debt and Liquidity"Liquidity” for details of the Second Amendment.
In December 2020, the proceeds from the issuance of the $500 million 2020 Senior Secured Notes were used to repay $500 million of principal on the 2018 Term Loan Facility. The repayment of the 2018 Term Loan Facility was accounted for as a partial debt extinguishment and triggered $3.2 million of accelerated accretion of the original issue discount and $5.2 million of accelerated amortization of the debt issuance costs. The 2020 Senior Secured Notes were accounted for as newour debt and the related debt issuance costs were deferred.
The Company has several interest rate swap contracts to fix our cash flows associated with the risk in variability in the one-month U.S. London Interbank Offered Rate ("USD LIBOR") for a portion of our outstanding debt. See Note 8, " Fair“Fair Value Measurements and Derivative Instruments"Instruments” for additional details of these transactions.on our interest rate swaps and embedded derivative.
(8) Fair Value Measurements and Derivative Instruments
Fair Value Measurements
Depending on the inputs, we classify each fair value measurement as follows:
•Level 1 – based upon quotedQuoted market prices for identical instruments in active markets for identical assets or liabilities.
•Level 2 – based upon quoted prices for similar instruments, prices for identical or similar instruments in marketsInputs other than Level 1 inputs that are not active,either directly or model-derived valuations of all of whose significant inputs are observable, andindirectly observable.
•Level 3 – based upon one or more significant unobservable inputs.Unobservable inputs developed using estimates and assumptions developed by the Company, which reflect those that a market participant would use.
GRAFTECH INTERNATIONAL LTD. AND SUBSIDIARIES
NOTES TO THE CONSOLIDATED FINANCIAL STATEMENTS
The following section describes key inputs and assumptions used in valuation methodologiestables present the classification of our assets and liabilities measured at fair value on a recurring basis:
Cash | | | | | | | | | | | | | | | | | | | | | | | |
| December 31, 2023 | Total | | Level 1 | | Level 2 | | Level 3 |
| Assets: | (Dollars in thousands) |
| Foreign currency derivatives | $ | 630 | | | $ | — | | | $ | 630 | | | $ | — | |
| Total assets at fair value | $ | 630 | | | $ | — | | | $ | 630 | | | $ | — | |
| Liabilities: | | | | | | | |
| Foreign currency derivatives | $ | 519 | | | $ | — | | | $ | 519 | | | $ | — | |
| Total liabilities at fair value | $ | 519 | | | $ | — | | | $ | 519 | | | $ | — | |
| | | | | | | |
| December 31, 2022 | Total | | Level 1 | | Level 2 | | Level 3 |
| Assets: | (Dollars in thousands) |
| Foreign currency derivatives | $ | 92 | | | $ | — | | | $ | 92 | | | $ | — | |
| Interest rate swap contracts | 27,384 | | | — | | | 27,384 | | | — | |
| Total assets at fair value | $ | 27,476 | | | $ | — | | | $ | 27,476 | | | $ | — | |
| Liabilities: | | | | | | | |
| Foreign currency derivatives | $ | 282 | | | $ | — | | | $ | 282 | | | $ | — | |
| Total liabilities at fair value | $ | 282 | | | $ | — | | | $ | 282 | | | $ | — | |
The carrying amounts and fair values of financial instruments, other than cash and cash equivalents, short-term notes and accounts receivable, accounts payable and other current payables, – are shown in the table above. The carrying amount approximatesvalue of cash and cash equivalents, receivables and accounts payable approximate fair value because ofdue to the short maturityshort-term nature of these instruments.
Debt – The fair value of our debt as of December 31, 20212023 and 20202022 was $1,051.6$676.6 million and $1,453.1$843.2 million, respectively. The fair values were determined using Level 3 inputs.
Foreign currency derivatives – Foreign currency derivatives are carried at fair value using Level 2 inputs. We had an outstanding gain of $0.4 million as of December 31, 2021 and an outstanding loss of $0.1 million as of December 31, 2020.
Commodity derivative contracts – Commodity derivative contracts are carried at fair value. We determinequoted market prices for the fair value using observable, quoted refined oil product prices that are determined by active markets and therefore classify the commodity derivative contracts as Level 2. We had outstanding unrealized gains of $8.5 million as of December 31, 2021, outstanding unrealized gains of $0.6 million and outstanding unrealized losses of $2.8 million as of December 31, 2020.
Interest rate swap contracts – Interest rate swap contracts are carried at fair value. We determine the fair value using the income approach to value the derivatives, using observable Level 2 market expectations at the measurement date and standard valuation techniques to convert future amounts to a single discounted present amount reflecting current market expectations about those future amounts. We had outstanding unrealized gains of $6.1 million and outstanding unrealized losses of $0.1 million as of December 31, 2021. We had no outstanding unrealized gains and outstanding unrealized losses of $11.9 million as of December 31, 2020.same or similar debt instruments.
Additional fair value information related to our pension funds' assets can be found in Note 11, "Retirement Plans and Post-Employment Benefits".Benefits."
Derivative Instruments
In the normal course of business, we are exposed to certain risks related to fluctuations in currency exchange rates. We use derivative financial instruments, primarily foreign currency derivatives, and have in the past used commodity derivative contracts and interest rate swaps as part of our overall foreign currency and commodity risk management strategiesstrategy to manage the risk of exchange rate movements that would reduce the value of our foreign cash flows and to minimize commodity price volatility. Foreign currency exchange rate movements create a degree of risk by affecting the value of sales made and costs incurred in currencies other than the U.S. dollar.risks from these market fluctuations.
Certain of our derivative contracts contain provisions that require us to provide collateral. Since the counterparties to these financial instruments are large commercial banks and similar financial institutions, we do not believe that we are exposed to material counterparty credit risk. We do not anticipate nonperformance by any of the counterparties to our instruments.
Foreign currency derivatives
We enter into foreign currency derivatives from time to time to attempt to manage exposure to changes in currency exchange rates. These foreign currency instruments, which include, but are not limited to, forward exchange contracts and purchased currency options, attemptare used to hedge global currency exposures such as foreign currency denominated debt, sales, receivables, payables, sales and purchases.
Foreign currency forward and swap contracts are used to mitigate the foreign exchange risk of balance sheet items. These derivatives are fair value hedges. Gains and losses from these derivatives are recorded in cost of goods sold and they are largely offset by the financial impact of translating foreign currency-denominated payables and receivables.
In the first quarter of 2022 and in the second, third and fourth quarters of 2023, we entered into foreign currency derivatives with maturities of one month to 12 months in order to protect against the risk that cash flows associated with certain sales and purchases denominated in a currency other than the U.S. dollar will be adversely affected by future changes in foreign exchange rates. These derivatives are designated as cash flow hedges. The resulting unrealized gains or losses from these derivatives are recorded in AOCL and subsequently, when realized, are reclassified to net sales or cost of goods sold in the Consolidated Statements of Operations when the hedged exposures affect earnings.
GRAFTECH INTERNATIONAL LTD. AND SUBSIDIARIES
NOTES TO THE CONSOLIDATED FINANCIAL STATEMENTS
We had no foreign currency cash flow hedges outstanding as of December 31, 2021 and December 31, 2020 and, therefore, no unrealized gains or losses reported under accumulated other comprehensive loss.
As of December 31, 2021, we had outstanding Mexican peso, South African rand, euro, Swiss franc and Japanese yen currency contracts, with aggregate notional amounts of $99.3 million. As of December 31, 2020, we had outstanding Mexican peso, South African rand, euro, Swiss franc and Japanese yen currency contracts, with aggregate notional amounts of $71.0 million. The foreign currency derivatives outstanding as of December 31, 2021 had maturity dates from January 2022 to April 2022, and were not designated as hedging instruments.
Commodity derivative contracts
We have entered into commodity derivative contracts for refined oil products. These contracts arewere entered into to protect against the risk that eventual cash flows related to these products will be adversely affected by future changes in prices. In the fourth quarter of 2017, we began to enter into LTAs, which are three- to five-year take-or-pay contracts, with many of our customers and began to hedge the cash flows related to these contracts. As of December 31, 2021, we had outstanding commodity derivative contracts with a notional amount of $19.5 million and maturities from January 2022 to June 2022. As of December 31, 2020, we had outstanding commodity derivative contracts with a notional amount of $61.3 million with maturities from January 2021 to June 2022. Within accumulated other comprehensive loss, we had a net unrealized pre-tax gain of $8.5 million and a net unrealized pre-tax loss of $2.2 million as of December 31, 2021 and 2020, respectively. The fair value of these contracts was determined using Level 2 inputs.
In connection with de-designated commodity derivative contracts, we recognized no unrealized gains or losses related to commodity derivative contracts designated as cash flow hedges are recorded in costAOCL and subsequently, when realized, are reclassified to the Consolidated Statement of sales in 2021 and a $0.4 million unrealized gain in 2020 as a result ofOperations when the variation in fair value fromhedged item impacts earnings, which is when the de-designation date. This resulted from a small portionfinished product is sold. The last of our commodity derivative contracts that ceased to qualify for hedge accounting.matured as of June 30, 2022 and we have not entered into any new contracts as of December 31, 2023.
Interest rate swap contracts
DuringWe have utilized interest rate swaps in the third quarterpast to limit exposure to market fluctuations on our variable-rate debt. For each derivative agreement that is designated as a cash flow hedge, the unrealized gain or loss is recorded in AOCL and, when realized, is recorded in interest expense. Upon discontinuance of 2019,a designated cash flow hedging relationship, when interest payments are still probable of occurring, the Companyfair value at the date of discontinuance is deferred into AOCL and amortized into interest expense based upon the term of the cash flow hedging relationship.
We entered into interest rate swap contracts. The contracts arethat were "pay fixed, receive variable" with notional amounts of $500 million maturing in two years and another $500 million maturing in five years. The Company’svariable." Our risk management objective was to fix itsour cash flows associated with the risk inof variability in the one-month USD LIBOR for a portion of our outstanding debt. It was expected that thesethe swaps would fix the cash flows associated with the forecasted interest payments on this notional amount of debt to an effective fixed interest rate of 5.1%, which could be lowered to 4.85% depending on credit ratings. In December 2020, in connection with the $500 million principal repayment of the 2018 Term Loan Facility, we de-designated one interest rate swap contract of $250 million notional maturing in the third quarter of 2021, and in February 2021, we closed the contract and recorded a $0.9 million charge in interest expense.
Additionally, in February 2021, the Company modified the three remaining swaps with notional amounts of $250 million that matured in the third quarter 2021 and $500 million maturing in the third quarter 2024 in order to align their terms to the amended 2018 Term Loan Facility (see Note 5, "Debt and Liquidity" for details of the February 2021 repricing of the 2018 Term Loan Facility). It is expected that these swaps will fix the cash flows associated with the forecasted interest payments on this notional amount ofour debt to an effective fixed interest rate of 4.2%, which could be lowered to 3.95% depending on credit ratings. TheSince their modification triggeredconcurrent with the de-designation and re-designation2018 Term Loan Facility modification in the first quarter of 2021, the swaps. Because the modified swaps contained an other-than-insignificant financing element at re-designation date,element. As such, they arewere considered hybrid instruments composed of a debt host and an embedded derivative and the associated cash (outflows)/inflowsflows are classified as financing (use)(uses)/sourcesources of cash. The embedded derivative was treated as a cash flow hedge.
In the first quarter of 2022, in connection with the partial repayment of principal on our 2018 Term Loan Facility and our probability assessment of the variable-rate debt remaining outstanding through the term of the swaps, we de-designated one interest rate swap contract with a $250.0 million notional amount, originally scheduled to mature in the third quarter of 2024. The fair value of the embedded derivative at the de-designation date was a gain of $6.6 million and was recorded in AOCL and is being amortized into interest expense over the remaining life of the swap.
In the third quarter of 2022, we redeemed $67.0 million of our $250.0 million notional amount de-designated interest rate swap. The change in fair value of the de-designated embedded derivative for the year ended December 31, 2023 resulted in a loss of $7.1 million, compared to a gain of $7.1 million for the year ended December 31, 2022, recorded in interest expense in the Consolidated Statements of Operations.
In the second quarter of 2023, in connection with the repayment of the $433.7 million outstanding balance on our 2018 Term Loan Facility, we terminated our $183.0 million notional de-designated interest rate swap and our $250.0 million notional designated interest rate swap and received net cash of $20.4 million. The net cash received included a $23.1 million gain on the embedded derivatives, partially offset by a $2.8 million loss on the settlement of our debt host portion amounted to a liability as of $7.0 million asthe termination date. As of December 31, 20212022, the debt host liability was $3.8 million, with $2.6$2.3 million included in "Other accrued liabilities" and $4.4$1.5 million included in "Other long-term obligations." The correspondingobligations" on the Consolidated Balance Sheets. As of December 31, 2023, a cumulative loss is accounted forof $1.8 million related to the debt host liability was recorded in "Accumulated other comprehensive loss"AOCL and iswill be amortized overinto interest expense using the remaining lifeeffective interest method through August 2024.
Out of the swaps. The$23.1 million gain on the embedded derivatives, $6.9 million for the de-designated swap was recorded in interest expense and $16.2 million for the designated swap was recorded in AOCI and will be amortized into interest expense using the effective interest method through August 2024.
All derivatives are recorded on the balance sheet at fair value. If the derivative is treateddesignated and effective as a cash flow hedge.
Within accumulated other comprehensive loss, we recorded a net unrealized pre-tax gain of $5.9 million and a net unrealized pre-tax loss of $11.9 million as of December 31, 2021 and 2020, respectively. The fair value of these contracts was determined using Level 2 inputs.
The changehedge, changes in the fair value of the de-designated interest rate swap contract fromderivative are recognized in AOCL until the de-designation date to December 31, 2020, washedged item is recognized in earnings. The ineffective portion of a derivative's fair value, if any, is recognized in earnings immediately. If a derivative is not a hedge, changes in its fair value are adjusted through earnings. The fair values of the outstanding derivatives are recorded on the balance sheet as assets (if the derivatives are in interest expense and was immaterial.
GRAFTECH INTERNATIONAL LTD. AND SUBSIDIARIES
NOTES TO THE CONSOLIDATED FINANCIAL STATEMENTS
The fair valuenotional amounts of all derivatives is recordedour outstanding derivative instruments as assets or liabilities on a gross basis in our Consolidated Balance Sheets. Atof December 31, 20212023 and 2020,2022 were as follows:
| | | | | | | | | | | |
| December 31, 2023 | | December 31, 2022 |
| | Notional Amount | | Notional Amount |
| (Dollars in thousands) |
| Derivative instruments designated as hedges: | | | |
| Foreign currency derivatives | $ | 10,684 | | | $ | — | |
| Interest rate swap contracts | — | | | 250,000 | |
| | | |
| Derivative instruments not designated as hedges: | | | |
| Foreign currency derivatives | $ | 41,863 | | | $ | 70,420 | |
| Interest rate swap contracts | — | | | 183,000 | |
The following table summarizes the fair value of our outstanding derivatives and their respective balance sheet locations are presented in the following table:
| | | | | | | | | | | | | | | | | | | | | | | |
| Asset Derivatives | | Liability Derivatives |
| | Location | | Fair Value | | Location | | Fair Value |
| As of December 31, 2021 | (Dollars in thousands) |
| Derivatives designated as cash flow hedges: | | | | | | |
| Commodity derivative contracts | Prepaid and other current assets | | $ | 8,469 | | | Other accrued liabilities | | $ | — | |
| Other assets | | — | | | Other long-term obligations | | — | |
| Interest rate swap contracts | Prepaid and other current assets | | $ | — | | | Other accrued liabilities | | $ | 140 | |
| Other assets | | 6,060 | | | Other long-term obligations | | — | |
| Total fair value | | | $ | 14,529 | | | | | $ | 140 | |
| | | | | | | |
| As of December 31, 2020 | | | | | | | |
| Commodity derivative contracts | Prepaid and other current assets | | $ | 518 | | | Other accrued liabilities | | $ | 888 | |
| Other assets | | 63 | | | Other long-term obligations | | 1,898 | |
| Interest rate swap contracts | Prepaid and other current assets | | $ | — | | | Other accrued liabilities | | $ | 4,080 | |
| Other assets | | — | | | Other long-term obligations | | 6,903 | |
| Total fair value | | | $ | 581 | | | | | $ | 13,769 | |
| | | | | | | |
| | | | | | | | | | | | | | | | | | | | | | | |
| | Asset Derivatives | | Liability Derivatives |
| | Location | | Fair Value | | Location | | Fair Value |
| As of December 31, 2021 | (Dollars in Thousands) |
| Derivatives not designated as hedges: | | | | | | |
| Foreign currency derivatives | Prepaid and other current assets | | $ | 388 | | | Other accrued liabilities | | $ | 2 | |
| Total fair value | | | $ | 388 | | | | | $ | 2 | |
| | | | | | | |
| As of December 31, 2020 | | | | | | | |
| Derivatives not designated as hedges: | | | | | | |
| Foreign currency derivatives | Prepaid and other current assets | | $ | 6 | | | Other accrued liabilities | | $ | 111 | |
| Interest rate swap contracts | Prepaid and other current assets | | — | | | Other accrued liabilities | | 952 | |
| | | | | | | |
| Total fair value | | | $ | 6 | | | | | $ | 1,063 | |
The realized (gains) losses resulting from the settlement of commodity derivative contracts designated as hedges remain in "Accumulated other comprehensive loss" until they are recognized in the Statement(on a gross basis) and balance sheet classification as of Operations when the hedged item impacts earnings, which is when the finished product is sold. December 31, 2023 and 2022:
| | | | | | | | | | | |
| December 31, 2023 | | December 31, 2022 |
| | Fair Value | | Fair Value |
| (Dollars in thousands) |
| Prepaid and other current assets | | | |
| Foreign currency derivatives | $ | 386 | | | $ | — | |
| Interest rate swap contracts | — | | | 10,246 | |
| Total | $ | 386 | | | $ | 10,246 | |
| | | |
| Other assets | | | |
| Interest rate swap contracts | $ | — | | | $ | 5,575 | |
| Total | $ | — | | | $ | 5,575 | |
| | | |
| Total asset | $ | 386 | | | $ | 15,821 | |
As a result of the settlement of commodity derivative contracts and interest rate swaps, as of December 31, 2021 and December 31, 2020,2023, net realized pre-tax gaingains of $11.5$2.5 million and net realized pre-tax loss of $7.4$9.2 million, respectively, were reported in accumulated other comprehensive income (loss)AOCL and will be (were) released to earnings within the followingnext 12 months. As of December 31, 2023, net realized pre-tax losses of $0.4 million related to our foreign currency derivatives were reported in AOCL and will be released to earnings within the next 12 months. In addition, we recorded $0.8 million of ineffectiveness income to cost of goods sold in the Consolidated Statements of Operations in 2022 related to the settlement of commodity derivative contracts. No ineffectiveness expense was recorded in 2023 or 2021. See the table below for amounts recognized on the effective portion of our commodity derivative contracts in the Statement of Operations.
GRAFTECH INTERNATIONAL LTD. AND SUBSIDIARIES
NOTES TO THE CONSOLIDATED FINANCIAL STATEMENTS
The realized (gains) losses on derivativescash flow hedges are recognized in the Statements of Operations when the hedged item impacts earnings and are as follows for the years ended December 31, 2021, 20202023, 2022 and 2019:2021:
| | | | | | | Amount of (Gain)/Loss
Recognized | | | | | Amount of (Gain)/Loss
Recognized |
| Location of Realized (Gain)/Loss Recognized in the Consolidated Statement of Operations | | 2021 | | 2020 | | 2019 |
| | Location of Realized (Gain)/Loss Recognized in the Consolidated Statement of Operations | | | | Location of Realized (Gain)/Loss Recognized in the Consolidated Statement of Operations | | 2023 | | 2022 | | 2021 |
| Derivatives designated as cash flow hedges: | Derivatives designated as cash flow hedges: | | (Dollars in thousands) | Derivatives designated as cash flow hedges: | | (Dollars in thousands) |
| Foreign currency derivatives | |
| Commodity derivative contracts | Commodity derivative contracts | | Cost of sales | | $ | 6,440 | | | $ | (4,134) | | | $ | (8,892) | |
| Interest rate swaps | Interest rate swaps | | Interest expense (income) | | 1,846 | | | 4,390 | | | (1,050) | |
| | | | | | | | | | | | | | | | | | | | | | | | | | |
| | | | | Amount of (Gain)/Loss
Recognized |
| | Location of Realized (Gain)/Loss Recognized in the Consolidated Statement of Operations | | 2021 | | 2020 | | 2019 |
| Derivatives not designated as hedges: | | (Dollars in thousands) |
| Foreign currency derivatives | | Cost of sales, Other (income) expense, net | | $ | 3,895 | | | $ | (2,671) | | | $ | (506) | |
| Commodity derivative contracts | | Cost of sales | | (1,399) | | | (530) | | | (223) | |
| Interest rate swap contracts | | Interest expense | | 866 | | | — | | | — | |
GRAFTECH INTERNATIONAL LTD. AND SUBSIDIARIES
In addition, the loss deferred to "Accumulated other comprehensive loss"NOTES TO THE CONSOLIDATED FINANCIAL STATEMENTS
Pre-tax gains and losses on non-designated derivatives recognized in the first quarter of 2021earnings are as a result of the portion of the interest rate swaps qualifying as a debt host is amortized to interest expense over the term of the swaps. The amount of the amortization is as follows for 2021:follows:
| | | | | | | Amount of (Gain)/Loss
Recognized | | | | | Amount of (Gain)/Loss
Recognized |
| Location of Realized (Gain)/Loss Recognized in the Consolidated Statement of Operations | | 2021 | | 2020 | | 2019 |
| | Location of Realized (Gain)/Loss Recognized in the Consolidated Statement of Operations | | | | Location of Realized (Gain)/Loss Recognized in the Consolidated Statement of Operations | | 2023 | | 2022 | | 2021 |
| Derivatives not designated as hedges: | Derivatives not designated as hedges: | | (Dollars in thousands) | Derivatives not designated as hedges: | | (Dollars in thousands) |
| Interest rate swap contracts | | Interest expense | | 2,807 | | | — | | | — | |
| Foreign currency derivatives | |
| Commodity derivative contracts | |
| Interest rate swaps | |
The following table summarizes the fair value of our outstanding derivatives not designated as hedges (on a gross basis) and balance of the deferred pre-tax loss is $7.0 millionsheet classification as of December 31, 2021, reported in "Accumulated other comprehensive loss", of which $2.6 million will be released to earnings within the next 12 months.2023 and 2022:
| | | | | | | | | | | |
| December 31, 2023 | | December 31, 2022 |
| | Fair Value | | Fair Value |
| (Dollars in thousands) |
| Prepaid and other current assets | | | |
| Interest rate swap contracts | $ | — | | | $ | 7,492 | |
| Foreign currency derivatives | 244 | | | 92 | |
| | | |
| Other assets | | | |
| Interest rate swap contracts | — | | | 4,071 | |
| | | |
| Other accrued liabilities | | | |
| Foreign currency derivatives | (519) | | | (282) | |
| | | |
| Net (liability) asset | $ | (275) | | | $ | 11,373 | |
GRAFTECH INTERNATIONAL LTD. AND SUBSIDIARIES
NOTES TO THE CONSOLIDATED FINANCIAL STATEMENTS
(9)Supplementary Balance Sheet Detail
The following tables present supplementary balance sheet details:
| | As of
December 31, 2021 | | As of
December 31, 2020 |
|
December 31, 2023 | | |
December 31, 2023 | |
December 31, 2022 |
| | | (Dollars in thousands) | | (Dollars in thousands) |
| Inventories: | Inventories: | |
| Raw materials and supplies | Raw materials and supplies | $ | 132,113 | | | $ | 101,098 | |
| Raw materials and supplies | |
| Raw materials and supplies | |
| Work in process | Work in process | 127,127 | | | 110,331 | |
| Finished goods | Finished goods | 30,192 | | | 54,535 | |
| $ | 289,432 | | | $ | 265,964 | |
| $ | |
| Prepaid expenses and other current assets: | Prepaid expenses and other current assets: | | | |
| Prepaid expenses | Prepaid expenses | $ | 8,193 | | | $ | 9,242 | |
| Value-added tax and other indirect taxes receivable* | 40,861 | | | 10,666 | |
| Prepaid expenses | |
| Prepaid expenses | |
| Value-added tax and other indirect taxes receivable | |
| Spare parts inventory | Spare parts inventory | 12,408 | | | 11,825 | |
| Other current assets | Other current assets | 11,902 | | | 3,381 | |
| $ | 73,364 | | | $ | 35,114 | |
| $ | |
| Property, plant and equipment: | Property, plant and equipment: | | | |
| Land and improvements | |
| Land and improvements | |
| Land and improvements | Land and improvements | $ | 49,201 | | | $ | 50,285 | |
| Buildings | Buildings | 79,660 | | | 80,041 | |
| Machinery and equipment and other | Machinery and equipment and other | 621,808 | | | 621,478 | |
| Construction in progress | Construction in progress | 64,629 | | | 33,098 | |
| $ | 815,298 | | | $ | 784,902 | |
| $ | |
| Other accrued liabilities: | Other accrued liabilities: | | | |
| Payrolls (including incentive programs) | |
| Payrolls (including incentive programs) | |
| Payrolls (including incentive programs) | Payrolls (including incentive programs) | $ | 16,904 | | | $ | 13,159 | |
| Employee benefits | Employee benefits | 7,272 | | | 7,128 | |
| Deferred revenue | Deferred revenue | 9,840 | | | 13,056 | |
| Other | Other | 22,389 | | | 23,158 | |
| $ | 56,405 | | | $ | 56,501 | |
| $ | |
| Other long-term obligations: | Other long-term obligations: | | | |
| Post-employment benefits | |
| Post-employment benefits | |
| Post-employment benefits | Post-employment benefits | $ | 14,597 | | | $ | 15,669 | |
| Pension and related benefits | Pension and related benefits | 31,139 | | | 37,847 | |
| Other | Other | 22,921 | | | 27,962 | |
| $ | 68,657 | | | $ | 81,478 | |
| $ | |
*Included in "Value-added tax and other indirect taxes receivable" is the recognition of the Brazil value-added tax credit of $11.5 million (see Note 16, "Other (Income) Expense, net").
GRAFTECH INTERNATIONAL LTD. AND SUBSIDIARIES
NOTES TO THE CONSOLIDATED FINANCIAL STATEMENTS
The following table presents an analysis of the allowance for doubtful accounts:accounts for the years ended December 31:
| | 2021 | | 2020 | | 2019 |
| 2023 | | | 2023 | | 2022 | | 2021 |
| | | | | | | (Dollars in thousands) |
| Balance at beginning of year | Balance at beginning of year | $ | 8,243 | | | $ | 5,474 | | | $ | 1,129 | |
| Charge to retained earnings - ASC 326 adoption impact | — | | | 2,026 | | | — | |
| (Credit) charge to income | (Credit) charge to income | (1,266) | | | 1,458 | | | 4,636 | |
| Deductions | Deductions | (142) | | | (715) | | | (291) | |
| Balance at end of year | Balance at end of year | $ | 6,835 | | | $ | 8,243 | | | $ | 5,474 | |
Supplier Finance Program (“SFP”) Obligations
GrafTech Mexico S.A. De C.V. (“GrafTech Mexico”) participates in an electronic vendor voucher payment program supported by the Mexican Government through one of its national banks, whereby suppliers can factor their invoices through a financial intermediary. This program gives GrafTech Mexico’s suppliers the option to settle trade receivables by obtaining payment for a discounted amount from the financial intermediary prior to the invoice due date. GrafTech Mexico’s responsibility is limited to making payment on the terms originally negotiated with its supplier, regardless of whether the supplier elects to receive early payment. The range of payment terms GrafTech Mexico negotiates with its suppliers is consistent, irrespective of whether a supplier participates in the program.
SFP obligations are included in accounts payable on the Consolidated Balance Sheets and upon settlement, are reflected as cash flow from operating activities in the Consolidated Statements of Cash Flows. See below for a rollforward of our SFP obligations.
| | | | | |
| (Dollars in thousands) |
| Confirmed obligations outstanding as of December 31, 2022 | $ | — | |
| Invoices confirmed during the year | 24,368 | |
| Confirmed invoices paid during the year | (19,732) | |
| Confirmed obligations outstanding as of December 31, 2023 | $ | 4,636 | |
GRAFTECH INTERNATIONAL LTD. AND SUBSIDIARIES
NOTES TO THE CONSOLIDATED FINANCIAL STATEMENTS
(10)Leases
We leaseThe Company leases certain transportation and mobile manufacturing equipment such as railcars and forklifts, as well as real estate.
ComponentsThe components of lease expense are as follows:
| | | Year Ended December 31, | |
| | Year Ended December 31, | |
| | Year Ended December 31, | |
| | 2023 | | | | 2023 | | 2022 | | 2021 |
| | (Dollars in thousands) | | | | (Dollars in thousands) |
| Operating lease cost | |
| | | For the Year Ended December 31, |
| | 2021 | | 2020 | | 2019 |
| | (Dollars in thousands) |
| Operating lease cost | | $ | 5,399 | | | $ | 6,138 | | | $ | 4,816 | |
| Finance lease cost: | |
| Finance lease cost: | |
| Finance lease cost: | |
| Amortization of lease assets | |
| Amortization of lease assets | |
| Amortization of lease assets | |
| Interest on lease liabilities | |
| Short-term lease cost | Short-term lease cost | | 408 | | | 159 | | | 14 | |
| Variable lease cost | Variable lease cost | | 453 | | | 429 | | | 227 | |
| Total lease cost | Total lease cost | | $ | 6,260 | | | $ | 6,726 | | | $ | 5,057 | |
Supplemental cash-flow and other information related to leases is as follows:
| | | | | | | | | | | | | | | | | | |
| | For the Year Ended December 31, |
| | 2021 | | 2020 | | 2019 |
| | (Dollars in thousands) |
| RoU assets obtained in exchange for new operating lease liabilities (non-cash) | | 5,584 | | | 5,262 | | | 4,995 | |
| Cash payments for operating leases | | (5,466) | | | (6,177) | | | (4,724) | |
Supplemental balance sheet information related to leases is as follows:
| | | | | | | | | | | | | | | | | |
| | | As of December 31, |
| | | 2021 | | 2020 |
| | | (Dollars in thousands) |
| Location | | | | |
| Operating RoU lease assets | Other assets | | $ | 7,646 | | | $ | 7,164 | |
| | | | | |
| Current operating lease liabilities | Other accrued liabilities | | 4,109 | | | 4,102 | |
| Non-current operating lease liabilities | Other long-term obligations | | 3,528 | | | 3,195 | |
| Total operating lease liabilities | | | $ | 7,637 | | | $ | 7,297 | |
| | | | | |
| Weighted average remaining lease term (in years) | | | 2.3 | | 2.7 |
| Weighted average discount rate | | | 4.31 | % | | 5.82 | % |
| | | | | | | | | | | | | | | | | | |
| | Year Ended December 31, |
| | 2023 | | 2022 | | 2021 |
| | (Dollars in thousands) |
| Cash paid for amounts included in the measurement of lease liabilities | | | | | | |
| Operating cash outflows - payments on operating leases | | $ | (3,919) | | | $ | (4,015) | | | $ | (5,466) | |
| Operating cash outflows - interest payments on finance leases | | (13) | | | — | | | — | |
| Financing cash outflows - payments on finance lease obligations | | (36) | | | — | | | — | |
| Right-of-use assets obtained in exchange for operating lease obligations | | 2,621 | | | 2,303 | | | 5,584 | |
| Right-of-use assets obtained in exchange for finance lease obligations | | 291 | | | — | | | — | |
GRAFTECH INTERNATIONAL LTD. AND SUBSIDIARIES
NOTES TO THE CONSOLIDATED FINANCIAL STATEMENTS
As of December 31, 2021, lease commitments under non-cancelable operatingSupplemental balance sheet information related to leases extending for one year or more will require the following future payments:is as follows:
| | | | | | | | |
| | | (Dollars in thousands) |
| 2022 | | 4,200 | |
| 2023 | | 2,238 | |
| 2024 | | 969 | |
| 2025 | | 451 | |
| 2026 and after | | 152 | |
| Total lease payments | | $ | 8,010 | |
| Less: Imputed interest | | (373) | |
| Present value of lease payments | | $ | 7,637 | |
| | | | | | | | | | | | | | | | | |
| | | December 31, |
| | | 2023 | | 2022 |
| | | (Dollars in thousands) |
| Location | | | | |
| Operating Leases | | | | | |
| Operating lease right-of-use assets | Other assets | | $ | 5,003 | | | $ | 5,741 | |
| | | | | |
| Current operating lease liabilities | Other accrued liabilities | | 2,568 | | | 3,575 | |
| Non-current operating lease liabilities | Other long-term obligations | | 2,542 | | | 2,304 | |
| Total operating lease liabilities | | | $ | 5,110 | | | $ | 5,879 | |
| | | | | |
| Finance Leases | | | | | |
| Property, plant and equipment | Property, plant and equipment | | $ | 330 | | | $ | — | |
| Accumulated depreciation | Accumulated depreciation | | 39 | | | — | |
| Finance lease assets, net | | | $ | 291 | | | $ | — | |
| Other liabilities and accrued items | Other liabilities and accrued items | | $ | 83 | | | $ | — | |
| Finance lease liabilities | Other long-term obligations | | 210 | | | — | |
| Total principal payable on finance leases | | | $ | 293 | | | $ | — | |
| | | | | |
| Weighted-Average Remaining Lease Term | | | | | |
| Operating leases | | | 2.4 years | | 2.1 years |
| Finance leases | | | 4.1 years | | 0 years |
| | | | | |
| Weighted-Average Discount Rate | | | | | |
| Operating leases | | | 6.63 | % | | 4.65 | % |
| Finance leases | | | 7.93 | % | | — | % |
As of December 31, 2021, we have2023, future minimum lease payments under noncancellable operating leases were as follows:
| | | | | | | | | | | | | | |
| | Finance Leases | | Operating Leases |
| | | (Dollars in thousands) |
| 2024 | | $ | 87 | | | $ | 2,640 | |
| 2025 | | 87 | | | 1,700 | |
| 2026 | | 87 | | | 891 | |
| 2027 | | 53 | | | 264 | |
| 2028 | | 31 | | | 30 | |
| 2029 and thereafter | | — | | | — | |
| Total lease payments | | $ | 345 | | | $ | 5,525 | |
| Less: Imputed interest | | (52) | | | (415) | |
| Present value of lease payments | | $ | 293 | | | $ | 5,110 | |
As of December 31, 2023, the Company has not entered into any additional operatingmaterial lease commitments that have yet to commence.
GRAFTECH INTERNATIONAL LTD. AND SUBSIDIARIES
NOTES TO THE CONSOLIDATED FINANCIAL STATEMENTS
(11)Retirement Plans and Post-Employment Benefits
Retirement Plans
On February 26, 1991, we formed our own retirement plan covering substantially all our U.S. employees. Under our plan, covered employees earned benefit payments based primarily on their service credits and wages subsequent to February 26, 1991.
Prior to that date, substantially all our U.S. employees were participants in the U.S. retirement plan of Union Carbide Corporation (“Union Carbide”). While service credit was frozen, covered employees continued to earn benefits under the Union Carbide plan based on their final average wages through February 26, 1991, adjusted for salary increases (not to exceed 6six percent per annum) through January 26, 1995, the date Union Carbide ceased to own a minimum 50% of the equity of GTI. The Union Carbide plan is responsible for paying retirement and death benefits earned as of February 26, 1991.
Effective January 1, 2002, we established a defined contribution plan for U.S. employees. Certain employees had the option to remain in our defined benefit plan for an additional period of up to five years. Employees not covered by this option had their benefits under our defined benefit plan frozen as of December 31, 2001, and began participating in the defined contribution plan.
Effective March 31, 2003, we curtailed our qualified benefit plan and the benefits were frozen as of that date for the U.S. employees who had the option to remain in our defined benefit plan. We also closed our non-qualified U.S. defined benefit plan for the participating salaried workforce. The employees began participating in the defined contribution plan as of April 1, 2003.
Pension coverage for employees of foreign subsidiaries is provided, to the extent deemed appropriate, through separate plans. Obligations under such plans are systematically provided for by depositing funds with trustees, under insurance policies or by book reserves.
The components of our consolidated net pension costs are set forth in the following table:
| | Year Ended December 31, | | | Year Ended December 31, |
| 2023 | | | 2023 | | 2022 | | 2021 |
| | For the Year Ended December 31, | | U.S. | | Foreign | | U.S. | | Foreign | | U.S. | | Foreign |
| 2021 | | 2020 | | 2019 |
| | U.S. | | Foreign | | U.S. | | Foreign | | U.S. | | Foreign |
| (Dollars in thousands) |
| (Dollars in thousands) | | | (Dollars in thousands) |
| Service cost | Service cost | $ | 1,328 | | | $ | 1,349 | | | $ | 1,322 | | | $ | 1,183 | | | $ | 1,297 | | | $ | 624 | |
| Interest cost | Interest cost | 2,962 | | | 111 | | | 3,949 | | | 174 | | | 5,070 | | | 275 | |
| Expected return on assets | Expected return on assets | (4,213) | | | (545) | | | (4,730) | | | (401) | | | (5,026) | | | (424) | |
| Mark-to-market (gain) loss | Mark-to-market (gain) loss | (2,428) | | | (1,327) | | | 613 | | | 2,596 | | | 205 | | | 3,302 | |
| Pension (benefits) costs | $ | (2,351) | | | $ | (412) | | | $ | 1,154 | | | $ | 3,552 | | | $ | 1,546 | | | $ | 3,777 | |
| Net periodic benefit (credit) cost | |
GRAFTECH INTERNATIONAL LTD. AND SUBSIDIARIES
NOTES TO THE CONSOLIDATED FINANCIAL STATEMENTS
The mark-to-market loss in 2023 was the result of an unfavorable change in the discount rate on our foreign plans. The mark-to-market gain in 2022 was primarily the result of a favorable change in the discount rate, partially offset by a worse than expected return on plan assets. The mark-to-market gain in 2021 was the result of a favorable change in the discount rate and favorable foreign currency translation, as well as a better than expected return on plan assets, particularly for the U.S. plans. The mark-to-market loss in 2020 was the result of the unfavorable change in the discount rate, new employee obligations and unfavorable foreign currency translation, partially offset by better than expected return on plan assets, particularly for the U.S. plans. The mark-to-market loss in 2019 was the result of the unfavorable change in the discount rate, partially offset by better than expected return on plan assets, particularly for the U.S. plans.
GRAFTECH INTERNATIONAL LTD. AND SUBSIDIARIES
NOTES TO THE CONSOLIDATED FINANCIAL STATEMENTS
The reconciliation of the beginning and ending balances of our pension plans’ benefit obligations, fair value of assets, and funded status at December 31, 20212023 and 2020 are:2022 are shown below.
| | | | | | | | | | | | | | | | | | | | | | | |
| | As of
December 31, 2021 | | As of
December 31, 2020 |
| | U.S. | | Foreign | | U.S. | | Foreign |
| | (Dollars in thousands) |
| Changes in Benefit Obligation: | | | | | | | |
| Net benefit obligation at beginning of period | $ | 140,254 | | | $ | 38,716 | | | $ | 135,810 | | | $ | 28,903 | |
| Service cost | 1,328 | | | 1,349 | | | 1,322 | | | 1,183 | |
| Interest cost | 2,962 | | | 111 | | | 3,949 | | | 174 | |
| Participant contributions | — | | | 580 | | | — | | | 470 | |
| Foreign currency exchange changes | — | | | (1,318) | | | — | | | 2,869 | |
| Actuarial (gain) loss | (4,316) | | | (1,104) | | | 9,583 | | | 2,683 | |
| Benefits paid* | (10,322) | | | 237 | | | (10,410) | | | 2,434 | |
| Net benefit obligation at end of period | $ | 129,906 | | | $ | 38,571 | | | $ | 140,254 | | | $ | 38,716 | |
| Changes in Plan Assets: | | | | | | | |
| Fair value of plan assets at beginning of period | $ | 115,568 | | | $ | 25,082 | | | $ | 107,832 | | | $ | 18,980 | |
| Actual return on plan assets | 2,325 | | | 799 | | | 13,700 | | | 488 | |
| Foreign currency exchange rate changes | — | | | (746) | | | — | | | 1,893 | |
| Employer contributions | 2,390 | | | 961 | | | 4,446 | | | 817 | |
| Participant contributions | — | | | 580 | | | — | | | 470 | |
| Benefits paid* | (10,322) | | | 237 | | | (10,410) | | | 2,434 | |
| Fair value of plan assets at end of period | $ | 109,961 | | | $ | 26,913 | | | $ | 115,568 | | | $ | 25,082 | |
| Funded status (underfunded): | $ | (19,945) | | | $ | (11,658) | | | $ | (24,686) | | | $ | (13,634) | |
Amounts recognized in the statement
of financial position: | | | | | | | |
| Non-current assets | $ | — | | | $ | — | | | $ | — | | | $ | 13 | |
| Current liabilities | (420) | | | (44) | | | (423) | | | (50) | |
| Non-current liabilities | (19,525) | | | (11,614) | | | (24,263) | | | (13,597) | |
| Net amount recognized | $ | (19,945) | | | $ | (11,658) | | | $ | (24,686) | | | $ | (13,634) | |
•For certain international jurisdictions, the amount reported under "Benefits paid" include obligations and assets that have been transferred into our plans in connection with personnel hired during the year. | | | | | | | | | | | | | | | | | | | | | | | |
| |
December 31, 2023 | |
December 31, 2022 |
| | U.S. | | Foreign | | U.S. | | Foreign |
| | (Dollars in thousands) |
| Changes in Benefit Obligation: | | | | | | | |
| Net benefit obligation at beginning of period | $ | 99,993 | | | $ | 31,065 | | | $ | 129,906 | | | $ | 38,571 | |
| Service cost | 1,483 | | | 1,053 | | | 1,390 | | | 1,220 | |
| Interest cost | 4,722 | | | 870 | | | 3,242 | | | 227 | |
| Participant contributions | — | | | 501 | | | — | | | 557 | |
| Plan settlements | — | | | (1,609) | | | — | | | — | |
| Foreign currency exchange changes | — | | | 2,983 | | | — | | | (660) | |
| Actuarial loss (gain) | 1,516 | | | 3,694 | | | (24,202) | | | (7,293) | |
| Benefits paid | (10,392) | | | (1,076) | | | (10,343) | | | (1,557) | |
| Net benefit obligation at end of period | $ | 97,322 | | | $ | 37,481 | | | $ | 99,993 | | | $ | 31,065 | |
| Changes in Plan Assets: | | | | | | | |
| Fair value of plan assets at beginning of period | $ | 80,006 | | | $ | 27,708 | | | $ | 109,961 | | | $ | 26,913 | |
| Actual return on plan assets | 8,382 | | | 645 | | | (20,061) | | | 1,148 | |
| Foreign currency exchange rate changes | — | | | 2,609 | | | — | | | (325) | |
| Plan settlements | — | | | (1,609) | | | — | | | — | |
| Employer contributions | 400 | | | 1,203 | | | 449 | | | 972 | |
| Participant contributions | — | | | 501 | | | — | | | 557 | |
| Benefits paid | (10,392) | | | (1,076) | | | (10,343) | | | (1,557) | |
| Fair value of plan assets at end of period | $ | 78,396 | | | $ | 29,981 | | | $ | 80,006 | | | $ | 27,708 | |
| Funded status (underfunded): | $ | (18,926) | | | $ | (7,500) | | | $ | (19,987) | | | $ | (3,357) | |
Amounts recognized in the statement
of financial position: | | | | | | | |
| Other accrued liabilities | $ | (324) | | | $ | (34) | | | $ | (409) | | | $ | (167) | |
| Other long-term obligations | (18,602) | | | (7,466) | | | (19,578) | | | (3,190) | |
| Net amount recognized | $ | (18,926) | | | $ | (7,500) | | | $ | (19,987) | | | $ | (3,357) | |
The accumulated benefit obligation for all defined benefit pension plans was $166.1$133.1 million and $176.3$129.5 million as of December 31, 20212023 and 2020,2022, respectively.
Plan Assets
The accounting guidance on fair value measurements specifies a hierarchy based on the observability of inputs used in valuation techniques (Level 1, 2 and 3). See Note 8, “Fair Value Measurements and Derivative Instruments" for a discussion of the fair value hierarchy.
The following describes the methods and significant assumptions used to estimate the fair value of the investments:
GRAFTECH INTERNATIONAL LTD. AND SUBSIDIARIES
NOTES TO THE CONSOLIDATED FINANCIAL STATEMENTS
Cash and cash equivalents – Valued at cost. Cash equivalents are valued at net asset value as provided by the administrator of the fund.
Foreign government bonds – Valued by the trustees using various pricing services of financial institutions.
Equity securities – Valued at the closing price reported on the active market on which the security is traded.
Fixed insurance contractcontracts – Valued at the present value of the guaranteed payment streams.
Investment contracts – Valued at the total cost of annuity contracts purchased, adjusted for market differences from the date of purchase to year-end.
Collective trusts – Valued at the net asset value provided by the administrator of the fund (the practical expedient). The net asset value is primarily based on quoted market prices of the underlying securities for which quoted market prices of the underlying securities of the funds. Some of the underlying investments include securities for which quoted market prices are not
GRAFTECH INTERNATIONAL LTD. AND SUBSIDIARIES
NOTES TO THE CONSOLIDATED FINANCIAL STATEMENTS
available and are valued using data obtained by the trustee from the best available source or market value. This method may produce a fair value calculation that may not be indicative of net realizable value or reflective of future fair values. Furthermore, although we believe its valuation method is appropriate and consistent with other market participants, the use of different methodologies or assumptions to determine fair value of certain financial instruments could result in a different fair value measurement at the reporting date.
The fair value of other plan assets by category is summarized below (dollars in thousands):
| | | | | | | | | | | | | | | | | | | | | | | |
| | As of December 31, 2021 |
| Level 1 | | Level 2 | | Level 3 | | Total |
| U.S. Plan Assets | | | | | | | |
| Cash and cash equivalents | $ | 715 | | | $ | — | | | $ | — | | | $ | 715 | |
| International Plan Assets | | | | | | | |
| Foreign government bonds | — | | | 910 | | | — | | | 910 | |
| Fixed insurance contracts | — | | | — | | | 26,003 | | | 26,003 | |
| Total assets in the fair value hierarchy | $ | — | | | $ | 910 | | | $ | 26,003 | | | $ | 26,913 | |
| U.S. Plan - Investments measured at net asset value | | | | | | | $ | 109,246 | |
| Total | $ | 715 | | | $ | 910 | | | $ | 26,003 | | | $ | 136,874 | |
| | | | | | | |
| As of December 31, 2020 |
| Level 1 | | Level 2 | | Level 3 | | Total |
| U.S. Plan Assets | | | | | | | |
| Cash and cash equivalents | $ | 1,850 | | | $ | — | | | $ | — | | | $ | 1,850 | |
| International Plan Assets | | | | | | | |
| Foreign government bonds | $ | — | | | $ | 995 | | | $ | — | | | $ | 995 | |
| Fixed insurance contracts | — | | | — | | | 24,087 | | | 24,087 | |
| Total assets in the fair value hierarchy | $ | — | | | $ | 995 | | | $ | 24,087 | | | $ | 25,082 | |
| U.S. Plan - Investments measured at net asset value | | | | | | | $ | 113,718 | |
| Total | $ | 1,850 | | | $ | 995 | | | $ | 24,087 | | | $ | 140,650 | |
| | | | | | | |
GRAFTECH INTERNATIONAL LTD. AND SUBSIDIARIES
NOTES TO THE CONSOLIDATED FINANCIAL STATEMENTS
| | | | | | | | | | | | | | | | | | | | | | | |
| | December 31, 2023 |
| Level 1 | | Level 2 | | Level 3 | | Total |
| U.S. Plan Assets | | | | | | | |
| Cash and cash equivalents | $ | 710 | | | $ | — | | | $ | — | | | $ | 710 | |
| International Plan Assets | | | | | | | |
| Foreign government bonds | — | | | 961 | | | — | | | 961 | |
| Fixed insurance contracts | — | | | — | | | 29,020 | | | 29,020 | |
| Total international plan assets | $ | — | | | $ | 961 | | | $ | 29,020 | | | $ | 29,981 | |
| U.S. Plan - Investments measured at net asset value | | | | | | | $ | 77,686 | |
| Total | $ | 710 | | | $ | 961 | | | $ | 29,020 | | | $ | 108,377 | |
| | | | | | | |
| December 31, 2022 |
| Level 1 | | Level 2 | | Level 3 | | Total |
| U.S. Plan Assets | | | | | | | |
| Cash and cash equivalents | $ | 706 | | | $ | — | | | $ | — | | | $ | 706 | |
| International Plan Assets | | | | | | | |
| Foreign government bonds | $ | — | | | $ | 1,023 | | | $ | — | | | $ | 1,023 | |
| Fixed insurance contracts | — | | | — | | | 26,685 | | | 26,685 | |
| Total international plan assets | $ | — | | | $ | 1,023 | | | $ | 26,685 | | | $ | 27,708 | |
| U.S. Plan - Investments measured at net asset value | | | | | | | $ | 79,300 | |
| Total | $ | 706 | | | $ | 1,023 | | | $ | 26,685 | | | $ | 107,714 | |
The following table presents the changes for those financial instruments classified within Level 3 of the valuation hierarchy for international plan pension assets for the years ended December 31, 20202023 and 20212022 (dollars in thousands):
| | | | | |
| Fixed Insurance
Contracts |
Balance at December 31, 2019 | $ | 17,985 | |
Gain / contributions / currency impact | 6,149 | |
Distributions | (16) | |
Balance at December 31, 2020 | 24,118 | |
Gain / contributions / currency impact | 1,900 | |
Distributions | (15) | |
| Balance at December 31, 2021 | $ | 26,003 | |
| Gain / contributions / currency impact | 864 | |
| Distributions | (182) | |
| Balance at December 31, 2022 | 26,685 | |
| Gain / contributions / currency impact | 2,489 | |
| Distributions | (154) | |
| Balance at December 31, 2023 | $ | 29,020 | |
GRAFTECH INTERNATIONAL LTD. AND SUBSIDIARIES
NOTES TO THE CONSOLIDATED FINANCIAL STATEMENTS
We annually re-evaluate assumptions and estimates used in projecting pension assets, liabilities and expenses. These assumptions and estimates may affect the carrying value of pension assets, liabilities and expenses in our Consolidated Financial Statements. Assumptions used to determine net pension costs and projected benefit obligations are:
| | Pension Benefit Obligations Key Assumptions | Pension Benefit Obligations Key Assumptions | As of December 31, | Pension Benefit Obligations Key Assumptions | December 31, |
| | | 2021 | | 2020 | | 2023 | | 2022 |
| Weighted average assumptions to determine benefit obligations: | Weighted average assumptions to determine benefit obligations: | | | |
| Discount rate | Discount rate | 2.14 | % | | 1.78 | % |
| Discount rate | |
| Discount rate | | 3.93 | % | | 4.43 | % |
| Rate of compensation increase | Rate of compensation increase | 1.46 | % | | 1.46 | % | Rate of compensation increase | 1.70 | % | | 1.71 | % |
| | Pension Cost Key Assumptions | Pension Cost Key Assumptions | |
| Weighted average assumptions to determine net cost: | Weighted average assumptions to determine net cost: | |
| Weighted average assumptions to determine net cost: | |
| Weighted average assumptions to determine net cost: | |
| Discount rate | |
| Discount rate | |
| Discount rate | Discount rate | 1.78 | % | | 2.59 | % | 4.43 | % | | 2.14 | % |
| Expected return on plan assets | Expected return on plan assets | 3.48 | % | | 4.14 | % | Expected return on plan assets | 5.30 | % | | 3.50 | % |
| Rate of compensation increase | Rate of compensation increase | 1.46 | % | | 1.50 | % | Rate of compensation increase | 1.71 | % | | 1.46 | % |
We adjust our discount rate annually in relation to the rate at which the benefits could be effectively settled. Discount rates are set for each plan in reference to the yields available on AA-rated corporate bonds of appropriate currency and duration. The appropriate discount rate is derived by developing an AA-rated corporate bond yield curve in each currency. The discount rate for a given plan is the rate implied by the yield curve for the duration of that plan’s liabilities. In certain countries, where little public information is available on which to base discount rate assumptions, the discount rate is based on government bond yields or other indices and approximate adjustments to allow for the differences in weighted durations for the specific plans and/or allowance for assumed credit spreads between government and AA-rated corporate bonds.
The expected return on assets assumption represents our best estimate of the long-term return on plan assets and generally was estimated by computing a weighted average return of the underlying long-term expected returns on the different asset classes, based on the target asset allocations. The expected return on assets assumption is a long-term assumption that is expected to remain the same from one year to the next unless there is a significant change in the target asset allocation, the fees and expenses paid by the plan or market conditions.
The rate of compensation increase assumption is generally based on salary increases.
GRAFTECH INTERNATIONAL LTD. AND SUBSIDIARIES
NOTES TO THE CONSOLIDATED FINANCIAL STATEMENTS
the long-term inflation rate projection of the jurisdictions where we have active plans and on any incremental change due to merit or productivity.Plan Assets. The following table presents our retirement plan weighted average asset allocations at December 31, 2021,2023, by asset category:
| | | | Percentage of Plan Assets as of December 31, 2021 | | Percentage of Plan Assets December 31, 2023 |
| | | U.S. | | Foreign | | U.S. | | Foreign |
| Equity securities and return seeking assets | Equity securities and return seeking assets | 20 | % | | — | % | Equity securities and return seeking assets | 20 | % | | — | % |
| Fixed income, debt securities, or cash | Fixed income, debt securities, or cash | 80 | % | | 100 | % | Fixed income, debt securities, or cash | 80 | % | | 100 | % |
| Total | Total | 100 | % | | 100 | % | Total | 100 | % | | 100 | % |
Investment Policy and Strategy. The investment policy and strategy of the U.S. plan is to invest approximately 20% in equities and return seeking assets and approximately 80% in fixed income securities. Rebalancing is undertaken monthly. To the extent we maintain plans in other countries, target asset allocation is 100% fixed income investments. For each plan, the investment policy is set within both asset return and local statutory requirements.
GRAFTECH INTERNATIONAL LTD. AND SUBSIDIARIES
NOTES TO THE CONSOLIDATED FINANCIAL STATEMENTS
Information for our pension plans with an accumulated benefit obligation in excess of plan assets at December 31, 20202023 and 20212022 follows:
| | | | 2021 | | 2020 | | 2023 | | 2022 |
| | | U.S. | | Foreign | | U.S. | | Foreign | | U.S. | | Foreign | | U.S. | | Foreign |
| | | (Dollars in thousands) | | (Dollars in thousands) |
| Accumulated benefit obligation | Accumulated benefit obligation | $ | 129,906 | | | $ | 35,247 | | | $ | 140,254 | | | $ | 35,316 | |
| Fair value of plan assets | Fair value of plan assets | 109,961 | | | 26,003 | | | 115,568 | | | 24,118 | |
Information for our pension plans with a projected benefit obligation in excess of plan assets at December 31, 20212023 and 20202022 follows:
| | | | 2021 | | 2020 | | 2023 | | 2022 |
| | | U.S. | | Foreign | | U.S. | | Foreign | | U.S. | | Foreign | | U.S. | | Foreign |
| | | (Dollars in thousands) | | (Dollars in thousands) |
| Projected benefit obligation | Projected benefit obligation | $ | 129,906 | | | $ | 37,412 | | | $ | 140,254 | | | $ | 37,734 | |
| Fair value of plan assets | Fair value of plan assets | 109,961 | | | 26,003 | | | 115,568 | | | 24,118 | |
Following is our projected future pension plan cash flow by year:
| | | | | | | | | | | |
| U.S. | | Foreign |
| | (Dollars in thousands) |
| Expected contributions in 2022: | | | |
| Expected employer contributions | $ | 420 | | | $ | 958 | |
| Expected employee contributions | — | | | — | |
| Estimated future benefit payments reflecting expected future service for the years ending December 31: | | | |
| 2022 | 9,224 | | | 1,352 | |
| 2023 | 9,186 | | | 1,503 | |
| 2024 | 9,067 | | | 2,916 | |
| 2025 | 9,015 | | | 1,581 | |
| 2026 | 8,914 | | | 2,663 | |
| 2027-2031 | 40,997 | | | 12,312 | |
GRAFTECH INTERNATIONAL LTD. AND SUBSIDIARIES
NOTES TO THE CONSOLIDATED FINANCIAL STATEMENTS
| | | | | | | | | | | |
| U.S. | | Foreign |
| | (Dollars in thousands) |
| Expected contributions in 2024: | | | |
| Expected employer contributions | $ | 4,709 | | | $ | 677 | |
| Expected employee contributions | — | | | — | |
| Estimated future benefit payments reflecting expected future service for the years ending December 31: | | | |
| 2024 | $ | 9,021 | | | $ | 3,152 | |
| 2025 | 8,912 | | | 1,411 | |
| 2026 | 8,826 | | | 2,673 | |
| 2027 | 8,596 | | | 2,177 | |
| 2028 | 8,379 | | | 1,723 | |
| Next five years | 37,440 | | | 11,850 | |
Post-Employment Benefit Plans
We have legacy post-employment medical coverage and life insurance benefits for eligible retired employees in the U.S. and in certain foreign jurisdictions. Effective December 31, 2005, all U.S. post-employment medical coverage plans were frozen.
The post-employment benefit plans are un-funded and our periodic contributions correspond to the amount of benefits paid in the period. Our funding contributions were $1.4$1.3 million and $1.3$1.2 million in 20212023 and 2020,2022, respectively.
The estimated liability for post-employment benefit plans was $16.0$14.3 million and $17.2$13.5 million as of December 31, 20212023 and 2020,2022, respectively. The Company recognized expense recognizedof $2.0 million in 2023, income of $0.9 million in 2022 and expense of $0.5 million in 2021 in the Consolidated Statement of Operations for post-employment benefits was $0.5 million, $0.7 million and $1.6 million for 2021, 2020 and 2019, respectively.benefits. Included in post-employment benefit expense are mark-to-market losses of $1.1 million in 2023 and mark-to-market gains of $1.6 million and $0.1 million in 2022 and less than $0.1 million for 2021, and 2020, respectively, and a mark-to-market loss of $0.6 million in 2019.
Savings Plan
Our employee savings plan provides eligible employees the opportunity for long-term savings and investment. The plan allows employees to contribute up to 5% of pay as a basic contribution and an additional 45% of pay as supplemental contribution. In 2021, 2020 and 2019, theThe Company's matching contributions to our savings plan were $3.0 million in both 2023 and 2022 and $2.5 million $2.2 million and $2.1 million, respectively.in 2021.
GRAFTECH INTERNATIONAL LTD. AND SUBSIDIARIES
NOTES TO THE CONSOLIDATED FINANCIAL STATEMENTS
(12)Commitments and Contingencies
Legal Proceedings
We are involved in various investigations, lawsuits, claims, demands, environmental compliance programslabor disputes and other legal proceedings, including with respect to environmental and human exposure or other personal injury matters, arising out of or incidental to the conduct of our business. While it is not possible to determine the ultimate disposition of each of these matters and proceedings, we do not believe that their ultimate disposition will have a material adverse effect on our financial position, results of operations or cash flows. Additionally, we are involved in the following legal proceedings described below.proceedings.
Arbitrations
We are involved in variouscertain arbitrations sometimes as claimants and other times as respondents/counterclaimants, pending before the International Chamber of Commerce with severala few customers who, among other things, have failed to perform under their LTAs and in certain instances are seeking to modify or frustrate their contractual commitments to us. In particular, Aperam South America LTDA, Aperam Sourcing S.C.A., ArcelorMittal Sourcing S.C.A., and ArcelorMittal Brasil S.A. (collectively, the “Claimants”) initiated a single arbitration proceeding against two of the Company’s subsidiaries in the International Chamber of Commerce in June 2020. In June 2021, the Claimants filed their statement of claim, seeking approximately $61 million plus interest in monetary relief and/or reimbursement in respect of several fixed price LTAs that were executed between such subsidiaries and the Claimants in 2017 and 2018. The Claimants argue, among other things, that they should no longer be required to comply with the terms of the LTAs that they signed due to an alleged drop in market prices for graphite electrodes in January 2020. Alternatively, the Claimants argue that they should not be required to comply with the LTAs that they signed due to alleged market circumstances at the time of execution. In June 2021, the Claimants filed their statement of claim, seeking approximately $61.0 million plus interest in monetary relief and/or reimbursement in respect of several fixed price LTAs that were executed between such subsidiaries and the Claimants in 2017 and 2018. On December 16, 2022, the Claimants revised their calculation of alleged damages to approximately $178.9 million including interest, with damages covering the period from the first quarter of 2020 through the end of the third quarter of 2022 and interest covering the period from June 2020 through December 16, 2022. In March 2023, an International Chamber of Commerce hearing was held before the party-appointed sole arbitrator with the Claimants, the Company, and witnesses in attendance. On March 31, 2023, the Claimants further revised their calculation of alleged damages to approximately $171.7 million, including interest, for the period covering the first quarter of 2020 through 2022. In June of 2023, the Claimants again revised their calculation of alleged damages to approximately $188.2 million, including interest, for the period covering the first quarter of 2020 through the first quarter of 2023. We believe we have valid defenses to these claims. We intend to vigorously defend them and enforce our rights under the LTAs.
Pending litigation in Brazil has been brought by employees seeking to recover additional amounts and interest thereon under certain wage increase provisions applicable in 1989 and 1990 under collective bargaining agreements to which employers in the Bahia region of Brazil were a party (including our subsidiary in Brazil). Companies in Brazil have settled claims arising out of these provisions and, in May 2015, the litigation was remanded by the Brazilian Supreme Court in favor of the employees union. After denying an interim appeal by the Bahia region employers on June 26, 2019, the Brazilian Supreme Court finally ruled in favor of the employees union on September 26, 2019. The employers union has determined not to seek annulment of such decision. Separately, on October 1, 2015, a related action was filed by current and former employees against our subsidiary in Brazil to recover amounts under such provisions, plus interest thereon, which amounts together with interest could be material to us. If the Brazilian Supreme Court proceeding above had been determined in favor of the employers union, it would also have resolved this proceeding in our favor. In the first quarter of 2017, the state court initially ruled in favor of the employees. We appealed this state court ruling, and the appellate court issued a decision in our favor on May 19, 2020. The employees have further appealed and, on December 16, 2020, the court upheld the decision in favor of GrafTech Brazil. On February 22, 2021, the employees filed a further appeal and, on April 28, 2021, the court rejected the employees'employees’ appeal in
favor of GrafTech Brazil. The employees filed a further appeal and on September 12, 2022, we filed our response in opposition. We intend to vigorously defend our position. As of December 31, 2021,2023, we are unable to assess the potential loss associated with these proceedings as the claims do not currently specify the number of employees seeking damages or the amount of damages being sought.
GRAFTECH INTERNATIONAL LTD. AND SUBSIDIARIES
NOTES TO THE CONSOLIDATED FINANCIAL STATEMENTS
Product Warranties
We generally sell products with a limited warranty. We accrue for known warranty claims if a loss is probable and can be reasonably estimated. We also accrue for estimated warranty claims incurred based on a historical claims charge analysis. Claims accrued but not yet paid and the related activity within the reserve for 20202022 and 20212023 are as follows:
| | | | | |
| | |
| (Dollars in thousands) |
| |
Balance as of December 31, 2019 | $ | 1,835 | |
Product warranty charges/adjustments | 1,220 | |
Payments and settlements | (1,058) | |
Balance as of December 31, 2020 | $ | 1,997 | |
Product warranty charges/adjustments | 1,183 | |
Payments and settlements | (2,092) | |
| Balance as of December 31, 2021 | $ | 1,088 | |
| Product warranty charges/adjustments | 456 | |
| Payments and settlements | (724) | |
| Balance as of December 31, 2022 | $ | 820 | |
| Product warranty charges/adjustments | 25 | |
| Payments and settlements | (768) | |
| Balance as of December 31, 2023 | $ | 77 | |
Related Party Tax Receivable Agreement
On April 23, 2018, the Company entered into the Tax Receivable Agreement that provides Brookfield, as the sole Pre-IPO stockholder, the right to receive future payments from us for 85% of the amount of cash savings, if any, in U.S. federal income tax and Swiss tax that we and our subsidiaries realize as a result of the utilization of the pre-IPO Tax Assets. In addition, we will pay interest on the payments we will make to Brookfield with respect to the amount of these cash savings from the due date (without extensions) of our tax return where we realize these savings to the payment date at adate. On April 10, 2023, the Tax Receivable Agreement was amended and restated to change the applicable interest rate equal tofrom LIBOR plus 1.00% per annum.year to the one-month period secured overnight financing rate administered by the Federal Reserve Bank of New York plus 1.10%. The term of the Tax Receivable Agreement commenced on April 23, 2018 and will continue until there is no potential for any future tax benefit payments.
As of December 31, 2020,2023, total Tax Receivable Agreement liability was $40.9$11.1 million, of which $21.8$5.4 million was classified as a current liability in "Related party payable - Tax Receivable Agreement" on the Consolidated Balance Sheets as we expected this portion to be settled within 12 months, and $19.1$5.7 million of the liability remainedwas classified as a long-term liability in "Related party payable - Tax Receivable Agreement long-term" on the Consolidated Balance Sheets. The 2020 current liability was settled in the first quarter of 2021.
In 2021, the Tax Receivable Agreement liability increased $0.2 million as a result of revised U.S. income estimates affecting the future usage of our U.S. tax attributes and related interest. The increase was recorded in "Related Party Tax Receivable Agreement Expense (Benefit)" on the Consolidated Statement of Operations. As of December 31, 2021,2022, the total Tax Receivable Agreement liability is $19.3was $15.5 million, of which $3.8$4.6 million iswas classified as a current liability "Related party payable - Tax Receivable Agreement" on the Consolidated Balance Sheets, as we expect this portion to be settled within 12 months, and $15.5$10.9 million of the liability remainswas classified as a long-term liability in "Related party payable - Tax Receivable Agreement long-term" on the Consolidated Balance Sheets.liability.
Long-term Incentive Plan
The long-term incentive plan ("LTIP") was adopted by the Company in August 2015 and amended and restated in March 2018. The purpose of the plan was to retain senior management of the Company, to incentivize them to make decisions with a long-term view and to influence behavior in a way that is consistent with maximizing value for the pre-IPO stockholder of the Company in a prudent manner. Each participant was allocated a number of profit units, with a maximum of 30,000 profit units ("Profit Units") available under the plan. Awards of Profit Units generally vested in equal increments over a five-year period beginning on the first anniversary of the grant date of the Profit Units, subject to continued employment with the Company through each vesting date. If a participant ceased to provide services prior to any applicable vesting date for any reason, other than a termination for cause, then the participant forfeited all unvested Profit Units and any vested Profit Units remained outstanding. If a participant had been terminated for cause, both vested and unvested Profit Units would have been forfeited. Upon a Change in Control (as defined in the LTIP), the Profit Units entitled the participant to a payment based on a
percentage of the sum of (i) all net "Sale Proceeds" (as defined in the LTIP) received by Brookfield Capital IV L.P. and its affiliates ("Brookfield Capital IV") less (ii) the "Threshold Value" (as defined in the LTIP), with such payment amount being determined by the Company's Board of Directors in its sole discretion. In the event that, in connection with a Change in Control, Brookfield Capital IV disposes of less than 100% of its ownership interest in the Company, the amount of the Sale Proceeds in excess of the Threshold Value shall be determined on a pro-rata basis by reference to the percentage of ownership interest disposed, as determined by the Board of Directors of the Company.
GRAFTECH INTERNATIONAL LTD. AND SUBSIDIARIES
NOTES TO THE CONSOLIDATED FINANCIAL STATEMENTS
The May 2021 secondary offering of our common stock by Brookfield Capital IV constituted a Change in Control under the LTIP. A Change in Control under the LTIP is defined as, among other things, a transaction or series of transactions (including, without limitation, the consummation of a combination, share purchases, recapitalization, redemption, issuance of capital stock, consolidation, reorganization or otherwise) pursuant to which following a public offering of the Company’s stock, Brookfield Capital IV ceases to have a beneficial ownership interest in at least 30% of the Company’s outstanding voting securities (effective on the first of such date). Upon completion of the May 2021 secondary offering, Brookfield beneficially owned approximately 24% of the Company's outstanding voting securities. Accordingly, the Company settled the vested Profit Units in lump sum payments within 30 days following the Change in Control. In the second quarter 2021, the settlement of the Profit Units resulted in the recording of a pre-tax charge of $73.4 million, of which $30.7 million was recorded in cost of salesgoods sold and $42.7 million was recorded in selling and administrative expense. As of December 31, 2021, $71.4To date, $71.8 million of the charges have been settled in cash by the Company while the remainder of the liability, related to payroll taxes, is expected to be paid in subsequent quarters, which will satisfy all obligations under the LTIP.
Mexico Value-Added Tax ("VAT")
In July 2019, the Mexican Tax Authority (“MTA”) opened an audit of the VAT filings of GrafTech Comercial de Mexico S. de R.L. de C.V. (“GrafTech Commercial Mexico”) for the period of January 1 to April 30, 2019. In September 2021, the MTA issued a tax assessment, claiming improper use of a certain VAT exemption rule for purchases from a foreign affiliate. As of December 31, 2023, the tax assessment for the four month period under audit amounted to approximately $28.8 million, including penalties, inflation and interest. Interest will continue to accrue up to five years from the date the corresponding VAT returns were filed and inflation will continue to accrue with the passage of time. GrafTech Commercial Mexico filed an administrative appeal against the tax assessment with the MTA's appeals office. In November 2022, the MTA’s appeals office concluded its review and confirmed the tax assessment. GrafTech Commercial Mexico believes that the purchases from a foreign affiliate are exempt from VAT back-up withholding, and in December 2022, GrafTech Commercial Mexico filed a Claim for Nullity with the Chamber Specialized in exclusive resolution of substance of the Federal Court of Administrative Justice. On February 17, 2023, the MTA filed the response to the nullity petition. On May 31, 2023, the court held a hearing to determine the scope of the issues to be decided in the proceedings. At the court’s request, GrafTech Commercial Mexico submitted formal pleadings on August 1, 2023. On January 8, 2024, the court ruled in GrafTech Commercial Mexico’s favor and annulled the tax assessment. On January 31, 2024, the MTA filed an appeal for review.
(13)Income TaxesIn March 2022, the MTA opened another audit of the VAT filings of GrafTech Commercial Mexico for the period January 1 to December 31, 2018. In the proposed assessment received in January 2023, the MTA is alleging the same improper use of certain VAT exemption rules on purchases from a foreign affiliate and has provided notice of its intent to assess approximately $51.0 million, including penalties, inflation and interest. In Mexico, each tax assessment requires a separate claim. In the first quarter of 2023, GrafTech Commercial Mexico requested a conclusive agreement with the Mexican ombudsman (“PRODECON”) to reach a settlement with the MTA. The MTA responded to GrafTech Commercial Mexico’s request on May 30, 2023. On August 2, 2023, GrafTech Commercial Mexico filed a motion exhibiting additional information and reaffirming its position. On September 22, 2023, the MTA responded to GrafTech Commercial Mexico’s motion. On October 2, 2023, GrafTech Commercial Mexico filed a motion requesting a formal meeting with the MTA and PRODECON, which occurred on November 14, 2023. During the meeting, the parties agreed that GrafTech Commercial Mexico will provide additional documentation and information to be evaluated by the MTA, and, on November 29, 2023, GrafTech Commercial Mexico filed the information requested. On January 24, 2024, the MTA filed its response. On that same day, GrafTech Commerical Mexico submitted before PRODECON the favorable ruling it obtained on January 8, 2024 in connection with the 2019 preceding for the MTA’s consideration. On February 1, 2024, the MTA confirmed its position, holding that GrafTech Commercial Mexico was required to withhold the VAT. GrafTech Commercial Mexico plans to challenge the assessment. The $51.0 million includes interest and inflation. Interest will continue to accrue up to five years from the date the corresponding VAT returns were filed and inflation will continue to accrue with the passage of time.
As evidenced by the favorable court decision issued on January 8, 2024, GrafTech Commercial Mexico’s application of the VAT exemption rules is appropriate and, accordingly, GrafTech Commercial Mexico does not believe that it is probable that it will incur a loss related to this matter for either of the two periods under the MTA's audit. The following table summarizes the U.S. and non-U.S. components of income before provision for income taxes:
| | | | | | | | | | | | | | | | | |
| For the Year Ended December 31, |
| | 2021 | | 2020 | | 2019 |
| | (Dollars in thousands) |
| U.S. | $ | (69,087) | | | $ | 51,672 | | | $ | 85,365 | |
| Non-U.S. | 525,493 | | | 458,373 | | | 757,462 | |
| Income before provision for income taxes | $ | 456,406 | | | $ | 510,045 | | | $ | 842,827 | |
Provision for income taxes consists of the following:
| | | | | | | | | | | | | | | | | | |
| | For the Year Ended December 31, | |
| | 2021 | | 2020 | | 2019 |
| | |
| U.S. income taxes: | | | | | | |
| Current | $ | 645 | | | $ | (7,660) | | | $ | 16,589 | | |
| Deferred | 2,132 | | | 27,822 | | | 5,690 | | |
| 2,777 | | | 20,162 | | | 22,279 | | |
| Non-U.S. income taxes: | | | | | | |
| Current | 71,088 | | | 63,092 | | | 64,134 | | |
| Deferred | (5,789) | | | (7,583) | | | 11,812 | | |
| 65,299 | | | 55,509 | | | 75,946 | | |
| Provision for income taxes | $ | 68,076 | | | $ | 75,671 | | | $ | 98,225 | | |
Provision for income taxes in 2021 was $68.1 million on income before taxes of $456.4 million. In 2020, provision for income taxes was $75.7 million on income before taxes of $510.0 million, and in 2019, provision for income taxes was $98.2 million on income before taxes of $842.8 million. The change in tax expense from year to year is primarily due to the reduction in pre-tax income, the mix of worldwide earnings from various countries taxed at different rates and the U.S. taxation of GILTI. The years 2019 and 2021 also included the partial release of a valuation allowance recorded against the deferred tax asset related to certain foreign, U.S. federal and state tax attributes.
GRAFTECH INTERNATIONAL LTD. AND SUBSIDIARIES
NOTES TO THE CONSOLIDATED FINANCIAL STATEMENTS
Provision for income taxes differed from the amount computed by applying the U.S. federal income tax rate of 21% for the years ended December 31, 2021, 2020 and 2019 to(13)Income Taxes
(Loss) income before the (benefit) provision for income taxes as set forth inwas derived from the following table:sources:
| | | | | | | | | | | | | | | | | |
| For the Year Ended December 31, |
| | 2021 | | 2020 | | 2019 |
| | (Dollars in thousands) |
| Tax at statutory U.S. federal rate | $ | 95,845 | | | $ | 107,109 | | | $ | 176,994 | |
| Impact of U.S. Tax Cuts and Jobs Act of 2017 - GILTI | 51,016 | | | 45,539 | | | 65,531 | |
| Impact of Tax Receivable Agreement | 49 | | | (4,429) | | | 713 | |
| Valuation allowance | (2,208) | | | (980) | | | (14,548) | |
| State taxes, net of federal tax benefit | 1,414 | | | 3,591 | | | 4,231 | |
| U.S. tax impact of foreign earnings (net of foreign tax credits) | 537 | | | 2,113 | | | 2,181 | |
| | | | | |
| Establishment/resolution of uncertain tax positions | (48) | | | (78) | | | (1,293) | |
| Adjustment for foreign income taxed at different rates | (38,530) | | | (38,464) | | | (76,922) | |
| Foreign tax credits | (43,821) | | | (37,280) | | | (56,171) | |
| Change-in-Control-related compensation | 10,626 | | | — | | | — | |
| Other | (6,804) | | | (1,450) | | | (2,491) | |
| Provision for income taxes | $ | 68,076 | | | $ | 75,671 | | | $ | 98,225 | |
| | | | | | | | | | | | | | | | | |
| Year Ended December 31, |
| | 2023 | | 2022 | | 2021 |
| | (Dollars in thousands) |
| U.S. | $ | (111,821) | | | $ | 55,107 | | | $ | (69,087) | |
| Foreign | (161,943) | | | 397,211 | | | 525,493 | |
| (Loss) income before (benefit) provision for income taxes | $ | (273,764) | | | $ | 452,318 | | | $ | 456,406 | |
The (benefit) provision for income taxes consisted of the following:
| | | | | | | | | | | | | | | | | | |
| | Year Ended December 31, | |
| | 2023 | | 2022 | | 2021 |
| | (Dollars in thousands) | |
| U.S. income taxes: | | | | | | |
| Current | $ | (129) | | | $ | 3,590 | | | $ | 645 | | |
| Deferred | (12,643) | | | 13,302 | | | 2,132 | | |
| (12,772) | | | 16,892 | | | 2,777 | | |
| Foreign income taxes: | | | | | | |
| Current | 9,738 | | | 48,744 | | | 71,088 | | |
| Deferred | (15,480) | | | 3,720 | | | (5,789) | | |
| (5,742) | | | 52,464 | | | 65,299 | | |
| (Benefit) provision for income taxes | $ | (18,514) | | | $ | 69,356 | | | $ | 68,076 | | |
The provision for income taxes represented a benefit for the year ended December 31, 2023 compared to an expense for the year ended December 31, 2022. Total pre-tax earnings shifted from a profit position to a loss position and the Company recorded a goodwill impairment charge that is not tax deductible.
A reconciliation of income taxes at the U.S. statutory rate to the (benefit) provision for income taxes follows:
| | | | | | | | | | | | | | | | | |
| Year Ended December 31, |
| | 2023 | | 2022 | | 2021 |
| | (Dollars in thousands) |
| Tax at statutory U.S. federal rate | $ | (57,490) | | | $ | 94,987 | | | $ | 95,845 | |
| Impact of U.S. Tax Cuts and Jobs Act of 2017 - GILTI | 1,041 | | | 38,153 | | | 51,016 | |
| Impact of Tax Receivable Agreement | 91 | | | (39) | | | 49 | |
| Valuation allowance | (282) | | | (1,259) | | | (2,208) | |
| State taxes, net of federal tax benefit | 818 | | | 2,182 | | | 1,414 | |
| U.S. tax impact of foreign earnings (net of foreign tax credits) | 311 | | | 348 | | | 537 | |
| Establishment/resolution of uncertain tax positions | (36) | | | (40) | | | (48) | |
| Adjustment for foreign income taxed at different rates | 16,666 | | | (25,656) | | | (38,530) | |
| Foreign tax credits | (2,534) | | | (34,264) | | | (43,821) | |
| Change-in-Control-related compensation | — | | | (1,432) | | | 10,626 | |
| Impact of non-deductible goodwill impairment | 24,570 | | | — | | | — | |
| Other | (1,669) | | | (3,624) | | | (6,804) | |
| (Benefit) provision for income taxes | $ | (18,514) | | | $ | 69,356 | | | $ | 68,076 | |
GRAFTECH INTERNATIONAL LTD. AND SUBSIDIARIES
NOTES TO THE CONSOLIDATED FINANCIAL STATEMENTS
The tax effects of temporary differences that give rise to significant components of the deferred tax assets and deferred tax liabilities at December 31, 20212023 and 20202022 are set forth in the following table:
| | | | As of December 31, | | December 31, |
| | | 2021 | | 2020 | | 2023 | | 2022 |
| | | (Dollars in thousands) | | (Dollars in thousands) |
| Deferred tax assets: | Deferred tax assets: | |
| Post-employment and other employee benefits | |
| Post-employment and other employee benefits | |
| Post-employment and other employee benefits | Post-employment and other employee benefits | $ | 17,375 | | | $ | 18,202 | |
| Foreign tax credit and other carryforwards | Foreign tax credit and other carryforwards | 32,452 | | | 37,101 | |
| Capitalized research and experimental costs | Capitalized research and experimental costs | 1,935 | | | 3,897 | |
| Environmental reserves | Environmental reserves | 1,133 | | | 1,111 | |
| Inventory adjustments | Inventory adjustments | 10,545 | | | 7,381 | |
| | Long-term contract option amortization | Long-term contract option amortization | 982 | | | 1,031 | |
| Provision for rationalization charges | 71 | | | 96 | |
| Mark-to-market hedges | — | | | 3,552 | |
| | Long-term contract option amortization | |
| | Long-term contract option amortization | |
| Previously taxed income | Previously taxed income | 5,229 | | | 2,163 | |
| Other | Other | 2,175 | | | 1,483 | |
| Total gross deferred tax assets | Total gross deferred tax assets | 71,897 | | | 76,017 | |
| Less: valuation allowance | Less: valuation allowance | (10,550) | | | (12,773) | |
| Total deferred tax assets | Total deferred tax assets | 61,347 | | | 63,244 | |
| Deferred tax liabilities: | Deferred tax liabilities: | | | |
| Fixed assets | Fixed assets | $ | 51,595 | | | $ | 54,485 | |
| Fixed assets | |
| Fixed assets | |
| | Inventory | Inventory | 8,834 | | | 8,573 | |
| Inventory | |
| Inventory | |
| | Goodwill and acquired intangibles | |
| Goodwill and acquired intangibles | |
| Goodwill and acquired intangibles | Goodwill and acquired intangibles | 9,502 | | | 7,552 | |
| Mark-to-market hedges | Mark-to-market hedges | 2,824 | | | — | |
| Other | Other | 3,079 | | | 3,254 | |
| Total deferred tax liabilities | Total deferred tax liabilities | 75,834 | | | 73,864 | |
| Net deferred tax (liability) | $ | (14,487) | | | $ | (10,620) | |
| Net deferred tax liability | |
Net deferred tax assets are separately stated as deferred income taxes in the amount of $61.3 million as of December 31, 2021 and $63.2 million as of December 31, 2020. Net deferred tax liabilities are separately stated as deferred income taxes in the amount of $75.8 million at December 31, 2021 and $73.9 million at December 31, 2020.
At each reporting period, we assessthe Company assesses the need for valuation allowances against deferred tax assets based on determinations ofand whether it is more likely than not that deferred tax benefits will be realized through the generation of future taxable income. Appropriate considerationin each jurisdiction. Consideration is given to all available evidence, both positive and negative, in assessing the need for a valuation allowance. Examples of positive evidence would include a strong earnings history, an event or events that would increase ourthe Company's taxable income through a continued reduction ofor reduce expenses, andor tax planning strategies that would indicate ancreate the ability to realize deferred tax assets. Examples of negative evidence would include cumulative losses in recent years andor a history of tax attributes expiring unused. In circumstances where the significantnegative evidence outweighs the positive evidence, does not outweigh the negative evidence in our assessment, we haveCompany has established andor maintained valuation allowances on thosethe jurisdiction’s net deferred tax assets. However, the recognition of the valuation allowance does not result in or limit the Company's ability to utilize these tax assets on a tax return in the future.future should taxable income be realized in sufficient amount to realize the assets.
Valuation allowance activity for the years ended December 31, 2023, 2022 and 2021 is as follows:
| | | | | |
| (Dollars in thousands) |
| Balance as of December 31, 2020 | $ | 12,773 | |
| Credited to income | (2,208) | |
| Translation adjustment | (15) | |
| Balance as of December 31, 2021 | $ | 10,550 | |
| Credited to income | (1,259) | |
| |
| Translation adjustment | (22) | |
| Balance as of December 31, 2022 | $ | 9,269 | |
| Credited to income | (268) | |
| |
| Translation adjustment | (45) | |
| Balance as of December 31, 2023 | $ | 8,956 | |
GRAFTECH INTERNATIONAL LTD. AND SUBSIDIARIES
NOTES TO THE CONSOLIDATED FINANCIAL STATEMENTS
Valuation allowance activity for the years ended December 31, 2021, 2020 and 2019 is as follows:
| | | | | |
| (Dollars in thousands) |
Balance as of December 31, 2018 | $ | 58,446 | |
Credited to income | (14,548) | |
Changes attributable to write-off of underlying assets | (30,138) | |
Translation adjustment | (24) | |
Balance as of December 31, 2019 | $ | 13,736 | |
Credited to income | (980) | |
| |
Translation adjustment | 17 | |
Balance as of December 31, 2020 | $ | 12,773 | |
Credited to income | (2,208) | |
| |
Translation adjustment | (15) | |
Balance as of December 31, 2021 | $ | 10,550 | |
During 2018, we determined that sufficient positive evidence existed that allowed us to conclude that a full valuation allowance was no longer required to be recorded against the deferred tax assets related the U.S. tax attributes. This positive evidence was primarily supplied by the Company exiting a cumulative loss period in the United States as well as sufficient U.S. current and forecasted taxable income that would utilize the U.S. tax attributes. As a result, a partial release (to reflect only the economic benefit of the attributes) of the valuation allowance against federal net operating losses and state losses was recorded in 2018, while a full release of the valuation allowance against the federal foreign tax credit carryforward, other federal deferred tax assets was also recorded. A valuation allowance of $35.8 million is included in the December 31, 2018 balance reflected above as there was not sufficient positive evidence that the deferred tax asset related to the U.S. federal net operating loss would generate more than its estimated economic benefit. This valuation allowance and the related deferred tax asset were subsequently released to the income statement in 2019. In 2020, the reductionThe decrease in the valuation allowance resultedin 2023 was primarily from expirations of NOLs upon which a valuation allowance was previously recorded. In 2021, the decrease in valuation allowance was mainly attributable to changes in expected future utilization, state law changes and expiration of U.S. state NOL carryforwardcarryforwards during the year. The reduction in the valuation allowance in 2022 resulted primarily from changes in expected future utilization, state law changes and expiration of U.S. state NOL carryforwards during the year.
As of December 31, 2021, we have2023, the Company had a total foreign tax credit carryforward of $13.1$4.5 million. These tax credit carryforwards begin to expire in 2027. In addition, we havethe Company had state net operating lossNOL carryforwards of $239.6$148.2 million (net of federal benefit), which can be carried forward from five to 20 years. These state net operating lossNOL carryforwards resultresulted in a deferred tax asset of $14.3$10.6 million as of December 31, 2021. We2023. The Company also havehas U.S. state tax credits of $0.1$0.2 million as of December 31, 2021. Our2023. The Company's U.S. interest limitations and foreign loss carryforwards on a gross basis are $6.8were $40.0 million and may be carried forward indefinitely.$7.5 million, respectively, as of December 31, 2023. These carryforwards do not expire.
As of December 31, 2021, we2023, the Company had no unrecognized tax benefits of $0.1 million, which, if recognized, would have a favorable impact on our effective tax rate.benefits. No material amounts of accrued interest or penalties have been recorded as of December 31, 20212023 or 2020.2022. A reconciliation of the beginning and ending amount of unrecognized tax benefits is as follows:
| | | | | |
| (Dollars in thousands) |
Balance as of December 31, 2019 | $ | 184 | |
Settlements | (75) | |
| |
| |
Foreign currency impact | 16 | |
Balance as of December 31, 2020 | $ | 125 | |
| |
| |
Lapse of statutes of limitations | (45) | |
Foreign currency impact | (7) | |
| Balance as of December 31, 2021 | $ | 73 | |
| Lapse of statute of limitations | (40) | |
| Foreign currency impact | 3 | |
| Balance as of December 31, 2022 | $ | 36 | |
| Lapse of statute of limitations | (36) | |
| Foreign currency impact | — | |
| Balance as of December 31, 2023 | $ | — | |
It is reasonably possible that a reduction ofWe do not expect there will be new unrecognized tax benefits of up to $0.1 million may occur within 12 months due to settlements and the expiration of statutes of limitation.months.
We fileThe Company files income tax returns in the U.S. federal jurisdiction, and various state and foreign jurisdictions. All U.S. federal tax years prior to 20182019 are generally closed by statute or have been audited and settled with the applicable domestic tax authorities. Other jurisdictions are generally closed for years prior to 2016.
GRAFTECH INTERNATIONAL LTD. AND SUBSIDIARIES
NOTES TO THE CONSOLIDATED FINANCIAL STATEMENTS
2018. As of December 31, 2021,2023, the Company has accumulated undistributed earnings generated by ourits foreign subsidiaries of approximately $1.2$1.0 billion. Because $1.1$1.0 billion of such earnings have previously been subject to taxation by way of the transition tax on foreign earnings required by the Tax Cuts and Jobs Act of 2017, as well as the current and previous years’ GILTI inclusion, any additional taxes due with respect to such earnings or the excess of the amount for financial reporting over the tax basis of ourGrafTech's foreign investments would generally be limited to foreign withholding and state taxes. We intend,The Company intends, however, to indefinitely reinvest these earnings and expect future U.S. cash generation to be sufficient to meet future U.S. cash needs.
GrafTech has considered the tax impact of COVID-19 legislation, including the American Rescue Plan Act, and has concluded that there is no material tax impact. The Company continues to monitor the tax effects of any legislative changes.
(14)Stockholders' Equity (Deficit)
The following information should be read in conjunction with the Consolidated Statement of Stockholders' Equity (Deficit).
Follow-on Offerings and Common Stock Repurchases
On December 5,July 31, 2019, GrafTechthe Company announced two separate transactions. The first was a Rule 144 secondary block trade in which Brookfield sold 11,175,927 sharesthat its Board of GrafTech common stock at a priceDirectors approved the repurchase of $13.125 per shareup to a broker-dealer who placed the shares with institutional and other investors. Separately, GrafTech entered into a share repurchase agreement with Brookfield to repurchase $250$100.0 million of stock from Brookfield at the arm's length price of $13.125 per share, set by the competitive bidding process of the secondary block trade. As a result, GrafTech repurchased 19,047,619 shares of common stock, reducing total shares outstanding at the time by approximately 7%.
Brookfield has since distributed a portion of its GrafTech common stock to the owners in the Brookfield consortium and sold shares of GrafTech common stock in public and private transactions, resulting in Brookfield's ownership of outstanding shares of GrafTech common stock decreasing to 55.3% as of December 31, 2020 and 24.3% as of December 31, 2021.
We announced on July 31, 2019, that our Board of Directors authorized a program to repurchase up to $100 million of our outstanding common stock. We may purchase shares from time to time on the open market purchases, including under Rule 10b5-1 and/or Rule 10b-18 plans. On November 4, 2021, the Company announced that its Board of Directors approved the repurchase of an additional $150.0 million of its common stock under this program. The stock repurchase program does not have an expiration date.
The Company did not repurchase any of its common stock in 2023. The Company repurchased 6,662,421 shares of its common stock for $60.0 million in 2022 and 4,658,544 shares of its common stock for $50.0 million in 2021, under the stock repurchase program. The amount and timing of repurchases are subject to a variety of factors including liquidity, stock price, applicable legal requirements, other business objectives and market conditions. On November 4, 2021, we announced that our Board of Directors approved an additional $150 million open market stock repurchase authorization. The stock repurchase program does not have an expiration date.
We repurchased 1,004,685 shares for $10.9 million in 2019, 3,328,574 shares for $30.1 million in 2020 and 4,658,544 shares for $50.0 million in 2021, under the stock repurchase program.
As of December 31, 2021, we are authorized to repurchase up to $159 million in shares of our common stock under the stock repurchase program, inclusive of the amount remaining under the previous authorization.
Dividends
The Company paid regular quarterly dividends of $0.085 through the first quarter of 2020. Effective in the second quarter of 2020, the regular quarterly dividend was reduced to $0.01 per share.
Accumulated other comprehensive loss
The balance in our Accumulated other comprehensive loss is set forth in the following table:
| | | | | | | | | | | | | |
| | | | As of
December 31, 2021 | | As of
December 31, 2020 |
| | | | (Dollars in thousands) |
| Foreign currency translation adjustments, net of tax | | | $ | (22,330) | | | $ | (2,725) | |
| Commodities and interest rate derivatives, net of tax | | | 14,886 | | | (16,916) | |
| Total accumulated other comprehensive loss | | | $ | (7,444) | | | $ | (19,641) | |
GRAFTECH INTERNATIONAL LTD. AND SUBSIDIARIES
NOTES TO THE CONSOLIDATED FINANCIAL STATEMENTS
As of December 31, 2023, approximately $99.0 million remained available for stock repurchases under this authorization.
Dividends
The Company paid quarterly dividends of $0.01 per share through the second quarter of 2023. On August 2, 2023, the Company’s Board of Directors elected to suspend the quarterly cash dividend of $0.01 per common share.
Accumulated other comprehensive loss
The balance in our AOCL is set forth in the following table:
| | | | | | | | | | | | | |
| | | |
December 31, 2023 | |
December 31, 2022 |
| | | | (Dollars in thousands) |
| Foreign currency translation adjustments, net of tax | | | $ | (19,188) | | | $ | (29,354) | |
| Commodities, interest rate and foreign currency derivatives, net of tax | | | 7,730 | | | 21,284 | |
| Total AOCL | | | $ | (11,458) | | | $ | (8,070) | |
(15) (Loss) Earnings per Share
The following table showspresents a reconciliation of the information used in the calculationnumerator and denominator of our basic and diluted (loss) earnings per share:
| | | | | | | | | | | | | | | | | |
| Year Ended December 31, |
| 2023 | | 2022 | | 2021 |
| (Dollars in thousands, except per share amounts) |
| Numerator for basic and diluted (loss) earnings per share: | | | | | |
| Net (loss) income | $ | (255,250) | | | $ | 382,962 | | | $ | 388,330 | |
| Denominator: | | | | | |
| Weighted average common shares outstanding for basic calculation | 257,042,843 | | | 258,781,843 | | | 266,251,097 | |
| Add: Effect of equity awards | — | | | 9,385 | | | 66,097 | |
| Weighted average common shares outstanding for diluted calculation | 257,042,843 | | | 258,791,228 | | | 266,317,194 | |
| Basic (loss) earnings per share | $ | (0.99) | | | $ | 1.48 | | | $ | 1.46 | |
| Diluted (loss) earnings per share | $ | (0.99) | | | $ | 1.48 | | | $ | 1.46 | |
Basic (loss) earnings per share calculation as of December 31, 2021, 2020 and 2019. See Note 14, "Stockholders' Equity (Deficit)" for details of our common stock repurchases in 2021, 2020 and 2019.
| | | | | | | | | | | | | | | | | |
| For the Year Ended December 31, |
| 2021 | | 2020 | | 2019 |
| | | | | |
| Weighted average common shares outstanding for basic calculation | 266,251,097 | | | 267,916,483 | | | 289,057,356 | |
| Add: Effect of equity awards | 66,097 | | | 14,161 | | | 17,245 | |
| Weighted average common shares outstanding for diluted calculation | 266,317,194 | | | 267,930,644 | | | 289,074,601 | |
Basic earnings per common share areis calculated by dividing net (loss) income by the weighted average number of common shares outstanding, which includesincluded 290,449, 243,006 and 130,624 73,320 and 32,981 shares of participating securities in 2021, 20202023, 2022 and 2019,2021, respectively. Diluted (loss) earnings per share areis calculated by dividing net (loss) income by the sum of the weighted average number of common shares outstanding plus the additional common shares that would have been outstanding if potentially dilutive securities had been issued.
The weighted average common shares outstanding for the diluted (loss) earnings per share calculation for the year ended December 31, 2023 excludes the dilutive effect of approximately 41,198 shares, primarily related to restricted stock units, as their inclusion would have been anti-dilutive due to the Company's net loss.
Additionally, the weighted average common shares outstanding for the diluted (loss) earnings per share calculation excludes consideration of 1,499,128, 1,667,3253,033,561, 2,240,655 and 1,082,1131,499,128 equivalent shares in 2021, 20202023, 2022 and 2019,2021, respectively, as these shares aretheir effect would have been anti-dilutive. See Note 14, "Stockholders' Equity" for details of the Company's common stock repurchases in 2023, 2022 and 2021.
GRAFTECH INTERNATIONAL LTD. AND SUBSIDIARIES
NOTES TO THE CONSOLIDATED FINANCIAL STATEMENTS
(16) Other Expense (Income) Expense,, net
The following table presents the details of other expense (income) expense:, net:
| | | | For the Year Ended December 31 | | Year Ended December 31, |
| 2021 | | 2020 | | 2019 |
| 2023 | | | 2023 | | 2022 | | 2021 |
| | | (Dollars in thousands) | | (Dollars in thousands) |
| Brazil value-added tax credit | Brazil value-added tax credit | $ | (11,511) | | | $ | — | | | $ | — | |
| Pension and post-employment non-service cost | (5,298) | | | 3,584 | | | 4,382 | |
| Non-service pension and other post-employment expense (income) | |
| Bank charges | Bank charges | 1,098 | | | 962 | | | 1,173 | |
| | Other | Other | (740) | | | (1,216) | | | (352) | |
| Total other (income) expense, net | $ | (16,451) | | | $ | 3,330 | | | $ | 5,203 | |
| Total other expense (income), net | |
In May 2021, the Brazilian Supreme Court ruled definitely to exclude the ICMS (state value-added tax) from the basis of calculation of certain federal value-added taxes, specifically the tax relative to the program of social integration ("PIS") and to the contribution for the financing of social security ("COFINS"), and confirmed the methodology for calculating the PIS-COFINS tax credit to which taxpayers are entitled. The Company's Brazilian subsidiary had previously filed a legal claim on this matter and is entitled to receive tax credits and interestsinterest dating back to five years preceding the date of the claim. The overpayments, plus interests,interest, of PIS-COFINS related to the period from June 2005 to August 2021 representrepresented $11.5 million, net of legal fees. In the fourth quarter of 2021, the Company's subsidiary obtained the approval by the Brazilian Tax Authorities to start offsetting the PIS-COFINS credit against the current federal value-added tax payable and recorded the one-time credit as a realizable gain. As of December 31, 2021,2023, the Company hadhas offset $1.2 millionthe entire amount of thethis credit. The balance of the PIS-COFINS credit is expected to be utilized within the next 12 months and is reported within "Prepaid expenses and other current assets" on the Consolidated Balance Sheet.
PensionNon-service pension and other post-employment non-service costs includeexpense (income) includes the components of pension and post-employment costs other than service cost. The incomeNon-service pension and other post-employment expense (income) included mark-to-market losses of $3.0 million in 2021 was due to a $3.8 million mark-to-market gain,2023, compared to mark-to-market lossesgains of $3.2$9.6 million and $3.5$3.8 million, recordedrespectively, in 20202022 and 2019, respectively.2021. See Note 11, "Retirement Plans and Post-Employment Benefits" for further discussion.
GRAFTECH INTERNATIONAL LTD. AND SUBSIDIARIES
NOTES TO THE CONSOLIDATED FINANCIAL STATEMENTS
(17) Subsequent Events
Dividend declaration
On February 2, 2022, the Board of Directors declared a dividend of $0.01 per share of common stock to stockholders of record as of the close of business on February 28, 2022, to be paid on March 31, 2022.
Item 9.Changes in and Disagreements with Accountants on Accounting and Financial Disclosure
None.
Item 9A.Controls and Procedures
Disclosure Controls and Procedures
Management is responsible for establishing and maintaining adequate disclosure controls and procedures at the reasonable assurance level.procedures. Disclosure controls and procedures are designed at the reasonable assurance level to ensure that information required to be disclosed by us in the reports that we file or submit under the Exchange Act is recorded, processed, summarized and reported within the time periods specified in the SEC’s rules and forms and that such information is accumulated and communicated to management, including our Interim Chief Executive Officer and theInterim Chief Financial Officer, as appropriate, to allow timely decisions regarding required disclosure.
Management, with the participation of our Interim Chief Executive Officer and Interim Chief Financial Officer, has evaluated the effectiveness of our disclosure controls and procedures as of December 31, 2021.2023. Based on that evaluation, our Interim Chief Executive Officer and Interim Chief Financial Officer concluded that these controls and procedures were effective at the reasonable assurance level as of December 31, 2021.2023.
Management’s Report on Internal Control over Financial Reporting
Management is responsible for establishing and maintaining adequate internal control over financial reporting. Internal control over financial reporting is defined in Rules 13a-15(f) and 15d-15(f) under the Exchange Act as a process, designed by, or under the supervision of, the chief executive officer and chief financial officer and effected by the boardBoard of directors,Directors, management and other personnel of a company, to provide reasonable assurance regarding the reliability of financial reporting and the preparation of financial statements for external purposes in accordance with GAAP, and includes those policies and procedures that:
•pertain to the maintenance of records that, in reasonable detail, accurately and fairly reflect transactions and dispositions of assets of the company;
•provide reasonable assurance that transactions are recorded as necessary to permit preparation of financial statements in accordance with generally accepted accounting principlesGAAP, and that receipts and expenditures of the company are being made only in accordance with authorizations of management and the boardBoard of directors;Directors; and
•provide reasonable assurance regarding prevention or timely detection of unauthorized acquisition, use or disposition of assets of the company that could have a material effect on its financial statements.
Internal control over financial reporting has inherent limitations which may not prevent or detect misstatements. Also, projections of any evaluation of effectiveness to future periods are subject to the risk that controls may become inadequate because of changes in conditions or because the level of compliance with related policies or procedures may deteriorate.
Management, with the participation of our Interim Chief Executive Officer and Interim Chief Financial Officer, has conducted an assessment of the effectiveness of our internal control over financial reporting as of December 31, 20212023 using the criteria set forth by the Committee of Sponsoring Organizations of the Treadway Commission (COSO) in Internal Control-Integrated Framework (2013). Based on that assessment, management concluded that our internal control over financial reporting was effective as of December 31, 2021.2023. The effectiveness of the Company’s internal control over financial reporting as of December 31, 20212023 has been audited by Deloitte & Touche LLP, our independent registered public accounting firm, as stated in their report, which is presented elsewhere in this Annual Report.
Changes in Internal Control over Financial Reporting
There have been no changes in the Company’s internal control over financial reporting during the Company’s most recent fiscal quarter that have materially affected, or are reasonably likely to materially affect, the Company’s internal control over financial reporting.
Item 9B.Other Information
None.Adjustments to the Compensatory Arrangements of Certain of Our Executive Officers
On February 12, 2024, the Human Resources and Compensation Committee of the Board of Directors of the Company made the following adjustments to the compensatory arrangements of certain of our executive officers:
•the annualized base salary for Catherine Hedoux-Delgado, the Company’s Interim Chief Financial Officer and Treasurer, has been increased from $305,500 to $353,500, effective April 1, 2024;
•Timothy K. Flanagan, the Company’s Interim Chief Executive Officer and President, Ms. Hedoux-Delgado, and Jeremy S. Halford, the Company’s Executive Vice President, Chief Operating Officer, will continue to receive monthly stipends for calendar year 2024 in the amount of $21,000, $4,000, and $8,000, respectively, in connection with their continued interim service and increased role and responsibilities, as applicable; and
•the Short-Term Incentive Plan (“STIP”) target award opportunities for calendar year 2024 for each of Mr. Flanagan and Ms. Hedoux-Delgado have been increased from 80% to 100% and 45% to 65%, respectively, of base salary and monthly stipend for each such month that such stipend is paid for serving such interim role, and Mr. Halford’s STIP target award opportunity for calendar year 2024 of 80%, although unchanged from calendar year 2023, will be based off of his base salary and monthly stipend for each such month that such stipend is paid.
Rule 10b5-1 Trading Arrangements
None of the Company’s directors or officers (as defined in Rule 16a-1(f) under the Securities Exchange Act of 1934) adopted, modified, or terminated a Rule 10b5-1 trading arrangement or a non-Rule 10b5-1 trading arrangement (as each term is defined in Item 408 of Regulation S-K) during the Company’s fiscal quarter ended December 31, 2023.
Item 9C. Disclosure Regarding Foreign Jurisdictions that Prevent Inspections
Not applicable.
PART III
Item 10. Directors, Executive Officers and Corporate Governance.Governance
The information regarding our executive officers is set forth in the Supplemental Item to Part I of this Report under the caption "Supplemental Item. Information about our Executive Officers" and is incorporated herein by reference.
We adopted a Code of Conduct and Ethics that applies to our employees, directors and officers, including our Interim Chief Executive Officer and President and our Interim Chief Financial Officer Vice President Finance and Treasurer. A copy of the Code of Conduct and Ethics is publicly available on our website at https://www.graftech.com/investors/default.aspx#governance. Any waiver (including an implicit waiver) from a provision of our Code of Conduct and Ethics granted to, or any amendment (other than technical, administrative or other non-substantive amendments) of the Code of Conduct and Ethics forthat applies to, our principal executive officersofficer, principal financial officer, principal accounting officer or directors (i) may be made only by the Audit Committee, (ii)controller or persons performing similar functions will be promptly disclosed as required by applicable U.S. federal securities laws and the listing standards of the NYSE and (iii) will be available in the “Investors” section ofon our website www.graftech.com.at https://www.graftech.com/investors/default.aspx#governance or in a report on Form 8-K filed electronically with the SEC at www.sec.gov.
The remaining information required by this Item is incorporated herein by reference from the sections entitled "Proposal“Proposal 1 Elect FourTwo Directors for a Three-Year Term and One Director for a One-Year Term or Until Their Successors are Elected and Qualified"Qualified” and "Committees“Committees of the Board of Directors"Directors” in our Proxy Statement for the Annual Meeting of Stockholders expected to be held on or about May 12, 2022.9, 2024.
We will provide disclosure of delinquent Section 16(a) reports, if any, in our Proxy Statement in thea section entitled "Delinquent Section 16(a) Reports," and such disclosure, if any, is incorporated herein by reference.
Item 11. Executive Compensation
The information required by this item is incorporated by reference from the sections entitled "Compensation“Compensation Discussion and Analysis," "Compensation” “Compensation Tables and Related Information," "CEO” “CEO Pay Ratio," "Director” “Pay Versus Performance,” “Director Compensation Program," "Risk” “2023 Director Compensation Table,” “Risk Oversight," "Compensation” “Compensation Committee Report"Report” and "Compensation“Compensation Committee Interlocks and Insider Participation"Participation” in the Proxy Statement.
Item 12. Security Ownership of Certain Beneficial Owners and Management and Related Stockholder Matters
The information regarding security ownership of certain beneficial owners and management required by this item is incorporated by reference from the section entitled "Security“Security Ownership of Certain Beneficial Owners and Management"Management” in the Proxy Statement.
Equity Compensation Plan Information
The following table provides information about our common stock that may be issued under our Omnibus Equity Incentive Plan atas of December 31, 2021.2023:
| | | | | | | | | | | | | | | | | | | | |
| Plan category | | Number of securities to be issued upon exercise of outstanding options, warrants and rights
(a) | | Weighted-average exercise price of outstanding options, warrants and rights
(b) | | Number of securities remaining available for future issuance under equity compensation plans (excluding securities reflected in column (a))
(c) |
| Equity compensation plans approved by security holders | | 1,813,0464,117,469(1)
| | $13.0811.27(2) | | 12,101,4989,512,574 |
| Equity compensation plans not approved by security holders | | — | | — | | — |
| Total | | 1,813,0464,117,469(1)
| | $13.0811.27(2) | | 12,101,4989,512,574 |
(1) This amount represents 1,616,7202,027,611 shares of common stock subject to outstanding stock options, 2,696885,365 shares of common stock subject to outstanding restricted stock units, and 193,630377,540 shares of stock subject to outstanding deferred share units, 696,030 shares of stock subject to outstanding performance shares units (assuming maximum level of performance), and 130,923 shares of stock subject to outstanding deferred restricted stock units.
(2) The weighted-average exercise price does not take into account shares of common stock subject to outstanding restricted stock units, outstanding deferred share units, outstanding performance stock units, or outstanding deferred sharerestricted stock units.
Item 13. Certain Relationships and Related Transactions, and Director Independence
The information required by this item is incorporated by reference from the sections entitled “Certain Relationships and Related Party Transactions,” “Director Independence” and "Committees“Committees of the Board of Directors"Directors” in the Proxy Statement.
Item 14. Principal Accountant Fees and Services
The information required by this item is incorporated by reference from the sectionssection entitled "Proposal 2 Ratify the Selection of Deloitte & Touche LLP as our Independent Registered Public Accounting Firm for 2022" and "Independent“Independent Auditor Fees and Other Matters"Matters” in the Proxy Statement.
PART IV
Item 15.Exhibit and Financial Statement Schedules
(a) The following documents are filed as part of this Report:
(1) Financial Statements
The following financial statements are set forth under Part II, Item 8 of this Annual Report:
•Report of Independent Registered Public Accounting Firm;
•Consolidated Balance Sheets as of December 31, 20212023 and December 31, 2020;2022;
•Consolidated Statements of Operations and Comprehensive (Loss) Income (Loss) for the fiscal years ended December 31, 2021,2023, December 31, 20202022 and December 31, 2019;2021;
•Consolidated Statements of Cash Flows for the fiscal years ended December 31, 2021,2023, December 31, 20202022 and December 31, 2019;2021;
•Consolidated Statements of Stockholders'Stockholders’ Equity (Deficit) for the fiscal years ended December 31, 2021,2023, December 31, 20202022 and December 31, 2019;2021; and
•Notes to the Consolidated Financial Statements.
(2) Financial Statement Schedules
All schedules have been omitted because the required information is included in the consolidated financial statements or the notes thereto, or because it is not required.
(3) Exhibits
The exhibits listed in the following table have been filed or furnished, as applicable, with this Annual Report, or have been incorporated herein by reference.
| | | | | | | | |
Exhibit
Number | Description of Exhibit | |
2.12 | | |
| 3.1 | | |
| 3.2 | | |
| | | | | | | | |
| 4.1 | | |
| 4.2 | | |
| 4.3 | | |
| 4.4 | | |
| 4.5 | Indenture, dated as of December 22, 2020, among GrafTech Finance Inc., as issuer, GrafTech International Ltd., as a guarantor, the subsidiary guarantors party thereto, and U.S. Bank National Association, as trustee and collateral agent, relating to GrafTech Finance Inc.’s 4.625% Senior Secured Notes due 2028 (incorporated herein by reference to Exhibit 4.1 to GrafTech International Ltd.'s’s Current Report on Form 8-K filed December 23, 2020). | |
| 4.6 | | |
| 4.7 | Indenture, dated as of June 26, 2023, among GrafTech Global Enterprises Inc., as issuer, GrafTech International Ltd., as a guarantor, each subsidiary guarantor from time to time party thereto, and U.S. Bank Trust Company, National Association, as trustee and collateral agent, relating to GrafTech Global Enterprises Inc.’s 9.875% Senior Secured Notes due 2028 (incorporated herein by reference to Exhibit 4.24.1 to GrafTech International Ltd.'s’s Current Report on Form 8-K filed December 23, 2020)June 26, 2023). | |
| 4.8 | | |
| 10.1 | Credit Agreement, dated February 12, 2018, among GrafTech International Ltd., as Holdings, GrafTech Finance Inc., GrafTech Switzerland SA and GrafTech Luxembourg II S.À.R.L., as co‑borrowers, the lenders and issuing banks party thereto and JPMorgan Chase Bank, N.A., as Administrative Agent and Collateral Agent (incorporated herein by reference to Exhibit 10.1 to GrafTech International Ltd.’s Registration Statement on Form S‑1 (Registration No. 333‑223791) filed March 20, 2018). | |
| 10.2 | First Amendment to the Credit Agreement, dated June 15, 2018, among GrafTech International Ltd., GrafTech Finance Inc., GrafTech Switzerland SA, GrafTech Luxembourg II S.À.R.L. each of the entities listed as co‑borrowers,an “Incremental Term Lender” on the lenders and issuing banks partysignature pages thereto, and JPMorgan Chase Bank, N.A., as Administrative Agent, and Collateral Agentfor purposes of Sections 5 and 6 thereof only, each of the entities listed as “Guarantor” on the signature pages thereto (incorporated herein by reference to Exhibit 10.1 to GrafTech International Ltd.’s Quarterly Report on Form 10‑Q filed on August 3, 2018). | |
| | | | | | | | |
| 10.3 | | |
| 10.4 | | |
| 10.5 | | |
| 10.6 | | |
| 10.7 | | |
| 10.8 | | |
| 10.9 | | |
| 10.10 | | |
| 10.11 | | |
| | | | | | | | |
| 10.12 | | |
| 10.13 | | |
| 10.14 | | |
10.1510.15* | | |
| 10.16+ | | |
| 10.17+ | | |
10.18+ | | |
10.19+ | | |
10.20+ | | |
10.21+ | | |
10.22+10.18+ | | |
10.23+ | | |
10.24+10.19+ | | |
10.25+ | | |
10.26+ | | |
10.27+ | | |
10.28+10.20+ | | |
10.29+ | | |
10.30+ | | |
| | | | | | | | |
10.31+10.21+ | | |
10.32+ | | |
10.3310.22 | | |
10.3410.23 | Second AmendmentSecond Amendment to the Credit Agreement, dated February 17,, 2021, 2021, among GrafTech International Ltd., GrafTech Finance Inc., GrafTech Luxembourg II S.À.R.L., GrafTech Switzerland SA, JPMorganJPMorgan Chase Bank, N.A., as AdministrativeAdministrative Agent, and thethe lenders and issuing banks party thereto(incorporated (incorporated herein by reference to Exhibit 10.1 to GrafTech International Ltd.’s Current Report on Form 8-K filed on February 19,, 2021) 2021). | |
10.35*+10.24 | Third Amendment to the Credit Agreement, dated as of May 31, 2022, by and among GrafTech International Ltd. Short-Term Incentive Plan., GrafTech Finance Inc., GrafTech Luxembourg II S.à r.l., GrafTech Switzerland SA, JPMorgan Chase Bank, N.A., as administrative agent, the New Revolving Lenders (as defined therein), the Consenting Revolving Lenders (as defined therein), each of the entities listed as an “Incremental Revolving Lender” on the signature pages thereto and for purposes of Sections 5, 7 and 8 thereof only, each of the entities listed as a “Guarantor” on the signature pages thereto (incorporated herein by reference to Exhibit 10.1 to GrafTech International Ltd.’sCurrent Report on Form 8-K filed June 2, 2022). | |
10.36*+10.25+ | | |
10.37*+10.26+ | | |
21.1*10.27+ | | |
| 10.28+ | | |
| 10.29+ | | |
| 10.30+ | | |
| 10.31+ | | |
| 10.32+ | | |
| 10.33+ | | |
| 10.34+ | | |
| 10.35 | | |
| 10.36+ | | |
| 10.37+ | | |
| 10.38+ | | |
| | | | | | | | |
| 10.39+ | | |
| 10.40+ | | |
| 10.41+ | | |
| 10.42+ | | |
| 10.43+* | | |
| 21* | | |
23.1*23* | | |
| 31.1* | | |
31.2* | | |
| 31.2* | | |
| 32.1** | | |
| 32.2** | | |
| 97* | | |
| 101 | The following financial information from GrafTech International Ltd.'s’s Annual Report on Form 10-K for the year ended December 31, 20212023 formatted in Inline XBRL (Extensible Business Reporting Language) includes: (i) the Consolidated Balance Sheets, (ii) the Consolidated Statements of Operations and Comprehensive (Loss) Income, (Loss), (iii) the Consolidated Statements of Cash Flows, (v)(iv) the Consolidated Statements of Stockholders'Stockholders’ Equity (Deficit), and (vi)(v) Notes to the Consolidated Financial Statements. | |
| 104 | Cover Page Interactive Data File (formatted as Inline XBRL and contained in Exhibit 101) | |
____________________________
* Filed herewith
** Furnished herewith
+ Indicates management contract or compensatory plan or arrangement
Item 16.Form 10-K Summary
None.
SIGNATURES
Pursuant to the requirements of Section 13 or 15(d) of the Securities Exchange Act of 1934, the registrant has duly caused this report to be signed on its behalf by the undersigned, thereunto duly authorized.
| | | | | | | | |
| | GRAFTECH INTERNATIONAL LTD. |
| | |
February 22, 202214, 2024 | By: | /s/ David J. RintoulTimothy K. Flanagan |
| | David J. RintoulTimothy K. Flanagan |
| | Title: | Interim Chief Executive Officer and President |
Pursuant to the requirements of the Securities Exchange Act of 1934, this report has been signed below by the following persons on behalf of the registrant and in the capacities and on the dates indicated.
| | | | | | | | | | | | | | |
| Signatures | | Title | | Date |
| | | | |
/s/ David J. Rintoul | | Chief Executive Officer and President and Director
(Principal Executive Officer) | | February 22, 2022 |
David J. Rintoul | | | | |
| /s/ Timothy K. Flanagan | | Interim Chief FinancialExecutive Officer Viceand President Finance and Treasurer
(Principal Financial and AccountingExecutive Officer) | | February 22, 202214, 2024 |
| Timothy K. Flanagan | | | | |
/s/ Denis A. TurcotteCatherine Hedoux-Delgado | | Interim Chief Financial Officer and Treasurer (Principal Financial and Accounting Officer) | | February 14, 2024 |
| Catherine Hedoux-Delgado | | | | |
| /s/ Henry R. Keizer | | Chairman and Director | | February 22, 202214, 2024 |
Denis A. TurcotteHenry R. Keizer | | | | |
/s/ Brian L. ActonDiego Donoso | | Director | | February 22, 202214, 2024 |
Brian L. ActonDiego Donoso | | | | |
/s/ Catherine L. Clegg | | Director | | February 22, 2022 |
Catherine L. Clegg | | | | |
| /s/ Michel J. Dumas | | Director | | February 22, 202214, 2024 |
| Michel J. Dumas | | | | |
/s/ Leslie D. Dunn | | Director | | February 22, 2022 |
Leslie D. Dunn | | | | |
| /s/ Debra Fine | | Director | | February 22, 202214, 2024 |
| Debra Fine | | | | |
| /s/ Jean-Marc Germain | | Director | | February 22, 202214, 2024 |
| Jean-Marc Germain | | | | |
/s/ David GregoryMarcel Kessler | | Director | | February 22, 202214, 2024 |
David GregoryMarcel Kessler | | | | |
/s/ Henry R. Keizer | | Director | | February 22, 2022 |
Henry R. Keizer | | | | |
| | | | | | | | | | | | | | |
| /s/ Anthony R. Taccone | | Director | | February 22, 202214, 2024 |
| Anthony R. Taccone | | | | |