
UNITED STATES SECURITIES AND EXCHANGE COMMISSION
Washington, D.C. 20549
Form 10-K
(Mark One)
☑ | ||
ANNUAL REPORT PURSUANT TO SECTION 13 OR 15(d) OF THE SECURITIES EXCHANGE ACT OF 1934 | ||
For fiscal year ended September 30, | ||
or | ||
☐ | TRANSITION REPORT PURSUANT TO SECTION 13 OR 15(d) OF THE SECURITIES EXCHANGE ACT OF 1934 | |
For the transition period from to . |
Commission File Number: 0-25434
Brooks Automation, Inc.
(Exact name of Registrant as Specified in Its Charter)
Delaware | 04‑3040660 | |
(State or Other Jurisdiction of Incorporation or Organization) | (I.R.S. Employer Identification No.) | |
15 Elizabeth Drive Chelmsford, Massachusetts (Address of Principal Executive Offices) | 01824 (Zip Code) | |
978‑262‑2400
(Registrant'sRegistrant’s telephone number, including area code)
Securities registered pursuant to Section 12(b) of the Act:
Title of Each Class | Name of Each Exchange on Which Registered | |
Common Stock, $0.01 par value | The NASDAQ Stock Market LLC |
Securities registered pursuant to Section 12(g) of the Act:
None
Indicate by check mark if the registrant is a well-known seasoned issuer, as defined in Rule 405 of the Securities Act. Yes ¨☑ No ☐
þ
Indicate by check mark whether the registrant (1) has filed all reports required to be filed by Section 13 or 15(d) of the Securities Exchange Act of 1934 during the preceding 12 months (or for such shorter period that the registrant was required to file such reports), and (2) has been subject to such filing requirements for the past 90 days. Yes þ☑ No ☐¨
Indicate by check mark whether the registrant has submitted electronically and posted on its corporate Web site, if any, every Interactive Data File required to be submitted and posted pursuant to Rule 405 of Regulation S-T (§232.405 of this chapter) during the preceding 12 months (or for such shorter period that the registrant was required to submit and post such files). Yes þ☑ No ☐¨
Indicate by check mark if disclosure of delinquent filers pursuant to RuleItem 405 of Regulation S-K (§229.405 of this chapter) is not contained herein, and will not be contained, to the best of registrant'sregistrant’s knowledge, in definitive proxy or information statements incorporated by reference in Part III of this Form 10-K10‑K or any amendment to the Form 10-K. 10‑K. ☐þ
Indicate by check mark whether the registrant is a large accelerated filer, an accelerated filer, a non-accelerated filer, or a smaller reporting company, or an emerging growth company. See the definitions of “large accelerated filer,” “accelerated filer”filer,” “smaller reporting company,” and “smaller reporting“emerging growth company” in Rule 12b-212b‑2 of the Exchange Act. (Check one):
Large accelerated filer | Accelerated filer | |||
Non-accelerated filer | ||||
Smaller reporting company ☐ | ||||
Emerging growth company ☐ | ||||
If an emerging growth company, indicate by check mark if the registrant has elected not to use the extended transition period for complying with any new or revised financial accounting standards provided pursuant to Section 13(a) of the Exchange Act. ☐
Indicate by check mark whether the registrant is a shell company (as defined in Exchange Act Rule 12b-2)12b‑2). Yes ¨☐ No þ☑
The aggregate market value of the registrant'sregistrant’s Common Stock, $0.01 par value, held by non-affiliates of the registrant as of March 31, 2014,2017, was approximately $706,764,000$1,172,736,000 based on the closing price per share of $10.93$22.40 on that date on the Nasdaq Stock Market. As of March 31, 2014, 66,806,2632017, 69,643,616 shares of the registrant'sregistrant’s Common Stock, $0.01 par value, were outstanding. As of November 5, 2014, 66,927,38810, 2017, 70,308,554 shares of the registrant'sregistrant’s Common Stock, $0.01, par value, were outstanding.
DOCUMENTS INCORPORATED BY REFERENCE
Portions of the registrant'sregistrant’s Proxy Statement involving the election of directors, which is expected to be filed within 120 days after the end of the registrant'sregistrant’s fiscal year, are incorporated by reference in Part III of this Report.
BROOKS AUTOMATION, INC.
TABLE OF CONTENTS
PAGE NUMBER | ||||
12 | ||||
22 | ||||
22 | ||||
23 | ||||
24 | ||||
24 | ||||
26 | ||||
28 | ||||
53 | ||||
54 | ||||
115 | ||||
115 | ||||
116 | ||||
116 | ||||
116 | ||||
116 | ||||
116 | ||||
116 | ||||
117 | ||||
120 | ||||
2
| 2014 | 2013 | 2012 | ||||||
| Semiconductor capital equipment | 46 | % | 46 | % | 51 | % | ||
| Service and spares | 19 | % | 21 | % | 17 | % | ||
| Industrial capital equipment | 11 | % | 12 | % | 11 | % | ||
| Other adjacent technology markets | 11 | % | 11 | % | 10 | % | ||
| Life sciences | 13 | % | 10 | % | 11 | % | ||
| 100 | % | 100 | % | 100 | % | |||
| Year Ended September 30, | |||||||||||
| 2014 | 2013 | 2012 | |||||||||
| North America | $ | 174,343 | $ | 177,779 | $ | 214,060 | |||||
| Asia/Pacific | 198,695 | 154,358 | 183,406 | ||||||||
| Europe | 109,810 | 90,303 | 91,517 | ||||||||
| $ | 482,848 | $ | 422,440 | $ | 488,983 | ||||||
| September 30, | |||||||
| 2014 | 2013 | ||||||
| North America | $ | 40,232 | $ | 38,505 | |||
| Asia/Pacific | 870 | 1,646 | |||||
| Europe/Middle East | 9,081 | 7,355 | |||||
| $ | 50,183 | $ | 47,506 | ||||
Information
| Market Price | Dividends Declared | ||||||||||
| High | Low | ||||||||||
| Fiscal year ended September 30, 2014 | |||||||||||
| First quarter | $ | 10.75 | $ | 9.01 | $ | 0.08 | |||||
| Second quarter | 11.64 | 9.43 | 0.08 | ||||||||
| Third quarter | 11.50 | 8.75 | 0.08 | ||||||||
| Fourth quarter | 11.53 | 9.86 | 0.10 | ||||||||
| Fiscal year ended September 30, 2013 | |||||||||||
| First quarter | $ | 8.24 | $ | 7.00 | $ | 0.08 | |||||
| Second quarter | 10.50 | 8.23 | 0.08 | ||||||||
| Third quarter | 10.97 | 8.78 | 0.08 | ||||||||
| Fourth quarter | 10.56 | 8.74 | 0.08 | ||||||||
| 9/30/09 | 9/30/10 | 9/30/11 | 9/30/12 | 9/30/13 | 9/30/14 | |||||||
| Brooks Automation, Inc. | 100.00 | 86.80 | 106.38 | 108.40 | 130.06 | 151.69 | ||||||
| NASDAQ/NYSE MKT/NYSE | 100.00 | 109.28 | 105.09 | 132.49 | 158.51 | 181.57 | ||||||
| Peer Group | 100.00 | 102.67 | 101.89 | 125.13 | 167.58 | 173.52 | ||||||
| Period | Total Number of Shares Purchased | Average Price Paid per Share | Total Number of Shares Purchased as Part of Publicly Announced Plans or Programs | Maximum Number (or Approximate Dollar Value) of Shares that May Yet be Purchased Under the Plans or Programs | ||||||||||
| July 1 - 31, 2014 | — | $ | — | — | $ | — | ||||||||
| August 1 - 31, 2014 | 8,608 | 10.56 | 8,608 | — | ||||||||||
| September 1 - 30, 2014 | — | — | — | — | ||||||||||
| Total | 8,608 | $ | 10.56 | 8,608 | $ | — | ||||||||
| Year Ended September 30, | |||||||||||||||||||
2014(1)(2)(3) | 2013(1)(4)(5) | 2012(1)(6)(7)(8) | 2011(1)(9)(10) | 2010(1)(11) | |||||||||||||||
| (In thousands, except per share data) | |||||||||||||||||||
| Revenue | $ | 482,848 | $ | 422,440 | $ | 488,983 | $ | 653,299 | $ | 562,744 | |||||||||
| Gross profit | $ | 167,337 | $ | 132,307 | $ | 159,453 | $ | 207,012 | $ | 152,605 | |||||||||
| Operating income (loss) | $ | (2,699 | ) | $ | (16,798 | ) | $ | 1,642 | $ | 70,301 | $ | 39,295 | |||||||
| Income (loss) from continuing operations | $ | 1,520 | $ | (7,114 | ) | $ | 131,835 | $ | 121,141 | $ | 52,172 | ||||||||
| Income from discontinued operations, net of tax | $ | 30,002 | $ | 4,964 | $ | 5,000 | $ | 9,296 | $ | 7,712 | |||||||||
| Net income (loss) attributable to Brooks Automation, Inc. | $ | 31,361 | $ | (2,215 | ) | $ | 136,789 | $ | 130,385 | $ | 59,841 | ||||||||
| Basic net income (loss) per share attributable to Brooks Automation, Inc. common stockholders: | |||||||||||||||||||
| Income (loss) from continuing operations | $ | 0.02 | $ | (0.11 | ) | $ | 2.02 | $ | 1.88 | $ | 0.82 | ||||||||
| Income from discontinued operations, net of tax | 0.45 | 0.08 | 0.08 | 0.14 | 0.12 | ||||||||||||||
| Basic net income (loss) per share attributable to Brooks Automation, Inc. | $ | 0.47 | $ | (0.03 | ) | $ | 2.10 | $ | 2.02 | $ | 0.94 | ||||||||
| Diluted net income (loss) per share attributable to Brooks Automation, Inc. common stockholders: | |||||||||||||||||||
| Income (loss) from continuing operations | $ | 0.02 | $ | (0.11 | ) | $ | 2.01 | $ | 1.86 | $ | 0.81 | ||||||||
| Income from discontinued operations, net of tax | 0.44 | 0.08 | 0.08 | 0.14 | 0.12 | ||||||||||||||
| Diluted net income (loss) per share attributable to Brooks Automation, Inc. | $ | 0.46 | $ | (0.03 | ) | $ | 2.08 | $ | 2.01 | $ | 0.93 | ||||||||
| Dividend declared per share | $ | 0.34 | $ | 0.32 | $ | 0.32 | $ | 0.08 | $ | — | |||||||||
| As of September 30, | |||||||||||||||||||
| 2014 | 2013 | 2012 | 2011 | 2010 | |||||||||||||||
| (In thousands) | |||||||||||||||||||
| Cash and cash equivalents and marketable securities | $ | 245,456 | $ | 173,362 | $ | 200,231 | $ | 205,818 | $ | 142,427 | |||||||||
Working capital(12) | $ | 98,228 | $ | 105,511 | $ | 121,709 | $ | 95,579 | $ | 107,064 | |||||||||
| Total assets | $ | 778,038 | $ | 736,763 | $ | 741,960 | $ | 636,958 | $ | 517,040 | |||||||||
| Total capital lease obligation | $ | 8,298 | $ | — | $ | — | $ | — | $ | — | |||||||||
| Total equity | $ | 642,889 | $ | 632,656 | $ | 649,301 | $ | 518,936 | $ | 388,168 | |||||||||
| Year Ended September 30, 2014 | |||||||||||||||
First Quarter(1) | Second Quarter | Third Quarter(2)(3) | Fourth Quarter(3) | ||||||||||||
| (In thousands, except per share data) | |||||||||||||||
| Revenue | $ | 117,072 | $ | 125,900 | $ | 117,359 | $ | 122,517 | |||||||
| Gross profit | $ | 40,891 | $ | 44,298 | $ | 40,746 | $ | 41,402 | |||||||
| Operating income (loss) | $ | 1,458 | $ | 2,396 | $ | (5,910 | ) | $ | (643 | ) | |||||
| Income (loss) from continuing operations | $ | 1,919 | $ | 2,103 | $ | (2,764 | ) | $ | 262 | ||||||
| Income from discontinued operations, net of tax | $ | 1,577 | $ | 1,162 | $ | 27,263 | $ | — | |||||||
| Net income attributable to Brooks Automation, Inc. | $ | 3,448 | $ | 3,189 | $ | 24,476 | $ | 248 | |||||||
| Basic net income per share attributable to Brooks Automation, Inc. common stockholders: | |||||||||||||||
| Income (loss) from continuing operations | $ | 0.03 | $ | 0.03 | $ | (0.04 | ) | $ | 0.00 | ||||||
| Income from discontinued operations, net of tax | 0.02 | 0.02 | 0.41 | — | |||||||||||
| Basic net income per share attributable to Brooks Automation, Inc. | $ | 0.05 | $ | 0.05 | $ | 0.37 | $ | 0.00 | |||||||
| Diluted net income per share attributable to Brooks Automation, Inc. common stockholders: | |||||||||||||||
| Income (loss) from continuing operations | $ | 0.03 | $ | 0.03 | $ | (0.04 | ) | $ | 0.00 | ||||||
| Income from discontinued operations, net of tax | 0.02 | 0.02 | 0.40 | — | |||||||||||
| Diluted net income per share attributable to Brooks Automation, Inc. | $ | 0.05 | $ | 0.05 | $ | 0.36 | $ | 0.00 | |||||||
| Year Ended September 30, 2013 | |||||||||||||||
First Quarter(5) | Second Quarter(5) | Third Quarter(5) | Fourth Quarter(4)(5) | ||||||||||||
| (In thousands, except per share data) | |||||||||||||||
| Revenue | $ | 91,506 | $ | 109,482 | $ | 110,771 | $ | 110,681 | |||||||
| Gross profit | $ | 26,281 | $ | 33,083 | $ | 36,075 | $ | 36,868 | |||||||
| Operating income (loss) | $ | (14,468 | ) | $ | (3,170 | ) | $ | 2,133 | $ | (1,293 | ) | ||||
| Income (loss) from continuing operations | $ | (10,407 | ) | $ | (3,165 | ) | $ | 4,549 | $ | 1,909 | |||||
| Income (loss) from discontinued operations, net of tax | $ | 1,188 | $ | 2,654 | $ | (2,981 | ) | $ | 4,103 | ||||||
| Net income (loss) attributable to Brooks Automation, Inc. | $ | (9,236 | ) | $ | (538 | ) | $ | 1,544 | $ | 6,015 | |||||
| Basic net income (loss) per share attributable to Brooks Automation, Inc. common stockholders: | |||||||||||||||
| Income (loss) from continuing operations | $ | (0.16 | ) | $ | (0.05 | ) | $ | 0.07 | $ | 0.03 | |||||
| Income (loss) from discontinued operations, net of tax | 0.02 | 0.04 | (0.05 | ) | 0.06 | ||||||||||
| Basic net income (loss) per share attributable to Brooks Automation, Inc. | $ | (0.14 | ) | $ | (0.01 | ) | $ | 0.02 | $ | 0.09 | |||||
| Diluted net income (loss) per share attributable to Brooks Automation, Inc. common stockholders: | |||||||||||||||
| Income (loss) from continuing operations | $ | (0.16 | ) | $ | (0.05 | ) | $ | 0.07 | $ | 0.03 | |||||
| Income (loss) from discontinued operations, net of tax | 0.02 | 0.04 | (0.04 | ) | 0.06 | ||||||||||
| Diluted net income (loss) per share attributable to Brooks Automation, Inc. | $ | (0.14 | ) | $ | (0.01 | ) | $ | 0.02 | $ | 0.09 | |||||
Certain statements in this Form 10-K, and in particular in “Management’s Discussion and Analysis of Financial Condition and Results of Operations,”10‑K constitute forward-looking statements, which are subject to the safe harbor provisions created by the Private Securities Litigation Reform Act of 1995. Certain, but not all, of the forward-looking statements in this report are specifically identified as forward-looking, by use of phrases and words such as “we believe,” “we estimate,” “we expect,” “may,” “should,” “could,” “intend,” “likely,” and other future-oriented terms. The identification of certain statements as “forward-looking” is not intended to mean that other statements not specifically identified are not forward-looking. Forward-looking statements include, but are not limited to, statements that relate to our future revenue, margin, costs, earnings, product development, demand, acceptance and market share, competitiveness, market opportunities and performance, levels of research and development, or R&D, the success of our marketing, sales and service efforts, outsourced activities and operating expenses, anticipated manufacturing, customer and technical requirements, the ongoing viability of the solutions that we offer and our customers’ success, tax expenses, our management’s plans and objectives for our current and future operations and business focus, the levels of customer spending, general economic conditions, the sufficiency of financial resources to support future operations, and capital expenditures. Such statements are based on current expectations and are subject to risks, uncertainties, and changes in condition, significance, value and effect, including without limitation those discussed above under the headingwithin Item 1 A, “Risk Factors” within Item 1A and elsewhere in this report and other documents we file from time to time with the Securities and Exchange Commission, (the “SEC”),or SEC, such as our quarterly reports on Form 10-Q10‑Q and our current reports on Form 8-K.8‑K. Such risks, uncertainties and changes in condition, significance, value and effect could cause our actual results, performance or achievements to differ materially from those expressed in this report and in ways we cannot readily foresee. Readers are cautioned not to place undue reliance on these forward-looking statements, which speak only as of the date hereof and are based on information currently and reasonably known to us. We do not undertake any obligation to release the results of any
Unless the context indicates otherwise, references in this report to "we", "us", "our" and other similar references mean Brooks Automation, Inc. and its consolidated subsidiaries.
Overview
We are a leading global provider of automation and cryogenic solutions for multiple applications and markets. We primarily serve the semiconductor capital equipment market and sample management market for life sciences. We believe our leadership position and global support structure in these markets including semiconductor manufacturing and life sciences and aremakes us a valued business partner to the largest semiconductor capital equipment and device makers and pharmaceutical and life science research institutions in the world. Our offerings are also applied to industrial capital equipment and other adjacent technology markets. We are headquartered in Chelmsford, Massachusetts, employ approximately 1,660 full-time employees worldwide, have sales in more than 50 countries, and provide customer support services globally.
Since 1978, we have been a leading partner to the global semiconductor manufacturing markets. In our early days, we developed and marketed automated handling equipment for semiconductor manufacturers. Since then, we have expanded our products and services through product development initiatives and acquisitions, and we are now recognized as a leading provider of vacuum robots, vacuum automation systems, wafer carrier contamination control systems, and cryogenic vacuum solutions to the global semiconductor capital equipment industry. In recent years we have made several key acquisitions, including certain integrated handling system assets of Crossing Automation, Inc. acquired in fiscal year 2013, the automated contamination cleaning equipment of Dynamic Micro Systems Semiconductor Equipment GmbH in fiscal year 2014 and Contact Co., Ltd. in fiscal year 2015. We have invested in research and development initiatives to advance the offerings from each of these acquisitions, as well as our offerings of vacuum automation and cryogenic products and services. In fiscal year 2014 we divested out Granville-Phillips
3
Instruments business. Our business supporting the semiconductor capital equipment and adjacent markets provided approximately 79% of our revenue in fiscal year 2017.
We entered the life sciences sample management market in 2011. We believed this market was underserved and that we could leverage our core competencies of automation and cryogenics to simultaneously diversify our business into a market that provides us the potential for higher growth and margin expansion. Our strategic objective was to provide offerings to assist customers in managing the “cold chain of custody” of their compound and biological samples, including storage, work flow solutions, transportation, handling, informatics and services. Today we are a leading provider of the life sciences sample management solutions for automation infrastructure, storage services, infrastructure services, and consumables and instruments. We have also recently commercialized software offerings which enable or enhance our customers’ visibility into their sample management inventories, which in turn is expected to increase the customers’ speed to market. Taken together, we believe these offerings allow our customers to maintain a complete “cold chain of custody” for their samples. Our business supporting the life science sample management market provided approximately 21% of our revenue in fiscal year 2017.
Our portfolio of product and service solutions is a result of strategic acquisitions, as well as internal research and product development initiatives over the past several years. We acquired three providers of large automated ultra-cold storage freezers and bench-top instruments for sample management: RTS Life Sciences and Nexus BioSystems, Inc., both of which were completed in fiscal year 2011, as well as Matrical, Inc. completed in fiscal year 2013. In fiscal year 2013, we launched an improved, internally-designed, automated freezer system successfully combined large automated systems into our single Twinbank platform, which we now manufacture in Manchester, United Kingdom. Market research led to our development of the BioStoreTM III Cryo offering, a smaller, automated, liquid nitrogen-cooled freezer that operates at -150°C, which we began to sell in 2016. The Twinbank and BioStore III Cryo systems are our core automated infrastructure offerings.
In November of 2015, we acquired BioStorage Technologies, Inc., a full-service outsourcing sample management business, which gave us the capability to support customers with an integrated, comprehensive set of sample management products, services and solutions. In July 2017, we acquired substantially all of the assets and liabilities of Pacific Bio-Material Management, Inc. and Novare, LLC, two companies that provide storage, transportation, management, and cold chain logistics of biological materials. These acquisitions are expected to expand our existing capabilities with respect to sample management and integrated cold chain storage and transportation solutions.
In October 2014, we acquired FluidX Ltd., a consumable sample tube and bench-top instruments business, and in November 2016 we acquired Cool Lab, LLC, a subsidiary of BioCision, LLC, a provider of a range of cryogenic product solutions that assist in managing the temperature stability of therapeutics, biological samples and related biomaterials in ultra-cold environments. We held an equity interest in BioCision prior to the acquisition of Cool Lab and collaborated in the development of advanced solutions in temperature controlled environments. We have made several investments in developing new consumable and instrument offerings since the acquisitions of FluidX and Cool Lab. Subsequent to September 30, 2017, we acquired all of the outstanding capital stock of 4titude Limited, a U.K.-based manufacturer of scientific consumables for biological sample materials used in a variety of genomic and DNA analytical applications. The acquisition is expected to expand our existing offerings of consumables and instruments within the Brooks Life Science Systems segment.
In fiscal year 2017, we launched BioStudies, a bioinformatics software platform that enables customers to manage their global sample collections. In August 2017, we acquired certain assets and liabilities related to FreezerPro®, a web-based software platform from RURO, Inc., which provides sample management software across multiple end markets, including academic research, government, pharmaceutical, biotech, and healthcare. We expect this acquisition to complement our BioStudies offerings and extend our informatics solutions to address laboratories, biobanks or other enterprises that manage biological samples.
As discussed above, we have made acquisitions over the years which accelerated our product development cycle, broadened our installed base and added customer relationships to our business. We have also divested certain of our products that were not in leadership positions in our core markets. As such, we use acquisitions and divestitures to strengthen our portfolio and achieve increased growth and profitability. For further information on our acquisitions and equity investments, please refer to Note 3, "Acquisitions," and Note 7, "Equity Method and Other Investments," to our
4
Consolidated Financial Statements included under "Item 8, Financial Statements and Supplementary Data" of this Form 10‑K.
The demand for semiconductors and semiconductor manufacturing equipment is cyclical, resulting in periodic expansions and contractions of this market. While the services element of our semiconductor business is generally more stable, the cyclical nature of the capital equipment business causes sales from products to vary quarterly based on short term market demands. It is not unusual for these variations in sales to be up or down 10% to 20% in sequential quarters. We believe the life science sample management market is generally more stable than the semiconductor capital equipment market and expected to grow more quickly than our semiconductor business as a result of the expanding need for storage and retention of compound and biological samples. However, even in this market, revenue streams from storage services can be more stable than the sale of freezers and other equipment, which exhibit periods of robust growth but also decline. As we have expanded our offerings of consumables, infrastructure services and storage services, we have seen these more stable revenue streams in life sciences increase to account for approximately 53% of our Brooks Life Science Systems segment revenue in fiscal year 2017.
Segments
We have two operating and reportable segments consisting of (i) Brooks Semiconductor Solutions Group segment and (ii) Brooks Life Science Systems segment. Prior to fiscal year 2016, we had three operating and reportable segments that consisted of Brooks Product Solutions segment, Brooks Global Services segment and Brooks Life Science Systems segment. During fiscal year 2016, we reorganized our reporting structure into two operating and reportable segments. For further information on our operating segments and the related restructuring actions, please refer to Note 15, "Restructuring and Other Charges" and Note 18, "Segment and Geographic Information," to our Consolidated Financial Statements included under "Item 8, Financial Statements and Supplementary Data" of this Form 10‑K. Our prior period reportable segment information has been reclassified to reflect the current segment structure and conform to the current period presentation.
Brooks Semiconductor Solutions Group Segment
Brooks Semiconductor Solutions Group is a leader in mission-critical wafer automation, vacuum pumping, as well as contamination controls solutions and services that are designed to improve throughput, yield, and cost of ownership of semiconductor tools in the fab. Our product offerings include vacuum and atmospheric robots, turnkey vacuum and atmospheric wafer handling systems, cryogenic vacuum pumps and chillers, as well as wafer carrier clean and reticle storage systems. We also capture the complete life cycle of value through a global service network of expert application and field engineers who are located close to our customers. Our services include rapid component exchange and repair, upgrades to improve equipment productivity, and proactive monitoring and diagnostics for predictive risk management and improved up-time of the installed base.
a) | Markets and Customers |
The principal markets served by the Brooks Semiconductor Solutions Group segment include the following:
· | Semiconductor capital equipment market |
Each year, the global semiconductor industry makes significant capital investments in equipment to keep up with advancements in semiconductor technology, to add manufacturing capacity and to improve productivity within existing semiconductor fabrication plants, or fabs. We are recognized as a market leader in four critical sub-segments: vacuum automation for wafer handling; cryogenic vacuum pumps; contamination control; and automation for advanced packaging. As discussed above, the global semiconductor capital equipment industry is cyclical, but we believe that it possesses a long-term growth profile driven by the demand for increasingly sophisticated consumer electronics, automotive and smart appliance products, growth in data centers, the expansion of Internet-of-Things which increasingly connects various appliances and devices to servers, and mobile platforms. The demand for higher performance, lower power consumption and reduced size for all such products is enabled by advancements in the technology and processes used for the manufacturing of the devices. We believe this trend continues to provide market opportunities for the
5
Brooks Semiconductor Solutions Group to be a valued partner in providing vacuum automation, carrier contamination control, cryogenic solutions and automation for advanced packaging to support the industry’s needs.
We have been a long-term partner to device manufacturers, or fabs, and the original equipment manufacturers, or OEMs, who are the providers of complex processing equipment, or tools, to fabs. We maintain collaborative relationships with our customers for the innovative design of solutions that enable our customers to have a valued wafer process advantage and equipment usersimproved cost of ownership in the fab. Our global network of technical specialists provides extensive support to our customers in all regions, including the key semiconductor markets in Korea, Taiwan, Japan, and China.
The production of advanced semiconductor chips requires many complex and logistically challenging manufacturing activities. Silicon wafers must go through hundreds of process steps in order to create billions of microscopic transistors and connect them in both horizontal and vertical layers to produce a functioning integrated circuit, or IC. These steps, which comprise the initial fabrication of the IC and referred to in the industry as front-end processes, are repeated many times on a single wafer to create the desired pattern on the silicon wafer. Up to 50% of these processes are performed in tools that operate under vacuum conditions, such as removing, depositing, or measuring materials on wafer surfaces. As the complexity of semiconductors has increased, the number of process steps that occur in a vacuum environment have also increased, resulting in a greater need for both automation and vacuum technology solutions.
The increase in packing density of components in mobile devices has led the industry to devise new techniques for chip interconnectivity using what is called wafer level packaging, or WLP. This advanced packaging technology is a process of combining multiple wafers together prior to cutting them into pieces and then forming them onto a packaging substrate where they are ultimately divided into the multitude of chips. The recent increased adoption of WLP has increased the need for a contaminant free and high purity manufacturing environment, which is providing new demand across our semiconductor offerings which are tailored to handle full wafer forms expanding our opportunity with existing and new customers. For example, throughout the world. fabrication and packaging processes noted above, the demand for clean processing extends to increased demand for wafer carrier devices which are used for the safe and clean transport of wafers between tools during the manufacturing process. Large scale semiconductor fabs may use thousands of these carriers. There is also growing demand for wafer carrier cleaning and conditioning tools used to remove microscopic particles, organic compounds and water that are attracted to the inside surface of the carrier. Automated cleaning and conditioning of the carrier devices are also in demand by customers looking to improve yields.
· | Adjacent capital equipment markets |
In addition to the semiconductor manufacturing industry, there are a variety of adjacent and industrial manufacturing operations that use similar manufacturing processes. Frequently, these markets have common customers and similar technology applications. A few of the adjacent markets which we serve include light-emitting diodes, or LED, which are manufactured using vacuum systems and handling processes similar to those used in semiconductor manufacturing. Organic Light Emitting Diode, or OLED, applications are also gaining traction in the mobile computing and telecommunications device markets because of their high quality display and low power consumption. Touch screen technology found in mobile devices requires either a vacuum or significant cooling for effective deposition of films or coatings during the production process.
We serve markets where equipmentbelieve the desire for efficient, higher throughput and extremely clean manufacturing for semiconductor wafer fabs, the chip packaging process and other industrial or high performance electronic-based products and processes have created a substantial market for us in the following offerings: (i) substrate handling automation, which is related to moving the wafers in a semiconductor fab, (ii) tool automation, which is related to using robots and modules in conjunction with and inside process tools that move wafers from station-to-station, (iii) vacuum systems technology to create and sustain the clean environment necessary for fabricating various products, and (iv) automated contamination control systems to condition and clean wafer carriers.
6
Product and Service Offerings
The principal offerings of the Brooks Semiconductor Solutions Group segment consist of: (i) wafer handling robotics and systems, (ii) semiconductor contamination control solutions, and (iii) cryogenic pumps and compressors. The segment also provides support services, including repair, diagnostic and installation, as well as spare parts and productivity enhancement upgrades to maximize tool productivity.
Wafer handling robotics and systems offerings- include vacuum robots and atmospheric robotic modules, as well as tool automation systems that provide precision handling and clean wafer environments. In the semiconductor industry, wafer handling robotics have emerged as a critical technology in the highly complex production tools in the world’s most advanced wafer fabs. A typical customer tool is designed and built around a process chamber and uses automation technology to move wafers in and out of the chamber. We specialize in developing and building the automated handling systems, as well as the vacuum technologies used in these tools. We provide individual components within an OEM customer system as well as complete integrated handling systems. We provide automation products that are used for both atmospheric pressure and vacuum-based tools and are designed to improve performance and productivity of the manufacturing process.
Contamination control solutions- include automated cleaning and inspection systems for wafer carriers, as well as reticle pod cleaners and stockers, which are automated systems that store wafers or reticles. Our products use enhanced technology to remove critical airborne contamination within the workflow of the manufacturing process. Our solutions contribute to improving yields, productivity and availabilityprocess stability in the manufacturing process which requires an ultra-clean manufacturing environment.
Cryogenic pumps and compressors- provide vacuum pump and thermal management solutions that are used in critical vacuum process applications. Certain process steps require our vacuum pumps to create and optimize the process environment by maintaining pressure consistency throughout the manufacturing process. Semiconductor manufacturers need to ensure that each process operates at carefully controlled pressure levels to achieve optimal production yields. Impurities or incorrect pressure levels can lower production yields, thereby significantly increasing manufacturing costs. Our cryogenic vacuum pumps are considered the industry standard by many leading semiconductor device manufacturers for ion implant and physical vapor deposition, or PVD, applications, both of which require high vacuum pumping capability.
Within the semiconductor industry, we sell our products and services to the world’s major semiconductor chip and OEMs. Our customers outside the semiconductor industry are broadly diversified. We have major customers in North America, Europe and Asia. Although much of our equipment sales ship to OEMs in the United States, a large percentage of these OEM tools are ultimately installed in semiconductor fabs that are outside of North America. We also provide support services to leading OEMs, fabs and foundries across the globe.
Brooks Life Science Systems Segment
Brooks Life Science Systems is a global leader of comprehensive sample life cycle management solutions that provides life science and bioscience customers with complete sample management solutions to advance scientific research and support drug development. Our sample management solutions are focused on providing customers with the highest level of sample quality, security, availability, management, intelligence and integrity throughout the life cycle of samples. Our solutions include automated storage systems, storage services, infrastructure services, as well as consumables and instruments. We also provide informatics solutions that manage samples throughout our customers’ research discovery and development work flows.
Markets and Customers
Brooks Life Science Systems serves a broad range of end markets within the life sciences industry to address a confluence of life science industry trends, such as technology, information management and new sophisticated tools and applications. With the advent of biologics and personalized medicine, biological samples have become critical factorassets to the success of drug and therapy pipelines, and the proper management and protection of these samples has gained
7
increased importance to our customers. We believe this trend has created a sizable market opportunity for Brooks Life Science Systems to provide comprehensive sample management solutions.
We believe that the total addressable market for sample management solutions is currently expanding as a result of an increasing number of samples being stored globally. The market is fragmented, so we are initially focused on marketing our products and services within biopharma, which encompasses drug discovery research and development along with related clinical research, to government and commercially-sponsored biobanks, as well as to healthcare and academic research institutions. Together, this presents a significant addressable market for our comprehensive sample management solutions.
Brooks Life Science Systems has more than 800 customers around the globe, including a majority of the top‑20 global bio-pharmaceutical companies. Due to the comprehensive nature of our sample management solutions that include automated ultra-cold storage management systems, consumables and instruments, as well as services and informatics, we are continuing to expand our customer base and geographic reach to increase our revenue streams and to deliver consistent growth over the long-term.
Product and Service Offerings
The principal offerings of the Brooks Life Science Systems segment include the following:
Automated cold storage systems- provide stand-alone systems that can store up to 2,000,000 samples each in temperature ranges from +4°C to -190°C. Our systems provide high throughput capability and optimized storage of multi-format tubes and plates, and increased storage capacity while maintaining consistent temperature profiles across stored samples. We also provide support services for our installed base of storage systems.
Sample management services- include a complete range of services that complement the Brooks Life Science Systems segment’s product offerings and consist of on-site and off-site sample storage, cold chain logistics, sample transport and collection relocation, bio-processing solutions (inclusive of sample preparation, and genomic and cell culture analysis), disaster recovery and business continuity, as well as project management and consulting.
Consumables and Instruments- include a complete range of unique consumables, including multiple formats of racks, tubes, caps, plates and foils, which support storage of samples prior to placing them in ultra-cold storage environment. A comprehensive range of instruments used for labeling, bar coding, capping, de-capping, auditing, sealing, peeling, and piercing tubes and plates complement our consumables.
Informatics- provides sample intelligence software solutions and integration of customer technology. Our informatics suite also provides laboratory work flow scheduling for life science tools and instrument work cells, sample inventory and logistics, environmental and temperature monitoring, clinical trial and consent management, as well as planning, data management, virtualization, and visualization of sample collections.
Sales, Marketing and Customer Support
We market and sell the majority of our semiconductor products and services in Asia (including Japan), Europe, the Middle East and North America through our direct sales organization. The sales process for our products is often multilevel, involving a team comprised of individuals from sales, marketing, engineering, operations and senior management. In many cases we assign a team to a customer and that team engages the customer at different levels of its organization to facilitate planning, provide product customization when required, and ensure open communication and support. A portion of our vacuum products and services are sold through local distributors.
Prior to March 2015, we served the Japanese market for our semiconductor robotics and automation products through Yaskawa Brooks Automation, our joint venture with Yaskawa Electric Corporation of Japan. The venture was terminated in March 2015 and was liquidated during the fourth quarter of fiscal year 2015. As a result of the joint venture’s dissolution, we reacquired the right to market our products in Japan through our direct sales force and employed a portion of the former employees of the venture.
8
The majority of our life sciences sales are completed through our direct Brooks Life Science Systems sales force, particularly our store systems and services. In addition, we supplement the sale of consumables and instruments through distributors that reach a broad range of customers. In regions with emerging life science industries such as China, India and the Middle East, we leverage local distributors to assist with the sales process for store systems. The sales process for our larger sample management systems may take 6 to 18 months to complete and it involves a team typically comprised of individuals from sales, marketing, engineering and senior management.
We typically provide product warranties for a period of one to two years depending on the product type.
Our marketing activities include participation in trade shows, delivery of seminars, participation in industry forums, distribution of sales literature and white papers, publication of press releases and articles in business and industry publications. We maintain sales and service centers in Asia, Europe, the Middle East and North America to enhance support and communication with our customers. These facilities, together with our headquarters, house local support capabilities and demonstration equipment for our customers to evaluate. We encourage customers to discuss features and applications of our demonstration equipment with our engineers who are located at these facilities.
Competition
Brooks Semiconductor Solutions Group segment operates in a variety of market segments of varying breadth with differing competitors and competitive dynamics. The semiconductor and adjacent technology markets, as well as process equipment manufacturing industries, are highly competitive and characterized by continual changes and technology improvements. A significant portion of equipment automation is still done internally by OEMs. Our competitors among merchant vacuum robot automation suppliers include primarily Japanese companies, such as Daihen Corporation, Daikin Industries, Ltd. and Rorze Corporation. Our competitors among vacuum pump component suppliers include Sumitomo Heavy Industries and Telemark, Inc. Atmospheric tool automation is typically less demanding, has fewer barriers to entry and has a larger field of competitors. We compete directly with other equipment automation suppliers of atmospheric modules and systems, such as Hirata Corporation, Kawasaki Heavy Industries, Ltd., Genmark Automation, Inc., Rorze Corporation, Sankyo Seisakusho Co., Ltd., TDK Corporation and Sinfonia Technology Co., Ltd.
We believe our customers will purchase our equipment automation products and vacuum subsystems as long as our products continue to provide the necessary throughput, reliability, contamination control and accuracy at an acceptable price. We believe our semiconductor offerings are competitive with respect to all of these factors. We cannot guarantee, however, that we will be successful in selling our products to OEMs who currently satisfy a portion of their automation needs in-house or from other independent suppliers, regardless of the performance or price of our products.
Given the breadth of Brooks Life Sciences sample management solutions, there are no direct competitors for the comprehensive set of automation, consumables, instruments, services and informatics solutions we provide to our customers. However, each of the business lines within the Life Sciences business has unique competitors. This would include Hamilton Company and Liconic AG for automation systems, Thermo-Fisher for consumables and services, as well as LabCorp and Covance for services.
Research and Development
Our research and development efforts are focused on developing new products and enhancing the functionality, degree of integration, reliability and performance of our existing products. Our engineering, marketing, operations and management personnel leverage their close collaborative relationships with their counterparts in customer organizations in an effort to proactively identify market demands that helps us refocus our research and development investment to match our customers’ success, typicallydemands. With the rapid pace of change that characterizes the markets we serve, it is essential for us to provide high-performance and reliable products in demandingorder to maintain our leadership position in both our Brooks Semiconductor Solutions Group and Brooks Life Science Systems businesses.
Our research and development spending was $47.0 million, $51.5 million and $52.2 million, respectively, during fiscal years 2017, 2016 and 2015.
9
We invest in research and development initiatives within our Brooks Semiconductor Solutions Group segment to maintain continued leadership positions in the markets we serve. We have recently launched our newest Vacuum Automation platform, MagnaTran LEAP™, for the rapidly emerging advanced technologies related to manufacturing 10 nanometer semiconductor chips. MagnaTran LEAP is well positioned to deliver clean, accurate and fast wafer transport available for the fast growing Deposition and Etch market.
We have developed and continue to develop automated biological sample storage solutions for operating in ultra-low temperature and/environments within the Brooks Life Science Systems segment. We have developed the Twin-bank platform and introduced the BioStore™ III Cryo automated cryogenic sample management system which offer sample automation, cold chain management and improved security and accessibility while maintaining sample protection within the storage environment.
Manufacturing and Service
Our manufacturing operations include product assembly, integration and testing. We implement quality assurance procedures that include standard design practices, reliability testing and analysis, supplier and component selection procedures, vendor controls, manufacturing process controls, and service processes that ensure high-quality performance of our products. Our major manufacturing facilities are located in Chelmsford, Massachusetts; Monterrey, Mexico; Yongin-City, South Korea; and Manchester, United Kingdom. Our manufacturing operations are designed to provide high quality, low cost, differentiated products to our customers in short lead times through responsive and flexible processes and sourcing strategies. We utilize lean manufacturing techniques for a large portion of our manufacturing, including manufacture of assemblies that we have outsourced to competitive regions, including Asia. We expect to continue to broaden our sourcing of certain portions of our manufacturing process to ensure we continue to provide high quality products at competitive costs. We also believe the continued sourcing of portions of our manufacturing processes in these regions allows us to better serve our customers who have operations in these regions.
We have service and support locations close to our customers to provide rapid response to their service needs. Our principal service and support locations include Chelmsford, Massachusetts; Fremont, California; Chu Bei City, Taiwan; Yongin-City, South Korea; Yokohama, Japan; Shanghai, China; Singapore; Manchester, United Kingdom; Monterrey, Mexico; and Kiryat-Gat, Israel. Our Brooks Life Science Systems segment provides sample management storage and transportation services in Indianapolis, Indiana; Fresno, California; El Segundo, California; Torrance, California; Bronx, New York; Germany, China, and Singapore.
Patents and Proprietary Rights
We rely on patents, trade secret laws, confidentiality procedures, copyrights, trademarks and licensing agreements to protect our technology. Due to the rapid technological change that characterizes the life sciences, semiconductor, adjacent technology markets and related process equipment industries, we believe that the improvement of existing technology, reliance upon trade secrets, unpatented proprietary know-how and the development of new products may be as important as patent protection in establishing and maintaining a competitive advantage. Our policy is to require all employees to enter into proprietary information and nondisclosure agreements to protect trade secrets and know-how. We cannot guarantee that these efforts will meaningfully protect our trade secrets.
As of September 30, 2017, we owned approximately 420 issued U.S. patents, with various corresponding patents issued in foreign jurisdictions. We also had approximately 115 pending U.S. patent applications, with foreign counterparts of certain of these applications having been filed or pressure environments.which may be filed at the appropriate time. Our largest served market ispatents will expire at various dates through 2035.
Backlog
Backlog for the semiconductor capital equipment industry,Brooks Semiconductor Solutions Group segment offerings totaled approximately $115 million as of September 30, 2017 as compared to approximately $92 million at September 30, 2016. Backlog for the Brooks Semiconductor Solutions Group segment includes all purchase orders for which our customers have scheduled delivery, regardless of the expected delivery date, and consists principally of orders for products sold throughand service agreements. Substantially all of this backlog consists of orders scheduled to be delivered within the next 12 months.
10
Backlog for the Brooks Life Science Systems segment offerings totaled $250 million as of September 30, 2017 as compared to approximately $233 million at September 30, 2016. Backlog for the Brooks Life Science Systems segment includes all purchase orders for which customers have scheduled delivery, regardless of the expected delivery date, and consists of orders for products and service agreements. In addition, it includes estimated revenue for future services related to our Brooks Product Solutions segment representedBioStorage business for which contracts have been secured. Final revenue realized will vary based on volumes, prices, duration, and other factors. Storage contracts vary in length of time, with some being short term and some indefinite. We include the estimated value for time periods in the contract up to a maximum of 5 years.
Geographic Information
Our top 10 customers accounted for approximately 51%, 52% and 56%39% of our consolidated revenue in fiscal year 2017. No customers accounted for more than 10% of our consolidated revenue for fiscal year 2017.
Net revenue for the fiscal years 2014, 2013ended September 30, 2017, 2016 and 2012, respectively. 2015 based upon the source of the order by geographic area is as follows (in thousands):
|
|
|
|
|
|
|
|
|
|
|
| Year Ended September 30, | |||||||
|
| 2017 |
| 2016 |
| 2015 | |||
North America |
| $ | 242,331 |
| $ | 209,727 |
| $ | 199,103 |
Asia/Pacific/Other |
|
| 327,864 |
|
| 247,241 |
|
| 231,840 |
Europe: |
|
|
|
|
|
|
|
|
|
United Kingdom |
|
| 42,138 |
| $ | 36,611 |
| $ | 32,160 |
Rest of Europe |
|
| 80,552 |
| $ | 66,744 |
| $ | 89,605 |
|
| $ | 692,885 |
| $ | 560,323 |
| $ | 552,708 |
The decreasemajority of our net revenue in North America is generated in the portionUnited States and amounted to $240.6 million, $208.3 million and $197.4 million, respectively, during fiscal years ended September 30, 2017, 2016 and 2015.
The geographic location of an OEM is not indicative of where our products will eventually be used. The geographic area for our orders is determined by the onward sale of an OEM system which incorporates our sub-systems and/or components.
Our property, plant and equipment as of September 30, 2017 and 2016 by geographic area was as follows (in thousands):
|
|
|
|
|
|
|
|
| September 30, | ||||
|
| 2017 |
| 2016 | ||
North America |
| $ | 52,235 |
| $ | 49,505 |
Asia/Pacific/Other |
|
| 676 |
|
| 952 |
Europe |
|
| 5,551 |
|
| 4,428 |
|
| $ | 58,462 |
| $ | 54,885 |
Property, plant and equipment located in the United States amounted to $52.0 million and $49.3 million, respectively, at September 30, 2017 and 2016.
Environmental Matters
We are subject to federal, state, and local environmental laws and regulations, as well as the environmental laws and regulations of the foreign national and local jurisdictions in which we have manufacturing facilities. We believe we are materially in compliance with all such laws and regulations.
Compliance with foreign, federal, state, and local laws and regulations has not had, and is not expected to have, an adverse effect on our capital expenditures, competitive position, financial condition or results of operations.
11
Employees
At September 30, 2017, we had 1,661 full time employees. In addition, we employ part time workers and contractors. We consider our relationships with these and all employees to be good. Approximately 10 employees in our facility in Jena, Germany were covered by a collective bargaining agreement at September 30, 2017. During fiscal year 2017, we completed a restructuring action to consolidate our Jena, Germany repair facility into our Chelmsford, Massachusetts repair operation as a part of our total revenues representedstrategy to reduce our global footprint and streamline our cost structure. We eliminated 45 positions within the service and administrative functions as a result of this restructuring action. For further information on this restructuring action, please refer to Note 15, "Restructuring and Other Charges" to our Consolidated Financial Statements included under "Item 8, Financial Statements and Supplementary Data" of this Form 10‑K.
Available Information
We file annual, quarterly, and current reports, proxy statements, and other documents with the SEC, under the Securities Exchange Act of 1934, as amended, or the Exchange Act. The public may read and copy any materials that we file with the SEC at the SEC’s Public Reference Room at 100 F Street, NE, Washington, DC 20549. The public may obtain information on the operation of the Public Reference Room by products soldcalling the SEC at 1‑800‑SEC‑0330. Also, the SEC maintains an Internet website that contains reports, proxy and information statements, and other information regarding issuers, including Brooks Automation, Inc., that file electronically with the SEC. The public can obtain any documents that we file with the SEC at www.sec.gov.
Our internet website address is http://www.brooks.com. Through our website, we make available, free of charge, our annual reports on Form 10‑K, quarterly reports on Form 10‑Q, current reports on Form 8‑K and any amendments to those reports, as soon as reasonably practicable after such materials are electronically filed, or furnished to, the SEC. These SEC reports can be accessed through the investors section of our Brooks Product Solutions segmentwebsite. The information found on our website is duenot part of this or any other report we file with or furnish to the SEC.
Factors That May Affect Future Results
You should carefully consider the risks described below and the other information in this report before deciding to invest in shares of our common stock. These are the risks and uncertainties we believe are most important for you to consider. Additional risks and uncertainties not presently known to us, which we currently deem immaterial or which are similar to those faced by other companies in our industry or business in general, may also impair our business operations. If any of the following risks or uncertainties actually occurs, our business, financial condition and operating results would likely suffer. In that event, the market price of our common stock could decline and you could lose all or part of your investment.
Risks Relating to Our Industry
Due in part to the cyclical nature of the semiconductor manufacturing industry and related industries, as well as due to volatility in worldwide capital and equity markets, we have previously incurred operating losses and may have future losses.
Our business is largely dependent on capital expenditures in the semiconductor manufacturing industry and other businesses employing similar manufacturing technologies. The semiconductor manufacturing industry in turn depends on current and anticipated demand for integrated circuits and the products that use them. In recent years, these businesses have experienced unpredictable and volatile business cycles due in large part to rapid changes in demand and manufacturing capacity for semiconductors, and these cycles have had an impact on our business, sometimes causing declines in revenue and operating losses. We could experience future operating losses during an industry downturn. If an industry downturn continues for an extended period of time, our business could be materially harmed. Conversely, in periods of rapidly increasing demand, we could have insufficient inventory and manufacturing capacity to meet our
12
customers’ needs on a timely basis, which could result in the loss of customers and various other expenses that could reduce gross margins and profitability.
We face competition which may lead to price pressure and otherwise adversely affect our sales.
We face competition throughout the world in each of our product and service areas, including from the competitors discussed in Part I, Item 1, “Business - Competition” as well as from internal automation capabilities at larger OEMs. Many of our competitors have substantial engineering, manufacturing, marketing and customer support capabilities. In addition, strategic initiatives in China to encourage local semiconductor manufacturing and supply chain could increase competition from domestic equipment manufacturers in China. We expect our competitors to continue to improve the performance of their current products and services and to introduce new products, services and technologies that could adversely affect sales of our current and future products and services. New products, services and technologies developed by our competitors or more efficient production of their products or provisions of their services could require us to make significant price reductions or decide not to compete for certain orders. If we fail to respond adequately to pricing pressures or fail to develop products with improved performance or better quality services with respect to the other factors on which we compete, we could lose customers or orders. If we are unable to compete effectively, our business and prospects could be materially harmed.
Risks Relating to Our Operations
Our operating results could fluctuate significantly, which could negatively impact our business.
Our revenue, operating margins and other operating results could fluctuate significantly from quarter to quarter depending upon a variety of factors, including:
· | demand for our products as a result of the cyclical nature of the semiconductor manufacturing industry and the markets upon which the industry depends or otherwise; |
· | changes in the timing and terms of product orders by our customers as a result of our customer concentration or otherwise; |
· | changes in the demand for the mix of products and services that we offer; |
· | timing and market acceptance of our new product and services introductions; |
· | delays or problems in the planned introduction of new products or services, or in the performance of any such products following delivery to customers or the quality of such services; |
· | new products, services or technological innovations by our competitors, which can, among other things, render our products less competitive due to the rapid technological changes in the markets in which we provide products and services; |
· | the timing and related costs of any acquisitions, divestitures or other strategic transactions; |
· | our ability to reduce our costs in response to decreased demand for our products and services; |
· | our ability to accurately estimate customer demand, including the accuracy of demand forecasts used by us; |
· | disruptions in our manufacturing process or in the supply of components to us; |
· | write-offs for excess or obsolete inventory; |
· | competitive pricing pressures; and |
· | increased amount of investment into the infrastructure to support our growth, including capital equipment, research and development, as well as selling and marketing initiatives to support continuous product |
13
innovation, technological capability enhancements and sales efforts. The timing of revenue generation coupled with the increased amount of investment may result in operating losses. |
As a result of these risks, we believe that reference to past performance for comparisons of our revenue and operating results may not be meaningful, and that these comparisons may not be an accurate indicator of our future performance.
If we do not continue to introduce new products and services that reflect advances in technology in a timely and effective manner, our products and services may become obsolete and our operating results will suffer.
Our success is dependent on our ability to respond to the technological changes present in the markets we serve. The success of our product development and introduction of products to market depends on our ability to:
· | identify and define new market opportunities, products and services in accurate manner; |
· | obtain market acceptance of our products and services; |
· | innovate, develop and commercialize new technologies and applications in a timely manner; |
· | adjust to changing market conditions; |
· | differentiate our offerings from our competitors’ offerings; |
· | obtain and maintain intellectual property rights where necessary; |
· | continue to develop a comprehensive, integrated product and service strategy; |
· | price our products and services appropriately; and |
· | design our products to high standards of manufacturability so that they meet customer requirements. |
If we cannot succeed in responding in a timely manner to technological and/or market changes or if the new products and services that we introduce do not achieve market acceptance, our competitive position would diminish which could materially harm our business and our prospects.
The global nature of our business exposes us to multiple risks.
During fiscal years ended September 30, 2017 and 2016, approximately 65% and 63% of our revenue was derived from sales outside of North America. We expect that international sales, including increased sales in Asia, will continue to account for a significant portion of our revenue. We maintain a global footprint of sales, service and repair operations. As a result of our international operations, we are exposed to many risks and uncertainties, including:
· | longer sales-cycles and time to collection; |
· | tariff and international trade barriers; |
· | fewer or less certain legal protections for intellectual property and contract rights abroad; |
· | different and changing legal and regulatory requirements in the jurisdictions in which we operate; |
· | government currency control and restrictions on repatriation of earnings; |
· | fluctuations in foreign currency exchange and interest rates, particularly in Asia and Europe; and |
· | political and economic instability, changes, hostilities and other disruptions in regions where we operate. |
14
Negative developments in any of these areas in one or more countries could result in a reduction in demand for our products, the cancellation or delay of orders already placed, threats to our intellectual property, difficulty in collecting receivables, and a higher cost of doing business, any of which could materially harm our business and profitability.
Our business could be materially harmed if we fail to adequately integrate the operations of the businesses that we have acquired or may acquire.
We have made in the past, and may make in the future, acquisitions or significant investments in businesses with complementary products, services and/or technologies. Our acquisitions present numerous risks, including:
· | difficulties in integrating the operations, technologies, products and personnel of the acquired companies and realizing the anticipated synergies of the combined businesses; |
· | defining and executing a comprehensive product strategy; |
· | managing the risks of entering markets or types of businesses in which we have limited or no direct experience; |
· | the potential loss of key employees, customers and strategic partners of ours or of acquired companies; |
· | unanticipated problems or latent liabilities, such as problems with the quality of the installed base of the target company’s products or infringement of another company’s intellectual property by a target company’s activities or products; |
· | problems associated with compliance with the acquired company’s existing contracts; |
· | difficulties in managing geographically dispersed operations; and |
· | the diversion of management’s attention from normal daily operations of the business. |
If we acquire a new business, we may expend significant funds, incur additional debt or issue additional securities, which may negatively affect our operations and be dilutive to our stockholders. In periods following an acquisition, we will be required to evaluate goodwill and acquisition-related intangible assets for impairment. If such assets are found to be impaired, they will be written down to estimated fair value, with a charge against earnings. The failure to adequately address these risks or the impairment of any assets could materially harm our business and financial results.
Expanding within current markets introduces new competitors and commercial risks.
A key part of our growth strategy is to continue expanding within the life sciences sample management market. As part of this strategy, we expect to diversify our product sales and service revenue by leveraging our core technologies, which requires investments and resources which may not be available as needed. We cannot guarantee that we will be successful in leveraging our capabilities into the life sciences sample management market to meet all the needs of new customers and to compete favorably. Because a significant portion of our growth potential may be dependent on our ability to increase sales within the life science sample management market, our inability to successfully expand within such market may adversely impact future financial results.
Changes in key personnel could impair our ability to execute our business strategy.
The continuing service of our executive officers and essential engineering, technical and management personnel, together with our ability to attract and retain such personnel, is an important factor in our continuing ability to execute our strategy. There is substantial competition to attract such employees and the loss of any such key employees could have a material adverse effect on our business and operating results. The same could be true if we were to experience a high turnover rate among engineering and technical personnel and we were unable to replace them.
15
Our failure to protect our intellectual property could adversely affect our future operations.
Our ability to compete is significantly affected by our ability to protect our intellectual property. We rely upon patents, trade secret laws, confidentiality procedures, copyrights, trademarks and licensing agreements to protect our technology. Existing trade secret, trademark and copyright laws offer only limited protection. Our success depends in part on our ability to obtain and enforce patent protection for our products both in the United States and in other countries. We own numerous U.S. and foreign patents, and we intend to file additional applications, as appropriate, for patents covering our products and technology. Any issued patents owned by or licensed to us may be challenged, invalidated or circumvented, and the rights under these patents may not provide us with competitive advantages. In addition, the laws of some countries in which our products are or may be developed, manufactured or sold may not fully protect our products. Due to the rapid technological change that characterizes the semiconductor capitaland adjacent technology markets, we believe that the improvement of existing technology, reliance upon trade secrets and unpatented proprietary know-how and the development of new products may be as important as patent protection in establishing and maintaining competitive advantage. To protect trade secrets and know-how, it is our policy to require all technical and management personnel to enter into nondisclosure agreements.
We cannot guarantee that the steps we have taken to protect our intellectual property will be adequate to prevent the misappropriation of our technology. Other companies could independently develop similar or superior technology without violating our intellectual property rights. In the future, it may be necessary to engage in litigation or like activities to enforce our intellectual property rights, to protect our trade secrets or to determine the validity and scope of proprietary rights of others, including our customers. This could require us to incur significant expenses and to divert the efforts and attention of our management and technical personnel from our business operations.
The expiration of our patents over time could lead to an increase of competition and a decline in our revenue.
One of our main competitive strengths is our technology, and we are dependent on our patent rights and other intellectual property rights to maintain our competitive position. Our current patents will expire from time to time through 2035 which could result in increased competition and declines in product and service revenue.
We may be subject to claims of infringement of third-party intellectual property rights, or demands that we license third-party technology, which could result in significant expense and prevent us from using our technology.
There has been substantial litigation regarding patent and other intellectual property rights in the semiconductor-related industries. We have in the past been, and may in the future be, notified that we may be infringing intellectual property rights possessed by third parties. We cannot guarantee that infringement claims by third parties or other claims for indemnification by customers or end-users of our products resulting from infringement claims will not be asserted in the future or that such assertions, whether or not proven to be true, will not materially and adversely affect our business, financial condition and results of operations.
We cannot predict the extent to which we might be required to seek licenses or alter our products so that they no longer infringe the rights of others. We also cannot guarantee that licenses will be available or the terms of any licenses we may be required to obtain will be reasonable. Similarly, changing our products or processes to avoid infringing the rights of others may be costly or impractical and could detract from the value of our products. If a judgment of infringement were obtained against us, we could be required to pay substantial damages and a court could issue an order preventing us from selling one or more of our products. Further, the cost and diversion of management attention brought about by such litigation could be substantial, even if we were to prevail. Any of these events could result in significant expense to us and may materially harm our business and our prospects.
Unexpected events could disrupt our sample storage operations and adversely affect our reputation and results of operations.
Unexpected events, including fires or explosions at our facilities, natural disasters, such as tornadoes, hurricanes and earthquakes, war or terrorist activities, unplanned power outages, supply disruptions and failure of equipment combinedor systems, could adversely affect our reputation and results of operations. Our Brooks Life Science Systems’ service customers rely on us to securely store and timely retrieve and transport their critical samples, and these events could
16
result in service disruptions, physical damage to one or more key storage facilities and the customer samples stored in those facilities, the temporary closure of one or more key operating facilities or the temporary disruption of service, each of which could negatively impact our reputation and results of operations. Our primary storage facility is located in Indianapolis, Indiana, an area of the United States that can be prone to tornado and other severe weather events.
If our manufacturing sites were to experience a significant disruption in operations, our business could be materially harmed, while the failure to estimate customer demand accurately could result in excess or obsolete inventory.
We have a limited number of manufacturing facilities for our products and we have moved portions of our manufacturing to third parties, including some in lesser developed countries. If the operations at any one of these facilities were disrupted as a result of a natural disaster, fire, power or other utility outage, work stoppage or other similar event, our business could be seriously harmed because we may be unable to manufacture and ship products and parts to our customers in a timely fashion. The impact of any disruption at one of our facilities may be exacerbated if the disruption occurs at a time when we need to rapidly increase our manufacturing capabilities to meet increased demand or expedited shipment schedules.
Moreover, if actual demand for our products is different than expected, we may purchase more/fewer component parts than necessary or incur costs for canceling, postponing or expediting delivery of such parts. If we purchase inventory in anticipation of customer demand that does not materialize, or if our customers reduce or delay orders, we may incur excess inventory charges. Any or all of these factors could materially and adversely affect our business, financial condition and results of operations.
Our business could be materially harmed if one or more key suppliers fail to continuously deliver key components of acceptable cost and quality.
We currently obtain many of our key components on an as-needed, purchase order basis from numerous suppliers. In some cases we have only a single source of supply for key components and materials used in the manufacturing of our products. Further, we are increasing our sourcing of products in Asia, and particularly in China, and we do not have a previous history of dealing with many of these suppliers. Our inability to obtain components or materials in required quantities or of acceptable cost and quality and with the growthnecessary continuity of salessupply could result in delays or reductions in product shipments to our customers. In addition, if a supplier or sub-supplier suffers a production stoppage or delay for any reason, including natural disasters such as the tsunamis that affected Japan and Thailand, this could result in a delay or reduction in our product shipments to our customers. Any of these contingencies could cause us to lose customers, result in delayed or lost revenue and otherwise materially harm our business.
Our business could be adversely affected by a decline in the availability of raw materials.
We are dependent on the availability of certain key raw materials and natural resources used in our products and various manufacturing processes, and we rely on third parties to supply us with these materials in a cost-effective and timely manner. Our access to raw materials may be adversely affected if our suppliers’ operations were disrupted as a result of limited or delayed access to key raw materials and natural resources which may result in increased cost of these items. While most of the raw materials used in our products and various manufacturing processes are commercially available, we rely in some cases on materials that have a limited supply and are considered rare Earth elements, such as helium. If the supply of these elements is drastically reduced, it may lead to price increases which could result in higher costs of our products and corresponding revenue declines and have a material adverse impact on our business, financial condition and results of operations.
Our outsource providers may fail to perform as we expect.
Outsource providers have played and will continue to play a key role in our manufacturing operations and in many of our transactional and administrative functions, such as information technology and facilities management. Although we attempt to select reputable providers and secure their performance on terms documented in written contracts, it is possible that one or more of these providers could fail to perform as we expect and such failure could have an adverse impact on our business.
17
Our business relies on certain critical information systems and a failure or breach of such a system could harm our business and results of operations and, in the event of unauthorized access to a customer’s data or our data, incur significant legal and financial exposure and liabilities.
We maintain and rely upon certain critical information systems for the effective operation of our business. These information systems include telecommunications, the internet, our corporate intranet, various computer hardware and software applications, network communications and e-mail. These information systems may be owned and maintained by us, our outsource providers or third parties such as vendors and contractors. These information systems are subject to attacks, failures, and access denials from a number of potential sources including viruses, destructive or inadequate code, power failures, and physical damage to computers, hard drives, communication lines and networking equipment. To the extent that these information systems are under our control, we have implemented security procedures, such as virus protection software and emergency recovery processes, to mitigate the outlined risks. However, security procedures for information systems cannot be guaranteed to be failsafe and our inability to use or access these information systems at critical points in time, or unauthorized releases of confidential information, could unfavorably impact the timely and efficient operation of our business.
Confidential information stored on these information systems could also be compromised. If a third party gains unauthorized access to our data, including any information regarding our customers, such security breach could expose us to a risk of loss of this information, loss of business, litigation and possible liability. These security measures may be breached as a result of third-party action, including intentional misconduct by computer hackers, employee error, malfeasance or otherwise. Additionally, third parties may fraudulently attempt to induce employees or customers into disclosing sensitive information such as user names, passwords or other information in order to gain access to our customers’ data or our data, including our intellectual property and other confidential business information, or our information technology systems. Because the techniques used to obtain unauthorized access, or to sabotage systems, change frequently and generally are not recognized until launched against a target, we may be unable to anticipate these techniques or to implement adequate preventative measures. Any security breach could result in a loss of confidence by our customers, damage our reputation, disrupt our business, lead to legal liability and negatively impact our future sales.
Our goodwill and intangible assets may become impaired.
As of September 30, 2017, we had $233.6 million of goodwill and $83.5 million in net intangible assets as a result of our acquisitions. We periodically review our goodwill and the estimated useful lives of our identifiable intangible assets, taking into consideration any events or circumstances that might result in either a diminished fair value, or for intangible assets, a revised useful life. These events and circumstances include significant changes in the business climate, legal factors, operating performance indicators, advances in technology and competition. Any impairment or revised useful life could have a material and adverse effect on our financial position and results of operations, and could harm the trading price of our common stock.
Changes in tax rates or tax regulation could affect results of operations.
As a global company, we are subject to taxation in the United States and various other countries. Significant judgment is required to determine and estimate worldwide tax liabilities. Our future annual and quarterly effective tax rates could be affected by numerous factors, including changes in the: applicable tax laws; composition of pre-tax income in countries with differing tax rates; and/or establishment of a valuation allowance against deferred tax assets based on the assessment of their realizability prior to expiration. In addition, we are subject to regular examination by the Internal Revenue Service and state, local and foreign tax authorities. We regularly assess the likelihood of favorable or unfavorable outcomes resulting from these examinations to determine the adequacy of our provision for income taxes. Although we believe our tax estimates are reasonable, there can be no assurance that any final determination will not be materially different from the treatment reflected in our historical income tax provisions and accruals, which could materially and adversely affect our financial condition and results of operations.
We are subject to numerous governmental regulations.
We are subject to federal, state, local and foreign regulations, including environmental regulations and regulations relating to the design and operation of our products and control systems. We might incur significant costs as we seek to
18
ensure that our products meet safety and emissions standards, many of which vary across the states and countries in which our products are used. In the past, we have invested significant resources to redesign our products to comply with these directives. Compliance with future regulations, directives, and standards could require us to modify or redesign some products, make capital expenditures, or incur substantial costs. If we do not comply with current or future regulations, directives, and standards:
· | we could be subject to fines; |
· | our production or shipments could be suspended; and |
· | we could be prohibited from offering particular products in specified markets. |
Any of these events could materially and adversely affect our business, financial condition and results of operations.
Regulations and customer demands related to conflict minerals may adversely affect us.
The Dodd-Frank Wall Street Reform and Consumer Protection Act imposes disclosure requirements regarding the use in components of our products of “conflict minerals” mined from the Democratic Republic of Congo and adjoining countries, whether the components of our products are manufactured by us or third parties. This requirement could affect the pricing, sourcing and availability of minerals used in the manufacture of components we use in our products. In addition, there are additional costs associated with complying with the disclosure requirements and customer requests, such as costs related to our due diligence to determine the source of any conflict minerals used in our products. We may face difficulties in satisfying customers who may require that all of the components of our products are certified as conflict mineral free and/or free of numerous other hazardous materials.
Unfavorable currency exchange rate fluctuations may lead to lower operating margins, or may cause us to raise prices, which could result in reduced sales.
Currency exchange rate fluctuations could have an adverse effect on our sales and results of operations and we could experience losses with respect to forward exchange contracts into which we may enter. Unfavorable currency fluctuations could require us to increase prices to foreign customers, which could result in lower net sales by us to such customers. Alternatively, if we do not adjust the prices for our products in response to unfavorable currency fluctuations, our results of operations could be materially and adversely affected. In addition, most sales made by our foreign subsidiaries are denominated in the currency of the country in which these products are sold and the currency they receive in payment for such sales could be less valuable as compared to the U.S. dollar at the time of receipt as a result of exchange rate fluctuations. From time to time, we enter into forward exchange contracts to reduce currency exposure. However, we cannot be certain that our efforts will be adequate to protect us against significant currency fluctuations or that such efforts will not expose us to additional exchange rate risks, which could materially and adversely affect our results of operations.
Risk related to the referendum of the United Kingdom’s membership in the European Union
In June 2016, a majority of voters in the United Kingdom voted “for” the Referendum of the United Kingdom’s Membership in the European Union, referred to as Brexit, approving the exit of the United Kingdom from the European Union, which triggered volatility in exchange rate fluctuations of the U.S. dollar against foreign currencies in which we conduct our business. We may experience volatility in exchange rates as the United Kingdom negotiates its exit from the European Union. As described in Item 7A, "Quantitative and Qualitative Disclosures About Market Risk", of this 10‑K, most of our foreign currency denominated transactions are conducted in Euros, British Pounds and a variety of Asian currencies. Sales in currencies other than the U.S. dollar were approximately 33% and 34%, respectively, of our total sales during fiscal years 2017 and 2016. If a dollar strengthens, our revenue denominated in foreign currencies may be adversely affected when translated into U.S. dollars.
The announcement of Brexit has also created global economic uncertainty, which may cause our customers to closely monitor their costs and reduce their spending on our products and services. The effects of Brexit depends on any agreements the United Kingdom makes to retain access to European Union markets either during a transitional period or more permanently. The measures could potentially disrupt the markets we serve and may cause us to lose customers and
19
employees. In addition, Brexit could lead to legal uncertainty and potentially divergent national laws and regulations as the United Kingdom determines which E.U. laws to replace or replicate. Any of these effects of Brexit, among others, could adversely affect our business, results of operations and financial condition.
Our indebtedness may adversely affect our ability to operate our business, generate cash flows and make payments on such indebtedness
On October 4, 2017, we entered into a $200.0 million Senior Secured Term Loan Facility, or term loan, with Morgan Stanley Senior Funding, Inc., JPMorgan Chase Bank, N.A. and Wells Fargo Securities, LLC. The term loan matures and becomes fully payable on October 4, 2024. We would be required to redeem the term loan at the principal amount then outstanding upon occurrence of certain events, as described in the term loan agreement. For further information on this transaction, please refer to Note 21, "Subsequent Events" in the Notes to the Consolidated Financial Statements included in Item 8 "Financial Statements and Supplementary Data" of this Form 10‑K.
Our ability to pay interest and repay the principal for our indebtedness is dependent upon our ability to manage our business operations and maintain sufficient liquidity to service such debt. The loan borrowings are subject to variable interest rates which create exposure to interest rate risk. Interest rate increases may result in higher cost of servicing the loan and reduce our profitability and cash flows. The terms of our debt covenants could limit our ability to raise additional funds and the manner in which we conduct our business. We have the ability to refinance the term loan and obtain additional indebtedness as long as we maintain a certain level of liquidity and earnings, as specified in the loan agreement. If our liquidity and earnings are reduced below a certain level, we will have limited ability to service the term loan and obtain additional debt financing. Our failure to comply with these restrictive covenants could also result in an event of default which, if not cured or waived, could result in the acceleration of all or a portion of our indebtedness. Accordingly, a default would have a material adverse effect on our business and our lender would have the right to exercise its rights and remedies to collect, which would include the right to foreclose on our assets.
Risks Relating to Our Customers
Because we rely on a limited number of customers for a large portion of our revenue, the loss of one or more of these customers could materially harm our business.
We receive a significant portion of our revenue in each fiscal period from a relatively limited number of customers, and that trend is likely to continue. Sales to our ten largest customers accounted for approximately 39%, 34% and 38%, respectively, of our total revenue in the fiscal years ended September 30, 2017, 2016 and 2015. The loss of one or more of these major customers, a significant decrease in orders from one of these customers, or the inability of one or more customers to make payments to us when they are due could materially affect our revenue, business and reputation. In addition, there has been and may continue to be significant consolidation among some of our largest OEM customers, which could lead to increased pressure to reduce the price of our products and/or decreased market share of our products with the combined companies.
Because of the lengthy sales cycles of many of our products, we may incur significant expenses before we generate any revenue related to those products.
Our customers may need several months to test and evaluate our products. This increases the possibility that a customer may decide to cancel an order or change its plans, which could reduce or eliminate our sales to that customer. The impact of this risk can be magnified during the periods in which we introduce a number of new products, as has been the case in recent years. As a result of this lengthy sales cycle, we may incur significant research and development expenses, and selling, general and administrative expenses before we generate the related revenue for these products, and we may never generate the anticipated revenue if our customer cancels an order or changes its plans.
In addition, many of our products will not be sold directly to the end-user but will be components of other products manufactured by OEMs. As a result, we rely on OEMs to select our products from among alternative offerings to be incorporated into their equipment at the design stage; so-called design-ins. The OEMs’ decisions often precede the generation of volume sales, if any, by a year or more. Moreover, if we are unable to achieve these design-ins from an OEM, we would have difficulty selling our products to that OEM because changing suppliers after design-ins involves significant cost, time, effort and risk on the part of that OEM.
20
Customers generally do not make long term commitments to purchase our products and our customers may cease purchasing our products at any time.
Sales of our products are often made pursuant to individual purchase orders and not under long-term commitments and contracts. Our customers frequently do not provide any assurance of minimum or future sales and are not prohibited from purchasing products from our competitors at any time. Accordingly, we are exposed to competitive pricing pressures on each order. Our customers also engage in the practice of purchasing products from more than one manufacturer to avoid dependence on sole-source suppliers for certain of their needs. The existence of these practices makes it more difficult for us to increase price, gain new customers and win repeat business from existing customers.
We may face claims for liability related to damages of customer materials attributed to the failure of our products or services, exposing us to significant financial or reputational harm.
Our automation products for the semiconductor manufacturing market are used in the handling and movement of silicon wafers at various points in the production process, and our automated cold storage systems for the life sciences sample management market are used in the handling, movement and storage of biological and chemical samples. We also provide sample storage services to customers where we store their biological and chemical samples at our facilities. In any case, damage to our customers’ materials may be attributed to a failure of our products or services which could lead to claims for damages made by our customers and could also harm our relationship with our customers and damage our reputation in each of these industries, resulting in material harm to our business.
Risks Relating to Owning Our Securities
Our stock price is volatile.
The market price of our common stock has fluctuated widely. From the beginning of fiscal year 2016 through the end of fiscal year 2017, our stock price fluctuated between a high of $30.36 per share and a low of $8.48 per share. Consequently, the current market price of our common stock may not be indicative of future market prices, and we may be unable to sustain or increase the value of an investment in our common stock. Factors affecting our stock price may include:
· | variations in operating results from quarter to quarter; |
· | changes in earnings estimates by analysts or our failure to meet analysts’ expectations; |
· | changes in the market price per share of our public company customers; |
· | market conditions in the semiconductor and other industries into which we sell products and services; |
· | global economic conditions; |
· | political changes, hostilities or natural disasters such as hurricanes and floods; |
· | low trading volume of our common stock; and |
· | the number of firms making a market in our common stock. |
In addition, the stock market has in the past experienced significant price and volume fluctuations. These fluctuations have particularly affected the market prices of the securities of high technology companies like ours. These market fluctuations could adversely affect the market price of our common stock.
We may not pay dividends on our common stock.
Holders of our common stock are only entitled to receive dividends when and if they are declared by our Board of Directors. Although we have declared cash dividends on our common stock for the past several years, we are not
21
required to do so and may reduce or eliminate our cash dividends in the future. This could adversely affect the market price of our common stock.
Provisions in our charter documents and, Delaware law may delay or prevent an acquisition of us, which could decrease the value of your shares.
Our restated certificate of incorporation and by-laws and Delaware law contain provisions that could make it harder for a third party to acquire us without the consent of our Board of Directors. These provisions include limitations on actions by our stockholders by written consent, the inability of stockholders to call special meetings and the potential for super majority votes of our stockholders in certain circumstances. In addition, our Board of Directors has the right to issue preferred stock without stockholder approval, which could be used to dilute the stock ownership of a potential hostile acquirer.
Our restated certificate of incorporation makes us subject to the anti-takeover provisions of Section 203 of the Delaware General Corporation Law. In general, Section 203 prohibits publicly held Delaware corporations to which it applies from engaging in a “business combination” with an “interested stockholder” for a period of three years after the date of the transaction in which the person became an interested stockholder, unless the business combination is approved in a prescribed manner. This provision could discourage others from bidding for our shares of common stock and could, as a result, reduce the likelihood of an increase in the price of our common stock that would otherwise occur if a bidder sought to buy our common stock.
Delaware law also imposes restrictions on mergers and other business combinations between us and any holder of 15% or more of our outstanding common stock. Although we believe these provisions provide for an opportunity to receive a higher bid by requiring potential acquirers to negotiate with our Board of Directors, these provisions apply even if the offer may be considered beneficial by stockholders. If a change of control or change in management is delayed or prevented, the market price of our common stock could decline.
Our certificate of incorporation authorizes the issuance of shares of blank check preferred stock.
Our certificate of incorporation provides that our Board of Directors is authorized to issue from time to time, without further stockholder approval, up to 1,000,000 shares of preferred stock in one or more series and to fix and designate the rights, preferences, privileges and restrictions of the preferred stock, including dividend rights, conversion rights, voting rights, redemption rights and terms of redemption and liquidation preferences. Such shares of preferred stock could have preferences over our common stock with respect to dividends and liquidation rights. Our issuance of preferred stock may have the effect of delaying or preventing a change in control. Our issuance of preferred stock could decrease the amount of earnings and assets available for distribution to the holders of common stock or could adversely affect the rights and powers, including voting rights, of the holders of common stock. The issuance of preferred stock could have the effect of decreasing the market price of our common stock.
Item 1B. Unresolved Staff Comments
None.
Our corporate headquarters and primary manufacturing/research and development facilities are currently located in three buildings in Chelmsford, Massachusetts.
22
We maintained the following principal facilities as of September 30, 2017:
Square Footage | Ownership Status/Lease | |||||
Location | Functions | (Approx.) | Expiration | |||
Chelmsford, Massachusetts | Corporate headquarters, training, manufacturing, R&D and sales & support | 298,000 | Owned | |||
Indianapolis, Indiana | Sample storage, sales & support | 98,000 | September 2023 | |||
Fremont, California | Manufacturing, R&D and sales & support | 44,940 | August 2025 | |||
Manchester, United Kingdom | Manufacturing, R&D and sales & support | 44,670 | December 2019 | |||
Yongin-City, South Korea | Manufacturing, R&D and sales & support | 32,000 | September 2019 | |||
Chu Bei City, Taiwan | Sales & support | 28,600 | June 2018 |
Our Brooks Semiconductor Solutions Group segment utilizes the facilities in Chelmsford, Massachusetts; Fremont, California; South Korea, Germany and Taiwan. Our Brooks Life Science Systems segment.segment utilizes the facilities in Manchester, United Kingdom; Indianapolis, Indiana; Chelmsford, Massachusetts; Bronx, New York; and Fremont, California.
During fiscal year ended September 30, 2017, we entered into a new lease agreement for the existing 85,000 square feet of space in Indianapolis, Indiana which expires on September 30, 2023. Additionally, we executed another lease agreement for an additional 13,000 square feet of space within the same facility which commences on March 1, 2019 and expires on September 30, 2023. Both leases may be extended at our option for three additional terms of five years each, subject to the terms and conditions of the lease.
During fiscal year ended September 30, 2017, we extended the lease term for our Fremont, California facility until August 31, 2025 which may be further extended at our option for two additional terms of five years each, subject to the terms and conditions of the lease.
During fiscal year ended September 30, 2017, we completed a restructuring action related to centralizing our North American and European repair services for cryogenic and automation products in our Chelmsford, Massachusetts facility and relocating such services from our facility in Jena, Germany as a part of our strategy to reduce our global footprint and streamline our cost structure. We vacated majority of the space in the 30,100 square foot Jena facility upon expiration of the lease term on February 28, 2017.
We maintain additional sales, support and training offices in Texas, Europe (France and Germany), Asia (China, Japan and Singapore) and the Middle East (Israel). We also maintain sample storage facilities in China, Germany and Singapore.
We utilize a third party to manage our manufacturing operations in Mexico under a shelter agreement. As a part of this arrangement, we make and guarantee the monthly payments for a lease of the 56,116 square foot manufacturing facility which expires in February 2019. The non-semiconductorremaining payments under the lease were approximately $1.0 million at September 30, 2017.
We are subject to various legal proceedings, both asserted and unasserted, that arise in the ordinary course of business. We cannot predict the ultimate outcome of such legal proceedings or in certain instances provide reasonable ranges of potential losses. However, as of the date of this report, we believe that none of these claims will have a material adverse effect on our consolidated financial condition or results of operations. In the event of unexpected subsequent developments and given the inherent unpredictability of these legal proceedings, there can be no assurance that our assessment of any claim will reflect the ultimate outcome and an adverse outcome in certain matters could, from
23
time-to-time, have a material adverse effect on our consolidated financial condition or results of operations in particular quarterly or annual periods.
Item 4. Mine Safety Disclosures
Not applicable.
Item 5. Market for Registrant’s Common Equity, Related Stockholder Matters and Issuer Purchases of Equity Securities
Our common stock is traded on the NASDAQ Stock Market LLC under the symbol “BRKS.” The following table sets forth the high and low intraday sales prices per share of our common stock as reported by the NASDAQ Stock Market LLC and the cash dividends declared per common share for the periods indicated:
|
|
|
|
|
|
|
|
|
|
|
| Market Price |
| Dividends | |||||
|
| High |
| Low |
| Declared | |||
Fiscal Year Ended September 30, 2017: |
|
|
|
|
|
|
|
|
|
First quarter |
| $ | 17.80 |
| $ | 12.89 |
| $ | 0.10 |
Second quarter |
|
| 22.40 |
|
| 16.68 |
|
| 0.10 |
Third quarter |
|
| 29.60 |
|
| 21.14 |
|
| 0.10 |
Fourth quarter |
|
| 30.36 |
|
| 21.78 |
|
| 0.10 |
Fiscal Year Ended September 30, 2016: |
|
|
|
|
|
|
|
|
|
First quarter |
| $ | 11.91 |
| $ | 10.68 |
| $ | 0.10 |
Second quarter |
|
| 10.54 |
|
| 8.48 |
|
| 0.10 |
Third quarter |
|
| 11.90 |
|
| 9.16 |
|
| 0.10 |
Fourth quarter |
|
| 13.96 |
|
| 11.05 |
|
| 0.10 |
Number of Holders
As of November 2, 2017, there were 556 holders of record of our common stock.
Dividend Policy
Dividends are declared at the discretion of our Board of Directors and depend on actual cash flow from operations, our financial condition, capital requirements and any other factors our Board of Directors may consider relevant. Future dividend declarations, as well as the record and payment dates for such dividends, will be determined by our Board of Directors on a quarterly basis.
On November 8, 2017, our Board of Directors approved a cash dividend of $0.10 per share payable on December 22, 2017 to common stockholders of record on December 1, 2017.
Comparative Stock Performance
The following graph compares the cumulative total shareholder return (assuming reinvestment of dividends) from investing $100 on September 30, 2012, and plotted at the last trading day of each of the fiscal years ended September 30, 2013, 2014, 2015, 2016 and 2017, in each of (i) our Common Stock; (ii) the NASDAQ/NYSE MKT/NYSE Index of companies; (iii) a peer group for the fiscal year ended September 30, 2017 (“Current Peer Group”), and (iv) a peer group for the fiscal year ended September 30, 2016 (“Prior Peer Group”).
The Current Peer Group is comprised of Advanced Energy Industries, Inc., Analogic Corp., Axcelis Technologies Inc., Bio Rad Laboratories Inc., Bruker Corp., Cabot Microelectronics Corp., Coherent Inc., Entegris, Inc., Formfactor Inc., Haemonetics Corp., MKS Instruments, Inc., MTS Instruments, Inc., Photronics, Inc., Ultra Clean Holdings, Inc., Varex Imaging Corp. and Veeco Instruments Inc. The Prior Peer Group is comprised of Advanced Energy Industries, Inc., Bruker Corp., Entegris, Inc., Formfactor Inc., MKS Instruments, Inc., Photronics, Inc.,
24
Teradyne Inc., Ultra Clean Holdings, Inc., Veeco Instruments Inc. and Xcerra Corp. The Current Peer Group was expanded to include life sciences companies due to the growing percentage of the Company’s revenue from the Brooks Life Sciences Systems segment.
The stock price performance on the graph below is not necessarily indicative of future price performance.
COMPARISON OF 5 YEAR CUMULATIVE TOTAL RETURN*
Among Brooks Automation, Inc., the NASDAQ/NYSE MKT/NYSE Index,
and a Peer Group
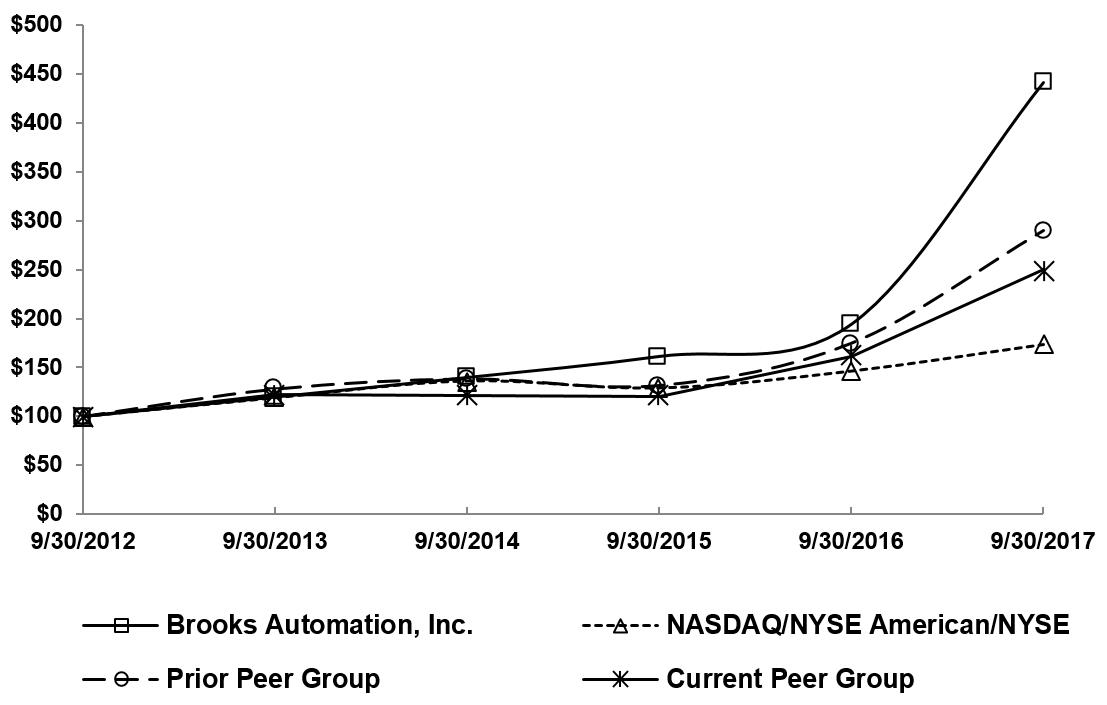
|
|
|
|
|
|
|
|
|
|
|
|
|
|
|
|
|
|
|
|
| 9/30/2012 |
| 9/30/2013 |
| 9/30/2014 |
| 9/30/2015 |
| 9/30/2016 |
| 9/30/2017 | ||||||
Brooks Automation, Inc. |
| $ | 100.00 |
| $ | 119.99 |
| $ | 139.94 |
| $ | 161.48 |
| $ | 194.44 |
| $ | 441.66 |
NASDAQ/NYSE American/NYSE |
|
| 100.00 |
|
| 119.19 |
|
| 136.37 |
|
| 129.16 |
|
| 146.39 |
|
| 173.50 |
Prior Peer Group |
|
| 100.00 |
|
| 127.88 |
|
| 138.30 |
|
| 131.63 |
|
| 174.73 |
|
| 289.61 |
Current Peer Group |
|
| 100.00 |
|
| 122.33 |
|
| 121.24 |
|
| 120.74 |
|
| 161.57 |
|
| 249.89 |
The information included under the heading “Comparative Stock Performance” in Item 5 of "this report" shall not be deemed to be “soliciting material” or subject to Regulation 14A, shall not be deemed “filed” for purposes of Section 18 of the Exchange Act, or otherwise subject to the liabilities of that section, nor shall it be deemed incorporated by reference in any filing under the Securities Act of 1933, as amended, or the Exchange Act.
Issuer’s Purchases of Equity Securities
On September 29, 2015, our Board of Directors approved a share repurchase program for up to $50 million worth of our common stock. The timing and amount of any shares to be repurchased under this program will be based on market and business conditions, legal requirements and other factors and may be commenced or suspended at any time at our discretion. There were no shares repurchased under this program during fiscal year ended September 30, 2017.
25
Item 6. Selected Financial Data
The selected consolidated financial data set forth below should be read in conjunction with our Consolidated Financial Statements and notes thereto and “Management’s Discussion and Analysis of Financial Condition and Results of Operations,” appearing elsewhere in this report.
|
|
|
|
|
|
|
|
|
|
|
|
|
|
|
|
|
| Year Ended September 30, | |||||||||||||
|
| 2017 |
| 2016 |
| 2015 |
| 2014 |
| 2013 | |||||
|
| (1)(2) |
| (3)(4) |
| (5)(6) |
| (7)(8)(9) |
| (8)(10)(11) | |||||
|
| (In thousands, except per share data) | |||||||||||||
Revenue |
| $ | 692,885 |
| $ | 560,323 |
| $ | 552,708 |
| $ | 482,848 |
| $ | 422,440 |
Gross profit |
|
| 267,404 |
|
| 198,081 |
|
| 189,105 |
|
| 167,337 |
|
| 132,307 |
Operating income (loss) |
|
| 64,113 |
|
| 4,238 |
|
| 16,890 |
|
| (2,699) |
|
| (16,798) |
Income (loss) from continuing operations |
|
| 62,612 |
|
| (69,476) |
|
| 14,221 |
|
| 1,520 |
|
| (7,114) |
Income from discontinued operations, net of tax |
|
| — |
|
| — |
|
| — |
|
| 30,002 |
|
| 4,964 |
Net income (loss) attributable to Brooks Automation, Inc. |
|
| 62,612 |
|
| (69,476) |
|
| 14,221 |
|
| 31,361 |
|
| (2,215) |
Basic net income (loss) per share attributable to Brooks Automation, Inc. common stockholders: |
|
|
|
|
|
|
|
|
|
|
|
|
|
|
|
Income (loss) from continuing operations |
|
| 0.90 |
|
| (1.01) |
|
| 0.21 |
|
| 0.02 |
|
| (0.11) |
Income from discontinued operations, net of tax |
|
| — |
|
| — |
|
| — |
|
| 0.45 |
|
| 0.08 |
Basic net income (loss) per share attributable to Brooks Automation, Inc. |
| $ | 0.90 |
| $ | (1.01) |
| $ | 0.21 |
| $ | 0.47 |
| $ | (0.03) |
Diluted net income (loss) per share attributable to Brooks Automation, Inc. common stockholders: |
|
|
|
|
|
|
|
|
|
|
|
|
|
|
|
Income (loss) from continuing operations |
| $ | 0.89 |
| $ | (1.01) |
| $ | 0.21 |
| $ | 0.02 |
| $ | (0.11) |
Income from discontinued operations, net of tax |
|
| — |
|
| — |
|
| — |
|
| 0.44 |
|
| 0.08 |
Diluted net income (loss) per share attributable to Brooks Automation, Inc. |
| $ | 0.89 |
| $ | (1.01) |
| $ | 0.21 |
| $ | 0.46 |
| $ | (0.03) |
Dividend declared per share |
| $ | 0.40 |
| $ | 0.40 |
| $ | 0.40 |
| $ | 0.34 |
| $ | 0.32 |
|
|
|
|
|
|
|
|
|
|
|
|
|
|
|
|
|
| As of September 30, | |||||||||||||
|
| 2017 |
| 2016 |
| 2015 |
| 2014 |
| 2013 | |||||
|
| (In thousands) | |||||||||||||
Cash and cash equivalents and marketable securities |
| $ | 104,292 |
| $ | 91,221 |
| $ | 214,030 |
| $ | 245,456 |
| $ | 173,362 |
Working capital (12), (13) |
|
| 100,941 |
|
| 94,416 |
|
| 89,225 |
|
| 80,027 |
|
| 88,691 |
Total assets |
|
| 766,628 |
|
| 685,905 |
|
| 758,702 |
|
| 777,227 |
|
| 736,765 |
Total capital lease obligation |
|
| — |
|
| — |
|
| — |
|
| 8,298 |
|
| — |
Total equity |
|
| 607,644 |
|
| 553,690 |
|
| 632,045 |
|
| 642,889 |
|
| 632,656 |
|
|
|
|
|
|
|
|
|
|
|
|
|
|
| Year Ended September 30, 2017 | ||||||||||
|
| First |
| Second |
| Third |
| Fourth | ||||
|
| Quarter (2) |
| Quarter |
| Quarter |
| Quarter (1) | ||||
|
| (In thousands, except per share data) | ||||||||||
Revenue |
| $ | 159,955 |
| $ | 169,333 |
| $ | 181,717 |
| $ | 181,880 |
Gross profit |
|
| 56,943 |
|
| 64,524 |
|
| 71,572 |
|
| 74,365 |
Operating income |
|
| 13,161 |
|
| 14,801 |
|
| 18,770 |
|
| 17,381 |
Net income |
|
| 13,871 |
|
| 14,005 |
|
| 17,350 |
|
| 17,386 |
Basic net income per share |
|
| 0.20 |
|
| 0.20 |
|
| 0.25 |
|
| 0.25 |
Diluted net income per share |
|
| 0.20 |
|
| 0.20 |
|
| 0.25 |
|
| 0.25 |
26
|
|
|
|
|
|
|
|
|
|
|
|
|
|
| Year Ended September 30, 2016 | ||||||||||
|
| First |
| Second |
| Third |
| Fourth | ||||
|
| Quarter (3) |
| Quarter (4) |
| Quarter |
| Quarter | ||||
|
| (In thousands, except per share data) | ||||||||||
Revenue |
| $ | 119,955 |
| $ | 135,281 |
| $ | 147,534 |
| $ | 157,553 |
Gross profit |
|
| 40,554 |
|
| 46,800 |
|
| 54,163 |
|
| 56,565 |
Operating (loss) income |
|
| (8,320) |
|
| (6,339) |
|
| 8,494 |
|
| 10,404 |
Net (loss) income |
|
| (4,648) |
|
| (83,939) |
|
| 8,564 |
|
| 10,547 |
Basic net (loss) income per share |
|
| (0.07) |
|
| (1.22) |
|
| 0.12 |
|
| 0.15 |
Diluted net (loss) income per share |
|
| (0.07) |
|
| (1.22) |
|
| 0.12 |
|
| 0.15 |
(1) | On July 5, 2017, we acquired substantially all of the assets and liabilities of Pacific Bio-Material Management, Inc., or PBMMI, and Novare, LLC, or Novare, a wholly owned subsidiary of PBMMI. The results of PBMMI have been included in our results of operations from the date of acquisition. Please refer to Note 3, “Acquisitions” to our Consolidated Financial Statements included under "Item 8. Financial Statements and Supplementary Data" of this Form 10‑K for additional information regarding this transaction. |
(2) | On November 28, 2016, we acquired Cool Lab, LLC, or Cool Lab. The results of Cool Lab have been included in our results of operations from the date of acquisition. Please refer to Note 3, “Acquisitions” to our Consolidated Financial Statements included under "Item 8. Financial Statements and Supplementary Data" of this Form 10 K for additional information regarding this transaction. |
(3) | On November 30, 2015, we acquired BioStorage Technologies, Inc., or BioStorage. The results of BioStorage have been included in our results of operations from the date of acquisition. Please refer to Note 3, “Acquisitions” to our Consolidated Financial Statements included under "Item 8. Financial Statements and Supplementary Data" of this Form 10‑K for additional information regarding this transaction. |
(4) | Operating income (loss) and net income (loss) includes a charge of $79.3 million related to establishing an additional valuation allowance against our U.S. net deferred tax assets. Please refer to Note 10, “Income Taxes” to our Consolidated Financial Statements included under "Item 8. Financial Statements and Supplementary Data" of this Form 10‑K for additional information. |
(5) | On August 14, 2015, we acquired Contact Co., Ltd., or Contact. The results of Contact have been included in our results of operations from the date of acquisition. Please refer to Note 3, “Acquisitions” to our Consolidated Financial Statements included under "Item 8. Financial Statements and Supplementary Data" of this Form 10‑K for additional information regarding this transaction. |
(6) | On October 1, 2014, we acquired FluidX Ltd., or FluidX. The results of FluidX have been included in our results of operations from the date of acquisition. Please refer to Note 3, “Acquisitions” to our Consolidated Financial Statements included under "Item 8. Financial Statements and Supplementary Data" of this Form 10‑K for additional information regarding this transaction. |
(7) | On April 30, 2014, we acquired Dynamic Micro Systems Semiconductor Equipment GmbH, or DMS. The results of DMS have been included in our results of operations from the date of acquisition. |
(8) | In March 2014, we entered into an agreement to sell the Granville-Phillips Gas Analysis & Vacuum Measurement, or Granville-Phillips, business unit for $87.0 million in cash. In the second quarter of fiscal year 2014, we determined that the Granville-Phillips business met the criteria of being reported as a discontinued operation. As a result, the selected financial data presented for periods prior to the second quarter of fiscal year 2014 has been revised to present the operating results of the Granville-Phillips business as a discontinued operation. |
(9) | On May 30, 2014, we completed the sale of the Granville-Phillips business. We realized a pre-tax gain of $56.8 million and an after-tax gain of $26.9 million in connection with the sale. The tax charge of $29.9 million on the gain is substantially non-cash as it was offset by our net operating losses in the United States. |
27
(10) | We acquired certain assets and assumed certain liabilities of Matrical, Inc.’s life science businesses, collectively referred to as Matrical, in August 2013. The results of Matrical have been included in our results of operations from the date of acquisition. |
(11) | We acquired Crossing Automation Inc., or Crossing, in October 2012. The results of Crossing have been included in our results of operations from the date of acquisition. |
(12) | The calculation of working capital excludes "Cash and cash equivalents", "Marketable securities", "Assets Held for Sale", as well as assets and liabilities identifiable within the Granville-Phillips business reported as “Assets held for sale” and “Liabilities held for sale,” respectively, in the Consolidated Balance Sheets as of September 30, 2013. |
(13) | Working capital amounts were adjusted to reflect the reclassification of current deferred tax assets and liabilities to non-current in accordance with Accounting Standard Update 2015-17, Income Taxes (Topic 740): Balance Sheet Classification of Deferred Taxes, issued by the Financial Accounting Standards Board. We reclassified $16.4 million, $18.2 million and $16.8 million, respectively, of net deferred tax assets from current to non-current at September 30, 2015, September 30, 2014, and September 30, 2013. |
Item 7. Management’s Discussion and Analysis of Financial Condition and Results of Operations
The Management’s Discussion and Analysis of Financial Condition and Results of Operations, or MD&A, describes principal factors affecting the results of our operations, financial condition and liquidity, as well as our critical accounting policies and estimates that require significant judgment and thus have the most significant potential impact on our Consolidated Financial Statements. Our MD&A is organized as follows:
· | Overview. This section provides a general description of our business and operating segments, as well as a brief discussion and overall analysis of our business and financial performance, including key developments affecting the Company during fiscal years ended September 30, 2017, 2016 and 2015. |
Critical Accounting Policies and Estimates. This section discusses accounting policies and estimates that require us to exercise subjective or complex judgments in their application. We believe these accounting policies and estimates are important to understanding the assumptions and judgments incorporated in our reported financial results.
· | Results of Operations. This section provides an analysis of our financial results for the fiscal year ended September 30, 2017 compared to the fiscal year ended September 30, 2016 and for the fiscal year ended September 30, 2016 compared to the fiscal year ended September 30, 2015. |
· | Liquidity and Capital Resources. This section provides an analysis of our liquidity and changes in cash flows, as well as a discussion of available borrowings and contractual commitments. |
You should read the MD&A in conjunction with our Consolidated Financial Statements and related notes beginning on page 54. In addition to historical information, the MD&A contains forward-looking statements that involve risks and uncertainties. You should read “Information Related to Forward-Looking Statements” included above in this Form 10‑K and "Item 1A. Risk Factors" for a discussion of important factors that could cause our actual results to differ materially from our expectations.
OVERVIEW
General
We are a leading global provider of automation and cryogenic solutions for multiple applications and markets. We primarily serve the semiconductor capital equipment market and sample management market for life sciences. Our leadership position and global support structure in each of these markets served bymakes us a valued business partner to the largest semiconductor capital equipment and device makers, as well as pharmaceutical and life science research institutions in the world. Our offerings are also includesapplied to industrial capital equipment and other adjacent technology markets.
28
In the semiconductor capital equipment market, equipment productivity and availability are critical factors for our customers, who typically operate equipment under demanding temperature and/or pressure environments. Our automation and cryogenics capabilities are demonstrated in our various robotic automation and cryogenic vacuum pump offerings, both of which are used by semiconductor manufacturers in the processing of silicon wafers into integrated circuits. Although the demand for semiconductors and semiconductor manufacturing equipment is cyclical resulting in periodic expansions and contractions of this market, we expect the semiconductor equipment market will continue to be a key end market forremain one of our products, andprincipal markets as we continue to makemaking investments to maintain and grow our semiconductor product and service offerings. A majority of our research and development spending advances our current product lines and drives innovations for new product offerings. We invest in research and development initiatives within the Brooks Semiconductor Solutions Group segment to maintain continued leadership position in the markets we serve. We have recently launched our newest Vacuum Automation platform, MagnaTran LEAP™, for the rapidly emerging advanced technologies related to manufacturing 10 nanometer semiconductor chips. MagnaTran LEAP is well positioned to deliver clean, accurate and fast wafer transport for the fast growing Deposition and Etch market segments. In addition, we have made a number of acquisitions to support and expand our technology and product offerings for the semiconductor market. In August 2015, we acquired DMS Dynamic Micro Systems Semiconductor Equipment GmbH,Contact Co., Ltd., or DMS, in April 2014Contact, for approximately $31.6 million. DMS$6.8 million, net of cash acquired. Contact is a German basedJapanese-based provider of automated cleaner products for wafer carrier devices used in the global semiconductor markets. This acquisition broadened our contamination control solutions product portfolio and added complementary technology capabilities to our contamination control solutions business unit.
In the life sciences sample management market, we utilize our core competencies and capabilities in automation and cryogenics to provide comprehensive bio-sample management solutions to a broad range of end markets within the life sciences industry. Our offerings include automated ultra-cold storage freezers, consumable sample storage containers, instruments which assist in the workflow of sample management, and both on-site and off-site full sample management services. We expect the life sciences sample management market to remain one of our principal markets for front opening unified pod, or FOUP, carriersour product and reticle storage,service offerings and provide favorable opportunities for improving yieldthe growth of semiconductor processes at semiconductor fabrication plants. our overall business. Over the past several years, we have acquired and developed essential capabilities required to strategically address the sample management needs across multiple end markets within the life sciences industry.
In October 2012,November of 2015, we acquired Crossing Automation Inc., or Crossing,BioStorage Technologies, a U.S. based provider of automation solutionsfull-service outsourcing sample management business, for the global semiconductor front-end markets. Thea total purchase price was $59.0 million.of $125.2 million, net of cash acquired. The acquisition of these businesses providesprovided us with the opportunitycapability to enhancesupport customers with an integrated, comprehensive set of sample management products, services and solutions. In July 2017, we acquired substantially all of the assets and liabilities of Pacific Bio-Material Management, Inc., or PBMMI, and Novare, LLC, or Novare, for a total purchase price of $34.3 million, net of cash acquired. PBMMI and Novare provide storage, transportation, management, and cold chain logistics of biological materials. The acquisition is expected to expand our existing capabilities with respect to manufacturingsample management and integrated cold chain storage and transportation solutions. We acquired FluidX Ltd., a consumable sample tube and bench-top instruments business, in October 2014 and Cool Lab, LLC, a subsidiary of atmosphericBioCision, LLC, which provides a range of cryogenic product solutions that assist in managing the temperature stability of therapeutics, biological samples and vacuum automation solutions withinrelated biomaterials in ultra-cold environments, in November 2016. We held an equity interest in BioCision prior to the semiconductor front-end market.
In fiscal year 2014,2017, we launched BioStudies, a bioinformatics sample intelligence software platform that enables customers to manage their global samples. In August 2017, we acquired certain assets and liabilities related to FreezerPro® web-based software platform from RURO, Inc. for a total purchase price of $5.5 million. RURO, Inc. provides sample management software across multiple end markets, including academic research, government, pharmaceutical, biotech, and healthcare. We expect the acquisition of FreezerPro to complement our BioStudies offerings and extend our informatics solutions to address laboratories, biobanks or enterprises that manage biological samples. Subsequent to September 30, 2017, we acquired all of the outstanding capital stock of 4titude Limited, a U.K.-
29
based manufacturer of scientific consumables for biological sample materials used in a variety of genomic and DNA analytical applications. We made a total cash payment of $65.5 million, net of cash acquired, subject to working capital adjustments. The acquisition is expected to expand our existing offerings of consumables and instruments within the Brooks Life Science Systems segment began shippingsegment.
Since entering the life sciences industry, we have also strengthened and broadened our Twinbank platformproduct portfolio and market reach by investing in internal product development. During fiscal years 2017, 2016 and 2015, more than 23% of automated systems for compoundour cumulative research and biological sample storage. In addition,development spending was focused on innovating and advancing solutions in the last eighteen monthslife sciences sample management market. Prior to fiscal year 2015, we completed twoinstalled our first system from the TwinBank platform, an automated sample management system developed internally, with a modular architecture designed for high reliability and maximum flexibility. In fiscal year 2016, we commercialized the internally developed Biostore III Cryo, an automated system which incorporates sample retrieval, archiving, monitoring, tracking, inventory control, and related enterprise systems connectivity with the industry’s leading cryogenic sample storage freezers. In fiscal year 2017, we launched BioStudies, a bioinformatics sample intelligence software platform that enables customers to manage their global samples. We expect to continue investing in research and development and making strategic acquisitions that expandedwith the objective of expanding our offerings in the life sciences sample management market.
Segments
We have two operating and reportable segments consisting of Brooks Semiconductor Solutions Group and Brooks Life Science Systems.Prior to fiscal year 2016, we had three operating and reportable segments that consisted of Brooks Product Solutions, Brooks Global Services and Brooks Life Science Systems. During fiscal year 2016, we reorganized our life science customers. In August 2013 we acquired certain assetsreporting structure into two operating and reportable segments. For additional information on our operating segments and the related restructuring actions, as well as segment revenues and their operating results, please refer to biological sample preparation, managementNote 15, "Restructuring and storage solutions from Matrical, Inc. for $9.3 million. In October 2014, subsequentOther Charges" and Note 18, "Segment and Geographic Information" in the Notes to the reporting periodConsolidated Financial Statements included in Item 8 "Financial Statements and Supplementary Data" of this filing, we announcedForm 10‑K. Our prior period reportable segment information has been reclassified to reflect the acquisition of FluidX Ltd., or FluidX, a UK based provider of biological sample storage tubescurrent segment structure and complementary bench-top instruments for approximately $16.0 million.
The Brooks ProductSemiconductor Solutions Group segment provides a variety of products, services and solutions that enable improved throughput and yield in controlled operating environments. Thoseenvironments, as well as an extensive range of support services. The products include atmospheric and vacuum robots, robotic modules and tool automation systems that provide precision handling and clean wafer environments, as well as cryogenic pumps and compressors that provide vacuum pumping and thermal management solutions used to create and control critical process vacuum applications.
The Brooks Life Science Systems segment provides comprehensive life cycle sample management solutions for life science and bioscience customers to advance scientific research and support drug development. The segment’s product offerings include automated cold sample management systems for compound and biobiological sample storage, equipment for sample preparation and handling, consumables, and partsinformatics that manage samples throughout our customers’ research discovery and development work flows. The segment’s service offerings include sample storage and support services provided to a wide range of life science customers, including pharmaceutical companies, biotechnology companies, biobanks national laboratories, research institutes and research universities.institutes.
Business and Financial Performance
Fiscal Year Ended September 30, 2017 Compared to Fiscal Year Ended September 30, 2016
Results of Operations- We generated revenue of $692.9 million during fiscal year 2017 compared to $560.3 million during fiscal year 2016, an increase of $132.6 million, or 24%. Gross margin was 38.6% for fiscal year 2017 as compared to 35.4% for fiscal year 2016, an increase in gross profit of $69.3 million. Operating expenses were $203.3 million during fiscal year 2017 as compared to $193.8 million during fiscal year 2016, an increase of $9.4 million. Operating income was $64.1 million during fiscal year 2017 as compared to $4.2 million during fiscal year 2016, an
30
increase of $59.9 million, which was primarily attributable to the revenue growth and gross margin improvement, partially offset by higher operating expenses. We generated a net income attributable to Brooks Automation, Inc. of $31.4$62.6 million of which $30.0 million was from discontinued operations, including the gain on sale of the Granville-Phillips business unit. Income from continuing operations was $1.5 million in fiscal year 2014 after a loss of $7.1 million in fiscal year 2013. In addition to the acquisitions activity described above, we intend to continue to implement measures to improve the profitability of our continuing operations. For example, during fiscal year 2014,2017 as compared to a net loss of $(69.5) million during fiscal year 2016. This increase of $132.1 million was primarily attributable to lower income tax provision of $63.7 million which is mostly due to a $79.3 million valuation allowance recorded against U.S. net deferred tax assets during fiscal year 2016, as well as higher operating income of $59.9 million and higher income generated from our equity method investments of $7.0 million during fiscal year 2017. Please refer to "Results of Operations" section below for a detailed discussion of our financial results for the fiscal year 2017 compared to fiscal year 2016.
Cash Flows and Liquidity- Cash and cash equivalents and marketable securities were $104.3 million at September 30, 2017 as compared to $91.2 million at September 30, 2016. The increase in cash and cash equivalents and marketable securities of $13.1 million was primarily attributable to cash inflows of $96.2 million generated from our operating activities, partially offset by cash payments of $44.8 million related to acquisitions, cash outflows of $27.9 million related to dividend payments made to our shareholders during fiscal year 2017, as well as capital expenditure payments of $12.7 million. Please refer to "Liquidity and Capital Resources" section below for a detailed discussion of our liquidity and changes in cash flows for fiscal year 2017 compared to fiscal year 2016.
On October 4, 2017, we discontinued certain product linesentered into a $200.0 million Senior Secured Term Loan Facility, or the term loan with Morgan Stanley Senior Funding, Inc., JPMorgan Chase Bank, N.A. and Wells Fargo Securities, LLC, or the lenders. The term loan was issued at a $2.4 million discount. The net loan proceeds of $197.6 million will be used for general corporate purposes, including acquisitions. On October 5, 2017, we acquired all of the outstanding capital stock of 4titude Limited, a U.K.-based manufacturer of scientific consumables for biological sample materials used in a variety of genomic and DNA analytical applications. We made total cash payment of $65.5 million, net of cash acquired, subject to working capital adjustments. The acquisition is expected to expand our existing offerings of consumables and instruments within the Brooks Life Science Systems segment. For additional information on these transactions, please refer to Note 21, "Subsequent Events" in the Notes to the Consolidated Financial Statements included in Item 8 "Financial Statements and Brooks Product Solutions segments, transitioned manufacturingSupplementary Data" of our linethis Form 10‑K.
Fiscal Year Ended September 30, 2016 Compared to Fiscal Year Ended September 30, 2015
Results of Polycold cryochillersOperations - We generated revenue of $560.3 million during fiscal year 2016 compared to a third party contract manufacturer, consolidated our global footprint and implemented other programs designed$552.7 million during fiscal year 2015, an increase of $7.6 million, or 1.4%. Gross margin was 35.4% for fiscal year 2016 as compared to improve our cost structure. In connection with these initiatives, we recorded34.2% for fiscal year 2015, which resulted in an increase in gross profit of $9.0 million. Operating expenses were $193.8 million during fiscal year 2016 as compared to $172.2 million during fiscal year 2015. This increase of $21.6 million was primarily attributable to the acquisition of BioStorage in November 2015, as well as higher restructuring charges incurred as a result of $6.3actions initiated during fiscal year 2016. Operating income was $4.2 million during fiscal year 2016 compared to $16.9 million during fiscal year 2015. The decrease of $12.7 million was primarily attributable to higher operating expenses incurred during fiscal year 2016, partially offset by higher gross profit generated during fiscal year 2016. We generated a net loss of $(69.5) million for fiscal year 2014,2016 as compared to $6.4a net income $14.2 million for fiscal year 2015. The decrease of restructuring charges recorded$83.7 million is primarily related to an increase of $72.4 million in our income tax provision during fiscal year 2016 driven by a change in a valuation allowance against U.S. net deferred tax assets, as well as a decline in our operating income during fiscal year 2016, as discussed above.
Cash Flows and Liquidity- Cash and cash equivalents and marketable securities were $91.2 million at September 30, 2016 as compared to $214.0 million at September 30, 2015. The decrease of $122.8 million in cash, cash equivalents and marketable securities was primarily attributable to the acquisition of BioStorage for $125.2 million in November 2015. Additional uses of cash in fiscal year 2013. We expect these changes2016 included $27.5 million of cash dividends paid to improve our profitabilityshareholders and $12.8 million paid for the capital expenditures, partially offset by inflows of $39.5 million of net cash provided by operating activities and $2.8 million of proceeds from sale of the building and the underlying land located in future periods.
CRITICAL ACCOUNTING POLICIES AND ESTIMATES
The preparation of the consolidated financial statementsConsolidated Financial Statements requires us to make estimates and judgments that affect the reported amounts of assets, liabilities, revenue and expenses, and related disclosure of contingent assets and
31
liabilities. On an ongoing basis, we evaluate our estimates, including those related to revenue, bad debts, inventories, derivative instruments, intangible assets, goodwill, bad debts, derivative instruments, warranty obligations, inventories, income taxes, warranty obligations, pensions and stock-based compensation. We base our estimates on historical experience and on various other assumptions that are believed to be reasonable under the circumstances, includingcircumstances. We evaluate current and anticipated worldwide economic conditions, both in general and specifically in relation to the semiconductor and life science industries, the results of which form thethat serve as a basis for making judgments about the carrying values of assets and liabilities that are not readily apparentdeterminable based on information from other sources. UsingActual results may differ from these estimates under different estimatesassumptions or conditions that could have a material impact on our financial condition and results of operations.
We believe that the assumptions and estimates associated with the following critical accounting policies incorporateinvolve significant judgment and thus have the most significant potential impact on our more significant judgments and estimates used in the preparation of our consolidated financial statements.
Revenue
We generate revenue is associated withfrom the sale of hardware systems, componentsproducts and spare parts as well as product license revenue. Serviceservices. A description of our revenue recognition policies is associated with service contracts, repairs, upgradesincluded in the Note 2, “Summary of Significant Accounting Policies” in the Notes to the Consolidated Financial Statements included in Item 8 "Financial Statements and field service. ShippingSupplementary Data" of this Form 10‑K.
Although most of our sales agreements contain standard terms and handling fees billed to customers, if any, are recognized as revenue. The related shippingconditions, certain agreements contain multiple elements or non-standard terms and handling costs are recognizedconditions. We exercise judgment in cost of revenue.
We recognize revenue is recognized upon receiving acceptance from the customer.
If our judgment regarding revenue recognition proves incorrect, our revenue in particular periods may be adversely affected and could have certain arrangementsa material impact on our financial condition and results of operations.
Business Combinations
We account for products with significant
32
Significant judgment is used in determining fair values of assets acquired and liabilities assumed, as well as intangibles and their estimated useful lives. Fair value and useful life determinations are based on, among other factors, estimates of future expected cash flows, royalty cost savings and appropriate discount rates used in computing present values. These judgments may materially impact the estimates used in allocating acquisition date fair values to assets acquired and liabilities assumed, as well as our current and future operating results. Actual results may vary from these estimates that may result in adjustments to goodwill and acquisition date fair values of assets and liabilities during a measurement period or upon a final determination of asset and liability fair values, whichever occurs first. Adjustments to fair values of assets and liabilities made after the end of the measurement period are recorded within our operating results.
Changes in the fair value of a contingent consideration resulting from a change in the underlying inputs are recognized in results of operations until the undelivered elementarrangement is delivered and all other criteria for revenue recognition have been met.
Intangible Assets, Goodwill and Other Long-Lived Assets
We have identified intangible assets and generated significant goodwill as a result of our acquisitions, we have identified intangible assets other than goodwill and generated significant goodwill.acquisitions. Intangible assets other than goodwill are valued based on estimates ofestimated future cash flows and amortized over their estimated useful life.lives. Goodwill is subject to annualtested for impairment testing as well as testing uponannually or more often if impairment indicators are present, at the occurrence of any event that indicates a potential impairment.reporting unit level. Intangible assets other than goodwill and other long-lived assets are subject to impairment testing if events and circumstances indicate that the carrying amount of an impairment test if there is an indicatorasset or a group of impairment. We conduct our annualassets may not be recoverable.
The goodwill impairment test as of our fiscal year end, or September 30th. Management's judgments are based on market and operational conditionsis performed at the time of the evaluation and can include management's best estimate of future business activity, which in turn drives estimates of future cash flows from these assets and the reporting units with associated goodwill. These periodic evaluations could cause management to conclude that impairment factors exist, requiring an adjustment of these assets to their then-current fair market value. Future business conditions and/or activity could differ materially from the projections made by management causing the need for additional adjustments and impairment charges.
Prior to fiscal year 2016, we had three operating and reportable segments that have goodwill, including two components that are partconsisted of our Brooks Product Solutions, operating segment and sole reporting units that are our Brooks Global Services and Brooks Life Science Systems operating segments.
We perform our annual goodwill impairment assessment on April 1st of each fiscal year. During fiscal year 2017, we adopted on a prospective basis the Accounting Standard Update 2017-04, Intangibles- Goodwill and Other (Topic 350): Simplifying the Test for Goodwill Impairment. The adoption of the guidance did not have an impact on our financial position or results of operations during fiscal year 2017. In accordance with provisions of the guidance, we initially assess qualitative factors to determine whether the existence of events or circumstances indicates that it is more likely than not that the fair value of a reporting unit is less than its respective carrying amount, including goodwill.value. If we determine, based on this assessment, that it is more likely than not that the fair value of the reporting unit exceedsis less than its carrying amount,value, we perform a quantitative goodwill ofimpairment test by comparing the reporting unitunit’s fair value with its carrying value. An impairment loss is not considered impaired. Ifrecognized for the amount by which the reporting unit’s carrying amountvalue exceeds theits fair value, up to the second step of the goodwill impairment test must be completed to measure thetotal amount of goodwill allocated to the reporting unit. No impairment loss if any. The second step compares the implied fair value of goodwill with the carrying value of goodwill. The implied fair value is determined by allocatingrecognized if the fair value of the reporting unit to all of the assets and liabilities of that unit, and the excess of the fair value over amounts assigned toexceeds its assets and liabilities is the implied fair value of goodwill. The implied fair value of goodwill determined in this step is compared to the carrying value of goodwill. If the implied fair value of goodwill is less than the carrying value of goodwill, an impairment loss is recognized equal to the difference.
We determine the fair valuevalues of our reporting units usingbased on an Income Approach, specificallyincome approach in accordance with the Discounted Cash Flow Method,discounted cash flow method, or DCF Method. The DCF Method includesis based on projected future cash flow projections, which areflows and terminal value estimates discounted to their present values. Terminal value and an estimate of terminal values, which are also discounted to present value. Terminal values represent therepresents a present value an investor would pay todayon the valuation date for the rights to the cash flows of the business for the years subsequent to the discrete cash flow projection period. We consider the DCF Method to be the most appropriate valuation indicator as the DCF analyses aretechnique since it is based on management’s long-term financial projections. GivenDue to the dynamiccyclical nature of the cyclical semiconductor equipment market, management’s
33
projections as of the valuation date are considered more objective since other market metrics forof peer companies fluctuate overduring the cycle. However,In addition, we also compare aggregate values of our net corporate assets and reporting unit fair values to our overall market capitalization and use certain market-based valuation techniques to test the reasonableness of the reporting
We completed the terminalannual goodwill impairment test for our five reporting units as of April 1, 2017 and determined that no adjustment to goodwill was necessary since the fair value of each reporting unit usingwas significantly in excess of the Gordon growth method. The Gordon growth method assumescarrying value of each reporting unit. We conducted a qualitative assessment for three reporting units within the Brooks Semiconductor Solutions Group segment and determined that it was not likely that their fair values were less than their carrying values. As a result of the analysis, we did not perform the quantitative assessment for these reporting units and did not recognize impairment losses. We also performed the quantitative goodwill impairment test for the fourth reporting unit within the Brooks Semiconductor Solutions Group segment and for the Brooks Life Science Systems reporting unit. We determined that no adjustment to goodwill was necessary for these two reporting units since their fair values significantly exceeded their respective carrying values. We evaluate a reporting unit’s goodwill for impairment between annual tests if events occur or circumstances change that would more likely than not reduce the fair value of such reporting unit below its carrying value.
Application of the goodwill impairment test requires judgment based on market and operational conditions at the time of the evaluation, including management’s best estimates of the reporting unit will growunit’s future business activity and generate freethe related estimates and assumptions of future cash flow at a constant rate. We believeflows from the assets that include the Gordonassociated goodwill. Different assumptions of forecasted sales volumes, product costs, future cash flows, risk-adjusted weighted average cost of capital discount rate, as well as long-term growth method israte projections used in the most appropriate method for determiningDCF model could results in different estimates of the terminalreporting unit’s fair value because the terminal value was calculated at the point in which we have assumed that our reporting units have reached stable growth rates.
We are required to test long-lived assets, other than goodwill, for impairment when impairment indicators of impairment are present. For purposes of this test, long-lived assets are grouped with other assets and liabilities at the lowest level for which identifiable cash flows are largely independent of the cash flows of other assets and liabilities. WhenIf we determine that indicators of potential impairment exist,are present, we assess the next step of the impairment test requires that the potentially impaired long-lived asset group is tested for recoverability. The test for recoverability compares the undiscounted future cash flows of the long-lived asset group by comparing its undiscounted future cash flows to its carrying value. If the carrying valuesvalue of the long-lived asset group exceed theexceeds its future cash flows, the assets are potentially impaired. The next step in the impairment process is towe determine the fair valuevalues of the individual net assets within the long-lived asset group.group to assess potential impairment. If the aggregate fair values of the individual net assets of the group are less than thetheir carrying values, an impairment chargeloss is recorded equal to therecognized for an amount in excess of the group’s aggregate carrying value of the group over the aggregateits fair value. The loss is allocated to each assetthe assets within the group based on their relative carrying values, with no asset reduced below its fair value.
Accounts Receivable
Trade accounts receivable do not bear interest and are recorded at the invoiced amount. Trade accounts receivables do not bear interest. We maintain an allowance for doubtful accounts representing our best estimate of the amount of probable credit losses inrelated to our existing accounts receivable.receivable and their net realizable value. We adjust our estimates of the receivables’ recoverability based on financial conditions of our customers. If the financial resultsconditions of our customers deteriorate reducing their ability to make payments, additional allowances would be required, resulting inwe increase the allowance for doubtful accounts and record a corresponding charge to operations. We do not have any off-balance-sheet credit exposure related to our customers.
Derivative Financial Instruments
We record all derivative instruments as assets or liabilities at their fair value which is determined by estimatingbased on the instruments’ estimated future cash flows of the instrument.flows. Subsequent changes in a derivative’s fair value are recognized in income, unless specific hedge accounting criteria are met. Changes in the fair value of a derivative that is highly effective and designated as a cash flow hedge are recognized in accumulated other comprehensive income until the forecasted transaction occurs or it becomes probable that the forecasted transaction will not occur. We perform an assessment at the inception of the hedge
34
and on a quarterly basis thereafter,during each subsequent reporting period to determine whether our derivatives are highly effective in offsetting changes in the valuevalues of the hedged items. Any changes in the fair value of a derivative resulting from hedge ineffectiveness are immediately recognized as income or expense.
Warranty
We providerecord a provision for the estimated costcosts of product warranties at the time revenue is recognized. While we engage in extensive product quality programs and processes, including actively monitoring and evaluating the quality of our component suppliers, our warranty obligation isobligations are affected by product failure rates, material usage and service delivery costs incurred in correcting a product failure. ShouldWe adjust our warranty obligations based on actual product failure rates, material usage or service delivery costs, differ from our estimates,which may result in revisions to the estimated warranty liability would be requiredliabilities and may result in additional benefits or charges to operations.
We adjust the reserves for obsolete or unmarketable inventory and record additional inventory write downs based on unfavorable changes in estimated customer demand diminish further or actual market conditions are less favorable than those projected bythat may differ from management additional inventory write-downs may be required.
Deferred Income Taxes
We record a valuation allowance to reduce our deferred tax assets to the amount that is more likely than not towill be realized. We consider recent historical income, estimated future taxable income, carry-forward periods of tax attributes, the volatility of the semiconductor industry and ongoing tax planning strategies in assessing the need for the valuation allowance. We maintain a valuation allowance against certainour U.S. net deferred tax assets in the U.S. and in certain foreign jurisdictions. During fiscal year 2016, we recorded an additional valuation allowance of $79.3 million against our U.S. net deferred tax assets. We will continue toevaluate the realizability of our deferred tax assets by tax-paying component and assess the need for a valuation allowance on an annual and quarterly basis. We evaluate the profitability of each tax-paying component on a historic cumulative basis and on a forward looking basis in the course of performing this analysis. We evaluated all positive and negative evidence and concluded it was appropriate to establish a full valuation allowance against U.S. net deferred tax assets during fiscal year 2016.
We will continue to maintain a full valuation allowance on its U.S. deferred tax assets until there is sufficient positive evidence outweighing the negative evidence to support the reversal of all or some portion of these allowances. We have reached a point of cumulative profitability in the U.S. on a pre-tax income basis which is a starting point of positive evidence. However, as noted in Note 21, “Subsequent Events” in the Notes to the Consolidated Financial Statements included in Item 8 "Financial Statements and Supplementary Data" of this Form 10‑K, we entered into a term loan agreement to fund future periods. If future operating resultsgrowth opportunities. We have determined that the level of historical U.S. core earnings would not be sufficient to offset the interest costs of the new debt. We also continue to generate a significant portion of revenue from the semiconductor industry and are subject to unpredictable swings in the business cycle. This is carefully considered by us and considered to be negative evidence in evaluating the U.S. or these foreign jurisdictions deviate from long-term expectations, it is reasonably possibledeferred tax assets. After evaluating all the relevant positive and negative evidence mentioned above, we have concluded that there could be a change inwe will maintain the valuation allowance inagainst U.S. net deferred tax assets as of the future. A change in the valuation allowance, in whole or in part, would result in a non-cash income tax expense or benefit during the periodend of change.fiscal year 2017.
35
Pension Plans
We sponsor defined benefit pension plans in Switzerland and Taiwan. The costcosts and obligations of these arrangements are calculated using manybased on certain assumptions related to estimate theestimated benefits that the employee earnsemployees earn while working, the amount of which cannot be completely determined until the benefit payments cease. MajorKey assumptions used in the accounting for these employee benefit plans include the discount rate, expected return on plan assets and rate of increase in employee compensation levels. Assumptions are determined based on companyCompany data and appropriate market indicators in consultation with third-party actuaries, and are evaluated each year as of the plans’ measurement date. ShouldA change in any of our assumptions change, they would have an effect on net periodic pension costs and the unfunded benefit obligation.
Stock-Based Compensation
We measure stock-based compensation cost for all employee stock awards at fair value on the grant date of grant and recognize compensationthe expense over the service period for the awards expected to vest. The fair value of restricted stock units is determined based on the number of shares granted and the closing price of our common stock quoted on NASDAQ on the date of grant, and the fair value of stock options is determined using the Black-Scholes valuation model. Such fair values are recognized asgrant.
We recognize stock-based compensation expense over the service period,on a straight-line basis, net of estimated forfeitures. The estimationforfeitures, over the requisite service period. We recognize benefits from stock-based compensation in equity using the with-and-without approach for the utilization of tax attributes. We make estimates of stock award forfeitures and a number of awards that will ultimatelyexpected to vest which requires significant judgment. We consider many factors when estimating expected forfeitures,in developing forfeiture estimates, including award types, of awards, employee class,classes and historical experience. In addition, for stock-based awards where vesting is dependent upon achieving certain operating performance goals, we estimateWe assess the likelihood of achieving the performance goals for stock-based awards that vest upon the satisfaction of these goals. ActualOur current estimates may differ from actual results and future changes in estimates, may differ fromestimates.
Recently Issued Accounting Pronouncements
For a summary of recently issued accounting pronouncements applicable to our current estimates.
RESULTS OF OPERATIONS
Fiscal Year Ended September 30, 20142017 Compared to Fiscal Year Ended September 30, 2013
Revenue
We reported revenue of $482.8$692.9 million for fiscal year 2014,2017 compared to $422.4$560.3 million in the previousfor fiscal year 2016, an increase of 14%$132.6 million, or 24%. All three of our segments contributed toWe reported revenue growth in both the increase in revenue. Revenue from Brooks ProductSemiconductor Solutions Group segment and Brooks Global Services increased $35.1 million and $5.4 million, respectively, and benefited from stronger demand from the semiconductor capital equipment market. Brooks Life Science Systems’Systems segment. The impact of changes in foreign currency exchange rates adversely affected revenue increased $19.9by approximately $3.4 million primarilyduring fiscal year 2017 compared to fiscal year 2016 as a result of increased demandstrengthening of the U.S. dollar relative to other currencies in which we conduct our business.
Our Brooks Semiconductor Solutions Group segment reported revenue of $544.2 million for fiscal year 2017 compared to $452.2 million for fiscal year 2016. The increase of $92.0 million, or 20%, reflects increases in revenues from contamination control systems, cryogenic pump products, and robotic automation products, partially offset by a decline in revenues from services and related spare parts. These increases include the favorable impact of changes in foreign currency exchange rates of $0.7 million during fiscal year 2017.
The robotic automation products revenue has historically included revenue from patent royalties and sales of third party atmospheric robots under a distribution agreement in North America. During fiscal year 2016, these revenue streams stopped, driving a decline of $8.7 million attributable to the expiration of certain patents and $13.0 million from exiting the atmospheric robot distribution arrangement. Royalty income generated from the expired patents was $8.7 million and $11.6 million, respectively, in fiscal years 2016 and 2015. Product revenue from the atmospheric robot
36
distribution arrangement was $13.0 million and $18.4 million, respectively, in fiscal years 2016 and 2015. There was no royalty income and no revenue from the atmospheric robot distribution arrangement generated during fiscal year 2017.
Our Brooks Life Science Systems segment reported revenue of $148.7 million for fiscal year 2017 compared to $108.1 million for fiscal year 2016. The increase of $40.6 million, or 38%, was primarily driven by organic growth of $25.3 million, or 23%. The organic growth was primarily attributable to sample storage services, automated cold storage systems.systems, including the BioStore III Cryo, and consumables and instruments. Acquisitions completed in the last twelve months contributed $5.5accounted for $15.3 million of revenue. the increase compared to fiscal year 2016, which consisted of $8.2 million from two additional months of revenue from BioStorage acquired on November 30, 2015, $3.7 million from the acquisition of Cool Labs, and $3.4 million from the acquisition of PBMMI. Revenue was adversely affected by foreign currency exchange rates which reduced revenue by $4.1 million during the fiscal year 2017 as compared to fiscal 2016.
We will continue to seek opportunities to expand our market share in the semiconductor and adjacent technology markets served by our Brooks ProductSemiconductor Solutions and Brooks Global Services segments. However, theseGroup segment. These markets are cyclical, and demandoften fluctuate significantly from quarter to quarter. Demand for theour Brooks Semiconductor Solution Group products and services offered will beis affected by these cycles. We anticipate continued growth in revenue from our Brooks Life Science Systems segment through our internally developedinternally-developed products and services including our Twinbank platform for automated systems, and through acquisitionour acquired businesses.
Revenue generated outside the United States amounted to $452.3 million, or 65% of total revenue, for fiscal year 2017 compared to $352.0 million, or 63% of total revenue, for fiscal year 2016.
Gross Margin
We reported gross margins of 38.6% for fiscal year 2017 compared to 35.4% for fiscal year 2016. Gross margin increased in the Brooks Semiconductor Solutions Group segment and Brooks Life Science Systems segment by 3.9 percentage points and 0.7 percentage points, respectively. Cost of revenue for fiscal year 2017 included $3.9 million of charges for amortization related to completed technology as compared to $4.2 million incurred during fiscal year 2016. Additionally, cost of revenue for fiscal year 2017 also included $0.5 million of charges related to the sale of inventory obtained in acquisitions to which a step-up in value was applied in purchase accounting, compared to $0.6 million for fiscal year 2016.
Our Brooks Semiconductor Solutions Group segment reported gross margins of 39.1% for fiscal year 2017 compared to 35.2% for fiscal year 2016. Product margins increased 2.8 percentage points driven by improved operating leverage from higher revenue and the outcome of product cost optimization efforts. Service margins increased 8.1 percentage points driven by lower material costs for pump and robot repair, as well as cost savings from the restructuring actions that resulted in reduced repair operations costs and increased field service productivity. Please refer to the "Restructuring Charges" section below for further information on the restructuring actions. These benefits were partially offset by the impact of lower revenues on the repair center fixed cost base. The change in mix of revenue between products and services was favorable to this segment’s margins by 0.3 percentage points. Cost of revenue during fiscal year 2017 included $2.5 million of amortization related to completed technology compared to $2.7 million during fiscal year 2016. During fiscal years 2017 and 2016, cost of revenue included $0.1 million and $0.6 million, respectively, of charges related to the sale of inventories obtained in acquisitions to which a step-up in value was applied in purchase accounting.
Our Brooks Life Science Systems segment reported gross margins of 36.8% for fiscal year 2017 compared to 36.1% for fiscal year 2016. The increase was driven by improved cost management on large stores projects, volume leverage driven by organic revenue growth, favorable contributions from recent acquisitions and savings from the recent restructuring actions, partially offset by increased expenses supporting the transition to in-sourcing of manufacturing from a contract provider to our Manchester location and expenses related to the consolidation of our Cool Labs operations. Please refer to the "Restructuring Charges" section below for further information on these restructuring actions. Cost of revenue during fiscal year 2017 included $1.4 million of amortization related to completed technology as compared to $1.5 million incurred during fiscal year 2016. Additionally, cost of revenue for fiscal year 2017 included $0.4 million of charges related to the sale of inventory obtained in acquisitions to which a step-up in value was applied in purchase accounting. There were no such charges incurred during fiscal year 2016.
37
Research and Development
Research and development expenses were $47.0 million in fiscal year 2017 compared to $51.5 million in fiscal year 2016. The decrease of $4.5 million reflects expense reductions of $2.8 million within the Brooks Semiconductor Solutions Group segment and $1.7 million within the Brooks Life Sciences System segment. Lower research and development expenses during fiscal year 2017 as compared to fiscal year 2016 were primarily attributable to the full year realization of savings from restructuring actions initiated prior to fiscal year 2017 and the progression of certain projects from the development stage to market which resulted in lower project spending. Please refer to the "Restructuring Charges" section below for further information on the restructuring actions initiated prior to fiscal year 2017.
Selling, General and Administrative
Selling, general and administrative expenses were $153.1 million in fiscal year 2017 compared to $130.3 million in fiscal year 2016. The increase of $22.8 million was primarily attributable to: (i) higher employee-related costs of $5.6 million primarily driven by increased incentive bonuses and commissions, as well as higher costs from hiring additional personnel to support the growth of our business, partially offset by savings from restructuring actions initiated in fiscal years 2017 and 2016, (ii) higher stock-based compensation expense of $5.3 million related mostly to changes in estimates to the expected payout related to the achievement of performance goals against previously established targets that expand our addressable markets, including our recentwill be measured at the end of the awards' vesting period, as well as award forfeitures recognized as expense reductions during fiscal year 2016 for employees that were terminated as a result of the restructuring actions initiated during the period, (iii) $4.9 million higher merger-related costs, which amounted to $8.3 million and $3.4 million, respectively, during fiscal years 2017 and 2016 and included costs related to merger, acquisition and divesture assessments as well as costs to execute such transaction, (iv) higher amortization expense of $2.4 million, which related primarily to customer relationship intangibles and amounted to $13.2 million and $10.8 million, respectively, during fiscal years 2017 and 2016, (v) higher outside service costs of $2.4 million and (vi) expenses of $1.4 million as a result of the acquisition of FluidX.PBMMI in the fourth quarter of fiscal year 2017 and two incremental months of expenses included in fiscal year 2017 compared to fiscal year 2016 from the acquisition of BioStorage, which was acquired on November 30, 2015. These increases were partially offset by lower depreciation expense of $3.4 million for information technology systems. Please refer to the "Restructuring Charges" section below for further information on the restructuring actions initiated prior to fiscal year 2017.
Restructuring Charges
We recorded restructuring charges of $3.2 million during fiscal year 2017 as compared to $12.0 million during fiscal year 2016.
Restructuring Charges Incurred During Fiscal Year Ended September 30, 2017
Restructuring charges of $3.2 million incurred during fiscal year 2017 were related to severance costs and consisted of $1.8 million related to restructuring actions initiated during fiscal year 2017 and $1.4 million related to restructuring actions initiated in prior periods.
Restructuring Charges Related to Actions Initiated During Fiscal Year Ended September 30, 2017
We incurred restructuring charges of $1.8 million related to restructuring actions initiated during fiscal year 2017. Such actions were primarily related to streamlining field service operations in our Brooks Semiconductor Solutions Group segment and resulted in severance costs of $1.6 million during the current fiscal year. This action has been completed as of September 30, 2017 and is expected to result in approximately $1.9 million in cost of revenue reductions. We began realizing a portion of these cost savings during fiscal year 2017 which amounted to approximately $0.8 million. No additional costs related to this action are expected to be incurred in future periods. Accrued restructuring costs related to this action were $0.5 million at September 30, 2017 and are expected to be paid within the next twelve months from cash flows generated from operating activities.
38
Restructuring Charges Related to Actions Initiated Prior to Fiscal Year Ended September 30, 2017
We incurred restructuring charges of $1.4 million related to actions initiated prior to fiscal year 2017. Such charges consisted of: (i) $0.8 million related to the consolidation of the Jena, Germany repair facility into the Chelmsford, Massachusetts repair operation, (ii) $0.3 million attributable to the company-wide restructuring action, (iii) $0.2 million attributable to restructuring initiatives within the Brooks Life Science Systems segment which included several actions initiated prior to fiscal year 2017, as described below, as well as (iv) $0.2 million related to the integration of the Contact manufacturing, engineering, and sales operations into our existing Contamination Control business. Please refer to “Restructuring Charges Incurred During Fiscal Year Ended September 30, 2016” section below for further information on these actions.
Restructuring action related to consolidating Jena repair facility into our Chelmsford, Massachusetts repair operation was initiated to streamline the service repair operations and reduce the overhead cost structure within our Brooks Semiconductor Solutions Group segment. Total severance costs incurred in connection with this action were $2.6 million, of which $1.8 million were recognized prior to fiscal year 2017 and $0.8 million were recognized during fiscal year 2017. This restructuring action was substantially completed as of September 30, 2017. We began realizing cost savings for this action starting with the second quarter of fiscal year 2017. Such costs savings amounted to $0.8 million during the fiscal year 2017 and when fully realized are expected to result in approximately $1.7 million in annual pre-tax cost savings consisting of $1.4 million of cost of revenue reductions and $0.2 million of selling, general and administrative expense reductions. Accrued restructuring costs related to this action were $1.0 million at September 30, 2017 and are expected to be paid within the next twelve months from cash flows generated from operating activities.
The company-wide restructuring action was initiated to streamline business operations and improve competitiveness and overall profitability. This action was initiated during fiscal year 2016 and resulted in the reduction of several positions across the company, including senior management positions. We incurred severance costs of $0.3 million and $5.8 million, respectively, during fiscal years 2017 and 2016. We realized a full year of savings during fiscal year 2017 which amounted to $13.1 million, and $5.1 million of savings during fiscal year 2016. Savings realized during fiscal year 2017 consisted of $4.3 million of cost of revenue reductions, $2.6 million of research and development expense reductions, and $6.2 million of selling, general and administrative expense reductions. This action has been completed as of September 30, 2017. There were no accrued restructuring costs related to this action as of September 30, 2017.
Restructuring Charges Incurred During Fiscal Year Ended September 30, 2016
Restructuring charges of $12.0 million incurred during fiscal year 2016 were related to severance costs which consisted of $10.8 million related to restructuring actions initiated during fiscal year 2016 and $1.3 million related to restructuring actions initiated in prior periods.
Restructuring Actions Initiated During Fiscal Year Ended September 30, 2016
Restructuring actions initiated during fiscal year 2016 resulted in $10.8 million of costs incurred during fiscal year 2016 which were comprised primarily of: (i) $3.1 million of costs attributable to the Brooks Life Science Systems segment, (ii) $1.8 million of costs attributable to the restructuring action within the Brooks Semiconductor Solutions Group segment to consolidate our Jena, Germany repair facility into our Chelmsford, Massachusetts repair operation, as described above, and (iii) $5.8 million of costs related to the company-wide restructuring action initiated during fiscal year 2016, as described above.
Restructuring initiatives within the Brooks Life Science Systems segment are primarily related to streamlining the segment’s management structure, integrating acquisitions and improving profitability. During fiscal year 2016, we initiated several actions within the Brooks Life Science Systems segment including integrating BioStorage, streamlining management structure, closing the segment’s Spokane, Washington facility in March 2016 and selling buildings associated with our Oberdiessbach, Switzerland facility in July 2016. The restructuring initiative within the Brooks Life Science Systems segment included additional actions completed during the first quarter of fiscal year 2017 which resulted in restructuring charges of $0.2 million during fiscal year 2017. These actions were finalized by the end of the first quarter of fiscal year 2017 and are not expected to result in additional restructuring charges in future periods. Total
39
severance costs incurred in connection with these actions during fiscal year 2016 were $3.1 million. These actions are expected to result in approximately $3.8 million in annual pre-tax cost savings, including $1.0 million of cost of revenue reductions and $2.9 million of selling, general and administrative expense reductions. Total cost savings realized as a result of these restructuring initiatives amounted to $5.1 million, of which $1.3 million were realized prior to fiscal year 2017 and $3.8 million were realized during fiscal year 2017. The savings from these actions took full effect in fiscal year 2017.
Restructuring Actions Initiated Prior to Fiscal Year Ended September 30, 2016
Restructuring actions initiated prior to fiscal year 2016 resulted in $1.2 million of costs attributable to the Brooks Semiconductor Solutions segment and less than $0.1 million of costs attributable to the Brooks Life Science Systems segment. These restructuring actions were primarily related to the integration of Contact, the closure and transfer of the Mistelgau, Germany manufacturing operations to a contract manufacturer, as well as reductions in workforce in order to improve our cost structure and profitability.
Non-Operating (Expenses) Income
Gain on Settlement of Equity Method Investment- During fiscal year 2017, we recognized a gain of $1.8 million on the settlement of the equity method investment in BioCision which was included as a part of the non-cash consideration for an acquisition of Cool Lab. For additional information on this transaction, please refer to Note 3, "Acquisitions", and Note 7, "Equity Method and Other Investments" in the Notes to the Consolidated Financial Statements included in Item 8 "Financial Statements and Supplementary Data" of this Form 10‑K.
Other Loss, net-we recorded other loss, net of $0.6 million in each of the fiscal years 2017 and 2016. We recognized higher foreign currency exchange losses of $0.4 million during fiscal year 2017 as compared to the prior fiscal year, partially offset by a gain on pension settlement of $0.3 million recognized during fiscal year 2017. Additionally, we recognized higher losses of $0.2 million during fiscal year 2017 as compared to fiscal year 2016 related to fair value measurement of convertible debt securities in BioCision. For additional information on this transaction, please refer to Note 3, "Acquisitions", and Note 7, "Equity Method and Other Investments" in the Notes to the Consolidated Financial Statements included in Item 8 "Financial Statements and Supplementary Data" of this Form 10‑K.
Income Tax Provision
We recorded an income tax provision of $12.1 million in fiscal year 2017 compared to $75.8 million in fiscal year 2016. The income tax provision of $12.1 million during fiscal year 2017 was driven primarily by foreign income, partially offset by $1.1 million of tax benefits related to the reduction of reserves for unrecognized tax benefits resulting from the expiration of statutes of limitations. We recorded an income tax provision of $75.8 million in fiscal year 2016 which was primarily driven by the change in a valuation allowance against U.S. net deferred tax assets recognized during fiscal year 2016 year resulting in an additional provision of $79.3 million. Partially offsetting the valuation allowance provision were benefits related to pre-tax losses in the U.S., the reinstatement of the U.S. research and development tax credit retroactive to January 1, 2015, and reductions of reserves for unrecognized tax benefits resulting from the expiration of the statutes of limitations. For additional discussion of the calculation of our tax liabilities, please refer to Note 10 "Income Taxes" to our Consolidated Financial Statements included under "Item 8. Financial Statements and Supplementary Data" of this Form 10‑K.
Equity in Earnings of Equity Method Investments
We recorded income from our equity method investments of $9.4 million in fiscal year 2017 compared to $2.4 million in fiscal year 2016. The increase of $7.0 million was primarily attributable to an increase of $6.4 million in income from ULVAC Cryogenics, Inc., or UCI, generated during fiscal year 2017 as compared to the prior fiscal year.
We also incurred losses of $0.5 million from our investment in BioCision during fiscal year 2017 compared to losses of $1.1 million during fiscal year 2016. Our investment in BioCision was settled during the first quarter of fiscal year 2017 as a part of the non-cash consideration for the acquisition of Cool Lab on November 28, 2016. Prior to closing the equity investment, we traditionally recorded the income and losses related to the equity method investment in
40
BioCision one quarter in arrears. During fiscal year 2017, we recorded two additional months of activity in the carrying value of the investment as a result of its settlement. We deemed the amount of $0.2 million related to two additional months of activity to be insignificant. For additional information on this transaction, please refer to Note 3, "Acquisitions" and Note 7, "Equity Method and Other Investments" to our Consolidated Financial Statements included under "Item 8. Financial Statements and Supplementary Data" of this Form 10‑K.
Fiscal Year Ended September 30, 2016 Compared to Fiscal Year Ended September 30, 2015
Revenue
We reported revenue of $560.3 million for fiscal year 2016 compared to $552.7 million for fiscal year 2015, an increase of $7.6 million, or 1%. We reported revenue growth in the Brooks Life Science Systems segment and lower revenue in the Brooks Semiconductor Solutions Group segment. The impact of changes in foreign currency exchange rates adversely affected revenue by $4.4 million during fiscal year 2016 compared to fiscal year 2015 as a result of strengthening of the U.S. dollar relative to other currencies in which we conduct our business.
Our Brooks ProductSemiconductor Solutions Group segment reported revenue of $325.6$452.2 million for fiscal year 2014, an increase of 12% from $290.5 million in the prior fiscal year. These increases were mostly attributable2016 compared to increased demand from the semiconductor capital equipment market. Revenue from the acquisition of DMS contributed $5.5 million to the increase.
Additional robotic automation revenue decline of approximately $3.0 million during fiscal year 2016 was attributable to the expiration of certain patents that we license to third parties in exchange for agreed upon royalties. Royalty income was $8.7 million in fiscal year 2016 compared to $11.6 million in fiscal year 2015. In addition, we exited a distribution arrangement for atmospheric robots during the priorfourth quarter of fiscal year. The increase was primarily due to increased demand from semiconductor capital equipment end-users.
Our Brooks Life Science Systems segment reported revenue of $63.1$108.1 million for fiscal year 2014, an2016 compared to $68.1 million for fiscal year 2015. The increase of 46% from $43.3$40.0 million in the prior fiscal year. Revenue growth was supporteddriven primarily by the launch and accelerating sales of the first internally developed Twinbank platform for automated cold storage systems. The acquisition of Matrical provided $6.0 million and $1.0BioStorage, which contributed $44.6 million of revenue from automated cold storage systems, instrumentation and consumables in fiscal years 2014 and 2013, respectively. Many of the opportunities for Matrical automated cold storage systems were transitioned to the Twinbank platform that we launched in fiscal year 2014.
Revenue generated outside the United States was $308.5amounted to $352.0 million, or 64% of total revenue, and $244.7 million, or 58%63% of total revenue, for fiscal years 2014 and 2013, respectively.
Gross Margin
We reported gross margins of 35.4% for fiscal year 2016 compared to 31.3%34.2% for the prior fiscal year.year 2015. The increase was drivenattributable to a 10.1 percentage point improvement in the gross margin of the Brooks Life Science Systems segment, partially offset by leverage on increased volumea 0.2 percentage point decline in all three segments, favorable mix in ourthe gross margin of the Brooks ProductSemiconductor Solutions segment and executionGroup segment. Cost of operational initiativesrevenue for fiscal year 2016 included $4.2 million of charges for amortization related to material and warranty cost reduction. Gross margin incompleted technology as compared to $5.2 million incurred during fiscal year 20142015. Additionally, cost of revenue for fiscal year 2016 also included $3.0$0.6 million of charges related to the step-upsale of inventory balancesobtained in acquisitions to which a step-up in value was applied in purchase accounting, impairment of intangible assets and restructuring charges compared with $5.0to $1.5 million of such charges infor fiscal year 2013. These charges reduced2015.
Our Brooks Semiconductor Solutions Group segment reported a gross profit margin byof 35.2% for fiscal year 2016 compared to 35.4% for fiscal year 2015. Product margins increased 0.6 percentage points induring fiscal year 2014 and 1.2 percentage points in fiscal year 2013.
41
to 0.5 percentage points in$3.6 million during fiscal year 2013.
Our gross margin percentage for our Brooks Life Science Systems segment increased to 37.1%reported a gross margin of 36.1% for fiscal year 2014 as2016 compared to 32.7% in the prior26.0% for fiscal year.year 2015. The increase was driven by leverage on increased volume, a reduction in inventory step-up charges associated with acquisitions and a reduction in impairment charges relatedgross margins is primarily attributable to completed technology intangible assets. The segment operating leverage drove significant benefits with revenue growth of 46% compared to fiscal year 2013. The operational improvements in the segment were partially offset by one $3.6 million project, recognized in the third quarter of fiscal 2013, that made a minimal contribution to gross margin. Gross profit margin in fiscal year 2014 benefited from $2.0 million of lower costs related to the step-up of inventory balances in purchase accounting, impairment of intangible assets and restructuring charges.
Research and facility costsDevelopment
Research and development expenses were $51.5 million in fiscal year 2016 compared to $52.2 million in fiscal year 2015. The decrease of $0.7 million reflects an expense reduction of $3.6 million within the Brooks Life Sciences System segment, partially offset by higher expenses of $2.9 million incurred within Brooks Semiconductor Solutions Group segment. The reduction of expenses within the Brooks Life Sciences System segment is primarily attributable to cost savings initiatives undertaken over the last twelve months.
Selling, General and Administrative
Selling, general and administrative expenses were $130.3 million in fiscal year 2016 compared to $115.3 million in fiscal year 2015. Acquisitions made since the beginning of fiscal year 2014, after2015 drove an increase of $10.4 million in selling, general and administrative expense and $3.1 million in amortization expense as compared to fiscal year 2015. Merger costs increased to $3.4 million during fiscal year 2016, as compared to $0.8 million in fiscal year 2015 primarily as a strategic partner informed usresult of their intentthe acquisition of BioStorage. Additional increases in selling, general and administrative expense included higher professional service fees of $1.5 million as compared to secure additional funding through an investment program designed to support early-stage
Amortization expense for fiscal year 2016 was related primarily to customer relationship intangibles and the subordination, we determined it was probable that we would not recover all amounts due from the loan and recorded an impairment charge. We determined the fair value of the loan by considering the fair value of the collateral using certain valuation techniques, principally, the discounted cash flow method, and the subordinationamounted to the new lender. As a result, the fair value of the loan, which we currently estimate$10.8 million compared to be $1.0$7.7 million could be different under different conditions or different assumptions, including the varying assumptions regarding future cash flows of the partner or discount rates.
Restructuring and Other Charges
We recorded restructuring charges of $6.3$12.0 million forduring fiscal year 2014. These2016 as compared to $4.7 million during fiscal year 2015. The increase of $7.3 million was primarily attributable to higher costs incurred as a result of the restructuring actions initiated during fiscal year 2016, partially offset by lower facility-related costs of $1.2 million.
Restructuring Charges Incurred During Fiscal Year Ended September 30, 2016
Restructuring charges relateof $12.0 million incurred during fiscal year 2016 were related to severance costs which consisted of $10.8 million of charges related to restructuring actions initiated during fiscal year 2016 and $1.3 million related to restructuring actions initiated in prior periods.
42
Restructuring Actions Initiated During Fiscal Year Ended September 30, 2016
Restructuring actions initiated during fiscal year 2016 resulted in $10.8 million of costs incurred during fiscal year 2016 which were comprised primarily of $3.1 million of costs attributable to our decision to discontinue certain product lines in the Brooks Life Science Systems segment, $1.8 million of costs attributable to the Brooks Semiconductor Solutions Group segment and $5.8 million of costs related to the company-wide restructuring action initiated during fiscal year 2016.
During fiscal year 2016, we initiated a restructuring action to streamline business operations as part of a company-wide initiative to improve profitability and competitiveness, as described above. Severance costs incurred in connection with this action were $5.8 million during fiscal year 2016.
Restructuring initiatives within the Brooks ProductLife Science Systems segment are primarily related to streamlining the segment’s management structure, integrating acquisitions and improving profitability. During fiscal year 2016, we initiated several actions within the Brooks Life Science Systems segment including integrating BioStorage, streamlining management structure, closing the segment’s Spokane, Washington facility in March 2016 and selling the buildings associated with our Oberdiessbach, Switzerland facility in July 2016. This restructuring initiative within the Brooks Life Science Systems segment included additional actions completed during the first quarter of fiscal year 2017 which were finalized by the end of the first quarter of fiscal year 2017 and are not expected to result in additional restructuring charges in future periods. Total severance costs incurred in connection with these actions during fiscal year 2016 were $3.1 million.
During fiscal year 2016, we initiated a restructuring action within the Brooks Semiconductor Solutions segments,Group segment to consolidate our Jena, Germany repair facility into our Chelmsford, Massachusetts repair operation as a part of our strategy to reduce our global footprint and streamline our cost structure, as described above. Severance costs incurred in connection with this action were $1.8 million during fiscal year 2016.
Restructuring Actions Initiated Prior to Fiscal Year Ended September 30, 2016
Restructuring actions initiated prior to fiscal year 2016 resulted in $1.2 million of costs attributable to the Brooks Semiconductor Solutions segment and less than $0.1 million of costs attributable to the Brooks Life Science Systems segment. These restructuring actions were primarily related to the integration of Contact, the closure and transfer of the Mistelgau, Germany manufacturing operations to a contract manufacturer, as well as reductions in workforce in order to improve our cost structure and profitability.
Restructuring Charges Incurred During Fiscal Year Ended September 30, 2015
During fiscal year 2015, we incurred restructuring charges of $4.7 million, which included severance costs of $3.4 million and facility-related costs of $1.3 million. Severance costs of $3.4 million consisted of $2.2 million of charges attributable to the Brooks Semiconductor Solutions segment and $1.3 million of costs attributable to the Brooks Life Science Systems segment. Restructuring actions within the Brooks Semiconductor Solutions Group segment were related to the integration of Dynamic Micro Systems Semiconductor Equipment GmbH, or DMS, with our operations and the transition of manufacturing of certain products from our facility in our lineMistelgau, Germany to a third-party contract manufacturer. Restructuring actions within the Brooks Life Science Systems segment were related to the closure of the Poway, California facility and transition of product sub-assembly manufacturing operations to the third-party contract manufacturers. These restructuring plans were substantially completed on December 31, 2015. Liabilities related to restructuring costs from these actions were fully paid as of September 30, 2016. Facility exit costs of $1.3 million attributable to Brooks Semiconductor Solutions Group segment were related to outsourcing manufacturing of certain lines of Polycold cryochillers and compressors within the United States to a third partythird-party contract manufacturer, the consolidation of our global footprintmanufacturer. The facility exit costs represented future lease payments and other programs designed to improve our cost structure.
43
Non-Operating (Expenses) Income
Interest Income
Other (Expenses) Income, net-we enteredrecorded other expenses, net of $0.6 million in March 2014.
Income Tax Benefit
We recorded an income tax benefitprovision of $2.0$75.8 million forin fiscal year 2014.2016 compared to $3.4 million in fiscal year 2015. The income tax benefit isprovision of $75.8 million during fiscal year 2016 was primarily driven by the change in a valuation allowance against U.S. net deferred tax assets recognized during the second quarter of the current fiscal year resulting in an additional provision of $79.3 million. Partially offsetting the valuation allowance provision were benefits related to pre-tax losses in the U.S., the reinstatement of the U.S. research and development tax credit retroactive to January 1, 2015, and reductions of reserves for unrecognized tax benefits resulting from the expiration of the statutes of limitations.
We recorded an income tax provision of $3.4 million in fiscal year 2015 which was driven by U.S. global income generated during the current fiscal year and German pre-tax losses andinterest related to unrecognized tax benefits. The tax provision includes $1.2 million of tax benefits related to reductions in unrecognized tax benefits resulting from the expiration of the statute of limitations in various foreign jurisdictions. These benefits are partially offset by foreign income taxesjurisdictions and interest related to unrecognized tax benefits.
For additional discussion of limitations in certain foreign jurisdictions. The U.S.the calculation of our tax benefit includes $0.9 millionliabilities, please refer to Note 10 "Income Taxes" to our Consolidated Financial Statements included under "Item 8. Financial Statements and Supplementary Data" of U.S. tax credits from fiscal year 2012 that were recognized in fiscal year 2013. These credits were reinstated under The American Taxpayer Relief Act of 2012 that was signed into law on January 2, 2013.
Equity in Earnings of Equity Method Investments
We recorded income of income$2.4 million from our equity method investments was $1.2in fiscal year 2016 as compared to a loss of $0.2 million in fiscal year 2014 compared with $2.42015. The increase was primarily attributable to $2.0 million of higher income generated from our investment in ULC. Additionally, we incurred losses of $0.6 million in fiscal year 2013. The decrease is driven primarily from lower income2015 from our 50% interest in ULVAC Cryogenics, Inc., a joint venture with ULVAC Corporation of Japan, which contributed $1.6 million of income in fiscal year 2014 as compared to $2.6 million for fiscal year 2013. The remaining decrease in income from our equity method investments is attributable to higher losses generated by our 50% interestinvestment in Yaskawa Brooks Automation, Inc., aor YBA, that was liquidated during the fourth quarter of fiscal year 2015.
During the first quarter of fiscal year 2015, we agreed in principle with Yaskawa to dissolve the YBA joint venture. The venture came to closure in March 2015 and was liquidated during the fourth quarter of fiscal year 2015. In connection with the dissolution, YBA assessed the recoverability of assets held by the joint venture with Yaskawa Electric Corporationand notified its equity partners of Japan andthe asset impairment. As a result, we recorded an impairment charge of $0.7 million in fiscal year 2015 to write down the carrying value of our proportionalequity investment in YBA to its fair value. The impairment charge was included in our proportionate share of losses generated by BioCision LLC, a privately-held company based in Larkspur, California, in which we made an equity investment in March 2014.
LIQUIDITY AND CAPITAL RESOURCES
A considerable portion of our revenue is dependent on the demand for semiconductor capital equipment. Demand for this equipment which historically has historically experienced periodic downturns. We believe that we have adequate resources to fund our currently planned working capital and capital expenditure requirements for the next twelve months. The cyclical nature of our served markets and uncertainty within the current global economic environment makesmake it difficult for us to predict longer-term
44
liquidity requirements with sufficient certainty. We may be unable to obtain any required additional financing on terms favorable to us, if at all. If adequate funds are not available to us on acceptable terms or otherwise, we may be unable to successfully develop or enhance products and services, respond to competitive pressure or take advantage of acquisition opportunities, any of which could have a material adverse effect on our business.
Our cash, cash equivalents and marketable securities were $104.3 million as of September 30, 2017. Our cash balances are held in numerous locations throughout the world, with substantial majority of those amounts located outside of the United States. As of September 30, 2017, we had cash and cash equivalents of $101.6 million, of which $77.0 million was held outside of the United States. If these funds are needed for the U.S. operations, we would be required to accrue tax liabilities to repatriate these funds. However, given the amount of our net operating loss carryovers in the United States, such repatriation will most likely not result in U.S. cash tax payments within the next twelve months. Our intent is to permanently reinvest these funds outside of the U.S. and our current operating plans do not demonstrate a need to repatriate these funds for our U.S. operations. We believe that our current cash balance, access to the revolving line of credit, as well as to debt and capital markets along with cash flows from operations will satisfy working capital, financing activities, and capital expenditure requirements for the next twelve months. We had marketable securities of $2.7 million and $6.1 million, respectively, as of September 30, 2017 and September 30, 2016. The decrease of $3.5 million was primarily attributable to the sale of marketable securities to finance the acquisitions completed during fiscal year 2017. For additional information on these transactions, please refer to Note 3, "Acquisitions" to our Consolidated Financial Statements included under "Item 8. Financial Statements and Supplementary Data" of this Form 10‑K.
As of September 30, 2017, we had approximately $45.1 million available for borrowing under the line of credit. There were no amounts outstanding pursuant to the line of credit as of September 30, 2017 and 2016. The amount of funds available for borrowing under the line of credit arrangement may fluctuate each period based on our borrowing base availability.
On October 4, 2017, we entered into the $200.0 million term loan with the lenders. The term loan was issued at $197.6 million, or 98.8% of its par value, resulting in a discount of $2.4 million, or 1.2%, which represented loan origination fees paid at the closing. The loan proceeds will be used for general corporate purposes, including acquisitions. Coincident with the entry into the term loan agreement, we amended certain terms and conditions of the line of credit agreement and entered into an arrangement with Wells Fargo Bank, N.A. and JPMorgan Chase Bank, N.A. Please refer to the “Capital Resources” section below for further information on the term loan and amended credit agreement terms.
Overview of Cash Flows and Liquidity
Our cash, cash equivalents and marketable securities as of September 30, 20142017 and 20132016 consist of the following (in thousands):
|
|
|
|
|
|
|
|
|
| September 30, 2017 |
| September 30, 2016 |
| ||
Cash and cash equivalents |
| $ | 101,622 |
| $ | 85,086 |
|
Short-term marketable securities |
|
| 28 |
|
| 39 |
|
Long-term marketable securities |
|
| 2,642 |
|
| 6,096 |
|
|
| $ | 104,292 |
| $ | 91,221 |
|
| September 30, | |||||||
| 2014 | 2013 | ||||||
| Cash and cash equivalents | $ | 94,114 | $ | 82,971 | |||
| Short-term marketable securities | 68,130 | 45,900 | |||||
| Long-term marketable securities | 83,212 | 44,491 | |||||
| $ | 245,456 | $ | 173,362 | ||||
Fiscal Year Ended September 30, 2017 Compared to cash without an adverse impact.
Overview
Cash and cash equivalents and marketable securities were $94.1$104.3 million at September 30, 2014, an increase of $11.12017 as compared to $91.2 million fromat September 30, 2013.2016. The increase in cash and cash equivalents and marketable securities of $13.1 million was primarily dueattributable to $85.4cash inflows of $96.2 million generated from our operating activities, partially offset by cash payments of $44.8 million related to acquisitions, cash outflows of $27.9 million related to dividend payments made to our shareholders during fiscal year 2017, as well as capital expenditure payments of $12.7 million.
45
Operating Activities
Cash flows from operating activities can fluctuate significantly from period to period as earnings, working capital needs and the timing of payments for income taxes, restructuring activities and other charges impact reported cash flows.
Cash flows provided by operating activities were $96.2 million during fiscal year 2017 as compared to $39.5 million during fiscal year 2016. The increase of $56.7 million in cash flows from operating activities was primarily attributable to the following factors:
· | During fiscal years 2017 and 2016, we generated net income (loss) of $62.6 million and $(69.5) million, respectively, including the impact of non-cash related charges of $34.3 million and $108.8 million, respectively, which amounted to $96.9 million and $39.3 million, respectively, after such impact. The non-cash charges are listed in the Consolidated Statements of Cash Flows and consist primarily of depreciation and amortization, stock-based compensation, undistributed earnings of equity method investments, deferred tax provision, as well as a gain on settlement of equity method investments. Please refer to the "Results of Operations" section above for a detailed discussion of our operating results during fiscal year 2017 as compared to fiscal year 2016. The increase in net income of $132.1 million is driven by a lower income tax provision of $63.7 million due to the change in a valuation allowance against U.S. net deferred tax assets recognized during fiscal year 2016, higher operating income of $59.9 million, higher income generated from our equity method investments of $7.0 million, as well as a gain of $1.8 million recognized on the settlement of the equity method investment in BioCision included as a part of the non-cash consideration for an acquisition of Cool Lab. For additional information on this transaction, please refer to Note 3, "Acquisitions" and Note 7, "Equity Method and Other Investments" to our Consolidated Financial Statements included under "Item 8. Financial Statements and Supplementary Data" of this Form 10 K. |
· | The amount of cash flows generated from or used by the aggregate of trade accounts receivable, inventories and trade accounts payable depends upon how effectively we manage our working capital and can be significantly impacted by the timing of customer billings, cash collections and vendor payments made during the period, as well as the sales volume driven by customer demand. Our trade accounts receivable, inventories and trade accounts payable used $16.1 million in operating cash flows during fiscal year 2017 as compared to a source of cash of $1.6 million during fiscal year 2016. The difference of $17.8 million was primarily attributable to an increase in inventory balances which resulted in a use of cash of $12.8 million during fiscal year 2017 compared to a source of cash of $8.6 million during fiscal year 2016. The increase in inventory during fiscal year 2017 was primarily related to supporting increased customer demand for the Brooks Semiconductor Solutions Group segment and the Brooks Life Science Systems segment products during the current fiscal year, as well as strategic investments to support operational and product development initiatives. Accounts receivable also resulted in a use of cash of $11.2 million during fiscal year 2017 compared to a use of cash of $1.8 million during fiscal year 2016. The increase in accounts receivable during fiscal year 2017 was primarily attributable to the higher revenue. The use of cash associated with increased accounts receivable and inventory balances in fiscal year 2017 was partially offset by a source of cash of $7.8 million related to an increase in accounts payable as compared to a use of cash of $5.1 million during fiscal year 2016. The increase in accounts payable is primarily attributable to an increase in inventory levels to support increased volumes and the timing of vendor payments. |
· | The timing of payments for prepaid expenses and other assets collectively with accrued expenses and other liabilities provided $7.4 million in operating cash flows during fiscal year 2017 as compared to $1.9 million during fiscal year 2016. The favorable impact of $5.5 million was primarily attributable to the timing of payments for income taxes for vested restricted stock units made during fiscal year 2016, as well as costs and other operating expenses that provided $20.6 million in cash inflows from operating activities. Such cash inflows were partially offset by cash payments of $8.1 million for restructuring liabilities related to restructuring actions initiated during fiscal years 2017 and 2016, as well as the timing of costs incurred on the percentage of completion type contracts. Accrued restructuring liabilities of $1.5 million at September 30, 2017 from these actions are expected to be paid within the next twelve months from cash flows generated from operating activities. These restructuring plans are expected to result in approximately $14.8 million of reduced annual cash spending. Please refer to Note 15, “Restructuring Charges” to our Consolidated Financial |
46
Statements included under "Item 8. Financial Statements and Supplementary Data" of this Form 10 K, as well as "Results of Operations- Restructuring Charges" section above for further information on these actions. |
· | Deferred revenue provided $8.0 million in operating cash flows during fiscal year 2017 as compared to $3.3 million used during fiscal year 2016. The source of cash was primarily attributable to billings and cash collections in advance of revenue recognized within our Brooks Life Science Systems segment. The use of cash during fiscal year 2016 was primarily related to the timing of milestone billings and the amount of revenue recognized on percentage of completion type contracts. |
Investing Activities
Cash flows from investing activities consist primarily of cash used for acquisitions, capital expenditures and purchases of marketable securities, as well as cash proceeds generated from sales and maturities of marketable securities.
Cash used in investing activities was $54.2 million during fiscal year 2017 as compared to $10.9 million during fiscal year 2016. Cash used in investing activities of $54.2 million during fiscal year 2017 included primarily cash payments of $44.8 million for the acquisitions completed during fiscal year 2017 and $12.7 million of net proceeds received from the sale of divested businesses and $53.8 million of cash flow from operations.capital expenditures. These sourcesuses of cash were partially offset by $62.2$3.6 million ofrelated to net purchases proceeds from sales and maturities of marketable securities $35.6 millionduring fiscal year 2017. Cash used in investing activities of $10.9 million in fiscal year 2016 included primarily $125.2 million for the acquisition of BioStorage, $12.8 million of capital expenditures and disbursement of $1.8 million for a loan provided to BioCision. These uses of cash were partially offset by $126.5 million related to net proceeds from sales and maturities of marketable securities that were used primarily for the acquisition of BioStorage. For additional information on the acquisitions made in fiscal years 2017 and $22.92016, please refer to Note 3, "Acquisitions" to our Consolidated Financial Statements included under "Item 8. Financial Statements and Supplementary Data" of this Form 10‑K.
Financing Activities
Cash used in financing activities was $25.9 million during fiscal year 2017 as compared to $26.0 million during fiscal year 2016. Cash used in financing activities included primarily cash dividend payments of $27.9 million and $27.5 million, respectively, made during fiscal years 2017 and 2016, as well as proceeds from common stock issuance of $2.0 million generated during each fiscal year.
Fiscal Year Ended September 30, 2016 Compared to Fiscal Year Ended September 30, 2015
Overview
Cash and cash equivalents and marketable securities were $85.1 million and $6.1 million, respectively, at September 30, 2016 as compared to $80.7 million and $133.3 million, respectively, at September 30, 2015. The aggregate decrease of $122.8 million in cash, cash equivalents and marketable securities was primarily attributable to the acquisition of BioStorage for $125.2 million. Additional uses of cash included $27.5 million of cash dividends paid to our shareholders. Our cashshareholders and cash equivalents$12.8 million paid for the capital expenditures, partially offset by inflows of $83.0 million at September 30, 2013 increased $28.3 million compared with cash and cash equivalents at September 30, 2012. In fiscal year 2013, the increase in cash and cash equivalents was due primarily to $54.4$39.5 million of cash flow from operations, $53.3 million of net sales of marketable securities and $14.1 million of proceeds from the sale of real estate offset, in part, by $68.3 million used for acquisitions and $21.3 million of cash dividends paid to our shareholders.
Operating Activities
Cash flows from operating activities were $39.5 million for non-cash related charges and $14.1 million of net working capital improvements. Non-cash related charges in fiscal year 2014 consisted of $23.52016 as compared to $43.7 million of depreciation and amortization and $10.9 million of stock-based compensation offset by $27.4 million related to gains from the sale of divested businesses.for fiscal year 2015. The decrease of $4.2 million in working capital is primarily due to a $12.1 million decrease in accounts receivable and a $9.6 million decrease in inventory. In fiscal year 2013, cash provided byflows from operating activities was composed primarily attributable to the following factors:
·During fiscal years 2016 and 2015, we generated net loss (income) of $69.5 million and $14.2 million, respectively, including the impact of net-cash related charges of $108.8 million and $38.6 million, respectively, which amounted to $39.3 million and $52.8 million, respectively. The non-cash related charges are listed in the Consolidated Statements of Cash Flows and consist primarily of a deferred tax provision, depreciation and amortization, as well as stock-based compensation expense. The decrease of $83.7 million in net income is |
47
primarily related to an increase of $72.4 million in our income tax provision during fiscal year 2016 driven by a change in a valuation allowance against U.S. net deferred tax assets, as well as a decline in our operating income. Please refer to the "Results of Operations" section above for a detailed discussion of our fiscal year 2016 operating results as compared to fiscal year 2015. |
·The aggregate of trade accounts receivable, inventories and trade accounts payable provided $1.6 million in operating cash flows in fiscal year 2016 as compared to $2.7 million used in fiscal year 2015. The amount of cash flow generated from or used by the aggregate of trade accounts receivable, inventories and trade accounts payable depends upon how effectively we manage our working capital and can be significantly impacted by the timing of customer billings, cash collections and vendor payments made during the period. Lower inventory levels during fiscal year 2016 compared to 2015 provided a favorable impact of $14.5 million on our cash flows from operating activities, partially offset by a decrease in accounts payable that resulted in an unfavorable impact of $13.5 million. We maintained lower level of finished goods inventory in fiscal year 2016 due to our focused efforts on improving working capital efficiencies while providing sufficient inventory balance to support current and future sales. A decrease in accounts payable during fiscal year 2016 compared to 2015 was primarily attributable to lower level of inventory purchases, as well as a timing of payments to our suppliers. Additionally, our cash flow from operating activities benefited by $3.3 million due to the favorable impact of the timing of product shipments and the associated billings during the last quarter of each fiscal year, as well as customer cash collections. |
·The timing of payments for aggregate of prepaid expenses and other assets collectively with accrued expenses and other liabilities provided $1.9 million in operating cash flows during fiscal year 2016 as compared to $0.4 million in fiscal year 2015. The increase of $1.5 million was primarily attributable to timing of cash payments for restructuring liabilities that provided a favorable impact of $5.1 million, partially offset by a negative impact of $3.7 million related to the timing of bonus and pension benefit payments. |
·The timing of customer billings and the associated changes in deferred revenue which used $3.3 million in operating cash flows in fiscal year 2016 as compared to $6.8 million in fiscal year 2015. The favorable impact of $3.5 million on our cash flows from operating activities was primarily attributable to the timing of milestone billings and the amount of revenue recognized on percentage of completion type contracts. |
Investing Activities
Cash used in investing activities was $17.8$10.9 million forin fiscal year 2014, and2016 as compared to $17.6 million in fiscal year 2015. Cash used in investing activities in fiscal year 2016 included $62.2primarily $125.2 million of net purchases of marketable securities, $35.6 million used for the acquisition of DMS and our investment in BioCision, LLC and $5.5BioStorage, $12.8 million of capital expenditures and disbursement of $1.8 million for a loan provided to BioCision. These uses of cash were partially offset in part, by $85.4$126.5 million ofrelated to net proceeds from sales and maturities of marketable securities that were used primarily for the saleacquisition of divested businesses. In fiscal year 2013, weBioStorage. Cash used $7.1 million of cash in investing activities which consistedwas $17.6 million in fiscal year 2015 and included primarily $14.5 million for the acquisition of $68.3 million used for acquisitionsFluidX, Contact and $3.6certain assets and liabilities of YBA, $16.1 million of capital expenditures, including the purchase of the building and the related land in Chelmsford, Massachusetts for $8.4 million, as well as $5.5 million paid for certain cost method investments and BioCision convertible debt securities. These uses of cash were partially offset in part, by $53.3$16.7 million of net sales of marketable securities and $14.1 million ofrelated to net proceeds from sales and maturities of marketable securities. For additional information on the saleacquisitions made in fiscal years 2016 and 2015, please refer to Note 3, "Acquisitions" to our Consolidated Financial Statements included under "Item 8. Financial Statements and Supplementary Data" of certain real estatethis Form 10‑K.
Capital expenditures are made primarily for increasing capacity, replacing equipment, supporting new product development and improving information technology infrastructure. Capital expenditures were $12.8 million during fiscal year 2016 compared to $16.1 million during fiscal year 2015. The decrease of $3.3 million was primarily attributable to the purchase of the building and the related land for $8.4 million during fiscal year 2015, partially offset by increased capital expenditures of $4.2 million due to the acquisition of BioStorage and investment in the United States and Switzerland.its capital infrastructure.
48
Financing Activities
Cash used in financing activities was $24.5$26.0 million forin fiscal year 20142016 compared with $19.5to $34.0 million forin fiscal year 2013. In fiscal year 2014, we used $22.9 million for the quarterly cash dividends we paid to our shareholders and an additional $3.2 million to acquire the outstanding interest of our majority-owned subsidiary in Korea.2015. Cash used in financing activities forincluded $27.5 million and $27.0 million, respectively, of cash dividend payments made during fiscal years 2016 and 2015, as well as $8.8 million of debt repayment assumed in connection with the Contact acquisition during fiscal year 2013 consisted2015.
Capital Resources
Line of $21.3Credit Facility
On May 26, 2016, we and certain of our subsidiaries entered into a credit agreement with Wells Fargo Bank, N.A., or Wells Fargo. The credit agreement provides for a five-year senior secured revolving line of credit, or line of credit, of $75.0 million. Availability under the line of credit is subject to a borrowing base which is redetermined from time to time based on specific advance rates on eligible assets. Such availability is limited to the lesser of (a) the amount committed by the lenders under the credit agreement, or (b) the amount determined based on the borrowing base limited to a certain percentage of certain eligible U.S. assets, including accounts receivable, inventory, real property, as well as machinery and equipment. If at any time the aggregate amounts outstanding under the credit agreement exceed the borrowing base then in effect, we are required to make a prepayment of an amount sufficient to eliminate such excess. The agreement includes sublimits of up to $25.0 million for letters of credit and $7.5 million of swing loans at the time there is more than one lender under the credit agreement. Availability under the borrowing base may be affected by events beyond our control, such as collection cycles, advance rates and general economic conditions. These and other events could require us to seek waivers or amendments of covenants or alternative sources of financing or to reduce expenditures. We can provide no assurance that such waivers, amendments or alternative financing sources could be obtained or, if obtained, would be on terms acceptable to us. The proceeds from the credit agreement are available for permitted acquisitions and general corporate purposes. The line of credit expires on May 26, 2021 with all outstanding principal and interest due and payable on such date or an earlier date if declared due and payable on such earlier date pursuant to the terms of the credit agreement (by acceleration or otherwise). Subject to certain conditions of the credit agreement, net cash proceeds from sales of certain collateral during the term of the arrangement are required to be used to prepay borrowings under the line of credit. We may also voluntarily prepay certain amounts under the line of credit without penalty or premium.
As of September 30, 2017, we had approximately $45.1 million available for borrowing under the line of credit. There were no amounts outstanding pursuant to the line of credit as of September 30, 2017 and September 30, 2016. The amount of funds available for borrowing under the line of credit arrangement may fluctuate each period based on our borrowing base availability, as described above.
Borrowings under the line of credit bear an annual interest rate equal to, at our option, the base rate or the LIBOR rate plus, in each case, an applicable margin determined based on our liquidity as of the first day of each fiscal quarter. LIBOR rate is reset at the beginning of each selected interest period based on the rate then in effect. The base rate is a fluctuating interest rate equal to the highest of (i) the federal funds rate plus 0.50%, (ii) the one month LIBOR rate plus 1.00% and (iii) the prime lending rate announced by Wells Fargo. During fiscal year 2016, we incurred $0.7 million in deferred financing costs which included commitments fees and other costs directly associated with obtaining line of credit financing. In addition to interest on any outstanding borrowings under the credit agreement, we are required to pay monthly fees of 0.25% per year related to unused portion of the revolver commitment amounts. The amount of such fees incurred during fiscal years 2017 and 2016 was insignificant. All outstanding borrowings under the credit agreement are guaranteed by us along with certain U.S. subsidiaries and secured by a first priority perfected security interest in substantially all of our and guarantor’s assets in the U.S., subject to certain exceptions. Additionally, we granted Wells Fargo a mortgage lien on certain company-owned real properties.
The line of credit contains certain customary representations and warranties, a financial covenant, affirmative and negative covenants, as well as events of default. In the event our liquidity is less than the greater of (i) 12.5% of the commitments under the line of credit, and (ii) $9.4 million, and continuing until the time such liquidity during a 60‑consecutive day period has been equal to or greater than the greater of (a) 12.5% of the commitments under the line of credit, and (b) $9.4 million, we are required to maintain a fixed charge coverage ratio of at least 1.0 to 1.0 measured
49
as of the last day of each fiscal month ending during such period. Liquidity is defined as a sum of (a) excess availability under the credit agreement; and (b) unrestricted cash and cash equivalents located in bank accounts in the United States that are subject to a control agreement in favor of Wells Fargo, limited to a maximum amount of 50% of liquidity. Negative covenants limit our ability to incur additional indebtedness, liens, sell assets, consolidate or merge with or into other entities, pay non-cash dividends, (and cash dividends if we fail to meet certain payment conditions), make certain investments, prepay, redeem or retire subordinated debt, and enter into certain types of transactions with our affiliates. If any of the events of default occur and are not waived or cured within applicable grace periods, any unpaid amounts under the credit agreement, including principal and interest, may be declared immediately due and payable and the credit agreement may be terminated. We were in compliance with the line of credit covenants as of September 30, 2017 and September 30, 2016. We are confident in our ability to generate sufficient cash in the United States and foreign jurisdictions to fund future operating costs. We secured the revolving line of credit as an additional assurance for maintaining liquidity in the United States during potentially severe downturns of the cyclical semiconductor market, as well as for strategic investments and acquisitions.
On October 4, 2017, we entered into a $200.0 million term loan with the lenders, pursuant to which we amended certain terms and conditions of the credit agreement and entered into an arrangement with Wells Fargo Bank, N.A. and JPMorgan Chase Bank, N.A. Based on the amended terms of the credit agreement, the line of credit continues to provide for revolving credit financing of up to $75.0 million, subject to borrowing base availability. The line of credit matures on October 4, 2022 and expires no less than 90 days prior to the term loan expiration. Borrowing base availability under the amended line of credit excludes collateral related to fixed assets and is redetermined periodically based on certain percentage of certain eligible U.S. assets, including accounts receivable and inventory. The sublimits for letters of credit were reduced to $7.5 million under the amended terms of the credit agreement. All outstanding borrowings under the credit agreement are guaranteed by us and BioStorage Technologies, Inc., our wholly-owned subsidiary, or the guarantor, and subordinated to the obligations under the term loan which are secured by a first priority lien on substantially all of our and the guarantor’s assets, other than accounts receivable and inventory. Please refer to the “Senior Secured Term Loan Facility” section below for further information on the term loan.
Senior Secured Term Loan Facility
On October 4, 2017, we entered into a $200.0 million Senior Secured Term Loan Facility, or the term loan with Morgan Stanley Senior Funding, Inc., JPMorgan Chase Bank, N.A. and Wells Fargo Securities, LLC, or collectively, the lenders. The term loan was issued at $197.6 million, or 98.8% of its par value, resulting in a discount of $2.4 million, or 1.2%, which represented loan origination fees paid at the closing. The loan proceeds will be used for general corporate purposes, including acquisitions. The loan principal amount may be increased by an aggregate amount equal to $75.0 million plus any voluntary repayments of the term loans plus an amount such that our secured leverage ratio is less than 3.00 to 1.00.
Under the terms of the term loan agreement, we may elect for the loan to bear an interest rate as Eurodollar Borrowings or as Alternate Base Rate, or ABR Borrowings. Interest applicable to Eurodollar Borrowings is based on the Adjusted LIBO Rate plus applicable margin of 2.50%. The Adjusted LIBO Rate is the rate appearing on Bloomberg screen LIBOR01 which gets reset at the beginning of each selected interest period based on LIBOR rate then in effect. Interest applicable to Alternate Base Rate Borrowings is based on the Alternate Base Rate plus applicable margin of 1.50%. Alternate Base Rate is determined based on the highest of: (a) the federal funds effective rate plus 0.50%, (b) prime rate plus 1.00%, or (c) one-month LIBOR rate plus 1.00%. We may experience exposure to interest rate risk due to the potential volatility associated with the variable interest rates on the loan. If rates increase, we may be subject to higher costs of servicing the loan which could reduce our profitability and cash flows.
Our obligations under the term loan are guaranteed by the guarantor, subject to the terms and conditions of the term loan agreement. We and the guarantor granted the lenders a perfected first priority security interest in substantially all of our and the guarantor’s assets to secure the repayment of the term loan.
The term loan matures and becomes fully payable on October 4, 2024. Principal payments equal to 0.25% of the initial principal amount of the term loan are payable in installments on March 31st, June 30th, September 30th and December 31st of each year, with any remaining amount of principal becoming due and payable on the maturity date. All accrued and unpaid interest on ABR Borrowings shall be due and payable at the same time as the loan principal
50
installments. All accrued and unpaid interest on Eurodollar Borrowings shall be due on the last day of each interest period elected by us for such Eurodollar Borrowings, except for interest periods of more than three months in which case all accrued and unpaid interest shall be due and payable every three months.
Subject to certain conditions stated in the term loan agreement, we may redeem the term loan at any time at our option without a significant premium or penalty, except for a repricing transaction, as defined in the term loan agreement, which is subject to a premium of 1.00% of the loan principal amount during the first six months of the loan term. We would be required to redeem the term loan at the principal amount then outstanding upon occurrence of certain events, including (i) net proceeds received from the sale or other disposition of our or the guarantors’ assets, subject to certain limitations, (ii) casualty and condemnation proceeds received by us or the guarantor, subject to certain exceptions, (iii) net proceeds received by us or the guarantor from the issuance of debt or disqualified capital stock after October 4, 2017. Commencing on December 31, 2018, we will be required to make principal payments equal to the excess cash flow amount, as defined in the term loan agreement. Such prepayments are equal to 50% of the preceding year excess cash flow amount reduced by voluntary prepayments of the term loan, subject to certain limitations.
The term loan agreement contains certain customary representations and warranties, covenants and events of default. If any of the events of default occur and are not waived or cured within applicable grace periods, any unpaid amounts under the term loan agreement will bear an annual interest rate at 2.00% above the rate otherwise applicable under the terms and conditions of such agreement. The term loan agreement does not contain financial maintenance covenants.
Shelf Registration Statement
On July 27, 2016, we filed a registration statement on Form S‑3 with the SEC to sell securities, including common stock, preferred stock, warrants, debt securities, depository shares, purchase contracts and purchase units in amounts to be determined at the time of an offering. Any such offering, if it does occur, may happen in one or more transactions. The specific terms of any securities to be sold will be described in supplemental filings with the SEC. This registration statement will expire on July 27, 2019.
Approximately 877,427 shares of common stock issued under our 1995 Employee Stock Purchase Plan, or ESPP, for the purchases made between January 2013 and July 2016, at purchase prices ranging from $7.79 to $9.01 per share, were inadvertently not registered under federal securities laws. Under the applicable provisions of federal securities laws, plan participants who purchase unregistered shares of common stock may seek to rescind the transaction within one year following the date of purchase, which is the applicable federal statute of limitations. If the ESPP participants were to seek rescission, we would make a registered rescission offer to repurchase the shares issued under the ESPP during fiscal 2016 to the extent they continued to be held by the original purchasers. The rescission rights related to the shares held by their original purchasers expired by statute of limitations on July 31, 2017. As of September 30, 2017, we had no obligations to repurchase the shares from their holders if they sought to rescind their original purchases since these shares were no longer subject to rescission rights.
51
Dividends
Our Board of Directors declared the following dividends during the fiscal years 2017 and 2016 (in thousands, except per share data):
|
|
|
|
|
|
|
|
|
|
|
|
| Dividend |
|
|
|
|
|
|
| |
|
| per |
| Record |
| Payment |
|
|
| |
Declaration Date |
| Share |
| Date |
| Date |
| Total | ||
Fiscal Year Ended September 30, 2017 |
|
|
|
|
|
|
|
|
|
|
November 9, 2016 |
| $ | 0.10 |
| December 2, 2016 |
| December 23, 2016 |
| $ | 6,952 |
January 31, 2017 |
|
| 0.10 |
| March 3, 2017 |
| March 24, 2017 |
|
| 6,962 |
April 27, 2017 |
|
| 0.10 |
| June 2, 2017 |
| June 23, 2017 |
|
| 6,972 |
August 1, 2017 |
|
| 0.10 |
| September 8, 2017 |
| September 29, 2017 |
|
| 6,980 |
Fiscal Year Ended September 30, 2016 |
|
|
|
|
|
|
|
|
|
|
November 4, 2015 |
| $ | 0.10 |
| December 4, 2015 |
| December 22, 2015 |
| $ | 6,844 |
February 3, 2016 |
|
| 0.10 |
| March 4, 2016 |
| March 24, 2016 |
|
| 6,862 |
April 27, 2016 |
|
| 0.10 |
| June 3, 2016 |
| June 24, 2016 |
|
| 6,863 |
July 27, 2016 |
|
| 0.10 |
| September 2, 2016 |
| September 23, 2016 |
|
| 6,876 |
On November 8, 2017, our Board of Directors approved a cash dividend of $0.10 per share of our common stock. The total dividend of approximately $7.0 million will be paid on December 22, 2017 to shareholders of record at the close of business on December 1, 2017. Dividends are declared at the discretion of our Board of Directors and depend on actual cash flow from operations, our financial condition, capital requirements and any other factors our Board of Directors may consider relevant. We intend to pay quarterly cash dividends partially offsetin the future; however, the amount and timing of these dividends may be impacted by $1.8the cyclical nature of certain markets we serve. We may reduce, delay or cancel a quarterly cash dividend based on the severity of a cyclical downturn.
Share Repurchase Program
On September 29, 2015, our Board of Directors approved a share repurchase program for up to $50 million worth of cash generated from employee contributions to our employee stock purchase plans.common stock. The timing and amount of any shares repurchased are based on market and business conditions, legal requirements and other factors and may be commenced or suspended at any time at our discretion. There were no shares repurchased under this program during fiscal year 2017.
Contractual Obligations and Requirements
Our contractual obligations were as follows at September 30, 2017 (in thousands):
|
|
|
|
|
|
|
|
|
|
|
|
|
|
|
|
|
|
|
|
| Less than |
| One to |
| Four to |
|
|
| |||
|
| Total |
| One Year |
| Three Years |
| Five Years |
| Thereafter | |||||
Contractual Cash Obligations: |
|
|
|
|
|
|
|
|
|
|
|
|
|
|
|
Operating leases |
| $ | 20,862 |
| $ | 3,739 |
| $ | 4,973 |
| $ | 3,084 |
| $ | 9,066 |
Pension and other post retirement benefit plans |
|
| 2,234 |
|
| 255 |
|
| 224 |
|
| 225 |
|
| 1,530 |
Other purchase commitments |
|
| 131,876 |
|
| 120,438 |
|
| 6,925 |
|
| 866 |
|
| 3,647 |
Total contractual cash obligations |
| $ | 154,972 |
| $ | 124,432 |
| $ | 12,122 |
| $ | 4,175 |
| $ | 14,243 |
Other Commercial Commitments: |
|
|
|
|
|
|
|
|
|
|
|
|
|
|
|
Letters of credit |
| $ | 3,511 |
| $ | 1,769 |
| $ | 1,742 |
| $ | — |
| $ | — |
Total commitments |
| $ | 158,483 |
| $ | 126,201 |
| $ | 13,864 |
| $ | 4,175 |
| $ | 14,243 |
The letters of credit outstandingof approximately $3.5 million are related primarily to customer advances and other performance obligations at September 30, 2014.2017. These arrangements guarantee the refund of advance payments received from our customers in the event that the product is not delivered or warranty obligations are not fulfilled in complianceaccordance with the terms of the contract. While we do not anticipate that thesecontract terms. These obligations will be called, they could be called by the beneficiaries at any time before the expiration date of the particular letter of credit shouldif we fail to meet certain contractual requirements. None of these obligations were called during fiscal year 2017, and we currently do not anticipate any of these obligations to be called in the near future.
52
| Total | Less than One Year | One to Three Years | Four to Five Years | Thereafter | |||||||||||||||
| Operating leases | $ | 12,472 | $ | 5,140 | $ | 5,132 | $ | 2,107 | $ | 93 | |||||||||
| Capital lease | 9,544 | 881 | 8,663 | — | — | ||||||||||||||
| Pension funding | 2,082 | 309 | 619 | 311 | 843 | ||||||||||||||
| Purchase commitments and other | 72,353 | 68,385 | 3,829 | 139 | — | ||||||||||||||
| Total contractual obligations | $ | 96,451 | $ | 74,715 | $ | 18,243 | $ | 2,557 | $ | 936 | |||||||||
As of September 30, 2014,2017, the total amount of net unrecognized tax benefits for uncertain tax positions and the accrual for the related interest was $5.8$1.7 million, all of which represents a potential future cash outlay. We are unable to make a reasonably reliable estimate of the timing of the cash settlement for this liability since the timing of future tax examinations by various tax jurisdictions and the related resolution is uncertain.
We areutilize a guarantor onthird party to manage our manufacturing operations in Mexico. As a part of this arrangement, we make and guarantee the monthly payments for a lease inof the Mexico thatfacility which expires in January 2018.February 2019. The remaining payments under thisthe lease atwere approximately $1.0 million as of September 30, 2014 are approximately $1.4 million.
On June 25, 2013,October 4, 2017, we filedentered into a shelf registration statement on Form S-3$200.0 million term loan with the SEC to sell up to $200lenders. The term loan was issued at $197.6 million, or 98.8% of securities, before anyits par value, resulting in a discount of $2.4 million, or 1.2%, which represented loan origination fees or expenses ofpaid at the offering. Securities that may be sold include common stock, preferred stock, warrants, debt securities, depository shares, purchase contracts and purchase units. Any such offering, if it does occur, may happen in one or more transactions. Specific terms of any securities to be soldclosing. The loan proceeds will be described in supplemental filings withused for general corporate purposes, including acquisitions. Please refer to the SEC. This registration statement will expire“Capital Resources” section above for further information on July 1, 2016.
Off-Balance Sheet Arrangements
As of Directors declared the following dividends during the fiscal years ended September 30, 2014 and 2013 (in thousands, except per share data):
| Declaration Date | Dividend per Share | Record Date | Payment Date | Total | ||||||||
| Fiscal year Ended September 30, 2014 | ||||||||||||
| November 12, 2013 | $ | 0.08 | December 6, 2013 | December 27, 2013 | $ | 5,391 | ||||||
| February 5, 2014 | 0.08 | March 7, 2014 | March 28, 2014 | 5,408 | ||||||||
| May 7, 2014 | 0.08 | June 6, 2014 | June 27, 2014 | 5,344 | ||||||||
| July 30, 2014 | 0.10 | September 5, 2014 | September 26, 2014 | 6,732 | ||||||||
| Fiscal year Ended September 30, 2013 | ||||||||||||
| November 7, 2012 | $ | 0.08 | December 7, 2012 | December 28, 2012 | $ | 5,311 | ||||||
| January 30, 2013 | 0.08 | March 8, 2013 | March 29, 2013 | 5,361 | ||||||||
| May 8, 2013 | 0.08 | June 7, 2013 | June 28, 2013 | 5,316 | ||||||||
| August 7, 2013 | 0.08 | September 6, 2013 | September 27, 2013 | 5,340 | ||||||||
Item 7A. Quantitative and financial results. Under the amended guidance, a strategic shift could include the disposal of a major line of business, a major geographical area, a major equity method investment or other major parts of an entity. In addition, the new guidance allows companies to have significant continuing involvement and continuing cash flows with the discontinued operation. The amended guidance is effective for fiscal years beginning on or after December 15, 2014. Early adoption is permitted but not required for disposals, or classifications as held for sale, that have not been previously reported in financial statements. We have elected not to adopt this amended guidance in regard to the Granville-Phillips discontinued operation.
We are exposed to a variety of market risks, including changes in interest rates affecting the return on our cash and cash equivalents, short-term and long-term investments and fluctuations in foreign currency exchange rates.
Interest Rate Exposure
Our cash and cash equivalents consist principally of money market securities which are short-term in nature. OurAt September 30, 2017 and 2016, our short-term and long-term investments consistwere $2.7 million and $6.1 million, respectively, and consisted mostly of highly rated corporate debt securities U.S. Treasury securities, and obligations of U.S. Government Agencies and other municipalities.municipal securities. At September 30, 2014,2016, the unrealized loss position on marketable securities was $38,000,less than $0.1 million, which is included in “Accumulated other comprehensive income” in the Consolidated Balance Sheets. There were no securities in unrealized loss position as of September 30, 2017. We sold a substantial portion of our marketable securities portfolio during fiscal year 2017 and utilized the sales proceeds for the acquisitions completed during the current fiscal year. A hypothetical 100 basis point change in interest rates would result in an annual change of approximately $2.1less than $0.1 million and $0.1 million, respectively, in interest income earned.
Currency Rate Exposure
We have transactions and balances denominated in currencies other than the U.S. dollar. Most of these transactions or balances are denominated in Euros, British Pounds and a variety of Asian currencies. Sales in currencies other than the U.S. dollar were 30%33% and 34%, respectively, of our total sales for the fiscal yearyears ended September 30, 2014.2017 and 2016. These foreign sales were made primarily by our foreign subsidiaries, which have cost structures that substantially align with the currency of sale.
In the normal course of our business, we have liquid assets denominated in non-functional currencies which include cash, short-term advances between our legal entities thatand accounts receivable which are subject to foreign currency exposure. These short-term advancesSuch balances were approximately $18.7$51.6 million and $34.9 million, respectively, at September 30, 2014,2017 and relate2016, and related to the Euro, British Pound and a variety of Asian currencies. We mitigate the impact of potential currency translation losses on these short-term intercompany advances by the timely settlement of each transaction, generally within 30 days. We also utilize forward contracts to mitigate our exposures to currency movement. We incurred a foreign currency losslosses of $1.2$2.3 million for theand $1.9 million, respectively, in fiscal year ended September 30, 2014,years 2017 and 2016, which relatesrelated to the currency fluctuation on these advancesbalances between the time the transaction occursoccurred and the ultimate settlement of the transaction. A hypothetical 10% change in foreign exchange rates at September 30, 2014 would result in a change of $0.5 million change in our net income.income (loss) at each fiscal year ended September 30, 2017 and 2016.
53
Item 8. Financial Statements and Supplementary Data
55 | |
57 | |
58 | |
59 | |
60 | |
61 | |
62 |
The supplementary quarterly financial information required by this Item 8 is included in Part II, Item 6, “Selected Financial Data”, and is incorporated herein by reference.
54
REPORT OF INDEPENDENT REGISTERED PUBLIC ACCOUNTING FIRM
Brooks Automation, Inc.
In our opinion, the accompanying consolidated balance sheets of Brooks Automation, Inc. as of September 30, 20142017 and 20132016 and the related consolidated statements of operations, of comprehensive (loss) income, of changes in equity, and of cash flows for the years then ended present fairly, in all material respects, the financial position of Brooks Automation, Inc. and its subsidiaries as of September 30, 2017 and 2016, and the results of their operations and their cash flows for the years then ended in conformity with accounting principles generally accepted in the United States of America. Also in our opinion, the Company maintained, in all material respects, effective internal control over financial reporting as of September 30, 2017, based on criteria established in Internal Control - Integrated Framework (2013) issued by the Committee of Sponsoring Organizations of the Treadway Commission (COSO). The Company's management is responsible for these financial statements, for maintaining effective internal control over financial reporting and for its assessment of the effectiveness of internal control over financial reporting, included in Management's Report on Internal Control Over Financial Reporting appearing under Item 9A. Our responsibility is to express opinions on these financial statements and on the Company's internal control over financial reporting based on our integrated audits. We conducted our audits in accordance with the standards of the Public Company Accounting Oversight Board (United States). Those standards require that we plan and perform the audits to obtain reasonable assurance about whether the financial statements are free of material misstatement and whether effective internal control over financial reporting was maintained in all material respects. Our audits of the financial statements included examining, on a test basis, evidence supporting the amounts and disclosures in the financial statements, assessing the accounting principles used and significant estimates made by management, and evaluating the overall financial statement presentation. Our audit of internal control over financial reporting included obtaining an understanding of internal control over financial reporting, assessing the risk that a material weakness exists, and testing and evaluating the design and operating effectiveness of internal control based on the assessed risk. Our audits also included performing such other procedures as we considered necessary in the circumstances. We believe that our audits provide a reasonable basis for our opinions.
A company’s internal control over financial reporting is a process designed to provide reasonable assurance regarding the reliability of financial reporting and the preparation of financial statements for external purposes in accordance with generally accepted accounting principles. A company’s internal control over financial reporting includes those policies and procedures that (i) pertain to the maintenance of records that, in reasonable detail, accurately and fairly reflect the transactions and dispositions of the assets of the company; (ii) provide reasonable assurance that transactions are recorded as necessary to permit preparation of financial statements in accordance with generally accepted accounting principles, and that receipts and expenditures of the company are being made only in accordance with authorizations of management and directors of the company; and (iii) provide reasonable assurance regarding prevention or timely detection of unauthorized acquisition, use, or disposition of the company’s assets that could have a material effect on the financial statements.
Because of its inherent limitations, internal control over financial reporting may not prevent or detect misstatements. Also, projections of any evaluation of effectiveness to future periods are subject to the risk that controls may become inadequate because of changes in conditions, or that the degree of compliance with the policies or procedures may deteriorate.
As described in Management’s Report on Internal Control over Financial Reporting, management has excluded Pacific Bio-Material Management, Inc. from its assessment of internal control over financial reporting as of September 30, 2017, because it was acquired by the Company in a purchase business combination during 2017. We have also excluded Pacific Bio-Material Management, Inc. from our audit of internal control over financial reporting. Pacific Bio-Material Management, Inc. is a wholly-owned subsidiary whose total assets and total revenues excluded from management’s assessment and our audit of internal control over financial reporting represent 1.7% and 0.5%, respectively, of the related consolidated financial statement amounts as of and for the year ended September 30, 2017.
/s/ PricewaterhouseCoopers LLP
Boston, Massachusetts
November 17, 2017
55
REPORT OF INDEPENDENT REGISTERED PUBLIC ACCOUNTING FIRM
Board of Directors and Stockholders
Brooks Automation, Inc.
Chelmsford, Massachusetts
We have audited the accompanying consolidated statements of operations, comprehensive (loss), income, changes in equity, and cash flows for the years then ended.year ended September 30, 2015 of Brooks Automation, Inc. (the Company”). These financial statements are the responsibility of the Company’s management. Our responsibility is to express an opinion on these financial statements based on our audits.
We conducted our auditsaudit in accordance with the standards of the Public Company Accounting Oversight Board (United States). Those standards require that we plan and perform the audit to obtain reasonable assurance about whether the financial statements are free of material misstatement. An audit also includes examining, on a test basis, evidence supporting the amounts and disclosures in the financial statements, assessing the accounting principles used and significant estimates made by management, as well as evaluating the overall presentation of the financial statements. We believe that our audits provideaudit provides a reasonable basis for our opinion.
In our opinion, the consolidated financial statements referred to above present fairly, in all material respects, the financial position of Brooks Automation, Inc. at September 30, 2014 and 2013 and the results of itsthe Company’s operations and its cash flows for the years thenyear ended September 30, 2015, in conformity with accounting principles generally accepted in the United States of America.
/s/ BDO USA, LLP
Boston, Massachusetts
November 13, 2014
56
BROOKS AUTOMATION, INC.
|
|
|
|
|
|
|
|
| September 30, |
| September 30, | ||
|
| 2017 |
| 2016 | ||
|
| (In thousands, except share and per share data) | ||||
Assets |
|
|
|
|
|
|
Current assets |
|
|
|
|
|
|
Cash and cash equivalents |
| $ | 101,622 |
| $ | 85,086 |
Marketable securities |
|
| 28 |
|
| 39 |
Accounts receivable, net |
|
| 120,828 |
|
| 106,372 |
Inventories |
|
| 106,395 |
|
| 92,572 |
Prepaid expenses and other current assets |
|
| 23,138 |
|
| 15,265 |
Total current assets |
|
| 352,011 |
|
| 299,334 |
Property, plant and equipment, net |
|
| 58,462 |
|
| 54,885 |
Long-term marketable securities |
|
| 2,642 |
|
| 6,096 |
Long-term deferred tax assets |
|
| 1,692 |
|
| 1,982 |
Goodwill |
|
| 233,638 |
|
| 202,138 |
Intangible assets, net |
|
| 83,520 |
|
| 81,843 |
Equity method investments |
|
| 28,593 |
|
| 27,273 |
Other assets |
|
| 6,070 |
|
| 12,354 |
Total assets |
| $ | 766,628 |
| $ | 685,905 |
Liabilities and Stockholders' Equity |
|
|
|
|
|
|
Current liabilities |
|
|
|
|
|
|
Accounts payable |
| $ | 49,100 |
| $ | 41,128 |
Deferred revenue |
|
| 24,292 |
|
| 14,966 |
Accrued warranty and retrofit costs |
|
| 8,054 |
|
| 6,324 |
Accrued compensation and benefits |
|
| 27,065 |
|
| 21,254 |
Accrued restructuring costs |
|
| 1,708 |
|
| 5,939 |
Accrued income taxes payable |
|
| 11,417 |
|
| 7,554 |
Accrued expenses and other current liabilities |
|
| 25,142 |
|
| 22,628 |
Total current liabilities |
|
| 146,778 |
|
| 119,793 |
Long-term tax reserves |
|
| 1,687 |
|
| 2,681 |
Long-term deferred tax liabilities |
|
| 3,748 |
|
| 2,913 |
Long-term pension liabilities |
|
| 1,979 |
|
| 2,557 |
Other long-term liabilities |
|
| 4,792 |
|
| 4,271 |
Total liabilities |
|
| 158,984 |
|
| 132,215 |
Commitments and contingencies (Note 20) |
|
|
|
|
|
|
Stockholders' Equity |
|
|
|
|
|
|
Preferred stock, $0.01 par value- 1,000,000 shares authorized, no shares issued or outstanding |
|
| — |
|
| — |
Common stock, $0.01 par value- 125,000,000 shares authorized, 83,294,848 shares issued and 69,832,979 shares outstanding at September 30, 2017, 82,220,270 shares issued and 68,758,401 shares outstanding at September 30, 2016 |
|
| 833 |
|
| 821 |
Additional paid-in capital |
|
| 1,874,918 |
|
| 1,855,703 |
Accumulated other comprehensive income |
|
| 15,213 |
|
| 15,166 |
Treasury stock, at cost- 13,461,869 shares |
|
| (200,956) |
|
| (200,956) |
Accumulated deficit |
|
| (1,082,364) |
|
| (1,117,044) |
Total stockholders' equity |
|
| 607,644 |
|
| 553,690 |
Total liabilities and stockholders' equity |
| $ | 766,628 |
| $ | 685,905 |
| September 30, 2014 | September 30, 2013 | ||||||
| (In thousands, except share and per share data) | |||||||
| Assets | |||||||
| Current assets | |||||||
| Cash and cash equivalents | $ | 94,114 | $ | 82,971 | |||
| Restricted cash | — | 177 | |||||
| Marketable securities | 68,130 | 45,900 | |||||
| Accounts receivable, net | 80,106 | 77,483 | |||||
| Inventories | 93,567 | 94,411 | |||||
| Deferred tax assets | 19,009 | 16,839 | |||||
| Assets held for sale | — | 27,778 | |||||
| Prepaid expenses and other current assets | 19,387 | 9,030 | |||||
| Total current assets | 374,313 | 354,589 | |||||
| Property, plant and equipment, net | 50,183 | 47,506 | |||||
| Long-term marketable securities | 83,212 | 44,491 | |||||
| Long-term deferred tax assets | 67,563 | 99,146 | |||||
| Goodwill | 109,501 | 97,924 | |||||
| Intangible assets, net | 59,550 | 60,088 | |||||
| Equity method investments | 28,944 | 25,687 | |||||
| Other assets | 4,772 | 7,332 | |||||
| Total assets | $ | 778,038 | $ | 736,763 | |||
| Liabilities and equity | |||||||
| Current liabilities | |||||||
| Accounts payable | $ | 33,740 | $ | 35,392 | |||
| Capital lease obligation | 881 | — | |||||
| Deferred revenue | 26,279 | 19,610 | |||||
| Accrued warranty and retrofit costs | 6,499 | 7,260 | |||||
| Accrued compensation and benefits | 21,663 | 14,225 | |||||
| Accrued restructuring costs | 3,475 | 1,412 | |||||
| Accrued income taxes payable | 1,808 | 1,058 | |||||
| Deferred tax liabilities | 808 | 19 | |||||
| Liabilities held for sale | — | 132 | |||||
| Accrued expenses and other current liabilities | 18,688 | 13,453 | |||||
| Total current liabilities | 113,841 | 92,561 | |||||
| Long-term capital lease obligation | 7,417 | — | |||||
| Long-term tax reserves | 5,708 | 6,115 | |||||
| Long-term deferred tax liabilities | 2,567 | 921 | |||||
| Long-term pension liability | 1,774 | 815 | |||||
| Other long-term liabilities | 3,842 | 3,695 | |||||
| Total liabilities | 135,149 | 104,107 | |||||
| Commitments and contingencies (Note 22) | |||||||
| Equity | |||||||
| Preferred stock, $0.01 par value, 1,000,000 shares authorized, no shares issued or outstanding | — | — | |||||
| Common stock, $0.01 par value, 125,000,000 shares authorized, 80,375,777 shares issued and 66,913,908 shares outstanding at September 30, 2014, 80,039,104 shares issued and 66,577,235 shares outstanding at September 30, 2013 | 804 | 800 | |||||
| Additional paid-in capital | 1,834,619 | 1,825,499 | |||||
| Accumulated other comprehensive income | 15,687 | 22,604 | |||||
| Treasury stock at cost, 13,461,869 shares | (200,956 | ) | (200,956 | ) | |||
| Accumulated deficit | (1,007,265 | ) | (1,015,991 | ) | |||
| Total Brooks Automation, Inc. stockholders’ equity | 642,889 | 631,956 | |||||
| Noncontrolling interest in subsidiaries | — | 700 | |||||
| Total equity | 642,889 | 632,656 | |||||
| Total liabilities and equity | $ | 778,038 | $ | 736,763 | |||
The accompanying notes are an integral part of these consolidated financial statements.
57
BROOKS AUTOMATION, INC.
CONSOLIDATED STATEMENTS OF OPERATIONS
|
|
|
|
|
|
|
|
|
|
|
|
|
|
|
|
|
|
|
|
|
| Year Ended September 30, | |||||||
|
| 2017 |
| 2016 |
| 2015 | |||
|
| (In thousands, except per share data) | |||||||
Revenue |
|
|
|
|
|
|
|
|
|
Products |
| $ | 533,624 |
| $ | 421,783 |
| $ | 457,411 |
Services |
|
| 159,261 |
|
| 138,540 |
|
| 95,297 |
Total revenue |
|
| 692,885 |
|
| 560,323 |
|
| 552,708 |
Cost of revenue |
|
|
|
|
|
|
|
|
|
Products |
|
| 323,812 |
|
| 267,974 |
|
| 298,348 |
Services |
|
| 101,669 |
|
| 94,268 |
|
| 65,255 |
Total cost of revenue |
|
| 425,481 |
|
| 362,242 |
|
| 363,603 |
Gross profit |
|
| 267,404 |
|
| 198,081 |
|
| 189,105 |
Operating expenses |
|
|
|
|
|
|
|
|
|
Research and development |
|
| 47,004 |
|
| 51,543 |
|
| 52,232 |
Selling, general and administrative |
|
| 153,061 |
|
| 130,261 |
|
| 115,270 |
Restructuring charges |
|
| 3,226 |
|
| 12,039 |
|
| 4,713 |
Total operating expenses |
|
| 203,291 |
|
| 193,843 |
|
| 172,215 |
Operating income |
|
| 64,113 |
|
| 4,238 |
|
| 16,890 |
Interest income |
|
| 464 |
|
| 452 |
|
| 899 |
Interest expense |
|
| (408) |
|
| (157) |
|
| (395) |
Gain on settlement of equity method investment |
|
| 1,847 |
|
| — |
|
| — |
Other (expense) income, net |
|
| (645) |
|
| (579) |
|
| 421 |
Income before income taxes and earnings (losses) of equity method investments |
|
| 65,371 |
|
| 3,954 |
|
| 17,815 |
Income tax provision |
|
| 12,140 |
|
| 75,810 |
|
| 3,430 |
Income (loss) before equity in earnings (losses) of equity method investments |
|
| 53,231 |
|
| (71,856) |
|
| 14,385 |
Equity in earnings (losses) of equity method investments |
|
| 9,381 |
|
| 2,380 |
|
| (164) |
Net income (loss) |
| $ | 62,612 |
| $ | (69,476) |
| $ | 14,221 |
Basic net income (loss) per share |
| $ | 0.90 |
| $ | (1.01) |
| $ | 0.21 |
Diluted net income (loss) per share |
|
| 0.89 |
|
| (1.01) |
|
| 0.21 |
Dividend declared per share |
|
| 0.40 |
|
| 0.40 |
|
| 0.40 |
Weighted average shares used in computing net income (loss) per share: |
|
|
|
|
|
|
|
|
|
Basic |
|
| 69,575 |
|
| 68,507 |
|
| 67,411 |
Diluted |
|
| 70,485 |
|
| 68,507 |
|
| 68,549 |
| Year ended September 30, | |||||||||||
| 2014 | 2013 | 2012 | |||||||||
| (In thousands, except per share data) | |||||||||||
| Revenue | |||||||||||
| Product | $ | 387,032 | $ | 335,011 | $ | 402,505 | |||||
| Services | 95,816 | 87,429 | 86,478 | ||||||||
| Total revenue | 482,848 | 422,440 | 488,983 | ||||||||
| Cost of revenue | |||||||||||
| Product | 252,688 | 229,411 | 267,448 | ||||||||
| Services | 62,823 | 60,722 | 62,082 | ||||||||
| Total cost of revenue | 315,511 | 290,133 | 329,530 | ||||||||
| Gross profit | 167,337 | 132,307 | 159,453 | ||||||||
| Operating expenses | |||||||||||
| Research and development | 52,649 | 46,209 | 44,717 | ||||||||
| Selling, general and administrative | 111,098 | 96,516 | 97,978 | ||||||||
| Restructuring and other charges | 6,289 | 6,380 | 3,153 | ||||||||
| Pension settlement | — | — | 8,937 | ||||||||
| In-process research and development | — | — | 3,026 | ||||||||
| Total operating expenses | 170,036 | 149,105 | 157,811 | ||||||||
| Operating income (loss) | (2,699 | ) | (16,798 | ) | 1,642 | ||||||
| Interest income | 950 | 1,032 | 1,213 | ||||||||
| Interest expense | (202 | ) | (2 | ) | (14 | ) | |||||
| Other income, net | 256 | 1,227 | 660 | ||||||||
| Income (loss) before income taxes and equity in earnings of equity method investments | (1,695 | ) | (14,541 | ) | 3,501 | ||||||
| Income tax benefit | (1,980 | ) | (4,985 | ) | (126,201 | ) | |||||
| Income (loss) before equity in earnings of equity method investments | 285 | (9,556 | ) | 129,702 | |||||||
| Equity in earnings of equity method investments | 1,235 | 2,442 | 2,133 | ||||||||
| Income (loss) from continuing operations | 1,520 | (7,114 | ) | 131,835 | |||||||
| Income from discontinued operations, net of tax | 30,002 | 4,964 | 5,000 | ||||||||
| Net income (loss) | 31,522 | (2,150 | ) | 136,835 | |||||||
| Net income attributable to noncontrolling interests | (161 | ) | (65 | ) | (46 | ) | |||||
| Net income (loss) attributable to Brooks Automation, Inc. | $ | 31,361 | $ | (2,215 | ) | $ | 136,789 | ||||
| Basic net income (loss) per share attributable to Brooks Automation, Inc. common stockholders: | |||||||||||
| Income (loss) from continuing operations | $ | 0.02 | $ | (0.11 | ) | $ | 2.02 | ||||
| Income from discontinued operations, net of tax | 0.45 | 0.08 | 0.08 | ||||||||
| Basic net income (loss) per share attributable to Brooks Automation, Inc. | $ | 0.47 | $ | (0.03 | ) | $ | 2.10 | ||||
| Diluted net income (loss) per share attributable to Brooks Automation, Inc. common stockholders: | |||||||||||
| Income (loss) from continuing operations | $ | 0.02 | $ | (0.11 | ) | $ | 2.01 | ||||
| Income from discontinued operations, net of tax | 0.44 | 0.08 | 0.08 | ||||||||
| Diluted net income (loss) per share attributable to Brooks Automation, Inc. common stockholders | $ | 0.46 | $ | (0.03 | ) | $ | 2.08 | ||||
| Dividend declared per share | $ | 0.34 | $ | 0.32 | $ | 0.32 | |||||
| Weighted-average shares used in computing earnings (loss) per share: | |||||||||||
| Basic | 66,648 | 65,912 | 65,128 | ||||||||
| Diluted | 67,644 | 65,912 | 65,722 | ||||||||
The accompanying notes are an integral part of these consolidated financial statements.
58
BROOKS AUTOMATION, INC.
CONSOLIDATED STATEMENTS OF COMPREHENSIVE INCOME (LOSS)
|
|
|
|
|
|
|
|
|
|
|
|
|
|
|
|
|
|
|
|
|
| Year Ended September 30, | |||||||
|
| 2017 |
| 2016 |
| 2015 | |||
|
| (In thousands) | |||||||
Net income (loss) |
| $ | 62,612 |
| $ | (69,476) |
| $ | 14,221 |
Other comprehensive income (loss), net of tax: |
|
|
|
|
|
|
|
|
|
Cumulative foreign currency translation adjustments |
|
| (221) |
|
| 8,844 |
|
| (9,557) |
Unrealized gains (losses) on marketable securities, net of tax effects of $0, $58 and $(83) for fiscal years 2017, 2016 and 2015 |
|
| 2 |
|
| (106) |
|
| 141 |
Actuarial gains (losses), net of tax effects of $(74), $161 and $115 for fiscal years 2017, 2016 and 2015 |
|
| 525 |
|
| (322) |
|
| (605) |
Pension settlement |
|
| (259) |
|
| — |
|
| 232 |
Pension curtailment |
|
| — |
|
| 852 |
|
| — |
Total other comprehensive income (loss), net of tax |
|
| 47 |
|
| 9,268 |
|
| (9,789) |
Comprehensive income (loss) |
| $ | 62,659 |
| $ | (60,208) |
| $ | 4,432 |
| Year ended September 30, | |||||||||||
| 2014 | 2013 | 2012 | |||||||||
| (In thousands) | |||||||||||
| Net income (loss) | $ | 31,522 | $ | (2,150 | ) | $ | 136,835 | ||||
| Comprehensive income (loss), net of tax: | |||||||||||
| Change in cumulative translation adjustment | (6,296 | ) | (2,113 | ) | (2,406 | ) | |||||
| Change in unrealized gain (loss) on marketable securities | (104 | ) | (135 | ) | 393 | ||||||
| Change in fair value on cash flow hedges | (14 | ) | 14 | — | |||||||
| Actuarial gain (loss) | (503 | ) | 1,109 | (606 | ) | ||||||
| Pension settlement | — | 87 | 8,937 | ||||||||
| Comprehensive income (loss), net of tax | 24,605 | (3,188 | ) | 143,153 | |||||||
| Comprehensive income attributable to noncontrolling interests | (161 | ) | (65 | ) | (46 | ) | |||||
| Comprehensive income (loss) attributable to Brooks Automation, Inc., net of tax | $ | 24,444 | $ | (3,253 | ) | $ | 143,107 | ||||
The accompanying notes are an integral part of these consolidated financial statements.
59
BROOKS AUTOMATION, INC.
CONSOLIDATED STATEMENTS OF CASH FLOWS
|
|
|
|
|
|
|
|
|
|
|
|
|
|
|
|
|
|
|
|
|
|
|
| Year Ended September 30, |
| |||||||
|
| 2017 |
| 2016 |
| 2015 |
| |||
|
| (In thousands) |
| |||||||
Cash flows from operating activities |
|
|
|
|
|
|
|
|
|
|
Net income (loss) |
| $ | 62,612 |
| $ | (69,476) |
| $ | 14,221 |
|
Adjustments to reconcile net income (loss) to net cash provided by operating activities: |
|
|
|
|
|
|
|
|
|
|
Depreciation and amortization |
|
| 28,149 |
|
| 28,046 |
|
| 25,160 |
|
Gain on settlement of equity method investment |
|
| (1,847) |
|
| — |
|
| — |
|
Impairment of other assets |
|
| — |
|
| 807 |
|
| — |
|
Stock-based compensation |
|
| 17,278 |
|
| 11,737 |
|
| 12,159 |
|
Amortization of premium on marketable securities and deferred financing costs |
|
| 252 |
|
| 339 |
|
| 1,193 |
|
(Earnings) losses of equity method investments |
|
| (9,381) |
|
| (2,380) |
|
| 164 |
|
Deferred income tax provision (benefit) |
|
| 517 |
|
| 70,273 |
|
| (2,173) |
|
Loss on write-downs of assets held for sale |
|
| — |
|
| — |
|
| 1,944 |
|
Pension settlement |
|
| (259) |
|
| — |
|
| 232 |
|
Other gains on disposals of assets |
|
| (406) |
|
| (41) |
|
| (85) |
|
Changes in operating assets and liabilities, net of acquisitions: |
|
|
|
|
|
|
|
|
|
|
Accounts receivable |
|
| (11,178) |
|
| (1,796) |
|
| (5,134) |
|
Inventories |
|
| (12,792) |
|
| 8,565 |
|
| (5,919) |
|
Prepaid expenses and other current assets |
|
| (5,829) |
|
| (428) |
|
| (2,875) |
|
Accounts payable |
|
| 7,846 |
|
| (5,143) |
|
| 8,358 |
|
Deferred revenue |
|
| 8,049 |
|
| (3,290) |
|
| (6,779) |
|
Accrued warranty and retrofit costs |
|
| 1,602 |
|
| 290 |
|
| (407) |
|
Accrued compensation and tax withholdings |
|
| 5,565 |
|
| (3,234) |
|
| (1,148) |
|
Accrued restructuring costs |
|
| (4,241) |
|
| 3,860 |
|
| (1,247) |
|
Accrued pension costs |
|
| (32) |
|
| (811) |
|
| 812 |
|
Accrued expenses and other current liabilities |
|
| 10,319 |
|
| 2,229 |
|
| 5,251 |
|
Net cash provided by operating activities |
|
| 96,224 |
|
| 39,547 |
|
| 43,727 |
|
Cash flows from investing activities |
|
|
|
|
|
|
|
|
|
|
Purchases of property, plant and equipment |
|
| (12,677) |
|
| (12,848) |
|
| (16,146) |
|
Purchases of technology intangibles |
|
| (240) |
|
| — |
|
| — |
|
Purchases of marketable securities |
|
| — |
|
| (12,901) |
|
| (87,333) |
|
Sales and maturities of marketable securities |
|
| 3,590 |
|
| 139,388 |
|
| 104,008 |
|
Disbursement for a loan receivable |
|
| — |
|
| (1,821) |
|
| — |
|
Acquisitions, net of cash acquired |
|
| (44,791) |
|
| (125,248) |
|
| (14,450) |
|
Proceeds from liquidation of a joint venture |
|
| — |
|
| — |
|
| 1,778 |
|
Purchases of other investments |
|
| (170) |
|
| (250) |
|
| (5,500) |
|
Proceeds from sales of property, plant and equipment |
|
| 100 |
|
| 2,806 |
|
| 6 |
|
Net cash used in investing activities |
|
| (54,188) |
|
| (10,874) |
|
| (17,637) |
|
Cash flows from financing activities |
|
|
|
|
|
|
|
|
|
|
Proceeds from line of credit |
|
| — |
|
| 366 |
|
| — |
|
Proceeds from issuance of common stock |
|
| 2,040 |
|
| 1,888 |
|
| 1,807 |
|
Payment of deferred financing costs |
|
| (28) |
|
| (708) |
|
| — |
|
Repayment of debt assumed in business acquisition |
|
| — |
|
| — |
|
| (8,829) |
|
Common stock dividends paid |
|
| (27,932) |
|
| (27,503) |
|
| (26,992) |
|
Net cash used in financing activities |
|
| (25,920) |
|
| (25,957) |
|
| (34,014) |
|
Effects of exchange rate changes on cash and cash equivalents |
|
| 420 |
|
| 1,648 |
|
| (5,468) |
|
Net increase (decrease) in cash and cash equivalents |
|
| 16,536 |
|
| 4,364 |
|
| (13,392) |
|
Cash and cash equivalents, beginning of period |
|
| 85,086 |
|
| 80,722 |
|
| 94,114 |
|
Cash and cash equivalents, end of period |
| $ | 101,622 |
| $ | 85,086 |
| $ | 80,722 |
|
Supplemental disclosures: |
|
|
|
|
|
|
|
|
|
|
Cash paid for interest |
| $ | 200 |
| $ | 114 |
| $ | 395 |
|
Cash paid for income taxes, net |
|
| 8,142 |
|
| 4,930 |
|
| 3,883 |
|
Supplemental disclosure of non-cash investing and financing activities: |
|
|
|
|
|
|
|
|
|
|
Derecognition of a capital lease obligation and the related assets |
| $ | — |
| $ | — |
| $ | 7,804 |
|
Deferred financing costs included in accrued expenses |
|
| 423 |
|
| — |
|
| — |
|
Fair value of non-cash consideration for the acquisition of Cool Lab, LLC |
|
| 10,348 |
|
| — |
|
| — |
|
| Year ended September 30, | |||||||||||
| 2014 | 2013 | 2012 | |||||||||
| (In thousands) | |||||||||||
| Cash flows from operating activities | |||||||||||
| Net income (loss) | $ | 31,522 | $ | (2,150 | ) | $ | 136,835 | ||||
| Adjustments to reconcile net income (loss) to net cash provided by operating activities: | |||||||||||
| Depreciation and amortization | 23,459 | 24,155 | 21,620 | ||||||||
| Impairment of intangible assets | 398 | 1,960 | — | ||||||||
| Impairment of other assets | 2,621 | — | — | ||||||||
| Stock-based compensation | 10,912 | 7,757 | 8,647 | ||||||||
| Amortization of premium on marketable securities | 1,255 | 1,274 | 2,401 | ||||||||
| Undistributed earnings of equity method investments | (1,235 | ) | (2,442 | ) | (2,133 | ) | |||||
| Deferred income tax benefit | (1,779 | ) | (2,936 | ) | (122,136 | ) | |||||
| Pension settlement | — | 87 | 8,937 | ||||||||
| Gain on disposal of businesses | (27,444 | ) | — | — | |||||||
| Loss (gain) on disposal of long-lived assets | 13 | (1,394 | ) | (63 | ) | ||||||
| Changes in operating assets and liabilities, net of acquisitions and disposals: | |||||||||||
| Accounts receivable | 12,098 | 6,422 | (784 | ) | |||||||
| Inventories | 9,598 | 15,490 | 5,874 | ||||||||
| Prepaid expenses and other current assets | (12,325 | ) | 4,359 | 5,801 | |||||||
| Accounts payable | (11,924 | ) | 3,123 | (11,182 | ) | ||||||
| Deferred revenue | 5,900 | 8,971 | (4,684 | ) | |||||||
| Accrued warranty and retrofit costs | (1,102 | ) | (1,806 | ) | (123 | ) | |||||
| Accrued compensation and benefits | 6,783 | (2,625 | ) | (4,878 | ) | ||||||
| Accrued restructuring costs | 2,161 | (972 | ) | 1,930 | |||||||
| Accrued pension | 997 | (950 | ) | (5,772 | ) | ||||||
| Accrued expenses and other current liabilities | 1,873 | (3,934 | ) | (4,252 | ) | ||||||
| Net cash provided by operating activities | 53,781 | 54,389 | 36,038 | ||||||||
| Cash flows from investing activities | |||||||||||
| Purchases of property, plant and equipment | (5,518 | ) | (3,635 | ) | (8,653 | ) | |||||
| Purchases of marketable securities | (174,287 | ) | (91,740 | ) | (132,015 | ) | |||||
| Sale/maturity of marketable securities | 112,085 | 145,023 | 131,317 | ||||||||
| Proceeds from divestitures | 85,369 | — | — | ||||||||
| Acquisitions, net of cash acquired | (35,625 | ) | (68,331 | ) | (9,216 | ) | |||||
| Decrease in restricted cash | 177 | 586 | 530 | ||||||||
| Other investment | — | — | (3,000 | ) | |||||||
| Proceeds from the sale of property, plant and equipment | — | 14,082 | — | ||||||||
| Payment of deferred leasing cost | — | (3,134 | ) | — | |||||||
| Net cash used in investing activities | (17,799 | ) | (7,149 | ) | (21,037 | ) | |||||
| Cash flows from financing activities | |||||||||||
| Proceeds from issuance of common stock, net of issuance costs | 1,838 | 1,851 | 1,705 | ||||||||
| Repayment of capital lease obligations | (239 | ) | — | — | |||||||
| Acquisition of noncontrolling interest | (3,189 | ) | — | — | |||||||
| Common stock dividend paid | (22,875 | ) | (21,328 | ) | (20,953 | ) | |||||
| Net cash used in financing activities | (24,465 | ) | (19,477 | ) | (19,248 | ) | |||||
| Effects of exchange rate changes on cash and cash equivalents | (374 | ) | 569 | 53 | |||||||
| Net increase (decrease) in cash and cash equivalents | 11,143 | 28,332 | (4,194 | ) | |||||||
| Cash and cash equivalents, beginning of year | 82,971 | 54,639 | 58,833 | ||||||||
| Cash and cash equivalents, end of year | $ | 94,114 | $ | 82,971 | $ | 54,639 | |||||
| Supplemental disclosures: | |||||||||||
| Cash paid during the year for interest | $ | 202 | $ | 2 | $ | 14 | |||||
| Cash paid (refunded) during the year for income taxes, net | $ | 1,084 | $ | (762 | ) | $ | 4,282 | ||||
| Supplemental disclosure of non-cash investing and financing activities: | |||||||||||
| Acquisition of buildings and land through capital lease | $ | 8,537 | $ | — | $ | — | |||||
The accompanying notes are an integral part of these consolidated financial statements.
60
BROOKS AUTOMATION, INC.
CONSOLIDATED STATEMENTS OF CHANGES IN EQUITY
|
|
|
|
|
|
|
|
|
|
|
|
|
|
|
|
|
|
|
|
|
|
|
|
|
|
|
|
|
|
|
|
|
|
|
|
|
|
|
|
|
|
|
|
|
|
|
|
|
|
|
|
|
|
|
|
|
|
|
|
|
|
|
|
|
|
| Common |
|
|
|
| Accumulated |
|
|
|
|
|
|
|
|
| ||
|
| Common |
| Stock at |
| Additional |
| Other |
|
|
|
|
|
|
|
|
| |||
|
| Stock |
| Par |
| Paid-In |
| Comprehensive |
| Accumulated |
| Treasury |
| Total | ||||||
|
| Shares |
| Value |
| Capital |
| Income |
| Deficit |
| Stock |
| Equity | ||||||
|
| (In thousands, except share data) | ||||||||||||||||||
Balance September 30, 2014 |
| 80,375,777 |
|
| 804 |
|
| 1,834,619 |
|
| 15,687 |
|
| (1,007,265) |
|
| (200,956) |
| $ | 642,889 |
Shares issued under restricted stock and purchase plans, net |
| 717,275 |
|
| 7 |
|
| (421) |
|
|
|
|
|
|
|
|
|
|
| (414) |
Stock-based compensation |
|
|
|
|
|
|
| 12,159 |
|
|
|
|
|
|
|
|
|
|
| 12,159 |
Common stock dividends declared, at $0.40 per share |
|
|
|
|
|
|
|
|
|
|
|
|
| (27,021) |
|
|
|
|
| (27,021) |
Net income |
|
|
|
|
|
|
|
|
|
|
|
|
| 14,221 |
|
|
|
|
| 14,221 |
Foreign currency translation adjustments |
|
|
|
|
|
|
|
|
|
| (9,557) |
|
|
|
|
|
|
|
| (9,557) |
Changes in unrealized gains on marketable securities, net of tax effects of ($83) |
|
|
|
|
|
|
|
|
|
| 141 |
|
|
|
|
|
|
|
| 141 |
Actuarial losses arising in the year, net of tax effects of $115 |
|
|
|
|
|
|
|
|
|
| (605) |
|
|
|
|
|
|
|
| (605) |
Recognition of pension settlement in earnings |
|
|
|
|
|
|
|
|
|
| 232 |
|
|
|
|
|
|
|
| 232 |
Balance September 30, 2015 |
| 81,093,052 |
|
| 811 |
|
| 1,846,357 |
|
| 5,898 |
|
| (1,020,065) |
|
| (200,956) |
|
| 632,045 |
Shares issued under restricted stock and purchase plans, net |
| 1,127,218 |
|
| 10 |
|
| (2,391) |
|
|
|
|
|
|
|
|
|
|
| (2,381) |
Stock-based compensation |
|
|
|
|
|
|
| 11,737 |
|
|
|
|
|
|
|
|
|
|
| 11,737 |
Common stock dividends declared, at $0.40 per share |
|
|
|
|
|
|
|
|
|
|
|
|
| (27,503) |
|
|
|
|
| (27,503) |
Net loss |
|
|
|
|
|
|
|
|
|
|
|
|
| (69,476) |
|
|
|
|
| (69,476) |
Foreign currency translation adjustments |
|
|
|
|
|
|
|
|
|
| 8,844 |
|
|
|
|
|
|
|
| 8,844 |
Changes in unrealized losses on marketable securities, net of tax effects of $58 |
|
|
|
|
|
|
|
|
|
| (106) |
|
|
|
|
|
|
|
| (106) |
Actuarial losses arising in the year, net of tax effects of $161 |
|
|
|
|
|
|
|
|
|
| (322) |
|
|
|
|
|
|
|
| (322) |
Pension curtailment |
|
|
|
|
|
|
|
|
|
| 852 |
|
|
|
|
|
|
|
| 852 |
Balance September 30, 2016 |
| 82,220,270 |
|
| 821 |
|
| 1,855,703 |
|
| 15,166 |
|
| (1,117,044) |
|
| (200,956) |
|
| 553,690 |
Shares issued under restricted stock and purchase plans, net |
| 1,074,578 |
|
| 12 |
|
| 1,937 |
|
|
|
|
|
|
|
|
|
|
| 1,949 |
Stock-based compensation |
|
|
|
|
|
|
| 17,278 |
|
|
|
|
|
|
|
|
|
|
| 17,278 |
Common stock dividends declared, at $0.40 per share |
|
|
|
|
|
|
|
|
|
|
|
|
| (27,932) |
|
|
|
|
| (27,932) |
Net income |
|
|
|
|
|
|
|
|
|
|
|
|
| 62,612 |
|
|
|
|
| 62,612 |
Foreign currency translation adjustments |
|
|
|
|
|
|
|
|
|
| (221) |
|
|
|
|
|
|
|
| (221) |
Changes in unrealized losses on marketable securities, net of tax effects of $0 |
|
|
|
|
|
|
|
|
|
| 2 |
|
|
|
|
|
|
|
| 2 |
Actuarial gains arising in the year, net of tax effects of $(74) |
|
|
|
|
|
|
|
|
|
| 525 |
|
|
|
|
|
|
|
| 525 |
Pension settlement |
|
|
|
|
|
|
|
|
|
| (259) |
|
|
|
|
|
|
|
| (259) |
Balance September 30, 2017 |
| 83,294,848 |
| $ | 833 |
| $ | 1,874,918 |
| $ | 15,213 |
| $ | (1,082,364) |
| $ | (200,956) |
| $ | 607,644 |
| Common Stock Shares | Common Stock at Par Value | Additional Paid-In Capital | Accumulated Other Comprehensive Income | Accumulated Deficit | Treasury Stock | Total Brooks Automation, Inc. Stockholders’ Equity | Noncontrolling Interests in Subsidiaries | Total Equity | ||||||||||||||||||||||||||
| (In thousands, except share data) | ||||||||||||||||||||||||||||||||||
| Balance September 30, 2011 | 79,737,189 | $ | 797 | $ | 1,809,287 | $ | 17,324 | $ | (1,108,105 | ) | $ | (200,956 | ) | $ | 518,347 | $ | 589 | $ | 518,936 | |||||||||||||||
| Shares issued under stock option, restricted stock and purchase plans, net | 53,368 | 1 | (228 | ) | (227 | ) | (227 | ) | ||||||||||||||||||||||||||
| Stock-based compensation | 8,647 | 8,647 | 8,647 | |||||||||||||||||||||||||||||||
| Common stock dividend declared | (21,208 | ) | (21,208 | ) | (21,208 | ) | ||||||||||||||||||||||||||||
| Net income | 136,789 | 136,789 | 46 | 136,835 | ||||||||||||||||||||||||||||||
| Currency translation adjustments | (2,406 | ) | (2,406 | ) | (2,406 | ) | ||||||||||||||||||||||||||||
| Changes in unrealized gain on marketable securities | 393 | 393 | 393 | |||||||||||||||||||||||||||||||
| Actuarial loss arising in the year | (606 | ) | (606 | ) | (606 | ) | ||||||||||||||||||||||||||||
| Recognition of pension settlement in earnings | 8,937 | 8,937 | 8,937 | |||||||||||||||||||||||||||||||
| Balance September 30, 2012 | 79,790,557 | 798 | 1,817,706 | 23,642 | (992,524 | ) | (200,956 | ) | 648,666 | 635 | 649,301 | |||||||||||||||||||||||
| Shares issued under stock option, restricted stock and purchase plans, net | 248,547 | 2 | 186 | 188 | 188 | |||||||||||||||||||||||||||||
| Stock-based compensation | 7,607 | 7,607 | 7,607 | |||||||||||||||||||||||||||||||
| Common stock dividend declared | (21,252 | ) | (21,252 | ) | (21,252 | ) | ||||||||||||||||||||||||||||
| Net loss | (2,215 | ) | (2,215 | ) | 65 | (2,150 | ) | |||||||||||||||||||||||||||
| Currency translation adjustments | (2,113 | ) | (2,113 | ) | (2,113 | ) | ||||||||||||||||||||||||||||
| Changes in unrealized loss on marketable securities, net of tax of $79 | (135 | ) | (135 | ) | (135 | ) | ||||||||||||||||||||||||||||
| Changes in unrealized gain on cash flow hedges, net of tax of $9 | 14 | 14 | 14 | |||||||||||||||||||||||||||||||
| Actuarial gain arising in the year, net of tax of $360 | 1,109 | 1,109 | 1,109 | |||||||||||||||||||||||||||||||
| Recognition of pension settlement in earnings | 87 | 87 | 87 | |||||||||||||||||||||||||||||||
| Balance September 30, 2013 | 80,039,104 | 800 | 1,825,499 | 22,604 | (1,015,991 | ) | (200,956 | ) | 631,956 | 700 | 632,656 | |||||||||||||||||||||||
| Shares issued under restricted stock and purchase plans, net | 336,673 | 4 | 386 | 390 | 390 | |||||||||||||||||||||||||||||
| Stock-based compensation | 11,062 | 11,062 | 11,062 | |||||||||||||||||||||||||||||||
| Common stock dividend declared | (22,635 | ) | (22,635 | ) | (22,635 | ) | ||||||||||||||||||||||||||||
| Acquisition of noncontrolling interest | (2,328 | ) | (2,328 | ) | (861 | ) | (3,189 | ) | ||||||||||||||||||||||||||
| Net income | 31,361 | 31,361 | 161 | 31,522 | ||||||||||||||||||||||||||||||
| Currency translation adjustments | (6,296 | ) | (6,296 | ) | (6,296 | ) | ||||||||||||||||||||||||||||
| Changes in unrealized loss on marketable securities, net of tax of $62 | (104 | ) | (104 | ) | (104 | ) | ||||||||||||||||||||||||||||
| Changes in unrealized loss on cash flow hedges, net of tax of $9 | (14 | ) | (14 | ) | (14 | ) | ||||||||||||||||||||||||||||
| Actuarial loss arising in the year, net of tax of $471 | (503 | ) | (503 | ) | (503 | ) | ||||||||||||||||||||||||||||
| Balance September 30, 2014 | 80,375,777 | $ | 804 | $ | 1,834,619 | $ | 15,687 | $ | (1,007,265 | ) | $ | (200,956 | ) | $ | 642,889 | $ | — | $ | 642,889 | |||||||||||||||
The accompanying notes are an integral part of these consolidated financial statements.
61
BROOKS AUTOMATION, INC.
NOTES TO CONSOLIDATED FINANCIAL STATEMENTS
1. Nature of the Business
Brooks Automation, Inc. (“Brooks”, or the “Company”) is a leading worldwideglobal provider of automation and cryogenic solutions for multiple markets includingapplications and markets. The Company primarily serves the semiconductor manufacturingcapital equipment market and the life sciences. sciences sample management market.
The Company'sCompany’s semiconductor capital equipment market offerings include mission critical automated transport, vacuum, contamination controls solutions and services that are designed to improve throughput, yield and cost of ownership. The Company’s life science sample management market offerings include automation, consumables and instruments, sample storage and support services, as well as informatics that manage samples throughout the customers’ research discovery and development work flows. The Company’s technologies, engineering competencies and global service capabilities provide customers speed to market and ensure high uptime and rapid response, which equate to superior value in their mission-critical controlled environments. Since 1978, the Company has been a leading partner to the global semiconductor manufacturing markets and through product development initiatives and strategic business acquisitions, Brooks has expanded its products and services to meet the needs of customers in the life science markets and in technology markets adjacent to semiconductor.
2. Summary of Significant Accounting Policies
Principles of Consolidation and Basis of Presentation
The consolidated financial statementsaccompanying Consolidated Financial Statements include the accounts of the Company and allits majority-owned subsidiaries. All intercompany accountsbalances and transactions are eliminated. Equityhave been eliminated in consolidation. The Company applies equity method of accounting to investments that provide it with ability to exercise significant influence over the entities in which the Company exercises significant influence but does not controlit lacks controlling financial interest and is not thea primary beneficiary are accounted for using the equity method of accounting.
Use of Estimates
The preparation of financial statements in conformity with accounting principles generally accepted accounting principles in the United States ("GAAP"of America (“GAAP”) requires management to make estimates and assumptions that affect the reported amounts of assets and liabilities and disclosure of contingent assets and liabilities at the date of the financial statements, andas well as the reported amounts of revenue and expenses during the reporting period. Significant estimates are associated with recording accounts receivable, inventories, goodwill, intangible assets other than goodwill, goodwill, long-lived assets, derivative financial instruments, deferred income taxes, warranty and pension obligations, revenue recognized usingin accordance with the percentage of completion method, pension obligations and stock-based compensation expense. AlthoughThe Company assesses the Company regularly assesses these estimates actualon an ongoing basis and records changes in estimates in the period they occur and become known. Actual results could differ from thosethese estimates. Changes
Business Combinations
The Company accounts for business acquisitions using the acquisition method of accounting, in estimatesaccordance with which assets acquired and liabilities assumed are recorded at their respective fair values at the acquisition date. The fair value of the consideration paid, including contingent consideration, is assigned to the assets acquired and liabilities assumed based on their respective fair values. Goodwill represents excess of the purchase price over the estimated fair values of the assets acquired and liabilities assumed.
Significant judgments are used in determining fair values of assets acquired and liabilities assumed, as well as intangibles. Fair value and useful life determinations are based on, among other factors, estimates of future expected cash flows, royalty cost savings and appropriate discount rates used in computing present values. These judgments may materially impact the estimates used in allocating acquisition date fair values to assets acquired and liabilities assumed, as well as the Company’s current and future operating results. Actual results may vary from these estimates which may result in adjustments to goodwill and acquisition date fair values of assets and liabilities during a measurement period in which they become known.or
62
NOTES TO CONSOLIDATED FINANCIAL STATEMENTS - (Continued)
upon a final determination of asset and liability fair values, whichever occurs first. Adjustments to fair values of assets and liabilities made after the end of the measurement period are recorded within the Company’s operating results.
Foreign Currency Translation
Certain transactions of the Company and its subsidiaries are madedenominated in currencies different fromother than their functional currency. Foreign currency exchange gains (losses) ongenerated from the settlement and remeasurement of these transactions or balances are recordedrecognized in earnings and presented within “Other (expense) income, net” when incurred.in the Company’s Consolidated Statements of Operations. Net foreign currency transaction lossesand remeasurement (losses) gains totaled $1.2$(2.3) million,
The determination of the functional currency of the Company’s subsidiaries is based on their financial and operational environment and is the local currency of all of the Company’s foreign subsidiaries. The subsidiaries’ assets and liabilities are translated into the reporting currency at period-end exchange rates, while revenue, expenses, gains and statements of operations itemslosses are translated at the average exchange rates forduring the period. The localGains and losses from foreign currency is considered to be the functional currency for all of the Company's foreign subsidiaries and, accordingly, translation adjustmentstranslations are reportedrecorded in “Accumulatedaccumulated other comprehensive income.” Foreign currency translation adjustments are one ofincome in the componentsCompany’s Consolidated Balance Sheets and presented as a component of comprehensive income (loss) in the Company’s Consolidated Statements of Comprehensive Income (Loss).
Derivative Financial Instruments
All derivatives, whether designated inas a hedging relationship or not, are recorded onin the Consolidated Balance Sheets at fair value. The accounting for changes in fair value of a derivative instrument depends on whether it has been designated and qualifies as part of a hedging relationship and further, on the type of hedging relationship. For those derivative instruments that are designated and qualify as hedging instruments, the Company must designate the hedging instrument based on the exposure being hedged, as a fair value hedge, cash flow hedge or a hedge of a net investment in a foreign operation.operation based on the exposure being hedged. Certain derivatives held by the Company are not designated as hedges but are used in managing exposure to changes in foreign exchange rates.
A fair value hedge is a derivative instrument designated for the purpose of hedging the exposure of changes in fair value of an asset or a liability resulting from a particular risk. If the derivative is designated as a fair value hedge, the changes in the fair value of the derivative and of the hedged item attributable to the hedged risk are both recognized in the results of operations and presented in the same caption in the Consolidated Statements of Operations and Consolidated Statements of Comprehensive Income (Loss).
A cash flow hedge is a derivative instrument designated for the purpose of hedging the exposure to variability in future cash flows resulting from a particular risk. If the derivative is designated as a cash flow hedge, the effective portions of changes in the fair value of the derivative are recorded in accumulated other comprehensive income and are recognized in the results of operations when the hedged item affects earnings. Ineffective portions of changes in the fair value of cash flow hedges are recognized in the results of operations.
A hedge of a net investment in a foreign operation is achieved through a derivative instrument designated for the purpose of hedging the exposure of changes in value of investments in foreign subsidiaries. If the derivative is designated as a hedge of a net investment in a foreign operation, the effective portions of changes in the fair value of the derivative are recorded in other comprehensive income as a part of the foreign currency translation adjustment. Ineffective portions of net investment hedges are recognized in the results of operations.
For derivative instruments not designated as hedging instruments, changes in fair value are recognized in the Consolidated Statements of Operations as gains andor losses consistent with the classification of the underlying risk.
Concentration of Credit Risk
Financial instruments whichthat potentially subject the Company to concentrations of credit risk areconsist of cash deposits and cash equivalents, marketable securities, derivative instruments and accounts receivable. All of the Company’s cash, cash equivalents, marketable securities and derivative instruments are maintained by major financial institutions.
63
NOTES TO CONSOLIDATED FINANCIAL STATEMENTS - (Continued)
The Company invests cash not required for useused in operations in investment grade, high credit quality securities based onin accordance with the Company'sCompany’s investment policy. The Company's investment policy which provides guidelines and limits regarding investments type, concentration, credit quality investment concentration, investment type, and maturity that the Company believes will provideterms aimed at maintaining liquidity and reducereducing risk of loss of capital. The Company’s customers are concentrated in the semiconductor industry, and relatively few customers account for a significant portion of the Company’s revenue. capital loss.
The Company regularly monitors the creditworthiness of its customers and believes that it has adequately provided for exposure to potential credit losses. The Company'sCompany’s top ten largest customers accountaccounted for approximately 37%39%, 40%34% and 45%38% of its consolidated revenue for the fiscal years ended September 30, 2014, 20132017, 2016 and 2012,2015, respectively. One of the Company's customerscustomer accounted for 11% of revenue forapproximately 12% in the fiscal year ended September 30, 2014. At September 30, 2014, no single customer represented2015. No customers accounted for more than 10% of the Company’s accounts receivable.
Fair Value of Financial Instruments
The Company'sCompany’s financial instruments includeconsist of cash and cash equivalents, restricted cash, marketable securities, derivative instruments, accounts receivable, noteloans receivable, convertible debt securities, a stock warrant, contingent consideration and accounts payable. In the case of marketable
Marketable securities and derivative instruments measurement isare measured at fair value based on quoted market prices or observable inputs other than quoted market prices for identical or similar assets or liabilities.
Convertible debt securities or instrumentswere measured at fair value based on the probability-weighted expected return method utilizing various scenarios for the expected payout of the instrument covering the full range of the potential outcomes. Fair value of the asset securities was based upon the present value of the probability of each future outcome becoming available to the asset and the economic rights and preferences of each asset. Stock warrant was measured at fair value based on the Black-Scholes model which representincorporated the constant price variation of the underlying asset, the time value of money, the warrant’s strike price and the time to the warrant’s expiration date. During fiscal year 2017, the Company settled the convertible debt securities and cancelled the stock warrant as a part of the non-cash consideration for the Company’s acquisition of Cool Lab, LLC. Please refer to Note 3, “Acquisitions”, Note 7, “Equity Method and Other Investments” and Note 19, “Fair Value Measurements” for further information on this transaction.
Loans receivable are measured at fair value on a non-recurring basis. The Company considers the subordination features of the loans and the fair value of the collateral when measuring the loans’ fair value. The fair value of the loans receivable is determined based on valuation techniques, principally the discounted cash flow method, and could be different under different conditions or different assumptions, including the varying assumptions regarding future cash flows of the Borrower or discount rates.
Contingent consideration is measured at fair value based on the probability-weighted average discounted cash flow model utilizing potential outcomes related to achievement of certain specified targets and events. The fair value measurement of the contingent consideration is based on probabilities assigned to each potential outcome and the discount rate.
The carrying amounts of other financial instruments reported in the Consolidated Balance Sheetscash, cash equivalent, accounts receivable and accounts payable approximate their fair value because ofdue to their short-term nature.
Cash and Cash Equivalents
Cash and cash equivalents consist of cash and highly liquid investments with original maturities of three months or less that are readily convertible to known amounts of cash. At September 30, 2017 and 2016, cash equivalents were less than $0.1 million and $0.1 million, respectively. Cash equivalents are reported at cost which approximates their fair value due to their short-term nature and varying interest rates.
Accounts Receivable, and Allowance for Doubtful Accounts and Sales Returns
Trade accounts receivable do not bear interest and are recorded at the invoiced amount and do not bear interest.amount. The Company maintains an allowance for doubtful accounts is the Company'srepresenting its best estimate of the amount of probable credit losses inrelated to its existing accounts receivable.receivable and their net realizable value. The Company determines the allowance based on a number of factors,
64
NOTES TO CONSOLIDATED FINANCIAL STATEMENTS - (Continued)
including an evaluation of customer credit worthiness, the age of the outstanding receivable,receivables, economic trends and historical experience. The Company reviews its allowance for doubtful accounts on a quarterly basis and adjusts the balance based on the Company’s estimates of the receivables’ recoverability in the period the changes in estimates are reflected in the period in which theyoccur and become known. Accounts receivable balances are written-offwritten off against the allowance for doubtful accounts when the Company determines that the receivable isbalances are not recoverable. Provisions for doubtful accounts are recorded in "Selling, general and administrative expenses" in the Consolidated Statements of Operations. The Company determines the allowance for sales returns is the Company'sbased on its best estimate of probable returns from its customers.customer returns. Provisions for sales returns are recorded in "Revenue" in the Consolidated Statements of Operations. The Company does not have any off-balance-sheet credit exposure related to its customers.
Inventories
Inventories are stated at the lower of cost or market cost being determined using a standard costing system which approximates cost based on a first-in, first-out method.basis and include the cost of materials, labor and manufacturing overhead. The Company reports inventories at their net realizable value and provides inventory reserves for excess, obsolete or damaged inventory based on changes in customer demand, technology and other economic factors.
Fixed Assets, Intangible Assets and Impairment of Long-lived Assets
Property, plant and equipment are stated at cost, lessnet of accumulated depreciation. Depreciation expense is computed usingbased on the straight-line method. Depreciablemethod and charged to results of operations to allocate the cost of the assets over their estimated useful lives, are summarized below:
Buildings | ||
10 - 40 years | ||
Computer equipment and software | 3 - 7 years | |
Machinery and equipment | 2 - 10 years | |
Furniture and fixtures | 3 - 10 years |
Leasehold improvements are amortized over the shorter of their estimated useful lives or the termremaining terms of the respective leases. Equipment used for demonstrations to customers is included in machinery and equipment and is depreciated over its estimated useful life. Repair and maintenance costs are expensed as incurred.
The Company has developeddevelops software for its internal use. Internaluse and external laborcapitalizes direct costs incurred to develop internal-use software during the application development stage after determining software technological requirements and obtaining management approval for funding projects probable of acompletion. Capitalization of the internal-use software development costs ceases upon substantially completing the project are capitalized. Costs incurred prior to application development and post implementation are expensed as incurred.placing the software into service based on its intended use. Training and data conversion costs, as well as costs incurred prior to the application development stage and during the post-implementation stage are also expensed as incurred.
Cost of disposed ofassets and the relatedassociated accumulated depreciation are removed fromderecognized upon their retirement or at the accounts,time of disposal, and anythe resulting gain or loss is included in the determinationCompany’s results of operating income (loss).
The Company has identified finite-lived intangible assets other than goodwill.goodwill as a result of acquisitions. Finite-lived intangible assets are valued based on estimates ofestimated future cash flows and amortized over their estimated useful life usinglives based on methods that approximate the pattern in which the economic benefits are expected to be realized.
Finite-lived intangibles assets and fixed assets are tested for impairment when indicators of impairment are present. For purposes of this test, long-lived assets are grouped with other assets and liabilities at the lowest level for which identifiable cash flows are largely independent of the cash flows of other assets and liabilities. WhenIf the Company determines that indicators of potential impairment exist,are present, it assesses the next steprecoverability of the impairment test requires that the potentially impaired long-lived asset group is tested for recoverability. The test for recoverability compares theby
65
NOTES TO CONSOLIDATED FINANCIAL STATEMENTS - (Continued)
comparing its undiscounted future cash flows of the long-lived asset group to its carrying value. The future cash flow period is based on the future service life of the primary asset within the long-lived asset group. If the carrying valuesvalue of the long-lived asset group exceed theexceeds its future cash flows, the assets are considered to be potentially impaired. The next step in the impairment process is to determine theCompany determines fair valuevalues of the individual net assets within the long-lived asset group.group to assess potential impairment. If the aggregate fair values of the individual net assets of the group are less than their carrying values, an impairment loss is recorded equal to therecognized for an amount in excess of the group’s aggregate carrying value of the group over the aggregateits fair value. The loss is allocated to each assetthe assets within the group based on their relative carrying values, with no asset reduced below its fair value.
Finite-lived intangible assets including those identifiedare amortized over their useful lives, as a result of purchase accounting, are summarized as follows:
Patents | ||
7 - 15 years | ||
Completed technology | 3 - 10 years | |
Customer relationships | 3 - |
Goodwill
Goodwill represents the excess of a purchase price over the fair value of net tangible and identifiable intangible assets of the businesses acquired by the Company. Goodwill is tested for impairment annually or more often if impairment indicators are present at the reporting unit level. The Company has elected April 1st as its annual goodwill impairment assessment date. If the existence of events or circumstances indicates that it is more likely than not that fair values of the reporting units are below their carrying values, the Company acquired. The Company performs an annualadditional impairment tests during interim periods to evaluate goodwill for impairment.
Application of the goodwill impairment test of its goodwill on September 30 of each fiscal year unless interim indicators of impairment exist. Management's judgments arerequires significant judgment based on market and operational conditions at the time of the evaluation, and can include management'sincluding management’s best estimate of future business activity which in turn drivesand the related estimates of future cash flows from thesethe assets and the reporting units withthat include the associated goodwill. These periodic evaluations could cause management to conclude that impairment factors exist, requiring an adjustment of these assets to their then-current fair market value.values. Future business conditions and/or activity could differ materially from the projections made by management causing the need forwhich could result in additional adjustments and impairment charges.
The testing of goodwill for impairment test is performed at a level referred to as athe reporting unit.unit level. A reporting unit is either the “operatingan operating segment level” or one level below it, which is referred to as a “component.”“component”. The level at which the impairment test is performed requires an assessment as toof whether the operations below thean operating segment constitute a self-sustaining
During the second quarter of fiscal year 2017, the Company currently has four reporting units that have goodwill, including two components that areadopted on a prospective basis the Accounting Standard Update 2017-04, Intangibles- Goodwill and Other (Topic 350): Simplifying the Test for Goodwill Impairment issued by the Financial Accounting Standards Board (the “FASB”) as a part of simplification initiative. The adoption of the Brooks Product Solutions operating segment, one reporting unitguidance is expected to reduce the cost and complexity of evaluating goodwill for impairment and did not have an impact on the Company’s financial position or results of operations during fiscal year 2017. In accordance with provisions of the guidance, the Company first assesses qualitative factors to determine whether the existence of events or circumstances indicates that it is the Brooks Global Services operating segment and one reporting unitmore likely than not that is the Brooks Life Science Systems operating segment.
The Company determines fair values of its reporting units usingbased on an Income Approach, specificallyincome approach in accordance with the Discounted Cash Flow Method (“discounted cash flow method, or DCF Method”).Method. The DCF Method includesis based on projected future cash flow projections, which areflows and terminal value estimates discounted to their present values. Terminal value and an estimate of terminal values, which are also discounted to present value. Terminal values represent therepresents a present value an investor would pay todayon the valuation date for the rights to the cash flows of the business for the fiscal years subsequent to the discrete cash flow projection period. The observable inputs used in the DCF Method include discount rates set above the Company’s weighted-average cost of capital. The Company derives discount rates that are commensurate with the risks and uncertainties inherent in the respective businesses and its internally developed projections of future cash flows. The
66
NOTES TO CONSOLIDATED FINANCIAL STATEMENTS - (Continued)
Company considers the DCF Method to be the most appropriate valuation indicator as the DCF analyses aretechnique since it is based on management'smanagement’s long-term financial projections. GivenDue to the dynamiccyclical nature of the cyclical semiconductor equipment market, management'smanagement’s projections as of the valuation date are considered more objective than comparisons tosince market metrics forof peer companies which fluctuate overduring the cycle. However,In addition, the Company also compares aggregate values of its net corporate assets and reporting unit fair values to its overall market capitalization and uses certain market-based valuation techniques to test the reasonableness of the reporting unit fair values determined byin accordance with the DCF MethodMethod.
Deferred Financing Costs
The Company records commitment fees and comparesother costs directly associated with obtaining line of credit financing as deferred financing costs which are presented within "Other assets" in the aggregate fair valueaccompanying Consolidated Balance Sheets. At September 30, 2017 and 2016, deferred financing costs were $0.5 million and $0.7 million, respectively. Such costs are amortized over the term of the related financing arrangement and included in “Interest expense” in the accompanying Consolidated Statements of Operations. Amortization expense incurred during fiscal years ended September 30, 2017 and 2016 was not material and was included in interest expense in the accompanying Consolidated Statements of Operations. Please refer to Note 9, “Line of Credit” for further information on this arrangement.
Warranty Obligations
The Company offers warranties on the sales of certain of its reporting units plus its net corporate assets to its overall market capitalization.
Defined Benefit Pension Plans
The cost and obligations of the Company'sCompany’s defined benefit pension plans are calculated using manybased on certain assumptions related to estimate the estimated benefits that the employee earnsemployees earn while working, the amount of which cannot be completely determined until the benefit payments cease. MajorKey assumptions used in the accounting for these employee benefit plans include the discount rate, expected return on plan assets and rate of increase in employee compensation levels. Assumptions are determined based on Company data and appropriate market indicators in consultation with third-party actuaries, and are evaluated each year as of the plans'plans’ measurement date.
Revenue Recognition
The Company generates revenue from the following sources:
· | Products, including sales of tool automation and automated cold sample management systems, atmospheric and vacuum robots, contamination control solutions, cryogenic pumps and compressors, as well as consumables and spare parts. |
· | Services, including repairs, upgrades, diagnostic support, installation, as well as biological sample and other support services. |
The Company recognizes revenue for such products and services when it is realized or realizable and earned. Revenue is considered realized and earned when all of the following revenue recognition criteria have been met: (i) persuasive evidence of an arrangement exists with the customer;exists; (ii) delivery of the specified products has occurred or services have been rendered; fees are(iii) the fee is fixed or determinable; and collection of(iv) collectability is probable. The Company recognizes shipping and handling fees billed to customers as revenue and includes the related receivable is reasonably assured. The arrangements for the salecosts in "Cost of certain of the Company's products include customer acceptance provisions. These provisions are included in these arrangements to ensure that the product delivered to the customer meets published specifications. Prior to shipment of its products, the Company typically inspects the product, tests its functionality and documents that it meets the published specifications. In general, the Company's inspections and testing replicate the testing that will be performed at the customer site prior to final acceptance by the customer. In situations where the Company has sufficient history of objectively demonstrating that the acceptance criteriarevenue" in the arrangement has been achieved prior to delivery, which are typically for products with limited customization, revenueaccompanying Consolidated Statements of Operations. Revenue is recognized in advancepresented net of final customer acceptance because there are no remaining substantive contingencies. Arrangements with certain customers also include contingent revenue provisions, in which a portion of the selling price of a delivered item is contingenttaxes assessed by governmental authorities on the delivery of other items or on the delivered items meeting specified performance criteria. In arrangements that include contingent revenue, the amount of revenue that the Company recognizes is limited to the lower of either: the amount billed that is not contingent on acceptance; or the value of the arrangement consideration allocated to the delivered elements, if the product is part of a multiple-element arrangement. When significant on-site customer acceptance provisions are present in the arrangement, or the Company is not able to objectively demonstrate that the acceptance criteria have been met, revenue is recognized upon receiving acceptance from the customer.
67
NOTES TO CONSOLIDATED FINANCIAL STATEMENTS - (Continued)
Products
Revenue from the sale of products is recognized upon their delivery to customers, provided all other revenue recognition criteria have been met. Delivery is considered complete when both of the following conditions have been met: (i) legal title and risk of loss have transferred to the customer upon product shipment or delivery; and (ii) the Company has reliably demonstrated that products have met their required specifications prior to shipment and, as a result, the Company possesses an enforceable claim right to amounts recognized as revenue. Revenue is recognized upon obtaining a customer technical acceptance if the Company was not able to demonstrate that products have met their required specifications prior to shipment and / or legal title and risk of loss did not transfer to the customer upon product shipment or delivery. Revenue from third-party sales for which the Company does not meet the criteria for gross revenue recognition is recognized on a net basis. All other revenue is recognized on a gross basis.
Customer allowances and rebates consist primarily of volume discounts and other incentive programs. Customer allowance and rebate amounts are estimated based on historical experience, contractual terms and expected level of sales during the qualifying incentive program period. The Company records customer allowances and rebates as a reduction of revenue at the time of product sale since they represent a reduction in purchase price.
Revenue from product sales that involve significant customization, which include primarily automated cold sample management systems, is recognized based on the percentage of completion method. The Company recognizes revenue as work progresses based on a percentage thatof actual labor hours incurred labor effort to date bears to total projected labor effort. Profit estimates on long-term contracts are revised periodically based on changes in circumstances,the project to-date and any losses on contracts are accrued in the same period the Company determines that the loss is probable. If the Company determines that a loss is probable, it estimates the amount of the loss by comparing total estimated contract revenue to the total estimated contract costs. Significant judgment is required when estimating total labor costs and progress to completion on these arrangements, as well as whether a loss ishours expected to be incurred on the contract dueproject. The Company develops profit estimates for long-term contracts based on total revenue expected to severalbe generated from the project and total costs anticipated to be incurred. These estimates are based on a number of factors, including the degree of required product customization required and the customer’s existing environment. The Company usesenvironment based on installation work, as well as the Company’s historical experience, project plans and an assessment of the risks and uncertainties inherent in the arrangementcontract related to establish these estimates. Uncertainties in these arrangements include implementation delays or performance issues that may or may not be within the Company'sCompany’s control. The Company also hasestimates a loss on a contract by comparing total estimated contract revenue to the total estimated contract costs and recognizes a loss during the period in which it becomes probable and can be reasonably estimated. The Company reviews profit estimates for long-term contracts during each reporting period and revises them based on changes in circumstances.
The Company uses the completed contract method for certain arrangements for products withthat involve significant product customization thatand include contractual terms that prohibitand customer rights disallowing the use of the percentage of completion method. In some circumstances, percentage ofThe Company recognizes revenue for these arrangements upon completion is not appropriate, as it relates to the contractual rightsor substantial completion of the customer,project, provided all other revenue recognition criteria have been met. The project is considered substantially complete when the Company receives acceptance and remaining tasks are perfunctory or inconsequential and in these casescontrol of the Company usesCompany. Generally, the completed-contract method. Underterms of long-term contracts provide for progress billings based on completion of milestones or other defined phases of work. In certain instances, payments collected from customers in advance of recognizing the completed-contract method, income is recognized only when a contract is completed or substantially completed.
Services
Service revenue is generally recognized ratably over the termperiod of performance, provided all other revenue recognition criteria have been met. Payments due or received from the contract, with payments from customers beingprior to rendering the associated services are recorded as deferred revenue. Revenue from repair services or upgrades of customer-owned equipment is recognized upon completion of the repair effort and upon the shipment of the repaired itemproduct back to the customer. In instances whereIf the repairrepairs or upgrade includesthe upgrades include installation, revenue is recognized when the installation is completed.
Multiple Element Arrangements
Certain customer arrangements related to the sale of the revenue arrangements for the Company'sautomated cold sample management systems and contamination control solution products particularly in sales of life science automation systems, arerepresent multiple element arrangements that can include product, service and other elements. For revenue arrangements with multiple elements,The Company allocates arrangement consideration is allocated to each elementdeliverable that has a standalone value based upon their relativethe selling price usinghierarchy which requires the Company to use vendor-specific objective evidence (“VSOE”(the "VSOE"), of selling price if it exists, or a third-party evidence (“TPE”(the "TPE") or based uponof the relative selling price using estimatedin the absence of VSOE. If neither VSOE nor TPE of selling prices ifprice exists for a deliverable, the Company uses its best estimate of selling price (the "BESP")
68
NOTES TO CONSOLIDATED FINANCIAL STATEMENTS - (Continued)
for that deliverable. The Company has not been able to establish VSOE or TPE does not exist.for the deliverables included in the multiple element arrangements and, as a result, primarily uses BESP to allocate the arrangement consideration. The Company relies primarilydetermines BESP based on estimated selling prices because it generally does not have VSOE or TPE. the cost plus a reasonable margin approach and considers entity-specific, as well as external market factors, when developing such estimates.
The Company recognizes revenue onfor each element of the arrangementdeliverable that has a standalone value in accordance with its policies for revenue recognition. The fair valuerecognition policies. Revenue allocated to the delivered elements is recognized at the time of anydelivery, provided all other revenue recognition criteria are met. Revenue allocated to the undelivered elements is deferred until the undelivered element iselements are delivered and all other criteria for revenue recognition criteria have been met.
Certain multiple element arrangements include the sale of automated cold sample management systems and contamination control solution products with installation services. Revenue allocated to the automated cold sample management systems and contamination control solution products is recognized in accordance with the Company’s revenue recognition policies. Revenue allocated to the installation services is recognized based on the sales of certain of its products and records an accrual for estimated future claims. Such accruals are based upon historical experience and management's estimatepercentage-of-completion method or the completed contract method in which case it is deferred until the installation-related tasks have been completed.
Certain customer arrangements include contingent revenue provisions in which a portion of the levelselling price of future claims.
Research and Development Expenses
Research and development costs are chargedexpensed as incurred and consist primarily of personnel expenses related to expense when incurred.
Stock-Based Compensation
The Company measures stock-based compensation cost for all employee stock awards at fair value on the grant date of grant and recognizes compensationthe expense over the service period for the awards expected to vest. The fair value of restricted stock units is determined based on the number of shares granted and the closing price of the Company'sCompany’s common stock quoted on NASDAQ on the date of grant, and the fair value of stock options is determined using the Black-Scholes valuation model. Such value is recognized asgrant.
The Company recognizes stock-based compensation expense ratably over the service period,on a straight-line basis, net of estimated forfeitures.forfeitures, over the requisite service period. The estimationCompany recognizes benefits from stock-based compensation in equity using the with-and-without approach for the utilization of tax attributes. The Company makes estimates of stock award forfeitures and a number of awards that will ultimatelyexpected to vest which requires significant judgment. The Company considers many factors when estimating expected forfeitures,in developing forfeiture estimates, including award types, of awards, employee class,classes and historical experience. In addition, for stock-based awards where vesting is dependent upon achieving certain operating performance goals, theThe Company estimatesassesses the likelihood of achieving the performance goals for stock-based awards that vest upon the satisfaction of these goals. ActualCurrent estimates may differ from actual results and future changes in estimates, may differ substantially from the Company's current estimates.
The following table reflects stock-based compensation expense, excluding amounts related to discontinued operations, recorded during the fiscal years ended September 30, 2014, 20132017, 2016 and 20122015 (in thousands):
|
|
|
|
|
|
|
|
|
|
|
| Year Ended September 30, | |||||||
|
| 2017 |
| 2016 |
| 2015 | |||
Restricted stock |
| $ | 16,662 |
| $ | 11,220 |
| $ | 11,696 |
Employee stock purchase plan |
|
| 616 |
|
| 517 |
|
| 463 |
Total stock-based compensation expense |
| $ | 17,278 |
| $ | 11,737 |
| $ | 12,159 |
69
| Year ended September 30, | |||||||||||
| 2014 | 2013 | 2012 | |||||||||
| Restricted stock | $ | 10,469 | $ | 7,112 | $ | 7,949 | |||||
| Employee stock purchase plan | 445 | 496 | 549 | ||||||||
| $ | 10,914 | $ | 7,608 | $ | 8,498 | ||||||
NOTES TO CONSOLIDATED FINANCIAL STATEMENTS - (Continued)
Valuation Assumptions for an Employee Stock Purchase Plan
The fair value of shares issued under the employee stock purchase plan wasis estimated on the commencement date of each offering period using the Black-Scholes option-pricing model with the following weighted average assumptions for the fiscal years ended September 30, 2014, 20132017, 2016 and 2012:2015:
|
|
|
|
|
|
|
|
|
| Year Ended September 30, |
| ||||
|
| 2017 |
| 2016 |
| 2015 |
|
Risk-free interest rate |
| 0.9 | % | 0.4 | % | 0.1 | % |
Volatility |
| 34 | % | 32 | % | 31 | % |
Expected life |
| 6 months |
| 6 months |
| 6 months |
|
Dividend yield |
| 3.4 | % | 3.4 | % | 3.4 | % |
| Year ended September 30, | ||||||||
| 2014 | 2013 | 2012 | ||||||
| Risk-free interest rate | 0.1 | % | 0.1 | % | 0.1 | % | ||
| Volatility | 25 | % | 32 | % | 45 | % | ||
| Expected life | 6 months | 6 months | 6 months | |||||
| Dividend yield | 3.40% | 3.30% - 3.40% | 2.75% - 3.30% | |||||
The risk-free rate is based on the U.S. Treasury yield curve in effect atfor notes with terms approximating the timeexpected life of grant for periods correspondingthe shares granted. The expected stock price volatility is determined based on the Company’s historic stock prices over a period commensurate with the expected life of the share; expected volatilities are based on historical volatilities of the Company's common stock; and theshares granted. The expected life represents the weighted average period of time that employee stock purchase planover which the shares are expected to be purchased. Dividend yields are projected based on the Company'sCompany’s history of dividends declared,dividend declarations and management'smanagement’s intention for future dividend declarations.
Restructuring Expenses
The Company's equity incentive plans are intendedCompany records restructuring expenses associated with management-approved restructuring actions to attractstreamline its business operations, improve profitability and retaincompetitiveness, consolidate duplicate infrastructure, as well as reduce headcount resulting from business acquisitions. Restructuring expenses include severance costs related to eliminating a specified number of employees, contract termination costs to vacate facilities and to provide an incentive for them to assist theconsolidate operations, as well as other costs directly associated with restructuring actions. The Company to achieve long-range performance goals and to enable them to participate in the long-term growth of the Company. The equity incentive plans consist of plans under which employees may be granted options to purchase shares of the Company's stock, restricted stockrecords severance and other equity incentives. Stock options generally had a vesting period of 4 yearsemployee termination costs associated with restructuring actions when it is probable that benefits will be paid and the amounts can be reasonably estimated. The rates used in determining restructuring liabilities related to severance costs are exercisable for a period not to exceed 10 years from the date of issuance. Restricted stock awards generally vest over 3 years. At September 30, 2014, a total of 2,486,983 shares were reservedbased on existing plans, historical experience and available for the issuance of awards under the plans.
Income Taxes
The Company records income taxes using the asset and liability method. Deferred income tax assets and liabilities are recognized for the future tax consequences attributable to differences between the financial statement carrying amounts of existing assets and liabilities and their respective income tax bases, andas well as operating loss and tax credit carryforwards. The Company's consolidated financial statementsCompany’s Consolidated Financial Statements contain certain deferred tax assets which have arisen primarilythat were recorded as a result of operating losses, as well as other temporary differences between financial and tax accounting. A valuation allowance is established if the likelihood of realization of theagainst deferred tax assets is not considered more likely than notif, based on anupon the evaluation of positive and negative evidence and the extent to which that evidence is objectively verifiable. verifiable, it is more likely than not that some or all of the deferred tax assets will not be realized.
Significant management judgment is required in determining the Company'sCompany’s income tax provision, for income taxes, the Company'sCompany’s deferred tax assets and liabilities and any valuation allowance recorded against those net deferred tax assets. The Company evaluates the weight of all available evidence to determine whether it is more likely than not that some portion or all of the net deferred income tax assets will not be realized.
The calculation of the Company'sCompany’s tax liabilities involves dealing withconsideration of uncertainties in the application of complex tax regulations. The Company recognizes liabilities for uncertain tax positions based on a two-step process. The first step is to evaluate the tax position for recognition by determining if the weight of available evidence indicates that it is more likely than not that the position will be sustained onupon an audit or an examination conducted by taxing authorities, including resolution of related appeals or litigation processes, if any. If the Company determines that a tax position will more likely than not be sustained, on audit, the second step requires the Company to estimate and measure the tax benefit as the largest amount that is more likely than 50% likelynot to be realized upon ultimate settlement. It is inherently difficult and subjective to estimate such amounts, as the Company has to determine the probability of various possible outcomes. The Company re-evaluates these uncertain tax positions on a quarterly basis. This evaluation is based on factors, such as changes in facts or circumstances, changes in tax law, new audit activity and effectively settled issues. Determining whether an
70
NOTES TO CONSOLIDATED FINANCIAL STATEMENTS - (Continued)
uncertain tax position is effectively settled requires judgment. Such aA change in recognition or measurement wouldmay result in the recognition of a tax benefit or an additional charge to the tax provision.
Earnings Per Share
Basic earningsincome (loss) per share is calculated based ondetermined by dividing net income (loss) by the weighted average number of common shares outstanding during the period. Diluted earningsincome (loss) per share is calculated based on thedetermined by dividing net income (loss) by diluted weighted average number of common shares and dilutive common equivalent shares assumed outstanding during the period. Shares usedDiluted weighted average shares reflect the dilutive effect, if any, of potential common shares. To the extent their effect is dilutive, employee equity awards and other commitments to computebe settled in common stock are included in the calculation of diluted earningsincome per share excludebased on the treasury stock method. Potential common share equivalentsshares are excluded from the calculation of dilutive weighted average shares outstanding if their inclusioneffect would have anbe anti-dilutive effect.
Recently Issued Accounting Pronouncements
In April 2014,January 2017, the FASB issued an amendment to the accounting guidance forrelated to goodwill impairment testing which eliminates the requirement to calculate the fair value of individual assets and liabilities of a reporting discontinued operations. The amendedunit to measure goodwill impairment. In accordance with the provisions of the newly issued guidance, raises the threshold for disposals to qualify as a discontinued operation by requiring a component of an entity should perform its goodwill impairment test by comparing the fair value of the reporting unit with its carrying value and recognize an impairment charge for the amount by which the carrying amount exceeds the reporting unit’s fair value, up to the amount of goodwill allocated to that is held for sale, or has been disposed of by sale, to represent a strategic shift that has or will have a major effect on operations and financial results. Under the amended guidance, a strategic shift could include the disposal of a major line of business, a major geographical area, a major equity method investment or other major parts of an entity. In addition, the new guidance allows companies to have significant continuing involvement and continuing cash flows with the discontinued operation.reporting unit. The amended guidance is effective for fiscal years, and interim periods within those years, beginning on or after December 15, 2014.2019 and should be adopted prospectively. Early adoption of the newly issued guidance is permitted butfor interim or annual goodwill impairment tests performed after January 1, 2017. The Company performs its annual goodwill impairment assessment on April 1st of each fiscal year. The Company adopted the guidance during the second quarter of fiscal year 2017. The adoption of the guidance did not have an impact on the Company’s financial position or results of operations. Please refer to Note 6, “Goodwill and Intangible Assets” for further discussion.
In January 2017, the FASB issued an amendment to the accounting guidance on business combinations to clarify the definition of a business when assessing whether a set of transferred assets and activities represents a business. Such a set of transferred assets and activities does not represent a business if substantially all of the fair value of the gross assets acquired is concentrated in a single identifiable asset or a group of similar identifiable assets. If the threshold is not met, entities need to evaluate whether the set of assets and activities meets the requirement that a business includes, at a minimum, an input and a substantive process that together significantly contribute to the ability to create outputs. The guidance is effective for fiscal years, and interim periods within those years, beginning after December 15, 2017 and should be adopted prospectively. Early adoption of the newly issued guidance is permitted. The Company is currently evaluating the impact of this guidance on its financial position and results of operations.
In June 2016, the FASB issued new accounting guidance for reporting credit losses. The new guidance introduces a new "expected loss" impairment model which applies to most financial assets measured at amortized cost and certain other instruments, including trade and other receivables, loans, held-to-maturity debt securities and other financial assets. Entities are required to estimate expected credit losses over the life of financial assets and record an allowance against the assets’ amortized cost basis to present them at the amount expected to be collected. Additionally, the guidance amends the impairment model for disposals, or classifications as heldavailable for sale that have not been previously reporteddebt securities and requires entities to determine whether all or a portion of the unrealized loss on such debt security is a credit loss. The guidance is effective for fiscal years, and interim periods within those years, beginning after December 15, 2019. Early adoption of the newly issued guidance is permitted for fiscal years, and interim periods within those years, beginning after December 15, 2018. The standard should be applied as a cumulative-effect adjustment to retained earnings as of the beginning of the first reporting period in financial statements.which the guidance is effective. The Company has elected notexpects to adopt the guidance during the first quarter of fiscal year 2021 and is currently evaluating the impact of this amended guidance in regardon its financial position and results of operations.
In March 2016, the FASB issued an amendment to the Granville-Phillips discontinued operation.accounting guidance to simplify accounting for share-based payment awards issued to employees. The amendment requires recognition of excess tax benefits or deficiencies within income tax expense or benefit and changes their presentation requirements on the statement of cash flows. Additionally, the entity can make an accounting policy election to either estimate the number of awards that are expected to vest,
71
NOTES TO CONSOLIDATED FINANCIAL STATEMENTS - (Continued)
consistent with the current accounting guidance, or account for forfeitures as they occur. The guidance is effective for fiscal years, and interim periods within those years, beginning after December 15, 2016. Early adoption of the newly issued guidance is permitted. The Company will adopt the guidance during the first quarter of fiscal year 2018 and is currently evaluating the impact of this guidance on its financial position and results of operations.
In March 2016, the FASB issued an amendment to the accounting guidance to simplify accounting for embedded derivatives. The amendment clarifies the requirements for assessing whether contingent call (put) options that can accelerate the payment of principal on debt instruments are clearly and closely related to the debt host contracts. An entity performing the assessment in accordance with this guidance is required to assess the embedded call (put) options solely in accordance with the four-step decision process set forth in the guidance. The guidance is effective for fiscal years, and interim periods within those years, beginning after December 15, 2016. The Company will adopt the guidance during the first quarter of fiscal year 2018, which is not expected to have a significant impact on its financial position and results of operations.
In February 2016, the FASB issued new accounting guidance for reporting lease transactions. In accordance with provisions of the newly issued guidance, a lessee should recognize at the inception of the arrangement a right-of-use asset and a corresponding lease liability initially measured at the present value of lease payments over the lease term. For finance leases, interest on a lease liability should be recognized separately from the amortization of the right-of-use asset, while for operating leases, total lease costs are recorded on a straight-line basis over the lease term. For leases with a term of twelve months or less, a lessee is permitted to make an accounting policy election by class of underlying assets to forgo recognition of right-of-use assets and corresponding lease liabilities and record a lease expense on a straight-line basis. Entities should determine at the inception of the arrangement whether a contract represents a lease or contains a lease which is defined as a right to control the use of identified property for a period of time in exchange for consideration. Additionally, entities should separate the lease components from the non-lease components and allocate the contract consideration on a relative standalone price basis in accordance with provisions of ASC Topic 606, Revenue from Contracts with Customers. The guidance is effective for fiscal years, and interim periods within those years, beginning after December 15, 2018 and should be adopted via a modified retrospective approach with certain optional practical expedients that entities may elect to apply. The Company expects to adopt the guidance during the first quarter of fiscal year 2020 and is currently evaluating the impact of this guidance on its financial position and results of operations.
In August 2014, the FASB issued new accounting guidance related to evaluation of relevant conditions or events that raise substantial doubt about the entity’s ability to continue as a going concern within one year after the financial statements issuance date. The guidance is effective for fiscal years ending after December 15, 2016, and for annual periods and interim periods thereafter. The Company adopted the guidance during fiscal year 2017 which did not have an impact on its financial position and the results of operations.
In May 2014, the FASB issued new accounting guidance for reporting revenue recognition. The guidance recognizesprovides for the recognition of revenue when promised goods or services are transferred to customers in an amount that reflects the consideration that is expected to be received for those goods or services. The five stepA five-step process set forth in the guidance may make it possible thatrequire more judgment and estimation will be required within the revenue recognition process than required under existingthe current GAAP, including identifying performance obligations in the contract, estimating the amount of variable consideration to include in the transaction price and allocating the transaction price to each separate performance obligation. ThisIn May 2016, the FASB issued an amendment to the revenue recognition guidance which released in May 2014. The amendment is intended to reduce the cost and complexity of applying the revenue recognition guidance and result in a more consistent application of the revenue recognition rules. The amendment clarifies the implementation guidance on collectability, non-cash consideration and the presentation of sales and other similar taxes, as well as transitional guidance related to completed contracts. In April 2016, the FASB issued another amendment to the revenue recognition guidance which clarifies the implementation guidance on identifying performance obligations and licensing. Specifically, such amendment reduces the cost and complexity of identifying promised goods or services and improves the guidance for determining whether promises are separately identifiable. The amendment also provides implementation guidance on determining whether an entity’s promise to grant a license provides a customer with either a right to use the entity’s intellectual property (which is satisfied at a point in time) or a right to access the entity’s intellectual property (which is satisfied over time). The guidance and the related amendments were initially effective for fiscal years, beginning after December 15, 2016. Early adoption is not permitted. The Company is evaluating the impact that the adoption of this guidance will have on its financial position and results of operations.interim periods within those years,
72
NOTES TO CONSOLIDATED FINANCIAL STATEMENTS - (Continued)
beginning after December 15, 2016. In August 2015, the FASB issued an amendment deferring the effective date of the guidance by one year. The Granville-Phillips business unit develops, manufactures, sellsguidance should be adopted retrospectively either for each reporting period presented or via recognizing the cumulative effect at the date of the initial application. Early adoption is permitted only as of annual reporting periods, including the interim periods, beginning after December 15, 2016. The Company expects to adopt the guidance during the first quarter of fiscal year 2019. The Company has initiated the evaluation of the potential impact of adopting the new guidance on its financial position and services vacuum measurementresults of operations, but has not yet completed such assessment or determined the transition method that will be used to adopt the new guidance. The Company is currently reviewing its current accounting policies and gas analysis instrumentationpractices and analyzing the impact of the guidance on its revenue contract portfolio by identifying potential differences that would result from applying the guidance to semiconductorits revenue contracts.
3. Acquisitions
Acquisitions Completed in Fiscal Year 2017
Acquisition of Pacific Bio-Material Management, Inc. and non-semiconductor customers. In March 2014,Novare, LLC
On July 5, 2017, the Company entered into an asset purchase agreement with Pacific Bio-Material Management, Inc. (“PBMMI”) and Novare, LLC, a wholly owned subsidiary of PBMMI (collectively, the “sellers”), pursuant to sell thiswhich the Company acquired substantially all of the assets and liabilities of the sellers’ business related to providing storage, transportation, management, and cold chain logistics of biological materials. The acquisition is expected to expand the Company’s existing capabilities with respect to sample management and integrated cold chain storage and transportation solutions within the Brooks Life Science Systems segment. The Company paid to the sellers cash consideration of $34.3 million, net of cash acquired, which is subject to working capital adjustments. Such consideration included a debt repayment of $0.6 million which was assumed by the Company on behalf of the sellers and paid on the acquisition date.
The Company used a market participant approach to record the assets acquired and liabilities assumed in the PBMMI acquisition. The purchase price allocation is based on a preliminary valuation and subject to further adjustments within the measurement period as additional information becomes available related to the fair value of such assets acquired and liabilities assumed. The fair values of property, plant and equipment, intangible assets acquired and residual goodwill were preliminary as of September 30, 2017. The Company will refine such fair value estimates as new information becomes available during the measurement period. Any adjustments to the purchase price allocation will be made as soon as practicable but no later than one year from the acquisition date.
The preliminary amounts recorded were as follows (in thousands):
|
|
|
|
|
| Fair Value of | |
|
| Assets and | |
|
| Liabilities | |
Accounts receivable (approximates contractual value) |
| $ | 2,800 |
Prepaid expenses and other current assets |
|
| 267 |
Property, plant and equipment |
|
| 2,887 |
Intangible assets |
|
| 8,600 |
Goodwill |
|
| 21,451 |
Accounts payable |
|
| (699) |
Accrued liabilities |
|
| (526) |
Deferred revenue |
|
| (385) |
Other liabilities |
|
| (103) |
Total purchase price, net of cash acquired |
| $ | 34,292 |
Fair values of intangible assets acquired consisted of customer relationship intangible assets of $8.5 million and trademarks of $0.1 million. The Company used the income approach in accordance with the excess-earnings method to estimate the fair value of customer relationship intangible assets which is equal to the present value of the after-tax cash flows attributable to the intangible asset only. The intangible assets acquired are amortized over the total weighted average period of 11.0 years using methods that approximate the pattern in which the economic benefits are expected to be realized.
73
NOTES TO CONSOLIDATED FINANCIAL STATEMENTS - (Continued)
At the closing of the acquisition of PBMMI, a cash payment of $3.3 million was placed into escrow which was ascribed to the purchase price. The escrow balance of $3.3 million included $2.9 million related to satisfaction of the sellers' indemnification obligations with respect to their representations and warranties and other indemnities, as well as $0.4 million payable to the former owner of Novare as a compensation for $87.0a sale of his ownership interest. This escrow arrangement is administered by the Company on behalf of the sellers. The escrow balances were $2.9 million in cash. The sale was completed on Mayand $0.4 million, respectively, as of September 30, 2014. The2017.
Goodwill represents the excess of the consideration transferred over the fair value of the net assets acquired and has been assigned to the Brooks Life Science Systems segment. Goodwill is primarily the result of expected synergies from combining the operations of PBMMI with the Company’s historical financial statements have been revised to present theoperations and is deductible for tax purposes.
The operating results of PBMMI have been reflected in the Granville-Phillips business as a discontinued operation. Summarized results of the discontinued operation are as followsoperations for the Brooks Life Science Systems segment from the date of the acquisition, which included approximately three months of activity during the fourth quarter of fiscal year 2017. During fiscal year ended September 30, 2017, revenue and net income from PBMMI recognized in the Company’s results of operations were $3.4 million and $0.8 million, respectively. During fiscal year ended September 30, 2017, the net income included amortization expense $0.3 million related to acquired intangible assets.
During fiscal year 2017, the Company incurred $0.3 million in non-recurring transaction costs with respect to the PBMMI acquisition which were recorded in "Selling, general and administrative" expenses within the accompanying Consolidated Statements of Operations.
The Company did not present a pro forma information summary for its consolidated results of operations for fiscal years ended September 30, 2014, 20132017 and 20122016 as if the acquisition of PBMMI occurred on October 1, 2015 because such results were immaterial.
Acquisition of Cool Lab, LLC
On November 28, 2016, the Company acquired 100% of the equity of Cool Lab, LLC ("Cool Lab") from BioCision, LLC ("BioCision"). The Company held a 20% equity ownership interest in BioCision prior to the acquisition. Cool Lab was established as a subsidiary of BioCision on November 28, 2016 upon the transfer of certain assets related to cell cryopreservation solutions with net carrying values of $0.9 million. Cool Lab provides a range of patented and/or patent-pending offerings for sample cooling and freezing, controlled rate freezing, portable cryogenic transport and archival storage solutions for customers with temperature-sensitive workflow process. Cool Lab’s offerings assist in managing the temperature stability of therapeutics, biological samples, and related biomaterials in ultra-cold and cryogenic environments. The acquisition of Cool Lab is expected to allow the Company to extend its comprehensive sample management solutions across the cold chain of custody, which is consistent with the other offerings it brings to its life sciences customers. Please refer to Note 7, "Equity Method and Other Investments" for further information on the equity interest in BioCision held by the Company immediately before the acquisition date.
The aggregate purchase price of $15.2 million consisted of a cash payment of $4.8 million, a liability to the seller of $0.1 million and the settlement of certain preexisting relationships with Cool Lab and BioCision, disclosed as non-cash consideration of $10.3 million, which has been measured at fair value on the acquisition date.
The non-cash consideration of $10.3 million consisted of financial instruments of BioCision held by the Company prior to the acquisition of Cool Lab that were subsequently measured at fair value on the acquisition date and delineated as non-cash consideration paid for Cool Lab. Such non-cash consideration was comprised of: (i) the redeemable fair value of the Company’s existing 20% equity ownership interest in BioCision of $3.1 million, (ii) convertible debt securities of BioCision and warrants of $5.6 million to purchase BioCision’s preferred units, and (iii) term notes of BioCision of $1.6 million including accrued interest. Such pre-acquisition financial instruments had an aggregate carrying value of $8.6 million and were measured at an aggregated fair value of $10.3 million on the acquisition date. As a result of such measurement, the Company recognized a net gain of $1.6 million during fiscal year 2017. Please refer to Note 7, "Equity Method Investments" and Note 19, "Fair Value Measurements" for further information on the financial instruments included in the non-cash consideration and the valuation techniques and inputs used in fair value measurements.
74
NOTES TO CONSOLIDATED FINANCIAL STATEMENTS - (Continued)
The Company used a market participant approach to record the assets acquired and liabilities assumed in the Cool Lab acquisition. The purchase price allocation is based on a preliminary valuation and subject to further adjustments within the measurement period as additional information becomes available related to the fair value of such assets acquired and liabilities assumed. The fair values of intangible assets acquired and residual goodwill were preliminary as of September 30, 2017. The Company will refine such fair value estimates as new information becomes available during the measurement period. Any adjustments to the purchase price allocation will be made as soon as practicable but no later than one year from the acquisition date.
The preliminary amounts recorded were as follows (in thousands):
|
|
|
|
|
| Fair Value of Assets | |
Inventory |
| $ | 1,283 |
Intangible assets |
|
| 6,100 |
Goodwill |
|
| 8,527 |
Accrued liabilities |
|
| (30) |
Other liabilities |
|
| (686) |
Total purchase price |
| $ | 15,194 |
Fair values of intangible assets acquired consisted of: (i) a customer relationship intangible asset of $3.6 million attributable to a certain customer, (ii) completed technology of $1.2 million and (iii) other customer relationship intangible assets of $1.3 million. The Company used the income approach in accordance with the excess-earnings method to estimate the fair value of customer relationship intangible assets. The Company used the income approach in accordance with the relief-from-royalty method to estimate the fair value of the completed technology which is equal to the present value of the after-tax royalty savings attributable to owning that intangible asset. The weighted average amortization periods for intangible assets acquired are 3 years for the customer relationship intangible asset attributable to a certain customer, 8 years for completed technology and 10 years for other customer relationship intangible assets. The intangible assets acquired are amortized over the total weighted average period of 5.4 years using methods that approximate the pattern in which the economic benefits are expected to be realized, including percentage of revenue expected to be generated from sales to a certain customer over the contract term.
Goodwill represents the excess of the consideration transferred over the fair value of the net assets acquired and has been assigned to the Brooks Life Science Systems segment. Goodwill is primarily the result of expected synergies from combining the operations of Cool Lab with the Company’s operations and is deductible for tax purposes.
The Company recorded a liability of $0.7 million in the purchase price allocation that represented a pre-acquisition contingency incurred on the acquisition date. The obligation is related to a rebate that is due to a particular customer if the annual product sales volume metrics exceed threshold amounts under the provisions of the contract with this customer assumed by the Company. Fair value of such liability was determined based on a probability weighted discounted cash flow model. The carrying amount of the liability was $0.7 million at September 30, 2017. Additionally, the Company recognized a customer relationship intangible asset of $3.6 million related to this arrangement, as discussed above.
The operating results of Cool Lab have been reflected in the results of operations for the Brooks Life Science Systems segment from the date of the acquisition, which included approximately one month of activity during the first quarter of fiscal year 2017. During fiscal year ended September 30, 2017, revenue and net loss from Cool Lab recognized in the Company’s results of operations were $3.7 million and $0.3 million, respectively. During fiscal year ended September 30, 2017, the net loss included charges of $0.4 million related to the step-up in value of the acquired inventories and amortization expense $1.2 million related to acquired intangible assets.
During fiscal year 2017, the Company incurred $0.4 million in non-recurring transaction costs with respect to the Cool Lab acquisition which were recorded in "Selling, general and administrative" expenses within the accompanying Consolidated Statements of Operations.
75
NOTES TO CONSOLIDATED FINANCIAL STATEMENTS - (Continued)
| Year Ended September 30, | |||||||||||
| 2014 | 2013 | 2012 | |||||||||
| Revenue | $ | 18,921 | $ | 28,512 | $ | 30,468 | |||||
| Income from discontinued operations | $ | 4,888 | $ | 7,779 | $ | 7,919 | |||||
| Gain on the sale of the discontinued operations | 56,804 | — | — | ||||||||
| Income tax provision | 31,690 | 2,815 | 2,919 | ||||||||
| Income from discontinued operations, net of tax | $ | 30,002 | $ | 4,964 | $ | 5,000 | |||||
The Company did not present a pro forma information summary for its consolidated results of operations for fiscal years ended September 30, 2017 and 2016 as if the acquisition of Cool Lab occurred on October 1, 2015 because such results were immaterial.
Other
On August 22, 2017, the Company acquired certain assets and liabilities of RURO, Inc., (the “seller”), a U.S.-based provider of sample management software solutions across multiple end markets, including academic research, government, pharmaceutical, biotech, and healthcare. The acquired FreezerPro® web-based software platform together with an exclusive license to sell and distribute RURO’s BioBankPro® software will allow the Company to complement its existing informatics offerings within the Brooks Life Science Systems segment and extend its informatics solutions to address laboratories, biobanks or enterprises that manage biological samples.
The aggregate purchase price of $5.5 million consisted of a cash payment of $5.2 million and a liability to the seller of $0.4 million. The Company allocated the purchase price of $5.5 million to the assets acquired and liabilities assumed related to the acquisition at their fair values as of the acquisition date, of which $0.1 million was ascribed to accounts receivable, $4.0 million to intangible assets, $1.6 million to goodwill assigned to the Brooks Life Science Systems segment and $0.2 million to deferred revenue. Fair values of intangible assets acquired of $4.0 million consisted of customer relationship intangible assets of $3.1 million and completed technology of $0.9 million. The purchase price allocation is based on a preliminary valuation and subject to further adjustments within the measurement period as additional information becomes available related to the fair value of such assets acquired and liabilities assumed. The Company will refine such fair value estimates as new information becomes available during the measurement period. Any adjustments to the purchase price allocation will be made as soon as practicable but no later than one year from the acquisition date.
At the closing of the acquisition, a cash payment of $0.5 million was placed into escrow which was ascribed to the purchase price. The escrow was related to satisfaction of the sellers' indemnification obligations with respect to their representations and warranties and other indemnities.
The operating results of the Granville-Phillipsacquisition have been reflected in the results of operations for the Brooks Life Science Systems segment from the date of the acquisition, which included approximately one month of activity during the fourth quarter of fiscal year 2017. The Company did not present a pro forma information summary for its consolidated results of operations for fiscal years ended September 30, 2017 and 2016 as if the acquisition occurred on October 1, 2015, as well as revenue or the results of operations related to the acquisition for fiscal year ended September 30, 2017 from the date of acquisition since such results are not material to the Company’s consolidated financial results during the period then ended.
Acquisitions Completed in Fiscal Year 2016
Acquisition of BioStorage Technologies, Inc.
On November 30, 2015, the Company completed its acquisition of BioStorage Technologies, Inc., or BioStorage, an Indiana-based global provider of comprehensive sample management and integrated cold chain solutions for the biosciences industry. These solutions include collection, transportation, processing, storage, protection, retrieval and disposal of biological samples. These solutions combined with the Company’s existing offerings, particularly automation for sample storage and formatting, provide customers with fully integrated sample management cold chain solutions which will help them increase productivity, efficiencies and speed to market. This acquisition will allow the Company to access a broader customer base that is storing samples at ultra cold temperatures and simultaneously provide opportunities for BioStorage to use the Company’s capabilities to expand into new markets.
The Company acquired 100% of the issued and outstanding shares of BioStorage. A cash payment of $130.7 million, net of the seller’s cash of $2.8 million, resulted in a net cash outflow of $128.0 million, including $125.2 million ascribed to the purchase price and $2.5 million for retention arrangements with certain employees based on the completion of a service retention period. The cash payment included a debt repayment of $3.2 million and transaction costs of $2.9 million paid by the Company on behalf of BioStorage.
76
NOTES TO CONSOLIDATED FINANCIAL STATEMENTS - (Continued)
On September 9, 2016, the Company reached a settlement with the sellers of BioStorage’s stock related to certain working capital adjustments. On September 13, 2016, the Company received $0.2 million of proceeds from the sellers as a result of such settlement, which was recorded as a decrease of $0.2 million in the purchase price and goodwill.
The Company recorded the following assets acquired and liabilities assumed related to BioStorage at their fair values as of the acquisition date, from a market participant’s perspective (in thousands):
|
|
|
|
|
| Fair Value of | |
|
| Assets and | |
|
| Liabilities | |
Accounts receivable |
| $ | 16,942 |
Prepaid expenses and other current assets |
|
| 321 |
Property, plant and equipment |
|
| 14,345 |
Intangible assets |
|
| 41,460 |
Goodwill |
|
| 79,639 |
Other assets |
|
| 53 |
Debt assumed |
|
| (385) |
Accounts payable |
|
| (1,708) |
Accrued liabilities |
|
| (9,423) |
Deferred revenue |
|
| (1,766) |
Long-term deferred tax liabilities |
|
| (14,169) |
Other liabilities |
|
| (61) |
Total purchase price, net of cash acquired |
| $ | 125,248 |
At the closing of the acquisition of BioStorage, a cash payment of $5.4 million was placed into escrow which consisted of $2.9 million ascribed to the purchase price and $2.5 million related to retention arrangements with certain employees. The escrow balance was reduced by its full amount subsequent to the acquisition date, and there was no escrow balance outstanding as of September 30, 2017.
The fair value of customer relationship intangible assets of $36.6 million was estimated based on the income approach in accordance with the excess-earnings method. The weighted average amortization period for the customer relationships intangible assets acquired in the BioStorage acquisition is 11.0 years. The fair value of the trademark intangible assets acquired of $4.9 million was estimated based on the income approach in accordance with the relief-from-royalty method. The weighted average amortization period for the trademark intangible assets acquired in the BioStorage acquisition is 8.0 years. The intangible assets acquired are amortized over the total weighted average period of 10.6 years using an accelerated depreciation method which approximates the pattern in which the economic benefits are expected to be realized. Fair values of intangible assets and their estimated useful lives are determined based on estimates of future expected after-tax cash flows and royalty savings, customer attrition rates, discount rates, as well as assumptions about the period of time over which the Company will be deriving economic benefits from the acquired intangible assets.
Goodwill represents the excess of the consideration transferred over the fair value of the net assets acquired and has been assigned to the Company’s Brooks Life Science Systems segment. Goodwill is primarily the result of expected synergies from combining the operations of BioStorage with the Company’s operations and is not deductible for tax purposes.
The operating results of BioStorage have been reflected in the results of operations for the Brooks Life Science Systems segment from the date of the acquisition, which included one month of activity during the first quarter of fiscal year ended September 30, 2016. During fiscal year 2017, revenue and net income from BioStorage recognized in the Company’s results of operations were $62.8 million and $9.3 million, respectively. During fiscal year ended September 30, 2016, revenue and net income from BioStorage recognized in the Company’s results of operations were $44.6 million and $2.4 million, respectively. During fiscal years ended September 30, 2017 and 2016, the net income included amortization expense of $4.6 million and $2.9 million, respectively, related to acquired intangible assets.
77
NOTES TO CONSOLIDATED FINANCIAL STATEMENTS - (Continued)
During fiscal years ended September 30, 2017 and 2016, the Company incurred $0.3 million and $3.2 million, respectively, in non-recurring transaction costs with respect to the BioStorage acquisition which were recorded in "Selling, general and administrative" expenses within the accompanying Consolidated Statements of Operations. The retention payment of $2.5 million was recorded within prepaid expenses and other current assets at the acquisition date and is recognized as a compensation expense over the service period or upon a triggering event in the underlying change in control agreements. During fiscal years ended September 30, 2017 and 2016, the Company recorded $0.1 million and $2.4 million of the compensation-related expense with respect to this arrangement. The retention payment balance was $0.1 million at September 30, 2016. There was no balance related to the retention payment as of September 30, 2017.
The following unaudited proforma financial information represents a summary of the consolidated results of operations for the Company and BioStorage for fiscal year 2016 as if the acquisition of BioStorage occurred on October 1, 2014 (in thousands):
|
|
|
|
|
|
|
|
| Year Ended September 30, | ||||
|
| 2016 |
| 2015 | ||
Revenue |
| $ | 571,369 |
| $ | 593,687 |
Net (loss) income |
|
| (63,396) |
|
| 7,000 |
Basic (loss) income per share |
| $ | (0.93) |
| $ | 0.10 |
Diluted (loss) income per share |
| $ | (0.93) |
| $ | 0.10 |
Weighted average shares outstanding used in computing net (loss) income per share: |
|
|
|
|
|
|
Basic |
|
| 68,507 |
|
| 67,411 |
Diluted |
|
| 68,507 |
|
| 68,549 |
The unaudited pro forma information presented above reflects historical operating results of the Company and BioStorage and includes the impact of certain adjustments directly attributable to the business were historicallycombination. The unaudited pro forma financial information is presented for informational purposes only and is not necessarily indicative of the results of operations that would have been achieved if the acquisition of BioStorage had taken place on October 1, 2014. During fiscal years ended September 30, 2016 and 2015, the adjustments reflected in the unaudited pro forma information included aggregate amortization and depreciation expense of $0.6 million and $4.3 million, respectively, and tax effects of $0.5 million and $0.8 million, respectively. Additionally, the impact of transaction costs of $3.3 million and restructuring charges of $1.9 million was included in the proforma net income during fiscal year ended September 30, 2015 and excluded from the proforma net loss during fiscal year ended September 30, 2016.
Acquisitions Completed in Fiscal Year 2015
Acquisition of Contact Co., Ltd.
On August 14, 2015, the Company acquired all of the outstanding stock of Contact Co., Ltd. (“Contact), a Japanese-based provider of automated cleaner products for wafer carrier devices used in the global semiconductor markets. The acquisition of Contact expanded the Company’s offerings of contamination control solutions within its Brooks Semiconductor Solutions Group segment, strengthened its current capabilities and technology used in its contamination control solutions business and enhanced its long-term strategy of gaining share in its core semiconductor markets.
The aggregate purchase price of $6.8 million, net of cash acquired, consisted of a cash payment of $1.9 million, the assumption of the seller’s debt of $8.8 million, seller’s cash of $4.8 million and a contingent consideration of $0.8 million payable upon achievement of certain specified targets and events. The entire debt amount was fully repaid as of September 30, 2015.
78
NOTES TO CONSOLIDATED FINANCIAL STATEMENTS - (Continued)
The Company recorded the following assets acquired and liabilities assumed related to Contact at their fair values as of the acquisition date, from a market participant’s perspective (in thousands):
|
|
|
|
|
| Fair Value of | |
|
| Assets and | |
|
| Liabilities | |
Accounts receivable |
| $ | 42 |
Inventories |
|
| 2,020 |
Prepaid expenses and other current assets | �� |
| 484 |
Property, plant and equipment |
|
| 79 |
Completed technology |
|
| 2,290 |
Goodwill |
|
| 4,195 |
Other assets |
|
| 1,410 |
Accounts payable |
|
| (1,089) |
Accrued liabilities |
|
| (1,823) |
Long-term deferred tax liabilities |
|
| (774) |
Total purchase price, net of cash acquired |
| $ | 6,834 |
Fair value of the contingent consideration of $0.8 million was determined based on a probability-weighted average discounted cash flow model and recorded in "Accrued expenses and other current liabilities" in the Company’s Consolidated Balance Sheets. The Company remeasured the fair value of the contingent consideration at each reporting date and recognized a corresponding gain of $0.3 million on the fair value remeasurement during fiscal year 2016. Fair value of the contingent consideration was $0.5 million at September 30, 2016. During the first quarter of fiscal year ended September 30, 2017, the Company settled the liability and remitted a cash payment of $0.5 million to the sellers. Please refer to Note 19, “Fair Value Measurements” for further information on the fair value measurement of the contingent consideration.
At September 30, 2017 and 2016, the Company had approximately $0.7 million in escrow related to potential working capital adjustments and the sellers’ satisfaction of general representations and warranties. At the closing of the acquisition of Contact, the escrow balance was $1.5 million which was reduced by approximately $0.8 million during fiscal year 2016 as a result of a payment made to the sellers upon termination of a certain third-party arrangement.
Fair value of the completed technology intangible assets was estimated based on the income approach in accordance with the excess-earnings method. The weighted average amortization period for the completed technology intangible assets acquired in the Contact acquisition is 5.0 years. The intangible assets acquired are amortized using an accelerated depreciation method which approximates the pattern in which the economic benefits are expected to be realized.
Goodwill represents the excess of the consideration transferred over the fair value of the net assets acquired and has been assigned to the Company’s Brooks Semiconductor Solutions Group segment. Goodwill is primarily the result of expected synergies from combining the operations of Contact with the Company’s operations and is not deductible for tax purposes.
The operating results of Contact have been included in the results of operations for the Brooks ProductSemiconductor Solutions Group segment exceptfrom the date of the acquisition. During fiscal year ended September 30, 2017, revenue and net income from Contact recognized in the Company’s results of operations were $7.0 million and $2.0 million, respectively. During fiscal year ended September 30, 2016, revenue and net loss from Contact recognized in the Company’s results of operations were $4.5 million and $1.1 million, respectively. The operating results of Contact for revenuesfiscal year 2015 were insignificant and expenses associated with support and repair services that werehave been included in the results of operations of Brooks Global Services segment.
79
| September 30, 2013 | |||
| Inventory | $ | 3,308 | |
| Property, plant and equipment | 364 | ||
| Goodwill | 24,106 | ||
| Assets held for sale | $ | 27,778 | |
| Deferred revenue | $ | 43 | |
| Accrued warranty and retrofit costs | 89 | ||
| Liabilities held for sale | $ | 132 | |
NOTES TO CONSOLIDATED FINANCIAL STATEMENTS - (Continued)
The Company incurred $0.1 million and $0.2 million, respectively, in 2014
The Company did not present a pro forma information summary for its consolidated results of operations for the fiscal year ended September 30, 2015 as if the acquisition of Contact occurred on October 1, 2013 because such results were insignificant.
Acquisition of FluidX Ltd.
On April 30,October 1, 2014, the Company acquired all of the outstanding stock of Dynamic Micro Systems Semiconductor Equipment GmbH (“DMS”)FluidX Ltd., or FluidX, a GermanUK-based provider of automated contamination control solutions for front opening unified pod, or "FOUP," carriersbiological sample storage tubes and reticle storage, which are targeted at improving yield of semiconductor processes at semiconductor fabrication plants.complementary bench-top instruments. The Company paid, in cash, aggregate merger consideration of $31.6$15.5 million, net of cash acquired. The acquisition of DMS expandsFluidX provided the Company’sCompany with the opportunity to enhance its existing capabilities at semiconductor fabrication plants for yield improvement on new technology nodes.
The Company recorded the following amounts for the assets acquired and liabilities associated with DMSassumed related to FluidX at their fair values as of the acquisition date. The preliminary amounts recorded were as followsdate (in thousands):
|
|
|
|
|
| Fair Values of | |
|
| Assets and | |
|
| Liabilities | |
Accounts receivable |
| $ | 1,980 |
Inventory |
|
| 2,857 |
Prepaid and other current assets |
|
| 213 |
Property, plant and equipment |
|
| 101 |
Completed technology |
|
| 1,230 |
Trademarks and trade names |
|
| 750 |
Customer relationships |
|
| 4,810 |
Goodwill |
|
| 8,247 |
Accounts payable |
|
| (2,079) |
Deferred revenue |
|
| (72) |
Accrued liabilities |
|
| (992) |
Long-term deferred tax liabilities |
|
| (1,540) |
Total purchase price, net of cash acquired |
| $ | 15,505 |
| Accounts receivable | $ | 15,262 | |
| Inventory | 10,051 | ||
| Prepaid and other current assets | 2,727 | ||
| Property, plant and equipment | 2,049 | ||
| Completed technology | 3,610 | ||
| Customer relationships | 7,100 | ||
| Goodwill | 11,638 | ||
| Accounts payable | (10,393 | ) | |
| Accrued liabilities | (5,522 | ) | |
| Deferred revenue | (1,309 | ) | |
| Long-term deferred tax liabilities | (3,588 | ) | |
| Total purchase price, net of cash acquired | $ | 31,625 | |
The purchase price was allocated based on the fair value of the identified assets acquired and liabilities assumed as of the acquisition date from a market participant’s perspective.
On January 23, 2015, the Company reached a settlement onwith respect to certain working capital adjustments with the sellers of DMS' stock inFluidX stock. On February 3, 2015, the fourth quarter of fiscal year 2014. AsCompany made a payment to the sellers as a result of this settlement, which increased the purchase price by $0.1 million. Prior to September 30, 2016, the Company will receivehad $1.5 million in a refund of approximately $2.2 million from certain escrows established atgeneral escrow account held by the date of acquisition.unrelated third party. The amountbalance was remitted to be received is reflected in the allocation presented above as a reduction in the consideration transferred. At September 30, 2014, $3.2 million remained in escrow related to potential future claims against the sellers of DMS' stock.and fully released during fiscal year 2016. The Company has not yet completedfinalized the finalpurchase price allocation of the consideration paid in connection with thefor FluidX acquisition of DMS with respect to matters associated with the balances held in escrow and the potential impact of these matters on deferred tax liabilities. However, the Company expects to complete the final allocation within the measurement period.
Fair values of the trademarks and the completed technology acquired were estimated based on the income approach to valuein accordance with the completed technology acquired. The principle behind this method is that therelief-from-royalty method. Fair value of an intangible asset is equal to the present value of the after-tax royalty savings attributable to owning that intangible asset. The Company used the excess-earnings method, a form ofcustomer relationships acquired was estimated based on the income approach to valuein accordance with the customer relationship acquired. The principle behind this method is that the value of the intangible asset is equal to the present value of the after-tax cash flows attributable to the intangible asset only.excess-earnings method. The weighted average amortization periods for intangible assets acquired in the DMSFluidX acquisition are 5.0 years for each of completed technologiestechnology, trademarks, and 8.0 years for customer relationships. The intangible assets acquired will beare amortized using methods that approximatean accelerated amortization method which approximates the pattern in which the economic benefits are expected to be realized, including variable declining balance and straight-line methods.realized.
80
NOTES TO CONSOLIDATED FINANCIAL STATEMENTS - (Continued)
Goodwill represents the excess of the consideration transferred over the fair value of the net assets acquired and has been assigned to the Company'sCompany’s Brooks Product SolutionsLife Science Systems segment. Goodwill is primarily the result of expected synergies from combining the operations of DMSFluidX with the Company. Goodwill arising from the acquisition of DMSCompany and is not deductible for tax purposes.
The operating results of DMSFluidX have been included in the results of operations for the Brooks Product SolutionsLife Science Systems segment from the date of the acquisition. Revenue from DMS for theDuring fiscal year ended September 30, 2014 was $5.52017, revenue and net loss attributable to FluidX were $17.7 million and the$0.4 million, respectively. During fiscal year ended September 30, 2016, revenue and net loss was $4.5 million. Theattributable to FluidX were $15.6 million and $0.2 million, respectively. During fiscal year ended September 30, 2015, revenue and net loss includesattributable to FluidX were $15.0 million and $0.6 million, respectively. The Company incurred charges to expense of $1.9$1.0 million related to the step-up in value of the acquired inventories $0.9 million ofduring fiscal year ended September 30, 2015, as well as amortization expense of $1.1 million, $1.2 million and $0.3$1.4 million, of restructuring charges.
During fiscal year ended September 30, 2015, the Company incurred $0.5 million in non-recurring transaction costs with respect to the FluidX acquisition which were recorded in "Selling, general and administrative" expenses within the accompanying Consolidated Statements of Operations.
The Company did not present a pro forma information summary for its consolidated results of operations for the fiscal year ended September 30, 2015 as if the acquisition of DMSFluidX occurred on October 1, 2012 (in thousands):
| Year ended September 30, | |||||||
| 2014 | 2013 | ||||||
| Revenue | $ | 501,951 | $ | 456,588 | |||
| Income (loss) from continuing operations | (4,788 | ) | (10,678 | ) | |||
| Net income (loss) attributable to Brooks Automation, Inc. | 25,053 | (5,779 | ) | ||||
| Matrical Assets | Crossing | ||||||
| Accounts receivable | $ | 636 | $ | 5,356 | |||
| Inventory | 2,095 | 8,668 | |||||
| Prepaid and other current assets | 103 | 1,968 | |||||
| Property, plant and equipment | 534 | 2,270 | |||||
| Completed technology | 500 | 10,530 | |||||
| Customer relationships | 1,500 | 20,010 | |||||
| Goodwill | 7,076 | 26,453 | |||||
| Other long-term assets | — | 885 | |||||
| Debt | (902 | ) | — | ||||
| Accounts payable | (294 | ) | (3,024 | ) | |||
| Deferred revenue | (351 | ) | (319 | ) | |||
| Customer deposits | (1,249 | ) | — | ||||
| Other current liabilities | (322 | ) | (5,560 | ) | |||
| Other long-term liabilities | — | (8,232 | ) | ||||
| Total purchase price, net of cash acquired | $ | 9,326 | $ | 59,005 | |||
4. Marketable Securities
The Company invests in marketable securities that are classified as available-for-sale and classifies them as available-for-sale. The Company records these securitiesrecorded at fair value.value in the Company’s Consolidated Balance Sheets. Marketable securities reported as current assets represent investments that mature within one year from the balance sheet date. Long-term marketable securities represent investments with maturity dates greater than one year from the balance sheet date. At the time that the maturity dates of these investments become one year or less, the securities are reclassified to current assets.
Unrealized gains and losses are excluded from earnings and reported as a separate component of accumulated other comprehensive income until the security is sold or matures. At the time of sale, any gainsGains or losses calculated byrealized from sales of marketable securities are computed based on the specific identification method will beand recognized as a component of operating results."Other (expense) income, net" in the accompanying Consolidated Statements of Operations. During fiscal year 2017, the Company sold marketable securities with a fair value and amortized cost of $3.6 million each and recognized net losses of less than $0.1 million. The Company collected cash proceeds of approximately $3.5 million from the sale of marketable securities and reclassified unrealized net holding losses of less than $0.1 million from accumulated other comprehensive income into "Other (expense) income, net" in the accompanying Consolidated Statements of Operations as a result of these transactions. During fiscal year 2016, the Company sold marketable securities with fair values of $127.6 million and amortized costs of $127.7 million and recognized net losses of approximately $0.1 million. Gross gains reported as a component of net losses recognized on the sale of marketable securities during fiscal year 2016 were insignificant. The Company collected cash proceeds of $127.0 million from the sale of marketable securities and reclassified unrealized net holding losses of approximately $0.1 million from accumulated other comprehensive income into "Other (expense) income, net" in the accompanying Consolidated Statements of Operations as a result of these transactions.
81
NOTES TO CONSOLIDATED FINANCIAL STATEMENTS - (Continued)
The following is a summary of marketable securities (included in shortthe amortized cost and long-term marketable securities in the Consolidated Balance Sheets),fair value, including accrued interest receivable, as well as unrealized holding gains (losses) on the short-term and long-term marketable securities as of September 30, 20142017 and 20132016 (in thousands):
|
|
|
|
|
|
|
|
|
|
|
|
|
|
|
|
| Gross |
| Gross |
|
| ||||
|
| Amortized |
| Unrealized |
| Unrealized |
|
| ||||
|
| Cost |
| Gains |
| Losses |
| Fair Value | ||||
September 30, 2017 : |
|
|
|
|
|
|
|
|
|
|
|
|
Corporate securities |
| $ | 2,642 |
| $ | — |
| $ | — |
| $ | 2,642 |
Other debt securities |
|
| 28 |
|
| — |
|
| — |
|
| 28 |
|
| $ | 2,670 |
| $ | — |
| $ | — |
| $ | 2,670 |
September 30, 2016 : |
|
|
|
|
|
|
|
|
|
|
|
|
Corporate securities |
| $ | 2,394 |
| $ | — |
| $ | — |
| $ | 2,394 |
Other debt securities |
|
| 39 |
|
| — |
|
| — |
|
| 39 |
Municipal securities |
|
| 3,704 |
|
| 1 |
|
| (3) |
|
| 3,702 |
|
| $ | 6,137 |
| $ | 1 |
| $ | (3) |
| $ | 6,135 |
| Amortized Cost | Gross Unrealized Gains | Gross Unrealized Losses | Fair Value | ||||||||||||
| September 30, 2014: | |||||||||||||||
| U.S. Treasury securities and obligations of U.S. government agencies | $ | 26,052 | $ | 1 | $ | (39 | ) | $ | 26,014 | ||||||
| Corporate securities | 74,614 | 23 | (174 | ) | 74,463 | ||||||||||
| Mortgage-backed securities | 964 | 36 | — | 1,000 | |||||||||||
| Other debt securities | 7,358 | — | (10 | ) | 7,348 | ||||||||||
| Municipal securities | 15,888 | 1 | (16 | ) | 15,873 | ||||||||||
| Bank certificate of deposits | 26,645 | 2 | (3 | ) | 26,644 | ||||||||||
| $ | 151,521 | $ | 63 | $ | (242 | ) | $ | 151,342 | |||||||
| September 30, 2013: | |||||||||||||||
| U.S. Treasury securities and obligations of U.S. government agencies | $ | 19,528 | $ | 6 | $ | (13 | ) | $ | 19,521 | ||||||
| Corporate securities | 35,045 | 11 | (47 | ) | 35,009 | ||||||||||
| Mortgage-backed securities | 1,093 | 25 | (1 | ) | 1,117 | ||||||||||
| Other debt securities | 88 | — | — | 88 | |||||||||||
| Municipal securities | 25,199 | 15 | (7 | ) | 25,207 | ||||||||||
| Bank certificate of deposits | 9,451 | — | (2 | ) | 9,449 | ||||||||||
| $ | 90,404 | $ | 57 | $ | (70 | ) | $ | 90,391 | |||||||
The fair valuevalues of the marketable securities by contractual maturities at September 30, 2014 by contractual maturity,2017 are shownpresented below (in thousands).
|
|
|
|
|
| Fair Value | |
Due in one year or less |
| $ | 28 |
Due after ten years |
|
| 2,642 |
Total marketable securities |
| $ | 2,670 |
Expected maturities could differ from contractual maturities because the security issuers of the securities may have the right to prepay obligations without prepayment penalties.
| Fair Value | |||
| Due in one year or less | $ | 68,130 | |
| Due after one year through five years | 79,885 | ||
| Due after ten years | 3,327 | ||
| $ | 151,342 | ||
The fair value measurement guidance establishes a fair value hierarchy which requiresCompany reviews the marketable securities for impairment at each reporting period to determine if any of the securities have experienced an entity to maximize the use of observable inputs and minimize the use of unobservable inputs when measuringother-than-temporary decline in fair value. The standard describes three levelsCompany considers factors, such as the length of inputstime and extent to which the market value has been less than the cost, the financial condition and near-term prospects of the issuer, the Company’s intent to sell, or whether it is more likely than not it will be required to sell the investment before recovery of its amortized cost basis. If the Company believes that may be usedan other-than-temporary decline in fair value has occurred, it writes down the investment to measure fair value:
82
NOTES TO CONSOLIDATED FINANCIAL STATEMENTS - (Continued)
5. Property, Plant and liabilities of the Company measured at fair value on a recurring basisEquipment
Property, plant and equipment were as follows as of September 30, 20142017 and 2013 are summarized as follows2016 (in thousands):
|
|
|
|
|
|
|
|
| September 30, | ||||
|
| 2017 |
| 2016 | ||
Buildings and land |
| $ | 46,641 |
| $ | 45,772 |
Computer equipment and software |
|
| 56,544 |
|
| 65,989 |
Machinery and equipment |
|
| 61,173 |
|
| 54,896 |
Furniture and fixtures |
|
| 4,376 |
|
| 5,704 |
Leasehold improvements |
|
| 18,938 |
|
| 17,128 |
Capital projects in progress |
|
| 3,013 |
|
| 5,428 |
|
|
| 190,685 |
|
| 194,917 |
Less accumulated depreciation and amortization |
|
| (132,223) |
|
| (140,032) |
Property, plant and equipment, net |
| $ | 58,462 |
| $ | 54,885 |
| Fair Value Measurements at Reporting Date Using | ||||||||||||||||
| Description | September 30, 2014 | Quoted Prices in Active Markets for Identical Assets (Level 1) | Significant Other Observable Inputs (Level 2) | Significant Unobservable Inputs (Level 3) | ||||||||||||
| Assets | ||||||||||||||||
| Cash equivalents | $ | 6,404 | $ | 5,166 | $ | 1,238 | $ | — | ||||||||
| Available-for-sale securities | 151,342 | — | 151,342 | — | ||||||||||||
| Total Assets | $ | 157,746 | $ | 5,166 | $ | 152,580 | $ | — | ||||||||
| Liabilities | ||||||||||||||||
| Foreign exchange contracts | $ | 58 | $ | — | $ | 58 | $ | — | ||||||||
| Fair Value Measurements at Reporting Date Using | ||||||||||||||||
| Description | September 30, 2013 | Quoted Prices in Active Markets for Identical Assets (Level 1) | Significant Other Observable Inputs (Level 2) | Significant Unobservable Inputs (Level 3) | ||||||||||||
| Assets | ||||||||||||||||
| Cash equivalents | $ | 7,754 | $ | 6,152 | $ | 1,602 | $ | — | ||||||||
| Available-for-sale securities | 90,391 | 2,199 | 88,192 | — | ||||||||||||
| Foreign exchange contracts | 31 | — | 31 | — | ||||||||||||
| Total Assets | $ | 98,176 | $ | 8,351 | $ | 89,825 | $ | — | ||||||||
| Liabilities | ||||||||||||||||
| Foreign exchange contracts | $ | 5 | $ | — | $ | 5 | $ | — | ||||||||
Cash equivalents ofDepreciation $5.2expense was $11.0 million, $13.1 million and $6.2$12.3 million, at respectively, for the fiscal years ended September 30, 20142017, 2016 and 2013, respectively, consisting2015. The Company recorded $0.7 million of Money Market Funds, are classified within Level 1additions to property, plant and equipment for which cash payments had not yet been made as of the fair value hierarchy because they are valued using quoted market prices in active markets. Cash equivalents of $1.2 million and $1.6 million at September 30, 2014 and 2013, respectively, consisting primarily2017.
As of Bank Certificate of Deposits, are classified within Level 2 of the hierarchy because they are not actively traded.
6. Goodwill and Intangible Assets
Goodwill represents the subordinationexcess of net book value over the estimated fair value of net tangible and identifiable intangible assets of a reporting unit. Goodwill is tested for impairment annually or more often if impairment indicators are present at the reporting unit level. The Company elected April 1st as its annual goodwill impairment assessment date. If the existence of events or circumstances indicates that it is more likely than not that fair values of the reporting units are below their carrying values, the Company performs additional impairment tests during interim periods to evaluate goodwill for impairment.
During the second quarter of fiscal year 2017, the Company adopted on a prospective basis the Accounting Standard Update 2017-04, Intangibles- Goodwill and Other (Topic 350): Simplifying the Test for Goodwill Impairment issued by the FASB. The adoption of the guidance is expected to reduce the cost and complexity of evaluating goodwill for impairment and did not have an impact on the Company’s notefinancial position or results of operations during fiscal year 2017. In accordance with provisions of the guidance, the Company initially assesses qualitative factors to debt provided bydetermine whether the existence of events or circumstances indicates that it is more likely than not that the fair value of a new lender as described in "Note 11. Note Receivable." Thereporting unit is less than its carrying value. If the Company determines, based on this assessment, that it is more likely than not that the fair value of the loan,reporting unit is less than its carrying value, it performs a quantitative goodwill impairment test by comparing the reporting unit’s fair value with its carrying value. An impairment loss is recognized for the amount by which the reporting unit’s carrying value exceeds its fair value, up to the total amount of goodwill allocated to the reporting unit. No impairment loss is recognized if the fair value of the reporting exceeds its carrying value.
The Company completed its annual goodwill impairment test as of April 1, 2017 and determined that no adjustment to goodwill was necessary since the fair value of each reporting unit was significantly in excess of the carrying value of each reporting unit. The Company conducted a qualitative assessment for three reporting units within the Brooks Semiconductor Solutions Group segment and determined that it was not likely that their fair values were less than their
83
NOTES TO CONSOLIDATED FINANCIAL STATEMENTS - (Continued)
carrying values. As a result of the analysis, the Company currently estimatesdid not perform the quantitative assessment for these reporting units and did not recognize impairment losses. The Company also performed the quantitative goodwill impairment test for the fourth reporting unit within the Brooks Semiconductor Solutions Group segment and for the Brooks Life Science Systems reporting unit. The Company determined that no adjustment to be $1.0 million, could be different under different conditionsgoodwill was necessary for these two reporting units since their fair values significantly exceeded their respective carrying values. If events occur or different assumptions, includingcircumstances change that would more likely than not reduce the varying assumptions regarding future cash flowsfair value of any reporting unit below its carrying value, the Company will evaluate such reporting unit’s goodwill for impairment between annual tests.
The components of the Borrower or discount rates.
|
|
|
|
|
|
|
|
|
|
|
|
|
|
| Brooks |
|
|
|
|
|
|
|
|
| |
|
| Semiconductor |
| Brooks |
|
|
|
|
|
| ||
|
| Solutions |
| Life Science |
|
|
|
|
|
| ||
|
| Group |
| Systems |
| Other |
| Total | ||||
Gross goodwill, at September 30, 2015 |
| $ | 654,727 |
| $ | 55,625 |
| $ | 26,014 |
| $ | 736,366 |
Accumulated goodwill impairments |
|
| (588,944) |
|
| — |
|
| (26,014) |
|
| (614,958) |
Goodwill, net of accumulated impairments, at September 30, 2015 |
|
| 65,783 |
|
| 55,625 |
|
| — |
|
| 121,408 |
Acquisitions and adjustments |
|
| 1,054 |
|
| 79,676 |
|
| — |
|
| 80,730 |
Gross goodwill, at September 30, 2016 |
| $ | 655,781 |
| $ | 135,301 |
| $ | 26,014 |
| $ | 817,096 |
Accumulated goodwill impairments |
|
| (588,944) |
|
| — |
|
| (26,014) |
|
| (614,958) |
Goodwill, net of accumulated impairments, at September 30, 2016 |
|
| 66,837 |
|
| 135,301 |
|
| — |
|
| 202,138 |
Acquisitions and adjustments |
|
| (19) |
|
| 31,519 |
|
| — |
|
| 31,500 |
Gross goodwill, at September 30, 2017 |
|
| 655,762 |
|
| 166,820 |
|
| 26,014 |
|
| 848,596 |
Accumulated goodwill impairments |
|
| (588,944) |
|
| — |
|
| (26,014) |
|
| (614,958) |
Goodwill, net of accumulated impairments, at September 30, 2017 |
| $ | 66,818 |
| $ | 166,820 |
| $ | — |
| $ | 233,638 |
During fiscal year 2017, the Company recorded a goodwill increase of $31.5 million related to the acquisitions of Cool Lab, PBMMI and equipmentcertain assets and liabilities of RURO, Inc. which represented the excess of the consideration transferred over the fair value of the net assets acquired.
The components of the Company’s identifiable intangible assets as of September 30, 20142017 and 2013, excluding amounts related to the discontinued operations, were2016 are as follows (in thousands):
|
|
|
|
|
|
|
|
|
|
|
|
|
|
|
|
|
|
|
|
| September 30, 2017 |
| September 30, 2016 | ||||||||||||||
|
|
|
| Accumulated |
| Net Book |
|
|
| Accumulated |
| Net Book | ||||||
|
| Cost |
| Amortization |
| Value |
| Cost |
| Amortization |
| Value | ||||||
Patents |
| $ | 9,028 |
| $ | 7,729 |
| $ | 1,299 |
| $ | 7,808 |
| $ | 7,486 |
| $ | 322 |
Completed technology |
|
| 61,662 |
|
| 54,777 |
|
| 6,885 |
|
| 60,485 |
|
| 51,018 |
|
| 9,467 |
Trademarks and trade names |
|
| 9,244 |
|
| 4,969 |
|
| 4,275 |
|
| 9,142 |
|
| 4,204 |
|
| 4,938 |
Customer relationships |
|
| 130,655 |
|
| 59,594 |
|
| 71,061 |
|
| 114,263 |
|
| 47,147 |
|
| 67,116 |
|
| $ | 210,589 |
| $ | 127,069 |
| $ | 83,520 |
| $ | 191,698 |
| $ | 109,855 |
| $ | 81,843 |
| September 30, | |||||||
| 2014 | 2013 | ||||||
| Buildings and land | $ | 47,639 | $ | 38,539 | |||
| Computer equipment and software | 59,962 | 72,240 | |||||
| Machinery and equipment | 42,104 | 49,947 | |||||
| Furniture and fixtures | 4,774 | 9,456 | |||||
| Leasehold improvements | 17,771 | 13,937 | |||||
| Capital projects in progress | 1,528 | 2,042 | |||||
| 173,778 | 186,161 | ||||||
| Less accumulated depreciation and amortization | (123,595 | ) | (138,655 | ) | |||
| Property, plant and equipment, net | $ | 50,183 | $ | 47,506 | |||
Amortization expense excluding amounts related to the discontinued operations,for intangible assets was $12.7$17.1 million,
84
Brooks Product Solutions | Brooks Global Services | Brooks Life Science Systems | Other | Total | |||||||||||||||
| Gross goodwill at September 30, 2012 | $ | 461,738 | $ | 151,238 | $ | 40,302 | $ | 26,014 | $ | 679,292 | |||||||||
| Acquisitions and adjustments during fiscal year 2013 | 20,899 | 5,554 | 7,137 | — | 33,590 | ||||||||||||||
| Gross goodwill at September 30, 2013 | 482,637 | 156,792 | 47,439 | 26,014 | 712,882 | ||||||||||||||
| Acquisitions and adjustments during fiscal year 2014 | 11,638 | — | (61 | ) | — | 11,577 | |||||||||||||
| Gross goodwill at September 30, 2014 | $ | 494,275 | $ | 156,792 | $ | 47,378 | $ | 26,014 | $ | 724,459 | |||||||||
| Accumulated goodwill impairments at September 30, 2012 | $ | (437,706 | ) | $ | (151,238 | ) | $ | — | $ | (26,014 | ) | $ | (614,958 | ) | |||||
| Impairments recorded during fiscal year 2013 | — | — | — | — | — | ||||||||||||||
| Accumulated goodwill impairments at September 30, 2013 | (437,706 | ) | (151,238 | ) | — | (26,014 | ) | (614,958 | ) | ||||||||||
| Impairments recorded during fiscal year 2014 | — | — | — | — | — | ||||||||||||||
| Accumulated goodwill impairments at September 30, 2014 | $ | (437,706 | ) | $ | (151,238 | ) | $ | — | $ | (26,014 | ) | $ | (614,958 | ) | |||||
| Goodwill, less accumulated impairments at September 30, 2013 | $ | 44,931 | $ | 5,554 | $ | 47,439 | $ | — | $ | 97,924 | |||||||||
| Goodwill, less accumulated impairments at September 30, 2014 | $ | 56,569 | $ | 5,554 | $ | 47,378 | $ | — | $ | 109,501 | |||||||||
NOTES TO CONSOLIDATED FINANCIAL STATEMENTS - (Continued)
| Year Ended September 30, | |||||||
| 2014 | 2013 | ||||||
| Reported as cost of revenue: | |||||||
| Completed technology intangible asset impairment | $ | 398 | $ | 1,910 | |||
| Reported as selling, general and administrative expense: | |||||||
| Trademarks and trade name intangible asset impairment | — | 50 | |||||
| Total impairment charges | $ | 398 | $ | 1,960 | |||
| September 30, 2014 | September 30, 2013 | ||||||||||||||||||||||
| Cost | Accumulated Amortization | Net Book Value | Cost | Accumulated Amortization | Net Book Value | ||||||||||||||||||
| Patents | $ | 7,808 | $ | 7,300 | $ | 508 | $ | 7,808 | $ | 7,196 | $ | 612 | |||||||||||
| Completed technology | 57,155 | 41,539 | 15,616 | 57,050 | 40,354 | 16,696 | |||||||||||||||||
| Trademarks and trade names | 3,496 | 3,496 | — | 3,564 | 3,554 | 10 | |||||||||||||||||
| Customer relationships | 73,389 | 29,963 | 43,426 | 66,687 | 23,917 | 42,770 | |||||||||||||||||
| $ | 141,848 | $ | 82,298 | $ | 59,550 | $ | 135,109 | $ | 75,021 | $ | 60,088 | ||||||||||||
Estimated future amortization expense for the intangible assets recorded by the Company as of September 30, 20142017 is as follows (in thousands):
|
|
|
|
Fiscal year ended September 30, |
|
|
|
2018 |
| $ | 18,026 |
2019 |
|
| 17,076 |
2020 |
|
| 15,244 |
2021 |
|
| 9,730 |
2022 |
|
| 7,418 |
Thereafter |
|
| 16,026 |
|
| $ | 83,520 |
| Year ended September 30, | |||
| 2015 | $ | 11,555 | |
| 2016 | 10,240 | ||
| 2017 | 9,536 | ||
| 2018 | 7,229 | ||
| 2019 | 6,660 | ||
| Thereafter | 14,330 | ||
| $ | 59,550 | ||
7. Equity Method and Other Investments
The Company accounts for certain of its investments using the equity method of accounting. Under this method of accounting the Companyand records in income its proportionate share of the investee’s earnings (losses) in its results of the investeeoperations with a corresponding increase (decrease) in the carrying value of the investment.
ULVAC Cryogenics, Inc.
The Company participatesand ULVAC Corporation of Chigasaki, Japan each own a 50% stake in a 50%the joint venture, ULVAC Cryogenics, Inc.Inc (“UCI”) with ULVAC Corporation of Chigasaki, Japan.. UCI manufactures and sells cryogenic vacuum pumps, principally to ULVAC Corporation. At September 30, 2014 and 2013, the
The carrying value of the investment in UCI in the Company's Consolidated Balance Sheet was $22.6$28.6 million and $22.7$25.6 million, respectively. Forrespectively, at September 30, 2017 and 2016. During the fiscal years ended September 30, 2014, 20132017, 2016 and 2012,2015, the Company recorded income associated with UCI of $1.6$9.8 million,
BioCision, LLC
As of September 30, 2016, the Company held a 20% equity interest in BioCision, LLC, or BioCision, a privately-held company based in Larkspur, California, which was accounted for as an equity method investment. The carrying value of the investment in BioCision was $1.7 million at September 30, 2016. During fiscal years ended September 30, 2016 and 2015, the Company recorded a loss associated with BioCision of $1.1 million and $1.0 million, respectively, representing its proportionate share of BioCision’s losses.
At September 30, 2016, the Company held a term loan receivable from BioCision and five-year convertible debt securities with a warrant agreement to purchase BioCision’s preferred units. The convertible debt securities and the warrant were purchased by the Company in fiscal year 2015 for a total purchase price of $5.0 million. The convertible debt securities were accruing interest at the annual rate of 9%, and all principal and accrued interest were due at maturity. The convertible debt securities and the warrant were recorded at fair value during each reporting period, and the remeasurement gains and losses were recognized as a component of "Other (expense) income, net" in the Company’s Consolidated Statements of Operations. The fair value of the convertible debt securities and the warrant was $5.8 million and less than $0.1 million, respectively, at September 30, 2016. During the fiscal year ended September 30, 2016, the Company recognized remeasurement gains of $0.4 million related to these financial instruments. Please refer to Note 19, “Fair Value Measurements” for further information on the valuation techniques and inputs used in fair value measurements of the convertible debt securities and the warrant. The term loan with an aggregate principal amount of $1.5 million bore an annual interest rate of 10% and was provided to BioCision to support its working capital
85
NOTES TO CONSOLIDATED FINANCIAL STATEMENTS - (Continued)
requirements. At September 30, 2016, the term loan was recorded at its carrying value of $1.5 million and included in "Other assets" in the Company’s Consolidated Balance Sheets.
On November 28, 2016, BioCision established Cool Lab as its subsidiary upon transferring certain assets related to cell cryopreservation solutions with net carrying values of $0.9 million, in which the Company acquired a 100% equity interest on that date for an aggregate purchase price of $15.2 million. The purchase price consisted of a cash payment of $4.8 million, a liability to the seller of $0.1 million, which has been satisfied, and non-cash consideration of $10.3 million measured at fair value on the acquisition date which was comprised of: (i) the redeemable fair value of the existing 20% equity ownership interest in BioCision of $3.1 million, (ii) the convertible debt securities of BioCision and warrants of $5.6 million to purchase BioCision’s preferred units, and (iii) the term notes of BioCision of $1.6 million including accrued interest.
The carrying value of the equity method investment in BioCision was $1.2 million on November 28, 2016 and reflected BioCision’s losses of $0.5 million recorded from October 1, 2016 through the acquisition date. Prior to closing the equity investment, the Company traditionally recorded the income and losses related to the equity method investment in BioCision one quarter in arrears. During fiscal year 2017, the Company recorded two additional months of activity in the carrying value of the investment as a result of its settlement. The Company deemed the amount of $0.2 million related to two additional months of activity to be insignificant. The equity method investment in BioCision was measured at fair value of $3.1 million at the acquisition date, and as a result the Company recognized a gain of $1.8 million upon the redemption of the equity method investment in its Consolidated Statements of Operations during fiscal year ended September 30, 2017. On November 28, 2016, convertible debt, warrant and the term loan with carrying values of $5.8 million, less than $0.1 million and $1.6 million, respectively, were measured at their fair values of $5.6 million, less than $0.1 million and $1.6 million, respectively. As a result of such measurement, the Company recognized an aggregate loss of $0.2 million upon the settlement of these financial instruments in "Other (expense) income, net" in its Consolidated Statements of Operations during the year ended September 30, 2017. Please refer to Note 3, "Acquisitions" and Note 19, "Fair Value Measurements" for further information on the acquisition transaction and the valuation techniques and inputs used in fair value measurements.
Yaskawa Brooks Automation, Inc.
During fiscal year 2015, the Company participatesparticipated in a 50% joint venture with Yaskawa Electric Corporation, (“Yaskawa”)or Yaskawa, called Yaskawa Brooks Automation, Inc. (“YBA”), or YBA, which came to closure in March 2015 and was liquidated on September 3, 2015. YBA exclusively marketmarketed and sell Yaskawa'ssold Yaskawa’s semiconductor robotics products and Brooks'the Company’s automation hardware products to semiconductor customers in Japan. At September 30, 2014During the first quarter of fiscal year 2015, the Company and 2013,Yaskawa agreed in principle to dissolve the joint venture. On January 22, 2015, the Company entered into an agreement with YBA to facilitate the acquisition of certain assets and liabilities by the Company’s subsidiary in Japan. In accordance with provisions of the joint venture’s agreement, on March 20, 2015, the Company purchased the net assets of YBA for cash consideration of approximately $1.8 million. The Company recorded the assets received and liabilities assumed from YBA at fair value as of the acquisition date. As a result of the transaction, the Company recorded $0.2 million of goodwill, representing the excess of the consideration transferred over the fair value of the net assets acquired. The Company received a final dividend of $1.8 million upon liquidation of YBA and incurred liquidation costs of $0.2 million during fiscal year 2015. In connection with the planned dissolution, YBA assessed the recoverability of assets held by the joint venture and notified its equity partners of the asset impairment. As a result, the Company recorded an impairment charge of $0.7 million related to the write down of the carrying value of the equity investment in YBA in the Company's Consolidated Balance Sheet was
During the fiscal years ended September 30, 2014, 2013 and 2012,2015, the Company recorded income (expense) associated with YBAa loss of
86
NOTES TO CONSOLIDATED FINANCIAL STATEMENTS - (Continued)
Summarized Financial Information
Summarized financial information for purposes of calculating basic and diluted earnings per sharethe unconsolidated subsidiaries accounted for based on the equity method for the fiscal years ended September 30, 2014, 20132017, 2016 and 20122015 is as follows (in thousands, except perthousands):
|
|
|
|
|
|
|
|
| September 30, | ||||
|
| 2017 |
| 2016 | ||
Balance Sheets: |
|
|
|
|
|
|
Current assets |
| $ | 74,645 |
| $ | 59,507 |
Non-current assets |
|
| 16,829 |
|
| 15,461 |
Current liabilities |
|
| 29,622 |
|
| 25,320 |
Non-current liabilities |
|
| 7,860 |
|
| 19,933 |
|
|
|
|
|
|
|
|
|
|
|
| Fiscal Year Ended September 30, | |||||||
|
| 2017 |
| 2016 |
| 2015 | |||
Statements of Operations: |
|
|
|
|
|
|
|
|
|
Total revenue |
| $ | 104,667 |
| $ | 74,659 |
| $ | 48,047 |
Gross profit |
|
| 41,241 |
|
| 27,355 |
|
| 16,327 |
Income (loss) from continuing operations |
|
| 26,340 |
|
| 6,731 |
|
| (1,074) |
Net income (loss) |
|
| 19,451 |
|
| 2,374 |
|
| (2,452) |
Summarized financial information presented in the table above includes results for UCI for fiscal years ended September 30, 2017, 2016 and 2015 and for BioCision for fiscal years ended September 30, 2016 and 2015. Such summarized financial information does not include results for BioCision for fiscal year ended September 30, 2017 and YBA for fiscal year ended September 30, 2015 since such amounts are not significant. The Company currently records its share data):
| Year ended September 30, | |||||||||||
| 2014 | 2013 | 2012 | |||||||||
| Income (loss) from continuing operations | $ | 1,520 | $ | (7,114 | ) | $ | 131,835 | ||||
| Income from discontinued operations, net of tax | 30,002 | 4,964 | 5,000 | ||||||||
| Net income (loss) | 31,522 | (2,150 | ) | 136,835 | |||||||
| Net income attributable to noncontrolling interests | (161 | ) | (65 | ) | (46 | ) | |||||
| Net income (loss) attributable to Brooks Automation, Inc. | $ | 31,361 | $ | (2,215 | ) | $ | 136,789 | ||||
| Weighted average common shares outstanding used in computing basic earnings per share | 66,648 | 65,912 | 65,128 | ||||||||
| Dilutive common stock options and restricted stock units | 996 | — | 594 | ||||||||
| Weighted average common shares outstanding for purposes of computing diluted earnings per share | 67,644 | 65,912 | 65,722 | ||||||||
| Basic net income (loss) per share attributable to Brooks Automation, Inc. common stockholders: | |||||||||||
| Income (loss) from continuing operations | $ | 0.02 | $ | (0.11 | ) | $ | 2.02 | ||||
| Income from discontinued operations, net of tax | 0.45 | 0.08 | 0.08 | ||||||||
| Basic net income (loss) per share attributable to Brooks Automation, Inc. | $ | 0.47 | $ | (0.03 | ) | $ | 2.10 | ||||
| Diluted net income (loss) per share attributable to Brooks Automation, Inc. common stockholders: | |||||||||||
| Income (loss) from continuing operations | $ | 0.02 | $ | (0.11 | ) | $ | 2.01 | ||||
| Income from discontinued operations, net of tax | 0.44 | 0.08 | 0.08 | ||||||||
| Diluted net income (loss) per share attributable to Brooks Automation, Inc. common stockholders | $ | 0.46 | $ | (0.03 | ) | $ | 2.08 | ||||
8. Supplementary Balance Sheet Information
The following is a summary of diluted earnings per shareaccounts receivable at September 30, 2017 and 2016 (in thousands):
|
|
|
|
|
|
|
|
|
| September 30, |
| September 30, |
| ||
|
| 2017 |
| 2016 |
| ||
Accounts receivable |
| $ | 122,868 |
| $ | 108,713 |
|
Less allowance for doubtful accounts |
|
| (1,959) |
|
| (2,241) |
|
Less allowance for sales returns |
|
| (81) |
|
| (100) |
|
Accounts receivable, net |
| $ | 120,828 |
| $ | 106,372 |
|
The allowance for doubtful accounts activity for the fiscal yearyears ended September 30, 20132017, 2016 and 2015 is as a result of the net loss for that period.
|
|
|
|
|
|
|
|
|
|
|
|
|
|
|
|
|
| Balance at |
|
|
|
| Reversals of |
| Write- |
| Balance at | ||||
|
| Beginning of |
|
|
|
| Bad Debt |
| offs and |
| End of | ||||
Description |
| Period |
| Provisions |
| Expense |
| Adjustments |
| Period | |||||
2017 Allowance for doubtful accounts |
| $ | 2,241 |
| $ | — |
| $ | (190) |
| $ | (92) |
| $ | 1,959 |
2016 Allowance for doubtful accounts |
|
| 1,019 |
|
| 202 |
|
| — |
|
| 1,020 |
|
| 2,241 |
2015 Allowance for doubtful accounts |
|
| 1,031 |
|
| — |
|
| — |
|
| (12) |
|
| 1,019 |
87
NOTES TO CONSOLIDATED FINANCIAL STATEMENTS - (Continued)
The amended loan has a stated interest rate of 10%.
|
|
|
|
|
|
|
|
|
|
|
|
|
|
| Balance at |
|
|
|
| Write- |
| Balance at | |||
|
| Beginning of |
|
|
|
| offs and |
| End of | |||
Description |
| Period |
| Provisions |
| Adjustments |
| Period | ||||
2017 Allowance for sales returns |
| $ | 101 |
| $ | (20) |
| $ | — |
| $ | 81 |
2016 Allowance for sales returns |
|
| 115 |
|
| (14) |
|
| — |
|
| 101 |
2015 Allowance for sales returns |
|
| 133 |
|
| (18) |
|
| — |
|
| 115 |
The Company did not have any notional amounts outstanding under foreign currency contracts that qualify for cash flow hedge accountingfollowing is a summary of inventories at September 30, 2014.2017 and 2016 (in thousands):
|
|
|
|
|
|
|
|
|
| September 30, |
| September 30, |
| ||
|
| 2017 |
| 2016 |
| ||
Inventories |
|
|
|
|
|
|
|
Raw materials and purchased parts |
| $ | 73,819 |
| $ | 60,979 |
|
Work-in-process |
|
| 10,548 |
|
| 16,090 |
|
Finished goods |
|
| 22,028 |
|
| 15,503 |
|
Total inventories |
| $ | 106,395 |
| $ | 92,572 |
|
The Company has transactionsactivity for excess and balances denominated in currencies other than the U.S. dollar. Most of these transactions or balances are denominated in Euros, British Pounds and a variety of Asian currencies. These transactions and balances, including short-term advances between the Company and its subsidiaries, subject the Company's operations to exposure from exchange rate fluctuations. The impact of currency exchange rate movement can be positive or negative in any period. The Company mitigates the impact of potential currency translation gains and losses on short-term intercompany advances through timely settlement of each transaction, generally within 30 days.
|
|
|
|
|
|
|
|
|
|
|
|
|
|
| Balance at |
|
|
|
| Inventory |
| Balance at | |||
|
| Beginning of |
|
|
|
| Disposals and |
| End of | |||
Description |
| Period |
|
| Provisions |
| Adjustments |
| Period | |||
2017 Reserves for excess and obsolete inventory |
| $ | 24,794 |
| $ | 6,636 |
| $ | (7,888) |
| $ | 23,542 |
2016 Reserves for excess and obsolete inventory |
|
| 23,768 |
|
| 7,293 |
|
| (6,267) |
|
| 24,794 |
2015 Reserves for excess and obsolete inventory |
|
| 26,027 |
|
| 7,879 |
|
| (10,138) |
|
| 23,768 |
The activity for valuation allowance for deferred tax assets is as follows for the fiscal years ended September 30, 2017, 2016 and 2015 (in thousands):
|
|
|
|
|
|
|
|
|
|
|
|
|
|
| Balance at |
|
|
|
|
|
| Balance at | |||
|
| Beginning of |
| Charged to |
| Charged to |
| End of | ||||
Description |
| Period |
| Provisions |
| Other Accounts |
| Period | ||||
2017 Valuation allowance for deferred tax assets |
| $ | 104,802 |
| $ | (10,881) |
| $ | (1,624) |
| $ | 92,297 |
2016 Valuation allowance for deferred tax assets |
|
| 18,797 |
|
| 77,531 |
|
| 8,474 |
|
| 104,802 |
2015 Valuation allowance for deferred tax assets |
|
| 18,354 |
|
| (36) |
|
| 479 |
|
| 18,797 |
The Company establishes reserves for estimated cost of product warranties based on historical information. Product warranty reserves are recorded at the time product revenue is recognized, and retrofit accruals are recorded at the time retrofit programs are established. The Company’s warranty obligation is affected by product failure rates, utilization levels, material usage, service delivery costs incurred in correcting a product failure and supplier warranties on parts delivered to the Company.
88
| Year ended September 30, | ||||||||||||
| 2014 | 2013 | 2012 | ||||||||||
| Realized gains (losses) on derivative instruments not designated as hedging instruments | $ | 185 | $ | 123 | $ | (151 | ) | |||||
NOTES TO CONSOLIDATED FINANCIAL STATEMENTS - (Continued)
| Buy Currency | Notional Amount of Buy Currency | Sell Currency | Maturity | Notional Amount of Sell Currency | Fair Value of Assets | Fair Value of Liabilities | ||||||||||||
| U.S. dollar | 1,736 | Japanese yen | October 2014 to December 2014 | 190,000 | $ | — | $ | 11 | ||||||||||
| U.S. dollar | 1,395 | Euro | October 2014 | 1,100 | — | 16 | ||||||||||||
| U.S. dollar | 656 | Taiwan dollar | October 2014 | 20,000 | — | 5 | ||||||||||||
| U.S. dollar | 650 | British pound | October 2014 | 400 | — | 5 | ||||||||||||
| U.S. dollar | 731 | Israeli shekel | October 2014 | 2,700 | — | 5 | ||||||||||||
| U.S. dollar | 76 | Korean won | October 2014 | 80,000 | — | 1 | ||||||||||||
| British pound | 3,513 | Euro | October 2014 | 4,500 | — | 15 | ||||||||||||
| $ | — | $ | 58 | |||||||||||||||
| Buy Currency | Notional Amount of Buy Currency | Sell Currency | Maturity | Notional Amount of Sell Currency | Fair Value of Assets | Fair Value of Liabilities | ||||||||||||
| U.S. dollar | 2,762 | Japanese yen | October 2013 to December 2013 | 273,000 | $ | 8 | $ | — | ||||||||||
| Korean won | 740,000 | U.S. dollar | October 2013 | 688 | — | 2 | ||||||||||||
| U.S. dollar | 304 | Israeli shekel | October 2013 | 1,075 | — | 3 | ||||||||||||
| U.S. dollar | 231 | Singapore dollar | October 2013 | 290 | — | — | ||||||||||||
| $ | 8 | $ | 5 | |||||||||||||||
The fair valuesfollowing is a summary of the forward contracts described above are recorded in the Company's Consolidated Balance Sheets as prepaid expensesproduct warranty and other current assets and accrued expenses and other current liabilities.
|
|
|
|
|
| Amount | |
Balance at September 30, 2014 |
| $ | 6,499 |
Adjustments for acquisitions and divestitures |
|
| 81 |
Accruals for warranties during the year |
|
| 9,917 |
Costs incurred during the year |
|
| (10,408) |
Balance at September 30, 2015 |
|
| 6,089 |
Accruals for warranties during the year |
|
| 9,975 |
Costs incurred during the year |
|
| (9,740) |
Balance at September 30, 2016 |
|
| 6,324 |
Accruals for warranties during the year |
|
| 10,413 |
Costs incurred during the year |
|
| (8,683) |
Balance at September 30, 2017 |
| $ | 8,054 |
9. Line of Credit
On May 26, 2016, the Company and certain of its subsidiaries entered into a credit agreement with Wells Fargo Bank, N.A. (the "Wells Fargo"). The credit agreement provides for a five-year senior secured revolving line of credit (the ‘‘line of credit") of $75.0 million. Availability under the line of credit is subject to a borrowing base which is redetermined from time to time based on certain percentage of certain eligible U.S. assets, including accounts receivable, inventory, real property, as well as machinery and equipment. The agreement includes sublimits of up to $25.0 million for letters of credit and $7.5 million of swing loans at the time there is more than one lender under the credit agreement. The line of credit expires on May 26, 2021 with all outstanding principal and interest due and payable on such date or an earlier date if declared due and payable on such earlier date pursuant to the terms of the credit agreement (by acceleration or otherwise). Subject to certain conditions of the credit agreement, the net cash proceeds from sales of certain collateral during the term of the arrangement are required to be used to prepay borrowings under the line of credit. The Company may also voluntarily prepay certain amounts under the line of credit without penalty or premium. There were no amounts outstanding under the line of credit as of September 30, 2017 and 2016.
Borrowings under the line of credit bear an annual interest rate equal to, at the Company’s option, the base rate or the LIBOR rate plus, in each case, an applicable margin determined based on the Company’s liquidity as of the first day of each fiscal quarter. LIBOR rate is reset at the beginning of each selected interest period based on the rate then in effect. The base rate is a fluctuating interest rate equal to the highest of (i) the federal funds rate plus 0.50%, (ii) the one month LIBOR rate plus 1.00% and (iii) the prime lending rate announced by Wells Fargo. In addition to interest on any outstanding borrowings under the credit agreement, the Company is required to pay monthly fees of 0.25% per year related to unused portion of the revolver commitment amounts. The amount of such fees incurred during fiscal years ended September 30, 2017 and 2016 was insignificant. All outstanding borrowings under the credit agreement are guaranteed by the Company along with certain U.S. subsidiaries and secured by a first priority perfected security interest in substantially all of the Company’s and guarantor’s assets in the U.S., subject to certain exceptions. Additionally, the Company granted Wells Fargo a mortgage lien on certain company-owned real properties.
The line of credit contains certain customary representations and warranties, a financial covenant, affirmative and negative covenants, as well as events of default. In the event in which the Company’s liquidity is less than the greater of (i) 12.5% of the commitments under the line of credit, and (ii) $9.4 million, and continuing until the time such liquidity during a 60‑consecutive day period has been equal to or greater than the greater of (a) 12.5% of the commitments under the line of credit, and (b) $9.4 million, the Company is required to maintain a fixed charge coverage ratio of at least 1.0 to 1.0 measured as of the last day of each fiscal month ending during such period. Liquidity is defined as a sum of (a) excess availability under the credit agreement; and (b) unrestricted cash and cash equivalents located in bank accounts in the United States that are subject to a control agreement in favor of Wells Fargo, limited to a maximum amount of 50% of liquidity. Negative covenants limit the Company’s ability to incur additional indebtedness, liens, sell assets, consolidate or merge with or into other entities, pay non-cash dividends (and cash dividends if the Company fails to meet certain payment conditions), make certain investments, prepay, redeem or retire subordinated debt, and enter
89
| Year Ended September 30, | |||||||||||
| 2014 | 2013 | 2012 | |||||||||
| Current income tax provision (benefit): | |||||||||||
| Federal | $ | 15 | $ | 15 | $ | 15 | |||||
| State | 177 | 70 | 213 | ||||||||
| Foreign | 1,417 | 681 | (1,374 | ) | |||||||
| Total current income tax provision (benefit) | 1,609 | 766 | (1,146 | ) | |||||||
| Deferred income tax benefit: | |||||||||||
| Federal | (2,276 | ) | (5,245 | ) | (121,203 | ) | |||||
| State | (35 | ) | (183 | ) | (439 | ) | |||||
| Foreign | (1,278 | ) | (323 | ) | (3,413 | ) | |||||
| Total deferred income tax benefit | (3,589 | ) | (5,751 | ) | (125,055 | ) | |||||
| Income tax benefit | $ | (1,980 | ) | $ | (4,985 | ) | $ | (126,201 | ) | ||
NOTES TO CONSOLIDATED FINANCIAL STATEMENTS - (Continued)
into certain types of transactions with the Company’s affiliates. If any of the events of default occur and are not waived or cured within applicable grace periods, any unpaid amounts under the credit agreement, including principal and interest, may be declared immediately due and payable and the credit agreement may be terminated. The Company was in compliance with the line of credit covenants as of September 30, 2017 and 2016.
On October 4, 2017, the Company entered into a $200.0 million Senior Secured Term Loan Facility (the “term loan”) with Morgan Stanley Senior Funding, Inc., JPMorgan Chase Bank, N.A. and Wells Fargo Securities, LLC (collectively, the “lenders”). Coincident with the entry into the term loan agreement, the Company amended certain terms and conditions of the credit agreement and entered into an arrangement with Wells Fargo Bank, N.A. and JPMorgan Chase Bank, N.A. Based on the amended terms of the credit agreement, the line of credit continues to provide for revolving credit financing of up to $75.0 million, subject to borrowing base availability. The line of credit matures on October 4, 2022 and expires no less than 90 days prior to the term loan expiration. Borrowing base availability under the amended line of credit excludes collateral related to fixed assets and is redetermined periodically based on certain percentage of certain eligible U.S. assets, including accounts receivable and inventory. The sublimits for letters of credit were reduced to $7.5 million under the amended terms of the credit agreement. All outstanding borrowings under the credit agreement are guaranteed by the Company and BioStorage Technologies, Inc., its wholly-owned subsidiary (“Guarantor”), and subordinated to the obligations under the term loan which are secured by a first priority lien on substantially all of the assets of the Company and the Guarantor, other than accounts receivable and inventory. Please refer to Note 21, “Subsequent Events”, for further information on the term loan transaction.
10. Income Taxes
The components of the income tax provision (benefit) from continuing operations for the fiscal years ended September 30, 2017, 2016 and 2015 are as follows (in thousands):
|
|
|
|
|
|
|
|
|
|
|
| Year Ended September 30, | |||||||
|
| 2017 |
| 2016 |
| 2015 | |||
Current income tax provision (benefit): |
|
|
|
|
|
|
|
|
|
Federal |
| $ | — |
| $ | (145) |
| $ | 10 |
State |
|
| 473 |
|
| (186) |
|
| 56 |
Foreign |
|
| 11,150 |
|
| 5,868 |
|
| 5,537 |
Total current income tax provision |
|
| 11,623 |
|
| 5,537 |
|
| 5,603 |
Deferred income tax provision (benefit): |
|
|
|
|
|
|
|
|
|
Federal |
|
| 538 |
|
| 68,300 |
|
| (1,773) |
State |
|
| 31 |
|
| 4,000 |
|
| (104) |
Foreign |
|
| (52) |
|
| (2,027) |
|
| (296) |
Total deferred income tax provision (benefit) |
|
| 517 |
|
| 70,273 |
|
| (2,173) |
Income tax provision |
| $ | 12,140 |
| $ | 75,810 |
| $ | 3,430 |
The components of income (loss) from continuing operations before income taxes and equity in earnings (losses) of equity method investments for the fiscal years ended September 30, 2014, 20132017, 2016 and 20122015 are as follows (in thousands):
|
|
|
|
|
|
|
|
|
|
|
| Year Ended September 30, | |||||||
|
| 2017 |
| 2016 |
| 2015 | |||
Domestic |
| $ | 26,428 |
| $ | (8,186) |
| $ | (1,321) |
Foreign |
|
| 38,943 |
|
| 12,140 |
|
| 19,136 |
|
| $ | 65,371 |
| $ | 3,954 |
| $ | 17,815 |
| Year Ended September 30, | |||||||||||
| 2014 | 2013 | 2012 | |||||||||
| Domestic | $ | (7,338 | ) | $ | (14,747 | ) | $ | (5,715 | ) | ||
| Foreign | 5,643 | 206 | 9,216 | ||||||||
| $ | (1,695 | ) | $ | (14,541 | ) | $ | 3,501 | ||||
The differences between the income tax benefitprovision (benefit) on income (loss) from continuing operations including income from equity in earnings (losses) of equity method investments and income taxes computed using the applicable
90
NOTES TO CONSOLIDATED FINANCIAL STATEMENTS - (Continued)
U.S. statutory federal tax rate of 35 percent for the fiscal years ended September 30, 2014, 20132017, 2016 and 20122015 are as follows (in thousands):
|
|
|
|
|
|
|
|
|
|
|
| Year Ended September 30, | |||||||
|
| 2017 |
| 2016 |
| 2015 | |||
Income tax provision computed at federal statutory rate |
| $ | 26,163 |
| $ | 2,217 |
| $ | 6,177 |
State income taxes, net of federal benefit |
|
| 960 |
|
| 113 |
|
| 243 |
Foreign income taxed at different rates |
|
| (2,001) |
|
| (755) |
|
| (938) |
Impact of equity investments |
|
| (2,499) |
|
| (1,666) |
|
| (1,069) |
Change in deferred tax asset valuation allowance |
|
| (10,881) |
|
| 77,531 |
|
| (36) |
Net increase (reduction) in uncertain tax positions |
|
| 731 |
|
| (1,543) |
|
| (1,207) |
Nondeductible compensation |
|
| 622 |
|
| 782 |
|
| 1,325 |
Tax credits |
|
| (1,412) |
|
| (1,786) |
|
| (1,741) |
Travel and entertainment |
|
| 266 |
|
| 274 |
|
| 314 |
Merger costs |
|
| — |
|
| 503 |
|
| 228 |
Other |
|
| 191 |
|
| 140 |
|
| 134 |
Income tax provision |
| $ | 12,140 |
| $ | 75,810 |
| $ | 3,430 |
| Year Ended September 30, | |||||||||||
| 2014 | 2013 | 2012 | |||||||||
| Income tax provision (benefit) computed at federal statutory rate | $ | (217 | ) | $ | (4,257 | ) | $ | 1,957 | |||
| State income taxes, net of federal benefit | (12 | ) | (101 | ) | 112 | ||||||
| Foreign income taxed at different rates | (596 | ) | 493 | (832 | ) | ||||||
| Dividends | (1,373 | ) | 115 | 956 | |||||||
| Change in deferred tax asset valuation allowance | 453 | 523 | (125,479 | ) | |||||||
| Reduction in uncertain tax positions | (1,236 | ) | (1,022 | ) | (3,732 | ) | |||||
| Nondeductible compensation | 1,064 | 474 | 1,339 | ||||||||
| Tax credits | (704 | ) | (2,002 | ) | (1,195 | ) | |||||
| Travel and entertainment | 220 | 124 | 139 | ||||||||
| Merger costs | 187 | 251 | — | ||||||||
| Other | 234 | 417 | 534 | ||||||||
| Income tax benefit | $ | (1,980 | ) | $ | (4,985 | ) | $ | (126,201 | ) | ||
The Company has not provided for U.S.deferred income taxes on the unremitted earnings of certainits foreign subsidiaries as these earnings are considered to be indefinitely reinvested. Thesereinvested outside of the U.S. As of September 30, 2017 these earnings amounted to approximately
The significant components of the net deferred tax assets and liabilities as of September 30, 20142017 and 20132016 are as follows (in thousands):
|
|
|
|
|
|
|
|
| September 30, | ||||
|
| 2017 |
| 2016 | ||
Accruals and reserves not currently deductible |
| $ | 18,747 |
| $ | 16,382 |
Federal, state and foreign tax credits |
|
| 25,413 |
|
| 24,183 |
Other assets |
|
| 42 |
|
| 269 |
Equity compensation |
|
| 7,615 |
|
| 4,447 |
Net operating loss carryforwards |
|
| 49,777 |
|
| 73,097 |
Inventory reserves and valuation |
|
| 9,847 |
|
| 11,342 |
Deferred tax assets |
|
| 111,441 |
|
| 129,720 |
Depreciation and intangible amortization |
|
| (21,200) |
|
| (25,850) |
Deferred tax liabilities |
|
| (21,200) |
|
| (25,850) |
Valuation allowance |
|
| (92,297) |
|
| (104,802) |
Net deferred tax liability |
| $ | (2,056) |
| $ | (932) |
| September 30, | |||||||
| 2014 | 2013 | ||||||
| Accruals and reserves not currently deductible | $ | 12,456 | $ | 11,050 | |||
| Federal, state and foreign tax credits | 20,434 | 20,084 | |||||
| Other assets | 3,523 | 1,859 | |||||
| Net operating loss carryforwards | 67,380 | 101,717 | |||||
| Inventory reserves and valuation | 9,956 | 9,052 | |||||
| Deferred tax assets | 113,749 | 143,762 | |||||
| Depreciation and intangible amortization | 12,198 | 12,208 | |||||
| Deferred tax liabilities | 12,198 | 12,208 | |||||
| Valuation allowance | (18,354 | ) | (16,509 | ) | |||
| Net deferred tax asset | $ | 83,197 | $ | 115,045 | |||
ASC Topic 740, Income Taxes, requires that all available evidence, both positive and negative, be considered in determining, based on the weight of that evidence, whether a valuation allowance is needed. The netweight given to the potential effect of negative and positive evidence should be commensurate with the extent to which it can be objectively verified. The more negative evidence that exists, (a) the more positive evidence is necessary and (b) the more difficult it is to support a conclusion that a valuation allowance is not needed for some portion or all of the deferred tax assets, including current and noncurrent, decreased from $115.0 million to $83.2 million during the fiscal year ended September 30, 2014. The decrease of asset. A$31.8 million was primarily driven by a tax provision of $29.9 million related to the taxable gain on the sale of discontinued operations. When the business was sold, the Company realized a higher gain on a tax basis than the gain reported on a GAAP basis. The higher taxable gain resulted in an effective tax rate on the sale
91
NOTES TO CONSOLIDATED FINANCIAL STATEMENTS - (Continued)
cumulative loss in recent years is considered a significant piece of 52.6% when calculated on GAAP results. The gain on sale of discontinued operations was reported net ofnegative evidence that is difficult to overcome in assessing the tax effect in the Consolidated Statements of Operations.
The Company evaluates the realizability of its deferred tax assets will be realized.by tax-paying component and assesses the need for a valuation allowance on an annual and quarterly basis. The Company evaluates the profitability of each tax-paying component on a historic cumulative basis and a forward looking basis in the course of performing this analysis. The Company evaluated all positive evidence considered was three year U.S. historical cumulative profitability, projected future taxable income and length of carry-forward periods of net operating losses and tax credits. The primary negative evidence considered isin concluding it was appropriate to establish a full valuation allowance against U.S. net deferred tax assets during fiscal year 2016.
As a result of this change in assessment, the volatile semiconductor industry in which the Company operates.
The Company will continue to maintain a full valuation allowance on its U.S. deferred tax assets until there is sufficient positive evidence outweighing the negative evidence to support the reversal of all or some portion of these allowances. The Company has continued to maintainreached a valuation allowancepoint of cumulative profitability in the United States against certain tax credits and state net operating losses dueU.S. on a pre-tax income basis which is a starting point of positive evidence. However, as noted in Note 21, “Subsequent Events,” to the uncertainty of their realization based on long-termconsolidated financial statements, the U.S. Company forecasts and the expiration dates on these attributes.entered into a term loan agreement to fund future growth opportunities. The Company has also continueddetermined that the level of historical U.S. core earnings would not be sufficient to maintain a valuation allowance in certain jurisdictions that have not generated historical cumulative profitability.
As of September 30, 2014,2017, the Company had federal, state and foreign net operating loss carryforwardscarry-forwards of approximately
As of September 30, 2017, the Company had federal research and development tax credit carry-forwards of $19.6 million. These credit carry-forwards will expire at various dates beginning in 2019 through 2037. The benefitsCompany also has $10.9 million of state credits which begin to expire in 2018, while some of these tax deductions will be credited to additional paid-in capital upon being realized.
The Company has performed studies to determine if there are any annual limitations on the federal net operating losses under sectionthe Section 382 of the Internal Revenue Code of 1986, as amended, (the “Internalor the Internal Revenue Code”).Code. As a result of these studies, the Company has determined that ownership changes have occurred primarily in connection with acquisitions when the Company has issued stock to the sellers, as well as ownership changes in the subsidiaries acquired by the Company. Certain limitations have been calculated, and the benefits of the net operating losses that will expire before utilization have not been recorded as deferred tax assets in the financial statements. accompanying Consolidated Balance Sheets.
The Company's U.S. net operating losses expire at various dates through
92
NOTES TO CONSOLIDATED FINANCIAL STATEMENTS - (Continued)
consolidated liability for unrecognized income tax benefits during the fiscal years ended September 30, 2014, 20132017, 2016 and 20122015 is as follows (in thousands):
|
|
|
|
|
| Total | |
Balance at October 1, 2014 |
| $ | 4,262 |
Reductions from settlements with taxing authorities |
|
| (1,304) |
Reductions from lapses in statutes of limitations |
|
| (734) |
Foreign exchange rate adjustment |
|
| (33) |
Balance at September 30, 2015 |
|
| 2,191 |
Additions for tax positions in current year |
|
| 4,165 |
Net reductions from lapses in statutes of limitations |
|
| (897) |
Foreign exchange rate adjustment |
|
| (32) |
Balance at September 30, 2016 |
|
| 5,427 |
Additions for tax positions in current year |
|
| 1,869 |
Reduction for tax positions in prior year |
|
| (3,485) |
Reductions from lapses in statutes of limitations |
|
| (431) |
Foreign exchange rate adjustment |
|
| (2) |
Balance at September 30, 2017 |
| $ | 3,378 |
| Unrecognized Tax Benefit | Interest and Penalties | Total | |||||||||
| Balance at October 1, 2011 | $ | 9,011 | $ | 1,989 | $ | 11,000 | |||||
| Additions for tax positions of prior years | 242 | 247 | 489 | ||||||||
| Reductions from lapses in statutes of limitations | (3,125 | ) | (607 | ) | (3,732 | ) | |||||
| Foreign exchange rate adjustment | (167 | ) | 15 | (152 | ) | ||||||
| Balance at September 30, 2012 | 5,961 | 1,644 | 7,605 | ||||||||
| Additions for tax positions of prior years | — | 228 | 228 | ||||||||
| Additions for tax positions related to acquired entities | 116 | — | 116 | ||||||||
| Reductions from lapses in statutes of limitations | (944 | ) | (78 | ) | (1,022 | ) | |||||
| Foreign exchange rate adjustment | 14 | — | 14 | ||||||||
| Balance at September 30, 2013 | 5,147 | 1,794 | 6,941 | ||||||||
| Additions for tax positions of prior years | — | 286 | 286 | ||||||||
| Reductions from lapses in statutes of limitations | (861 | ) | (375 | ) | (1,236 | ) | |||||
| Foreign exchange rate adjustment | (24 | ) | — | (24 | ) | ||||||
| Balance at September 30, 2014 | $ | 4,262 | $ | 1,705 | $ | 5,967 | |||||
Included in the Company'sending balance of unrecognized tax benefits for the fiscal year ended September 30, 2017 are $3.0 million of tax benefits that if recognized would affectimpact the effective tax rate. The Company recognizes interest related to unrecognized benefits as a component of income tax expense,provision (benefit), of which
The Company is subject to U.S. federal income tax and various state, local and international income taxes in various jurisdictions. The amount of income taxes paid is subject to the Company'sCompany’s interpretation of applicable tax laws in the jurisdictions in which it files.
In the normal course of business, the Company is subject to examination by taxing authorities throughout the world. The statute of limitations lapsed on several uncertain tax positions in the foreign jurisdictions during fiscal year 2014 that resulted in a
11. Derivative Instruments
The Company has transactions and balances denominated in currencies other than the U.S. dollar. Most of these transactions or balances are denominated in Euros, British Pounds and a variety of Asian currencies. These transactions and balances, including short-term advances between $1.2the Company and its subsidiaries, subject the Company’s operations to exposure from exchange rate fluctuations. The impact of currency exchange rate movement can be positive or negative in any period. The Company mitigates the impact of potential currency transaction gains and losses on short-term intercompany advances through timely settlement of each transaction, generally within 30 days.
The Company also enters into foreign exchange contracts to reduce its exposure to currency fluctuations. Under forward contract arrangements, the Company typically agrees to purchase a fixed amount of U.S. dollars in exchange for a fixed amount of a foreign currency on specified dates with maturities of three months or less. These transactions do not qualify for hedge accounting. Net gains and losses related to these contracts are recorded as a component of "Other
93
NOTES TO CONSOLIDATED FINANCIAL STATEMENTS - (Continued)
(expense) income, net" in the accompanying Consolidated Statements of Operations and are as follows for the fiscal years ended September 30, 2017, 2016 and 2015 (in thousands):
|
|
|
|
|
|
|
|
|
|
|
|
|
|
|
|
|
|
|
|
|
| Fiscal Year Ended September 30, | |||||||
|
| 2017 |
| 2016 |
| 2015 | |||
Realized (losses) gains on derivatives not designated as hedging instruments |
| $ | (545) |
| $ | 1,434 |
| $ | 628 |
The Company had the following notional amounts outstanding under foreign currency contracts that do not qualify for hedge accounting at September 30, 2017 and 2016 (in thousands):
|
|
|
|
|
|
|
|
|
|
|
|
|
|
|
September 30, 2017: |
|
|
|
|
|
|
|
|
|
|
|
|
|
|
|
| Notional Amount |
|
|
|
|
| Notional Amount |
| Fair Value of |
| Fair Value of | ||
Buy Currency |
| of Buy Currency |
| Sell Currency |
| Maturity |
| of Sell Currency |
| Assets |
| Liabilities | ||
Japanese Yen |
| 391,500 |
| U.S. Dollar |
| October 2017 |
| 3,473 |
| $ | 1 |
| $ | — |
U.S. Dollar |
| 1,074 |
| British Pound |
| October 2017 |
| 800 |
|
| 1 |
|
| — |
Korean Won |
| 3,230,100 |
| U.S. Dollar |
| October 2017 |
| 2,833 |
|
| — |
|
| (8) |
U.S. Dollar |
| 6,294 |
| Chinese Yuan |
| October 2017 |
| 41,800 |
|
| — |
|
| (2) |
Euro |
| 13,700 |
| U.S. Dollar |
| October 2017 |
| 16,167 |
|
| — |
|
| (62) |
British Pound |
| 188 |
| Norwegian Krone |
| October 2017 |
| 2,000 |
|
| — |
|
| — |
Singapore Dollar |
| 700 |
| U.S. Dollar |
| October 2017 |
| 515 |
|
| — |
|
| — |
U.S. Dollar |
| 226 |
| Israeli Shekel |
| October 2017 |
| 800 |
|
| — |
|
| — |
U.S. Dollar |
| 3,600 |
| Swiss Franc |
| October 2017 |
| 3,500 |
|
| 2 |
|
| — |
Euro |
| 19,200 |
| British Pound |
| October 2017 |
| 16,888 |
|
| — |
|
| (74) |
|
|
|
|
|
|
|
|
|
| $ | 4 |
| $ | (146) |
|
|
|
|
|
|
|
|
|
|
|
|
|
|
|
September 30, 2016: |
|
|
|
|
|
|
|
|
|
|
|
|
|
|
|
| Notional Amount |
|
|
|
|
| Notional Amount |
| Fair Value of |
| Fair Value of | ||
Buy Currency |
| of Buy Currency |
| Sell Currency |
| Maturity |
| of Sell Currency |
| Assets |
| Liabilities | ||
British Pound |
| 190 |
| Swedish Krona |
| October 2016 |
| 2,100 |
| $ | 1 |
| $ | — |
Japanese Yen |
| 124,000 |
| U.S. Dollar |
| October 2016 |
| 1,229 |
|
| — |
|
| — |
U.S. Dollar |
| 6,107 |
| British Pound |
| October 2016 |
| 4,710 |
|
| 2 |
|
| — |
Euro |
| 13,300 |
| U.S. Dollar |
| October 2016 |
| 14,976 |
|
| — |
|
| (40) |
U.S. Dollar |
| 5,815 |
| Chinese Yuan |
| October 2016 |
| 39,000 |
|
| — |
|
| (33) |
Korean Won |
| 2,488,000 |
| U.S. Dollar |
| October 2016 |
| 2,255 |
|
| 1 |
|
| — |
Euro |
| 7,482 |
| British Pound |
| October 2016 |
| 6,500 |
|
| — |
|
| (23) |
U.S. Dollar |
| 311 |
| Israeli Shekel |
| October 2016 |
| 1,169 |
|
| 1 |
|
| — |
Singapore Dollar |
| 360 |
| U.S. Dollar |
| October 2016 |
| 265 |
|
| — |
|
| — |
U.S. Dollar |
| 210 |
| Taiwanese Dollar |
| October 2016 |
| 6,600 |
|
| — |
|
| — |
British Pound |
| 171 |
| Norwegian Krone |
| October 2016 |
| 1,800 |
|
| — |
|
| — |
|
|
|
|
|
|
|
|
|
| $ | 5 |
| $ | (96) |
The fair values of the forward contracts described above are recorded in the Company’s accompanying Consolidated Balance Sheets as "Prepaid expenses and other current assets" and "Accrued expenses and other current liabilities".
Stock Warrants
The stock warrant was less than $0.1 million at September 30, 2016. The BioCision warrant agreement contained net share settlement provisions, which permitted the Company to pay the warrant exercise price using shares issuable under the warrant (“cashless exercise”). The value of the stock warrants fluctuated primarily in relation to the value of BioCision’s underlying securities, either providing an appreciation in value or potentially expiring with no value. Gains and $2.3 million duringlosses on the next twelve months primarilyrevaluation of the stock warrant were recognized as a component of "Other (expense) income, net" in the resultaccompanying Consolidated Statements of statutesOperations. During fiscal year 2017, the Company canceled the stock
94
Table of limitations expiring.Contents
NOTES TO CONSOLIDATED FINANCIAL STATEMENTS - (Continued)
warrant as a portion of the non-cash consideration transferred for the acquisition of Cool Lab, which was measured at fair value on the acquisition date. There were no stock warrants held by the Company at September 30, 2017. Please refer to Note 3, "Acquisitions"; Note 7, "Equity Method and Other Investments" and Note 19 “Fair Value Measurements” for further information on the acquisition of Cool Lab and the stock warrant.
12. Postretirement Benefits
Defined Benefit Pension Plans
The Company has two active defined benefit pension plans (collectively, the “Plans”). The Plans cover substantially all of the Company’s employees in Switzerland and Taiwan. Retirement benefits are generally earned based on years of service and the level of compensation during active employment; however,employment, but the level of benefits varies within the Plans. Eligibility is determined in accordance with local statutory requirements.
The Company uses a September 30th as a measurement date in the determination ofto determine net periodic benefit costs, benefit obligations and the value of plan assets for all plans. The following tables set forth the funded status and amounts recognized in the Company’s Consolidated Balance Sheets as of September 30, 20142017 and 20132016 (in thousands):
|
|
|
|
|
|
|
|
| September 30, | ||||
|
| 2017 |
| 2016 | ||
Benefit obligation at beginning of fiscal year |
| $ | 6,847 |
| $ | 7,661 |
Service cost |
|
| 270 |
|
| 548 |
Interest cost |
|
| 27 |
|
| 71 |
Actuarial loss |
|
| (617) |
|
| 106 |
Benefits paid |
|
| — |
|
| (712) |
Employee contributions |
|
| — |
|
| 156 |
Settlements paid |
|
| (2,526) |
|
| — |
Curtailment gain |
|
| — |
|
| (1,064) |
Foreign currency translation |
|
| (29) |
|
| 81 |
Benefit obligation at end of fiscal year |
| $ | 3,972 |
| $ | 6,847 |
Fair value of assets at beginning of fiscal year |
| $ | 4,734 |
| $ | 4,838 |
Actual return on plan assets |
|
| 57 |
|
| 30 |
Disbursements |
|
| (51) |
|
| (837) |
Employer contributions |
|
| 153 |
|
| 296 |
Employee contributions |
|
| 101 |
|
| 352 |
Settlements paid |
|
| (2,526) |
|
| — |
Foreign currency translation |
|
| (32) |
|
| 55 |
Fair value of assets at end of fiscal year |
| $ | 2,436 |
| $ | 4,734 |
Accrued benefit obligation |
| $ | 1,536 |
| $ | 2,113 |
| September 30, | |||||||
| 2014 | 2013 | ||||||
| Benefit obligation at beginning of fiscal year | $ | 7,107 | $ | 10,181 | |||
| Service cost | 406 | 604 | |||||
| Interest cost | 154 | 148 | |||||
| Actuarial loss (gain) | 968 | (670 | ) | ||||
| Benefits paid | (141 | ) | (1,421 | ) | |||
| Settlements paid | — | (1,383 | ) | ||||
| Curtailment gain | — | (500 | ) | ||||
| Foreign currency translation | (281 | ) | 148 | ||||
| Benefit obligation at end of fiscal year | $ | 8,213 | $ | 7,107 | |||
| Fair value of assets at beginning of fiscal year | $ | 5,996 | $ | 8,015 | |||
| Actual return on plan assets | 98 | 304 | |||||
| Disbursements | (264 | ) | (1,573 | ) | |||
| Employer contributions | 302 | 292 | |||||
| Employee contributions | 200 | 194 | |||||
| Settlements paid | — | (1,383 | ) | ||||
| Foreign currency translation | (201 | ) | 147 | ||||
| Fair value of assets at end of fiscal year | $ | 6,131 | $ | 5,996 | |||
| Accrued benefit obligation | $ | 2,082 | $ | 1,111 | |||
The accumulated benefit obligation of the Plans is $7.3$3.4 million and $6.3 million, respectively, at September 30, 20142017 and 2013, respectively. All of the2016. Both Plans have an accumulated benefit obligation and projected benefit obligation in excess of plans’ assets of the respective Plan at September 30, 20142017 and 2013.2016.
The following table provides pension-related amounts and their classification within the accompanying Consolidated Balance Sheets as of September 30, 2017 and 2016 (in thousands):
|
|
|
|
|
|
|
|
| September 30, | ||||
|
| 2017 |
| 2016 | ||
Accrued compensation and benefits |
| $ | 112 |
| $ | 155 |
Long-term pension liability |
|
| 1,424 |
|
| 1,958 |
|
| $ | 1,536 |
| $ | 2,113 |
Accumulated other comprehensive income at September 30, 2017 and 2016 includes unrecognized net actuarial gains (losses) of $0.4 million and ($0.3) million, respectively, and cumulative unrecognized investment losses of less
95
NOTES TO CONSOLIDATED FINANCIAL STATEMENTS - (Continued)
| September 30, | |||||||
| 2014 | 2013 | ||||||
| Accrued compensation and benefits | $ | 308 | $ | 296 | |||
| Long-term pension liability | 1,774 | 815 | |||||
than $0.1 million and ($0.9) million, respectively, during fiscal years 2017 and 2016. Unrecognized net actuarial gains (losses) and cumulative unrecognized investment losses within accumulated other comprehensive income were offset by a settlement gain of $0.3 million and a curtailment gain of $0.9 million at September 30, 20142017 and 2013 includes unrecognized net actuarial gains (losses) of
The components of the Company’s net pension cost for the fiscal years ended September 30, 2014, 20132017, 2016 and 2012 is2015 are as follows (in thousands):
|
|
|
|
|
|
|
|
|
|
|
| Year Ended September 30, | |||||||
|
| 2017 |
| 2016 |
| 2015 | |||
Service cost |
| $ | 270 |
| $ | 548 |
| $ | 482 |
Interest cost |
|
| 27 |
|
| 71 |
|
| 124 |
Amortization of losses |
|
| 11 |
|
| (159) |
|
| (210) |
Expected return on plan assets |
|
| (134) |
|
| 2 |
|
| 2 |
Net periodic pension cost |
| $ | 174 |
| $ | 462 |
| $ | 398 |
Curtailment gain |
|
| — |
|
| (227) |
|
| — |
Settlement (gain) loss |
|
| (259) |
|
| — |
|
| 232 |
Total pension cost (gain) |
| $ | (85) |
| $ | 235 |
| $ | 630 |
| Year ended September 30, | |||||||||||
| 2014 | 2013 | 2012 | |||||||||
| Service cost | $ | 406 | $ | 604 | $ | 787 | |||||
| Interest cost | 154 | 148 | 984 | ||||||||
| Expected return on plan assets | (214 | ) | (247 | ) | (1,072 | ) | |||||
| Amortization of losses | 2 | 4 | 620 | ||||||||
| Other | — | 160 | — | ||||||||
| Net periodic pension cost | 348 | 669 | 1,319 | ||||||||
| Settlement loss | — | 87 | 8,937 | ||||||||
| Total pension cost | $ | 348 | $ | 756 | $ | 10,256 | |||||
The following changes in PlanPlans’ assets and benefit obligations were recognized in other comprehensive lossincome (loss) as of September 30, 20142017 and 2013 is as follows2016 (in thousands):
|
|
|
|
|
|
|
|
| September 30, | ||||
|
| 2017 |
| 2016 | ||
Net (gain) loss |
| $ | (588) |
| $ | 165 |
Amortization of net loss |
|
| (11) |
|
| (2) |
Curtailment gain |
|
| — |
|
| (852) |
Settlement gain |
|
| 259 |
|
| — |
Total recognized in other comprehensive income (loss) |
|
| (340) |
|
| (689) |
Total recognized in net periodic pension cost and other comprehensive income (loss) |
| $ | 514 |
| $ | (227) |
| September 30, | |||||||
| 2014 | 2013 | ||||||
| Net loss (gain) | $ | 961 | $ | (791 | ) | ||
| Amortization of net loss | (2 | ) | (3 | ) | |||
| Curtailment loss | — | (675 | ) | ||||
| Settlement loss | — | (87 | ) | ||||
| Total recognized in other comprehensive income (loss) | 959 | (1,556 | ) | ||||
| Total recognized in net periodic pension cost and other comprehensive income (loss) | $ | 1,307 | $ | (887 | ) | ||
The settlement gain of $0.3 million realized during fiscal year ended September 30, 2017 was recorded as a reduction of accumulated other comprehensive income (loss) and the pension cost during the period then ended. The curtailment gain of $0.2 million and the settlement loss of $(0.2) million incurred during fiscal years ended September 30, 2016 and 2015 were reclassified from accumulated other comprehensive income (loss) into the results of operations during each fiscal year. Additionally, a curtailment gain of $1.1 million was recognized as a reclassification from accumulated other comprehensive income and a corresponding reduction in pension liabilities during fiscal year ended September 30, 2016. Please refer to Note 13, "Stockholders’ Equity", for further information on these reclassifications and their impact on the accumulated other comprehensive income and other comprehensive income during each fiscal year.
Weighted-average assumptions used to determine the projected benefit obligation for the fiscal years ended September 30, 2014, 20132017, 2016 and 20122015 are as follows:
|
|
|
|
|
|
|
|
|
| Year Ended September 30, |
| ||||
|
| 2017 |
| 2016 |
| 2015 |
|
Discount rate |
| 0.88 | % | 0.40 | % | 0.92 | % |
Expected return on plan assets |
| 1.75 | % | 1.75 | % | 1.78 | % |
Expected rate of compensation increases |
| 1.54 | % | 1.31 | % | 1.65 | % |
|
|
|
|
|
|
|
|
| Year Ended September 30, | ||||||||
| 2014 | 2013 | 2012 | ||||||
| Discount rate | 1.55 | % | 2.15 | % | 3.51 | % | ||
| Expected return on plan assets | 2.18 | % | 2.17 | % | 2.18 | % | ||
| Expected rate of compensation increases | 1.87 | % | 1.89 | % | 1.84 | % | ||
In selecting the appropriate discount raterates for the Plans, the Company uses country-specific information, adjusted to reflect the duration of the particular plan. The expected return on plan assets is based on an evaluation of fixed income yield curves and equity return assumption studies applied to the Plans’ asset allocationallocations.
96
NOTES TO CONSOLIDATED FINANCIAL STATEMENTS - (Continued)
The Company bases its determination of pension expense or benefit on a market-related valuation of assets, which reduces year-to-year volatility. This market-related valuation recognizes investment gains or losses over a five-yearfive-year period from the year in which they occur. Investment gains or losses for this purpose arerepresent the difference between the expected return calculated using the market-related value of assets and the actual return on assets. Since the market-related value of assets recognizes gains or losses over a five-year period, the future value of assets will be impacted as previously deferred gains or
Plan Assets
The fair value of plan assets for the Switzerland Plan and Taiwan Plan were
The assets of the Taiwan Plan are invested with a trustee that has been selected by the Taiwan government. Thegovernment, and the Company has no investment authority over the assets of either the Switzerland Plan or the Taiwan Plan. Plan’s assets.
The asset allocation of the planPlans’ assets at September 30, 2014 was2017 is as follows:
September 30, | |||
2017 | |||
Cash and cash equivalents | 6 | % | |
Debt securities | 62 | ||
Equity securities | 13 | ||
Other | 19 | ||
100 | % |
The fair valuevalues of pension assets by asset category and by level at September 30, 2014 were2017 are as follows (in thousands):
|
|
|
|
|
|
|
|
|
|
|
|
|
|
| As of September 30, 2017 | ||||||||||
|
| Level 1 |
| Level 2 |
| Level 3 |
| Total | ||||
Swiss Life collective foundation |
| $ | — |
| $ | 1,886 |
| $ | — |
| $ | 1,886 |
Taiwan collective trust |
|
| — |
|
| 550 |
|
| — |
|
| 550 |
Total |
| $ | — |
| $ | 2,436 |
| $ | — |
| $ | 2,436 |
The fair values of pension assets by asset category and by level at September 30, 2016 are as follows (in thousands):
|
|
|
|
|
|
|
|
|
|
|
|
|
|
| As of September 30, 2016 | ||||||||||
|
| Level 1 |
| Level 2 |
| Level 3 |
| Total | ||||
Swiss Life collective foundation |
| $ | — |
| $ | 4,208 |
| $ | — |
| $ | 4,208 |
Taiwan collective trust |
|
| — |
|
| 526 |
|
| — |
|
| 526 |
Total |
| $ | — |
| $ | 4,734 |
| $ | — |
| $ | 4,734 |
| As of September 30, 2014 | |||||||||||||||
| Total | Level 1 | Level 2 | Level 3 | ||||||||||||
| Swiss Life collective foundation | $ | 5,608 | $ | — | $ | 5,608 | $ | — | |||||||
| Taiwan collective trust | 523 | — | 523 | — | |||||||||||
| Total | $ | 6,131 | $ | — | $ | 6,131 | $ | — | |||||||
Please refer to Note 19, "Fair Value Measurements" for a description of the levels of inputs used to determine fair value measurements.
97
Expected benefitNOTES TO CONSOLIDATED FINANCIAL STATEMENTS - (Continued)
Benefit payments expected to be paid over the next tenfive fiscal years and thereafter are anticipated to be paid as follows (in thousands):
|
|
|
|
2018 |
| $ | 51 |
2019 |
|
| 52 |
2020 |
|
| 53 |
2021 |
|
| 68 |
2022 |
|
| 78 |
Thereafter (through 2026) |
|
| 295 |
| 2015 | $ | 231 | |
| 2016 | 54 | ||
| 2017 | 55 | ||
| 2018 | 56 | ||
| 2019 | 57 | ||
| 2020-2024 | 664 | ||
The Company expects to contribute $0.3$0.1 million to its plansthe Plans in fiscal year 2015 in order2018 to meet the minimum funding targets.
Defined Contribution Plans
The Company sponsors a defined contribution plansplan that meetmeets the requirements of Section 401(k) of the Internal Revenue Code. All United States employees of the Company who meet minimum age and service requirements are eligible to participate in the plan.plans. The plan allowsplans allow employees to invest, on a pre-tax basis, a percentage of their annual salary and bonus subject to statutory limitations. The Company’s contributionCompany matches a portion of their contributions on a pre-tax basis up to a maximum amount of 4.5% of deferred pay. The expense recognized for this United Statesthe defined contribution planplans was $3.5$3.6 million,
13. Stockholders’ Equity
Preferred Stock
Total number of shares of preferred stock $0.01 par value per share authorized; noauthorized for issuance was 1,000,000 shares were issued or outstanding at September 30, 2014 or 2013.2017 and 2016, respectively. Preferred stock has a par value of $0.01 per share and may be issued at the discretion of the Board of Directors without stockholder approval with such designations, rights and preferences as the Board of Directors may determine. There were no shares of preferred stock issued or outstanding at September 30, 2017 or 2016, respectively.
98
NOTES TO CONSOLIDATED FINANCIAL STATEMENTS - (Continued)
Accumulated Other Comprehensive Income
The following is a summary of the components of accumulated other comprehensive income, net of tax, at September 30, 2014, 20132017, 2016 and 20122015 (in thousands):
|
|
|
|
|
|
|
|
|
|
|
|
|
|
|
|
|
| Unrealized |
|
|
|
|
|
| |
|
|
|
|
| Gains (Losses) |
|
|
|
|
|
| |
|
| Currency |
| on Available- |
| Pension |
|
|
| |||
|
| Translation |
| for-Sale |
| Liability |
|
|
| |||
|
| Adjustments |
| Securities |
| Adjustments |
| Total | ||||
Balance at September 30, 2014 |
| $ | 16,102 |
| $ | (38) |
| $ | (377) |
| $ | 15,687 |
Other comprehensive (loss) income before reclassifications |
|
| (9,426) |
|
| 144 |
|
| (605) |
|
| (9,887) |
Amounts reclassified from accumulated other comprehensive income |
|
| (131) |
|
| (3) |
|
| 232 |
|
| 98 |
Balance at September 30, 2015 |
|
| 6,545 |
|
| 103 |
|
| (750) |
|
| 5,898 |
Other comprehensive income (loss) before reclassifications |
|
| 8,844 |
|
| (231) |
|
| (322) |
|
| 8,291 |
Amounts reclassified from accumulated other comprehensive income |
|
| — |
|
| 125 |
|
| 852 |
|
| 977 |
Balance at September 30, 2016 |
|
| 15,389 |
|
| (3) |
|
| (220) |
|
| 15,166 |
Other comprehensive (loss) income before reclassifications |
|
| (221) |
|
| (10) |
|
| 514 |
|
| 283 |
Amounts reclassified from accumulated other comprehensive income |
|
| — |
|
| 12 |
|
| (248) |
|
| (236) |
Balance at September 30, 2017 |
| $ | 15,168 |
| $ | (1) |
| $ | 46 |
| $ | 15,213 |
| Currency Translation Adjustments | Unrealized Gains (Losses) on Available-for-Sale Securities | Unrealized Gains (Losses) on Cash Flow Hedges | Pension Liability Adjustments | Total | ||||||||||||||||
| Balance at September 30, 2011 | $ | 26,917 | $ | (192 | ) | $ | — | $ | (9,401 | ) | $ | 17,324 | ||||||||
| Other comprehensive income before reclassifications | (2,406 | ) | 408 | — | (606 | ) | (2,604 | ) | ||||||||||||
| Amounts reclassified from accumulated other comprehensive income | — | (15 | ) | — | 8,937 | 8,922 | ||||||||||||||
| Balance at September 30, 2012 | 24,511 | 201 | — | (1,070 | ) | 23,642 | ||||||||||||||
| Other comprehensive income before reclassifications | (2,113 | ) | (114 | ) | 14 | 1,109 | (1,104 | ) | ||||||||||||
| Amounts reclassified from accumulated other comprehensive income | — | (21 | ) | — | 87 | 66 | ||||||||||||||
| Balance at September 30, 2013 | 22,398 | 66 | 14 | 126 | 22,604 | |||||||||||||||
| Other comprehensive income before reclassifications | (6,296 | ) | (78 | ) | 79 | (503 | ) | (6,798 | ) | |||||||||||
| Amounts reclassified from accumulated other comprehensive income | — | (26 | ) | (93 | ) | — | (119 | ) | ||||||||||||
| Balance at September 30, 2014 | $ | 16,102 | $ | (38 | ) | $ | — | $ | (377 | ) | $ | 15,687 | ||||||||
Unrealized net holding gains (losses) on available-for-sale marketable securities are reclassified from accumulated other comprehensive income or AOCI, to net income related to available-for-sale securities result frominto results of operations at the time of the securities’ sale, of these securities as described in “Note 5. MarketableNote 4, "Marketable Securities.” Reclassifications from AOCI to net incomeGains (losses) related to cash flow hedges resultdefined benefit pension plan settlements are reclassified from accumulated other comprehensive income into results of operations at the time of the settlement, of this instrument as described in “Note 12. Derivative Instruments.Note 12, "Postretirement Benefits.” Reclassifications from AOCI to net income related to the Company’s pension plans relate to settlement losses under definedDefined benefit pension plansplan curtailments are recognized as reclassifications from accumulated other comprehensive income and corresponding reductions in pension liabilities and net pension cost, as described in “Note 14. PostretirementNote 12, "Postretirement Benefits.”
Losses related to currency translation adjustments were reclassified from accumulated other comprehensive income into results of operations from BAA and presented the portionupon liquidation of the income attributable to the minority shareholders as “Net income attributable to noncontrolling interests” in the Consolidated Statements of Operations. In September 2014, the Company acquired the remaining interest in BAA from the minority shareholders for $3.2 million. Increases in ownership of a consolidated subsidiary are accounted for as equity transactions and as a result, no additional assets or liabilities were recognized related to the additional interest acquired. As of the date of acquisition, 100% of BAA’s pre-tax income has been reflected in the Company’s results of operations. The increase in the Company's proportional share of BAA's results were not material to the Company's results of operations for theYBA joint venture during fiscal year ended September 30, 2014. In addition, the Company will no longer report a noncontrolling interest2015, as described in its Consolidated Balance Sheets. The payment to the minority shareholders has been classified as a financing activity on the Consolidated Statements of Cash Flows.
14. Equity Incentive Plan
The purposes of the Amended and Restated 2000 Equity Incentive Plan (the “2000 Plan”),Company’s equity incentive plans are intended to attract and retain employees and to provide an incentive for them to assistcontribute to the Company to achieveCompany’s long-term growth and achievement of its long-range performance goalsgoals. The equity incentive plans consist of plans under which employees may be granted options to purchase shares of the Company’s stock, restricted stock and other equity incentives. Restricted stock awards generally have a 3 year vesting period. At September 30, 2017, a total of 3,459,828 shares were reserved and available for future grant under the equity incentive plans.
2015 Equity Incentive Plan
The primary purpose of the 2015 Equity Incentive Plan, (the “2015 Plan") is to enableattract and retain employees and provide an incentive for them to participate incontribute to the Company’s long-term growth and achievement of its long-range performance goals. In accordance with the Company. Under the 20002015 Plan provisions, the Company may grant (i) restricted stock and other stock-based awards, (ii) nonqualified stock options, and (iii) options intended to qualify as incentive stock options under Section 422 of the Internal Revenue Code, and (ii) options that are not qualified as incentive stock options (“nonqualified stock options”) and (iii) stock appreciation rights, performance awards and restricted stock.Code. All employees of the Company or any affiliate of the Company, independent
99
NOTES TO CONSOLIDATED FINANCIAL STATEMENTS - (Continued)
directors, consultants and advisors are eligible to participate in the 20002015 Plan. Options underThe 2015 Plan provides for the 2000 Plan generally vest over four years and expire within ten years from the dateissuance of grant. A totala maximum of 9,000,0005,000,000 shares of common stock was reserved for issuance underin addition to the stock option and restricted stock awards granted out of the 2000 Plan. AsPlan that were canceled or forfeited after February 5, 2015 upon expiration of September 30, 2014, no options are outstanding and 2,486,983 shares remain available for grant under the 2000 Plan.
Restricted Stock Options of Acquired Companies
The following table summarizes restricted stock optionunit activity for all the above plans for the fiscal year ended September 30, 2014:2017:
|
|
|
|
|
|
|
|
|
| Weighted | |
|
|
|
| Average | |
|
|
|
| Grant-Date | |
|
| Shares |
| Fair Value | |
Outstanding at September 30, 2016 |
| 2,489,076 |
| $ | 10.79 |
Granted |
| 1,018,570 |
|
| 14.43 |
Vested |
| (918,738) |
|
| 10.51 |
Forfeited |
| (114,897) |
|
| 11.80 |
Outstanding at September 30, 2017 |
| 2,474,011 |
| $ | 12.34 |
| 2014 | ||||||||||||
| Shares | Weighted- Average Remaining Contractual Term | Weighted Average Price | Aggregate Intrinsic Value (In Thousands) | |||||||||
| Options outstanding at September 30, 2013 | 15,540 | $ | 15.86 | |||||||||
| Forfeited/expired | (9,990 | ) | $ | 17.34 | ||||||||
| Options outstanding at September 30, 2014 | 5,550 | 0.3 years | $ | 13.20 | $ | — | ||||||
| Vested at September 30, 2014 | 5,550 | 0.3 years | $ | 13.20 | $ | — | ||||||
| Options exercisable at September 30, 2014 | 5,550 | 0.3 years | $ | 13.20 | $ | — | ||||||
| Shares available for future grant | 2,486,983 | |||||||||||
| 2014 | ||||||
| Shares | Weighted Average Grant-Date Fair Value | |||||
| Outstanding at September 30, 2013 | 2,915,413 | $ | 11.25 | |||
| Awards granted | 1,517,057 | $ | 9.49 | |||
| Awards vested | (592,857 | ) | $ | 9.48 | ||
| Awards canceled | (1,113,128 | ) | $ | 10.28 | ||
| Outstanding at September 30, 2014 | 2,726,485 | $ | 11.05 | |||
The weighted average grant date fair value of restricted stock units granted during fiscal years 20132017, 2016 and 20122015 was $9.33$14.43, $10.84 and $11.80$11.89 per share, respectively. The fair value of restricted stock units vested during fiscal years 2014, 20132017, 2016 and 20122015 was $5.6$15.0 million, $7.3$14.3 million and $5.6$8.4 million, respectively.
As of September 30, 2014,2017, the future unrecognized stock-based compensation costexpense related to restricted stock units that is expected to vest is $17.2$20.3 million and willis expected to be recognized over an estimated weighted average amortization period of 1.71.6 years.
The Company grants restricted stock units that vest over a required service period and awards where vesting is dependent upon achieving/or achievement of certain operating performance goals. Restricted stock units granted with performance goals may also have a required service period.period following the achievement of all or a portion of the goals. The following table reflects restricted stock units and stock awards granted including awards related to the discontinued operation, during thefiscal years ended September 30, 2014, 20132017, 2016 and 2012:2015:
|
|
|
|
|
|
|
|
|
|
|
|
| Time-Based |
|
|
| Performance- |
|
| Total Units |
| Units |
| Stock Grants |
| Based Units |
Year ended September 30, 2017 |
| 1,018,570 |
| 386,713 |
| 43,519 |
| 588,338 |
Year ended September 30, 2016 |
| 1,690,582 |
| 744,250 |
| 86,082 |
| 860,250 |
Year ended September 30, 2015 |
| 1,513,281 |
| 597,250 |
| 69,281 |
| 846,750 |
| Total Units | Time-Based Units | Performance-Based Units | ||||||
| Year ended September 30, 2014 | 1,517,057 | 678,307 | 838,750 | |||||
| Year ended September 30, 2013 | 1,471,977 | 794,602 | 677,375 | |||||
| Year ended September 30, 2012 | 1,887,419 | 767,169 | 1,120,250 | |||||
Time-Based Grants
Restricted stock units granted with a required service period typically have three year vesting schedules in which one-third of awards vest at the first anniversary of the grant date, of grant, one-third vest at the second anniversary of the grant date of grant and one-third vest at the third anniversary of the grant date, subject to the award holders meeting service requirements.
100
Table of grant, except that time-based awardsContents
NOTES TO CONSOLIDATED FINANCIAL STATEMENTS - (Continued)
Stock Grants
During fiscal years 2017, 2016 and 2015, the Company granted 43,519, 86,082 and 69,281 units, respectively, to the members of the Company’s Board of Directors, including compensation-related restricted stock units of 28,065, 55,380 and 49,267, respectively.
Compensation-related units granted during fiscal year 2017 are subject to a one-year vesting period starting from the grant date. The units will vest immediately. on the date which is one day before the Company’s 2018 Annual Meeting of Stockholders. Compensation-related units granted during fiscal years 2016 and 2015 vested on the grant date upon their issuance.
Certain members of the Board of Directors previously elected to defer receiving their annual awards of restricted shares of the Company stock and quarterly dividends until a future date. During fiscal years 2017, 2016 and 2015, the Company granted 13,065, 25,560 and 13,318 units, respectively, related to such deferred annual restricted share awards, as well as 2,389, 5,142 and 6,876 units, related to deferred quarterly dividends. Annual restricted share awards granted during fiscal year 2017 are subject to a one-year vesting period starting from the grant date. The units will vest on the date which is one day before the Company’s 2018 Annual Meeting of Stockholders, but certain holders have elected to defer the receipt of the Company shares until they attain a certain age or cease to provide services to the Company in their capacity as Board members. Annual restricted share awards granted during fiscal years 2016 and 2015 vested on the grant date upon their issuance, but the settlement was deferred by certain holders, for the same conditions as described above for grants in fiscal year 2017. The amount of deferred dividends granted during fiscal years 2017, 2016 and 2015 was equal to the value of cash dividends that would be paid on the number of total deferred shares based on the closing price of the Company’s stock on the dividend record date. Such units vested upon their issuance, but the settlement was deferred by certain holders for the same conditions, as described above.
Performance-Based Grants
Performance-based restricted stock units haveare earned based on the achievement of performance criteria established by the Company’s Human Resources and Compensation Committee andof the Board of Directors.
Performance-based awards granted in fiscal year 2014 and 2013 included provisions where2017 allow participants could achieve up to 200%earn 100% of thea targeted number of performance-based awardsrestricted stock units if the Company’s performance exceeds themeets its target thresholds. The measurementfor each applicable financial metric, and up to a maximum of achievement against performance-based units granted in fiscal year 2014 and 2013 occurred at the end200% of the fiscal yearrestricted stock units if the Company’s performance for such metrics meets the maximum threshold. Performance below the minimum threshold for each financial metric results in which the units were granted. The performance-based units granted in fiscal year 2012 had performance criteria toaward forfeitures. Performance goals will be measured over a three year period ending on September 30, 2014. Theat the end of fiscal year 2019 to determine the number of units earned by recipients who continue to meet a service requirement. Units held by recipients who fail to meet the continued service requirement are forfeited. Earned units for recipients who continue to meet the service requirements of the performance-based units are three years from date of grant. Performance-based units granted in fiscal 2014 and 2013 have three year vesting schedules in which one-half vest at the second anniversary ofon the date the Company’s Board of grant and one-half vest atDirectors determines the number of units earned, which will be approximately the third anniversary of the dategrant date.
Performance-based awards granted in fiscal year 2016 also include provisions that allow participants to earn threshold, target and maximum awards ranging from 0% of grant. Thethe award for performance below the minimum threshold, 100% of the award for performance at target, and up to a maximum of 200% of the award if the Company achieves the maximum performance goals.
Performance-based awards granted in fiscal year 2015 include provisions similar to fiscal years 2017 and 2016 awards that allow participants to earn threshold, target and maximum awards ranging from 0% of the award for performance below the minimum threshold, 100% of the award for performance at target, and up to a maximum of 200% of the award if the Company achieves the maximum performance goals.
Sixty percent of the performance-based units granted in fiscal year 20122015 had certain performance goals that were measured at the end of fiscal year 2015 to determine the number of earned units eligible for subsequent vesting. The Company performed below the threshold levels relative to the performance criteria for these awards and as a result these awards were not eligible for subsequent vesting, which resulted in a forfeiture of 495,684 units.
101
NOTES TO CONSOLIDATED FINANCIAL STATEMENTS - (Continued)
Forty percent of the performance-based units granted in fiscal year 2015 have certain performance goals which will be measured over a three year vesting schedule in which allperiod at the end of fiscal year 2017 to determine the awards vested atnumber of earned units eligible for vesting. Earned units vest on the third anniversary of the grant date, of grant.
1995 Employee Stock Purchase Plan
On February 22, 1996, the stockholders approved the 1995 Employee Stock Purchase Plan, (the “1995 Plan”"1995 Plan"), which enables eligible employees to purchase shares of the Company’s common stock. Under the 1995 Plan, eligible employees may purchase up to an aggregate of 3,000,000 shares during six-month offering periods commencing on February 1 and August 1 of each year at a stock price per share ofequal to 85% of the lower of the fair market value price per share onof the firstCompany’s stock at the beginning or last daythe end of each six-month offering period.the semi-annual period, whichever is lower. On February 8, 2012, the stockholders approved an amendment to the 1995 Plan to increase the number of shares of the Company’s common stock available for issuance by 1,000,000 shares, from 3,000,000 to 4,000,000 shares. Participating employees may elect to have up to 10% of their base pay withheld and applied toward the purchase of such shares. The rights of participating employees under the 1995 Plan terminate upon voluntary withdrawal from the plan at any time or upon termination of employment. As of September 30, 2014, 3,350,6452017, 3,949,432 shares of common stock have been purchased under the 1995 Plan which was terminated on August 1, 2017. As of September 30, 2017, there were no shares available for future purchases under the 1995 Plan since 50,568 shares remaining in the plan expired upon its termination. During fiscal years 2017 and 649,3552016, the Company issued 162,360 and 235,727 shares, respectively, under the 1995 Plan for $2.0 million and $1.9 million, respectively.
2017 Employee Stock Purchase Plan
On February 8, 2017, the stockholders approved the 2017 Employee Stock Purchase Plan, (the "2017 Plan"), which enables eligible employees to purchase shares of the Company’s common stock. The 2017 Plan replaced the 1995 Plan which was terminated on August 1, 2017 upon the expiration of the offering period on July 31, 2017. The 2017 Plan allows for purchases by employees of up to 1,250,000 shares of the Company’s common stock. If the rights of participating employees granted under the 2017 Plan terminate without having been exercised, the shares of common stock not purchased under such rights become available for issuance under the 2017 Plan. As of September 30, 2017, 1,250,000 shares of common stock remain available for purchase.
15. Restructuring and Other Charges
Fiscal Year 20142017 Activities
During fiscal year 2017, the Company recorded restructuring charges of $3.2 million related to severance, of which $2.6 million were attributable to the Brooks Semiconductor Solutions Group segment, $0.4 million were attributable to the Brooks Life Science Systems segment and $0.3 million were attributable to the company-wide restructuring action.
The restructuring charges of $2.6 million attributable to the Brooks Semiconductor Solutions Group segment consisted of $1.6 million of charges related to the actions initiated during fiscal year 2017 and $1.0 million of charges related to the actions initiated prior to fiscal year 2017. The restructuring action initiated during fiscal year 2017 was related to streamlining field service operations in order to optimize the cost structure and improve productivity. Total severance costs expected to be incurred in connection with this action are $1.6 million which were recognized entirely during fiscal year 2017. This restructuring action has been completed as of September 30, 2017. Accrued restructuring costs related to this action were $0.5 million at September 30, 2017 and are expected to be paid within the next twelve months from cash flows generated from operating activities. The $1.0 million of restructuring charges related to actions initiated prior to fiscal year 2017 consisted of $0.8 million attributable to the consolidation of the Jena, Germany repair facility into the Chelmsford, Massachusetts repair operation and $0.2 million related to the integration of Contact Co., Ltd. ("Contact") after its acquisition by the Company. Prior to fiscal year 2017, the Company initiated a restructuring action within the Brooks Semiconductor Solutions Group segment to consolidate the Company’s Jena,
102
NOTES TO CONSOLIDATED FINANCIAL STATEMENTS - (Continued)
Germany repair facility into the Chelmsford, Massachusetts repair operation to streamline the service repair operations and reduce the overhead cost structure. Total severance costs incurred in connection with this action were $2.6 million, of which $1.8 million were recognized prior to fiscal year 2017 and $0.8 million were recognized during fiscal year 2017. This restructuring action was substantially completed as of September 30, 2017. Accrued restructuring costs related to this action were $1.0 million at September 30, 2017 and are expected to be paid within the next twelve months from cash flows generated from operating activities.
Restructuring charges of $0.3 million were related to the company-wide restructuring action initiated in fiscal year 2016. This restructuring action has been completed as of September 30, 2017 and is not expected to result in any additional restructuring charges in future periods. There were no accrued restructuring costs related to this action at September 30, 2017. The restructuring action was taken to streamline business operations, improve competitiveness and overall profitability and is expected to benefit both segments. Total severance costs incurred in connection with this action were $6.1 million, of which $5.8 million were recognized during fiscal year 2016. Severance costs incurred in connection with this action were attributable to the reduction of several positions across the company, including senior management positions.
Fiscal Year 2016 Activities
The Company recorded restructuring charges of $6.3$12.0 million forduring fiscal year 2014. These2016 related to severance costs which consisted primarily of $10.8 million of charges relate primarilyrelated to the Company's decisionrestructuring actions initiated during fiscal year 2016 and $1.3 million of charges related to discontinue certain product linesrestructuring actions initiated in prior periods.
Restructuring Actions Initiated During Fiscal Year 2016
The Company’s restructuring actions initiated during fiscal year 2016 resulted in total charges of $10.8 million, which consisted of: (i) $3.1 million of costs attributable to the Brooks Life Science Systems segment, (ii) $1.8 million of costs attributable to the restructuring action within the Brooks Semiconductor Solutions Group segment to consolidate our Jena, Germany repair facility into our Chelmsford, Massachusetts repair operation, as described above, and (iii) $5.8 million of costs related to the company-wide restructuring action, as described above.
Restructuring initiatives within the Brooks ProductLife Science Systems segment are primarily related to streamlining the segment’s management structure, integrating acquisitions and improving profitability. During fiscal year 2016, the Company initiated several actions within the Brooks Life Science Systems segment related to integrating BioStorage, streamlining management structure and closing the segment’s Spokane, Washington facility in March 2016 and Oberdiessbach, Switzerland facility in July 2016 upon selling the building and temporarily leasing a smaller size office space until December 2016. This restructuring initiative within the Brooks Life Science Systems segment included additional actions completed during the first quarter of fiscal year 2017 which resulted in restructuring charges of $0.2 million during fiscal year 2017. These actions were finalized by the end of the first quarter of fiscal year 2017 and are not expected to result in additional restructuring charges in future periods. Total severance costs incurred in connection with these initiatives were $3.3 million, of which $3.1 million were recognized during fiscal year 2016 and $0.2 million during fiscal year 2017. Accrued restructuring costs related to these actions were $0.5 million at September 30, 2016 and were paid entirely during fiscal year 2017.
Restructuring Actions Initiated Prior to Fiscal Year 2016
The Company’s restructuring actions initiated in prior periods resulted in $1.2 million of costs attributable to the Brooks Semiconductor Solutions segments,segment and less than $0.1 million of costs attributable to the Brooks Life Science Systems segment. These restructuring actions were primarily related to the integration of Contact, as well as the closure and transfer of the Mistelgau, Germany manufacturing operations to a contract manufacturer. Accrued restructuring costs related to these actions were $0.2 million at September 30, 2016 and were paid entirely during fiscal year 2017.
Fiscal Year 2015 Activities
The Company recorded restructuring charges of $4.7 million in fiscal year 2015, which included severance costs of $3.4 million and facility-related costs of $1.3 million.
103
NOTES TO CONSOLIDATED FINANCIAL STATEMENTS - (Continued)
Severance costs of $3.4 million consisted of $2.2 million of charges attributable to the Brooks Semiconductor Solutions segment and $1.3 million of costs attributable to the Brooks Life Science Systems segment. Restructuring actions within the Brooks Semiconductor Solutions Group segment were related to the integration of Dynamic Micro Systems Semiconductor Equipment GmbH (the "DMS") with the Company’s operations and the transition of manufacturing of certain products from the Company’s facility in Mistelgau, Germany to a third party contract manufacturer. Restructuring actions within the Brooks Life Science Systems segment were related to the closure of the Poway, California facility and transition of product sub-assembly manufacturing operations to the third party contract manufacturers. These restructuring plans were substantially completed on December 31, 2015.
Facility exit costs of $1.3 million were attributable to Brooks Semiconductor Solutions Group segment were related to the outsourcing of manufacturing certain of the Company’s line of Polycold cryochillers and compressors within the United States to a third party contract manufacturer and other global programs designed to improve the Company’s cost structure.
The following is a summary of Crossing and the Company, to transition internal manufacturing of the Polycold product line to a third party contract manufacturer and other programs designed to improve the Company’s cost structure. Restructuring charges also included facility related costs incurred in connection with the consolidation of Crossing facilities with the Company’s facilities.
|
|
|
|
|
|
|
|
|
|
|
|
|
|
| Activity -Year Ended September 30, 2017 | ||||||||||
|
| Balance |
|
|
|
|
|
|
| Balance | ||
|
| September 30, |
|
|
|
|
|
|
| September 30, | ||
|
| 2016 |
| Expenses |
| Payments |
| 2017 | ||||
Total restructuring liabilities related to workforce termination benefits |
| $ | 5,939 |
| $ | 3,226 |
| $ | (7,457) |
| $ | 1,708 |
|
|
|
|
|
|
|
|
|
|
|
|
|
|
| Activity -Year Ended September 30, 2016 | ||||||||||
|
| Balance |
|
|
|
|
|
|
| Balance | ||
|
| September 30, |
|
|
|
|
|
|
| September 30, | ||
|
| 2015 |
| Expenses |
| Payments |
| 2016 | ||||
Facility and other contract termination costs |
| $ | 433 |
| $ | 25 |
| $ | (458) |
| $ | — |
Workforce-related termination benefits |
|
| 1,640 |
|
| 12,014 |
|
| (7,715) |
|
| 5,939 |
Total restructuring liabilities |
| $ | 2,073 |
| $ | 12,039 |
| $ | (8,173) |
| $ | 5,939 |
|
|
|
|
|
|
|
|
|
|
|
|
|
|
| Activity - Year Ended September 30, 2015 | ||||||||||
|
| Balance |
|
|
|
|
|
|
| Balance | ||
|
| September 30, |
|
|
|
|
|
|
| September 30, | ||
|
| 2014 |
| Expenses |
| Payments |
| 2015 | ||||
Facility and other contract termination costs |
| $ | 71 |
| $ | 1,204 |
| $ | (842) |
| $ | 433 |
Workforce-related termination benefits |
|
| 3,404 |
|
| 3,213 |
|
| (4,977) |
|
| 1,640 |
Total restructuring liabilities related to workforce termination benefits |
| $ | 3,475 |
| $ | 4,417 |
| $ | (5,819) |
| $ | 2,073 |
| Fiscal Year 2014 Activity | |||||||||||||||
| Balance September 30, 2013 | Expense | Utilization | Balance September 30, 2014 | ||||||||||||
| Facility and other contract termination costs | $ | 155 | $ | 583 | $ | (667 | ) | $ | 71 | ||||||
| Workforce-related termination benefits | 1,257 | 5,706 | (3,559 | ) | 3,404 | ||||||||||
| $ | 1,412 | $ | 6,289 | $ | (4,226 | ) | $ | 3,475 | |||||||
| Fiscal Year 2013 Activity | |||||||||||||||
| Balance September 30, 2012 | Expense | Utilization | Balance September 30, 2013 | ||||||||||||
| Facility and other contract termination costs | $ | — | $ | 818 | $ | (663 | ) | $ | 155 | ||||||
| Workforce-related termination benefits | 2,098 | 5,475 | (6,316 | ) | 1,257 | ||||||||||
| $ | 2,098 | $ | 6,293 | $ | (6,979 | ) | $ | 1,412 | |||||||
| Fiscal Year 2012 Activity | |||||||||||||||
| Balance September 30, 2011 | Expense | Utilization | Balance September 30, 2012 | ||||||||||||
| Workforce-related termination benefits | $ | 293 | $ | 3,153 | $ | (1,348 | ) | $ | 2,098 | ||||||
Accrued restructuring costs of $3.5$1.7 million as of September 30, 20142017 are expected to be paid during fiscal year 2018.
104
NOTES TO CONSOLIDATED FINANCIAL STATEMENTS - (Continued)
16. Earnings per Share
The calculations of basic and diluted net income (loss) per share and basic and diluted weighted average shares outstanding are as follows for the fiscal years ended September 30, 2017, 2016 and 2015 (in thousands, except per share data):
|
|
|
|
|
|
|
|
|
|
|
|
|
|
|
|
|
|
|
|
|
| Year Ended September 30, | |||||||
|
| 2017 |
| 2016 |
| 2015 | |||
Net income (loss) |
| $ | 62,612 |
| $ | (69,476) |
| $ | 14,221 |
|
|
|
|
|
|
|
|
|
|
Weighted average common shares outstanding used in computing basic earnings (losses) per share |
|
| 69,575 |
|
| 68,507 |
|
| 67,411 |
Dilutive common stock options and restricted stock units |
|
| 910 |
|
| — |
|
| 1,138 |
Weighted average common shares outstanding used in computing diluted earnings (losses) per share |
|
| 70,485 |
|
| 68,507 |
|
| 68,549 |
|
|
|
|
|
|
|
|
|
|
Basic net income (loss) per share |
| $ | 0.90 |
| $ | (1.01) |
| $ | 0.21 |
Diluted net income (loss) per share |
|
| 0.89 |
|
| (1.01) |
|
| 0.21 |
Restricted stock units of 9,500 during fiscal year 2017 were excluded from the computation of diluted earnings per share as their effect would be anti-dilutive based on the treasury stock method. Restricted stock units of 859,000 during fiscal year 2016 were excluded from the computation of diluted earnings per share as a result of a net loss incurred during the period. Approximately 120,000 shares of unvested restricted stock units were excluded from the computation of diluted earnings per share for the fiscal year ended September 30, 2015 as their effect would be anti-dilutive based on the treasury stock method.
On November 8, 2017, the Company’s compensation committee and Board of Directors authorized and approved the annual grant of approximately 468,700 restricted stock units with a grant date of November 8, 2017.
17. Significant Customers
The Company had one customer that accounted for more than 10% of its consolidated revenue at 12% during the fiscal year ended September 30, 2015.
18. Segment and Geographic Information
Operating segments are defined as components of an enterprise that engage in business activities for which discrete financial information is available and regularly reviewed by the chief operating decision maker in deciding how to allocate resources and to assess performance. The Company’s Chief Executive Officer is the Company’s chief operating decision maker.
The Company reports financial results inhas two operating and reportable segments consisting of (i) Brooks Semiconductor Solutions Group segment and (ii) Brooks Life Science Systems segment. Prior to fiscal year 2016, the Company had three segments: operating and reportable segments that consisted of Brooks Product Solutions segment, Brooks Global Services segment and Brooks Life Science Systems.Systems segment. During fiscal year 2016, the Company reorganized its reporting structure into two operating and reportable segments. The Company’s reportable segment information for the fiscal year ended September 30, 2015 has been reclassified to reflect the current segment structure and to conform to the presentation of information for fiscal years ended September 30, 2017 and 2016. The accounting policies of the operating segments remained unchanged as a result of the realignment.
105
NOTES TO CONSOLIDATED FINANCIAL STATEMENTS - (Continued)
The Brooks ProductSemiconductor Solutions Group segment provides a variety of products, services and solutions that enable improved throughput and yield in controlled operating environments. Those productsenvironments, as well as an extensive range of support services. The solutions include atmospheric and vacuum robots, robotic modules, and tool automation systems that provide precision handling and clean wafer environments, contamination control of wafer carrier front opening unified pods, as well as cryogenic pumps and compressors that provide vacuum pumping and thermal management solutions used to create and control critical process vacuum applications.
The Brooks Life Science Systems segment provides comprehensive life cycle sample management solutions for life science and bioscience customers to advance scientific research and support drug development. The segment’s product offerings include automated cold sample management systems for compound and biobiological sample storage, equipment for sample preparation and handling, consumables, and partsinformatics that manage samples throughout our customers’ research discovery and development work flows. The segment’s service offerings include sample storage and support services provided to a wide range of life science customers, including pharmaceutical companies, biotechnology companies, biobanks national laboratories, research institutes and research universities.
The Company evaluates the performance and future opportunities of its segments and allocates resources to each of its segmentsthem based on their revenues,revenue, operating income (loss) and returns on invested assets. Operating income (loss) for each segment includes selling, general and administrative expenses directly attributable to the segment. Other unallocated corporate expenses, amortizationAmortization of acquired intangible assets (excluding completed technology) and, restructuring and other charges, pension settlement, and in-process research and development, as well as other unallocated corporate expenses are excluded from the segments’ operating income (loss). The Company’s indirect overhead costs, which include various general and administrative expenses, are allocated among the segments based upon multipleseveral cost drivers associated with the respective administrative function, including segment revenue, segment headcount, or an analysis of the segmentsbenefits that benefiteach segment derives from a specific administrative function. Segment assets exclude cash, cash equivalents, restricted cash, marketable securities, deferred tax assets, assets held for sale and equity method investments.
106
NOTES TO CONSOLIDATED FINANCIAL STATEMENTS - (Continued)
The following is the summary of the financial information for the Company’s businessoperating and reportable segments excluding amounts related to the discontinued operations, for the fiscal years ended September 30, 2014, 20132017, 2016 and 2012 are as follows2015 (in thousands):
|
|
|
|
|
|
|
|
|
|
|
| Brooks |
| Brooks |
|
|
| ||
|
| Semiconductor |
| Life Science |
|
|
| ||
|
| Solutions Group |
| Systems |
| Total | |||
Fiscal Year Ended September 30, 2017 |
|
|
|
|
|
|
|
|
|
Revenue |
|
|
|
|
|
|
|
|
|
Products |
| $ | 466,871 |
| $ | 66,753 |
| $ | 533,624 |
Services |
|
| 77,305 |
|
| 81,956 |
|
| 159,261 |
Segment revenue |
| $ | 544,176 |
| $ | 148,709 |
| $ | 692,885 |
Gross profit |
| $ | 212,652 |
| $ | 54,752 |
| $ | 267,404 |
Segment operating income |
|
| 86,716 |
|
| 4,695 |
|
| 91,411 |
Depreciation expense |
|
| 5,052 |
|
| 4,694 |
|
| 9,746 |
Assets |
|
| 325,408 |
|
| 306,666 |
|
| 632,074 |
Fiscal Year Ended September 30, 2016 |
|
|
|
|
|
|
|
|
|
Revenue |
|
|
|
|
|
|
|
|
|
Products |
| $ | 375,237 |
| $ | 46,546 |
| $ | 421,783 |
Services |
|
| 76,973 |
|
| 61,567 |
|
| 138,540 |
Segment revenue |
| $ | 452,210 |
| $ | 108,113 |
| $ | 560,323 |
Gross profit |
| $ | 159,018 |
| $ | 39,063 |
| $ | 198,081 |
Segment operating income (loss) |
|
| 37,926 |
|
| (6,451) |
|
| 31,476 |
Depreciation expense |
|
| 4,788 |
|
| 3,496 |
|
| 8,284 |
Assets |
|
| 317,717 |
|
| 247,735 |
|
| 565,452 |
Fiscal Year Ended September 30, 2015 |
|
|
|
|
|
|
|
|
|
Revenue |
|
|
|
|
|
|
|
|
|
Products |
| $ | 406,579 |
| $ | 50,832 |
| $ | 457,411 |
Services |
|
| 78,058 |
|
| 17,239 |
|
| 95,297 |
Segment revenue |
| $ | 484,637 |
| $ | 68,071 |
| $ | 552,708 |
Gross profit |
| $ | 171,379 |
| $ | 17,726 |
| $ | 189,105 |
Segment operating income (loss) |
|
| 49,695 |
|
| (19,580) |
|
| 30,115 |
Depreciation expense |
|
| 4,312 |
|
| 1,295 |
|
| 5,607 |
Assets |
|
| 317,069 |
|
| 110,910 |
|
| 427,979 |
|
|
|
|
|
|
|
|
|
|
The following is a reconciliation of the Company’s operating and reportable segments’ operating income and segment assets to the corresponding amounts presented in the accompanying Consolidated Balance Sheets and Consolidated Statements of Operations for the fiscal years ended September 30, 2017, 2016 and 2015 (in thousands):
|
|
|
|
|
|
|
|
|
|
|
| As of and for the Year Ended | |||||||
|
| September 30, | |||||||
|
| 2017 |
| 2016 |
| 2015 | |||
Segment operating income |
| $ | 91,411 |
| $ | 31,476 |
| $ | 30,115 |
Amortization of acquired intangible assets |
|
| 13,929 |
|
| 10,799 |
|
| 7,656 |
Restructuring charges |
|
| 3,226 |
|
| 12,039 |
|
| 4,713 |
Other unallocated corporate expenses |
|
| 10,143 |
|
| 4,400 |
|
| 856 |
Total operating income |
| $ | 64,113 |
| $ | 4,238 |
| $ | 16,890 |
107
| Brooks Product Solutions | Brooks Global Services | Brooks Life Science Systems | Total | ||||||||||||
| Year ended September 30, 2014 | |||||||||||||||
| Revenue | |||||||||||||||
| Product | $ | 325,639 | $ | 14,978 | $ | 46,415 | $ | 387,032 | |||||||
| Services | — | 79,083 | 16,733 | 95,816 | |||||||||||
| $ | 325,639 | $ | 94,061 | $ | 63,148 | $ | 482,848 | ||||||||
| Gross profit | $ | 111,746 | $ | 32,168 | $ | 23,423 | $ | 167,337 | |||||||
| Segment operating income (loss) | $ | 10,836 | $ | 12,451 | $ | (8,431 | ) | $ | 14,856 | ||||||
| Depreciation expense | $ | 8,316 | $ | 2,361 | $ | 2,022 | $ | 12,699 | |||||||
| Assets | $ | 252,944 | $ | 58,678 | $ | 103,498 | $ | 415,120 | |||||||
| Year ended September 30, 2013 | |||||||||||||||
| Revenue | |||||||||||||||
| Product | $ | 290,523 | $ | 13,152 | $ | 31,336 | $ | 335,011 | |||||||
| Services | — | 75,477 | 11,952 | 87,429 | |||||||||||
| $ | 290,523 | $ | 88,629 | $ | 43,288 | $ | 422,440 | ||||||||
| Gross profit | $ | 91,255 | $ | 26,912 | $ | 14,140 | $ | 132,307 | |||||||
| Segment operating income (loss) | $ | 1,116 | $ | 9,592 | $ | (12,380 | ) | $ | (1,672 | ) | |||||
| Depreciation expense | $ | 8,698 | $ | 2,746 | $ | 2,256 | $ | 13,700 | |||||||
| Assets | $ | 226,759 | $ | 59,762 | $ | 105,221 | $ | 391,742 | |||||||
| Year ended September 30, 2012 | |||||||||||||||
| Revenue | |||||||||||||||
| Product | $ | 351,432 | $ | 11,324 | $ | 39,749 | $ | 402,505 | |||||||
| Services | — | 73,616 | 12,862 | 86,478 | |||||||||||
| $ | 351,432 | $ | 84,940 | $ | 52,611 | $ | 488,983 | ||||||||
| Gross profit | $ | 113,945 | $ | 25,093 | $ | 20,415 | $ | 159,453 | |||||||
| Segment operating income (loss) | $ | 13,330 | $ | 8,898 | $ | (3,139 | ) | $ | 19,089 | ||||||
| Depreciation expense | $ | 8,600 | $ | 2,344 | $ | 2,111 | $ | 13,055 | |||||||
NOTES TO CONSOLIDATED FINANCIAL STATEMENTS - (Continued)
| As of and for the Year Ended September 30, | |||||||||||
| 2014 | 2013 | 2012 | |||||||||
| Segment operating income (loss) | $ | 14,856 | $ | (1,672 | ) | $ | 19,089 | ||||
| Other unallocated corporate expenses (1) | 5,096 | 3,002 | (1,833 | ) | |||||||
| Amortization of acquired intangible assets | 6,170 | 5,694 | 4,164 | ||||||||
| Impairment of acquired intangible assets | — | 50 | — | ||||||||
| Restructuring and other charges | 6,289 | 6,380 | 3,153 | ||||||||
| Pension settlement | — | — | 8,937 | ||||||||
| In-process research and development | — | — | 3,026 | ||||||||
| Total operating income (loss) | $ | (2,699 | ) | $ | (16,798 | ) | $ | 1,642 | |||
|
|
|
|
|
|
|
|
| September 30, |
| September 30, | ||
|
| 2017 |
| 2016 | ||
Segment assets |
| $ | 632,074 |
| $ | 565,452 |
Cash, cash equivalents and marketable securities |
|
| 104,292 |
|
| 91,221 |
Deferred tax assets |
|
| 1,692 |
|
| 1,982 |
Equity method investments |
|
| 28,570 |
|
| 27,250 |
Total assets |
| $ | 766,628 |
| $ | 685,905 |
| Segment assets | $ | 415,120 | $ | 391,742 | |||||
| Cash, cash equivalents, restricted cash and marketable securities | 245,456 | 173,539 | |||||||
| Deferred tax assets | 86,572 | 115,985 | |||||||
| Assets held for sale | — | 27,778 | |||||||
| Equity method investments | 28,944 | 25,687 | |||||||
| Other unallocated corporate net assets | 1,946 | 2,032 | |||||||
| Total assets | $ | 778,038 | $ | 736,763 | |||||
Revenue from external customers is attributed to geographic areas based on locations in which customer orders are placed. Net revenue based upon the source of the order by geographic area for the fiscal years ended September 30, 2014, 20132017, 2016 and 20122015 are as follows (in thousands):
|
|
|
|
|
|
|
|
|
|
|
| Year Ended September 30, | |||||||
|
| 2017 |
| 2016 |
| 2015 | |||
North America |
| $ | 242,331 |
| $ | 209,727 |
| $ | 199,103 |
Asia / Pacific/ Other |
|
| 327,864 |
|
| 247,241 |
|
| 231,840 |
Europe: |
|
|
|
|
|
|
|
|
|
United Kingdom |
| $ | 42,138 |
| $ | 36,611 |
| $ | 32,160 |
Rest of Europe |
| $ | 80,552 |
| $ | 66,744 |
| $ | 89,605 |
|
| $ | 692,885 |
| $ | 560,323 |
| $ | 552,708 |
| Year Ended September 30, | |||||||||||
| 2014 | 2013 | 2012 | |||||||||
| North America | $ | 174,343 | $ | 177,779 | $ | 214,060 | |||||
| Asia/Pacific | 198,695 | 154,358 | 183,406 | ||||||||
| Europe | 109,810 | 90,303 | 91,517 | ||||||||
| $ | 482,848 | $ | 422,440 | $ | 488,983 | ||||||
The majority of the Company’s net revenue in North America is generated in the United States which amounted to $240.6 million, $208.3 million and $197.4 million, respectively, during fiscal years ended September 30, 2017, 2016 and 2015.
Property, plant and equipment by geographic area as of September 30, 20142017 and 20132016 are as follows (in thousands):
|
|
|
|
|
|
|
|
| September 30, | ||||
|
| 2017 |
| 2016 | ||
North America |
| $ | 52,235 |
| $ | 49,505 |
Asia / Pacific / Other |
|
| 676 |
|
| 952 |
Europe |
|
| 5,551 |
|
| 4,428 |
|
| $ | 58,462 |
| $ | 54,885 |
| September 30, | |||||||||
| 2014 | 2013 | ||||||||
| North America | $ | 40,232 | $ | 38,505 | |||||
| Asia/Pacific | 870 | 1,646 | |||||||
| Europe | 9,081 | 7,355 | |||||||
| $ | 50,183 | $ | 47,506 | ||||||
Property, plant and 13%,equipment located in the fiscal years ended September 30, 2014, 2013United States amounted to $52.0 million and 2012, respectively. The Company did not have any customers that accounted for more than 10% of its accounts receivable balance$49.3 million, respectively, at September 30, 20142017 and 2016.
19. Fair Value Measurements
The fair value measurement guidance establishes a fair value hierarchy which requires an entity to maximize the use of observable inputs and minimize the use of unobservable inputs when measuring fair value. The following levels of inputs may be used to measure fair value:
Level 1 Inputs: Quoted prices in active markets for identical assets or 2013.
Level 2 Inputs: Observable inputs other than prices included in Level 1, including quoted prices for similar assets or liabilities; quoted prices in markets that are not active; or other inputs that are observable or can be corroborated by observable market data for substantially the full term of revenue from any original equipment manufacturer ("OEM") customer, the Company does not include revenue from products sold to a contract manufacturer customer which in turn sellsassets or liabilities.
Level 3 Inputs: Unobservable inputs that are significant to the OEM. If the Company included revenue from products sold to contract manufacturer customers supporting the Company's OEM customers, the percentagefair value of the Company's total revenue derived from certain OEM customers would be higher.assets or liabilities and reflect an entity’s own assumptions in pricing assets or liabilities since they are supported by little or no market activity.
108
NOTES TO CONSOLIDATED FINANCIAL STATEMENTS - (Continued)
The following istables summarize assets and liabilities measured and recorded at fair value on a summaryrecurring basis in the accompanying Consolidated Balance Sheets as of accounts receivableSeptember 30, 2017 and 2016 (in thousands):
|
|
|
|
|
|
|
|
|
|
|
|
|
|
|
|
|
| Fair Value Measurements at Reporting Date Using | |||||||
|
|
|
|
| Quoted Prices in |
|
|
|
| Significant | ||
|
|
|
|
| Active Markets for |
| Significant Other |
| Unobservable | |||
|
| September 30, |
| Identical Assets |
| Observable Inputs |
| Inputs | ||||
Description |
| 2017 |
| (Level 1) |
| (Level 2) |
| (Level 3) | ||||
Assets: |
|
|
|
|
|
|
|
|
|
|
|
|
Cash equivalents |
| $ | 45 |
| $ | 42 |
| $ | 3 |
| $ | — |
Available-for-sale securities |
|
| 2,670 |
|
| — |
|
| 2,670 |
|
| — |
Foreign exchange contracts |
|
| 4 |
|
| — |
|
| 4 |
|
| — |
Total Assets |
| $ | 2,719 |
| $ | 42 |
| $ | 2,677 |
| $ | — |
Liabilities: |
|
|
|
|
|
|
|
|
|
|
|
|
Foreign exchange contracts |
|
| 146 |
|
| — |
|
| 146 |
|
| — |
Total Liabilities |
| $ | 146 |
| $ | — |
| $ | 146 |
| $ | — |
|
|
|
|
|
|
|
|
|
|
|
|
|
|
|
|
|
| Fair Value Measurements at Reporting Date Using | |||||||
|
|
|
|
| Quoted Prices in |
|
|
|
| Significant | ||
|
|
|
|
| Active Markets for |
| Significant Other |
| Unobservable | |||
|
| September 30, |
| Identical Assets |
| Observable Inputs |
| Inputs | ||||
Description |
| 2016 |
| (Level 1) |
| (Level 2) |
| (Level 3) | ||||
Assets: |
|
|
|
|
|
|
|
|
|
|
|
|
Cash equivalents |
| $ | 143 |
| $ | 98 |
| $ | 45 |
| $ | — |
Available-for-sale securities |
|
| 6,135 |
|
| — |
|
| 6,135 |
|
| — |
Foreign exchange contracts |
|
| 5 |
|
| — |
|
| 5 |
|
| — |
Convertible debt securities |
|
| 5,774 |
|
| — |
|
| — |
|
| 5,774 |
Stock warrant |
|
| 45 |
|
| — |
|
| — |
|
| 45 |
Total Assets |
| $ | 12,102 |
| $ | 98 |
| $ | 6,185 |
| $ | 5,819 |
Liabilities: |
|
|
|
|
|
|
|
|
|
|
|
|
Contingent consideration |
| $ | 500 |
| $ | — |
| $ | — |
| $ | 500 |
Foreign exchange contracts |
|
| 96 |
|
| — |
|
| 96 |
|
| — |
Total Liabilities |
| $ | 596 |
| $ | — |
| $ | 96 |
| $ | 500 |
The convertible debt securities and the stock warrant are included in "Other assets" in the accompanying Consolidated Balance Sheets as of September 30, 2016. During fiscal year ended September 30, 2017, the Company settled the convertible debt securities and the stock warrant as a part of the non-cash consideration for the Company’s acquisition of Cool Lab completed on November 28, 2016. The convertible debt securities and the stock warrant were measured at fair value on the acquisition date as a portion of the consideration transferred to the seller. A loss of $0.2 million on settlement of these financial instruments was recorded in the "Other (expense) income, net" in the Company’s Consolidated Statements of Operations for the fiscal year ended September 30, 2017. Please refer to Note 7, "Equity Method and Other Investments" for further information on the convertible debt securities and the stock warrant and Note 3, "Acquisitions" for the acquisition of Cool Lab.
Cash Equivalents
Cash equivalents of less than $0.1 million and $0.1 million, respectively, at September 30, 20142017 and 2013 (in thousands):
| September 30, | |||||||
| 2014 | 2013 | ||||||
| Accounts receivable | $ | 81,270 | $ | 78,460 | |||
| Less allowance for doubtful accounts | (1,031 | ) | (863 | ) | |||
| Less allowance for sales returns | (133 | ) | (114 | ) | |||
| $ | 80,106 | $ | 77,483 | ||||
| Description | Balance at Beginning of Period | Provisions | Reversals of Bad Debt Expense | Write-offs and Adjustments | Balance at End of Period | |||||||||||||||
| 2014 Allowance for doubtful accounts | $ | 863 | $ | 438 | $ | (315 | ) | $ | 45 | $ | 1,031 | |||||||||
| 2013 Allowance for doubtful accounts | 851 | 48 | (143 | ) | 107 | 863 | ||||||||||||||
| 2012 Allowance for doubtful accounts | 617 | 367 | (130 | ) | (3 | ) | 851 | |||||||||||||
109
| Description | Balance at Beginning of Period | Provisions | Write-offs and Adjustments | Balance at End of Period | |||||||||||
| 2014 Allowance for sales returns | $ | 114 | $ | 19 | $ | — | $ | 133 | |||||||
| 2013 Allowance for sales returns | — | 72 | 42 | 114 | |||||||||||
| September 30, | |||||||
| 2014 | 2013 | ||||||
| Inventories | |||||||
| Raw materials and purchased parts | $ | 57,250 | $ | 57,678 | |||
| Work-in-process | 20,068 | 19,991 | |||||
| Finished goods | 16,249 | 16,742 | |||||
| $ | 93,567 | $ | 94,411 | ||||
NOTES TO CONSOLIDATED FINANCIAL STATEMENTS - (Continued)
Available-For-Sale Securities
Available-for-sale securities of $2.7 million and $6.1 million, respectively, at September 30, 2017 and 2016 consist of Municipal Securities, Bank Certificate of Deposits, U.S Corporate Securities and Other Debt Securities. The Company providessecurities are valued using matrix pricing and benchmarking and classified within Level 2 of the fair value hierarchy because they are not actively traded. Matrix pricing is a mathematical technique used to value securities by relying on the securities’ relationship to other benchmark quoted prices.
Foreign Exchange Contracts
Foreign exchange contract assets and liabilities amounted to less than $0.1 million and $0.1 million, respectively, at September 30, 2017. Foreign exchange contract assets and liabilities amounted to less than $0.1 million and $0.1 million, respectively, at September 30, 2016. Foreign exchange contract assets and liabilities are measured and reported at fair value based on observable market inputs and classified within Level 2 of the fair value hierarchy due to a lack of an active market for these contracts.
Convertible Debt Securities
At September 30, 2016, convertible debt securities of $5.8 million were measured at fair value and classified within Level 3 of the estimated cost of product warranties, primarily from historical information, at the time product revenue is recognized and retrofit accruals at the time retrofit programs are established. The Company’s warranty obligation is affected by product failure rates, utilization levels, material usage, service delivery costs incurred in correcting a product failure, and supplier warranties on parts delivered to the Company. Product warranty and retrofit activity on a gross basis for thefair value hierarchy. During fiscal yearsyear ended September 30, 2014, 2013 and 2012, excluding amounts related to discontinued operations, is as follows (in thousands):
| Balance at September 30, 2011 | $ | 7,438 | |
| Adjustments for acquisitions and divestitures | 7 | ||
| Accruals for warranties during the year | 13,551 | ||
| Costs incurred during the year | (13,750 | ) | |
| Balance at September 30, 2012 | 7,246 | ||
| Adjustments for acquisitions and divestitures | 1,187 | ||
| Accruals for warranties during the year | 9,968 | ||
| Costs incurred during the year | (11,141 | ) | |
| Balance at September 30, 2013 | 7,260 | ||
| Adjustments for acquisitions and divestitures | 364 | ||
| Accruals for warranties during the year | 9,969 | ||
| Costs incurred during the year | (11,094 | ) | |
| Balance at September 30, 2014 | $ | 6,499 | |
| Sale proceeds | $ | 11,275 | |
| Net book value of building and land | (6,095 | ) | |
| Deferred leasing costs and other | (3,718 | ) | |
| Direct transaction costs | (437 | ) | |
| Gain on the sale of building and land | $ | 1,025 | |
Stock Warrants
Stock warrant valued at the end of the lease period. The assets acquired under the lease were recorded at the net present value of the minimum lease payments which was then allocated to the building and the land based on their relative fair values. The cost of the building and the land under the capital lease are included in the Consolidated Balance Sheets as property, plant and equipment at $6.4 million and $2.1 million, respectively. Depreciation expense related to the building is computed using the straight-line method over the estimated useful life of the asset. Accumulated amortization related to the lease wasless than $0.1 million at September 30, 2014.2016 was classified within Level 3 of the fair value hierarchy and measured at fair value based on the Black-Scholes model. The Black-Scholes model applied to the warrant incorporated the constant price variation of the underlying asset, the time value of money, the warrant’s strike price and the time until the warrant’s expiration date. The fair value of the warrant was determined utilizing a five year equity volatility percentage based on an average equity volatility derived from comparable public companies.
During fiscal year ended September 30, 2017, the Company canceled the stock warrant as part of the non-cash consideration for the Company’s acquisition of Cool Lab and measured the stock warrant at fair value of less than $0.1 million on the acquisition date. The fair value of the warrant was determined based on the option pricing approach that treats various classes of securities in a company’s capital structure as call options on the total equity value of the company.
110
NOTES TO CONSOLIDATED FINANCIAL STATEMENTS - (Continued)
Contingent Consideration
Contingent consideration liability of $0.5 million at September 30, 2016 was classified within Level 3 of the fair value hierarchy and measured at fair value based on the probability-weighted average discounted cash flow model utilizing potential outcomes related to achievement of certain specified targets and events. The fair value measurement of the capital leasecontingent consideration is recordedbased on probabilities assigned to each potential outcome and the discount rate. During fiscal year ended September 30, 2017, the Company settled the liability and remitted a cash payment of $0.5 million to the sellers of Contact as a remaining part of the acquisition purchase price. Please refer to Note 3, “Acquisitions” for further information on the contingent consideration liability.
The carrying amounts of accounts receivable and accounts payable approximate their fair value due to their short-term or long-term obligationnature.
The following table presents the reconciliation of the assets and liabilities measured and recorded at fair value on a recurring basis using significant unobservable inputs (Level 3) (in thousands):
|
|
|
|
|
|
|
|
|
|
|
|
|
|
| Convertible |
| Stock |
| Contingent |
|
|
| |||
|
| Debt Securities |
| Warrant |
| Consideration |
| Total | ||||
Balance at September 30, 2016 |
| $ | 5,774 |
| $ | 45 |
| $ | 500 |
| $ | 6,319 |
Change in fair value |
|
| (194) |
|
| (37) |
|
| — |
|
| (231) |
Settlements |
|
| (5,580) |
|
| (8) |
|
| (500) |
|
| (6,088) |
Balance at September 30, 2017 |
| $ | — |
| $ | — |
| $ | — |
| $ | — |
Nonrecurring Fair Value Measurements
The Company holds certain assets that are measured at fair value on a nonrecurring basis in periods subsequent to initial recognition.
A loan receivable of $1.5 million at September 30, 2016 was recorded at carrying value and included in "Other assets" in the Consolidated Balance Sheets dependingSheets. During the fiscal year ended September 30, 2017, the Company settled the loan as part of the non-cash consideration for the Company’s acquisition of Cool Lab and remeasured it at fair value of $1.6 million on when payments are due. The future minimum lease payments required under the capital lease and the presentacquisition date. Fair value of the net minimum lease payments, asloan was classified within Level 3 of the fair value hierarchy and determined based on the market approach utilizing a loan settlement value, including its principal and accrued interest, in a similar transaction in a non-observable market. The carrying value of the loan was $1.6 million on the acquisition date and included the loan’s principal and accrued interest. Please refer to Note 7, "Equity Method and Other Investments" for further information on the loan and Note 3, "Acquisitions" for the acquisition of Cool Lab.
The equity method investment in BioCision of $1.7 million at September 30, 2014,2016 was recorded at carrying value in the accompanying Consolidated Balance Sheets. During the fiscal year ended September 30, 2017, the Company redeemed the equity method investment in BioCision as part of the non-cash consideration for the Company’s acquisition of Cool Lab. Fair value of the equity method investment in BioCision of $3.1 million was classified within Level 3 of the fair value hierarchy and measured based on the option pricing approach which treats various classes of securities in a company’s capital structure as call options on the total equity value of the company. The key inputs used in the option pricing approach consisted of: (i) total equity value of BioCision estimated at $6.5 million; (ii) equity volatility estimated at 80%; (iii) time to liquidity event estimated at 1.5 years; and (iv) risk free rate of 0.96%. Please refer to Note 7, "Equity Method and Other Investments" for further information on the convertible debt securities and Note 3, "Acquisitions" for the acquisition of Cool Lab.
Certain non-financial assets, including goodwill, finite-lived intangible assets and other long-lived assets, are as follows (in thousands):measured at fair value on a non-recurring basis in accordance with the income approach when there is an indication of impairment. Please refer to Note 2, "Summary of Significant Accounting Policies" for further information on the valuation techniques used in developing these measurements.
111
NOTES TO CONSOLIDATED FINANCIAL STATEMENTS - (Continued)
| Year ended September 30, | |||
| 2015 | $ | 881 | |
| 2016 | 881 | ||
| 2017 | 881 | ||
| 2018 | 6,901 | ||
| Total minimum lease payments | 9,544 | ||
| Less amounts representing interest | 1,246 | ||
| Total capital lease obligation | 8,298 | ||
| Less current portion of capital lease obligation | 881 | ||
| Long-term capital lease obligation | $ | 7,417 | |
20. Commitments and Contingencies
Operating Leases Commitments
The Company leases manufacturing and office facilities and certain equipment under non-cancelable operating leases that expirewith lease expiration dates through 2019. Rental2025. Rent expense under the operating leases, excluding expensecosts recorded as a component of restructuring charges, was $4.4 million, $4.9 million and $6.5 million, respectively, for the fiscal years ended September 30, 2014, 20132017, 2016 and 2012 was $8.2 million,
The Company leases approximately 85,000 square feet of space in Indianapolis, Indiana to accommodate its sample storage, sales and
In addition to the Indianapolis facility, the Company leases approximately 45,000 square feet of space in each of its Fremont, California and Manchester, UK to accommodate its manufacturing, research and development, and sales and support functions. During the fiscal year ended September 30, 2017, the Company extended the lease term for its Fremont, California facility until August 31, 2025 which may be further extended at the Company’s option for two additional terms of five years each, subject to the terms and conditions of the lease. The initial term for the Manchester, UK facility expires in December 2019 and may be extended at the Company’s option for five years subject to the terms and conditions of the lease.
Future minimum lease commitments on non-cancelable operating leases and scheduled sublease payments as of September 30, 20142017 are as follows (in thousands):
|
|
|
|
|
|
|
|
|
|
|
|
|
| Scheduled |
|
| |||
|
| Gross |
| Sublease |
| Net | |||
Year Ended September 30, |
| Payments |
| Payments |
| Payments | |||
2018 |
| $ | 3,739 |
| $ | 54 |
| $ | 3,685 |
2019 |
|
| 3,182 |
|
| 9 |
|
| 3,173 |
2020 |
|
| 1,791 |
|
| — |
|
| 1,791 |
2021 |
|
| 1,535 |
|
| — |
|
| 1,535 |
2022 |
|
| 1,549 |
|
| — |
|
| 1,549 |
Thereafter |
|
| 9,066 |
|
| — |
|
| 9,066 |
|
| $ | 20,862 |
| $ | 63 |
| $ | 20,799 |
| Year ended September 30, 2015 | $ | 5,140 | |
| 2016 | 3,384 | ||
| 2017 | 1,748 | ||
| 2018 | 1,401 | ||
| 2019 | 706 | ||
| Thereafter | 93 | ||
| $ | 12,472 | ||
The Company isutilizes a guarantor onthird party to manage its manufacturing operations in Mexico. As a part of this arrangement, the Company makes and guarantees the monthly payments for a lease inof its Mexico thatfacility which expires in January 2018. As of September 30, 2014, theFebruary 2019. The remaining payments under thisthe lease arewere approximately $$1.41.0 million at September 30, 2017..
Letters of Credit
At September 30, 2014,2017 and 2016, the Company had
112
NOTES TO CONSOLIDATED FINANCIAL STATEMENTS - (Continued)
Purchase Commitments
The Company has non-cancelable contracts and purchase orders for inventory of $71.0$122.0 million and $101.4 million, respectively, at September 30, 2014.
Contingencies
During the fiscal year ended September 30, 2016, the Company discovered that it inadvertently failed to register on Form S‑8 with the Securities and Exchange Commission certain shares of common stock previously authorized for issuance by the Company’s Board of Directors and stockholders under the Company’s 1995 Employee Stock Purchase Plan, as amended (the “ESPP”). As a result, certain purchasers of common stock under the ESPP had the right to rescind their purchases for an amount equal to the purchase price paid for the shares, plus interest from the date of purchase. The rescission rights were limited to the shares purchased in the last twelve months, which is the applicable federal statute of limitations, and still held by the original purchasers. These shares have been treated as issued and outstanding for financial reporting purposes.
In fiscal year 2016, the Company sold shares of its common stock under the ESPP in two separate transactions. On January 29, 2016, the Company sold 118,548 shares to ESPP participants at a price of $8.00 per share and on July 29, 2016, the Company sold 117,179 shares to ESPP participants at a price of $8.02 per share, for an aggregate purchase price of approximately $1.9 million. No commissions or other fees were paid in connection with the issuance of those shares. On February 8, 2017, the Company filed a Form S-8 registration statement with the SEC to cover the 1,000,000 shares of common stock that had been authorized for issuance by our Board of Directors and approved by the stockholders but not otherwise registered on a Form S-8. All the shares subject to rescission rights expired by statute of limitations on July 31, 2017.
The Company is subject to various legal proceedings, both asserted and unasserted, that arise in the ordinary course of business. The Company cannot predict the ultimate outcome of such legal proceedings or in certain instances provide reasonable ranges of potential losses. However, as of the date of this report, the Company believes that none of these claims will have a material adverse effect on its consolidated financial conditionposition or results of operations. In the event of unexpected subsequent developments and given the inherent unpredictability of these legal proceedings, there can be no assurance that the Company'sCompany’s assessment of any claim will reflect the ultimate outcome, and an adverse outcome in certain matters could, from time to time, have a material adverse effect on the Company'sCompany’s consolidated financial conditionposition or results of operations in particular quarterly or annual periods.
21. Subsequent Events
Senior Secured Term Loan Facility
On October 1, 2014,4, 2017, the Company acquired allentered into the $200.0 million term loan with the lenders. The term loan was issued at $197.6 million, or 98.8% of its par value, resulting in a discount of $2.4 million, or 1.2%, which represented loan origination fees paid at the closing. The loan proceeds will be used for general corporate purposes, including acquisitions. The loan principal amount may be increased by an aggregate amount equal to $75.0 million plus any voluntary repayments of the outstanding stockterm loans plus an amount such that the secured leverage ratio of FluidX Ltd. (“FluidX”), a UK based provider of biological sample storage tubes and complementary bench-top instruments. The Company agreed to a purchase price of approximately $16.0 million of cash, subject to a working capital adjustment. The acquisition of FluidX provides the Company is less than 3.00 to 1.00. Deferred financing costs directly associated with obtaining the term loan were $0.4 million at September 30, 2017 and are presented within "Other assets" in the accompanying Consolidated Balance Sheets.
Under the terms of the loan agreement, the Company may elect for the loan to bear an interest rate as Eurodollar Borrowings or as Alternate Base Rate, or ABR Borrowings. Interest applicable to Eurodollar Borrowings is based on the Adjusted LIBO Rate plus applicable margin of 2.50%. The Adjusted LIBO Rate is the rate appearing on Bloomberg screen LIBOR01 which gets reset at the beginning of each selected interest period based on LIBOR rate then in effect. Interest applicable to Alternate Base Rate Borrowings is based on the Alternate Base Rate plus applicable margin of 1.50%. Alternate Base Rate is determined based on the highest of: (a) the federal funds effective rate plus 0.50%, (b) prime rate plus 1.00%, or (c) one-month LIBOR rate plus 1.00%.
113
NOTES TO CONSOLIDATED FINANCIAL STATEMENTS - (Continued)
The Company’s obligations under the term loan are guaranteed by the Company’s wholly-owned subsidiary, BioStorage Technologies, Inc. (the “guarantor”), subject to the terms and conditions of the term loan agreement. The Company and the guarantor granted the lenders a perfected first priority security interest in substantially all of the assets of the Company and the guarantor to secure the repayment of the term loan.
The term loan matures and becomes fully payable on October 4, 2024. The principal is payable in installments equal to 0.25% of the initial principal amount of the term loans on March 31st, June 30th, September 30th and December 31st of each year, with any remaining amount of principal becoming due and payable on the opportunitymaturity date. All accrued and unpaid interest on ABR Borrowings shall be due and payable at the same time as the loan principal installments. All accrued and unpaid interest on Eurodollar Borrowings shall be due on the last day of each interest period elected by the Company for such Eurodollar Borrowings, except for interest periods of more than three months in which case all accrued and unpaid interest shall be due and payable every three months.
Subject to enhance its existing capabilities with respect to biobanking solutionscertain conditions stated in the term loan agreement, the Company may redeem the term loan at any time at its option without a significant premium or penalty, except for a repricing transaction, as defined in the term loan agreement, which is subject to a premium of 1.00% of the loan principal amount during the first six months of the loan term. The Company would be required to redeem the term loan at the principal amount then outstanding upon occurrence of certain events, including (i) net proceeds received from the sale or other disposition of the Company’s or guarantor’ assets, subject to certain limitations, (ii) casualty and condemnation proceeds received by the Company or the guarantor, subject to certain exceptions, (iii) net proceeds received by the Company or the guarantor from the issuance of debt or disqualified capital stock after October 4, 2017. Commencing on December 31, 2018, the Company will be required to make principal payments equal to the excess cash flow amount, as defined in the term loan agreement. Such prepayments are equal to 50% of the preceding year excess cash flow amount reduced by voluntary prepayments of the term loan, subject to certain limitations.
The term loan agreement contains certain customary representations and warranties, covenants and events of default. If any of the events of default occur and are not waived or cured within applicable grace periods, any unpaid amounts under the term loan agreement will bear an annual interest rate at 2.00% above the rate otherwise applicable under the terms and conditions of such agreement. The term loan agreement does not contain financial maintenance covenants.
Acquisition
On October 5, 2017, the Company acquired all of the outstanding capital stock of 4titude Limited (“4titude”), a U.K.-based manufacturer of scientific consumables for biological sample materials used in a variety of genomic and DNA analytical applications. Total cash payment made by the Company was $65.5 million, net of cash acquired, and is subject to working capital adjustments. The acquisition is expected to expand the Company’s existing offerings of consumables and instruments within the Brooks Life Science Systems segment.
Dividend
On November 5, 2014,8, 2017, the Company’s Board of Directors declared a cash dividend of $0.10 per share payable on December 26, 201422, 2017 to common stockholders of record onas of December 5, 2014.1, 2017. Dividends are declared at the discretion of the Company’s Board of Directors and depend on the Company’s actual cash flow from operations, the Company’sits financial condition and capital requirements, andas well as any other factors the Company’s Board of Directors may consider relevant. Future dividend declarations, as well as the record and payment dates for such dividends, will be determined by the Company’s Board of Directors on a quarterly basis.
114
Item 9.Changes In |
Under the supervision and with the participation of our management, including our chief executive officer and chief financial officer, we conducted an evaluation of our disclosure controls and procedures, as such term is defined under Rule 13a-15(e)13a‑15(e) promulgated under the Exchange Act. Disclosure controls and procedures are designed to ensure that information required to be disclosed by us in the reports we file or submit under the Exchange Act is recorded, processed, summarized and reported on a timely basis and that such information is accumulated and communicated to management, including the chief executive officer and chief financial officer, as appropriate, to allow timely decisions regarding required disclosure. Based upon this evaluation, our chief executive officer and our chief financial officer concluded that our disclosure controls and procedures were effective as of September 30, 2017, the end of the period covered by this annual report.
Management’s Report on Internal Control Over Financial Reporting
Our management is responsible for establishing and maintaining adequate internal control over financial reporting. Internal control over financial reporting is defined in Rules 13a-15(f)13a‑15(f) and 15d-15(f)15d‑15(f) under the Exchange Act, as a process designed by, or under the supervision of our chief executive and chief financial officers and effected by our board of directors, management and other personnel to provide reasonable assurance regarding the reliability of financial reporting and the preparation of financial statements for external purposes in accordance with generally accepted accounting principlesGAAP and includes those policies and procedures that:
· | pertain to the maintenance of records that in reasonable detail accurately and fairly reflect the transactions and disposition of our assets; |
· | provide reasonable assurance that transactions are recorded as necessary to permit preparation of financial statements in accordance with GAAP, and that our receipts and expenditures are being made only in accordance with authorization of our management and directors; and |
· | provide reasonable assurance regarding prevention or timely detection of unauthorized acquisition, use or disposition of our assets that could have a material effect on the financial statements. |
Because of its inherent limitations, internal control over financial reporting may not prevent or detect misstatements. Projections of any evaluation of effectiveness to future periods are subject to the risks that controls may become inadequate because of changes in conditions, or that the degree of compliance with the policies or procedures may deteriorate.
Under the supervision and with the participation of our management, including our chief executive officer and chief financial officer, we conducted an assessment of the effectiveness of our internal control over financial reporting as of September 30, 2014.2017. In making this assessment, we used the criteria set forth in the 1992 framework establishedInternal Control - Integrated Framework (2013) issued by the Committee of Sponsoring Organizations (COSO) of the Treadway Commission (COSO) in Internal Control-Integrated Framework. Commission. Based on our assessment, weour management concluded that, as of September 30, 2014,2017, our internal control over financial reporting was effective.
We excluded Pacific Bio-Material Management, Inc. from our assessment of the effectiveness of our internal control over financial reporting as of September 30, 2014 does not include2017 because it was acquired by the internal controlsCompany in a purchase business combination during fiscal year 2017. The total assets and total revenues of DMS as management determined that it would not be practical to conduct a sufficiently comprehensive assessmentPacific Bio-Material Management, Inc. represent 1.7% and 0.5%, respectively, of the internal controlsrelated consolidated financial statement amounts as of DMS based on the date of the acquisition and managements’ other time commitments. Guidance issued by the Securities and Exchange Commission permits companies to exclude acquisitions from their assessment of internal control over financial reporting for the first fiscal year in which the acquisition occurred. Our consolidated revenue for the fiscal year ended September 30, 2014 was $482.8 million,2017.
115
The effectiveness of our internal control over financial reporting as of September 30, 20142017 has been audited by BDO USAPricewaterhouseCoopers LLP, an independent registered public accounting firm, as stated in the following report:
Changes in Internal Control Over Financial Reporting
There were no changes in internal control over financial reporting during the fiscal fourth quarter ended September 30, 2014,2017, that have materially affected, or are reasonably likely to materially affect, our internal control over financial reporting.
Item 9B. Other Information None. Item 10. Directors, Executive Officers and Corporate Governance The information required by this Item 10 is contained in our definitive proxy statement for our Item 9B.Other InformationNone.PART IIIItem 10.Directors, Executive Officers and Corporate Governance20152018 annual meeting of shareholders to be filed by us within 120 days after the close of our fiscal year, (the "2015or the 2018 Proxy Statement")Statement, under the caption "Proposal No. 1-Election1‑Election of Directors," "Other Matters-Section 16(a) Beneficial Ownership Compliance," "Other Matters-Standards of Conduct," "Other Matters-Stockholder Proposals and Recommendations for Directors" and "Corporate Governance" and is incorporated herein by reference.
Item 11. Executive Compensation The information required by this Item 11 is contained under the caption "Corporate Governance and Director Compensation" and "Executive Officers" in the Item 11.Executive Compensation20152018 Proxy Statement to be filed by us within 120 days after the close of our fiscal year and is incorporated herein by reference.
Item 12. Security Ownership of Certain Beneficial Owners and Management and Related Stockholder Matters The information required by this Item 12 is contained under the caption "General Information-Security Ownership of Certain Beneficial Owners" and "Equity Compensation Plan Information" in the Item 12.Security Ownership of Certain Beneficial Owners and Management and Related Stockholder Matters20152018 Proxy Statement to be filed by us within 120 days after the close of our fiscal year and is incorporated herein by reference.
Item 13. Certain Relationships and Related Transactions, and Director Independence The information required by this Item 13 is contained under the caption "Related Party Transactions" and "Corporate Governance and Director Compensation" in the Item 13.Certain Relationships and Related Transactions, and Director Independence20152018 Proxy Statement to be filed by us within 120 days after the close of our fiscal year and is incorporated herein by reference.
Item 14. Principal Accountant Fees and Services The information required by this Item 14 is contained under the caption "Independent Auditor Fees and Other Matters" in the 116 PART IVItem 14.Principal Accountant Fees and Services20152018 Proxy Statement to be filed by us within 120 days after the close of our fiscal year and is incorporated herein by reference.
Item 15. Exhibits and Financial Statement Schedules
(a)Financial Statements and Financial Statement Schedules |
· | Consolidated Financial Statements of the Company and the related notes are included under Part II, Item 8, "Financial Statements and Supplementary Data" of this Form 10‑K. |
· | Consolidated Financial Statements of ULVAC Cryogenics, Inc. as of as of June 30, 2017 and 2016 and for each of the periods ended June 30, 2017, 2016 and 2015 and the related notes are filed as Exhibit 99.2 hereto and incorporated herein by reference in this Form 10‑K pursuant to Rule 3‑09 of Regulation S-X. |
· | Other financial statement schedules are omitted because of the absence of conditions under which they are required or because the required information is given in the supplementary Consolidated Financial Statements or notes thereto. |
(b)Exhibits |
Exhibit | Description | |
3.01 | ||
3.02 | ||
3.03 | ||
4.01 | ||
10.01 | ||
Basic agreement between the Company and Ulvac Corporation dated August 17, 1981 (incorporated herein by reference to Exhibit 10.13 of the registration statement on Form | ||
10.02 | ||
10.03 | ||
10.04 | ||
10.05 | ||
10.06 | ||
117
10.07 | ||
10.08 | ||
10.09 | ||
10.10 | ||
10.11 | ||
10.12 | ||
10.13 | ||
10.14 | ||
10.15 | ||
10.16 | ||
10.17 | ||
10.18 | ||
10.19 | ||
10.20 | ||
10.21 | Brooks Automation, Inc. Deferred Compensation Plan, as amended. | |
118
10.22 | ||
10.23 | ||
10.24 | ||
10.25 | ||
10.26 | ||
10.27 | ||
21.01 | ||
23.01 | ||
23.02 | ||
23.03 | ||
31.01 | ||
31.02 | ||
32 | ||
99.1 | ||
99.2 | ||
101 | The following material from the | |
119
SIGNATURES
Pursuant to the requirements of Section 13 or 15(d) of the Securities Exchange Act of 1934, the registrant has duly caused this report to be signed on its behalf by the undersigned, thereunto duly authorized.
BROOKS AUTOMATION, INC. | |||
By: | /S/ STEPHEN S. SCHWARTZ | ||
Stephen S. Schwartz Chief Executive Officer | |||
Date: November 13, 2014
Pursuant to the requirements of the Securities Exchange Act of 1934, this report has been signed below by the following persons on behalf of the registrant and in the capacities and on the dates indicated.
Signature | Title | Date | ||
/S/ STEPHEN S. SCHWARTZ | ||||
Director and Chief Executive Officer | ||||
(Principal Executive Officer) | November 17, 2017 | |||
Stephen S. Schwartz | ||||
/S/ | Executive Vice President and | |||
Chief Financial Officer | ||||
(Principal Financial Officer) | November 17, 2017 | |||
Lindon G. Robertson | ||||
/S/ | Vice President - Finance and | |||
Corporate Controller | ||||
(Principal Accounting Officer) | November 17, 2017 | |||
David Pietrantoni | ||||
/S/ A. CLINTON ALLEN | Director | November 17, 2017 | ||
A. Clinton Allen | ||||
/S/ | Director | November | ||
Robyn C. Davis | ||||
/ | Director | November | ||
Joseph R. Martin | ||||
/ | Director | November | ||
John K. McGillicuddy | ||||
/ | Director | November | ||
Krishna G. Palepu | ||||
/ | Director | November | ||
Kirk P. Pond | ||||
/ | Director | November | ||
Alfred Woollacott III | ||||
/ | Director | November | ||
Mark S. Wrighton | ||||
/ | Director | November | ||
Ellen M. Zane |
120