The majority of our net revenue in North America is generated in the United States which amounted to $232.7 million, $172.9 million and $156.9 million, respectively, during fiscal years ended September 30, 2018, 2017 and 2016.
The geographic location of an OEM is not indicative of where our products will eventually be used. The geographic area for our orders is determined by the onward sale of an OEM system which incorporates our sub-systems and/or components.
Property, plant and equipment by geographic area as of any particular date should not be relied uponSeptember 30, 2018 and 2017 are as indicative of our revenue for any future period. A substantial percentage of current business generates no backlog because we deliver our productsfollows (in thousands):
|
|
|
|
|
|
|
|
| September 30, | ||||
|
| 2018 |
| 2017 | ||
North America |
| $ | 50,614 |
| $ | 50,908 |
Asia / Pacific/ Other |
|
| 492 |
|
| 547 |
Europe: |
|
|
|
|
|
|
United Kingdom |
|
| 5,494 |
|
| 2,848 |
Rest of Europe |
|
| 3,388 |
|
| 2,678 |
|
| $ | 59,988 |
| $ | 56,981 |
Property, plant and servicesequipment located in the same period in which the order is received. The orders included in our backlog may also be canceled or rescheduled by customers without significant penalty. United States amounted to $50.5 million and $50.7 million, respectively, at September 30, 2018 and 2017.
Environmental Matters
We are subject to federal, state, and local environmental laws and regulations, as well asand the environmental laws and regulations of the foreign national and local jurisdictions in which we have manufacturing facilities. We believe we are materially in compliance with all such laws and regulations.
Compliance with foreign, federal, state, and local laws and regulations has not had, and is not expected to have, an adverse effect on our capital expenditures, competitive position, financial condition or results of operations.
Employees
At September 30, 2015,2018, we had 1,4261,548 full time employees. In addition, we employ part time workers and contractors. Approximately 50 employees in our facility in Jena, Germany are covered by a collective bargaining agreement. We consider our relationships with these and allour employees to be good.
Available Information
We file annual, quarterly, and current reports, proxy statements, and other documents with the SEC, under the Securities Exchange Act of 1934, as amended, or the Exchange Act. The public may read and copy any materials that we file with the SEC at the SEC'sSEC’s Public Reference Room at 100 F Street, NE, Washington, DC 20549. The public may obtain information on the operation of the Public Reference Room by calling the SEC at 1-800-SEC-0330.1‑800‑SEC‑0330. Also, the SEC maintains an Internet website that contains reports, proxy and information statements, and other information regarding issuers, including Brooks Automation, Inc., that file electronically with the SEC. The public can obtain any documents that we file with the SEC at
Our internet website address is
http://12
Item 1A.
Factors That May Affect Future Results
You should carefully consider the risks described below and the other information in this report before deciding to invest in shares of our common stock. These are the risks and uncertainties we believe are most important for you to consider. Additional risks and uncertainties not presently known to us, which we currently deem immaterial or which are similar to those faced by other companies in our industry or business in general, may also impair our business operations. If any of the following risks or uncertainties actually occurs, our business, financial condition and operating results would likely suffer. In that event, the market price of our common stock could decline and you could lose all or part of your investment.
Risks Relating to Our Industry
Due in part to the cyclical nature of the semiconductor manufacturing industry and related industries, as well as due to volatility in worldwide capital and equity markets, we have previously incurred operating losses and may have future losses.
Our business is largely dependent on capital expenditures in the semiconductor manufacturing industry and other businesses employing similar manufacturing technologies. The semiconductor manufacturing industry in turn depends on current and anticipated demand for integrated circuits and the products that use them. In recent years, these businesses have experienced unpredictable and volatile business cycles due in large part to rapid changes in demand and manufacturing capacity for semiconductors, and these cycles have had an impact on our business, sometimes causing declines in revenue and operating losses. We could experience future operating losses during an industry downturn. If an industry downturn continues for an extended period of time, our business could be materially harmed. Conversely, in periods of rapidly increasing demand,
We face competition which may lead to price pressure and otherwise adversely affect our sales.
We face competition throughout the world in each of our product and service areas, including from the competitors discussed in Part I, Item 1, “Business - Competition” as well as from internal automation capabilities at larger OEMs. Many of our competitors have substantial engineering, manufacturing, marketing and customer support capabilities. In addition, strategic initiatives in China to encourage local semiconductor manufacturing and supply chain could increase competition from domestic equipment manufacturers in China. We expect our competitors to continue to improve the performance of their current products and services and to introduce new products, services and technologies that could adversely affect sales of our current and future products and services. New products, services and technologies developed by our competitors or more efficient production of their products or provisions of their services could require us to make significant price reductions or decide not to compete for certain orders. If we fail to respond adequately to pricing pressures or fail to develop products with improved performance or developments or better quality services with respect to the other factors on which we compete, we could lose customers or orders. If we are unable to compete effectively, our business and prospects could be materially harmed.
Risks Relating to Our Operations
Our operating results could fluctuate significantly, which could negatively impact our business.
Our revenue, operating margins and other operating results could fluctuate significantly from quarter to quarter depending upon a variety of factors, including:
· | demand for our products as a result of the cyclical nature of the semiconductor manufacturing industry and the markets upon which the industry depends or otherwise; |
· | changes in the timing and terms of product orders by our customers as a result of our customer concentration or otherwise; |
13
· | changes in the demand for the mix of products and services that we offer; |
· | timing and market acceptance of our new product and services introductions; |
· | delays or problems in the planned introduction of new products or services, or in the performance of any such products following delivery to customers or the quality of such services; |
· | new products, services or technological innovations by our competitors, which can, among other things, render our products less competitive due to the rapid technological changes in the markets in which we provide products and services; |
· | the timing and related costs of any acquisitions, divestitures or other strategic transactions; |
· | our ability to reduce our costs in response to decreased demand for our products and services; |
· | our ability to accurately estimate customer demand, including the accuracy of demand forecasts used by us; |
· | disruptions in our manufacturing process or in the supply of components to |
· | write-offs for excess or obsolete inventory; |
· | competitive pricing pressures; and |
· | increased amount of investment into the infrastructure to support our growth, including capital equipment, research and development, as well as selling and marketing initiatives to support continuous product innovation, technological capability enhancements and sales efforts. The timing of revenue generation coupled with the increased amount of investment may result in operating losses. |
As a result of these risks, we believe that quarter-to-quarterreference to past performance for comparisons of our revenue and operating results may not be meaningful, and that these comparisons may not be an accurate indicator of our future performance.
If we do not continue to introduce new products and services that reflect advances in technology in a timely and effective manner, our products and services may become obsolete and our operating results will suffer.
Our success is dependent on our ability to respond to the technological changes present in the markets we serve. The success of our product development and introduction of products to market depends on our ability to:
· | identify and define new market opportunities, products and services in accurate manner; |
· | obtain market acceptance of our products and services; |
· | innovate, develop and commercialize new technologies and applications in a timely manner; |
· | adjust to changing market conditions; |
· | differentiate our offerings from our competitors’ offerings; |
· | obtain and maintain intellectual property rights where necessary; |
· | continue to develop a comprehensive, integrated product and service strategy; |
· | price our products and services appropriately; and |
· | design our products to high standards of manufacturability so that they meet customer requirements. |
14
If we cannot succeed in responding in a timely manner to technological and/or market changes or if the new products and services that we introduce do not achieve market acceptance, our competitive position would diminish which could materially harm our business and our prospects.
The global nature of our business exposes us to multiple risks.
During fiscal years ended September 30, 20152018 and 2014,2017, approximately 63% and 64%, respectively,67% of our revenue was derived from sales outside of North America. We expect that international sales, including increased sales in Asia, will continue to account for a significant portion of our revenue. We maintain a global footprint of sales, service and repair operations. As a result of our international operations, we are exposed to many risks and uncertainties, including:
· | longer sales-cycles and time to collection; |
· | tariff and international trade barriers; |
· | fewer or less certain legal protections for intellectual property and contract rights abroad; |
· | different and changing legal and regulatory requirements in the jurisdictions in which we operate; |
· | government currency control and restrictions on repatriation of earnings; |
· | fluctuations in foreign currency exchange and interest rates, particularly in Asia and Europe; and |
· | political and economic instability, changes, hostilities and other disruptions in regions where we operate. |
Negative developments in any of these areas in one or more countries could result in a reduction in demand for our products, the cancellation or delay of orders already placed, threats to our intellectual property, difficulty in collecting receivables, and a higher cost of doing business, any of which could materially harm our business and profitability.
Our business could be materially harmed if we fail to adequately integrate the operations of the businesses that we have acquired or may acquire.
We have made in the past, and may make in the future, acquisitions or significant investments in businesses with complementary products, services and/or technologies. Our acquisitions present numerous risks, including:
· | difficulties in integrating the operations, technologies, products and personnel of the acquired companies and realizing the anticipated synergies of the combined businesses; |
· | defining and executing a comprehensive product strategy; |
· | managing the risks of entering markets or types of businesses in which we have limited or no direct experience; |
· | the potential loss of key employees, customers and strategic partners of ours or of acquired companies; |
· | unanticipated problems or latent liabilities, such as problems with the quality of the installed base of the target company’s products or infringement of another company’s intellectual property by a target company’s activities or products; |
· | problems associated with compliance with the acquired company’s existing contracts; |
· | difficulties in managing geographically dispersed operations; and |
· | the diversion of management’s attention from normal daily operations of the business. |
If we acquire a new business, we may be required to expend significant funds, incur additional debt or issue additional securities, which may negatively affect our operations and be dilutive to our stockholders. In periods following an acquisition, we
15
will be required to evaluate goodwill and acquisition-related intangible assets for impairment. If such assets are found to be impaired, they will be written down to estimated fair value, with a charge against earnings. The failure to adequately address these risks or the impairment of any assets could materially harm our business and financial results.
The announcement and pendency of the sale of our semiconductor cryogenics business to Atlas Copco could have an adverse effect on our stock price and/or our business, results of operations, financial condition and prospects.
The announcement and pendency of the sale of our semiconductor cryogenics business to Edwards Vacuum LLC (a member of the Atlas Copco Group) pursuant to the asset purchase agreement we entered into on August 27, 2018 could disrupt our business in the following ways, among others:
· | customers may determine to delay or defer purchase decisions with regard to our cryogenics products or terminate and/or attempt to renegotiate their relationships with us as a result of the pending sale, whether pursuant to the terms of their existing agreements with us or otherwise; |
· | the attention of our management may be directed toward the completion of the pending sale and related matters, and their focus may be diverted from the day-to-day business operations of our company, including from other opportunities that might otherwise be beneficial to us. |
Should any of these matters occur, they could adversely affect our stock price or harm our business, results of operations, financial condition and prospects.
Obtaining required approvals necessary to satisfy the conditions to the completion of the sale of our semiconductor cryogenics business may delay or prevent completion of the pending sale.
The completion of the sale of our semiconductor cryogenics business to Atlas Copco is conditioned upon the approval of the Committee on Foreign Investment in the United States (CFIUS). We intend to pursue all required approvals in accordance with the terms of the asset purchase agreement. No assurance, however, can be given that the required approvals will be obtained and, even if all such approvals are obtained, no assurance can be given as to the terms, conditions and timing of the approvals or that the approvals will satisfy the terms of the asset purchase agreement.
Inability to complete the sale of our semiconductor cryogenics business could negatively impact our business, financial condition, results of operations or our stock price.
The completion of the sale of our semiconductor cryogenics business to Atlas Copco is subject to a number of conditions, including, among others, clearance under the HSR Act, approval of CFIUS, the receipt of any required third party consents and there not having been a material adverse effect with respect to such business, and there can be no assurance that the conditions to the completion of the pending sale will be satisfied. The asset purchase agreement may also be terminated by us and Atlas Copco in certain specified circumstances, including if the sale has not been consummated by April 15, 2019. While the potential sale is pending and if the pending sale is not completed, we will be subject to several risks, including:
· | the current trading price of our common stock may reflect a market assumption that the sale will be completed; |
· | we expect to incur substantial transaction costs in connection with the pending sale whether or not it is completed; |
16
· | under the asset purchase agreement, we are subject to certain restrictions on the conduct of our business prior to the completion of the pending sale, which restrictions could adversely affect our ability to realize certain of our business strategies or take advantage of certain business opportunities; |
· | we may be limited in our ability to repay our $350.0 million senior secured incremental term loan facility under our Credit Agreement, dated as of October 4, 2017, used to fund a portion of the cash purchase price of our acquisition of GENEWIZ on November 15, 2018; and |
· | The negative perception of investors and customers of our semiconductor cryogenics business if the sale is not consummated and our inability to operate the business in the same manner as before the announcement of the proposed sale. |
Any of these risks could have a material adverse effect on our business, financial condition, results of operations and stock price.
Expanding within current markets introduces new competitors and commercial risks.
A key part of our growth strategy is to continue expanding beyondwithin the semiconductor manufacturing market into semiconductor adjacent and life sciences sample management markets.market. As part of this strategy, we expect to diversify our product sales and service revenue by leveraging our core technologies, which requires investments and resources which may not be available as needed. We cannot guarantee that we will be successful in leveraging our capabilities into the life sciences sample management market to meet all the needs of these new customers and to compete favorably. Because a significant portion of our growth potential may be dependent on our ability to increase sales to markets beyond semiconductor manufacturing,within the life science sample management market, our inability to successfully enter new marketsexpand within such market may adversely impact future financial results.
Changes in key personnel could impair our ability to execute our business strategy.
The continuing service of our executive officers and essential engineering, technical and management personnel, together with our ability to attract and retain such personnel, is an important factor in our continuing ability to execute our strategy. There is substantial competition to attract such employees and the loss of any such key employees could have a material adverse effect on our business and operating results. The same could be true if we were to experience a high turnover rate among engineering and technical personnel and we were unable to replace them.
Our failure to protect our intellectual property could adversely affect our future operations.
Our ability to compete is significantly affected by our ability to protect our intellectual property. We rely upon patents, trade secret laws, confidentiality procedures, copyrights, trademarks and licensing agreements to protect our technology. Existing trade secret, trademark and copyright laws offer only limited protection. Our success depends in part on our ability to obtain and enforce patent protection for our products both in the United States and in other countries. We own numerous U.S. and foreign patents, and we intend to file additional applications, as appropriate, for patents covering our products and technology. Any issued patents owned by or licensed to us may be challenged, invalidated or circumvented, and the rights under these patents may not provide us with competitive advantages. In addition, the laws of some countries in which our products are or may be developed, manufactured or sold may not fully protect our products. Due to the rapid technological change that characterizes the semiconductor and adjacent technology markets, we believe that the improvement of existing technology, reliance upon trade secrets and unpatented proprietary know-how and the development of new products may be as important as patent protection in establishing and maintaining competitive advantage. To protect trade secrets and know-how, it is our policy to require all technical and management personnel to enter into nondisclosure agreements.
We cannot guarantee that the steps we have taken to protect our intellectual property will be adequate to prevent the misappropriation of our technology. Other companies could independently develop similar or superior technology without violating our intellectual property rights. In the future, it may be necessary to engage in litigation or like activities to enforce our intellectual property rights, to protect our trade secrets or to determine the validity and scope of proprietary rights of others, including our customers. This could require us to incur significant expenses and to divert the efforts and attention of our management and technical personnel from our business operations.
17
The expiration of our patents over time could lead to an increase of competition and a decline in our revenue.
One of our main competitive strengths is our technology, and we are dependent on our patent rights and other intellectual property rights to maintain our competitive position. While ourOur current patents will expire from time to time through 2033, certain significant patents2035 which we license to third parties in exchange for agreed upon royalties will expire within the next 12 months. In addition to the loss of revenue from royalties, the expiration of patents could result in increased competition and declines in product and service revenue.
We may be subject to claims of infringement of third-party intellectual property rights, or demands that we license third-party technology, which could result in significant expense and prevent us from using our technology.
There has been substantial litigation regarding patent and other intellectual property rights in the semiconductor-related industries. We have in the past been, and may in the future be, notified that we may be infringing intellectual property rights possessed by third parties. We cannot guarantee that infringement claims by third parties or other claims for indemnification by customers or end-users of our products resulting from infringement claims will not be asserted in the future or that such assertions, whether or not proven to be true, will not materially and adversely affect our business, financial condition and results of operations.
We cannot predict the extent to which we might be required to seek licenses or alter our products so that they no longer infringe the rights of others. We also cannot guarantee that licenses will be available or the terms of any licenses we may be required to obtain will be reasonable. Similarly, changing our products or processes to avoid infringing the rights of others may be costly or impractical and could detract from the value of our products. If a judgment of infringement were obtained against us, we could be required to pay substantial damages and a court could issue an order preventing us from selling one or more of our products. Further, the cost and diversion of management attention brought about by such litigation could be substantial, even if we were to prevail. Any of these events could result in significant expense to us and may materially harm our business and our prospects.
Unexpected events could disrupt our sample storage operations and adversely affect our reputation and results of operations.
Unexpected events, including fires or explosions at our facilities, natural disasters, such as tornadoes, hurricanes and earthquakes, war or terrorist activities, unplanned power outages, supply disruptions and failure of equipment or systems, could adversely affect our reputation and results of operations. Our Brooks Life Sciences’ service customers rely on us to securely store and timely retrieve and transport their critical samples, and these events could result in service disruptions, physical damage to one or more key storage facilities and the customer samples stored in those facilities, the temporary closure of one or more key operating facilities or the temporary disruption of service, each of which could negatively impact our reputation and results of operations. Our primary storage facility is located in Indianapolis, Indiana, an area of the United States that can be prone to tornado and other severe weather events.
If our manufacturing sites were to experience a significant disruption in operations, our business could be materially harmed, while the failure to estimate customer demand accurately could result in excess or obsolete inventory.
We have a limited number of manufacturing facilities for our products and we have moved portions of our manufacturing to third parties, including some in lesser developed countries. If the operations at any one of these facilities were disrupted as a result of a natural disaster, fire, power or other utility outage, work stoppage or other similar event, our business could be seriously harmed because we may be unable to manufacture and ship products and parts to our customers in a timely fashion.
Moreover, if actual demand for our products is different than expected, we may purchase more/fewer component parts than necessary or incur costs for canceling, postponing or expediting delivery of such parts. If we purchase inventory in anticipation of customer demand that does not materialize, or if our customers reduce or delay orders, we may incur excess inventory charges. Any or all of these factors could materially and adversely affect our business, financial condition and results of operations.
18
Our business could be materially harmed if one or more key suppliers fail to continuously deliver key components of acceptable cost and quality.
We currently obtain many of our key components on an as-needed, purchase order basis from numerous suppliers. In some cases we have only a single source of supply for necessarykey components and materials used in the manufacturing of our products. Further, we are increasing our sourcing of products in Asia, and particularly in China, and we do not have a previous coursehistory of dealing with many of these suppliers. We do not generally have long-term supply contracts with any of these suppliers, and many of them underwent cost-containment measures in light of the last significant industry downturn in 2008 and 2009. As the industry has recovered, these suppliers have faced challenges in delivering components on a timely basis. The volatility in demand of these components has led some of our vendors to exit the semiconductor market, and other vendors may also decide to exit this market. Our inability to obtain components or materials in required quantities or of acceptable cost and quality and with the necessary continuity of supply could result in delays or reductions in product shipments to our customers. In addition, if a supplier or sub-supplier suffers a production stoppage or delay for any reason, including natural disasters such as the tsunamis that affected Japan and Thailand, this could result in a delay or reduction in our product shipments to our customers. Any of these contingencies could cause us to lose customers, result in delayed or lost revenue and otherwise materially harm our business.
Our business could be adversely affected by a decline in the availability of raw materials.
We are dependent on the availability of certain key raw materials and natural resources used in our products and various manufacturing processes, and we rely on third parties to supply us with these materials in a cost-effective and timely manner. Our access to raw materials may be adversely affected if our suppliers’ operations were disrupted as a result of limited or delayed access to key raw materials and natural resources which may result in increased cost of these items. While most of the raw materials used in our products and various manufacturing processes are commercially available, we rely in some cases on materials that have a limited supply and are considered rare Earth elements, such as helium. If the supply of these elements is drastically reduced, it may lead to price increases which could result in higher costs of our products and corresponding revenue declines and have a material adverse impact on our business, financial condition and results of operations.
Our outsource providers may fail to perform as we expect.
Outsource providers have played and will continue to play a key role in our manufacturing operations and in many of our transactional and administrative functions, such as information technology and facilities management. Although we attempt to select reputable providers and secure their performance on terms documented in written contracts, it is possible that one or more of these providers could fail to perform as we expect and such failure could have an adverse impact on our business.
Our business relies on certain critical information systems and a failure or breach of such a system could harm our business and results of operations and, in the event of unauthorized access to a customer’s data or our data, incur significant legal and financial exposure and liabilities.
We maintain and rely upon certain critical information systems for the effective operation of our business. These information systems include telecommunications, the internet, our corporate intranet, various computer hardware and software applications, network communications and e-mail. These information systems may be owned and maintained by us, our outsource providers or third parties such as vendors and contractors. These information systems are subject to attacks, failures, and access denials from a number of potential sources including viruses, destructive or inadequate code, power failures, and physical damage to computers, hard drives, communication lines and networking equipment. To the extent that these information systems are under our control, we have implemented security procedures, such as virus protection software and emergency recovery processes, to mitigate the outlined risks. However, security procedures for information systems cannot be guaranteed to be failsafe and our inability to use or access these information systems at critical points in time, or unauthorized releases of confidential information, could unfavorably impact the timely and efficient operation of our business.
Confidential information stored on these information systems could also be compromised. If a third party gains unauthorized access to our data, including any information regarding our customers, such security breach could expose us to a risk of loss of this information, loss of business, litigation and possible liability. These security measures may be breached as a result of third-party action, including intentional misconduct by computer hackers, employee error, malfeasance or otherwise. Additionally, third parties may fraudulently attempt to induce employees or customers into disclosing sensitive information such as user names, passwords or other informatio ninformation in order to gain access to our customers'
19
customers’ data or our data, including our intellectual property and other confidential business information, or our information technology systems. Because the techniques used to obtain unauthorized access, or to sabotage systems, change frequently and generally are not recognized until launched against a target, we may be unable to anticipate these techniques or to implement adequate preventative measures. Any security breach could result in a loss of confidence by our customers, damage our reputation, disrupt our business, lead to legal liability and negatively impact our future sales.
Our goodwill and intangible assets may become impaired.
As of September 30, 2015,2018, we had $121.4$255.9 million of goodwill and $55.4$100.0 million in net intangible assets as a result of our acquisitions. We periodically review our goodwill and the estimated useful lives of our identifiable intangible assets, taking into consideration any events or circumstances that might result in either a diminished fair value, or for intangible assets, a revised useful life. These events and circumstances include significant changes in the business climate, legal factors, operating performance indicators, advances in technology and competition. Any impairment or revised useful life could have a material and adverse effect on our financial position and results of operations, and could harm the trading price of our common stock.
Changes in tax rates or tax regulation could affect results of operations.
As a global company, we are subject to taxation in the United States and various other countries. Significant judgment is required to determine and estimate worldwide tax liabilities. Our future annual and quarterly effective tax rates could be affected by numerous factors, including changes in the: applicable tax laws; composition of pre-tax income in countries with differing tax rates; and/or establishment of a valuation of ourallowance against deferred tax assets and liabilities.based on the assessment of their realizability prior to expiration. In addition, we are subject to regular examination by the Internal Revenue Service and state, local and foreign tax authorities. We regularly assess the likelihood of favorable or unfavorable outcomes resulting from these examinations to determine the adequacy of our provision for income taxes. Although we believe our tax estimates are reasonable, there can be no assurance that any final determination will not be materially different from the treatment reflected in our historical income tax provisions and accruals, which could materially and adversely affect our financial condition and results of operations.
The implementation of tariffs and export controls on our products may have a material impact on our business.
Our global business operations and supply chain may be disrupted by the additional tariffs imposed on our products.
As of July 6, 2018, the United States imposed a 25% tariff on a list of products that included certain parts and components made in China and imported into the United States for incorporation with our products. We are implementing operational changes that should mitigate the impact of the 25% tariff on our imports into the United States from China. As a result of these operational changes, we do not expect that the increase in these tariffs will have a significant impact on our business, supply chain, operations or financial results. However, if the United States increases the amount of these tariffs or adds additional items to the list of products subject to tariff, tariffs could materially adversely affect our business, financial results and operations.
In addition to the increased tariffs imposed by the United States, China has implemented additional retaliatory tariffs on products made in the United States. While these tariffs currently do not materially impact us, if China increases its tariffs or places additional tariffs or other nations impose tariffs on our products, it could materially adversely affect our business, financial results and operations.
We are subject to numerous governmental regulations.
We are subject to federal, state, local and foreign regulations, including environmental regulations and regulations relating to the design and operation of our products and control systems. We might incur significant costs as we seek to ensure that our products meet safety and emissions standards, many of which vary across the states and countries in which our products are used. In the past, we have invested significant resources to redesign our products to comply with these directives. Compliance with future regulations, directives, and standards could require us to modify or redesign
20
some products, make capital expenditures, or incur substantial costs. If we do not comply with current or future regulations, directives, and standards:
· | we could be subject to fines; |
· | our production or shipments could be suspended; and |
· | we could be prohibited from offering particular products in specified markets. |
Any of these events could materially and adversely affect our business, financial condition and results of operations.
Regulations and customer demands related to conflict minerals may adversely affect us.
The Dodd-Frank Wall Street Reform and Consumer Protection Act imposes new disclosure requirements regarding the use in components of our products of “conflict minerals” mined from the Democratic Republic of Congo and adjoining countries, whether or not the components of our products are manufactured by us or third parties. This new requirement could affect the pricing, sourcing and availability of minerals used in the manufacture of components we use in our products. In addition, there are additional costs associated with complying with the disclosure requirements and customer requests, such as costs related to our due diligence to determine the source of any conflict minerals used in our products. We may face difficulties in satisfying customers who may require that all of the components of our products are certified as conflict mineral free and/or free of numerous other hazardous materials.
Unfavorable currency exchange rate fluctuations may lead to lower operating margins, or may cause us to raise prices, which could result in reduced sales.
Currency exchange rate fluctuations could have an adverse effect on our sales and results of operations and we could experience losses with respect to forward exchange contracts into which we may enter. Unfavorable currency fluctuations could require us to increase prices to foreign customers, which could result in lower net sales by us to such customers. Alternatively, if we do not adjust the prices for our products in response to unfavorable currency fluctuations, our results of operations could be materially and adversely affected. In addition, most sales made by our foreign subsidiaries are denominated in the currency of the country in which these products are sold and the currency they receive in payment for such sales could be less valuable as compared to the U.S. dollar at the time of receipt as a result of exchange rate fluctuations. From time to time, we enter into forward exchange contracts to reduce currency exposure. However, we cannot be certain that our efforts will be adequate to protect us against significant currency fluctuations or that such efforts will not expose us to additional exchange rate risks, which could materially and adversely affect our results of operations.
Risk related to the referendum of the United Kingdom’s membership in the European Union
In June 2016, a majority of voters in the United Kingdom voted “for” the Referendum of the United Kingdom’s Membership in the European Union, referred to as Brexit, approving the exit of the United Kingdom from the European Union, which triggered volatility in exchange rate fluctuations of the U.S. dollar against foreign currencies in which we conduct our business. We may experience volatility in exchange rates as the United Kingdom negotiates its exit from the European Union. As described in Item 7A, "Quantitative and Qualitative Disclosures About Market Risk", of this Form 10‑K, most of our foreign currency denominated transactions are conducted in Euros, British Pounds and a variety of Asian currencies. Sales in currencies other than the U.S. dollar were approximately 34% and 38%, respectively, of our total sales during fiscal years 2018 and 2017. If a dollar strengthens, our revenue denominated in foreign currencies may be adversely affected when translated into U.S. dollars.
The announcement of Brexit has also created global economic uncertainty, which may cause our customers to closely monitor their costs and reduce their spending on our products and services. The effects of Brexit depend on any agreements the United Kingdom makes to retain access to European Union markets either during a transitional period or more permanently. The measures could potentially disrupt the markets we serve and may cause us to lose customers and employees. In addition, Brexit could lead to legal uncertainty and potentially divergent national laws and regulations as the United Kingdom determines which E.U. laws to replace or replicate. Any of these effects of Brexit, among others, could adversely affect our business, results of operations and financial condition.
21
Our indebtedness may adversely affect our ability to operate our business, generate cash flows and make payments on such indebtedness
On October 4, 2017, we entered into a $200.0 million Senior Secured Term Loan Facility, or term loan, with Morgan Stanley Senior Funding, Inc., JPMorgan Chase Bank, N.A. and Wells Fargo Securities, LLC. The term loan matures and becomes fully payable on October 4, 2024. We would be required to redeem the term loan at the principal amount then outstanding upon occurrence of certain events, as described in the term loan agreement. For further information on this transaction, please refer to Note 11, "Debt" to our Consolidated Financial Statements included in Item 8 "Financial Statements and Supplementary Data" of this Form 10‑K.
Our ability to pay interest and repay the principal for our indebtedness is dependent upon our ability to manage our business operations and maintain sufficient liquidity to service such debt. The loan borrowings are subject to variable interest rates which create exposure to interest rate risk. Interest rate increases may result in higher cost of servicing the loan and reduce our profitability and cash flows. The terms of our debt covenants could limit our ability to raise additional funds and the manner in which we conduct our business. We have the ability to refinance the term loan and obtain additional indebtedness as long as we maintain a certain level of liquidity and earnings, as specified in the loan agreement. If our liquidity and earnings are reduced below a certain level, we will have limited ability to service the term loan and obtain additional debt financing. Our failure to comply with these restrictive covenants could also result in an event of default which, if not cured or waived, could result in the acceleration of all or a portion of our indebtedness. Accordingly, a default would have a material adverse effect on our business and our lender would have the right to exercise its rights and remedies to collect, which would include the right to foreclose on our assets.
Risks Relating to Our Customers
Because we rely on a limited number of customers for a large portion of our revenue, the loss of one or more of these customers could materially harm our business.
We receive a significant portion of our revenue in each fiscal period from a relatively limited number of customers, and that trend is likely to continue. Sales to our ten largest customers accounted for approximately 38%34%, 37%35% and 40%35%, respectively, of our total revenue in the fiscal years ended September 30, 2015, 20142018, 2017 and 2013, respectively.2016. The loss of one or more of these major customers, a significant decrease in orders from one of these customers, or the inability of one or more customers to make payments to us when they are due could materially affect our revenue, business and reputation. In addition, there has been and may continue to be significant consolidation among some of our largest OEM customers, which could lead to increased pressure to reduce the price of our products and/or decreased market share of our products with the combined companies.
Because of the lengthy sales cycles of many of our products, we may incur significant expenses before we generate any revenue related to those products.
Our customers may need several months to test and evaluate our products. This increases the possibility that a customer may decide to cancel an order or change its plans, which could reduce or eliminate our sales to that customer. The impact of this risk can be magnified during the periods in which we introduce a number of new products, as has been the case in recent years. As a result of this lengthy sales cycle, we may incur significant research and development expenses, and selling, general and administrative expenses before we generate the related revenue for these products, and we may never generate the anticipated revenue if our customer cancels an order or changes its plans.
In addition, many of our products will not be sold directly to the end-user but will be components of other products manufactured by OEMs. As a result, we rely on OEMs to select our products from among alternative offerings to be incorporated into their equipment at the design stage; so-called design-ins. The OEMs'OEMs’ decisions often precede the generation of volume sales, if any, by a year or more. Moreover, if we are unable to achieve these design-ins from an OEM, we would have difficulty selling our products to that OEM because changing suppliers after design-ins involves significant cost, time, effort and risk on the part of that OEM.
22
Customers generally do not make long term commitments to purchase our products and our customers may cease purchasing our products at any time.
Sales of our products are often made pursuant to individual purchase orders and not under long-term commitments and contracts. Our customers frequently do not provide any assurance of minimum or future sales and are not prohibited from purchasing products from our competitors at any time. Accordingly, we are exposed to competitive pricing pressures on each order. Our customers also engage in the practice of purchasing products from more than one manufacturer to avoid dependence on sole-source suppliers for certain of their needs. The existence of these practices makes it more difficult for us to increase price, gain new customers and win repeat business from existing customers.
We may face claims for liability related to damages of customer materials attributed to the failure of our products or services, exposing us to significant financial or reputational harm.
Our automation products for the semiconductor manufacturing market are used in the handling and movement of silicon wafers at various points in the production process, and our automated cold storage systems for the life sciences sample management market are used in the handling, movement and storage of biological and chemical samples. We also provide sample storage services to customers where we store their biological and chemical samples at our facilities. In eitherany case, damage to our customers'customers’ materials may be attributed to a failure of our products or services which could lead to claims for damages made by our customers and could also harm our relationship with our customers and damage our reputation in each of these industries, resulting in material harm to our business.
Risks Relating to Owning Our Securities
Our stock price is volatile.
The market price of our common stock has fluctuated widely. From the beginning of fiscal year 20142017 through the end of fiscal year 2015,2018, our stock price fluctuated between a high of $13.37$39.60 per share and a low of $9.06$12.89 per share. Consequently, the current market price of our common stock may not be indicative of future market prices, and we may be unable to sustain or increase the value of an investment in our common stock. Factors affecting our stock price may include:
· | variations in operating results from quarter to quarter; |
· | changes in earnings estimates by analysts or our failure to meet analysts’ expectations; |
· | changes in the market price per share of our public company customers; |
· | market conditions in the semiconductor and other industries into which we sell products and services; |
· | global economic conditions; |
· | political changes, hostilities or natural disasters such as hurricanes and floods; |
· | low trading volume of our common stock; and |
· | the number of firms making a market in our common stock. |
In addition, the stock market has in the past experienced significant price and volume fluctuations. These fluctuations have particularly affected the market prices of the securities of high technology companies like ours. These market fluctuations could adversely affect the market price of our common stock.
We may not pay dividends on our common stock.
Holders of our common stock are only entitled to receive dividends when and if they are declared by our Board of Directors. Although we have declared cash dividends on our common stock for the past several years, we are not
23
required to do so and may reduce or eliminate our cash dividends in the future. This could adversely affect the market price of our common stock.
Provisions in our charter documents and, Delaware law may delay or prevent an acquisition of us, which could decrease the value of your shares.
Our restated certificate of incorporation and by-laws and Delaware law contain provisions that could make it harder for a third party to acquire us without the consent of our Board of Directors. These provisions include limitations on actions by our stockholders by written consent, the inability of stockholders to call special meetings and the potential for super majority votes of our stockholders in certain circumstances. In addition, our Board of Directors has the right to issue preferred stock without stockholder approval, which could be used to dilute the stock ownership of a potential hostile acquirer.
Our restated certificate of incorporation makes us subject to the anti-takeover provisions of Section 203 of the Delaware General Corporation Law. In general, Section 203 prohibits publicly held Delaware corporations to which it applies from engaging in a “business combination” with an “interested stockholder” for a period of three years after the date of the transaction in which the person became an interested stockholder, unless the business combination is approved in a prescribed manner. This provision could discourage others from bidding for our shares of common stock and could, as a result, reduce the likelihood of an increase in the price of our common stock that would otherwise occur if a bidder sought to buy our common stock.
Delaware law also imposes restrictions on mergers and other business combinations between us and any holder of 15% or more of our outstanding common stock. Although we believe these provisions provide for an opportunity to receive a higher bid by requiring potential acquirers to negotiate with our Board of Directors, these provisions apply even if the offer may be considered beneficial by stockholders. If a change of control or change in management is delayed or prevented, the market price of our common stock could decline.
Our certificate of incorporation authorizes the issuance of shares of blank check preferred stock.
Our certificate of incorporation provides that our Board of Directors is authorized to issue from time to time, without further stockholder approval, up to 1,000,000 shares of preferred stock in one or more series and to fix and designate the rights, preferences, privileges and restrictions of the preferred stock, including dividend rights, conversion rights, voting rights, redemption rights and terms of redemption and liquidation preferences. Such shares of preferred stock could have preferences over our common stock with respect to dividends and liquidation rights. Our issuance of preferred stock may have the effect of delaying or preventing a change in control. Our issuance of preferred stock could decrease the amount of earnings and assets available for distribution to the holders of common stock or could adversely affect the rights and powers, including voting rights, of the holders of common stock. The issuance of preferred stock could have the effect of decreasing the market price of our common stock.
Item 1B. Unresolved Staff Comments None.Item 1B.Unresolved Staff Comments16
Item 2. Properties Our corporate headquarters and primary manufacturing/research and development facilities are currently located in three buildings in Chelmsford, Massachusetts. 24 We Item 2.Propertiesmaintainmaintained the following principal facilities:
Square Footage | Ownership Status/Lease | ||||||
Location | Functions | (Approx.) | Expiration | ||||
Chelmsford, Massachusetts | Corporate headquarters, training, manufacturing, R&D and sales & support | 298,000 | Owned | ||||
Indianapolis, Indiana | Sample storage, sales & support | 98,000 | September 2023 | ||||
Yongin-City, South Korea | Manufacturing, R&D and sales & support | 48,600 | September 2019 | ||||
Fremont, California | Manufacturing, R&D and sales & support | 44,940 | August 2025 | ||||
Manchester, United Kingdom | Manufacturing, R&D and sales & support | 44,670 | December 2019 | ||||
Chu Bei City, Taiwan | Sales & support | 28,600 | June |
Our Brooks ProductSemiconductor Solutions Group segment utilizes the facilities in Chelmsford, Massachusetts; Fremont, California; South Korea, and Germany. Our Brooks Global Services segment utilizes the facilities in Chelmsford, Massachusetts; South Korea; Germany and Taiwan. Our Brooks Life Science SystemsSciences segment utilizes the facilities in Manchester, UKUnited Kingdom; Indianapolis, Indiana; Chelmsford, Massachusetts; Bronx, New York; and Spokane, Washington.
We maintain additional sales, and support and training offices in Texas, Europe (France Germany and Switzerland)Germany), Asia (Japan, China, Singapore(China, Japan and Taiwan)Singapore) and the Middle East (Israel).
Item 3. We are subject to various legal proceedings, both asserted and unasserted, that arise in the ordinary course of business. We cannot predict the ultimate outcome of such legal proceedings or in certain instances provide reasonable ranges of potential losses. However, as of the date of this report, we believe that none of these claims will have a material adverse effect on our consolidated financial condition or results of operations. In the event of unexpected subsequent developments and given the inherent unpredictability of these legal proceedings, there can be no assurance that our assessment of any claim will reflect the ultimate outcome and an adverse outcome in certain matters could, from time-to-time, have a material adverse effect on our consolidated financial condition or results of operations in particular quarterly or annual periods. Item 4. Mine Safety Disclosures Not applicable. 25 Item 5. Market for Registrant’s Common Equity, Related Stockholder Matters and Issuer Purchases of Equity Securities Our common stock is traded on the Market Price Dividends High Low Declared Fiscal Year Ended September 30, 2018: First quarter $ 34.39 $ 22.54 $ 0.10 Second quarter 30.15 23.30 0.10 Third quarter 36.36 24.88 0.10 Fourth quarter 39.60 28.71 0.10 Fiscal Year Ended September 30, 2017: First quarter $ 17.80 $ 12.89 $ 0.10 Second quarter 22.40 16.68 0.10 Third quarter 29.60 21.14 0.10 Fourth quarter 30.36 21.78 0.10 Number of Holders As of Dividend Policy Dividends are declared at the discretion of our Board of Directors and depend on actual cash flow from operations, our financial condition, capital requirements and any other factors our Board of Directors may consider relevant. Future dividend declarations, as well as the record and payment dates for such dividends, will be determined by our Board of Directors on a quarterly basis. On November Comparative Stock Performance The following graph compares the cumulative total shareholder return (assuming reinvestment of dividends) from investing $100 on September 30, The Current Peer Group for the year ended September 30, 2018 is comprised 26 The stock price performance on the graph below is not necessarily indicative of future price performance. 9/30/2013 9/30/2014 9/30/2015 9/30/2016 9/30/2017 9/30/2018 Brooks Automation, Inc. $ 100.00 $ 116.63 $ 134.58 $ 162.05 $ 368.09 $ 430.52 Nasdaq/NYSE American/NYSE 100.00 114.58 108.82 123.26 146.27 166.32 Prior Peer Group 100.00 108.15 102.93 136.64 226.47 212.25 Current Peer Group 100.00 100.20 99.03 134.83 217.75 234.16 The information included under the heading “Comparative Stock Performance” in Item 5 of "this report" shall not be deemed to be “soliciting material” or subject to Regulation 14A, shall not be deemed “filed” for purposes of Section 18 of the Exchange Act, or otherwise subject to the liabilities of that section, nor shall it be deemed incorporated by reference in any filing under the Securities Act of 1933, as amended, or the Exchange Act. Issuer’s Purchases of Equity Securities On September 29, 2015, our Board of Directors approved a share repurchase program for up to 27 Item 6. Year Ended September 30, 2018 2017 2016 2015 2014 (2) (2) (4) (4)(6) (In thousands, except per share data) Revenue $ 631,560 $ 527,499 $ 434,012 $ 406,874 $ 344,934 Gross profit 246,081 198,887 156,689 132,766 114,106 Operating income (loss) 31,409 14,319 (17,054) (22,564) (37,800) Income (loss) from continuing operations 67,717 10,687 (85,457) (12,523) (23,171) Income from discontinued operations, net of tax 48,747 51,925 15,981 26,744 54,693 Net income (loss) attributable to Brooks Automation, Inc. 116,575 62,612 (69,476) 14,221 31,361 Basic net income (loss) per share attributable to Brooks Automation, Inc. common stockholders: Income (loss) from continuing operations 0.96 0.15 (1.25) (0.19) (0.35) Income from discontinued operations, net of tax 0.69 0.75 0.23 0.40 0.82 Basic net income (loss) per share attributable to Brooks Automation, Inc. $ 1.65 $ 0.90 $ (1.01) $ 0.21 $ 0.47 Diluted net income (loss) per share attributable to Brooks Automation, Inc. common stockholders: Income (loss) from continuing operations $ 0.96 $ 0.15 $ (1.25) $ (0.18) $ (0.34) Income from discontinued operations, net of tax 0.69 0.74 0.23 0.39 0.81 Diluted net income (loss) per share attributable to Brooks Automation, Inc. $ 1.65 $ 0.89 $ (1.01) $ 0.21 $ 0.46 Dividend declared per share $ 0.40 $ 0.40 $ 0.40 $ 0.40 $ 0.34 As of September 30, 2018 2017 2016 2015 2014 (In thousands) Cash and cash equivalents and marketable securities $ $ $ 91,221 $ 214,030 $ 245,456 Working capital (3) 98,650 50,738 54,651 45,319 40,870 Total assets 1,095,257 766,628 685,905 758,702 777,227 Total capital lease obligation — — — — 8,298 Total equity 717,832 607,644 553,690 632,045 642,889 Year Ended September 30, 2018 First Second Third Fourth Quarter Quarter (2) Quarter Quarter (In thousands, except per share data) Revenue $ 142,599 $ 156,952 $ 172,363 $ 159,646 Gross profit 54,259 62,386 66,816 62,620 Operating income 4,925 10,321 12,547 3,616 Net income attributable to Brooks Automation, Inc. 16,486 67,020 22,717 10,352 Basic net income per share 0.23 0.95 0.32 0.15 Diluted net income per share 0.23 0.95 0.32 0.15 28 Year Ended September 30, 2017 First Second Third Fourth Quarter Quarter Quarter Quarter (In thousands, except per share data) Revenue $ 126,138 $ 130,401 $ 136,387 $ 134,573 Gross profit 44,250 48,077 52,593 53,967 Operating income 5,024 3,031 4,341 1,923 Net income attributable to Brooks Automation, Inc. 13,871 14,005 17,350 17,386 Basic net income per share 0.20 0.20 0.25 0.25 Diluted net income per share 0.20 0.20 0.25 0.25 (1) We (3) The calculation of working capital excludes "Cash and cash equivalents" and "Marketable securities”. (4) Working capital amounts were adjusted to reflect the reclassification of current deferred tax assets and liabilities to non-current in accordance with Accounting Standard Update 2015-17, Income Taxes (Topic 740): Balance Sheet Classification of Deferred Taxes, issued by the Financial Accounting Standards Board. We reclassified $16.4 million and $18.2 million, respectively, of net deferred tax assets from current to non-current at September 30, 2015 and September 30, 2014. (5) On August 27, 2018, we entered into an agreement to sell the Cryogenics business. We determined that the Cryogenics business met the criteria of being reported as a discontinued operation as of September 30, 2018. As a result, the selected financial (6) In March 2014, we entered into an agreement to sell the Granville-Phillips Gas Analysis & Vacuum Measurement, or Item 7. Management’s Discussion and Analysis of Financial Condition and Results of Operations The Management’s Discussion and Analysis of Financial Condition and Results of Operations, or MD&A, describes principal factors affecting the results of our operations, financial condition and liquidity, as well as our critical accounting policies and estimates that require significant judgment and thus have the most significant potential impact on our Consolidated Financial Statements. Our MD&A is organized as follows: · Overview. This section provides a · Critical Accounting Policies and Estimates. This section discusses accounting policies and estimates that require us to exercise subjective or complex judgments in their application. We believe these accounting policies and estimates are important to understanding the assumptions and judgments incorporated in our reported financial results. 29 · Results of · Liquidity and Capital Resources. This section provides an analysis of our liquidity and changes in cash flows, as well as a discussion of available borrowings and contractual commitments. You should read the OVERVIEW General We are a leading In the semiconductor capital equipment market, equipment productivity and availability are critical factors for our In the life sciences sample management market, we utilize our core competencies and capabilities in automation and cryogenics 30 In November of 2015, we acquired BioStorage Technologies, a full-service outsourcing sample management In fiscal year 2017, we launched BioStudies, a bioinformatics sample intelligence software platform that enables customers to manage their global samples. In August 2017, we acquired certain assets and liabilities related to FreezerPro® web-based software platform from RURO, Inc. for a total purchase price of $5.5 million. RURO, Inc. provides sample management software across multiple end markets, including academic research, government, pharmaceutical, biotech, and healthcare. We expect the acquisition of FreezerPro to complement our BioStudies offerings and extend our informatics solutions to address laboratories, biobanks or enterprises that manage biological samples. In October 2017, we acquired all of the outstanding capital stock of 4titude Limited, or 4titude, a U.K.-based manufacturer of scientific consumables for biological sample On September 26, 2018, we entered into a definitive agreement to acquire GENEWIZ, a leading provider of genomic services, based in New Jersey with operations throughout the United States, Asia, and Europe for a cash price of $450.0 million, subject to customary adjustments. We completed this acquisition on November 15, 2018. Please refer to Note 23, “Subsequent Events” to our Consolidated Financial Statements included under “Item 8, Financial Statements and Supplementary Data” of this Form 10-K. Since entering the life sciences industry, we have also strengthened and broadened our product portfolio and market reach by investing in internal product development. During fiscal Recent Developments In 31 As discussed above, on November 15, 2018, we completed our acquisition of GENEWIZ for a Segments We have two operating and reportable segments consisting of Brooks Semiconductor Solutions Group and Brooks Life Sciences.For additional information on our operating segments and the related restructuring actions, as well as segment revenues and their operating results, please refer to Note 17, "Restructuring and Other Charges" and Note 20, "Segment and Geographic Information" to our Consolidated Financial Statements included in The Brooks The Brooks Life Fiscal Year Ended September 30, 2018 Compared to Fiscal Year Ended September 30, 2017 Results of Cash Flows and Liquidity - Cash and cash equivalents and marketable securities were $251.2 million at September 30, 2018 as compared to $104.3 million at September 30, 2017. The increase in cash and cash equivalents and marketable securities of $146.9 million was primarily attributable to cash inflows of $197.6 million related to proceeds from the 32 our shareholders, as well as capital expenditure payments of $12.8 million. Please refer to the "Liquidity and Capital Resources" section below for a detailed discussion of our liquidity and changes in cash flows for fiscal Fiscal Year Ended September 30, 2017 Compared to Fiscal Year Ended September 30, 2016 Results of Operations- We generated revenue of $527.5 million during fiscal year Cash Flows and CRITICAL ACCOUNTING POLICIES AND ESTIMATES The preparation of the We believe that the assumptions and estimates associated with the following critical accounting policies involve significant judgment and thus have the most significant potential impact on our We generate revenue Although most of our sales agreements contain standard terms and 33 units of accounting for revenue recognition We recognize revenue If our judgment regarding revenue Business Combinations We account for business acquisitions using the purchase method of accounting, in accordance with which assets acquired and liabilities assumed are recorded at their respective fair values at the acquisition date. The fair value of the consideration paid, including contingent consideration, is assigned to the assets acquired and liabilities assumed based on their respective fair values. Goodwill represents the excess of the purchase price over the estimated fair values of the assets acquired and liabilities assumed. Significant judgment is used in determining fair values of assets acquired and liabilities assumed, as well as intangibles and their estimated useful lives. Fair value and useful life determinations are based on, among other factors, estimates of future expected cash flows, royalty cost savings and appropriate discount rates used in computing present values. These judgments may materially impact the estimates used in allocating acquisition date fair values to assets acquired and liabilities assumed, as well as our current and future operating results. Actual results may vary from these estimates Changes in the fair value of a contingent consideration resulting from a change in the underlying inputs are recognized in results of operations until the arrangement is settled. Intangible Assets, Goodwill and Other Long-Lived Assets We have identified intangible assets and generated significant goodwill as a result of our acquisitions. Intangible assets other than goodwill are valued based on estimated future cash flows and amortized over their estimated useful lives. Goodwill is tested for impairment annually or more often if impairment indicators are present, at the reporting unit level. The goodwill impairment test is performed at the reporting unit level. A reporting unit is either an operating segment or one level below it, which is referred to as a “component.” The level at which the impairment test is 34 performed requires an assessment of whether the operations below an operating segment constitute a self-sustaining business, in which case testing is generally performed at this level. We We perform our annual goodwill impairment assessment on April 1st of each fiscal year. In accordance with ASC 350, Intangibles- Goodwill We determine fair values of our reporting units based on an We Application of the goodwill impairment test requires judgment based on market and operational conditions at the We are required to test long-lived assets, other than goodwill, for impairment when impairment indicators are present. For purposes of this test, long-lived assets are grouped with other assets and liabilities at the lowest level for which identifiable cash flows are largely independent of the cash flows of other assets and liabilities. If we determine that indicators of potential impairment are present, we assess the recoverability of the long-lived asset group by comparing its undiscounted future cash flows to its carrying value. If the carrying value of the long-lived asset group exceeds its future cash flows, we determine fair values of the individual net assets within the long-lived asset group to 35 assess potential impairment. If the aggregate fair values of the individual net assets of the group are less than their carrying values, an impairment loss is recognized for an amount in excess of the Inventory We state our inventory at the lower of cost or market amount and make adjustments to reduce the inventory cost to its net realizable value by providing estimated reserves for obsolete or unmarketable inventory. The reserves are established for the difference between the cost of inventory and its estimated market value based on assumptions related to future demand and market conditions. We fully reserve for inventories and non-cancelable purchase orders for inventory deemed obsolete. We perform periodic reviews of our inventory to identify excess inventories on hand. We compare on-hand inventory balances to anticipated inventory usage based on our recent historical activity and anticipated or forecasted demand for our products developed through our planning systems and sales and marketing inputs. We adjust the reserves for obsolete or unmarketable inventory and record additional inventory write downs based on unfavorable changes in estimated customer demand or actual market conditions that may differ from management projections. Deferred Income Taxes We record a valuation allowance to reduce our deferred tax assets to the amount that is more likely than not will be realized. We consider recent historical income, estimated future taxable income, carry-forward periods of tax attributes, the volatility of the semiconductor industry and ongoing tax planning strategies in assessing the need for the valuation allowance. Stock-Based Compensation We measure Recently Issued Accounting Pronouncements For a summary of recently issued accounting pronouncements applicable to our Consolidated Financial Statements which is incorporated here by reference, please refer to Note 2, "Summary of Significant Accounting Policies" in the 36 Notes to the Consolidated Financial Statements included in Item 8 "Financial Statements and Supplementary Data" of this Form 10‑K. RESULTS OF OPERATIONS Fiscal Year Ended September 30, Revenue We reported revenue of Our Brooks Our Brooks Life Sciences segment reported revenue of $196.5 million for fiscal year 2018 compared to $148.7 million for fiscal year 2017. The increase of $47.8 million, or 32%, included organic growth of $22.6 million, or 14%. The organic growth was broad-based across all major product lines, including sample storage services, automated storage systems, including the BioStore III Cryo, consumables, instruments and informatics. Acquisitions accounted for $25.2 million of the increase compared to fiscal year 2017, which consisted of $15.6 million from the We anticipate continued growth in revenue from Revenue generated outside the United States amounted to Gross Margin We reported gross margins of Our Brooks Our Brooks Life Sciences segment reported gross margins of 36.7% for fiscal year 2018 compared to 36.8% for fiscal year 2017. Margins benefitted from recent acquisitions and the continued growth of our BioStorage services, which carries higher than average gross margins. These benefits were offset by lower margins in 37 Research and Development Research and development expenses were Selling, General and Administrative Selling, general and administrative expenses were Amortization expense Restructuring We recorded restructuring charges of Restructuring Charges Incurred During Fiscal Year Ended September 30, 2018 Restructuring charges of $0.7 million incurred during fiscal year 2018 were related to severance costs and consisted primarily of Restructuring Charges Incurred During Fiscal Year Ended September 30, 2017 Restructuring charges of $3.1 million incurred during fiscal year 2017 were related to severance costs and consisted of $1.7 million related to restructuring actions initiated during fiscal year 2017 and $1.4 million related to restructuring actions initiated in prior periods. The charges from restructuring actions initiated during fiscal year 2017 were primarily related to the action to streamline field service operations in our Brooks Semiconductor Solutions Group segment. This action had been completed as of September 30, 2017 and resulted in approximately $1.9 million in annualized cost The charges from actions initiated prior to fiscal year 2017 was primarily related to the consolidation of the Jena, Germany repair facility into the Chelmsford, Massachusetts repair operation. This restructuring action was initiated to streamline the service repair operations and reduce the overhead cost structure within our Brooks Semiconductor Solutions Group segment. This restructuring action was substantially completed as of September 30, 2017. We recognized $0.8 million cost savings related to this action during the fiscal year 2017 and $1.5 million during fiscal year 2018. Total cost savings from this action consisted of $1.0 million of 38 The charges from actions initiated prior to fiscal year 2017 also include a small portion of charges from the company-wide restructuring action initiated in fiscal year 2016 to streamline business operations and improve competitiveness and overall profitability. This action had been completed as of September 30, 2017. Cost savings from this action were $13.1 million during fiscal year 2017. Savings realized during fiscal year 2017 consisted of $4.3 million of cost of revenue reductions, $2.6 million of research and development expense reductions, and $6.1 million of selling, general and administrative expense reductions. Non-Operating Income (Expenses) Gain on Settlement of Equity Method Investment - During fiscal year 2017, we recognized a gain of $1.8 million on the settlement of the equity method investment in BioCision which was included as a part of the non-cash consideration for an acquisition of Cool Lab. Interest income – During fiscal years 2018 and 2017, we recorded interest income of $1.9 million and $0.5 million respectively, which represented interest earned on our marketable securities. Interest expense – During fiscal years 2018 and 2017, we recorded interest expense of $9.5 million and $0.4 million, respectively. The increase in interest expense during fiscal year 2018 primarily related to the term loan originated in October 2017. Please refer to the “Liquidity and Capital Resources” section below for further information on the term loan. Other expenses, net – During fiscal years 2018 and 2017 we recorded other expenses, net of $3.3 million and $1.7 million, respectively. The $1.6 million increase in expense was primarily attributable to higher foreign currency exchange losses of $1.0 million recognized during fiscal year 2018 as compared to the corresponding period of the prior year, as well as gains recognized in fiscal year 2017 related to a pension Income Tax Provision We recorded Equity in Earnings of Equity Method Investments We Discontinued Operations We incurred 39 identifiable as costs being disposed of upon completion of the Fiscal Year Ended September 30, Revenue We reported revenue of Our Brooks The robotic automation products revenue has historically included revenue from patent royalties and sales of third party atmospheric robots under a distribution agreement in North America. During fiscal year 2016, these revenue streams stopped, driving a decline of $8.7 million attributable to the expiration of certain patents and $13.0 million from exiting the atmospheric robot distribution arrangement. Royalty income generated from the expired patents was $8.7 million in fiscal years 2016. Product revenue from the atmospheric robot distribution arrangement was $13.0 million in fiscal years 2016. There was no royalty income and no revenue from the atmospheric robot distribution arrangement generated during fiscal year Our Brooks Life Sciences segment reported revenue of $148.7 million for fiscal year 2017 compared to $108.1 million for fiscal year 2016. The increase of $40.6 million, or 38%, was primarily driven by organic growth of $25.3 million, or 23%. The organic growth was primarily attributable to Revenue generated outside the United States Gross Margin We reported gross margins of 37.7% for fiscal year 2017 compared to 36.1% for fiscal year 2016. Gross margin increased in the Brooks Semiconductor Solutions Group segment and Our Brooks Semiconductor Solutions Group segment reported gross margins of 38.0% for fiscal year 2017 compared to 36.1% for fiscal year 2016. Product margins increase was driven by improved operating leverage from higher revenue and the outcome of product cost optimization efforts. Service margins increase was driven by lower material costs for robot repair, and cost savings from the restructuring actions that resulted in reduced repair operations costs and increased field service productivity. Please refer to the "Restructuring Charges" section below for further information on the restructuring actions. Cost of revenue during fiscal year 2017 included $2.5 million of amortization related to completed technology compared to $2.7 million during fiscal year 2016. During fiscal years 2017 and 2016, cost of revenue included $0.1 million and $0.6 million, respectively, of inventory step-up charges. Our Brooks Life Sciences segment reported gross margins of 36.8% for fiscal year 2017 compared to 36.1% for fiscal year 2016. The increase was driven by improved cost management on large stores projects, volume leverage 40 restructuring actions, partially offset by increased Research and Development Research and development expenses were Selling, General and Administrative Selling, general and administrative expenses were Amortization expense related primarily to customer relationships was $13.2 million and Restructuring We recorded restructuring charges of Restructuring Charges Incurred During Fiscal Year Ended September 30, 2017 Restructuring charges of $3.1 million incurred during fiscal year 2017 were related to severance costs and consisted of $1.7 million related to restructuring actions initiated during fiscal year 2017 and $1.4 million related to restructuring actions initiated in prior periods. The charges from restructuring actions initiated during fiscal year 2017 was primarily related to streamlined field service operations in our Brooks Semiconductor Solutions Group segment. This action had been completed as of September 30, 2017 and resulted in approximately $1.9 million in annualized cost of revenue reductions. We realized approximately $1.9 million and $0.8 million, respectively, of cost savings during fiscal year 2018 and 2017. The charges from actions initiated prior to fiscal year 2017 were primarily related to the consolidation of the Jena, Germany repair facility into the Chelmsford, Massachusetts repair operation. This restructuring action was initiated to streamline the service repair operations and reduce the overhead cost structure within our Brooks Semiconductor Solutions Group segment. This restructuring action was substantially completed as of September 30, 2018. We recognized $0.8 million cost savings related to this action during the fiscal year 2017 and $1.5 million during fiscal year 2018. Total annualized cost savings from this action consisted of $1.0 million of cost of revenue reductions and $0.6 million of selling, general and administrative expense reductions. The charges from actions initiated prior to fiscal year 2017 also include a small portion of charges from the company-wide restructuring action initiated in fiscal year 41 this action were $13.1 million and $5.8 million, respectively, during fiscal year 2017 and 2016. Savings realized during fiscal year 2017 consisted of $4.3 million of cost of revenue reductions, $2.6 million of research and development expense reductions, and $6.1 million of selling, general and administrative expense reductions. Restructuring Charges Incurred During Fiscal Year Ended September 30, 2016 Restructuring charges of $10.2 million incurred during fiscal year 2016 were related Charges from restructuring actions initiated during fiscal year 2016 consisted of: (i) $3.1 million attributable to the Brooks Life Sciences segment to streamline the segment’s management structure, integrate acquisitions, consolidate facility and improve profitability, (ii) $1.2 million attributable to the Brooks Semiconductor Solutions Group segment to consolidate our These actions in the Brooks Life Our restructuring actions initiated in prior periods was primarily related to the Non-Operating Income (Expenses) Gain on Settlement of Equity Method Investment – During fiscal year 2017, we recognized a gain of $1.8 million on the settlement of the Interest income Interest expense Other expenses, net – During fiscal years 2017 and 2016 we recorded other expenses, net of $1.7 million and $1.4 million, respectively. The $0.3 million increase in expense was primarily attributable to higher foreign currency exchange losses of $0.4 million recognized during fiscal year 2017 and higher losses of $0.2 million Income Tax We recorded an income tax Equity in Earnings of Equity Method Investments We incurred losses of $0.5 million from our investment in BioCision during fiscal year 2017 compared to losses of $1.1 million during fiscal year 2016. Our investment in BioCision was settled during the first quarter of fiscal year 2017 42 as a part of the non-cash consideration for the acquisition of Cool Lab on November 28, 2016. Prior to closing the equity investment, we traditionally recorded the income and losses related to the equity method investment in BioCision one quarter in arrears. During fiscal year 2017, we recorded two additional months of activity in the carrying value of the investment as a result of its settlement. We deemed the amount of $0.2 million related to two additional months of activity to be insignificant. Discontinued Operations We incurred revenue and net income from discontinued operations of $165.4 million and $51.9 million, respectively for fiscal year 2017 related to our semiconductor cryogenics business as compared to $126.3 million and $16.0 million, respectively for fiscal year 2016. The net income is inclusive of income from LIQUIDITY AND CAPITAL RESOURCES A considerable portion of our revenue is dependent on the demand for semiconductor capital equipment which historically has experienced periodic downturns. We believe that we have adequate resources to The discussion of our cash flows and liquidity that follows does not include the impact of the disposition of our cryogenics business and is stated on a total company consolidated basis. Overview of Cash Flows and Liquidity Our cash, cash equivalents and marketable securities as of September 30, Year Ended September 30, 2018 2017 Cash and cash equivalents $ 197,708 $ 101,622 Short-term marketable securities 46,281 28 Long-term marketable securities 7,237 2,642 $ 251,226 $ 104,292 Our cash, cash equivalents and marketable securities were $251.2 million as of September 30, 2018. Our cash balances are held in numerous locations throughout the world, with the substantial majority of those amounts located outside of the United States. As of September 30, 2018, we had cash and cash equivalents of $197.7 million, of which $84.7 million was held outside of the United States. If these funds are needed for the U.S. operations, we would need to repatriate these funds. As a result of recent changes in U.S. tax legislation, any repatriation in the future would not result in U.S. federal income tax. Our intent is to permanently reinvest these funds outside of the U.S. and our current operating plans do not demonstrate a need to repatriate these funds for our U.S. operations. We had marketable securities of $53.5 million and $2.7 million, respectively, as of September 30, 2018 and 2017. Our marketable securities are generally readily convertible to cash without an adverse impact. 43 Fiscal Year Ended September 30, Overview Cash and cash equivalents and marketable securities were Operating Activities Cash flows from operating activities can fluctuate significantly from period to period as earnings, working capital needs and the timing of payments for Cash flows provided by operating activities Net income from discontinued operations contributed $48.7 million and $51.9 million for fiscal years ended 2018 and 2017, respectively, in the net income referenced for the respective periods above. Cash flows from operations will be negatively impacted in future periods by the completion of sale of our cryogenic business. Investing Activities Cash flows from investing activities consist primarily of cash used for acquisitions, capital expenditures and purchases of marketable securities as well as cash proceeds generated from sales and maturities of marketable securities. Cash used in investing activities was $148.5 million during fiscal year 2018 as compared to $54.2 million during the fiscal year 2017. Cash used in investing activities of $148.5 million during fiscal year 2018 included cash payments of $85.8 million for acquisitions, $69.7 million for the purchases of marketable securities and $12.8 million of capital expenditures, partially offset by cash inflows from sales and maturities of marketable securities of $19.1 million and $0.7 million in proceeds from other investments and sales of property, plant and equipment. Cash used in investing activities of $54.2 million during fiscal year 2017 included $44.8 million for acquisitions and $12.7 million of capital expenditures, offset by $3.6 million of proceeds from sales and maturities of marketable Capital expenditures are made primarily for increasing capacity, replacing equipment, supporting new product development and Financing Activities Cash provided by financing activities was $170.3 million during fiscal year 2018 as compared to $25.9 million used in financing activities during fiscal year 2017. Cash provided by financing activities during fiscal year 2018 included cash inflows of $197.6 million related to proceeds from the 44 Fiscal Year Ended September 30, Overview Cash and cash equivalents and marketable securities were Operating Activities Cash flows provided by operating activities were $96.2 million during fiscal year 2017 and were comprised primarily of earnings of $96.9 million, including net Net income from discontinued operations contributed $51.9 million and $16.0 million for fiscal years ended 2017 and 2016, respectively, in the Investing Activities Cash used in investing activities was Capital expenditures are made primarily for increasing capacity, replacing equipment, supporting new product development and improving information technology infrastructure. Capital expenditures were $12.7 million during fiscal year 2017 as compared to $12.8 million during fiscal year 2016. Financing Activities Cash used in financing activities was Capital Resources Senior Secured Term Loan Facility On October 4, 2017, we entered into a $200.0 million term loan with Morgan Stanley Senior Funding, Inc., JPMorgan Chase Bank, N.A. and Wells Fargo Securities, LLC. The term loan was issued at $197.6 million, or 98.8% of its par value, resulting in 45 As of September 30, Borrowings under the term loan bear variable interest rates, at our option, based on The term loan agreement contains certain customary representations and warranties, covenants and events of default. As of September 30, 2018, we were in compliance with all covenants and conditions under the term loan agreement. On November 15, 2018, entered into a new $350.0 million senior secured incremental term loan, under our Credit Agreement, dated October 4, 2017 to finance a portion of the cash purchase price of our acquisition of GENEWIZ which was completed on that same date. Line of Credit Facility We maintain a revolving line of credit with Wells Fargo Bank, N.A. and JPMorgan Chase Bank, N.A that provides for revolving credit financing of up to $75.0 million, subject to borrowing base availability, as defined in the credit agreement. The line of credit matures on October 4, 2022. The proceeds from the line of credit are available for permitted acquisitions and general corporate purposes. As of September 30, 2018, we had approximately $47.5 million available for borrowing under the line of credit. We anticipate that our Shelf Registration Statement On 46 Dividends Our Board of Directors declared the following dividends during the fiscal years Dividend per Record Payment Declaration Date Share Date Date Total Fiscal Year Ended September 30, 2018: November 8, 2017 $ 0.10 December 1, 2017 December 22, 2017 $ 7,040 January 31, 2018 0.10 March 2, 2018 March 23, 2018 7,050 April 30, 2018 0.10 June 1, 2018 June 22, 2018 7,058 July 31, 2018 0.10 September 7, 2018 September 28, 2018 7,066 Fiscal Year Ended September 30, 2017 November 9, 2016 $ 0.10 December 2, 2016 December 23, 2016 $ 6,952 January 31, 2017 0.10 March 3, 2017 March 24, 2017 6,962 April 27, 2017 0.10 June 2, 2017 June 23, 2017 6,972 August 1, 2017 0.10 September 8, 2017 September 29, 2017 6,980 On November Share Repurchase Program On September 29, 2015, our Board of Directors approved a share repurchase program for up to $50.0 million worth of our common stock. The timing and amount of any shares repurchased are based on market and business conditions, legal requirements and other factors and may be commenced or suspended at any time at our discretion. There were no shares repurchased under this program during fiscal year 2018. Contractual Obligations and Requirements Our contractual obligations were as follows at September 30, 2018 (in thousands): Less than One to Four to Total One Year Three Years Five Years Thereafter Contractual Cash Obligations: Operating leases $ 12,232 $ 3,842 $ 3,922 $ 2,621 $ 1,847 Pension and other post-retirement benefit plans 4,688 433 876 894 2,485 Term loan 196,071 2,000 4,000 4,000 186,071 Other purchase commitments 89,761 87,111 2,282 368 — Total contractual cash obligations $ 302,752 $ 93,386 $ 11,080 $ 7,883 $ 190,403 Other Commercial Commitments: Letters of credit $ 2,233 $ 1,716 $ 517 $ — $ — Total commitments $ 304,985 $ 95,102 $ 11,597 $ 7,883 $ 190,403 The letters of credit of approximately $2.2 million are related primarily to customer advances and other performance obligations at September 30, 2018. These arrangements guarantee the refund of advance payments received from our customers in the event that the product is not delivered or warranty obligations are not fulfilled in accordance with the contract terms. These obligations could be called by the beneficiaries at any time before the expiration date of the particular letter of credit if we fail to meet certain contractual requirements. None of these obligations were called during fiscal year 2018, and we currently do not anticipate any of these obligations to be called in the near future. 47 As of September 30, Off-Balance Sheet Arrangements As of September 30, 2018, we did not have any Item 7A. Quantitative and We are exposed to a variety of market risks, including changes in interest rates affecting the return on our cash and cash equivalents, short-term and long-term investments and fluctuations in foreign currency exchange rates. Interest Rate Exposure Our $200.0 million term loan bears variable interest rates which subjects us to interest rate risk. Our primary interest rate risk exposure results from changes in the short-term LIBOR rate, the federal funds effective rate and the prime rate. As of September 30, 2018, the weighted average stated interest rate on the term loan was 4.4%. At September 30, 2018, the outstanding term loan principal balance was $198.5 million, excluding unamortized deferred financing costs of $2.4 million. During fiscal year 2018, we incurred interest expense of $8.7 million on the term loan. A hypothetical 100 basis point change in interest rates would result in a $2.0 million change in interest expense incurred during fiscal year 2018. Our cash and cash equivalents consist principally of money market securities which are short-term in nature. Currency Rate Exposure We have transactions and balances denominated in currencies other than the U.S. dollar. Most of these transactions or balances are denominated in Euros, British Pounds and a variety of Asian currencies. Sales in currencies other than the U.S. dollar were In the normal course of our business, we have liquid assets denominated in non-functional currencies which include cash, short-term advances between our legal entities 48 Item 8. Financial Statements and Supplementary Data The supplementary quarterly financial information required by this Item 8 is included in Part II, Item 6, “Selected Financial Data”, and is incorporated herein by reference. 49 Brooks Automation, Inc. Opinions on the Financial Statements and Internal Control over Financial Reporting We have audited the accompanying consolidated balance sheets of Brooks Automation, Inc. and its subsidiaries as of September 30, In our opinion, the consolidated financial statements referred to above present fairly, in all material respects, the financial position of Basis for Opinions The Company's management is responsible for these consolidated financial statements, for maintaining effective internal control over financial reporting, and for its assessment of the We conducted our Our audits of the consolidated financial statements included performing procedures to assess the risks of material misstatement of the consolidated financial statements, whether due to error or fraud, and performing procedures that respond to those risks. Such procedures included examining, on a test basis, evidence regarding the amounts and disclosures in the consolidated financial statements. Our audits also included evaluating the accounting principles used and significant estimates made by management, as well as evaluating the overall presentation of the consolidated financial statements. Our audit of internal control over financial reporting included obtaining an As described in Management’s Report on Internal Control over Financial Reporting, management has excluded Tec-Sem Group AG and 4titude, Ltd. from its assessment of internal control over financial reporting as of September 30, 2018, because they were acquired by the Company in purchase business combinations during 2018. We have also excluded Tec-Sem Group AG and 4titude, Ltd. from our audit of internal control over financial reporting. Tec-Sem Group AG and 50 4titude, Ltd. are wholly-owned subsidiaries whose total assets and total revenues excluded from management’s assessment and our audit of internal control over financial reporting represent approximately 2% and 4%, respectively, of the related consolidated financial statement amounts as of and for the year ended September 30, 2018. Definition and Limitations of Internal Control over Financial Reporting A company’s internal control over financial reporting is a process designed to provide reasonable assurance regarding the reliability of financial reporting and the preparation of financial statements for external purposes in accordance with generally accepted accounting principles. A company’s internal control over financial reporting includes those policies and procedures that (i) pertain to the maintenance of records that, in reasonable detail, accurately and fairly reflect the transactions and dispositions of the assets of the company; (ii) provide reasonable assurance that transactions are recorded as necessary to permit preparation of financial statements in accordance with generally accepted accounting principles, and that receipts and expenditures of the company are being made only in accordance with authorizations of management and directors of the company; and (iii) provide reasonable assurance regarding prevention or timely detection of unauthorized acquisition, use, or disposition of the company’s assets that could have a material effect on the financial statements. Because of its inherent limitations, internal control over financial reporting may not prevent or detect misstatements. Also, projections of any evaluation of effectiveness to future periods are subject to the risk that controls may become inadequate because of changes in conditions, or that the degree of compliance with the policies or procedures may deteriorate. /s/ PricewaterhouseCoopers LLP Boston, Massachusetts November 29, 2018 We have served as the Company’s auditor since 2016. 51 BROOKS AUTOMATION, INC. September 30, September 30, 2018 2017 (In thousands, except share and per share data) Assets Current assets Cash and cash equivalents $ 197,708 $ 101,622 Marketable securities 46,281 28 Accounts receivable, net 125,192 93,465 Inventories 96,986 73,397 Prepaid expenses and other current assets 31,741 22,594 Current assets held for sale 66,148 60,671 Total current assets 564,056 351,777 Property, plant and equipment, net 59,988 56,981 Long-term marketable securities 7,237 2,642 Long-term deferred tax assets 43,798 1,692 Goodwill 255,876 207,154 Intangible assets, net 99,956 83,504 Other assets 5,294 6,325 Non-current assets held for sale 59,052 56,553 Total assets $ 1,095,257 $ 766,628 Liabilities and Stockholders' Equity Current liabilities Current portion of long term debt $ 2,000 $ — Accounts payable 55,873 49,100 Deferred revenue 25,884 22,564 Accrued warranty and retrofit costs 6,340 5,479 Accrued compensation and benefits 29,322 23,877 Accrued restructuring costs 659 1,708 Accrued income taxes payable 6,746 11,417 Accrued expenses and other current liabilities 30,405 24,808 Current liabilities held for sale 7,388 7,825 Total current liabilities 164,617 146,778 Long-term debt 194,071 — Long-term tax reserves 1,102 1,687 Long-term deferred tax liabilities 7,135 3,748 Long-term pension liabilities 4,255 1,783 Other long-term liabilities 5,547 4,336 Non-current liabilities held for sale 698 652 Total liabilities 377,425 158,984 Commitments and contingencies (Note 22) Stockholders' Equity Preferred stock, $0.01 par value - 1,000,000 shares authorized, no shares issued or outstanding — — Common stock, $0.01 par value - 125,000,000 shares authorized, 84,164,130 shares issued and 70,702,261 shares outstanding at September 30, 2018, 83,294,848 shares issued and 69,832,979 shares outstanding at September 30, 2017 841 833 Additional paid-in capital 1,898,434 1,874,918 Accumulated other comprehensive income 13,587 15,213 Treasury stock, at cost- 13,461,869 shares (200,956) (200,956) Accumulated deficit (994,074) (1,082,364) Total stockholders' equity 717,832 607,644 Total liabilities and stockholders' equity $ 1,095,257 $ 766,628 The accompanying notes are an integral part of these consolidated financial statements. 52 BROOKS AUTOMATION, INC. CONSOLIDATED STATEMENTS OF OPERATIONS Year Ended September 30, 2018 2017 2016 (In thousands, except per share data) Revenue Products $ 482,389 $ 406,986 $ 335,923 Services 149,171 120,513 98,089 Total revenue 631,560 527,499 434,012 Cost of revenue Products 288,323 249,396 212,029 Services 97,156 79,216 65,294 Total cost of revenue 385,479 328,612 277,323 Gross profit 246,081 198,887 156,689 Operating expenses Research and development 46,936 39,875 44,241 Selling, general and administrative 167,022 141,549 119,292 Restructuring charges 714 3,144 10,210 Total operating expenses 214,672 184,568 173,743 Operating income (loss) 31,409 14,319 (17,054) Interest income 1,881 464 452 Interest expense (9,520) (408) (157) Gain on settlement of equity method investment — 1,847 — Other expenses, net (3,304) (1,702) (1,383) Income (loss) before income taxes and earnings of equity method investments 20,466 14,520 (18,142) Income tax provision (benefit) (47,251) 3,380 66,250 Income (loss) before equity in earnings of equity method investments 67,717 11,140 (84,392) Equity in earnings of equity method investments — (453) (1,065) Income (loss) from continuing operations 67,717 10,687 (85,457) Income from discontinued operations, net of tax 48,747 51,925 15,981 Net income (loss) $ 116,464 $ 62,612 $ (69,476) Net loss attributable to noncontrolling interest 111 — — Net income (loss) attributable to Brooks Automation, Inc. $ 116,575 $ 62,612 $ (69,476) Basic net income (loss) per share attributable to Brooks Automation, Inc. common stockholders: Income (loss) from continuing operations $ 0.96 $ 0.15 $ (1.25) Income from discontinued operations, net of tax 0.69 0.75 0.23 Basic net income (loss) per share $ 1.65 $ 0.90 $ (1.01) Diluted net income (loss) per share attributable to Brooks Automation, Inc. common stockholders: Income (loss) from continuing operations $ 0.95 $ 0.15 $ (1.25) Income from discontinued operations, net of tax 0.69 0.74 0.23 Diluted net income (loss) per share $ 1.64 $ 0.89 $ (1.01) Dividend declared per share $ 0.40 $ 0.40 $ 0.40 Weighted average shares used in computing net income per share: Basic 70,489 69,575 68,507 Diluted 70,937 70,485 68,507 The accompanying notes are an integral part of these consolidated financial statements. 53 BROOKS AUTOMATION, INC. CONSOLIDATED STATEMENTS OF COMPREHENSIVE INCOME (LOSS) Year Ended September 30, 2018 2017 2016 (In thousands) Net income (loss) $ 116,464 $ 62,612 $ (69,476) Other comprehensive (loss) income, net of tax: Cumulative foreign currency translation adjustments (1,651) (221) 8,844 Unrealized (losses) gains on marketable securities, net of tax effects of $0, $0 and $58 for fiscal years 2018, 2017 and 2016 (111) 2 (106) Actuarial gains (losses), net of tax effects of ($49), ($74) and $161 for fiscal years 2018, 2017 and 2016 136 525 (322) Pension settlement — (259) — Pension curtailment — — 852 Total other comprehensive (loss) income, net of tax (1,626) 47 9,268 Comprehensive loss attributable to noncontrolling interest 111 — — Comprehensive income (loss) $ 114,949 $ 62,659 $ (60,208) The accompanying notes are an integral part of these consolidated financial statements. 54 BROOKS AUTOMATION, INC. CONSOLIDATED STATEMENTS OF CASH FLOWS Year Ended September 30, 2018 2017 2016 (In thousands) Cash flows from operating activities Net income (loss) $ 116,464 $ 62,612 $ (69,476) Adjustments to reconcile net income (loss) to net cash provided by operating activities: Depreciation and amortization 37,429 28,149 28,046 Gain on settlement of equity method investment — (1,847) — Impairment of other assets — — 807 Stock-based compensation 19,822 17,278 11,737 Amortization of premium on marketable securities and deferred financing costs 710 252 339 Earnings of equity method investments (6,788) (9,381) (2,380) Loss recovery on insurance claim (1,103) Deferred income tax benefit (45,217) 517 70,273 Pension settlement — (259) — Other gains on disposals of assets (758) (406) (41) Changes in operating assets and liabilities, net of acquisitions: Accounts receivable (28,463) (11,178) (1,796) Inventories (24,365) (12,792) 8,565 Prepaid expenses and other current assets (3,676) (5,829) (428) Accounts payable 5,457 7,846 (5,143) Deferred revenue 2,791 8,049 (3,290) Accrued warranty and retrofit costs (157) 1,602 290 Accrued compensation and tax withholdings 5,978 5,565 (3,234) Accrued restructuring costs (1,080) (4,241) 3,860 Accrued pension costs — (32) (811) Accrued expenses and other current liabilities (3,080) 10,319 2,229 Net cash provided by operating activities 73,964 96,224 39,547 Cash flows from investing activities Purchases of property, plant and equipment (12,787) (12,677) (12,848) Purchases of technology intangibles — (240) — Purchases of marketable securities (69,692) — (12,901) Sales of marketable securities 1,584 3,590 139,388 Maturities of marketable securities 17,482 — — Proceeds from divestitures — — — Disbursement for a loan receivable — — (1,821) Acquisitions, net of cash acquired (85,755) (44,791) (125,248) Proceeds from other investments 500 (170) (250) Proceeds from sales of property, plant and equipment 200 100 2,806 Net cash used in investing activities (148,468) (54,188) (10,874) Cash flows from financing activities Proceeds from term loan 197,554 — 366 Proceeds from issuance of common stock 2,826 2,040 1,888 Payment of deferred financing costs (318) (28) (708) Repayment of term loan (1,500) — — Common stock dividends paid (28,285) (27,932) (27,503) Net cash provided by (used in) financing activities 170,277 (25,920) (25,957) Effects of exchange rate changes on cash and cash equivalents 313 420 1,648 Net increase in cash and cash equivalents 96,086 16,536 4,364 Cash and cash equivalents, beginning of period 101,622 85,086 80,722 Cash and cash equivalents, end of period $ 197,708 $ 101,622 $ 85,086 Supplemental disclosures: Cash paid for interest $ 6,537 $ 200 $ 114 Cash paid for income taxes, net 21,051 8,142 4,930 Supplemental disclosure of non-cash investing and financing activities: Deferred financing costs included in accounts payable — 423 — Fair value of non-cash consideration for the acquisition of Cool Lab, LLC — 10,348 — The accompanying notes are an integral part of these consolidated financial statements. 55 BROOKS AUTOMATION, INC. CONSOLIDATED STATEMENTS OF CHANGES IN EQUITY Total Brooks Common Accumulated Automation, Common Stock at Additional Other Inc. Noncontrolling Stock Par Paid-In Comprehensive Accumulated Treasury Stockholders’ Interests in Total Shares Value Capital Income Deficit Stock Equity Subsidiaries Equity (In thousands, except share data) Balance September 30, 2015 81,093,052 $ 811 $ 1,846,357 $ 5,898 $ (1,020,065) $ (200,956) $ 632,045 $ — $ 632,045 Shares issued under restricted stock and purchase plans, net 1,127,218 10 (2,391) (2,381) (2,381) Stock-based compensation 11,737 11,737 11,737 Common stock dividends declared, at $0.40 per share (27,503) (27,503) (27,503) Net loss (69,476) (69,476) (69,476) Foreign currency translation adjustments 8,844 8,844 8,844 Changes in unrealized gains on marketable securities, net of tax effects of $58 (106) (106) (106) Actuarial losses arising in the year, net of tax effects of $161 (322) (322) (322) Pension curtailment 852 852 852 Balance September 30, 2016 82,220,270 821 1,855,703 15,166 (1,117,044) (200,956) 553,690 — 553,690 Shares issued under restricted stock and purchase plans, net 1,074,578 12 1,937 1,949 1,949 Stock-based compensation 17,278 17,278 17,278 Common stock dividends declared, at $0.40 per share (27,932) (27,932) (27,932) Net income 62,612 62,612 62,612 Foreign currency translation adjustments (221) (221) (221) Changes in unrealized losses on marketable securities, net of tax effects of $0 2 2 2 Actuarial gains arising in the year, net of tax effects of ($74) 525 525 525 Pension settlement (259) (259) (259) Balance September 30, 2017 83,294,848 833 1,874,918 15,213 (1,082,364) (200,956) 607,644 — 607,644 Shares issued under restricted stock and purchase plans, net 869,282 8 2,818 2,826 2,826 Stock-based compensation 19,822 19,822 19,822 Common stock dividends declared, at $0.40 per share (28,285) (28,285) (28,285) Acquisition of noncontrolling interest 876 876 111 987 Net income 116,575 116,575 (111) 116,464 Foreign currency translation adjustments (1,651) (1,651) (1,651) Changes in unrealized losses on marketable securities, net of tax effects of $0 (111) (111) (111) Actuarial gains arising in the year, net of tax effects of ($49) 136 136 136 Balance September 30, 2018 84,164,130 $ 841 $ 1,898,434 $ 13,587 $ (994,074) $ (200,956) $ 717,832 $ — $ 717,832 The accompanying notes are an integral part of these consolidated financial statements. 56 BROOKS AUTOMATION, INC. NOTES TO CONSOLIDATED FINANCIAL STATEMENTS 1. Nature of the Business Brooks Automation, Inc. (“Brooks”, or the “Company”) is a leading In the 2. Summary of Significant Accounting Policies Principles of Consolidation and Basis of Presentation The accompanying Use of Estimates The preparation of financial statements in conformity with accounting principles generally accepted in the United States of America (“GAAP”) requires management to make estimates and assumptions that affect the reported amounts of assets and liabilities and disclosure of contingent assets and liabilities at the date of the financial statements, as well as the reported amounts of revenue and expenses during the reporting period. Significant estimates are associated with recording accounts receivable, inventories, goodwill, intangible assets other than goodwill, long-lived assets, derivative financial instruments, deferred income taxes, warranty and pension obligations, revenue recognized in accordance with the percentage of completion method, and stock-based compensation expense. The Company assesses the estimates on an ongoing basis and records changes in estimates in the period they occur and become known. Actual results could differ from these estimates. Business Combinations The Company accounts for business acquisitions using the 57 Significant judgments are used in determining fair values of assets acquired and liabilities assumed, as well as Foreign Currency Translation Certain transactions of the Company and its subsidiaries are denominated in currencies other than their functional currency. Foreign currency exchange gains (losses) generated from the settlement and remeasurement of these transactions are recognized in earnings and presented within “Other (expense) income, net” in the The determination of the functional currency of the Derivative Financial Instruments All derivatives, whether designated as a hedging relationship or not, are recorded in the Consolidated Balance Sheets at fair value. The accounting for changes in fair value of a derivative instrument depends on whether it has been designated and qualifies as part of a hedging relationship and the type of hedging relationship. For those derivative instruments that are designated and qualify as hedging instruments, the Company must designate the hedging instrument as a fair value hedge, cash flow hedge or a hedge of a net investment in a foreign operation based on the exposure being hedged. Certain derivatives held by the Company are not designated as hedges but are used in managing exposure to changes in foreign exchange rates. A fair value hedge is a derivative instrument designated for the purpose of hedging the exposure of changes in fair value of an asset or a liability resulting from a particular risk. If the derivative is designated as a fair value hedge, the changes in the fair value of the derivative and of the hedged item attributable to the hedged risk are both recognized in the results of operations and presented in the same caption in the Consolidated Statements of Operations and Consolidated Statements of Comprehensive Income (Loss). A cash flow hedge is a derivative instrument designated for the purpose of hedging the exposure to variability in future cash flows resulting from a particular risk. If the derivative is designated as a cash flow hedge, the effective portions of changes in the fair value of the derivative are recorded in accumulated other comprehensive income and recognized in the results of operations when the hedged item affects earnings. Ineffective portions of changes in the fair value of cash flow hedges are recognized in the results of operations. A hedge of a net investment in a foreign operation is achieved through a derivative instrument designated for the purpose of hedging the exposure of changes in value of investments in foreign subsidiaries. If the derivative is designated as a hedge of a net investment in a foreign operation, the effective portions of changes in the fair value of the derivative are recorded in other comprehensive income as a part of the foreign currency translation adjustment. Ineffective portions of net investment hedges are recognized in the results of operations. For derivative instruments not designated as hedging instruments, changes in fair value are recognized in the Consolidated Statements of Operations as gains or losses consistent with the classification of the underlying risk. 58 Concentration of Credit Risk Financial instruments that potentially subject the Company to concentrations of credit risk consist of cash deposits and cash equivalents, marketable securities, derivative instruments and accounts receivable. All of the Company’s cash, cash equivalents, marketable securities and derivative instruments are maintained by major financial institutions. The Company invests cash not used in operations in investment grade, high credit quality securities in accordance with the The Company regularly monitors the creditworthiness of its customers and believes that it has adequately provided for exposure to potential credit losses. The Fair Value of Financial Instruments The Cash and Cash Equivalents Cash and cash equivalents consist of cash and highly liquid investments with original maturities of three months or Accounts Receivable, Trade accounts receivable do not bear interest and are recorded at the invoiced amount. The Company maintains an allowance for doubtful accounts representing its best estimate of probable credit losses related to its existing accounts receivable and their net realizable value. The Company determines the allowance based on a number of factors, including an evaluation of customer credit worthiness, the age of the outstanding receivables, economic trends and historical experience. The Company reviews its allowance for doubtful accounts on a quarterly basis and adjusts the balance based on the Inventories Inventories are stated at the lower of cost or 59 Fixed Assets, Intangible Assets and Impairment of Long-lived Assets Property, plant and equipment are stated at cost, net of accumulated depreciation. Depreciation expense is computed based on the straight-line method and charged to results of operations to allocate the cost of the assets over their estimated useful lives, as follows: Buildings 10 - 40 years Computer equipment and software 3 - 7 years Machinery and equipment 2 - 10 years Furniture and fixtures 3 - 10 years Leasehold improvements are amortized over the shorter of their estimated useful lives or the remaining terms of the respective leases. Equipment used for demonstrations to customers is included in machinery and equipment and depreciated over its estimated useful life. Repair and maintenance costs are expensed as incurred. The Company Cost of disposed assets The Company identified finite-lived intangible assets other than goodwill as a result of acquisitions. Finite-lived intangible assets are valued based on estimated future cash flows and amortized over their estimated useful lives based on methods that approximate the pattern in which the economic benefits are expected to be realized. Finite-lived intangibles assets and fixed assets are tested for impairment when indicators of impairment are present. For purposes of this test, long-lived assets are grouped with other assets and liabilities at the lowest level for which identifiable cash flows are largely independent of the cash flows of other assets and liabilities. If the Company determines that indicators of potential impairment are present, it assesses the recoverability of long-lived asset group by comparing its undiscounted future cash flows to its carrying value. The future cash flow period is based on the future service life of the primary asset within the long-lived asset group. If the carrying value of the long-lived asset group exceeds its future cash flows, the Company determines fair values of the individual net assets within the long-lived asset group to assess potential impairment. If the aggregate fair values of the individual net assets of the group are less than their carrying values, an impairment loss is recognized for an amount in excess of the Finite-lived intangible assets are amortized over their useful lives, as follows: Patents 7 - 15 years Completed technology 3 - 10 years Customer relationships 3 - Goodwill Goodwill represents the excess of a purchase price over the fair value of net tangible and identifiable intangible assets of the businesses acquired by the Company. 60 values of the reporting units are below their carrying values, the Company Application of the goodwill impairment test requires significant judgment based on market and operational conditions at the time of the evaluation, including The goodwill impairment test is performed at the reporting unit level. A reporting unit is either an operating segment or one level below it, which is referred to as a “component”. The level at which the impairment test is performed requires an assessment of whether the operations below an operating segment constitute a self-sustaining business, in which case testing is generally performed at this level. In accordance with ASC 350, Intangibles- Goodwill and The Company determines fair values of its reporting units based on an Deferred Financing Costs The Company records commitment fees and other costs directly associated with obtaining the term loan and line of credit financing as deferred financing costs which are presented within "Other assets" in the accompanying Consolidated Balance Sheets. Deferred financing costs were $2.9 million and $0.5 million at both September 30, 2018 and 2017. Such costs are amortized over the term of the related financing arrangement and included in “Interest expense” in the accompanying Consolidated Statements of Operations. Amortization expense incurred during fiscal years ended September 30, 2018 and 2017 was not material and was included in interest expense in the accompanying Consolidated Statements of Operations. Please refer to Note 10, “Line of Credit” and Note 11, “Debt” for further information on this arrangement. Warranty Obligations The Company offers warranties on the sales of certain of its products and records warranty obligations for estimated future claims at the time revenue is recognized. Warranty obligations are estimated based on historical experience and 61 Defined Benefit Pension Plans The cost and obligations of the The Company generates revenue from the following sources: · Products, including sales of tool automation and automated cold sample management systems, atmospheric and vacuum robots, contamination control solutions, as well as consumables and spare parts. · Services, including repairs, upgrades, diagnostic support, installation, as well as biological sample and other support services. The Company recognizes revenue for such products and services when it is realized or realizable and earned. Revenue is considered realized and earned when all Products Revenue from the Customer allowances and Revenue from product sales that 62 probable and can be reasonably estimated. The Company reviews profit estimates for long-term contracts during each reporting period and revises them based on changes in circumstances. The Company uses the completed contract method for certain arrangements that involve significant product Services Service revenue is generally recognized ratably over the Multiple Element Arrangements Certain customer arrangements related to the sale of The Company recognizes revenue for each Certain multiple element arrangements include the sale of automated cold sample management systems and contamination control solution products with installation services. Revenue allocated to the automated cold sample management systems and contamination control solution products is recognized in accordance with the Company’s revenue recognition policies. Revenue allocated to the installation services is recognized based on the percentage-of-completion method or the completed contract method in which case it is deferred until the installation-related tasks have been completed. Certain customer arrangements include contingent revenue provisions in which a portion of the selling price of a delivered element is contingent on meeting specified performance criteria or on delivery of other elements included in the arrangement. The amount of revenue recognized for these arrangements is limited to the lower of either: (i) the amount billed to the customer that is not contingent on obtaining a customer technical acceptance; or (ii) the value of the arrangement consideration allocated to the delivered elements. 63 Research and Development Expense Research and development costs are expensed as incurred. Stock-Based Compensation Expense The Company measures stock-based compensation cost at fair value on the grant date and recognizes the expense over the service period for the awards expected to vest. The fair value of restricted stock units is determined based on the number of shares granted and the closing price of the The Company recognizes stock-based compensation expense on a straight-line basis, net of estimated forfeitures, over the requisite service period. The Company recognizes benefits from stock-based compensation in equity using the with-and-without approach for the utilization of tax attributes. The Company makes estimates of stock award forfeitures and a number of awards expected to vest which requires significant judgment. The Company considers many factors in developing forfeiture estimates, including award types, employee classes and historical experience. The Company assesses the likelihood of achieving the performance goals for stock-based awards that vest upon the satisfaction of these goals. Current estimates may differ from actual results and future changes in estimates. The following table reflects stock-based compensation expense, excluding amounts related to discontinued operations, recorded during the fiscal years ended September 30, Year Ended September 30, 2018 2017 2016 Restricted stock $ 18,081 $ 16,056 $ 10,859 Employee stock purchase plan 775 517 418 Total stock-based compensation expense $ 18,856 $ 16,573 $ 11,277 Valuation Assumptions for an Employee Stock Purchase Plan The fair value of shares issued under the employee stock purchase plan is estimated on the commencement date of each offering period using the Black-Scholes option-pricing model with the following weighted average assumptions for the fiscal years ended September 30, Year Ended September 30, 2018 2017 2016 Risk-free interest rate 1.9 % 0.9 % 0.4 % Volatility 46 % 34 % 32 % Expected life 6 months 6 months 6 months Dividend yield 1.5 % 3.4 % 3.4 % The risk-free rate is based on the U.S. Treasury yield curve for notes with terms approximating the expected life of the shares granted. The expected stock price volatility is determined based on the Restructuring Expenses The Company records restructuring expenses associated with management-approved restructuring actions, such as consolidation of duplicate infrastructure and reduction in force, to streamline its business operations and improve profitability and competitiveness. Restructuring expenses include severance costs, contract termination costs to vacate facilities and consolidate operations, and other costs directly associated with restructuring actions. The Company records severance and other employee termination costs associated with restructuring actions when it is probable that benefits 64 will be paid and the amounts can be reasonably estimated. The rates used in determining restructuring liabilities related to severance costs are based on existing plans, historical experience and negotiated settlements. Income Taxes The Company records income taxes using the asset and liability method. Deferred income tax assets and liabilities are recognized for the future tax differences between the financial statement carrying amounts of existing assets and liabilities and their respective income tax bases, as well as operating loss and tax credit carryforwards. The Significant management judgment is required in determining the The calculation of the Earnings Per Share Basic income (loss) per share is determined by dividing net income (loss) by the weighted average common shares outstanding during the period. Diluted income (loss) per share is determined by dividing net income (loss) by diluted weighted average shares outstanding during the period. Diluted weighted average shares reflect the dilutive effect, if any, of potential common shares. To the extent their effect is dilutive, employee equity awards and other commitments to be settled in common stock are included in the calculation of diluted income Recently Issued Accounting Pronouncements The Company will adopt this standard effective October 1, 2018, using the modified retrospective method and will only apply this method to contracts that are not completed as of the effective date and all new contracts initiated on or after the effective date. The Company’s quarterly results beginning with the quarter ended December 31, 2018 will be compliant with ASC 606. The Company’s Annual Report on Form 10-K for the year ended September 30, 2019 will be the 65 Company’s first Annual Report that will be issued in compliance with ASC 606. Comparative prior periods will not be restated. The Company has established an implementation team to assist with its assessment of the impact of the new revenue guidance on its operations, consolidated financial statements and related disclosures. The implementation team is also responsible for evaluating and designing the necessary changes to the Company’s business processes, policies, systems and controls to support recognition and disclosure under the new guidance. The implementation team has completed its procedures over the implementation of ASC 606 and has identified the necessary changes to the Company’s processes, policies, systems and controls. The Company expects to record a cumulative-effect adjustment as of October 1, 2018, which is expected to impact retained earnings by an amount not to exceed $3 million. This adjustment is driven by the acceleration of revenue within the Semiconductor Solutions Group segment, and deferral of previously recognized revenue In accordance with the adoption of ASC 606, the Company expects to accelerate revenue related to semiconductor contamination control solutions as the Company is no longer required to restrain revenue in accordance with billing constraints defined in the contract In February 2016, the FASB issued ASU 2016-02, Leases (Topic 842), which replaces ASC 840 to set forth disclosure requirements related to leases. In accordance with provisions of the newly issued guidance, a lessee should recognize at the inception of the arrangement a right-of-use asset and a corresponding lease liability initially measured at the present value of lease payments over the lease term. For finance leases, interest on a lease liability should be recognized separately from the amortization of the right-of-use asset, while for operating leases, total lease costs are recorded on a straight-line basis over the lease term. For leases with a term of twelve months or less, a lessee is permitted to make an accounting policy election by class of underlying assets to forgo recognition of right-of-use assets and corresponding lease liabilities and record a lease expense on a straight-line basis. Entities should determine at the inception of the arrangement whether 66 a contract represents a lease or contains a lease which is defined as a right to control the use of identified property for a period of time in exchange for consideration. Additionally, entities should separate the lease components from the non-lease components and allocate the contract consideration In June 2016, the FASB issued ASU 2016-13, Financial Instruments—Credit Losses (Topic 326), which amends ASC 326 to add, remove, and clarify disclosure requirements related to credit losses of financial instruments. The new guidance introduces a new "expected loss" impairment model which applies to most financial assets measured at amortized cost and certain other instruments, including trade and other receivables, loans, held-to-maturity debt securities and other financial assets. Entities are required to estimate expected credit losses over the life of financial assets and record an allowance against the assets’ amortized cost basis to present them at the amount expected to be collected. Additionally, the guidance amends the impairment model for available for sale debt securities and requires entities to determine whether all or a portion of the unrealized loss on such debt security is a credit loss. The guidance is effective for fiscal years, and interim periods within those years, beginning after December 15, 2019. Early adoption of the newly issued guidance is permitted for fiscal years, and interim periods within those years, beginning after December 15, 2018. The standard should be applied as a cumulative-effect adjustment to retained earnings as of the beginning of the first reporting period in which the guidance is effective. The Company expects to adopt the guidance during the first quarter of fiscal year 2021 and is currently evaluating the impact of this guidance on its financial position and results of operations. In January 2017, the FASB issued ASU 2017-01, Business Combinations (Topic 805): Clarifying the Definition of a Business, which amends ASC 805 to add, remove, and clarify disclosure requirements related to business combinations. This guidance revised the definition of a business to assist entities with evaluating whether a set of transferred assets and activities represents a business. Such a set of transferred assets and activities does not represent a business if substantially all of the fair value of the gross assets acquired is concentrated in a single identifiable asset or a group of similar identifiable assets. If the threshold is not met, entities need to evaluate whether the set of assets and activities meets the requirement that a business includes, at a minimum, an input and a substantive process that together significantly contribute to the ability to create outputs. The guidance is effective for fiscal years, and interim periods within those years, beginning after December 15, 2017 and should be adopted prospectively. Early adoption of the newly issued guidance is permitted. The Company is currently evaluating the impact of this guidance on its financial position and results of operations. In March 2018, the FASB issued ASU 2018-02, Reclassification of Certain Tax Effects from Accumulated Other Comprehensive Income, which amends ASC 220 to add, remove, and clarify disclosure requirements related to reporting comprehensive income. This ASU gives entities the option to reclassify tax effects recorded in accumulated other comprehensive income as a result of tax reform to retained earnings. The entities have the option to apply the guidance retrospectively or in the period of adoption. The guidance requires entities to make new disclosures, regardless of whether they elect to reclassify tax effects. The guidance is effective for fiscal years beginning after December 15, 2018, and interim periods within those fiscal years. Early adoption in any period is permitted. The Company expects to adopt the guidance during the first quarter of fiscal year 2020 and is evaluating the effect that ASU 2018-02 will have on its consolidated financial statements and related disclosures. In August 2018, the FASB issued ASU 2018-13, Fair Value Measurement (Topic 820): Disclosure Framework - Changes to the Disclosure Requirements for Fair Value Measurement, which amends ASC 820 to add and remove disclosure requirements related to fair value measurement. The amendments include new disclosure requirement for changes in unrealized gains or losses included in other comprehensive income (OCI) for recurring Level 3 fair value measurements held at the end of the reporting period and the range and weighted average used to develop significant unobservable inputs for Level 3 fair value measurements. The amendments eliminated disclosure requirements for amount of and reasons for transfers between Level 1 and Level 2, valuation processes for Level 3 fair value measurements, and policy for timing of transfers between levels of the fair value hierarchy. In addition, the amendments modified certain disclosure requirement to provide clarification or to promote appropriate exercise of discretion by 67 entities. ASU 2018-13 is effective for fiscal years beginning after December 15, 2019, including interim periods therein. Early adoption is permitted. The Company is currently evaluating the impact of this ASU. In August 2018, the FASB issued ASU 2018-14, Disclosure Framework — Changes to the Disclosure Requirements for Defined Benefit Plans, which amends ASC 715 to add, remove, and clarify disclosure requirements related to defined benefit pension and other postretirement plans. The amendments require additional disclosure for the weighted-average interest crediting rates, a narrative description of the reasons for significant gains and losses, and an explanation of any other significant changes in the benefit obligation or plan assets. The amendment removes disclosure requirement for accumulated other comprehensive income expected to be recognized over the next year, information about plan assets to be returned to the entity, and the effects of a one-percentage-point change on the assumed health care costs and the effect of this change in rates on service cost, interest cost, and the benefit obligation for postretirement health care benefits. The ASU is effective for fiscal years ending after December 15, 2020. Early adoption is permitted. The ASU does not amend the interim disclosure requirements of ASC 715-20. The Company is currently evaluating the impact of this ASU. Recently Adopted Accounting Pronouncements In March 2016, the FASB issued ASU 2016-09, Compensation-Stock Compensation (Topic 718): Improvement to Employee Share-Based Payment Accounting, which amends ASC 718 to add, remove, and clarify disclosure requirements related to stock compensation. This guidance was issued to simplify accounting for share-based payment awards issued to employees. The amendment requires recognition of excess tax benefits or deficiencies within income tax expense or benefit and changes their presentation requirements on the statement of cash flows. Additionally, the entity can make an accounting policy election to either estimate the number of awards that are expected to vest, consistent with the current accounting guidance, or account for forfeitures as they occur. The guidance is effective for fiscal years, and interim periods within those years, beginning after December 15, 2016. Early adoption of the newly issued guidance is permitted. The Company adopted the guidance during the first quarter of fiscal year 2018. Upon adoption of this guidance, the Company made an accounting policy election to continue accounting for forfeitures by applying an estimated forfeiture rate. The adoption of this guidance did not have an impact on the stock compensation expense amount recognized during the year ended September 30, 2018 and accumulated deficit at September 30, 2018. 3. Discontinued Operations On August 27, 2018, the Company entered into The semiconductor cryogenics business In connection with the Disposition, the Company and Edwards entered into a transition service agreement, a supply agreement, and lease agreements. The transition service agreement outlines the information technology, people, and facility support the Company expects to provide to Edwards for a period from 1 month to 6 months after transaction closing date. The supply agreement allows the Company to purchase CTI and Polycold goods at cost from Edwards up to an aggregate amount equal to $1.0 million during the one-year term after closing of the Disposition. The lease agreements will provide facility space to Edwards free of charge for three years after the transaction closing date. Edwards will have the option to renew each lease at the then current market rates after the initial three-year lease term has ended. This Disposition is consistent with the Company’s long-standing strategy to increase shareholder value by accelerating the growth of its Life Sciences business with further acquisitions and strengthening its semiconductor automation business with opportunistic acquisitions. 68 The Disposition met the "held for sale" criteria and the “discontinued operation” criteria in accordance with FASB ASC 205 as of September 30, 2018. As such, its operating results have been reported as a discontinued operation The following table presents the financial results of discontinued operations (in thousands): Fiscal Year Ended September 30, 2018 2017 2016 Revenue Products $ 150,365 $ $ 85,860 Services 45,731 40,451 Total revenue 196,096 165,386 126,311 Cost of revenue Products 85,350 55,144 Services 22,834 28,974 Total cost of revenue 108,184 84,118 Gross profit 87,912 42,193 Operating expenses Research and development 7,605 6,932 Selling, general and administrative 25,017 12,139 Restructuring charges 2 1,830 Total operating expenses 32,624 20,901 Operating income 55,288 21,292 Interest income Interest expense Other (expense) income, net 1,091 Income before income taxes and earnings of equity method investment Income tax provision Income before equity in earnings of equity method investment Equity in earnings of equity method investment Net income $ $ $ The Company performed its annual goodwill impairment analysis in April 2018. This analysis was updated upon announcement of the Disposition for the year ended September 30, 2018. The Company has concluded that there is no The following table presents the summarized financial information for Ulvac Cryogenics, Inc., the unconsolidated subsidiaries accounted for based on September 30, 2018 2017 Balance Sheets: Current assets $ 69,302 $ 74,645 Non-current assets 21,338 16,829 Current liabilities 26,006 29,622 Non-current liabilities 8,397 7,860 69 Fiscal Year Ended September 30, 2018 2017 2016 Statements of Operations: Total revenue $ 94,652 $ 104,667 $ 68,054 Gross profit 34,982 41,241 23,586 Operating Income 18,405 26,340 10,571 Net income 13,345 19,451 7,492 The following table presents the significant non-cash items and capital expenditures for the discontinued operations that are included in the Consolidated Statements of Cash Flows (in thousands): Fiscal Year Ended September 30, 2018 2017 2016 Depreciation and amortization $ 743 $ 919 $ 1,034 Capital expenditures 302 1,049 560 Stock-based compensation 966 705 460 Earnings of equity method investment (6,788) (9,834) (3,445) The carrying value of the assets and liabilities of the discontinued operations on the Consolidated Balance Sheet as of September 30, 2018 and September 30, 2017 were as follows (in thousands): Fiscal Year Ended September 30, 2018 2017 Assets Accounts receivable, net $ 27,852 $ 27,363 Inventories 37,953 32,998 Other current assets 343 310 Total current assets of discontinued operation $ 66,148 $ 60,671 Property, plant and equipment, net $ 1,081 $ 1,481 Goodwill 26,485 26,485 Intangibles, net 14 16 Equity method investment 31,472 28,570 Other assets - 1 Total long-term assets of discontinued operation $ 59,052 $ 56,553 Liabilities Deferred revenue $ 1,052 $ 1,728 Accrued warranty and retrofit costs 2,464 2,574 Accrued compensation and benefits 3,648 3,189 Other current liabilities 224 334 Total current liabilities of discontinued operation $ 7,388 $ 7,825 Long-term liabilities of discontinued operation $ 698 $ 652 70 4. Acquisitions Acquisitions Completed in Acquisition of On The preliminary amounts recorded were as follows (in thousands): Fair Value of Assets Accounts receivable (approximates contractual value) $ 988 Inventories 4,297 Prepaid expenses and other current assets 4,038 Property, plant and equipment 85 Intangible assets 10,694 Goodwill 7,665 Accounts payable (1,049) Accrued liabilities (6,962) Deferred tax liabilities (1,391) Accrued pension liability (2,800) Total purchase price, net of cash acquired $ 15,565 The Company Goodwill of $7.7 million largely reflects the potential synergies and expansion of technical capabilities to the Company's existing contamination control solutions business. The goodwill from this acquisition is reported within the Brooks Semiconductor Solutions Group segment and is not tax deductible. As part of the acquisition, the Company assumed all the assets and liabilities of Tec-Sem’s Swiss defined benefit plan, which covered substantially all its full-time employees. At acquisition date, the plan was fully funded for each employee’s pension contribution plus an expected rate of return equal to the statutory discount rate. Total plan assets and plan liability were $5.1 million and $7.9 million, respectively, at acquisition date. The Company recorded a liability of $2.8 million for the unfunded projected benefit obligation related to each plan participant’s future services. The Company reports the results of operations for Tec-Sem in the Brooks Semiconductor Solutions Group segment. The revenues and net loss from Tec-Sem included in the Company's consolidated results for fiscal year 2018 were $11.6 million and $1.2 million, respectively. During fiscal year 2018, the net loss included $0.7 million related to the step-up in value of the acquired inventories and $2.1 million related to amortization expense of acquired intangible assets. During fiscal year 2018, the Company incurred $0.9 million in transaction costs related to the Tec-Sem acquisition. The escrow at closing had a balance of $2.6 million which consisted of $1.8 million related to satisfaction of the sellers' indemnification obligations with respect to their representations and warranties and other indemnities. The remaining $0.8 million of the escrow balance is related to a performance obligation that the Company assumed at the acquisition date for the transfer of non-core wafer stocker technology to an unrelated third party. Upon successful delivery of such technology, the Company expects to collect a portion of the $0.8 million which represent reimbursement of costs incurred to complete development. 71 The Company did not present a pro forma information summary for its consolidated results of operations for the fiscal years ended September 30, 2018 and 2017 as if the acquisition of Tec-Sem occurred on October 1, 2016 because such results were immaterial. Acquisition of 4titude Limited On October 5, 2017, the Company acquired all the outstanding capital stock of 4titude Limited (“4titude”), a U.K.-based manufacturer of scientific consumables for biological sample materials used in a variety of genomic and DNA analytical applications. The acquisition of 4titude has expanded the Company’s existing offerings of consumables and instruments within the Brooks Life Sciences segment. The aggregate purchase price of $65.1 million, net of cash acquired, consisted primarily of a cash payment of $64.8 million subject to working capital adjustments and the assumption of the seller’s liabilities of $0.4 million. The Company used a market participant approach to record the assets acquired and liabilities assumed in the 4titude acquisition as follows (in thousands): Fair Value of Assets and Liabilities Accounts receivable (approximates contractual value) $ 1,581 Inventories 2,667 Prepaid expenses and other current assets 140 Property, plant and equipment 1,555 Intangible assets 27,212 Goodwill 38,185 Accounts payable (286) Accrued liabilities (845) Deferred tax liabilities (5,090) Total purchase price, net of cash acquired $ 65,119 The Company applied variations of the income approach to estimate the fair values of the intangible assets acquired. The identified intangible assets include customer relationships (excess earnings method) of $21.4 million with a useful life of 10 years, completed technology (relief from royalty method) of $5.2 million with a useful life of 13 years, backlog (excess earnings method) of $0.4 million with a useful life of 1 year and trademarks (excess earnings method) of $0.2 million with a useful life of 1 year. The intangible assets acquired are amortized over the total weighted average period of 10.4 years using methods that approximate the pattern in which the economic benefits are expected to be realized. At the acquisition date, a cash payment of $0.4 million was placed into escrow which was ascribed to the purchase price. The escrow was related to satisfaction of the sellers' indemnification obligations with respect to their representations and warranties and other indemnities. The escrow balance was $0.2 million as of September 30, 2018. Goodwill represents the excess of the consideration paid over the fair value of the net assets acquired and has been assigned to the Brooks Life Sciences segment. Goodwill is primarily the result of expected synergies from combining the operations of 4titude with the Company’s operations and is not deductible for tax purposes. The operating results of 4titude have been reflected in the results of operations for the Brooks Life Sciences segment. During fiscal year 2018, revenue and net loss from 4titude recognized in the Company’s results of operations were $15.9 million and $0.8 million, respectively. The net in fiscal year 2018 included recurring charges of $4.1 million, related to amortization expense of acquired intangible assets. The net loss in fiscal year 2018 also included non-recurring charges of $1.2 million related to the step-up in value of the acquired inventories. During fiscal year 2018, the Company incurred $1.1 million in non-recurring transaction costs with respect to the 4titude acquisition. The Company did not present a pro forma information summary for its consolidated results of operations for the fiscal years ended September 30, 2018 and 2017 as if the acquisition of 4titude occurred on October 1, 2016 because such results were immaterial. 72 Other On April 20, 2018, the Company acquired BioSpeciMan Corporation (“BioSpeciMan”), a Canada-based provider of storage services for biological sample materials. BioSpeciMan, founded in 2002, provides temperature controlled biological sample storage services to an attractive mix of pharma, biotech and contract lab customers. This acquisition has expanded customer relationships and geographic reach within its growing sample management storage services business in the Brooks Life Sciences segment. The total cash payment made by the Company was $5.2 million, net of cash acquired and subject to working capital adjustments. The Company allocated the purchase price of $5.2 million based on the fair value of the assets and liabilities acquired, which included $0.3 million of accounts receivable, $2.6 million of customer relationships, $2.7 million of goodwill and $0.7 million of assumed liabilities. The Company applied the excess earnings method, a variation of the income approach to determine the fair value of the customer relationship intangible asset. The purchase price allocation was based on a preliminary valuation which is subject to further adjustments within the measurement period when additional information becomes available. The goodwill from this acquisition is reported within the Brooks Life Sciences segment and is not tax deductible. At the acquisition date, a cash payment of $0.5 million was placed into escrow which was ascribed to the purchase price. The escrow was related to satisfaction of the sellers' indemnification obligations with respect to their representations and warranties and other indemnities. The operating results of the acquisition have been reflected in the results of operations for the Brooks Life Sciences segment. The Company did not present a pro forma information summary for its consolidated results of operations for the fiscal years ended September 30, 2018 and 2017 as if the acquisition of BioSpeciMan occurred on October 1, 2016 because such results were immaterial. Acquisitions Completed in Fiscal Year 2017 Acquisition of Pacific Bio-Material Management, Inc. and Novare, LLC On July 5, 2017, the Company entered into an asset purchase agreement with Pacific Bio-Material Management, Inc. (“PBMMI”) and Novare, LLC, a wholly owned subsidiary of PBMMI (collectively, the “sellers”), to acquire substantially all the assets and liabilities of the sellers’ business related to providing storage, transportation, management, and cold chain logistics of biological materials. The acquisition has expanded the Company’s existing capabilities with respect to sample management and integrated cold chain storage and transportation solutions within the Brooks Life Sciences segment. The Company paid to the sellers cash consideration of $34.3 million, net of cash acquired and subject to working capital adjustments. The Company used a market participant approach to record the assets acquired and liabilities assumed in the PBMMI acquisition. The amounts recorded were as follows (in thousands): Fair Value of Assets and Liabilities Accounts receivable (approximates contractual value) $ 2,800 Prepaid expenses and other current assets 267 Property, plant and equipment 2,887 Intangible assets 8,600 Goodwill 21,434 Accounts payable (699) Accrued liabilities (673) Deferred revenue (385) Other liabilities (103) Total purchase price, net of cash acquired $ 34,128 73 The Company applied variations of the income approach to estimate the fair values of the intangible assets acquired. The identified intangible assets include customer relationship intangible (excess-earnings method) of $8.5 million and trademarks of $0.1 million. The intangible assets acquired are amortized over the total weighted average period of 11.0 years using methods that approximate the pattern in which the economic benefits are expected to be realized. At the acquisition date, a cash payment of $3.3 million was placed into escrow which was ascribed to the purchase price. The escrow balance of $3.3 million included $2.9 million related to satisfaction of the sellers' indemnification obligations with respect to their representations and warranties and other indemnities, as well as $0.4 million payable to the former owner of Novare as a compensation for a sale of his ownership interest. This escrow arrangement is administered by the Company on behalf of the sellers. The escrow balance related to satisfaction of the sellers' indemnification obligations was $2.7 million as of September 30, 2018. The Novare escrow balance was reduced by its full amount as of September 30, 2018. Goodwill represents the excess of the consideration transferred over the fair value of the net assets acquired and has been assigned to the The operating results of The Company did not present a pro forma information summary for its consolidated results of operations for the fiscal years ended September 30, Acquisition of On The aggregate purchase price of $15.2 million consisted of a cash payment of $4.8 million, a liability to the seller of $0.1 million and the settlement of certain preexisting relationships with The Company Fair Value of Assets Inventory $ 1,283 Intangible assets 6,100 Goodwill 8,527 Accrued liabilities (30) Other liabilities (686) Total purchase price $ 15,194 74 The Goodwill represents the excess of the consideration transferred over the fair value of the net assets acquired and has been assigned to the The Company recorded a liability of $0.7 million in the purchase price allocation that represented a pre-acquisition contingency incurred on the acquisition date. The obligation is related to a rebate that is due to a particular customer if the annual product sales volume metrics exceed threshold amounts under the provisions of the contract with this customer assumed by the Company. Fair value of such liability was determined based on a probability weighted discounted cash flow model. The carrying amount of the liability was $0.8 million and $0.7 million, respectively, at September 30, 2018 and 2017. The operating results of The Company did not present a pro forma information summary for its consolidated results of operations for the fiscal Other On The aggregate purchase price of $5.5 million consisted of a cash payment of $5.2 million and At the closing of the acquisition, a cash payment of $0.5 million was placed into escrow which was ascribed to the purchase price. The 75 The operating results of the acquisition have been reflected in the results of operations for the Brooks Life Sciences segment. The Company did not present a pro forma information summary for its consolidated results of operations for fiscal years ended September 30, 2018 and 2017 as Acquisitions Completed in Fiscal Year 2016 Acquisition of BioStorage Technologies, Inc. On November 30, 2015, the Company completed its acquisition of BioStorage Technologies, Inc., or BioStorage, an Indiana-based global provider of comprehensive sample management and integrated cold chain solutions for the biosciences industry. These solutions include collection, transportation, processing, storage, protection, retrieval and disposal of biological samples. These solutions combined with the Company’s existing offerings, particularly automation for sample storage and formatting, provide customers with fully integrated sample management cold chain solutions which will help them increase productivity, efficiencies and speed to market. This acquisition has allowed the Company to access a broader customer base that is storing samples at ultra-cold temperatures and simultaneously provide opportunities for BioStorage to use the Company’s capabilities to expand into new markets. The Company acquired 100% of the issued and outstanding shares of BioStorage. A cash payment of $130.7 million, net of the seller’s cash of $2.8 million, resulted in a net cash outflow of $128.0 million, including $125.2 million ascribed to the purchase price On September 9, 2016, the Company reached a settlement with the sellers of BioStorage’s stock related to certain working capital adjustments. On September 13, 2016, the Company received $0.2 million of proceeds from the sellers as a result of such settlement, which was recorded as a decrease in the purchase price and goodwill. The Company recorded the following assets acquired and liabilities assumed related to BioStorage at their fair values as of the acquisition date, from a market participant’s Fair Value of Assets and Liabilities Accounts receivable $ 16,942 Prepaid expenses and other current assets 321 Property, plant and equipment 14,345 Intangible assets 41,460 Goodwill 79,639 Other assets 53 Debt assumed (385) Accounts payable (1,708) Accrued liabilities (9,423) Deferred revenue (1,766) Long-term deferred tax liabilities (14,169) Other liabilities (61) Total purchase price, net of cash acquired $ 125,248 At the acquisition date, a cash payment of $5.4 million was placed into escrow which consisted of $2.9 million ascribed to the purchase price The Company 76 Goodwill represents the excess of the consideration transferred over the fair value of the net assets acquired and has been assigned to the The operating results of During fiscal years The following unaudited proforma financial Year Ended September 30, 2016 Revenue $ 445,058 Net loss (79,377) Basic loss per share $ (1.16) Diluted loss per share $ (1.16) Weighted average shares outstanding used in computing net loss per share: Basic 68,507 Diluted 68,507 The unaudited pro forma information presented above reflects historical operating results of the 5. Marketable Securities The Company invests in marketable securities that are classified as available-for-sale and recorded at fair value in the Unrealized gains and losses are excluded from earnings and reported as a separate component of accumulated other comprehensive income until the security is sold or matures. Gains or losses realized from sales of marketable securities are computed based on the specific identification method and recognized 77 cash proceeds of approximately $1.6 million from the sale of marketable securities and reclassified unrealized net holding losses of $0.1 million from accumulated other comprehensive income The following is a summary of the amortized cost and the fair value, including accrued interest receivable, as well as unrealized holding gains (losses) on the short-term and long-term marketable securities as of September 30, Gross Gross Amortized Unrealized Unrealized Cost Losses Gains Fair Value September 30, 2018: U.S. Treasury securities and obligations of U.S. government agencies $ 30,142 $ (65) $ — $ 30,077 Bank certificates of deposits 5,148 — 1 5,149 Corporate securities 14,763 (30) — 14,733 Municipal securities 2,797 (17) — 2,780 Other debt securities 779 — — 779 $ 53,629 $ (112) $ 1 $ 53,518 September 30, 2017: Corporate securities $ 2,642 $ — $ — $ 2,642 Other debt securities 28 — — 28 $ 2,670 $ — $ — $ 2,670 The fair values of the marketable securities by contractual maturities at September 30, Fair Value Due in one year or less $ 46,281 Due after one year through five years 4,373 Due after five years through ten years — Due after ten years 2,864 Total marketable securities $ 53,518 Expected maturities could differ from contractual maturities because the security issuers may have the right to prepay obligations without prepayment penalties. The Company reviews the marketable securities for impairment at each reporting period to determine if any of the securities have experienced an other-than-temporary decline in fair value. The Company considers factors, such as the length of time and extent to which the market value has been less than the cost, the financial condition and near-term prospects of the issuer, the 78 6. Property, plant and equipment were as follows as of September 30, 2018 and 2017 (in thousands): September 30, 2018 2017 Buildings and land $ 47,745 $ 46,608 Computer equipment and software 56,982 55,352 Machinery and equipment 55,794 48,647 Furniture and fixtures 4,842 4,034 Leasehold improvements 19,433 18,045 Capital projects in progress 5,796 2,761 190,592 175,447 Less: accumulated depreciation and amortization (130,604) (118,466) Property, plant and equipment, net $ 59,988 $ 56,981 Depreciation expense was $12.5 million, $10.1 million and $12.2 million, respectively, for the fiscal years ended September 30, 2018, 2017 and 2016. The Company recorded $0.9 million of additions to property, plant and equipment for which cash payments had not yet been made as of September 30, 2018. 7. Goodwill and Intangible Assets Goodwill represents the excess of net book value over the estimated fair value In accordance with ASC 350, the The Company completed its annual goodwill impairment test as of April 1, 2018 and determined that no adjustment to goodwill was necessary since the fair value of each reporting unit was significantly in excess of the carrying value of each reporting unit. The Company conducted a qualitative assessment for three reporting units within the Brooks Semiconductor Solutions Group segment and determined that it was not likely that their fair values were less than their carrying values. As a result of the analysis, the Company did not perform the quantitative assessment for these reporting units and did not recognize impairment losses. The Company also performed the quantitative goodwill impairment test for the fourth reporting unit within the Brooks Semiconductor Solutions Group segment and for the Brooks Life Sciences reporting unit. The Company determined that no adjustment to goodwill was necessary for these two reporting units since their fair values significantly exceeded their respective carrying values. If events occur or 79 The following Brooks Semiconductor Solutions Brooks Group Life Sciences Other Total Gross goodwill, at September 30, 2016 $ 629,297 $ 135,301 $ 26,014 $ 790,612 Accumulated goodwill impairments (588,944) — (26,014) (614,958) Goodwill, net of accumulated impairments, at September 30, 2016 40,353 135,301 — 175,654 Acquisitions and adjustments (19) 31,519 — 31,500 Gross goodwill, at September 30, 2017 $ 629,278 $ 166,820 $ 26,014 $ 822,112 Accumulated goodwill impairments (588,944) — (26,014) (614,958) Goodwill, net of accumulated impairments, at September 30, 2017 40,334 166,820 — 207,154 Acquisitions and adjustments 7,629 41,093 — 48,722 Gross goodwill, at September 30, 2018 636,907 207,913 26,014 870,834 Accumulated goodwill impairments (588,944) — (26,014) (614,958) Goodwill, net of accumulated impairments, at September 30, 2018 $ 47,963 $ 207,913 $ — $ 255,876 During fiscal year 2018, the Company recorded a goodwill increase of $41.0 million primarily related to the acquisitions of 4titude, TecSem and BioSpeciMan. The components of the Company’s identifiable intangible assets as of September 30, September 30, 2018 September 30, 2017 Accumulated Net Book Accumulated Net Book Cost Amortization Value Cost Amortization Value Patents $ 5,302 $ 4,325 $ 977 $ 5,302 $ 4,019 $ 1,283 Completed technology 44,829 28,934 15,895 31,264 24,379 6,885 Trademarks and trade names 6,298 2,953 3,345 6,138 1,863 4,275 Customer relationships 142,489 62,750 79,739 115,596 44,535 71,061 $ 198,918 $ 98,962 $ 99,956 $ 158,300 $ 74,796 $ 83,504 Amortization expense for intangible assets was $24.2 million, $17.1 million and $14.8 million, respectively, for the fiscal years ended September 30, 2018, 2017 and 2016. Estimated future amortization expense for the intangible assets as of September 30, 2018 is as follows (in thousands): Fiscal year ended September 30, 2019 $ 23,187 2020 21,061 2021 14,752 2022 11,839 2023 9,423 Thereafter 19,694 $ 99,956 80 8. Equity Method and Other Investments The BioCision, LLC As of September 30, 2016, the Company held a 20% equity interest in BioCision, LLC, or BioCision, a privately-held company based in Larkspur, California, which was accounted for as an equity method investment. The carrying value of the investment in BioCision was $1.7 million at September 30, 2016. During fiscal years ended September 30, 2016, the Company recorded a loss associated with BioCision of $1.1 million. The Company held a term loan receivable from BioCision as of September 30, 2016. The term loan was provided to BioCision to support its working capital requirements. The term loan had an aggregate principal amount of $1.5 million and bore an annual interest rate of 10%. At September 30, 2016, the term loan was recorded at its carrying value of $1.5 million and included in "Other assets" in the The Company also held five-year convertible debt securities with a warrant agreement to purchase BioCision’s preferred units as of September 30, 2016. The convertible debt securities and the warrant were purchased by the Company in fiscal year 2015 for a total purchase price of $5.0 million. The convertible debt securities were accruing interest at the annual rate of 9%, and On November 28, 2016, BioCision established Cool Lab as its subsidiary upon transferring certain assets related to cell cryopreservation solutions. The Company acquired a 100% equity interest of the subsidiary on that date for an aggregate purchase price of $15.2 million, consisting of a cash payment of $4.8 million, a liability to the seller of $0.1 million, and non-cash consideration of $10.3 million measured at fair value on the acquisition date. The carrying value of the equity method investment in BioCision was $1.2 million on November 28, 2016. The Company recorded a loss associated with BioCision of $0.5 million from October 1, 2016 through the acquisition date. The equity method investment in BioCision was measured at fair value of $3.1 million at the acquisition date, and as a result the Company recognized a gain of $1.8 million upon the redemption of the equity method investment in its Consolidated Statements of Operations during fiscal year ended September 30, 2017. On November 28, 2016, convertible debt, warrant and the term loan with carrying values of $5.8 million, less than $0.1 million and $1.6 million, respectively, were measured at their fair values of $5.6 million, less than $0.1 million and $1.6 million, respectively. As a result of such measurement, the Company recognized an aggregate loss of $0.2 million upon the settlement of these financial instruments in "Other (expense) income, net" in its Consolidated Statements of Operations during the year ended September 30, 2017. Please refer to Note 9. Supplementary Balance Sheet Information The following is a summary of accounts receivable at September 30, 2018 and September 30, 2018 2017 Accounts receivable $ 126,350 $ 94,927 Less allowance for doubtful accounts (1,113) (1,381) Less allowance for sales returns (45) (81) Accounts receivable, net $ 125,192 $ 93,465 81 The allowance for doubtful accounts activity for the fiscal years ended September 30, 2018, 2017 and 2016 is as follows (in thousands): Balance at Reversals of Write- Balance at Beginning of Bad Debt offs and End of Description Period Provisions Expense Adjustments Period 2018 Allowance for doubtful accounts $ 1,381 $ 708 $ (724) $ (252) $ 1,113 2017 Allowance for doubtful accounts 1,543 — (131) (31) 1,381 2016 Allowance for doubtful accounts 332 143 48 1,020 1,543 The allowance for sales returns activity for the fiscal years ended September 30, 2018, 2017 and 2016 is as follows (in thousands): Balance at Write- Balance at Beginning of offs and End of Description Period Provisions Adjustments Period 2018 Allowance for sales returns $ 81 $ (36) $ — $ 45 2017 Allowance for sales returns 101 (20) — 81 2016 Allowance for sales returns 115 (14) — 101 The following is a summary of inventories at September 30, 2018 and 2017 (in thousands): September 30, 2018 2017 Inventories Raw materials and purchased parts $ 57,527 $ 53,234 Work-in-process 19,547 7,120 Finished goods 19,912 13,043 Total inventories $ 96,986 $ 73,397 The activity for excess and obsolete inventory reserves is as follows for the fiscal years ended September 30, 2018, 2017 and 2016 (in thousands): Balance at Inventory Balance at Beginning of Disposals and End of Description Period Provisions Adjustments Period 2018 Reserves for excess and obsolete inventory $ 17,734 $ 4,455 $ (7,236) $ 14,953 2017 Reserves for excess and obsolete inventory 19,663 4,858 (6,787) 17,734 2016 Reserves for excess and obsolete inventory 19,603 5,754 (5,694) 19,663 The activity for valuation allowance for deferred tax assets is as follows for the fiscal years ended September 30, 2018, 2017 and 2016 (in thousands): Balance at Balance at Beginning of Charged to Charged to End of Description Period Provisions Other Accounts Period 2018 Valuation allowance for deferred tax assets $ 92,297 $ (72,842) $ (874) $ 18,581 2017 Valuation allowance for deferred tax assets 104,802 (10,881) (1,624) 92,297 2016 Valuation allowance for deferred tax assets 18,797 77,531 8,474 104,802 The Company establishes reserves for estimated cost of product warranties based on historical information. Product warranty reserves are recorded at the time product revenue is recognized, and retrofit accruals are recorded at the time retrofit programs are established. The Company’s warranty obligation is affected by product failure rates, utilization levels, material usage, service delivery costs incurred in correcting a product failure and supplier warranties on parts delivered to the Company. The following is a summary of product warranty and retrofit activity on a gross basis, 82 excluding amounts related to discontinued operations, for the fiscal years ended September 30, 2018, 2017 and 2016 (in thousands): Amount Balance at September 30, 2015 $ 4,255 Accruals for warranties during the year 5,851 Costs incurred during the year (5,947) Balance at September 30, 2016 4,159 Accruals for warranties during the year 6,683 Costs incurred during the year (5,363) Balance at September 30, 2017 5,479 Accruals for warranties during the year 5,209 Costs incurred during the year (4,348) Balance at September 30, 2018 $ 6,340 10. Line of Credit On May 26, 2016, the Company and certain of its subsidiaries entered into a credit agreement with Wells Fargo Bank, N.A. (the "Wells Fargo"). The credit agreement provided for a five-year senior secured revolving line of credit (the ‘‘line of credit") of $75.0 million. The agreement included sub-limits of up to $25.0 million for letters of credit and $7.5 million of swing loans at the time there is more than one lender under the credit agreement. On October 4, 2017, the Company entered into a $200.0 million Senior Secured Term Loan Facility (the “term loan”) with Morgan Stanley Senior Funding, Inc., JPMorgan Chase Bank, N.A. and Wells Fargo Securities, LLC (collectively, the “lenders”). Coincident with the entry into the term loan agreement, the Company amended certain terms and conditions of the credit agreement and entered into an arrangement with Wells Fargo Bank, N.A. and JPMorgan Chase Bank, N.A. Based on the The sub-limits for letters of credit were reduced to $7.5 million under the amended terms of the credit agreement. All outstanding borrowings under the credit agreement are guaranteed by the Company and BioStorage Technologies, Inc., its wholly-owned subsidiary (“guarantor”), and subordinated to the obligations under the term loan which are secured by a first priority lien on substantially all of the assets of the Company and the Guarantor, other than accounts receivable and inventory. There were no amounts outstanding under the line of credit as of September 30, 2018 and September 30, 2017. The Company records commitment fees and other costs directly associated with obtaining line of credit financing as deferred financing costs, which are amortized over the term of the related financing arrangement. Deferred financing costs were $0.5 million at both September 30, 2018 and September 30, 2017. The line of credit contains certain customary representations and warranties, a financial covenant and affirmative and negative covenants as well as events of default. The Company was in compliance with the line of credit covenants as of September 30, 2018 and September 30, 2017. 11. Debt On October 4, 2017, the Company entered into a $200.0 million term loan with the lenders. The term loan was issued at $197.6 million, or 98.8% of its par value, resulting in a discount of $2.4 million, or 1.2%, which represented loan origination fees paid at the closing. The Company incurred additional deferred financing costs of $0.4 million during the year ended September 30, 2018. The loan proceeds are to be used for general corporate purposes, including acquisitions. The loan principal amount may be increased by an aggregate amount equal to $75.0 million plus any voluntary repayments of the term loans plus any additional amount such that the secured leverage ratio of the Company is less than 3.00 to 1.00. 83 Under the term loan agreement, the Company may elect for the loan to bear an interest rate as Eurodollar Borrowings or as Alternate Base Rate Borrowings. Interest applicable to Eurodollar Borrowings is based on the Adjusted LIBO Rate plus applicable margin of 2.50%. The Adjusted LIBO Rate is the rate appearing on Bloomberg screen LIBOR01 which gets reset at the beginning of each selected interest period based on the LIBOR rate then in effect. Interest applicable to ABR Borrowings is based on the Alternate Base Rate plus applicable margin of 1.50%. Alternate Base Rate is determined based on the highest of: (a) the federal funds effective rate plus 0.50%, (b) prime rate plus 1.00%, or (c) one-month LIBOR rate plus 1.00%. The Company’s obligations under the term loan are also guaranteed by BioStorage Technologies, Inc. as the guarantor, subject to the terms and conditions of the term loan agreement. The Company and the guarantor granted the lenders a perfected first priority security interest in substantially all of the assets of the Company and the guarantor to secure the repayment of the term loan. The term loan matures and becomes fully payable on October 4, 2024. The principal is payable in installments equal to 0.25% of the initial principal amount of the term loans on March 31st, June 30th, September 30th and December 31st of each year, commencing on March 31, 2018, with any remaining amount of principal becoming due and payable on the maturity date. All accrued and unpaid interest on Borrowings shall be due on the last day of each interest period elected by the Company for such Borrowings, except for interest periods of more than three months in which case all accrued and unpaid interest shall be due and payable every three months. Subject to certain conditions stated in the term loan agreement, the Company may redeem the term loan at any time at its option without a significant premium or penalty, except for a repricing transaction, as defined in the term loan agreement. The Company would be required to redeem the term loan at the principal amount then outstanding upon occurrence of certain events, including (i) net proceeds received from the sale or other disposition of the Company’s or guarantor’ assets, subject to certain limitations, (ii) casualty and condemnation proceeds received by the Company or the guarantor, subject to certain exceptions, (iii) net proceeds received by the Company or the guarantor from the issuance of debt or disqualified capital stock after October 4, 2017. Commencing on December 31, 2018, the Company is required to make principal payments equal to the excess cash flow amount, as defined in the term loan agreement. Such prepayments are equal to 50% of the preceding year excess cash flow amount reduced by voluntary prepayments of the term loan, subject to certain limitations. The Company records commitment fees and other costs directly associated with obtaining term loan financing as deferred financing costs which are presented as a reduction of the term loan principal balance. Such costs are accreted over the term of the loan using the effective interest rate method. At September 30, During the year ended September 30, 2018, the weighted average stated interest rate paid on the term loan was 4.4%. During the year ended September 30, 2018, the Company incurred aggregate interest expense of $9.1 million in connection with the term loan borrowings, including $0.4 million of deferred financing costs amortization. The term loan agreement contains certain customary representations and 84 The following are the future minimum principal payment obligations under the term loan as of September 30, 2018: The Amount Fiscal year ended September 30, 2019 $ 2,000 2020 2,000 2021 2,000 2022 2,000 2023 2,000 Thereafter 188,500 Total outstanding principal balance 198,500 Unamortized deferred financing costs (2,429) 196,071 Term loan, current portion 2,000 Term loan, long-term portion $ 194,071 As of September 30, 2018, estimated fair value of the term loan outstanding principal balance approximates its carrying value. The fair value On November 15, 2018, in connection with the closing of the 12. The components of the income tax provision (benefit) Year Ended September 30, 2018 2017 2016 Current income tax provision (benefit): Federal $ — $ — $ (145) State 917 402 (193) Foreign 7,608 7,499 4,709 Total current income tax provision 8,525 7,901 4,371 Deferred income tax provision (benefit): Federal (48,815) (4,247) 59,906 State (5,518) (249) 4,000 Foreign (1,443) (25) (2,027) Total deferred income tax provision (benefit) (55,776) (4,521) 61,879 Income tax provision (benefit) $ (47,251) $ 3,380 $ 66,250 The components of income (loss) from continuing operations before income taxes and equity in earnings Year Ended September 30, 2018 2017 2016 Domestic $ 3,122 $ (13,211) $ (26,775) Foreign 17,344 27,731 8,633 $ 20,466 $ 14,520 $ (18,142) 85 The differences between the income tax provision (benefit) on income (loss) from continuing operations including income from equity in earnings (losses) of equity method investments and income taxes computed using the applicable U.S. statutory federal tax Year Ended September 30, 2018 2017 2016 Income tax provision computed at federal statutory rate $ 5,014 $ 4,923 $ (6,722) State income taxes, net of federal benefit 692 137 (374) Foreign income taxed at different rates 920 (1,644) (690) Impact of investments in subsidiaries (729) (965) (971) Change in deferred tax asset valuation allowance (75,918) 319 76,486 Net increase (reduction) in uncertain tax positions 220 731 (1,543) Impact of U.S. federal tax rate change 15,287 — — Compensation (701) 579 743 Tax credits (1,633) (1,151) (1,555) Merger costs 1,405 — 503 Transition Tax 8,027 — — Other 165 451 373 Income tax provision (benefit) $ (47,251) $ 3,380 $ 66,250 The Company has not provided The significant components of the net deferred tax assets and liabilities as of September 30, September 30, 2018 2017 Accruals and reserves not currently deductible $ 14,581 $ 18,747 Federal, state and foreign tax credits 27,923 25,413 Other assets 175 42 Equity compensation 5,926 7,615 Net operating loss carryforwards 16,790 50,882 Inventory reserves and valuation 6,520 9,847 Deferred tax assets 71,915 112,546 Depreciation and intangible amortization (19,476) (21,200) Deferred tax liabilities (19,476) (21,200) Valuation allowance (18,581) (93,402) Net deferred tax asset (liability) $ 33,858 $ (2,056) The deferred tax assets on the balance sheet for September 30, 2018 also includes a $2.8 million deferred tax charge related to the company’s intercompany profit elimination. This amount is included in the net deferred tax asset recorded on the balance sheet. ASC Topic 740, Income Taxes, requires that all available evidence, both positive and negative, be considered in determining, based on the weight of 86 cumulative loss in recent years is considered a significant piece of negative evidence that is difficult to overcome in assessing the need for a valuation allowance. The Company evaluates the realizability of its deferred tax assets After evaluating all the relevant positive and negative evidence as of March 31, 2018, the Company concluded that it As of September 30, As of September 30, 2018, the Company had federal During the fiscal year 2018, the Tax Cuts and Jobs Act (“Tax Reform”) was enacted in the U.S., making significant tax law changes affecting the Company. The SEC issued Staff Accounting Bulletin 118 (“SAB 118”), which provided guidance for companies that had not completed the accounting for the income tax effects of Tax Reform. Under SAB 118, a company may report provisional amounts based on reasonable estimates where the accounting is incomplete. These amounts are subject to adjustments during a measurement period of up to one year beginning in the reporting period of the enactment date. Upon the enactment of Tax Reform, the Company is subject to a toll charge in the U.S. on its previously untaxed accumulated foreign earnings. The Company recorded a tax impact of $8.0 million, net of foreign tax credits, related to the toll charge during the fiscal year ended September 30, 2018. There are still incomplete components related to the accumulated foreign earnings and tax pools for older tax years that require additional time to analyze the data and complete the calculations. The Company will continue to refine these calculations through the quarter ended December 31, 2018 and continue to monitor legislative updates and clarifications and the related impact to the toll charge as recorded during the fiscal year 2018. The Company did not record any current cash U.S. federal tax provision for the toll charge because sufficient net operating loss The Company has performed studies to determine if there are any annual limitations on the federal net operating losses under the Section 382 of the Internal Revenue Code of 1986, as amended, or the Internal Revenue Code. As a result of these studies, the Company has determined that ownership changes have occurred primarily in connection with acquisitions when the Company has issued stock to the sellers, as well as ownership changes in the subsidiaries acquired by the Company. Certain limitations have been calculated, and the benefits of the net operating losses that will expire before utilization have not been recorded as deferred tax assets in the accompanying Consolidated Balance Sheets. The 87 consolidated liability for unrecognized income tax benefits during the fiscal years ended September 30, Total Balance at September 30, 2015 $ 2,191 Reductions from settlements with taxing authorities 4,165 Reductions from lapses in statutes of limitations (897) Foreign exchange rate adjustment (32) Balance at September 30, 2016 5,427 Additions for tax positions in current year 1,869 Reduction for tax positions in prior year (3,485) Net reductions from lapses in statutes of limitations (431) Foreign exchange rate adjustment (2) Balance at September 30, 2017 3,378 Additions for tax positions in current year 874 Reduction for tax positions in prior year (656) Reductions from lapses in statutes of limitations (353) Balance at September 30, 2018 $ 3,243 Included in the The Company is subject to U.S. federal income tax and In the normal course of business, the 13. Derivative Instruments The Company has transactions and balances denominated in currencies other than the U.S. dollar. Most of these transactions or balances are denominated in Euros, British Pounds and a variety of Asian currencies. These transactions and balances, including short-term advances between the Company and its subsidiaries, subject the Company’s operations to exposure from exchange rate fluctuations. The impact of currency exchange rate movement can be positive or negative in any period. The Company mitigates the impact of potential currency transaction gains and losses on short-term intercompany advances through timely settlement of each transaction, generally within 30 days. The Company also enters into foreign exchange contracts to reduce its exposure to currency fluctuations. Under forward contract arrangements, the Company typically agrees to purchase a fixed amount of one currency in exchange for a fixed amount of another currency on specified dates with maturities of three months or less. These transactions do not qualify for hedge accounting. Net gains and losses related to these contracts are recorded as a component of "Other 88 (expense) income, net" in the accompanying Consolidated Statements of Operations and are as follows for the fiscal years ended September 30, 2018, 2017 and 2016 (in thousands): Fiscal Year Ended September 30, 2018 2017 2016 Realized gains (losses) on derivatives not designated as hedging instruments $ (330) $ (545) $ 1,434 The fair value of derivative instruments are as follows at September 30, 2018 and 2017 (in thousands): Fair Value of Assets Fair Value of Liabilities As of September 30, 2018 2017 2018 2017 Derivatives not designated as hedging instruments Foreign exchange contracts $ $ 4 $ (177) $ (146) Total $ $ $ (177) $ (146) The fair values of the forward contracts described above are recorded in the Company’s accompanying Consolidated Balance Sheets as "Prepaid expenses and other current assets" and "Accrued expenses and other current liabilities". 14. Postretirement Benefits Defined Benefit Pension Plans The Company has 89 The Company uses September 30th as a measurement date to determine net periodic benefit costs, benefit obligations and the value of plan assets for all plans. The following tables set forth the funded status and amounts recognized in the Company’s Consolidated Balance Sheets as of September 30, September 30, 2018 2017 Benefit obligation at beginning of fiscal year $ 3,565 $ 6,444 Benefit obligation through acquisition 7,852 — Service cost 382 268 Interest cost 75 22 Actuarial loss (165) (601) Benefits paid (685) — Employee contributions 191 — Settlements paid — (2,526) Foreign currency translation (71) (42) Benefit obligation at end of fiscal year $ 11,144 $ 3,565 Fair value of assets at beginning of fiscal year $ 2,225 $ 4,532 Fair value of assets through acquisition 5,052 — Actual return on plan assets 69 55 Disbursements (685) (51) Employer contributions 266 153 Employee contributions 191 101 Settlements paid — (2,526) Foreign currency translation (40) (39) Fair value of assets at end of fiscal year $ 7,078 $ 2,225 Accrued benefit obligation $ 4,066 $ 1,340 The accumulated benefit obligation of the Plans is The following table provides pension-related amounts and their classification within the accompanying Consolidated Balance Sheets as of September 30, September 30, 2018 2017 Accrued compensation and benefits $ 431 $ 112 Long-term pension liability 3,635 1,228 $ 4,066 $ 1,340 The Company bases its determination of pension expense 90 The components of the Company’s net pension cost for the fiscal years ended September 30, Year Ended September 30, 2018 2017 2016 Service cost $ 382 $ 268 $ 546 Interest cost 75 22 66 Amortization of losses 5 7 1 Expected return on plan assets (66) (130) (156) Net periodic pension cost $ 396 $ 167 $ 457 Curtailment gain — — (227) Settlement (gain) loss — (259) — Total pension cost (gain) $ 396 $ (92) $ 230 The following changes in Plans’ assets and benefit obligations were recognized in other comprehensive income (loss) as of September 30, 2018 and 2017 (in thousands): September 30, 2018 2017 Net (gain) loss $ (191) $ (577) Amortization of net loss (7) (7) Curtailment gain — — Settlement gain — 259 Total recognized in other comprehensive income (loss) (198) (325) Total recognized in net periodic pension cost and other comprehensive income (loss) $ 593 $ 491 The settlement gain of $0.3 million realized during fiscal year ended September 30, 2017 was recorded as a reduction of accumulated other comprehensive income (loss) and the pension cost during the period then ended. The curtailment gain of $0.2 million incurred during fiscal years ended September 30, 2016 was reclassified from accumulated other comprehensive income (loss) into the results of operations during fiscal year 2016. Additionally, a curtailment gain of $1.1 million was recognized as a reclassification from accumulated other comprehensive income and a corresponding reduction in pension liabilities during fiscal year ended September 30, 2016. Please refer to Note 15, "Stockholders’ Equity", for further information on these reclassifications and their impact on the accumulated other comprehensive income and other comprehensive income during each fiscal year. Weighted-average assumptions used to determine the projected benefit obligation for the fiscal years ended September 30, 2018, 2017 and 2016 are as follows: Year Ended September 30, 2018 2017 2016 Discount rate % % % Expected return on plan assets % % % Expected rate of compensation increases % % % In selecting the appropriate discount rates for the Plans, the Company Plan Assets The fair value of plan assets for the 91 does not have any rights or an investment authority over the The assets of the Taiwan Plan are invested with a trustee selected by the Taiwan government, and the Company has no investment authority over the The allocation of the September 30, 2018 Cash and cash equivalents 3 % Debt securities 69 Equity securities 6 Other 22 100 % The fair values of pension assets by asset category and by level at September 30, As of September 30, 2018 Level 1 Level 2 Level 3 Total Swiss Life collective foundation $ — $ 6,754 $ — $ 6,754 Taiwan collective trust — 324 — 324 Total $ — $ 7,078 $ — $ 7,078 The fair values of pension assets by asset category and by level at September 30, As of September 30, 2017 Level 1 Level 2 Level 3 Total Swiss Life collective foundation $ — $ 1,886 $ — $ 1,886 Taiwan collective trust — 339 — 339 Total $ — $ 2,225 $ — $ 2,225 Please refer to Note Benefit payments expected to be paid over the next five fiscal years and thereafter are as follows (in thousands): Fiscal year ended September 30, 2019 $ 2020 2021 2022 2023 Thereafter The Company expects to contribute $0.3 million to the Plans in fiscal year Defined Contribution Plans The Company sponsors a defined contribution plan that meets the requirements of Section 401(k) of the Internal Revenue Code. All United States employees who meet minimum age and service requirements are eligible to participate in the plans. The plans allow employees to invest, on a pre-tax basis, a percentage of their annual salary and bonus subject to statutory limitations. The Company matches a portion of their contributions on a pre-tax basis up to a maximum amount of 4.5% of deferred pay. The expense recognized for the defined contribution plans was $3.4 million, $3.0 million 92 15. Stockholders’ Equity Preferred Stock Total number of shares of preferred stock authorized for issuance was 1,000,000 shares at September 30, Accumulated Other Comprehensive Income The following is a summary of the components of accumulated other comprehensive income, net of tax, at September 30, Unrealized Gains (Losses) Currency on Available- Pension Translation for-Sale Liability Adjustments Securities Adjustments Total Balance at September 30, 2015 $ 6,545 $ 103 $ (750) $ 5,898 Other comprehensive (loss) income before reclassifications 8,844 (231) (322) 8,291 Amounts reclassified from accumulated other comprehensive income — 125 852 977 Balance at September 30, 2016 15,389 (3) (220) 15,166 Other comprehensive income (loss) before reclassifications (221) (10) 514 283 Amounts reclassified from accumulated other comprehensive income — 12 (248) (236) Balance at September 30, 2017 15,168 (1) 46 15,213 Other comprehensive (loss) income before reclassifications (1,651) (110) 124 (1,637) Amounts reclassified from accumulated other comprehensive income — (1) 12 11 Balance at September 30, 2018 $ 13,517 $ (112) $ 182 $ 13,587 Unrealized net holding gains (losses) on available-for-sale marketable securities are reclassified from accumulated other comprehensive income 16. Equity Incentive Plans The 2015 Equity Incentive Plan In accordance with the 93 of the Company, independent directors, consultants and advisors are eligible to participate in the 2015 Plan. The 2015 Plan provides for the issuance of a maximum of 5,000,000 shares of common stock in addition to the stock option and restricted stock awards granted out of the 2000 Plan that were canceled or forfeited after February 5, Restricted Stock Activity The following table summarizes restricted stock unit activity for the fiscal year ended September 30, Weighted Average Grant-Date Shares Fair Value Outstanding at September 30, 2017 2,474,011 $ 12.34 Granted 535,289 33.28 Vested (732,356) 12.78 Forfeited (82,432) 16.51 Outstanding at September 30, 2018 2,194,512 $ 17.20 The weighted average grant date fair value of restricted stock units granted during fiscal years As of September 30, The Company grants restricted stock units that vest over a required service period and Time-Based Performance- Total Units Units Stock Grants Based Units Year ended September 30, 2018 535,289 213,893 36,774 Year ended September 30, 2017 1,018,570 386,713 43,519 Year ended September 30, 2016 1,690,582 744,250 86,082 Among the total restricted stock units granted, 134,993, 124,124, and 109,876 shares, respectively, were granted to the employees who belong to the discontinued operations in the year ended September 30, 2018, 2017 and 2016. As of November 7, 2018, only 61,000 shares granted to these employees were not vested and expected to be vested upon the closing of the Disposition. Time-Based Grants Restricted stock units granted with a required service period typically have 94 The Restricted stock awards granted during fiscal year 2018 and 2017 are subject to a one-year vesting period. Restricted stock awards granted during fiscal years 2016 vested Certain members of the Board of Directors have elected to defer receiving their annual awards of restricted stock units and related quarterly dividends until they attain a certain age or cease to provide services as the Company’s Board members. Annual restricted stock units granted during fiscal years 2018 and 2017 are subject to a one-year vesting period. Annual restricted stock units granted during fiscal year 2016 vested on the grant date upon issuance. Performance-Based Grants Performance-based restricted stock units are earned based on the achievement of performance criteria established by the Performance-based awards granted in fiscal Employee Stock Purchase Plan The Company maintains an 17. Restructuring and Other Charges Fiscal Year During fiscal year 2018, the Company incurred restructuring charges of $0.7 million, primarily related to the planned closure of its Denmark facility and reduction in force at Tec-Sem. During the fourth quarter of fiscal year 2018, the Company initiated an action to consolidate the operations at its Denmark facility into its operations at its Manchester, UK facility to eliminate cost redundancies. The $0.3 million charge resulted from the Denmark action was related to Brooks Life Sciences segment. During the fourth quarter of fiscal year 2018, the Company also initiated a post-acquisition reduction in force plan at Tec-Sem to maximize synergies with the Company’s existing infrastructure. The $0.3 million charge resulted from the Tec-Sem action was related to the Brooks Semiconductor Solutions Group segment. 95 During fiscal year 2017, the Company recorded restructuring charges of $3.1 million related to severance, including $2.5 million attributable to the Brooks Semiconductor Solutions Group segment, $0.4 million attributable to the Brooks Life Sciences segment and $0.3 million attributable to the company-wide restructuring action. The restructuring charges in the Brooks Semiconductor Solutions Group segment consisted of $1.5 million of charges related to the actions initiated during fiscal year 2017 to streamline field service operations and optimize the cost structure and improve productivity, and $1.0 million of charges related to the actions initiated prior to fiscal year 2017 primarily related to consolidate the Jena, Germany repair facility into the Chelmsford, Massachusetts repair operation. Restructuring charges of $0.3 million were related to the company-wide restructuring action initiated in fiscal year 2016 to streamline business operations, improve competitiveness and overall profitability. Fiscal Year 2016 Activities The Company recorded restructuring charges of The Company’s charges from restructuring actions initiated during fiscal year 2016 consisted of: (i) $3.1 million attributable to The Company’s charges from restructuring actions initiated in The following is a summary of activity related to the Company’s restructuring and other charges, excluding amounts related to the discontinued operations, for the fiscal years ended September 30, Activity - Year Ended September 30, 2018 Balance Balance September 30, September 30, 2017 Expenses Payments 2018 Total restructuring liabilities related to workforce termination benefits $ 1,708 $ 714 $ (1,763) $ 659 Activity - Year Ended September 30, 2017 Balance Balance September 30, September 30, 2016 Expenses Payments 2017 Total restructuring liabilities related to workforce termination benefits $ 5,939 3,144 (7,375) 1,708 Activity - Year Ended September 30, 2016 Balance Balance September 30, September 30, 2015 Expenses Payments 2016 Facility and other contract termination costs $ 433 $ 25 $ (458) $ — Workforce-related termination benefits 1,640 10,185 (5,886) 5,939 Total restructuring liabilities $ 2,073 $ 10,210 $ (6,344) $ 5,939 96 Accrued restructuring costs of 18. Earnings per Share The calculations of basic and diluted net income (loss) per share and basic and diluted weighted average shares outstanding are as follows for the fiscal years ended September 30, 2018, 2017 and 2016 (in thousands, except per share data): Year Ended September 30, 2018 2017 2016 Income (loss) income from continuing operations $ 67,717 $ 10,687 $ (85,457) Income from discontinued operations, net of tax 48,747 51,925 15,981 Net income 116,464 62,612 (69,476) Net loss attributable to noncontrolling interest 111 — — Net income (loss) attributable to Brooks Automation, Inc. $ 116,575 $ 62,612 $ (69,476) Weighted average common shares outstanding used in computing basic earnings per share 70,489 69,575 68,507 Dilutive restricted stock units 448 910 — Weighted average common shares outstanding used in computing diluted earnings per share 70,937 70,485 68,507 Basic net income (loss) per share attributable to Brooks Automation, Inc. common stockholders: Income (loss) from continuing operations $ 0.96 $ 0.15 $ (1.25) Income from discontinued operations, net of tax 0.69 0.75 0.23 Basic net income (loss) per share attributable to Brooks Automation, Inc. $ 1.65 $ 0.90 $ (1.01) Diluted net income (loss) per share attributable to Brooks Automation, Inc. common stockholders: Income (loss) from continuing operations $ 0.95 $ 0.15 $ (1.25) Income from discontinued operations, net of tax 0.69 0.74 0.23 Diluted net income (loss) per share attributable to Brooks Automation, Inc. common stockholders $ 1.64 $ 0.89 $ (1.01) Restricted stock units of 9,927 and 9,500, respectively during fiscal year 2018 and 2017 were excluded from the computation of diluted earnings per share as their effect would be anti-dilutive based on the treasury stock method. Restricted stock units of 859,000 during fiscal year 2016 were excluded from the computation of diluted earnings per share as a result of a net loss incurred during the period. 19. Significant Customers No customers accounted for more than 10% of the Company’s consolidated revenue during the fiscal years ended September 30, 2018, 2017 and 2016. Operating segments are defined as components of an enterprise that engage in business activities for which discrete financial information is available and regularly reviewed by the chief operating decision maker in deciding how to allocate resources and to assess performance. The Company’s Chief Executive Officer is the 97 The Company The Brooks The Brooks Life The Company evaluates the performance and future opportunities of its segments and allocates resources to them based on their revenue, operating income (loss) and returns on invested assets. Operating income (loss) for each segment includes selling, general and administrative expenses directly attributable to the segment. Amortization of acquired intangible assets (excluding completed technology), restructuring and other charges, pension settlement, in-process research and development, 98 The following is the summary of the financial information for the Company’s operating and reportable segments Brooks Semiconductor Brooks Solutions Group Life Sciences Total Fiscal Year Ended September 30, 2018 Revenue Products $ 390,087 $ 92,302 $ 482,389 Services 44,931 104,240 149,171 Segment revenue $ 435,018 $ 196,542 $ 631,560 Gross profit $ 173,954 $ 72,127 $ 246,081 Segment operating income 58,373 1,160 59,533 Depreciation expense 3,869 7,433 11,302 Fiscal Year Ended September 30, 2017 Revenue Products $ 340,233 $ 66,753 $ 406,986 Services 38,557 81,956 120,513 Segment revenue $ 378,790 $ 148,709 $ 527,499 Gross profit $ 144,119 $ 54,768 $ 198,887 Segment operating income 40,110 1,410 41,520 Depreciation expense 4,592 4,694 9,286 Fiscal Year Ended September 30, 2016 Revenue Products $ 289,377 $ 46,546 $ 335,923 Services 36,522 61,567 98,089 Segment revenue $ 325,899 $ 108,113 $ 434,012 Gross profit $ 117,626 $ 39,063 $ 156,689 Segment operating income (loss) 16,634 (6,451) 10,183 Depreciation expense 5,158 3,496 8,654 Assets: September 30, 2018 $ 264,452 $ 410,581 $ 675,033 September 30, 2017 236,755 306,666 543,421 The following is a reconciliation of the Company’s operating and reportable For the Year Ended September 30, 2018 2017 2016 Segment operating income $ 59,533 $ 41,520 $ 10,183 Amortization of acquired intangible assets 19,339 13,228 10,799 Restructuring charges 714 3,144 10,210 Other unallocated corporate expenses 8,071 10,829 6,228 Total operating income $ 31,409 $ 14,319 $ (17,054) 99 September 30, September 30, 2018 2017 Segment assets $ 675,033 $ 543,421 Cash, cash equivalents and marketable securities 251,226 104,292 Deferred tax assets 43,798 1,692 Assets held for sale 125,200 117,223 Total assets $ 1,095,257 $ 766,628 Revenue from external customers is attributed to geographic areas based on locations in which customer orders are placed. Net revenue by geographic area for the fiscal years ended September 30, Year Ended September 30, 2018 2017 2016 North America $ 233,243 $ 174,432 $ 157,426 Asia / Pacific/ Other 262,706 255,825 196,117 Europe: United Kingdom 51,690 37,283 31,342 Rest of Europe 83,921 59,959 49,127 $ 631,560 $ 527,499 $ 434,012 The majority of The geographic location of an OEM is not indicative of where the products will eventually be used. The geographic area for the orders is determined by the onward sale of an OEM system which incorporates the sub-systems and/or components. Property, plant and equipment by geographic area as of September 30, September 30, 2018 2017 North America $ 50,614 $ 50,908 Asia / Pacific/ Other 492 547 Europe: United Kingdom 5,494 2,848 Rest of Europe 3,388 2,678 $ 59,988 $ 56,981 Property, plant and 21. Fair Value Measurements The Level 1 Inputs: Quoted prices in active markets for 100 Level 2 Inputs: Observable inputs other than prices included in Level 1, including quoted prices for similar assets or liabilities; quoted prices in markets that are not active; or other inputs that are observable or can be corroborated by observable market data for substantially the Level 3 Inputs: Unobservable inputs that are significant to the The Financial Assets and The following tables summarize assets and Fair Value Measurements at Reporting Date Using Quoted Prices in Significant Active Markets for Significant Other Unobservable September 30, Identical Assets Observable Inputs Inputs Description 2018 (Level 1) (Level 2) (Level 3) Assets: Cash equivalents $ 50,572 $ 50,572 $ — $ — Available-for-sale securities 53,518 — 53,518 — Foreign exchange contracts 170 — 170 — Total Assets $ 104,260 $ 50,572 $ 53,688 $ — Liabilities: Foreign exchange contracts 177 — 177 — Term loan 196,071 — 196,071 — Total Liabilities $ 196,248 $ — $ 196,248 $ — Fair Value Measurements at Reporting Date Using Quoted Prices in Significant Active Markets for Significant Other Unobservable September 30, Identical Assets Observable Inputs Inputs Description 2017 (Level 1) (Level 2) (Level 3) Assets: Cash equivalents $ 45 $ 42 $ 3 $ — Available-for-sale securities 2,670 — 2,670 — Foreign exchange contracts 4 — 4 — Total Assets $ 2,719 $ 42 $ 2,677 $ — Liabilities: Foreign exchange contracts 146 — 146 — Total Liabilities $ 146 $ — $ 146 $ — Cash Equivalents Cash equivalents of $50.6 million and less than $0.1 million, respectively, at September 30, 2018 and 2017 consist of money market funds and are classified within Level 1 of the 101 Available-For-Sale Securities Available-for-sale securities of $53.5 million and $2.7 million, respectively, at September 30, 2018 and 2017 consist of U.S. Treasury Securities, Municipal Securities, Bank Certificate of Deposits, U.S Corporate Securities and Other Debt Securities. The securities are valued using matrix pricing and benchmarking and classified within Level 2 of the fair value hierarchy because they are not actively traded. Matrix pricing is a mathematical technique used to value securities by relying on the Foreign Exchange Contracts Foreign exchange contract assets and liabilities amounted to $0.2 million each at September 30, 2018. Foreign exchange contract assets and liabilities amounted to less than $0.1 million and $0.1 million, respectively, at September 30, Term Loan Financial Assets and Liabilities Measured at Fair Value on a Nonrecurring Basis During fiscal year 2018 and 2017, the Company did not record any material other-than-temporary impairments on financial assets required to be measured at fair value on a nonrecurring basis. 22. Commitments and Contingencies Operating Leases Commitments The Company leases manufacturing and office facilities and certain equipment under non-cancelable operating leases Future minimum lease commitments on non-cancelable operating leases and scheduled sublease payments as of September 30, Scheduled Gross Sublease Net Year Ended September 30, Payments Payments Payments 2019 $ 3,842 9 3,833 2020 2,377 — 2,377 2021 1,545 — 1,545 2022 1,370 — 1,370 2023 1,251 — 1,251 Thereafter 1,847 — 1,847 $ 12,232 $ 9 $ 12,223 Letters of Credit At September 30, 102 expiration date of the particular letter of credit if the Company fails to meet certain contractual requirements. None of these obligations were called Purchase Commitments The Company has non-cancelable contracts and purchase orders for inventory of Contingencies The Company is subject to various legal proceedings, both asserted and unasserted, that arise in the ordinary course of business. The Company cannot predict the ultimate outcome of such legal proceedings or in certain instances provide reasonable ranges of potential losses. However, as of the date of this report, the Company believes that none of these claims will have a material adverse effect on its consolidated financial position or results of operations. In the event of unexpected subsequent developments and given the inherent unpredictability of these legal proceedings, there can be no assurance that the 23. Subsequent Events Acquisition On September 26, 2018, the Company entered into a definitive agreement to acquire GENEWIZ, a leading provider of genomic services, based in New Jersey with operations throughout the United States, Asia, and Europe, for $450.0 million in cash, subject to customary adjustments. The Company completed this acquisition on November 15, 2018. Term Loan Modification On November Dividend On November 103 Item 9. Changes in and Disagreements with Accountants on Financial Accounting and Financial Disclosure Not applicable. Item 9A. Controls and Procedures Evaluation of Disclosure Controls and Procedures Under the supervision and with the participation of our management, including our chief executive officer and chief financial officer, we conducted an evaluation of our disclosure controls and procedures, as such term is defined under Rule Management’s Report on Internal Control Over Financial Reporting Our management is responsible for establishing and maintaining adequate internal control over financial reporting. Internal control over financial reporting is defined in Rules · pertain to the maintenance of records that in reasonable detail accurately and fairly reflect the transactions and disposition of our assets; · provide reasonable assurance that transactions are recorded as necessary to permit preparation of financial statements in accordance with GAAP, and that our receipts and expenditures are being made only in accordance with authorization of our management and directors; and · provide reasonable assurance regarding prevention or timely detection of unauthorized acquisition, use or disposition of our assets that could have a material effect on the financial statements. Because of its inherent limitations, internal control over financial reporting may not prevent or detect misstatements. Projections of any evaluation of effectiveness to future periods are subject to the risks that controls may become inadequate because of changes in conditions, or that the degree of compliance with the policies or procedures may deteriorate. Under the supervision and with the participation of our management, including our chief executive officer and chief financial officer, we conducted an assessment of the effectiveness of our internal control over financial reporting as of September 30, We excluded 4Titude and 104 The effectiveness of our internal control over financial reporting as of September 30, Changes in Internal Control Over Financial Reporting There were no changes in internal control over financial reporting during the fiscal fourth quarter ended September 30, Item 9B. Other Information None. Item 10. Directors, Executive Officers and Corporate Governance The information required by this Item 10 is contained in our definitive proxy statement for our Item 11. Executive Compensation The information required by this Item 11 is contained under the caption "Corporate Governance and Director Compensation" and "Executive Officers" in the Item 12. Security Ownership of Certain Beneficial Owners and Management and Related Stockholder Matters The information required by this Item 12 is contained under the caption "General Information-Security Ownership of Certain Beneficial Owners" and "Equity Compensation Plan Information" in the Item 13. Certain Relationships and Related Transactions, and Director Independence The information required by this Item 13 is contained under the caption "Related Party Transactions" and "Corporate Governance and Director Compensation" in the Item 14. Principal Accountant Fees and Services The information required by this Item 14 is contained under the caption "Independent Auditor Fees and Other Matters" in the 105 PART IV Item 15. Exhibits and Financial Statement Schedules (a)Financial Statements and Financial Statement Schedules · Consolidated Financial Statements of the Company and the related notes are included under Part II, Item 8, "Financial Statements and Supplementary Data" of this Form 10‑K. · Consolidated Financial Statements of ULVAC Cryogenics, Inc. as of as of June 30, 2018 and 2017 and for each of the periods ended June 30, 2018, 2017 and 2016 and the related notes are filed as Exhibit 99.2 hereto and incorporated herein by reference in this Form 10‑K pursuant to Rule 3‑09 of Regulation S-X. · Other financial statement schedules are omitted because of the absence of conditions under which they are required or because the required information is given in the supplementary Consolidated Financial Statements or notes thereto. (b)Exhibits Exhibit Description 3.01 3.02 3.03 4.01 10.01 Basic agreement between the Company and Ulvac Corporation dated August 17, 1981 (incorporated herein by reference to Exhibit 10.13 of the registration statement on Form 10.02 10.03 10.04 10.05 106 10.06 10.07 10.08 10.09 10.10 10.11 10.12 10.13 10.14 10.15 10.16 10.17 10.18 10.19 10.20 107 10.21 10.22 10.23 10.24 10.25 10.26 10.27 10.28 10.29 21.01 23.01 23.02 31.01 31.02 108 32 99.1 99.2 101 The following material from the 109 SIGNATURES Pursuant to the requirements of Section 13 or 15(d) of the Securities Exchange Act of 1934, the registrant has duly caused this report to be signed on its behalf by the undersigned, thereunto duly authorized. BROOKS AUTOMATION, INC. By: /S/ STEPHEN S. SCHWARTZ Stephen S. Schwartz Date: November Pursuant to the requirements of the Securities Exchange Act of 1934, this report has been signed below by the following persons on behalf of the registrant and in the capacities and on the dates indicated. Signature Title Date /S/ STEPHEN S. SCHWARTZ Director and Chief Executive Officer (Principal Executive Officer) November 29, 2018 Stephen S. Schwartz /S/ Executive Vice President and Chief Financial Officer (Principal Financial Officer) November 29, 2018 Lindon G. Robertson /S/ Vice President - Finance and Corporate Controller (Principal Accounting Officer) November 29, 2018 David Pietrantoni /S/ A. CLINTON ALLEN Director November 29, 2018 A. Clinton Allen /S/ Director November Robyn C. Davis / Director November Joseph R. Martin / Director November John K. McGillicuddy / Director November Krishna G. Palepu / Director November Kirk P. Pond / Director November Michael Rosenblatt 110Item 3.Legal Proceedings17Item 4.Mine Safety DisclosuresNot applicable.Item 5.Market for Registrant's Common Equity, Related Stockholder Matters and Issuer Purchases of Equity SecuritiesNASDAQNasdaq Stock Market LLC under the symbol “BRKS.” The following table sets forth the high and low intraday sales prices per share of our common stock as reported by the NASDAQNasdaq Stock Market LLC and the cash dividends declared per common share for the periods indicated: Market Price High Low Fiscal year ended September 30, 2015 First quarter $ 13.02 $ 9.87 $ 0.10 Second quarter 13.37 11.43 0.10 Third quarter 12.36 10.76 0.10 Fourth quarter 11.74 9.71 0.10 Fiscal year ended September 30, 2014 First quarter $ 10.75 $ 9.01 $ 0.08 Second quarter 11.64 9.43 0.08 Third quarter 11.50 8.75 0.08 Fourth quarter 11.53 9.86 0.10 October 30, 2015,November 9, 2018, there were 615535 holders of record of our common stock.4, 2015,6, 2018, our Board of Directors approved a cash dividend of $0.10 per share payable on December 22, 201520, 2018 to common stockholders of record on December 4, 2015.182010,2013, and plotted at the last trading day of each of the fiscal years ended September 30, 2011, 2012, 2013, 2014, 2015, 2016, 2017 and 2015,2018, in each of (i) our Common Stock; (ii) the NASDAQ/Nasdaq/NYSE MKT/NYSE Index of companies; and (iii) a peer group for the fiscal year ended September 30, 2018 (“Current Peer Group”), and (iv) a peer group for the fiscal year ended September 30, 2016 (“Prior Peer Group”).of:of Advanced Energy Industries, Inc., Axcelis Technologies Inc., Bio Rad Laboratories Inc., Bruker Corp., Cabot Microelectronics Corp., Coherent Inc., Entegris, Inc., Formfactor Inc., Haemonetics Corp., MKS Instruments, Inc., MTS Instruments, Inc., Novanta Inc., Rudolph Technologies Inc., Ultra Clean Holdings, Inc., Varex Imaging Corp. and Veeco Instruments Inc. The Prior Peer Group is comprised of Advanced Energy Industries, Inc., Bruker Corp., Entegris, Inc., FEI Company, Formfactor Inc., MKS Instruments, Inc., Photronics, Inc., Teradyne Inc., Ultra Clean Technology,Holdings, Inc., Veeco Instruments Inc. and Xcerra Corp. The Current Peer Group was expanded to include life sciences companies due to the growing percentage of our revenue from the Brooks Life Sciences segment.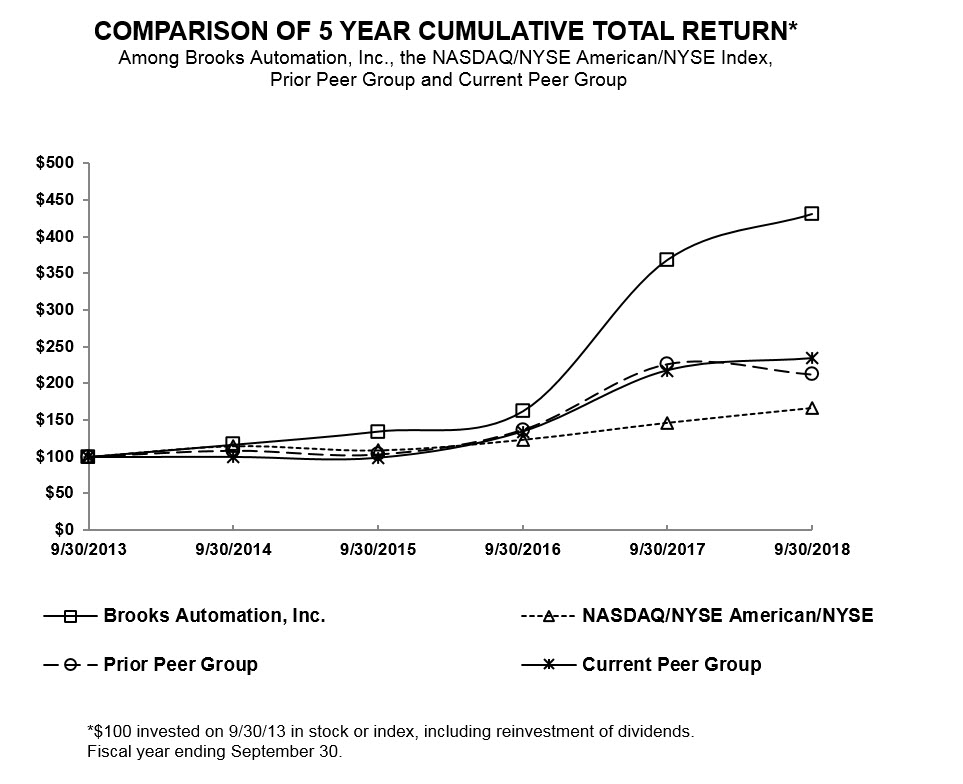
COMPARISON OF 5 YEAR CUMULATIVE TOTAL RETURN*Among Brooks Automation, Inc., the NASDAQ/NYSE MKT/NYSE Index,and a Peer Group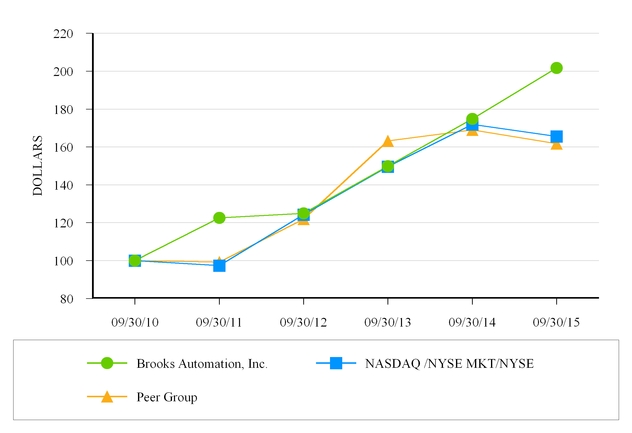
* $100 invested on September 30, 2010 in stock or index, including reinvestment of dividends. 9/30/10 9/30/11 9/30/12 9/30/13 9/30/14 9/30/15 Brooks Automation, Inc. $ 100.00 $ 122.55 $ 124.88 $ 149.83 $ 174.75 $ 201.65 NASDAQ/NYSE MKT/NYSE 100.00 97.43 124.31 149.54 171.96 165.51 Peer Group 100.00 99.24 121.88 163.22 169.00 161.71 Unregistered Sales of SecuritiesNot applicable.Issuer'sAs part of our equity compensation program, we offer recipients of restricted stock awards the opportunity to elect to sell their shares at the time of vesting to satisfy tax obligations in connection with such vesting. The following table provides19information concerning shares of our Common Stock, $0.01 par value, purchased in connection with the forfeiture of shares to satisfy the employees' obligations with respect to withholding taxes in connection with the vesting of certain shares of restricted stock during the three months ended September 30, 2015. Upon purchase, these shares are immediately retired. Period July 1 - 31, 2015 — $ — — $ — August 1 - 31, 2015 369 10.87 369 — September 1 - 30, 2015 — — — — Total 369 $ 10.87 369 $ — $50$50.0 million worth of our common stock. The timing and amount of any shares to be repurchased areunder this program will be based on market and business conditions, legal requirements and other factors and may be commenced or suspended at any time at our discretion. There were no shares repurchased under this program during fiscal year 2015.ended September 30, 2018.Item 6.Selected Financial Dataconsolidated financial statementsConsolidated Financial Statements and notes thereto and “Management’s Discussion and Analysis of Financial Condition and Results of Operations,” appearing elsewhere in this report.251,227 104,292 Year Ended September 30, 2013(4)(6)(7) 2011(4)(11)(12) (In thousands, except per share data) Revenue $ 552,708 $ 482,848 $ 422,440 $ 488,983 $ 653,299 Gross profit $ 189,105 $ 167,337 $ 132,307 $ 159,453 $ 207,012 Operating income (loss) $ 16,890 $ (2,699 ) $ (16,798 ) $ 1,642 $ 70,301 Income (loss) from continuing operations $ 14,221 $ 1,520 $ (7,114 ) $ 131,835 $ 121,141 Income from discontinued operations, net of tax $ — $ 30,002 $ 4,964 $ 5,000 $ 9,296 Net income (loss) attributable to Brooks Automation, Inc. $ 14,221 $ 31,361 $ (2,215 ) $ 136,789 $ 130,385 Basic net income (loss) per share attributable to Brooks Automation, Inc. common stockholders: Income (loss) from continuing operations $ 0.21 $ 0.02 $ (0.11 ) $ 2.02 $ 1.88 Income from discontinued operations, net of tax — 0.45 0.08 0.08 0.14 Basic net income (loss) per share attributable to Brooks Automation, Inc. $ 0.21 $ 0.47 $ (0.03 ) $ 2.10 $ 2.02 Diluted net income (loss) per share attributable to Brooks Automation, Inc. common stockholders: Income (loss) from continuing operations $ 0.21 $ 0.02 $ (0.11 ) $ 2.01 $ 1.86 Income from discontinued operations, net of tax — 0.44 0.08 0.08 0.14 Diluted net income (loss) per share attributable to Brooks Automation, Inc. $ 0.21 $ 0.46 $ (0.03 ) $ 2.08 $ 2.01 Dividend declared per share $ 0.40 $ 0.34 $ 0.32 $ 0.32 $ 0.08 20 As of September 30, 2015 2014 2013 2012 2011 (In thousands) Cash and cash equivalents and marketable securities $ 214,030 $ 245,456 $ 173,362 $ 200,231 $ 205,818 $ 105,583 $ 98,228 $ 105,511 $ 121,709 $ 95,579 Total assets $ 759,654 $ 778,038 $ 736,763 $ 741,960 $ 636,958 Total capital lease obligation $ — $ 8,298 $ — $ — $ — Total equity $ 632,045 $ 642,889 $ 632,656 $ 649,301 $ 518,936 Year Ended September 30, 2015 (In thousands, except per share data) Revenue $ 122,736 $ 139,313 $ 144,894 $ 145,765 Gross profit $ 39,088 $ 46,025 $ 51,187 $ 52,805 Operating income (loss) $ (6,480 ) $ 3,053 $ 10,170 $ 10,147 Net income (loss) $ (2,734 ) $ 2,711 $ 7,681 $ 6,563 Basic net income (loss) per share $ (0.04 ) $ 0.04 $ 0.11 $ 0.10 Diluted net income (loss) per share $ (0.04 ) $ 0.04 $ 0.11 $ 0.10 Year Ended September 30, 2014 (In thousands, except per share data) Revenue $ 117,072 $ 125,900 $ 117,359 $ 122,517 Gross profit $ 40,891 $ 44,298 $ 40,746 $ 41,402 Operating income (loss) $ 1,458 $ 2,396 $ (5,910 ) $ (643 ) Income (loss) from continuing operations $ 1,919 $ 2,103 $ (2,764 ) $ 262 Income from discontinued operations, net of tax $ 1,577 $ 1,162 $ 27,263 $ — Net income attributable to Brooks Automation, Inc. $ 3,448 $ 3,189 $ 24,476 $ 248 Basic net income per share attributable to Brooks Automation, Inc. common stockholders: Income (loss) from continuing operations $ 0.03 $ 0.03 $ (0.04 ) $ 0.00 Income from discontinued operations, net of tax 0.02 0.02 0.41 — Basic net income per share attributable to Brooks Automation, Inc. $ 0.05 $ 0.05 $ 0.37 $ 0.00 Diluted net income per share attributable to Brooks Automation, Inc. common stockholders: Income (loss) from continuing operations $ 0.03 $ 0.03 $ (0.04 ) $ 0.00 Income from discontinued operations, net of tax 0.02 0.02 0.40 — Diluted net income per share attributable to Brooks Automation, Inc. $ 0.05 $ 0.05 $ 0.36 $ 0.00 (1)acquired Contact Co., Ltd., or Contact,make acquisitions frequently and includes the operation results from these acquisitions in August 2015. The results of Contact have been included in ourthe results of operations from the datedates of acquisition.the acquisitions. Please refer to Note 4, “Acquisitions” to our consolidated financial statements included under "Item 8.Consolidated Financial Statements and Supplementary Data" of this Form 10-K for additional information regarding this transaction.information.statements21included under "Item 8. Financial Statements and Supplementary Data" of this Form 10-K for additional information regarding this transaction.(3)We acquired Dynamic Micro Systems Semiconductor Equipment GmbH, or DMS, in April 2014. The results of DMSdata presented for current period and prior periods have been included in our results of operations fromrevised to reflect the date of acquisition.discontinued operation classification. Please refer to Note 4, “Acquisitions”3, “Discontinued Operations” to our consolidated financial statements included under "Item 8. Financial Statements and Supplementary Data" of this Form 10-K for additional information regarding this transaction.information.(4)Granville-Phillips, business unit for $87.0 million in cash.Granville-Phillips. In the second quarter of fiscal year 2014, we determined that the Granville-Phillips business met the criteria of being reported as a discontinued operation. As a result, the selected financial data presented for periods prior to the second quarter of fiscal year 2014 has been revised to present the operating results of the Granville-Phillips business as a discontinued operation. Please refer to Note 3, “Discontinued Operations” to our consolidated financial statements included under "Item 8. Financial Statements and Supplementary Data" of this Form 10-K for additional information regarding this transaction.(5)We completed the sale of the Granville-Phillips business in May 2014. We realizedpre-tax gain of $56.8 million and an after-tax gain of $26.9 million in connection with the sale. The tax charge of $29.9 million on the gain is substantially non-cash as it was offset by our net operating losses in the United States.(6)We acquired certain assets and assumed certain liabilities of Matrical, Inc.’s life science businesses, collectively referred to as Matrical, in August 2013. The results of Matrical have been included in our results of operations from the date of acquisition. Please refer to Note 4, “Acquisitions” to our consolidated financial statements included under "Item 8. Financial Statements and Supplementary Data" of this Form 10-K for additional information regarding this transaction.(7)We acquired Crossing Automation Inc., or Crossing, in October 2012. The results of Crossing have been included in our results of operations from the date of acquisition. Please refer to Note 4, “Acquisitions” to our consolidated financial statements included under "Item 8. Financial Statements and Supplementary Data" of this Form 10-K for additional information regarding this transaction.(8)We acquired the Celigo® product line in December 2011. The results from the Celigo® product line were included in our results of operations from the date of acquisition through March 2014, when we completed the sale of this product line.(9)Income (loss) from continuing operations and net income (loss) attributable to Brooks Automation, Inc. includes a $121.8 million deferred income tax benefit in connection with a reversal of a majority of the valuation allowance against our net deferred tax assets.(10)Income (loss) from continuing operations and net income (loss) attributable to Brooks Automation, Inc. includes an $8.9 million charge in connection with the settlementgeneral description of our U.S. defined benefit pension plan.(11)We acquired RTS Life Science Limited, or RTS, in April 2011business and Nexus Biosystems, Inc., or Nexus, in July 2011. The results of RTS and Nexus have been included in our results of operations from the date of each acquisition.(12)On June 28, 2011, we disposed of our contract manufacturing business that did not qualify as discontinued operations because of the significance of the ongoing commercial arrangements between us and the buyer. As such, the operations prior to the divestiture are included in our results of operations. Income (loss) from continuing operations and net income (loss) attributable to Brooks Automation, Inc. includes a $45.0 million pre-tax gain on the sale of our contract manufacturing business.(13)The calculation of working capital excludes "Cash and cash equivalents", "Marketable securities", "Assets Held for Sale",operating segments, recent developments, as well as assetsa brief discussion and liabilities identifiable within the Granville-Phillipsoverall analysis of our business reported as “Assets held for sale” and “Liabilities held for sale,” respectively, in the Consolidated Balance Sheets as offinancial performance, including key developments affecting us during fiscal years ended September 30, 2013.2018, 2017 and 2016.Item 7.Management’s Discussion and Analysis of Financial Condition and OperationsOperations. This section provides an analysis of our financial results for the fiscal year ended September 30, 2018 compared to the fiscal year ended September 30, 2017 and for the fiscal year ended September 30, 2017 compared to the fiscal year ended September 30, 2016.following discussionMD&A in conjunction with our consolidated financial statementsConsolidated Financial Statements and related notes beginning on page 40.in this Form 10-K. In addition to historical information, this discussionthe MD&A contains forward-looking statements that involve risks and uncertainties. You should read “Information Related to Forward-Looking Statements” included above in this Form 10-K10‑K and "Item 1A. Risk Factors" for a discussion of important factors that could cause our actual results to differ materially from our expectations.Overviewworldwideglobal provider of automation and cryogenic solutions for multiple markets includingmarkets. We primarily serve two distinct and unrelated markets: the semiconductor capital equipment market and the life science biologicalsciences sample management market. We believe our leadership positions and storage, and we areour global support capability in each of these markets makes us a valued business partner to originalthe largest semiconductor capital equipment manufacturers, or "OEMs, and equipment users throughoutdevice makers, and pharmaceutical and life science research institutions in the world. We serveOur offerings are also applied to other adjacent technology and industrial markets, in whichand we provide customer support services globally.customers’ success,customers, who typically inoperate equipment under demanding temperature and/or pressure environments. TheWe are a leader in wafer automation and contamination controls solutions and services that are designed to improve throughput, yield, and cost of ownership of tools in semiconductor fabs. Our product offerings include vacuum and atmospheric robots, turnkey vacuum and atmospheric wafer handling systems, as well as wafer carrier cleaning and reticle storage systems. We also capture the complete life cycle of value through our global service network of expert application and field engineers who are located close to our customers. Our services include rapid refurbishment of robots to stringent specifications, upgrades to improve equipment productivity, and proactive monitoring and diagnostics for predictive risk management and improved up-time of the installed base. Although the demand for semiconductors and semiconductor manufacturing equipment is cyclical resulting in periodic expansions and contractions, of this market. In addition to the semiconductor market, we serve the life sciences, industrial capital equipment and other adjacent technology markets.22In the semiconductor capital equipment market, we utilize our capabilities in automation and cryogenics in various robotic automation and cryogenic vacuum pump offerings, both of which are used in the wafer processing steps of a semiconductor manufacturer. We expect the semiconductor equipment market to remain a key end market forone of our products and servicesprincipal markets as we continue making investments to maintain and grow our semiconductor product and service offerings. A majority of our research and development spending advances our current product lines and drives innovations for new product offerings. We invest in research and development initiatives within the Brooks Semiconductor Solutions Group segment to maintain continued leadership position in the markets we serve. We have made numerous acquisitions in past yearsrecently launched our newest Vacuum Automation platform, MagnaTran LEAP™, for the rapidly emerging advanced technologies related to manufacturing 10 nanometer design rul semiconductor chips. MagnaTran LEAP is well positioned to deliver clean, accurate and fast wafer transport available for the fast-growing Deposition and Etch markets. In addition, we expect to continue to support and expand our technology and product offerings for the semiconductor market.market through acquisitions. In October 2012,2018, we acquired Crossing Automation Inc.,Tec-Sem Group AG, or Crossing,Tec-Sem, a U.S.-basedSwitzerland-based provider of automation solutions and services for semiconductor front-end markets, for $59.0 million. In April 2014, we acquired Dynamic Micro Systems Semiconductor Equipment GmbH, or DMS, for $31.6 million. DMS is a German-based provider of automated contamination control solutions, or CCS, for front opening unified pod, or FOUP, carriers and reticle storage targeted at improving yield of semiconductor processes at semiconductor fabrication plants. In August 2015, we acquired Contact Co., Ltd., or Contact, for $6.8 million, net of cash acquired. Contactautomation equipment with a focus on reticle management. The acquisition is a Japanese-based provider of automated cleaner products for wafer carrier devices used in the global semiconductor markets. This acquisition broadensexpected to enhance our CCS product portfolio and adds complementary technology to our CCS business unit.in variousto provide comprehensive bio-sample management solutions to a broad range of end markets within the life sciences industry. Our offerings such asinclude automated ultra coldultra-cold storage freezers, consumable sample storage containers, and instruments towhich assist in the workflow of sample management.management, and both on-site and off-site full sample management services. We expect the life sciences sample management market to remain a key end marketone of our principal markets for our productsproduct and services. In 2011,service offerings and provide favorable opportunities for the growth of our overall business. Over the past several years, we enteredhave acquired and developed essential capabilities required to strategically address the sample management needs across multiple end markets within the life sciences industry.market throughbusiness, for a total purchase price of $125.2 million, net of cash acquired. The acquisition provided us with the capability to support customers with an integrated, comprehensive set of sample management products, services and solutions. In July 2017, we acquired substantially all of the assets and liabilities of Pacific Bio-Material Management, Inc., or PBMMI, and Novare, LLC, or Novare, for a total purchase price of $34.1 million, net of cash acquired. PBMMI and Novare provide storage, transportation, management, and cold chain logistics of biological materials. The acquisition is expected to expand our existing capabilities with respect to sample management and integrated cold chain storage and transportation solutions. We acquired Cool Lab, LLC, a subsidiary of BioCision, LLC, which provides a range of cryogenic product solutions that assist in managing the temperature stability of therapeutics, biological samples and related biomaterials in ultra-cold environments, in November 2016. We held an equity interest in BioCision prior to the acquisition of Nexus Biosystems, Inc., or Nexus,Cool Lab and RTS Life Science Limited, or RTS,collaborated in the providersdevelopment of automationadvanced solutions and consumablesin temperature-controlled environments. The aggregate purchase price of $15.2 million consisted of a cash payment of $4.8 million, a liability to the life sciences sample management market. We continued to expand our offeringsseller of $0.1 million and customer relationships in the life sciences sample management market in August 2013 witha non-cash consideration of $10.3 million measured at fair value on the acquisition date. We have made several investments in developing new consumable and instrument offerings since the acquisitions of FluidX and Cool Lab.preparation, managementmaterials used in a variety of genomic and storage solutions from Matrical, Inc., or Matrical,DNA analytical applications, for $9.3 million. These acquisitions provided a broad settotal purchase price of offerings, including automated systems for compound and biological sample storage in temperatures below -80 degrees Celsius, consumable storage products and instruments to support the work flow of sample management. In October 2014, we acquired FluidX Ltd., or FluidX, a UK-based provider of biological sample storage tubes and complementary bench-top instruments for $15.5$65.1 million, net of cash acquired. The acquisition has expanded our existing offerings of consumables and instruments within the Brooks Life Sciences segment.In April 2018, we acquired BioSpeciMan Corporation, or BioSpeciMan, a Canadian provider of storage services for biological sample materials. We made a total cash payment of $5.2 million, net of cash acquired and subject to working capital adjustments. The acquisition is expected to expand customer relationships and geographic reach within our growing sample management storage services business.year 2015years 2018, 2017 and 2014,2016, more than 25%24% of our cumulative research and development spending haswas focused on innovating and advancing solutions in the life sciences sample management market. In fiscal year 2014, as a result of our research and development efforts, our Brooks Life Science Systems segment began shipping our modular Twin-bank platform of automated systems for compound and biological sample storage for temperatures at below -80 degrees Celsius. In fiscal year 2015, we have shipped evaluation prototypes of our Biostore III Cryo store, an automated ultra-cold system which stores biological samples below -150 degrees Celsius. We expect to continue investing in research and development and making strategic acquisitions with the objective of expanding our offerings in the life sciences sample management market.March 2014,the fourth quarter of fiscal year 2018, we entered into ana definitive agreement to sell our semiconductor cryogenics business to Edwards Vacuum LLC (a member of the Granville-Phillips business unit to MKS Instruments, Inc.Atlas Copco Group) for $87.0approximately $675.0 million in cash.cash, subject to customary adjustments. We originally acquired the cryogenics business in 2005 as part of the acquisition of Helix Technology Corporation. The Granville-Phillipsclosing of our sale of the cryogenics business is subject to various closing conditions and regulatory approvals. The semiconductor cryogenics business has been classified as discontinued operations and, unless otherwise noted, the description of our business in this report relates solely to our continuing operations and does not include the operations of our semiconductor cryogenics business.providercash purchase price of gas analysis$450.0 million, which is subject to customary adjustments. We financed a portion of the cash purchase price through a new $350.0 million senior secured incremental term loan, under our Credit Agreement, dated October 4, 2017. Please refer to the "Liquidity and vacuum measurement devices used primarilyCapital Resources" section below for a detailed description of the senior secured incremental term loan.the semiconductorItem 8 "Financial Statements and adjacent industrial manufacturing markets. We completed the sale on May 30, 2014. We recorded a pre-tax gain of $56.8 million and an after-tax gain of $26.9 million as a resultSupplementary Data" of this transaction. The tax charge of $29.9 million on the gain was substantially non-cash as it was offset by our prior net operating losses in the United States. Our historical financial statements have been revised to present the operating results of the Granville-Phillips business as a discontinued operation.We report financial results in the following three segments:ProductSemiconductor Solutions Group segment provides a variety of products, services and solutions that enable improved throughput and yield in controlled operating environments. Those productsenvironments, as well as an extensive range of support services. The solutions include atmospheric and vacuum robots, robotic modules, and tool automation systems, that provide precision handling and cleancontamination control of wafer environments, as well as cryogenic pumps and compressors that provide vacuum pumping and thermal management solutions used to create and control critical process vacuum applications. Brooks Global Services segment provides an extensive range of support services includinginclude repair services, diagnostic support services, and installation services in support of the products, from our Brooks Product Solutions segment, which enable our customers to maximize process tool uptime and productivity. This segment also provides end-user customers with spare parts and productivity enhancement upgrades to maximize customer tool productivity.Science SystemsSciences segment provides comprehensive life cycle sample management solutions for life science and bioscience customers to advance scientific research and support drug development. The segment’s product offerings include automated cold sample management systems for compound and biological sample storage, equipment for sample preparation and handling, consumables, and partsinformatics that help customers manage samples throughout their research discovery and development work flows. The segment’s service offerings include sample storage and support services provided to a wide range of life science customers, including pharmaceutical companies, biotechnology companies, biobanks national laboratories, research institutes and research universities.23TableBusiness and Financial PerformanceContentsDuringOperations - We reported revenue of $631.6 million for fiscal year 2015, we had net2018 compared to $527.5 million for fiscal year 2017, an increase of $104.1 million, or 20%. Gross margin was 39.0% for fiscal year 2018 compared to 37.7% for fiscal year 2017, an increase in gross profit of $47.2 million. Operating expenses were $214.7 million for fiscal year 2018 compared to $184.6 million for fiscal year 2017, an increase of $30.1 million. Operating income was $31.4 million for fiscal year 2018 compared to $14.3 million for fiscal year 2017, an increase of $17.1 million, which was primarily attributable to Brooks Automation, Inc. of $14.2 million, all which was attributable to income from continuing operations. During fiscal year 2014, we had net income attributable to Brooks Automation, Inc. of $31.4 million, of which $1.5 million was attributable tothe revenue growth and gross margin improvement, partially offset by higher operating expenses. We generated income from continuing operations and $30.0of $67.7 million to income from discontinued operations, including the gain on sale of the Granville-Phillips business unit. The increase of $12.7 million in income from continuing operations during fiscal year 20152018 as compared to $10.7 million in fiscal year 20142017. This increase was primarily attributable to the decrease in income taxes of $50.6 million driven primarilyby the release of the tax valuation allowance of $77.2 million and an increase in operating income of $17.1 million. These increases were partially offset by higher revenuenet non-operating expenses of $69.9$11.2 million compared to the prior fiscal year, primarily related to increased interest expense of $9.1 million due to the term loan, higher foreign exchanges losses of $1.0 million and higher gross profitthe impact of $21.8 million.a $1.8 million gain recorded on the settlement of our investment in Biocision, LLC, during fiscal year 2017. Please refer to the "Results of Operations" section below for a detailed discussion of our currentfinancial results for the fiscal year operating results2018 compared to fiscal year 2017.priorterm loan and cash inflows of $74.0 million generated from our operating activities, partially offset by cash payments of $85.8 million related to acquisitions, cash outflows of $28.3 million related to dividend payments made toyear.Income from continuing operations was $1.5year 2018 compared to fiscal year 2017.20142017 compared to $434.0 million during fiscal year 2016, an increase of $93.5 million, or 22%. Gross margin was 37.7% for fiscal year 2017 as compared to 36.1% for fiscal year 2016, an increase in gross profit of $42.2 million. Operating expenses were $184.6 million during fiscal year 2017 as compared to $173.7 million during fiscal year 2016, an increase of $10.8 million. Operating income was $14.3 million during fiscal year 2017 as compared to a loss of $7.1$17.1 million during fiscal year 2013. Net income2016, an increase of $31.4 million, which was primarily attributable to Brooks Automation, Inc.the revenue growth and gross margin improvement, partially offset by higher operating expenses. We generated income from continuing operations of $10.7million during fiscal year 2017 as compared to a loss of $85.4 million during fiscal year 2016. This increase of $96.1 million was primarily attributable to a lower income tax provision of $62.9 million which is mostly due to a $76.5 million valuation allowance recorded against U.S. net deferred tax assets during fiscal year 2016, as well as higher operating income of $31.4 million during fiscal year 2014 compared to a net loss of $2.2 million during fiscal year 2013 and included income from discontinued operations related to the Granville-Phillips business unit of $30.0 million and $5.0 million, respectively, during each fiscal year. During fiscal year 2014, we implemented a number of measures aimed at improving the profitability of our continuing operations. We discontinued certain product lines in the Brooks Life Science Systems and Brooks Product Solutions segments, transitioned manufacturing of our line of Polycold cryochillers to a third party contract manufacturer, consolidated our global footprint and implemented other programs designed to improve our cost structure. In connection with these initiatives, we recorded restructuring charges of $6.3 million and $6.4 million, respectively, in fiscal years 2014 and 2013, as compared to $4.7 million of these charges recorded in fiscal year 2015. We expect these changes to result in lower operating costs in future periods and have minimal impact on our ability to generate revenue from products and services.2017. Please refer to the "Results of Operations" section below for a detailed discussion of our financial results for the fiscal year 2014 operating results as2017 compared to fiscal year 2013.Critical Accounting Policies2016.Estimatesconsolidated financial statementsConsolidated Financial Statements requires us to make estimates and judgments that affect the reported amounts of assets, liabilities, revenue and expenses, and related disclosure of contingent assets and liabilities. On an ongoing basis, we evaluate our estimates, including those related to revenue, bad debts, inventories, derivative instruments, intangible assets, goodwill, inventories, income taxes, warranty obligations, pensions and stock-based compensation. We base our estimates on historical experience and various other assumptions that are believed to be reasonable under the circumstances. We evaluate current and anticipated worldwide economic conditions, both in general and specifically in relation to the semiconductor and life science industries, that serve as a basis for making judgments about the carrying values of assets and liabilities that are not readily determinable based on information from other sources. Actual results may differ from these estimates under different assumptions or conditions whichthat could have a material impact on our financial condition and results of operations.consolidated financial statements.Product Recognitionis associated withfrom the sale of hardware systems, componentsproducts and spare parts, as well as product license revenue. Serviceservices. A description of our revenue recognition policies is associated with service contracts, repairs, upgradesincluded in the Note 2, “Summary of Significant Accounting Policies” in the Notes to the Consolidated Financial Statements included in Item 8 "Financial Statements and field services. ShippingSupplementary Data" of this Form 10‑K.handling fees billed to customers, if any, are recognized as revenue. The related shippingconditions, certain agreements contain multiple elements or non-standard terms and handling costs are recognizedconditions. We exercise judgment in cost of revenue.We recognize revenueinterpreting the commercial terms and determining when all four revenue recognition criteria have been met: persuasive evidencemet to ensure revenue was recognized in the appropriate accounting period. Moreover, judgment is required to properly identify the units of an arrangement exists; delivery has occurred or services have been rendered; seller’s price to buyer is fixed or determinable;accounting in multiple element arrangements and collectibility is probable. Ourdetermine the manner in which revenue should be allocated among separate units of accounting. We exercise judgment in determining whether the deliverables specified in these arrangements should be treated as separatepolicy generally results in revenue recognition atpurposes, and, if so, how the following points: (1) for all transactions where legal title passes toconsideration should be allocated among the customer upon shipment or delivery, we recognize revenue upon passage of title for all products that have been demonstrated to meet product specifications prior to shipment; the portion of revenue associated with certain installation-related tasks is deferred,elements and that revenue is recognized upon completion of the installation-related tasks; (2) for products that have not been demonstrated to meet product specifications prior to shipment, revenue is recognized at customer technical acceptance; (3) for transactions where legal title does not pass at shipment or delivery, revenue is recognized when legal title passes to the customer, which is generally at customer technical acceptance; and (4) for arrangements containing multiple elements, revenue for delivered elements that have a stand alone value is recognized ateach element should be recognized. We allocate revenue to each element in the time of delivery, provided all other revenue recognition criteria are met. Revenue related tocontractual arrangement based on the undelivered elements is deferred using the relative selling price method utilizing estimated sales prices until delivery of the deferred elements has occurred. Arrangements with certain customers include contingent revenue provisions, in which a portion ofhierarchy that may require us to estimate the selling price of a delivered itemcertain deliverables that are not sold separately or where third-party evidence of pricing is contingent onnot observable. Our estimate of selling price impacts the delivery of other items or on the delivered items meeting specified performance criteria. In arrangements that include contingent revenue, the amount and timing of revenue recognized is limited toin multiple element arrangements. While changes in the lower of either: the amount billed that is not contingent on acceptance; or the valueallocation of the estimated sales price between the units of accounting will not affect the total revenue amount recognized for a particular sales arrangement, consideration allocated toany material changes in these allocations could impact the delivered elements if the product istiming of revenue recognition that could have a partmaterial effect on our financial condition and results of a multiple-element arrangement. In24cases where we have sold products that have been demonstrated to meet product specifications prior to shipment, we believe that at the time of delivery, we have an enforceable claim to amounts recognized as revenue. Spare partsoperations.is generally recognized upon shipment, and services revenue is generally recognized over the period that the services are provided.Revenue from product sales that include significant customization, which primarily include life science automation systems, is recognized using the percentage of completion method. In accordance withfor certain arrangements based on the percentage of completion method revenue is recognized as work progressesand develop profit estimates for long-term contracts based on a percentage that incurred labor effort to date bears to total projected labor effort. Profit estimates on long-term contracts are revised periodically based on changes in circumstances, and any losses on contracts are recognized in the period in which they are deemedrevenue expected to be probable. If we determine that a loss is probable, we estimategenerated from the loss amount by comparingproject and total estimated contract revenuecosts anticipated to the total estimated contract costs.be incurred. Significant judgment is required in estimating such total labor costs and measuring the progress toof the project completion, on these arrangements, as well as whether a loss is expected to be incurred on the contract due to severalcontract. We use certain assumptions and develop estimates based on a number of factors, including the degree of required product customization required and the customer’s existing environment. We useenvironment based on installation work, as well as our historical experience, project plans and an assessment of the risks and uncertainties inherent in the arrangementcontract related to establish these estimates. Uncertainties in these arrangements include implementation delays or performance issues that may or may not be within our control. We also have certain product arrangements with significant customization that include contractual terms and customer rights disallowingestimate a loss on a contract by comparing total estimated contract revenue to the use of the percentage of completion method. We account for these arrangements in accordance with the completed-contract methodtotal estimated contract costs and recognize income only when a contract is completed or substantially completed.Generally,loss during the terms ofperiod in which it becomes probable and can be reasonably estimated. We review profit estimates for long-term contracts provide for progress billingsduring each reporting period and revise them based on completion of milestones or other defined phases of work. In certain instances, payments collected from customerschanges in advance of recognizing the relatedcircumstances.are recorded as deferred revenue.Revenue associated with service agreements is generally recognized ratably over the term of the contract, with payments from customers being recorded as deferred revenue. Revenue from repair services or upgrades of customer-owned equipment is recognized upon completion of the repair effort and the shipment of the repaired item back to the customer. If the repair or the upgrade includes installation, revenue is recognized when the installation is completed.A portion of the revenue arrangements for our products, particularly in sales of life science automation systems and contamination control solutions, are multiple element arrangements that can include product, service and other elements. For multiple element revenue arrangements, arrangement consideration is allocated to each element based upon their relative selling price using vendor-specific objective evidence, or VSOE, or third-party evidence, or TPE, or based upon the relative selling price using estimated selling prices if VSOE or TPE do not exist. We rely primarily on estimated selling prices since we generally do not have VSOE or TPE. We recognize revenue for each element of the arrangement in accordance withrecognition proves incorrect, our revenue recognition policies. The fair valuein particular periods may be adversely affected and could have a material impact on our financial condition and results of any undelivered elements is deferred until the elements are delivered and all other revenue recognition criteria have been met.whichthat may result in adjustments to goodwill and acquisition date fair values of assets and liabilities during a measurement period or upon a 25Prior to fiscal year 2015, we conducted our annual goodwill impairment test as of September 30 fiscal year end. Beginning with fiscal year 2015, we changed the date of our annual goodwill impairment test from September 30th to April 1st to align more closely with our annual strategic planning process. This change did not delay, accelerate, or avoid an impairment charge and did not result in adjustments to our consolidated financial statements when applied retrospectively. During fiscal year 2015, we completed the annual goodwill impairment test and determined that no adjustment to goodwill was necessary since the fair value of all reporting units substantially exceeded their respective carrying values. The change in the annual impairment test date did not have an impact on our financial position and results of operations during the fiscal year ended September 30, 2015. No triggering events indicating goodwill impairment occurred subsequent to the test date.Application of the goodwill impairment test requires significant judgment based on market and operational conditions at the time of the evaluation, including management's best estimate of future business activity and the related estimates of future cash flows from the assets and the reporting units that include the associated goodwill. These periodic evaluations could cause management to conclude that impairment factors exist, requiring an adjustment of these assets to their then-current fair market values. Future business conditions and/or activity could differ materially from the projections made by management which could result in additional adjustments and impairment charges.currently have sixtwo operating and reportable segments consisting of Brooks Semiconductor Solutions Group and Brooks Life Sciences. We have five reporting units, that have goodwill, including three components that are part of ourfour reporting units within the Brooks ProductSemiconductor Solutions Group operating segment and soleone reporting units that are our Brooks Global Services andunit which is the Brooks Life Science SystemsSciences operating segments.impairment testing involves a two-step process. We first compareand Other, we initially assess qualitative factors to determine whether the existence of events or circumstances indicates that it is more likely than not that the fair value of eacha reporting unit tois less than its respective carrying amount, including goodwill, to assess whether potential goodwill impairment exists.value. If we determine, based on this assessment, that it is more likely than not that the fair value of the reporting unit exceedsis less than its carrying amount,value, we perform a quantitative goodwill ofimpairment test by comparing the reporting unitunit’s fair value with its carrying value. An impairment loss is not considered impaired. Ifrecognized for the amount by which the reporting unit’s carrying amountvalue exceeds its fair value, we performup to the second steptotal amount of goodwill allocated to the goodwill impairment test to measure the potentialreporting unit. No impairment loss amount by comparing the implied fair value of goodwill with its carrying amount. The implied fair value of goodwill is determined by allocatingrecognized if the fair value of the reporting unit to all of its assets and liabilities and assigning the excess amount to goodwill. If the implied fair value of goodwill is less thanexceeds its carrying amount, an impairment loss is recognized for difference between the carrying amount of goodwill and its implied fair value.Income Approachincome approach in accordance with the Discounted Cash Flow Method,discounted cash flow method, or DCF Method. The DCF Method is based on projected future cash flows and terminal value estimates discounted to their present values. Terminal value represents a present value an investor would pay on the valuation date for the rights to the cash flows of the business for the years subsequent to the discrete cash flow projection period. We consider the DCF Method to be the most appropriate valuation technique since it is based on management’s long-term financial projections. Due to the cyclical nature of the semiconductor equipment market, management’s projections as of the valuation date are considered more objective since market metrics of peer companies fluctuate during the cycle. In addition, we also compare aggregate values of our net corporate assets and reporting unit fair values to our overall market capitalization and use certain market-based valuation techniques to test the reasonableness of the reporting unit fair values determined in accordance with the DCF Method.methodMethod include discount rates that are at or above our weighted-average cost of capital. We derive discount rates that are commensurate with the risks and uncertainties inherent in the respective businesses and our internally developed projections of future cash flows.determinecompleted the terminalannual goodwill impairment test for our five reporting units as of April 1, 2018 and determined that no adjustment to goodwill was necessary since the fair value of each reporting unit was significantly in excess of the carrying value of each reporting unit. We conducted a qualitative assessment for three reporting units within the Brooks Semiconductor Solutions Group segment and determined that it was not likely that their fair values were less than their carrying values. As a result of the analysis, we did not perform the quantitative assessment for these reporting units and did not recognize impairment losses. We also performed the quantitative goodwill impairment test for the fourth reporting unit within the Brooks Semiconductor Solutions Group segment and for the Brooks Life Sciences reporting unit. We determined that no adjustment to goodwill was necessary for these two reporting units since their fair values significantly exceeded their respective carrying values. We evaluate a reporting unit’s goodwill for impairment between annual tests if events occur or circumstances change that would more likely than not reduce the fair value of such reporting unit below its carrying value.Gordon growth method which assumes thattime of the evaluation, including management’s best estimates of the reporting unit will growunit’s future business activity and generate freethe related estimates and assumptions of future cash flows at a constant rate. We believefrom the assets that include the Gordonassociated goodwill. Different assumptions of forecasted sales volumes, product costs, future cash flows, risk-adjusted weighted average cost of capital discount rate, as well as long-term growth method israte projections used in the most appropriate technique for determiningDCF model could results in different estimates of the terminalreporting unit’s fair value because it is calculated based on the assumption that our reporting units have reached stable growth rates.group'sgroup’s aggregate carrying value over its fair value. The loss is allocated to the assets within the group based on their relative carrying values, with no asset reduced below its fair value.26 determined that impairment indicators were present for long-lived assets related to the Celigo product line as of September 30, 2013. Indicators of impairment for this asset group included declining sales in the trailing twelve months and negative cash flows from the asset group. We tested the recoverability of the asset group by comparing aggregate expected future undiscounted cash flows directly attributable to the assets to their carrying values, which resulted in the conclusion that the carrying amounts of the assets were not recoverable. Fair value estimate of the long-lived assets related to the Celigo products was based primarily on market-based valuation techniques reflecting the view of a market participant using the assets in the group to their best possible use. We determined that the carrying value of the asset group exceeded its fair value by approximately $2.0 million and recorded this amount as an impairment charge in the fourth quarter of fiscal year 2013. We revised our estimate of the fair value of these assets in the first quarter of fiscal year 2014 and recorded an additional impairment charge of $0.4 million for the remaining carrying value of the long-lived assets.Except as described above, we did not test our long-lived assets for impairment during fiscal years 2015, 20142018, and 20132017 since no events indicating impairment occurred during the periods then ended. Accounts ReceivableTrade accounts receivable do not bear interest and are recorded at the invoiced amount. We maintain an allowance for doubtful accounts representing our best estimate of probable credit losses related to our existing accounts receivable and their net realizable value. We adjust our estimates of the receivables' recoverability based on financial conditions of our customers. If financial conditions of our customers deteriorate reducing their ability to make payments, we increase the allowance for doubtful accounts and record a corresponding charge to operations. We do not have any off-balance-sheet credit exposure related to our customers.Derivative Financial InstrumentsWe record all derivative instruments as assets or liabilities at their fair value determined based on the instruments' estimated future cash flows. Subsequent changes in a derivative's fair value are recognized in income, unless specific hedge accounting criteria are met. Changes in the fair value of a derivative that is highly effective and designated as a cash flow hedge are recognized in accumulated other comprehensive income until the forecasted transaction occurs or it becomes probable that the forecasted transaction will not occur. We perform an assessment at the inception of the hedge and during each subsequent reporting period to determine whether our derivatives are highly effective in offsetting changes in the values of the hedged items. Any changes in the fair value of a derivative resulting from hedge ineffectiveness are immediately recognized as income or expense. WarrantyWe provide for the estimated cost of product warranties at the time revenue is recognized. While we engage in extensive product quality programs and processes, including actively monitoring and evaluating the quality of our component suppliers, our warranty obligations are affected by product failure rates, material usage and service delivery costs incurred in correcting a product failure. We adjust our warranty obligations based on actual product failure rates, material usage or service delivery costs, which may result in revisions to the estimated warranty liabilities and additional benefits or charges to our operating results.We maintainThroughout fiscal year 2017 we maintained a full valuation allowance against certainour U.S. net deferred tax assets in the U.S. and inalong with those of certain foreign jurisdictions.tax-paying components. We will continue toevaluate the realizability of our deferred tax assets by tax-paying component and assess the need for a valuation allowance in future periods. If future operating resultson an annual and quarterly basis. We evaluate the profitability of27or these foreign jurisdictions deviate from long-term expectations, it is reasonably possible that there coulddeferred tax assets would be realized. In the second quarter of fiscal year 2018 we reached a changesignificant level of cumulative profitability in the U.S., coupled with an improved outlook of U.S. earnings. During the full fiscal year 2018, we reduced our U.S. valuation against our U.S. net deferred tax assets resulting in a tax benefit of $77.2 million. The remaining portion of our U.S. valuation allowance in the future. A change in the valuation allowance, in whole or in part, would result in a non-cash income tax expense or benefit during the period of change.Pension PlansWe sponsor defined benefit pension plans in Switzerland and Taiwan. The costs and obligations of these arrangements are calculated based on certain assumptionsis related to estimated benefits that employees earn while working, the amountrealizability of which cannot be completely determined until the benefit payments cease. Key assumptions usedcertain state tax credits and net operating loss carry-forwards. We continue to maintain valuation allowances against net deferred tax assets in accounting for these employee benefit plans include the discount rate, expected return on plan assets and rate of increase in employee compensation levels. Assumptions are determined based on Company data and appropriate market indicators in consultation with third-party actuaries, and are evaluated each yearcertain foreign tax-paying components as of the plans’ measurement date. A change in anyend of our assumptions would have an effect on net periodic pension costs and the unfunded benefit obligation.stock-based compensation cost for all employee stock awards at fair value on the date of grant date and recognize thecompensation expense over the service period for the awards expected to vest. The fair value of restricted stock units is determined based on the number of shares granted and the closing price of our common stock quoted on NASDAQNasdaq on the date of grant. Fairgrant, and the fair value of stock options is determined based onusing the Black-Scholes valuation model.We recognize stock-based compensation Such fair values are recognized as expense on a straight-line basis,over the service period, net of estimated forfeitures, over the requisite service period. We make estimatesforfeitures. The estimation of stock award forfeitures and a number of awards expected tothat will ultimately vest which requires significant judgment. We consider many factors in developing forfeiture estimates,when estimating expected forfeitures, including award types of awards, employee classesclass, and historical experience. We assessIn addition, for stock-based awards where vesting is dependent upon achieving certain operating performance goals, we estimate the likelihood of achieving the performance goals for stock-based awards that vest upon the satisfaction of these goals. Our current estimates may differ from actualActual results, and future changes in estimates, may differ from our current estimates.Results20152018 Compared to Fiscal Year Ended September 30, 2014$552.7$631.6 million for fiscal year 20152018 compared to $482.8$527.5 million for fiscal year 2014. The2017, an increase of $69.9$104.1 million, or 14.5% is net of a negative impact of $9.4 million from foreign currency exchange rates. Our growth was driven by organic growth generated by our Brooks Product Solutions segment and by revenue from businesses acquired in fiscal year 2014 and 2015.ProductSemiconductor Solutions Group segment reported revenue of $390.1$435.0 million for fiscal year 20152018 compared to $325.6$378.8 million for fiscal year 2014.2017. The increase of $64.5$56.2 million, or 19.8% is net of a negative impact of $2.9 million15%, reflects increases in revenues from foreign currency exchange rates. The DMSrobotic automation products, systems and related services business, acquired on April 30, 2014, provided $44.0 million of revenue in fiscal year 2015 compared to $5.5 million in fiscal year 2014. The remaining growth of $25.9 million was attributable to the organic growth of 8.1% across automation and cryogenic product sets.Our Brooks Global Services segment reported revenue of $94.5 million for fiscal year 2015 compared to $94.1 million for fiscal year 2014. The increase of $0.4 million, or 0.4% is net of a negative impact of $3.6 million from foreign currency exchange rates. The increase was primarily attributable to organic growth.Our Brooks Life Science Systems segment reported revenue of $68.1 million for fiscal year 2015 compared to $63.1 million for fiscal year 2014, an increase of $5.0 million, or 7.8%. The increase of $5.0 million or 7.8% is net of a negative impact of $2.9 million from foreign currency exchange rates. The revenue increase was primarily attributable to the $15.0 million of revenue generated from the FluidX business acquired on October 1, 2014, and was partially offset by a decline in revenues from our contamination control systems. These increases include revenues generated by the Tec-Sem acquisition of $10.1$11.6 million which we acquired in the third quarter of fiscal year 2018.reductionacquisition of 4titude, $8.1 million from the acquisition of PBMMI, and $0.5 million from the acquisition of BioSpeciMan.large stores systemsour Brooks Life Sciences segment through our internally-developed products and instruments.seekingto seek opportunities to expand our market share in the semiconductor and adjacent technology markets served by our Brooks ProductSemiconductor Solutions and Brooks Global Services segments. However, theseGroup segment. These markets are cyclical, and demandoften fluctuate significantly from quarter to quarter. Demand for our Brooks Semiconductor Solution Group products and services is affected by these cycles. We anticipate continued growth in revenue from our Brooks Life Science Systems segment through our internally developed products and services, including our Twin-bank and Biostore III automated sample management systems, and through acquisition of products and services that expand our addressable markets.$353.6$398.9 million, or 63% of total revenue, for fiscal year 2015 and $308.52018 compared to $354.6 million, or 64%67% of total revenue, for fiscal year 2014, respectively.2834.2%39.0% for fiscal year 2018 compared to 37.7% for fiscal year 2015 compared to 34.7%2017. Gross margin increased 1.9% in the Brooks Semiconductor Solutions Group segment and decreased 0.1% in the Brooks Life Sciences segment. Cost of revenue for fiscal year 2014. The decline was attributable2018 included $4.9 million of charges for amortization related to reduced marginscompleted technology as compared to $3.9 million incurred during fiscal year 2017. Additionally, cost of therevenue for fiscal year 2018 also included $1.9 million of inventory step-up charges, compared to $0.5 million for fiscal year 2017.Life Science SystemsSemiconductor Solutions Group segment partially offset by improvements ofreported gross margins of 40.0% for fiscal year 2018 compared to 38.0% for fiscal year 2017. Margins improved on the Brooks Product Solutionsimpact of product mix, volume leverage of fixed costs, and Brooks Global Services segments.lower charges related to warranty and excess and obsolete inventory. Cost of revenue induring fiscal year 20152018 included $5.2$3.4 million of amortization related to completed technology compared to $2.5 million during fiscal year 2017. During fiscal years 2018 and $1.52017, cost of revenue included $0.7 million of charges related to the saleand $0.1 million, respectively, of inventory obtainedstep-up charges.acquisitions toour manufactured automated stores business, which a step-upexperienced cost overruns in value was applied in purchase accounting. This compares to $4.4the areas of production and project management. Cost of revenue during fiscal year 2018 included $1.5 million of amortization related to completed technology and $2.2 million of charges related to the sale of inventory obtained in acquisitions to which a step-up in value was applied in purchase accounting, in fiscal year 2014. Cost of revenue in 2014 also included $0.4 million of charges related to the impairment of completed technology and $0.3 million of inventory write downs related to restructuring programs.Our Brooks Product Solutions segment reported gross margins of 35.5% for fiscal year 2015 as compared to 34.3% for$1.4 million incurred during fiscal year 2014. The increase was primarily attributable to volume leverage of fixed manufacturing costs and product cost reductions achieved from sourcing and value engineering initiatives. The increase was partially offset by costs related to transitioning a product line to contract manufacturing, and an increase in warranty costs. Cost of revenue in2017. During fiscal year 2015 included $3.0 million of amortization related to completed technology2018 and $0.6 million of charges in fiscal year related to the sale of inventory obtained in acquisitions to which a step-up in value was applied in purchase accounting. This compares to $2.2 million of amortization related to completed technology and $1.9 million of charges related to the sale of inventory obtained in acquisitions to which a step-up in value was applied in purchase accounting, in fiscal year 2014. Cost of revenue in 2014 also included $0.1 million of inventory write downs related to restructuring programs. Certain patents that we license to third parties in exchange for agreed upon royalties will expire within the next 12 months. Royalty income was $11.6 million, $9.8 million and $6.8 million, respectively, during fiscal years 2015, 2014 and 2013 and is expected to decline in future periods as a result of patent expirations.Our Brooks Global Services segment reported gross margins of 34.8% for fiscal year 2015 compared to 34.2% for fiscal year 2014. The increase in the gross margin reflects improved utilization of our service organization, partially offset by the unfavorable impact of foreign currency exchange rates during this period. A majority of our Brooks Global Services contracts are written in the local currencies of the countries in which the services are delivered, while a portion of contract costs are based in U.S. dollars. Cost of revenue in 2015 and 2014 included $0.6 million of amortization related to completed technology.Our Brooks Life Science Systems segment reported gross margins of 26.0% for fiscal year 2015 compared to 37.1% in the prior year. Approximately nine points of the decline were due to lower gross margins in our systems business with the remainder driven primarily by negative impacts from foreign currency exchange rates. The lower margins in the systems business were primarily driven by less absorption of fixed cost with the lower systems revenue and an increase of cost related to transitioning operations toward contract manufacturing support. In the fourth fiscal quarter of 2015, we discontinued all manufacturing at our Poway, California and Spokane, Washington sites to consolidate our systems operations into the Manchester UK location and to increase contract manufacturing support to the business. Cost of revenue also included $1.6 million of amortization related to completed technology in each of the fiscal years 2015 and 2014, respectively. Additionally,2017, cost of revenue in fiscal year 2015 included $1.0$1.2 million of charges related to the saleand $0.4 million, respectively, of inventory obtained in acquisitions to which a step-up in value was applied in purchase accounting, compared to $0.4 millioncharges.$52.2$46.9 million in fiscal year 20152018 compared to $52.6$39.9 million in fiscal year 2014.2017. The decreaseincrease of $0.4$7.1 million or 0.8%, was primarily attributabledue to lower compensation-related expenses and project material costs of $5.2 million, partially offset by higher expensesincreased expense of $4.2 million relatedwithin the Brooks Semiconductor Solutions Group segment and $2.8 million within the Brooks Life Sciences segment. Higher research and development expenses during fiscal year 2018 as compared to businesses acquired since the beginningfiscal year 2017 were primarily attributable increased investments for new product development in both of fiscal 2014 and $0.6 million of expenses related to outsourcing of certain development activities.$115.3$167.0 million in fiscal year 20152018 compared to $111.1$141.5 million in fiscal year 2014. Business2017. The increase of $25.5 million was primarily attributable to: (i) higher employee-related costs driven by increased incentive bonuses and higher salaries resulting from hiring additional personnel to support the growth of our business, (ii) higher amortization costs due to acquisitions made since 2014 droveduring the period, (iii) higher operating expenses related to the acquisitions of PBMMI, 4titude, Tec-Sem and BioSpeciMan and (iv) higher stock-based compensation expense driven mostly by higher estimates of the expected payout related to the achievement of performance goals for our performance-based awards. Fiscal year 2018 also included a loss recovery from an increase in amortization of $1.5 million and $6.3 million of additional selling, general and administrative spending. insurance claim which partially offset the increases described above. was related primarily to customer relationships was $19.3 million and amounted to $7.7$13.2 million, inrespectively, during fiscal year 2015 compared to $6.2 million in fiscal year 2014. Partially offsetting these increases was a decrease of $1.1 million in compensationyears 2018 and employee-related costs and a reduction of $2.6 million related to a note receivable impairment charge recognized in fiscal year 2014. Selling, general and administrative expenses included merger costs of $0.7 million in each fiscal year.29During fiscal 2014, we recorded the impairment charge of $2.6 million on the note receivable after a partner informed us of their intent to secure additional funding through an investment program designed to support early-stage companies being funded by the Commonwealth of Massachusetts. In connection with their efforts to secure additional financing, we agreed to subordinate our first-priority security interest to the new lender and to extend the due date of our loan to coincide with the due date of the new loan, which is September 2019. The partner also provided revised assumptions about their future cash flows. Based on the information provided by the partner and the subordination of our interest to the new lender, we determined it was probable that we would not recover all amounts due from the loan and recorded an impairment charge of $2.6 million. We determined the fair value of the loan by considering the fair value of the collateral using certain valuation techniques, principally, the discounted cash flow method, and the subordination to the new lender.and Other Charges$4.7$0.7 million induring fiscal year 2015, which included2018 as compared to $3.1 million during fiscal year 2017.$3.4actions initiated during the fourth quarter of fiscal year 2018. Of these charges, $0.3 million and facility-related costs of $1.3 million. These costs resulted from the consolidation of certain administrative functions in the Brooks Life Science Systems segment, the on-going transition of manufacturing certain products to a third party contract manufacturer and actions taken to reduce our workforce in order to improve our cost structure and ongoing cost discipline.We incurred $3.4 million of severance costs related to workforce reductions of approximately 93 positions across all of our reportable segments and our corporate function. Total severance costs included charges related to the outsourcing of certain manufacturing operation along with certain products from our DMS business and Brooks Life Sciences Systems segment, as well as workforce reductions related to the integration of acquisitionsTec-Sem which was acquired during fiscal year 2018 as part of our Brooks Semiconductor Solutions Group segment and other$0.3 million related to the announced closure of our Denmark facility which will eliminate redundancies in our Brooks Life Sciences segment. Cost savings realized during fiscal year 2018 related to these actions were nominal as these actions were initiated during the fourth quarter of fiscal year 2018.reduction initiatives.of revenue reductions. We incurred $0.2realized approximately $1.9 million and $0.8 million, respectively, of cost savings related to this action during fiscal year 2018 and 2017.costscost of revenue reductions and $0.6 million of selling, general and administrative expense reductions.plan settlements.We incurred facility-related costssettlement of $1.3$0.3 million which consistedand sale of lease paymentsproperty, plant and fixed asset write-offs associated with our effortsequipment of $0.2 million. Please refer to reduce the space usedItem 7A. “Quantitative and Qualitative Disclosures About Market Risk – Currency Rate Exposure” in our operations.restructuring chargesan income tax benefit on continuing operations of $6.3$47.3 million in fiscal year 2014. These costs resulted from the consolidation of certain administrative functions in the Brooks Life Science Systems segment, the on-going transition of manufacturing of certain Polycold products to a third party contract manufacturer and other programs designed to improve our cost structure.Restructuring charges of $6.3 million recorded in fiscal year 2014 included $5.7 million of severance costs resulting from workforce reductions of approximately 70 positions across all of our reportable segments and our corporate function. Total severance charges related to the outsourcing of the Polycold manufacturing operation, which relate to the Brooks Product Solutions and Brooks Global Services segments, were $1.2 million, of which $0.6 million was recorded in fiscal year 2014. The charge for this program was recorded ratably over the period from notification of the closing in October 2012 to the actual service end date in September 2014.In addition to the workforce-related charges described above, we recorded $0.6 million of facility-related costs which consisted of lease payments and fixed asset write-offs associated with our efforts to reduce the space used in our operations. In addition, we recorded $0.3 million of inventory write-offs associated primarily with discontinuing certain product lines that were included in cost of revenue in our Consolidated Statements of Operations for the fiscal year 2014.Interest IncomeInterest income was $0.9 million and $1.0 million for fiscal years 2015 and 2014, respectively. Interest ExpenseInterest expense was $0.4 million and $0.2 million in fiscal years 2015 and 2014, respectively, and related to the capital lease of the building and the associated land on our Chelmsford, Massachusetts campus. We began leasing the building in fiscal year 2002 and exercised a renewal option in March 2014 to extend the lease term until March 2018 and purchase the building at the end of the lease period. We reached an agreement with the lessor and purchased the building and the related land on September 30, 2015 for a total price of $8.4 million. For additional information on the capital lease arrangement, please refer to Note 21 "Commitments and Contingencies" to our consolidated financial statements included under "Item 8. Financial Statements and Supplementary Data" of this Form 10-K. Other Income, netOther income, net was $0.4 million in fiscal year 2015 compared to $0.3 million in fiscal year 2014. The increase of $0.1 million is primarily attributable to currency exchange gains of $0.5 million in fiscal year 2015 compared to losses of $1.2 million in the prior fiscal year that were recognized by our foreign subsidiaries on the balances denominated in U.S dollars. Additionally, we recognized gains of $0.4 million during fiscal year 2015 related to fair value measurement of convertible debt securities. These increases were partially offset by a loss of $1.9 million recognized as a result of writing down the assets held for sale to their fair value at September 30, 2015. For additional information on this transaction, please30refer to Note 7 "Property, Plant and Equipment" to our consolidated financial statements included under "Item 8. Financial Statements and Supplementary Data" of this Form 10-K.Income Tax BenefitWe recorded an income tax provision of $3.4 million in fiscal year 2015. The tax provision is driven by U.S. global income generated during the current fiscal year and interest related to unrecognized tax benefits. The tax provision also includes $1.2 million of tax benefits related to reductions in unrecognized tax benefits resulting from the expiration of the statute of limitations in various foreign jurisdictions.2017. The income tax provisionbenefit during fiscal year 2018 was driven primarily by the reversal of the valuation allowance against a substantial portion of the U.S. net deferred tax assets. We have estimated the toll charge on our taxable foreign earnings, net of foreign tax credits, associated with the enactment of the Tax Cuts and Jobs Act during fiscal year 2018 to be $8.0 million. This amount is an offset to the valuation allowance reversal recorded during the year and is included in the full year tax benefit reported. The tax benefit for fiscal year 20152018 also included $0.9a $0.7 million tax benefit related to the re-measurement of net U.S. deferred tax benefits resulting fromliabilities to account for the reinstatement of the U.S. federal research and development tax credit, retroactive to January 1, 2014.We recorded anreduced 21 percent statutory Federal income tax rate. The overall benefit of $2.0 million infor fiscal year 2014. The tax benefit2018 was driven by U.S. and German pre-tax losses and $1.2 million of reductions in unrecognized tax benefits resulting from the expiration of the statute of limitations in various foreign jurisdictions. These benefits were partially offset by the tax provisions on earnings in our foreign income taxes and interest related to unrecognized tax benefits.The net deferred tax assets, including current and noncurrent, remained at $83.6 millionjurisdictions during fiscal year 2015. We recognized deferred tax liabilities of $2.3 million as part of purchase accounting related to the acquisition of two foreign subsidiaries. These liabilities were partially offset by deferred tax benefits of $2.2 million, as well tax return true-ups and tax effects of other comprehensive income adjustments.recorded a lossincurred losses of $0.2$0.5 million from our equity method investments forinvestment in BioCision during fiscal year 2015 as compared to an income of $1.2 million for fiscal year 2014. The decrease of $1.4 million was driven primarily by lower income of $0.2 million generated from our joint venture with ULVAC Corporation of Japan and higher proportional share of losses of $1.2 million generated by our joint venture with Yaskawa Electric Corporation of Japan and BioCision LLC, a privately-held company based in Larkspur, California, in which we made an equity2017. Our investment in March 2014.DuringBioCision was settled during the first quarter of fiscal year 2015,2017 as a part of the non-cash consideration for the acquisition of Cool Lab on November 28, 2016. Prior to closing the equity investment, we agreedtraditionally recorded the income and losses related to the equity method investment in principle with Yaskawa to dissolve the YBA joint venture. The venture came to closureBioCision one quarter in March 2015 and was liquidated during the fourth quarter ofarrears. During fiscal year 2015. In connection with the dissolution, YBA assessed the recoverability of assets held by the joint venture and notified its equity partners of the asset impairment. As a result,2017, we recorded an impairment chargetwo additional months of $0.7 millionactivity in fiscal year 2015 to write down the carrying value of our equitythe investment in YBAas a result of its settlement. We deemed the amount of $0.2 million related to its fair value. The impairment charge was included in our proportionate sharetwo additional months of losses generated from the joint venture with YBA. activity to be insignificant.$0.2revenue and net income from discontinued operations of $196.1 million of liquidation costs related to the dissolution of the joint venture. Income from Discontinued Operations, Net of TaxDuring fiscal year 2014, we determined that the Granville-Phillips business was not consistent with our strategy to expand our leadership positions in our core semiconductor and life science sample management market segments. On March 17, 2014, we entered into an agreement to sell the Granville-Phillips business unit to MKS Instruments, Inc. for $87.0$48.7 million, in cash. The sale was completed on May 30, 2014. We determined that our Granville-Phillips business unit met the criteria to be reported as a discontinued operation. As a result, our historical financial statements have been revised to present the operating results of the Granville-Phillips business as a discontinued operation.Reported revenuerespectively for fiscal year 2014 was reduced by $19.32018 related to our semiconductor cryogenics business as compared to $165.4 million and $51.9 million, respectively for amounts attributable to Granville-Phillips.fiscal year 2017. The pre-tax and the after-taxnet income is inclusive of income from the UCI joint venture in 2018 and 2017. The income from discontinued operation for fiscal year 2014 were $61.7 million and $30.0 million, respectively. The resultsoperations only includes direct operating expenses incurred that (1) are clearlydiscontinued operation for fiscal year 2014 includedsale and (2) will not be continued by the pre-tax gain of $56.8 millionCompany on an ongoing basis. Indirect expenses which supported the Cryogenics business, and the after-tax gain of $26.9 million from the salewhich will remain as part of the Granville-Phillips business unit. Tax expense related to the gain on the sale of the business was $29.9 million, representing a tax rate of 52.7%, which is higher than the U.S. statutory rate. The goodwill that was disposed ofcontinuing operations, are not reflected in this transaction had no basis for tax purposes and as a result, increased the gain recognized for tax purposes. The tax charge was substantially non-cash as it was offset by our net operating losses.20142017 Compared to Fiscal Year Ended September 30, 2013$482.8$527.5 million for fiscal year 20142017 compared to $422.4$434.0 million for fiscal year 2013,2016, an increase of $60.4$93.5 million, or 14%22%. All three of our segments contributed to the increase in revenue. Revenue from Brooks Product Solutions and Brooks Global Services increased $35.1 million and $5.4 million, respectively, and benefited from stronger demand from the semiconductor capital equipment market. Brooks Life Science Systems’ revenue increased $19.931million, primarily as a result of increased demand for automated cold storage systems. Acquisitions completed in the twelve months preceding September 30, 2014 contributed $5.5 million of revenue.ProductSemiconductor Solutions Group segment reported revenue of $325.6$378.8 million for fiscal year 2014, an2017 compared to $325.9 million for fiscal year 2016. The increase of 12%$52.9 million, or 16%, reflects increases in revenues from $290.5contamination control systems and robotic automation products and systems, partially offset by a decline in revenues from services.2013. These increases were mostly2017.increased demandsample storage services, automated storage systems, including the BioStore III Cryo, and consumables and instruments. Acquisitions accounted for $15.3 million of the increase compared to fiscal year 2016, which consisted of $8.2 million from the semiconductor capital equipment market. Revenuetwo additional months of revenue from BioStorage acquired on November 30, 2015, $3.7 million from the acquisition of DMS contributed $5.5Cool Labs, and $3.4 million tofrom the revenue increase.Our Brooks Global Services segment reported revenue of $94.1 million for fiscal year 2014, an increase of 6% from $88.6 million in fiscal year 2013. The increase was primarily due to increased demand from semiconductor capital equipment end-users.Our Brooks Life Science Systems segment reported revenue of $63.1 million for fiscal year 2014, an increase of 46% from $43.3 million in fiscal year 2013. Revenue growth was supported by the launch and accelerating sales of the first internally developed Twin-bank platform for automated cold storage systems. The acquisition of Matrical provided $6.0 million and $1.0 million of revenue from automated cold storage systems, instrumentation and consumables in fiscal years 2014 and 2013, respectively. Many of the opportunities for Matrical automated cold storage systems were transitioned to the Twin-bank platform that we launched in fiscal year 2014.was $308.5amounted to $354.6 million, or 67% of total revenue, for fiscal year 2017 compared to $277.1 million, or 64% of total revenue, for fiscal year 20142016.$244.7 million, or 58%Brooks Life Sciences segment by 1.9 percentage points and 0.7 percentage points, respectively. Cost of total revenue for fiscal year 2013, respectively.Gross MarginGross margin increased by 3.4 percentage points2017 included $3.9 million of charges for amortization related to 34.7%completed technology as compared to $4.2 million incurred during fiscal year 2016. Additionally, cost of revenue for fiscal year 20142017 also included $0.5 million of inventory step-up charges, compared to 31.3%$0.6 million for fiscal year 2013. 2016.ondriven by organic revenue growth, favorable contributions from recent acquisitions and savings from the recentvolume in all three segments, favorable mix inexpenses supporting the transition to in-sourcing of manufacturing from a contract provider to our Brooks Product Solutions segmentManchester location and execution of operational initiatives related to material and warranty cost reduction. Gross margin in fiscal year 2014 included $3.0 million of chargesexpenses related to the step-upconsolidation of inventory balances in purchase accounting, impairmentour Cool Labs operations. Please refer to the "Restructuring Charges" section below for further information on these restructuring actions. Cost of intangible assets and restructuring charges compared with $5.0revenue during fiscal year 2017 included $1.4 million of such charges in fiscal year 2013. These charges reduced gross profit margin by 0.6 percentage points in fiscal year 2014 and 1.2 percentage points in fiscal year 2013.Our gross margin for our Brooks Products Solutions segment increased to 34.3% for fiscal year 2014 as compared to 31.4% in fiscal year 2013. The increase was primarily driven by leverage on increased volume, execution of operational initiatives related to material and warranty cost reduction and favorable product mix. Operational improvements were partially offset by an increase in inventory step-up charges associated with acquisitions which reduced gross profit margin by 0.6 percentage points in fiscal year 2014 as compared to 0.5 percentage points in fiscal year 2013.Our gross margin for our Brooks Global Services segment increased to 34.2% for fiscal year 2014 as compared to 30.4% in fiscal year 2013. The increase was primarily driven by leverage on increased volume, improved utilization of our field service organization and a reduction in inventory step-up charges associated with acquisitions. Gross margin for fiscal year 2013 included $1.3 million of step-up charges which reduced gross margin by 1.5 percentage points. Our Brooks Global Services segment did not have any step-up charges in fiscal year 2014.Our gross margin for our Brooks Life Science Systems segment increased to 37.1% for fiscal year 2014 as compared to 32.7% in fiscal year 2013. The increase was driven by leverage on increased volume, a reduction in inventory step-up charges associated with acquisitions and a reduction in impairment chargesamortization related to completed technology intangible assets. The segment operating leverage drove significant benefits with revenue growth of 46%as compared to $1.5 million during fiscal year 2013. The operational improvements in the segment were partially offset by one $3.6 million project, recognized in the third quarter2016. Additionally, cost of fiscal 2013, that made a minimal contribution to gross margin. Gross profit margin inrevenue for fiscal year 2014 benefited from $2.02017 included $0.4 million of lower costs related to theinventory step-up of inventory balances in purchase accounting, impairment of intangible assets and restructuring charges.Research and development expenses consist primarily of employee-related and project costs. $52.6$39.9 million in fiscal year 20142017 compared to $46.2$44.2 million in fiscal year 2013.2016. The increasedecrease of $6.4$4.3 million was primarily attributable to developing enhancements to our current product offeringsreflects expense reductions of $2.6 million within the Brooks Semiconductor Solutions Group segment and investing in new product development as part of our strategy to grow longer-term revenue. The increase in$1.7 million within the Brooks Life Sciences System segment. Lower research and development expenses induring fiscal year 20142017 as compared to fiscal year 2013 also2016 were primarily attributable to the full year realization of savings from restructuring actions initiated prior to fiscal year 2017 and the progression of certain projects from the development stage to market which resulted from acquisitions completed in fiscal 2014.$111.1$141.5 million in fiscal year 20142017 compared to $96.5$119.3 million in fiscal year 2013.2016. The increase of $14.6$22.2 million was primarily attributable to $10.4 million ofto: (i) higher compensation costs forprimarily driven by increased headcounts, and increased incentive compensationbonuses and commissions, (ii) higher stock-based compensation resulting from our improved execution against financialexpense related primarily to performance32objectives and an impairment charge of $2.6 million related to the impairment of a note receivable. The increase in selling, general and administrative expenses in fiscal year 2014 compared to fiscal year 2013 also resulted from acquisitions completed in fiscal 2014.PBMMI acquisition. These increases were partially offset by lower employee-relateddepreciation expense in information technology systems.facility costs attributable to cost savings initiatives undertaken in$10.8 million, respectively, during fiscal year 2014.and Other Charges$6.3$3.1 million during fiscal year 2017 as compared to $10.2 million during fiscal year 2016.2014. These2016 to streamline business operations and improve competitiveness and overall profitability. This action had been completed as of September 30, 2017. Cost savings fromprimarily to severance costs which consisted of $8.9 million related to restructuring actions initiated during fiscal year 2016 and $1.3 million related to restructuring actions initiated in prior periods.decisionJena, Germany repair facility into our Chelmsford, Massachusetts repair operation, and (iii) $4.5 million of costs related to discontinue certain product linesthe company-wide restructuring action to streamline business operations, improve competitiveness and overall profitability.Science SystemsSciences segment resulted in approximately $3.8 million in annual pre-tax cost savings, including $1.0 million of cost of revenue reductions and Brooks Product Solutions segments, the transition$2.9 million of manufacturing certain products in our lineselling, general and administrative expense reductions. Total cost savings realized as a result of Polycold cryochillers and compressorsthese restructuring initiatives amounted to a third party contract manufacturer, the consolidation$5.1 million, of our global footprint and other programs designedwhich $1.3 million were realized prior to improve our cost structure.Restructuring charges of $6.3 million recorded in fiscal year 2014 included $5.72017 and $3.8 million of severance costs resulting from workforce reductions of approximately 70 positions across all of our reportable segments and our corporate function. Total severance chargeswere realized during fiscal year 2017.outsourcingBrooks Semiconductor Solutions segment to integrate Contact, and to close and transfer the Mistelgau, Germany manufacturing operations to a contract manufacturer.Polycold manufacturing operation,equity method investment in BioCision which relate to the Brooks Product Solutions and Brooks Global Services segments, were $1.2 million, of which $0.6 million was recorded in fiscal year 2014. The charge for this program was recorded ratably over the period from notificationincluded as a part of the closing in October 2012 to the actual service end date in September 2014.In addition to the workforce-related charges described above, we recorded $0.6 millionnon-cash consideration for an acquisition of facility-related costs which consisted of lease payments and fixed asset write-offs associated with our efforts to reduce the space used in our operations. In addition, we recorded $0.3 million of inventory write-offs associated primarily with discontinuing certain product lines that were included in cost of revenue in our Consolidated Statements of Operations for the fiscal year 2014.We recorded restructuring charges of $6.4 million in fiscal year 2013. These charges were related primarily to workforce reductions implemented to consolidate the operations of Crossing into our operations, the transition of manufacturing cryochillers and compressors within our Polycold product line to a third party contract manufacturer and other programs designed to improve our cost structure. Restructuring charges also included facility-related costs incurred in connection with the consolidation of Crossing facilities with our facilities. Restructuring costs recorded in fiscal year 2013 consisted of $0.8 million of facility related costs and $5.5 million of severance costs related to a series of workforce reductions implemented to improve our cost structure by eliminating approximately 200 positions. Restructuring and other charges recorded in fiscal year 2013 also included $0.1 million related to a partial settlement of a defined benefit pension plan that covered substantially all of our Swiss employees.Interest Income was $1.0 million in – During both fiscal years 20142017 and 2013.Interest Expense– During fiscal years 2017 and 2016, we recorded interest expense of 0.4 million and $0.2 million, respectively.Interestinduring fiscal year 2014 and2017 as compared to fiscal year 2016 related to the capital leasefair value measurement of the building and the associated landconvertible debt securities in BioCision. These increases were partially offset by a gain on our Chelmsford, Massachusetts campus. For additional information on this arrangement, please refer to Note 21 "Commitments and Contingencies" to our consolidated financial statements included under "Item 8. Financial Statements and Supplementary Data" of this Form 10-K. Other Income, netOther income, netpension settlement of $0.3 million forrecognized during fiscal year 2014 consisted primarily of $1.4 million of other income, of which $0.6 million was attributable to joint venture management fee income, partially offset by $1.2 million of foreign exchange losses.Other income, net of $1.2 million for fiscal year 2013 consisted primarily of a $1.4 million gain on the sale of certain underutilized buildings in Chelmsford, MA and Oberdiessbach, Switzerland and $0.6 million of joint venture management fee income, partially offset by foreign exchange losses of $0.9 million.Benefitbenefitprovision on continuing operations of $2.0$3.4 million in fiscal year 2014.2017 compared to an income tax provision of $66.3 million in fiscal year 2016. The continuing operations income tax benefitprovision for fiscal year 2017 was primarily comprised of the provision on our earnings during that fiscal year. The continuing operations income tax provision for fiscal year 2016 was primarily driven by U.S. and German pre-tax losses and $1.2 millionthe establishment of reductions in unrecognized tax benefits resulting from the expiration of the statute of limitations in various foreign jurisdictions. These benefits were partially offset by foreign income taxes and interest related to unrecognized tax benefits.Thea full valuation allowance against our U.S. net deferred tax assets including current and noncurrent, decreased from $115.0 million to $83.2 million during the fiscal year 2014. The decrease of $31.8 million was primarily driven by a tax provision of $29.9 million related to the gain on the sale of discontinued operations. The gain on sale of discontinued operations was reported net of the tax effect in the Consolidated Statements of Operations.33We recorded an income tax benefit of $5.0 million in fiscal year 2013. This benefit consisted of deferred tax benefits in the U.S. generated by pre-tax losses and tax credits of $5.1 million. We recorded the benefit in the U.S. because there was no valuation allowance against the deferred tax assets generated in fiscal year 2013. This benefit was partially offset by foreign taxes on profits of our foreign subsidiaries. Additionally, we recorded $1.0 million of tax benefits for the reversal of tax reserves resulting from the expiration of statutes of limitations in certain foreign jurisdictions. The U.S. tax benefit included $0.9 million of U.S. tax credits from fiscal year 2012 that were recognized in fiscal year 2013. These credits were reinstated under The American Taxpayer Relief Act of 2012 that was signed into law on January 2, 2013.Our proportional shareour equity method investments was $1.2 millionthe UCI joint venture in fiscal year 2014 compared to $2.4 million in fiscal year 2013.2017 and 2016. The decrease is driven primarily by lower income from our 50% interest in ULVAC Cryogenics, Inc., a joint venture with ULVAC Corporationdiscontinued operations only includes direct operating expenses incurred that (1) are clearly identifiable as costs being disposed of Japan,upon completion of the sale and (2) will not be continued by the Company on an ongoing basis. Indirect expenses which contributed $1.6 millionsupported the cryogenics business, and which will remain as part of income in fiscal year 2014 as compared to $2.6 million for fiscal year 2013. The remaining decreasethe continuing operations, are not reflected in income from our equity method investments was attributable to higher losses generated by our 50% interest in Yaskawa Brooks Automation, Inc., a joint venture with Yaskawa Electric Corporation of Japan and our proportional share of losses generated by BioCision LLC, a privately-held company based in Larkspur, California, in which we made an equity investment in March 2014. Income from Discontinued Operations, Net of TaxDuring fiscal year 2014, we determined that the Granville-Phillips business was not consistent with our strategy to expand our leadership positions in our core semiconductor and life science sample management market segments. On March 17, 2014, we entered into an agreement to sell the Granville-Phillips business unit to MKS Instruments, Inc. for $87.0 million in cash. The sale was completed on May 30, 2014. We determined that our Granville-Phillips business unit met the criteria to be reported as a discontinued operation. As a result, our historical financial statements have been revised to present the operating results of the Granville-Phillips business as a discontinued operation.Reported revenue was reduced by $19.3 million and $28.5 million, respectively, for the fiscal years 2014 and 2013 for the amounts attributable to Granville-Phillips. The pre-tax income from the discontinued operation was $61.7 million and $7.8 million for the fiscal year 2014 and 2013, respectively. The after-tax income from the discontinued operation was $30.0 million and $5.0 million for the fiscal years 2014 and 2013, respectively. The results of the discontinued operation for the fiscal year 2014 included the pre-tax gain of $56.8 million and the after-tax gain of $26.9 million from the sale of the Granville-Phillips business unit. Tax expense related to the gain on the sale of the business was $29.9 million representing a tax rate of 52.7%, which is higher than the U.S. statutory rate. The goodwill that was disposed of in this transaction had no basis for tax purposes and as a result, increased the gain recognized for tax purposes. The tax charge was substantially non-cash as it was offset by our net operating losses.Liquidity and Capital Resourcesfundsatisfy our currently planned working capital, financing activities, debt service and capital expenditure requirements for the next twelve months. The cyclical nature of our served markets and uncertainty in the current global economic environment uncertainty make it difficult for us to predict longer-term liquidity requirements with sufficient certainty. We may be unable to obtain any required additional financing on terms favorable to us, if at all. If adequate funds are not available to us on acceptable terms or otherwise, we may be unable to successfully develop or enhance products and services, respond to competitive pressure or take advantage of acquisition opportunities, any of which could have a material adverse effect on our business, financial condition and operating results.20152018 and 20142017 consist of the following (in thousands): Year Ended September 30, 2015 2014 Cash and cash equivalents $ 80,722 $ 94,114 Short-term marketable securities 70,021 68,130 Long-term marketable securities 63,287 83,212 $ 214,030 $ 245,456 3420152018 Compared to Fiscal Year Ended September 30, 2014$80.7 million and $94.1$251.2 million at September 30, 2015 and 2014, respectively.2018 as compared to $104.3 million at September 30, 2017. The decrease of $13.4 millionincrease in cash and cash equivalents and marketable securities of $146.9 million was primarily attributable to cash inflows of $197.6 million related to proceeds from the term loan and cash inflows of $74.0 million generated from our operating activities, partially offset by cash payments of $85.8 million related to acquisitions, cash outflows of FluidX and Contact for which we paid $14.5$28.3 million net of cash acquired, and repaid debt of $8.8 million assumed in connection with the acquisition of Contact. Additional uses of cash included $27.0 million of cash dividends paidrelated to dividend payments made to our shareholders, $16.1 million paid for the capital expenditures, including the purchase of the building and the related land, as well as $5.5 million paidcapital expenditure payments of $12.8 million.certain cost method investmentsincome taxes, restructuring activities and BioCision convertible debt securities. These payments were partially offset by inflows of $16.7 million related to net proceeds from sales and maturities of marketable securities and $43.7 million of netother charges impact reported cash provided by operating activities.was $43.7were $74.0 million and $53.8 million in fiscal years 2015 and 2014, respectively. Cash provided by operating activities of $43.7 million induring fiscal year 2015 was2018 comprised primarily of earnings of $120.6 million, including net income of $14.2$116.5 million and the impact of non-cash related charges of $38.4$4.1 million. Partially offsetting these items were the uses of cash of $46.6 million partially offset by net working capital increasesrelated to the changes in our operating assets and liabilities. The changes in operating assets and liabilities that resulted in a use of $8.9 million. Non-cash related chargescash consisted primarily of depreciation and amortization of $25.2 million, stock-based compensation expense of $12.2 million, loss on write down of assets held for sale of $1.9 million and amortization of a premium on marketable securities of $1.2 million, partially offset by a deferred tax benefit of $2.2 million. The increase in working capital was primarily attributable to a decrease in deferred revenue of $6.8 million, an increase in inventories of $5.9 million, an increase in accounts receivable as a result of $5.1 million, an increase in prepaid expenses and other current assets of $2.9 million, a decrease in restructuring charges of $1.2 million and a decrease in accrued compensation and benefits of $1.1 million. These changes were partially offset by an increase in accounts payable of $8.4 millionhigher revenue and an increase in accrued expenses and other current liabilitiesinventory levels to support the growth of $5.3 million. The increase in accounts receivable is primarily attributable to increased shipments in our Brooks Product Solutions segment during the last quarter of fiscal year 2015.Cash used in investing activities was $17.6 million and $17.8 million in fiscal years 2015 and 2014, respectively. Cash used in investing activities of $17.6 million in fiscal year 2015 included $12.7 million for the acquisition of FluidX and Contact along with $1.8 million for the acquisition of certain assets and liabilities of YBA, $16.1 million of capital expenditures, including the purchase of the building and the related land, as well as $5.5 million paid for certain cost method investments and BioCision convertible debt securities.business. These uses of cash were partially offset by $16.7sources of cash related primarily to increases in accounts payable as well as increased accrued compensation and tax withholdings. Cash flows provided by operating activities were $96.2 million during fiscal year 2017 and were comprised primarily of earnings of $96.9 million, including net income of $62.6 million and the impact of non-cash related earnings of $34.3 million. Partially offsetting these items were uses of cash of $0.7 million related to the changes in our operating assets and liabilities. securitiessecurities.$1.8improving information technology infrastructure. Capital expenditures were $12.8 million during fiscal year 2018 as compared to $12.7 million during the fiscal year 2017.liquidationterm loan originated in October 2017, partially offset by cash dividend payments to our shareholders of the YBA joint venture.During fiscal year 2015, we purchased five-year convertible debt securities with a warrant agreement to acquire preferred units of BioCision, LLC for a total purchase price of $5.0 million. Interest$28.3 million and principal payments on the convertible debt securities accrues at a rateterm loan of 9% per annum and is due with the principal upon maturity. For additional information on this arrangement, please refer to Note 9 "Equity Method Investments" to our consolidated financial statements included under "Item 8. Financial Statements and Supplementary Data" of this Form 10-K.$34.0$25.9 million and $24.5 million in fiscal years 2015 and 2014, respectively. Cash used in financing activities of $34.0 million induring fiscal year 2015 was comprised2017 and related primarily of $27.0 million for the quarterlyto cash dividends we paiddividend payments to our shareholders and $8.8 millionshareholders.20142017 Compared to Fiscal Year Ended September 30, 2013$94.1 million and $83.0$104.3 million at September 30, 2014 and 2013, respectively.2017 as compared to $91.2 million at September 30, 2016. The increase in cash and cash equivalents and marketable securities of $11.1$13.1 million was primarily dueattributable to $85.4cash inflows of $96.2 million generated from our operating activities, partially offset by cash outflows related to acquisitions of $44.8 million, dividends payments to our shareholders of $27.9 million, and capital expenditure payments of $12.7 million during fiscal year 2017.proceeds received fromincome of $62.6 million and the saleimpact of divested businesses and $53.8 millionnon-cash related earnings of $34.3 million. Partially offsetting these items were uses of cash flow from operations.of $0.7 million related to the changes in our operating assets and liabilities. The changes in operating assets and liabilities that resulted in a use of cash consisted primarily of an increase in accounts receivable as a result of higher revenue and an increase in inventory levels to support the growth of our business. These sourcesuses of cash were partially offset by $62.2 million of net purchases of marketable securities, $35.6 million used in acquisitions and $22.9 millionsources of cash dividends paidrelated primarily to our shareholders.was $53.8were $39.5 million and $54.4 million in fiscal years 2014 and 2013, respectively. Cash provided by operating activities of $53.8 million induring fiscal year 2014 was2016 and were comprised primarily of $31.5earnings of $39.3 million, including the impact of net income adjusted by $8.2 million for non-cash related chargesearnings of $108.8 million and $14.1 milliona net loss of net working capital improvements. Non-cash related charges in fiscal year 2014 consisted$69.5 million. Partially offsetting these items were sources of $23.5 millioncash of depreciation and amortization and $10.9 million of stock-based compensation, partially offset by $27.4$0.2 million related to gainsthe changes in our operating assets and liabilities.sale of divested businesses. The decrease in working capital was primarily due to a $12.1 million decrease in accounts receivable and a $9.6 million decrease in inventory.$17.8$54.2 million and $7.1during fiscal year 2017 as compared to $10.9 million induring fiscal years 2014 and 2013, respectively.year 2017. Cash used in investing activities of $17.8$54.2 million induring fiscal year 20142017 included $62.2$44.8 million for acquisitions and $12.7 million of net purchasescapital expenditures, offset by $3.6 million of marketable35securities, $35.6marketable securities. Cash used in investing activities of $10.9 million usedduring fiscal year 2016 included $125.2 million for the acquisition of DMS and our investment in BioCision, LLC and $5.5BioStorage, $12.8 million of capital expenditures and the disbursement of $1.8 million for a loan provided to BioCision, partially offset by $85.4$139.4 million of net proceeds from the salesales and maturities of divested businesses.$24.5$25.9 million and $19.5during fiscal year 2017 as compared to $26.0 million induring fiscal years 2014 and 2013, respectively.year 2016. Cash used in financing activities of $24.5 million in both fiscal year 2014 was comprised of $22.9 million for the quarterlyyears 2017 and 2016 related primarily to cash dividends paiddividend payments to our shareholders of $27.9 million and an additional $3.2$27.5 million, to acquire the outstanding interestrespectively, partially offset by proceeds from issuance of our majority-owned subsidiarycommon stock.Korea.Contractual Obligations and RequirementsOur contractual obligations were as follows at September 30, 2015 (in thousands): Total Thereafter Contractual Cash Obligations: Operating leases $ 7,142 $ 3,097 $ 3,321 $ 724 $ — Pension funding 3,500 382 105 166 2,847 Other purchase commitments 80,345 78,687 1,626 32 — Total contractual cash obligations $ 90,987 $ 82,166 $ 5,052 $ 922 $ 2,847 Other Commercial Commitments: Letters of credit $ 3,543 $ 2,349 $ 1,194 $ — $ — Total commitments $ 94,530 $ 84,515 $ 6,246 $ 922 $ 2,847 The lettersa discount of credit of approximately $3.5$2.4 million, are related primarily to customer advances and other performance obligations at September 30, 2015. These arrangements guarantee the refund of advance payments received from our customers in the event that the product is not delivered or warranty obligations are not fulfilled in accordance with the contract terms. These obligations could be called by the beneficiaries at any time before the expiration date of the particular letter of credit should we fail to meet certain contractual requirements. None of these obligations were called in fiscal year 2015 and we currently do not anticipate any of these obligations to be called in the near future.During fiscal year 2015, we were leasing the building and the related land on our Chelmsford, Massachusetts campus. We began leasing the building in fiscal year 2002 and exercised a renewal option in March 2014 to extend the lease term until March 2018 and purchase the building1.2%, which represented loan origination fees paid at the endclosing. The loan proceeds are used for acquisition and general corporate purposes.2015,2018, the totaloutstanding term loan principal balance was $198.5 million, excluding unamortized deferred financing costs of $2.4 million. The term loan matures and becomes fully payable on October 4, 2024. Installment principal payments equal to 0.25% of the initial principal amount of net unrecognized tax benefits for uncertain tax positionsthe term loan are payable on the last day of each quarter, with any remaining principal amount becoming due and payable on the accrual for the related interest was $3.6maturity date. During fiscal year 2018, we made principal payments of $1.5 million all of which represents a potential future cash outlay. We are unable to make a reasonably reliable estimate of the timing of the cash settlement for this liability since the timing of future tax examinations by various tax jurisdictions and the related resolution is uncertain.We utilize a third party to manage our manufacturing operations in Mexico. As a part of this arrangement, we make and guarantee the monthly payments for a lease of the Mexico facility which expires in January 2018. The remaining payments under the lease were approximately $1.0 million as of September 30, 2015.On September 29, 2015, our Board of Directors approved a share repurchase program for upterm loan. Subject to $50 million worth of our common stock. The timing and amount of any shares repurchased are based on market and businesscertain conditions legal requirements and other factors andstated in the term loan agreement, we may be commenced or suspendedredeem the term loan at any time at our discretion.option without a significant premium or penalty, except for a repricing transaction, as defined in the term loan agreement. We expectwould also be required to fund share repurchases through cashredeem the term loan at the principal amount then outstanding upon the occurrence of certain events, as set forth in the term loan agreement.handeither LIBOR, the federal funds effective rate or the prime rate plus an applicable percentage. As a result, we may experience exposure to interest rate risk due to the potential volatility associated with the variable interest rates on the term loan. If rates increase, we may be subject to higher costs of servicing the loan which could reduce our profitability and cash generatedflows. During fiscal year 2018, the weighted average stated interest rate on the term loan was 4.4%. During fiscal year 2018, we incurred cash interest expense of $8.7 million on the term loan. Our debt service requirements are expected to be funded through our existing sources of liquidity and operating cash flows.operations.available borrowings under the line of credit will reduce upon the closure of the sale of our semiconductor cryogenics business. There were no shares repurchasedamounts outstanding pursuant to the line of credit as of September 30, 2018. The amount of funds available for borrowing under this programthe line of credit arrangement may fluctuate each period based on our borrowing base availability. The line of credit contains certain customary representations and warranties, a financial covenant, affirmative and negative covenants, as well as events of default. We were in compliance with the line of credit covenants as of September 30, 2018. Although we believe we will be able to generate sufficient cash in the United States and foreign jurisdictions to fund future operating costs, we secured the revolving line of credit as an additional assurance for maintaining liquidity in the United States during fiscal year 2015.June 25, 2013,July 27, 2016, we filed a shelf registration statement on Form S-3S‑3 with the SEC to sell up to $200 million of securities, before any fees or expenses of the offering. Securities that may be sold includeincluding common stock, preferred stock, warrants, debt securities, depository shares, purchase contracts and purchase units.units in amounts to be determined at the time of an offering. Any such offering, if it does occur, may happen in one or more transactions. SpecificThe specific terms of any securities to be sold will be described in supplemental filings with the SEC. This registration statement will expire on July 1, 2016.27, 2019.3620152018 and 20142017 (in thousands, except per share data):Declaration Date Total Fiscal year Ended September 30, 2015 November 5, 2014 $ 0.10 December 5, 2014 December 26, 2014 $ 6,731 February 4, 2015 0.10 March 6, 2015 March 27, 2015 6,748 April 28, 2015 0.10 June 5, 2015 June 26, 2015 6,749 August 5, 2015 0.10 September 4, 2015 September 25, 2015 6,763 Fiscal year Ended September 30, 2014 November 12, 2013 $ 0.08 December 6, 2013 December 27, 2013 $ 5,391 February 5, 2014 0.08 March 7, 2014 March 28, 2014 5,408 May 7, 2014 0.08 June 6, 2014 June 27, 2014 5,344 July 30, 2014 0.10 September 5, 2014 September 26, 2014 6,732 4, 2015,6, 2018, our Board of Directors approved a cash dividend of $0.10 per share of our common stock. The total dividend of approximately $6.9$7.2 million will be paid on December 22, 201520, 2018 to shareholders of record at the close of business on December 4, 2015.7, 2018. Dividends are declared at the discretion of our Board of Directors and depend on actual cash flow from operations, our financial condition, capital requirements and any other factors our Board of Directors may consider relevant. We intend to pay quarterly cash dividends in the future; however, the amount and timing of these dividends may be impacted by the cyclical nature of certain markets we serve. We may reduce, delay or cancel a quarterly cash dividend based on the severity of a cyclical downturn.Off-Balance Sheet Arrangements2015,2018, the total amount of net unrecognized tax benefits for uncertain tax positions and the accrual for the related interest was $3.5 million, all of which represents a potential future cash outlay. In comparison to September 30, 2017 where the balance was $3.9 million. The reduction largely has to do with the statute of limitations lapsing on certain positions throughout the year. We are unable to make a reasonably reliable estimate of the timing of the cash settlement for this liability since the timing of future tax examinations by various tax jurisdictions and the related resolution is uncertain. significant off-balance sheet arrangements, as defined in Item 303(a)(4)(ii) of SEC Regulation S-K.Recently Issued Accounting PronouncementsIn September 2015, the Financial Accounting Standards Board, or FASB, issued a new accounting guidance to simplify the presentation of measurement-period adjustments recognized in business combinations. Measurement-period adjustments will be recognized in the period they are determined, an acquirer will be required to record in earnings the effect of these adjustments. The guidance is effective for fiscal years, and interim periods within those years, beginning after December 15, 2015 and should be applied prospectively to the adjustments that occur after the effective date of the guidance. Early application is permitted for the financial statements that have not been issued. We will adopt the guidance during the first quarter of fiscal year 2017. We are currently evaluating the impact of the guidance on our financial position and results of operations.In July 2015, the FASB, issued a new accounting guidance amending the inventory measurement. Inventory will be measured at the lower of cost or net realizable value defined as the estimated selling price in the ordinary course of business, net of costs of completion, disposal and transportation. The guidance is effective for fiscal years, and interim periods within those years, beginning after December 15, 2016 and should be applied prospectively. Early adoption is permitted as of the beginning of an interim or annual reporting period. We will adopt the guidance during the first quarter of fiscal year 2018. We are currently evaluating the impact of the guidance on our financial position and results of operations.In February 2015, the FASB issued an amendment to the accounting guidance for consolidations of financial statements by changing the analysis that a reporting entity must perform to determine whether it should consolidate certain types of legal entities. The guidance is effective for fiscal years, and interim periods within those years, beginning after December 15, 2015. Early adoption is permitted. The guidance can be adopted either via a full retrospective approach or a modified retrospective approach by recording a cumulative-effect adjustment to beginning equity in the period of adoption. We will adopt the guidance during the first quarter of fiscal year 2017. We are currently evaluating the impact of the guidance on our financial position and results of operations.In January 2015, the FASB issued new accounting guidance to simplify income statement classification by removing the concept of extraordinary items from Generally Accepted Accounting Principles, or GAAP. As a result, items that are both unusual in nature and infrequent in occurrence will no longer be separately reported net of tax after the results of continuing operations. The guidance is effective for fiscal years, and interim periods within those years, beginning after December 15, 2015 and can be adopted retrospectively or prospectively based on an entity's election. Early adoption is37permitted. We will adopt the guidance during the first quarter of fiscal year 2017. The adoption of the guidance is not expected to have a material impact on our financial position and results of operations.In May 2014, the FASB issued new accounting guidance for reporting revenue recognition. The guidance provides for the recognition of revenue when promised goods or services are transferred to customers in an amount that reflects the consideration that is expected to be received for those goods or services. A five-step process set forth in the guidance may require more judgment and estimation within the revenue recognition process than the current GAAP, including identifying performance obligations in the contract, estimating the amount of variable consideration to include in the transaction price and allocating the transaction price to each separate performance obligation. The guidance was initially effective for fiscal years, and interim periods within those years, beginning after December 15, 2016. In August 2015, the FASB issued an amendment deferring the effective date of the guidance by one year. The guidance should be adopted retrospectively either for each reporting period presented or via recognizing the cumulative effect at the date of the initial application. Early adoption is permitted only as of annual reporting periods, including the interim periods, beginning after December 15, 2016. We will adopt the guidance during the first quarter of fiscal year 2019. We are currently evaluating the impact of this guidance on our financial position and results of operations.In April 2014, the FASB issued an amendment to the accounting guidance for reporting discontinued operations. The amended guidance raises the threshold for disposals to qualify as a discontinued operation by requiring a component of an entity that is held for sale, or has been disposed of by sale, to represent a strategic shift that has or will have a major effect on operations and financial results. A strategic shift could include the disposal of a major line of business, a major geographical area, a major equity method investment or other major parts of an entity. In addition, the guidance allows companies to have significant continuing involvement and continuing cash flows with the discontinued operation. The guidance is effective for fiscal years, and interim periods within those years, beginning on or after December 15, 2014 and should be applied prospectively. Early adoption is permitted for disposals, or assets classified as held for sale, that have not been previously reported in financial statements. We did not apply the provisions of this guidance to the Granville-Phillips discontinued operation. We will adopt the guidance during the first quarter of fiscal year 2016. We are currently evaluating the impact of the guidance on our financial position and results of operations.In July 2013, the FASB issued an amendment to the accounting guidance for presentation of unrecognized tax benefits. The prior guidance related to unrecognized tax benefits did not explicitly address financial statement presentation of unrecognized tax benefits when a net operating loss carryforward, a similar tax loss or a tax credit carryforward existed. The guidance eliminated the existing diversity in practice in the presentation of unrecognized tax benefits related to these instances. An unrecognized tax benefit, or a portion of an unrecognized tax benefit, is presented in the financial statements as a reduction of a deferred tax asset when an operating loss carryforward, a similar tax loss or a tax credit carryforward exists, with limited exceptions. The guidance is effective for fiscal years, and interim periods within those years, beginning after December 15, 2013 and should be applied prospectively. We adopted the guidance during the first quarter of fiscal year 2015, which had no material impact on our financial position or results of operations.Item 7A.Quantitative and Qualitative Disclosures About Market RiskOurAt September 30, 2018 and 2017, our aggregate short-term and long-term investments consistwere $53.5 million and $2.7 million, respectively, and consisted mostly of highly rated corporate debt securities U.S. Treasury securities, and obligations of U.S. Government Agencies and other municipalities.municipal securities. At September 30, 2015,2018, the unrealized loss position on marketable securities was $30,000,insignificant, which is included in “Accumulated other comprehensive income” in the Consolidated Balance Sheets. There were no securities in an unrealized loss position as of September 30, 2017. A hypothetical 100 basis point change in interest rates would result in an annual change of approximately $1.4$1.0 million and less than $0.1 million, respectively, in interest income earned.35%34% and 38%, respectively, of our total sales for the fiscal yearyears ended September 30, 2015.2018 and 2017. These foreign sales were made primarily by our foreign subsidiaries, which have cost structures that substantially align with the currency of sale.38thatand accounts receivable which are subject to foreign currency exposure. These short-term advancesSuch balances were approximately $14.2$84.7 million and $51.6 million, respectively, at September 30, 2015,2018 and relate2017, and related to the Euro, British Pound and a variety of Asian currencies. We mitigate the impact of potential currency translation losses on these short-term intercompany advances by the timely settlement of each transaction, generally within 30 days. We also utilize forward contracts to mitigate our exposures to currency movement. We incurred a foreign currency gainlosses of $0.5$3.3 million for theand $2.3 million, respectively, in fiscal year ended September 30, 2015,years 2018 and 2017, which relatesrelated to the currency fluctuation on these advancesbalances between the time the transaction occursoccurred and the ultimate settlement of the transaction. A hypothetical 10% change in foreign exchange rates at September 30, 2015 would result in a $0.1change of $4.9 million changeand $0.5 million, respectively, in our net income.income during fiscal year 2018 and 2017.39Item 8.Financial Statements and Supplementary Data50 52 53 54 55 56 57 40REPORT OF INDEPENDENT REGISTERED PUBLIC ACCOUNTING FIRMChelmsford, Massachusetts20152018 and 20142017, and the related consolidated statements of operations, of comprehensive income (loss), of changes in equity, and of cash flows for each of the three years in the three-year period ended September 30, 2015. These2018, including the related notes (collectively referred to as the “consolidated financial statements arestatements”). We also have audited the responsibilityCompany's internal control over financial reporting as of September 30, 2018, based on criteria established in Internal Control - Integrated Framework (2013) issued by the Committee of Sponsoring Organizations of the Company’s management. Our responsibility is to express an opinion on these financial statements based on our audits.We conducted our audits in accordance with the standards of the Public Company Accounting Oversight Board (United States)Treadway Commission (COSO). Those standards require that we plan and perform the audit to obtain reasonable assurance about whether the financial statements are free of material misstatement. An audit also includes examining, on a test basis, evidence supporting the amounts and disclosures in the financial statements, assessing the accounting principles used and significant estimates made by management, as well as evaluating the overall presentation of the financial statements. We believe that our audits provide a reasonable basis for our opinion.Brooks Automation, Inc. atthe Company as of September 30, 20152018 and 20142017, and the results of itstheir operations and itstheir cash flows for each of the three years in the three-year period ended September 30, 2015,2018 in conformity with accounting principles generally accepted in the United States of America.We also have audited, Also in accordance withour opinion, the standards of the Public Company Accounting Oversight Board (United States), Brooks Automation, Inc.’smaintained, in all material respects, effective internal control over financial reporting as of September 30, 2015,2018, based on criteria established in the 2013 Internal Control - Integrated Framework (2013) issued by the Committee of Sponsoring OrganizationsCOSO.Treadwayeffectiveness of internal control over financial reporting, included in Management's Report on Internal Control over Financial Reporting appearing under Item 9A. Our responsibility is to express opinions on the Company’s consolidated financial statements and on the Company's internal control over financial reporting based on our audits. We are a public accounting firm registered with the Public Company Accounting Oversight Board (United States) ("PCAOB") and are required to be independent with respect to the Company in accordance with the U.S. federal securities laws and the applicable rules and regulations of the Securities and Exchange Commission (COSO) and the PCAOB.report dated November 5, 2015 expressedaudits in accordance with the standards of the PCAOB. Those standards require that we plan and perform the audits to obtain reasonable assurance about whether the consolidated financial statements are free of material misstatement, whether due to error or fraud, and whether effective internal control over financial reporting was maintained in all material respects. unqualified opinion thereon.understanding of internal control over financial reporting, assessing the risk that a material weakness exists, and testing and evaluating the design and operating effectiveness of internal control based on the assessed risk. Our audits also included performing such other procedures as we considered necessary in the circumstances. We believe that our audits provide a reasonable basis for our opinions./s/ BDO USA, LLPBoston, MassachusettsNovember 5, 201541 September 30,
2015 September 30,
2014 (In thousands, except share and per share data) Assets Current assets Cash and cash equivalents $ 80,722 $ 94,114 Marketable securities 70,021 68,130 Accounts receivable, net 86,448 80,106 Inventories 100,619 93,567 Deferred tax assets 17,609 19,009 Assets held for sale 2,900 — Prepaid expenses and other current assets 15,158 19,387 Total current assets 373,477 374,313 Property, plant and equipment, net 41,855 50,183 Long-term marketable securities 63,287 83,212 Long-term deferred tax assets 70,476 67,563 Goodwill 121,408 109,501 Intangible assets, net 55,446 59,550 Equity method investments 24,308 28,944 Other assets 9,397 4,772 Total assets $ 759,654 $ 778,038 Liabilities and equity Current liabilities Accounts payable $ 44,890 $ 33,740 Capital lease obligation — 881 Deferred revenue 17,886 26,279 Accrued warranty and retrofit costs 6,089 6,499 Accrued compensation and benefits 20,401 21,663 Accrued restructuring costs 2,073 3,475 Accrued income taxes payable 6,111 1,808 Deferred tax liabilities 1,251 808 Accrued expenses and other current liabilities 15,550 18,688 Total current liabilities 114,251 113,841 Long-term capital lease obligation — 7,417 Long-term tax reserves 3,644 5,708 Long-term deferred tax liabilities 3,196 2,567 Long-term pension liability 3,118 1,774 Other long-term liabilities 3,400 3,842 Total liabilities 127,609 135,149 Commitments and contingencies (Note 21) Equity Preferred stock, $0.01 par value- 1,000,000 shares authorized, no shares issued or outstanding — — Common stock, $0.01 par value- 125,000,000 shares authorized, 81,093,052 shares issued and 67,631,183 shares outstanding at September 30, 2015, 80,375,777 shares issued and 66,913,908 shares outstanding at September 30, 2014 811 804 Additional paid-in capital 1,846,357 1,834,619 Accumulated other comprehensive income 5,898 15,687 Treasury stock, at cost- 13,461,869 shares (200,956 ) (200,956 ) Accumulated deficit (1,020,065 ) (1,007,265 ) Total equity 632,045 642,889 Total liabilities and equity $ 759,654 $ 778,038 42 Year ended September 30, 2015 2014 2013 (In thousands, except per share data) Revenue Product $ 457,411 $ 387,032 $ 335,011 Services 95,297 95,816 87,429 Total revenue 552,708 482,848 422,440 Cost of revenue Product 307,865 252,688 229,411 Services 55,738 62,823 60,722 Total cost of revenue 363,603 315,511 290,133 Gross profit 189,105 167,337 132,307 Operating expenses Research and development 52,232 52,649 46,209 Selling, general and administrative 115,270 111,098 96,516 Restructuring and other charges 4,713 6,289 6,380 Total operating expenses 172,215 170,036 149,105 Operating income (loss) 16,890 (2,699 ) (16,798 ) Interest income 899 950 1,032 Interest expense (395 ) (202 ) (2 ) Other income, net 421 256 1,227 Income (loss) before income taxes and earnings (losses) of equity method investments 17,815 (1,695 ) (14,541 ) Income tax provision (benefit) 3,430 (1,980 ) (4,985 ) Income (loss) before earnings (losses) of equity method investments 14,385 285 (9,556 ) Equity in (losses) earnings of equity method investments (164 ) 1,235 2,442 Income (loss) from continuing operations 14,221 1,520 (7,114 ) Income from discontinued operations, net of tax — 30,002 4,964 Net income (loss) 14,221 31,522 (2,150 ) Net income attributable to noncontrolling interests — (161 ) (65 ) Net income (loss) attributable to Brooks Automation, Inc. $ 14,221 $ 31,361 $ (2,215 ) Basic net income (loss) per share attributable to Brooks Automation, Inc. common stockholders: Income (loss) from continuing operations $ 0.21 $ 0.02 $ (0.11 ) Income from discontinued operations, net of tax — 0.45 0.08 Basic net income (loss) per share attributable to Brooks Automation, Inc. $ 0.21 $ 0.47 $ (0.03 ) Diluted net income (loss) per share attributable to Brooks Automation, Inc. common stockholders: Income (loss) from continuing operations $ 0.21 $ 0.02 $ (0.11 ) Income from discontinued operations, net of tax — 0.44 0.08 Diluted net income (loss) per share attributable to Brooks Automation, Inc. common stockholders $ 0.21 $ 0.46 $ (0.03 ) Dividend declared per share $ 0.40 $ 0.34 $ 0.32 Weighted-average shares used in computing earnings (loss) per share: Basic 67,411 66,648 65,912 Diluted 68,549 67,644 65,912 43 Year ended September 30, 2015 2014 2013 (In thousands) Net income (loss) $ 14,221 $ 31,522 $ (2,150 ) Comprehensive income (loss), net of tax: Change in cumulative foreign currency translation adjustments, net of tax effects of $21, ($580), and $376 for fiscal years 2015, 2014 and 2013 (9,557 ) (6,296 ) (2,113 ) Change in unrealized gains (losses) on available for sale securities, net of tax effects of $(83), $62, and $79 for fiscal years 2015, 2014 and 2013 141 (104 ) (135 ) Change in fair value of cash flow hedges, net of tax impact of $9 and ($9) for fiscal years 2014 and 2013 — (14 ) 14 Actuarial (losses) gains, net of tax effects of $115, $471, and ($360) for fiscal years 2015, 2014 and 2013 (605 ) (503 ) 1,109 Pension settlement 232 — 87 Comprehensive income (loss), net of tax 4,432 24,605 (3,188 ) Comprehensive income attributable to noncontrolling interests — (161 ) (65 ) Comprehensive income (loss) attributable to Brooks Automation, Inc., net of tax $ 4,432 $ 24,444 $ (3,253 ) 44 Year ended September 30, 2015 2014 2013 (In thousands) Cash flows from operating activities Net income (loss) $ 14,221 $ 31,522 $ (2,150 ) Adjustments to reconcile net income (loss) to net cash provided by operating activities: Depreciation and amortization 25,160 23,459 24,155 Impairment of intangible assets — 398 1,960 Impairment of other assets — 2,621 — Stock-based compensation 12,159 10,912 7,757 Amortization of premium on marketable securities 1,193 1,255 1,274 Undistributed losses (earnings) of equity method investments 164 (1,235 ) (2,442 ) Deferred income tax benefit (2,173 ) (1,779 ) (2,936 ) Loss on write-downs of assets held for sale 1,944 — — Pension settlement 232 — 87 Gain on disposal of businesses (85 ) (27,444 ) — Loss (gain) on disposal of long-lived assets — 13 (1,394 ) Changes in operating assets and liabilities, net of acquisitions and disposals: Accounts receivable (5,134 ) 12,098 6,422 Inventories (5,919 ) 9,598 15,490 Prepaid expenses and other current assets (2,875 ) (12,325 ) 4,359 Accounts payable 8,358 (11,924 ) 3,123 Deferred revenue (6,779 ) 5,900 8,971 Accrued warranty and retrofit costs (407 ) (1,102 ) (1,806 ) Accrued compensation and benefits (1,148 ) 6,783 (2,625 ) Accrued restructuring costs (1,247 ) 2,161 (972 ) Accrued pension costs 812 997 (950 ) Accrued expenses and other current liabilities 5,251 1,873 (3,934 ) Net cash provided by operating activities 43,727 53,781 54,389 Cash flows from investing activities Purchases of property, plant and equipment (16,146 ) (5,518 ) (3,635 ) Purchases of marketable securities (87,333 ) (174,287 ) (91,740 ) Sales and maturities of marketable securities 104,008 112,085 145,023 Proceeds from divestitures — 85,369 — Acquisitions, net of cash acquired (14,450 ) (35,625 ) (68,331 ) Decrease in restricted cash — 177 586 Proceeds from liquidation of joint venture 1,778 — — Other investments (5,500 ) — — Proceeds from sales of property, plant and equipment 6 — 14,082 Payments of deferred leasing costs — — (3,134 ) Net cash used in investing activities (17,637 ) (17,799 ) (7,149 ) Cash flows from financing activities Proceeds from issuance of common stock, net of issuance costs 1,807 1,838 1,851 Principal repayments of capital lease obligations — (239 ) — Acquisitions of noncontrolling interest — (3,189 ) — Repayment of debt assumed in business acquisition (8,829 ) — — Common stock dividends paid (26,992 ) (22,875 ) (21,328 ) Net cash used in financing activities (34,014 ) (24,465 ) (19,477 ) Effects of exchange rate changes on cash and cash equivalents (5,468 ) (374 ) 569 Net (decrease) increase in cash and cash equivalents (13,392 ) 11,143 28,332 Cash and cash equivalents, beginning of year 94,114 82,971 54,639 Cash and cash equivalents, end of year $ 80,722 $ 94,114 $ 82,971 Supplemental disclosures: Cash paid for interest $ 395 $ 202 $ 2 Cash paid (refunded) for income taxes, net $ 3,883 $ 1,084 $ (762 ) 45Supplemental disclosure of non-cash investing and financing activities: Acquisition of buildings and land through capital lease $ — $ 8,537 $ — Derecognition of a capital lease obligation and the related assets 7,804 — — 46CONSOLIDATED STATEMENTS OF CHANGES IN EQUITY Common
Stock
Shares Common
Stock at
Par
Value Additional
Paid-In
Capital Accumulated
Other
Comprehensive
Income Accumulated
Deficit Treasury
Stock Total
Brooks
Automation,
Inc.
Stockholders’
Equity Noncontrolling
Interests in
Subsidiaries Total
Equity (In thousands, except share data) Balance September 30, 2012 79,790,557 $ 798 $ 1,817,706 $ 23,642 $ (992,524 ) $ (200,956 ) $ 648,666 $ 635 $ 649,301 Shares issued under stock option, restricted stock and purchase plans, net 248,547 2 186 188 188 Stock-based compensation 7,607 7,607 7,607 Common stock dividends declared (21,252 ) (21,252 ) (21,252 ) Net loss (2,215 ) (2,215 ) 65 (2,150 ) Foreign currency translation adjustments, net of tax effects of $376 (2,113 ) (2,113 ) (2,113 ) Changes in unrealized losses on marketable securities, net of tax effects of $79 (135 ) (135 ) (135 ) Changes in unrealized gains on cash flow hedges, net of tax effects of ($9) 14 14 14 Actuarial gains arising in the year, net of tax effects of ($360) 1,109 1,109 1,109 Recognition of pension settlement in earnings 87 87 87 Balance September 30, 2013 80,039,104 800 1,825,499 22,604 (1,015,991 ) (200,956 ) 631,956 700 632,656 Shares issued under restricted stock and purchase plans, net 336,673 4 386 390 390 Stock-based compensation 11,062 11,062 11,062 Common stock dividends declared (22,635 ) (22,635 ) (22,635 ) Acquisition of noncontrolling interest (2,328 ) (2,328 ) (861 ) (3,189 ) Net income 31,361 31,361 161 31,522 Foreign currency translation adjustments, net of tax effects of ($580) (6,296 ) (6,296 ) (6,296 ) Changes in unrealized losses on marketable securities, net of tax effects of $62 (104 ) (104 ) (104 ) Changes in unrealized losses on cash flow hedges, net of tax effects of $9 (14 ) (14 ) (14 ) Actuarial losses arising in the year, net of tax effects of $471 (503 ) (503 ) (503 ) Balance September 30, 2014 80,375,777 804 1,834,619 15,687 (1,007,265 ) (200,956 ) 642,889 — 642,889 Shares issued under restricted stock and purchase plans, net 717,275 7 (421 ) (414 ) (414 ) Stock-based compensation 12,159 12,159 12,159 Common stock dividends declared (27,021 ) (27,021 ) (27,021 ) Net income 14,221 14,221 14,221 Foreign currency translation adjustments, net of tax effects of $21 (9,557 ) (9,557 ) (9,557 ) Changes in unrealized gains on marketable securities, net of tax effects of ($83) 141 141 141 Actuarial losses arising in the year, net of tax effects of $115 (605 ) (605 ) (605 ) Recognition of pension settlement in earnings 232 232 232 Balance September 30, 2015 81,093,052 $ 811 $ 1,846,357 $ 5,898 $ (1,020,065 ) $ (200,956 ) $ 632,045 $ — $ 632,045 The accompanying notes are an integral part of these consolidated financial statements.47BROOKS AUTOMATION, INC.worldwideglobal provider of automation and cryogenic solutions for multiple markets. The Company primarily serves two distinct and unrelated markets: the semiconductor capital equipment market and the life sciences sample management market. The Company believes its leadership positions and its global support capability in each of these markets includingmakes it a valued business partner to the largest semiconductor capital equipment and device makers, and pharmaceutical and life sciences biological sample managementscience research institutions in the world. The Company’s offerings are also applied to other adjacent technology and storage. The Company's technologies, engineering competenciesindustrial markets, and global service capabilities provide customers speed to market and ensure high uptime and rapid response, which equate to superior value in their mission-critical controlled environments. Since 1978, the Company has been a leading partner to the global semiconductor manufacturing markets. The Company has expanded its products andprovides customer support services through product development initiatives and strategic business acquisitions to meet the needs of customers in the life science and technology markets adjacent to semiconductor.secondfourth quarter of fiscal year 2014,2018, the Company entered into a definitive agreement to sell its semiconductor cryogenics business to Edwards Vacuum LLC (a member of the Atlas Copco Group), (the “Disposition”). The Company determined that its Granville-Phillips Gas Analysis & Vacuum Measurement, or Granville-Phillips,the cryogenics business met the “held for sale” criteria and the “discontinued operations” criteria in accordance with Financial Accounting Standard Boards (“FASB”) Accounting Standards Codification (“ASC”) 205, Presentation of being reportedFinancial Statements, (“FASB ASC 205”) as aof September 30, 2018 (please refer to Note 3, “Discontinued Operations” for further information about the discontinued operation. As a result, the Company’s historical financial statements have been revised to present the operating results of the Granville-Phillips business as a discontinued operation.business). The results of operations from the Granville-Phillips business are presented as “Income from discontinued operations, net of tax” in theConsolidated Balance Sheets and Consolidated Statements of Operations. The Company has not separated cash flowsOperations, and the notes to the Consolidated Financial Statements were restated for all periods presented to reflect the discontinuation of the Granville-Phillipscryogenics business, from those of its continuing operations and has not revised its historical statements of cash flows. Unless otherwise noted, thein accordance with FASB ASC 205. The discussion in the notes to these consolidated financial statements relatesConsolidated Financial Statements, unless otherwise noted, relate solely to the Company's continuing operations.consolidated financial statementsConsolidated Financial Statements include the accounts of the Company and its majority-owned subsidiaries. All intercompany balances and transactions have been eliminated in consolidation. The Company applies equity method of accounting to investments that provide it with ability to exercise significant influence over the entities in which it lacks controlling financial interest and is not a primary beneficiary.purchaseacquisition method of accounting, in accordance with which assets acquired and liabilities assumed are recorded at their respective fair values at the acquisition date. The fair value of the consideration paid, including contingent consideration, is assigned to the assets acquired and liabilities assumed based on their respective fair values. Goodwill represents excess of the purchase price over the estimated fair values of the assets acquired and liabilities assumed.intangibles and their estimated useful lives.intangibles. Fair value and useful life determinations are based on, among other factors, estimates of future expected cash flows, royalty cost savings and appropriate discount rates used in computing present values. These judgments may materially impact the estimates used in allocating acquisition date fair values to assets acquired and liabilities assumed, as well as the Company'sCompany’s current and future operating results. Actual results may vary from these estimates which may result in adjustments to goodwill and acquisition date fair values of assets and liabilities during a measurement period or upon a final determination of asset and liability fair values, whichever occurs first. Adjustments to fair values of assets and liabilities made after the end of the measurement period are recorded within the Company'sCompany’s operating results.Changes in the fair value of a contingent consideration resulting from a change in the underlying inputs are recognized in results of operations until the arrangement is settled.48NOTES TO CONSOLIDATED FINANCIAL STATEMENTS - (Continued)Company'sCompany’s Consolidated Statements of Operations. Net foreign currency transaction and remeasurement gains (losses)losses totaled $0.5$3.3 million, $(1.2)$2.3 million and $(0.9)$1.9 million for the fiscal years ended September 30, 2015, 20142018, 2017 and 2013,2016, respectively.Company'sCompany’s subsidiaries is based on their financial and operational environment and is the local currency of all of the Company'sCompany’s foreign subsidiaries. The subsidiaries'subsidiaries’ assets and liabilities are translated into the reporting currency at period-end exchange rates, while revenue, expenses, gains and losses are translated at the average exchange rates during the period. Gains and losses from foreign currency translations are recorded in accumulated other comprehensive income in the Company'sCompany’s Consolidated Balance Sheets and presented as a component of comprehensive income (loss) in the Company'sCompany’s Consolidated Statements of Comprehensive Income (Loss).Company'sCompany’s investment policy which provides guidelines and limits regarding investments type, concentration, credit quality and maturity terms aimed at maintaining liquidity and reducing risk of capital loss.A majority of the Company’s customers is concentrated in the semiconductor industry. Company's topCompany’s ten largest customers accounted for approximately 38%34%, 37%35% and 40%35% of its consolidated revenue for the fiscal years ended September 30, 2015, 20142018, 2017 and 2013,2016, respectively. One customerNo customers accounted for approximately 12%, 11%, and 11%, respectively, inmore than 10% of the Company’s consolidated revenue for fiscal years ended September 30, 2015, 20142018, 2017 and 2013.Company'sCompany’s financial instruments consist of cash and cash equivalents, marketable securities, derivative instruments, term loan, accounts receivable, note receivable, convertible debt securities, stock warrants and accounts payable.49NOTES TO CONSOLIDATED FINANCIAL STATEMENTS - (Continued)and derivative instruments and term loan are measured at fair value based on quoted market prices or observable inputs other than quoted market prices for identical or similar assets or liabilities.Convertible debt securities are measured at fair value based on the probability-weighted expected return method utilizing various scenarios for the expected payout of the instrument covering the full range of the potential outcomes. Fair value of the asset securities is based upon the present value of the probability of each future outcome becoming available to the asset and the economic rights and preferences of each asset.Stock warrants are measured at fair value based on the Black-Scholes model which incorporates the constant price variation of the underlying asset, the time value of money, the warrant’s strike price and the time to the warrant’s expiration date.Note receivable is measured at fair value on non-recurring basis. The Company considers the subordination features of the note and the fair value of the collateral determined based on valuation techniques, principally the discounted cash flow method. The fair value of the note receivable could be different under different conditions or different assumptions, including the varying assumptions regarding future cash flows of the Borrower or discount rates.less.less that are readily convertible to known amounts of cash. At September 30, 20152018 and 2014,2017, cash equivalents were $11.6$50.6 million and $6.4less than $0.1 million, respectively. Cash equivalents are reported at cost which approximates their fair value due to their short-term nature and varying interest rates. and Allowance for Doubtful Accounts and Sales ReturnsCompany'sCompany’s estimates of the receivables'receivables’ recoverability in the period the changes in estimates occur and become known. Accounts receivable balances are written-offwritten off against the allowance for doubtful accounts when the Company determines that the balances are not recoverable. Provisions for doubtful accounts are recorded in "Selling, general and administrative expenses" in the Consolidated Statements of Operations. The Company determines the allowance for sales returns based on its best estimate of probable customer returns. Provisions for sales returns are recorded in "Revenue" in the Consolidated Statements of Operations. The Company does not have any off-balance-sheet credit exposure related to its customers.market. Cost ismarket determined based on standard cost which approximates actual cost on a first-in, first-out basis.basis and include the cost of materials, labor and manufacturing overhead. The Company reports inventories at their net realizable value and provides reserves for excess, obsolete or damaged inventory based on changes in customer demand, technology and other economic factors.Buildings202developshas developed software for its internal use. Internal and external labor costs incurred during the application development stage of a project are capitalized. Costs incurred prior to application development and post implementation are expensed as incurred. Training and data conversion costs as well as costs incurred prior to the application development stage and during the post-implementation stage are expensed as incurred.50NOTES TO CONSOLIDATED FINANCIAL STATEMENTS - September 30, 2018, and 2017, the Company had cumulative capitalized direct costs of $5.6 million and $4.7 million, respectively, associated with development of software for its internal use. These capitalized costs are included within "Property, plant and equipment, net" in the accompanying Consolidated Balance Sheets. During fiscal year 2018, the Company capitalized direct costs of $(Continued)0.9 upon their retirement and the associated accumulated depreciation are derecognized upon their retirement or at the time of disposal, and the resulting gain or loss is included in the Company'sCompany’s results of operations as a component of operating income (loss).group'sgroup’s aggregate carrying value over its fair value. The loss is allocated to the assets within the group based on their relative carrying values, with no asset reduced below its fair value.Patents551311 yearsPrior to fiscal year 2015, theThe Company conductedhas elected April 1st as its annual goodwill impairment test asassessment date. If the existence of its fiscal year end,events or September 30th. Beginning with fiscal year 2015,circumstances indicates that it is more likely than not that fairchanged the date of its annualperforms additional impairment tests during interim periods to evaluate goodwill impairment test from September 30th to April 1st to align more closely with its annual strategic planning process. This change did not delay, accelerate, or avoid an impairment charge and did not result in adjustments to the Company's consolidated financial statements when applied retrospectively. The Company completed the annual goodwill impairment test during fiscal year 2015 and determined that no adjustment to goodwill was necessary since the fair value of all reporting units substantially exceeded their respective carrying values. The change in the annual impairment test date did not have an impact on the Company's financial position and results of operations during the fiscal year ended September 30, 2015. No triggering events indicating goodwill impairment occurred subsequent to the test date.management'smanagement’s best estimate of future business activity and the related estimates of future cash flows from the assets and the reporting units that include the associated goodwill. These periodic evaluations could cause management to conclude that impairment factors exist, requiring an adjustment of these assets to their then-current fair market values. Future business conditions and/or activity could differ materially from the projections made by management which could result in additional adjustments and impairment charges. The Company currently has six reporting units that have goodwill, including three components that are part of our Brooks Product Solutions operating segmentsole reporting units that are our Brooks Global Services and Brooks Life Science Systems operating segments.Goodwill impairment testing involves a two-step process. TheOther (“ASC 350”), the Company first comparesassesses qualitative factors to determine whether the existence of events or circumstances indicates that it is more likely than not that the fair value of eacha reporting unit tois less than its respective carrying amount, including goodwill, to assess whether potential goodwill impairment exists.value. If the Company determines, based on this assessment, that it is more likely than not that the fair value of the reporting unit exceeds its carrying amount, goodwill of the reporting unit is not considered impaired. If the reporting unit’s carrying amount exceeds its fair value, the Company performs the second step of the goodwill impairment test to measure the potential impairment loss amount by comparing the implied fair value of goodwill with its carrying amount. The implied fair value of goodwill is determined by allocating the fair value of the reporting unit to all of its assets and liabilities and assigning the excess amount to goodwill. If the implied fair value of goodwill is less than its carrying amount, anvalue, it performs a quantitative goodwill impairment test by comparing the reporting unit’s fair value with its carrying value. An impairment loss is recognized for difference between the amount by which the reporting unit’s carrying value exceeds its fair value, up to the total amount of goodwill and its implied fair value.51NOTES TO CONSOLIDATED FINANCIAL STATEMENTS - allocated to the reporting unit.(Continued)Income Approachincome approach in accordance with the Discounted Cash Flow Method,discounted cash flow method, or DCF Method. The DCF Method is based on projected future cash flows and terminal value estimates discounted to their present values. Terminal value represents a present value an investor would pay on the valuation date for the rights to the cash flows of the business for the years subsequent to the discrete cash flow projection period. The observable inputs used in the DCF Method include discount rates set above the Company’s weighted-average cost of capital. The Company derives discount rates that are commensurate with the risks and uncertainties inherent in the respective businesses and its internally developed projections of future cash flows. The Company considers the DCF Method to be the most appropriate valuation technique since it is based on management’s long-term financial projections. Due to the cyclical nature of the semiconductor equipment market, management’s projections as of the valuation date are considered more objective since market metrics of peer companies fluctuate during the cycle. In addition, the Company also compares aggregate values of its net corporate assets and reporting unit fair values to its overall market capitalization and uses certain market-based valuation techniques to test the reasonableness of the reporting unit fair values determined in accordance with the DCF Method.management'smanagement’s estimate of the level of future claims.Company'sCompany’s defined benefit pension plans are calculated based on certain assumptions related to the estimated benefits that employees earn while working, the amount of which cannot be completely determined until the benefit payments cease. Key assumptions used in accounting for these employee benefit plans include the discount rate, expected return on plan assets and rate of increase in employee compensation levels. Assumptions are determined based on Company data and appropriate market indicators in consultation with third-party actuaries, and are evaluated each year as of the plans’ measurement date.Product revenue is associated with the sale of hardware systems, components and spare parts, as well as product license revenue. Service revenue is associated with service contracts, repairs, upgrades and field services. Shipping and handling fees billed to customers, if any, are recognized as revenue. The related shipping and handling costs are recognized in cost of revenue.fourof the following revenue recognition criteria have been met: (i) persuasive evidence of an arrangement exists; (ii) delivery has occurred or services have been rendered; seller’s price to buyer(iii) the fee is fixed or determinable; and collectibility(iv) collectability is probable. The Company recognizes shipping and handling fees billed to customers as revenue recognition policy generally resultsand includes the related costs in revenue recognition at"Cost of revenue" in the following points: (1) for all transactions where legal title passes toaccompanying Consolidated Statements of Operations. Revenue is presented net of taxes assessed by governmental authorities on revenue-producing transactions. Revenue from software products generated during fiscal years ended September 30, 2018 and 2017 was insignificant.customer upon shipment or delivery, revenuesale of products is recognized upon passage of title for all products that have been demonstratedtheir delivery to meet product specifications prior to shipment; the portion of revenue associated with certain installation-related tasks is deferred, and that revenue is recognized upon completion of the installation-related tasks; (2) for products that have not been demonstrated to meet product specifications prior to shipment, revenue is recognized at customer technical acceptance; (3) for transactions where legal title does not pass at shipment or delivery, revenue is recognized when legal title passes to the customer, which is generally at customer technical acceptance; and (4) for arrangements containing multiple elements, revenue for delivered elements that have a stand alone value is recognized at the time of delivery,customers, provided all other revenue recognition criteria arehave been met. Revenue relatedDelivery is considered complete when both of the following conditions have been met: (i) legal title and risk of loss have transferred to the undelivered elements is deferred usingcustomer upon product shipment or delivery; and (ii) the relative selling price method utilizing estimated sales prices until delivery of the deferred elementsCompany has occurred. Arrangements with certain customers include contingent revenue provisions, in which a portion of the selling price of a delivered item is contingent on the delivery of other items or on the delivered items meeting specified performance criteria. In arrangementsreliably demonstrated that include contingent revenue, the amount of revenue recognized is limited to the lower of either: the amount billed that is not contingent on acceptance; or the value of the arrangement consideration allocated to the delivered elements if the product is a part of a multiple-element arrangement. In cases when products sold have been demonstrated to meet productmet their required specifications prior to shipment whichand, as a result, the Company believes is at the time of delivery, it haspossesses an enforceable claim right to amounts recognized as revenue. Spare partsRevenue is recognized upon obtaining a customer technical acceptance if the Company was not able to demonstrate that products have met their required specifications prior to shipment and / or legal title and risk of loss did not transfer to the customer upon product shipment or delivery. Revenue from third-party sales for which the Company does not meet the criteria for gross revenue recognition is recognized on a net basis. All other revenue is generally recognized upon shipment,on a gross basis.servicesrebates consist primarily of volume discounts and other incentive programs. Customer allowance and rebate amounts are estimated based on historical experience, contractual terms and expected level of sales during the qualifying incentive program period. The Company records customer allowances and rebates as a reduction of revenue is generally recognized overat the period that the services are provided.includeinvolve significant customization, which include primarily include life science automationautomated cold sample management systems, is recognized usingbased on the percentage of completion method. In accordance with the percentage of completion method,The Company recognizes revenue is recognized as work progresses based on a percentage thatof actual labor hours incurred labor effort to date bears to total projected labor effort. Profit estimates on long-term contracts are revised periodically based on changes in circumstances,the project to-date and any losses on contracts are recognized in the period in which they are deemed to be probable. If the Company determines that a loss is probable, it estimates the loss amount by comparing total estimated contract revenue to the total estimated contract costs. Significant judgment is required in estimating total labor costs and progress to completion on these arrangements, as well as whether a loss ishours expected to be incurred on the contract dueproject. The Company develops profit estimates for long-term contracts based on total revenue expected to severalbe generated from the project and total costs anticipated to be incurred. These estimates are based on a number of factors, including the degree of required product customization required52NOTES TO CONSOLIDATED FINANCIAL STATEMENTS - (Continued)environment. The Company usesenvironment based on installation work, as well as the Company’s historical experience, project plans and an assessment of the risks and uncertainties inherent in the arrangementcontract related to establish these estimates. Uncertainties in these arrangements include implementation delays or performance issues that may or may not be within the Company'sCompany’s control. The Company also hasestimates a loss on a contract by comparing total estimated contract revenue to the total estimated contract costs and recognizes a loss during the period in which it becomesarrangements with significant customization thatand include contractual terms and customer rights disallowing the use of the percentage of completion method. The Company accountsrecognizes revenue for these arrangements upon completion or substantial completion of the project, provided all other revenue recognition criteria have been met. The project is considered substantially complete when the Company receives acceptance and remaining tasks are perfunctory or inconsequential and in accordance withcontrol of the completed-contract method and recognizes income only when a contract is completed or substantially completed.Revenue associated with service agreementstermperiod of performance, provided all other revenue recognition criteria have been met. Payments due or received from the contract, with payments from customers beingprior to rendering the associated services are recorded as deferred revenue. Revenue from repair services or upgrades of customer-owned equipment is recognized upon completion of the repair effort and the shipment of the repaired itemproduct back to the customer. If the repairrepairs or the upgradeupgrades include installation, revenue is generally recognized when the installation is completed.A portioncompleted unless the installation period is longer term in nature and the project is accounted for on percentage-of-completion basis.the revenue arrangements for our products, particularly in sales of life science automationautomated cold sample management systems and contamination control solutions, aresolution products represent multiple element arrangements that can include product, service and other elements. For multiple element revenue arrangements,The Company allocates arrangement consideration is allocated to each elementdeliverable that has a standalone value based upon their relativethe selling price usinghierarchy which requires the Company to use vendor-specific objective evidence (the "VSOE") of selling price if it exists, or VSOE, ora third-party evidence or TPE, or based upon(the "TPE") of the relative selling price using estimatedin the absence of VSOE. If neither VSOE nor TPE of selling prices ifprice exists for a deliverable, the Company uses its best estimate of selling price (the "BESP") for that deliverable. The Company has not been able to establish VSOE or TPE do not exist.for the deliverables included in the multiple element arrangements and, as a result, primarily uses BESP to allocate the arrangement consideration. The Company relies primarilydetermines BESP based on estimated selling prices since it generally does not have VSOE or TPE. the cost plus a reasonable margin approach and considers entity-specific, as well as external market factors, when developing such estimates.element of the arrangementdeliverable that has a standalone value in accordance with its revenue recognition policies. The fair valueRevenue allocated to the delivered elements is recognized at the time of anydelivery, provided all other revenue recognition criteria are met. Revenue allocated to the undelivered elements is deferred until the elements are delivered and all other revenue recognition criteria have been met.Company'sCompany’s common stock quoted on NASDAQNasdaq on the date of grant. Fair value of stock options is determined based on the Black-Scholes valuation model.2015, 20142018, 2017 and 20132016 (in thousands): Year ended September 30, 2015 2014 2013 Restricted stock $ 11,696 $ 10,469 $ 7,112 Employee stock purchase plan 463 445 496 Total stock-based compensation expense $ 12,159 $ 10,914 $ 7,608 53NOTES TO CONSOLIDATED FINANCIAL STATEMENTS - (Continued)2015, 20142018, 2017 and 2013:2016: Year ended September 30, 2015 2014 2013 Risk-free interest rate 0.1 % 0.1 % 0.1 % Volatility 31 % 25 % 32 % Expected life 6 months 6 months 6 months Dividend yield 3.40 % 3.40 % 3.30 - 3.40 Company'sCompany’s historic stock prices over a period commensurate with the expected life of the shares granted. The expected life represents the weighted average period over which the shares are expected to be purchased. Dividend yields are projected based on the Company'sCompany’s history of dividend declarations and management'smanagement’s intention for future dividend declarations.Company's consolidated financial statementsCompany’s Consolidated Financial Statements contain certain deferred tax assets that were recorded as a result of operating losses, as well as other temporary differences between financial and tax accounting. A valuation allowance is established against deferred tax assets if, based upon the evaluation of positive and negative evidence and the extent to which that evidence is objectively verifiable, it is more likely than not that some or all of the deferred tax assets will not be realized.Company'sCompany’s income tax provision, the Company'sCompany’s deferred tax assets and liabilities and any valuation allowance recorded against those net deferred tax assets. The Company evaluates the weight of all available evidence to determine whether it is more likely than not that some portion or all of the net deferred income tax assets will not be realized.Company'sCompany’s tax liabilities involves dealing withconsideration of uncertainties in the application of complex tax regulations. The Company recognizes liabilities for uncertain tax positions based on a two-step process. The first step is to evaluate the tax position for recognition by determining if the weight of available evidence indicates that it is more likely than not that the position will be sustained upon an audit or an examination conducted by taxing authorities, including resolution of related appeals or litigation processes, if any. If the Company determines that a tax position will more likely than not be sustained, the second step requires the Company to estimate and measure the tax benefit as the largest amount that is more likely than not to be realized upon ultimate settlement. It is inherently difficult and subjective to estimate such amounts, as the Company has to determine the probability of various possible outcomes. The Company re-evaluates these uncertain tax positions on a quarterly basis. This evaluation is based on factors, such as changes in facts or circumstances, tax law, new audit activity and effectively settled issues. Determining whether an uncertain tax position is effectively settled requires judgment. A change in recognition or measurement may result in the recognition of a tax benefit or an additional charge to the tax provision.(loss) per share based on the treasury stock method. Potential common shares are excluded from the calculation of dilutive weighted average shares outstanding if their effect would be anti-dilutive at the balance sheet date.In February 2015, the FASB issued an amendment to the accounting guidance for consolidations of financial statements by changing the analysis that a reporting entity must perform to determine whether it should consolidate certain types of legal entities. The guidance is effective for fiscal years, and interim periods within those years, beginning after December 15, 2015. Early adoption is permitted. The guidance can be adopted either via a full retrospective approach or a modified retrospective54NOTES TO CONSOLIDATED FINANCIAL STATEMENTS - (Continued)approach by recording a cumulative-effect adjustment to beginning equity in the period of adoption. The Company will adopt the guidance during the first quarter of fiscal year 2017. The Company is currently evaluating the impact of the guidance on its financial position and results of operations.In January 2015, the FASB issued new accounting guidance to simplify income statement classification by removing the concept of extraordinary items from Generally Accepted Accounting Principles ("GAAP"). As a result, items that are both unusual in nature and infrequent in occurrence will no longer be separately reported net of tax after the results of continuing operations. The guidance is effective for fiscal years, and interim periods within those years, beginning after December 15, 2015 and can be adopted retrospectively or prospectively based on an entity's election. Early adoption is permitted. The Company will adopt the guidance during the first quarter of fiscal year 2017. The adoption of the guidance is not expected to have a material impact on the Company's financial position and results of operations.recognition.recognition, ASC 606 Revenue from Contracts with Customers (“ASC 606”). The guidance provides for the recognition of revenue when promised goods or services are transferred to customers in an amount that reflects the consideration that is expected to be received for those goods or services. A five-step process set forth inIn addition, the guidance may require more judgmentrequires disclosure of the nature, amount, timing, and estimationuncertainty of revenue and cash flows arising from contracts with customers. The guidance also specifies the accounting for certain costs to obtain and fulfill a contract, as codified in ASC 340-40 Accounting for Other Assets and Deferred Costs, (“ASC 340-40”).recognition process thanand commission expense within the current GAAP, including identifying performance obligationsBrooks Life Sciences segment. The anticipated adjustment within the Semiconductor Solutions Group segment is derived from the elimination of billing constraints that historically prevented the Company from recognizing revenue in excess of its right to bill. The anticipated adjustment within the Brooks Life Science segment is derived from the requirement to recognize revenue and commission expense associated with certain transactions over time under ASC 606, while historically these transactions have been recorded at a point in time. In accordance with the adoption of ASC 606, classification of certain balance sheet accounts will be impacted through the creation of contract assets and contract liabilities, and additional disclosures will be required. The Company’s systems and internal control environment are not expected to be significantly impacted by the adoption of the standard. The Company will fully disclose the impacts of the new standard in connection with its Quarterly Report on Form 10-Q for the quarter ended December 31, 2018.estimatingwith the customer. Under ASC 606, this constraint has been removed, permitting the Company to recognize revenue in an amount equivalent to the transfer of control that has occurred. This change will result in an anticipated impact to retained earnings of approximately $1 million to $2 million as of October 1, 2018. In addition, the Company expects to defer previously recognized revenue related to sample life cycle management solutions. Fees associated with the registration of biological samples are currently recognized at a point in time upon completion of the registration services, provided all other criteria for revenue recognition have been met. The adoption of the standard will result in revenue generated from registration fees being recognized ratably over the period of benefit, which is generally two years. This change will result in an anticipated impact to retained earnings of approximately $2 million to $4 million as of October 1, 2018. The Company expects this impact to retained earnings to be offset by the deferral of previously recognized commission expense. Sales commissions resulting from the acquisition of contracts with customers are currently expensed when incurred. Upon the adoption of the standard certain costs to obtain a contract will be required to be recorded as an asset when incurred and expensed as the transfer of control of the underlying performance obligations occur or over the estimated customer life, depending on the nature of the underlying contract. The Company expects this change to impact its commissions earned on contracts with a term greater than 12 months. This change will result in an anticipated impact to retained earnings of approximately $0.8 million to $1.4 million as of October 1, 2018 for contracts which are not completed as of the effective date. The adoption of ASC 606 will result in additional changes to the Company’s retained earnings. The effect of these changes both individually and in the aggregate are expected to be insignificant and result from identification of additional performance obligations, reallocation of transaction consideration and changes to the timing and amount of variablerevenue recognized for certain product and service offerings. The corresponding tax effect from these adjustment’s will have an insignificant impact to the cumulative effect adjustment.to includeon a relative standalone price basis in the transaction price and allocating the transaction price to each separate performance obligation.accordance with provisions of ASC 606. The guidance was initiallyis effective for fiscal years, and interim periods within those years, beginning after December 15, 2016. In August 2015, the FASB issued an amendment deferring the effective date of the guidance by one year. The guidance2018 and should be adopted retrospectively either for each reporting period presented or via recognizing the cumulative effect at the date of the initial application. Early adoption is permitted only as of annual reporting periods, including the interim periods, beginning after December 15, 2016.a modified retrospective approach with certain optional practical expedients that entities may elect to apply. The Company willexpects to adopt the guidance during the first quarter of fiscal year 2020 and is currently evaluating the impact of this guidance on its financial position and results of operations.The Granville-Phillips business unit developed, manufactured, sold and serviced vacuum measurement and gas analysis instrumentation to semiconductor and non-semiconductor customers. In March 2014,ana definitive agreement to sell thisits semiconductor cryogenics business to Edwards Vacuum LLC (a member of the Atlas Copco Group) for $87.0$675.0 million in cash. The sale was completed on May 30, 2014.purchase price is subject to adjustments for working capital and other items. The Company’s historical financial statements have been revised to present the operating resultsCompany anticipates closing of the Granville-Phillipstransaction in the first quarter of calendar year 2019 upon satisfaction of various closing conditions and regulatory approvals.as a discontinued operation. Summarized resultsconsists of the discontinued operation are as follows forCTI pump business, Polycold chiller business, the fiscal years ended September 30, 2014related services business and 2013 (in thousands): Year Ended September 30, 2014 2013 Revenue $ 18,921 $ 28,512 Income from discontinued operations 4,888 $ 7,779 Gain on the sale of the discontinued operations 56,804 — Income tax provision 31,690 2,815 Income from discontinued operations, net of tax $ 30,002 $ 4,964 operating results ofsemiconductor cryogenics business was originally acquired by the Granville-Phillips business were historically includedCompany in the results of operations for the Brooks Product Solutions segment, except for revenuesits 2005 merger with Helix Technology Corporation and expenses associated with support and repair services that wereis included in the Brooks Global Services segment.The presentationSemiconductor Solutions Group segment as part of the Granville-Phillipssegment.hadfor all periods presented. 126,638 38,748 73,714 22,400 96,114 69,272 6,860 12,536 82 19,478 49,794 1,057 804 56,379 50,851 22,096 14,420 8,760 9,560 41,959 42,091 12,536 6,788 9,834 3,445 48,747 51,925 15,981 impactimpairment indicator related to the goodwill of the Disposition group at either date the impairment analysis was performed.previously reported net income (loss) or stockholders' equity.the equity method (in thousands): 4. Acquisitions2015Contact Co., Ltd.August 14, 2015,April 6, 2018, the Company acquired allapproximately 93% of the outstanding capital stock of Contact Co.Tec-Sem Group AG (“Tec-Sem”), Ltd., or Contact, a Japanese-based providerSwitzerland-based manufacturer of automated cleaner products for wafer carrier devices used insemiconductor fabrication automation equipment with a focus on reticle management. In the global semiconductor markets.fourth quarter of fiscal year 2018, the Company acquired the remaining 7% noncontrolling interest upon the completion of certain procedural steps. The acquisition of Contact expandstotal cash payment to acquire the Company's offerings of contamination control solutions within its Brooks Product Solutions segment, strengthens its current capabilities and technology used in its contamination control solutions business and enhances its long-term strategy of gaining share in our core semiconductor markets.The aggregate purchase price of $6.8was $15.6 million, net of cash acquired consistedand subject to working capital adjustments. The acquisition of a cash payment of $1.9 million,Tec-Sem has expanded the assumption ofCompany’s contamination control solutions business within the seller's debt of $8.8 million, seller's cash of $4.8 million and a contingent consideration of 0.8 million payable upon achievement of certain specified targets and events. The entire debt amount was fully repaid as of September 30, 2015.The Company recorded the assets acquired and liabilities assumed related to Contact at their fair values as of the acquisition date. Brooks Semiconductor Solutions Group segment.
and Liabilities55NOTES TO CONSOLIDATED FINANCIAL STATEMENTS - (Continued) Fair Value of Assets and Liabilities Accounts receivable $ 42 Inventories 2,020 Prepaid expenses and other current assets 484 Property, plant and equipment 1,130 Completed technology 2,290 Goodwill 3,144 Other assets 1,410 Accounts payable (1,089 ) Accrued liabilities (1,823 ) Long-term deferred tax liabilities (774 ) Total purchase price, net of cash acquired $ 6,834 The purchase price was allocated based on the fair value of the identified assets acquired and liabilities assumed as of the acquisition date from a market participant’s perspective. At September 30, 2015, the Company has not yet completed the final allocation of the consideration in connection with the acquisition of Contact, but expects to do so during the measurement period.Fair value of the contingent consideration of $0.8 million was determined based on a probability-weighted average discounted cash flow model and recorded in "Accrued expenses and other current liabilities" in the Company's Consolidated Balance Sheets. remeasures the fair valueapplied variations of the contingent consideration at each reporting date until the arrangement is settled. Please refer to Note 6 “Fair Value Measurements” for further information on the fair value measurement of the contingent consideration.At September 30, 2015, the Company had $1.5 million in escrow account which consisted of $750,000 payable to the sellers upon termination of a certain third-party arrangement and $750,000 related to potential working capital adjustments and the sellers' satisfaction of general representations and warranties.Fair value of the completed technology intangible assets was estimated based on the income approach in accordance withto estimate the excess-earnings method. In accordance with the excess-earnings method, the valuefair values of the intangible asset is equal to the present value of the after-tax cash flows attributable to theassets acquired. The identifiable intangible asset only. The weighted average amortization period for theassets include completed technology intangible assets acquired in the Contact acquisition is 5.0(excess earnings method) of $8.4 million with a useful life of 10 years, backlog (excess earnings method) of $1.6 million with a useful life of 1 year, and customer relationships (distributor method) of $0.7 million with a useful life of 9 years. The intangible assets acquired are amortized over the total weighted average period of 8.6 years using an accelerated depreciation method which approximatesmethods that approximate the pattern in which the economic benefits are expected to be realized.Company's Brooks Product SolutionsLife Sciences segment. Goodwill is primarily the result of expected synergies from combining the operations of ContactPBMMI with the CompanyCompany’s operations and is not deductible for tax purposes.Contact are insignificant andPBMMI have been includedreflected in the results of operations for the Brooks Product Solutions segmentLife Sciences segment. During fiscal year 2018, revenue and net income from PBMMI recognized in the dateCompany’s results of operations were $11.5 million and $0.7 million, respectively. During fiscal year 2017, revenue and net income from PBMMI recognized in the Company’s results of operations were $3.4 million and $0.8 million, respectively. During fiscal year ended September 30, 2018 and 2017, the net income included amortization expense of $1.6 million and $0.3 million, respectively, related to acquired intangible assets. During fiscal year 2018 and 2017, the Company incurred less than $0.1 million and $0.3 million in non-recurring transaction costs with respect to the PBMMI acquisition.20152017 and 20142016 as if the acquisition of ContactPBMMI occurred on October 1, 20132015 because such results were insignificant.FluidX Ltd.October 1, 2014,November 28, 2016, the Company acquired all100% of the outstanding stockequity of FluidX Ltd., or FluidX, a UK-based provider of biological sample storage tubes and complementary bench-top instruments.Cool Lab, LLC ("Cool Lab") from BioCision, LLC ("BioCision"). The Company paid,held a 20% equity ownership interest in cash, aggregate merger considerationBioCision prior to the acquisition. Cool Lab was established as a subsidiary of $15.5 million, netBioCision on November 28, 2016 upon the transfer of cash acquired.certain assets related to cell cryopreservation solutions. Cool Lab’s offerings assist in managing the temperature stability of therapeutics, biological samples, and related biomaterials in ultra-cold and cryogenic environments. The acquisition of FluidX providedCool Lab has allowed the Company to extend its comprehensive sample management solutions across the cold chain of custody, which is consistent with the opportunityother offerings it brings to enhance its existing capabilitieslife sciences customers.respect to biobanking solutions inCool Lab and BioCision, disclosed as non-cash consideration of $10.3 million, which has been measured at fair value on the Brooks Life Science Systems segment.recorded the following amounts forused a market participant approach to record the assets acquired and liabilities assumed related to FluidX at their fair valuesin the Cool Lab acquisition. The amounts recorded were as of the acquisition datefollows (in thousands):
and Liabilities56NOTES TO CONSOLIDATED FINANCIAL STATEMENTS - (Continued) Fair Values of Assets and Liabilities Accounts receivable $ 1,980 Inventory 2,857 Prepaid and other current assets 213 Property, plant and equipment 101 Completed technology 1,230 Trademarks and trade names 750 Customer relationships 4,810 Goodwill 8,247 Accounts payable (2,079 ) Deferred revenue (72 ) Accrued liabilities (992 ) Long-term deferred tax liabilities (1,540 ) Total purchase price, net of cash acquired $ 15,505 purchase price was allocated based on the fair valueCompany applied variations of the identified assets acquired and liabilities assumed as ofincome approach to estimate the acquisition date from a market participant’s perspective.On January 23, 2015, the Company reached a settlement with respect to certain working capital adjustments with the sellers of FluidX stock. On February 3, 2015, the Company paid such proceeds to the sellers, which increased the purchase price by $0.1 million. At September 30, 2015, the Company had $1.5 million in a general escrow account held by the unrelated third party. The Company finalized the purchase price allocation for FluidX acquisition within the measurement period. Adjustments to the initial purchase price allocation recorded during the measurement period were not material to the Company's financial position.Fairfair values of the trademarks and the existing technology acquired were estimated based on the income approach in accordance with the relief-from-royalty method. In accordance with the relief-from-royalty method, the value of an intangible asset is equal to the present value of the after-tax royalty savings attributable to owning that intangible asset. Fair value of customer relationships acquired was estimated based on the income approach in accordance with the excess-earnings method. The weighted average amortization periods for intangible assets acquired in the FluidX acquisition are 5.0acquired. The identified intangible assets include customer relationship with a certain customer (excess-earnings method) of $3.6 million with a useful life of 3 years, for each of completed technology trademarks,(relief-from-royalty) of $1.2 million with a useful life of 8 years, and other customer relationships.relationship (excess-earnings method) of $1.3 million with a useful life of 10 years. The intangible assets acquired are amortized over the total weighted average period of 5.4 years using an accelerated amortization method which approximatesmethods that approximate the pattern in which the economic benefits are expected to be realized.Company's Brooks Life Science SystemsSciences segment. Goodwill is primarily the result of expected synergies from combining the operations of FluidXCool Lab with the CompanyCompany’s operations and is not deductible for tax purposes.FluidXCool Lab have been includedreflected in the results of operations for the Brooks Life Science Systems segment from the date of the acquisition. RevenueSciences segment. During fiscal year 2018, revenue and net loss attributable to FluidX forfrom Cool Lab recognized in the Company’s results of operations were $3.7 million and $0.2 million, respectively. During fiscal year 20152017, revenue and net loss from Cool Lab recognized in the Company’s results of operations were $15.0$3.7 million and $0.6$0.3 million, respectively. TheDuring fiscal year ended September 30, 2018, the net loss for fiscal year 2015 included charges of $1.0amortization expense $1.6 million related to acquired intangible assets. During fiscal year ended September 30, 2017, the net loss included charges of $0.4 million related to the step-up in value of the acquired inventories and amortization expense of $1.4$1.2 million related to the acquired intangible assets.The During fiscal year 2017, the Company also incurred $0.5$0.4 million and $0.2 million, respectively, during fiscal years 2015 and 2014 in non-recurring transaction costs with respect to the FluidX acquisition which were recorded in "Selling, general and administrative" expenses within the Consolidated Statements of Operations.yearyears ended September 30, 20142017 and 2016 as if the acquisition of FluidXCool Lab occurred on October 1, 20132015 because such results were insignificant.Acquisitions Completed in 2014April 30, 2014,August 22, 2017, the Company acquired all the outstanding stockcertain assets and liabilities of Dynamic Micro Systems Semiconductor Equipment GmbH, or DMS,RURO, Inc., (the “seller”), a GermanU.S.-based provider of automated contamination controlsample management software solutions for front opening unified pod,across multiple end markets, including academic research, government, pharmaceutical, biotech, and healthcare. The acquired FreezerPro® web-based software platform together with an exclusive license to sell and distribute RURO’s BioBankPro® software has allowed the Company to complement its existing informatics offerings within the Brooks Life Sciences segment and extend its informatics solutions to address laboratories, biobanks or FOUP, carriersenterprises that manage biological samples.reticle storage targeted at improving yielda liability to the seller of semiconductor processes at semiconductor fabrication plants.$0.4 million. The Company paid, in cash, aggregate merger considerationallocated the purchase price of 31.6$5.5 million net of cash acquired. The acquisition of DMS expanded the Company’s capabilities at semiconductor fabrication plants for yield improvement on new technology57NOTES TO CONSOLIDATED FINANCIAL STATEMENTS - (Continued)nodes.The Company recordedto the assets acquired and the liabilities assumed related to DMSthe acquisition at their fair values as of the acquisition date.date, of which $0.1 million was ascribed to accounts receivable, $4.0 million to intangible assets, $1.6 million to goodwill assigned to the Brooks Life Sciences segment and $0.2 million to deferred revenue. Fair values of intangible assets acquired of $4.0 million consisted of customer relationship intangible assets of $3.1 million and completed technology of $0.9 million.amounts recorded wereescrow was related to satisfaction of the sellers' indemnification obligations with respect to their representations and warranties and other indemnities.follows (in thousands): Fair Values of Assets and Liabilities Accounts receivable $ 15,262 Inventory 10,051 Prepaid and other current assets 2,727 Property, plant and equipment 2,049 Completed technology 3,610 Customer relationships 7,100 Goodwill 11,638 Accounts payable (10,393 ) Accrued liabilities (5,522 ) Deferred revenue (1,309 ) Long-term deferred tax liabilities (3,588 ) Total purchase price, net of cash acquired $ 31,625 was allocatedand $2.5 million for retention arrangements with certain employees based on the fair valuecompletion of a service retention period. The cash payment included a debt repayment of $3.2 million and transaction costs of $2.9 million paid by the identifiedCompany on behalf of BioStorage.perspective. The Company finalizedperspective (in thousands):allocation for this acquisition withinand $2.5 million related to retention arrangements with certain employees. The escrow balance was reduced by its full amount by the measurement period. Adjustments to the initial purchase price allocation recorded during the measurement period were not material to the Company's financial position.The Company reached a settlement with respect to certain working capital adjustments and other issues with the sellers of DMS' stock in the fourththird quarter of fiscal year 2014. As a result of this settlement, the2017.received $2.2 million in the first quarter of fiscal year 2015 from certain escrow accounts established at the date of acquisition and held by the unrelated third party. At September 30, 2015, $2.8 million remained in escrow related to potential future claims against the sellers of DMS' stock. On October 30, 2015, the Company remitted $2.8 million to the sellers upon expirationapplied variations of the escrow period.The Company used the relief-from-royalty methodincome approach to estimate the fair valuevalues of the completed technology and the excess-earnings method to estimate the fair value of the customer relationships.intangibles assets acquired. The weighted average amortization periods foridentified intangible assets acquired in the DMS acquisition are 5.0include customer relationship (excess-earnings method) of $36.6 million with a useful life of 11.0 years, for completed technologies and trademark (relief-from-royalty method) of $4.9 million with a useful life of 8.0 years for customer relationships.years. The intangible assets acquired are amortized over the total weighted average period of 10.6 years using variable declining balance and straight-line methods that approximatean accelerated depreciation method which approximates the pattern in which the economic benefits are expected to be realized.Company'sCompany’s Brooks Product SolutionsLife Sciences segment. Goodwill is primarily the result of expected synergies from combining the operations of DMSBioStorage with the CompanyCompany’s operations and is not deductible for tax purposes. In the first quarter of fiscal year 2015, the Company increased the opening goodwill balance by $0.3 million as a result of a fair value adjustment recorded to inventory. DMSBioStorage have been includedreflected in the results of operations for the Brooks Product Solutions segmentLife Sciences segment. During fiscal year 2018, revenue and net income from BioStorage recognized in the dateCompany’s results of the acquisition. Revenue from DMS was $44.0operations were $74.7 million and $12.6 million, respectively. During fiscal year 2017, revenue and net income from BioStorage recognized in the Company’s results of operations were $62.8 million and $9.3 million, respectively. During fiscal year 2016, revenue and net income from BioStorage recognized in the Company’s results of operations were $44.6 million and $2.4 million, respectively. During fiscal years ended September 30, 2018, 2017 and 2016, the net income included amortization expense of $5.5 million, for$4.6 million and $2.9 million, respectively, related to acquired intangible assets.2015ended September 30, 2018, 2017 and 2014, respectively. Net income attributable to DMS was $3.1 million for fiscal year 2015 and included charges of $0.6 million related to2016, the step-up in values of the acquired inventories, $2.2 million of amortization expense and $0.1 million of restructuring charges during the period then ended. Net loss attributable to DMS was $4.5 million for fiscal year 2014 and included charges of $1.9 million related to the step-up in values of the acquired inventories, $0.9 million of amortization expense andCompany incurred $0.3 million, of restructuring charges during the period then ended.The Company incurred $0.4$0.3 million during fiscal year 2014and $3.2 million, respectively, in non-recurring transaction costs with respect to the DMS acquisition which wereBioStorage acquisition. The retention payment of $2.5 million was recorded in "Selling, generalwithin prepaid expenses and administrative" expenses within the Consolidated Statements of Operations.58NOTES TO CONSOLIDATED FINANCIAL STATEMENTS - (Continued)Acquisitions Completed in 2013In August 2013, the Company acquired certainother current assets and assumed certain liabilities of Matrical, Inc.’s, or Matrical, life science businesses (collectively “the Matrical Assets”) for cash consideration of approximately $9.3 million, net of cash acquired. Matrical was a Spokane, Washington-based, privately held company that provided biological sample preparation, management and storage solutions to customers in agricultural biotechnology, biotechnology, life science sample management and pharmaceutical markets. The acquisition of the Matrical Assets provided the Company with the opportunity to enhance its existing product offerings in biobanking and sample management for the Brooks Life Science Systems segment.In October 2012, the Company acquired all the outstanding stock of Crossing Automation Inc., or Crossing, a Fremont, California-based provider of automation solutions and services primarily to global semiconductor front-end markets. The Company paid, in cash, an aggregate merger consideration of $59.0 million, net of cash acquired. The acquisition of Crossing provided the Company with the opportunity to enhance its existing capabilities with respect to manufacturing of atmospheric and vacuum automation solutions within the semiconductor front-end market.The Company recorded the assets and liabilities associated with the purchase of the Matrical Assets and Crossing at their fair values as of their respective acquisition dates. The amounts recorded were as follows (in thousands): Matrical Assets Crossing Accounts receivable $ 636 $ 5,356 Inventory 2,095 8,668 Prepaid and other current assets 103 1,968 Property, plant and equipment 534 2,270 Completed technology 500 10,530 Customer relationships 1,500 20,010 Goodwill 7,076 26,453 Other long-term assets — 885 Debt (902 ) — Accounts payable (294 ) (3,024 ) Deferred revenue (351 ) (319 ) Customer deposits (1,249 ) — Other current liabilities (322 ) (5,560 ) Other long-term liabilities — (8,232 ) Total purchase price, net of cash acquired $ 9,326 $ 59,005 The purchase prices were allocated based upon the fair value of the identified assets acquired and liabilities assumed as of the acquisition date fromand is recognized as a market participant’s perspective.compensation expense over the service period or upon a triggering event in the underlying change in control agreements. The Company finalizedretention payments were completed paid out by the purchase price allocations for these acquisitions within the measurement periods. Subsequent adjustments to the initially reported purchase price allocations were not material to the Company'sfirst quarter of fiscal year 2017.position.The Company used the relief-from-royalty method to estimate the fair valueinformation represents a summary of the completed technology and the excess-earnings method to estimate the fair valueconsolidated results of the customer relationships. The weighted-average amortization periodsoperations for the intangible assets acquired in connection with the Matrical Assets are 4.6 yearsCompany and BioStorage for completed technologies and 7.0 years for customer relationships. The intangible assets acquired are amortized using the straight-line method that approximates the pattern in which the economic benefits are expected to be realized. The weighted-average amortization periods for intangible assets acquired in the Crossing acquisition are 7.7 years for completed technologies and 8.0 years for customer relationships. The intangible assets acquired are amortized using the variable declining balance and straight-line methods that approximate the pattern in which the economic benefits are expected to be realized.Goodwill represents the excess of the purchase price over the fair values of the net tangible and intangible assets acquired and is primarily the result of expected synergies from combining the acquired products with the Company’s existing products and integrating the operations of the acquired businesses into those of the Company. The goodwill resulting fromfiscal year 2016 as if the acquisition of BioStorage occurred on October 1, 2014 (in thousands):Matrical Assets has been allocatedCompany and BioStorage and includes the impact of certain adjustments directly attributable to the Brooks Life Science Systems segment, while goodwill resulting frombusiness combination. The unaudited pro forma financial information is presented for informational purposes only and is not necessarily indicative of the Crossing acquisition hasresults of operations that would have been allocated to the Brooks Product Solutions and Brooks Global Services segments. Goodwill fromachieved if the acquisition of BioStorage had taken place on October 1, 2014. During fiscal years ended September 30, 2016, the Matrical Assets is deductible foradjustments reflected in the unaudited pro forma information included aggregate amortization and depreciation expense of $0.6 million, and tax purposes. Goodwilleffects of $0.5 million. Additionally, the impact of restructuring charges of $1.9 million was excluded from the acquisition of Crossing is not deductible for tax purposes.59NOTES TO CONSOLIDATED FINANCIAL STATEMENTS - (Continued)Company'sCompany’s Consolidated Balance Sheets. Marketable securities reported as current assets represent investments that mature within one year from the balance sheet date. Long-term marketable securities represent investments with maturity dates greater than one year from the balance sheet date.in the results of operations as a component of operating"Other expenses, net" in the accompanying Consolidated Statements of Operations. During fiscal year 2018, the Company sold marketable securities with a fair value and amortized cost of $1.6 million each and recognized nominal net losses. The Company collected(loss).20152018 and 20142017 (in thousands): Amortized
Cost Gross
Unrealized
Gains Gross
Unrealized
Losses Fair Value September 30, 2015: U.S. Treasury securities and obligations of U.S. government agencies $ 30,343 $ 39 $ — $ 30,382 Corporate securities 54,725 13 (48 ) 54,690 Mortgage-backed securities 857 27 884 Other debt securities 5,056 3 5,059 Municipal securities 30,258 18 (9 ) 30,267 Bank certificate of deposits 12,024 2 12,026 $ 133,263 $ 102 $ (57 ) $ 133,308 September 30, 2014: U.S. Treasury securities and obligations of U.S. government agencies $ 26,052 $ 1 $ (39 ) $ 26,014 Corporate securities 74,614 23 (174 ) 74,463 Mortgage-backed securities 964 36 — 1,000 Other debt securities 7,358 — (10 ) 7,348 Municipal securities 15,888 1 (16 ) 15,873 Bank certificate of deposits 26,645 2 (3 ) 26,644 $ 151,521 $ 63 $ (242 ) $ 151,342 Gross realized gains on sales of available-for-sale marketable securities were approximately $2,000, $35,000 and $57,000, respectively, for the fiscal years ended September 30, 2015, 2014 and 2013. Gross realized losses on sales of available-for-sale marketable securities were approximately $5,000, $8,000 and $36,000 for the fiscal years ended September 30, 2015, 2014 and 2013, respectively. Gross realized gains and losses were included as a component of "Other income, net" in the accompanying Consolidated Statements of Operations. Unrealized net holding (losses) gains on available-for-sale marketable securities of approximately $(3,000), $26,000 and $21,000, respectively, were reclassified from Accumulated Other Comprehensive Income into the results of operations at the time of the securities' sale during fiscal years ended September 30, 2015, 2014 and 2013. Please refer to Note 15, "Stockholders' Equity", for further information on these reclassifications and their impact on the Accumulated Other Comprehensive Income and Other Comprehensive Income for the fiscal years ended September 30, 2015, 2014 and 2013.20152018 are presented below (in thousands). Fair Value Due in one year or less $ 70,021 Due after one year through five years 60,156 Due after ten years 3,131 $ 133,308 60NOTES TO CONSOLIDATED FINANCIAL STATEMENTS - (Continued)Company'sCompany’s intent to sell, or whether it is more likely than not it will be required to sell the investment before recovery of its amortized cost basis. If the Company believes that an other-than-temporary decline in fair value has occurred, it writes down the investment to fair value and recognizes the credit loss in earnings and the non-credit loss in accumulated other comprehensive income. During fiscal years 2015 and 2014,There were no marketable securities in unrealized loss position as of September 30, 2017. As of September 30, 2018, aggregate fair value of the marketable securities in unrealized loss position was $43.0 million and was comprised primarily of U.S. Treasury securities, corporate securities, and municipal securities. Aggregate unrealized losses for these securities were insignificant as of September 30, 2018 and are presented in the table above. The securities in unrealized loss position as of September 30, 2018 were not considered other-than-temporarily impaired and, as such, the Company did not recognize impairment losses during the periodsperiod then ended. UnrealizedThe unrealized losses arewere attributable to changes in interest rates.rates that impacted the value of the investments.Fair Value MeasurementsProperty, Plant and Equipmentmeasurement guidance establishesof net tangible and identifiable intangible assets of a reporting unit. Goodwill is tested for impairment annually or more often if impairment indicators are present at the reporting unit level. The Company elected April 1st as its annual goodwill impairment assessment date. If the existence of events or circumstances indicates that it is more likely than not that fair value hierarchy which requires an entity to maximize the use of observable inputs and minimize the use of unobservable inputs when measuring fair value. The following levels of inputs may be used to measure fair value:Level 1 Inputs: Quoted prices in active markets for identical assets or liabilities asvalues of the reporting date. Active marketsunits are those in which transactionsbelow their carrying values, the Company performs additional impairment tests during interim periods to evaluate goodwill for impairment.asset and liability occur in sufficient frequency and volumeCompany initially assesses qualitative factors to provide pricing informationdetermine whether the existence of events or circumstances indicates that it is more likely than not that the fair value of a reporting unit is less than its carrying value. If the Company determines, based on an ongoing basis.Level 2 Inputs: Observable inputs otherthis assessment, that it is more likely than prices included in Level 1, including quoted prices for similar assets or liabilities; quoted prices in marketsnot that are not active; or other inputs that are observable or can be corroborated by observable market data for substantially the full term of the assets or liabilities.Level 3 Inputs: Unobservable inputs that are significant to the fair value of the assetsreporting unit is less than its carrying value, it performs a quantitative goodwill impairment test by comparing the reporting unit’s fair value with its carrying value. An impairment loss is recognized for the amount by which the reporting unit’s carrying value exceeds its fair value, up to the total amount of goodwill allocated to the reporting unit. No impairment loss is recognized if the fair value of the reporting exceeds its carrying value.liabilities and reflect an entity's own assumptions in pricing assets or liabilities since they are supported by little or no market activity.circumstances change that would more likely than not reduce the fair value of any reporting unit below its carrying value, the Company will evaluate such reporting unit’s goodwill for impairment between annual tests.tables summarize assets and liabilities measured and recorded at fair value on a recurring basistable sets forth the changes in the accompanying Consolidated Balance Sheetscarrying amount of goodwill by operating segment for the year ended September 30, 2018 and 2017 (in thousands):20152018 and 20142017 are as follows (in thousands): Fair Value Measurements at Reporting Date Using Description September 30,
2015 Quoted Prices in
Active Markets for
Identical Assets
(Level 1) Significant Other
Observable Inputs
(Level 2) Significant
Unobservable Inputs
(Level 3)Assets: Cash equivalents $ 11,628 $ 10,133 $ 1,495 $ — Available-for-sale securities 133,308 — 133,308 — Foreign exchange contracts 89 89 — Convertible debt securities $ 5,337 $ — $ — $ 5,337 Stock warrants 59 — — 59 Total Assets $ 150,421 $ 10,133 $ 134,892 $ 5,396 Liabilities: Contingent consideration $ 811 $ — $ — $ 811 Foreign exchange contracts 36 — 36 — Total Liabilities $ 847 $ — $ 36 $ 811 convertible debt securitiesCompany accounts for certain of its investments using the equity method of accounting and stock warrants arerecords its proportionate share of the investee’s earnings (losses) in its results of operations with a corresponding increase (decrease) in the carrying value of the investment.accompanyingCompany’s Consolidated Balance SheetsSheets.2014.all principal and accrued interest were due at maturity. The convertible debt securities and the warrant were recorded at fair value during each reporting period, and the remeasurement gains and losses were recognized as a component of "Other (expense) income, net" in the Company’s Consolidated Statements of Operations. During the fiscal year ended September 30, 2016, the Company recognized remeasurement gains of $0.4 million related to these financial instruments.9, "Equity Method Investments"4, "Acquisitions" for further information on the convertible debt securitiesacquisition transaction.stock warrants.61NOTES TO CONSOLIDATED FINANCIAL STATEMENTS - (Continued) Fair Value Measurements at Reporting Date Using Description September 30,
2014 Quoted Prices in
Active Markets for
Identical Assets
(Level 1) Significant Other
Observable Inputs
(Level 2) Significant
Unobservable Inputs
(Level 3)Assets: Cash equivalents $ 6,404 $ 5,166 $ 1,238 $ — Available-for-sale securities 151,342 — 151,342 — Total Assets $ 157,746 $ 5,166 $ 152,580 $ — Liabilities: Foreign exchange contracts $ 58 $ — $ 58 $ — Cash EquivalentsCash equivalents$5.2amended terms of the credit agreement, the line of credit continues to provide for revolving credit financing of up to $75.0 million, subject to borrowing base availability. Borrowing base availability under the amended line of credit excludes collateral related to fixed assets and is redetermined periodically based on certain percentage of certain eligible U.S. assets, including accounts receivable and inventory. The line of credit matures on October 4, 2022 and expires no less than 90 days prior to the term loan expiration.20152018, deferred financing costs were $2.4 million.2014, respectively, consistwarranties, covenants and events of Money Market Fundsdefault. If any of the events of default occur and are classifiednot waived or cured within Level 1applicable grace periods, any unpaid amounts under the term loan agreement will bear an annual interest rate at 2.00% above the rate otherwise applicable under the terms and conditions of such agreement. The term loan agreement does not contain financial maintenance covenants. As of September 30, 2018, the Company was in compliance with all covenants and conditions under the term loan agreement.hierarchy because they are valued using quoted market prices in active markets. Cash equivalents of $1.5 million and $1.2 million at September 30, 2015 and 2014, respectively, consist primarily of Bank Certificate of Deposits and are classified within Level 2 of the fair value hierarchy because they are not actively traded.Available-For-Sale SecuritiesAvailable-for-sale securities of $133.3 million and $151.3 million at September 30, 2015 and 2014, respectively, consist of Municipal Securities, Bank Certificate of Deposits, Commercial Paper, Mortgage-Backed Securities, as well as U.S. Treasury Securities and Obligations of U.S. Government Agencies. The securities are valued using matrix pricing and benchmarking and classified within Level 2 of the fair value hierarchy because they are not actively traded. Matrix pricing is a mathematical technique used to value securities by relying on the securities’ relationship to other benchmark quoted prices.Foreign Exchange ContractsForeign exchange contract assets and liabilities amount to $89,000 and $36,000, respectively, at September 30, 2015. Foreign exchange contract liabilities amount to $0.1 million at September 30, 2014. Foreign exchange contract assets and liabilities are measured and reported at fair valuewas determined based on observable market inputs and classified within Level 2 of the fair value hierarchy due to a lack of an active market for these contracts.Contingent ConsiderationContingent consideration liability of 0.8 million at September 30, 2015 is classified within Level 3this term loan or a similar loan instrument.fair value hierarchy and measured at fair value based onGENEWIZ Group (“GENEWIZ”) acquisition, the probability-weighted average discounted cash flow model utilizing potential outcomes related to achievement of certain specified targets and events. The fair value measurementCompany entered into an amendment of the contingent consideration is based on probabilities assignedexisting term loan agreement which increased its outstanding principal balance to each potential outcome and the discount rate. The Company remeasures the fair value of the contingent consideration at each reporting date and recognizes the corresponding fair value change related to the underlying inputs in the operating expenses.$546.0 million. Please refer to Note 4 “Acquisitions”23, “Subsequent Events”, for further information on the contingent consideration liability.Convertible Debt SecuritiesConvertible debt securities of $5.3 million at September 30, 2015 are classified within Level 3 of the fair value hierarchy and measured at fair value based on the probability-weighted expected return method, or PWERM, utilizing various scenarios for the expected payout of the instrument covering the full range of the potential outcomes. The PWERM determines the value of an asset based upon an analysis of future values for the subject asset and full range of its potential values. The asset value is based upon the present value of the probability of each future outcome becoming available to the assetterm loan transaction and the economic rights and preferences of each asset.Stock WarrantsStock warrants of $0.1 million at September 30, 2015 are classified within Level 3 of the fair value hierarchy and measured at fair value based on the Black-Scholes model. The Black-Scholes model applied to a warrant incorporates the constant price variation of the underlying asset, the time value of money, the warrant’s strike price and the time until the warrant’s expiration date. The fair value of the warrants was determined utilizing a five year equity volatility percentage based on an average equity volatility derived from comparable public companies.62NOTES TO CONSOLIDATED FINANCIAL STATEMENTS - acquisition(Continued).The carrying amounts of cash, cash equivalent, accounts receivable and accounts payable approximate their fair value due to their short-term nature.The following table presents the reconciliation of the assets measured and recorded at fair value on a recurring basis using significant unobservable inputs (Level 3) (in thousands): Convertible Debt Securities Stock Warrants Contingent Consideration Total Balance at September 30, 2014 $ — $ — $ — $ — Additions (1) 4,934 75 811 5,820 Change in fair value 403 (16 ) — 387 Balance at September 30, 2015 $ 5,337 $ 59 $ 811 $ 6,207 _________________(1) Please refer to Note 9, "Equity Method Investments".Nonrecurring Fair Value MeasurementsNote receivable of $1.0 million at September 30, 2015 is recorded at carrying value in the accompanying Consolidated Balance Sheets.During fiscal year 2014, the Company evaluated the recoverability of the note receivable from its strategic partner, or Borrower, and adjusted the note to fair value of $1.0 million as of September 30, 2014. The Company considered the fair value of the collateral determined based on valuation techniques, principally the discounted cash flow method, and the subordination of the note to the debt provided by the new lender. Fair value measurement was classified within Level 3 of the fair value hierarchy since it was based on unobservable inputs and required significant management judgment. The fair value of the note receivable could be different under different conditions or different assumptions, including the varying assumptions regarding future cash flows of the Borrower or discount rates. Please refer to Note 11, "Note Receivable" for further information on the note.As of September 30, 2015, the building and the underlying land located in Oberdiessbach, Switzerland were presented at fair value of $2.9 million as "Assets Held for Sale" in the accompanying Consolidated Balance Sheets. The Company determined fair value of the assets held for sale based on indication of value resulting from marketing the building and the land to prospective buyers. Fair value measurement is classified within Level 3 of the fair value hierarchy since it is based on unobservable inputs.Certain non-financial assets, including goodwill, finite-lived intangible assets and other long-lived assets, are measured at fair value on a non-recurring basis in accordance with the income approach when there is an indication of impairment. Please refer to Note 2, "Summary of Significant Accounting Policies" for further information on the valuation techniques used in developing these measurements.7. Property, Plant and EquipmentProperty, plant and equipment were as follows as of September 30, 2015 and 2014 (in thousands): September 30, 2015 2014 Buildings and land $ 43,765 $ 47,639 Computer equipment and software 58,715 59,962 Machinery and equipment 43,185 42,104 Furniture and fixtures 5,310 4,774 Leasehold improvements 13,617 17,771 Capital projects in progress 4,427 1,528 169,019 173,778 Less accumulated depreciation and amortization (127,164 ) (123,595 ) Property, plant and equipment, net $ 41,855 $ 50,183 Depreciation expense, excluding amounts related to the discontinued operations, was $12.3 million, $12.7 million and $13.7 million for the fiscal years ended September 30, 2015, 2014 and 2013, respectively.63NOTES TO CONSOLIDATED FINANCIAL STATEMENTS - (Continued)During fiscal year 2015, the Company was leasing one of the buildings in Chelmsford, Massachusetts which was purchased for a total price of $8.4 million on September 30, 2015. Please refer to Note 21, "Commitments and Contingencies" for further information on this transaction.During fiscal year 2013, the Company sold an underutilized building and the related land located on its Chelmsford, Massachusetts campus to a real estate investment trust for $11.3 million. This property was leased to an unrelated third party prior to the sale. Direct transaction costs, consisting of broker commissions and legal fees, and unamortized deferred costs of $3.7 million, consisting primarily of commissions and tenant allowances, were written off and included in the determination of the gain on the sale.The components of the gain on the sale recognized in fiscal year 2013 are as follows (in thousands): Amount Sale proceeds $ 11,275 Net book value of building and land (6,095 ) Deferred leasing costs and other (3,718 ) Direct transaction costs (437 ) Gain on the sale of building and land $ 1,025 In addition, the Company sold certain buildings in Oberdiessbach, Switzerland during fiscal year 2013 for total proceeds of $3.2 million. The sale of these buildings resulted in a gain of $0.2 million which was recognized in the Company's results of operations during fiscal year 2013.Gains related to the sale of these buildings are recorded as a component of "Other income, net" in the accompanying Consolidated Statements of Operations.As of September 30, 2015, the building and the underlying land with a carrying value of $4.8 million located in Oberdiessbach, Switzerland were presented as "Assets Held for Sale" in the accompanying Consolidated Balance Sheets. The Company determined fair value of the assets held for sale based on indication of value resulting from marketing the building and the land to prospective buyers. The Company recognized a loss of $1.9 million in its results of operations during fiscal year 2015 for the difference between the assets' fair value of $2.9 million and the carrying value of $4.8 million.8. Goodwill and Intangible AssetsThe components of the Company’s goodwill by an operating segment at September 30, 2015 and 2014 are as follows (in thousands): Brooks
Product
Solutions Brooks
Global
Services Brooks
Life Science
Systems Other Total Gross goodwill, at September 30, 2013 $ 482,637 $ 156,792 $ 47,439 $ 26,014 $ 712,882 Accumulated goodwill impairments (437,706 ) (151,238 ) — (26,014 ) (614,958 ) Goodwill, net of accumulated impairments, at September 30, 2013 44,931 5,554 47,439 — 97,924 Acquisitions and adjustments 11,638 — (61 ) — 11,577 Gross goodwill, at September 30, 2014 494,275 156,792 47,378 26,014 724,459 Accumulated goodwill impairments (437,706 ) (151,238 ) — (26,014 ) (614,958 ) Goodwill, net of accumulated impairments, at September 30, 2014 56,569 5,554 47,378 — 109,501 Acquisitions and adjustments 3,660 — 8,247 — 11,907 Gross goodwill, at September 30, 2015 497,935 156,792 55,625 26,014 736,366 Accumulated goodwill impairments (437,706 ) (151,238 ) — (26,014 ) (614,958 ) Goodwill, net of accumulated impairments, at September 30, 2015 $ 60,229 $ 5,554 $ 55,625 $ — $ 121,408 Goodwill is tested for impairment annually or more often if impairment indicators are present, at the reporting unit level. Prior to fiscal year 2015, the Company conducted its annual goodwill impairment test as of its fiscal year end, or September 30th. Beginning with fiscal year 2015, the Company changed the date of its annual goodwill impairment test from September 30th to April 1st to align more closely with its annual strategic planning process. This change did not delay, accelerate, or avoid an impairment charge and did not result in adjustments to the Company's consolidated financial statements64NOTES TO CONSOLIDATED FINANCIAL STATEMENTS - (Continued)when applied retrospectively. During fiscal year 2015, the Company completed the annual goodwill impairment test and determined that no adjustment to goodwill was necessary since the fair value of all reporting units substantially exceeded their respective carrying values. The change in the annual impairment test date did not have an impact on the Company's financial position and results of operations during the fiscal year ended September 30, 2015. No triggering events indicating goodwill impairment occurred subsequent to the test date.The Company determines fair values of its reporting units based on an Income Approach in accordance with the DCF Method. The observable inputs used in the DCF Method include discount rates set above the Company's weighted-average cost of capital. The Company derives discount rates that are commensurate with the risks and uncertainties inherent in the respective businesses and its internally developed projections of future cash flows. Please refer to Note 2, "Summary of Significant Accounting Policies" for a detailed description of the Company's goodwill impairment testing process and the valuation techniques used in developing the related fair value measurements.The Company tests certain long-lived assets when impairment indicators are present. During fiscal year 2013, the Company determined that impairment indicators were present for the finite-lived intangible assets related to the Celigo product line. The assets were tested for recoverability by comparing the sum of the undiscounted cash flows directly attributable to the assets to their carrying values, which resulted in the conclusion that the carrying amounts of the assets were not recoverable. The fair values of the assets were determined based primarily on market-based valuation techniques, and an impairment loss of $2.0 million was recognized during fiscal year 2013. The loss amount was allocated to the long-lived assets in the impaired asset group based on the carrying value of each asset, with no asset reduced below its respective fair value. The Company revised its estimate of the fair value of these assets in fiscal year 2014 and recorded an additional impairment loss of $0.4 million within cost of revenue in its Consolidated Statements of Operations for the fiscal years ended September 30, 2014. The impairment loss was recorded in the Brooks Life Science Systems segment. The Company completed the sale of the Celigo product line during fiscal year 2014 which did not have a material impact on the Company's financial position or results of operations for the period then ended.The components of the Company’s identifiable intangible assets as of September 30, 2015 and 2014 are as follows (in thousands): September 30, 2015 September 30, 2014 Cost Accumulated
Amortization Net Book
Value Cost Accumulated
Amortization Net Book
ValuePatents $ 7,808 $ 7,394 $ 414 $ 7,808 $ 7,300 $ 508 Completed technology 60,748 46,718 14,030 57,155 41,539 15,616 Trademarks and trade names 4,241 3,604 637 3,496 3,496 — Customer relationships 77,716 37,351 40,365 73,389 29,963 43,426 $ 150,513 $ 95,067 $ 55,446 $ 141,848 $ 82,298 $ 59,550 Amortization expense for intangible assets, excluding amounts related to the discontinued operations, was $12.9 million, $10.6 million and $9.8 million for the fiscal years ended September 30, 2015, 2014 and 2013, respectively.Estimated future amortization expense for the intangible assets as of September 30, 2015 is as follows (in thousands):Year ended September 30, 2016 $ 12,180 2017 11,037 2018 8,677 2019 7,945 2020 7,224 Thereafter 8,383 $ 55,446 9. Equity Method and Other InvestmentsThe Company accounts for certain of its investments using the equity method of accounting and records its proportionate share of the investee's earnings (losses) in its results of operations with a corresponding increase (decrease) in the carrying value of the investment.BioCision, LLCIn March 2014, the Company acquired a 22% equity interest in BioCision, LLC, or BioCision, a privately-held company based in Larkspur, California, for $4.0 million. During fiscal year 2015, the Company's equity investment was diluted from 22% to 20% as a result of stock options granted to new employees. BioCision develops, manufactures and markets cell cryopreservation products used to improve and standardize the tools and methods for biomaterial sample handling. The Company determined that BioCision represented a variable interest entity since the level of equity investment at risk was not sufficient to finance its activities without additional financial support. However, the Company does not qualify as a primary beneficiary since it does not have the power to direct BioCision's product research, development, selling and marketing activities that have the most significant impact on its economic performance. The Company's loss exposure is limited to the amount of its investment since it has no future contractual funding commitments to BioCision. As such, the Company concluded that BioCision should not be consolidated in its financial statements.During the fiscal years ended September 30, 2015 and 2014, the Company recorded a loss of $1.0 million and $0.3 million, respectively, representing its proportional share in the BioCision's losses. The carrying value of the investment in BioCision is $2.7 million and $3.7 million, respectively, at September 30, 2015 and 2014.The Company purchased BioCision's five-year convertible debt securities with a warrant agreement to purchase preferred units of BioCision for $2.5 million on December 22, 2014 and February 2, 2015 for a total purchase price of $5.0 million. The convertible debt securities were recorded at fair value and accounted for in accordance with the fair value method. The warrants were recorded at fair value and accounted for as a derivative. At September 30, 2015, the fair values of the convertible debt securities and warrants are $5.3 million and $0.1 million, respectively.For further information regarding the convertible debt securities and warrants, please refer to Note 6, “Fair Value Measurements”. The Company re-measures the fair values of the BioCision convertible debt securities and warrants during each reporting period and recognizes the respective gains or losses in its results of operations. The Company recognized remeasurement gains of $0.4 million during fiscal year ended September 30, 2015. Interest accrues on the convertible debt securities at a rate of 9% per annum, and is due with the principal at maturity.As a result of providing the additional funding to BioCision, the Company reconsidered whether BioCision represents a variable interest entity subject to consolidation. The Company concluded that BioCision remains a variable interest entity since the level of equity investment at risk is not sufficient to finance its activities without additional financial support. However, the Company does not qualify as a primary beneficiary since it does not have the power to direct BioCision's product research, development, selling and marketing activities that have the most significant impact on its economic performance. As such, the Company concluded that BioCision should not be consolidated in its financial statements.ULVAC Cryogenics, Inc.The Company participates in a 50% joint venture, ULVAC Cryogenics, Inc., or UCI, with ULVAC Corporation of Chigasaki, Japan. UCI manufactures and sells cryogenic vacuum pumps, principally to ULVAC Corporation.The carrying value of the investment in UCI is $21.5 million and $22.6 million, respectively, at September 30, 2015 and 2014. During the fiscal years ended September 30, 2015, 2014 and 2013, the Company recorded an income of $1.4 million, $1.6 million and $2.6 million, respectively, representing its proportionate share of the UCI's earnings. Management fee payments received by the Company from UCI were $0.6 million during each fiscal year ended September 30, 2015, 2014 and 2013, respectively. During the fiscal years ended September 30, 2015, 2014 and 2013, the Company incurred charges from UCI for products or services of $0.4 million, $0.4 million and $0.5 million, respectively. At September 30, 2015 and 2014, the Company owed UCI $54,000 and $79,000, respectively, in connection with accounts payable for unpaid products and services. During the fiscal years ended September 30, 2015 and 2014, the Company received $0.6 million and $0.9 million, respectively, of cash dividends from UCI which reduced the carrying value of the Company's investment.Yaskawa Brooks Automation, Inc.The Company participated in a 50% joint venture with Yaskawa Electric Corporation, or Yaskawa, called Yaskawa Brooks Automation, Inc., or YBA, which came to closure in March 2015 and was liquidated on September 3, 2015. YBA exclusively marketed and sold Yaskawa’s semiconductor robotics products and Brooks’ automation hardware products to semiconductor customers in Japan. During the first quarter of fiscal year 2015, the Company and Yaskawa agreed in principle to dissolve the joint venture. On January 22, 2015, the Company entered into an agreement with YBA to facilitate the acquisition of certain assets and liabilities by the Company’s subsidiary in Japan. In accordance with provisions of the joint65NOTES TO CONSOLIDATED FINANCIAL STATEMENTS - (Continued)venture's agreement, on March 20, 2015, the Company purchased the net assets of YBA for cash consideration of approximately $1.8 million. The Company recorded the assets received and liabilities assumed from YBA at fair value as of the acquisition date. As a result of the transaction, the Company recorded $0.2 million of goodwill, representing the excess of the consideration transferred over the fair value of the net assets acquired. The Company received a final dividend of $1.8 million upon liquidation of YBA and incurred liquidation costs of $0.2 million during fiscal year 2015. During fiscal year 2015, YBA assessed the recoverability of assets held by the joint venture in connection with its planned dissolution and notified its equity partners of the asset impairment. As a result, the Company recorded an impairment charge of $0.7 million during fiscal year 2015 to write down the carrying value of its equity investment in YBA to its fair value.During the fiscal years ended September 30, 2015, 2014 and 2013, the Company recorded a loss of $(0.6) million, $(0.1) million and $(0.2) million, respectively, representing its proportionate share of the YBA's losses. The carrying value of the investment in YBA was $2.6 million at September 30, 2014. During the fiscal years ended September 30, 2015, 2014 and 2013, revenue earned by the Company from YBA was $2.5 million, $7.4 million and $6.3 million, respectively. During the fiscal years ended September 30, 2015, 2014 and 2013, the Company incurred charges from YBA for products or services of $0.7 million, $0.7 million and $0.5 million, respectively. There were no amounts receivable by the Company from YBA or owed by the Company to YBA at September 30, 2015. At September 30, 2014, the Company had a balance of $2.1 million, respectively, receivable from YBA which was included in accounts receivable in the accompanying Consolidated Balance Sheets. At September 30, 2014, the Company owed YBA $0.1 million, respectively, in connection with accounts payable for unpaid products and services.66NOTES TO CONSOLIDATED FINANCIAL STATEMENTS - (Continued)10. Earnings per ShareThe calculations of basic and diluted net income (loss) per share and basic and diluted weighted average shares outstanding are as follows for the fiscal years ended September 30, 2015, 2014 and 2013 (in thousands, except per share data): Year ended September 30, 2015 2014 2013 Income (loss) from continuing operations $ 14,221 $ 1,520 $ (7,114 ) Income from discontinued operations, net of tax — 30,002 4,964 Net income (loss) 14,221 31,522 (2,150 ) Net income attributable to noncontrolling interests — (161 ) (65 ) Net income (loss) attributable to Brooks Automation, Inc. $ 14,221 $ 31,361 $ (2,215 ) Weighted average common shares outstanding used in computing basic earnings per share 67,411 66,648 65,912 Dilutive common stock options and restricted stock units 1,138 996 — Weighted average common shares outstanding used in computing diluted earnings per share 68,549 67,644 65,912 Basic net income (loss) per share attributable to Brooks Automation, Inc. common stockholders: Income (loss) from continuing operations $ 0.21 $ 0.02 $ (0.11 ) Income from discontinued operations, net of tax — 0.45 0.08 Basic net income (loss) per share attributable to Brooks Automation, Inc. $ 0.21 $ 0.47 $ (0.03 ) Diluted net income (loss) per share attributable to Brooks Automation, Inc. common stockholders: Income (loss) from continuing operations $ 0.21 $ 0.02 $ (0.11 ) Income from discontinued operations, net of tax — 0.44 0.08 Diluted net income (loss) per share attributable to Brooks Automation, Inc. common stockholders $ 0.21 $ 0.46 $ (0.03 ) Approximately 120,000 shares of unvested restricted stock units were excluded from the computation of diluted earnings per share for the fiscal year ended September 30, 2015 as their effect would be anti-dilutive based on the treasury stock method. Options to purchase approximately 11,000 shares of common stock were excluded from the computation of diluted earnings per share attributable to Brooks Automation, Inc. common stockholders for the fiscal years ended September 30, 2014 as their effect would be anti-dilutive based on the treasury stock method. There were no anti-dilutive restricted stock awards for the fiscal year ended September 2014. Options to purchase approximately 43,000 shares of common stock and 3,006,000 shares of unvested restricted stock units were excluded from the computation of diluted earnings per share for the fiscal year ended September 30, 2013 as a result of the net loss for that period.On November 4, 2015, the Company's compensation committee and Board of Directors authorized and approved the annual grant of 1,204,000 restricted stock units with a grant date of November 4, 2015.11. Note ReceivableIn fiscal year 2012, the Company provided a strategic partner, or the Borrower, a loan of $3.0 million to support the Borrower's future product development and other working capital requirements. The loan initially bore a stated interest rate of 9%, and the outstanding principal and interest were initially due in May 2015. The Company also received a warrant to purchase the Borrower's common stock in the event of an equity offering by the Borrower and certain other rights related to conversion of the loan, including the first refusal to acquire the Borrower and a redemption premium. The loan was initially secured by a security agreement granting the Company a first-priority security interest in all of the Borrower's assets.The Company determined that the Borrower represented a variable interest entity since the level of equity investment at risk was not sufficient for the entity to finance its activities without additional financial support. However, the Company does not qualify as the primary beneficiary since it would not absorb the majority of the expected losses from the Borrower and does not have the power to direct the Borrower's product research, development and marketing activities that have the most significant impact on its economic performance. The Company has no future contractual funding commitments to the Borrower and, as a result, the Company's exposure to loss is limited to the outstanding principal and interest due on the loan.During the third quarter of fiscal year 2014, the Borrower informed the Company of its intent to secure additional funding from an investment program funded by the Commonwealth of Massachusetts designed to support early-stage companies. In connection with the Borrower’s efforts to secure additional financing, the Company agreed to subordinate its security interest in the assets of the Borrower to the new lender. Additionally, the Company agreed to extend the due date of its loan by approximately 5 years, to September 2019, in order to coincide with the due date of the new loan. The amended loan has a stated interest rate of 10%.In connection with its efforts to secure additional financial support, the Borrower developed revised assumptions about its future cash flows. Based on the information provided by the Borrower and the subordination of the loan to the new lender, the Company determined it was probable that it would not recover all amounts due from the loan and recorded an impairment charge of $2.6 million during the third quarter of fiscal year 2014. The impairment charge included the warrant write-off and was recorded in the selling, general and administrative expenses in the Company's Consolidated Statements of Operations.The fair value of the loan was determined by considering the fair value of the collateral using valuation techniques, principally the discounted cash flow method, reduced by the amounts committed to the new lender. The observable inputs used in the Company's analysis were limited primarily to the discount rate, which was based on a rate commensurate with the risks and uncertainties of the Borrower. As a result, the fair value of the loan could vary under different conditions or assumptions, including the varying assumptions regarding future cash flows of the Borrower or discount rates.At September 30, 2015 and 2014, the carrying value of the note receivable was $1.0 million. No triggering events indicating impairment of the note receivable occurred during the fiscal year ended September 30, 2015. Derivative InstrumentsPrior to fiscal year 2014, the Company was a party to foreign exchange contracts to reduce its exposure to changes in foreign exchange rates associated with an order for multiple automated sample management systems. The Company concluded that these foreign currency contracts met the criteria to qualify as a cash flow hedge. Accordingly, the Company reflected changes in the fair value of the effective portion of these foreign currency contracts in accumulated other comprehensive income. In the third quarter of fiscal year 2014, the Company reclassified the realized gain of $0.1 million on these contracts from accumulated other comprehensive income into revenue to coincide with recognition of the hedged transaction. Please refer to Note 15, "Stockholders' Equity", for further information on this reclassification and its impact on the accumulated other comprehensive income and other comprehensive income for the fiscal year 2014. The Company did not recognize any amounts related to hedging ineffectiveness of these contracts in the results of operations for the fiscal year ended September 30, 2014. As of September 30, 2014, the Company did not have any notional amounts outstanding under foreign currency contracts that qualified for cash flow hedge accounting.The Company has transactions and balances denominated in currencies other than the U.S. dollar. Most of these transactions or balances are denominated in Euros, British Pounds and a variety of Asian currencies. These transactions and balances, including short-term advances between the Company and its subsidiaries, subject the Company's operations to exposure from exchange rate fluctuations. The impact of currency exchange rate movement can be positive or negative in any period. The Company mitigates the impact of potential currency translation gains and losses on short-term intercompany advances through timely settlement of each transaction, generally within 30 days.The Company also enters into foreign exchange contracts to reduce its exposure to currency fluctuations. Under forward contract arrangements, the Company typically agrees to purchase a fixed amount of U.S. dollars in exchange for a fixed amount of a foreign currency on specified dates with maturities of three months or less. These transactions do not qualify for hedge accounting. Net gains and losses related to these contracts are recorded as a component of "Other income, net" in the accompanying Consolidated Statements of Operations and are as follows for the fiscal years ended September 30, 2015, 2014 and 2013 (in thousands): Years Ended September 30, 2015 2014 2013 Realized gains on derivatives not designated as hedging instruments $ 628 $ 185 $ 123 67NOTES TO CONSOLIDATED FINANCIAL STATEMENTS - (Continued)The Company had the following notional amounts outstanding under foreign currency contracts that do not qualify for hedge accounting at September 30, 2015 and 2015 (in thousands):September 30, 2015:Buy Currency Notional Amount
of Buy Currency Sell Currency Maturity Notional Amount
of Sell Currency Fair Value of
Assets Fair Value of
LiabilitiesU.S. Dollar 1,543 Korean Won October 2015 1,852,000 $ — $ (6 ) British Pound 2,157 Euro October 2015 1,600 — (29 ) U.S. Dollar 1,336 Japanese Yen December 2015 160,000 2 — U.S. Dollar 662 Taiwan Dollar October 2015 22,000 (1 ) U.S. Dollar 4,308 British Pound October 2015 6,520 32 — U.S. Dollar 5,177 Chinese Yuan October 2015 33,000 15 — Euro 9,300 U.S. Dollar October 2015 8,253 40 — U.S. Dollar 425 Japanese Yen October 2015 51,000 — — U.S. Dollar 457 Israeli Shekel October 2015 1,800 — — 89 (36 ) September 30, 2014:Buy Currency Notional Amount
of Buy Currency Sell Currency Maturity Notional Amount
of Sell Currency Fair Value of
Assets Fair Value of
LiabilitiesU.S. dollar 1,736 Japanese yen October 2014 to December 2014 190,000 $ — $ 11 U.S. dollar 1,395 Euro October 2014 1,100 — 16 U.S. dollar 656 Taiwan dollar October 2014 20,000 — 5 U.S. dollar 650 British pound October 2014 400 — 5 U.S. dollar 731 Israeli shekel October 2014 2,700 — 5 U.S. dollar 76 Korean won October 2014 80,000 — 1 British pound 3,513 Euro October 2014 4,500 — 15 $ — $ 58 The fair values of the forward contracts described above are recorded in the Company's Consolidated Balance Sheets as prepaid expenses and other current assets and accrued expenses and other current liabilities.Stock WarrantsThe BioCision warrant agreements contain net share settlement provisions, which permit the Company to pay the warrant exercise price using shares issuable under the warrants (“cashless exercise”). The value of the stock warrants fluctuates primarily in relation to the value of BioCision's underlying securities, either providing an appreciation in value or potentially expiring with no value. Gains and losses on the revaluation of the stock warrants are recognized as a component of "Other income, net" in the accompanying Consolidated Statements of Operations. Please refer to Note 6 “Fair Value Measurements” for further information regarding the fair value of the stock warrants.68NOTES TO CONSOLIDATED FINANCIAL STATEMENTS - (Continued)13. Income Taxes, excluding amounts related to the discontinued from continuing operations for the fiscal years ended September 30, 2015, 2014 and 2013 are as follows (in thousands): Year Ended September 30, 2015 2014 2013 Current income tax provision: Federal $ 10 $ 15 $ 15 State 56 177 70 Foreign 5,537 1,417 681 Total current income tax provision 5,603 1,609 766 Deferred income tax benefit: Federal (1,773 ) (2,276 ) (5,245 ) State (104 ) (35 ) (183 ) Foreign (296 ) (1,278 ) (323 ) Total deferred income tax benefit (2,173 ) (3,589 ) (5,751 ) Income tax provision (benefit) $ 3,430 $ (1,980 ) $ (4,985 ) (losses) of equity method investments for the fiscal years ended September 30, 2015, 2014 and 2013 are as follows (in thousands): Year Ended September 30, 2015 2014 2013 Domestic $ (1,321 ) $ (7,338 ) $ (14,747 ) Foreign 19,136 5,643 206 $ 17,815 $ (1,695 ) $ (14,541 ) raterates for the fiscal years ended September 30, 2015, 20142018, 2017 and 20132016 are as follows (in thousands): Year Ended September 30, 2015 2014 2013 Income tax provision (benefit) computed at federal statutory rate $ 6,177 $ (217 ) $ (4,257 ) State income taxes, net of federal benefit 243 (12 ) (101 ) Foreign income taxed at different rates (938 ) (596 ) 493 Dividends (1,069 ) (1,373 ) 115 Change in deferred tax asset valuation allowance (36 ) 453 523 Reduction in uncertain tax positions (1,207 ) (1,236 ) (1,022 ) Nondeductible compensation 1,325 1,064 474 Tax credits (1,741 ) (704 ) (2,002 ) Travel and entertainment 314 220 124 Merger costs 228 187 251 Other 134 234 417 Income tax provision (benefit) $ 3,430 $ (1,980 ) $ (4,985 ) for U.S. income taxes on the outside basis differences of its foreign subsidiaries consistent with the indefinite reinvestment assertion. As of September 30, 2018, the cumulative unremitted earnings of certain foreign subsidiaries as these earnings are consideredcontributing to be indefinitely reinvested. These earningsthe outside basis difference amounted to approximately $40.3 million, $25.2 million and $17.5 million, at September 30, 2015, 2014 and 2013, respectively. It$164.0 million. The basis difference for U.S. tax purposes is not practicable to computelower because the estimated deferredCompany has U.S. tax liability on thesebasis in the foreign earnings as they dependa result of the toll charge recognized during fiscal year 2018. The foreign earnings are expected to be reinvested in foreign operations and acquisitions. The Company has not accrued foreign withholding tax costs on numerous factors and vary based on the timing of future remittances and the future results of various foreign operations.69NOTES TO CONSOLIDATED FINANCIAL STATEMENTS - unremitted earnings(Continued). 20152018 and 20142017 are as follows (in thousands): September 30, 2015 2014 Accruals and reserves not currently deductible $ 9,602 $ 12,456 Federal, state and foreign tax credits 22,115 20,434 Other assets 5,939 3,523 Net operating loss carryforwards 63,569 67,380 Inventory reserves and valuation 10,598 9,956 Deferred tax assets 111,823 113,749 Depreciation and intangible amortization 9,388 12,198 Deferred tax liabilities 9,388 12,198 Valuation allowance (18,797 ) (18,354 ) Net deferred tax asset $ 83,638 $ 83,197 Management hasall availablethat evidence, in determining whether a valuation allowance is needed. The weight given to the potential effect of negative and positive evidence should be established againstcommensurate with the extent to which it can be objectively verified. The more negative evidence that exists, (a) the more positive evidence is necessary and (b) the more difficult it is to support a conclusion that a valuation allowance is not needed for some portion or the entire deferred tax asset. Aat September 30, 2015. Basedby tax-paying component and assesses the need for a valuation allowance on an annual and quarterly basis. The Company evaluates the considerationprofitability of botheach tax-paying component on a historic cumulative basis and a forward-looking basis in the course of performing this analysis. The Company evaluated all positive and negative evidence management hasin concluding it was appropriate to establish a full valuation allowance against U.S. net deferred tax assets during fiscal year 2016. The company maintained this position throughout fiscal year 2017 and the first quarter of fiscal year 2018.iswas more likely than not that a substantial portion of itsthe U.S. deferred tax assets willwould be realized. The positive evidence considered included threeIn the second quarter of fiscal year U.S. historical2018 the Company reached a significant level of cumulative profitability projected future taxable income and lengthin the U.S., coupled with an improved outlook of carry-forward periodsU.S. earnings. During the full fiscal year 2018, the Company reduced its U.S. valuation against its U.S. net deferred tax assets resulting in a tax benefit of net operating losses and tax credits.$77.2 million. The primary negative evidence considered was the volatilityremaining portion of the semiconductor industry in which the Company operates.The Company maintains aCompany’s U.S. valuation allowance inis related to the United States againstrealizability of certain state tax credits and state net operating losses due to the uncertainty of their realization based on long-term Company forecasts and the expiration dates on these attributes.loss carry-forwards. The Company also maintains acontinues to maintain valuation allowanceallowances against net deferred tax assets in certain jurisdictions that have not generated historical cumulative profitability. It is reasonably possible that the valuation allowance may change in future periods if future operating resultsforeign tax-paying components as of the U.S. or foreign jurisdictions deviate from the Company's expectations, which would result, in whole or in part, in a non-cash income tax expense or benefit recognized during the periodend of change.2015,2018, the Company had federal, state and foreign net operating loss carryforwardscarry-forwards of approximately $133.6 million, $101.1$67.4 million and $23.6$58.7 million, respectively,respectively. The state net operating losses are generated in various jurisdictions with different carryover periods and expire starting in 2019 through 2035. Certain foreign net operating loss carryovers will begin to expire in 2019. and state research and development tax credit carryforwardscarry-forwards of approximately $23.8 million available to reduce future tax liabilities, which$20.4 million. These credit carry-forwards will expire at various dates beginning in 2019 through 2035.2038. The Company also has $11.0 million of state credits which begin to expire in 2019, while some of these credits have an unlimited carryover period.carryforward includes excess deductions relatedcarryovers and tax credits exist to stock compensation inoffset the amount of $13.0 million which have not been recognized for financial statement purposes. The benefits of these tax deductions will be credited to additional paid-in capital upon being realized.Company's U.S. net operating losses expire at various dates through 2030.70NOTES TO CONSOLIDATED FINANCIAL STATEMENTS - (Continued)2015, 20142018, 2017 and 20132016 is as follows (in thousands): Unrecognized Tax
Benefit Interest
and
Penalties Total Balance at October 1, 2012 $ 5,961 $ 1,644 $ 7,605 Additions for tax positions of prior years — 228 228 Additions for tax positions related to acquired entities 116 — 116 Reductions from lapses in statutes of limitations (944 ) (78 ) (1,022 ) Foreign exchange rate adjustment 14 — 14 Balance at September 30, 2013 5,147 1,794 6,941 Additions for tax positions of prior years — 286 286 Reductions from lapses in statutes of limitations (861 ) (375 ) (1,236 ) Foreign exchange rate adjustment (24 ) — (24 ) Balance at September 30, 2014 4,262 1,705 5,967 Additions for tax positions of prior years — 221 221 Reductions from settlements with taxing authorities (1,304 ) — (1,304 ) Reductions from lapses in statutes of limitations (734 ) (473 ) (1,207 ) Foreign exchange rate adjustment (33 ) — (33 ) Balance at September 30, 2015 $ 2,191 $ 1,453 $ 3,644 As of September 30, 2015, all ofCompany'sending balance of unrecognized tax benefits for the fiscal year ended September 30, 2018 are $3.0 million of tax benefits that if recognized would affectimpact the effective tax rate. The Company recognizes interest related to unrecognized benefits as a component of the income tax provision (benefit), of which $0.2$0.1 million, $0.3$0.1 million and $0.2$0.1 million, respectively, was recognized for the fiscal years ended September 30, 2015, 20142018, 2017 and 2013, respectively. various state, local and international income taxes in various jurisdictions. The amount of income taxes paid is subject to the Company'sCompany’s interpretation of applicable tax laws in the jurisdictions in which it files. Company is subject to examination by taxing authorities throughout the world. The statute of limitations lapsed on several uncertain tax positions in the foreign jurisdictions during fiscal year 2015 that resulted in a $1.2 million reduction in gross unrecognized tax benefits that impacted the effective tax rate. The Company is subject to income tax audits in various global jurisdictions in which it operates. The years subject to examination vary for the U.S. and international jurisdictions, with the earliest tax year being 2009.2011. Based on the outcome of these examinations or the expiration of statutes of limitations for specific jurisdictions, it is reasonably possible that the related unrecognized tax benefits could change from those recorded in the Company'sCompany’s Consolidated Balance Sheets. The Company currently anticipates that it is reasonably possible that the unrecognized tax benefits will be reduced by approximately $1.3 million.$0.1 million in the next 12 months.170 170 4 twothree active defined benefit pension plans (collectively, the “Plans”)., including legacy Taiwan Plan, the legacy Switzerland Plan, and the newly acquired Tec-Sem Plan. The Plans cover substantially all of the Company’s employees in Switzerland and Taiwan. Retirement benefits are generally earned based on years of service and the level of compensation during active employment; however,employment, but the level of benefits varies within the Plans. Eligibility is determined in accordance with local statutory requirements.20152018 and 20142017 (in thousands):71NOTES TO CONSOLIDATED FINANCIAL STATEMENTS - (Continued) September 30, 2015 2014 Benefit obligation at beginning of fiscal year $ 8,213 $ 7,107 Service cost 482 406 Interest cost 124 154 Actuarial loss 733 968 Benefits paid (209 ) (141 ) Employee contributions 444 — Settlements paid (1,795 ) — Foreign currency translation (331 ) (281 ) Benefit obligation at end of fiscal year $ 7,661 $ 8,213 Fair value of assets at beginning of fiscal year $ 6,131 $ 5,996 Actual return on plan assets 112 98 Disbursements (334 ) (264 ) Employer contributions 306 302 Employee contributions 642 200 Settlements paid (1,795 ) — Foreign currency translation (224 ) (201 ) Fair value of assets at end of fiscal year $ 4,838 $ 6,131 Accrued benefit obligation $ 2,823 $ 2,082 $6.9$10.6 million and $7.3$3.1 million, respectively, at September 30, 20152018 and 2014, respectively. Both2017. All Plans have an accumulated benefit obligation and projected benefit obligation in excess of plans'plans’ assets at September 30, 2015 and 2014.20152018 and 20142017 (in thousands): September 30, 2015 2014 Accrued compensation and benefits $ 298 $ 308 Long-term pension liability 2,525 1,774 2,823 2,082 Accumulated other comprehensive income at September 30, 2015 and 2014 includes unrecognized net actuarial (losses) gains of $(0.2) million and $0.3 million, respectively, and cumulative unrecognized investment losses of $(0.8) million during each fiscal year, respectively.The components of the Company’s net pension cost for the fiscal years ended September 30, 2015, 2014 and 2013 are as follows (in thousands): Year ended September 30, 2015 2014 2013 Service cost $ 482 $ 406 $ 604 Interest cost 124 154 148 Expected return on plan assets (210 ) (214 ) (247 ) Amortization of losses 2 2 4 Other — — 160 Net periodic pension cost 398 348 669 Settlement loss 232 — 87 Total pension cost $ 630 $ 348 $ 756 72NOTES TO CONSOLIDATED FINANCIAL STATEMENTS - (Continued)The following changes in Plans' assets and benefit obligations were recognized in other comprehensive income (loss) as of September 30, 2015 and 2014 (in thousands): September 30, 2015 2014 Net loss $ 722 $ 961 Amortization of net loss (2 ) (2 ) Settlement loss (232 ) — Total recognized in other comprehensive income (loss) 488 959 Total recognized in net periodic pension cost and other comprehensive income (loss) $ 886 $ 1,307 Settlement loss of $(0.2) million was reclassified from accumulated other comprehensive income (loss) into the results of operations during the fiscal year ended September 30, 2015. Please refer to Note 15, "Stockholders' Equity", for further information on this reclassification and its impact on the accumulated other comprehensive income and other comprehensive income for the period then ended.Weighted-average assumptions used to determine the projected benefit obligation for the fiscal years ended September 30, 2015, 2014 and 2013 are as follows: Year Ended September 30, 2015 2014 2013 Discount rate 0.92 % 1.55 % 2.15 % Expected return on plan assets 1.78 % 2.18 % 2.17 % Expected rate of compensation increases 1.65 % 1.87 % 1.89 % In selecting the appropriate discount rates for the Plans, the Company uses country-specific information, adjusted to reflect the duration of the particular plan. The expected return on plan assets is based on an evaluation of fixed income yield curves and equity return assumption studies applied to the Plans' asset allocations. (benefit) on a market-related valuation of assets, which reduces year-to-year volatility. This market-related valuation recognizes investment gains or losses over a five-year period from the year in which they occur. Investment gains or losses represent the difference between the expected return calculated using the market-related value of assets and the actual return on assets. Since the market-related value of assets recognizes gains or losses over a five-year period, the future value of assets will be impacted as previously deferred gains or losses are recognized. At September 30, 2015,2018 and 2017, the Company had cumulative unrecognized net actuarial gains less than $0.1 million and $0.4 million, respectively, which are amortized into net periodic benefit cost over the average remaining service period of active Plans’ participants. At September 30, 2018 and 2017, the Company had cumulative unrecognized investment gains of $0.5 million and losses of approximately $0.8$0.1 million, respectively, under the Plans which remain to be recognized in the calculation of the market-related values of assets. At2015,2018, 2017 and 2016 are as follows (in thousands):1.04 0.88 0.40 1.06 1.75 1.75 1.19 1.54 1.31 had cumulative other actuarial gainsuses country-specific information, adjusted to reflect the duration of (0.2) million which are amortized into net periodic benefit cost over the average remaining service periodparticular plan. The expected return on plan assets is based on an evaluation of active Plans' participants.Switzerland Plantwo Swiss Plans and the Taiwan Plan were $4.3$6.8 million and $0.5$0.3 million, respectively, at September 30, 2015.2018. The assets of the Swiss Plans are invested in a collective fund with multiple employers through a Swiss insurance company, which is a customary practice for Swiss pension plans. The CompanyPlan'sPlan’s assets which are invested primarily in highly rated debt securities.Plan'sPlan’s assets.Plans'Plans’ assets at September 30, 20152018 is as follows:73NOTES TO CONSOLIDATED FINANCIAL STATEMENTS - (Continued)September 30, 201572871310020152018 are as follows (in thousands): As of September 30, 2015 Level 1 Level 2 Level 3 Total Swiss Life collective foundation $ — $ 4,347 $ — $ 4,347 Taiwan collective trust — 491 — 491 Total $ — $ 4,838 $ — $ 4,838 20142017 are as follows (in thousands): As of September 30, 2014 Level 1 Level 2 Level 3 Total Swiss Life collective foundation $ — $ 5,608 $ — $ 5,608 Taiwan collective trust — 523 — 523 Total $ — $ 6,131 $ — $ 6,131 6,21, "Fair Value Measurements" for a description of the levels of inputs used to determine fair value measurements.266 253 267 297 293 117 2016 $ 218 2017 52 2018 53 2019 54 2020 112 Thereafter (through 2025) 748 20162019 to meet the minimum funding requirements of the Plans.$3.5and $3.1 million, and $3.2 million, respectively, for the fiscal years ended September 30, 2015, 20142018, 2017 and 2013.2016.20152018 and 2014,2017, respectively. Preferred stock has a par value of $0.01 per share and may be issued at the discretion of the Board of Directors without stockholder approval with such designations, rights and preferences as the Board of Directors may determine. There were no shares of preferred stock issued or outstanding at September 30, 20152018 or 2014,2017, respectively.74NOTES TO CONSOLIDATED FINANCIAL STATEMENTS - (Continued)2015, 20142018, 2017 and 20132016 (in thousands): Currency Translation Adjustments Unrealized Gains (Losses) on Available-for-Sale Securities Unrealized Gains (Losses) on Cash Flow Hedges Pension Liability Adjustments Total Balance at September 30, 2012 $ 24,511 $ 201 $ — $ (1,070 ) $ 23,642 Other comprehensive (loss) income before reclassifications (2,113 ) (114 ) 14 1,109 (1,104 ) Amounts reclassified from accumulated other comprehensive income — (21 ) — 87 66 Balance at September 30, 2013 22,398 66 14 126 22,604 Other comprehensive (loss) income before reclassifications (6,296 ) (78 ) 79 (503 ) (6,798 ) Amounts reclassified from accumulated other comprehensive income — (26 ) (93 ) — (119 ) Balance at September 30, 2014 16,102 (38 ) — (377 ) 15,687 Other comprehensive income before reclassifications (9,426 ) 144 — (605 ) (9,887 ) Amounts reclassified from accumulated other comprehensive income (131 ) (3 ) — 232 98 Balance at September 30, 2015 $ 6,545 $ 103 $ — $ (750 ) $ 5,898 or AOCI, into results of operations at the time of the securities'securities’ sale, as described in Note 5, "Marketable Securities.” Losses on settlements of cash flow hedges are reclassified from AOCI into results of operations at the time of the settlement, as described in Note 12, "Derivative Instruments.” LossesGains (losses) related to defined benefit pension plan settlements are reclassified from AOCIaccumulated other comprehensive income into results of operations at the time of the settlement, as described in Note 14, "Postretirement Benefits.” Losses related to currency translation adjustments were reclassifiedDefined benefit pension plan curtailments are recognized as reclassifications from AOCI into results of operations upon liquidation of YBA joint venture,accumulated other comprehensive income and corresponding reductions in pension liabilities and net pension cost, as described in Note 9, "Equity Method Investments".Noncontrolling InterestsNoncontrolling interests represents the minority shareholders’ proportionate share of the equity in the Company’s majority owned subsidiary, Brooks Automation Asia, Ltd., or BAA. The Company has historically consolidated the financial position and results of operations from BAA and presented the portion of the income attributable to the minority shareholders as “Net income attributable to noncontrolling interests” in the Consolidated Statements of Operations. In September 2014, the Company acquired the remaining interest in BAA from the minority shareholders for $3.2 million. Increases in ownership of a consolidated subsidiary are accounted for as equity transactions and as a result, no additional assets or liabilities are recognized upon acquiring additional interest. As of the date of the acquisition, 100% of BAA’s pre-tax income was reflected in the Company’s results of operations. The increase in the Company's proportional share of BAA's results of operations was not material to the Company's results of operations for the fiscal year ended September 30, 2014. The payment to the minority shareholders was classified as a financing activity in the Consolidated Statements of Cash Flows. As a result of this transaction, the Company does not have noncontrolling interests as of September 30, 2015 and 2014, respectively.Company'sCompany’s equity incentive plans are intended to attract and retain employees and provide an incentive for them to contribute to the Company'sCompany’s long-term growth and achievement of its long-range performance goals. The equity incentive plans consist of plans under which employees may be granted options to purchase shares of the Company'sCompany’s stock, restricted stock and other equity incentives. Stock options generally had a 4 year vesting period and were exercisable for a period not to exceed 10 years from the date of issuance. Restricted stock awards generally have a 3 yearthree-year vesting period. At September 30, 2015, there were no options outstanding, and2018, a total of 4,928,8703,006,971 shares were reserved and available for future issuancegrant under the equity incentive plans.75NOTES TO CONSOLIDATED FINANCIAL STATEMENTS - (Continued)Amended and Restated 2000The primary purpose of the Amended and Restated 2000 Equity Incentive Plan, or the “2000 Plan, is to attract and retain employees and provide an incentive for them to contribute to the Company's long-term growth and achievement of its long-range performance goals. 20002015 Equity Incentive Plan (the “2015 Plan") provisions, the Company may grant (i) options intended to qualify as incentive stock options under Section 422 of the Internal Revenue Code, (ii) options that are not qualified as incentive stock options, or the nonqualified stock options, and (iii) stock appreciation rights, performance awards and restricted stock. All employees of the Company or any affiliate of the Company, independent directors, consultants and advisors are eligible to participate in the 2000 Plan. Options granted out of the 2000 Plan generally vested over four years and expired within ten years from the date of grant. The 2000 Plan provided for the issuance of a maximum of 9,000,000 shares of common stock. The 2000 Plan expired on March 31, 2015. Stock option and restricted stock and other stock-based awards, granted out of the 2000 Plan that were canceled or forfeited after February 5, 2015 were available for grant under the 2015 Equity Incentive Plan.2015 Equity Incentive PlanThe primary purpose of the 2015 Equity Incentive Plan, or the “2015 Plan, is to attract and retain employees and provide an incentive for them to contribute to the Company's long-term growth and achievement of its long-range performance goals. In accordance with the 2015 Plan provisions, the Company may grant (i) stock appreciation rights, performance awards and restricted stock, (ii) options that are not qualified as incentive stock options, or nonqualified stock options, and (iii) options intended to qualify as incentive stock options under Section 422 of the Internal Revenue Code. All employees of the Company or any affiliate2015.Stock Option ActivityThe following table summarizes stock option activity for all the aforementioned plans for the fiscal year ended September 30, 2015: 2015 Shares Weighted-
Average
Remaining
Contractual Term Weighted
Average Exercise Price Aggregate
Intrinsic Value
(In Thousands)Outstanding at September 30, 2014 5,550 0.3 years $ 13.20 Forfeited / Expired (5,550 ) $ 13.20 Outstanding at September 30, 2015 — 0.0 years $ — Vested at September 30, 2015 — 0.0 years $ — Exercisable at September 30, 2015 — 0.0 years $ — Prior to fiscal year 2014, the Company assumed the outstanding options of multiple stock option plans in connection with the acquisition of Helix Technology Corporation, or Helix. At acquisition, 689,622 options to purchase shares of Helix common stock were outstanding and converted into 765,480 options to purchase shares2015 upon expiration of the Company’s common stock. As of September 30, 2014, a total of 5,550 vested options were outstanding which expired in fiscal year2000 Plan on March 31, 2015. As of September 30, 2015, no options were outstanding and no shares were available for grant out of the Helix plans.Options outstanding as of September 30, 2014 had no intrinsic value based on the Company’s closing stock price of $10.51 as of that date. The total intrinsic value of options exercised was $0 during fiscal year 2013. Cash proceeds received from option exercises were $0 during fiscal year 2013. The Company settled option exercises with newly issued shares of common stock. There were no options exercised during fiscal years 2015 and 2014, respectively.As of September 30, 2015, the Company had no future unrecognized stock-based compensation expense related to stock options.2015:76NOTES TO CONSOLIDATED FINANCIAL STATEMENTS - (Continued) 2014 Shares Weighted
Average
Grant-Date
Fair ValueOutstanding at September 30, 2014 2,726,485 $ 11.05 Granted 1,513,281 $ 11.89 Vested (709,619 ) $ 9.40 Forfeited (272,734 ) $ 10.40 Outstanding at September 30, 2015 3,257,413 $ 9.95 2015, 20142018, 2017 and 20132016 was $11.89, $9.49$33.28, $14.43 and $9.33$10.84 per share, respectively. The fair value of restricted stock units vested during fiscal years 2015, 20142018, 2017 and 20132016 was $8.4$22.0 million, $5.6$15.0 million and $14.3 million, respectively. During fiscal years 2018, 2017 and 2016, the Company remitted $7.3 million, respectively.2015,2018, the future unrecognized stock-based compensation expense related to restricted stock units expected to vest is $11.2$20.7 million and is expected to be recognized over an estimated weighted average amortization period of 1.71.5 years.The Company issues restricted stock units which vest upon the satisfaction of certain performance conditions and / or service conditions. In addition, the Company issues shares to participating employees pursuant to an employee stock purchase plan.awards for which vesting is dependent upon achieving/or achievement of certain operating performance goals. Restricted stock units granted with performance goals may also have a required service period.period following the achievement of all or a portion of the goals. The following table reflects restricted stock units granted, including 8,500 of time-basedand stock awards related to the discontinued operation,granted during fiscal years ended September 30, 2015, 20142018, 2017 and 2013:2016:284,622 588,338 860,250 Total Units Time-Based Units Stock Grants Performance-Based Units Year ended September 30, 2015 1,513,281 597,250 69,281 846,750 Year ended September 30, 2014 1,517,057 596,212 82,095 838,750 Year ended September 30, 2013 1,471,977 716,625 77,977 677,375 Unitsthree yearthree-year vesting schedules in accordance with which one-third of awards vest at the first anniversary of the grant date, one-third vest at the second anniversary of the grant date and one-third vest at the third anniversary of the grant date, subject to the award holders meeting service requirements.Companystock awards granted 69,281 shares, 82,095 shares and 77,977 shares, respectively, during fiscal years 2015, 2014 and 2013 to the members of the Company’s Board of Directors thatinclude restricted stock awards and deferred restricted stock units.immediately.Company’s Human Resources and Compensation Committee and approved by the Board of Directors. The criteria for performance-based awards are weighted and have threshold, target and maximum performance goals.years 2014year 2018, 2017 and 2013 included provisions that allowed2016 allow participants to earn 100% of the targeted number of performance-based awardsrestricted stock units if the Company’s performance met targets,meets its target goal for each applicable financial metric, and up to a maximum of 200% of the performance-based awards if the Company’s performance significantly exceededfor such metrics meets the targets.maximum or stretch goal. Performance below the minimum threshold resultedfor each financial metric results in award forfeitures. The measurement of achievement against the performancePerformance goals will be measured over a three-year period for performance-based units granted in fiscal year 2014each plan and 2013 occurred at the end of each fiscal yearthe period to determine the number of units earned units eligible for subsequent vesting. One-half ofby recipients who continue to meet the earned units vest at the second anniversary of the grant date and one-half of the earned units vest atservice requirement. Around the third anniversary of theeach plan’s grant date, subjectthe Company’s Board of Directors determines the number of units earned for participants who continue to the award holders meeting service requirements.The Company significantly exceeded the fiscal year 2014 financial goals associated with the performance-based awards granted in fiscal year 2014. In accordance with the award terms, a total of 1,297,546 units, or 154.7%, were eligible for subsequent vesting, subject to award holders satisfyingmeet the service requirements which resulted inon the vest date.increaseemployee stock purchase plan that allows its employees to purchase shares of 458,796 units over the target grant amount of 838,750 units. Units grantedcommon stock at a price equal to the employees85% of the Granville-Phillips77NOTES TO CONSOLIDATED FINANCIAL STATEMENTS - (Continued)business were forfeited upon completionfair market value of the sale.The Company performed belowCompany’s stock at the target levels relative to the criteria outlined in the awards granted in fiscal year 2013. As a result, 460,615 units,beginning or 68.0%, of performance-based awards granted in fiscal year 2013 were eligible for subsequent vesting, subject to award holders satisfying the service requirements, which resulted in a decrease of 216,760 units under the target grant amount of 716,625 units.Performance-based awards granted in fiscal year 2015 include provisions similar to fiscal 2014 awards and allow participants to earn threshold, target and maximum award amounts ranging from 0% of the award for performance below the minimum threshold, 100% of the award for performance at target amount and up to a maximum of 200% of the award if the Company’s performance significantly exceeds the target goals.Sixty percent of the performance-based units granted in fiscal year 2015 had certain performance goals that were measured at the end of fiscal year 2015 to determine the number of earned units eligible for subsequent vesting. The Company performed belowsemi-annual period, whichever is lower. On February 8, 2017, the target levels relative tostockholders approved the performance criteria for these awards and as a result these awards were not eligible for subsequent vesting, which resulted in a a decrease of 508,050 units from the target grant amount of 846,750 units.Forty percent of the performance-based units granted in fiscal year 2015 have certain performance goals to be measured over a three year period at the end of fiscal year 2017 to determine the number of earned units eligible for subsequent vesting. Earned units vest on the third anniversary of the grant date, subject to award holders satisfying the service requirements. 338,700 units, or 40.0%, of performance-based awards granted in fiscal year 2015 are eligible for subsequent vesting, subject to award holders satisfying the service requirements.1995 Employee Stock Purchase PlanOn February 22, 1996, the stockholders approved (the "2017 Plan") to replace the 1995 Employee Stock Purchase Plan or(the "1995 Plan") which was terminated upon the 1995expiration of the offering period ending on July 31, 2017. The 2017 Plan which enables eligibleallows for purchases by employees of up to purchase1,250,000 shares of the Company’s common stock. Under the 1995 Plan, eligible employees may purchase up to an aggregate of 3,000,000 shares during six-month offering periods commencing on February 1 and August 1 of each year at a share price of 85% of the lower of the Company’s closing stock price on the first or last day of each six-month offering period. On February 8, 2012, the stockholders approved an amendment to the 1995 Plan to increase the number of shares of the Company’s common stock available for issuance by 1,000,000 shares, from 3,000,000 to 4,000,000 shares. Participating employees may elect to have up to 10% of their base pay withheld and applied toward the purchase of such shares. The rights of participating employees under the 1995 Plan terminate upon voluntary withdrawal from the plan at any time or upon termination of employment. As of September 30, 2015, 3,551,3452018, 1,123,326 shares of common stock have been purchasedremain available for purchase under the 2017 Plan. During fiscal year ended September 30, 2018, the Company issued 126,674 shares under the 2017 Plan. During fiscal years 2017, the Company issued 162,360 shares under the 1995 Plan and 448,655 shares remain available for purchase.20152018 Activities$4.7$10.2 million induring fiscal year 2015, which included2016 related to severance costs, of $3.4including $8.9 million related to restructuring actions initiated during fiscal year 2016 and facility-related costs of $1.3 million as a result ofrelated to restructuring actions takeninitiated in prior periods. reduce the workforce in order to improve the cost structure and ongoing cost discipline. These costs resulted from the consolidation of certain administrative functions in the Brooks Life Science SystemsSciences segment to streamline the on-going transition of manufacturing certain productssegment’s management structure, integrate acquisitions, consolidate facility and improve profitability, (ii) $1.2 million attributable to a third party contract manufacturerthe Brooks Semiconductor Solutions Group segment to consolidate its Jena, Germany repair facility into its Chelmsford, Massachusetts repair operation, and actions taken to reduce the workforce in order to improve the Company's cost structure and ongoing cost discipline.Severance costs of $3.4(iii) $4.5 million related to the reductioncompany-wide restructuring action to streamline business operations, improve competitiveness and overall profitability.workforce reductions of approximately 93 positions across all of the Company's reportable segments and its corporate function. Total severance costs included chargesprior periods was primarily related to the outsourcing of certainBrooks Semiconductor Solutions segment to integrate Contact, and to close and transfer the Mistelgau, Germany manufacturing operation along with certain products from the DMS business and Brooks Life Sciences Systems segment, as well as workforce reductions related to the integration of acquisitions and other cost reduction initiatives.Facility exit costs of $1.3 million which consisted of lease payments and fixed asset write-offs associated with the Company's efforts to reduce the space used in its operations.Fiscal Year 2014 ActivitiesThe Company recorded restructuring charges of $6.3 million in fiscal year 2014. These charges were related primarily to the Company's decision to discontinue certain product lines in the Brooks Life Science Systems and Brooks Product Solutions segments, the on-going transition of manufacturing cryochillers and compressors within the Company's Polycold product lineoperations to a third party contract manufacturer and other global programs designed to improve the Company’s cost structure.78NOTES TO CONSOLIDATED FINANCIAL STATEMENTS - (Continued)Restructuring charges of $6.3 million recorded in fiscal year 2014 consisted of $5.7 million of severance costs and $0.6 million of facility-related costs.Severance costs of $5.7 million included charges related to the outsourcing of the Polycold manufacturing operation and workforce-related charges resulting from reductions of approximately 70 positions. Severance charges incurred during fiscal year 2014 by the Brooks Product Solutions segment, the Brooks Global Services segment and the Brooks Life Science Systems segment amounted to $2.4 million, $0.4 million and $1.6 million, respectively. In addition to these severance charges, the Brooks Life Science Systems segment recorded a charge of $1.3 million related to the reduction of positions within the corporate and sales functions. Total severance charges related to the outsourcing of the Polycold manufacturing operation were $1.2 million and consisted of severance and retention fees. The charge for this program was recorded ratably over the period from notification of the closing in October 2012 to the actual service end date in September 2014.Facility-related costs of $0.6 million consisted of lease payments and fixed asset write-offs associated with the Company's efforts to reduce the space used in its operations.In addition to the workforce and facility-related charges described above, the Company recorded $0.3 million of inventory write-offs associated with discontinuing certain product lines. Inventory write-offs are included in cost of revenue in the accompanying Consolidated Statements of Operations.Fiscal Year 2013 ActivitiesThe Company recorded a restructuring charge of $6.4 million in fiscal year 2013. These charges were related primarily to workforce reductions implemented to consolidate the operations of Crossing into the Company's operations, the transition of manufacturing cryochillers and compressors within the Company's Polycold product line to a third party contract manufacturer and other programs designed to improve the Company's cost structure.Restructuring costs of $6.4 million recorded in fiscal year 2013 consisted of $5.5 million of severance costs and $0.8 million of facility-related costs. Severance costs incurred in fiscal year 2013 were related to the workforce reduction of approximately 200 positions. Severance charges incurred during fiscal year 2013 by the Brooks Product Solutions segment, the Brooks Global Services segment and the Brooks Life Science Systems segment amounted to $2.5 million, $1.1 million and $1.5 million, respectively, and were related primarily to the reduction of corporate positions. In addition to these severance charges, the Brooks Life Science Systems segment recorded a charge of $0.4 million related to the consolidation of positions within its administrative function.In addition to the workforce and facility-related charges described above, the Company recorded a charge of $0.1 million related to a partial settlement of a defined benefit pension plan covering substantially all of the Company’s Swiss employees.79NOTES TO CONSOLIDATED FINANCIAL STATEMENTS - (Continued)2015, 20142018, 2017 and 20132016 (in thousands): Fiscal Year 2015 Activity Balance
September 30,
2014 Expenses Payments Balance
September 30,
2015Facility and other contract termination costs $ 71 $ 1,204 $ (842 ) $ 433 Workforce-related termination benefits 3,404 3,213 (4,977 ) 1,640 $ 3,475 $ 4,417 $ (5,819 ) $ 2,073 Fiscal Year 2014 Activity Balance
September 30,
2013 Expenses Payments Balance
September 30,
2014Facility and other contract termination costs $ 155 $ 583 $ (667 ) $ 71 Workforce-related termination benefits 1,257 5,706 (3,559 ) 3,404 $ 1,412 $ 6,289 $ (4,226 ) $ 3,475 Fiscal Year 2013 Activity Balance
September 30,
2012 Expenses Payments Balance
September 30,
2013Facility and other contract termination costs $ — $ 818 $ (663 ) $ 155 Workforce-related termination benefits $ 2,098 $ 5,475 $ (6,316 ) 1,257 $ 2,098 $ 6,293 $ (6,979 ) $ 1,412 $2.1$0.7 million as of September 30, 20152018 are expected to be paid during fiscal year 2019.18.20. Segment and Geographic InformationCompany'sCompany’s chief operating decision maker.reports its financial results for threehas two operating and reportable segments: (i)segments consisting of Brooks ProductSemiconductor Solutions (ii) Brooks Global ServicesGroup segment and (iii) Brooks Life Science Systems.ProductSemiconductor Solutions Group segment provides a variety of products, services and solutions that enable improved throughput and yield in controlled operating environments. Those productsenvironments, as well as an extensive range of support services. The solutions include atmospheric and vacuum robots, robotic modules, and tool automation systems, that provide precision handling and cleancontamination control of wafer environments, as well as vacuum pumping and thermal management solutions used to create and control critical process vacuum applications. Brooks Global Services segment provides an extensive range of support services includinginclude repair services, diagnostic support services, and installation services in support of the products, from the Company's Brooks Product Solutions segment, which enable itsthe customers to maximize process tool uptime and productivity. This segment also provides end-user customers with spare parts and productivity enhancement upgrades to maximize customer tool productivity.Science SystemsSciences segment provides comprehensive life cycle sample management solutions for life science and bioscience customers to advance scientific research and support drug development. The segment’s product offerings include automated cold sample management systems for compound and biological sample storage, equipment for sample preparation and handling, consumables, as well as partsand informatics that help customers manage samples throughout their research discovery and development work flows. The segment’s service offerings include sample storage and support services provided to a wide range of life science customers, including pharmaceutical companies, biotechnology companies, biobanks national laboratories, research institutes and research universities.as well asand other unallocated corporate expenses are excluded from the segments’ operating income (loss). The Company’s indirect overhead costs, which include various general and administrative expenses, are allocated among the segments based upon multipleseveral cost drivers associated with the respective administrative function, including segment revenue, headcount, or benefits that each segment derives from a specific administrative function. Segment assets exclude cash, cash equivalents, restricted cash, marketable securities, deferred tax assets, assets held for sale and equity method investments.80NOTES TO CONSOLIDATED FINANCIAL STATEMENTS - (Continued)excluding amounts related to the discontinued operations, for the fiscal years ended September 30, 2015, 20142018, 2017 and 20132016 (in thousands): Brooks
Product
Solutions Brooks
Global
Services Brooks
Life Science
Systems Total Fiscal year ended September 30, 2015: Revenue Product $ 389,425 $ 17,154 $ 50,832 $ 457,411 Services 703 77,355 17,239 95,297 Segment revenue $ 390,128 $ 94,509 $ 68,071 $ 552,708 Gross profit $ 138,446 $ 32,933 $ 17,726 $ 189,105 Segment operating income (loss) 35,780 13,915 (19,580 ) 30,115 Depreciation expense 3,832 480 1,295 5,607 Assets 260,011 57,058 110,910 427,979 Fiscal year ended September 30, 2014: Revenue Product $ 325,639 $ 14,978 $ 46,415 $ 387,032 Services — 79,083 16,733 95,816 Segment revenue $ 325,639 $ 94,061 $ 63,148 $ 482,848 Gross profit $ 111,746 $ 32,168 $ 23,423 $ 167,337 Segment operating income (loss) 10,836 12,451 (8,431 ) 14,856 Depreciation expense 8,316 2,361 2,022 12,699 Assets 252,944 58,678 103,498 415,120 Fiscal year ended September 30, 2013: Revenue Product $ 290,523 $ 13,152 $ 31,336 $ 335,011 Services — 75,477 11,952 87,429 Segment revenue $ 290,523 $ 88,629 $ 43,288 $ 422,440 Gross profit $ 91,255 $ 26,912 $ 14,140 $ 132,307 Segment operating income (loss) 1,116 9,592 (12,380 ) (1,672 ) Depreciation expense 8,698 2,746 2,256 13,700 Assets 226,759 59,762 105,221 391,742 81NOTES TO CONSOLIDATED FINANCIAL STATEMENTS - (Continued)segments'segments’ operating income (loss) and segment assets to the corresponding amounts presented in the accompanying Consolidated Balance Sheets and Consolidated Statements of Operations for the fiscal years ended September 30, 2015, 20142018, 2017 and 20132016 (in thousands): As of and for the Year Ended
September 30, 2015 2014 2013 Segment operating income (loss) $ 30,115 $ 14,856 $ (1,672 ) Other unallocated corporate expenses 856 5,096 3,002 Amortization of acquired intangible assets 7,656 6,170 5,694 Impairment of acquired intangible assets — — 50 Restructuring and other charges 4,713 6,289 6,380 Total operating income (loss) $ 16,890 $ (2,699 ) $ (16,798 ) Segment assets $ 427,979 $ 415,120 Cash, cash equivalents and marketable securities 214,030 245,456 Deferred tax assets 89,959 86,572 Assets held for sale 2,900 — Equity method investments 24,286 28,944 Other unallocated corporate net assets 500 1,946 Total assets $ 759,654 $ 778,038 2015, 20142018, 2017 and 20132016 are as follows (in thousands): Year Ended September 30, 2015 2014 2013 North America $ 199,103 $ 174,343 $ 177,779 Asia / Pacific 121,765 198,695 154,358 Europe 231,840 109,810 90,303 $ 552,708 $ 482,848 $ 422,440 ourthe Company’s net revenue in North America is generated in the United States.20152018 and 20142017 are as follows (in thousands): September 30, 2015 2014 North America $ 36,402 $ 40,232 Asia / Pacific 2,104 870 Europe 3,349 9,081 $ 41,855 $ 50,183 19. Significant CustomersThe Company had one customer that accounted for more than 10% of its consolidated revenue, at 12%, 11%,11%, respectively,equipment located in the fiscal years ended September 30, 2015, 2014 and 2013. The Company did not have any customers that accounted for more than 10% of its accounts receivable balance at September 30, 2015 or 2014.For purposes of determining the percentage of revenue generated from any of the Company's original equipment manufacturer, or OEM, customers, the Company does not include revenue from products soldUnited States amounted to contract manufacturer customers who in turn sell to the OEM's. If the Company included revenue from products sold to contract manufacturer customers supporting the Company's OEM customers, the percentage of the Company's total revenue derived from certain OEM customers would be higher.82NOTES TO CONSOLIDATED FINANCIAL STATEMENTS - (Continued)20. Supplementary Balance Sheet InformationThe following is a summary of accounts receivable at September 30, 2015 and 2014 (in thousands): September 30, 2015 2014 Accounts receivable $ 87,582 $ 81,270 Less allowance for doubtful accounts (1,019 ) (1,031 ) Less allowance for sales returns (115 ) (133 ) $ 86,448 $ 80,106 The allowance for doubtful accounts activity for the fiscal years ended September 30, 2015, 2014 and 2013 is as follows (in thousands):Description Balance at
Beginning of
Period Provisions Reversals of
Bad Debt
Expense Write-offs and
Adjustments Balance at
End of
Period2015 Allowance for doubtful accounts $ 1,031 $ — $ — $ 12 $ 1,019 2014 Allowance for doubtful accounts 863 438 (315 ) 45 1,031 2013 Allowance for doubtful accounts 851 48 (143 ) 107 863 As part of the acquisition of Crossing in fiscal year 2013, the Company acquired a contract in which a certain customer has a right of return on the purchase of spare parts. The allowance for returns activity for the fiscal years ended September 30, 2015, 2014 and 2013 is as follows (in thousands):Description Balance at
Beginning of
Period Provisions Write-offs and
Adjustments Balance at
End of
Period2015 Allowance for sales returns $ 133 $ (18 ) $ — $ 115 2014 Allowance for sales returns 114 19 — 133 2013 Allowance for sales returns — 72 42 114 The following is a summary of inventories at September 30, 2015 and 2014, excluding amounts related to discontinued operations (in thousands): September 30, 2015 2014 Inventories Raw materials and purchased parts $ 62,441 $ 57,250 Work-in-process 21,563 20,068 Finished goods 16,615 16,249 $ 100,619 $ 93,567 Reserves for excess and obsolete inventory, excluding amounts related to discontinued operations, were $23.8 million,$26.0 million, $24.2$50.5 million and $23.2$50.7 million, respectively, at September 30, 2015, 2014, 20132018 and 2012. 2017.Company recorded chargesfair value measurement guidance establishes a fair value hierarchy which requires an entity to reservesmaximize the use of observable inputs and minimize the use of unobservable inputs when measuring fair value. The following levels of inputs may be used to measure fair value:excess and obsolete inventory of $7.9 million, $6.9 million and $5.4 million, respectively, in fiscal years 2015, 2014 and 2013. Reductionsidentical assets or liabilities as of the reserves for excess and obsolete inventory were related to inventory disposals and amounted to $10.3 million, $5.1 million and $4.3 million, respectively,reporting date. Active markets are those in fiscal years 2015, 2014 and 2013.The Company establishes reserves for estimated cost of product warranties developed based on historical information. Product warranty reserves are recorded at the time product revenue is recognized, and retrofit accruals are recorded at the time retrofit programs are established. The Company’s warranty obligation is affected by product failure rates, utilization levels, material usage, service delivery costs incurred in correcting a product failure and supplier warranties on parts delivered to the Company.The following is a summary of product warranty and retrofit activity on a gross basis, excluding amounts related to discontinued operations,which transactions for the fiscal years ended September 30, 2015, 2014asset and 2013 (in thousands):liability occur in sufficient frequency and volume to provide pricing information on an ongoing basis.83NOTES TO CONSOLIDATED FINANCIAL STATEMENTS - (Continued) Amount Balance at September 30, 2012 $ 7,246 Adjustments for acquisitions and divestitures 1,187 Accruals for warranties during the year 9,968 Costs incurred during the year (11,141 ) Balance at September 30, 2013 7,260 Adjustments for acquisitions and divestitures 364 Accruals for warranties during the year 9,969 Costs incurred during the year (11,094 ) Balance at September 30, 2014 6,499 Adjustments for acquisitions and divestitures 81 Accruals for warranties during the year 9,917 Costs incurred during the year (10,408 ) Balance at September 30, 2015 $ 6,089 21. Commitments and ContingenciesCapital Lease ObligationDuring fiscal year 2015,Company was leasing the building and the related land on its Chelmsford, Massachusetts campus. The Company began leasing the building in fiscal year 2002 and exercised a renewal option in March 2014 to extend the leasefull term until March 2018 and purchase the building at the end of the lease period. During fiscal year 2014,assets or liabilities.Company recorded the assets and the associated capital lease obligation at the net presentfair value of the minimum lease paymentsassets or liabilities and reflect an entity’s own assumptions in its Consolidated Balance Sheets. pricing assets or liabilities since they are supported by little or no market activity.net presentCompany measures certain assets, including the cost and equity method investments, at fair value on a nonrecurring basis when they are deemed to be other-than-temporarily impaired. The fair values of the minimum lease payments was allocated to the building and the landthese investments are determined based on their relative fair values. As of September 30, 2014,valuation techniques using the best information available, and may include quoted market prices, market comparables, and discounted cash flow projections. An impairment charge is recorded when the cost of the buildinginvestment exceeds its fair value and the land under the capital lease was $6.4 millionthis condition is determined to be other-than-temporary.$2.1 million, respectively.On September 30, 2015, the Company purchased the buildingLiabilities Measured at Fair Value on a Recurring Basisthe related land forliabilities measured and recorded at fair value on a total price of $8.4 million and derecognized the associated capital lease obligation of $7.8 million. The difference of $0.6 million between the purchase price of $8.4 million and the capital lease obligation of $7.8 million was recorded an adjustment to the acquisition cost of the building and land of $6.6 million and $2.3 million, respectively, which were classified as property, plant and equipmentrecurring basis in the accompanying Consolidated Balance Sheets as of September 30, 2015. Depreciation expense related to the building is computed using the straight-line method over the estimated useful life2018 and 2017 (in thousands):asset. Accumulated amortization relatedfair value hierarchy because they are valued using quoted market prices in active markets. Cash equivalents of less than $0.1 million as of September 30, 2017 consist primarily of Bank Certificate of Deposits and are classified within Level 2 of the fair value hierarchy because they are not actively traded.building wassecurities’ relationship to other benchmark quoted prices.20152017. Foreign exchange contract assets and 2014.84NOTES TO CONSOLIDATED FINANCIAL STATEMENTS - As of September 30, 2018, estimated fair value of the term loan outstanding principal balance approximates its carrying value. The fair value was determined based on observable market inputs and classified within Level 2 of the fair value hierarchy due to a lack of an active market for this term loan or a similar loan instrument(Continued).that expire throughout 2020.with lease expiration dates through 2025. Rent expense under the operating leases, excluding costs recorded as a component of restructuring charges, was $6.5$5.3 million, $8.2$4.0 million and $8.4$4.5 million,, respectively, for the fiscal years ended September 30, 2015, 20142018, 2017 and 2013.20152018 are as follows (in thousands):Year ended September 30, Amount 2016 $ 3,097 2017 2,012 2018 1,309 2019 638 2020 86 Thereafter — $ 7,142 The Company utilizes a third party to manage its manufacturing operations in Mexico. As a part of this arrangement, the Company makes and guarantees the monthly payments for a lease of its Mexico facility which expires in January 2018. The remaining payments under the lease were approximately $1.0 million at September 30, 2015.2015,2018, the Company had $3.5$2.2 million of letters of credit outstanding related primarily to customer advances and other performance obligations. These arrangements guarantee the refund of advance payments received from ourthe Company’s customers in the event that the product is not delivered or warranty obligations are not fulfilled in accordance with the contract terms. These obligations could be called by the beneficiaries at any time before theinduring fiscal year 2015,years ended September 30, 2018, and the Company currently does not anticipate any of these obligations to be called in the near future.$77.2$85.4 million at September 30, 2015.Company'sCompany’s assessment of any claim will reflect the ultimate outcome, and an adverse outcome in certain matters could, from time to time, have a material adverse effect on the Company'sCompany’s consolidated financial position or results of operations in particular quarterly or annual periods.22.4, 2015,15, 2018, in connection with the Company’s acquisition of GENEWIZ, the Company entered into an amendment of the existing term loan agreement and planwhich increased its outstanding principal balance to $546.0 million. The Company used the proceeds from this extended loan to pay a portion of merger with BioStorage Technologies, Inc. (“BioStorage”), pursuant to which the Company has agreed to acquire all the outstanding capital stock of BioStorage for an aggregate purchase price of $127.0 million, subject to adjustment for working capital and other items. The transaction is expected to close in first quarter of fiscal year 2016 and is subject to customary closing conditions, including regulatory approvals. The acquisition is expected to enhance the Company’s ability to offer its customers a full solution for biological sample storage.4, 2015,6, 2018, the Company’s Board of Directors declared a cash dividend of $0.10 per share payable on December 22, 201520, 2018 to common stockholders of record as of December 4, 2015.7, 2018. Dividends are declared at the discretion of the Company’s Board of Directors and depend on the Company'sCompany’s actual cash flow from operations, its financial condition and capital requirements, as well as any other factors the Company’s Board of Directors may consider relevant. Future dividend declarations, as well as the record and payment dates for such dividends, will be determined by the Company’s Board of Directors on a quarterly basis.85Item 9.Changes In and Disagreements With Accountants on Financial Accounting and Financial DisclosureItem 9A.Controls and Procedures13a-15(e)13a‑15(e) promulgated under the Exchange Act. Disclosure controls and procedures are designed to ensure that information required to be disclosed by us in the reports we file or submit under the Exchange Act is recorded, processed, summarized and reported on a timely basis and that such information is accumulated and communicated to management, including the chief executive officer and chief financial officer, as appropriate, to allow timely decisions regarding required disclosure. Based upon this evaluation, our chief executive officer and our chief financial officer concluded that our disclosure controls and procedures were effective as of September 30, 2018, the end of the period covered by this annual report.13a-15(f)13a‑15(f) and 15d-15(f)15d‑15(f) under the Exchange Act, as a process designed by, or under the supervision of our chief executive and chief financial officers and effected by our board of directors, management and other personnel to provide reasonable assurance regarding the reliability of financial reporting and the preparation of financial statements for external purposes in accordance with generally accepted accounting principlesGAAP and includes those policies and procedures that:pertain to the maintenance of records that in reasonable detail accurately and fairly reflect the transactions and disposition of our assets;provide reasonable assurance that transactions are recorded as necessary to permit preparation of financial statements in accordance with generally accepted accounting principles, and that our receipts and expenditures are being made only in accordance with authorization of our management and directors; andprovide reasonable assurance regarding prevention or timely detection of unauthorized acquisition, use or disposition of our assets that could have a material effect on the financial statements.2015.2018. In making this assessment, we used the criteria set forth in the 2013 Internal Control - Integrated Framework (2013) issued by the Committee of Sponsoring Organizations (COSO) of the Treadway Commission. Based on our assessment, weour management concluded that, as of September 30, 2015,2018, our internal control over financial reporting was effective.Our audited consolidated financial statements include the results of FluidX Ltd., or FluidX,Contact Co., Ltd., or Contact, that were acquired on October 1, 2014 and August 14, 2015, respectively. The scope ofTec-Semfrom our assessment of the effectiveness of our internal control over financial reporting as of September 30, 2015 does not include2018 because they were acquired by the internal controlsCompany in a purchase business combination during fiscal year 2018. The total assets and total revenues of FluidX4Titude and Contact as management determined that it would not be practical to conduct a sufficiently comprehensive assessmentTec-Sem, represent 2.2% and 4.4%, respectively, of the internal controlsrelated consolidated financial statement amounts as of FluidX and Contact based on the date of the acquisition and managements’ other time commitments. Guidance issued by the Securities and Exchange Commission permits companies to exclude acquisitions from their assessment of internal control over financial reporting for the first fiscal year in which the acquisition occurred. Our consolidated revenue for the fiscal year ended September 30, 2015 was $552.7 million,2018.20152018 has been audited by BDO USAPricewaterhouseCoopers LLP, an independent registered public accounting firm, as stated in the following report:86Report of Independent Registered Public Accounting FirmBoard of Directors and StockholdersBrooks Automation, Inc.Chelmsford, MassachusettsWe have audited Brooks Automation Inc.’s internal control over financial reporting as of September 30, 2015, based on criteria established in 2013 Internal Control - Integrated Framework issued by the Committee of Sponsoring Organizations of the Treadway Commission (the COSO criteria). Brooks Automation, Inc.’s management is responsible for maintaining effective internal control over financial reporting and for its assessment of the effectiveness of internal control over financial reporting, included in the accompanying Management Report on Internal Control Over Financial Reporting appearing under Item 9A. Our responsibility is to express an opinion on the Company’s internal control over financial reporting based on our audit.We conducted our audit in accordance with the standards of the Public Company Accounting Oversight Board (United States). Those standards require that we plan and perform the audit to obtain reasonable assurance about whether effective internal control over financial reporting was maintained in all material respects. Our audit included obtaining an understanding of internal control over financial reporting, assessing the risk that a material weakness exists, and testing and evaluating the design and operating effectiveness of internal control based on the assessed risk. Our audit also included performing such other procedures as we considered necessary in the circumstances. We believe that our audit provides a reasonable basis for our opinion.A company’s internal control over financial reporting is a process designed to provide reasonable assurance regarding the reliability of financial reporting and the preparation of financial statements for external purposes in accordance with generally accepted accounting principles. A company’s internal control over financial reporting includes those policies and procedures that (1) pertain to the maintenance of records that, in reasonable detail, accurately and fairly reflect the transactions and dispositions of the assets of the company; (2) provide reasonable assurance that transactions are recorded as necessary to permit preparation of financial statements in accordance with generally accepted accounting principles, and that receipts and expenditures of the company are being made only in accordance with authorizations of management and directors of the company; and (3) provide reasonable assurance regarding prevention or timely detection of unauthorized acquisition, use, or disposition of the company’s assets that could have a material effect on the financial statements.Because of its inherent limitations, internal control over financial reporting may not prevent or detect misstatements. Also, projections of any evaluation of effectiveness to future periods are subject to the risk that controls may become inadequate because of changes in conditions, or that the degree of compliance with the policies or procedures may deteriorate.As indicated in the accompanying Item 9A, Management's Report on Internal Control Over Financial Reporting, management's assessment of and conclusion on the effectiveness of internal control over financial reporting did not include the internal controls of FluidX Ltd., or FluidX, and Contact Co., Ltd., or Contact, that were acquired on October 1, 2014 and August 14, 2015, respectively, andtheir report which are included in the consolidated balance sheets of Brooks Automation, Inc. as of September 30, 2015, and the related consolidated statements of operations, comprehensive income (loss), changes in equity, and cash flows for the fiscal year then ended. FluidX and Contact constituted 4% and 4% of total assets and net assets, respectively, as of September 30, 2015, and 3% of revenues for the year then ended. Management did not assess the effectiveness of internal control over financial reporting of FluidX and Contact because of the timing of the acquisitions which were completed on October 1, 2014 and August 14, 2015, respectively. Our audit of internal control over financial reporting of Brooks Automation, Inc. also did not include an evaluation of the internal control over financial reporting of FluidX and Contact.In our opinion, Brooks Automation, Inc. maintained, in all material respects, effective internal control over financial reporting as of September 30, 2015, based on the COSO criteria.We also have audited, in accordance with the standards of the Public Company Accounting Oversight Board (United States), the consolidated balance sheet of Brooks Automation, Inc. as of September 30, 2015 and the related consolidated statements of operations, comprehensive income (loss), changes in equity, and cash flows for each of the three years in the period ended September 30, 2015 and our report dated November 5, 2015 expressed an unqualified opinion thereon./s/ BDO USA, LLPBoston, MassachusettsNovember 5, 2015872015,2018, that have materially affected, or are reasonably likely to materially affect, our internal control over financial reporting.Item 9B.Other InformationNone.Item 10.Directors, Executive Officers and Corporate Governance20162019 annual meeting of shareholders to be filed by us within 120 days after the close of our fiscal year, or the 20162019 Proxy Statement, under the caption "Proposal No. 1-Election1‑Election of Directors," "Other Matters-Section 16(a) Beneficial Ownership Compliance," "Other Matters-Standards of Conduct," "Other Matters-Stockholder Proposals and Recommendations for Directors" and "Corporate Governance" and is incorporated herein by reference.Item 11.Executive Compensation20162019 Proxy Statement to be filed by us within 120 days after the close of our fiscal year and is incorporated herein by reference.Item 12.Security Ownership of Certain Beneficial Owners and Management and Related Stockholder Matters20162019 Proxy Statement to be filed by us within 120 days after the close of our fiscal year and is incorporated herein by reference.Item 13.Certain Relationships and Related Transactions, and Director Independence20162019 Proxy Statement to be filed by us within 120 days after the close of our fiscal year and is incorporated herein by reference.Item 14.Principal Accountant Fees and Services20162019 Proxy Statement to be filed by us within 120 days after the close of our fiscal year and is incorporated herein by reference.Item 15.Exhibits(a) Financial Statements and Financial Statement SchedulesThe consolidated financial statements of the Company are listed in the index under Part II, Item 8, in this Form 10-K.Other financial statement schedules are omitted because of the absence of conditions under which they are required or because the required information is given in the supplementary consolidated financial statements or notes thereto.(b) Exhibits
No.ExhibitNo. Description 3.014.01U.S. Robot Supply Agreement, made as of June 30, 2006, by and between Brooks Automation, Inc. and Yaskawa Electric Corporation (incorporated herein by reference to Exhibit 10.02 to the 2010 10-K).10.02S-2S‑2 (Reg. No. 2-84880)2‑84880) filed by Helix Technology Corporation).10.0310.0410.05Offer letter dated December 1, 2011 between the Company and Mark D. Morelli (incorporated herein by reference to Exhibit 10.08 to the Company's annual report on Form 10-K for the fiscal year ended September 30, 2012, as filed on November 21, 2012 (the “2012 10-K”)).10.06Letter Agreement dated June 4, 2015 between Brooks Automation, Inc. and Mark D. Morelli (incorporated herein by reference to Exhibit 10.1 to the Company's current report on Form 8-K, filed on June 9, 2015).10.0710.0810.0910.101995 Employee Stock Purchase Plan, as amended (incorporated herein by reference to Exhibit 10.13 to the 2010 10-K).10.138810.14Form of 2000 Equity Incentive10.15Form of 2000 Equity Incentive Plan Existing Employee Nonqualified Stock Option Agreement (incorporated herein by reference to Exhibit 10.19 to the 2010 10-K).10.16Form of 2000 Equity Incentive Plan Director Stock Option Agreement (incorporated herein by reference to Exhibit 10.20 to the 2010 10-K).10.1710.18Form of Restricted Stock Agreement (incorporated herein by reference to Exhibit 10.21 to the 2010 10-K).10.1910.2010.2110.22Amendment No. 2008-01 to the10.23Lease, dated May 14, 1999, between MUM IV, LLC as Lessor10.24Standard Industrial lease21.0131.01101Company'sCompany’s Annual Report on Form 10-K,10‑K, for the year ended September 30, 2015,2018, formatted in XBRL (Xtensible Business Reporting Language): (i) the Consolidated Balance Sheets; (ii) the Consolidated Statements of Operations; (iii) the Consolidated Statements of Comprehensive Income (Loss); (iv) the Consolidated Statements of Cash Flows; (v) the Consolidated Statements of Changes in Equity; and (vi) the Notes to Consolidated Financial Statements.89By:/S/ STEPHEN S. SCHWARTZ
Chief Executive Officer5, 2015SignatureTitleDate/S/ STEPHEN S. SCHWARTZNovember 5, 2015Stephen S. SchwartzLINDONG. ROBERTSON LINDON G. ROBERTSONNovember 5, 2015Lindon G. Robertson DAVID PIETRANTONI DAVID PIETRANTONINovember 5, 2015David Pietrantoni/S/ A. CLINTON ALLENDirectorNovember 5, 2015ROBYN ROBYN C.DAVISDirector5, 201529, 2018S/ JOSEPHS/ JOSEPH R. MARTINDirector5, 201529, 2018S/ JOHNS/ JOHN K. MCGILLICUDDYDirector5, 201529, 2018S/ KRISHNAS/ KRISHNA G. PALEPUDirector5, 201529, 2018S/ KIRKS/ KIRK P. PONDDirector5, 201529, 2018S/ ALFRED WOOLLACOTT IIIDirector5, 201529, 2018