(Mark One)
[X] ANNUAL REPORT PURSUANT TO SECTION 13 OR 15(D) OF THE SECURITIES EXCHANGE ACT OF 1934
OR
[ ] TRANSITION REPORT PURSUANT TO SECTION 13 orOR 15(D) OF THE SECURITIES EXCHANGE ACT OF 1934

| Delaware | 74-1871327 | |||
(State or other jurisdiction of incorporation or organization) | (I.R.S. Employer Identification Number) | |||
11500 North MoPac Expressway Austin, Texas | 78759 | |||
| (address of principal executive offices) | (zip code) |
(512) 338-9119
| Title of Each Class | Name of Each Exchange on Which Registered | |||
| Common Stock, $0.01 par value | The NASDAQ Stock Market, LLC |
Indicate by check mark if the registrant is a well-known seasoned issuer, as defined in Rule 405 of the Securities Act. Yes [X]T No [ ]
£
T
£
T
T
ITEM 1. BUSINESS
National Instruments Corporation (“we”, “us” or “our”) is a leading supplier of measurement and automation products that engineers and scientists use in a wide range of industries. These industries are spread acrosscomprise a large and diverse market for design, control and test applications. We provide flexible application software and modular, multifunction hardware that users combine with industry-standard computers, networks and third partythird-party devices to create measurement, automation and embedded systems, which we also refer to as “virtual instruments.” Our approach gives customers the ability to quickly and cost-effectively design, prototype and deploy unique custom-defined solutions for their design, control and test application needs.
We are based in Austin, Texas and were incorporated under the laws of the State of Texas in May 1976 and were reincorporated in Delaware in June 1994. On March 13, 1995, we completed an initial public offering of shares of our common stock. Our common stock, $0.01 par value, is quoted on the NASDAQ Stock Market under the trading symbol NATI.
Our Internet website address is http://www.ni.com. Our annual report on Form 10-K, quarterly reports on Form 10-Q, current reports on Form 8-K and amendments to those reports filed or furnished pursuant to Section 13(a) or 15(d) of the Securities Exchange Act of 1934 are available upon written request and without charge through our Internet website as soon as reasonably practicable after we electronically file such material with, or furnish itthem to, the SEC. Our Internet website and the information contained therein or connected thereto are not intended to be incorporated into this Annual Report on Form 10-K.
Industry Background
Engineers and scientists have long used instruments to observe, better understand and manage the real-world phenomena, events and processes related to their industries or areas of expertise. Instruments measure and control electrical signals, such as voltage, current and power, as well as physical phenomena, such as temperature, pressure, speed, flow, volume, torque and vibration. Common general-purpose instruments include voltmeters, signal generators, oscilloscopes, dataloggers,data loggers, spectrum analyzers, cameras, and temperature and pressure monitors and controllers. Some traditional instruments are also highly application specific, designed to measure specific signals for particular vertical industries or applications. Instruments used for industrial automation applications include data loggers, strip chart recorders, programmable logic controllers (PLCs)(“PLCs”), and proprietary turn-key devices and/or systems designed to automate specific vertical applications. Measurement and control functionality is also used in a variety of embedded and/or real-time applications, such as machine monitoring, machine control, and embedded design and prototyping. Instrument
Measurement and automation applications can be generally categorized as either test and measurement (“T&M”) or industrial automation (“IA”).industrial/embedded. T&M applications generally involve testing during the research, design, manufacture and service of a wide variety of products. IAIndustrial/embedded applications generally involve automatingdesigning, prototyping and deploying the machinery and processes used in the production and distribution of a wide variety of products and materials.
Instruments and systems for design, control, and test applications have historically shared common limitations, including: fixed, vendor-defined functionality;functionality, proprietary, closed architectures that were generally difficult to program and integrate with other systems; and inflexible operator interfaces that were usually cumbersome to operate and change. Proprietary instrumentation systems have traditionally been very expensive, with IAindustrial/embedded system prices ranging as high as several million dollars and T&M instrumentation system prices often ranging in the hundreds of thousands of dollars. In addition, the limitations on the programmability of traditional systems means that adapting these systems to changing requirements iscan be both expensive and time consuming, and users are often required to purchase multiple single-purpose instruments.
Our Approach to Measurement and Automation
A virtual instrument is a user-defined measurement and automation system that consists of an industry standard computer (which may be a mainstream general-purpose computer, workstation, handheld PDA device, or a version of an industry standard computer, workstation, or handheld PDA that is specially designed and packaged for harsh industrial or embedded environments) equipped with our user-friendly application software, cost-effective hardware and driver software. Virtual instrumentation represents a fundamental shift from traditional hardware-centered instrumentation systems to software-centered systems that exploit the computational, display, productivity and connectivity capabilities of computers, networks and the Internet. Because virtual instruments exploit these computation, connectivity, and display capabilities, users can define and change the functionality of their instruments, rather than being restricted by fixed-functions imposed by traditional instrument and automation vendors. Our products empower users to monitor and control traditional instruments, create innovative computer-based systems that can replace traditional instruments at a lower cost, and develop systems that integrate measurement functionality together with industrial and embedded capabilities. We believe that giving users flexibility to create their own user-defined virtual instruments for an increasing number of applications in a wide variety of industries, and letting users leverage the latest technologies from computers, networking and communications shortens system development time and reduces both the short- and long-term costs of developing, owning and operating measurement and automation systems, and improves the efficiency and precision of applications spanning research, design, production and service.
Compared with traditional solutions, we believe our products and computer-based, virtual instrumentation approach provide the following significant customer benefits:
Performance, Ease-of-UseEase of Use and Efficiency
Our virtual instrument application software brings the power and ease-of-useease of use of computers, PDAs, networks and the Internet to instrumentation. With features such as graphical programming, automatic code generation capabilities, graphical tools libraries, ready-to-use example programs, libraries of specific instrumentation functions, and the ability to deploy their applications on a range of platforms, users can quickly build a virtual instrument system that meets their individual application needs. In addition, the continuous performance improvement in performance of PC and networking technologies, which are the core platform for our approach, results in direct performance benefits for virtual instrument users in the form of faster execution for software-based measurement and automation applications, resulting in shorter test times, faster automation, and higher manufacturing throughput.
Modularity, Reusability and Reconfigurability
Our products include reusable hardware and software modules that offer considerable flexibility in configuring systems. This ability to reuse and reconfigure instrumentmeasurement and automation systems allows users to reduce development time and maximizeimprove efficiency by eliminating duplicated programming efforts and to quickly adapt their instrumentssystems to new and changing needs. In addition, these features help protect both hardware and software investments against obsolescence.
Lower Total Solution Cost
We believe that our products and solutions offer price/performance and energy efficiency advantages over traditional instrumentation.solutions. Virtual instrumentation provides users the ability to utilize industry standard computers and workstations, portable PDAs and other handheld devices, as well as ruggedized industrial computers equipped with modular and reusable application software, cost-effective hardware and driver software that together perform the instrumentation functions that would otherwise be performed by costly, proprietary instrumentation systems. In addition, virtual instrumentation gives users the flexibility and portability to adapt to changing needs, whereas traditional closed systems are both expensive and time consuming to adapt, if adaptable at all.
Products, Technology and TechnologyServices
We offer an extensive line of measurement and automation products.products that empower engineers and scientists to more efficiently create automated test, industrial control, and embedded design applications. Our products consist of off-the-shelf application software and modular, cost-effective hardware components together with related driver software. OurWe design our products are designed to work either inseparately, as stand-alone products or as an integrated solution or separately;solution; however, customers generally purchase our software and hardware together. We believe that the flexibility, functionality and ease of use of our application software promotes sales of our other software and hardware products.
Application Software
We believe thatFor more than 20 years, we have pioneered measurement and automation application software is playingfor virtual instrumentation, which we believe plays an increasingly important role in the development of computer-based instrumentssystems for test, control, and systems in measurement and automationdesign applications. Our application software products leverage the increasing capability of computers, networks and the Internet for data analysis, connectivity and presentation power to bring increasing efficiency and precision to measurement and automation applications. Our application software products include LabVIEW, LabVIEW Real-Time, LabVIEW FPGA, Measurement Studio, LabWindows/CVI, DIAdem, NI TestStand, NI VeriStand, and Multisim. Our application software products are integrated with our hardware/driver software.
We offer a variety of software products for developing measurementtest, control, and automationdesign applications to meet the differentour customer’s programming and computer preferences of our customers.preferences. LabVIEW, LabWindows/CVI, and Measurement Studio are programming environments with whichwhere users can develop graphical user interfaces (“GUIs”), control instruments,design, prototype, and acquire, analyze and present data.deploy systems. With these software products, users can design custom virtual instruments by creating a GUIgraphical user interface (“GUI”) on the computer screen through which they operate the actual program and control selected hardware. Users can customize front panels with knobs, buttons, dials and graphs to emulate control panels of instruments or add custom graphics to visually represent the control and operation of processes. LabVIEW, LabWindows/CVI and Measurement Studio also have ready-to-use libraries for controlling thousands of programmable instruments, including our hardware products, as well as traditional serial, General Purpose Interface Bus (GPIB)(“GPIB”), VME extensions for instrumentation (VXI)(“VXI”), PCI, PCI Express, PCI Extensions for Instrumentation (“PXI”), PXI Express, Ethernet and USB measurement and automation devices from other vendors.
The principal difference between LabVIEW, LabWindows/CVI, and Measurement Studio is in the way users develop programs. With LabVIEW, users program graphically, developing application programs by connecting icons to create “block diagrams” which are natural design notations for scientists and engineers. With LabVIEW Real-Time, the user’suser can easily configure their application program can be easily configured to execute using a real-time operating system kernel instead of the Windows operating system, which allowsso users tocan easily build virtual instrument solutions for mission-critical applications that require highly reliable operation. In addition, with LabVIEW Real-Time, users can easily configure their programs to execute remotely on embedded processors inside PXI systems, on embedded processors inside FieldpointCompactRIO distributed I/O systems, or on processors embedded on plug-in PC data acquisition boards. With LabVIEW FPGA, the user’suser can configure their application can be configured to execute directly in silicon via a Field Programmable Gate Array (FPGA)(“FPGA”) residing on one of our reconfigurable I/O hardware products. LabVIEW FPGA allows users to easily build their own highly specialized, custom hardware devices for ultra high-performance requirements or for unique or proprietary measurement or control protocols. With
LabWindows/CVI users program usinguse the conventional, text-based programming language of C.C for creating test and control applications. Measurement Studio consists of measurement and automation add-on libraries and additional tools for programmers that use Microsoft’s Visual Basic, Visual C++, Visual C#, and Visual Studio.NET development environments.
We offer a software product called NI TestStand targeted for T&M applications in a manufacturing environment. TestStand is a test management environment for organizing, controlling, and running automated productionprototype, validation, and manufacturing test systems on the factory floor.systems. It also generates customized test reports and integrates product and test data across the customers’ enterprise and across the Internet. TestStand manages tests that are written in LabVIEW, LabWindows/CVI, Measurement Studio, C and C++, and Visual Basic, so test engineers can easily share and re-use test code throughout their organization and from one product to the next. TestStand is a key element of our strategy to broaden the reach of our application software products across the corporate enterprise. In
NI Multisim equips engineers, educators, and students with powerful and innovative circuit design technology. Educators and students can take advantage of easy-to-use teaching tools to overcome the traditional hurdles in electronics education. Professional engineers can improve productivity with intuitive capture tools, interactive simulation, board layout, and design validation. Multisim was added to our software offering in 2005, when we acquired Electronics Workbench and its suite of software for electronic design automation. The Electronics Workbench flagship product, Multisim Circuit Simulation Software, is widely used
NI DIAdem offers users configuration-based technical data management, analysis, and report generation tools to interactively mine and analyze data. DIAdem helps users make informed decisions and meet the demands of today’s testing environments, which require quick access to large volumes of scattered data, consistent reporting, and data visualization.
In 2009 we introduced NI VeriStand, a ready-to-use software environment for electronic circuit design, board layout,configuring real-time testing applications, including hardware-in-the-loop ("HIL") test systems. With NI VeriStand, users configure real-time I/O, stimulus profiles, data logging, alarming, and electrical engineering training programsother tasks; implement control algorithms or system simulations by companiesimporting models from a variety of software environments; build test system user interfaces quickly; and academic institutions including Sony, Boeing, MIT,add custom functionality using NI LabVIEW, NI TestStand, and DeVry. The acquisition strengthened the integration between our functional test and design tools and has advanced our graphical system design technology.other software environments.
Hardware Products and Related Driver Software
Using cutting-edge commercial technology, such as the latest ADCs, FPGSs, and PC busses, NI hardware delivers modular and easy-to-use solutions for a wide range of applications – from automated test and data logging to industrial control and embedded design. Our hardware and related driver software products include data acquisition (“DAQ”("DAQ"), PCI extensions for instrumentation (PXI)PXI chassis and controllers, image acquisition, motion control, Distributeddistributed I/O, Modular Instrumentsmodular instruments and Embedded Control Hardware/Software,embedded control hardware/software, industrial communications interfaces, GPIB interfaces, and VXI Controllers. The high level of integration between our products provides users with the flexibility to mix and match hardware components when developing custom virtual instrumentation systems.
DAQ Hardware/Driver Software. Our DAQ hardware and driver software products are “instruments on a board” that users can combine with sensors, signal conditioning hardware and software to acquire analog data and convert it into a digital format that can be accepted by a computer. We believe that computer-basedComputer-based DAQ products are typically a lower-cost solution than traditional instrumentation. We believe that applicationsApplications suitable for automation with computer-based DAQ products are widespread throughout many industries, and that many systems currently using traditional instrumentation (either manual or computer-controlled) could be displaced by computer-based DAQ systems. We offer a range of computer-based DAQ products, including models for digital, analog and timing input-output, and for transferring data directly to a computer’s random-access memory. In 2005,2006, we acquired the operating assets of both Measurement Computing and IOtech, two smallerintroduced NI CompactDAQ a rugged, portable, USB data acquisition companies, whose products complement and extendsystem designed for high-performance mixed-signal measurement systems. In 2008, we introduced our first data acquisition offerings, including portable and vibrationdevices that leverage wireless technologies, an extension of PC-based data acquisition for measurement products.applications where wiring is difficult or cost-prohibitive.
PXI Modular Instrumentation Platform.Our PXI modular instrument platform, which was introduced in 1997, is a standard PC packaged in a small, rugged form factor with expansion slots and instrumentation extensions. It combines mainstream PC software and PCI hardware with advanced instrumentation capabilities. In essence, PXI is an instrumentation PC with several expansion slots to enable us to pursueideal for complete system-level opportunities and deliverdelivering a much higher percentage of the overall system content using our own products. We continue to expand our PXI product offerings with new modules, which address a wide variety of measurement and automation applications. The platform is now a testing standard, with 70 companies developing on the platform and investing in its future through the PXI also continues to gain acceptance, with numerous endorsements from our customers, engineering trade publications and industry analysts.System Alliance ("PXISA"). In 2006, we introduced our first PXI Express products which provide backward software compatibility with PXI while providing advanced capabilities for high-performance instrumentation, such as RF instrumentation.
Modular Instruments. We offer a variety of modular instrument devices used in general purpose test and communication test applications. These devices include digitizers, digital multimeters, signal generators, RF analyzers/generators, power supplies, and switch modules that users can configure through software to meet their specific measurement tasks. Because these instruments are modular and software-defined, they can be quickly interchanged and easily repurposed to meet evolving test needs. Additionally, NI modular instruments provide high-speed test execution by harnessing the power of industry-standard PC and advanced timing and synchronization technologies. Options are available for a variety of platforms including PXI, PXI Express, PCI, PCI Express, and USB.
Machine Vision/Image Acquisition.Our machine vision platform includes hardware ranging from plug-in devices for PCI and PXI systems to image processing on the sensor itself with the NI Smart Camera. Software options include image acquisition software to acquire images from thousands of cameras, a world-class image processing library, and a configurable interface for industrial machine vision applications. In 1996, we introduced our first image acquisition hardware which provides users with a cost-effective solution to integrate vision into their measurement and automation applications. Our vision software is designed to work with many different software environments, including LabVIEW, LabWindows/CVI, Visual Basic, C, and Measurement Studio. In 2002, we expanded our software offering with an easy-to-use menu driven machine vision software that can run as a stand-alone vision system. The software can also generate LabVIEW code.LabVIEW. In 2003, we introduced our Vision Builder software for automated inspection and our Compact Vision System, which is a small, ruggedized, industrial vision system that can connect up to three IEEE-1394 cameras and that is easily programmed using Vision Builder. In 2007, we introduced our first integrated Smart Cameras which leverage our LabVIEW software to provide integrated solutions for many inspection and other industrial/embedded applications.
Motion Control. During 1997, we By integrating flexible software with high-performance hardware, our motion control products offer a powerful solution for motion system design. From automating test equipment and research labs to controlling biomedical, packaging, and manufacturing machines, engineers use our motion products to meet a diverse set of application challenges. Our software tools for motion easily integrate with our other product lines, so users can combine motion control with image acquisition, test, measurement, data acquisition, and automation to create robust, flexible solutions. We introduced our first line of motion control hardware, software and peripheral products. This intelligent PC-based motion control hardware is programmable from industry standard development environments including LabVIEW, LabWindows/CVI and Measurement Studio. Our software tools for motion are easily integrated with our other product lines, allowing motion to be combined with image acquisition, test, measurement, data acquisition and automation. Our computer-based motion products allows users to leverage standard hardware and software in measurement and automation applications to create robust, flexible solutions.1997.
Distributed I/O and Embedded Control Hardware/Software. Our distributed I/O products, including Compact FieldPoint, and CompactRIO, are designed for remote measurement, industrial control, and embedded data-logging applications. Compact FieldPoint is an intelligent, distributed, and modular I/O system first introduced by us in 1997, that gives industrial system developers an economical solution for distributed data acquisition, monitoring and control applications. Suitable for direct connection to industrial signals, Compact FieldPoint includes a wide array of rugged and isolated analog and digital I/O modules, terminal base options, and network modules. With LabVIEW Real-Time users can download their LabVIEW code and easily create networked systems of intelligent, real-time nodes for embedded measurement and control. In late 2002, we launched Compact FieldPoint, a smaller and even more rugged intelligent distributed I/O product that is also an execution target for LabVIEW Real-Time. In 2004, we introduced CompactRIO, an advanced embedded control and acquisition system powered by our reconfigurable I/O (RIO)("RIO") technology. Compact RIOCompactRIO leverages LabVIEW Real-Time and LabVIEW FPGA for industrial control, process monitoring, and embedded machine applications that require intelligent I/O products with a small form factor, a wide operating temperature, and resistance to shock and vibration. In 2008, we introduced Single-Board RIO, which is a board-only, lower-cost version of CompactRIO designed for higher volume system deployments.
Industrial Communications Interfaces. In mid-1995,1995, we began shipping our first interface boards for communicating with serial devices, such as dataloggersdata loggers and programmable logic controllers (PLCs)PLCs targeted for IAindustrial/embedded applications, and benchtop instruments, such as oscilloscopes, targeted for T&Mtest and measurement applications. Industrial applications need the same high-quality, easy-to-use hardware and software tools for communicating with industrial devices such as process instrumentation, PLCs, single-loop controllers, and a variety of I/O and DAQ devices. We offer hardware and driver software product lines for communication with industrial devices—Controller Area Network (CAN)("CAN"), DeviceNet, Foundation Fieldbus, and RS-485 and RS-232.
GPIB Interfaces/Driver Software. We began selling GPIB products in 1977 and are a leading supplier of GPIB interface boards and driver software to control traditional GPIB instruments. These traditional instruments are manufactured by a variety of third-party vendors and are used primarily in T&M applications. Our diverse portfolio of hardware and software products for GPIB instrument control is available for a wide range of computers. Our GPIB product line also includes products for portable computers such as a personal computer memory card (PCMCIA)-GPIB interface card, and products for controlling GPIB instruments using the computer’s standard parallel, USB, IEEE 1394 (Firewire)("Firewire"), Ethernet, and serial ports.
VXI Controllers//Driver Software. We are a leading supplier of VXI computer controller hardware and the accompanying NI-VXI and NI-VISA driver software. We also offer LabVIEW, LabWindows/CVI, Measurement Studio and TestStand software products for VXI systems.
Services
Customer Training Courses. We offer fee-based training classes and self-paced course kits for many of our software and hardware products. On-site courses are quoted per customer requests.requests and we include on-line course offerings with live teachers. We also offer programs to certify programmers and instructors for our products.
Software Maintenance
Software maintenance revenue is post contract customer support that provides the customer with unspecified upgrades/updates and technical support.
Markets and Applications
Our products are used across many industries in a variety of applications fromincluding research and development, to simulation and modeling, to product design and validation, to production testing and industrial control toand field and factory service and repair. TheWe serve the following industries and applications are served by us worldwide: advanced research, automotive, automated test equipment, commercial aerospace, computers and electronics, continuous process manufacturing, education, government/defense, medical research/pharmaceutical, power/energy, semiconductors, automated test equipment, telecommunications and others.
Customers
We have a broad customer base, with no customer accounting for more than 3% of our sales in 2006, 2005,2009, 2008 or 2004.2007.
Marketing
Through our worldwide marketing efforts, we strive to educate engineers and scientists about the benefits of our virtual instrumentation philosophy, products and technology, and to highlight the performance, ease of use and cost advantages of our products. We also seek to present our position as a technological leader among producers of instrumentation software and hardware and to help promulgate industry standards that willcan benefit users of computer-based instrumentation.
We reach our intended audience through our Web site at ni.com as well as through the distribution of written and electronic materials including demonstration versions of our software products, participation in tradeshows and technical conferences and training and user seminars.
We actively market our products in higher education environments, and we identify many colleges, universities and trade and technical schools as key accounts. We offer special academic pricing and products to enable universities to utilize our products in their classes and laboratories. We believe our prominence in the higher education area can contribute to our future success because students gain experience using our products before they enter the work force.
Sales and Distribution
We distributesell our software and hardware products primarily through a direct sales organization. We also use independent distributors, OEMs, VARs, system integrators and consultants to market our products. Our Hungarian manufacturing facility sources a substantial majority of our sales throughout the world. We have sales offices in the United States and sales offices and distributors in key international markets. Sales outside of the AmericasU.S. accounted for approximately 52%61%, 52%,61% and 53%59%, of our revenues in 2006, 2005,2009, 2008 and 2004,2007, respectively. We expect that a significant portion of our total revenues will continue to be derived from international sales. See (See Note 12 – Segment information of Notes to Consolidated Financial Statements for details concerning the geographic breakdown of our net sales, operating income, interest income and identifiable assets.)
We believe the ability to provide comprehensive service and support to our customers is an important factor in our business. We permit customers to return products within 30 days from receipt for a refund of the purchase price less a restocking charge,charge. Our products are generally warranted against defects in materials and generally provide a two-year warranty on GPIB hardwareworkmanship for one year from the date we ship the products a three-year warranty onto our new M-Series DAQ products, a one-year warranty on other hardware products, and a 90-day warranty on cables and software (medium only). Customers may also purchase a one-year extended warranty on hardware products.customers. Historically, warranty costs have not been material.
The marketplace for our products dictates that many of our products be shipped very quickly after an order is received. As a result, we are required to maintain significant inventories. Therefore, inventory obsolescence is a risk for us due to frequent engineering changes, shifting customer demand, the emergence of new industry standards and rapid technological advances including the introduction by us or our competitors of products embodying new technology. We strive to mitigate this risk by monitoring inventory levels against product demand and technological changes. There can be no assurance that we will be successful in these efforts in the future.
Our foreign operations are subject to certain risks set forth on page 1114 under “We“We are Subject to Various Risks Associated with International Operations and Foreign Economies.”
See Fluctuationsdiscussion regarding fluctuations in our quarterly results on page 9 for discussion ofand seasonality in our business.ITEM 1A, Risk Factors, “Our Revenues are Subject to Seasonal Variations.”
Competition
The markets in which we operate are characterized by intense competition from numerous competitors, some of which are divisions of large corporations having far greater resources than us,we have, and we expect tomay face further competition from new market entrants in the future. We believeA key competitor is Agilent Technologies Inc. is the dominant supplier of T&M instruments(“Agilent”). Agilent offers hardware and systems.software products that provide solutions that directly compete with our virtual instrumentation products. Agilent is also a leading supplier of equipment used in data acquisitionaggressively advertising and control applications.marketing products that are competitive with our products. Because of Agilent’s dominanceAgilent's strong position in the instrumentation business, changeschange in its marketing strategy or product offerings could have a material adverse affect on us. We also face competition from a variety of other competitors. Certain of our competitors have substantial competitive advantages in terms of breadth of technology, sales, marketing and support capability and resources, including the number of sales and technical personnel and their ability to cover a geographic area and/or particular account more extensively and with more complete solutions than we can offer, and more extensive warranty support, system integration and service capabilities than those we have. In addition, large competitors can often enter into strategic alliances with our key customers or target accounts, which can potentially have a negative impacteffect on our success with those accounts.
operating results.
We believe our ability to compete successfully depends on a number of factors both within and outside our control, including:
· new product introductions by competitors;
o· product pricing, pricing;
· the impact of foreign exchange rates on product pricing;
· quality and performance;
o· success in developing new products;
o· adequate manufacturing capacity and supply of components and materials;
o· efficiency of manufacturing operations;
o· effectiveness of sales and marketing resources and strategies;
osuccess in leveraging the Web;o· strategic relationships with other suppliers;
o· timing of our new product introductions by us or our competitors;introductions;
o· protection of our products by effective use of intellectual property laws;
o· the outcome of any material intellectual property litigation;
· the financial strength of our competitors;
· barriers to entry imposed by competitors with significant market power in new markets;
· general market and economic conditions; and,
o· events related to severe weather, natural disasters and government actions throughout the world.
Although we operate in a highly competitive market, we believe we compete favorably with respect to these factors of competition.
There can be no assurance that we will be able to compete successfully in the future.
Research and Development
We believe that our long-term growth and success depends on delivering high quality software and hardware products on a timely basis. We intend to focus our research and development efforts on enhancing existing products and developing new products that incorporate appropriate features and functionality to be competitive with respect to technology and price/performance.performance characteristics.
Our research and development staff strives to build quality into products at the design stage in an effort to reduce overall development and manufacturing costs. Our research and development staff also designs proprietary application specific integrated circuits (“ASICs”), many of which are designed for use in several of our products. The goal of our ASIC design program is to further differentiate our products from competing products, to improve manufacturability and to reduce costs. We seek to reduce theour time to market for new and enhanced products by sharing our internally developed hardware and software components across multiple products.
As of December 31, 2006,2009, we employed 1,1221,457 people in product research and development. Our research and development expenses were $113.1$133 million, $87.8$143 million and $84.7$127 million for 2006, 2005,2009, 2008 and 2004,2007, respectively.
Intellectual Property
We rely on a combination of patent, trade secret, copyright and trademark law, contracts and technical measures to establish and protect our proprietary rights in our products. As of December 31, 2006,2009, we held 362502 United States patents (355(495 utility patents and 7 design patents) and 2720 patents in foreign countries (23(18 patents registered in Europe in various countries; 1 patent in Canada; and 32 patents in Japan), and had 295296 patent applications pending in the United States and foreign countries. 88124 of our issued United States patents are software patents related to LabVIEW, and cover fundamental aspects of the graphical programming approach used in LabVIEW. Our patents expire from 20072011 to 2025. We do not expect that the expiration of certain of our patents in 2007 will have a significant impact on our business.2027. No assurance can be given that our pending patent applications will result in the issuance of patents. We also own certain registered trademarks in the United States and abroad. See further discussion regarding risks associated with our patents in ITEM 1A, Risk Factors, “Our Business Depends on Our Proprietary Rights and We are Subject to Intellectual Property Litigation.”
Manufacturing and Suppliers
We manufacture a substantial majority of our products at our facilitiesfacility in Debrecen, Hungary. Additional production primarily of low volume or newly introduced products is done in Austin, Texas. Our product manufacturing operations can be divided into four areas: electronic circuit card and module assembly; chassis and cable assembly; technical manuals and product support documentation; and software duplication. We manufacture most of the electronic circuit card assemblies, modules and chassismodules in-house, although subcontractors are used from time to time. Beginning in 2005, some chassis are produced byWe currently use subcontractors in Asia.Asia to manufacture a significant portion of our chassis, but we review these arrangements periodically. We manufacture some of our electronic cable assemblies in-house, but many assemblies are produced by subcontractors. We primarily subcontract our software duplication, our technical manuals and product support documentation. We obtain most
Our manufacturing processes use large volumes of our electronichigh-quality components from suppliers located principallyand subassemblies supplied by outside sources in the United States,U.S., Europe and Asia. SomeSeveral of thethese components are available through limited sources. Limited source components purchased by us, including application-specific integrated circuits (“ASICs”), are sole-sourced.include custom ASICs, chassis and other components. Any disruption of our supply of sole or limited source components, whether resulting from business demand, quality, production or delivery problems, could adversely affect our ability to manufacture our products, which could in turn adversely affect our business and results of operations. See“Our Business is Dependent on Key Suppliers” at page 14 for additional discussion of the risks associated with limited source suppliers.
See “Our Manufacturing Operations are Subject to a Variety of Environmental Regulations and CostsCosts” at page 1315 for discussion of environmental matters as they may affect our business.
Backlog
Backlog is a measure of orders that are received but that are not shipped to customers at the end of the quarter. We typically ship products shortly following the receipt of an order. Accordingly, our backlog typically represents less than 5 days sales. Backlog should not be viewed as an indicator of our future sales. During the year ended December 31, 2009, our order backlog increased by approximately $8 million.
Employees
EmployeesAs of December 31, 2006,2009, we had 4,1495,120 employees worldwide, including 1,1221,457 in research and development, 1,8792,338 in sales and marketing and customer support, 674755 in manufacturing and 474570 in administration and finance. None of our employees are represented by a labor union and we have never experienced a work stoppage. We consider our employee relations to be good. For eighteleven consecutive years, from 1999 to 2006,2009, we have been named among the 100 Best Companies to Work for in America according toFORTUNE magazine.
U.S./GlobalContinuing Uncertainty in General Economic Change Will Impact our Future Business.As has occurredConditions and Fluctuations in the past, the marketsGlobal Credit and Equity Markets Have Adversely Affected Our Financial Condition and Results of Operations. Our business is sensitive to changes in which we do business could again experience the negative effects of a slowdowngeneral economic conditions, both in the U.S. and/and globally. Due to the continued concerns regarding the availability of credit, our current or Global economies. The worsening of the U.S.potential customers may delay or Global economies could result in reduced purchasing and capital spending in anyreduce purchases of our marketsproducts which couldmay continue to have a materialan adverse effect on our operating results. Ourrevenues and therefore harm our business could also be subjectand results of operations. The continuing uncertainty in the credit markets is likely to or impacted by acts of terrorism and/or the effects that war or continued U.S. military action wouldcontinue to have an adverse effect on the U.S. and/orand world economies, which could continue to negatively impact the spending patterns of businesses including our current and potential customers. Historically, our business cycles have corresponded to changes in the global Purchasing Managers Index (“PMI”). From June 2008 to July 2009, this index indicated a contracting industrial economy. Starting in August 2009, the index has had readings above 50 which are indicative of expansion in the industrial global economy; however, we continue to believe there is still a substantial amount of uncertainty about the global industrial economy. We are unable to predict whether the current expansion cycle, as measured by the PMI, will be sustained throughout 2010. This continuing uncertainty in the global industrial economy is likely to continue to have an adverse effect on the spending patterns of businesses including our current and potential customers which could adversely affect our revenues and therefore harm our business and result of operations.
Concentrations of Credit Risk and Negative Conditions in the Global economies.Financial Markets May Adversely Affect Our business could also be impacted by public health concerns, natural disasters, disruptionsFinancial Condition and Result of Operations. By virtue of our holdings of investment securities and foreign currency derivatives, we have exposure to public ormany different counterparties, and routinely execute transactions with counterparties in the financial services industry, including commercial transportation systems, political instability or similar events which resultbanks and investment banks. Many of these transactions expose us to credit risk in increased difficulty or higher costs for the export of products into affected regions, the import of components used in our products from affected regions, and/or the effects the event of a default of our counterparties. We have policies relating to initial credit rating requirements and to exposure limits to counterparties, which are designed to mitigate credit and liquidity risk. There can be no assurance, however, that any losses or impairments to the carrying value of our financial assets as a result of defaults by our counterparties, would not materially and adversely affect our business, financial position and results of operations.
Negative Conditions in the Global Credit Markets Have Impaired the Liquidity of a Portion of Our Investment Portfolio. Our short-term investments include auction rate securities backed by education loan revenue bonds. One of our auction rate securities is from the Vermont Student Assistance Corporation and has ona par value of $2.2 million. The other of our auction rate securities is from the economyNew Hampshire Health and Education Facilities Authority and has a par value of $6.4 million. On January 15, 2010, and in regionsprior auction periods beginning in whichFebruary 2008, the auction process for these securities failed. These auction rate securities are classified as available-for-sale. The auction rate market is not expected to provide liquidity for these securities in the foreseeable future. Should we do business.need or desire to access the funds invested in those securities prior to their maturity or prior to our exercise period under our Rights agreement with UBS, we may be unable to find a buyer in a secondary market outside the auction process or if a buyer in a secondary market is found, we would likely realize a loss. See Note 3 – Fair value measurements in Notes to Consolidated Financial Statements for further discussion of our auction rate securities.
We Have Established a Budget and Variations From Our Budget Will Affect Our Financial Results.We have During the fourth quarter of 2009, we established an operating budget for 2007.2010. Our budget wasbudgets are established based on the estimated revenue from forecasted sales of our products which isare based in part on economic conditions in the markets in which we do business as well as the timing and volume of our new products and the expected penetration of both new and existing products in the marketplace. Historically, our business cycles have corresponded to changes in the global PMI. From June 2008 to July 2009, this index had indicated a contracting industrial economy. Starting in August 2009, the index has had readings above 50 which are indicative of expansion in the industrial global economy. We believe there is still a substantial amount of uncertainty about the global industrial economy. We are unable to predict whether the current expansion cycle, as measured by the PMI, will be sustained throughout 2010. This uncertainty as well as the uncertainty as to how our business will be impacted by any future expansion or contraction in the global industrial economy, makes forecasting our results difficult. This uncertainty is reflected in key assumptions used to establish our 2010 budget. If demand for our products in 2010 is less than the demand we have anticipated in setting our 2010 budget, our operating results could be negatively impacted. If we exceed the level of expenses established in our 2010 operating budget or if we cannot reduce budgeted expenditures in response to a decreases in revenue, our operating results could be adversely affected. Our spending for 2007 could exceed our budgetbudgets due to a number of factors, including:
o· additional marketing costs for new product introductions and/or for conferences and tradeshows;
o· increased costs from hiring more product development engineers or other personnel;
o· additional costs related to acquisitions, if any;associated with our incremental investment in our field sales force;
o· additional costs associated with the expiration of temporary cost cutting measures, such as salary reductions, implemented in 2009;
· increased manufacturing costs resulting from component supply shortages and/or component price fluctuations; and/or
o· increased component costs resulting from vendors increasing prices in response to increased economic activity;
· additional expenses related to intellectual property litigation.litigation; and/or
· additional costs related to acquisitions, if any.
We are Subject to Risks Associated with Our Centralization of Inventory and Distribution. Currently, shipments to our customers worldwide are primarily sourced from our warehouse facility in Debrecen, Hungary. Shipments to some of our customers in Asia are currently made either out of local inventory managed by our branch operations in various Asian countries or from a centralized distribution point in Singapore. We will continue to devote resources to centralizing our distribution to a limited number of shipping points. Our planned centralization of inventory and distribution from a limited number of shipping points is subject to inherent risks, including:
· burdens of complying with additional and/or more complex VAT and customs regulations; and,
· severe concentration of inventory increasing the risks associated with fire, natural disasters and logistics disruptions to customer order fulfillment.
No assurance can be given that our efforts will be successful. Any future decreased demand for our productsdifficulties with the centralization of distribution or delays in the implementation of the systems or processes to support this centralized distribution could result in decreased revenueinterruption of our normal operations, including our ability to process orders and could require usship products to revise our budget and reduce expenditures. Exceedingcustomers. Any failure or delay in distribution from our established operating budget or failing to reduce expendituresfacility in response to any decrease in revenueHungary could have a material adverse effect on our operating results.
We May Experience Component Shortages. As has occurredA Substantial Majority of Our Manufacturing Capacity is Located in Hungary. Our Hungarian manufacturing and warehouse facility sources a substantial majority of our sales. During the year ended December 31, 2009, we continued to maintain and enhance the systems and processes that support the direct shipment of product orders to our customers worldwide from our manufacturing facility in Hungary. In order to enable timely shipment of products to our customers we also maintain the vast majority of our inventory at our Hungary warehouse facility. In addition to being subject to the risks of maintaining such a concentration of manufacturing capacity and global inventory, this facility and its operation are also subject to risks associated with doing business internationally, including:
· difficulty in managing manufacturing operations in a foreign country;
· difficulty in achieving or maintaining product quality;
· interruption to transportation flows for delivery of components to us and finished goods to our customers;
· changes in the country’s political or economic conditions; and,
· changes in the country’s tax laws.
No assurance can be given that our efforts to mitigate these risks will be successful. Accordingly, a failure to deal with these factors could result in interruption in the past and as may be expected to occurfacility’s operation or delays in the future, supply shortages of components used in our products, including sole source components, can result in significant additional costs and inefficiencies in manufacturing. If we are unsuccessful in resolving any such component shortages in a timely manner, we will experience a significant impact on the timing of revenue, a possible loss of revenue and/or an increase in manufacturing costs, anyexpanding its capacity, either of which wouldcould have a material adverse impact on our operating results.Our Business is Dependent on Key Suppliers. Our manufacturing processes use large volumes of high-quality components and subassemblies supplied by outside sources. Several of these components are available through sole or limited sources. Sole-source components purchased include custom application-specific integrated circuits (“ASICS”), chassis and other components. We have in the past experienced delays and quality problems in connection with sole-source components, and there can be no assurance that these problems will not recur in the future. Accordingly, our failure to receive sole-source components from suppliers could result in a material adverse effect on our revenues and operating results.
In response to significant and frequent changes in the corporate tax law, the unstable political environment, a restrictive labor code, the volatility of the Hungarian forint relative to the U.S. dollar and increasing labor costs, we have doubts as to the long term viability of Hungary as a location for our manufacturing and warehousing operations. As such, we may need to look for an alternative location for a substantial majority of our manufacturing and warehousing activities which could have a material adverse effect on our ability to meet current customer demands, our ability to grow our business as well as our liquidity, capital resources and results of operations. Our long term manufacturing and warehousing capacity planning contemplates a third manufacturing and warehousing facility in Malaysia. Deployment of this facility could be accelerated in response to an unfavorable change in the corporate taxation, regulatory or economic environment in Hungary. We can give no assurance that we would be successful in accelerating the deployment of a new facility in Malaysia. Our failure to accelerate the deployment of our manufacturing and warehousing facility in Malaysia in response to unfavorable changes in the corporate taxation, regulatory or economic environment in Hungary, could have a material adverse effect on our ability to meet current customer demands, our ability to grow our business as well as our liquidity, capital resources and results of operations.
Our Income Tax Rate is Affected by Tax Benefits in Hungary. As a result of certain foreign investment incentives available under Hungarian law, the profit from our Hungarian operation was subject to a reduced income tax rate. This special tax status terminated on January 1, 2008, with the merger of our Hungarian manufacturing operations with its Hungarian parent company. The tax position of our Hungarian operation continued to benefit from assets created by the restructuring of our operations in Hungary. Realization of these assets was based on our estimated future earnings in Hungary. Partial release of the valuation allowance on these assets resulted in income tax benefits of $18.3 million for the year ended December 31, 2007, and $8.7 million for the year ended December 31, 2008.
For the year 2009, we expected to recognize an additional tax benefit of $9.7 million related to these assets. Effective January 1, 2010, a new tax law in Hungary provides for an enhanced deduction for the qualified research and development expenses of NI Hungary Software and Hardware Manufacturing Kft. ("NI Hungary"). During the three months ended December 31, 2009, we obtained confirmation of the application of this new tax law for the qualified research and development expenses of NI Hungary. Based on the application of this new tax law to the qualified research and development expense of NI Hungary, we no longer expect to have sufficient future taxable income in Hungary to realize the benefits of these tax assets. As such, we recorded an income tax charge of $21.6 million during the three months ended December 31, 2009, $18.4 million of which was related to a valuation allowance on the previously recognized assets created by the restructuring and $3.2 million of which was related to tax benefits from other assets that we will no longer be able to realize as a result of this change. We do not expect to realize the tax benefit of the remaining assets created by the restructuring and therefore we have a full valuation allowance of $98.2 million against those assets at December 31, 2009.
Changes in Hungary’s political condition and/or tax laws could eliminate the enhanced tax deduction in the future. The reduction or elimination of this enhanced tax deduction in Hungary or future changes in U.S. law pertaining to taxation of foreign earnings could result in an increase in our future effective income tax rate which could have a material adverse effect on our operating results.
We Rely on Management Information Systems and any Disruptions in Our Systems Would Adversely Affect Us. We rely on a primary global center for our management information systems and on multiple systems in branches not covered by our global center. As with any information system, unforeseen issues may arise that could affect our ability to receive adequate, accurate and timely financial information, which in turn could inhibit effective and timely decisions. Furthermore, it is possible that our global center for information systems or our branch operations could experience a complete or partial shutdown. If such a shutdown occurred, it could impact our product shipments and revenues, as order processing and product distribution are heavily dependent on our management information systems. Accordingly, our operating results in such periods would be adversely impacted. We are continually working to maintain reliable systems to control costs and improve our ability to deliver our products in our markets worldwide. No assurance can be given that our efforts will be successful.
During the year ended December 31, 2009, we continued to devote resources to the development of our systems for manufacturing, sales, product services and to the continued development of our web offerings. There can be no assurance that we will not experience difficulties with our systems. Difficulties with our systems may interrupt our normal operations, including our ability to provide quotes, process orders, ship products, provide services and support to our customers, bill and track our customers, fulfill contractual obligations and otherwise run our business. Any disruption occurring with these systems may have a material adverse effect on our operating results. In 2010, we will focus on upgrading our Americas business application suite to Oracle’s version R12 and will continue to devote significant resources to the continued development of our web applications. Any failure to successfully implement these initiatives could have a material adverse effect on our operating results.
Our Quarterly Results are Subject to FluctuationFluctuations Due to Various Factors.Factors.Our quarterly operating results have fluctuated in the past and may fluctuate significantly in the future due to a number of factors, including:
· changes in the economy or credit markets in the U.S. or globally;
o· changes in the mix of products sold;
o· the availability and pricing of components from third parties (especially solelimited sources);
othe timing of orders;opricing of our products;o· fluctuations in foreign currency exchange rates;
o· the timing, cost or outcome of intellectual property litigation;
o· the difficulty in maintaining margins, including the higher margins traditionally achieved in international sales; and,
o· changes in pricing policies by us, our competitors or suppliers.
Specifically, if the local currencies in which we sell weaken against the U.S. dollar, and if the local sales prices cannot be raised due
Our Revenues are Subject to competitive pressures, we will experience a deterioration of our gross and net profit margins. If the U.S. dollar strengthens in the future, it could have a material adverse effect on our gross and net profit margins. As has occurred in the past and as may be expected to occur in the future, our new software products or new operating systems of third parties on which our products are based often contain bugs or errors that can result in reduced sales and/or cause our support costs to increase, either of which could have a material adverse impact on our operating results. Furthermore, we have significant revenues from customers in industries such as semiconductors, automated test equipment, telecommunications, aerospace, defense and automotive which are cyclical in nature. Downturns in these industries could have a material adverse effect on our operating results.
Seasonal Variations.
In recentprevious years, our revenues have been characterized by seasonality, with revenues typically growing from the first quarter to the second quarter, being relatively constant infrom the second andquarter to the third quarters,quarter, growing in the fourth quarter compared to the third quarter and declining in the first quarter of the following from the fourth quarter of the year to the first quarter of the followingpreceding year. This historical trend has been affected and may continue to be affected in the future by declines in the global industrial economy, the economic impact of larger orders as well as the timing of new product introductions and/or acquisitions, if any. For example, during the fourth quarter of 2008, we experienced a sequential decline in revenue from the third quarter of 2008 due to the severe contraction in the global industrial economy, which is contrary to the typical seasonality described above. In addition, our first quarter and second quarter of 2009 had sequential revenue declines from the fourth quarter of 2008 and first quarter of 2009, respectively, and the magnitude of the decline in the first quarter of 2009 was greater than what has occurred in the past. We cannot predict when or if we will return to our typical historical revenue pattern. We believe the historical pattern of seasonality of our revenue results from the international mix of our revenue and the variability of the budgeting and purchasing cycles of our customers throughout each international region. In addition, our total operating expenses have in the past tended to increase in each successive quarter and have fluctuated as a percentage of revenue based on the seasonality of our revenue. During the year ended December 31, 2009, we were able to reduce our operating costs compared to 2008. Some of the cost cutting measures implemented in 2009, such as salary reduction, may not be higheravailable to us in 2010. We cannot provide any assurance that the cost cutting measures implemented in 2009 can be sustained in 2010 as we plan to continue our strategic investments in research and development and field sales while limiting expense growth elsewhere.
We Operate in Intensely Competitive Markets. The markets in which we operate are characterized by intense competition from numerous competitors, some of which are divisions of large corporations having far greater resources than we have, and we may face further competition from new market entrants in the secondfuture. A key competitor is Agilent Technologies Inc. (“Agilent”). Agilent offers hardware and third quarterssoftware products that provide solutions that directly compete with our virtual instrumentation products. Agilent is aggressively advertising and marketing products that are competitive with our products. Because of each year, dueAgilent’s strong position in the instrumentation business, changes in its marketing strategy or product offerings could have a material adverse effect on our operating results.
We believe our ability to recruitingcompete successfully depends on a number of factors both within and increased intern personnel expenses.outside our control, including:
· new product introductions by competitors;
· product pricing;
· the impact of foreign exchange rates on product pricing;
· quality and performance;
· success in developing new products;
· adequate manufacturing capacity and supply of components and materials;
· efficiency of manufacturing operations;
· effectiveness of sales and marketing resources and strategies;
· strategic relationships with other suppliers;
· timing of our new product introductions;
· protection of our products by effective use of intellectual property laws;
· the outcome of any material intellectual property litigation;
· the financial strength of our competitors;
· barriers to entry imposed by competitors with significant market power in new markets;
· general market and economic conditions; and,
· government actions throughout the world.
There can be no assurance that we will be able to compete successfully in the future.
Our Product Revenues are Dependent on Certain Industries. Sales of our products are dependent on customers in certain industries, particularly the telecommunications, semiconductor, automotive, automated test equipment, defense and aerospace industries. As we have experienced in the past, and as we may continue to experience in the future, downturns characterized by diminished product demand in any one or more of these industries have resulted and may continue to result in decreased sales, and a material adverse effect on our operating results.
Our Success Depends on New Product Introductions and Market Acceptance of Our Products.Products.The market for our products is characterized by rapid technological change, evolving industry standards, changes in customer needs and frequent new product introductions, and is therefore highly dependent upon timely product innovation. Our success is dependent on our ability to successfully develop and introduce new and enhanced products on a timely basis to replace declining revenues from older products, and on increasing penetration in domestic and international markets. InAs has occurred in the past and as may be expected to occur in the future, we have experienced significant delays between the announcement and the commercial availability of new products. Any significant delay in releasing new products could have a material adverse effect on the ultimate success of a product and other related products and could impede continued sales of predecessor products, any of which could have a material adverse effect on our operating results. There can be no assurance that we will be able to introduce new products in accordance with announced release dates, that new products will achieve market acceptance or that any such acceptance will be sustained for any significant period. Failure of our new products to achieve or sustain market acceptance could have a material adverse effect on our operating results. Moreover, there can be no assurance that our international sales will continue at existing levels or grow in accordance with our efforts to increase foreign market penetration.
Our Business is Dependent on Key Suppliers. Our manufacturing processes use large volumes of high-quality components and subassemblies supplied by outside sources. Several of these components are available through limited sources. Limited source components purchased include custom application specific integrated circuits (“ASICs”), chassis and other components. We have in the past experienced delays and quality problems in connection with limited source components, and there can be no assurance that these problems will not recur in the future. Accordingly, our failure to receive components from limited suppliers could result in a material adverse effect on our revenues and operating results. In the event that any of our limited suppliers experience significant financial or operational difficulties due to adverse global economic conditions or otherwise, our business and operating results would likely be adversely impacted until we are able to secure another source for the required materials.
We May Experience Component Shortages. As has occurred in the past and as may be expected to occur in the future, supply shortages of components used in our products, including limited source components, can result in significant additional costs and inefficiencies in manufacturing. If we are unsuccessful in resolving any such component shortages in a timely manner, we will experience a significant impact on the timing of revenue, a possible loss of revenue, and/or an increase in manufacturing costs, any of which would have a material adverse impact on our operating results.
We are Subject to Risks Associated with Our Web Site.Site. We devote resources to maintain our Web site as a key marketing, sales and support tool and expect to continue to do so in the future. However, there can be no assurance that we will be successful in our attempt to leverage the Web to increase sales. We host our Web site internally. Any failure to successfully maintain our Web site or any significant downtime or outages affecting our Web site could have a significantmaterial adverse impact on our operating results.
We Operate in Intensely Competitive Markets. The markets in which we operateOur Products are characterized by intense competition from numerous competitors, some of which are divisions of large corporations having far greater resources than we have,Complex and we expect to face further competition from new market entrantsMay Contain Bugs or Errors. As has occurred in the future. A key competitor is Agilent Technologies Inc. Agilent offers its own line of instrument controllers,past and also offers hardware andas may be expected to occur in the future, our new software products or new operating systems of third parties on which our products are based often contain bugs or errors that provide solutions that directly compete withcan result in reduced sales and/or cause our virtual instrumentation products. Agilent is aggressively advertising and marketing products that are competitive with our products. Becausesupport costs to increase, either of Agilent’s strong position in the instrumentation business, changes in its marketing strategy or product offeringswhich could have a material adverse effectimpact on our operating results. We believe our ability to compete successfully depends on a number of factors both within and outside our control, including:
onew product introductions by competitors;oproduct pricing;oquality and performance;osuccess in developing new products;oadequate manufacturing capacity and supply of components and materials;oefficiency of manufacturing operations;oeffectiveness of sales and marketing resources and strategies;ostrategic relationships with other suppliers;otiming of our new product introductions;oprotection of our products by effective use of intellectual property laws;othe outcome of any material intellectual property litigation;ogeneral market and economic conditions; andogovernment actions throughout the world
There can be no assurance that we will be able to compete successfully in the future.
We Rely on Management Information Systems and any Disruption in Such Systems Would Adversely Affect Us. We rely on three primary regional centers for our management information systems and on multiple systems in some branches not covered by our three regional centers. As with any information system, unforeseen issues may arise that could affect our ability to receive adequate, accurate and timely financial information, which in turn could inhibit effective and timely decisions. Furthermore, it is possible that one or more of our three regional information systems could experience a complete or partial shutdown. If such a shutdown occurred it could impact our product shipments and revenues, as order processing and product distribution are heavily dependent on the integrated management information systems in each region. Accordingly, our operating results in such periods would be adversely impacted. We are working to maintain reliable regional management information systems to control costs and improve our ability to deliver our products in our markets worldwide. No assurance can be given that our efforts will be successful. The failure to receive adequate, accurate and timely financial information could inhibit our ability to make effective and timely decisions. During 2006, we devoted resources to the initial phase of consolidating our Japanese business application suite with our European business application suite. During 2006, we also devoted resources to the continued development of our web offerings. There can be no assurance that we will not experience difficulties with these new systems. Difficulties with these new systems may interrupt our normal operations, including our ability to provide quotes, process orders, ship products, provide services and support to our customers, bill and track our customers, fulfill contractual obligations and otherwise run our business. Any disruption occurring with these systems may have a material adverse effect on our operating results. During 2007, we plan to continue to devote significant resources to the consolidation of our Japanese and European business application suites scheduled for January, 2007, to the implementation of systems that support direct shipment worldwide from our manufacturing facility and warehouse in Hungary scheduled for the third quarter of 2007 and to the continued development of our web offerings. Any failure to successfully implement these initiatives could have a material adverse effect on our operating results.
We are Subject to Various Risks Associated with International Operations and Foreign Economies.Our international sales are subject to inherent risks, including:
o· fluctuations in local economies;
o· fluctuations in foreign currencies relative to the U.S. dollar;
o· difficulties in staffing and managing foreign operations;
o· greater difficulty in accounts receivable collection;
o· costs and risks of localizing products for foreign countries;
o· unexpected changes in regulatory requirements;
o· tariffs and other trade barriers;
o· difficulties in the repatriation of earnings; and,
o· the burdens of complying with a wide variety of foreign laws.
In many foreign countries, particularly in those with developing economies, it is common to engage in business practices that are prohibited by United StatesU.S. regulations applicable to us such as the Foreign Corrupt Practices Act. Although we implementhave policies and procedures designed to ensure compliance with these laws, there can be no assurance that all of our employees, contractors and agents, including those based in or from countries where practices which violate such United StatesU.S. laws may be customary, will not take actions in violationsviolation of our policies. Any violation of foreign or United StatesU.S. laws by our employees, contractors or agents, even if such violation is prohibited by our policies, could have a material adverse effect on our business. We must also comply with various import and export regulations. The application of these various regulations depends on the classification of our products which can change over time as such regulations are modified or interpreted. As a result, even if we are currently in compliance with applicable regulations, there can be no assurance that we will not have to incur additional costs or take additional compliance actions in the future. Failure to comply with these regulations could result in fines and/or termination of import and export privileges, which could have a material adverse effect on our operating results. Additionally, the regulatory environment in some countries is very restrictive as their governments try to protect their local economy and value of their local currency against the U.S. dollar.
Sales made by our international direct sales offices are denominated in local currencies, and accordingly, the U.S. dollar equivalent of these sales is affected by changes in the foreign currency exchange rates. Net of hedging results, the change in exchange rates had the effect of decreasing our consolidated sales by 0.5% in 2006$29 million or 4% for the year ended December 31, 2009, compared to 2005.2008. If the local currencies in which we sell our products strengthen against the U.S. dollar, we may need to lower our prices in the local currency to remain competitive in our international markets which could have a material adverse effect on our gross and net profit margins. If the local currencies in which we sell our products weaken against the U.S. dollar and if the local sales prices cannot be raised due to competitive pressures, we will experience a deterioration of our gross and net profit margins. Since most of our international operating expenses are also incurred in local currencies, the change in exchange rates had the effect of decreasing our operating expenses by $1.5$12 million or 2% for 2006the year ended December 31, 2009, compared to 2005. If the U.S. dollar weakens in the future, it could result in our having to reduce prices locally in order for our products to remain competitive in the local marketplace. If the U.S. dollar strengthens in the future, and we are unable to successfully raise our international selling prices, it could have a materially adverse effect on our operating results.A Substantial Majority of Our Manufacturing Capacity is Located in Hungary.Our Hungarian manufacturing facility sources a substantial majority of our sales.2008. Currently, we are continuing to develop and implement information systems to support the operation of this facility. During the third quarter of 2006, we moved one of our two manufacturing linesexperiencing significant volatility in our Austin, Texas manufacturing facility to our manufacturing facilityforeign currency exchange rates in Debrecen, Hungary. In the third quarter of 2007, we intend to implement systems and processes that support the direct shipment of product orders to our customers worldwide from our manufacturing facility in Hungary. In order to better insure timely shipment of products to our customers we will maintain the vast majority of our inventory at our Hungary manufacturing facility. In addition to being subject to the risks of maintaining such a concentrated global inventory, this facility and its operation are also subject to risks associated with doing business internationally, including:
odifficulty in managing manufacturing operations in a foreign country;odifficulty in achieving or maintaining product quality;ointerruption to transportation flows for delivery of components to us and finished goods to our customers, andochanges in the country's political or economic conditions.
No assurance can be given that our efforts will be successful. Accordingly, a failure to deal with these factors could result in interruption in the facility’s operation or delays in expanding its capacity, either of which could have a material adverse effect on our operating results.
Our Income Tax Rate is Affected by Tax Benefits in Hungary.As a result of certain foreign investment incentives available under Hungarian law, the profit from our Hungarian operation is currently subject to a reduced income tax rate. These benefits may not be available in the future due to changes in Hungary’s political condition and/or tax laws. The reduction or elimination of these foreign investment incentives would result in the reduction or elimination of certain tax benefits thereby increasing our future effective income tax rate, which could have a material adverse effect on our operating results.
We received a substantial income tax benefit from the extraterritorial income exemption (“ETI”) under U.S. law. The ETI rules provided that a percentagemany of the profits from products and intangibles exported from the U.S. were exempt from U.S. tax.markets in which we do business. This benefit will not be available in the future as the ETI was repealed by the American Jobs Creation Act of 2004. ETI ceased to be available as of December 31, 2006. The repeal of the ETI will increase our future effective income tax rate, which could have a material adverse effect on our operating results. However, we believe that the effect of the repeal of the ETI will be offset by the effects of the expected increased benefit from the deduction for income from qualified domestic production activities and increased profits in certain foreign jurisdictions with reduced income tax rates.
Our Product Revenues are Dependent on Certain Industries.Sales of our products are dependent on customers in certain industries, particularly the telecommunications, semiconductor, automotive, automated test equipment, defense and aerospace industries. As experienced in the past, and as may be expected to occur in the future, downturns characterized by diminished product demand in any one or more of these industries could result in decreased sales, which could have a material adverse effect on our operating results.
Our Reported Financial Results may be Adversely Affected by Changes in Accounting Principles Generally Accepted in the United States.We prepare our financial statements in conformity with accounting principles generally accepted in the U.S. These accounting principles are subject to interpretation by the Financial Accounting Standards Board, the American Institute of Certified Public Accountants, the Securities and Exchange Commission and various bodies formed to interpret and create appropriate accounting policies. A change in these policies or interpretations could have a significant effect on our reported financial results, and could affect the reporting of transactions completed before the announcement of a change. For example, beginning in the first quarter of fiscal 2006, with the adoption of SFAS 123(R), we now record a charge to earnings for employee stock option grants for all stock options unvested at December 31, 2005. This accounting pronouncement has had a material negativesignificant impact on the revaluation of our financial results. Technology companies generally,foreign currency denominated firm commitments and on our company specifically,ability to forecast our U.S. dollar equivalent revenues and expenses. In the past, these dynamics have also adversely affected our revenue growth in international markets and will likely pose similar challenges in the past relied on stock options as a major component of our employee compensation packages. Because we are required to expense options, we have changed our equity compensation program to no longer grant options but instead grant restricted stock units. Furthermore, because we are required to expense options, we may be less likely to sustain profitability in the future.
Our Business Depends on Our Proprietary Rights and We are Subject to Intellectual Property Litigation. Our success depends on our ability to obtain and maintain patents and other proprietary rights relative to the technologies used in our principal products. Despite our efforts to protect our proprietary rights, unauthorized parties may have in the past infringed or violated certain of our intellectual property rights. We from time to time engage in litigation to protect our intellectual property rights. In monitoring and policing our intellectual property rights, we have been and may be required to spend significant resources. We from time to time may be notified that we are infringing certain patent or intellectual property rights of others. There can be no assurance that any existing intellectual property litigation or any intellectual property litigation initiated in the future, will not cause significant litigation expense, liability, injunction against the sale of some of our products, and a diversion of management’s attention, any of which may have a material adverse effect on our operating results.
Our Reported Financial Results May be Adversely Affected by Changes in Accounting Principles Generally Accepted in the United States. We prepare our financial statements in conformity with accounting principles generally accepted in the U.S. These accounting principles are subject to interpretation by the Financial Accounting Standards Board and the Securities and Exchange Commission. A change in these policies or interpretations could have a significant effect on our reported financial results, and could affect the reporting of transactions completed before the announcement of a change.
Compliance withWith Sections 302 and 404 of the Sarbanes-Oxley Act of 2002 is Costly and Challenging. As required by Section 302 of the Sarbanes-Oxley Act of 2002, this Form 10-K contains our managements’ certification of adequate disclosure controls and procedures as of December 31, 2006.2009. This report on Form 10-K also contains a report by our management on our internal control over financial reporting including an assessment of the effectiveness of our internal control over financial reporting as of December 31, 2006.2009. This Form 10-K also contains an attestation and report by our external auditors with respect to management’s assessment of the effectiveness of our internal control over financial reporting under Section 404. While these assessments and reports did not reveal any material weaknesses in our internal control over financial reporting, compliance with Sections 302 and 404 is required for each future fiscal year end. We expect that the ongoing compliance with Sections 302 and 404 will continue to be both very costly and very challenging and there can be no assurance that material weaknesses will not be identified in future periods. Any adverse results from such ongoing compliance efforts could result in a loss of investor confidence in our financial reports and have an adverse effect on our stock price.
Our Business Depends on the Continued Service of Key Management and Technical Personnel.Personnel.Our success depends upon the continued contributions of our key management, sales, marketing, research and development and operational personnel, including Dr. Truchard, our Chairman and Chief Executive Officer, and other members of our senior management and key technical personnel. We have no agreements providing for the employment of any of our key employees for any fixed term and our key employees may voluntarily terminate their employment with us at any time. The loss of the services of one or more of our key employees in the future could have a material adverse affecteffect on our operating results. We also believe our future success will depend upon our ability to attract and retain additional highly skilled management, technical, marketing, research and development, and operational personnel with experience in managing large and rapidly changing companies, as well as training, motivating and supervising employees. As a result of the impact that the adoption of SFAS 123R in our first fiscal quarter of 2006 has had on our results of operations, we have changed our equity compensation program. We now grant fewer equity instruments and the type of equity instrument is restricted stock units rather than stock options, which may make it more difficult for us to attract or retain qualified management and technical personnel, which could have an adverse effect on our operating results. In addition, the recruiting environment for software engineering, sales and other technical professionals is very competitive. Competition for qualified software engineers is particularly intense and is likely to result in increased personnel costs. Our failure to attract or retain qualified software engineerskey technical or managerial talent could have an adverse effect on our operating results. We also recruit and employ foreign nationals to achieve our hiring goals primarily for engineering and software positions. There can be no guarantee that we will continue to be able to recruit foreign nationals at the current rate. There can be no assurance that we will be successful in retaining our existing key personnel or attracting and retaining additional key personnel. Failure to attract and retain a sufficient number of our key personnel could have a material adverse effect on our operating results.
Our Manufacturing Operations are Subject to a Variety of Environmental Regulations and Costs.Costs.We must comply with many different governmental regulations related to the use, storage, discharge and disposal of toxic, volatile or otherwise hazardous chemicals used in our manufacturing operations in the U.S. and in Hungary. Although we believe that our activities conform to presently applicable environmental regulations, our failure to comply with present or future regulations could result in the imposition of fines, suspension of production or a cessation of operations. Any such environmental regulations could require us to acquire costly equipment or to incur other significant expenses to comply with such regulations. Any failure by us to control the use of or adequately restrict the discharge of hazardous substances could subject us to future liabilities.
Our Acquisitions are Subject to a Number of Related Costs and Challenges.We have from time to time acquired, and may in the future acquire, complementary businesses, products or technologies. Achieving the anticipated benefits of an acquisition depends upon whether the integration of the acquired business, products or technology is accomplished efficiently and effectively. In addition, successful acquisitions may require, among other things, integration of product offerings, manufacturing operations and coordination of sales and marketing and R&D efforts. These difficulties can become more challenging due to the need to coordinate geographically separated organizations, the complexities of the technologies being integrated, and the necessities of integrating personnel with disparate business backgrounds and combining two different corporate cultures. The integration of operations following an acquisition also requires the dedication of management resources, which may distract attention from our day-to-day business and may disrupt key R&D, marketing or sales efforts. The inability of our management to successfully integrate any future acquisition could harm our business. Some of the existing products previously sold by the acquired entities are of lesser quality than our products and/or could contain errors that produce incorrect results on which users rely or cause failure or interruption of systems or processes that could subject us to liability claims that could have a material adverse effect on our operating results or financial position. Furthermore, products acquired in connection with acquisitions may not gain acceptance in our markets, and we may not achieve the anticipated or desired benefits of such transaction.Provisions in Our Charter Documents and Delaware Law and Our Stockholder Rights Plan May Delay or Prevent an Acquisition of Us. Our certificate of incorporation and bylaws and Delaware law contain provisions that could make it more difficult for a third party to acquire us without the consent of our Board of Directors. These provisions include a classified Board of Directors, prohibition of stockholder action by written consent, prohibition of stockholders to call special meetings and the requirement that the holders of at least 80% of our shares approve any business combination not otherwise approved by two-thirds of the Board of Directors. Delaware law also imposes some restrictions on mergers and other business combinations between us and any holder of 15% or more of our outstanding common stock. In addition, our Board of Directors has the right to issue preferred stock without stockholder approval, which could be used to dilute the stock ownership of a potential hostile acquirer. Our Board of Directors adopted a new stockholders rights plan on January 21, 2004, pursuant to which we declared a dividend of one right for each share of our common stock outstanding as of May 10, 2004. This rights plan replaced a similar rights plan that had been in effect since our initial public offering in 1995. Unless redeemed by us prior to the time the rights are exercised, upon the occurrence of certain events, the rights will entitle the holders to receive upon exercise thereof shares of our preferred stock, or shares of an acquiring entity, having a value equal to twice the then-current exercise price of the right. The issuance of the rights could have the effect of delaying or preventing a change of control of us.
We areAre Subject to the Risk of Product Liability Claims.Claims. Our products are designed to provide information upon which users may rely. Our products are also used in “real time” applications requiring extremely rapid and continuous processing and constant feedback. Such applications give rise to the risk that a failure or interruption of the system or application could result in economic damage or bodily harm. We attempt to assure the quality and accuracy of the processes contained in our products, and to limit our product liability exposure through contractual limitations on liability, limited warranties, express disclaimers and warnings as well as disclaimers contained in our “shrink wrap” license agreements with end-users. If our products contain errors that produce incorrect results on which users rely or cause failure or interruption of systems or processes, customer acceptance of our products could be adversely affected. Further, we could be subject to liability claims that could have a material adverse effect on our operating results or financial position. Although we maintain liability insurance for product liability matters, there can be no assurance that such insurance or the contractual limitations used by us to limit our liability will be sufficient to cover or limit any claims which may occur.
Our Acquisitions are Subject to a Number of Related Costs and Challenges. We have from time to time acquired, and may in the future acquire, complementary businesses, products or technologies. Achieving the anticipated benefits of an acquisition depends upon whether the integration of the acquired business, products or technology is accomplished efficiently and effectively. In addition, successful acquisitions generally require, among other things, integration of product offerings, manufacturing operations and coordination of sales and marketing and R&D efforts. These difficulties can become more challenging due to the need to coordinate geographically separated organizations, the complexities of the technologies being integrated, and the necessities of integrating personnel with disparate business backgrounds and combining two different corporate cultures. The integration of operations following an acquisition also requires the dedication of management resources, which may distract attention from our day-to-day business and may disrupt key R&D, marketing or sales efforts. The inability of our management to successfully integrate any future acquisition could harm our business. Some of the existing products previously sold by some of the entities we have acquired are of lesser quality than our products and/or could contain errors that produce incorrect results on which users rely or cause failure or interruption of systems or processes that could subject us to liability claims that could have a material adverse effect on our operating results or financial position. Furthermore, products acquired in connection with acquisitions may not gain acceptance in our markets, and we may not achieve the anticipated or desired benefits of such transaction.
Provisions in Our Charter Documents and Delaware Law and Our Stockholder Rights Plan May Delay or Prevent an Acquisition of Us. Our certificate of incorporation and bylaws and Delaware law contain provisions that could make it more difficult for a third party to acquire us without the consent of our Board of Directors. These provisions include a classified Board of Directors, prohibition of stockholder action by written consent, prohibition of stockholders to call special meetings and the requirement that the holders of at least 80% of our shares approve any business combination not otherwise approved by two-thirds of the Board of Directors. Delaware law also imposes some restrictions on mergers and other business combinations between us and any holder of 15% or more of our outstanding common stock. In addition, our Board of Directors has the right to issue preferred stock without stockholder approval, which could be used to dilute the stock ownership of a potential hostile acquirer. Our Board of Directors adopted a stockholders rights plan on January 21, 2004, pursuant to which we declared a dividend of one right for each share of our common stock outstanding as of May 10, 2004. This rights plan replaced a similar rights plan that had been in effect since our initial public offering in 1995. Unless redeemed by us prior to the time the rights are exercised, upon the occurrence of certain events, the rights will entitle the holders to receive upon exercise thereof shares of our preferred stock, or shares of an acquiring entity, having a value equal to twice the then-current exercise price of the right. The issuance of the rights could have the effect of delaying or preventing a change of control of us.
ITEM 1B. UNRESOLVED STAFF COMMENTS
None.
ITEM 2. PROPERTIES
Our principal corporate and research and development activities are conducted at three buildings we own in Austin, Texas. We own approximately 69 acres of land in north Austin, Texas, on which are a 232,000 square foot office facility, a 140,000 square foot manufacturing and office facility, and a 380,000 square foot research and development facility. We also own a 136,000 square foot office building in Austin, Texas which is being leased to third-parties. We also own a 148,000Our principal manufacturing and distribution activities are conducted at our 239,000 square foot manufacturing and distribution facility in Debrecen, Hungary.Hungary which we own. Our German subsidiary, National Instruments Engineering GmbH & Co. KG, owns a 25,500 square foot office building in Aachen, Germany in which a majority of its activities are conducted. National Instruments Engineering owns another 19,375 square foot office building in Aachen, Germany, which is partially leased to third-parties. We own approximately 17 acres of land in an industrial park in Penang, Malaysia.
As of December 31, 2006,2009, we also leased a number of sales and support offices in the United StatesU. S. and overseas.various countries throughout the world. Our facilities are currently being utilized below maximum capacity to allow for future headcount growth and design/construction cycles.cycles, as needed. We believe our existing facilities are adequate to meet our current requirements.
ITEM 3. LEGAL PROCEEDINGS
We filed a patent infringement action on January 25, 2001, in the U.S. District Court, Eastern District of Texas (Marshall Division) claiming that The MathWorks, Inc. (“MathWorks”) infringed certain of our U.S. patents. On January 30, 2003, a jury found infringement by MathWorks of three of the patents involved and awarded us specified damages. On JuneSeptember 23, 2003, the District Court entered final judgment in favor of us and entered an injunction against MathWorks’ sale of its Simulink and related products and stayed the injunction pending appeal. Upon appeal, the judgment and the injunction were affirmed by the U.S. Court of Appeals for the Federal Circuit (September 3, 2004). Subsequently the stay of injunction was lifted by the District Court. In November 2004, the final judgment amount of $7.4 million which had been held in escrow pending appeal was released to us.
An action was filed by MathWorks against us on September 22, 2004, in the U.S. District Court, Eastern District of Texas (Marshall Division), claiming that on that day MathWorks had released modified versions of its Simulink and related products, and seeking a declaratory judgment that the modified products do not infringe the three patents adjudged infringed in the District Court’sCourt's decision of JuneSeptember 23, 2003 (and affirmed by the Court of Appeals on September 3, 2004). On November 2, 2004, MathWorks served the complaint on us. We filed an answer to MathWorks’ declaratory judgment complaint, denying MathWorks’ claims of non-infringement and alleging our own affirmative defenses. On January 5, 2005, the Court denied a contempt motion by us to enjoin the modified Simulink products under the injunction in effect from the first case. On January 7, 2005, we amended our answer to include counterclaims that MathWorks’ modified products are infringing three of our patents, and requested unspecified damages and an injunction. MathWorks filed its reply to our counterclaims on February 7, 2005, denying the counterclaims and alleging affirmative defenses. On March 2, 2005, we filed a notice of appeal regarding the Court’sCourt's denial of the contempt motion. On March 15, 2005, the Court stayed MathWorks’ declaratory judgment action, pending a decision on the appeal by the Court of Appeals for the Federal Circuit. On February 9, 2006, the Court of Appeals for the Federal Circuit affirmed the District Court’s January 2005 order. On November 22, 2006, the District Court lifted the stay. The case schedule has yet to be set in this action. During the fourth quarter of 2004, we accrued $4 million related to our probable loss from this contingency, which consists entirely of anticipated patent defense costs that are probable of being incurred. In the fourth quarter of 2006, we accrued an additional $600,000 related to this contingency. We charged approximately $57,000 against this accrual duringDuring the fourththird quarter of 2006. We2009, we reduced the accrual by $2 million to reflect a decrease in the estimated costs that are probable of being incurred in this action. To date, we have charged a cumulative total of $602,000$623,000 against this accrual throughaccrual. At December 31, 2006.2009, the remaining accrual was $2 million.
ITEM 4. SUBMISSION OF MATTERS TO A VOTE OF SECURITY HOLDERS
No matter was submitted to a vote of our security holders during the fourth quarter of the fiscal year covered by this report.
PART II
ITEM 5. MARKET FOR THE REGISTRANT’S COMMON EQUITY, RELATED STOCKHOLDER MATTERS AND ISSUER PURCHASES OF EQUITY SECURITIES
Our common stock, $0.01 par value, began trading on The NASDAQ Stock Market (formerly known as the Nasdaq National Market) under the symbol NATI effective March 13, 1995. Prior to that date, there was no public market for our common stock. The high and low closing prices for our common stock, as reported by Nasdaq for the two most recent fiscal years, are as indicated in the following table.High Low 2006 First Quarter 2006 $ 36.28 $ 31.32 Second Quarter 2006 33.67 26.18 Third Quarter 2006 27.89 24.55 Fourth Quarter 2006 31.60 26.63 2005 First Quarter 2005 $ 29.14 $ 24.68 Second Quarter 2005 24.37 20.92 Third Quarter 2005 29.25 21.35 Fourth Quarter 2005 32.74 23.15
High Low 2009 First Quarter 2009 $ 23.40 $ 15.82 Second Quarter 2009 23.61 18.41 Third Quarter 2009 28.42 21.26 Fourth Quarter 2009 29.85 26.52 2008 First Quarter 2008 $ 31.95 $ 24.19 Second Quarter 2008 31.85 25.59 Third Quarter 2008 34.63 25.88 Fourth Quarter 2008 27.99 20.20
At the close of business on February 16, 2007,15, 2010, there were approximately 600473 holders of record of our common stock and approximately 16,00026,500 shareholders of beneficial interest.
We believe factors such as quarterly fluctuations in our results of operations, announcements by us or our competitors, technological innovations, new product introductions, governmental regulations, litigation, changes in earnings estimates by analysts or changes in our financial guidance may cause the market price of our Common Stockcommon stock to fluctuate, perhaps substantially. In addition, stock prices for many technology companies fluctuate widely for reasons that may be unrelated to their operating results. These broad market and industry fluctuations may adversely affect the market price of our Common Stock. We paidcommon stock.
Our cash dividends of $0.06dividend payments for the two most recent fiscal years are indicated in the following table on a per share basis. The dividends were paid on each of February 27, 2006, May 30, 2006, August 28, 2006 and November 27, 2006, and paid cash dividends of $0.05 per share on each of February 25, 2005, May 31, 2005, August 25, 2005 and November 28, 2005. the dates set forth below;
2009 March 2, 2009 $ 0.12 June 1, 2009 0.12 August 31, 2009 0.12 November 30, 2009 0.12 2008 March 3, 2008 $ 0.11 June 2, 2008 0.11 September 2, 2008 0.11 December 1, 2008 0.11
Our policy as to future dividends will be based on, among other considerations, our views on potential future capital requirements related to research and development, expansion into new market areas, investments and acquisitions, share dilution management, legal risks, and challenges to our business model.
See Item 12 for information regarding securities authorized for issuance under our equity compensation plans.
Performance Graph
The following graph compares the cumulative total return to stockholders of NI’s common stock from December 31, 2004 to December 31, 2009 to the cumulative return over such period of (i) Nasdaq Composite Index and (ii) Russell 2000 Index. We use the Russell 2000 Index due to the fact that we have not been able to identify a published industry or line of business index that we believe appropriately reflects our industry or line of business. We considered that our primary competitors are divisions of large corporations that have other significant business operations such that any index comprised of such competitors would not be reflective of our industry or line of business. We have also considered using a peer group index but do not believe such index is appropriate as we have not been able to identify other public companies that we believe are principally in the same line of business as we are.
The graph assumes that $100 was invested on December 31, 2004 in NI’s common stock and in each of the other two indices and the reinvestment of all dividends, if any. Stockholders are cautioned against drawing any conclusions from the data contained therein, as past results are not necessarily indicative of future performance.
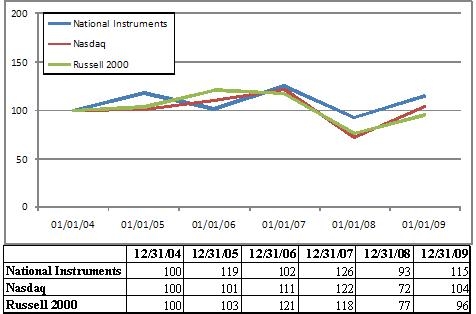
The information contained in the Performance Graph shall not be deemed to be “soliciting material” or to be “filed” with the SEC, nor shall such information be incorporated by reference into any future filing under the Securities Act of 1933, as amended (the “Securities Act”), or the Exchange Act, except to the extent that NI specifically incorporates it by reference into any such filing. The graph is presented in accordance with SEC requirements.
ISSUER PURCHASES OF EQUITY SECURITIESPeriod
Total number of shares
Average
price paid
per share
Total number of
shares purchased as
part of a publicly
announced plan or
program
Maximum number of
shares that may yet
be purchased under
the plan or program
October 1, 2006 to October 31, 2006———3,000,000November 1, 2006 to November 30, 2006———3,000,000December 1, 2006 to December 31, 2006———3,000,000
Total———
Period Total number of shares Average price paid per share Total number of shares purchased as part of a publicly announced plan or program Maximum number of shares that may yet be purchased under the plan or program (1) October 1, 2009 to October 31, 2009 — — — 2,262,168 November 1, 2009 to November 30, 2009 573,841 $ 28.55 573,841 1,688,327 December 1, 2009 to December 31, 2009 — — — 1,688,327 Total 573,841 $ 28.55 573,841
(1) For the past several years, we have maintained various stock repurchase programs. In January 2007, our board of directors approved a new shareThis repurchase plan that increases the aggregate number of shares of common stock that we are authorized to repurchase from 1.5 million to 3.0 million. There is nodoes not have an expiration date for this share repurchase program.date.ITEM 6. SELECTED CONSOLIDATED FINANCIAL DATA
The following selected consolidated financial data should be read in conjunction with theour consolidated financial statements, including the Notes to Consolidated Financial Statements contained in thethis Form 10-K. The information set forth below is not necessarily indicative of the results of our future operations. The information should be read in conjunction with “Management’s Discussion and Analysis of Financial Condition and Results of Operations.”Years Ended December 31,
2006
2005
2004
2003
2002
(in thousands, except per share data)
Statements of Income Data: Net sales: Americas $ 317,780 $ 275,524 $ 243,651 $ 200,210 $ 195,770 Europe 193,364 171,499 164,895 137,761 122,800 Asia Pacific 149,263 124,818 105,542 87,921 72,220
Consolidated net sales 660,407 571,841 514,088 425,892 390,790 Cost of sales 170,326 149,309 135,473 111,672 105,086
Gross profit 490,081 422,532 378,615 314,220 285,704
Operating expenses: Sales and marketing 235,072 211,280 188,727 160,478 145,671 Research and development 113,095 87,841 84,692 70,896 63,964 General and administrative 54,192 45,199 42,500 42,497 35,714
Total operating expenses 402,359 344,320 315,919 273,871 245,349
Operating income 87,722 78,212 62,696 40,349 40,355 Other income (expense): Interest income 6,847 3,758 2,905 2,511 3,295 Net foreign exchange gain (loss) 740 (1,566 ) 1,287 1,125 (724 ) Other income (expense), net (7 ) 276 (2,075 ) 506 692
Income before income taxes 95,302 80,680 64,813 44,491 43,618 Provision for income taxes 22,594 19,163 16,203 11,123 12,213
Net income $ 72,708 $ 61,517 $ 48,610 $ 33,368 $ 31,405
Basic earnings per share $ 0.91 $ 0.78 $ 0.62 $ 0.43 $ 0.41
Weighted average shares outstanding - basic 79,519 78,552 78,680 77,438 76,829
Diluted earnings per share $ 0.89 $ 0.76 $ 0.59 $ 0.41 $ 0.39
Weighted average shares outstanding - diluted 81,519 80,910 82,096 80,946 80,117
Cash dividends paid per common share $ 0.24 $ 0.20 $ 0.18 $ 0.07 $ —
December 31,
2006
2005
2004
2003
2002
(in thousands)
Balance Sheet Data: Cash and cash equivalents $ 100,287 $ 55,864 $ 76,216 $ 53,446 $ 12,840 Short-term investments 150,190 119,846 150,392 141,227 141,038 Working capital 374,512 274,686 309,635 255,330 211,453 Total assets 721,220 608,336 582,093 525,151 458,714 Long-term debt, net of current portion — — — — — Total stockholders' equity 596,682 503,850 486,449 439,452 386,463
Years Ended December 31, 2009 2008 2007 2006 2005 (in thousands, except per share data) Statements of Income Data: Net sales: Americas $ 292,999 $ 355,878 $ 331,482 $ 317,780 $ 275,524 Europe . 210,188 267,373 230,940 193,364 171,499 Asia Pacific 173,407 197,286 177,956 149,263 124,818 Consolidated net sales 676,594 820,537 740,378 660,407 571,841 Cost of sales 169,884 207,109 185,267 173,348 151,939 Gross profit 506,710 613,428 555,111 487,059 419,902 Operating expenses: Sales and marketing 269,267 307,409 264,060 232,050 208,650 Research and development 132,974 143,140 126,515 113,095 87,841 General and administrative 57,938 67,162 62,445 54,192 45,199 Total operating expenses 460,179 517,711 453,020 399,337 341,690 Operating income 46,531 95,717 102,091 87,722 78,212 Other income (expense): Interest income 1,629 5,996 9,822 6,847 3,758 Net foreign exchange gain (loss) 734 (3,737 ) 1,672 740 (1,566 ) Other income (expense), net 1,351 161 (158 ) (7 ) 276 Income before income taxes 50,245 98,137 113,427 95,302 80,680 Provision for income taxes 33,160 13,310 6,394 22,594 19,163 Net income $ 17,085 $ 84,827 $ 107,033 $ 72,708 $ 61,517 Basic earnings per share $ 0.22 $ 1.08 $ 1.35 $ 0.91 $ 0.78 Weighted average shares outstanding - basic 77,520 78,567 79,468 79,519 78,552 Diluted earnings per share $ 0.22 $ 1.07 $ 1.32 $ 0.89 $ 0.76 Weighted average shares outstanding - diluted 78,026 79,515 81,043 81,519 80,910 Cash dividends declared per common share $ 0.48 $ 0.44 $ 0.34 $ 0.24 $ 0.20
December 31, 2009 2008 2007 2006 2005 (in thousands) Balance Sheet Data: Cash and cash equivalents $ 201,465 $ 229,400 $ 194,839 $ 100,287 $ 55,864 Short-term investments 87,196 6,220 93,838 150,190 119,846 Working capital 413,759 398,292 419,874 379,733 274,686 Total assets 813,029 832,591 818,812 721,220 608,336 Long-term debt, net of current portion — — — — — Total stockholders’ equity 654,420 664,438 661,086 596,682 503,850
ITEM 7. MANAGEMENT'SMANAGEMENT’S DISCUSSION AND ANALYSIS OF FINANCIAL CONDITION AND RESULTS OF OPERATIONS
The following “Management’s Discussion and Analysis of Financial Condition and Results of Operations” contains forward-looking statements within the meaning of Section 27A of the Securities Act of 1933 and Section 21E of the Securities Exchange Act of 1934. Any statements contained herein regarding our future financial performance or operations (including, without limitation, statements to the effect that we “believe,” “expect,” “plan,” “may,” “will,” “project,” “continue,” or “estimate” or other variations thereof or comparable terminology or the negative thereof) should be considered forward-looking statements. Actual results could differ materially from those projected in the forward-looking statements as a result of a number of important factors including those set forth under the heading “Risk Factors”“Risk Factors” beginning on page 8,10, and elsewhere in this Form 10-K. Although we believe that the expectations reflected in the forward-looking statements are reasonable, we cannot guarantee future results, levels of activity, performance or achievements. You should not place undue reliance on these forward-looking statements. We disclaim any obligation to update information contained in any forward-looking statement.
Overview
National Instruments designs, develops, manufactures and markets instrumentationCorporation (“we”, “us” or “our”) is a leading supplier of measurement and automation softwareproducts that engineers and hardware for general commercial, industrial and scientific applications. We offer hundredsscientists use in a wide range of products used to create virtual instrumentation systems for measurement and automation. We have identifiedindustries. These industries comprise a large and diverse market for design, control and test applications. We provide flexible application software and modular, multifunctional hardware that users combine with industry-standard computers, networks and third party devices to create measurement, automation and embedded systems, which we also refer to as “virtual instruments”. Our products are used in a variety of applications from researchapproach gives customers the ability to quickly and development to production testing, monitoringcost-effectively design, prototype and industrial control.deploy unique custom-defined solutions for their design, control and test application needs. We sell to a large number of customers in a wide variety of industries. No single customer accounted for more than 3% of our sales in 2006, 20052009, 2008 or 2004.2007.
The key strategies that management focuses on in running our business are the following:
Expanding our broad customer base:base
We strive to increase our already broad customer base by serving a large market on many computer platforms, through a global marketing and distribution network. We also seek to acquire new technologies and expertise from time to time in order to open up new opportunities for our existing product portfolio. While we continue our efforts to expand our customer base, we are also benefiting from our efforts in increasing order size from both new and existing customers.
Maintaining a high level of customer satisfaction:satisfaction
To maintain a high level of customer satisfaction we strive to offer innovative, modular and integrated products through a global sales and support network. We strive to maintain a high degree of backwards compatibility across different platforms in order to preserve the customer’s investment in our products. In this time of intense global competition, we believe it is crucial that we continue to offer products with quality and reliability, and that these products provide cost-effective solutions for our customers.
Leveraging external and internal technology:technology
Our product strategy is to provide superior products by leveraging generally available technology, supporting open architectures on multiple platforms and by leveraging our core technologies such as custom ASICs (application-specificapplication specific integrated circuits)circuits (“ASICs”) across multiple products.
We sell into the test and measurement (“T&M”) and the industrial automation (“IA”)industrial/embedded applications in a broad range of industries and as such are subject to the economic and industry forces which drive those markets. It has been our experience that the performance of these industries and our performance is impacted by general trends in industrial production for the global economy and by the specific performance of certain vertical markets that are intensive consumers of measurement technologies. Examples of these markets are semiconductor capital equipment, telecom, defense, aerospace, automotive and others. In assessing our business, our management considerswe consider the trends in the Global Purchasing Managers Index (published(“PMI”) published by JP Morgan),Morgan, global industrial production as well as industry reports on the specific vertical industries mentioned earlier.that we target. Starting in August 2009, the PMI has had readings above 50 which are indicative of expansion in the industrial global economy. However, we believe there is still a substantial amount of uncertainty about the global industrial economic conditions. We are unable to predict whether the current expansion cycle, as measured by the PMI, will be sustained throughout 2010. This continuing uncertainty in the global industrial economy is likely to continue to have an adverse effect on the spending patterns of businesses including our current and potential customers which could adversely affect our revenues and therefore harm our business and result of operations.
We distribute our software and hardware products primarily through a direct sales organization. We also use independent distributors, OEMs, VARs, system integrators and consultants to market and sell our products. We have sales offices in the United StatesU.S. and sales offices and distributors in key international markets. Sales outside of the Americas accounted for approximately 52%57%, 52%57% and 53% of55% or our revenues in 2006, 2005,2009, 2008 and 2004,2007, respectively. The vast majority of our foreign sales are denominated in the customers’ local currency, which exposes us to the effects of changes in foreign-currencyforeign currency exchange rates. We expect that a significant portion of our total revenues will continue to be derived from international sales. See (See Note 12 – Segment information of Notes to Consolidated Financial Statements for details concerning the geographic breakdown of our net sales, operating income, interest income and identifiable assets.long-lived assets).
We manufacture a substantial majority of our products at our facilityfacilities in Debrecen, Hungary. Additional production primarily of low volume or newly introduced products is done in Austin, Texas. Our product manufacturing operations can be divided into four areas: electronic circuit card and module assembly; chassis and cable assembly; technical manuals and product support documentation; and software duplication. We manufacture most of the electronic circuit card assemblies, modules and chassismodules in-house, although subcontractors are used from time to time. Beginning in 2005, some chassis have been produced byWe currently use subcontractors in Asia.Asia to manufacture a significant portion of our chassis but we review these arrangements periodically. We manufacture some of our electronic cable assemblies in-house, but many assemblies are produced by subcontractors. We primarily subcontract our software duplication, our technical manuals and product support documentation.
We believe that our long-term growth and success depends on delivering high quality software and hardware products on a timely basis. Accordingly, we focus significant efforts on research and development. We focus our research and development efforts on enhancing existing products and developing new products that incorporate appropriate features and functionality to be competitive with respect to technology, price and price/performance. Our success also is dependantdependent on our ability to obtain and maintain patents and other proprietary rights related to technologies used in our products. We have engaged in litigation and where necessary, will likely engage in future litigation to protect our intellectual property rights. In monitoring and policing our intellectual property rights, we have been and may be required to spend significant resources.
We have been profitable in every year since 1990. However, there can be no assurance that our net sales will grow or that we will remain profitable in future periods. Our operating results fluctuate from period to period due to changes in global economic conditions and a number of other factors. As a result, we believe historical results of operations should not be relied upon as indications of future performance.
Results of Operations
The following table sets forth, for the periods indicated, the percentage of net sales represented by certain items reflected in our consolidated statementsConsolidated Statements of income:Years Ended December 31,
2006
2005
2004
Net sales: Americas 48.1 % 48.2 % 47.4 % Europe 29.3 30.0 32.1 Asia Pacific 22.6 21.8 20.5
Consolidated net sales 100.0 100.0 100.0 Cost of sales 25.8 26.1 26.4
Gross profit 74.2 73.9 73.6 Operating expenses: Sales and marketing 35.6 36.9 36.7 Research and development 17.1 15.4 16.4 General and administrative 8.2 7.9 8.3
Total operating expenses 60.9 60.2 61.4
Operating income 13.3 13.7 12.2 Other income (expense): Interest income 1.0 0.7 0.5 Net foreign exchange gain (loss) 0.1 (0.3 ) 0.3 Other income (expense), net — — (0.4 )
Income before income taxes 14.4 14.1 12.6 Provision for income taxes 3.4 3.3 3.1
Net income 11.0 % 10.8 % 9.5 %
Income:
Years Ended December 31, 2009 2008 2007 Net sales: Americas 43.3 % 43.4 % 44.8 % Europe 31.1 32.6 31.2 Asia Pacific 25.6 �� 24.0 24.0 Consolidated net sales 100.0 100.0 100.0 Cost of sales 25.1 25.2 25.0 Gross profit 74.9 74.8 75.0 Operating expenses: Sales and marketing 39.8 37.5 35.7 Research and development 19.6 17.4 17.1 General and administrative 8.6 8.2 8.4 Total operating expenses 68.0 63.1 61.2 Operating income 6.9 11.7 13.8 Other income (expense): Interest income 0.2 0.7 1.3 Net foreign exchange gain (loss) 0.1 (0.5 ) 0.2 Other income (expense), net 0.2 — — Income before income taxes 7.4 11.9 15.3 Provision for income taxes 4.9 1.6 0.8 Net income 2.5 % 10.3 % 14.5 %
Net Sales.In 2006, consolidatedSales. Consolidated net sales were $660.4$677 million, $821 million and $740 million for the years ended December 31, 2009, 2008 and 2007, respectively, a 15%decrease of 18% in 2009 compared to 2008 following an increase of 11% in 2008 compared to 2007. The decrease in 2009 can be attributed to declines in sales volume across all regions of our business. Instrument control products which comprised approximately 7% of our revenues for the year ended December 31, 2009, saw a year-over-year decline of 31%. Products in the areas of virtual instrumentation and graphical system design which comprised approximately 93% of our revenues for the year ended December 31, 2009, saw a year-over-year decline of 16%. Revenues from our instrument control products are the level achievedmost sensitive to the cycles of the global industrial economy. For the year ended December 31, 2009, our order backlog increased by approximately $8 million. Backlog is a measure of orders that were received but that had not shipped to customers at the end of the quarter. We did not take any significant action with regard to pricing during the year ended December 31, 2009, and thus, the decrease in 2005, which followed anrevenues is attributable to a decrease in customer orders. The increase in net sales of 11% in 2005 from the level achieved in 2004. The increase in sales in 20062008, compared to 2005 was primarily attributable2007 can be attributed to volume growth in the introductionareas of newmodular instruments, particularly RF test products, PXI, software and upgraded products, an increased market acceptance of our productsCompactRIO which performed very well in all regions and the current year impact of prior year acquisitions. The increase in sales in 2005 compared to 2004 was primarily attributable to the introduction of new and upgraded products, the increase in unit volume from the increased market acceptance of our products in all regions and the strengthlight of the Euro.industry contraction. The increases in these areas were offset by declines in revenue from instrument control products which are the most sensitive to downturns in the Global PMI.
Sales in the Americas increased $42.3were $293 million, or 15%, to $317.8$356 million and $331 million for the years ended December 31, 2009, 2008 and 2007, respectively, a decrease of 18% in 20062009 compared to 2005, which followed a 13%2008 following an increase in 2005 over 2004 levels. The increasesof 8% in sales in the Americas in 2006 and 2005 were attributable2008 compared to an increased market acceptance of our products and from revenue of $34.4 million and $21.9 million, respectively, from acquired companies. (See Note 15 of Notes to Consolidated Financial Statements for a description of acquisitions).2007. Sales outside of the Americas, as a percentage of consolidated sales were 57%, 57% and 55% for 2006, remained flat at 52% with 2005. European revenue was $193.4the years ended December 31, 2009, 2008 and 2007, respectively. Sales in Europe were $210 million, $267 million and $231 million for the years ended December 31, 2009, 2008 and 2007, respectively, a decrease of 21% in 2006,2009 compared to 2008 following an increase of 13% from 2005,16% in 2008 compared to 2007. Sales in Asia were $173 million, $197 million and $178 million for the years ended December 31, 2009, 2008 and 2007, respectively, a decrease of 12% in 2009 compared to 2008 following a 4%an increase of 11% in 2005 from 2004. Asia Pacific revenue grew 20%2008 compared to $149.3 million in 2006, which followed an 18% increase in 2005 over 2004 levels.2007. We expect sales outside of North Americathe Americas to continue to represent a significant portion of our revenue. We intend to continue to expand our international operations by increasing our presence in existing markets, adding a presence in some new geographical markets and continuing the use of distributors to sell our products in some countries.
Almost all sales made by our direct sales offices in the Americas, outside of the U.S., in Europe and in Asia Pacific are denominated in local currencies, and accordingly, the U.S. dollar equivalent of these sales is affected by changes in the foreign currency exchange rates. Between 2006 and 2005,For 2009, net of hedging results, the change in the exchange rates had the effect of decreasing our consolidated sales by 0.5%$29 million or 4%, decreasing America’s sales by $6 million or 2%, decreasing European sales by 3%$17 million or 6%, and had no material effect ondecreasing sales in Asia Pacific. The increase in sales in Europe and Asia was the resultPacific by $6 million or 3% compared to 2008. For 2008, net of the change in exchange rates and the increase in local currency product pricing in each region. Since most of our international operating expenses are also incurred in local currencies,hedging results, the change in exchange rates had the effect of decreasing operating expenses $1.5increasing our consolidated sales by $34 million or 0.4%4%, in 2006,increasing America’s sales by $1.7 million or 0.5%, increasing European sales by $28 million or 12%, and increasing operating expenses $4.2sales in Asia Pacific by $4.3 million or 1.2% in 2005, and $4.4 million, or 1.4%, in 2004.2% compared to 2007.
Gross Profit.Profit.As a percentage of sales, gross profitmargin was 74%75% in each of 2006, 2005,2009, 75% in 2008 and 2004. Our75% in 2007. In 2009, we were successful in implementing cost reduction strategies throughout our manufacturing cycle which allowed us to maintain a stable gross margin percentage despite the 18% decrease in 2006 remained flat with 2005 primarily becausesales volume in 2009. For the favorableyears ended December 31, 2009, 2008 and 2007, charges related to acquisition related intangibles and stock based compensation were $4.7 million, $4.7 million and $3.6 million, respectively. For the years ended December 31, 2009 and 2008, the net impact of higher sales volume and improved product margins resulting from both price increases and cost reductions on certain products were offset entirely by the negative impact of unfavorablechange in foreign currency exchange rates had the expensingeffect of stock-based compensation, the increase in the amortizationdecreasing our cost of acquisition intangiblesgoods sold by $3 million or 1%, and the write-off in the first quarterincreasing our cost of 2006 of some capitalized facility costs due to the continued transition of production to our manufacturing facility in Hungary. Our gross margin in 2005 remained flat with 2004 primarily because the favorable impacts of foreign currency exchange rates and higher sales volume were offsetgoods sold by the reduced margins realized on product lines from acquired companies as well as the impact of the amortization of acquisition related intangibles and a reduction of selling prices of some of our products. There can be no assurance that we will maintain our historical margins. We believe our current manufacturing capacity is adequate to meet current needs.$1.1 million or 4%, respectively.
Sales and Marketing.Marketing.Sales and marketing expenseexpenses were $269 million, $307 million and $264 million for the years ended December 31, 2009, 2008 and 2007, respectively, a decrease of 12% in 2006 increased2009 compared to $235.1 million, an 11% increase from 2005,2008 following an increase of 12%16% in 2005 over 2004. Sales2008 compared to 2007. As a percentage of net sales, sales and marketing expenseexpenses were 40%, 38% and 36% for 2009, 2008 and 2007, respectively. For 2009, the increase in sales and marketing expenses as a percentage of revenue was 36%due to the 18% decrease in 2006, down from 37%revenue. For 2009, the decrease in 2005sales and 2004. Approximately 84%marketing expenses in absolute dollars was due to a decrease in travel, tradeshows and advertising of $15 million, a decrease in variable compensation of $4.2 million and a decrease caused by the net impact of changes in foreign currency exchange rates of $9 million. Temporary cost cutting measures which included a company-wide wage reduction as well as a reduction in the number of accrued vacation hours that employees are allowed to carry beyond December 31, 2009, resulted in additional cost savings of $7 million compared to 2008. For 2008, the increase in sales and marketing expense, both in 2006 comparedabsolute dollars and as a percentage of sales, was consistent with our plan to 2005 is attributablemake additional investments in our field sales force during 2008. Approximately 65% of the increase in 2008 over 2007, can be attributed to the increase in sales and marketing personnel, costs due to the increaseincreases in salesstock-based compensation and marketing personnel, the increase in variable compensation from higher sales volume and fromvolume. In addition, during 2008, the net impact of foreign currency exchange rates had the expensingeffect of stock-based compensation. Approximately 60% of the increase inincreasing our sales and marketing expensesexpense by $10 million or 3%. We plan to continue to make additional investments in 2005 compared to 2004 is attributable to the increaseour field sales force in sales and marketing personnel costs,2010. However, due to the increasecontinuing uncertainty in the industrial economy, the extent of our field sales and marketing personnel, the increaseexpansion during 2010 will be dependent on our overall sales volumes in variable compensation from higher sales volume and from the effects of the change in currency exchange rates, with the remaining fraction of the increase attributable to increases in advertising, tradeshows and special events.2010. We expect sales and marketing expenses in future periods to increase in absolute dollars, andcontinue to fluctuate as a percentage of sales based on recruiting, marketing and advertising campaign costs associated with major new product releases and entry into new market areas, investment in web sales and marketing efforts, increasing product demonstration costs and the timing of domestic and international conferences and trade shows.
Research and Development.Development.Research and development expenses were $133 million, $143 million and $127 million for the years ended December 31, 2009, 2008 and 2007, respectively, a decrease of 7% in 2006 increased 29%2009 compared to 20052008 following an increase of 4%13% in 2005 over 2004. Research2008 compared to 2007. As a percentage of net sales, research and development expenseexpenses were 20%, 17% and 17% for 2009, 2008 and 2007, respectively. For 2009, the increase in research and development expenses as a percentage of revenue was 17.1%due to the 18% decrease in 2006, up from 15.4%revenue. For 2009, the decrease in 2005research and 16.4%development expenses in 2004. Theabsolute dollars was due to a decrease in variable compensation of $2.9 million and a decrease caused by the net impact of changes in foreign currency exchange rates of $327,000. Temporary cost cutting measures which included a company-wide wage reduction as well as a reduction in the number of accrued vacation hours that employees were allowed to carry beyond December 31, 2009, resulted in additional cost savings of $7 million. These decreases were offset by personnel costs related to a net headcount increase of 42 people during 2009. For 2008, the increase in research and development costs in 2006expenses in absolute dollars and as a percentage of revenue was primarily due to increases in personnel costs from the hiring of additional product development engineers and from the impact of the expensing ofas well as increases related to stock-based compensation and fromwas consistent with our plan to continue to grow our research and development capacity in line with the decreaseoverall revenue growth of the company. During 2008, we had a net headcount increase of 109 people in our worldwide research and development group. In addition, during 2008, the capitalizationnet impact of software development costs. The decrease inforeign currency exchange rates had the effect of increasing our research and development expense as a percentage of revenue in 2005 compared to 2004 was primarily due to the increase in the capitalization of software development costs. The increase in research and development expense in absolute dollars in 2005 was primarily due to increases in personnel costs from the hiring of additional product development engineers, which was partially offset by the decrease in expense from the increase in the capitalization of software development costs. Research and development personnel increased from 1,036 at December 31, 2005 to 1,122 at December 31, 2006.$2.7 million or 2%. We plan to continue making a significant investmentto make additional investments in research and development in order2010. However, due to remain competitivethe continuing uncertainty in the industrial economy, the extent of our research and support revenue growth.development expansion during 2010 will be dependent on our overall sales volumes in 2010.
We capitalize software development costs in accordance with Statement ofthe Financial Accounting Standards (“SFAS”) 86, “Accounting for the Costs of Computer Board (FASB) Accounting Standards Codification (ASC) 985, Software to be Sold, Leased, or Otherwise Marketed.” (FASB ASC 985). We amortize such costs over the related product’s estimated economic useful life, generally three years, beginning when a product becomes available for general release. Software amortization expense included in cost of goods sold totaled $9.1$9 million, $7.2$10 million and $6.6$9 million during 2006, 20052009, 2008 and 2004,2007, respectively. Internally developed software costs capitalized during such years2009, 2008 and 2007 were $7.4$13 million, $13.4$10 million and $5.0$8 million, respectively. Capitalization of internally developed software costs varies depending on the timing of when each project reaches technological feasibility and the length and scope of the development cycle of each individual project. (See Note 57 - Intangibles of Notes to Consolidated Financial Statements for a description of intangibles.)intangibles).
General and Administrative.Administrative.General and administrative expenses were $58 million, $67 million and $62 million for the years ended December 31, 2009, 2008 and 2007, respectively, a decrease of 13% in 2006 increased 20%2009 compared to 2005,2008 following an increase of 6%8% in 2005 over 2004. The 20% increase in2008 compared to 2007. As a percentage of net sales, general and administrative expenses were 9%, 8% and 8% in 2006 from 2005 was primarily attributable to increases in personnel costs from both2009, 2008 and 2007. For 2009, the increase in international general and administrative personnel and the impact of the expensing of stock-based compensation, and the effect of decreased litigation costs in the prior year, primarily from the reversal of previously accrued estimated patent defense costs associated with the SoftWIRE legal matter which resulted in a gain of $1.9 million in 2005. The 6% increase in general and administrative expenses in 2005 from the prior year period was primarily due to the litigation settlement in 2004 which resulted in the $6.0 million net gain in 2004 from the judgment award against The MathWorks, Inc. (See Note 14 of Notes to Consolidated Financial Statements.) General and administrative expenses as a percentage of revenue increasedwas due to 8.2% during 2006 from 7.9% during 2005.the 18% decrease in revenue. For 2009, the decrease in general and administrative expenses was due to a decrease caused by the net impact of changes in foreign currency exchange rates of $2.6 million, a reduction of our patent litigation accrual which resulted in a non-cash decrease to our operating expenses of $2 million and a decrease in variable compensation of $948,000. Temporary cost cutting measures which include a company-wide wage reduction as well as a reduction in the number of accrued vacation hours that employees are allowed to carry beyond December 31, 2009, resulted in additional cost savings of $1.8 million. For 2008, the increase in absolute dollars compared to 2007 can primarily be attributed to the net impact of foreign currency exchange rates which had the effect of increasing our general and administrative expense by $2.4 million or 4%. We expect that general and administrative expenses in future periods will fluctuate in absolute amountsdollars and as a percentage of revenue.
Interest Income.Income.Interest income increased 82%was $1.6 million, $6 million and $10 million for the years ended December 31, 2009, 2008 and 2007, respectively, a decrease of 73% in 2006 from 2005, which followed an increase2009 compared to 2008 following a decrease of 29%40% in 2005 from 2004. The increase2008 compared to 2007. For 2009, the decrease is attributable to significant decreases in investment yields for high grade treasury, municipal and corporate bonds. For 2008, the decrease is attributable to a decrease in invested funds as well as to the rapid rate of decrease in interest income in 2006 was due to higher yields on larger invested funds. The increase in interest income in 2005 versus 2004 was due to higher yields.rates during the second half of 2008. The primary source of interest income is from the investment of our cash and short-term investments. Net cash provided by operating activities totaled $97.9 million and $88.1 million in 2006 and 2005, respectively.
Net Foreign Exchange Gain (Loss). We experienced net Net foreign exchange gains of $740,000 in 2006, compared to losses of $1.6gain (loss) was $734,000, $(3.7) million in 2005 and gains of $1.3$1.7 million in 2004.for the years ended December 31, 2009, 2008 and 2007, respectively. These results are attributable to movements in the foreign currency exchange rates between the U.S. dollar and the localforeign currencies in countries in whichwhere our sales subsidiaries are located.functional currency is not the U.S. dollar. We recognize the local currency as the functional currency in virtually all of our international subsidiaries.
We utilize foreign currency forward contracts to hedge our foreign denominated net foreign currency balance sheet positions to protect against the change in value caused by a majorityfluctuation in foreign currency exchange rates. We typically hedge up to 90% of our outstanding foreign currency-denominated receivables in order to reduce our exposure to significant foreign currency fluctuations. Wedenominated net receivable or payable positions and typically limit the duration of our “receivables”these foreign currency forward contracts to approximately 90 days. We also utilize The gain or loss on these derivatives as well as the offsetting gain or loss on the hedge item attributable to the hedged risk is recognized in current earnings under the line item “net foreign exchange gain (loss)”. Our hedging strategy reduced our foreign exchange gains by $1.7 million in 2009, reduced our foreign exchange losses by $1.2 million in 2008 and reduced our foreign exchange gains by $1.1 million in 2007.
To protect against the change in the value caused by a fluctuation in foreign currency exchange rates of forecasted foreign currency cash flows resulting from international sales and expenses over the next one to two years, we have instituted a foreign currency cash flow hedging program. We hedge portions of our forecasted revenue and forecasted expenses denominated in foreign currencies with forward and option contracts. For forward contracts, andwhen the dollar strengthens significantly against the foreign currency purchased option contractscurrencies, the change in order to reduce our exposure to fluctuations inthe present value of future foreign currency cash flows. We purchase theseflows may be offset by the change in the fair value of the forward contracts for up to 100%designated as hedges. For purchased option contracts, when the dollar strengthens significantly against the foreign currencies, the change in the present value of our forecastedfuture foreign currency cash flows may be offset by the change in selected currencies (primarily the euro, yen and pound sterling) and limitfair value of the durationoption contracts designated as hedges, net of these contracts to 40 months.the premium paid. Our foreign currency purchased option contracts are purchased “at-the-money” or “out-of-the-money.” We purchase foreign currency forward and option contracts for up to 100% of our forecasted exposures in selected currencies (primarily in Euro, Japanese yen, British pound sterling and Hungarian forint) and limit the duration of these contracts to 40 months or less. As a result, our hedging activities only partially address our risks infrom foreign currency transactions, and there can be no assurance that this strategy will be successful. We do not invest in contracts for speculative purposes. (See Note 114 - Derivative instruments and hedging activities of Notes to Consolidated Financial Statements for a description of our forward and purchased option contracts and hedged positions.) Our hedging strategy reduced our foreign exchange gains for December 31, 2006 by $1.0 million and reduced our foreign exchange loss for December 31, 2005 by $2.2 million.positions).
Other Income (Expense), Net. We established a valuation reserve in the fourth quarter of 2004 for the estimated total impairment of a $2.5 million cost-method investment.Provision for Income Taxes.Our provision for income taxes reflectsreflected an effective tax rate of 24%66%, 14% and 6% for the years ended December 31, 2009, 2008 and 2007, respectively. The increase in 2006 and 2005 and 25% in 2004. Ourour effective tax rate is lower thanin 2009 compared to 2008 was driven by changes in our valuation allowances, tax charges related to inter-company profits and an increase in equity compensation expense as a percentage of pre-tax book income. (See Note 9 – Income taxes of Notes to Consolidated Financial Statements for further discussion regarding changes in our effective tax rate and a reconciliation of income taxes at the U.S. federal statutory income tax rate of 35% primarily as a result of the extraterritorial income exclusion, tax-exempt interest and reducedto our effective tax rates in certain foreign jurisdictions. The decreases in our tax rate in 2006 and 2005 from 2004 are due to increased profits in foreign jurisdictions with reduced income tax rates.rate).
Liquidity and Capital Resources
Working Capital, Cash and Cash Equivalents, Short-term Investments and Long-term Investments. We currently finance The following table presents our working capital, cash and cash equivalents and marketable securities (in thousands):
December 31,2009 December 31,2008 Increase/(Decrease) Working capital $ 413,759 $ 398,292 $ 15,467 Cash and cash equivalents (1) 201,465 229,400 (27,935 ) Short-term investments (1) 87,196 6,220 80,976 Long-term investments — 10,500 (10,500 ) Total cash, cash equivalents, short and long-term investments $ 288,661 $ 246,120 $ 42,541
(1)Included in working capital
Our working capital increased by $15 million during the year ended December 31, 2009 compared to December 31, 2008, due to cash provided by operations offset by repurchases of shares of our common stock, dividend payments and capital expenditures throughexpenditures.
Our cash flow from operations. At December 31, 2006, we had working capitaland cash equivalent balances are held in numerous financial institutions throughout the world, including substantial amounts held outside of approximately $374.5 million comparedthe U.S.; however, the majority of our cash and investments that are located outside of the U.S. are denominated in the U.S. dollar. Most of the amounts held outside of the U.S. could be repatriated to $274.7the U.S., but under current law, would be subject to U.S. federal income taxes, less applicable foreign tax credits. In some countries repatriation of certain foreign balances is restricted by local laws. We have provided for the U.S. federal tax liability on these amounts for financial statement purposes, except for foreign earnings that are considered indefinitely reinvested outside of the U.S. Repatriation could result in additional U.S. federal income tax payments in future years. We utilize a variety of tax planning and financing strategies with the objective of having our worldwide cash available in the locations in which it is needed.Cash Provided and (Used) in 2009 and 2008. Cash and cash equivalents decreased to $201 million at December 31, 2005. Net2009 from $229 million at December 31, 2008. The following table summarizes the proceeds and (uses) of cash (in thousands):
December 31, 2009 2008 Cash provided by operating activities $ 135,651 $ 121,818 Cash (used in)/provided by investing activities (111,915 ) 18,756 Cash (used in) financing activities (51,671 ) (106,013 ) Net (decrease)/increase in cash equivalents (27,935 ) 34,561 Cash and cash equivalents at beginning of year 229,400 194,839 Cash and cash equivalents at end of year $ 201,465 $ 229,400
Our operating activities provided $136 million and $122 million for the years ended December 31, 2009 and 2008, respectively, a 11% increase. For 2009, cash provided by operating activities was the result of $17 million of net income, $77 million in 2006, 2005net non-cash operating expenses which consisted of depreciation and 2004 totaled $97.9amortization, stock-based compensation, benefits from deferred income taxes, and by $41 million $88.1in net cash provided by changes in operating assets and liabilities, principally a $18 million decrease in accounts receivable, a $21 million decrease in inventories and $65.6a $13 million respectively.decrease in prepaid expenses and other assets, offset by a decrease of $10 million in accounts payable, taxes and other liabilities. In 2008, cash provided by operating activities was primarily the result of $84.8 million in net income and $51.3 million in net non-cash operating expenses which primarily consisted of depreciation and amortization, stock-based compensation, and benefits from deferred income taxes, offset in part by $14.3 million in net cash used by changes in operating assets and liabilities, principally a $24.6 million increase in inventory.
Accounts receivable increaseddecreased to $117.2$104 million at December 31, 20062009 from $95.7$122 million at December 31, 2005,2008, as a result of higherlower sales levelsvolumes during 2009. This decrease in the fourth quarter of 2006 compared to the fourth quarter of 2005. Daysrevenue also caused our days sales outstanding at December 31, 2006 increased to 59 days from 55increase to 61 days at December 31, 2005. 2009, compared to 57 days at December 31, 2008. We typically bill customers on an open account basis subject to our standard net thirty day payment terms. If, in the longer term, our revenue increases, it is likely that our accounts receivable balance will also increase. Our accounts receivable could also increase if customers delay their payments or if we grant extended payment terms to customers, both of which are more likely to occur during challenging economic times when our customers may face issues gaining access to sufficient funding or credit.
Consolidated inventory balances have increaseddecreased to $77.1$87 million at December 31, 20062009 from $62.8$107 million at December 31, 2005.2008. Inventory turns decreased to 2.41.8 per year for 2006 from 2.7at December 31, 2009 compared to 2.1 per year for 2005.at December 31, 2008. The increasedecrease in inventory in 2006during 2009 was principally to support the transfer of one of our two remaining Austin based production lines todriven by a reduction in our manufacturing facilityactivities in Hungary. The additionalresponse to the decreased demand for our products. Our inventory is intended aslevels will continue to be determined based upon our anticipated demand for products and our need to keep sufficient inventory on hand to meet our customers’ demands. We attempt to balance such considerations against the risk of obsolescence or potentially excess inventory levels. Rapid changes in industrial demand could have a buffer to support continued production as bothsignificant impact on our inventory balances in future periods.
Investing activities used cash of $112 million during 2009, which was the capital equipment andresult of the inventory needed to support its operation were physically moved to Hungary in September 2006. Cash used in 2006 fornet purchase of short-term investments of $74 million, the purchase of property and equipment totaled $18.5of $21 million, for the capitalization of internally developed software costs totaled $7.4of $13 million and for additions tothe acquisition of other intangibles totaled $3.1of $5 million. Cash used in 2005 for acquisitions totaled $63.9For 2008, investing activities provided cash of $19 million forwhich was primarily the result of the net sale of $77 million of short-term investments, offset by the purchase of property and equipment totaled $15.4of $26 million, fora net cash payment of $17 million related to the acquisition of microLEX Systems ApS (see Note 15 - Acquisitions of Notes to Consolidated Financial Statements), capitalization of internally developed software costs totaled $13.4of $10 million and for additions tothe acquisition of other intangibles totaled $4.3of $3 million. Cash
Financing activities used in 2004 for$52 million during 2009, which was the purchaseresult of property$35 million used to repurchase our common stock and equipment totaled $12.6$37 million for the capitalizationused to pay dividends to our shareholders, offset by $22 million received as a result of internally developed software costs totaled $5.0 million and for additions to other intangibles totaled $3.1 million. Cash provided by the issuance of our common stock totaled $37.1from the exercise of stock options and sales of our common stock through our employee stock purchase plan. For 2008, financing activities used $106 million $23.2which was the result of $104 million used to repurchase our common stock and $16.8$35 million used to pay dividends to our shareholders, offset by $31 million received as a result of the issuance of our common stock from the exercise of stock options and our employee stock purchase plan.
From time to time our Board of Directors has authorized various programs to repurchase shares of our common stock depending on market conditions and other factors. Under such programs, we repurchased a total of 1,443,441, 4,110,042 and 2,730,125 shares of our common stock at weighted average prices of $23.96, $25.22 and $29.20 per share, in 2006, 2005the years ended December 31, 2009, 2008 and 2004, respectively, and cash used for payment2007, respectively.
On January 23, 2009, our Board of dividends totaled $19.0 million, $15.8 million and $14.5 million in 2006, 2005 and 2004, respectively. The issuanceDirectors approved a new share repurchase plan which increased the aggregate number of shares of common stock wasthat we are authorized to repurchase from 591,324 to 3.0 million. At December 31, 2009, there were 1,688,327 shares remaining available for repurchase under this plan. This repurchase plan does not have an expiration date.
During 2009, we received reduced proceeds from the exercise of stock options compared to 2008. The timing and number of stock option exercises and the amount of cash proceeds we receive through those exercises are not within our control, and in the future we may not generate as much cash from the exercise of stock options as we have in the past. Moreover, it is now our practice to issue restricted stock units and not stock options to eligible employees under our Employee Stock Purchase Plan, our 1994 Incentive Plan and our 2005 Incentive Plan.which will reduce the number of stock options available for exercise in the future. Unlike the exercise of stock options, the issuance of shares upon vesting of restricted stock units does not result in any cash proceeds to us.
Contractual Cash used for the repurchase of common stock totaled $16.5 million, $49.5 million and $16.1 million in 2006, 2005 and 2004, respectively.Obligations.
The following summarizes our contractual cash obligations as of December 31, 20062009 (in thousands):Payments Due by Period
Total
2007
2008
2009
2010
2011
Beyond
Long-term debt $ — $ — $ — $ — $ — $ — $ — Capital lease obligations — — — — — — — Operating leases 23,691 7,241 5,682 4,883 3,103 1,983 799 Other long-term obligations — — — — — — —
Total contractual cash obligations $ 23,691 $ 7,241 $ 5,682 $ 4,883 $ 3,103 $ 1,983 $ 799
Payments Due by Period Total 2010 2011 2012 2013 2014 Beyond Long-term debt $ — $ — $ — $ — $ — $ — $ — Capital lease obligations — — — — — ��� — Operating leases 51,701 14,415 9,898 6,982 4,611 3,665 12,130 Total contractual cash obligations $ 51,701 $ 14,415 $ 9,898 $ 6,982 $ 4,611 $ 3,665 $ 12,130
The following summarizes our other commercial commitments as of December 31, 20062009 (in thousands):Total
2007
2008
2009
2010
2011
Beyond
Guarantees $ 3,500 $ 3,500 $ — $ — $ — $ — $ — Purchase obligations 7,004 7,004 — — — — —
Total commercial commitments $ 10,504 $ 10,504 $ — $ — $ — $ — $ —
Total 2010 2011 2012 2013 2014 Beyond Guarantees $ 5,200 $ 5,200 $ — $ — $ — $ — $ — Purchase obligations 6,500 6,500 — — — — — Total commercial commitments $ 11,700 $ 11,700 $ — $ — $ — $ — $ —
We currently expecthave commitments under non-cancelable operating leases primarily for office facilities throughout the world. Certain leases require us to fund expenditures for capital requirements as well as liquidity needs created by changes in working capital from a combination of available cashpay property taxes, insurance and short-term investment balancesroutine maintenance, and internally generated funds.include escalation clauses. As of December 31, 2006 and 2005, we had no debt outstanding. We believe that our cash flow from operations and existing cash balances and short-term investments will be sufficient to meet our cash requirements for at least the next twelve months. Cash requirements for periods beyond the next twelve months will depend on our profitability, our ability to manage working capital requirements and our rate of growth. Financial Risk Management
Our international sales are subject to inherent risks, including fluctuations in local economies; difficulties in staffing and managing foreign operations; greater difficulty in accounts receivable collection; costs and risks of localizing products for foreign countries; unexpected changes in regulatory requirements, tariffs and other trade barriers; difficulties in the repatriation of earnings and burdens of complying with a wide variety of foreign laws. The vast majority of our sales outside of North America are denominated in local currencies, and accordingly, we are subject to the risks associated with fluctuations in currency rates. In particular, increases in the value of the dollar against foreign currencies decrease the U.S. dollar value of foreign sales requiring that we either increase our price in the local currency, which could render our product prices noncompetitive, or suffer reduced revenues and gross margins as measured in U.S. dollars. These dynamics have adversely affected our revenue growth in international markets in previous years. Our foreign currency hedging program includes both foreign currency forward and purchased option contracts to reduce the effect of exchange rate fluctuations. However, our hedging program will not eliminate all of our foreign exchange risks. (See “Net Foreign Exchange Gain (Loss)” and Note 11 of Notes to Consolidated Financial Statements.)
The marketplace for our products dictates that many of our products be shipped very quickly after an order is received. As a result, we are required to maintain significant inventories. Therefore, inventory obsolescence is a risk for us due to frequent engineering changes, shifting customer demand, the emergence of new industry standards and rapid technological advances including the introduction by us or our competitors of products embodying new technology. While we adjust for excess and obsolete inventories and we monitor the valuation of our inventories, there can be no assurance that our valuation adjustments will be sufficient.
Off-Balance Sheet Arrangements
We have no debt or off-balance sheet debt. As of December 31, 2006,2009, we have non-cancelable operating lease obligations of approximately $23.7$52 million compared to $50 million at December 31, 2008. Rent expense under operating leases was $12 million, $12 million and contractual$10 million for the years ended December 31, 2009, 2008 and 2007, respectively.
Purchase obligations primarily represent purchase commitments for customized inventory and inventory components. As of December 31, 2009, we had non-cancelable purchase commitments with various suppliers of general components and customized inventory and inventory components totaling approximately $6.5 million over the next twelve months. At December 31, 2008, we had non-cancelable purchase commitments with various suppliers of customized inventory and inventory components totaling approximately $7.0$8.4 million.
Guarantees are related to payments of customs and foreign grants. As of December 31, 2006,2009, we have outstanding guarantees for payment of customs and foreign grants totaling approximately $3.5$5.2 million. (See Note 13 of Notes to Consolidated Financial Statements.) As of December 31, 2006,2008, we have outstanding guarantees for payment of customs and foreign grants totaling approximately $2.4 million.
Off-Balance Sheet Arrangements. We do not have any debt or off-balance sheet debt. As of December 31, 2009, we did not have any relationships with any unconsolidated entities or financial partnerships, such as entities often referred to as structured finance entities, which would have been established for the purpose of facilitating off-balance sheet arrangements. As such, we are not exposed to any financing, liquidity, market or credit risk that could arise if we were engaged in such relationships.
Market RiskProspective Capital Needs. We are exposedbelieve that our existing cash, cash equivalents and marketable securities, together with cash generated from operations and from the exercise of employee stock options and the purchase of common stock through our employee stock purchase plan, will be sufficient to a varietycover our working capital needs, capital expenditures, investment requirements, commitments, payment of risks, including foreign currency fluctuationsdividends to our shareholders and changes in the market valuerepurchases of our investments. Incommon stock for at least the normal coursenext 12 months. However, we may choose or be required to raise additional funds by selling equity or debt securities to the public or to selected investors, or by borrowing money from financial institutions. Historically, we have not had to rely on debt, public or private, to fund our operating, financing or investing activities. We could also choose or be required to reduce certain expenditures, such as payments of business, we employ established policies and procedures to manage our exposure to fluctuations in foreign currency values and changes in the market valuedividends or repurchases of our investments.
Foreign Currency Hedging Activities. Our objective in managing our exposurecommon stock. In addition, even though we may not need additional funds, we may still elect to foreign currency exchange rate fluctuations issell additional equity or debt securities or obtain credit facilities for other reasons. If we elect to reduceraise additional funds, we may not be able to obtain such funds on a timely basis on acceptable terms, if at all. If we raise additional funds by issuing additional equity or convertible debt securities, the impactownership percentages of adverse fluctuations in such exchange rates on our earnings and cash flow. Accordingly,existing shareholders would be reduced. In addition, the equity or debt securities that we utilize purchased foreign currency option contracts and forward contractsissue may have rights, preferences or privileges senior to hedge our exposure on anticipated transactions and firm commitments. The principal currencies hedged are the euro, British pound and Japanese yen. We monitor our foreign exchange exposures regularly to ensure the overall effectivenessthose of our foreign currency hedge positions. However, there can be no assurance that our foreign currency hedging activities will substantially offset the impact of fluctuations in currency exchange rates on our results of operations and financial position. Based on the foreign exchange instruments outstanding at December 31, 2006 and 2005, an adverse change (defined as 20% in the Asian currencies and 10% in all other currencies) in exchange rates would result in a decline in the aggregate fair market value of all of our instruments outstanding of approximately $6.6 million and $4.2 million, respectively. However, as we utilize foreign currency instruments for hedging anticipated and firmly committed transactions,common stock.
Although we believe that a loss in fair valuewe have sufficient capital to fund our activities for at least the next 12 months, our future capital requirements may vary materially from those instrumentsnow planned. We anticipate that the amount of capital we will be substantially offset by increasesneed in the value of the underlying exposure. (See Note 10 of Notes to Consolidated Financial Statements for a description of our financial instruments at December 31, 2006 and 2005.)Short-term Investments. The fair value of our investments in marketable securities at December 31, 2006 and 2005 was $150.2 million and $119.8 million, respectively. Investments with maturities beyond one year are classified as short-term basedfuture will depend on their highly liquid nature and because such marketable securities represent the investment of cash that is available for current operations. Our investment policy is to manage our investment portfolio to preserve principal and liquidity while maximizing the return on our investment portfolio through the full investment of available funds. We diversify our marketable securities portfolio by investing in multiple types of investment-grade securities. Our investment portfolio is primarily invested in securities with at least an investment grade rating to minimize interest rate and credit risk as well as to provide for an immediate source of funds. Based on our investment portfolio and interest rates at December 31, 2006 and 2005, a 100 basis point increase or decrease in interest rates would result in a decrease or increase of approximately $750,000 and $600,000, respectively, in the fair value of our investment portfolio. Although changes in interest rates may affect the fair value of our investment portfolio and cause unrealized gains or losses, such gains or losses would not be realized unless the investments are sold.
many factors, including:
· general economic and political conditions and specific conditions in the markets we address, including the continuing volatility in the industrial economy, current general economic volatility and trends in the industrial economy in various geographic regions in which we do business;
· the inability of certain of our customers who depend on credit to have access to their traditional sources of credit to finance the purchase of products from us, particularly in the current global economic environment, which may lead them to reduce their level of purchases or to seek credit or other accommodations from us;
· the overall levels of sales of our products and gross profit margins;
· our business, product, capital expenditure and research and development plans, and product and technology roadmaps;
· repurchases of our common stock;
· required levels of research and development and other operating costs;
· litigation expenses, settlements and judgments;
· the levels of inventory and accounts receivable that we maintain;
· acquisitions of other businesses, assets, products or technologies;
· capital improvements for new and existing facilities;
· our relationships with suppliers and customers; and,
· the level of exercises of stock options and stock purchases under our employee stock purchase plan.
Recently Issued Accounting Pronouncements
In July 2006,April 2009, the Financial Accounting Standards Board (“FASB”) issued FASB Interpretation (“FIN”) 48,Accountingupdated FASB ASC 820 providing additional guidance for Uncertainty in Income Taxes – an interpretationestimating fair value when the volume and level of Statement of Financial Accounting Standards (“SFAS”) 109.activity for the asset or liability have significantly decreased. This interpretation clarifies the accounting for uncertainty in income taxes recognized in an entity’s financial statements in accordance with SFAS 109,Accounting for Income Taxes. It prescribesupdate also includes guidance on identifying circumstances that indicate a recognition threshold and measurement attribute for financial statement disclosure of tax positions taken or expected to be taken on a tax return. This interpretationtransaction is effective for fiscal years beginning after December 15, 2006.not orderly. We adopted FIN 48the update on JanuaryApril 1, 20072009 as required. The cumulative effect of adopting FIN 48 was recorded in retained earnings upon adoption. The adoption of FIN 48required and concluded it did not have a significantmaterial impact on our consolidated financial position or results of operations.
In September 2006,2009, the SecuritiesFASB updated FASB ASC 105, Generally Accepted Accounting Principles (FASB ASC 105). The update establishes the FASB Standards Accounting Codification (“Codification”) as the source of authoritative U.S. generally accepted accounting principles (“GAAP”) recognized by the FASB to be applied to nongovernmental entities and Exchange Commission (“SEC”) issued Staff Accounting Bulletin (“SAB”) 108 regardingrules and interpretive releases of the process of quantifying financial statement misstatements. SAB 108 states that registrants should use both a balance sheet approachSEC as authoritative GAAP for SEC registrants. The Codification supersedes all existing non-SEC accounting and an income statement approach when quantifying and evaluating the materiality of a misstatement. The interpretations in SAB 108 contain guidance on correcting errors under the dual approach as well as provide transition guidance for correcting errors.reporting standards. This interpretation does not change the requirements within SFAS 154,Accounting Changes and Error Corrections – a replacement of APB 20 and FASB Statement 3, for the correction of an error on financial statements. SAB 108update is effective for annual financial statements covering the first fiscal yearissued for interim and annual periods ending after NovemberSeptember 15, 2006.2009. We adopted this interpretationthe update on December 31, 2006. The adoption of SAB 108July 1, 2009, as required and concluded it did not have a significant effectmaterial impact on our consolidated financial statements.position or results of operations.
In September 2006,October 2009, the FASB issued SFAS 157,Fair Value Measurements. This standard defines fair value, establishesupdated FASB ASC 605, Revenue Recognition (FASB ASC 605) that amended the criteria for separating consideration in multiple-deliverable arrangements. The amendments establish a frameworkselling price hierarchy for measuring fair value in accounting principles generally accepteddetermining the selling price of a deliverable. The selling price used for each deliverable will be based on vendor-specific objective evidence if available, third–party evidence if vendor-specific objective evidence is not available, or estimated selling price if neither vendor-specific objective evidence nor third-party evidence is available. The amendments will change the application of the residual method of allocation and require that arrangement consideration be allocated at the inception of the arrangement to all deliverables using the relative selling price method. The relative selling price method allocates any discount in the United Statesarrangement proportionally to each deliverable on the basis of America, and expands disclosure about fair value measurements.each deliverable’s selling price. This pronouncement applies under other accounting standards that requireupdate will be effective prospectively for revenue arrangements entered into or permit fair value measurements. Accordingly, this statement does not require any new fair value measurement. This statement is effective formaterially modified in fiscal years beginning on or after NovemberJune 15, 2007, and interim periods within those fiscal years. We will be required to adopt SFAS 157 in the first quarter of fiscal year 2008.2010. Early adoption is permitted. We are currently evaluating the requirements of SFAS 157this update and have not yet determined the impact on our consolidated financial statements.
In March 2006,October 2009, the Emerging Issues Task Force (“EITF”) reached a consensus on EITF Issue 06-3,How Taxes Collected from CustomersFASB updated FASB ASC 985, Software (FASB ASC 985) that changes the accounting model for revenue arrangements that include both tangible products and Remittedsoftware elements. Tangible products containing software components and non-software components that function together to Governmental Authorities Should Be Presented indeliver the Income Statement (that is, Gross versus Net Presentation). Taxestangible product’s essential functionality are no longer within the scope of EITF Issue 06-3 include any taxes assessed bythe software revenue guidance in Subtopic 985-605. In addition, the amendments require that hardware components of a governmental authority thattangible product containing software components always be excluded from the software revenue guidance. This update will be effective prospectively for revenue arrangements entered into or materially modified in fiscal years beginning on or after June 15, 2010. Early adoption is permitted. We are directly imposed on a revenue-producing transaction between a sellercurrently evaluating the requirements of this update and a customer and may include, but arehave not limited to, sales taxes, use taxes, value-added taxes, and some excise taxes. The EITF concluded thatyet determined the presentation of these taxes on either a gross (included in revenues and costs) or a net (excluded from revenue) basis is an accounting policy decision that should be disclosed. For any such taxes that are reported on a gross basis, a company should disclose the amounts of those taxes in interim and annual financial statements. Our policy is to exclude all such taxes from revenue. The provisions of EITF 06-3 are effective for interim and annual reporting periods beginning after December 15, 2006. The adoption of EITF 06-3 will not have any effectimpact on our consolidated financial statements.
Critical Accounting Policies
The preparation of our financial statements in conformity with generally accepted accounting principles requires us to make estimates and assumptions that affect the reported amounts of assets, liabilities, revenues, expenses and related disclosures of contingent assets and liabilities. We base our estimates on past experience and other assumptions that we believe are reasonable under the circumstances, and we evaluate these estimates on an ongoing basis. Our critical accounting policies are those that affect our financial statements materially and involve difficult, subjective or complex judgments by management. Although these estimates are based on management's best knowledge of current events and actions that may impact the company in the future, actual results may be materially different from the estimates.
Our critical accounting policies are as follows:
o Revenue recognition
We derive revenue primarily from the sale/licensing of integrated hardware and software solutions. We also sell application software licenses which are sold separately as well as training and post contract support services. The products and services are generally sold under standardized licensing and sales arrangements with payment terms ranging from net 30 days in the United States to net 30 days and up to net 90 days in some international markets. Approximately 95% of our product/license sales include both hardware and software in the customer arrangement, with a small percentage of sales including other services. We offer rights of return and standard warranties for product defects related to our products. The rights of return are generally for a period of up to 30 days after the delivery date. The standard warranties cover periods ranging from 90 days to three years. We do not enter into contracts requiring product acceptance from the customer.
· Revenue is recognized in accordance with the provisions of SOP 97-2 when persuasive evidence of an arrangement exists, delivery has occurred, the fee is fixed or determinable, and collectability is probable. We enter into certain arrangements where we are obligated to deliver multiple products and/or services (“multiple elements”). In these transactions, we allocate the total revenue among the elements based on the sales price of each element when sold separately (“vendor-specific objective evidence”).recognition
We derive revenue primarily from the sale/licensing of integrated hardware and software solutions. Independent sales of application software licenses include post contract support services. In addition, training services are sold separately. The products and services are generally sold under standardized licensing and sales arrangements with payment terms ranging from net 30 days in the U.S. to net 30 days and up to net 90 days in some international markets. Approximately 83% of our product/license sales include both hardware and software in the customer arrangement, with a small percentage of sales including other services. We offer rights of return and standard warranties for product defects related to our products. The rights of return are generally for a period of up to 30 days after the delivery date. The standard warranties cover periods ranging from 90 days to three years. We do not generally enter into contracts requiring product acceptance from the customer.
Revenue is recognized in accordance with the provisions of FASB ASC 985, when persuasive evidence of an arrangement exists, delivery has occurred, the fee is fixed or determinable, and collectability is probable. We enter into certain arrangements where we are obligated to deliver multiple products and/or services (“multiple elements”). In these transactions, we allocate the total revenue among the elements based on vendor specific objective evidence (“VSOE”) of fair value as determined by the sales price of each element when sold separately.
When VSOE of fair value is available for the undelivered element of a multiple element arrangements, sales revenue is generally recognized on the date the product is shipped, using the residual method under FASB ASC 985, with a portion of revenue recorded as deferred (unearned) due to applicable undelivered elements. Undelivered elements for our multiple element arrangements with a customer are generally restricted to post contract support and training and education. The amount of revenue allocated to these undelivered elements is based on the VSOE of fair value for those undelivered elements. Deferred revenue due to undelivered elements is recognized ratably on a straight-line basis over the service period or when the service is completed. When VSOE of fair value is not available for the undelivered element of a multiple element arrangement, sales revenue is generally recognized ratably, on a straight-line basis over the service period of the undelivered element, generally 12 months or when the service is completed in accordance with the subscription method under FASB ASC 985. Deferred revenue at December 31, 2009 and 2008 was $57 million and $46 million, respectively.
The application of FASB ASC 985, requires judgment, including whether a software arrangement includes multiple elements, and if so, whether VSOE of fair value exists for those elements. Changes to the elements in a software arrangement, the ability to identify VSOE for those elements, the fair value of the respective elements, and changes to a product’s estimated life cycle could materially impact the amount of our earned and unearned revenue. Judgment is also required to assess whether future releases of certain software represent new products or upgrades and enhancements to existing products.
· Sales revenue from product sales is generally recognized on the date the product is shipped, with a portion of revenue recorded as deferred (unearned) due to applicable undelivered elements. Undelivered elements for our multiple-element arrangements with a customer are generally restricted to post contract support and training and education. The amount of revenue allocated to these undelivered elements is based on the vendor-specific objective evidence (“VSOE”) of fair value for those undelivered elements. Deferred revenue due to undelivered elements is recognized ratably on a straight-line basis over the service period or when the service is completed. Deferred revenue at December 31, 2006 and 2005 was $22.2 million and $16.0 million, respectively.
The application of SOP 97-2 requires judgment, including whether a software arrangement includes multiple elements, and if so, whether VSOE of fair value exists for those elements. Changes to the elements in a software arrangement, the ability to identify VSOE for those elements, the fair value of the respective elements, and changes to a product's estimated life cycle could materially impact the amount of earned and unearned revenue. Judgment is also required to assess whether future releases of certain software represent new products or upgrades and enhancements to existing products.
Provision for estimated sales returns is made by reducing recorded revenue based on historical experience. The accounts receivable are net ofEstimating allowances for doubtful accounts and sales returns of $4.4 million and $4.7 million at December 31, 2006 and 2005, respectively.
The preparation of financial statements requires that we make estimates and assumptions of potential future product returns related to current period product revenue. We analyze historical returns, current economic trends, and changes in customer demand and acceptance of our products when evaluating the adequacy of our sales returns allowance. Significant judgments and estimates must be made and used in connection with establishing the sales returns allowance in any accounting period. A provision for estimated sales returns is made by reducing recorded revenue by the amount of the allowance. Accounts receivable is reported net of the allowance for sales returns. The allowance for sales returns was $1.9 million and $1.8 million at December 31, 2009 and 2008, respectively. Material differences may result in the amount and timing of our revenue for any period if we made different judgments or utilized different estimates or if actual results varied materially from our estimates.
· o Estimating allowances, specifically sales returns, the allowance for doubtful accounts and the adjustment for excess and obsolete inventories
In addition to estimating an allowance for sales returns, we must also make estimates about the uncollectability of our accounts receivables. We specifically analyze accounts receivable and analyze historical bad debts, customer concentrations, customer credit-worthiness and current economic trends when evaluating the adequacy of our allowance for doubtful accounts. Our allowance for doubtful accounts was $2.7 million and $3.9 million at December 31, 2009 and 2008, respectively. We also write down our inventory for estimated obsolescence or unmarketable inventory equal to the difference between the cost of inventory and estimated market value based on assumptions of future demand and market conditions. Our allowance for excess and obsolete inventories was $4.4 million and $4.4 million at December 31, 2009 and 2008, respectively. Significant judgments and estimates must be made and used in connection with establishing these allowances. Material differences may result in the amount and timing of our bad debt and inventory obsolescence if we made different judgments or utilized different estimates or if actual results varied materially from our estimates.
· The preparation of financial statements requires that we make estimates and assumptions that affect the reported amount of assets and liabilities and disclosure of contingent assets and liabilities at the date of the financial statements and the reported amounts of revenues and expenses during the reported period. Specifically, we must make estimates of potential future product returns related to current period product revenue. Management analyzes historical returns, current economic trends, and changes in customer demand and acceptance of our products when evaluating the adequacy of our sales returns and other allowances. Significant management judgments and estimates must be made and used in connection with establishing the sales returns and other allowances in any accounting period. The allowance for sales returns was $1.5 million at December 31, 2006. Material differences may result in the amount and timing of our revenue for any period if management made different judgments or utilized different estimates. Similarly, management must make estimates of the uncollectability of our accounts receivables. Management specifically analyzes accounts receivable and analyzes historical bad debts, customer concentrations, customer credit-worthiness and current economic trends when evaluating the adequacy of our allowance for doubtful accounts. The allowance for doubtful accounts was $2.9 million at December 31, 2006. We write down our inventory for estimated obsolescence or unmarketable inventory equal to the difference between the cost of inventory and estimated market value based on assumptions of future demand and market conditions. Our adjustment for excess and obsolete inventories was $5.2 million at December 31, 2006. If actual market conditions are less favorable than those projected by management, additional inventory write downs would be required.
o Accounting for costs of computer software
We capitalize costs related to the development and acquisition of certain software products. Capitalization of costs begins when technological feasibility has been established and ends when the product is available for general release to customers. Technological feasibility for our products is established when the product is available for beta release. Judgment is required in determining when technological feasibility of a product is established. Amortization is computed on an individual product basis for those products available for market and has been recognized based on the product’s estimated economic life, generally three years. At each balance sheet date, the unamortized costs are reviewed by management and reduced to net realized value when necessary. As of December 31, 2009, unamortized capitalized software development costs were $18 million.
· We capitalize costs related to the development and acquisition of certain software products. Capitalization of costs begins when technological feasibility has been established and ends when the product is available for general release to customers. Judgment is required in determining when technological feasibility of a product is established. Amortization is computed on an individual product basis for those products available for market and has been recognized based on the product’s estimated economic life, generally three years. At each balance sheet date, the unamortized costs are reviewed by management and reduced to net realized value when necessary. As of December 31, 2006, unamortized capitalized software development costs was $15.8 million.
o Valuation of long-lived and intangible assets
We assess the impairment of identifiable intangibles, long-lived assets and related goodwill whenever events or changes in circumstances indicate that the carrying value may not be recoverable. In accordance with FASB ASC 350, Intangibles – Goodwill and Other (FASB ASC 350), goodwill is tested for impairment on an annual basis, and between annual tests if indicators of potential impairment exist, using a fair-value-based approach based on the market capitalization of the reporting unit. Our annual impairment test was performed as of February 28, 2009. No impairment of goodwill has been identified during the period presented. Goodwill is deductible for tax purposes in certain jurisdictions. We have defined our operating segment based on geographic regions. We sell our products in three geographic regions. Our sales to these regions share similar economic characteristics, similar product mix, similar customers, and similar distribution methods. Accordingly, we have elected to aggregate these three geographic regions into a single operating segment. As we have one reporting segment, we allocate goodwill to one reporting unit for goodwill impairment testing. Factors considered important which could trigger an impairment review include the following:
· We assess the impairment of identifiable intangibles, long-lived assets and related goodwill whenever events or changes in circumstances indicate that the carrying value may not be recoverable. Factors considered important which could trigger an impairment review include the following:
oSignificantsignificant underperformance relative to expected historical or projected future operating results;
o· Significantsignificant changes in the manner of our use of the acquired assets or the strategy for our overall business;
o· Significantsignificant negative industry or economic trends; and,
o· Ourour market capitalization relative to net book value.
When it is determined that the carrying value of intangibles, long-lived assets and related goodwill may not be recoverable based upon the existence of one or more of the above indicators of impairment, the measurement of any impairment is determined and the carrying value is reduced as appropriate. As of December 31, 2009, we had net goodwill of approximately $65 million.
· When it is determined that the carrying value of intangibles, long-lived assets and related goodwill may not be recoverable based upon the existence of one or more of the above indicators of impairment, the measurement of any impairment is determined and the carrying value is reduced as appropriate. As of December 31, 2006, we had net goodwill of approximately $53.3 million.
o Accounting for income taxes
We account for income taxes under the asset and liability method that requires the recognition of deferred tax assets and liabilities for the expected future tax consequences of events that have been recognized in our financial statements or tax returns. Judgment is required in assessing the future tax consequences of events that have been recognized in our financial statements or tax returns. Variations in the actual outcome of these future tax consequences could materially impact our financial position or our results of operations. In estimating future tax consequences, all expected future events are considered other than enactments of changes in tax laws or rates. Valuation allowances are established when necessary to reduce deferred tax assets to amounts which are more likely than not to be realized.
As a result of certain foreign investment incentives available under Hungarian law, the profit from our Hungarian operation was subject to a reduced income tax rate. This special tax status terminated on January 1, 2008, with the merger of our Hungarian manufacturing operations with its Hungarian parent company. The tax position of our Hungarian operation continued to benefit from assets created by the restructuring of our operations in Hungary. Realization of these assets was based on estimated future earnings in Hungary. Partial release of the valuation allowance on these assets resulted in income tax benefits of $18.3 million for the year ended December 31, 2007, and $8.7 million for the year ended December 31, 2008.
For the year 2009, we expected to recognize an additional tax benefit of $9.7 million related to these assets. Effective January 1, 2010, a new tax law in Hungary provides for an enhanced deduction for the qualified research and development expenses of NI Hungary Software and Hardware Manufacturing Kft. ("NI Hungary"). During the three months ended December 31, 2009, we obtained confirmation of the application of this new tax law for the qualified research and development expenses of NI Hungary. Based on the application of this new tax law to the qualified research and development expense of NI Hungary, we no longer expect to have sufficient future taxable income in Hungary to realize the benefits of these tax assets. As such, we recorded an income tax charge of $21.6 million during the three months ended December 31, 2009, $18.4 million of which was related to a valuation allowance on the previously recognized assets created by the restructuring and $3.2 million of which was related to tax benefits from other assets that we will no longer be able to realize as a result of this change. We do not expect to realize the tax benefit of the remaining assets created by the restructuring and therefore we have a full valuation allowance of $98.2 million against those assets at December 31, 2009.For additional discussion about our income taxes including components of income before income taxes, our provision for income taxes charged to operations, components of our deferred tax assets and liabilities, a reconciliation of income taxes at the U.S. federal statutory rate of 35% to our effective tax rate and other tax matters, see Note 9 – Income taxes of Notes to Consolidated Financial Statements.· We account for income taxes under the asset and liability method that requires the recognition of deferred tax assets and liabilities for the expected future tax consequences of events that have been recognized in our financial statements or tax returns. Judgment is required in assessing the future tax consequences of events that have been recognized in our financial statements or tax returns. Variations in the actual outcome of these future tax consequences could materially impact our financial position or our results of operations. In estimating future tax consequences, all expected future events are considered other than enactments of changes in tax laws or rates. Valuation allowances are established when necessary to reduce deferred tax assets to amounts which are more likely than not to be realized.Loss contingencies
As a result of certain foreign investment incentives available under Hungarian law, the profit from our Hungarian operation is currently subject to a reduced income tax rate. These benefits may not be available in the future due to changes in Hungary’s political condition and/or tax laws. The reduction or elimination of these foreign investment incentives would result in the reduction or elimination of certain tax benefits thereby increasing our future effective income tax rate, which could have a material adverse effect on our operating results.
We accrue for probable losses from contingencies including legal defense costs, on an undiscounted basis, in accordance with FASB ASC 450, Contingencies (FASB ASC 450), when such costs are considered probable of being incurred and are reasonably estimable. We periodically evaluate available information, both internal and external, relative to such contingencies and adjust this accrual as necessary. Disclosure of a contingency is required if there is at least a reasonable possibility that a loss has been incurred. In determining whether a loss should be accrued we evaluate, among other factors, the degree of probability of an unfavorable outcome and the ability to make a reasonable estimate of the amount of loss. Changes in these factors could materially impact our financial position or our results of operation.
We receive a substantial income tax benefit from the extraterritorial income (“ETI”) exemption under U.S. law. The ETI rules were repealed for transactions after December 31, 2004, with a two-year transition period, and ceased to be available as of December 31, 2006. The repeal of ETI will increase our future effective income tax rate by approximately one percentage point in December 31, 2007. However, we believe this increase will be offset entirely by the effects of the expected increased benefit from the deduction for income from qualified domestic production activities and increased profits in certain foreign jurisdictions with reduced income tax rates.
o Loss contingencies
We accrue for probable losses from contingencies including legal defense costs, on an undiscounted basis, in accordance with SFAS 5,Accounting for Loss Contingencies, when such costs are considered probable of being incurred and are reasonably estimable. We periodically evaluate available information, both internal and external, relative to such contingencies and adjust this accrual as necessary. Disclosure of a contingency is required if there is at least a reasonable possibility that a loss has been incurred. In determining whether a loss should be accrued we evaluate, among other factors, the degree of probability of an unfavorable outcome and the ability to make a reasonable estimate of the amount of loss. Changes in these factors could materially impact our financial position or our results of operation.
ITEM 7A. QUANTITATIVE AND QUALITATIVE DISCLOSURES ABOUT MARKET RISK
Financial Risk Management
Our international sales are subject to inherent risks, including fluctuations in local economies; fluctuations in foreign currencies relative to the U.S. dollar; difficulties in staffing and managing foreign operations; greater difficulty in accounts receivable collection; costs and risks of localizing products for foreign countries; unexpected changes in regulatory requirements, tariffs and other trade barriers; difficulties in the repatriation of earnings and burdens of complying with a wide variety of foreign laws. The informationvast majority of our sales outside of North America are denominated in local currencies, and accordingly, the U.S. dollar equivalent of these sales is affected by changes in the foreign currency exchange rates. Net of hedging results, the change in exchange rates had the effect of decreasing our consolidated sales by $29 million or 4% for the year ended December 31, 2009, compared to 2008. If the local currencies in which we sell our products strengthen against the U.S. dollar, we may need to lower our prices in the local currency to remain competitive in our international markets which could have a material adverse effect on our gross and net profit margins. If the local currencies in which we sell our products weaken against the U.S. dollar and if the local sales prices cannot be raised due to competitive pressures, we will experience a deterioration of our gross and net profit margins. Since most of our international operating expenses are also incurred in local currencies, the change in exchange rates had the effect of decreasing our operating expenses by $12 million or 2% for the year ended December 31, 2009, compared to 2008. Currently, we are experiencing significant volatility in foreign currency exchange rates in many of the markets in which we do business. This has had a significant impact on the revaluation of our foreign currency denominated firm commitments and on our ability to forecast our U.S. dollar equivalent revenues and expenses. In the past, these dynamics have also adversely affected our revenue growth in international markets and will likely pose similar challenges in the future. Our foreign currency hedging program includes both foreign currency forward and purchased option contracts to reduce the effect of exchange rate fluctuations. However, our hedging program will not eliminate all of our foreign exchange risks, particularly when market conditions experience the recent level of volatility. (See “Net Foreign Exchange Gain (Loss)” and Note 4 – Derivative instruments and hedging activities of Notes to Consolidated Financial Statements).
Inventory ManagementThe marketplace for our products dictates that many of our products be shipped very quickly after an order is received. As a result, we are required to maintain significant inventories. Therefore, inventory obsolescence is a risk for us due to frequent engineering changes, shifting customer demand, the emergence of new industry standards and rapid technological advances including the introduction by this itemus or our competitors of products embodying new technology. While we adjust for excess and obsolete inventories and we monitor the valuation of our inventories, there can be no assurance that our valuation adjustments will be sufficient.
Market RiskWe are exposed to a variety of risks, including foreign currency fluctuations and changes in the market value of our investments. In the normal course of business, we employ established policies and procedures to manage our exposure to fluctuations in foreign currency values and changes in the market value of our investments.Cash, Cash Equivalents and Short-Term Investments
At December 31, 2009, we had $289 million in cash, cash equivalents and short-term investments. We maintain cash and cash equivalents with various financial institutions located in many countries throughout the world. Approximately $114 million or 39% of these amounts were held in domestic accounts with various financial institutions and $175 million or 61% was held in accounts outside of the U.S. with various financial institutions. At December 31, 2009, $85 million or 42% of our cash and cash equivalents was held in cash in various operating accounts throughout the world, and $116 million or 58% was held in money market accounts. The most significant of our operating accounts was our domestic operating account which held approximately $22 million or 11% of our total cash and cash equivalents at a bank that carried a A1 rating at December 31, 2009. Our short-term investment balance is incorporatedcomprised of $35 million held in our investment accounts in the U.S. and $52 million held in investment accounts of our foreign subsidiaries.
Short-term debt securities available-for-sale included auction rate securities backed by referenceeducation loan revenue bonds. One of our auction rate securities is from the Vermont Student Assistance Corporation and has a par value of $2.2 million. The other of our auction rate securities is from the New Hampshire Health and Education Facilities Authority and has a par value of $6.4 million. At December 31, 2009, we reported these auction rate securities at their estimated fair market value of $8.2 million as a component of short-term debt securities available for sale. We are also a party to “Item 7—Management’s Discussiona UBS Auction Rate Securities Rights (the “Rights”) agreement. The Rights agreement is a nontransferable right to sell our auction rate securities, at par value, back to UBS at any time during the period June 30, 2010, through July 2, 2012. At December 31, 2009, we reported the Rights agreement at its estimated fair market value of $423,000 as a component of short-term debt securities available for sale. See Note 3 – Fair value measurements in Notes to Consolidated Financial Statements for further discussion of our auction rate securities and Analysisour Rights agreement.
Due to the fact that our Rights agreement has an initial exercise date that is less than one year from now, we are now reporting our auction rate securities and the corresponding Rights agreement as short-term. We continue to have the ability to hold our auction rate securities to their ultimate maturities which are in excess of one year and we have not made a determination as to whether we will exercise our option under the Rights agreement or if we do choose to exercise our option, at what point during the period June 30, 2010 through July 2, 2012, we would exercise our option. We have recorded the unrealized loss related to the auction rate securities and the unrealized gain related to the Rights agreement as a component of other income (expense), in our Consolidated Statements of Income.
We do not anticipate that the auction rate market will provide liquidity for these securities in the foreseeable future. Should we need or desire to access the funds invested in those securities prior to their maturity or prior to our exercise period under the Rights agreement discussed above, we may be unable to find a buyer in a secondary market outside the auction process or if a buyer in a secondary market is found, we would likely realize a loss.
We maintain an investment portfolio of various types of security holdings and maturities. Pursuant to FASB ASC 820, cash equivalents and short-term investments available-for-sale are valued using a market approach (Level 1) based on the quoted market prices of identical instruments when available or other observable inputs such as trading prices of identical instruments in inactive markets. The estimated fair market value of both the auction rate securities and the Rights agreement was determined using significant unobservable inputs (Level 3) as prescribed by FASB ASC 820.
The goal of our investment policy is to manage our investment portfolio to preserve principal and liquidity while maximizing the return on our investment portfolio through the full investment of available funds. We place our cash investments in instruments that meet credit quality standards, as specified in our corporate investment policy guidelines. These guidelines also limit the amount of credit exposure to any one issue, issuer or type of instrument. Other than our auction rate securities discussed above, at December 31, 2009, our cash equivalents and short-term investments carried ratings from the major credit rating agencies that were in accordance with our corporate investment policy. Our investment policy allows investments in the following; government and federal agency obligations, repurchase agreements (“Repos”), certificates of deposit and time deposits, corporate obligations, medium term notes and deposit notes, commercial paper including asset-backed commercial paper (“ABCP”), puttable bonds, general obligation and revenue bonds, money market funds, taxable commercial paper, corporate notes/bonds, municipal notes, municipal obligations, variable rate demand notes and tax exempt commercial paper. All such instruments must carry minimum ratings of A1/P1/F1, MIG1/VMIG1/SP1 and A2/A/A, as applicable, all of which are considered “investment grade”. Our investment policy for marketable securities requires that all securities mature in three years or less, with a weighted average maturity of no longer than 18 months with at least 10% maturing in 90 days or less.
We account for our investments in debt and equity instruments under FASB ASC 320. Our investments are classified as available-for-sale and accordingly are reported at fair value, with unrealized gains and losses reported as other comprehensive income, a component of shareholders’ equity. Unrealized losses are charged against income when a decline in fair value is determined to be other than temporary. Investments with maturities beyond one year are classified as short-term based on their highly liquid nature and because such marketable securities represent the investment of cash that is available for current operations. The fair value of our short-term investments in debt securities at December 31, 2009 and December 31, 2008 was $87 million and $6 million, respectively. The increase was due to the net purchase of $74 million of short-term investments and the transfer of $8.6 related to our auction rate securities and our rights agreement from long-term investments to short-term investments during the year ended December 31, 2009. The net purchase of $74 million of short term investments was done to diversify our holdings from money market accounts to debt securities and to take advantage of higher yields associated with longer maturity debt securities. We follow the guidance provided by FASB ASC 320 to assess whether our investments with unrealized loss positions are other than temporarily impaired. Realized gains and losses and declines in value judged to be other than temporary are determined based on the specific identification method and are reported in other income (expense), net, in our Consolidated Statements of Income.Long-Term Investments
At December 31, 2008, our long-term investments consisted primarily of Aaa/A/AAA rated investments in auction rate securities that we originally purchased for $8.6 million. These auction rate securities consist of education loan revenue bonds. Auction rate securities are variable rate debt instruments whose interest rates are typically reset approximately every 7 to 35 days. At December 31, 2008, we classified these investments as long-term due to the fact that the underlying securities have contractual maturities that are greater than one year. These contractual maturities are also in excess of the guidelines provided for in our corporate investment policy. The auction rate securities are classified as available-for-sale. At December 31, 2008, we reported these long-term investments at their estimated fair market value of $7.0 million. In November 2008, we accepted the Rights agreement offered by UBS as a liquidity alternative to the failed auction process. The Rights agreement is a nontransferable right to sell our auction rate securities, at par value, back to UBS at any time during the period June 30, 2010, through July 2, 2012. At December 31, 2008, we reported the Rights agreement at its estimated fair market value of $1.6 million. At December 31, 2008 he estimated fair market value of both the auction rate securities and the Rights agreement was determined using significant unobservable inputs (Level 3) as prescribed by FASB ASC 820. These auction rate securities and the Rights agreement are now reported as a component of short-term investments as discussed above.
Interest Rate Risk
Investments in both fixed rate and floating rate instruments carry a degree of interest rate risk. Fixed rate securities may have their market value adversely impacted due to an increase in interest rates, while floating rate securities may produce less income than expected if interest rates fall. Due in part to these factors, our future investment income may fall short of expectations due to changes in interest rates or if the decline in fair value of our publicly traded debt investments is judged to be other-than-temporary. We may suffer losses in principal if we are forced to sell securities that have declined in market value due to changes in interest rates. However, because any debt securities we hold are classified as available-for-sale, no gains or losses are realized in the income statement due to changes in interest rates unless such securities are sold prior to maturity or unless declines in value are determined to be other-than-temporary. These securities are reported at fair value with the related unrealized gains and losses included in accumulated other comprehensive income (loss), a component of shareholders’ equity, net of tax.
In a declining interest rate environment, as short-term investments mature, reinvestment occurs at less favorable market rates. Given the short-term nature of certain investments, the current interest rate environment of low or declining rates will likely negatively impact our investment income.
In order to assess the interest rate risk associated with our investment portfolio, we performed a sensitivity analysis to determine the impact a change in interest rates would have on the value of the investment portfolio assuming a 100 basis point parallel shift in the yield curve. Based on our investment positions as of December 31, 2009, a 100 basis point increase or decrease in interest rates across all maturities would result in a $614,000 increase or decrease in the fair market value of the portfolio. As of December 31, 2008, a similar 100 basis point shift in the yield curve would have resulted in a $50,000 increase or decrease in the fair market value of the portfolio. Such losses would only be realized if we sold the investments prior to maturity or if there is a other than temporary impairment.
Actual future gains and losses associated with our investments may differ from the sensitivity analyses performed as of December 31, 2009 due to the inherent limitations associated with predicting the changes in the timing and level of interest rates and our actual exposures and positions.
Economic conditions in 2008 and 2009 had negative effects on the financial markets. In response to these conditions, we shifted a larger percentage of our portfolio to money market funds, U.S. Treasuries and time deposits toward the end of 2008. This had a negative impact on our investment income in 2009. As we noted some stabilization in the financial markets throughout 2009, we made net purchases of $74 million of short-term investments, primarily to diversify our holdings from money market accounts to debt securities and to take advantage of higher yields associated with longer maturity debt securities. However, yields, even at longer maturities, remained at or near historic lows throughout 2009. We cannot predict when interest rates and investment yields will rise. If yields continue to stay at these low levels, our investment income will continue to be negatively impacted.
Exchange Rate RiskOur objective in managing our exposure to foreign currency exchange rate fluctuations is to reduce the impact of adverse fluctuations in such exchange rates on our earnings and cash flow. Accordingly, we utilize purchased foreign currency option and forward contracts to hedge our exposure on anticipated transactions and firm commitments. The principal currencies hedged are the Euro, British pound, Japanese yen and Hungarian forint. We monitor our foreign exchange exposures regularly to help ensure the overall effectiveness of our foreign currency hedge positions. There can be no assurance that our foreign currency hedging activities will substantially offset the impact of fluctuations in currency exchanges rates on our results of operations and financial position. Based on the foreign exchange instruments outstanding at December 31, 2009 and December 31, 2008, an adverse change (defined as 20% in the Asian currencies and 10% in all other currencies) in exchange rates would result in a decline in the aggregate settlement value of all of our instruments outstanding of approximately $22 million and $31 million, respectively. However, as we utilize foreign currency instruments for hedging anticipated and firmly committed transactions, we believe that a loss in settlement value for those instruments will be substantially offset by increases in the value of the underlying exposure. (See Note 4 - Derivative instruments and hedging activities of Notes to Consolidated Financial ConditionStatements for a further description of our derivative instruments and Results of Operations—Market Risk” above.hedging activities).
ITEM 8. FINANCIAL STATEMENTS AND SUPPLEMENTARY DATA
The information required by this item is incorporated by reference to the Consolidated Financial Statements set forth on pages F-1 through F-27 and S-1F-31 hereof.
ITEM 9. CHANGES IN AND DISAGREEMENTS WITH ACCOUNTANTS ON ACCOUNTING AND FINANCIAL DISCLOSURE
There were no disagreements with accountants on accounting and financial disclosure for the year ended December 31, 2006.2009.
ITEM 9A. CONTROLS AND PROCEDURES
Evaluation of Disclosure Controls and Procedures
As of the end of the period covered by this Annual Report on Form 10-K, as required by paragraph (b) of Rule 13a-15 or Rule 15d-15 under the Securities Exchange Act of 1934, as amended, we evaluated under the supervision of our Chief Executive Officer, Dr. James Truchard, and our Chief Financial Officer, the effectivenessAlex Davern, based on their evaluation of our disclosure controls and procedures (as defined in Rules 13a-15(e) orand 15d-15(e) of the Securities Exchange Act of 1934, as amended). Based on this evaluation, our Chief Executive Officer and our Chief Financial Officer, required by paragraph (b) of Rule 13a – 15 or Rule 15d – 15, have concluded that our disclosure controls and procedures arewere effective at the reasonable assurance level, to ensure the timely collection, evaluation and disclosure of information relating to us that information we are requiredwould potentially be subject to disclose in reports that we file or submitdisclosure under the Securities Exchange Act of 1934, (i)as amended, and the rules and regulations promulgated there under, and that such information is recorded, processed, summarized and reported within the time periods specified in Securities and Exchange Commissionthe SEC’s rules and forms,forms. These disclosure controls and (ii)procedures include, without limitation, controls and procedures designed to ensure that information required to be disclosed by us in the reports we file or submit is accumulated and communicated to our management, including our Chief Executive Officer and our Chief Financial Officer, as appropriate to allow timely decisions regarding required disclosure. Our disclosure controls and procedures are designed to provide reasonable assurance that such information is accumulated and communicated to our management. Our disclosure controls and procedures include components of our internal control over financial reporting. Management’s assessment of the effectiveness of our internal controlcontrols over financial reporting is expressed at the level of reasonable assurance because a control system, no matter how well designed and operated, can provide only reasonable, but not absolute assurance that the control system’s objectives will be met. We continue to enhance our internal control over financial reporting in key functional areas with the goal of monitoring our operations at the level of documentation, segregation of duties, and systems security necessary, as well as transactional control procedures required under Auditing Standard No. 5 issued by the Public Company Accounting Oversight Board. We discuss and disclose these matters to the audit committee of our board of directors and to our auditors.
Management Report on Internal Control over Financial Reporting
Our management is responsible for establishing and maintaining adequate internal control over financial reporting to provide reasonable assurance regarding the reliability of our financial reporting and the preparation of financial statements for external purposes in accordance with generally accepted accounting principles. Internal control over financial reporting includes those policies and procedures that (i) pertain to the maintenance of records that in reasonable detail accurately and fairly reflect the transactions and dispositions of the assets of the company, (ii) provide reasonable assurance that transactions are recorded as necessary to permit preparation of financial statements in accordance with generally accepted accounting principles, and that receipts and expenditures of the Company are being made only in accordance with authorizations of management and directors of the Company; and (iii) provide reasonable assurance regarding prevention or timely detection of unauthorized acquisition, use or disposition of the Company’s assets that could have a material effect on the financial statements.
Management assessed our internal control over financial reporting as of December 31, 2006,2009, which was the end of our fiscal year. Management based its assessment on criteria established in Internal Control – Integrated Framework issued by the Committee of Sponsoring Organizations of the Treadway Commission. Management’s assessment included evaluation of such elements as the design and operating effectiveness of key financial reporting controls, process documentation, accounting policies, and our overall control environment. This assessment is supported by testing and monitoring performed by our finance organization.
Based on our assessment, management has concluded that our internal control over financial reporting was effective as of the end of the fiscal year to provide reasonable assurance regarding the reliability of financial reporting and the preparation of financial statements for external reporting purposes in accordance with generally accepted accounting principles. We reviewed the results of management’s assessment with the Audit Committee of our Board of Directors.
Our independent registered public accounting firm, Ernst & Young LLP, who also audited our consolidated financial statements, audited management’s assessment and independently assessed the effectiveness of our internal control over financial reporting. Ernst & Young LLP has issued their attestation report, which is included in Part II, Item 8 of this Form 10-K.
Changes in Internal Control over Financial Reporting
During the three months ended December 31, 2006,2009, there was no change in our internal control over financial reporting identified in connection with the evaluation required by paragraph (d) of Rule 13a-15 or Rule 15d-15 that has materially affected, or is reasonably likely to materially affect, our internal control over financial reporting.
ITEM 9B. OTHER INFORMATION
None.
PART III
Certain information required by Part III is omitted from this Report in that we intend to file a definitive proxy statement pursuant to Regulation 14A with the Securities and Exchange Commission (the “Proxy Statement”) relating to our annual meeting of stockholders not later than 120 days after the end of the fiscal year covered by this Report, and such information is incorporated by reference herein.
ITEM 10. DIRECTORS, EXECUTIVE OFFICERS AND CORPORATE GOVERNANCE
The information concerning our directors required by this Item pursuant to Item 401 of Regulation S-K will appear in our Proxy Statement under the section “Election of Directors” and such information is incorporated herein by reference.
The information concerning our executive officers required by this Item pursuant to Item 401 of Regulation S-K will appear in our Proxy Statement under the section “Executive Officers” and such information is incorporated herein by reference.
The information required by this Item pursuant to Item 405 of Regulation S-K regarding compliance with Section 16(a) of the Securities Exchange Act of 1934, as amended, will appear in our Proxy Statement under the section “Section 16(a) Beneficial Ownership Reporting Compliance” and such information is incorporated herein by reference.
The information concerning our code of ethics that applies to our principal executive officer, our principal financial officer, our controller or person performing similar functions required by this Item pursuant to Item 406 of Regulation S-K will appear in our Proxy Statement under the section “Code of Ethics” and such information is incorporated herein by reference.
The information required by this Item pursuant to Item 407(c)(3) of Regulation S-K regarding material changes, if any, to procedures by which security holders may recommend nominees to our board of directors will appear in our Proxy Statement under the section “Deadline for Receipt of Stockholder Proposals” and such information is incorporated herein by reference.
The information required by this Item pursuant to Item 407(d)(4) and Item 407(d)(5) of Regulation S-K regarding our Audit Committee and our audit committee financial expert(s), respectively, will appear in our Proxy Statement under the heading “Corporate Governance” and such information is incorporated herein by reference.
ITEM 11. EXECUTIVE COMPENSATION
The information required by this Item pursuant to Item 402 of Regulation S-K regarding director compensation will appear in our Proxy Statement under the section “Board Compensation” and such information is incorporated herein by reference.
The information required by this Item pursuant to Item 402 of Regulation S-K regarding executive officer compensation, including our Compensation Discussion & Analysis, will appear in our Proxy Statement under the section “Executive Compensation” and such information is incorporated herein by reference.
The information required by this Item pursuant to Item 407(e)(4) of Regulation S-K will appear in our Proxy Statement under the section “Compensation Committee Interlocks and Insider Participation” and such information is incorporated herein by reference.
The information required by this Item pursuant to Item 407(e)(5) will appear in our Proxy Statement under the section “Compensation Committee Report” and such information is incorporated herein by reference.
ITEM 12. SECURITY OWNERSHIP OF CERTAIN BENEFICIAL OWNERS AND MANAGEMENT AND RELATED STOCKHOLDER MATTERS
From time to time our directors, executive officers and other insiders may adopt stock trading plans pursuant to Rule 10b5-1(c) promulgated by the Securities and Exchange Commission under the Securities Exchange Act of 1934, as amended. Jeffrey L. Kodosky and James J. Truchard have made periodic sales of our stock pursuant to such plans.
The information required by this Item pursuant to Item 403 of Regulation S-K concerning security ownership of certain beneficial owners and management will appear in our Proxy Statement under the section “Security Ownership” and such information is incorporated herein by reference.
The information required by this Item pursuant to Item 201(d) of Regulation S-K concerning securities authorized for issuance under equity compensation plans will appear in our Proxy Statement under the section “Equity Compensation Plans Information” and such information is incorporated herein by reference.
ITEM 13. CERTAIN RELATIONSHIPS AND RELATED TRANSACTIONS AND DIRECTOR INDEPENDENCE During 2002, we irrevocably contributed approximately $3.6 million to the National Instruments Foundation, a 501(c)(3) charitable foundation established in 2002 for the purpose of continued promotion of scientific and engineering research and education at higher education institutions worldwide. Two of the four directors of the National Instruments Foundation are current officers of National Instruments.
In addition, the information required by this Item pursuant to Item 404 of Regulation S-K will appear in our Proxy Statement under the section “Certain Relationships and Related Transactions” and such information is incorporated herein by reference.
The information required by this Item pursuant to Item 407(a) of Regulation S-K regarding the independence of our directors will appear in our Proxy Statement under the section “Corporate Governance” and such information is incorporated herein by reference.
ITEM 14. PRINCIPAL ACCOUNTING FEES AND SERVICES
The information concerning principal accountant fees and services required by this Item is incorporated by reference to our Proxy Statement under the heading “Independent Public Accountants.”
The information concerning pre-approval policies for audit and non-audit services required by this Item is incorporated by reference to our Proxy Statement under the heading “Audit Committee Pre-Approval of Audit and Permissible Non-Audit Services of Independent Auditors.”
PART IV
ITEM 15. EXHIBITS AND FINANCIAL STATEMENT SCHEDULES
(a) Documents FilesFiled with Report
1. Financial Statements.
2. Financial Statement Schedules.
None
3. Exhibits.
ExhibitNumber Description 3.1(2) Certificate of Incorporation, as amended, of the Company. 3.2(11) Amended and Restated Bylaws of the Company. 3.3(4) Certificate of Designation of Rights, Preferences and Privileges of Series A Participating Preferred Stock of the Company. 4.1(1) Specimen of Common Stock certificate of the Company. 4.2(3) Rights Agreement dated as of January 21, 2004, between the Company and EquiServe Trust Company, N.A. 10.1(1) Form of Indemnification Agreement. 10.2(5) 1994 Incentive Plan, as amended.* 10.3(9) 1994 Employee Stock Purchase Plan.* 10.5(7) 2005 Incentive Plan.* 10.6(8) National Instruments Corporation Annual Incentive Program.* 10.7(6) National Instruments Corporation Annual Incentive Program, as amended.* 10.8(10) Form of Restricted Stock Unit Award Agreement (Non-Employee Director).* 10.9(10) Form of Restricted Stock Unit Award Agreement (Performance Vesting).* 10.10(10) Form of Restricted Stock Unit Award Agreement (Current Employee).* 10.11(10) Form of Restricted Stock Unit Award Agreement (Newly Hired Employee).* 21.1 Subsidiaries of the Company. 23.1 Consent of Independent Registered Public Accounting Firm F-4Firm.Consolidated Balance SheetsF-5Consolidated Statements of IncomeF-6Consolidated Statements of Cash FlowsF-7Consolidated Statements of Stockholders' EquityF-8Notes to Consolidated Financial StatementsF-9
2.
Financial Statements Schedules.
See Schedule II - Valuation and Qualifying Accounts at page S-1
3.
Exhibits.
Exhibit
NumberDescription
3.1
(2)
Certificate of Incorporation, as amended, of the Company.
3.2
(2)
Amended and Restated Bylaws of the Company.
3.3
(4)
Certificate of Designation of Rights, Preferences and Privileges of Series A Participating Preferred Stock of the Company.
4.1
(1)
Specimen of Common Stock certificate of the Company.
4.2
(3)
Rights Agreement dated as of January 21, 2004, between the Company and EquiServe Trust Company, N.A.
10.1
(1)
Form of Indemnification Agreement.
10.2
(5)
1994 Incentive Plan, as amended.*
10.3
1994 Employee Stock Purchase Plan.*
10.4
(6)
Long-Term Incentive Program.*
10.5
(7)
2005 Incentive Plan.*
10.6
(8)
National Instruments Corporation Annual Incentive Program.*
10.7
(9)
2006 Annual Incentive Program Goals and Awards for the Named Executive Officers.*
10.8
(10)
Form of Restricted Stock Unit Award Agreement (Non-Employee Director).*
10.9
(10)
Form of Restricted Stock Unit Award Agreement (Performance Vesting).*
10.10
(10)
Form of Restricted Stock Unit Award Agreement (Current Employee).*
10.11
(10)
Form of Restricted Stock Unit Award Agreement (Newly Hired Employee).*
21.1
Subsidiaries of the Company.
23.1
Consent of Independent Registered Public Accounting Firm.
23.2
Consent of Independent Registered Public Accounting Firm.
24.0
Power of Attorney (included on page 33).
31.1
Certification of Chief Executive Officer Pursuant to 18 U.S.C. Section 1350, as Adopted Pursuant to Section 302 of the Sarbanes-Oxley Act of 2002.
31.2
Certification of Chief Financial Officer Pursuant to 18 U.S.C. Section 1350, as Adopted Pursuant to Section 302 of the Sarbanes-Oxley Act of 2002.
32.1
Certification of Chief Executive Officer and Chief Financial Officer Pursuant to 18 U.S.C. Section 1350, as Adopted Pursuant to Section 906 of the Sarbanes-Oxley Act of 2002.
24.0 Power of Attorney (included on page 41). 31.1 Certification of Chief Executive Officer Pursuant to 18 U.S.C. Section 1350, as Adopted Pursuant to Section 302 of the Sarbanes-Oxley Act of 2002. 31.2 Certification of Chief Financial Officer Pursuant to 18 U.S.C. Section 1350, as Adopted Pursuant to Section 302 of the Sarbanes-Oxley Act of 2002. 32.1 Certification of Chief Executive Officer and Chief Financial Officer Pursuant to 18 U.S.C. Section 1350, as Adopted Pursuant to Section 906 of the Sarbanes-Oxley Act of 2002.
(1) Incorporated by reference to the Company's Registration Statement on Form S-1 (Reg. No. 33-88386) declared effective March 13, 1995.
(2) Incorporated by reference to the same-numbered exhibit filed with the Company's Annual Report on Form 10-K for the fiscal year ended December 31, 2003.
(3) Incorporated by reference to exhibit 4.1 filed with the Company's currentCurrent Report on Form 8-K filed on January 28, 2004.
(4) Incorporated by reference to the same-numbered exhibit filed with the Company's Form 8-K on April 27, 2004.
(5) Incorporated by reference to the same-numbered exhibit filed with the Company's Form 10-Q on August 5, 2004.
(6) Incorporated by reference to exhibit 99.2 filed with the Company's Current Report on Form 8-K filed on October 28, 2008. (7) Incorporated by reference to exhibit A of the Company's Proxy Statement dated and filed on April 4, 2005. (8) Incorporated by reference to exhibit 99.2 filed with the Company's Current Report on Form 8-K filed on October 22, 2008. (9) Incorporated by reference to exhibit 10.3 filed with the Company's Annual Report on Form 10-K for the fiscal year ended December 31, 2006. (10) Incorporated by reference to the same-numbered exhibit filed with the Company's Form 10-Q on August 2, 2006. (11) Incorporated by reference to the same-numbered exhibit filed with the Company's Annual Report on Form 10-K for the fiscal year ended December 31, 2004.2007.
(7)Incorporated by reference to exhibit A of the Company's Proxy Statement dated and filed on April 4, 2005.
(8)Incorporated by reference to the exhibit 10.1 filed with the Company's Current Report on Form 8-K filed June 27, 2006.
(9)Incorporated by reference to the exhibit 10.2 filed with the Company's Current Report on Form 8-K filed June 27, 2006.
(10)Incorporated by reference to the same-numbered exhibit filed with the Company's Form 10-Q filed on August 2, 2006.
* Management Contract or Compensatory Plan or Arrangement.
(b) Exhibits
See Item 15(a)(3) above.
(c) Financial Statement Schedules
See Item 15(a)(2) above.
SIGNATURES
Pursuant to the requirements of Section 13 or 15(d) of the Securities Exchange Act of 1934, the registrant has duly caused this report to be signed on its behalf by the undersigned thereunto duly authorized.Registrant Registrant
NATIONAL INSTRUMENTS CORPORATION
February 20, 200717, 2010
BY: By:
/s/ Dr. James J. TruchardDr. James J. Truchard
Chairman of the Board and President
POWER OF ATTORNEY
KNOW ALL PERSONS BY THESE PRESENTS, that each person whose signature appears below constitutes and appoints Dr. James J. Truchard and Alexander M. Davern, jointly and severally, his or her attorneys-in-fact, each with the power of substitution, for him or her in any and all capacities, to sign any amendments to this Report on Form 10-K, and to file the same, with exhibits thereto and other documents in connection therewith, with the Securities and Exchange Commission, hereby ratifying and conformingconfirming all that each of said attorneys-in-fact, or his substitute or substitutes, may do or cause to be done by virtue hereof.
Pursuant to the requirements of the Securities Exchange Act of 1934, this report has been signed below by the following persons on behalf of the registrant and in the capacities and on the dates indicated.Signature
Capacity in Which Signed
Date
/s/ Dr. James J. Truchard
Chairman of the Board and President(Principal Executive Officer) February 17, 2010 Dr. James J. Truchard
Chairman of the Board and
President (Principal Executive Officer)
February 20, 2007
/s/ Alex M. Davern
Chief Financial Officer and Treasurer(Principal Financial and Accounting Officer) February 17, 2010 Alex M. Davern
Chief Financial Officer
and Treasurer (Principal Financial
and Accounting Officer)
February 20, 2007
/s/ Jeffrey L. Kodosky
Director February 17, 2010 Jeffrey L. Kodosky
Director
February 16, 2007
/s/ Dr. Donald M. Carlton
Director February 17, 2010 Dr. Donald M. Carlton
Director
February 16, 2007
/s/ Dr. Ben G. Streetman
Dr. Ben G. Streetman
Director
February 16, 2007
/s/ R. Gary Daniels
R. Gary Daniels
Director
February 16, 2007
/s/ Charles J. Roesslein
Director February 17, 2010 Charles J. Roesslein
Director
February 16, 2007
/s/ Duy-Loan T. Le
Director February 17, 2010 Duy-Loan T. Le
/s/ John Medica Director
February 16, 200717, 2010 John Medica
NATIONAL INSTRUMENTS CORPORATION
INDEX TO FINANCIAL STATEMENTS
Page No. Financial Statements: Page No.Report of Independent Registered Public Accounting FirmF-2Report of Independent Registered Public Accounting Firm on Internal Control over Financial Reporting F-3F-2 Report of Independent Registered Public Accounting Firm F-4F-3 Consolidated Balance Sheets as of December 31, 20062009 and 20052008 F-5F-4 Consolidated Statements of Income for each of the Three Years in the period Ended December 31, 20062009 F-6F-5 Consolidated Statements of Cash Flows for each of the Three Years in the period Ended December 31, 20062009 F-7F-6 Consolidated Statements of Stockholders' Equity for each of the Three Years in the period Ended December 31, 20062009 F-8F-7 Notes to Consolidated Financial Statements F-9F-8
Financial Statement Schedules:For each of the Three Years in the period Ended December 31, 2006 Schedule II--Valuation and Qualifying AccountsS-1
All other schedules are omitted because they are not applicable.
The Board of Directors and Shareholders of National Instruments Corporation:
We have audited the accompanying consolidated balance sheets of National Instruments Corporation and subsidiaries as of December 31, 20062009 and 20052008, and the related consolidated statements of income, stockholders’stockholders' equity, and cash flows for each of the twothree fiscal years in the period ended December 31, 2006. Our audits also included the financial statement schedule listed in the Index at Item 15.2009. These financial statements and schedule are the responsibility of the Company’sCompany's management. Our responsibility is to express an opinion on these financial statements and schedule based on our audits.
We conducted our audits in accordance with the standards of the Public Company Accounting Oversight Board (United States). Those standards require that we plan and perform the audit to obtain reasonable assurance about whether the financial statements are free of material misstatement. An audit includes examining, on a test basis, evidence supporting the amounts and disclosures in the financial statements. An audit also includes assessing the accounting principles used and significant estimates made by management, as well as evaluating the overall financial statement presentation. We believe that our audits provide a reasonable basis for our opinion.
In our opinion, the financial statements referred to above present fairly, in all material respects, the consolidated financial position of National Instruments Corporation and subsidiaries at December 31, 20062009 and 20052008, and the consolidated results of their operations and their cash flows for each of the twothree fiscal years in the period ended December 31, 2006,2009, in conformity with U.S. generally accepted accounting principles. Also, in our opinion, the related financial statement schedule, when considered in relation to the basic financial statements taken as a whole, presents fairly in all material respects the information set forth therein.As discussed in Note 1 to the consolidated financial statements, effective January 1, 2006, the Company changed its method of accounting for stock-based compensation to conform to Statement of Financial Accounting Standards No. 123(R), Share-Based Payment.
We also have audited, in accordance with the standards of the Public Company Accounting Oversight Board (United States), the effectiveness of National Instruments Corporation’sCorporation internal control over financial reporting as of December 31, 2006,2009, based on criteria established in Internal Control-Integrated Framework issued by the Committee of Sponsoring Organizations of the Treadway Commission and our report dated February 15, 200717, 2010 expressed an unqualified opinion thereon./s/ Ernst & Young LLP
Austin, Texas
February 15, 2007
/s/ Ernst & Young LLP
Austin, TexasFebruary 17, 2010
Report of Independent Registered Public Accounting Firm on Internal Control over Financial Reporting
The Board of Directors and Shareholders of National Instruments Corporation:
We have audited management’s assessment, included in the Management’s Report on Internal Control over Financial Reporting, that National Instruments Corporation maintained effectiveCorporation’s internal control over financial reporting as of December 31, 2006,2009, based on criteria established in Internal Control—Integrated Framework issued by the Committee of Sponsoring Organizations of the Treadway Commission (the COSO criteria). National Instruments Corporation’s management is responsible for maintaining effective internal control over financial reporting, and for its assessment of the effectiveness of internal control over financial reporting.reporting included in the accompanying Management Report on Internal Control over Financial Reporting. Our responsibility is to express an opinion on management’s assessment and an opinion on the effectiveness of the company’s internal control over financial reporting based on our audit.
We conducted our audit in accordance with the standards of the Public Company Accounting Oversight Board (United States). Those standards require that we plan and perform the audit to obtain reasonable assurance about whether effective internal control over financial reporting was maintained in all material respects. Our audit included obtaining an understanding of internal control over financial reporting, evaluating management’s assessment,assessing the risk that a material weakness exists, testing and evaluating the design and operating effectiveness of internal control based on the assessed risk, and performing such other procedures as we considered necessary in the circumstances. We believe that our audit provides a reasonable basis for our opinion.
A company’s internal control over financial reporting is a process designed to provide reasonable assurance regarding the reliability of financial reporting and the preparation of financial statements for external purposes in accordance with generally accepted accounting principles. A company’s internal control over financial reporting includes those policies and procedures that (1) pertain to the maintenance of records that, in reasonable detail, accurately and fairly reflect the transactions and dispositions of the assets of the company; (2) provide reasonable assurance that transactions are recorded as necessary to permit preparation of financial statements in accordance with generally accepted accounting principles, and that receipts and expenditures of the company are being made only in accordance with authorizations of management and directors of the company; and (3) provide reasonable assurance regarding prevention or timely detection of unauthorized acquisition, use or disposition of the company’s assets that could have a material effect on the financial statements.
Because of its inherent limitations, internal control over financial reporting may not prevent or detect misstatements. Also, projections of any evaluation of effectiveness to future periods are subject to the risk that controls may become inadequate because of changes in conditions, or that the degree of compliance with the policies or procedures may deteriorate.
In our opinion, management’s assessment that National Instruments Corporation maintained effective internal control over financial reporting as of December 31, 2006, is fairly stated, in all material respects, based on the COSO criteria. Also, in our opinion, National Instruments Corporation maintained, in all material respects, effective internal control over financial reporting as of December 31, 2006,2009, based on the COSO criteria.
We also have audited, in accordance with the standards of the Public Company Accounting Oversight Board (United States), the consolidated balance sheets of National Instruments Corporation as of December 31, 20062009 and 2005,2008, and the related consolidated statements of income, stockholders’ equity, and cash flows for each of the twothree years in the period ended December 31, 2006 of National Instruments Corporation2009 and our report dated February 15, 200717, 2010 expressed an unqualified opinion thereon./s/ Ernst & Young LLP
Austin, Texas
February 15, 2007
/s/ Ernst & Young LLP
Austin, TexasFebruary 17, 2010
Report of Independent Registered Public Accounting Firm
To the Board of Directors and Stockholders of National Instruments Corporation:
In our opinion, the consolidated statements of income, of stockholders’ equity and of cash flows (appearing on pages F-6 through F-8 of this National Instruments Corporation 2006 Annual Report on Form 10-K) for the year ended December 31, 2004 present fairly, in all material respects, the results of operations and cash flows of National Instruments Corporation and its subsidiaries for the year ended December 31, 2004, in conformity with accounting principles generally accepted in the United States of America. In addition, in our opinion, the financial statement schedule for the year ended December 31, 2004 presents fairly, in all material respects, the information set forth therein when read in conjunction with the related consolidated financial statements. These financial statements and financial statement schedule are the responsibility of the Company’s management. Our responsibility is to express an opinion on these financial statements and financial statement schedule based on our audit. We conducted our audit of these statements in accordance with the standards of the Public Company Accounting Oversight Board (United States). Those standards require that we plan and perform the audit to obtain reasonable assurance about whether the financial statements are free of material misstatement. An audit includes examining, on a test basis, evidence supporting the amounts and disclosures in the financial statements, assessing the accounting principles used and significant estimates made by management, and evaluating the overall financial statement presentation. We believe that our audit provides a reasonable basis for our opinion.
/s/ PricewaterhouseCoopers LLP
Austin, Texas
March 4, 2005
NATIONAL INSTRUMENTS CORPORATION
(in thousands, except share data)December 31,
2006
2005
Assets
Current assets: Cash and cash equivalents $ 100,287 $ 55,864 Short-term investments 150,190 119,846 Accounts receivable, net 117,235 95,733 Inventories, net 77,138 62,827 Prepaid expenses and other current assets 11,393 13,146 Deferred income taxes, net 20,851 14,890
Total current assets 477,094 362,306 Property and equipment, net 145,425 144,330 Goodwill, net 53,343 52,533 Intangible assets, net 40,065 43,602 Other long-term assets 5,293 5,565
Total assets $ 721,220 $ 608,336
Liabilities and Stockholders' Equity
Current liabilities: Accounts payable $ 32,001 $ 30,832 Accrued compensation 20,912 18,084 Deferred revenue 22,208 16,018 Accrued expenses and other liabilities 15,934 8,838 Other taxes payable 11,527 13,848
Total current liabilities 102,582 87,620 Deferred income taxes 21,956 16,866
Total liabilities 124,538 104,486
Commitments and contingencies Stockholders' equity: Preferred stock: par value $0.01; 5,000,000 shares authorized; none issued and outstanding — — Common stock: par value $0.01; 180,000,000 shares authorized; 79,883,837 and 79,276,086 shares issued and outstanding, respectively 799 793 Additional paid-in capital 109,851 91,430 Deferred stock-based compensation — (16,547 ) Retained earnings 483,533 429,859 Accumulated other comprehensive income (loss) 2,499 (1,685 )
Total stockholders' equity 596,682 503,850
Total liabilities and stockholders' equity $ 721,220 $ 608,336
December 31, 2009 2008 Assets Current assets: Cash and cash equivalents $ 201,465 $ 229,400 Short-term investments 87,196 6,220 Accounts receivable, net 103,957 121,548 Inventories, net 86,515 107,358 Prepaid expenses and other current assets 36,523 43,062 Deferred income taxes, net 16,522 21,435 Total current assets 532,178 529,023 Long-term investments — 10,500 Property and equipment, net 153,265 154,477 Goodwill, net 64,779 64,561 Intangible assets, net 43,390 41,915 Other long-term assets 19,417 32,115 Total assets $ 813,029 $ 832,591 Liabilities and Stockholders’ Equity Current liabilities: Accounts payable $ 23,502 $ 30,876 Accrued compensation 14,934 22,012 Deferred revenue 57,242 45,514 Accrued expenses and other liabilities 8,560 18,848 Other taxes payable 14,181 13,481 Total current liabilities 118,419 130,731 Deferred income taxes 25,012 25,157 Liability for uncertain tax positions 11,062 9,364 Other long-term liabilities 4,116 2,901 Total liabilities 158,609 168,153 Commitments and contingencies Stockholders’ equity: Preferred stock: par value $0.01; 5,000,000 shares authorized; none issued and outstanding — — Common stock: par value $0.01; 180,000,000 shares authorized;77,367,874 and 77,193,063 shares issued and outstanding, respectively 774 772 Additional paid-in capital 336,446 300,352 Retained earnings 303,655 352,831 Accumulated other comprehensive income 13,545 10,483 Total stockholders’ equity 654,420 664,438 Total liabilities and stockholders’ equity $ 813,029 $ 832,591
The accompanying notes are an integral part of these financial statements.
NATIONAL INSTRUMENTS CORPORATION
(in thousands, except per share data)For the Years Ended December 31,
2006
2005
2004
Net sales $ 660,407 $ 571,841 $ 514,088 Cost of sales (1) 170,326 149,309 135,473
Gross profit 490,081 422,532 378,615
Operating expenses: Sales and marketing (2) 235,072 211,280 188,727 Research and development (3) 113,095 87,841 84,692 General and administrative (4) 54,192 45,199 42,500
Total operating expenses 402,359 344,320 315,919
Operating income 87,722 78,212 62,696
Other income (expense): Interest income 6,847 3,758 2,905 Net foreign exchange gain (loss) 740 (1,566 ) 1,287 Other income (expense), net (7 ) 276 (2,075 )
Income before income taxes 95,302 80,680 64,813 Provision for income taxes (5) 22,594 19,163 16,203
Net income $ 72,708 $ 61,517 $ 48,610
Basic earnings per share $ 0.91 $ 0.78 $ 0.62
Weighted average shares outstanding - basic 79,519 78,552 78,680
Diluted earnings per share $ 0.89 $ 0.76 $ 0.59
Weighted average shares outstanding - diluted 81,519 80,910 82,096
Dividends declared per share $ 0.24 $ 0.20 $ 0.18
The following footnotes apply to the years ended December 31, 2006, 2005 and 2004:
(1)including $598, $101 and $0, respectively, of non-cash stock compensation.(2)including $6,008, $500 and $0, respectively, of non-cash stock compensation.(3)including $5,201, $598 and $0, respectively, of non-cash stock compensation.(4)including $2,333, $345 and $0, respectively, of non-cash stock compensation.(5)including $2,403, $364 and $0, respectively, of benefit from non-cash stock compensation.
For the YearsEnded December 31, 2009 2008 2007 Net sales: Product $ 623,736 $ 765,441 $ 701,589 Software maintenance 52,858 55,096 38,789 Total net sales 676,594 820,537 740,378 Cost of sales: Product 164,700 201,064 180,556 Software maintenance 5,184 6,045 4,711 Total cost of sales 169,884 207,109 185,267 Gross profit 506,710 613,428 555,111 Operating expenses: Sales and marketing 269,267 307,409 264,060 Research and development 132,974 143,140 126,515 General and administrative 57,938 67,162 62,445 Total operating expenses 460,179 517,711 453,020 Operating income 46,531 95,717 102,091 Other income (expense): Interest income 1,629 5,996 9,822 Net foreign exchange gain (loss) 734 (3,737 ) 1,672 Other income (expense), net 1,351 161 (158 ) Income before income taxes 50,245 98,137 113,427 Provision for income taxes 33,160 13,310 6,394 Net income $ 17,085 $ 84,827 $ 107,033 Basic earnings per share $ 0.22 $ 1.08 $ 1.35 Weighted average shares outstanding - basic 77,520 78,567 79,468 Diluted earnings per share $ 0.22 $ 1.07 $ 1.32 Weighted average shares outstanding – diluted �� 78,026 79,515 81,043 Dividends declared per share $ 0.48 $ 0.44 $ 0.34
The accompanying notes are an integral part of these financial statements.
NATIONAL INSTRUMENTS CORPORATION
(in thousands)For the Years Ended December 31,
2006
2005
2004
Cash flow from operating activities: Net income $ 72,708 $ 61,517 $ 48,610 Adjustments to reconcile net income to net cash provided by operating activities: Depreciation and amortization 34,181 28,553 25,592 Stock-based compensation 14,507 1,545 — Impairment of cost method investment — — 2,500 Gain on sale of subsidiary — — (242 ) Provision for (benefit from) deferred income taxes (339 ) 3,219 (825 ) Tax benefit from stock option plans (4,271 ) 675 3,071 Changes in operating assets and liabilities: Accounts receivable (21,502 ) (4,080 ) (9,342 ) Inventories (14,311 ) (4,572 ) (15,230 ) Prepaid expenses and other assets 2,116 (2,177 ) 4,624 Accounts payable 1,169 4,647 (4,359 ) Deferred revenue 6,190 3,847 3,385 Taxes and other liabilities 7,443 (5,124 ) 7,848
Net cash provided by operating activities 97,891 88,050 65,632
Cash flow from investing activities: Proceeds from sale of subsidiary — — 680 Acquisitions, net of cash received — (63,891 ) — Capital expenditures (18,503 ) (15,383 ) (12,596 ) Capitalization of internally developed software (7,370 ) (13,380 ) (5,007 ) Additions to other intangibles (3,115 ) (4,288 ) (3,050 ) Purchases of short-term investments (244,238 ) (124,227 ) (125,954 ) Sales and maturities of short-term investments 213,894 154,773 116,789
Net cash used in investing activities (59,332 ) (66,396 ) (29,138 )
Cash flow from financing activities: Proceeds from issuance of common stock 37,146 23,222 16,826 Repurchase of common stock (16,519 ) (49,452 ) (16,064 ) Dividends paid (19,034 ) (15,776 ) (14,486 ) Tax benefit from stock option plans 4,271 — —
Net cash provided by (used in) financing activities 5,864 (42,006 ) (13,724 )
Net change in cash and cash equivalents 44,423 (20,352 ) 22,770 Cash and cash equivalents at beginning of period 55,864 76,216 53,446
Cash and cash equivalents at end of period $ 100,287 $ 55,864 $ 76,216
Cash paid for interest and income taxes Interest $ 41 $ 17 $ 31 Income taxes $ 9,827 $ 15,117 $ 10,622
For the Years Ended December 31, 2009 2008 2007 Cash flow from operating activities: Net income $ 17,085 $ 84,827 $ 107,033 Adjustments to reconcile net income to net cash provided by operating activities: Depreciation and amortization 38,365 37,103 36,605 Stock-based compensation 20,299 19,854 17,754 Tax expense/(benefit from) deferred income taxes 17,196 (4,475 ) (16,954 ) Tax expense/(benefit from) stock option plans 1,450 (1,213 ) (2,964 ) Changes in operating assets and liabilities: Accounts receivable 17,591 12,159 (14,047 ) Inventories 20,843 (24,578 ) (5,537 ) Prepaid expenses and other assets 12,740 (10,340 ) (12,330 ) Accounts payable (7,374 ) (5,648 ) 4,186 Deferred revenue 11,728 9,423 13,883 Taxes and other liabilities (14,272 ) 4,706 19,743 Net cash provided by operating activities 135,651 121,818 147,372 Cash flow from investing activities: Acquisitions, net of cash received — (17,310 ) — Capital expenditures (20,847 ) (25,771 ) (24,864 ) Capitalization of internally developed software (12,583 ) (9,487 ) (8,263 ) Additions to other intangibles (4,602 ) (3,010 ) (6,447 ) Purchases of short-term investments (93,087 ) (9,061 ) (87,586 ) Sales and maturities of short-term investments 19,204 86,179 143,938 Purchases of foreign currency option contracts — (2,784 ) (2,242 ) Net cash provided by (used in) investing activities (111,915 ) 18,756 14,536 Cash flow from financing activities: Proceeds from issuance of common stock 21,672 31,150 36,460 Repurchase of common stock (34,585 ) (103,641 ) (79,728 ) Dividends paid (37,308 ) (34,735 ) (27,052 ) Tax (expense)/benefit from stock option plans (1,450 ) 1,213 2,964 Net cash (used in) financing activities (51,671 ) (106,013 ) (67,356 ) Net change in cash and cash equivalents (27,935 ) 34,561 94,552 Cash and cash equivalents at beginning of period 229,400 194,839 100,287 Cash and cash equivalents at end of period $ 201,465 $ 229,400 $ 194,839 Cash paid for interest and income taxes: Interest $ 23 $ 116 $ 159 Income taxes $ 14,608 $ 17,214 $ 21,147
The accompanying notes are an integral part of these financial statements.
NATIONAL INSTRUMENTS CORPORATION
(in thousands, except share data)Common
Stock
Shares
Common
Stock
Amount
Additional
Paid-In
Capital
Deferred
Compensation
Retained
Earnings
Accumulated
Other
Comprehensive
Income/(Loss)
Total
Stockholders'
Equity
Balance at December 31, 2003 78,269,235 $ 783 $ 95,070 $ — $ 349,994 $ (6,395 ) $ 439,452 Net income 48,610 48,610 Foreign currency translation adjustment (net of $1,013 tax expense) 3,050 3,050 Unrealized loss on securities available for sale (net of $0 tax benefit) (417 ) (417 ) Unrealized gain on derivative instruments (net of $2,136 tax expense) 6,407 6,407
Total comprehensive income 57,650
Issuance of common stock under employee plans, including tax benefits 1,234,195 12 19,885 19,897 Repurchase and retirement of common stock (557,850 ) (6 ) (16,058 ) (16,064 ) Dividends declared (14,486 ) (14,486 )
Balance at December 31, 2004 78,945,580 $ 789 $ 98,897 $ — $ 384,118 $ 2,645 $ 486,449 Net income 61,517 61,517 Foreign currency translation adjustment(net of $1,636 tax benefit) (5,181 ) (5,181 ) Unrealized gain on securities available for sale (net of $0 tax expense) 50 50 Unrealized gain on derivative instruments (net of $253 tax expense) 801 801
Total comprehensive income 57,187
Net activity related to restricted stock units 813,305 8 18,084 (16,547 ) 1,545 Issuance of common stock under employee plans, including tax benefits 1,573,547 16 23,206 23,222 Repurchase and retirement of common stock (2,056,346 ) (20 ) (49,432 ) (49,452 ) Dividends declared (15,776 ) (15,776 ) Disqualified dispositions 675 675
Balance at December 31, 2005 79,276,086 $ 793 $ 91,430 ($ 16,547 ) $ 429,859 ($ 1,685 ) $ 503,850 Net income 72,708 72,708 Foreign currency translation adjustment (net of $1,434 tax expense) 4,542 4,542 Unrealized gain on securities available for sale (net of $0 tax expense) 78 78 Unrealized loss on derivative instruments (net of $138 tax benefit) (436 ) (436 )
Total comprehensive income 76,892
Issuance of common stock under employee plans, including tax benefits 1,915,172 19 37,127 37,146 Stock-based compensation under
restricted stock plan 113,794 1 5,082 5,083 Stock-based compensation under stock
option and employee stock purchase plans 9,424 9,424 Repurchase and retirement of common stock (607,910 ) (6 ) (16,513 ) (16,519 ) Effect of adoption of SFAS 123R (813,305 ) (8 ) (16,539 ) 16,547 — Dividends declared (19,034 ) (19,034 ) Disqualified dispositions (160 ) (160 )
Balance at December 31, 2006 $ 79,883,837 $ 799 $ 109,851 $ — $ 483,533 $ 2,499 $ 596,682
CommonStockShares CommonStockAmount AdditionalPaid-InCapital DeferredCompensation RetainedEarnings AccumulatedOtherComprehensiveIncome/(Loss) TotalStockholders’Equity Balance at December 31, 2006 79,883,837 $ 799 $ 207,808 $ — $ 385,480 $ 2,499 $ 596,586 Net income 107,033 107,033 Foreign currency translation adjustment(net of $286 tax expense) 4,483 4,483 Unrealized gain on securities available-for-sale(net of $13 tax expense) 200 200 Unrealized loss on derivative instruments(net of $7 tax benefit) (117 ) (117 ) Total comprehensive income 111,599 Issuance of common stock under employee plans, including tax benefits 2,251,657 22 36,438 36,460 Stock-based compensation 17,754 17,754 Repurchase and retirement of common stock (2,730,135 ) (27 ) (7,102 ) (72,599 ) (79,728 ) Dividends paid (27,052 ) (27,052 ) Disqualified dispositions 5,467 5,467 Balance at December 31, 2007 79,405,359 $ 794 $ 260,365 $ — $ 392,862 $ 7,065 $ 661,086 Net income 84,827 84,827 Foreign currency translation adjustment(net of $681 tax benefit) (4,188 ) (4,188 ) Unrealized loss on securities available-for-sale(net of $82 tax benefit) (502 ) (502 ) Unrealized gain on derivative instruments(net of $1,320 tax expense) 8,108 8,108 Total comprehensive income 88,245 Issuance of common stock under employee plans, including tax benefits 1,897,746 19 31,131 31,150 Stock-based compensation 19,854 19,854 Repurchase and retirement of common stock (4,110,042 ) (41 ) (13,477 ) (90,123 ) (103,641 ) Dividends paid (34,735 ) (34,735 ) Disqualified dispositions 2,479 2,479 Balance at December 31, 2008 77,193,063 $ 772 $ 300,352 $ — $ 352,831 $ 10,483 $ 664,438 Net income 17,085 17,085 Foreign currency translation adjustment(net of $1,799 tax expense) 927 927 Unrealized gain on securities available-for-sale(net of $1,093 tax expense) 563 563 Unrealized gain on derivative instruments(net of $3,053 tax expense) 1,572 1,572 Total comprehensive income 20,147 Issuance of common stock under employee plans, including tax benefits 1,618,252 16 21,656 21,672 Stock-based compensation 20,574 20,574 Repurchase and retirement of common stock (1,443,441 ) (14 ) (5,618 ) (28,953 ) (34,585 ) Dividends paid (37,308 ) (37,308 ) Disqualified dispositions (518 ) (518 ) Balance at December 31, 2009 77,367,874 $ 774 $ 336,446 $ — $ 303,655 $ 13,545 $ 654,420
The accompanying notes are an integral part of these financial statements.
NATIONAL INSTRUMENTS CORPORATION
Note 1:1 – Operations and summary of significant accounting policies
National Instruments Corporation is a Delaware corporation. We engage in the design, development, manufacture and marketing of instrumentationprovide flexible application software and specialty computer plug-in cards and accessoriesmodular, multifunction hardware that users combine with industry standardindustry-standard computers, networks and the Internetthird party devices to create measurement, automation and automation systems.embedded systems, which we also refer to as “virtual instruments.” Our approach gives customers the ability to quickly and cost-effectively design, prototype and deploy unique custom-defined solutions for their design, control and test application needs. We offer hundreds of products used to create virtual instrumentation systems for general, commercial, industrial and scientific applications. Our products may be used in different environments, and consequently, specific application of our products is determined by the customer and generally is not known to us. We approach all markets with essentially the same products, which are used in a variety of applications from research and development to production testing, monitoring and industrial control. The following industries and applications are served by us worldwide: advanced research, automotive, commercial aerospace, computers and electronics, continuous process manufacturing, education, government/defense, medical research/pharmaceutical, power/energy, semiconductors, automated test equipment, telecommunications and others. TheThese financial statements have been prepared in accordance with accounting principles generally accepted in the United States of America.
Principles of consolidation
The consolidated financial statementsConsolidated Financial Statements include the accounts of National Instruments Corporation and its subsidiaries. All significant intercompany accounts and transactions have been eliminated.
We have historically recorded the excess of the purchase price over the par or stated value of retired shares of our common stock as a reduction of additional paid-in capital. We completed our review of this accounting policy under FASB ASC 505, Equity (FASB ASC 505). Based on this review, we have reclassified a portion of the excess of the purchase price over the par or stated value of retired shares of our common stock from a reduction of additional paid-in capital to a reduction of retained earnings. This reclassification did not have any impact on previously reported statements of income, earning per share amounts, statements of cash flows or total stockholders’ equity. Certain prior year amounts from our Consolidated Statements of Stockholders’ Equity have been reclassified to conform to the 2009 presentation as shown in the following table:
APIC RE 2006 Beginning Balance 12/31/06 balance as previously reported $ 109,851 $ 483,437 Cumulative reclassification of share repurchase 97,957 (97,957 ) 12/31/06 balance as reported in current Form 10-K $ 207,808 $ 385,480 2007 Activity Repurchase and retirement of common stock as previously reported $ (79,701 ) $ — Reclassification of 2007 activity 72,599 (72,599 ) Repurchase and retirement of common stock as reported in current Form 10-K $ (7,102 ) $ (72,599 ) 2007 Ending Balance 12/31/07 balance as previously reported $ 89,809 $ 563,418 Cumulative reclassification of share repurchase 170,556 (170,556 ) 12/31/07 balance as reported in current Form 10-K $ 260,365 $ 392,862 2008 Activity Repurchase and retirement of common stock as previously reported $ (103,600 ) $ — Reclassification of 2008 activity 90,123 (90,123 ) Repurchase and retirement of common stock as reported in current Form 10-K $ (13,477 ) $ (90,123 ) 2008 Ending Balance 12/31/08 balance as previously reported $ 39,673 $ 613,510 Cumulative reclassification of share repurchase 260,679 (260,679 ) 12/31/08 balance as reported in current Form 10-K $ 300,352 $ 352,831
Going forward, we will account for the retired shares of our common stock by recording the excess of the purchase price over par value as a reduction of retained earnings, to the extent that the excess of the purchase price over par value exceeds the original proceeds received from the issuance of the same shares of our common stock, as prescribed by FASB ASC 505.
Use of estimates Judgments and estimates are required in the
The preparation of our financial statements to conformin conformity with U.S. generally accepted accounting principles. Theprinciples requires us to make estimates and underlying assumptions that affect the reported amounts of assets, liabilities, revenues, expenses and liabilities,related disclosures of contingent assets and liabilities. We base our estimates on past experience and other assumptions that we believe are reasonable under the disclosurecircumstances, and we evaluate these estimates on an ongoing basis. Our critical accounting policies are those that affect our financial statements materially and involve difficult, subjective or complex judgments by management. Although these estimates are based on management's best knowledge of contingencies atcurrent events and actions that may impact the balance sheet date andcompany in the reported revenues and expenses forfuture, actual results may be materially different from the period. Actual results could differ from those estimates.
Cash and cash equivalents
Cash and cash equivalents include cash and highly liquid investments with maturities of three months or less at the date of acquisition. Short-term
Short-Term Investments
We maintain an investment portfolio of various types of security holdings and maturities. Pursuant to FASB ASC 820, cash equivalents and short-term investments Short-term available-for-sale are valued using the market approach (Level 1) based on unadjusted quoted prices in active markets for identical assets at the measurement date. Our short-term investments also include auction rate securities that we originally purchased for $8.6 million. These auction rate securities consist of corporate, state and municipaleducation loan revenue bonds. Auction rate securities with readily determinableare variable rate debt instruments whose interest rates are typically reset approximately every 7 to 35 days. In November 2008, we accepted the UBS Auction Rate Securities Rights (“the Rights”) agreement offered by UBS as a liquidity alternative to the failed auction process. The Rights agreement is a nontransferable right to sell our auction rate securities, at par value, back to UBS at any time during the period June 30, 2010, through July 2, 2012. The estimated fair market valuesvalue of both the auction rate securities and maturitiesthe Rights agreement was determined using significant unobservable inputs (Level 3) as prescribed by FASB ASC 820.
We account for our investments in excessdebt and equity instruments under FASB ASC 320. Our investments are classified as available-for-sale and accordingly are reported at fair value, with unrealized gains and losses reported as other comprehensive income, a component of three months at the date of acquisition.stockholders’ equity. Unrealized losses are charged against income when a decline in fair value is determined to be other than temporary. Investments with maturities beyond one year are classified as short-term based on their highly liquid nature and because such marketable securities represent the investment of cash that is available for current operations. Our investments are classified as available-for-sale and accordingly are reported atThe fair value of our short-term investments in debt securities at December 31, 2009 and December 31, 2008 was $87 million and $6 million, respectively. The increase was due to the net purchase of $74 million of short-term investments and the transfer of $8.6 related to our auction rate securities and our rights agreement from long-term investments to short-term investments during the year ended December 31, 2009. The net purchase of $74 million of short term investments was done to diversify our holdings from money market accounts to debt securities and to take advantage of higher yields associated with longer maturity debt securities. We follow the guidance provided by FASB ASC 320 to assess whether our investments with unrealized loss positions are other than temporarily impaired. Realized gains and losses reported as other comprehensive income. Unrealized losses are charged against income when a declineand declines in fair value is determinedjudged to be other than temporary. Thetemporary are determined based on the specific identification method and are reported in other income (expense), net, in our Consolidated Statements of Income.
Accounts Receivable, net
Accounts receivable are recorded net of allowance for sales returns of $1.9 million and $1.8 million at December 31, 2009 and 2008, respectively, and net of allowances for doubtful accounts of $2.7 million and $3.9 million at December 31, 2009 and 2008, respectively. A provision for estimated sales returns is used to determinemade by reducing recorded revenue based on historical experience. We analyze historical returns, current economic trends and changes in customer demand and acceptance of our products when evaluating the costadequacy of securities sold.our sales returns allowance. Our allowance for doubtful accounts is based on historical experience. We analyze historical bad debts, customer concentrations, customer creditworthiness and current economic trends when evaluating the adequacy of our allowance for doubtful accounts.
Year Description Balance atBeginningof Period Provisions Write-Offs Balance atEnd ofPeriod 2007 Allowance for doubtful accounts and sales returns $ 4,360 $ 1,940 $ 698 $ 5,602 2008 Allowance for doubtful accounts and sales returns 5,602 447 367 5,682 2009 Allowance for doubtful accounts and sales returns 5,682 337 1,400 4,619
Inventories
Inventories are stated at the lower-of-cost or market. Cost is determined using standard costs, which approximate the first-in first-out (FIFO)(“FIFO”) method. Cost includes the acquisition cost of purchased components, parts and subassemblies, in-bound freight costs, labor and overhead. Market is replacement cost with respect to raw materials and is net realizable value with respect to work in process and finished goods.
Inventory is shown net of adjustment for excess and obsolete inventories of $5.2$4.4 million and $6.0$4.4 million at December 31, 20062009 and 2005,2008, respectively.
Long-Term Investments
At December 31, 2008, our long-term investments primarily consisted of auction rate securities that we originally purchased for $8.6 million as well as our Rights agreement with UBS. At December 31, 2008, we classified these investments as long-term due to the fact that the market for these securities was inactive, the underlying securities generally had contractual maturities that were in excess of the guidelines provided for in our investment policy, the fact that we had the ability to hold the debt instruments to their ultimate maturity and the fact that we had not made a determination as to whether we would exercise our rights under the Rights agreement. The auction rate securities were classified as available-for-sale. At December 31, 2008, we reported our auction rate securities at their estimated fair market value of $7.0 million and our Rights agreement at its estimated fair market value of $1.6 million. The estimated fair market value of both the auction rate securities and the Rights agreement was determined using significant unobservable inputs (Level 3) as prescribed by FASB ASC 820. These auction rate securities and the Rights agreement are now reported as a component of short-term investments as discussed above.
Property and equipment
Property and equipment are recorded at cost. Depreciation is computed using the straight-line method over the estimated useful lives of the assets, which range from twenty to forty years for buildings, three to seven years for purchased internal use software and for equipment which are each included in furniture and equipment. Leasehold improvements are depreciated over the shorter of the life of the lease or the asset.
Intangible assets
We capitalize costs related to the development and acquisition of certain software products. In accordance with Statement of Financial Accounting Standards (“SFAS”) 86,Accounting for the Costs of Computer Software to Be Sold, Leased or Otherwise Marketed,FASB ASC 985, capitalization of costs begins when technological feasibility has been established and ends when the product is available for general release to customers. Technological feasibility for our products is established when the product is available for beta release. Amortization is computed on an individual product basis for those products available for market and is recognized based on the product’s estimated economic life, generally three years. Patents are amortized using the straight-line method over their estimated period of benefit, generally ten to seventeen years. At each balance sheet date, the unamortized costs for all intangible assets are reviewed by management and reduced to net realizable value when necessary.
Goodwill
GoodwillThe excess purchase price over the fair value of assets acquired is recorded as goodwill. As we have one operating segment, we allocate goodwill to one reporting unit for goodwill impairment testing. In accordance with SFAS 142,FASB ASC 350, Intangibles – Goodwill and Other Intangible Assets, (FASB ASC 350), goodwill is tested for impairment on an annual basis, and between annual tests if indicators of potential impairment exist, using a fair-value-based approach.approach based on the market capitalization of the reporting unit. Our annual impairment test was performed on April 6, 2006.as of February 28, 2009. No impairment of goodwill was identified.has been identified during the period presented. Goodwill is deductible for tax purposes in certain jurisdictions.
Concentrations of credit risk Financial
We maintain cash and cash equivalents with various financial institutions located in many countries throughout the world. At December 31, 2009, $85 million or 42% of our cash and cash equivalents was held in cash in various operating accounts with financial institutions throughout the world and $116 million or 58% was held in money market accounts. The most significant of our operating accounts was our domestic operating account which held approximately $22 million or 11% of our total cash and cash equivalents at a bank that carried an A1 rating at December 31, 2009. From a geographic standpoint, approximately $78 million or 39% was held in various domestic accounts with financial institutions and $123 million or 61% was held in various accounts outside of the U. S. with financial institutions. At December 31, 2009, our short-term investments consist of $35 million or 40% of foreign government bonds, $21 million or 24% of U.S. treasuries and agencies, $12 million or 14% of municipal bonds, $9 million or 10% of auction rate securities and our auction rate securities put option, $8 million or 9% of corporate bonds and $3 million or 3% in time deposits.
The goal of our investment policy is to manage our investment portfolio to preserve principal and liquidity while maximizing the return on our investment portfolio through the full investment of available funds. We place our cash investments in instruments that potentially subject us to concentrationsmeet credit quality standards, as specified in our corporate investment policy guidelines. These guidelines also limit the amount of credit risk consist principallyexposure to any one issue, issuer or type of instrument. With the exception of our auction rate security from the Vermont Student Assistance Corporation, at December 31, 2009, our cash equivalents and short-term investments carried ratings from the major credit rating agencies that were in accordance with our corporate investment policy. Our investment policy allows investments in the following; government and federal agency obligations, repurchase agreements (“Repos”), certificates of deposit and time deposits, corporate obligations, medium term notes and deposit notes, commercial paper including asset-backed commercial paper (“ABCP”), puttable bonds, general obligation and revenue bonds, money market funds, taxable commercial paper, corporate notes/bonds, municipal notes, municipal obligations, variable rate demand notes and tax exempt commercial paper. All such instruments must carry minimum ratings of A1/P1/F1, MIG1/VMIG1/SP1 and A2/A/A, as applicable, all of which are considered “investment grade”. Our investment policy for marketable securities requires that all securities mature in three years or less, with a weighted average maturity of no longer than 18 months with at least 10% maturing in 90 days or less. We actively monitor our investment portfolio to ensure compliance with our investment objective to preserve capital, meet liquidity requirements and maximize return on our investments. We do not require collateral or enter into master netting arrangements to mitigate our credit risk. (See Note 2 – Cash, cash equivalents, short-term and long-term investments in Notes to Consolidated Financial Statements for further discussion and analysis of our investments.).
At December 31, 2009, we held foreign currency forward and option contracts cashwith an aggregate notional amount of $148.4 million with various counterparties and cash equivalents, short-term investments and trade accounts receivable. We have no significant concentrations of credit risk at December 31, 2006.with varying maturity dates. Our counterparties in our foreign currency forward and option contracts are major financial institutions. We do not anticipate nonperformance by these counterparties. We maintain cash(See Note 4 – Derivative instruments and cash equivalents with various financial institutions locatedhedging activities in many countries worldwide. Our short-term investments are diversified among and limitedNotes to high-quality securities with high credit ratings. Consolidated Financial Statements).
Concentration of credit risk with respect to trade accounts receivable is limited due to the large number of customers and their dispersion across many countries and industries. The amount of sales to any individual customer did not exceed 3% of revenue for the periods presented. The largest trade account receivable from any individual customer at December 31, 20062009 was approximately $1.8$1.9 million.
Key supplier risk
Our manufacturing processes use large volumes of high-quality components and subassemblies supplied by outside sources. Several of thosethese components are available through singlesole or limited sources. Supply shortages of or quality problems in connection with some of these key components could require us to procure components from replacement suppliers, which would cause significant delays in fulfillment of orders and likely result in additional costs. In order to manage this risk, we maintain safety stock of some of these single sourced components and subassemblies and perform regular assessments of suppliers performance, grading key suppliers in critical areas such as quality and “on-time” delivery.
Revenue recognition
We derive revenue primarily from the sale/licensing of integrated hardware and software solutions. We also sellIndependent sales of application software licenses which are sold separately as well as training andinclude post contract support services. In addition, training services are sold separately. The products and services are generally sold under standardized licensing and sales arrangements with payment terms ranging from net 30 days in the United States to net 30 days and up to net 90 days in some international markets. Approximately 95%83% of our product/license sales include both hardware and software in the customer arrangement, with a small percentage of sales including other services. We offer rights of return and standard warranties for product defects related to our products. The rights of return are generally for a period of up to 30 days after the delivery date. The standard warranties cover periods ranging from 90 days to three years. With the exception of our former German systems integration subsidiary, which accounted for less than 1.5% of our revenues in the year ended December 31, 2004, weWe do not generally enter into contracts requiring product acceptance from the customer. This subsidiary was sold in December 2004.
Revenue is recognized in accordance with the provisions of SOP 97-2FASB ASC 985, when persuasive evidence of an arrangement exists, delivery has occurred, the fee is fixed or determinable, and collectability is probable. We enter into certain arrangements where we are obligated to deliver multiple products and/or services (“multiple elements”). In these transactions, we allocate the total revenue among the elements based on vendor specific objective evidence (“VSOE”) of fair value as determined by the sales price of each element when sold separately (“vendor-specific objective evidence”). Salesseparately.
When VSOE of fair value is available for the undelivered element of a multiple element arrangements, sales revenue from product sales is generally recognized on the date the product is shipped, using the residual method under FASB ASC 985, with a portion of revenue recorded as deferred (unearned) due to applicable undelivered elements. Undelivered elements for our multiple-elementmultiple element arrangements with a customer are generally restricted to post contract support and training and education. The amount of revenue allocated to these undelivered elements is based on the vendor-specific objective evidence (“VSOE”)VSOE of fair value for those undelivered elements. Deferred revenue due to undelivered elements is recognized ratably on a straight-line basis over the service period or when the service is completed. When VSOE of fair value is not available for the undelivered element of a multiple element arrangement, sales revenue is generally recognized ratably, on a straight-line basis over the service period of the undelivered element, generally 12 months or when the service is completed in accordance with the subscription method under FASB ASC 985. Deferred revenue at December 31, 20062009 and 20052008 was $22.2$57 million and $16.0$46 million, respectively.
The application of SOP 97-2FASB ASC 985 requires judgment, including whether a software arrangement includes multiple elements, and if so, whether VSOE of fair value exists for those elements. Changes to the elements in a software arrangement, the ability to identify VSOE for those elements, the fair value of the respective elements, and changes to a product'sproduct’s estimated life cycle could materially impact the amount of our earned and unearned revenue. Judgment is also required to assess whether future releases of certain software represent new products or upgrades and enhancements to existing products. Provision
Product revenue
Our product revenue is generated predominantly from the sales of measurement and automation products. Our products consist of application software and hardware components together with related driver software.
Software maintenance revenue
Software maintenance revenue is post contract customer support that provides the customer with unspecified upgrades/updates and technical support.Shipping and handling costsOur shipping and handling costs charged to customers are included in net sales, and the associated expense is recorded in cost of sales for estimated sales returns is made by reducing recorded revenue based on historical experience. Management analyzes historical returns, current economic trends, and changes in customer demand and acceptance of our products when evaluating the adequacy of our allowance for sales returns. The accounts receivable are net of allowance for sales returns of $1.5 million and $1.3 million at December 31, 2006 and 2005, respectively. Similarly, management must make estimates of the uncollectability of our accounts receivables. Management specifically analyzes accounts receivable and analyzes historical bad debts, customer concentrations, customer credit-worthiness and current economic trends when evaluating the adequacy of our allowance for doubtful accounts. The accounts receivable are net of allowances for doubtful accounts of $2.9 million and $3.4 million at December 31, 2006 and 2005, respectively.all periods presented.
Warranty reserve
We offer a one-year limited warranty on most hardware products, with a two or three-year warranty on a subset of our hardware products, which is included in the sales price of many of our products. Provision is made for estimated future warranty costs at the time of the sale pursuant to SFAS 5,Accounting for Loss FASB ASC 450, Contingencies (FASB ASC 450), for the estimated costs that may be incurred under the basic limited warranty. Our estimate is based on historical experience and product sales during this period.
The warranty reserve for the years ended December 31, 20062009 and 2005,2008, respectively, was as follows (in thousands):2006
2005
Balance at the beginning of the period $ 915 $ 815 Accruals for warranties issued during the period 1,593 1,652 Settlements made (in cash or in kind) during the period (1,641 ) (1,552 )
Balance at the end of the period $ 867 $ 915
2009 2008 Balance at the beginning of the period $ 952 $ 750 Accruals for warranties issued during the period 1,991 1,836 Settlements made (in cash or in kind) during the period (2,022 ) (1,634 ) Balance at the end of the period $ 921 $ 952
Loss contingencies
We accrue for probable losses from contingencies including legal defense costs, on an undiscounted basis, in accordance with SFAS 5, Accounting for Loss FASB ASC 450, Contingencies (FASB ASC 450), when such costs are considered probable of being incurred and are reasonably estimable. We periodically evaluate available information, both internal and external, relative to such contingencies and adjust this accrual as necessary.
Advertising expense
We expense costs of advertising as incurred. Advertising expense for the years ended December 31, 2006, 20052009, 2008 and 20042007 was $47.3$13.6 million, $42.5$19.3 million and $39.7$20.0 million, respectively.
Foreign currency translation
The functional currency for our international sales operations is the applicable local currency. The assets and liabilities of these operations are translated at the rate of exchange in effect on the balance sheet date and sales and expenses are translated at average rates. The resulting gains or losses from translation are included in a separate component of other comprehensive income. Gains and losses resulting from re-measuring monetary asset and liability accounts that are denominated in a currency other than a subsidiary’s functional currency are included in net foreign exchange gain (loss) and are included in net income.
Foreign currency hedging instruments
All of our derivative instruments are recognized on the balance sheet at their fair value. We currently use foreign currency forward and purchased option contracts to hedge our exposure to material foreign currency denominated receivables and forecasted foreign currency cash flows.
On the date the derivative contract is entered into, we designate the derivative as either a hedge of the fair value of foreign currency denominated receivables (“fair-value” hedge) or as a hedge of the variability of foreign currency cash flows to be received or paid (“cash flow” hedge). Changes in the fair market value or as a hedge of a fair-value hedge are recorded, along with the loss or gain on the re-measurement of foreign-currency-denominated receivables, in current earnings.our foreign denominated net receivable positions (“other derivatives”). Changes in the fair value of derivatives that are designated and qualify as cash flow hedges under SFAS 133FASB ASC 815, Derivatives and Hedging (FASB ASC 815) and that are deemed to be highly effective are recorded in other comprehensive income. These amounts are subsequently reclassified into earnings in the period during which the hedgehedged transaction is realized. The gain or loss on the other derivatives as well as the offsetting gain or loss on the hedged item attributable to the hedged risk is recognized in current earnings under the line item “Net foreign exchange gain (loss)”. We do not enter into derivative contracts for speculative purposes.
We formally document all relationships between hedging instruments and hedged items, as well as our risk-management objective and strategy for undertaking various hedge transactions. This process includes linking all derivatives that are designated as fair-value or cash flow hedges to specific assets and liabilities on the balance sheet or to specific firm commitments or forecasted transactions. We also formally assess, both at the hedge’s inception and on an ongoing basis, whether the hedging instruments are highly effective in offsetting changes in cash flows of hedged items.
We prospectively discontinue hedge accounting if (1) it is determined that the derivative is no longer highly effective in offsetting changes in the fair value of a hedged item (forecasted transactions); or (2) the derivative is de-designated as a hedge instrument, because it is unlikely that a forecasted transaction will occur. When hedge accounting is discontinued, the derivative is sold and the resulting gains and losses are recognized immediately in earnings.
Income taxes
We account for income taxes under the asset and liability method as set forth in SFAS 109,Accounting for FASB ASC 740, Income Taxes.Taxes (FASB ASC 740). Deferred tax assets and liabilities are recognized for the expected tax consequences of temporary differences between the tax bases of assets and liabilities and their reported amounts. Valuation allowances are established when necessary to reduce deferred tax assets to amounts which are more likely than not to be realized.
Earnings per share On January 21, 2004, we declared a stock split effected in the form of a dividend of one share of common stock for each two shares of common stock outstanding. The dividend was paid on February 20, 2004 to holders of record as of the close of business on February 5, 2004. All per share data and numbers of common shares, where appropriate, have been retroactively adjusted to reflect the stock split.
Basic earnings per share (“EPS”) is computed by dividing net income by the weighted average number of common shares outstanding during each period. Diluted EPS is computed by dividing net income by the weighted average number of common shares and common share equivalents outstanding (if dilutive) during each period. The number of common share equivalents, which include stock options and restricted stock units, is computed using the treasury stock method.
The reconciliation of the denominators used to calculate basic EPS and diluted EPS for the years ended December 31, 2006, 20052009, 2008 and 2004,2007, respectively, are as follows (in thousands):Years Ended December 31,
2006
2005
2004
Weighted average shares outstanding-basic 79,519 78,552 78,680 Plus: Common share equivalents Stock options, restricted stock units 2,000 2,358 3,416
Weighted average shares outstanding-diluted 81,519 80,910 82,096
Years Ended December 31, 2009 2008 2007 Weighted average shares outstanding-basic�� 77,520 78,567 79,468 Plus: Common share equivalents Stock options, restricted stock units 506 948 1,575 Weighted average shares outstanding-diluted 78,026 79,515 81,043
Stock options to acquire 3,295,000, 3,056,0002,711,976, 2,402,934 and 2,523,0002,304,078 shares for the years ended December 31, 2006, 20052009, 2008 and 2004,2007, respectively, were excluded in the computations of diluted EPS because the effect of including the stock options would have been anti-dilutive.
Stock-based compensation plans
Effective January 1, 2006, we adopted Statement of Financial Accounting Standards 123R (“SFAS 123R”),“Share-based Payments”FASB ASC 718, Compensation – Stock Compensation (FASB ASC 718), using the modified-prospective-transition method. Under this method, prior periods are not restated. Under this transition method, stock compensation cost recognized beginning January 1, 2006 includes: (a) compensation cost for all share-based payments granted prior to, but not yet vested as of January 1, 2006, based on the grant date fair value estimated in accordance with the original provisions of SFAS 123,FASB ASC 718, and (b) compensation cost for all share-based payments granted on or subsequent to January 1, 2006, based on the grant-date fair value estimated in accordance with the provisions of SFAS 123R.FASB ASC 718. Prior
Comprehensive income
Our comprehensive income is comprised of net income, foreign currency translation and unrealized gains and losses on forward and option contracts and securities available-for-sale. Comprehensive income for 2009, 2008 and 2007 was $20.1 million, $88.2 million and $111.6 million, respectively.
Recently Issued Accounting Pronouncements
In April 2009, the FASB updated FASB ASC 820 providing additional guidance for estimating fair value when the volume and level of activity for the asset or liability have significantly decreased. This update also includes guidance on identifying circumstances that indicate a transaction is not orderly. We adopted the update on April 1, 2009 as required and concluded it did not have a material impact on our consolidated financial position or results of operations.
In September 2009, the FASB updated FASB ASC 105, Generally Accepted Accounting Principles (FASB ASC 105). The update establishes the FASB Standards Accounting Codification (“Codification”) as the source of authoritative U.S. generally accepted accounting principles (“GAAP”) recognized by the FASB to adopting SFAS 123R, we presentedbe applied to nongovernmental entities and rules and interpretive releases of the SEC as authoritative GAAP for SEC registrants. The Codification supersedes all tax benefitsexisting non-SEC accounting and reporting standards. This update is effective for financial statements issued for interim and annual periods ending after September 15, 2009. We adopted the update on July 1, 2009, as required and concluded it did not have a material impact on our consolidated financial position or results of deductions resultingoperations.
In October 2009, the FASB updated FASB ASC 605, Revenue Recognition (FASB ASC 605) that amended the criteria for separating consideration in multiple-deliverable arrangements. The amendments establish a selling price hierarchy for determining the selling price of a deliverable. The selling price used for each deliverable will be based on vendor-specific objective evidence if available, third–party evidence if vendor-specific objective evidence is not available, or estimated selling price if neither vendor-specific objective evidence nor third-party evidence is available. The amendments will change the application of the residual method of allocation and require that arrangement consideration be allocated at the inception of the arrangement to all deliverables using the relative selling price method. The relative selling price method allocates any discount in the arrangement proportionally to each deliverable on the basis of each deliverable’s selling price. This update will be effective prospectively for revenue arrangements entered into or materially modified in fiscal years beginning on or after June 15, 2010. Early adoption is permitted. We are currently evaluating the requirements of this update and have not yet determined the impact on our consolidated financial statements.
In October 2009, the FASB updated FASB ASC 985, Software (FASB ASC 985) that changes the accounting model for revenue arrangements that include both tangible products and software elements. Tangible products containing software components and nonsoftware components that function together to deliver the tangible product’s essential functionality are no longer within the scope of the software revenue guidance in Subtopic 985-605. In addition, the amendments require that hardware components of a tangible product containing software components always be excluded from the exercisesoftware revenue guidance. This update will be effective prospectively for revenue arrangements entered into or materially modified in fiscal years beginning on or after June 15, 2010. Early adoption is permitted. We are currently evaluating the requirements of stock grants as operatingthis update and have not yet determined the impact on our consolidated financial statements.
Cash, cash flows. SFAS 123R requires the cash flows resulting from the tax benefits from tax deductions in excessequivalents, short-term and long-term investments consist of the compensation costfollowing (in thousands):
As ofDecember 31, 2009 As ofDecember 31, 2008 Cash and cash equivalents: Cash $ 85,612 $ 100,967 Cash equivalents: Time deposits — 73,400 Money market accounts 115,853 55,033 Total cash and cash equivalents $ 201,465 $ 229,400 Short-term investments: Municipal bonds $ 12,549 $ 6,220 Corporate bonds 7,587 — U.S. treasuries and agencies 21,033 — Foreign government bonds 34,674 — Time deposits 2,753 — Auction rate securities 8,177 — Auction rate securities put option 423 — Total short-term investments 87,196 6,220 Long-term investments: Auction rate securities — 6,964 Auction rate securities put option — 1,636 Other long-term investments — 1,900 Total investments $ 87,196 $ 16,720 Total cash, cash equivalents and investments $ 288,661 $ 246,120
The following table summarizes unrealized gains and losses related to our investments designated as available-for-sale (in thousands):
As of December 31, 2009 Adjusted Cost GrossUnrealized Gain GrossUnrealized Loss Cumulative Translation Adjustment Fair Value Municipal bonds $ 12,491 $ 58 $ — $ — $ 12,549 Corporate bonds 7,478 110 (1 ) — 7,587 U.S. treasuries and agencies 21,080 — (47 ) — 21,033 Foreign government bonds 36,105 76 — (1,507 ) 34,674 Time deposits 2,753 — — — 2,753 Auction rate securities 8,600 — (423 ) — 8,177 Auction rate securities put option — 423 — — 423 Total investments $ 88,507 $ 667 $ (471 ) $ (1,507 ) $ 87,196
As of December 31, 2008 Adjusted Cost GrossUnrealized Gain GrossUnrealized Loss Fair Value Municipal securities $ 6,199 $ 28 $ (7 ) $ 6,220 Auction rate securities 8,600 — (1,636 ) 6,964 Auction rate securities put option — 1,636 — 1,636 Other long-term investments 1,900 — — 1,900 Total investments $ 16,699 $ 1,664 $ (1,643 ) $ 16,720
The following table summarizes the contractual maturities of our investments designated as available-for-sale (in thousands):
As of December 31, 2009 Adjusted Cost Fair Value Due in less than 1 year $ 44,029 $ 43,267 Due in 1 to 5 years 44,478 43,929 Total investments $ 88,507 $ 87,196
As of December 31, 2009 Due in less than 1 year Adjusted Cost Fair Value Municipal bonds $ 4,103 $ 4,110 Corporate bonds 5,384 5,473 U.S. treasuries and agencies 5,065 5,057 Foreign government bonds 18,124 17,274 Time deposits 2,753 2,753 Auction rate securities 8,600 8,177 Auction rate securities put option — 423 Total investments $ 44,029 $ 43,267
As of December 31, 2009 Due in 1 to 5 years Adjusted Cost Fair Value Municipal bonds $ 8,388 $ 8,439 Corporate bonds 2,094 2,114 U.S. treasuries and agencies 16,015 15,976 Foreign government bonds 17,981 17,400 Time deposits — — Auction rate securities — — Auction rate securities put option — — Total investments $ 44,478 $ 43,929
Note 3 – Fair value measurements
FASB ASC 820, clarifies the definition of fair value, prescribes methods for measuring fair value, establishes a fair value hierarchy based on the inputs used to measure fair value and expands disclosures about the use of fair value measurements. Effective January 1, 2009, we adopted FASB ASC 820 for our nonfinancial assets and nonfinancial liabilities, except those items recognized (excess tax benefits) to be classifiedor disclosed at fair value on an annual or more frequently recurring basis. The adoption of FASB ASC 820 did not have a material impact on our fair value measurements as financing cash flows. Aswe did not have any items that were measured at fair value on a result, $4.3 million of excess tax benefitsnonrecurring basis for the year ended December 31, 20062009. In April 2009, FASB ASC 820 was updated to provide additional guidance for estimating fair value when the volume and level of activity for the asset or liability have been classified as financing cash flows. Prior tosignificantly decreased. The update also includes guidance on identifying circumstances that indicate a transaction is not orderly. We adopted the effective date of SFAS 123R, we applied Accounting Principles Board Opinion 25 (“APB 25”),“Accounting for Stock Issued to Employees”update on April 1, 2009 and related interpretations forit did not have a material impact on our stock option grants. APB 25 providesfair value measurements.
The following tables present our assets and liabilities that are measured at fair value on a recurring basis and are categorized using the compensation expense relative to our stock options is measuredfair value hierarchy. The fair value hierarchy has three levels based on the intrinsicreliability of the inputs used to determine fair value.
Fair Value Measurements at Reporting Date Using Description December 31, 2009 Quoted Prices in Active Markets for Identical Assets(Level 1) Significant Other Observable Inputs(Level 2) Significant Unobservable Inputs(Level 3) Assets Money Market Funds $ 115,853 $ 115,853 $ — $ — Short-term investments available-for-sale 87,196 78,596 — 8,600 Derivatives 11,016 — 11,016 — Total Assets $ 214,065 $ 194,449 $ 11,016 $ 8,600 Liabilities Derivatives $ (318 ) $ — $ (318 ) $ — Total Liabilities $ (318 ) $ — $ (318 ) $ —
Fair Value Measurements Using Significant Unobservable Inputs(Level 3) Short-term investmentsavailable-for-sale Beginning Balance, January 1, 2008 $ 8,600 Total gains (realized/unrealized) Included in earnings 423 Included in other comprehensive income — Total losses (realized/unrealized) Included in earnings (423 ) Included in other comprehensive income — Purchases, issuances and settlements — Transfer in and/or out of Level 3 — Ending Balance, December 31, 2009 $ 8,600 The amount of total gains or (losses) for the period included in earnings (or changes in net assets) attributableto the change in unrealized gains or losses relating to assets still held at the reporting date $ —
Short-term investments available-for-sale are valued using a market approach (Level 1) based on the quoted market prices of identical instruments when available or other observable inputs such as trading prices of identical instruments in inactive markets. Short-term investments available-for-sale consist of debt securities issued by states of the U.S. and political subdivisions of the states, corporate debt securities and debt securities issued by U.S. government corporations and agencies. All short-term investments available-for-sale have contractual maturities of less than 24 months.
Derivatives include foreign currency forward and option contracts. Our foreign currency forward contracts are valued using an income approach (Level 2) based on the spot rate less the contract rate multiplied by the notional amount. Our foreign currency option contracts are valued using a market approach based on the quoted market prices which are derived from observable inputs including current and future spot rates, interest rate spreads as well as quoted market prices of identical instruments.
Short-term debt securities available-for-sale included in Level 3 are reported at their fair market value and consist of auction rate securities backed by education loan revenue bonds. One of our auction rate securities is from the Vermont Student Assistance Corporation and has a par value of $2.2 million. The other of our auction rate securities is from the New Hampshire Health and Education Facilities Authority and has a par value of $6.4 million. The ratings for these securities at December 31, 2009, were Baa3/A/AAA and Aaa/NR/AAA, respectively. Historically, we reported the fair market value of these securities at par as differences between par value and the purchase price or settlement value were historically comprised of accrued interest. Auction rate securities are variable rate debt instruments whose interest rates are typically reset approximately every 7 to 35 days. On January 15, 2010, and in prior auction periods beginning in February 2008, the auction process for these securities failed. At December 31, 2009, we reported these as short-term investments at their estimated fair market value of $8.2 million.
In November 2008, we accepted the UBS Auction Rate Securities Rights (the “Rights”) agreement offered by UBS as a liquidity alternative to the failed auction process. This Rights agreement is related to the auction rates securities discussed above. The Rights agreement is a nontransferable right to sell our auction rate securities, at par value, back to UBS at any time during the period June 30, 2010, through July 2, 2012. At December 31, 2009, we reported the Rights agreement at its estimated fair market value of $423,000 as a component of short-term debt securities available for sale.
Due to the fact that our Rights agreement has an initial exercise date that is less than one year from now, we are now reporting our auction rate securities and the corresponding Rights agreement as short-term. We continue to have the ability to hold our auction rate securities to their ultimate maturities which are in excess of one year and we have not made a determination as to whether we will exercise our option under the Rights agreement or if we do choose to exercise our option, at what point during the period June 30, 2010 through July 2, 2012, we would exercise our option. However, due to the fact that our Rights agreement has an initial exercise date that is less than one year from now, we are now reporting our auction rate securities and the corresponding Rights agreement as short-term. We have recorded the unrealized loss related to the auction rate securities and the unrealized gain related to the Rights agreement as a component of other income (expense), in our Consolidated Statements of Income.
The estimated fair market value of both the auction rate securities and the Rights agreement was determined using significant unobservable inputs (Level 3) as prescribed by FASB ASC 820. We considered many factors in determining the fair market value of the stockauction rate securities as well as our corresponding Rights agreement at December 31, 2009, including the fact that the debt instruments underlying the auction rate securities have redemption features which call for redemption at 100% of par value, current credit curves for like securities and discount factors to account for the illiquidity of the market for these securities. During the year ended December 31, 2009, we did not make any changes to our valuation techniques or related inputs.
FASB ASC 815 requires companies to recognize all of their derivative instruments as either assets or liabilities in the statement of financial position at fair value. The accounting for changes in the fair value (i.e., gains or losses) of a derivative instrument depends on whether it has been designated and qualifies as part of a hedging relationship and further, on the type of hedging relationship. For those derivative instruments that are designated and qualify as hedging instruments, a company must designate the hedging instrument, based upon the exposure being hedged, as a fair value hedge, cash flow hedge, or a hedge of a net investment in a foreign operation.
We have operations in over 40 countries. Sales outside of the Americas as a percentage of consolidated sales were 57% and 57% for the years ended December 31, 2009 and 2008, respectively. Our activities expose us to a variety of market risks, including the effects of changes in foreign currency exchange rates. These financial risks are monitored and managed by us as an integral part of our overall risk management program.
We maintain a foreign currency risk management strategy that uses derivative instruments (foreign currency forward and purchased option contracts) to help protect our earnings and cash flows from fluctuations caused by the volatility in currency exchange rates. Movements in foreign currency exchange rates pose a risk to our operations and competitive position, since exchange rate changes may affect our profitability and cash flow, and the business or pricing strategies of our non-U.S. based competitors.
The vast majority of our foreign sales are denominated in the customers’ local currency. We purchase foreign currency forward and option contracts as hedges of forecasted sales that are denominated in foreign currencies and as hedges of foreign currency denominated receivables. These contracts are entered into to protect against the risk that the eventual dollar-net-cash inflows resulting from such sales or firm commitments will be adversely affected by changes in exchange rates. We also purchase foreign currency forward contracts as hedges of forecasted expenses that are denominated in foreign currencies. These contracts are entered into to protect against the risk that the eventual dollar-net-cash outflows resulting from foreign currency operating and cost of revenue expenses will be adversely affected by changes in exchange rates.
In accordance with FASB ASC 815, we designate foreign currency forward and purchased option contracts as cash flow hedges of forecasted revenues or forecasted expenses. In addition, we hedge our foreign currency denominated balance sheet exposures using foreign currency forward contracts. These derivatives are not designated as hedging instruments under FASB ASC 815. None of our derivative instruments contain a credit-risk-related contingent feature.
Cash flow hedges
To protect against the reduction in value caused by a fluctuation in foreign currency exchange rates of forecasted foreign currency cash flows resulting from international sales over the next one to two years, we have instituted a foreign currency cash flow hedging program. We hedge portions of our forecasted revenue and forecasted expenses denominated in foreign currencies with forward and purchased option contracts. For forward contracts, when the dollar strengthens significantly against the foreign currencies, the change in the present value of future foreign currency cash flows may be offset by the change in the fair value of the forward contracts designated as hedges. For option contracts, when the dollar strengthens significantly against the foreign currencies, the change in the present value of future foreign currency cash flows may be offset by the change in the fair value of the option contracts net of the premium paid designated as hedges. Our foreign currency purchased option contracts are purchased “at-the-money” or “out-of-the-money”. We purchase foreign currency forward and option contracts for up to 100% of our forecasted exposures in selected currencies (primarily in Euro, Japanese yen, British pound sterling, South Korean won and Hungarian forint) and limit the duration of these contracts to 40 months or less.
For derivative instruments that are designated and qualify as a cash flow hedge, the effective portion of the gain or loss on the derivative is reported as a component of accumulated other comprehensive income (“OCI”) and reclassified into earnings in the same line item (net sales, operating expenses, or cost of sales) associated with the forecasted transaction and in the same period or periods during which the hedged transaction affects earnings. Gains and losses on the derivative representing either hedge ineffectiveness or hedge components excluded from the assessment of effectiveness are recognized in current earnings or expenses during the current period and are classified as a component of “net foreign exchange gain (loss)”. Hedge effectiveness of foreign currency forwards and purchased option contracts designated as cash flow hedges are measured by comparing the hedging instrument’s cumulative change in fair value from inception to maturity to the forecasted transaction’s terminal value.
We held forward contracts with a notional amount of $28.6 million dollar equivalent of Euro, $4.0 million dollar equivalent of British pound sterling, $24.4 million dollar equivalent of Japanese yen, and $17.8 million dollar equivalent of Hungarian forint at dateDecember 31, 2009. These contracts are for terms of grant.up to 24 months. At December 31, 2008, we held forward contracts with a notional amount of $54.9 million dollar equivalent of Euro, $6.2 million dollar equivalent of British pound sterling, $18.9 million dollar equivalent of Japanese yen, $4.7 million dollar equivalent of South Korean won and $21.7 million dollar equivalent of Hungarian forint.
We held purchased option contracts with a notional amount of $28.4 million dollar equivalent of Euro at December 31, 2009. These contracts are for terms of up to 12 months. At December 31, 2008, we held purchased option contracts with a notional amount of $111.3 million dollar equivalent of Euro.
At December 31, 2009, we expect to reclassify $2.8 million of gains on derivative instruments from accumulated other comprehensive income to net sales during the next twelve months when the hedged international sales occur. At December 31, 2009, we expect to reclassify $3.7 million of gains on derivative instruments from accumulated OCI to cost of sales and $2.0 million of gains on derivative instruments from accumulated OCI to operating expenses during the next twelve months when the hedged international expenses occur. Expected amounts are based on derivative valuations at December 31, 2009. Actual results may vary as a result of changes in the corresponding exchange rate subsequent to this date.
During the year ended December 31, 2009, hedges with a notional amount of $22.8 million were determined to be ineffective. As a result, we recorded a net gain of adopting SFAS 123R$1.2 million related to these hedges as a component of “net foreign exchange gain (loss)” during the year ended December 31, 2009. We did not record any gains or losses due to the ineffectiveness of our hedges during the year ended December 31, 2008.Other Derivatives
Other derivatives not designated as hedging instruments under FASB ASC 815 consist primarily of foreign currency forward contracts that we use to hedge our foreign denominated net receivable or net payable positions to protect against the change in value caused by a fluctuation in foreign currency exchange rates. We typically hedge up to 90% of our outstanding foreign denominated net receivables or net payables and typically limit the duration of these foreign currency forward contracts to approximately 90 days. The gain or loss on the derivatives as well as the offsetting gain or loss on the hedge item attributable to the hedged risk is recognized in current earnings under the line item “net foreign exchange gain (loss)”. As of December 31, 2009 and December 31, 2008, we held foreign currency forward contracts with a notional amount of $45.2 million and $67.1 million, respectively.
Effective January 1, 2006,2009, we adopted the updated disclosure requirements of FASB ASC 815. The following table presents the fair value of derivative instruments on our income before income taxesConsolidated Balance Sheets and net incomethe effect of derivative instruments on our Consolidated Statements of Income.
Fair Values of Derivative Instruments (in thousands):
In thousands Asset Derivatives December 31, 2009 December 31, 2008 Balance Sheet Location Fair Value Balance Sheet Location Fair Value Derivatives designated as hedginginstruments under FASB ASC 815 Foreign exchange contracts – ST forwards Prepaid expenses and other current assets $ 7,947 Prepaid expenses and other current assets $ 5,260 Foreign exchange contracts – LT forwards Other long-term assets 274 Other long-term assets 2,654 Foreign exchange contracts – ST options Prepaid expenses and other current assets 1,821 Prepaid expenses and other current assets 5,705 Foreign exchange contracts – LT options Other long-term assets — Other long-term assets 3,838 Total derivatives designated ashedging instruments under FASB ASC 815 $ 10,042 $ 17,457 Derivatives not designated ashedging instruments under FASB ASC 815 Foreign exchange contracts – ST forwards Prepaid expenses and other current assets $ 974 Prepaid expenses and other current assets $ 2,745 Total derivatives not designated ashedging instruments under FASB ASC 815 $ 974 $ 2,745 Total derivatives $ 11,016 $ 20,202
Liability Derivatives December 31, 2009 December 31, 2008 Balance Sheet Location Fair Value Balance Sheet Location Fair Value Derivatives designated as hedginginstruments under FASB ASC 815 Foreign exchange contracts – ST forwards Accrued expenses and other liabilities $ — Accrued expenses and other liabilities $ (1,803 ) Foreign exchange contracts – LT forwards Other long-term liabilities — Other long-term liabilities — Foreign exchange contracts – ST options Accrued expenses and other liabilities — Accrued expenses and other liabilities — Foreign exchange contracts – LT options Other long-term liabilities — Other long-term liabilities — Total derivatives designated ashedging instruments under FASB ASC 815 $ — $ (1,803 ) Derivatives not designated ashedging instruments under FASB ASC 815 Foreign exchange contracts – ST forwards Accrued expenses and other liabilities $ (318 ) Accrued expenses and other liabilities $ (3,280 ) Total derivatives not designated ashedging instruments under FASB ASC 815 $ (318 ) $ (3,280 ) Total derivatives $ (318 ) $ (5,083 )
The following table shows the effect of derivative instruments on our Consolidated Statements of Income for the year ended December 31, 2006 are $9.42009 (in thousands):
Derivatives in FASB ASC 815 Cash Flow Hedging Relationship Amount of Gain or (Loss) Recognized in OCI on Derivative (Effective Portion) (in thousands) Location of Gain or (Loss) Reclassified from Accumulated OCI into Income (Effective Portion) Amount of Gain or (Loss) Reclassified from Accumulated OCI into Income (Effective Portion) (in thousands) Location of Gain or (Loss) Recognized in Income on Derivative (Ineffective Portion and Amount Excluded from Effectiveness Testing) Amount of Gain or (Loss) Recognized in Income on Derivative (Ineffective Portion and Amount Excluded from Effectiveness Testing) 2009 2009 2009 Foreign exchange contracts – forwards and options $ (6,304 ) Net sales $ 1,399 Net foreign exchange gain (loss) $ 1,132 Foreign exchange contracts – forwards and options 2,055 Cost of sales (74 ) Net foreign exchange gain (loss) (41 ) Foreign exchange contracts – forwards and options 1,427 Operating expenses 517 Net foreign exchange gain (loss) 81 Total $ (2,822 ) $ 1,842 $ 1,172
Derivatives not Designated as Hedging Instruments under FASB ASC 815 Location of Gain (Loss) Recognized in Income on Derivative Amount of Gain (Loss) Recognized in Income on Derivative 2009 Foreign exchange contracts – forwards Net foreign exchange gain/(loss) $ (1,669 ) Total $ (1,669 )
Note 5 – Inventories
Inventories, net consist of the following (in thousands):
December 31, 2009 2008 Raw materials $ 42,121 $ 48,004 Work-in-process 2,042 4,150 Finished goods 42,352 55,204 $ 86,515 $ 107,358
Note 6 – Property and equipment
Property and equipment consist of the following (in thousands):
December 31, 2009 2008 Land $ 17,076 $ 7,210 Buildings 138,367 136,802 Furniture and equipment 154,558 144,979 310,001 288,991 Accumulated depreciation (156,736 ) (134,514 ) $ 153,265 $ 154,477
Depreciation expense for the years ended December 31, 2009, 2008 and 2007, was $22.3 million, $20.9 million and $22.2 million, respectively.
Intangibles at December 31, 2009 and 2008 are as follows:
2009 2008 Gross Carrying Amount Accumulated Amortization Net Carrying Amount Gross Carrying Amount Accumulated Amortization Net Carrying Amount Capitalized software development costs $ 38,928 $ (20,455 ) $ 18,473 $ 25,610 $ (11,344 ) $ 14,266 Acquired technology 28,022 (20,967 ) 7,055 27,503 (16,804 ) 10,699 Patents 19,033 (5,377 ) 13,656 16,068 (4,506 ) 11,562 Other 12,577 (8,371 ) 4,206 11,401 (6,013 ) 5,388 $ 98,560 $ (55,170 ) $ 43,390 $ 80,582 $ (38,667 ) $ 41,915
Software development costs capitalized during 2009, 2008 and 2007 were $13.3 million, $9.5 million and $8.3 million, respectively, and related amortization was $9.1 million, $10.3 million and $8.9 million, respectively. Included in these capitalized costs for the years ended December 31, 2009, 2008, and 2007 were costs related to stock based compensation of $734,000, $451,000 and $422,000, respectively. Amortization of capitalized software development costs is computed on an individual product basis for those products available for market and is recognized based on the product’s estimated economic life, generally three years. Patents are amortized using the straight-line method over their estimated period of benefit, generally ten to seventeen years. Total intangible assets amortization expenses were $16.5 million, $16.2 million and $14.4 million for the years ended December 31, 2009, 2008 and 2007, respectively.
Capitalized software development costs, acquired technology, patents and other have weighted-average useful lives of 2.2 years, 1.8 years, 5.3 years, and 1.8 years, respectively, as of December 31, 2009. The estimated future amortization expense related to intangible assets as of December 31, 2009 is as follows:
Amount(in thousands) 2010 $ 18,097 2011 12,986 2012 7,187 2013 1,868 2014 1,186 Thereafter 2,066 $ 43,390
Acquisition intangibles are amortized over their useful lives, which range from three to eight years. Amortization expense for acquisition intangibles was approximately $3.9 million and $4.2 million for 2009 and 2008, respectively, of which approximately $3.4 million and $3.6 million was recorded in cost of sales and approximately $503,000 and $580,000 was recorded in operating expenses for 2009 and 2008, respectively. The estimated amortization expense of acquisition intangibles in future years will be recorded in our Consolidated Statements of Income as follows (in thousands):
Fiscal Year Cost of Sales Acquisition related costs and amortization, net Total 2010 $ 2,701 $ 369 $ 3,070 2011 2,160 221 2,381 2012 1,126 206 1,332 2013 87 75 162 Thereafter — — — Total $ 6,074 $ 871 $ 6,945
Note 8 – Goodwill
The carrying amount of goodwill for 2008 and 2009 are as follows:
Amount(in thousands) Balance as of December 31, 2007 $ 54,111 Acquisitions/purchase accounting adjustments 10,818 Divestitures — Foreign currency translation impact (368 ) Balance as of December 31, 2008 $ 64,561 Acquisitions/purchase accounting adjustments — Divestitures — Foreign currency translation impact 218 Balance as of December 31, 2009 $ 64,779
The excess purchase price over the fair value of assets acquired is recorded as goodwill. As we have one operating segment, we allocate goodwill to one reporting unit for goodwill impairment testing. In accordance with FASB ASC 350, goodwill is tested for impairment on an annual basis, and between annual tests if indicators of potential impairment exist, using a fair-value-based approach based on the market capitalization of the reporting unit. Our annual impairment test was performed as of February 28, 2009. No impairment of goodwill has been identified during the period presented. Goodwill is deductible for tax purposes in certain jurisdictions.
The components of income before income taxes are as follows (in thousands):
Years Ended December 31, 2009 2008 2007 Domestic $ 34,953 $ 15,921 $ 31,685 Foreign 15,292 82,216 81,742 $ 50,245 $ 98,137 $ 113,427
The provision for income taxes charged to operations is as follows (in thousands):
Years Ended December 31, 2009 2008 2007 Current tax expense: U.S. federal $ 3,117 $ 14,631 $ 15,957 State 136 1,391 1,155 Foreign 13,760 18,910 9,925 Total current 17,013 34,932 27,037 Deferred tax expense (benefit): U.S. federal 9,920 (11,008 ) 628 State 387 (373 ) (156 ) Foreign (2,864 ) (1,570 ) (2,783 ) Total deferred 7,443 (12,951 ) (2,311 ) Change in valuation allowance 8,704 (8,671 ) (18,332 ) Total provision $ 33,160 $ 13,310 $ 6,394
Deferred tax liabilities (assets) at December 31, 2009 and 2008 as follows (in thousands):
December 31, 2009 2008 Capitalized software $ 5,978 $ 4,615 Depreciation and amortization 10,577 9,536 Unrealized gain on derivative instruments — 4,153 Undistributed earnings of foreign subsidiaries 9,278 10,075 Gross deferred tax liabilities 25,833 28,379 Operating loss carryforwards (57,422 ) (43,360 ) Intangible assets (44,159 ) (58,987 ) Vacation and other accruals (3,700 ) (4,890 ) Inventory valuation and warranty provisions (6,702 ) (12,665 ) Doubtful accounts and sales provisions (1,088 ) (1,512 ) Unrealized exchange loss (917 ) (1,345 ) Deferred revenue . (853 ) (71 ) Accrued rent expenses (111 ) (117 ) Accrued legal expenses (710 ) (1,466 ) Unrealized loss on derivative instruments (242 ) — 10% minority stock investment (900 ) (920 ) Stock-based compensation (4,483 ) (5,353 ) Research and development tax credit carryforward (2,054 ) — Foreign tax credit carryforward (1,775 ) — Other (657 ) (783 ) Gross deferred tax assets (125,773 ) (131,469 ) Valuation allowance 99,862 85,815 Net deferred tax liability (asset) $ (78 ) $ (17,275 )
A reconciliation of income taxes at the U.S. federal statutory income tax rate to the effective tax rate follows:
Years Ended December 31, 2009 2008 2007 U.S. federal statutory tax rate 35 % 35 % 35 % Domestic production activities — — (1 ) Foreign taxes (less) than federal statutory rate (6 ) (9 ) (14 ) Change in valuation allowance 17 (9 ) (16 ) Research and development tax credit (4 ) (2 ) (1 ) Tax exempt interest — (1 ) (1 ) State income taxes, net of federal tax benefit 1 1 1 Employee share-based compensation 7 2 2 Intercompany profit 15 (5 ) — Other 1 2 1 Effective tax rate 66 % 14 % 6 %
Certain prior year amounts in the reconciliation of income taxes at the U.S. federal statutory income tax rate to the effective tax rate have been reclassified to conform to the 2009 presentation as shown in the following tables:
2008 foreign taxes (less) than federal statutory rate as reported in prior year Form 10-K (14 ) Reclassification (a) 5 2008 foreign taxes (less) than federal statutory rate as reported in current year Form 10-K (9 ) 2008 intercompany profit as reported in prior year Form 10-K — Reclassification (a) (5 ) 2008 intercompany profit as reported in current year Form 10-K (5 )
(a) These amounts represent income taxes on intercompany profit previously included in foreign taxes (less) than the federal statutory rate and reclassified to intercompany profit for comparability to corresponding amounts reported in 2009. The reclassification did not have any impact on our total income tax expense.
For the year ended December 31, 2009, we generated a federal net operating loss of approximately $3.3 million and tax credits of approximately $3.8 million. The federal net operating loss can be carried back two years and the federal tax credits can be carried back one year.
As of December 31, 2009, eleven of our subsidiaries have available, for income tax purposes, foreign net operating loss carryforwards of an aggregate of approximately $286 million, of which $12.1 million expire during the years 2011 - - 2018 and $273.9 million of which may be carried forward indefinitely. Our tax valuation allowance relates to our ability to realize certain of these foreign net operating loss carryforwards and benefits of tax deductible goodwill in excess of book goodwill.
We maintain a manufacturing facility in Hungary. As a result of certain foreign investment incentives available under Hungarian law, the profit from our Hungarian operation was subject to a reduced income tax rate. This special tax status terminated on January 1, 2008, with the merger of our Hungary manufacturing operations with its Hungarian parent company. The merger was effective on January 1, 2008. The aggregate tax benefit of the exemption was $8.7 million lower, respectively, than if we had continued to account for share-based compensation under APB 25. Basic and diluted earnings per share for the year ended December 31, 2006 are $0.112007.
In 2003, we restructured the organization of our manufacturing operation in Hungary. The tax deductible goodwill in excess of book goodwill created by this restructuring resulted in our being required to record a gross deferred tax asset of $91.0 million. Because we did not expect to have sufficient taxable income in the relevant jurisdiction in future periods to realize the benefit of this deferred tax asset, a full valuation allowance was established. Following the approval of the merger of our Hungarian manufacturing operation with its Hungarian parent company in December 2007, we released $8.7 million and $0.11 lower,$18.3 million in 2008 and 2007, respectively, than if we had continued to account for share-based compensation under APB 25. Deferred stock-based compensation balancesof the valuation allowance previously required under APB 25 were adjusted against previously recorded common stock and additional paid-in capital balances upon adoption of SFAS 123R, as required. Had we previously recognized compensation costs as prescribed by SFAS 123, previously reported net income, basic earnings per share and diluted earnings per share would have changed to the pro forma amounts shown below (in thousands, except per share amounts):
Years Ended December 31,
2005
2004
Net income, as reported $ 61,517 $ 48,610 Stock-based compensation included in reported net income, net of related tax effects 959 — Total stock-based compensation expense determined under fair value method for all awards, net of related tax effects (13,998 ) (12,741 )
Pro-forma net income $ 48,478 $ 35,869
Earnings per share: Basic - as reported $ 0.78 $ 0.62 Basic - pro-forma $ 0.62 $ 0.46 Diluted - as reported $ 0.76 $ 0.59 Diluted - pro-forma $ 0.60 $ 0.44
Pro-forma disclosuresestablished for the excess tax deductible goodwill to reflect the tax benefit we expected to realize in future periods.
For the year 2009, we expected to recognize an additional tax benefit of $9.7 million related to these assets. Effective January 1, 2010, a new tax law in Hungary provides for an enhanced deduction for the qualified research and development expenses of NI Hungary Software and Hardware Manufacturing Kft. ("NI Hungary"). During the three months ended December 31, 2006 are2009, we obtained confirmation of the application of this new tax law for the qualified research and development expenses of NI Hungary. Based on the application of this new tax law to the qualified research and development expense of NI Hungary, we no longer expect to have sufficient future taxable income in Hungary to realize the benefits of these tax assets. As such, we recorded an income tax charge of $21.6 million during the three months ended December 31, 2009, $18.4 million of which was related to a valuation allowance on the previously recognized assets created by the restructuring and $3.2 million of which was related to tax benefits from other assets that we will no longer be able to realize as a result of this change. We do not presented becauseexpect to realize the amounts aretax benefit of the remaining assets created by the restructuring and therefore we have a full valuation allowance of $98.2 million against those assets at December 31, 2009.
We have not provided for U.S. federal income and foreign withholding taxes on approximately $267.5 million of certain non-U.S. subsidiaries’ undistributed earnings as of December 31, 2009. These earnings would become subject to taxes of approximately $85.7 million, if they were actually or deemed to be remitted to the parent company as dividends or if we should sell our stock in these subsidiaries. We intend to permanently reinvest the undistributed earnings.
We adopted the provisions of FASB ASC 740, on January 1, 2007. FASB ASC 740 clarifies the accounting for uncertainty in income taxes recognized in an entity's financial statements and prescribes a recognition threshold and measurement attribute for financial statement disclosure of tax positions taken or expected to be taken on a tax return. We recognized no material adjustment to the Consolidated Statementsliability for unrecognized income tax benefits. A reconciliation of Income.the beginning and ending amount of unrecognized tax benefit is as follows (in thousands):
2009 2008 Balance at beginning of period $ 9,364 $ 8,273 Additions based on tax positions related to the current year 2,060 1,946 Additions for tax positions of prior years 1,272 366 Reductions as a result of the lapse of the applicable statute of limitations (1,634 ) (1,221 ) Balance at end of period $ 11,062 $ 9,364
All of our unrecognized tax benefits at December 31, 2009 would affect our effective income tax rate if recognized. As of December 31, 2009, it is deemed reasonably possible that the Company will recognize tax benefits in the amount of $2.3 million in the next twelve months due to the closing of open tax years. The nature of the uncertainty relates to deductions taken on returns that have not been examined by the applicable tax authority.
We recognize interest and penalties related to income tax matters in income tax expense. During the years ended December 31, 2009 and 2008, we recognized interest expense related to uncertain tax positions of approximately $506,000 and $365,000, respectively. The tax years 2002 through 2009 remain open to examination by the major taxing jurisdictions in which we file income tax returns.
Note 10 – Stockholders’ equity and stock-based compensation
Stock option plans
Our stockholders approved the 1994 Incentive Stock Option Plan (the “1994 Plan”) on May 9, 1994. At the time of approval, 9,112,500 shares of our common stock were reserved for issuance under this plan. In 1997, an additional 7,087,500 shares of our common stock were reserved for issuance under this plan, and an additional 750,000 shares were reserved for issuance under this plan, as amended, in 2004. The 1994 Plan terminated in May 2005, except with respect to outstanding awards previously granted thereunder. Awards under the plan were either incentive stock options within the meaning of Section 422 of the Internal Revenue Code or nonqualified options. The right to purchase shares vests over a five to ten-year period, beginning on the date of grant. Vesting of ten year awards may accelerate based on the Company’s previous year’s earnings and revenue growth but shares cannot accelerate to vest over a period of less than five years. Stock options must be exercised within ten years from date of grant. Stock options were issued at the market price at the grant date. As part of the requirements of SFAS 123R, the Company isFASB ASC 718, we are required to estimate potential forfeitures of stock grants and adjust compensation cost recorded accordingly. The estimate of forfeitures will be adjusted over the requisite service period to the extent that actual forfeitures differ, or are expected to differ, from such estimates. Changes in estimated forfeitures will be recognized through a cumulative catch-up adjustment in the period of change and will also impact the amount of stock compensation expense to be recognized in future periods.
Transactions under all stock option plans are summarized as follows:Number of
shares under
option
Weighted
average
exercise
price
Outstanding at December 31, 2003 9,726,418 $ 18.07 Exercised (882,539 ) 9.60 Canceled (325,912 ) 27.66 Granted 1,262,599 29.71
Outstanding at December 31, 2004 9,780,566 $ 20.02 Exercised (1,188,614 ) 10.72 Canceled (358,444 ) 29.49 Granted 244,725 24.24
Outstanding at December 31, 2005 8,478,233 $ 21.05 Exercised (1,398,617 ) 13.16 Canceled (164,943 ) 27.32 Granted 0 0
Outstanding at December 31, 2006 6,914,673 $ 22.49
Options exercisable at December 31: 2004 6,353,236 $ 17.23 2005 5,946,139 19.10 2006 5,384,470 21.53
Number of
shares under
option
Weighted
average
fair value
Weighted average, grant date fair value of options granted during: 2004 1,262,599 $ 16.72 2005 244,725 12.85 2006 0 0
Number ofshares underoption Weightedaverageexerciseprice Outstanding at December 31, 2006 6,914,673 $ 22.49 Exercised (1,515,107 ) 15.22 Canceled (104,925 ) 27.33 Granted — — Outstanding at December 31, 2007 5,294,641 $ 24.47 Exercised (925,743 ) 17.30 Canceled (96,331 ) 26.98 Granted — — Outstanding at December 31, 2008 4,272,567 $ 25.97 Exercised (379,630 ) 15.40 Canceled (181,434 ) 26.80 Granted — — Outstanding at December 31, 2009 3,711,503 $ 26.93 Options exercisable at December 31: 2007 4,368,972 $ 24.17 2008 3,812,334 26.00 2009 3,493,574 26.94
The aggregate intrinsic value of stock options at exercise, represented in the table above, was $25.5$2.3 million, $19.1$11.0 million and $18.3$22.3 million for the years ended December 31, 2006, 20052009, 2008 and 2004,2007, respectively. Total unrecognized stock-based compensation expense related to non-vested stock options was approximately $18.1$2.5 million as of the end of 2006,December 31, 2009, related to approximately 1,530,000218,000 shares with a per share weighted average fair value of $15.93.$17.50. We anticipate this expense to be recognized over a weighted average period of approximately 4.04.3 years.Outstanding and Exercisable by Price Range
As of December 31, 2006
Options Outstanding
Options Exercisable
Range of Exercise prices
Number
outstanding
as of
12/31/2006
Weighted
average
remaining
contractual life
Weighted
average
exercise
price
Number
exercisable
as of
12/31/2006
Weighted
average
exercise price
$8.6667 -$12.2222 1,072,535 1.27 $ 10.98 1,045,669 $ 10.9677 12.3611 - 15.3055 976,976 1.54 $ 15.23 967,192 $ 15.2258 15.5555 - 21.0417 1,720,096 5.18 $ 20.64 1,223,332 $ 20.6330 21.2533 - 29.5400 839,349 6.80 $ 25.53 538,372 $ 25.5261 29.8500 - 34.3750 2,305,717 5.60 $ 31.19 1,609,905 $ 31.5078
$8.6667 - $34.3750 6,914,673 3.94 $ 22.4883 5,384,470 $ 21.5254
Outstanding and Exercisable by Price Range as of December 31, 2009 Options Outstanding Options Exercisable Range of Exercise prices Number outstanding as of 12/31/2009 Weighted average remaining contractual life Weighted average exercise price Number exercisable as of 12/31/2009 Weighted average exercise price $16.08 – $21.95 1,238,441 1.74 $ 20.69 1,188,337 $ 20.71 $22.30 – $29.85 1,257,625 3.90 $ 28.15 1,098,218 $ 28.08 $30.51 – $34.38 1,215,437 0.41 $ 32.02 1,207,019 $ 32.02 $16.08 – $34.38 3,711,503 2.04 $ 26.93 3,493,574 $ 26.94
The weighted average remaining contractual life of options exercisable as of December 31, 20062009 was 3.371.9 years. The aggregate intrinsic value of options outstanding as of December 31, 20062009 was $32.9$9.4 million. The aggregate intrinsic value of options currently exercisable as of December 31, 20062009 was $30.8$8.8 million. No options were granted in the yearyears ended December 31, 20062009, 2008 and 2007 as our incentive option plan terminated in May 2005. The fair value of options granted in 2004 and 2005 were estimated on the date of grant using the Black-Scholes option-pricing model with the following weighted-average assumptions:2005
2004
Dividend expense yield 0.2% 0.2% Expected life 5.5 years 5.5 years Expected volatility 43.3% 53.2% Risk-free interest rate 4.0% 2.7%
Restricted stock plan
Our stockholders approved theour 2005 Incentive Plan on May 10, 2005. At the time of approval, 2,700,000 shares of our common stock were reserved for issuance under this plan, as well as the number of shares which had been reserved but not issued under the 1994 Plan (our incentive stock option plan which terminated in May 2005), and any shares that returned to the 1994 Plan as a result of termination of options or repurchase of shares issued under such plan. The 2005 Plan, administered by the Compensation Committee of the Board of Directors, provides for granting of incentive awards in the form of restricted stock and restricted stock units (“RSUs”) to directors, executive officers and employees of the Company and its subsidiaries. Awards vest over a three, five or ten-year period, beginning on the date of grant. Vesting of ten year awards may accelerate based on the Company’s previous year’s earnings and growth but ten year awards cannot accelerate to vest over a period of less than five years. Shares available for grant at December 31, 20062009 were 3,804,106.2,089,302. As part of the requirements of SFAS 123R, the Company isFASB ASC 718, we are required to estimate potential forfeitures of restricted stock unitsRSUs and adjust compensation cost recorded accordingly. The estimate of forfeitures will be adjusted over the requisite service period to the extent that actual forfeitures differ, or are expected to differ, from such estimates. Changes in estimated forfeitures will be recognized through a cumulative catch-up adjustment in the period of change and will also impact the amount of stock compensation expense to be recognized in future periods.
Transactions under the restricted stock plan2005 Plan are summarized as follows:RSUs
Number of RSUs
Weighted Average Grant Price
Balance at January 1, 2005 0 $ 0.00 Granted 813,305 $ 22.24 Earned 0 $ 0.00 Canceled (15,000 ) $ 22.12
Balance at December 31, 2005 798,305 $ 22.24 Granted 693,805 $ 32.21 Earned (113,794 ) $ 31.67 Canceled (53,383 ) $ 25.93
Balance at December 31, 2006 1,324,933 $ 26.77
RSUs Number of RSUs Weighted Average Grant Price Balance at January 1, 2007 1,324,933 $ 26.77 Granted 801,780 $ 27.90 Earned (209,303 ) $ 27.85 Canceled (75,776 ) $ 27.64 Balance at December 31, 2007 1,841,634 $ 26.86 Granted 763,182 $ 28.51 Earned (320,251 ) $ 29.42 Canceled (119,337 ) $ 28.19 Balance at December 31, 2008 2,165,228 $ 26.99 Granted 604,083 $ 21.80 Earned (407,156 ) $ 22.04 Canceled (57,721 ) $ 27.88 Balance at December 31, 2009 2,304,434 $ 26.48
Total unrecognized stock-based compensation expense related to non-vested restricted stock unitsRSU’s was approximately $32.6$57.1 million as of the end of 2006,December 31, 2009, related to 1,324,9332,304,434 shares with a per share weighted average fair value of $27.24.$26.48. We anticipate this expense to be recognized over a weighted average period of approximately 77.3 years.
Employee stock purchase plan
Our employee stock purchase plan permits substantially all domestic employees and employees of designated subsidiaries to acquire our common stock at a purchase price of 85% of the lower of the market price at the beginning or the end of the participationpurchase period. On December 21, 2005, our Compensation Committee amended theThe plan has quarterly purchase periods to be quarterly beginning on November 1, February 1, May 1, and AugustNovember 1 of each year. The initial period commencedAt our annual shareholders meeting held on April 1, 2006 and ended on July 31, 2006.May 7, 2007, our shareholders approved an additional 3 million shares of common stock to be reserved for issuance under this plan. Employees may designate up to 15% of their compensation for the purchase of common stock.stock under this plan. Common stock reserved for future employee purchases aggregated 823,3091,755,071 shares at December 31, 2006.2009. Shares issued under this plan were 539,541838,536 in the year ended December 31, 2006.2009. The weighted average fair value of the employees’ purchase rights was $22.34$19.05 per share and was estimated using the Black-Scholes model with the following assumptions:2006
2005
2004
Dividend expense yield 0.2% 0.2% 0.2% Expected life 3 months 6 months 6 months Expected volatility 29% 29% 35% Risk-free interest rate 4.5% 3.2% 1.0%
2009 2008 2007 Dividend expense yield 0.5% 0.3% 0.3% Expected life 3 months 3 months 3 months Expected volatility 45% 26% 23% Risk-free interest rate 0.8% 3.8% 5.0%
Weighted average, grant date fair value of purchase rights granted under the Employee Stock Purchase Plan:Number of shares
Weighted average fair value
2004 380,211 $ 7.73 2005 467,932 6.08 2006 539,541 6.62
Plan are as follows:
Numberof shares Weightedaveragefair value 2007 549,719 $ 6.19 2008 679,983 5.86 2009 838,536 5.75
Stock-based compensation included in total cost of sales and operating expenses for the years ended December 31, 2009, 2008 and 2007 are summarized as follows (in thousands):
2009 2008 2007 Stock-based compensation Total cost of sales $ 1,284 $ 1,063 $ 911 Sales and marketing 8,774 8,479 7,322 Research and development 7,236 7,121 6,435 General and administrative 3,005 3,084 2,866 Provision for income taxes (3,765 ) (4,601 ) (3,839 ) Total $ 16,534 $ 15,146 $ 13,695
Authorized Preferred Stock and Preferred Stock Purchase Rights Plan
We have 5,000,000 authorized shares of preferred stock. On January 21, 2004, our Board of Directors designated 750,000 of these shares as Series A Participating Preferred Stock in conjunction with its adoption of a Preferred Stock Rights Agreement (the “Rights Agreement”) and declaration of a dividend of one preferred share purchase right (a “Right”) for each share of common stock outstanding held as of May 10, 2004 or issued thereafter. Each Right will entitle its holder to purchase one one-thousandth of a share of National Instruments’ Series A Participating Preferred Stock at an exercise price of $200, subject to adjustment, under certain circumstances. The Rights Agreement was not adopted in response to any effort to acquire control of National Instruments.
The Rights only become exercisable in certain limited circumstances following the tenth day after a person or group announces acquisitions of or tender offers for 20% or more of our common stock. In addition, if an acquirer (subject to certain exclusions for certain current stockholders of National Instruments, an “Acquiring Person”) obtains 20% or more of our common stock, then each Right (other than the Rights owned by an Acquiring Person or its affiliates) will entitle the holder to purchase, for the exercise price, shares of our common stock having a value equal to two times the exercise price. Under certain circumstances, our Board of Directors may redeem the Rights, in whole, but not in part, at a purchase price of $0.01 per Right. The Rights have no voting privileges and are attached to and automatically traded with our common stock until the occurrence of specified trigger events. The Rights will expire on the earlier of May 10, 2014 or the exchange or redemption of the Rights. Comprehensive income
Our comprehensive income is comprised of net income, foreign currency translation and unrealized gains and losses on forward and option contracts and securities available for sale. Comprehensive income for 2006, 2005 and 2004 was $76.9 million, $57.2 million and $57.7 million, respectively.
Recently issued accounting pronouncements
In July 2006, the Financial Accounting Standards Board (“FASB”) issued FASB Interpretation (“FIN”) 48,Accounting for Uncertainty in Income Taxes – an interpretation of Statement of Financial Accounting Standards (“SFAS”) 109. This interpretation clarifies the accounting for uncertainty in income taxes recognized in an entity’s financial statements in accordance with SFAS 109,Accounting for Income Taxes. It prescribes a recognition threshold and measurement attribute for financial statement disclosure of tax positions taken or expected to be taken on a tax return. This interpretation is effective for fiscal years beginning after December 15, 2006. We adopted FIN 48 on January 1, 2007 as required. The cumulative effect of adopting FIN 48 was recorded in retained earnings upon adoption. The adoption of FIN 48 did not have a significant impact on our financial position or results of operations.
In September 2006, the Securities and Exchange Commission (“SEC”) issued Staff Accounting Bulletin (“SAB”) 108 regarding the process of quantifying financial statement misstatements. SAB 108 states that registrants should use both a balance sheet approach and an income statement approach when quantifying and evaluating the materiality of a misstatement. The interpretations in SAB 108 contain guidance on correcting errors under the dual approach as well as provide transition guidance for correcting errors. This interpretation does not change the requirements within SFAS 154,Accounting Changes and Error Corrections – a replacement of APB 20 and FASB Statement 3, for the correction of an error on financial statements. SAB 108 is effective for annual financial statements covering the first fiscal year ending after November 15, 2006. We adopted this interpretation on December 31, 2006. The adoption of SAB 108 did not have a significant effect on our consolidated financial statements.
In September 2006, the FASB issued SFAS 157,Fair Value Measurements. This standard defines fair value, establishes a framework for measuring fair value in accounting principles generally accepted in the United States of America, and expands disclosure about fair value measurements. This pronouncement applies under other accounting standards that require or permit fair value measurements. Accordingly, this statement does not require any new fair value measurement. This statement is effective for fiscal years beginning after November 15, 2007, and interim periods within those fiscal years. We will be required to adopt SFAS 157 in the first quarter of fiscal year 2008. We are currently evaluating the requirements of SFAS 157 and have not yet determined the impact on our consolidated financial statements.
In March 2006, the Emerging Issues Task Force (“EITF”) reached a consensus on EITF Issue 06-3,How Taxes Collected from Customers and Remitted to Governmental Authorities Should Be Presented in the Income Statement (that is, Gross versus Net Presentation). Taxes within the scope of EITF Issue 06-3 include any taxes assessed by a governmental authority that are directly imposed on a revenue-producing transaction between a seller and a customer and may include, but are not limited to, sales taxes, use taxes, value-added taxes, and some excise taxes. The EITF concluded that the presentation of these taxes on either a gross (included in revenues and costs) or a net (excluded from revenue) basis is an accounting policy decision that should be disclosed. For any such taxes that are reported on a gross basis, a company should disclose the amounts of those taxes in interim and annual financial statements. Our policy is to exclude all such taxes from revenue. The provisions of EITF 06-3 are effective for interim and annual reporting periods beginning after December 15, 2006. The adoption of EITF 06-3 will not have any effect on our consolidated financial statements.
Note 2: Short-term investments
Short-term investments at December 31, 2006 and 2005, consisting of corporate, state and municipal securities, were acquired at an aggregate cost of $150.2 million and $119.8 million, respectively. The contractual maturities of these securities, which are classified as available-for-sale and carried at fair value, are as follows (in thousands):
December 31,
2006
2005
Less than 90 days $ 73,787 $ 61,855 90 days to one year 31,309 42,222 One year through two years 38,559 11,877 Two years or more 6,535 3,892
$ 150,190 $ 119,846
Note 3: Inventories
Inventories, net consist of the following (in thousands):
December 31,
2006
2005
Raw materials $ 38,270 $ 28,497 Work-in-process 4,321 4,634 Finished goods 34,547 29,696
$ 77,138 $ 62,827
Note 4: Property and equipment
Property and equipment consist of the following (in thousands):
December 31,
2006
2005
Land $ 7,165 $ 7,085 Buildings 125,228 124,428 Furniture and equipment 110,710 91,073
243,103 222,586 Accumulated depreciation (97,678 ) (78,256 )
$ 145,425 $ 144,330
Depreciation expense for the years ended December 31, 2006, 2005 and 2004, was $20.2 million, $17.8 million and $17.3 million, respectively.
Note 5: Intangibles
Intangibles at December 31, 2006 and 2005 are as follows:
2006
2005
Gross Carrying Amount
Accumulated Amortization
Net Carrying Amount
Gross Carrying Amount
Accumulated Amortization
Net Carrying Amount
Capitalized software development costs $ 57,571 $ (41,791 ) $ 15,780 $ 50,201 $ (32,651 ) $ 17,550 Acquired technology 20,814 (9,734 ) 11,080 20,257 (6,296 ) 13,961 Patents 12,928 (3,076 ) 9,852 11,647 (2,445 ) 9,202 Other 6,452 (3,099 ) 3,353 4,826 (1,937 ) 2,889
$ 97,765 $ (57,700 ) $ 40,065 $ 86,931 $ (43,329 ) $ 43,602
Software development costs capitalized during 2006, 2005 and 2004 were $7.4 million, $13.4 million and $5.0 million, respectively, and related amortization was $9.1 million, $7.2 million and $6.6 million, respectively. Amortization of capitalized software development costs is computed on an individual product basis for those products available for market and is recognized based on the product’s estimated economic life, generally three years. Patents are amortized using the straight-line method over their estimated period of benefit, generally ten to seventeen years. Total intangible assets amortization expenses were $13.9 million, $10.7 million and $8.3 million for the years ended December 31, 2006, 2005 and 2004, respectively.
Capitalized software development costs, acquired technology, patents and other have weighted-average useful lives of 2.1 years, 4.1 years, 7.7 years and 3.7 years, respectively, as of the end of December 31, 2006. The estimated future amortization expense related to intangible assets as of December 31, 2006 is as follows:
Amount (in thousands)
2007 $ 13,044 2008 10,219 2009 5,046 2010 2,477 2011 1,569 Thereafter 7,710
$ 40,065
We established a valuation reserve in 2004 for the estimated total impairment of our $2.5 million cost-method investment in a start-up company. This impairment was based on our lack of expected recovery of our investment based on the start-up company’s lack of profitability.
Note 6: Goodwill
The carrying amount of goodwill for 2005 and 2006 are as follows:
Amount (in thousands)
Balance as of December 31, 2004 $ 13,356 Acquisitions/purchase accounting adjustments 39,177 Divestitures —
Balance as of December 31, 2005 52,533 Acquisitions/purchase accounting adjustments — Divestitures — Foreign currency translation impact 810
Balance as of December 31, 2006 $ 53,343
The excess purchase price over the fair value of assets acquired is recorded as goodwill. In accordance with SFAS 142,Goodwill and Other Intangible Assets, goodwill is tested for impairment on an annual basis, and between annual tests if indicators of potential impairment exist, using a fair-value-based approach. Our annual impairment test was performed on April 6, 2006. No impairment of goodwill was identified during any of the periods presented.
Note 7: Income taxes
The components of income before income taxes are as follows (in thousands):
Years Ended December 31,
2006
2005
2004
Domestic $ 40,681 $ 40,460 $ 37,786 Foreign 54,621 40,220 27,027
$ 95,302 $ 80,680 $ 64,813
The provision for income taxes charged to operations is as follows (in thousands):
Years Ended December 31,
2006
2005
2004
Current tax expense: U.S. federal $ 17,966 $ 11,022 $ 10,594 State 901 1,029 1,106 Foreign 5,190 3,725 3,300
Total current 24,057 15,776 15,000
Deferred tax expense (benefit): U.S. federal (1,233 ) 2,396 1,041 State (90 ) (102 ) 121 Foreign (140 ) 1,093 41
Total deferred (1,463 ) 3,387 1,203
Total provision $ 22,594 $ 19,163 $ 16,203
Deferred tax liabilities (assets) at December 31, 2006 and 2005 as follows (in thousands):
December 31,
2006
2005
Capitalized software $ 5,392 $ 6,288 Unrealized gain on derivative instruments — 86 Depreciation and amortization 9,071 8,598 Unrealized exchange gain 2 1,238 Undistributed earnings of foreign subsidiaries 10,313 4,410
Gross deferred tax liabilities 24,778 20,620
Operating loss carryforwards (34,154 ) (22,672 ) Intangibles (85,684 ) (71,125 ) Vacation and other accruals (3,783 ) (2,946 ) Inventory valuation and warranty provisions (6,666 ) (9,043 ) Doubtful accounts and sales provisions (1,328 ) (1,545 ) Intercompany profit (3,242 ) (2,442 ) Deferred revenue (2,613 ) — Accrued rent expenses (17 ) (17 ) Accrued legal expenses (1,450 ) (12 ) Unrealized loss on derivative instruments (149 ) — 10% minority stock investment (906 ) (911 ) Stock-based compensation (1,954 ) (563 ) Other (691 ) (629 )
Gross deferred tax assets (142,637 ) (111,905 )
Valuation allowance 117,768 91,534
Net deferred tax liability (asset) $ (91 ) $ 249
A reconciliation of income taxes at the U.S. federal statutory income tax rate to the effective tax rate follows:
Years Ended December 31,
2006
2005
2004
U.S. federal statutory tax rate 35 % 35 % 35 % Foreign sales corporation/ETI benefit (1 ) (2 ) (3 ) Domestic production activities (1 ) (1 ) — Foreign taxes more (less) than federal statutory rate (11 ) (7 ) (6 ) Change in valuation allowance — (1 ) — Research and development tax credit (1 ) (1 ) (1 ) Tax exempt interest (1 ) (1 ) (1 ) State income taxes, net of federal tax benefit 1 1 1 Employee share-based compensation 3 — — Other — 1 —
Effective tax rate 24 % 24 % 25 %
As of December 31, 2006, thirteen of our subsidiaries have available, for income tax purposes, foreign net operating loss carryforwards of an aggregate of approximately $214.4 million, of which $8.5 million expire during the years 2008 — 2013 and $205.9 million of which may be carried forward indefinitely. Our tax valuation allowance relates to the realizability of certain of these foreign net operating loss carryforwards and benefits of tax deductible goodwill in excess of book goodwill.
We maintain a manufacturing facility in Hungary. As a result of certain foreign investment incentives available under Hungarian law, the profit from our Hungarian operation is currently subject to a reduced income tax rate. Based on our capital investment in Hungary and current exemption limits which apply to this and any capital investments made through December 31, 2005, we currently expect this special tax status will terminate on or before December 31, 2008. The aggregate tax benefit of the exemption was $5.4 million and $3.4 million for the years ended December 31, 2006 and 2005, respectively.
In 2003, we restructured the organization of our manufacturing operation in Hungary. The tax deductible goodwill in excess of book goodwill created by this restructuring resulted in our being required to record a gross deferred tax asset of $91.0 million. The amortization of this excess tax deductible goodwill resulted in a $32.1 million and $20.1 million deferred tax asset for the associated net operating loss for the years ended December 31, 2006 and 2005, respectively. As of December 31, 2006 and 2005, the gross deferred tax asset related to the excess tax goodwill was $85.7 million and $71.1 million, respectively. Because we do not expect to have significant taxable income in the relevant jurisdiction in future periods to realize the benefit of these deferred tax assets, a valuation allowance for the entire amount of these deferred tax assets has been established.
We have not provided for U.S. federal income and foreign withholding taxes on approximately $111.8 million of certain non-U.S. subsidiaries’ undistributed earnings as of December 31, 2006. These earnings would become subject to taxes of approximately $36.5 million, if they were actually or deemed to be remitted to the parent company as dividends or if we should sell our stock in these subsidiaries. We currently intend to reinvest indefinitely these undistributed earnings.
Note 8: Stockholders’ equity
Stock repurchases and retirements In
Since 1998, our Board of Directors approved theand we maintained various stock repurchase and retirement of shares of common stock to reduce the dilutive effect of our stock plans.programs. Pursuant to the 1998 repurchase programthese plans we have repurchasedhad purchased and retired a total of 1,402,7257,354,966 shares for approximately $23.1$184.9 million from 1998 through December 31, 2007. During 2008, we purchased an additional 4,110,042 share for approximately $103.6 million. In 2002,At December 31, 2008, there were 723,092 shares available for repurchase under the plan approved in April 2008. On January 23, 2009, our Board of Directors approved a new share repurchase and retirement plan which replacedthat increased the 1998 plan. Underaggregate number of shares of common stock we are authorized to purchase from 591,324 to 3.0 million. During 2009, we purchased an additional 1,443,441 shares for approximately $34.6 million. At December 31, 2009, there were 1,688,327 shares available for repurchase under the plan approved in 2002, weJanuary 2009. Our share repurchase plan does not have authorization to repurchase up to 6,222,106 shares of National Instruments stock. This plan has noan expiration date. Pursuant to our repurchase program, we have repurchased and retired a total of 3,222,106 shares for approximately $82.0 million.
Note 9:11 – Employee retirement plan
We have a defined contribution retirement plan pursuant to Section 401(k) of the Internal Revenue Code. Substantially all domestic employees with at least thirty30 days of continuous service are eligible to participate and may contribute up to 15% of their compensation. The Board of Directors has elected to make matching contributions equal to 50% of employee contributions, which may be applied to a maximum of 6% of each participant’s compensation. Employees are eligible for our matching contributions after one year of continuous service. Company contributions vest immediately. Our policy prohibits participants from direct investment in shares of our common stock within the plan. Company contributions charged to expense were $3.0$3.9 million, $2.6$3.7 million and $2.4$3.3 million in 2006, 20052009, 2008 and 2004,2007, respectively.
Fair value of financial instrumentsIn accordance with FASB ASC 280, Segment Reporting (FASB ASC 280), we determine operating segments using the management approach. The estimated fair value amounts disclosed below have been determined using available market informationmanagement approach designates the internal organization that is used by management for making operating decisions and valuation methodologies described below. For certainassessing performance as the source of our financial instruments, including cashoperating segments. It also requires disclosures about products and cash equivalents, accounts receivable, accounts payableservices, geographic areas and accrued liabilities,major customers.
We have defined our operating segment based on geographic regions. We sell our products in three geographic regions. Our sales to these regions share similar economic characteristics, similar product mix, similar customers, and similar distribution methods. Accordingly, we have elected to aggregate these three geographic regions into a single operating segment. Revenue from the carrying amount approximates fair value due to the short-term maturity of these instruments. The estimated fair values of the other assets (liabilities)sale of our remaining financial instruments at December 31, 2006products which are similar in nature and 2005software maintenance are reflected as total net sales in our Consolidated Statements of Income.
Total net sales, operating income, interest income and long-lived assets, classified by the major geographic areas in which we operate, are as follows (in thousands):December 31,
2006
2005
Carrying
Amount
Fair
Value
Carrying
Amount
Fair
Value
Short-term investments $ 150,190 $ 150,190 $ 119,846 $ 119,846 Other assets/liabilities: Forward contracts (1,043 ) (1,043 ) 523 523
The fair values of short-term investments
Years Ended December 31, 2009 2008 2007 Net sales: Americas: Unaffiliated customer sales $ 292,999 $ 355,878 $ 331,482 Geographic transfers 86,145 132,563 115,709 379,144 488,441 447,191 Europe: Unaffiliated customer sales 210,188 267,373 230,940 Geographic transfers 189,076 204,282 159,992 399,264 471,655 390,932 Asia Pacific: Unaffiliated customer sales 173,407 197,286 177,956 Eliminations (275,221 ) (336,845 ) (275,701 ) $ 676,594 $ 820,537 $ 740,378
Years Ended December 31, 2009 2008 2007 Operating income: Americas $ 46,816 $ 71,467 $ 76,292 Europe 87,250 105,748 92,469 Asia Pacific 45,439 61,642 59,845 Unallocated: Research and development expenses (132,974 ) (143,140 ) (126,515 ) $ 46,531 $ 95,717 $ 102,091
Years Ended December 31, 2009 2008 2007 Interest income: Americas $ 803 $ 2,603 $ 5,138 Europe 727 3,291 4,485 Asia Pacific 99 102 199 $ 1,629 $ 5,996 $ 9,822
December 31, 2009 2008 Long-lived assets: Americas $ 100,489 $ 107,701 Europe 36,555 39,280 Asia Pacific 16,221 7,496 $ 153,265 $ 154,477
Total sales outside the United States for 2009, 2008 and foreign currency forward contracts2007 were estimated based upon quotes from brokers as of the applicable balance sheet date.$412.7 million, $499.3 million and $437.0 million, respectively.
Note 11: Derivative instruments13 – Commitments, contingencies and hedging activitiesleases
We have operations in 40 countries. Approximately 52% of our revenues are generated outsidecommitments under non-cancelable operating leases primarily for office facilities throughout the Americas. Our activities exposeworld. Certain leases require us to a varietypay property taxes, insurance and routine maintenance, and include escalation clauses. Future minimum lease payments as of market risks, includingDecember 31, 2009, for each of the effects of changes in foreign-currency exchange rates. These financial risksnext five years are monitored and managed by us as an integral part of our overall risk management program. We maintain a foreign-currency risk management strategy that uses derivative instruments (foreign currency forward and purchased options contracts) to protect our earnings and cash flows from fluctuations caused by the volatility in currency exchange rates. Movements in foreign-currency exchange rates pose a risk to our operations and competitive position, since exchange rate changes may affect our profitability and cash flow, and the business or pricing strategies of our non-U.S. based competitors.
Foreign currency fair value and cash flow hedges
The vast majority of our foreign sales are denominated in the customers’ local currency. We purchase foreign currency forward and purchased options contracts as hedges of forecasted sales that are denominated in foreign currencies and as hedges of foreign currency denominated receivables. These contracts are entered into to protect against the risk that the eventual dollar-net-cash inflows resulting from such sales or firm commitments will be adversely affected by changes in exchange rates.
We held forward contracts with notional amounts totaling $19.6follows (in thousands):
2010 $ 14,415 2011 9,898 2012 6,982 2013 4,611 2014 3,665 Thereafter 12,130 $ 51,701
Rent expense under operating leases was approximately $12.3 million, $11.7 million and $24.1$10.2 million at December 31, 2006 and 2005, respectively, that were designated as foreign currency fair value hedges of our foreign denominated receivables. The fair value of these contracts, which are for 90-day periods, is a liability of $617,000 and a receivable of $278,000 at December 31, 2006 and 2005, respectively. We recorded net losses of $1.0 million, net gains of $2.2 million and net losses of $2.6 million for fair value hedges for the years ended December 31, 2006, 20052009, 2008 and 2004, respectively, which was recorded2007, respectively.
As of December 31, 2009, we have non-cancelable purchase commitments with various suppliers of customized inventory and inventory components totaling approximately $6.5 million over the next twelve months.
As of December 31, 2009, we have outstanding guarantees for payment of customs and foreign grants totaling approximately $5.2 million.
Note 14 – Litigation
We filed a patent infringement action on January 25, 2001, in “Foreign Exchange Gain (Loss).” We hedge up to 90%the U.S. District Court, Eastern District of Texas (Marshall Division) claiming that The MathWorks, Inc. (“MathWorks”) infringed certain of our outstanding foreign denominated receivables. We held forward contracts withU.S. patents. On January 30, 2003, a notionaljury found infringement by MathWorks of three of the patents involved and awarded us specified damages. On September 23, 2003, the District Court entered final judgment in favor of us and entered an injunction against MathWorks’ sale of its Simulink and related products and stayed the injunction pending appeal. Upon appeal, the judgment and the injunction were affirmed by the U.S. Court of Appeals for the Federal Circuit (September 3, 2004). Subsequently the stay of injunction was lifted by the District Court. In November 2004, the final judgment amount of $26.6$7.4 million which had been held in escrow pending appeal was released to us.
An action was filed by MathWorks against us on September 22, 2004, in the U.S. District Court, Eastern District of Texas (Marshall Division), claiming that on that day MathWorks had released modified versions of its Simulink and $7.1related products, and seeking a declaratory judgment that the modified products do not infringe the three patents adjudged infringed in the District Court's decision of September 23, 2003 (and affirmed by the Court of Appeals on September 3, 2004). On November 2, 2004, MathWorks served the complaint on us. We filed an answer to MathWorks’ declaratory judgment complaint, denying MathWorks’ claims of non-infringement and alleging our own affirmative defenses. On January 5, 2005, the Court denied a contempt motion by us to enjoin the modified Simulink products under the injunction in effect from the first case. On January 7, 2005, we amended our answer to include counterclaims that MathWorks’ modified products are infringing three of our patents, and requested unspecified damages and an injunction. MathWorks filed its reply to our counterclaims on February 7, 2005, denying the counterclaims and alleging affirmative defenses. On March 2, 2005, we filed a notice of appeal regarding the Court's denial of the contempt motion. On March 15, 2005, the Court stayed MathWorks’ declaratory judgment action, pending a decision on the appeal by the Court of Appeals for the Federal Circuit. On February 9, 2006, the Court of Appeals for the Federal Circuit affirmed the District Court’s January 2005 order. On November 22, 2006, the District Court lifted the stay. The case schedule has yet to be set in this action. During the fourth quarter of 2004, we accrued $4 million at December 31, 2006 and 2005, respectively, that were designated as foreign currency cash flow hedges related to our probable loss from this contingency, which consists entirely of anticipated sales transactions.patent defense costs that are probable of being incurred. In the fourth quarter of 2006, we accrued an additional $600,000 related to this contingency. During the third quarter of 2009, we reduced the accrual by $2 million to reflect a decrease in the estimated costs that are probable of being incurred in this action. To date, we have charged a cumulative total of $623,000 against this accrual. At December 31, 2009, the remaining accrual was $2 million.
On February 1, 2008, we acquired all of the outstanding shares of microLEX Systems ApS, (“microLEX”) a premier provider of virtual instrumentation-based video, audio and mixed-signal test solutions. This acquisition was accounted for as a business combination. The purchase price of the acquisition, which included legal and accounting fees, was $17.8 million in cash. The allocation of the purchase price was determined using the fair value of these contracts, whichassets and liabilities acquired as of February 1, 2008. We funded the purchase price from existing cash balances. Our consolidated financial statements include the operating results from the date of acquisition. Pro-forma results or operations have not been presented because the effects of those operations were not material. The following table summarizes the allocation of the purchase price of microLEX (in thousands):
Goodwill $ 10,818 Acquired core technology 5,201 Non-competition agreements 159 Trademarks 119 Customer relationships 354 Current assets acquired 3,057 Long-term assets acquired 20 Current liabilities assumed (486 ) Deferred tax liabilities (1,458 ) Total assets acquired $ 17,784
Goodwill is not deductible for tax purposes. Existing technology, non-competition agreements, trademarks, and customer relationships have useful lives of 5 years, 3 years, 3 years, and 5 years, respectively, from the date of acquisition. These assets are not deductible for terms uptax purposes.
Note 16 – Quarterly results (unaudited)
The following quarterly results have been derived from unaudited consolidated financial statements that, in the opinion of management, reflect all adjustments (consisting only of normal recurring adjustments) necessary for a fair presentation of such quarterly information. The operating results for any quarter are not necessarily indicative of the results to twelve months, is a liabilitybe expected for any future period. The unaudited quarterly financial data for each of $427,000 and a receivable of $245,000 at December 31, 2006 and 2005, respectively, and a net unrealized deferred loss of $427,000 and a net unrealized deferred gain of $245,000 at December 31, 2006 and 2005, respectively, was recordedthe eight quarters in “Accumulated Other Comprehensive Income.” We hedge up to 100% of anticipated foreign currency denominated sales transactions for up to 40 months. We recorded net losses of $1.0 million and net gains of $105,000 and net losses of $5.8 million for cash flow hedges for the two years ended December 31, 2006, 2005 and 2004, respectively, which was included in “Net Sales.” As of December 31, 2006, $427,000 of deferred losses on cash flow hedges recorded in “Accumulated Other Comprehensive Income” are expected to be reclassified to earnings during the next twelve months. The actual foreign sales expected to occur over the next twelve months will necessitate the reclassifying to earnings of these derivative gains.
Hedge effectiveness of a foreign currency option contract designated as a cash flow hedge is measured by comparing the hedging instrument’s cumulative change in fair value from inception to maturity to the forecasted transaction’s terminal value. No amounts were excluded from the assessment of hedge effectiveness nor were there any amounts of ineffectiveness recorded in the consolidated statements of income for the years ended December 31, 2006 and 2005.
Note 12: Segment information
In accordance with SFAS 131,Disclosures about Segments of an Enterprise and Related Information, we determine operating segments using the management approach. The management approach designates the internal organization that is used by management for making operating decisions and assessing performance as the source of our operating segments. It also requires disclosures about products and services, geographic areas and major customers.
While we sell our products to many different markets, management has chosen to organize the Company by geographic areas, and as a result has determined that we have one operating segment. Substantially all of the interest income, depreciation and amortization is recorded in the Americas. Net sales, operating income and identifiable assets, classified by the major geographic areas in which we operate,2009 are as follows (in thousands)thousands, except per share data):
Years Ended December 31,
2006
2005
2004
Net sales: Americas: Unaffiliated customer sales $ 317,780 $ 275,524 $ 243,651 Geographic transfers 125,096 87,072 84,520
442,876 362,596 328,171
Europe: Unaffiliated customer sales 193,364 171,499 164,895 Geographic transfers 159,369 125,650 99,958
352,733 297,149 264,853
Asia Pacific: Unaffiliated customer sales 149,263 124,818 105,542
Eliminations (284,465 ) (212,722 ) (184,478 )
$ 660,407 $ 571,841 $ 514,088
Years Ended December 31,
2006
2005
2004
Operating income: Americas $ 67,644 $ 63,267 $ 53,472 Europe 78,402 61,790 55,705 Asia Pacific 54,771 40,996 38,211 Unallocated: Research and development expenses (113,095 ) (87,841 ) (84,692 )
$ 87,722 $ 78,212 $ 62,696
December 31,
2006
2005
Identifiable assets: Americas $ 476,027 $ 436,170 Europe 188,388 129,420 Asia Pacific 56,805 42,746
$ 721,220 $ 608,336
Total sales outside
Three Months Ended Mar. 31,2009 Jun. 30,2009 Sep. 30,2009 Dec. 31,2009 Net sales $ 157,799 $ 152,163 $ 165,035 $ 201,597 Gross profit 116,916 111,677 123,136 154,981 Operating income (2,479 ) 2,341 10,688 35,981 Net income 358 4,430 9,931 2,366 Basic earnings per share $ 0.00 $ 0.06 $ 0.13 $ 0.03 Weighted average shares outstanding-basic 77,277 77,556 77,653 77,589 Diluted earnings per share $ 0.00 $ 0.06 $ 0.13 $ 0.03 Weighted average shares outstanding-diluted 77,436 77,824 78,103 78,325 Dividends declared per share $ 0.12 $ 0.12 $ 0.12 $ 0.12
Three Months Ended Mar. 31,2008 Jun. 30,2008 Sep. 30,2008 Dec. 31,2008 Net sales $ 192,918 $ 210,474 $ 215,038 $ 202,107 Gross profit 143,849 157,034 160,531 152,014 Operating income 18,065 27,834 27,946 21,872 Net income 17,616 24,734 23,159 19,318 Basic earnings per share $ 0.22 $ 0.32 $ 0.29 $ 0.25 Weighted average shares outstanding-basic 78,840 78,484 78,834 78,110 Diluted earnings per share $ 0.22 $ 0.31 $ 0.29 $ 0.25 Weighted average shares outstanding-diluted 79,825 79,549 79,841 78,522 Dividends declared per share $ 0.11 $ 0.11 $ 0.11 $ 0.11
Note 17 – Subsequent events
In accordance with FASB ASC 855, Subsequent Events (FASB ASC 855), we have evaluated subsequent events through February 17, 2010, the United States for 2006, 2005 and 2004date the financial statements were $373.7 million, $323.9 million and $293.3 million, respectively.issued.
On January 22, 2010, our Board of Directors declared a quarterly cash dividend of $0.13 per common share, payable March 1, 2010, to shareholders of record on February 8, 2010.
From January 29, 2010 to February 12, 2010, we have repurchased 683,832 shares of our common stock at an average price of $29.97 under our share repurchase plan. The maximum number of shares that may yet be purchased under our plan is 1,004,495. Our purchase plan does not have an expiration date.
Note 13: Commitments, contingencies and leases
We have commitments under non-cancelable operating leases primarily for office facilities. Certain leases require us to pay property taxes, insurance and routine maintenance, and include escalation clauses. Future minimum lease payments as of December 31, 2006, for each of the next five years are as follows (in thousands):
2007 $ 7,241 2008 5,682 2009 4,883 2010 3,103 2011 1,983 Thereafter 799
$ 23,691
Rent expense under operating leases was approximately $8.7 million, $7.8 million and $6.5 million for the years ended December 31, 2006, 2005 and 2004, respectively.
As of December 31, 2006, we have non-cancelable purchase commitments with various suppliers of customized inventory and inventory components totaling approximately $7.0 million over the next twelve months.
As of December 31, 2006, we have outstanding guarantees for payment of customs and foreign grants totaling approximately $3.5 million.
Note 14: ��Litigation
We filed a patent infringement action on January 25, 2001 in the U.S. District Court, Eastern District of Texas (Marshall Division) claiming that The MathWorks, Inc. (“MathWorks”) infringed certain of our U.S. patents. On January 30, 2003, a jury found infringement by MathWorks of three of the patents involved and awarded us specified damages. On June 23, 2003, the District Court entered final judgment in favor of us and entered an injunction against MathWorks’ sale of its Simulink and related products and stayed the injunction pending appeal. Upon appeal, the judgment and the injunction were affirmed by the U.S. Court of Appeals for the Federal Circuit (September 3, 2004). Subsequently the stay of injunction was lifted by the District Court. In November 2004, the final judgment amount of $7.4 million which had been held in escrow pending appeal was released to us.
An action was filed by MathWorks against us on September 22, 2004, in the U.S. District Court, Eastern District of Texas (Marshall Division), claiming that on that day MathWorks had released modified versions of its Simulink and related products, and seeking a declaratory judgment that the modified products do not infringe the three patents adjudged infringed in the District Court’s decision of June 23, 2003, (and affirmed by the Court of Appeals on September 3, 2004). On November 2, 2004, MathWorks served the complaint on us. We filed an answer to MathWorks’ declaratory judgment complaint, denying MathWorks’ claims of non-infringement and alleging our own affirmative defenses. On January 5, 2005, the Court denied a contempt motion by us to enjoin the modified Simulink products under the injunction in effect from the first case. On January 7, 2005, we amended our answer to include counterclaims that MathWorks’ modified products are infringing three of our patents, and requested unspecified damages and an injunction. MathWorks filed its reply to our counterclaims on February 7, 2005, denying the counterclaims and alleging affirmative defenses. On March 2, 2005, we filed a notice of appeal regarding the Court’s denial of the contempt motion. On March 15, 2005, the Court stayed MathWorks’ declaratory judgment action, pending a decision on the appeal by the Court of Appeals for the Federal Circuit. On February 9, 2006, the Court of Appeals for the Federal Circuit affirmed the District Court’s January 2005 order. On November 22, 2006, the District Court lifted the stay. The case schedule has yet to be set in this action. During the fourth quarter of 2004, we accrued $4 million related to our probable loss from this contingency, which consists entirely of anticipated patent defense costs that are probable of being incurred. In the fourth quarter of 2006, we accrued an additional $600,000 related to this contingency. We charged approximately $57,000 against this accrual during the fourth quarter of 2006. We have charged a total of $602,000 against this accrual through December 31, 2006.
Note 15: Acquisitions
On January 31, 2005, we acquired all of the common stock of Toronto, Canada-based Electronics Workbench, a supplier of electronics design automation software. The acquisition was accounted for as a purchase. The purchase price of the acquisition, subject to adjustment as provided for in the purchase agreement, was $12.1 million in cash. We funded the purchase price from existing cash balances. Our consolidated financial statements include the operating results from the date of acquisition. Pro-forma results of operations have not been presented because the effects of those operations were not material. In accordance with SFAS 141, Business Combinations, the total purchase consideration has been allocated to the assets acquired and liabilities assumed, including identifiable intangible assets, based on their respective estimated fair values at the date of acquisition.
On April 29, 2005, we acquired the operating assets of Measurement Computing Corporation (MCC), a provider of low-cost data acquisition products. The acquisition was accounted for as a purchase. We acquired the operating assets of MCC, which included the legal positions of MCC and SoftWIRE in litigation against us. As a result of the asset acquisition, a pending legal action was dismissed with prejudice and we eliminated our remaining $1.9 million accrual for patent defense costs related to MCC. The gain that resulted from the elimination of the accrual was recorded in general and administrative expenses. The purchase price of the acquisition, subject to adjustment as provided for in the purchase agreement, was $33.2 million in cash. We funded the purchase price from existing cash balances. Our consolidated financial statements include the operating results from the date of acquisition. Pro-forma results of operations have not been presented because the effects of those operations were not material. In accordance with SFAS 141, the total purchase consideration has been allocated to the assets acquired and liabilities assumed, including identifiable assets, based on their respective estimated fair values at the date of acquisition.
On October 17, 2005, we acquired the operating assets of IOtech, Inc., a provider of PC-based data acquisition and instrumentation products. The acquisition was accounted for as a purchase. The purchase price of the acquisition, subject to adjustment as provided for in the purchase agreement, was $17.6 million in cash. We funded the purchase price from existing cash balances. Our consolidated financial statements include the operating results from the date of acquisition. Pro-forma results of operations have not been presented because the effects of those operations were not material. In accordance with SFAS 141, the total purchase consideration has been allocated to the assets acquired and liabilities assumed, including identifiable assets, based on their respective estimated fair values at the date of acquisition.
Goodwill is deductible for tax purposes. Goodwill is not amortized but is reviewed periodically for impairment. Acquired core technology and intangible assets are amortized over their useful lives, which range from three to eight years. Amortization expense for intangible assets acquired was approximately $3.2 million and $2.0 million for 2006 and 2005, respectively, of which approximately $2.7 million and $1.5 million was recorded in cost of sales and approximately $490,000 and $490,000 was recorded in operating expenses. The estimated amortization expense of intangible assets acquired for the current fiscal year and in future years will be recorded in the consolidated statements of income as follows (in thousands):
Fiscal Year
Cost of Sales
Acquisition related costs and amortization, net
Total
2007 $ 2,689 $ 450 $ 3,139 2008 2,532 412 2,944 2009 2,259 338 2,597 2010 1,725 177 1,902 Thereafter 1,166 271 1,437
Total $ 10,371 $ 1,648 $ 12,019
Note 16: Related party transactions
During 2002, we contributed approximately $3.6 million to the National Instruments Foundation, a 501(c)(3) charitable foundation established in 2002 for the purpose of continued promotion of scientific and engineering research and education at higher education institutions worldwide. This contribution was recorded as general and administrative expense in 2002. Two of the four directors of the National Instruments Foundation are current officers of National Instruments.
Note 17: Quarterly results (unaudited)
The following quarterly results have been derived from unaudited consolidated financial statements that, in the opinion of management, reflect all adjustments (consisting only of normal recurring adjustments) necessary for a fair presentation of such quarterly information. The operating results for any quarter are not necessarily indicative of the results to be expected for any future period. The unaudited quarterly financial data for each of the eight quarters in the two years ended December 31, 2006 are as follows (in thousands, except per share data):
Three Months Ended
Mar. 31, 2006
Jun. 30, 2006
Sep. 30, 2006
Dec. 31, 2006
Net sales $ 154,752 $ 160,123 $ 164,079 $ 181,453 Gross profit 113,247 119,271 121,648 135,915 Operating income 15,826 20,911 22,367 28,616 Net income 12,602 17,021 18,651 24,434 Basic earnings per share $ 0.16 $ 0.21 $ 0.23 $ 0.31 Weighted average shares outstanding-basic 79,053 79,611 79,637 79,767 Diluted earnings per share $ 0.15 $ 0.21 $ 0.23 $ 0.30 Weighted average shares outstanding-diluted 81,608 81,653 81,274 81,524 Dividends declared per share $ 0.06 $ 0.06 $ 0.06 $ 0.06
Three Months Ended
Mar. 31, 2005
Jun. 30, 2005
Sep. 30, 2005
Dec. 31, 2005
Net sales $ 129,740 $ 140,822 $ 141,618 $ 159,661 Gross profit 97,376 104,109 103,725 117,322 Operating income 14,182 19,093 18,343 26,594 Net income 11,136 15,024 14,399 20,958 Basic earnings per share $ 0.14 $ 0.19 $ 0.18 $ 0.27 Weighted average shares outstanding-basic 79,175 78,303 78,158 78,505 Diluted earnings per share $ 0.14 $ 0.19 $ 0.18 $ 0.26 Weighted average shares outstanding-diluted 81,924 80,190 80,575 80,821 Dividends declared per share $ 0.05 $ 0.05 $ 0.05 $ 0.05
Note 18: Subsequent Event
On January 30, 2007, our Board of Directors declared a quarterly cash dividend of $0.07 per common share, payable March 5, 2007, to shareholders of record on February 12, 2007.
On January 30, 2007, our Board of Directors granted authorization for the repurchase of an additional 1,522,106 shares of our common stock under our share repurchase plan.
SCHEDULE II
NATIONAL INSTRUMENTS CORPORATION
VALUATION AND QUALIFYING ACCOUNTS
(In thousands)
Allowance for doubtful accounts and sales returns:
Year
Description
Balance at Beginning of Period
Provision for Bad Debt Expense
Write-Offs Charged to Allowances
Balance at End of Period
2004 Allowance for doubtful accounts and sales returns $ 3,244 $ 596 $ 329 $ 3,511 2005 Allowance for doubtful accounts and sales returns 3,511 1,462 239 4,734 2006 Allowance for doubtful accounts and sales returns 4,734 33 407 4,360
Instrument
Services
In
other software environments.
. We offer fee-based training classes and self-paced course kits for many of our software and hardware products. On-site courses are quoted per customer requests.requests and we include on-line course offerings with live teachers. We also offer programs to certify programmers and instructors for our products.
2007.
)
ITEM 1A, Risk Factors, “Our Revenues are Subject to Seasonal Variations.”
Certain of our competitors have substantial competitive advantages in terms of breadth of technology, sales, marketing and support capability and resources, including the number of sales and technical personnel and their ability to cover a geographic area and/or particular account more extensively and with more complete solutions than we can offer, and more extensive warranty support, system integration and service capabilities than those we have. In addition, large competitors can often enter into strategic alliances with our key customers or target accounts, which can potentially have a negative impacteffect on our success with those accounts.
operating results.
| · | new product introductions by competitors; |
| product |
| · | the impact of foreign exchange rates on product pricing; |
| · | quality and performance; |
| success in developing new products; |
| adequate manufacturing capacity and supply of components and materials; |
| efficiency of manufacturing operations; |
| effectiveness of sales and marketing resources and strategies; |
| strategic relationships with other suppliers; |
| timing of our new product |
| protection of our products by effective use of intellectual property laws; |
| the outcome of any material intellectual property litigation; |
| · | the financial strength of our competitors; |
| · | barriers to entry imposed by competitors with significant market power in new markets; |
| · | general market and economic conditions; and, |
Although we operate in a highly competitive market, we believe we compete favorably with respect to these factors of competition.
performance characteristics.
See further discussion regarding risks associated with our patents in ITEM 1A, Risk Factors, “Our Business Depends on Our Proprietary Rights and We are Subject to Intellectual Property Litigation.”
We obtain most
See“Our Business is Dependent on Key Suppliers” at page 14 for additional discussion of the risks associated with limited source suppliers.
During the year ended December 31, 2009, our order backlog increased by approximately $8 million.
As of December 31, 2006,2009, we had 4,1495,120 employees worldwide, including 1,1221,457 in research and development, 1,8792,338 in sales and marketing and customer support, 674755 in manufacturing and 474570 in administration and finance. None of our employees are represented by a labor union and we have never experienced a work stoppage. We consider our employee relations to be good. For eighteleven consecutive years, from 1999 to 2006,2009, we have been named among the 100 Best Companies to Work for in America according toFORTUNE magazine.
| additional marketing costs for new product introductions and/or for conferences and tradeshows; |
| increased costs from hiring more product development engineers or other personnel; |
| additional costs |
| additional costs associated with the expiration of temporary cost cutting measures, such as salary reductions, implemented in 2009; |
| · | increased manufacturing costs resulting from component supply shortages and/or component price fluctuations; |
| increased component costs resulting from vendors increasing prices in response to increased economic activity; |
| · | additional expenses related to intellectual property |
| · | additional costs related to acquisitions, if any. |
| · | burdens of complying with additional and/or more complex VAT and customs regulations; and, |
| · | severe concentration of inventory increasing the risks associated with fire, natural disasters and logistics disruptions to customer order fulfillment. |
| · | difficulty in managing manufacturing operations in a foreign country; |
| · | difficulty in achieving or maintaining product quality; |
| · | interruption to transportation flows for delivery of components to us and finished goods to our customers; |
| · | changes in the country’s political or economic conditions; and, |
| · | changes in the country’s tax laws. |
Our Business is Dependent on Key Suppliers. Our manufacturing processes use large volumes of high-quality components and subassemblies supplied by outside sources. Several of these components are available through sole or limited sources. Sole-source components purchased include custom application-specific integrated circuits (“ASICS”), chassis and other components. We have in the past experienced delays and quality problems in connection with sole-source components, and there can be no assurance that these problems will not recur in the future. Accordingly, our failure to receive sole-source components from suppliers could result in a material adverse effect on our revenues and operating results.
As a result of certain foreign investment incentives available under Hungarian law, the profit from our Hungarian operation was subject to a reduced income tax rate. This special tax status terminated on January 1, 2008, with the merger of our Hungarian manufacturing operations with its Hungarian parent company. The tax position of our Hungarian operation continued to benefit from assets created by the restructuring of our operations in Hungary. Realization of these assets was based on our estimated future earnings in Hungary. Partial release of the valuation allowance on these assets resulted in income tax benefits of $18.3 million for the year ended December 31, 2007, and $8.7 million for the year ended December 31, 2008.
| · | changes in the economy or credit markets in the U.S. or globally; |
| changes in the mix of products sold; |
| the availability and pricing of components from third parties (especially |
| fluctuations in foreign currency exchange rates; |
| the timing, cost or outcome of intellectual property litigation; |
| the difficulty in maintaining margins, including the higher margins traditionally achieved in international sales; and, |
| changes in pricing policies by us, our competitors or suppliers. |
Specifically, if the local currencies in which we sell weaken against the U.S. dollar, and if the local sales prices cannot be raised due
As has occurred in the past and as may be expected to occur in the future, our new software products or new operating systems of third parties on which our products are based often contain bugs or errors that can result in reduced sales and/or cause our support costs to increase, either of which could have a material adverse impact on our operating results. Furthermore, we have significant revenues from customers in industries such as semiconductors, automated test equipment, telecommunications, aerospace, defense and automotive which are cyclical in nature. Downturns in these industries could have a material adverse effect on our operating results.
Seasonal Variations.
Inoutside our control, including:
| · | new product introductions by competitors; |
| · | product pricing; |
| · | the impact of foreign exchange rates on product pricing; |
| · | quality and performance; |
| · | success in developing new products; |
| · | adequate manufacturing capacity and supply of components and materials; |
| · | efficiency of manufacturing operations; |
| · | effectiveness of sales and marketing resources and strategies; |
| · | strategic relationships with other suppliers; |
| · | timing of our new product introductions; |
| · | protection of our products by effective use of intellectual property laws; |
| · | the outcome of any material intellectual property litigation; |
| · | the financial strength of our competitors; |
| · | barriers to entry imposed by competitors with significant market power in new markets; |
| · | general market and economic conditions; and, |
| · | government actions throughout the world. |
There can be no assurance that we will be able to compete successfully in the future.
We believe our ability to compete successfully depends on a number of factors both within and outside our control, including:
There can be no assurance that we will be able to compete successfully in the future.
During 2006, we devoted resources to the initial phase of consolidating our Japanese business application suite with our European business application suite. During 2006, we also devoted resources to the continued development of our web offerings. There can be no assurance that we will not experience difficulties with these new systems. Difficulties with these new systems may interrupt our normal operations, including our ability to provide quotes, process orders, ship products, provide services and support to our customers, bill and track our customers, fulfill contractual obligations and otherwise run our business. Any disruption occurring with these systems may have a material adverse effect on our operating results. During 2007, we plan to continue to devote significant resources to the consolidation of our Japanese and European business application suites scheduled for January, 2007, to the implementation of systems that support direct shipment worldwide from our manufacturing facility and warehouse in Hungary scheduled for the third quarter of 2007 and to the continued development of our web offerings. Any failure to successfully implement these initiatives could have a material adverse effect on our operating results.
We are Subject to Various Risks Associated with International Operations and Foreign Economies.Our international sales are subject to inherent risks, including:
| fluctuations in local economies; |
| fluctuations in foreign currencies relative to the U.S. dollar; |
| difficulties in staffing and managing foreign operations; |
| greater difficulty in accounts receivable collection; |
| costs and risks of localizing products for foreign countries; |
| unexpected changes in regulatory requirements; |
| tariffs and other trade barriers; |
| difficulties in the repatriation of earnings; and, |
| the burdens of complying with a wide variety of foreign laws. |
A Substantial Majority of Our Manufacturing Capacity is Located in Hungary.Our Hungarian manufacturing facility sources a substantial majority of our sales.2008. Currently, we are continuing to develop and implement information systems to support the operation of this facility. During the third quarter of 2006, we moved one of our two manufacturing linesexperiencing significant volatility in our Austin, Texas manufacturing facility to our manufacturing facilityforeign currency exchange rates in Debrecen, Hungary. In the third quarter of 2007, we intend to implement systems and processes that support the direct shipment of product orders to our customers worldwide from our manufacturing facility in Hungary. In order to better insure timely shipment of products to our customers we will maintain the vast majority of our inventory at our Hungary manufacturing facility. In addition to being subject to the risks of maintaining such a concentrated global inventory, this facility and its operation are also subject to risks associated with doing business internationally, including:
No assurance can be given that our efforts will be successful. Accordingly, a failure to deal with these factors could result in interruption in the facility’s operation or delays in expanding its capacity, either of which could have a material adverse effect on our operating results.
Our Income Tax Rate is Affected by Tax Benefits in Hungary.As a result of certain foreign investment incentives available under Hungarian law, the profit from our Hungarian operation is currently subject to a reduced income tax rate. These benefits may not be available in the future due to changes in Hungary’s political condition and/or tax laws. The reduction or elimination of these foreign investment incentives would result in the reduction or elimination of certain tax benefits thereby increasing our future effective income tax rate, which could have a material adverse effect on our operating results.
We received a substantial income tax benefit from the extraterritorial income exemption (“ETI”) under U.S. law. The ETI rules provided that a percentagemany of the profits from products and intangibles exported from the U.S. were exempt from U.S. tax.markets in which we do business. This benefit will not be available in the future as the ETI was repealed by the American Jobs Creation Act of 2004. ETI ceased to be available as of December 31, 2006. The repeal of the ETI will increase our future effective income tax rate, which could have a material adverse effect on our operating results. However, we believe that the effect of the repeal of the ETI will be offset by the effects of the expected increased benefit from the deduction for income from qualified domestic production activities and increased profits in certain foreign jurisdictions with reduced income tax rates.
Our Product Revenues are Dependent on Certain Industries.Sales of our products are dependent on customers in certain industries, particularly the telecommunications, semiconductor, automotive, automated test equipment, defense and aerospace industries. As experienced in the past, and as may be expected to occur in the future, downturns characterized by diminished product demand in any one or more of these industries could result in decreased sales, which could have a material adverse effect on our operating results.
Our Reported Financial Results may be Adversely Affected by Changes in Accounting Principles Generally Accepted in the United States.We prepare our financial statements in conformity with accounting principles generally accepted in the U.S. These accounting principles are subject to interpretation by the Financial Accounting Standards Board, the American Institute of Certified Public Accountants, the Securities and Exchange Commission and various bodies formed to interpret and create appropriate accounting policies. A change in these policies or interpretations could have a significant effect on our reported financial results, and could affect the reporting of transactions completed before the announcement of a change. For example, beginning in the first quarter of fiscal 2006, with the adoption of SFAS 123(R), we now record a charge to earnings for employee stock option grants for all stock options unvested at December 31, 2005. This accounting pronouncement has had a material negativesignificant impact on the revaluation of our financial results. Technology companies generally,foreign currency denominated firm commitments and on our company specifically,ability to forecast our U.S. dollar equivalent revenues and expenses. In the past, these dynamics have also adversely affected our revenue growth in international markets and will likely pose similar challenges in the past relied on stock options as a major component of our employee compensation packages. Because we are required to expense options, we have changed our equity compensation program to no longer grant options but instead grant restricted stock units. Furthermore, because we are required to expense options, we may be less likely to sustain profitability in the future.
Provisions in Our Charter Documents and Delaware Law and Our Stockholder Rights Plan May Delay or Prevent an Acquisition of Us. Our certificate of incorporation and bylaws and Delaware law contain provisions that could make it more difficult for a third party to acquire us without the consent of our Board of Directors. These provisions include a classified Board of Directors, prohibition of stockholder action by written consent, prohibition of stockholders to call special meetings and the requirement that the holders of at least 80% of our shares approve any business combination not otherwise approved by two-thirds of the Board of Directors. Delaware law also imposes some restrictions on mergers and other business combinations between us and any holder of 15% or more of our outstanding common stock. In addition, our Board of Directors has the right to issue preferred stock without stockholder approval, which could be used to dilute the stock ownership of a potential hostile acquirer. Our Board of Directors adopted a new stockholders rights plan on January 21, 2004, pursuant to which we declared a dividend of one right for each share of our common stock outstanding as of May 10, 2004. This rights plan replaced a similar rights plan that had been in effect since our initial public offering in 1995. Unless redeemed by us prior to the time the rights are exercised, upon the occurrence of certain events, the rights will entitle the holders to receive upon exercise thereof shares of our preferred stock, or shares of an acquiring entity, having a value equal to twice the then-current exercise price of the right. The issuance of the rights could have the effect of delaying or preventing a change of control of us.
We areAre Subject to the Risk of Product Liability Claims.Claims. Our products are designed to provide information upon which users may rely. Our products are also used in “real time” applications requiring extremely rapid and continuous processing and constant feedback. Such applications give rise to the risk that a failure or interruption of the system or application could result in economic damage or bodily harm. We attempt to assure the quality and accuracy of the processes contained in our products, and to limit our product liability exposure through contractual limitations on liability, limited warranties, express disclaimers and warnings as well as disclaimers contained in our “shrink wrap” license agreements with end-users. If our products contain errors that produce incorrect results on which users rely or cause failure or interruption of systems or processes, customer acceptance of our products could be adversely affected. Further, we could be subject to liability claims that could have a material adverse effect on our operating results or financial position. Although we maintain liability insurance for product liability matters, there can be no assurance that such insurance or the contractual limitations used by us to limit our liability will be sufficient to cover or limit any claims which may occur.
ITEM 1B. UNRESOLVED STAFF COMMENTS
None.
ITEM 2. PROPERTIES
Our principal corporate and research and development activities are conducted at three buildings we own in Austin, Texas. We own approximately 69 acres of land in north Austin, Texas, on which are a 232,000 square foot office facility, a 140,000 square foot manufacturing and office facility, and a 380,000 square foot research and development facility. We also own a 136,000 square foot office building in Austin, Texas which is being leased to third-parties. We also own a 148,000Our principal manufacturing and distribution activities are conducted at our 239,000 square foot manufacturing and distribution facility in Debrecen, Hungary.Hungary which we own. Our German subsidiary, National Instruments Engineering GmbH & Co. KG, owns a 25,500 square foot office building in Aachen, Germany in which a majority of its activities are conducted. National Instruments Engineering owns another 19,375 square foot office building in Aachen, Germany, which is partially leased to third-parties. We own approximately 17 acres of land in an industrial park in Penang, Malaysia.
As of December 31, 2006,2009, we also leased a number of sales and support offices in the United StatesU. S. and overseas.various countries throughout the world. Our facilities are currently being utilized below maximum capacity to allow for future headcount growth and design/construction cycles.cycles, as needed. We believe our existing facilities are adequate to meet our current requirements.
ITEM 3. LEGAL PROCEEDINGS
We filed a patent infringement action on January 25, 2001, in the U.S. District Court, Eastern District of Texas (Marshall Division) claiming that The MathWorks, Inc. (“MathWorks”) infringed certain of our U.S. patents. On January 30, 2003, a jury found infringement by MathWorks of three of the patents involved and awarded us specified damages. On JuneSeptember 23, 2003, the District Court entered final judgment in favor of us and entered an injunction against MathWorks’ sale of its Simulink and related products and stayed the injunction pending appeal. Upon appeal, the judgment and the injunction were affirmed by the U.S. Court of Appeals for the Federal Circuit (September 3, 2004). Subsequently the stay of injunction was lifted by the District Court. In November 2004, the final judgment amount of $7.4 million which had been held in escrow pending appeal was released to us.
An action was filed by MathWorks against us on September 22, 2004, in the U.S. District Court, Eastern District of Texas (Marshall Division), claiming that on that day MathWorks had released modified versions of its Simulink and related products, and seeking a declaratory judgment that the modified products do not infringe the three patents adjudged infringed in the District Court’sCourt's decision of JuneSeptember 23, 2003 (and affirmed by the Court of Appeals on September 3, 2004). On November 2, 2004, MathWorks served the complaint on us. We filed an answer to MathWorks’ declaratory judgment complaint, denying MathWorks’ claims of non-infringement and alleging our own affirmative defenses. On January 5, 2005, the Court denied a contempt motion by us to enjoin the modified Simulink products under the injunction in effect from the first case. On January 7, 2005, we amended our answer to include counterclaims that MathWorks’ modified products are infringing three of our patents, and requested unspecified damages and an injunction. MathWorks filed its reply to our counterclaims on February 7, 2005, denying the counterclaims and alleging affirmative defenses. On March 2, 2005, we filed a notice of appeal regarding the Court’sCourt's denial of the contempt motion. On March 15, 2005, the Court stayed MathWorks’ declaratory judgment action, pending a decision on the appeal by the Court of Appeals for the Federal Circuit. On February 9, 2006, the Court of Appeals for the Federal Circuit affirmed the District Court’s January 2005 order. On November 22, 2006, the District Court lifted the stay. The case schedule has yet to be set in this action. During the fourth quarter of 2004, we accrued $4 million related to our probable loss from this contingency, which consists entirely of anticipated patent defense costs that are probable of being incurred. In the fourth quarter of 2006, we accrued an additional $600,000 related to this contingency. We charged approximately $57,000 against this accrual duringDuring the fourththird quarter of 2006. We2009, we reduced the accrual by $2 million to reflect a decrease in the estimated costs that are probable of being incurred in this action. To date, we have charged a cumulative total of $602,000$623,000 against this accrual throughaccrual. At December 31, 2006.2009, the remaining accrual was $2 million.
ITEM 4. SUBMISSION OF MATTERS TO A VOTE OF SECURITY HOLDERS
No matter was submitted to a vote of our security holders during the fourth quarter of the fiscal year covered by this report.
PART II
ITEM 5. MARKET FOR THE REGISTRANT’S COMMON EQUITY, RELATED STOCKHOLDER MATTERS AND ISSUER PURCHASES OF EQUITY SECURITIES
Our common stock, $0.01 par value, began trading on The NASDAQ Stock Market (formerly known as the Nasdaq National Market) under the symbol NATI effective March 13, 1995. Prior to that date, there was no public market for our common stock. The high and low closing prices for our common stock, as reported by Nasdaq for the two most recent fiscal years, are as indicated in the following table.High Low 2006 First Quarter 2006 $ 36.28 $ 31.32 Second Quarter 2006 33.67 26.18 Third Quarter 2006 27.89 24.55 Fourth Quarter 2006 31.60 26.63 2005 First Quarter 2005 $ 29.14 $ 24.68 Second Quarter 2005 24.37 20.92 Third Quarter 2005 29.25 21.35 Fourth Quarter 2005 32.74 23.15
High Low 2009 First Quarter 2009 $ 23.40 $ 15.82 Second Quarter 2009 23.61 18.41 Third Quarter 2009 28.42 21.26 Fourth Quarter 2009 29.85 26.52 2008 First Quarter 2008 $ 31.95 $ 24.19 Second Quarter 2008 31.85 25.59 Third Quarter 2008 34.63 25.88 Fourth Quarter 2008 27.99 20.20
At the close of business on February 16, 2007,15, 2010, there were approximately 600473 holders of record of our common stock and approximately 16,00026,500 shareholders of beneficial interest.
We believe factors such as quarterly fluctuations in our results of operations, announcements by us or our competitors, technological innovations, new product introductions, governmental regulations, litigation, changes in earnings estimates by analysts or changes in our financial guidance may cause the market price of our Common Stockcommon stock to fluctuate, perhaps substantially. In addition, stock prices for many technology companies fluctuate widely for reasons that may be unrelated to their operating results. These broad market and industry fluctuations may adversely affect the market price of our Common Stock. We paidcommon stock.
Our cash dividends of $0.06dividend payments for the two most recent fiscal years are indicated in the following table on a per share basis. The dividends were paid on each of February 27, 2006, May 30, 2006, August 28, 2006 and November 27, 2006, and paid cash dividends of $0.05 per share on each of February 25, 2005, May 31, 2005, August 25, 2005 and November 28, 2005. the dates set forth below;
2009 March 2, 2009 $ 0.12 June 1, 2009 0.12 August 31, 2009 0.12 November 30, 2009 0.12 2008 March 3, 2008 $ 0.11 June 2, 2008 0.11 September 2, 2008 0.11 December 1, 2008 0.11
Our policy as to future dividends will be based on, among other considerations, our views on potential future capital requirements related to research and development, expansion into new market areas, investments and acquisitions, share dilution management, legal risks, and challenges to our business model.
See Item 12 for information regarding securities authorized for issuance under our equity compensation plans.
Performance Graph
The following graph compares the cumulative total return to stockholders of NI’s common stock from December 31, 2004 to December 31, 2009 to the cumulative return over such period of (i) Nasdaq Composite Index and (ii) Russell 2000 Index. We use the Russell 2000 Index due to the fact that we have not been able to identify a published industry or line of business index that we believe appropriately reflects our industry or line of business. We considered that our primary competitors are divisions of large corporations that have other significant business operations such that any index comprised of such competitors would not be reflective of our industry or line of business. We have also considered using a peer group index but do not believe such index is appropriate as we have not been able to identify other public companies that we believe are principally in the same line of business as we are.
The graph assumes that $100 was invested on December 31, 2004 in NI’s common stock and in each of the other two indices and the reinvestment of all dividends, if any. Stockholders are cautioned against drawing any conclusions from the data contained therein, as past results are not necessarily indicative of future performance.
The information contained in the Performance Graph shall not be deemed to be “soliciting material” or to be “filed” with the SEC, nor shall such information be incorporated by reference into any future filing under the Securities Act of 1933, as amended (the “Securities Act”), or the Exchange Act, except to the extent that NI specifically incorporates it by reference into any such filing. The graph is presented in accordance with SEC requirements.
ISSUER PURCHASES OF EQUITY SECURITIESPeriod
Total number of shares
Average
price paid
per share
Total number of
shares purchased as
part of a publicly
announced plan or
program
Maximum number of
shares that may yet
be purchased under
the plan or program
October 1, 2006 to October 31, 2006———3,000,000November 1, 2006 to November 30, 2006———3,000,000December 1, 2006 to December 31, 2006———3,000,000
Total———
Period Total number of shares Average price paid per share Total number of shares purchased as part of a publicly announced plan or program Maximum number of shares that may yet be purchased under the plan or program (1) October 1, 2009 to October 31, 2009 — — — 2,262,168 November 1, 2009 to November 30, 2009 573,841 $ 28.55 573,841 1,688,327 December 1, 2009 to December 31, 2009 — — — 1,688,327 Total 573,841 $ 28.55 573,841
(1) For the past several years, we have maintained various stock repurchase programs. In January 2007, our board of directors approved a new shareThis repurchase plan that increases the aggregate number of shares of common stock that we are authorized to repurchase from 1.5 million to 3.0 million. There is nodoes not have an expiration date for this share repurchase program.date.ITEM 6. SELECTED CONSOLIDATED FINANCIAL DATA
The following selected consolidated financial data should be read in conjunction with theour consolidated financial statements, including the Notes to Consolidated Financial Statements contained in thethis Form 10-K. The information set forth below is not necessarily indicative of the results of our future operations. The information should be read in conjunction with “Management’s Discussion and Analysis of Financial Condition and Results of Operations.”Years Ended December 31,
2006
2005
2004
2003
2002
(in thousands, except per share data)
Statements of Income Data: Net sales: Americas $ 317,780 $ 275,524 $ 243,651 $ 200,210 $ 195,770 Europe 193,364 171,499 164,895 137,761 122,800 Asia Pacific 149,263 124,818 105,542 87,921 72,220
Consolidated net sales 660,407 571,841 514,088 425,892 390,790 Cost of sales 170,326 149,309 135,473 111,672 105,086
Gross profit 490,081 422,532 378,615 314,220 285,704
Operating expenses: Sales and marketing 235,072 211,280 188,727 160,478 145,671 Research and development 113,095 87,841 84,692 70,896 63,964 General and administrative 54,192 45,199 42,500 42,497 35,714
Total operating expenses 402,359 344,320 315,919 273,871 245,349
Operating income 87,722 78,212 62,696 40,349 40,355 Other income (expense): Interest income 6,847 3,758 2,905 2,511 3,295 Net foreign exchange gain (loss) 740 (1,566 ) 1,287 1,125 (724 ) Other income (expense), net (7 ) 276 (2,075 ) 506 692
Income before income taxes 95,302 80,680 64,813 44,491 43,618 Provision for income taxes 22,594 19,163 16,203 11,123 12,213
Net income $ 72,708 $ 61,517 $ 48,610 $ 33,368 $ 31,405
Basic earnings per share $ 0.91 $ 0.78 $ 0.62 $ 0.43 $ 0.41
Weighted average shares outstanding - basic 79,519 78,552 78,680 77,438 76,829
Diluted earnings per share $ 0.89 $ 0.76 $ 0.59 $ 0.41 $ 0.39
Weighted average shares outstanding - diluted 81,519 80,910 82,096 80,946 80,117
Cash dividends paid per common share $ 0.24 $ 0.20 $ 0.18 $ 0.07 $ —
December 31,
2006
2005
2004
2003
2002
(in thousands)
Balance Sheet Data: Cash and cash equivalents $ 100,287 $ 55,864 $ 76,216 $ 53,446 $ 12,840 Short-term investments 150,190 119,846 150,392 141,227 141,038 Working capital 374,512 274,686 309,635 255,330 211,453 Total assets 721,220 608,336 582,093 525,151 458,714 Long-term debt, net of current portion — — — — — Total stockholders' equity 596,682 503,850 486,449 439,452 386,463
Years Ended December 31, 2009 2008 2007 2006 2005 (in thousands, except per share data) Statements of Income Data: Net sales: Americas $ 292,999 $ 355,878 $ 331,482 $ 317,780 $ 275,524 Europe . 210,188 267,373 230,940 193,364 171,499 Asia Pacific 173,407 197,286 177,956 149,263 124,818 Consolidated net sales 676,594 820,537 740,378 660,407 571,841 Cost of sales 169,884 207,109 185,267 173,348 151,939 Gross profit 506,710 613,428 555,111 487,059 419,902 Operating expenses: Sales and marketing 269,267 307,409 264,060 232,050 208,650 Research and development 132,974 143,140 126,515 113,095 87,841 General and administrative 57,938 67,162 62,445 54,192 45,199 Total operating expenses 460,179 517,711 453,020 399,337 341,690 Operating income 46,531 95,717 102,091 87,722 78,212 Other income (expense): Interest income 1,629 5,996 9,822 6,847 3,758 Net foreign exchange gain (loss) 734 (3,737 ) 1,672 740 (1,566 ) Other income (expense), net 1,351 161 (158 ) (7 ) 276 Income before income taxes 50,245 98,137 113,427 95,302 80,680 Provision for income taxes 33,160 13,310 6,394 22,594 19,163 Net income $ 17,085 $ 84,827 $ 107,033 $ 72,708 $ 61,517 Basic earnings per share $ 0.22 $ 1.08 $ 1.35 $ 0.91 $ 0.78 Weighted average shares outstanding - basic 77,520 78,567 79,468 79,519 78,552 Diluted earnings per share $ 0.22 $ 1.07 $ 1.32 $ 0.89 $ 0.76 Weighted average shares outstanding - diluted 78,026 79,515 81,043 81,519 80,910 Cash dividends declared per common share $ 0.48 $ 0.44 $ 0.34 $ 0.24 $ 0.20
December 31, 2009 2008 2007 2006 2005 (in thousands) Balance Sheet Data: Cash and cash equivalents $ 201,465 $ 229,400 $ 194,839 $ 100,287 $ 55,864 Short-term investments 87,196 6,220 93,838 150,190 119,846 Working capital 413,759 398,292 419,874 379,733 274,686 Total assets 813,029 832,591 818,812 721,220 608,336 Long-term debt, net of current portion — — — — — Total stockholders’ equity 654,420 664,438 661,086 596,682 503,850
ITEM 7. MANAGEMENT'SMANAGEMENT’S DISCUSSION AND ANALYSIS OF FINANCIAL CONDITION AND RESULTS OF OPERATIONS
The following “Management’s Discussion and Analysis of Financial Condition and Results of Operations” contains forward-looking statements within the meaning of Section 27A of the Securities Act of 1933 and Section 21E of the Securities Exchange Act of 1934. Any statements contained herein regarding our future financial performance or operations (including, without limitation, statements to the effect that we “believe,” “expect,” “plan,” “may,” “will,” “project,” “continue,” or “estimate” or other variations thereof or comparable terminology or the negative thereof) should be considered forward-looking statements. Actual results could differ materially from those projected in the forward-looking statements as a result of a number of important factors including those set forth under the heading “Risk Factors”“Risk Factors” beginning on page 8,10, and elsewhere in this Form 10-K. Although we believe that the expectations reflected in the forward-looking statements are reasonable, we cannot guarantee future results, levels of activity, performance or achievements. You should not place undue reliance on these forward-looking statements. We disclaim any obligation to update information contained in any forward-looking statement.
Overview
National Instruments designs, develops, manufactures and markets instrumentationCorporation (“we”, “us” or “our”) is a leading supplier of measurement and automation softwareproducts that engineers and hardware for general commercial, industrial and scientific applications. We offer hundredsscientists use in a wide range of products used to create virtual instrumentation systems for measurement and automation. We have identifiedindustries. These industries comprise a large and diverse market for design, control and test applications. We provide flexible application software and modular, multifunctional hardware that users combine with industry-standard computers, networks and third party devices to create measurement, automation and embedded systems, which we also refer to as “virtual instruments”. Our products are used in a variety of applications from researchapproach gives customers the ability to quickly and development to production testing, monitoringcost-effectively design, prototype and industrial control.deploy unique custom-defined solutions for their design, control and test application needs. We sell to a large number of customers in a wide variety of industries. No single customer accounted for more than 3% of our sales in 2006, 20052009, 2008 or 2004.2007.
The key strategies that management focuses on in running our business are the following:
Expanding our broad customer base:base
We strive to increase our already broad customer base by serving a large market on many computer platforms, through a global marketing and distribution network. We also seek to acquire new technologies and expertise from time to time in order to open up new opportunities for our existing product portfolio. While we continue our efforts to expand our customer base, we are also benefiting from our efforts in increasing order size from both new and existing customers.
Maintaining a high level of customer satisfaction:satisfaction
To maintain a high level of customer satisfaction we strive to offer innovative, modular and integrated products through a global sales and support network. We strive to maintain a high degree of backwards compatibility across different platforms in order to preserve the customer’s investment in our products. In this time of intense global competition, we believe it is crucial that we continue to offer products with quality and reliability, and that these products provide cost-effective solutions for our customers.
Leveraging external and internal technology:technology
Our product strategy is to provide superior products by leveraging generally available technology, supporting open architectures on multiple platforms and by leveraging our core technologies such as custom ASICs (application-specificapplication specific integrated circuits)circuits (“ASICs”) across multiple products.
We sell into the test and measurement (“T&M”) and the industrial automation (“IA”)industrial/embedded applications in a broad range of industries and as such are subject to the economic and industry forces which drive those markets. It has been our experience that the performance of these industries and our performance is impacted by general trends in industrial production for the global economy and by the specific performance of certain vertical markets that are intensive consumers of measurement technologies. Examples of these markets are semiconductor capital equipment, telecom, defense, aerospace, automotive and others. In assessing our business, our management considerswe consider the trends in the Global Purchasing Managers Index (published(“PMI”) published by JP Morgan),Morgan, global industrial production as well as industry reports on the specific vertical industries mentioned earlier.that we target. Starting in August 2009, the PMI has had readings above 50 which are indicative of expansion in the industrial global economy. However, we believe there is still a substantial amount of uncertainty about the global industrial economic conditions. We are unable to predict whether the current expansion cycle, as measured by the PMI, will be sustained throughout 2010. This continuing uncertainty in the global industrial economy is likely to continue to have an adverse effect on the spending patterns of businesses including our current and potential customers which could adversely affect our revenues and therefore harm our business and result of operations.
We distribute our software and hardware products primarily through a direct sales organization. We also use independent distributors, OEMs, VARs, system integrators and consultants to market and sell our products. We have sales offices in the United StatesU.S. and sales offices and distributors in key international markets. Sales outside of the Americas accounted for approximately 52%57%, 52%57% and 53% of55% or our revenues in 2006, 2005,2009, 2008 and 2004,2007, respectively. The vast majority of our foreign sales are denominated in the customers’ local currency, which exposes us to the effects of changes in foreign-currencyforeign currency exchange rates. We expect that a significant portion of our total revenues will continue to be derived from international sales. See (See Note 12 – Segment information of Notes to Consolidated Financial Statements for details concerning the geographic breakdown of our net sales, operating income, interest income and identifiable assets.long-lived assets).
We manufacture a substantial majority of our products at our facilityfacilities in Debrecen, Hungary. Additional production primarily of low volume or newly introduced products is done in Austin, Texas. Our product manufacturing operations can be divided into four areas: electronic circuit card and module assembly; chassis and cable assembly; technical manuals and product support documentation; and software duplication. We manufacture most of the electronic circuit card assemblies, modules and chassismodules in-house, although subcontractors are used from time to time. Beginning in 2005, some chassis have been produced byWe currently use subcontractors in Asia.Asia to manufacture a significant portion of our chassis but we review these arrangements periodically. We manufacture some of our electronic cable assemblies in-house, but many assemblies are produced by subcontractors. We primarily subcontract our software duplication, our technical manuals and product support documentation.
We believe that our long-term growth and success depends on delivering high quality software and hardware products on a timely basis. Accordingly, we focus significant efforts on research and development. We focus our research and development efforts on enhancing existing products and developing new products that incorporate appropriate features and functionality to be competitive with respect to technology, price and price/performance. Our success also is dependantdependent on our ability to obtain and maintain patents and other proprietary rights related to technologies used in our products. We have engaged in litigation and where necessary, will likely engage in future litigation to protect our intellectual property rights. In monitoring and policing our intellectual property rights, we have been and may be required to spend significant resources.
We have been profitable in every year since 1990. However, there can be no assurance that our net sales will grow or that we will remain profitable in future periods. Our operating results fluctuate from period to period due to changes in global economic conditions and a number of other factors. As a result, we believe historical results of operations should not be relied upon as indications of future performance.
Results of Operations
The following table sets forth, for the periods indicated, the percentage of net sales represented by certain items reflected in our consolidated statementsConsolidated Statements of income:Years Ended December 31,
2006
2005
2004
Net sales: Americas 48.1 % 48.2 % 47.4 % Europe 29.3 30.0 32.1 Asia Pacific 22.6 21.8 20.5
Consolidated net sales 100.0 100.0 100.0 Cost of sales 25.8 26.1 26.4
Gross profit 74.2 73.9 73.6 Operating expenses: Sales and marketing 35.6 36.9 36.7 Research and development 17.1 15.4 16.4 General and administrative 8.2 7.9 8.3
Total operating expenses 60.9 60.2 61.4
Operating income 13.3 13.7 12.2 Other income (expense): Interest income 1.0 0.7 0.5 Net foreign exchange gain (loss) 0.1 (0.3 ) 0.3 Other income (expense), net — — (0.4 )
Income before income taxes 14.4 14.1 12.6 Provision for income taxes 3.4 3.3 3.1
Net income 11.0 % 10.8 % 9.5 %
Income:
Years Ended December 31, 2009 2008 2007 Net sales: Americas 43.3 % 43.4 % 44.8 % Europe 31.1 32.6 31.2 Asia Pacific 25.6 �� 24.0 24.0 Consolidated net sales 100.0 100.0 100.0 Cost of sales 25.1 25.2 25.0 Gross profit 74.9 74.8 75.0 Operating expenses: Sales and marketing 39.8 37.5 35.7 Research and development 19.6 17.4 17.1 General and administrative 8.6 8.2 8.4 Total operating expenses 68.0 63.1 61.2 Operating income 6.9 11.7 13.8 Other income (expense): Interest income 0.2 0.7 1.3 Net foreign exchange gain (loss) 0.1 (0.5 ) 0.2 Other income (expense), net 0.2 — — Income before income taxes 7.4 11.9 15.3 Provision for income taxes 4.9 1.6 0.8 Net income 2.5 % 10.3 % 14.5 %
Net Sales.In 2006, consolidatedSales. Consolidated net sales were $660.4$677 million, $821 million and $740 million for the years ended December 31, 2009, 2008 and 2007, respectively, a 15%decrease of 18% in 2009 compared to 2008 following an increase of 11% in 2008 compared to 2007. The decrease in 2009 can be attributed to declines in sales volume across all regions of our business. Instrument control products which comprised approximately 7% of our revenues for the year ended December 31, 2009, saw a year-over-year decline of 31%. Products in the areas of virtual instrumentation and graphical system design which comprised approximately 93% of our revenues for the year ended December 31, 2009, saw a year-over-year decline of 16%. Revenues from our instrument control products are the level achievedmost sensitive to the cycles of the global industrial economy. For the year ended December 31, 2009, our order backlog increased by approximately $8 million. Backlog is a measure of orders that were received but that had not shipped to customers at the end of the quarter. We did not take any significant action with regard to pricing during the year ended December 31, 2009, and thus, the decrease in 2005, which followed anrevenues is attributable to a decrease in customer orders. The increase in net sales of 11% in 2005 from the level achieved in 2004. The increase in sales in 20062008, compared to 2005 was primarily attributable2007 can be attributed to volume growth in the introductionareas of newmodular instruments, particularly RF test products, PXI, software and upgraded products, an increased market acceptance of our productsCompactRIO which performed very well in all regions and the current year impact of prior year acquisitions. The increase in sales in 2005 compared to 2004 was primarily attributable to the introduction of new and upgraded products, the increase in unit volume from the increased market acceptance of our products in all regions and the strengthlight of the Euro.industry contraction. The increases in these areas were offset by declines in revenue from instrument control products which are the most sensitive to downturns in the Global PMI.
Sales in the Americas increased $42.3were $293 million, or 15%, to $317.8$356 million and $331 million for the years ended December 31, 2009, 2008 and 2007, respectively, a decrease of 18% in 20062009 compared to 2005, which followed a 13%2008 following an increase in 2005 over 2004 levels. The increasesof 8% in sales in the Americas in 2006 and 2005 were attributable2008 compared to an increased market acceptance of our products and from revenue of $34.4 million and $21.9 million, respectively, from acquired companies. (See Note 15 of Notes to Consolidated Financial Statements for a description of acquisitions).2007. Sales outside of the Americas, as a percentage of consolidated sales were 57%, 57% and 55% for 2006, remained flat at 52% with 2005. European revenue was $193.4the years ended December 31, 2009, 2008 and 2007, respectively. Sales in Europe were $210 million, $267 million and $231 million for the years ended December 31, 2009, 2008 and 2007, respectively, a decrease of 21% in 2006,2009 compared to 2008 following an increase of 13% from 2005,16% in 2008 compared to 2007. Sales in Asia were $173 million, $197 million and $178 million for the years ended December 31, 2009, 2008 and 2007, respectively, a decrease of 12% in 2009 compared to 2008 following a 4%an increase of 11% in 2005 from 2004. Asia Pacific revenue grew 20%2008 compared to $149.3 million in 2006, which followed an 18% increase in 2005 over 2004 levels.2007. We expect sales outside of North Americathe Americas to continue to represent a significant portion of our revenue. We intend to continue to expand our international operations by increasing our presence in existing markets, adding a presence in some new geographical markets and continuing the use of distributors to sell our products in some countries.
Almost all sales made by our direct sales offices in the Americas, outside of the U.S., in Europe and in Asia Pacific are denominated in local currencies, and accordingly, the U.S. dollar equivalent of these sales is affected by changes in the foreign currency exchange rates. Between 2006 and 2005,For 2009, net of hedging results, the change in the exchange rates had the effect of decreasing our consolidated sales by 0.5%$29 million or 4%, decreasing America’s sales by $6 million or 2%, decreasing European sales by 3%$17 million or 6%, and had no material effect ondecreasing sales in Asia Pacific. The increase in sales in Europe and Asia was the resultPacific by $6 million or 3% compared to 2008. For 2008, net of the change in exchange rates and the increase in local currency product pricing in each region. Since most of our international operating expenses are also incurred in local currencies,hedging results, the change in exchange rates had the effect of decreasing operating expenses $1.5increasing our consolidated sales by $34 million or 0.4%4%, in 2006,increasing America’s sales by $1.7 million or 0.5%, increasing European sales by $28 million or 12%, and increasing operating expenses $4.2sales in Asia Pacific by $4.3 million or 1.2% in 2005, and $4.4 million, or 1.4%, in 2004.2% compared to 2007.
Gross Profit.Profit.As a percentage of sales, gross profitmargin was 74%75% in each of 2006, 2005,2009, 75% in 2008 and 2004. Our75% in 2007. In 2009, we were successful in implementing cost reduction strategies throughout our manufacturing cycle which allowed us to maintain a stable gross margin percentage despite the 18% decrease in 2006 remained flat with 2005 primarily becausesales volume in 2009. For the favorableyears ended December 31, 2009, 2008 and 2007, charges related to acquisition related intangibles and stock based compensation were $4.7 million, $4.7 million and $3.6 million, respectively. For the years ended December 31, 2009 and 2008, the net impact of higher sales volume and improved product margins resulting from both price increases and cost reductions on certain products were offset entirely by the negative impact of unfavorablechange in foreign currency exchange rates had the expensingeffect of stock-based compensation, the increase in the amortizationdecreasing our cost of acquisition intangiblesgoods sold by $3 million or 1%, and the write-off in the first quarterincreasing our cost of 2006 of some capitalized facility costs due to the continued transition of production to our manufacturing facility in Hungary. Our gross margin in 2005 remained flat with 2004 primarily because the favorable impacts of foreign currency exchange rates and higher sales volume were offsetgoods sold by the reduced margins realized on product lines from acquired companies as well as the impact of the amortization of acquisition related intangibles and a reduction of selling prices of some of our products. There can be no assurance that we will maintain our historical margins. We believe our current manufacturing capacity is adequate to meet current needs.$1.1 million or 4%, respectively.
Sales and Marketing.Marketing.Sales and marketing expenseexpenses were $269 million, $307 million and $264 million for the years ended December 31, 2009, 2008 and 2007, respectively, a decrease of 12% in 2006 increased2009 compared to $235.1 million, an 11% increase from 2005,2008 following an increase of 12%16% in 2005 over 2004. Sales2008 compared to 2007. As a percentage of net sales, sales and marketing expenseexpenses were 40%, 38% and 36% for 2009, 2008 and 2007, respectively. For 2009, the increase in sales and marketing expenses as a percentage of revenue was 36%due to the 18% decrease in 2006, down from 37%revenue. For 2009, the decrease in 2005sales and 2004. Approximately 84%marketing expenses in absolute dollars was due to a decrease in travel, tradeshows and advertising of $15 million, a decrease in variable compensation of $4.2 million and a decrease caused by the net impact of changes in foreign currency exchange rates of $9 million. Temporary cost cutting measures which included a company-wide wage reduction as well as a reduction in the number of accrued vacation hours that employees are allowed to carry beyond December 31, 2009, resulted in additional cost savings of $7 million compared to 2008. For 2008, the increase in sales and marketing expense, both in 2006 comparedabsolute dollars and as a percentage of sales, was consistent with our plan to 2005 is attributablemake additional investments in our field sales force during 2008. Approximately 65% of the increase in 2008 over 2007, can be attributed to the increase in sales and marketing personnel, costs due to the increaseincreases in salesstock-based compensation and marketing personnel, the increase in variable compensation from higher sales volume and fromvolume. In addition, during 2008, the net impact of foreign currency exchange rates had the expensingeffect of stock-based compensation. Approximately 60% of the increase inincreasing our sales and marketing expensesexpense by $10 million or 3%. We plan to continue to make additional investments in 2005 compared to 2004 is attributable to the increaseour field sales force in sales and marketing personnel costs,2010. However, due to the increasecontinuing uncertainty in the industrial economy, the extent of our field sales and marketing personnel, the increaseexpansion during 2010 will be dependent on our overall sales volumes in variable compensation from higher sales volume and from the effects of the change in currency exchange rates, with the remaining fraction of the increase attributable to increases in advertising, tradeshows and special events.2010. We expect sales and marketing expenses in future periods to increase in absolute dollars, andcontinue to fluctuate as a percentage of sales based on recruiting, marketing and advertising campaign costs associated with major new product releases and entry into new market areas, investment in web sales and marketing efforts, increasing product demonstration costs and the timing of domestic and international conferences and trade shows.
Research and Development.Development.Research and development expenses were $133 million, $143 million and $127 million for the years ended December 31, 2009, 2008 and 2007, respectively, a decrease of 7% in 2006 increased 29%2009 compared to 20052008 following an increase of 4%13% in 2005 over 2004. Research2008 compared to 2007. As a percentage of net sales, research and development expenseexpenses were 20%, 17% and 17% for 2009, 2008 and 2007, respectively. For 2009, the increase in research and development expenses as a percentage of revenue was 17.1%due to the 18% decrease in 2006, up from 15.4%revenue. For 2009, the decrease in 2005research and 16.4%development expenses in 2004. Theabsolute dollars was due to a decrease in variable compensation of $2.9 million and a decrease caused by the net impact of changes in foreign currency exchange rates of $327,000. Temporary cost cutting measures which included a company-wide wage reduction as well as a reduction in the number of accrued vacation hours that employees were allowed to carry beyond December 31, 2009, resulted in additional cost savings of $7 million. These decreases were offset by personnel costs related to a net headcount increase of 42 people during 2009. For 2008, the increase in research and development costs in 2006expenses in absolute dollars and as a percentage of revenue was primarily due to increases in personnel costs from the hiring of additional product development engineers and from the impact of the expensing ofas well as increases related to stock-based compensation and fromwas consistent with our plan to continue to grow our research and development capacity in line with the decreaseoverall revenue growth of the company. During 2008, we had a net headcount increase of 109 people in our worldwide research and development group. In addition, during 2008, the capitalizationnet impact of software development costs. The decrease inforeign currency exchange rates had the effect of increasing our research and development expense as a percentage of revenue in 2005 compared to 2004 was primarily due to the increase in the capitalization of software development costs. The increase in research and development expense in absolute dollars in 2005 was primarily due to increases in personnel costs from the hiring of additional product development engineers, which was partially offset by the decrease in expense from the increase in the capitalization of software development costs. Research and development personnel increased from 1,036 at December 31, 2005 to 1,122 at December 31, 2006.$2.7 million or 2%. We plan to continue making a significant investmentto make additional investments in research and development in order2010. However, due to remain competitivethe continuing uncertainty in the industrial economy, the extent of our research and support revenue growth.development expansion during 2010 will be dependent on our overall sales volumes in 2010.
We capitalize software development costs in accordance with Statement ofthe Financial Accounting Standards (“SFAS”) 86, “Accounting for the Costs of Computer Board (FASB) Accounting Standards Codification (ASC) 985, Software to be Sold, Leased, or Otherwise Marketed.” (FASB ASC 985). We amortize such costs over the related product’s estimated economic useful life, generally three years, beginning when a product becomes available for general release. Software amortization expense included in cost of goods sold totaled $9.1$9 million, $7.2$10 million and $6.6$9 million during 2006, 20052009, 2008 and 2004,2007, respectively. Internally developed software costs capitalized during such years2009, 2008 and 2007 were $7.4$13 million, $13.4$10 million and $5.0$8 million, respectively. Capitalization of internally developed software costs varies depending on the timing of when each project reaches technological feasibility and the length and scope of the development cycle of each individual project. (See Note 57 - Intangibles of Notes to Consolidated Financial Statements for a description of intangibles.)intangibles).
General and Administrative.Administrative.General and administrative expenses were $58 million, $67 million and $62 million for the years ended December 31, 2009, 2008 and 2007, respectively, a decrease of 13% in 2006 increased 20%2009 compared to 2005,2008 following an increase of 6%8% in 2005 over 2004. The 20% increase in2008 compared to 2007. As a percentage of net sales, general and administrative expenses were 9%, 8% and 8% in 2006 from 2005 was primarily attributable to increases in personnel costs from both2009, 2008 and 2007. For 2009, the increase in international general and administrative personnel and the impact of the expensing of stock-based compensation, and the effect of decreased litigation costs in the prior year, primarily from the reversal of previously accrued estimated patent defense costs associated with the SoftWIRE legal matter which resulted in a gain of $1.9 million in 2005. The 6% increase in general and administrative expenses in 2005 from the prior year period was primarily due to the litigation settlement in 2004 which resulted in the $6.0 million net gain in 2004 from the judgment award against The MathWorks, Inc. (See Note 14 of Notes to Consolidated Financial Statements.) General and administrative expenses as a percentage of revenue increasedwas due to 8.2% during 2006 from 7.9% during 2005.the 18% decrease in revenue. For 2009, the decrease in general and administrative expenses was due to a decrease caused by the net impact of changes in foreign currency exchange rates of $2.6 million, a reduction of our patent litigation accrual which resulted in a non-cash decrease to our operating expenses of $2 million and a decrease in variable compensation of $948,000. Temporary cost cutting measures which include a company-wide wage reduction as well as a reduction in the number of accrued vacation hours that employees are allowed to carry beyond December 31, 2009, resulted in additional cost savings of $1.8 million. For 2008, the increase in absolute dollars compared to 2007 can primarily be attributed to the net impact of foreign currency exchange rates which had the effect of increasing our general and administrative expense by $2.4 million or 4%. We expect that general and administrative expenses in future periods will fluctuate in absolute amountsdollars and as a percentage of revenue.
Interest Income.Income.Interest income increased 82%was $1.6 million, $6 million and $10 million for the years ended December 31, 2009, 2008 and 2007, respectively, a decrease of 73% in 2006 from 2005, which followed an increase2009 compared to 2008 following a decrease of 29%40% in 2005 from 2004. The increase2008 compared to 2007. For 2009, the decrease is attributable to significant decreases in investment yields for high grade treasury, municipal and corporate bonds. For 2008, the decrease is attributable to a decrease in invested funds as well as to the rapid rate of decrease in interest income in 2006 was due to higher yields on larger invested funds. The increase in interest income in 2005 versus 2004 was due to higher yields.rates during the second half of 2008. The primary source of interest income is from the investment of our cash and short-term investments. Net cash provided by operating activities totaled $97.9 million and $88.1 million in 2006 and 2005, respectively.
Net Foreign Exchange Gain (Loss). We experienced net Net foreign exchange gains of $740,000 in 2006, compared to losses of $1.6gain (loss) was $734,000, $(3.7) million in 2005 and gains of $1.3$1.7 million in 2004.for the years ended December 31, 2009, 2008 and 2007, respectively. These results are attributable to movements in the foreign currency exchange rates between the U.S. dollar and the localforeign currencies in countries in whichwhere our sales subsidiaries are located.functional currency is not the U.S. dollar. We recognize the local currency as the functional currency in virtually all of our international subsidiaries.
We utilize foreign currency forward contracts to hedge our foreign denominated net foreign currency balance sheet positions to protect against the change in value caused by a majorityfluctuation in foreign currency exchange rates. We typically hedge up to 90% of our outstanding foreign currency-denominated receivables in order to reduce our exposure to significant foreign currency fluctuations. Wedenominated net receivable or payable positions and typically limit the duration of our “receivables”these foreign currency forward contracts to approximately 90 days. We also utilize The gain or loss on these derivatives as well as the offsetting gain or loss on the hedge item attributable to the hedged risk is recognized in current earnings under the line item “net foreign exchange gain (loss)”. Our hedging strategy reduced our foreign exchange gains by $1.7 million in 2009, reduced our foreign exchange losses by $1.2 million in 2008 and reduced our foreign exchange gains by $1.1 million in 2007.
To protect against the change in the value caused by a fluctuation in foreign currency exchange rates of forecasted foreign currency cash flows resulting from international sales and expenses over the next one to two years, we have instituted a foreign currency cash flow hedging program. We hedge portions of our forecasted revenue and forecasted expenses denominated in foreign currencies with forward and option contracts. For forward contracts, andwhen the dollar strengthens significantly against the foreign currency purchased option contractscurrencies, the change in order to reduce our exposure to fluctuations inthe present value of future foreign currency cash flows. We purchase theseflows may be offset by the change in the fair value of the forward contracts for up to 100%designated as hedges. For purchased option contracts, when the dollar strengthens significantly against the foreign currencies, the change in the present value of our forecastedfuture foreign currency cash flows may be offset by the change in selected currencies (primarily the euro, yen and pound sterling) and limitfair value of the durationoption contracts designated as hedges, net of these contracts to 40 months.the premium paid. Our foreign currency purchased option contracts are purchased “at-the-money” or “out-of-the-money.” We purchase foreign currency forward and option contracts for up to 100% of our forecasted exposures in selected currencies (primarily in Euro, Japanese yen, British pound sterling and Hungarian forint) and limit the duration of these contracts to 40 months or less. As a result, our hedging activities only partially address our risks infrom foreign currency transactions, and there can be no assurance that this strategy will be successful. We do not invest in contracts for speculative purposes. (See Note 114 - Derivative instruments and hedging activities of Notes to Consolidated Financial Statements for a description of our forward and purchased option contracts and hedged positions.) Our hedging strategy reduced our foreign exchange gains for December 31, 2006 by $1.0 million and reduced our foreign exchange loss for December 31, 2005 by $2.2 million.positions).
Other Income (Expense), Net. We established a valuation reserve in the fourth quarter of 2004 for the estimated total impairment of a $2.5 million cost-method investment.Provision for Income Taxes.Our provision for income taxes reflectsreflected an effective tax rate of 24%66%, 14% and 6% for the years ended December 31, 2009, 2008 and 2007, respectively. The increase in 2006 and 2005 and 25% in 2004. Ourour effective tax rate is lower thanin 2009 compared to 2008 was driven by changes in our valuation allowances, tax charges related to inter-company profits and an increase in equity compensation expense as a percentage of pre-tax book income. (See Note 9 – Income taxes of Notes to Consolidated Financial Statements for further discussion regarding changes in our effective tax rate and a reconciliation of income taxes at the U.S. federal statutory income tax rate of 35% primarily as a result of the extraterritorial income exclusion, tax-exempt interest and reducedto our effective tax rates in certain foreign jurisdictions. The decreases in our tax rate in 2006 and 2005 from 2004 are due to increased profits in foreign jurisdictions with reduced income tax rates.rate).
Liquidity and Capital Resources
Working Capital, Cash and Cash Equivalents, Short-term Investments and Long-term Investments. We currently finance The following table presents our working capital, cash and cash equivalents and marketable securities (in thousands):
December 31,2009 December 31,2008 Increase/(Decrease) Working capital $ 413,759 $ 398,292 $ 15,467 Cash and cash equivalents (1) 201,465 229,400 (27,935 ) Short-term investments (1) 87,196 6,220 80,976 Long-term investments — 10,500 (10,500 ) Total cash, cash equivalents, short and long-term investments $ 288,661 $ 246,120 $ 42,541
(1)Included in working capital
Our working capital increased by $15 million during the year ended December 31, 2009 compared to December 31, 2008, due to cash provided by operations offset by repurchases of shares of our common stock, dividend payments and capital expenditures throughexpenditures.
Our cash flow from operations. At December 31, 2006, we had working capitaland cash equivalent balances are held in numerous financial institutions throughout the world, including substantial amounts held outside of approximately $374.5 million comparedthe U.S.; however, the majority of our cash and investments that are located outside of the U.S. are denominated in the U.S. dollar. Most of the amounts held outside of the U.S. could be repatriated to $274.7the U.S., but under current law, would be subject to U.S. federal income taxes, less applicable foreign tax credits. In some countries repatriation of certain foreign balances is restricted by local laws. We have provided for the U.S. federal tax liability on these amounts for financial statement purposes, except for foreign earnings that are considered indefinitely reinvested outside of the U.S. Repatriation could result in additional U.S. federal income tax payments in future years. We utilize a variety of tax planning and financing strategies with the objective of having our worldwide cash available in the locations in which it is needed.Cash Provided and (Used) in 2009 and 2008. Cash and cash equivalents decreased to $201 million at December 31, 2005. Net2009 from $229 million at December 31, 2008. The following table summarizes the proceeds and (uses) of cash (in thousands):
December 31, 2009 2008 Cash provided by operating activities $ 135,651 $ 121,818 Cash (used in)/provided by investing activities (111,915 ) 18,756 Cash (used in) financing activities (51,671 ) (106,013 ) Net (decrease)/increase in cash equivalents (27,935 ) 34,561 Cash and cash equivalents at beginning of year 229,400 194,839 Cash and cash equivalents at end of year $ 201,465 $ 229,400
Our operating activities provided $136 million and $122 million for the years ended December 31, 2009 and 2008, respectively, a 11% increase. For 2009, cash provided by operating activities was the result of $17 million of net income, $77 million in 2006, 2005net non-cash operating expenses which consisted of depreciation and 2004 totaled $97.9amortization, stock-based compensation, benefits from deferred income taxes, and by $41 million $88.1in net cash provided by changes in operating assets and liabilities, principally a $18 million decrease in accounts receivable, a $21 million decrease in inventories and $65.6a $13 million respectively.decrease in prepaid expenses and other assets, offset by a decrease of $10 million in accounts payable, taxes and other liabilities. In 2008, cash provided by operating activities was primarily the result of $84.8 million in net income and $51.3 million in net non-cash operating expenses which primarily consisted of depreciation and amortization, stock-based compensation, and benefits from deferred income taxes, offset in part by $14.3 million in net cash used by changes in operating assets and liabilities, principally a $24.6 million increase in inventory.
Accounts receivable increaseddecreased to $117.2$104 million at December 31, 20062009 from $95.7$122 million at December 31, 2005,2008, as a result of higherlower sales levelsvolumes during 2009. This decrease in the fourth quarter of 2006 compared to the fourth quarter of 2005. Daysrevenue also caused our days sales outstanding at December 31, 2006 increased to 59 days from 55increase to 61 days at December 31, 2005. 2009, compared to 57 days at December 31, 2008. We typically bill customers on an open account basis subject to our standard net thirty day payment terms. If, in the longer term, our revenue increases, it is likely that our accounts receivable balance will also increase. Our accounts receivable could also increase if customers delay their payments or if we grant extended payment terms to customers, both of which are more likely to occur during challenging economic times when our customers may face issues gaining access to sufficient funding or credit.
Consolidated inventory balances have increaseddecreased to $77.1$87 million at December 31, 20062009 from $62.8$107 million at December 31, 2005.2008. Inventory turns decreased to 2.41.8 per year for 2006 from 2.7at December 31, 2009 compared to 2.1 per year for 2005.at December 31, 2008. The increasedecrease in inventory in 2006during 2009 was principally to support the transfer of one of our two remaining Austin based production lines todriven by a reduction in our manufacturing facilityactivities in Hungary. The additionalresponse to the decreased demand for our products. Our inventory is intended aslevels will continue to be determined based upon our anticipated demand for products and our need to keep sufficient inventory on hand to meet our customers’ demands. We attempt to balance such considerations against the risk of obsolescence or potentially excess inventory levels. Rapid changes in industrial demand could have a buffer to support continued production as bothsignificant impact on our inventory balances in future periods.
Investing activities used cash of $112 million during 2009, which was the capital equipment andresult of the inventory needed to support its operation were physically moved to Hungary in September 2006. Cash used in 2006 fornet purchase of short-term investments of $74 million, the purchase of property and equipment totaled $18.5of $21 million, for the capitalization of internally developed software costs totaled $7.4of $13 million and for additions tothe acquisition of other intangibles totaled $3.1of $5 million. Cash used in 2005 for acquisitions totaled $63.9For 2008, investing activities provided cash of $19 million forwhich was primarily the result of the net sale of $77 million of short-term investments, offset by the purchase of property and equipment totaled $15.4of $26 million, fora net cash payment of $17 million related to the acquisition of microLEX Systems ApS (see Note 15 - Acquisitions of Notes to Consolidated Financial Statements), capitalization of internally developed software costs totaled $13.4of $10 million and for additions tothe acquisition of other intangibles totaled $4.3of $3 million. Cash
Financing activities used in 2004 for$52 million during 2009, which was the purchaseresult of property$35 million used to repurchase our common stock and equipment totaled $12.6$37 million for the capitalizationused to pay dividends to our shareholders, offset by $22 million received as a result of internally developed software costs totaled $5.0 million and for additions to other intangibles totaled $3.1 million. Cash provided by the issuance of our common stock totaled $37.1from the exercise of stock options and sales of our common stock through our employee stock purchase plan. For 2008, financing activities used $106 million $23.2which was the result of $104 million used to repurchase our common stock and $16.8$35 million used to pay dividends to our shareholders, offset by $31 million received as a result of the issuance of our common stock from the exercise of stock options and our employee stock purchase plan.
From time to time our Board of Directors has authorized various programs to repurchase shares of our common stock depending on market conditions and other factors. Under such programs, we repurchased a total of 1,443,441, 4,110,042 and 2,730,125 shares of our common stock at weighted average prices of $23.96, $25.22 and $29.20 per share, in 2006, 2005the years ended December 31, 2009, 2008 and 2004, respectively, and cash used for payment2007, respectively.
On January 23, 2009, our Board of dividends totaled $19.0 million, $15.8 million and $14.5 million in 2006, 2005 and 2004, respectively. The issuanceDirectors approved a new share repurchase plan which increased the aggregate number of shares of common stock wasthat we are authorized to repurchase from 591,324 to 3.0 million. At December 31, 2009, there were 1,688,327 shares remaining available for repurchase under this plan. This repurchase plan does not have an expiration date.
During 2009, we received reduced proceeds from the exercise of stock options compared to 2008. The timing and number of stock option exercises and the amount of cash proceeds we receive through those exercises are not within our control, and in the future we may not generate as much cash from the exercise of stock options as we have in the past. Moreover, it is now our practice to issue restricted stock units and not stock options to eligible employees under our Employee Stock Purchase Plan, our 1994 Incentive Plan and our 2005 Incentive Plan.which will reduce the number of stock options available for exercise in the future. Unlike the exercise of stock options, the issuance of shares upon vesting of restricted stock units does not result in any cash proceeds to us.
Contractual Cash used for the repurchase of common stock totaled $16.5 million, $49.5 million and $16.1 million in 2006, 2005 and 2004, respectively.Obligations.
The following summarizes our contractual cash obligations as of December 31, 20062009 (in thousands):Payments Due by Period
Total
2007
2008
2009
2010
2011
Beyond
Long-term debt $ — $ — $ — $ — $ — $ — $ — Capital lease obligations — — — — — — — Operating leases 23,691 7,241 5,682 4,883 3,103 1,983 799 Other long-term obligations — — — — — — —
Total contractual cash obligations $ 23,691 $ 7,241 $ 5,682 $ 4,883 $ 3,103 $ 1,983 $ 799
Payments Due by Period Total 2010 2011 2012 2013 2014 Beyond Long-term debt $ — $ — $ — $ — $ — $ — $ — Capital lease obligations — — — — — ��� — Operating leases 51,701 14,415 9,898 6,982 4,611 3,665 12,130 Total contractual cash obligations $ 51,701 $ 14,415 $ 9,898 $ 6,982 $ 4,611 $ 3,665 $ 12,130
The following summarizes our other commercial commitments as of December 31, 20062009 (in thousands):Total
2007
2008
2009
2010
2011
Beyond
Guarantees $ 3,500 $ 3,500 $ — $ — $ — $ — $ — Purchase obligations 7,004 7,004 — — — — —
Total commercial commitments $ 10,504 $ 10,504 $ — $ — $ — $ — $ —
Total 2010 2011 2012 2013 2014 Beyond Guarantees $ 5,200 $ 5,200 $ — $ — $ — $ — $ — Purchase obligations 6,500 6,500 — — — — — Total commercial commitments $ 11,700 $ 11,700 $ — $ — $ — $ — $ —
We currently expecthave commitments under non-cancelable operating leases primarily for office facilities throughout the world. Certain leases require us to fund expenditures for capital requirements as well as liquidity needs created by changes in working capital from a combination of available cashpay property taxes, insurance and short-term investment balancesroutine maintenance, and internally generated funds.include escalation clauses. As of December 31, 2006 and 2005, we had no debt outstanding. We believe that our cash flow from operations and existing cash balances and short-term investments will be sufficient to meet our cash requirements for at least the next twelve months. Cash requirements for periods beyond the next twelve months will depend on our profitability, our ability to manage working capital requirements and our rate of growth. Financial Risk Management
Our international sales are subject to inherent risks, including fluctuations in local economies; difficulties in staffing and managing foreign operations; greater difficulty in accounts receivable collection; costs and risks of localizing products for foreign countries; unexpected changes in regulatory requirements, tariffs and other trade barriers; difficulties in the repatriation of earnings and burdens of complying with a wide variety of foreign laws. The vast majority of our sales outside of North America are denominated in local currencies, and accordingly, we are subject to the risks associated with fluctuations in currency rates. In particular, increases in the value of the dollar against foreign currencies decrease the U.S. dollar value of foreign sales requiring that we either increase our price in the local currency, which could render our product prices noncompetitive, or suffer reduced revenues and gross margins as measured in U.S. dollars. These dynamics have adversely affected our revenue growth in international markets in previous years. Our foreign currency hedging program includes both foreign currency forward and purchased option contracts to reduce the effect of exchange rate fluctuations. However, our hedging program will not eliminate all of our foreign exchange risks. (See “Net Foreign Exchange Gain (Loss)” and Note 11 of Notes to Consolidated Financial Statements.)
The marketplace for our products dictates that many of our products be shipped very quickly after an order is received. As a result, we are required to maintain significant inventories. Therefore, inventory obsolescence is a risk for us due to frequent engineering changes, shifting customer demand, the emergence of new industry standards and rapid technological advances including the introduction by us or our competitors of products embodying new technology. While we adjust for excess and obsolete inventories and we monitor the valuation of our inventories, there can be no assurance that our valuation adjustments will be sufficient.
Off-Balance Sheet Arrangements
We have no debt or off-balance sheet debt. As of December 31, 2006,2009, we have non-cancelable operating lease obligations of approximately $23.7$52 million compared to $50 million at December 31, 2008. Rent expense under operating leases was $12 million, $12 million and contractual$10 million for the years ended December 31, 2009, 2008 and 2007, respectively.
Purchase obligations primarily represent purchase commitments for customized inventory and inventory components. As of December 31, 2009, we had non-cancelable purchase commitments with various suppliers of general components and customized inventory and inventory components totaling approximately $6.5 million over the next twelve months. At December 31, 2008, we had non-cancelable purchase commitments with various suppliers of customized inventory and inventory components totaling approximately $7.0$8.4 million.
Guarantees are related to payments of customs and foreign grants. As of December 31, 2006,2009, we have outstanding guarantees for payment of customs and foreign grants totaling approximately $3.5$5.2 million. (See Note 13 of Notes to Consolidated Financial Statements.) As of December 31, 2006,2008, we have outstanding guarantees for payment of customs and foreign grants totaling approximately $2.4 million.
Off-Balance Sheet Arrangements. We do not have any debt or off-balance sheet debt. As of December 31, 2009, we did not have any relationships with any unconsolidated entities or financial partnerships, such as entities often referred to as structured finance entities, which would have been established for the purpose of facilitating off-balance sheet arrangements. As such, we are not exposed to any financing, liquidity, market or credit risk that could arise if we were engaged in such relationships.
Market RiskProspective Capital Needs. We are exposedbelieve that our existing cash, cash equivalents and marketable securities, together with cash generated from operations and from the exercise of employee stock options and the purchase of common stock through our employee stock purchase plan, will be sufficient to a varietycover our working capital needs, capital expenditures, investment requirements, commitments, payment of risks, including foreign currency fluctuationsdividends to our shareholders and changes in the market valuerepurchases of our investments. Incommon stock for at least the normal coursenext 12 months. However, we may choose or be required to raise additional funds by selling equity or debt securities to the public or to selected investors, or by borrowing money from financial institutions. Historically, we have not had to rely on debt, public or private, to fund our operating, financing or investing activities. We could also choose or be required to reduce certain expenditures, such as payments of business, we employ established policies and procedures to manage our exposure to fluctuations in foreign currency values and changes in the market valuedividends or repurchases of our investments.
Foreign Currency Hedging Activities. Our objective in managing our exposurecommon stock. In addition, even though we may not need additional funds, we may still elect to foreign currency exchange rate fluctuations issell additional equity or debt securities or obtain credit facilities for other reasons. If we elect to reduceraise additional funds, we may not be able to obtain such funds on a timely basis on acceptable terms, if at all. If we raise additional funds by issuing additional equity or convertible debt securities, the impactownership percentages of adverse fluctuations in such exchange rates on our earnings and cash flow. Accordingly,existing shareholders would be reduced. In addition, the equity or debt securities that we utilize purchased foreign currency option contracts and forward contractsissue may have rights, preferences or privileges senior to hedge our exposure on anticipated transactions and firm commitments. The principal currencies hedged are the euro, British pound and Japanese yen. We monitor our foreign exchange exposures regularly to ensure the overall effectivenessthose of our foreign currency hedge positions. However, there can be no assurance that our foreign currency hedging activities will substantially offset the impact of fluctuations in currency exchange rates on our results of operations and financial position. Based on the foreign exchange instruments outstanding at December 31, 2006 and 2005, an adverse change (defined as 20% in the Asian currencies and 10% in all other currencies) in exchange rates would result in a decline in the aggregate fair market value of all of our instruments outstanding of approximately $6.6 million and $4.2 million, respectively. However, as we utilize foreign currency instruments for hedging anticipated and firmly committed transactions,common stock.
Although we believe that a loss in fair valuewe have sufficient capital to fund our activities for at least the next 12 months, our future capital requirements may vary materially from those instrumentsnow planned. We anticipate that the amount of capital we will be substantially offset by increasesneed in the value of the underlying exposure. (See Note 10 of Notes to Consolidated Financial Statements for a description of our financial instruments at December 31, 2006 and 2005.)Short-term Investments. The fair value of our investments in marketable securities at December 31, 2006 and 2005 was $150.2 million and $119.8 million, respectively. Investments with maturities beyond one year are classified as short-term basedfuture will depend on their highly liquid nature and because such marketable securities represent the investment of cash that is available for current operations. Our investment policy is to manage our investment portfolio to preserve principal and liquidity while maximizing the return on our investment portfolio through the full investment of available funds. We diversify our marketable securities portfolio by investing in multiple types of investment-grade securities. Our investment portfolio is primarily invested in securities with at least an investment grade rating to minimize interest rate and credit risk as well as to provide for an immediate source of funds. Based on our investment portfolio and interest rates at December 31, 2006 and 2005, a 100 basis point increase or decrease in interest rates would result in a decrease or increase of approximately $750,000 and $600,000, respectively, in the fair value of our investment portfolio. Although changes in interest rates may affect the fair value of our investment portfolio and cause unrealized gains or losses, such gains or losses would not be realized unless the investments are sold.
many factors, including:
· general economic and political conditions and specific conditions in the markets we address, including the continuing volatility in the industrial economy, current general economic volatility and trends in the industrial economy in various geographic regions in which we do business;
· the inability of certain of our customers who depend on credit to have access to their traditional sources of credit to finance the purchase of products from us, particularly in the current global economic environment, which may lead them to reduce their level of purchases or to seek credit or other accommodations from us;
· the overall levels of sales of our products and gross profit margins;
· our business, product, capital expenditure and research and development plans, and product and technology roadmaps;
· repurchases of our common stock;
· required levels of research and development and other operating costs;
· litigation expenses, settlements and judgments;
· the levels of inventory and accounts receivable that we maintain;
· acquisitions of other businesses, assets, products or technologies;
· capital improvements for new and existing facilities;
· our relationships with suppliers and customers; and,
· the level of exercises of stock options and stock purchases under our employee stock purchase plan.
Recently Issued Accounting Pronouncements
In July 2006,April 2009, the Financial Accounting Standards Board (“FASB”) issued FASB Interpretation (“FIN”) 48,Accountingupdated FASB ASC 820 providing additional guidance for Uncertainty in Income Taxes – an interpretationestimating fair value when the volume and level of Statement of Financial Accounting Standards (“SFAS”) 109.activity for the asset or liability have significantly decreased. This interpretation clarifies the accounting for uncertainty in income taxes recognized in an entity’s financial statements in accordance with SFAS 109,Accounting for Income Taxes. It prescribesupdate also includes guidance on identifying circumstances that indicate a recognition threshold and measurement attribute for financial statement disclosure of tax positions taken or expected to be taken on a tax return. This interpretationtransaction is effective for fiscal years beginning after December 15, 2006.not orderly. We adopted FIN 48the update on JanuaryApril 1, 20072009 as required. The cumulative effect of adopting FIN 48 was recorded in retained earnings upon adoption. The adoption of FIN 48required and concluded it did not have a significantmaterial impact on our consolidated financial position or results of operations.
In September 2006,2009, the SecuritiesFASB updated FASB ASC 105, Generally Accepted Accounting Principles (FASB ASC 105). The update establishes the FASB Standards Accounting Codification (“Codification”) as the source of authoritative U.S. generally accepted accounting principles (“GAAP”) recognized by the FASB to be applied to nongovernmental entities and Exchange Commission (“SEC”) issued Staff Accounting Bulletin (“SAB”) 108 regardingrules and interpretive releases of the process of quantifying financial statement misstatements. SAB 108 states that registrants should use both a balance sheet approachSEC as authoritative GAAP for SEC registrants. The Codification supersedes all existing non-SEC accounting and an income statement approach when quantifying and evaluating the materiality of a misstatement. The interpretations in SAB 108 contain guidance on correcting errors under the dual approach as well as provide transition guidance for correcting errors.reporting standards. This interpretation does not change the requirements within SFAS 154,Accounting Changes and Error Corrections – a replacement of APB 20 and FASB Statement 3, for the correction of an error on financial statements. SAB 108update is effective for annual financial statements covering the first fiscal yearissued for interim and annual periods ending after NovemberSeptember 15, 2006.2009. We adopted this interpretationthe update on December 31, 2006. The adoption of SAB 108July 1, 2009, as required and concluded it did not have a significant effectmaterial impact on our consolidated financial statements.position or results of operations.
In September 2006,October 2009, the FASB issued SFAS 157,Fair Value Measurements. This standard defines fair value, establishesupdated FASB ASC 605, Revenue Recognition (FASB ASC 605) that amended the criteria for separating consideration in multiple-deliverable arrangements. The amendments establish a frameworkselling price hierarchy for measuring fair value in accounting principles generally accepteddetermining the selling price of a deliverable. The selling price used for each deliverable will be based on vendor-specific objective evidence if available, third–party evidence if vendor-specific objective evidence is not available, or estimated selling price if neither vendor-specific objective evidence nor third-party evidence is available. The amendments will change the application of the residual method of allocation and require that arrangement consideration be allocated at the inception of the arrangement to all deliverables using the relative selling price method. The relative selling price method allocates any discount in the United Statesarrangement proportionally to each deliverable on the basis of America, and expands disclosure about fair value measurements.each deliverable’s selling price. This pronouncement applies under other accounting standards that requireupdate will be effective prospectively for revenue arrangements entered into or permit fair value measurements. Accordingly, this statement does not require any new fair value measurement. This statement is effective formaterially modified in fiscal years beginning on or after NovemberJune 15, 2007, and interim periods within those fiscal years. We will be required to adopt SFAS 157 in the first quarter of fiscal year 2008.2010. Early adoption is permitted. We are currently evaluating the requirements of SFAS 157this update and have not yet determined the impact on our consolidated financial statements.
In March 2006,October 2009, the Emerging Issues Task Force (“EITF”) reached a consensus on EITF Issue 06-3,How Taxes Collected from CustomersFASB updated FASB ASC 985, Software (FASB ASC 985) that changes the accounting model for revenue arrangements that include both tangible products and Remittedsoftware elements. Tangible products containing software components and non-software components that function together to Governmental Authorities Should Be Presented indeliver the Income Statement (that is, Gross versus Net Presentation). Taxestangible product’s essential functionality are no longer within the scope of EITF Issue 06-3 include any taxes assessed bythe software revenue guidance in Subtopic 985-605. In addition, the amendments require that hardware components of a governmental authority thattangible product containing software components always be excluded from the software revenue guidance. This update will be effective prospectively for revenue arrangements entered into or materially modified in fiscal years beginning on or after June 15, 2010. Early adoption is permitted. We are directly imposed on a revenue-producing transaction between a sellercurrently evaluating the requirements of this update and a customer and may include, but arehave not limited to, sales taxes, use taxes, value-added taxes, and some excise taxes. The EITF concluded thatyet determined the presentation of these taxes on either a gross (included in revenues and costs) or a net (excluded from revenue) basis is an accounting policy decision that should be disclosed. For any such taxes that are reported on a gross basis, a company should disclose the amounts of those taxes in interim and annual financial statements. Our policy is to exclude all such taxes from revenue. The provisions of EITF 06-3 are effective for interim and annual reporting periods beginning after December 15, 2006. The adoption of EITF 06-3 will not have any effectimpact on our consolidated financial statements.
Critical Accounting Policies
The preparation of our financial statements in conformity with generally accepted accounting principles requires us to make estimates and assumptions that affect the reported amounts of assets, liabilities, revenues, expenses and related disclosures of contingent assets and liabilities. We base our estimates on past experience and other assumptions that we believe are reasonable under the circumstances, and we evaluate these estimates on an ongoing basis. Our critical accounting policies are those that affect our financial statements materially and involve difficult, subjective or complex judgments by management. Although these estimates are based on management's best knowledge of current events and actions that may impact the company in the future, actual results may be materially different from the estimates.
Our critical accounting policies are as follows:
o Revenue recognition
We derive revenue primarily from the sale/licensing of integrated hardware and software solutions. We also sell application software licenses which are sold separately as well as training and post contract support services. The products and services are generally sold under standardized licensing and sales arrangements with payment terms ranging from net 30 days in the United States to net 30 days and up to net 90 days in some international markets. Approximately 95% of our product/license sales include both hardware and software in the customer arrangement, with a small percentage of sales including other services. We offer rights of return and standard warranties for product defects related to our products. The rights of return are generally for a period of up to 30 days after the delivery date. The standard warranties cover periods ranging from 90 days to three years. We do not enter into contracts requiring product acceptance from the customer.
· Revenue is recognized in accordance with the provisions of SOP 97-2 when persuasive evidence of an arrangement exists, delivery has occurred, the fee is fixed or determinable, and collectability is probable. We enter into certain arrangements where we are obligated to deliver multiple products and/or services (“multiple elements”). In these transactions, we allocate the total revenue among the elements based on the sales price of each element when sold separately (“vendor-specific objective evidence”).recognition
We derive revenue primarily from the sale/licensing of integrated hardware and software solutions. Independent sales of application software licenses include post contract support services. In addition, training services are sold separately. The products and services are generally sold under standardized licensing and sales arrangements with payment terms ranging from net 30 days in the U.S. to net 30 days and up to net 90 days in some international markets. Approximately 83% of our product/license sales include both hardware and software in the customer arrangement, with a small percentage of sales including other services. We offer rights of return and standard warranties for product defects related to our products. The rights of return are generally for a period of up to 30 days after the delivery date. The standard warranties cover periods ranging from 90 days to three years. We do not generally enter into contracts requiring product acceptance from the customer.
Revenue is recognized in accordance with the provisions of FASB ASC 985, when persuasive evidence of an arrangement exists, delivery has occurred, the fee is fixed or determinable, and collectability is probable. We enter into certain arrangements where we are obligated to deliver multiple products and/or services (“multiple elements”). In these transactions, we allocate the total revenue among the elements based on vendor specific objective evidence (“VSOE”) of fair value as determined by the sales price of each element when sold separately.
When VSOE of fair value is available for the undelivered element of a multiple element arrangements, sales revenue is generally recognized on the date the product is shipped, using the residual method under FASB ASC 985, with a portion of revenue recorded as deferred (unearned) due to applicable undelivered elements. Undelivered elements for our multiple element arrangements with a customer are generally restricted to post contract support and training and education. The amount of revenue allocated to these undelivered elements is based on the VSOE of fair value for those undelivered elements. Deferred revenue due to undelivered elements is recognized ratably on a straight-line basis over the service period or when the service is completed. When VSOE of fair value is not available for the undelivered element of a multiple element arrangement, sales revenue is generally recognized ratably, on a straight-line basis over the service period of the undelivered element, generally 12 months or when the service is completed in accordance with the subscription method under FASB ASC 985. Deferred revenue at December 31, 2009 and 2008 was $57 million and $46 million, respectively.
The application of FASB ASC 985, requires judgment, including whether a software arrangement includes multiple elements, and if so, whether VSOE of fair value exists for those elements. Changes to the elements in a software arrangement, the ability to identify VSOE for those elements, the fair value of the respective elements, and changes to a product’s estimated life cycle could materially impact the amount of our earned and unearned revenue. Judgment is also required to assess whether future releases of certain software represent new products or upgrades and enhancements to existing products.
· Sales revenue from product sales is generally recognized on the date the product is shipped, with a portion of revenue recorded as deferred (unearned) due to applicable undelivered elements. Undelivered elements for our multiple-element arrangements with a customer are generally restricted to post contract support and training and education. The amount of revenue allocated to these undelivered elements is based on the vendor-specific objective evidence (“VSOE”) of fair value for those undelivered elements. Deferred revenue due to undelivered elements is recognized ratably on a straight-line basis over the service period or when the service is completed. Deferred revenue at December 31, 2006 and 2005 was $22.2 million and $16.0 million, respectively.
The application of SOP 97-2 requires judgment, including whether a software arrangement includes multiple elements, and if so, whether VSOE of fair value exists for those elements. Changes to the elements in a software arrangement, the ability to identify VSOE for those elements, the fair value of the respective elements, and changes to a product's estimated life cycle could materially impact the amount of earned and unearned revenue. Judgment is also required to assess whether future releases of certain software represent new products or upgrades and enhancements to existing products.
Provision for estimated sales returns is made by reducing recorded revenue based on historical experience. The accounts receivable are net ofEstimating allowances for doubtful accounts and sales returns of $4.4 million and $4.7 million at December 31, 2006 and 2005, respectively.
The preparation of financial statements requires that we make estimates and assumptions of potential future product returns related to current period product revenue. We analyze historical returns, current economic trends, and changes in customer demand and acceptance of our products when evaluating the adequacy of our sales returns allowance. Significant judgments and estimates must be made and used in connection with establishing the sales returns allowance in any accounting period. A provision for estimated sales returns is made by reducing recorded revenue by the amount of the allowance. Accounts receivable is reported net of the allowance for sales returns. The allowance for sales returns was $1.9 million and $1.8 million at December 31, 2009 and 2008, respectively. Material differences may result in the amount and timing of our revenue for any period if we made different judgments or utilized different estimates or if actual results varied materially from our estimates.
· o Estimating allowances, specifically sales returns, the allowance for doubtful accounts and the adjustment for excess and obsolete inventories
In addition to estimating an allowance for sales returns, we must also make estimates about the uncollectability of our accounts receivables. We specifically analyze accounts receivable and analyze historical bad debts, customer concentrations, customer credit-worthiness and current economic trends when evaluating the adequacy of our allowance for doubtful accounts. Our allowance for doubtful accounts was $2.7 million and $3.9 million at December 31, 2009 and 2008, respectively. We also write down our inventory for estimated obsolescence or unmarketable inventory equal to the difference between the cost of inventory and estimated market value based on assumptions of future demand and market conditions. Our allowance for excess and obsolete inventories was $4.4 million and $4.4 million at December 31, 2009 and 2008, respectively. Significant judgments and estimates must be made and used in connection with establishing these allowances. Material differences may result in the amount and timing of our bad debt and inventory obsolescence if we made different judgments or utilized different estimates or if actual results varied materially from our estimates.
· The preparation of financial statements requires that we make estimates and assumptions that affect the reported amount of assets and liabilities and disclosure of contingent assets and liabilities at the date of the financial statements and the reported amounts of revenues and expenses during the reported period. Specifically, we must make estimates of potential future product returns related to current period product revenue. Management analyzes historical returns, current economic trends, and changes in customer demand and acceptance of our products when evaluating the adequacy of our sales returns and other allowances. Significant management judgments and estimates must be made and used in connection with establishing the sales returns and other allowances in any accounting period. The allowance for sales returns was $1.5 million at December 31, 2006. Material differences may result in the amount and timing of our revenue for any period if management made different judgments or utilized different estimates. Similarly, management must make estimates of the uncollectability of our accounts receivables. Management specifically analyzes accounts receivable and analyzes historical bad debts, customer concentrations, customer credit-worthiness and current economic trends when evaluating the adequacy of our allowance for doubtful accounts. The allowance for doubtful accounts was $2.9 million at December 31, 2006. We write down our inventory for estimated obsolescence or unmarketable inventory equal to the difference between the cost of inventory and estimated market value based on assumptions of future demand and market conditions. Our adjustment for excess and obsolete inventories was $5.2 million at December 31, 2006. If actual market conditions are less favorable than those projected by management, additional inventory write downs would be required.
o Accounting for costs of computer software
We capitalize costs related to the development and acquisition of certain software products. Capitalization of costs begins when technological feasibility has been established and ends when the product is available for general release to customers. Technological feasibility for our products is established when the product is available for beta release. Judgment is required in determining when technological feasibility of a product is established. Amortization is computed on an individual product basis for those products available for market and has been recognized based on the product’s estimated economic life, generally three years. At each balance sheet date, the unamortized costs are reviewed by management and reduced to net realized value when necessary. As of December 31, 2009, unamortized capitalized software development costs were $18 million.
· We capitalize costs related to the development and acquisition of certain software products. Capitalization of costs begins when technological feasibility has been established and ends when the product is available for general release to customers. Judgment is required in determining when technological feasibility of a product is established. Amortization is computed on an individual product basis for those products available for market and has been recognized based on the product’s estimated economic life, generally three years. At each balance sheet date, the unamortized costs are reviewed by management and reduced to net realized value when necessary. As of December 31, 2006, unamortized capitalized software development costs was $15.8 million.
o Valuation of long-lived and intangible assets
We assess the impairment of identifiable intangibles, long-lived assets and related goodwill whenever events or changes in circumstances indicate that the carrying value may not be recoverable. In accordance with FASB ASC 350, Intangibles – Goodwill and Other (FASB ASC 350), goodwill is tested for impairment on an annual basis, and between annual tests if indicators of potential impairment exist, using a fair-value-based approach based on the market capitalization of the reporting unit. Our annual impairment test was performed as of February 28, 2009. No impairment of goodwill has been identified during the period presented. Goodwill is deductible for tax purposes in certain jurisdictions. We have defined our operating segment based on geographic regions. We sell our products in three geographic regions. Our sales to these regions share similar economic characteristics, similar product mix, similar customers, and similar distribution methods. Accordingly, we have elected to aggregate these three geographic regions into a single operating segment. As we have one reporting segment, we allocate goodwill to one reporting unit for goodwill impairment testing. Factors considered important which could trigger an impairment review include the following:
· We assess the impairment of identifiable intangibles, long-lived assets and related goodwill whenever events or changes in circumstances indicate that the carrying value may not be recoverable. Factors considered important which could trigger an impairment review include the following:
oSignificantsignificant underperformance relative to expected historical or projected future operating results;
o· Significantsignificant changes in the manner of our use of the acquired assets or the strategy for our overall business;
o· Significantsignificant negative industry or economic trends; and,
o· Ourour market capitalization relative to net book value.
When it is determined that the carrying value of intangibles, long-lived assets and related goodwill may not be recoverable based upon the existence of one or more of the above indicators of impairment, the measurement of any impairment is determined and the carrying value is reduced as appropriate. As of December 31, 2009, we had net goodwill of approximately $65 million.
· When it is determined that the carrying value of intangibles, long-lived assets and related goodwill may not be recoverable based upon the existence of one or more of the above indicators of impairment, the measurement of any impairment is determined and the carrying value is reduced as appropriate. As of December 31, 2006, we had net goodwill of approximately $53.3 million.
o Accounting for income taxes
We account for income taxes under the asset and liability method that requires the recognition of deferred tax assets and liabilities for the expected future tax consequences of events that have been recognized in our financial statements or tax returns. Judgment is required in assessing the future tax consequences of events that have been recognized in our financial statements or tax returns. Variations in the actual outcome of these future tax consequences could materially impact our financial position or our results of operations. In estimating future tax consequences, all expected future events are considered other than enactments of changes in tax laws or rates. Valuation allowances are established when necessary to reduce deferred tax assets to amounts which are more likely than not to be realized.
As a result of certain foreign investment incentives available under Hungarian law, the profit from our Hungarian operation was subject to a reduced income tax rate. This special tax status terminated on January 1, 2008, with the merger of our Hungarian manufacturing operations with its Hungarian parent company. The tax position of our Hungarian operation continued to benefit from assets created by the restructuring of our operations in Hungary. Realization of these assets was based on estimated future earnings in Hungary. Partial release of the valuation allowance on these assets resulted in income tax benefits of $18.3 million for the year ended December 31, 2007, and $8.7 million for the year ended December 31, 2008.
For the year 2009, we expected to recognize an additional tax benefit of $9.7 million related to these assets. Effective January 1, 2010, a new tax law in Hungary provides for an enhanced deduction for the qualified research and development expenses of NI Hungary Software and Hardware Manufacturing Kft. ("NI Hungary"). During the three months ended December 31, 2009, we obtained confirmation of the application of this new tax law for the qualified research and development expenses of NI Hungary. Based on the application of this new tax law to the qualified research and development expense of NI Hungary, we no longer expect to have sufficient future taxable income in Hungary to realize the benefits of these tax assets. As such, we recorded an income tax charge of $21.6 million during the three months ended December 31, 2009, $18.4 million of which was related to a valuation allowance on the previously recognized assets created by the restructuring and $3.2 million of which was related to tax benefits from other assets that we will no longer be able to realize as a result of this change. We do not expect to realize the tax benefit of the remaining assets created by the restructuring and therefore we have a full valuation allowance of $98.2 million against those assets at December 31, 2009.For additional discussion about our income taxes including components of income before income taxes, our provision for income taxes charged to operations, components of our deferred tax assets and liabilities, a reconciliation of income taxes at the U.S. federal statutory rate of 35% to our effective tax rate and other tax matters, see Note 9 – Income taxes of Notes to Consolidated Financial Statements.· We account for income taxes under the asset and liability method that requires the recognition of deferred tax assets and liabilities for the expected future tax consequences of events that have been recognized in our financial statements or tax returns. Judgment is required in assessing the future tax consequences of events that have been recognized in our financial statements or tax returns. Variations in the actual outcome of these future tax consequences could materially impact our financial position or our results of operations. In estimating future tax consequences, all expected future events are considered other than enactments of changes in tax laws or rates. Valuation allowances are established when necessary to reduce deferred tax assets to amounts which are more likely than not to be realized.Loss contingencies
As a result of certain foreign investment incentives available under Hungarian law, the profit from our Hungarian operation is currently subject to a reduced income tax rate. These benefits may not be available in the future due to changes in Hungary’s political condition and/or tax laws. The reduction or elimination of these foreign investment incentives would result in the reduction or elimination of certain tax benefits thereby increasing our future effective income tax rate, which could have a material adverse effect on our operating results.
We accrue for probable losses from contingencies including legal defense costs, on an undiscounted basis, in accordance with FASB ASC 450, Contingencies (FASB ASC 450), when such costs are considered probable of being incurred and are reasonably estimable. We periodically evaluate available information, both internal and external, relative to such contingencies and adjust this accrual as necessary. Disclosure of a contingency is required if there is at least a reasonable possibility that a loss has been incurred. In determining whether a loss should be accrued we evaluate, among other factors, the degree of probability of an unfavorable outcome and the ability to make a reasonable estimate of the amount of loss. Changes in these factors could materially impact our financial position or our results of operation.
We receive a substantial income tax benefit from the extraterritorial income (“ETI”) exemption under U.S. law. The ETI rules were repealed for transactions after December 31, 2004, with a two-year transition period, and ceased to be available as of December 31, 2006. The repeal of ETI will increase our future effective income tax rate by approximately one percentage point in December 31, 2007. However, we believe this increase will be offset entirely by the effects of the expected increased benefit from the deduction for income from qualified domestic production activities and increased profits in certain foreign jurisdictions with reduced income tax rates.
o Loss contingencies
We accrue for probable losses from contingencies including legal defense costs, on an undiscounted basis, in accordance with SFAS 5,Accounting for Loss Contingencies, when such costs are considered probable of being incurred and are reasonably estimable. We periodically evaluate available information, both internal and external, relative to such contingencies and adjust this accrual as necessary. Disclosure of a contingency is required if there is at least a reasonable possibility that a loss has been incurred. In determining whether a loss should be accrued we evaluate, among other factors, the degree of probability of an unfavorable outcome and the ability to make a reasonable estimate of the amount of loss. Changes in these factors could materially impact our financial position or our results of operation.
ITEM 7A. QUANTITATIVE AND QUALITATIVE DISCLOSURES ABOUT MARKET RISK
Financial Risk Management
Our international sales are subject to inherent risks, including fluctuations in local economies; fluctuations in foreign currencies relative to the U.S. dollar; difficulties in staffing and managing foreign operations; greater difficulty in accounts receivable collection; costs and risks of localizing products for foreign countries; unexpected changes in regulatory requirements, tariffs and other trade barriers; difficulties in the repatriation of earnings and burdens of complying with a wide variety of foreign laws. The informationvast majority of our sales outside of North America are denominated in local currencies, and accordingly, the U.S. dollar equivalent of these sales is affected by changes in the foreign currency exchange rates. Net of hedging results, the change in exchange rates had the effect of decreasing our consolidated sales by $29 million or 4% for the year ended December 31, 2009, compared to 2008. If the local currencies in which we sell our products strengthen against the U.S. dollar, we may need to lower our prices in the local currency to remain competitive in our international markets which could have a material adverse effect on our gross and net profit margins. If the local currencies in which we sell our products weaken against the U.S. dollar and if the local sales prices cannot be raised due to competitive pressures, we will experience a deterioration of our gross and net profit margins. Since most of our international operating expenses are also incurred in local currencies, the change in exchange rates had the effect of decreasing our operating expenses by $12 million or 2% for the year ended December 31, 2009, compared to 2008. Currently, we are experiencing significant volatility in foreign currency exchange rates in many of the markets in which we do business. This has had a significant impact on the revaluation of our foreign currency denominated firm commitments and on our ability to forecast our U.S. dollar equivalent revenues and expenses. In the past, these dynamics have also adversely affected our revenue growth in international markets and will likely pose similar challenges in the future. Our foreign currency hedging program includes both foreign currency forward and purchased option contracts to reduce the effect of exchange rate fluctuations. However, our hedging program will not eliminate all of our foreign exchange risks, particularly when market conditions experience the recent level of volatility. (See “Net Foreign Exchange Gain (Loss)” and Note 4 – Derivative instruments and hedging activities of Notes to Consolidated Financial Statements).
Inventory ManagementThe marketplace for our products dictates that many of our products be shipped very quickly after an order is received. As a result, we are required to maintain significant inventories. Therefore, inventory obsolescence is a risk for us due to frequent engineering changes, shifting customer demand, the emergence of new industry standards and rapid technological advances including the introduction by this itemus or our competitors of products embodying new technology. While we adjust for excess and obsolete inventories and we monitor the valuation of our inventories, there can be no assurance that our valuation adjustments will be sufficient.
Market RiskWe are exposed to a variety of risks, including foreign currency fluctuations and changes in the market value of our investments. In the normal course of business, we employ established policies and procedures to manage our exposure to fluctuations in foreign currency values and changes in the market value of our investments.Cash, Cash Equivalents and Short-Term Investments
At December 31, 2009, we had $289 million in cash, cash equivalents and short-term investments. We maintain cash and cash equivalents with various financial institutions located in many countries throughout the world. Approximately $114 million or 39% of these amounts were held in domestic accounts with various financial institutions and $175 million or 61% was held in accounts outside of the U.S. with various financial institutions. At December 31, 2009, $85 million or 42% of our cash and cash equivalents was held in cash in various operating accounts throughout the world, and $116 million or 58% was held in money market accounts. The most significant of our operating accounts was our domestic operating account which held approximately $22 million or 11% of our total cash and cash equivalents at a bank that carried a A1 rating at December 31, 2009. Our short-term investment balance is incorporatedcomprised of $35 million held in our investment accounts in the U.S. and $52 million held in investment accounts of our foreign subsidiaries.
Short-term debt securities available-for-sale included auction rate securities backed by referenceeducation loan revenue bonds. One of our auction rate securities is from the Vermont Student Assistance Corporation and has a par value of $2.2 million. The other of our auction rate securities is from the New Hampshire Health and Education Facilities Authority and has a par value of $6.4 million. At December 31, 2009, we reported these auction rate securities at their estimated fair market value of $8.2 million as a component of short-term debt securities available for sale. We are also a party to “Item 7—Management’s Discussiona UBS Auction Rate Securities Rights (the “Rights”) agreement. The Rights agreement is a nontransferable right to sell our auction rate securities, at par value, back to UBS at any time during the period June 30, 2010, through July 2, 2012. At December 31, 2009, we reported the Rights agreement at its estimated fair market value of $423,000 as a component of short-term debt securities available for sale. See Note 3 – Fair value measurements in Notes to Consolidated Financial Statements for further discussion of our auction rate securities and Analysisour Rights agreement.
Due to the fact that our Rights agreement has an initial exercise date that is less than one year from now, we are now reporting our auction rate securities and the corresponding Rights agreement as short-term. We continue to have the ability to hold our auction rate securities to their ultimate maturities which are in excess of one year and we have not made a determination as to whether we will exercise our option under the Rights agreement or if we do choose to exercise our option, at what point during the period June 30, 2010 through July 2, 2012, we would exercise our option. We have recorded the unrealized loss related to the auction rate securities and the unrealized gain related to the Rights agreement as a component of other income (expense), in our Consolidated Statements of Income.
We do not anticipate that the auction rate market will provide liquidity for these securities in the foreseeable future. Should we need or desire to access the funds invested in those securities prior to their maturity or prior to our exercise period under the Rights agreement discussed above, we may be unable to find a buyer in a secondary market outside the auction process or if a buyer in a secondary market is found, we would likely realize a loss.
We maintain an investment portfolio of various types of security holdings and maturities. Pursuant to FASB ASC 820, cash equivalents and short-term investments available-for-sale are valued using a market approach (Level 1) based on the quoted market prices of identical instruments when available or other observable inputs such as trading prices of identical instruments in inactive markets. The estimated fair market value of both the auction rate securities and the Rights agreement was determined using significant unobservable inputs (Level 3) as prescribed by FASB ASC 820.
The goal of our investment policy is to manage our investment portfolio to preserve principal and liquidity while maximizing the return on our investment portfolio through the full investment of available funds. We place our cash investments in instruments that meet credit quality standards, as specified in our corporate investment policy guidelines. These guidelines also limit the amount of credit exposure to any one issue, issuer or type of instrument. Other than our auction rate securities discussed above, at December 31, 2009, our cash equivalents and short-term investments carried ratings from the major credit rating agencies that were in accordance with our corporate investment policy. Our investment policy allows investments in the following; government and federal agency obligations, repurchase agreements (“Repos”), certificates of deposit and time deposits, corporate obligations, medium term notes and deposit notes, commercial paper including asset-backed commercial paper (“ABCP”), puttable bonds, general obligation and revenue bonds, money market funds, taxable commercial paper, corporate notes/bonds, municipal notes, municipal obligations, variable rate demand notes and tax exempt commercial paper. All such instruments must carry minimum ratings of A1/P1/F1, MIG1/VMIG1/SP1 and A2/A/A, as applicable, all of which are considered “investment grade”. Our investment policy for marketable securities requires that all securities mature in three years or less, with a weighted average maturity of no longer than 18 months with at least 10% maturing in 90 days or less.
We account for our investments in debt and equity instruments under FASB ASC 320. Our investments are classified as available-for-sale and accordingly are reported at fair value, with unrealized gains and losses reported as other comprehensive income, a component of shareholders’ equity. Unrealized losses are charged against income when a decline in fair value is determined to be other than temporary. Investments with maturities beyond one year are classified as short-term based on their highly liquid nature and because such marketable securities represent the investment of cash that is available for current operations. The fair value of our short-term investments in debt securities at December 31, 2009 and December 31, 2008 was $87 million and $6 million, respectively. The increase was due to the net purchase of $74 million of short-term investments and the transfer of $8.6 related to our auction rate securities and our rights agreement from long-term investments to short-term investments during the year ended December 31, 2009. The net purchase of $74 million of short term investments was done to diversify our holdings from money market accounts to debt securities and to take advantage of higher yields associated with longer maturity debt securities. We follow the guidance provided by FASB ASC 320 to assess whether our investments with unrealized loss positions are other than temporarily impaired. Realized gains and losses and declines in value judged to be other than temporary are determined based on the specific identification method and are reported in other income (expense), net, in our Consolidated Statements of Income.Long-Term Investments
At December 31, 2008, our long-term investments consisted primarily of Aaa/A/AAA rated investments in auction rate securities that we originally purchased for $8.6 million. These auction rate securities consist of education loan revenue bonds. Auction rate securities are variable rate debt instruments whose interest rates are typically reset approximately every 7 to 35 days. At December 31, 2008, we classified these investments as long-term due to the fact that the underlying securities have contractual maturities that are greater than one year. These contractual maturities are also in excess of the guidelines provided for in our corporate investment policy. The auction rate securities are classified as available-for-sale. At December 31, 2008, we reported these long-term investments at their estimated fair market value of $7.0 million. In November 2008, we accepted the Rights agreement offered by UBS as a liquidity alternative to the failed auction process. The Rights agreement is a nontransferable right to sell our auction rate securities, at par value, back to UBS at any time during the period June 30, 2010, through July 2, 2012. At December 31, 2008, we reported the Rights agreement at its estimated fair market value of $1.6 million. At December 31, 2008 he estimated fair market value of both the auction rate securities and the Rights agreement was determined using significant unobservable inputs (Level 3) as prescribed by FASB ASC 820. These auction rate securities and the Rights agreement are now reported as a component of short-term investments as discussed above.
Interest Rate Risk
Investments in both fixed rate and floating rate instruments carry a degree of interest rate risk. Fixed rate securities may have their market value adversely impacted due to an increase in interest rates, while floating rate securities may produce less income than expected if interest rates fall. Due in part to these factors, our future investment income may fall short of expectations due to changes in interest rates or if the decline in fair value of our publicly traded debt investments is judged to be other-than-temporary. We may suffer losses in principal if we are forced to sell securities that have declined in market value due to changes in interest rates. However, because any debt securities we hold are classified as available-for-sale, no gains or losses are realized in the income statement due to changes in interest rates unless such securities are sold prior to maturity or unless declines in value are determined to be other-than-temporary. These securities are reported at fair value with the related unrealized gains and losses included in accumulated other comprehensive income (loss), a component of shareholders’ equity, net of tax.
In a declining interest rate environment, as short-term investments mature, reinvestment occurs at less favorable market rates. Given the short-term nature of certain investments, the current interest rate environment of low or declining rates will likely negatively impact our investment income.
In order to assess the interest rate risk associated with our investment portfolio, we performed a sensitivity analysis to determine the impact a change in interest rates would have on the value of the investment portfolio assuming a 100 basis point parallel shift in the yield curve. Based on our investment positions as of December 31, 2009, a 100 basis point increase or decrease in interest rates across all maturities would result in a $614,000 increase or decrease in the fair market value of the portfolio. As of December 31, 2008, a similar 100 basis point shift in the yield curve would have resulted in a $50,000 increase or decrease in the fair market value of the portfolio. Such losses would only be realized if we sold the investments prior to maturity or if there is a other than temporary impairment.
Actual future gains and losses associated with our investments may differ from the sensitivity analyses performed as of December 31, 2009 due to the inherent limitations associated with predicting the changes in the timing and level of interest rates and our actual exposures and positions.
Economic conditions in 2008 and 2009 had negative effects on the financial markets. In response to these conditions, we shifted a larger percentage of our portfolio to money market funds, U.S. Treasuries and time deposits toward the end of 2008. This had a negative impact on our investment income in 2009. As we noted some stabilization in the financial markets throughout 2009, we made net purchases of $74 million of short-term investments, primarily to diversify our holdings from money market accounts to debt securities and to take advantage of higher yields associated with longer maturity debt securities. However, yields, even at longer maturities, remained at or near historic lows throughout 2009. We cannot predict when interest rates and investment yields will rise. If yields continue to stay at these low levels, our investment income will continue to be negatively impacted.
Exchange Rate RiskOur objective in managing our exposure to foreign currency exchange rate fluctuations is to reduce the impact of adverse fluctuations in such exchange rates on our earnings and cash flow. Accordingly, we utilize purchased foreign currency option and forward contracts to hedge our exposure on anticipated transactions and firm commitments. The principal currencies hedged are the Euro, British pound, Japanese yen and Hungarian forint. We monitor our foreign exchange exposures regularly to help ensure the overall effectiveness of our foreign currency hedge positions. There can be no assurance that our foreign currency hedging activities will substantially offset the impact of fluctuations in currency exchanges rates on our results of operations and financial position. Based on the foreign exchange instruments outstanding at December 31, 2009 and December 31, 2008, an adverse change (defined as 20% in the Asian currencies and 10% in all other currencies) in exchange rates would result in a decline in the aggregate settlement value of all of our instruments outstanding of approximately $22 million and $31 million, respectively. However, as we utilize foreign currency instruments for hedging anticipated and firmly committed transactions, we believe that a loss in settlement value for those instruments will be substantially offset by increases in the value of the underlying exposure. (See Note 4 - Derivative instruments and hedging activities of Notes to Consolidated Financial ConditionStatements for a further description of our derivative instruments and Results of Operations—Market Risk” above.hedging activities).
ITEM 8. FINANCIAL STATEMENTS AND SUPPLEMENTARY DATA
The information required by this item is incorporated by reference to the Consolidated Financial Statements set forth on pages F-1 through F-27 and S-1F-31 hereof.
ITEM 9. CHANGES IN AND DISAGREEMENTS WITH ACCOUNTANTS ON ACCOUNTING AND FINANCIAL DISCLOSURE
There were no disagreements with accountants on accounting and financial disclosure for the year ended December 31, 2006.2009.
ITEM 9A. CONTROLS AND PROCEDURES
Evaluation of Disclosure Controls and Procedures
As of the end of the period covered by this Annual Report on Form 10-K, as required by paragraph (b) of Rule 13a-15 or Rule 15d-15 under the Securities Exchange Act of 1934, as amended, we evaluated under the supervision of our Chief Executive Officer, Dr. James Truchard, and our Chief Financial Officer, the effectivenessAlex Davern, based on their evaluation of our disclosure controls and procedures (as defined in Rules 13a-15(e) orand 15d-15(e) of the Securities Exchange Act of 1934, as amended). Based on this evaluation, our Chief Executive Officer and our Chief Financial Officer, required by paragraph (b) of Rule 13a – 15 or Rule 15d – 15, have concluded that our disclosure controls and procedures arewere effective at the reasonable assurance level, to ensure the timely collection, evaluation and disclosure of information relating to us that information we are requiredwould potentially be subject to disclose in reports that we file or submitdisclosure under the Securities Exchange Act of 1934, (i)as amended, and the rules and regulations promulgated there under, and that such information is recorded, processed, summarized and reported within the time periods specified in Securities and Exchange Commissionthe SEC’s rules and forms,forms. These disclosure controls and (ii)procedures include, without limitation, controls and procedures designed to ensure that information required to be disclosed by us in the reports we file or submit is accumulated and communicated to our management, including our Chief Executive Officer and our Chief Financial Officer, as appropriate to allow timely decisions regarding required disclosure. Our disclosure controls and procedures are designed to provide reasonable assurance that such information is accumulated and communicated to our management. Our disclosure controls and procedures include components of our internal control over financial reporting. Management’s assessment of the effectiveness of our internal controlcontrols over financial reporting is expressed at the level of reasonable assurance because a control system, no matter how well designed and operated, can provide only reasonable, but not absolute assurance that the control system’s objectives will be met. We continue to enhance our internal control over financial reporting in key functional areas with the goal of monitoring our operations at the level of documentation, segregation of duties, and systems security necessary, as well as transactional control procedures required under Auditing Standard No. 5 issued by the Public Company Accounting Oversight Board. We discuss and disclose these matters to the audit committee of our board of directors and to our auditors.
Management Report on Internal Control over Financial Reporting
Our management is responsible for establishing and maintaining adequate internal control over financial reporting to provide reasonable assurance regarding the reliability of our financial reporting and the preparation of financial statements for external purposes in accordance with generally accepted accounting principles. Internal control over financial reporting includes those policies and procedures that (i) pertain to the maintenance of records that in reasonable detail accurately and fairly reflect the transactions and dispositions of the assets of the company, (ii) provide reasonable assurance that transactions are recorded as necessary to permit preparation of financial statements in accordance with generally accepted accounting principles, and that receipts and expenditures of the Company are being made only in accordance with authorizations of management and directors of the Company; and (iii) provide reasonable assurance regarding prevention or timely detection of unauthorized acquisition, use or disposition of the Company’s assets that could have a material effect on the financial statements.
Management assessed our internal control over financial reporting as of December 31, 2006,2009, which was the end of our fiscal year. Management based its assessment on criteria established in Internal Control – Integrated Framework issued by the Committee of Sponsoring Organizations of the Treadway Commission. Management’s assessment included evaluation of such elements as the design and operating effectiveness of key financial reporting controls, process documentation, accounting policies, and our overall control environment. This assessment is supported by testing and monitoring performed by our finance organization.
Based on our assessment, management has concluded that our internal control over financial reporting was effective as of the end of the fiscal year to provide reasonable assurance regarding the reliability of financial reporting and the preparation of financial statements for external reporting purposes in accordance with generally accepted accounting principles. We reviewed the results of management’s assessment with the Audit Committee of our Board of Directors.
Our independent registered public accounting firm, Ernst & Young LLP, who also audited our consolidated financial statements, audited management’s assessment and independently assessed the effectiveness of our internal control over financial reporting. Ernst & Young LLP has issued their attestation report, which is included in Part II, Item 8 of this Form 10-K.
Changes in Internal Control over Financial Reporting
During the three months ended December 31, 2006,2009, there was no change in our internal control over financial reporting identified in connection with the evaluation required by paragraph (d) of Rule 13a-15 or Rule 15d-15 that has materially affected, or is reasonably likely to materially affect, our internal control over financial reporting.
ITEM 9B. OTHER INFORMATION
None.
PART III
Certain information required by Part III is omitted from this Report in that we intend to file a definitive proxy statement pursuant to Regulation 14A with the Securities and Exchange Commission (the “Proxy Statement”) relating to our annual meeting of stockholders not later than 120 days after the end of the fiscal year covered by this Report, and such information is incorporated by reference herein.
ITEM 10. DIRECTORS, EXECUTIVE OFFICERS AND CORPORATE GOVERNANCE
The information concerning our directors required by this Item pursuant to Item 401 of Regulation S-K will appear in our Proxy Statement under the section “Election of Directors” and such information is incorporated herein by reference.
The information concerning our executive officers required by this Item pursuant to Item 401 of Regulation S-K will appear in our Proxy Statement under the section “Executive Officers” and such information is incorporated herein by reference.
The information required by this Item pursuant to Item 405 of Regulation S-K regarding compliance with Section 16(a) of the Securities Exchange Act of 1934, as amended, will appear in our Proxy Statement under the section “Section 16(a) Beneficial Ownership Reporting Compliance” and such information is incorporated herein by reference.
The information concerning our code of ethics that applies to our principal executive officer, our principal financial officer, our controller or person performing similar functions required by this Item pursuant to Item 406 of Regulation S-K will appear in our Proxy Statement under the section “Code of Ethics” and such information is incorporated herein by reference.
The information required by this Item pursuant to Item 407(c)(3) of Regulation S-K regarding material changes, if any, to procedures by which security holders may recommend nominees to our board of directors will appear in our Proxy Statement under the section “Deadline for Receipt of Stockholder Proposals” and such information is incorporated herein by reference.
The information required by this Item pursuant to Item 407(d)(4) and Item 407(d)(5) of Regulation S-K regarding our Audit Committee and our audit committee financial expert(s), respectively, will appear in our Proxy Statement under the heading “Corporate Governance” and such information is incorporated herein by reference.
ITEM 11. EXECUTIVE COMPENSATION
The information required by this Item pursuant to Item 402 of Regulation S-K regarding director compensation will appear in our Proxy Statement under the section “Board Compensation” and such information is incorporated herein by reference.
The information required by this Item pursuant to Item 402 of Regulation S-K regarding executive officer compensation, including our Compensation Discussion & Analysis, will appear in our Proxy Statement under the section “Executive Compensation” and such information is incorporated herein by reference.
The information required by this Item pursuant to Item 407(e)(4) of Regulation S-K will appear in our Proxy Statement under the section “Compensation Committee Interlocks and Insider Participation” and such information is incorporated herein by reference.
The information required by this Item pursuant to Item 407(e)(5) will appear in our Proxy Statement under the section “Compensation Committee Report” and such information is incorporated herein by reference.
ITEM 12. SECURITY OWNERSHIP OF CERTAIN BENEFICIAL OWNERS AND MANAGEMENT AND RELATED STOCKHOLDER MATTERS
From time to time our directors, executive officers and other insiders may adopt stock trading plans pursuant to Rule 10b5-1(c) promulgated by the Securities and Exchange Commission under the Securities Exchange Act of 1934, as amended. Jeffrey L. Kodosky and James J. Truchard have made periodic sales of our stock pursuant to such plans.
The information required by this Item pursuant to Item 403 of Regulation S-K concerning security ownership of certain beneficial owners and management will appear in our Proxy Statement under the section “Security Ownership” and such information is incorporated herein by reference.
The information required by this Item pursuant to Item 201(d) of Regulation S-K concerning securities authorized for issuance under equity compensation plans will appear in our Proxy Statement under the section “Equity Compensation Plans Information” and such information is incorporated herein by reference.
ITEM 13. CERTAIN RELATIONSHIPS AND RELATED TRANSACTIONS AND DIRECTOR INDEPENDENCE During 2002, we irrevocably contributed approximately $3.6 million to the National Instruments Foundation, a 501(c)(3) charitable foundation established in 2002 for the purpose of continued promotion of scientific and engineering research and education at higher education institutions worldwide. Two of the four directors of the National Instruments Foundation are current officers of National Instruments.
In addition, the information required by this Item pursuant to Item 404 of Regulation S-K will appear in our Proxy Statement under the section “Certain Relationships and Related Transactions” and such information is incorporated herein by reference.
The information required by this Item pursuant to Item 407(a) of Regulation S-K regarding the independence of our directors will appear in our Proxy Statement under the section “Corporate Governance” and such information is incorporated herein by reference.
ITEM 14. PRINCIPAL ACCOUNTING FEES AND SERVICES
The information concerning principal accountant fees and services required by this Item is incorporated by reference to our Proxy Statement under the heading “Independent Public Accountants.”
The information concerning pre-approval policies for audit and non-audit services required by this Item is incorporated by reference to our Proxy Statement under the heading “Audit Committee Pre-Approval of Audit and Permissible Non-Audit Services of Independent Auditors.”
PART IV
ITEM 15. EXHIBITS AND FINANCIAL STATEMENT SCHEDULES
(a) Documents FilesFiled with Report
1. Financial Statements.
2. Financial Statement Schedules.
None
3. Exhibits.
ExhibitNumber Description 3.1(2) Certificate of Incorporation, as amended, of the Company. 3.2(11) Amended and Restated Bylaws of the Company. 3.3(4) Certificate of Designation of Rights, Preferences and Privileges of Series A Participating Preferred Stock of the Company. 4.1(1) Specimen of Common Stock certificate of the Company. 4.2(3) Rights Agreement dated as of January 21, 2004, between the Company and EquiServe Trust Company, N.A. 10.1(1) Form of Indemnification Agreement. 10.2(5) 1994 Incentive Plan, as amended.* 10.3(9) 1994 Employee Stock Purchase Plan.* 10.5(7) 2005 Incentive Plan.* 10.6(8) National Instruments Corporation Annual Incentive Program.* 10.7(6) National Instruments Corporation Annual Incentive Program, as amended.* 10.8(10) Form of Restricted Stock Unit Award Agreement (Non-Employee Director).* 10.9(10) Form of Restricted Stock Unit Award Agreement (Performance Vesting).* 10.10(10) Form of Restricted Stock Unit Award Agreement (Current Employee).* 10.11(10) Form of Restricted Stock Unit Award Agreement (Newly Hired Employee).* 21.1 Subsidiaries of the Company. 23.1 Consent of Independent Registered Public Accounting Firm F-4Firm.Consolidated Balance SheetsF-5Consolidated Statements of IncomeF-6Consolidated Statements of Cash FlowsF-7Consolidated Statements of Stockholders' EquityF-8Notes to Consolidated Financial StatementsF-9
2.
Financial Statements Schedules.
See Schedule II - Valuation and Qualifying Accounts at page S-1
3.
Exhibits.
Exhibit
NumberDescription
3.1
(2)
Certificate of Incorporation, as amended, of the Company.
3.2
(2)
Amended and Restated Bylaws of the Company.
3.3
(4)
Certificate of Designation of Rights, Preferences and Privileges of Series A Participating Preferred Stock of the Company.
4.1
(1)
Specimen of Common Stock certificate of the Company.
4.2
(3)
Rights Agreement dated as of January 21, 2004, between the Company and EquiServe Trust Company, N.A.
10.1
(1)
Form of Indemnification Agreement.
10.2
(5)
1994 Incentive Plan, as amended.*
10.3
1994 Employee Stock Purchase Plan.*
10.4
(6)
Long-Term Incentive Program.*
10.5
(7)
2005 Incentive Plan.*
10.6
(8)
National Instruments Corporation Annual Incentive Program.*
10.7
(9)
2006 Annual Incentive Program Goals and Awards for the Named Executive Officers.*
10.8
(10)
Form of Restricted Stock Unit Award Agreement (Non-Employee Director).*
10.9
(10)
Form of Restricted Stock Unit Award Agreement (Performance Vesting).*
10.10
(10)
Form of Restricted Stock Unit Award Agreement (Current Employee).*
10.11
(10)
Form of Restricted Stock Unit Award Agreement (Newly Hired Employee).*
21.1
Subsidiaries of the Company.
23.1
Consent of Independent Registered Public Accounting Firm.
23.2
Consent of Independent Registered Public Accounting Firm.
24.0
Power of Attorney (included on page 33).
31.1
Certification of Chief Executive Officer Pursuant to 18 U.S.C. Section 1350, as Adopted Pursuant to Section 302 of the Sarbanes-Oxley Act of 2002.
31.2
Certification of Chief Financial Officer Pursuant to 18 U.S.C. Section 1350, as Adopted Pursuant to Section 302 of the Sarbanes-Oxley Act of 2002.
32.1
Certification of Chief Executive Officer and Chief Financial Officer Pursuant to 18 U.S.C. Section 1350, as Adopted Pursuant to Section 906 of the Sarbanes-Oxley Act of 2002.
24.0 Power of Attorney (included on page 41). 31.1 Certification of Chief Executive Officer Pursuant to 18 U.S.C. Section 1350, as Adopted Pursuant to Section 302 of the Sarbanes-Oxley Act of 2002. 31.2 Certification of Chief Financial Officer Pursuant to 18 U.S.C. Section 1350, as Adopted Pursuant to Section 302 of the Sarbanes-Oxley Act of 2002. 32.1 Certification of Chief Executive Officer and Chief Financial Officer Pursuant to 18 U.S.C. Section 1350, as Adopted Pursuant to Section 906 of the Sarbanes-Oxley Act of 2002.
(1) Incorporated by reference to the Company's Registration Statement on Form S-1 (Reg. No. 33-88386) declared effective March 13, 1995.
(2) Incorporated by reference to the same-numbered exhibit filed with the Company's Annual Report on Form 10-K for the fiscal year ended December 31, 2003.
(3) Incorporated by reference to exhibit 4.1 filed with the Company's currentCurrent Report on Form 8-K filed on January 28, 2004.
(4) Incorporated by reference to the same-numbered exhibit filed with the Company's Form 8-K on April 27, 2004.
(5) Incorporated by reference to the same-numbered exhibit filed with the Company's Form 10-Q on August 5, 2004.
(6) Incorporated by reference to exhibit 99.2 filed with the Company's Current Report on Form 8-K filed on October 28, 2008. (7) Incorporated by reference to exhibit A of the Company's Proxy Statement dated and filed on April 4, 2005. (8) Incorporated by reference to exhibit 99.2 filed with the Company's Current Report on Form 8-K filed on October 22, 2008. (9) Incorporated by reference to exhibit 10.3 filed with the Company's Annual Report on Form 10-K for the fiscal year ended December 31, 2006. (10) Incorporated by reference to the same-numbered exhibit filed with the Company's Form 10-Q on August 2, 2006. (11) Incorporated by reference to the same-numbered exhibit filed with the Company's Annual Report on Form 10-K for the fiscal year ended December 31, 2004.2007.
(7)Incorporated by reference to exhibit A of the Company's Proxy Statement dated and filed on April 4, 2005.
(8)Incorporated by reference to the exhibit 10.1 filed with the Company's Current Report on Form 8-K filed June 27, 2006.
(9)Incorporated by reference to the exhibit 10.2 filed with the Company's Current Report on Form 8-K filed June 27, 2006.
(10)Incorporated by reference to the same-numbered exhibit filed with the Company's Form 10-Q filed on August 2, 2006.
* Management Contract or Compensatory Plan or Arrangement.
(b) Exhibits
See Item 15(a)(3) above.
(c) Financial Statement Schedules
See Item 15(a)(2) above.
SIGNATURES
Pursuant to the requirements of Section 13 or 15(d) of the Securities Exchange Act of 1934, the registrant has duly caused this report to be signed on its behalf by the undersigned thereunto duly authorized.Registrant Registrant
NATIONAL INSTRUMENTS CORPORATION
February 20, 200717, 2010
BY: By:
/s/ Dr. James J. TruchardDr. James J. Truchard
Chairman of the Board and President
POWER OF ATTORNEY
KNOW ALL PERSONS BY THESE PRESENTS, that each person whose signature appears below constitutes and appoints Dr. James J. Truchard and Alexander M. Davern, jointly and severally, his or her attorneys-in-fact, each with the power of substitution, for him or her in any and all capacities, to sign any amendments to this Report on Form 10-K, and to file the same, with exhibits thereto and other documents in connection therewith, with the Securities and Exchange Commission, hereby ratifying and conformingconfirming all that each of said attorneys-in-fact, or his substitute or substitutes, may do or cause to be done by virtue hereof.
Pursuant to the requirements of the Securities Exchange Act of 1934, this report has been signed below by the following persons on behalf of the registrant and in the capacities and on the dates indicated.Signature
Capacity in Which Signed
Date
/s/ Dr. James J. Truchard
Chairman of the Board and President(Principal Executive Officer) February 17, 2010 Dr. James J. Truchard
Chairman of the Board and
President (Principal Executive Officer)
February 20, 2007
/s/ Alex M. Davern
Chief Financial Officer and Treasurer(Principal Financial and Accounting Officer) February 17, 2010 Alex M. Davern
Chief Financial Officer
and Treasurer (Principal Financial
and Accounting Officer)
February 20, 2007
/s/ Jeffrey L. Kodosky
Director February 17, 2010 Jeffrey L. Kodosky
Director
February 16, 2007
/s/ Dr. Donald M. Carlton
Director February 17, 2010 Dr. Donald M. Carlton
Director
February 16, 2007
/s/ Dr. Ben G. Streetman
Dr. Ben G. Streetman
Director
February 16, 2007
/s/ R. Gary Daniels
R. Gary Daniels
Director
February 16, 2007
/s/ Charles J. Roesslein
Director February 17, 2010 Charles J. Roesslein
Director
February 16, 2007
/s/ Duy-Loan T. Le
Director February 17, 2010 Duy-Loan T. Le
/s/ John Medica Director
February 16, 200717, 2010 John Medica
NATIONAL INSTRUMENTS CORPORATION
INDEX TO FINANCIAL STATEMENTS
Page No. Financial Statements: Page No.Report of Independent Registered Public Accounting FirmF-2Report of Independent Registered Public Accounting Firm on Internal Control over Financial Reporting F-3F-2 Report of Independent Registered Public Accounting Firm F-4F-3 Consolidated Balance Sheets as of December 31, 20062009 and 20052008 F-5F-4 Consolidated Statements of Income for each of the Three Years in the period Ended December 31, 20062009 F-6F-5 Consolidated Statements of Cash Flows for each of the Three Years in the period Ended December 31, 20062009 F-7F-6 Consolidated Statements of Stockholders' Equity for each of the Three Years in the period Ended December 31, 20062009 F-8F-7 Notes to Consolidated Financial Statements F-9F-8
Financial Statement Schedules:For each of the Three Years in the period Ended December 31, 2006 Schedule II--Valuation and Qualifying AccountsS-1
All other schedules are omitted because they are not applicable.
The Board of Directors and Shareholders of National Instruments Corporation:
We have audited the accompanying consolidated balance sheets of National Instruments Corporation and subsidiaries as of December 31, 20062009 and 20052008, and the related consolidated statements of income, stockholders’stockholders' equity, and cash flows for each of the twothree fiscal years in the period ended December 31, 2006. Our audits also included the financial statement schedule listed in the Index at Item 15.2009. These financial statements and schedule are the responsibility of the Company’sCompany's management. Our responsibility is to express an opinion on these financial statements and schedule based on our audits.
We conducted our audits in accordance with the standards of the Public Company Accounting Oversight Board (United States). Those standards require that we plan and perform the audit to obtain reasonable assurance about whether the financial statements are free of material misstatement. An audit includes examining, on a test basis, evidence supporting the amounts and disclosures in the financial statements. An audit also includes assessing the accounting principles used and significant estimates made by management, as well as evaluating the overall financial statement presentation. We believe that our audits provide a reasonable basis for our opinion.
In our opinion, the financial statements referred to above present fairly, in all material respects, the consolidated financial position of National Instruments Corporation and subsidiaries at December 31, 20062009 and 20052008, and the consolidated results of their operations and their cash flows for each of the twothree fiscal years in the period ended December 31, 2006,2009, in conformity with U.S. generally accepted accounting principles. Also, in our opinion, the related financial statement schedule, when considered in relation to the basic financial statements taken as a whole, presents fairly in all material respects the information set forth therein.As discussed in Note 1 to the consolidated financial statements, effective January 1, 2006, the Company changed its method of accounting for stock-based compensation to conform to Statement of Financial Accounting Standards No. 123(R), Share-Based Payment.
We also have audited, in accordance with the standards of the Public Company Accounting Oversight Board (United States), the effectiveness of National Instruments Corporation’sCorporation internal control over financial reporting as of December 31, 2006,2009, based on criteria established in Internal Control-Integrated Framework issued by the Committee of Sponsoring Organizations of the Treadway Commission and our report dated February 15, 200717, 2010 expressed an unqualified opinion thereon./s/ Ernst & Young LLP
Austin, Texas
February 15, 2007
/s/ Ernst & Young LLP
Austin, TexasFebruary 17, 2010
Report of Independent Registered Public Accounting Firm on Internal Control over Financial Reporting
The Board of Directors and Shareholders of National Instruments Corporation:
We have audited management’s assessment, included in the Management’s Report on Internal Control over Financial Reporting, that National Instruments Corporation maintained effectiveCorporation’s internal control over financial reporting as of December 31, 2006,2009, based on criteria established in Internal Control—Integrated Framework issued by the Committee of Sponsoring Organizations of the Treadway Commission (the COSO criteria). National Instruments Corporation’s management is responsible for maintaining effective internal control over financial reporting, and for its assessment of the effectiveness of internal control over financial reporting.reporting included in the accompanying Management Report on Internal Control over Financial Reporting. Our responsibility is to express an opinion on management’s assessment and an opinion on the effectiveness of the company’s internal control over financial reporting based on our audit.
We conducted our audit in accordance with the standards of the Public Company Accounting Oversight Board (United States). Those standards require that we plan and perform the audit to obtain reasonable assurance about whether effective internal control over financial reporting was maintained in all material respects. Our audit included obtaining an understanding of internal control over financial reporting, evaluating management’s assessment,assessing the risk that a material weakness exists, testing and evaluating the design and operating effectiveness of internal control based on the assessed risk, and performing such other procedures as we considered necessary in the circumstances. We believe that our audit provides a reasonable basis for our opinion.
A company’s internal control over financial reporting is a process designed to provide reasonable assurance regarding the reliability of financial reporting and the preparation of financial statements for external purposes in accordance with generally accepted accounting principles. A company’s internal control over financial reporting includes those policies and procedures that (1) pertain to the maintenance of records that, in reasonable detail, accurately and fairly reflect the transactions and dispositions of the assets of the company; (2) provide reasonable assurance that transactions are recorded as necessary to permit preparation of financial statements in accordance with generally accepted accounting principles, and that receipts and expenditures of the company are being made only in accordance with authorizations of management and directors of the company; and (3) provide reasonable assurance regarding prevention or timely detection of unauthorized acquisition, use or disposition of the company’s assets that could have a material effect on the financial statements.
Because of its inherent limitations, internal control over financial reporting may not prevent or detect misstatements. Also, projections of any evaluation of effectiveness to future periods are subject to the risk that controls may become inadequate because of changes in conditions, or that the degree of compliance with the policies or procedures may deteriorate.
In our opinion, management’s assessment that National Instruments Corporation maintained effective internal control over financial reporting as of December 31, 2006, is fairly stated, in all material respects, based on the COSO criteria. Also, in our opinion, National Instruments Corporation maintained, in all material respects, effective internal control over financial reporting as of December 31, 2006,2009, based on the COSO criteria.
We also have audited, in accordance with the standards of the Public Company Accounting Oversight Board (United States), the consolidated balance sheets of National Instruments Corporation as of December 31, 20062009 and 2005,2008, and the related consolidated statements of income, stockholders’ equity, and cash flows for each of the twothree years in the period ended December 31, 2006 of National Instruments Corporation2009 and our report dated February 15, 200717, 2010 expressed an unqualified opinion thereon./s/ Ernst & Young LLP
Austin, Texas
February 15, 2007
/s/ Ernst & Young LLP
Austin, TexasFebruary 17, 2010
Report of Independent Registered Public Accounting Firm
To the Board of Directors and Stockholders of National Instruments Corporation:
In our opinion, the consolidated statements of income, of stockholders’ equity and of cash flows (appearing on pages F-6 through F-8 of this National Instruments Corporation 2006 Annual Report on Form 10-K) for the year ended December 31, 2004 present fairly, in all material respects, the results of operations and cash flows of National Instruments Corporation and its subsidiaries for the year ended December 31, 2004, in conformity with accounting principles generally accepted in the United States of America. In addition, in our opinion, the financial statement schedule for the year ended December 31, 2004 presents fairly, in all material respects, the information set forth therein when read in conjunction with the related consolidated financial statements. These financial statements and financial statement schedule are the responsibility of the Company’s management. Our responsibility is to express an opinion on these financial statements and financial statement schedule based on our audit. We conducted our audit of these statements in accordance with the standards of the Public Company Accounting Oversight Board (United States). Those standards require that we plan and perform the audit to obtain reasonable assurance about whether the financial statements are free of material misstatement. An audit includes examining, on a test basis, evidence supporting the amounts and disclosures in the financial statements, assessing the accounting principles used and significant estimates made by management, and evaluating the overall financial statement presentation. We believe that our audit provides a reasonable basis for our opinion.
/s/ PricewaterhouseCoopers LLP
Austin, Texas
March 4, 2005
NATIONAL INSTRUMENTS CORPORATION
(in thousands, except share data)December 31,
2006
2005
Assets
Current assets: Cash and cash equivalents $ 100,287 $ 55,864 Short-term investments 150,190 119,846 Accounts receivable, net 117,235 95,733 Inventories, net 77,138 62,827 Prepaid expenses and other current assets 11,393 13,146 Deferred income taxes, net 20,851 14,890
Total current assets 477,094 362,306 Property and equipment, net 145,425 144,330 Goodwill, net 53,343 52,533 Intangible assets, net 40,065 43,602 Other long-term assets 5,293 5,565
Total assets $ 721,220 $ 608,336
Liabilities and Stockholders' Equity
Current liabilities: Accounts payable $ 32,001 $ 30,832 Accrued compensation 20,912 18,084 Deferred revenue 22,208 16,018 Accrued expenses and other liabilities 15,934 8,838 Other taxes payable 11,527 13,848
Total current liabilities 102,582 87,620 Deferred income taxes 21,956 16,866
Total liabilities 124,538 104,486
Commitments and contingencies Stockholders' equity: Preferred stock: par value $0.01; 5,000,000 shares authorized; none issued and outstanding — — Common stock: par value $0.01; 180,000,000 shares authorized; 79,883,837 and 79,276,086 shares issued and outstanding, respectively 799 793 Additional paid-in capital 109,851 91,430 Deferred stock-based compensation — (16,547 ) Retained earnings 483,533 429,859 Accumulated other comprehensive income (loss) 2,499 (1,685 )
Total stockholders' equity 596,682 503,850
Total liabilities and stockholders' equity $ 721,220 $ 608,336
December 31, 2009 2008 Assets Current assets: Cash and cash equivalents $ 201,465 $ 229,400 Short-term investments 87,196 6,220 Accounts receivable, net 103,957 121,548 Inventories, net 86,515 107,358 Prepaid expenses and other current assets 36,523 43,062 Deferred income taxes, net 16,522 21,435 Total current assets 532,178 529,023 Long-term investments — 10,500 Property and equipment, net 153,265 154,477 Goodwill, net 64,779 64,561 Intangible assets, net 43,390 41,915 Other long-term assets 19,417 32,115 Total assets $ 813,029 $ 832,591 Liabilities and Stockholders’ Equity Current liabilities: Accounts payable $ 23,502 $ 30,876 Accrued compensation 14,934 22,012 Deferred revenue 57,242 45,514 Accrued expenses and other liabilities 8,560 18,848 Other taxes payable 14,181 13,481 Total current liabilities 118,419 130,731 Deferred income taxes 25,012 25,157 Liability for uncertain tax positions 11,062 9,364 Other long-term liabilities 4,116 2,901 Total liabilities 158,609 168,153 Commitments and contingencies Stockholders’ equity: Preferred stock: par value $0.01; 5,000,000 shares authorized; none issued and outstanding — — Common stock: par value $0.01; 180,000,000 shares authorized;77,367,874 and 77,193,063 shares issued and outstanding, respectively 774 772 Additional paid-in capital 336,446 300,352 Retained earnings 303,655 352,831 Accumulated other comprehensive income 13,545 10,483 Total stockholders’ equity 654,420 664,438 Total liabilities and stockholders’ equity $ 813,029 $ 832,591
The accompanying notes are an integral part of these financial statements.
NATIONAL INSTRUMENTS CORPORATION
(in thousands, except per share data)For the Years Ended December 31,
2006
2005
2004
Net sales $ 660,407 $ 571,841 $ 514,088 Cost of sales (1) 170,326 149,309 135,473
Gross profit 490,081 422,532 378,615
Operating expenses: Sales and marketing (2) 235,072 211,280 188,727 Research and development (3) 113,095 87,841 84,692 General and administrative (4) 54,192 45,199 42,500
Total operating expenses 402,359 344,320 315,919
Operating income 87,722 78,212 62,696
Other income (expense): Interest income 6,847 3,758 2,905 Net foreign exchange gain (loss) 740 (1,566 ) 1,287 Other income (expense), net (7 ) 276 (2,075 )
Income before income taxes 95,302 80,680 64,813 Provision for income taxes (5) 22,594 19,163 16,203
Net income $ 72,708 $ 61,517 $ 48,610
Basic earnings per share $ 0.91 $ 0.78 $ 0.62
Weighted average shares outstanding - basic 79,519 78,552 78,680
Diluted earnings per share $ 0.89 $ 0.76 $ 0.59
Weighted average shares outstanding - diluted 81,519 80,910 82,096
Dividends declared per share $ 0.24 $ 0.20 $ 0.18
The following footnotes apply to the years ended December 31, 2006, 2005 and 2004:
(1)including $598, $101 and $0, respectively, of non-cash stock compensation.(2)including $6,008, $500 and $0, respectively, of non-cash stock compensation.(3)including $5,201, $598 and $0, respectively, of non-cash stock compensation.(4)including $2,333, $345 and $0, respectively, of non-cash stock compensation.(5)including $2,403, $364 and $0, respectively, of benefit from non-cash stock compensation.
For the YearsEnded December 31, 2009 2008 2007 Net sales: Product $ 623,736 $ 765,441 $ 701,589 Software maintenance 52,858 55,096 38,789 Total net sales 676,594 820,537 740,378 Cost of sales: Product 164,700 201,064 180,556 Software maintenance 5,184 6,045 4,711 Total cost of sales 169,884 207,109 185,267 Gross profit 506,710 613,428 555,111 Operating expenses: Sales and marketing 269,267 307,409 264,060 Research and development 132,974 143,140 126,515 General and administrative 57,938 67,162 62,445 Total operating expenses 460,179 517,711 453,020 Operating income 46,531 95,717 102,091 Other income (expense): Interest income 1,629 5,996 9,822 Net foreign exchange gain (loss) 734 (3,737 ) 1,672 Other income (expense), net 1,351 161 (158 ) Income before income taxes 50,245 98,137 113,427 Provision for income taxes 33,160 13,310 6,394 Net income $ 17,085 $ 84,827 $ 107,033 Basic earnings per share $ 0.22 $ 1.08 $ 1.35 Weighted average shares outstanding - basic 77,520 78,567 79,468 Diluted earnings per share $ 0.22 $ 1.07 $ 1.32 Weighted average shares outstanding – diluted �� 78,026 79,515 81,043 Dividends declared per share $ 0.48 $ 0.44 $ 0.34
The accompanying notes are an integral part of these financial statements.
NATIONAL INSTRUMENTS CORPORATION
(in thousands)For the Years Ended December 31,
2006
2005
2004
Cash flow from operating activities: Net income $ 72,708 $ 61,517 $ 48,610 Adjustments to reconcile net income to net cash provided by operating activities: Depreciation and amortization 34,181 28,553 25,592 Stock-based compensation 14,507 1,545 — Impairment of cost method investment — — 2,500 Gain on sale of subsidiary — — (242 ) Provision for (benefit from) deferred income taxes (339 ) 3,219 (825 ) Tax benefit from stock option plans (4,271 ) 675 3,071 Changes in operating assets and liabilities: Accounts receivable (21,502 ) (4,080 ) (9,342 ) Inventories (14,311 ) (4,572 ) (15,230 ) Prepaid expenses and other assets 2,116 (2,177 ) 4,624 Accounts payable 1,169 4,647 (4,359 ) Deferred revenue 6,190 3,847 3,385 Taxes and other liabilities 7,443 (5,124 ) 7,848
Net cash provided by operating activities 97,891 88,050 65,632
Cash flow from investing activities: Proceeds from sale of subsidiary — — 680 Acquisitions, net of cash received — (63,891 ) — Capital expenditures (18,503 ) (15,383 ) (12,596 ) Capitalization of internally developed software (7,370 ) (13,380 ) (5,007 ) Additions to other intangibles (3,115 ) (4,288 ) (3,050 ) Purchases of short-term investments (244,238 ) (124,227 ) (125,954 ) Sales and maturities of short-term investments 213,894 154,773 116,789
Net cash used in investing activities (59,332 ) (66,396 ) (29,138 )
Cash flow from financing activities: Proceeds from issuance of common stock 37,146 23,222 16,826 Repurchase of common stock (16,519 ) (49,452 ) (16,064 ) Dividends paid (19,034 ) (15,776 ) (14,486 ) Tax benefit from stock option plans 4,271 — —
Net cash provided by (used in) financing activities 5,864 (42,006 ) (13,724 )
Net change in cash and cash equivalents 44,423 (20,352 ) 22,770 Cash and cash equivalents at beginning of period 55,864 76,216 53,446
Cash and cash equivalents at end of period $ 100,287 $ 55,864 $ 76,216
Cash paid for interest and income taxes Interest $ 41 $ 17 $ 31 Income taxes $ 9,827 $ 15,117 $ 10,622
For the Years Ended December 31, 2009 2008 2007 Cash flow from operating activities: Net income $ 17,085 $ 84,827 $ 107,033 Adjustments to reconcile net income to net cash provided by operating activities: Depreciation and amortization 38,365 37,103 36,605 Stock-based compensation 20,299 19,854 17,754 Tax expense/(benefit from) deferred income taxes 17,196 (4,475 ) (16,954 ) Tax expense/(benefit from) stock option plans 1,450 (1,213 ) (2,964 ) Changes in operating assets and liabilities: Accounts receivable 17,591 12,159 (14,047 ) Inventories 20,843 (24,578 ) (5,537 ) Prepaid expenses and other assets 12,740 (10,340 ) (12,330 ) Accounts payable (7,374 ) (5,648 ) 4,186 Deferred revenue 11,728 9,423 13,883 Taxes and other liabilities (14,272 ) 4,706 19,743 Net cash provided by operating activities 135,651 121,818 147,372 Cash flow from investing activities: Acquisitions, net of cash received — (17,310 ) — Capital expenditures (20,847 ) (25,771 ) (24,864 ) Capitalization of internally developed software (12,583 ) (9,487 ) (8,263 ) Additions to other intangibles (4,602 ) (3,010 ) (6,447 ) Purchases of short-term investments (93,087 ) (9,061 ) (87,586 ) Sales and maturities of short-term investments 19,204 86,179 143,938 Purchases of foreign currency option contracts — (2,784 ) (2,242 ) Net cash provided by (used in) investing activities (111,915 ) 18,756 14,536 Cash flow from financing activities: Proceeds from issuance of common stock 21,672 31,150 36,460 Repurchase of common stock (34,585 ) (103,641 ) (79,728 ) Dividends paid (37,308 ) (34,735 ) (27,052 ) Tax (expense)/benefit from stock option plans (1,450 ) 1,213 2,964 Net cash (used in) financing activities (51,671 ) (106,013 ) (67,356 ) Net change in cash and cash equivalents (27,935 ) 34,561 94,552 Cash and cash equivalents at beginning of period 229,400 194,839 100,287 Cash and cash equivalents at end of period $ 201,465 $ 229,400 $ 194,839 Cash paid for interest and income taxes: Interest $ 23 $ 116 $ 159 Income taxes $ 14,608 $ 17,214 $ 21,147
The accompanying notes are an integral part of these financial statements.
NATIONAL INSTRUMENTS CORPORATION
(in thousands, except share data)Common
Stock
Shares
Common
Stock
Amount
Additional
Paid-In
Capital
Deferred
Compensation
Retained
Earnings
Accumulated
Other
Comprehensive
Income/(Loss)
Total
Stockholders'
Equity
Balance at December 31, 2003 78,269,235 $ 783 $ 95,070 $ — $ 349,994 $ (6,395 ) $ 439,452 Net income 48,610 48,610 Foreign currency translation adjustment (net of $1,013 tax expense) 3,050 3,050 Unrealized loss on securities available for sale (net of $0 tax benefit) (417 ) (417 ) Unrealized gain on derivative instruments (net of $2,136 tax expense) 6,407 6,407
Total comprehensive income 57,650
Issuance of common stock under employee plans, including tax benefits 1,234,195 12 19,885 19,897 Repurchase and retirement of common stock (557,850 ) (6 ) (16,058 ) (16,064 ) Dividends declared (14,486 ) (14,486 )
Balance at December 31, 2004 78,945,580 $ 789 $ 98,897 $ — $ 384,118 $ 2,645 $ 486,449 Net income 61,517 61,517 Foreign currency translation adjustment(net of $1,636 tax benefit) (5,181 ) (5,181 ) Unrealized gain on securities available for sale (net of $0 tax expense) 50 50 Unrealized gain on derivative instruments (net of $253 tax expense) 801 801
Total comprehensive income 57,187
Net activity related to restricted stock units 813,305 8 18,084 (16,547 ) 1,545 Issuance of common stock under employee plans, including tax benefits 1,573,547 16 23,206 23,222 Repurchase and retirement of common stock (2,056,346 ) (20 ) (49,432 ) (49,452 ) Dividends declared (15,776 ) (15,776 ) Disqualified dispositions 675 675
Balance at December 31, 2005 79,276,086 $ 793 $ 91,430 ($ 16,547 ) $ 429,859 ($ 1,685 ) $ 503,850 Net income 72,708 72,708 Foreign currency translation adjustment (net of $1,434 tax expense) 4,542 4,542 Unrealized gain on securities available for sale (net of $0 tax expense) 78 78 Unrealized loss on derivative instruments (net of $138 tax benefit) (436 ) (436 )
Total comprehensive income 76,892
Issuance of common stock under employee plans, including tax benefits 1,915,172 19 37,127 37,146 Stock-based compensation under
restricted stock plan 113,794 1 5,082 5,083 Stock-based compensation under stock
option and employee stock purchase plans 9,424 9,424 Repurchase and retirement of common stock (607,910 ) (6 ) (16,513 ) (16,519 ) Effect of adoption of SFAS 123R (813,305 ) (8 ) (16,539 ) 16,547 — Dividends declared (19,034 ) (19,034 ) Disqualified dispositions (160 ) (160 )
Balance at December 31, 2006 $ 79,883,837 $ 799 $ 109,851 $ — $ 483,533 $ 2,499 $ 596,682
CommonStockShares CommonStockAmount AdditionalPaid-InCapital DeferredCompensation RetainedEarnings AccumulatedOtherComprehensiveIncome/(Loss) TotalStockholders’Equity Balance at December 31, 2006 79,883,837 $ 799 $ 207,808 $ — $ 385,480 $ 2,499 $ 596,586 Net income 107,033 107,033 Foreign currency translation adjustment(net of $286 tax expense) 4,483 4,483 Unrealized gain on securities available-for-sale(net of $13 tax expense) 200 200 Unrealized loss on derivative instruments(net of $7 tax benefit) (117 ) (117 ) Total comprehensive income 111,599 Issuance of common stock under employee plans, including tax benefits 2,251,657 22 36,438 36,460 Stock-based compensation 17,754 17,754 Repurchase and retirement of common stock (2,730,135 ) (27 ) (7,102 ) (72,599 ) (79,728 ) Dividends paid (27,052 ) (27,052 ) Disqualified dispositions 5,467 5,467 Balance at December 31, 2007 79,405,359 $ 794 $ 260,365 $ — $ 392,862 $ 7,065 $ 661,086 Net income 84,827 84,827 Foreign currency translation adjustment(net of $681 tax benefit) (4,188 ) (4,188 ) Unrealized loss on securities available-for-sale(net of $82 tax benefit) (502 ) (502 ) Unrealized gain on derivative instruments(net of $1,320 tax expense) 8,108 8,108 Total comprehensive income 88,245 Issuance of common stock under employee plans, including tax benefits 1,897,746 19 31,131 31,150 Stock-based compensation 19,854 19,854 Repurchase and retirement of common stock (4,110,042 ) (41 ) (13,477 ) (90,123 ) (103,641 ) Dividends paid (34,735 ) (34,735 ) Disqualified dispositions 2,479 2,479 Balance at December 31, 2008 77,193,063 $ 772 $ 300,352 $ — $ 352,831 $ 10,483 $ 664,438 Net income 17,085 17,085 Foreign currency translation adjustment(net of $1,799 tax expense) 927 927 Unrealized gain on securities available-for-sale(net of $1,093 tax expense) 563 563 Unrealized gain on derivative instruments(net of $3,053 tax expense) 1,572 1,572 Total comprehensive income 20,147 Issuance of common stock under employee plans, including tax benefits 1,618,252 16 21,656 21,672 Stock-based compensation 20,574 20,574 Repurchase and retirement of common stock (1,443,441 ) (14 ) (5,618 ) (28,953 ) (34,585 ) Dividends paid (37,308 ) (37,308 ) Disqualified dispositions (518 ) (518 ) Balance at December 31, 2009 77,367,874 $ 774 $ 336,446 $ — $ 303,655 $ 13,545 $ 654,420
The accompanying notes are an integral part of these financial statements.
NATIONAL INSTRUMENTS CORPORATION
Note 1:1 – Operations and summary of significant accounting policies
National Instruments Corporation is a Delaware corporation. We engage in the design, development, manufacture and marketing of instrumentationprovide flexible application software and specialty computer plug-in cards and accessoriesmodular, multifunction hardware that users combine with industry standardindustry-standard computers, networks and the Internetthird party devices to create measurement, automation and automation systems.embedded systems, which we also refer to as “virtual instruments.” Our approach gives customers the ability to quickly and cost-effectively design, prototype and deploy unique custom-defined solutions for their design, control and test application needs. We offer hundreds of products used to create virtual instrumentation systems for general, commercial, industrial and scientific applications. Our products may be used in different environments, and consequently, specific application of our products is determined by the customer and generally is not known to us. We approach all markets with essentially the same products, which are used in a variety of applications from research and development to production testing, monitoring and industrial control. The following industries and applications are served by us worldwide: advanced research, automotive, commercial aerospace, computers and electronics, continuous process manufacturing, education, government/defense, medical research/pharmaceutical, power/energy, semiconductors, automated test equipment, telecommunications and others. TheThese financial statements have been prepared in accordance with accounting principles generally accepted in the United States of America.
Principles of consolidation
The consolidated financial statementsConsolidated Financial Statements include the accounts of National Instruments Corporation and its subsidiaries. All significant intercompany accounts and transactions have been eliminated.
We have historically recorded the excess of the purchase price over the par or stated value of retired shares of our common stock as a reduction of additional paid-in capital. We completed our review of this accounting policy under FASB ASC 505, Equity (FASB ASC 505). Based on this review, we have reclassified a portion of the excess of the purchase price over the par or stated value of retired shares of our common stock from a reduction of additional paid-in capital to a reduction of retained earnings. This reclassification did not have any impact on previously reported statements of income, earning per share amounts, statements of cash flows or total stockholders’ equity. Certain prior year amounts from our Consolidated Statements of Stockholders’ Equity have been reclassified to conform to the 2009 presentation as shown in the following table:
APIC RE 2006 Beginning Balance 12/31/06 balance as previously reported $ 109,851 $ 483,437 Cumulative reclassification of share repurchase 97,957 (97,957 ) 12/31/06 balance as reported in current Form 10-K $ 207,808 $ 385,480 2007 Activity Repurchase and retirement of common stock as previously reported $ (79,701 ) $ — Reclassification of 2007 activity 72,599 (72,599 ) Repurchase and retirement of common stock as reported in current Form 10-K $ (7,102 ) $ (72,599 ) 2007 Ending Balance 12/31/07 balance as previously reported $ 89,809 $ 563,418 Cumulative reclassification of share repurchase 170,556 (170,556 ) 12/31/07 balance as reported in current Form 10-K $ 260,365 $ 392,862 2008 Activity Repurchase and retirement of common stock as previously reported $ (103,600 ) $ — Reclassification of 2008 activity 90,123 (90,123 ) Repurchase and retirement of common stock as reported in current Form 10-K $ (13,477 ) $ (90,123 ) 2008 Ending Balance 12/31/08 balance as previously reported $ 39,673 $ 613,510 Cumulative reclassification of share repurchase 260,679 (260,679 ) 12/31/08 balance as reported in current Form 10-K $ 300,352 $ 352,831
Going forward, we will account for the retired shares of our common stock by recording the excess of the purchase price over par value as a reduction of retained earnings, to the extent that the excess of the purchase price over par value exceeds the original proceeds received from the issuance of the same shares of our common stock, as prescribed by FASB ASC 505.
Use of estimates Judgments and estimates are required in the
The preparation of our financial statements to conformin conformity with U.S. generally accepted accounting principles. Theprinciples requires us to make estimates and underlying assumptions that affect the reported amounts of assets, liabilities, revenues, expenses and liabilities,related disclosures of contingent assets and liabilities. We base our estimates on past experience and other assumptions that we believe are reasonable under the disclosurecircumstances, and we evaluate these estimates on an ongoing basis. Our critical accounting policies are those that affect our financial statements materially and involve difficult, subjective or complex judgments by management. Although these estimates are based on management's best knowledge of contingencies atcurrent events and actions that may impact the balance sheet date andcompany in the reported revenues and expenses forfuture, actual results may be materially different from the period. Actual results could differ from those estimates.
Cash and cash equivalents
Cash and cash equivalents include cash and highly liquid investments with maturities of three months or less at the date of acquisition. Short-term
Short-Term Investments
We maintain an investment portfolio of various types of security holdings and maturities. Pursuant to FASB ASC 820, cash equivalents and short-term investments Short-term available-for-sale are valued using the market approach (Level 1) based on unadjusted quoted prices in active markets for identical assets at the measurement date. Our short-term investments also include auction rate securities that we originally purchased for $8.6 million. These auction rate securities consist of corporate, state and municipaleducation loan revenue bonds. Auction rate securities with readily determinableare variable rate debt instruments whose interest rates are typically reset approximately every 7 to 35 days. In November 2008, we accepted the UBS Auction Rate Securities Rights (“the Rights”) agreement offered by UBS as a liquidity alternative to the failed auction process. The Rights agreement is a nontransferable right to sell our auction rate securities, at par value, back to UBS at any time during the period June 30, 2010, through July 2, 2012. The estimated fair market valuesvalue of both the auction rate securities and maturitiesthe Rights agreement was determined using significant unobservable inputs (Level 3) as prescribed by FASB ASC 820.
We account for our investments in excessdebt and equity instruments under FASB ASC 320. Our investments are classified as available-for-sale and accordingly are reported at fair value, with unrealized gains and losses reported as other comprehensive income, a component of three months at the date of acquisition.stockholders’ equity. Unrealized losses are charged against income when a decline in fair value is determined to be other than temporary. Investments with maturities beyond one year are classified as short-term based on their highly liquid nature and because such marketable securities represent the investment of cash that is available for current operations. Our investments are classified as available-for-sale and accordingly are reported atThe fair value of our short-term investments in debt securities at December 31, 2009 and December 31, 2008 was $87 million and $6 million, respectively. The increase was due to the net purchase of $74 million of short-term investments and the transfer of $8.6 related to our auction rate securities and our rights agreement from long-term investments to short-term investments during the year ended December 31, 2009. The net purchase of $74 million of short term investments was done to diversify our holdings from money market accounts to debt securities and to take advantage of higher yields associated with longer maturity debt securities. We follow the guidance provided by FASB ASC 320 to assess whether our investments with unrealized loss positions are other than temporarily impaired. Realized gains and losses reported as other comprehensive income. Unrealized losses are charged against income when a declineand declines in fair value is determinedjudged to be other than temporary. Thetemporary are determined based on the specific identification method and are reported in other income (expense), net, in our Consolidated Statements of Income.
Accounts Receivable, net
Accounts receivable are recorded net of allowance for sales returns of $1.9 million and $1.8 million at December 31, 2009 and 2008, respectively, and net of allowances for doubtful accounts of $2.7 million and $3.9 million at December 31, 2009 and 2008, respectively. A provision for estimated sales returns is used to determinemade by reducing recorded revenue based on historical experience. We analyze historical returns, current economic trends and changes in customer demand and acceptance of our products when evaluating the costadequacy of securities sold.our sales returns allowance. Our allowance for doubtful accounts is based on historical experience. We analyze historical bad debts, customer concentrations, customer creditworthiness and current economic trends when evaluating the adequacy of our allowance for doubtful accounts.
Year Description Balance atBeginningof Period Provisions Write-Offs Balance atEnd ofPeriod 2007 Allowance for doubtful accounts and sales returns $ 4,360 $ 1,940 $ 698 $ 5,602 2008 Allowance for doubtful accounts and sales returns 5,602 447 367 5,682 2009 Allowance for doubtful accounts and sales returns 5,682 337 1,400 4,619
Inventories
Inventories are stated at the lower-of-cost or market. Cost is determined using standard costs, which approximate the first-in first-out (FIFO)(“FIFO”) method. Cost includes the acquisition cost of purchased components, parts and subassemblies, in-bound freight costs, labor and overhead. Market is replacement cost with respect to raw materials and is net realizable value with respect to work in process and finished goods.
Inventory is shown net of adjustment for excess and obsolete inventories of $5.2$4.4 million and $6.0$4.4 million at December 31, 20062009 and 2005,2008, respectively.
Long-Term Investments
At December 31, 2008, our long-term investments primarily consisted of auction rate securities that we originally purchased for $8.6 million as well as our Rights agreement with UBS. At December 31, 2008, we classified these investments as long-term due to the fact that the market for these securities was inactive, the underlying securities generally had contractual maturities that were in excess of the guidelines provided for in our investment policy, the fact that we had the ability to hold the debt instruments to their ultimate maturity and the fact that we had not made a determination as to whether we would exercise our rights under the Rights agreement. The auction rate securities were classified as available-for-sale. At December 31, 2008, we reported our auction rate securities at their estimated fair market value of $7.0 million and our Rights agreement at its estimated fair market value of $1.6 million. The estimated fair market value of both the auction rate securities and the Rights agreement was determined using significant unobservable inputs (Level 3) as prescribed by FASB ASC 820. These auction rate securities and the Rights agreement are now reported as a component of short-term investments as discussed above.
Property and equipment
Property and equipment are recorded at cost. Depreciation is computed using the straight-line method over the estimated useful lives of the assets, which range from twenty to forty years for buildings, three to seven years for purchased internal use software and for equipment which are each included in furniture and equipment. Leasehold improvements are depreciated over the shorter of the life of the lease or the asset.
Intangible assets
We capitalize costs related to the development and acquisition of certain software products. In accordance with Statement of Financial Accounting Standards (“SFAS”) 86,Accounting for the Costs of Computer Software to Be Sold, Leased or Otherwise Marketed,FASB ASC 985, capitalization of costs begins when technological feasibility has been established and ends when the product is available for general release to customers. Technological feasibility for our products is established when the product is available for beta release. Amortization is computed on an individual product basis for those products available for market and is recognized based on the product’s estimated economic life, generally three years. Patents are amortized using the straight-line method over their estimated period of benefit, generally ten to seventeen years. At each balance sheet date, the unamortized costs for all intangible assets are reviewed by management and reduced to net realizable value when necessary.
Goodwill
GoodwillThe excess purchase price over the fair value of assets acquired is recorded as goodwill. As we have one operating segment, we allocate goodwill to one reporting unit for goodwill impairment testing. In accordance with SFAS 142,FASB ASC 350, Intangibles – Goodwill and Other Intangible Assets, (FASB ASC 350), goodwill is tested for impairment on an annual basis, and between annual tests if indicators of potential impairment exist, using a fair-value-based approach.approach based on the market capitalization of the reporting unit. Our annual impairment test was performed on April 6, 2006.as of February 28, 2009. No impairment of goodwill was identified.has been identified during the period presented. Goodwill is deductible for tax purposes in certain jurisdictions.
Concentrations of credit risk Financial
We maintain cash and cash equivalents with various financial institutions located in many countries throughout the world. At December 31, 2009, $85 million or 42% of our cash and cash equivalents was held in cash in various operating accounts with financial institutions throughout the world and $116 million or 58% was held in money market accounts. The most significant of our operating accounts was our domestic operating account which held approximately $22 million or 11% of our total cash and cash equivalents at a bank that carried an A1 rating at December 31, 2009. From a geographic standpoint, approximately $78 million or 39% was held in various domestic accounts with financial institutions and $123 million or 61% was held in various accounts outside of the U. S. with financial institutions. At December 31, 2009, our short-term investments consist of $35 million or 40% of foreign government bonds, $21 million or 24% of U.S. treasuries and agencies, $12 million or 14% of municipal bonds, $9 million or 10% of auction rate securities and our auction rate securities put option, $8 million or 9% of corporate bonds and $3 million or 3% in time deposits.
The goal of our investment policy is to manage our investment portfolio to preserve principal and liquidity while maximizing the return on our investment portfolio through the full investment of available funds. We place our cash investments in instruments that potentially subject us to concentrationsmeet credit quality standards, as specified in our corporate investment policy guidelines. These guidelines also limit the amount of credit risk consist principallyexposure to any one issue, issuer or type of instrument. With the exception of our auction rate security from the Vermont Student Assistance Corporation, at December 31, 2009, our cash equivalents and short-term investments carried ratings from the major credit rating agencies that were in accordance with our corporate investment policy. Our investment policy allows investments in the following; government and federal agency obligations, repurchase agreements (“Repos”), certificates of deposit and time deposits, corporate obligations, medium term notes and deposit notes, commercial paper including asset-backed commercial paper (“ABCP”), puttable bonds, general obligation and revenue bonds, money market funds, taxable commercial paper, corporate notes/bonds, municipal notes, municipal obligations, variable rate demand notes and tax exempt commercial paper. All such instruments must carry minimum ratings of A1/P1/F1, MIG1/VMIG1/SP1 and A2/A/A, as applicable, all of which are considered “investment grade”. Our investment policy for marketable securities requires that all securities mature in three years or less, with a weighted average maturity of no longer than 18 months with at least 10% maturing in 90 days or less. We actively monitor our investment portfolio to ensure compliance with our investment objective to preserve capital, meet liquidity requirements and maximize return on our investments. We do not require collateral or enter into master netting arrangements to mitigate our credit risk. (See Note 2 – Cash, cash equivalents, short-term and long-term investments in Notes to Consolidated Financial Statements for further discussion and analysis of our investments.).
At December 31, 2009, we held foreign currency forward and option contracts cashwith an aggregate notional amount of $148.4 million with various counterparties and cash equivalents, short-term investments and trade accounts receivable. We have no significant concentrations of credit risk at December 31, 2006.with varying maturity dates. Our counterparties in our foreign currency forward and option contracts are major financial institutions. We do not anticipate nonperformance by these counterparties. We maintain cash(See Note 4 – Derivative instruments and cash equivalents with various financial institutions locatedhedging activities in many countries worldwide. Our short-term investments are diversified among and limitedNotes to high-quality securities with high credit ratings. Consolidated Financial Statements).
Concentration of credit risk with respect to trade accounts receivable is limited due to the large number of customers and their dispersion across many countries and industries. The amount of sales to any individual customer did not exceed 3% of revenue for the periods presented. The largest trade account receivable from any individual customer at December 31, 20062009 was approximately $1.8$1.9 million.
Key supplier risk
Our manufacturing processes use large volumes of high-quality components and subassemblies supplied by outside sources. Several of thosethese components are available through singlesole or limited sources. Supply shortages of or quality problems in connection with some of these key components could require us to procure components from replacement suppliers, which would cause significant delays in fulfillment of orders and likely result in additional costs. In order to manage this risk, we maintain safety stock of some of these single sourced components and subassemblies and perform regular assessments of suppliers performance, grading key suppliers in critical areas such as quality and “on-time” delivery.
Revenue recognition
We derive revenue primarily from the sale/licensing of integrated hardware and software solutions. We also sellIndependent sales of application software licenses which are sold separately as well as training andinclude post contract support services. In addition, training services are sold separately. The products and services are generally sold under standardized licensing and sales arrangements with payment terms ranging from net 30 days in the United States to net 30 days and up to net 90 days in some international markets. Approximately 95%83% of our product/license sales include both hardware and software in the customer arrangement, with a small percentage of sales including other services. We offer rights of return and standard warranties for product defects related to our products. The rights of return are generally for a period of up to 30 days after the delivery date. The standard warranties cover periods ranging from 90 days to three years. With the exception of our former German systems integration subsidiary, which accounted for less than 1.5% of our revenues in the year ended December 31, 2004, weWe do not generally enter into contracts requiring product acceptance from the customer. This subsidiary was sold in December 2004.
Revenue is recognized in accordance with the provisions of SOP 97-2FASB ASC 985, when persuasive evidence of an arrangement exists, delivery has occurred, the fee is fixed or determinable, and collectability is probable. We enter into certain arrangements where we are obligated to deliver multiple products and/or services (“multiple elements”). In these transactions, we allocate the total revenue among the elements based on vendor specific objective evidence (“VSOE”) of fair value as determined by the sales price of each element when sold separately (“vendor-specific objective evidence”). Salesseparately.
When VSOE of fair value is available for the undelivered element of a multiple element arrangements, sales revenue from product sales is generally recognized on the date the product is shipped, using the residual method under FASB ASC 985, with a portion of revenue recorded as deferred (unearned) due to applicable undelivered elements. Undelivered elements for our multiple-elementmultiple element arrangements with a customer are generally restricted to post contract support and training and education. The amount of revenue allocated to these undelivered elements is based on the vendor-specific objective evidence (“VSOE”)VSOE of fair value for those undelivered elements. Deferred revenue due to undelivered elements is recognized ratably on a straight-line basis over the service period or when the service is completed. When VSOE of fair value is not available for the undelivered element of a multiple element arrangement, sales revenue is generally recognized ratably, on a straight-line basis over the service period of the undelivered element, generally 12 months or when the service is completed in accordance with the subscription method under FASB ASC 985. Deferred revenue at December 31, 20062009 and 20052008 was $22.2$57 million and $16.0$46 million, respectively.
The application of SOP 97-2FASB ASC 985 requires judgment, including whether a software arrangement includes multiple elements, and if so, whether VSOE of fair value exists for those elements. Changes to the elements in a software arrangement, the ability to identify VSOE for those elements, the fair value of the respective elements, and changes to a product'sproduct’s estimated life cycle could materially impact the amount of our earned and unearned revenue. Judgment is also required to assess whether future releases of certain software represent new products or upgrades and enhancements to existing products. Provision
Product revenue
Our product revenue is generated predominantly from the sales of measurement and automation products. Our products consist of application software and hardware components together with related driver software.
Software maintenance revenue
Software maintenance revenue is post contract customer support that provides the customer with unspecified upgrades/updates and technical support.Shipping and handling costsOur shipping and handling costs charged to customers are included in net sales, and the associated expense is recorded in cost of sales for estimated sales returns is made by reducing recorded revenue based on historical experience. Management analyzes historical returns, current economic trends, and changes in customer demand and acceptance of our products when evaluating the adequacy of our allowance for sales returns. The accounts receivable are net of allowance for sales returns of $1.5 million and $1.3 million at December 31, 2006 and 2005, respectively. Similarly, management must make estimates of the uncollectability of our accounts receivables. Management specifically analyzes accounts receivable and analyzes historical bad debts, customer concentrations, customer credit-worthiness and current economic trends when evaluating the adequacy of our allowance for doubtful accounts. The accounts receivable are net of allowances for doubtful accounts of $2.9 million and $3.4 million at December 31, 2006 and 2005, respectively.all periods presented.
Warranty reserve
We offer a one-year limited warranty on most hardware products, with a two or three-year warranty on a subset of our hardware products, which is included in the sales price of many of our products. Provision is made for estimated future warranty costs at the time of the sale pursuant to SFAS 5,Accounting for Loss FASB ASC 450, Contingencies (FASB ASC 450), for the estimated costs that may be incurred under the basic limited warranty. Our estimate is based on historical experience and product sales during this period.
The warranty reserve for the years ended December 31, 20062009 and 2005,2008, respectively, was as follows (in thousands):2006
2005
Balance at the beginning of the period $ 915 $ 815 Accruals for warranties issued during the period 1,593 1,652 Settlements made (in cash or in kind) during the period (1,641 ) (1,552 )
Balance at the end of the period $ 867 $ 915
2009 2008 Balance at the beginning of the period $ 952 $ 750 Accruals for warranties issued during the period 1,991 1,836 Settlements made (in cash or in kind) during the period (2,022 ) (1,634 ) Balance at the end of the period $ 921 $ 952
Loss contingencies
We accrue for probable losses from contingencies including legal defense costs, on an undiscounted basis, in accordance with SFAS 5, Accounting for Loss FASB ASC 450, Contingencies (FASB ASC 450), when such costs are considered probable of being incurred and are reasonably estimable. We periodically evaluate available information, both internal and external, relative to such contingencies and adjust this accrual as necessary.
Advertising expense
We expense costs of advertising as incurred. Advertising expense for the years ended December 31, 2006, 20052009, 2008 and 20042007 was $47.3$13.6 million, $42.5$19.3 million and $39.7$20.0 million, respectively.
Foreign currency translation
The functional currency for our international sales operations is the applicable local currency. The assets and liabilities of these operations are translated at the rate of exchange in effect on the balance sheet date and sales and expenses are translated at average rates. The resulting gains or losses from translation are included in a separate component of other comprehensive income. Gains and losses resulting from re-measuring monetary asset and liability accounts that are denominated in a currency other than a subsidiary’s functional currency are included in net foreign exchange gain (loss) and are included in net income.
Foreign currency hedging instruments
All of our derivative instruments are recognized on the balance sheet at their fair value. We currently use foreign currency forward and purchased option contracts to hedge our exposure to material foreign currency denominated receivables and forecasted foreign currency cash flows.
On the date the derivative contract is entered into, we designate the derivative as either a hedge of the fair value of foreign currency denominated receivables (“fair-value” hedge) or as a hedge of the variability of foreign currency cash flows to be received or paid (“cash flow” hedge). Changes in the fair market value or as a hedge of a fair-value hedge are recorded, along with the loss or gain on the re-measurement of foreign-currency-denominated receivables, in current earnings.our foreign denominated net receivable positions (“other derivatives”). Changes in the fair value of derivatives that are designated and qualify as cash flow hedges under SFAS 133FASB ASC 815, Derivatives and Hedging (FASB ASC 815) and that are deemed to be highly effective are recorded in other comprehensive income. These amounts are subsequently reclassified into earnings in the period during which the hedgehedged transaction is realized. The gain or loss on the other derivatives as well as the offsetting gain or loss on the hedged item attributable to the hedged risk is recognized in current earnings under the line item “Net foreign exchange gain (loss)”. We do not enter into derivative contracts for speculative purposes.
We formally document all relationships between hedging instruments and hedged items, as well as our risk-management objective and strategy for undertaking various hedge transactions. This process includes linking all derivatives that are designated as fair-value or cash flow hedges to specific assets and liabilities on the balance sheet or to specific firm commitments or forecasted transactions. We also formally assess, both at the hedge’s inception and on an ongoing basis, whether the hedging instruments are highly effective in offsetting changes in cash flows of hedged items.
We prospectively discontinue hedge accounting if (1) it is determined that the derivative is no longer highly effective in offsetting changes in the fair value of a hedged item (forecasted transactions); or (2) the derivative is de-designated as a hedge instrument, because it is unlikely that a forecasted transaction will occur. When hedge accounting is discontinued, the derivative is sold and the resulting gains and losses are recognized immediately in earnings.
Income taxes
We account for income taxes under the asset and liability method as set forth in SFAS 109,Accounting for FASB ASC 740, Income Taxes.Taxes (FASB ASC 740). Deferred tax assets and liabilities are recognized for the expected tax consequences of temporary differences between the tax bases of assets and liabilities and their reported amounts. Valuation allowances are established when necessary to reduce deferred tax assets to amounts which are more likely than not to be realized.
Earnings per share On January 21, 2004, we declared a stock split effected in the form of a dividend of one share of common stock for each two shares of common stock outstanding. The dividend was paid on February 20, 2004 to holders of record as of the close of business on February 5, 2004. All per share data and numbers of common shares, where appropriate, have been retroactively adjusted to reflect the stock split.
Basic earnings per share (“EPS”) is computed by dividing net income by the weighted average number of common shares outstanding during each period. Diluted EPS is computed by dividing net income by the weighted average number of common shares and common share equivalents outstanding (if dilutive) during each period. The number of common share equivalents, which include stock options and restricted stock units, is computed using the treasury stock method.
The reconciliation of the denominators used to calculate basic EPS and diluted EPS for the years ended December 31, 2006, 20052009, 2008 and 2004,2007, respectively, are as follows (in thousands):Years Ended December 31,
2006
2005
2004
Weighted average shares outstanding-basic 79,519 78,552 78,680 Plus: Common share equivalents Stock options, restricted stock units 2,000 2,358 3,416
Weighted average shares outstanding-diluted 81,519 80,910 82,096
Years Ended December 31, 2009 2008 2007 Weighted average shares outstanding-basic�� 77,520 78,567 79,468 Plus: Common share equivalents Stock options, restricted stock units 506 948 1,575 Weighted average shares outstanding-diluted 78,026 79,515 81,043
Stock options to acquire 3,295,000, 3,056,0002,711,976, 2,402,934 and 2,523,0002,304,078 shares for the years ended December 31, 2006, 20052009, 2008 and 2004,2007, respectively, were excluded in the computations of diluted EPS because the effect of including the stock options would have been anti-dilutive.
Stock-based compensation plans
Effective January 1, 2006, we adopted Statement of Financial Accounting Standards 123R (“SFAS 123R”),“Share-based Payments”FASB ASC 718, Compensation – Stock Compensation (FASB ASC 718), using the modified-prospective-transition method. Under this method, prior periods are not restated. Under this transition method, stock compensation cost recognized beginning January 1, 2006 includes: (a) compensation cost for all share-based payments granted prior to, but not yet vested as of January 1, 2006, based on the grant date fair value estimated in accordance with the original provisions of SFAS 123,FASB ASC 718, and (b) compensation cost for all share-based payments granted on or subsequent to January 1, 2006, based on the grant-date fair value estimated in accordance with the provisions of SFAS 123R.FASB ASC 718. Prior
Comprehensive income
Our comprehensive income is comprised of net income, foreign currency translation and unrealized gains and losses on forward and option contracts and securities available-for-sale. Comprehensive income for 2009, 2008 and 2007 was $20.1 million, $88.2 million and $111.6 million, respectively.
Recently Issued Accounting Pronouncements
In April 2009, the FASB updated FASB ASC 820 providing additional guidance for estimating fair value when the volume and level of activity for the asset or liability have significantly decreased. This update also includes guidance on identifying circumstances that indicate a transaction is not orderly. We adopted the update on April 1, 2009 as required and concluded it did not have a material impact on our consolidated financial position or results of operations.
In September 2009, the FASB updated FASB ASC 105, Generally Accepted Accounting Principles (FASB ASC 105). The update establishes the FASB Standards Accounting Codification (“Codification”) as the source of authoritative U.S. generally accepted accounting principles (“GAAP”) recognized by the FASB to adopting SFAS 123R, we presentedbe applied to nongovernmental entities and rules and interpretive releases of the SEC as authoritative GAAP for SEC registrants. The Codification supersedes all tax benefitsexisting non-SEC accounting and reporting standards. This update is effective for financial statements issued for interim and annual periods ending after September 15, 2009. We adopted the update on July 1, 2009, as required and concluded it did not have a material impact on our consolidated financial position or results of deductions resultingoperations.
In October 2009, the FASB updated FASB ASC 605, Revenue Recognition (FASB ASC 605) that amended the criteria for separating consideration in multiple-deliverable arrangements. The amendments establish a selling price hierarchy for determining the selling price of a deliverable. The selling price used for each deliverable will be based on vendor-specific objective evidence if available, third–party evidence if vendor-specific objective evidence is not available, or estimated selling price if neither vendor-specific objective evidence nor third-party evidence is available. The amendments will change the application of the residual method of allocation and require that arrangement consideration be allocated at the inception of the arrangement to all deliverables using the relative selling price method. The relative selling price method allocates any discount in the arrangement proportionally to each deliverable on the basis of each deliverable’s selling price. This update will be effective prospectively for revenue arrangements entered into or materially modified in fiscal years beginning on or after June 15, 2010. Early adoption is permitted. We are currently evaluating the requirements of this update and have not yet determined the impact on our consolidated financial statements.
In October 2009, the FASB updated FASB ASC 985, Software (FASB ASC 985) that changes the accounting model for revenue arrangements that include both tangible products and software elements. Tangible products containing software components and nonsoftware components that function together to deliver the tangible product’s essential functionality are no longer within the scope of the software revenue guidance in Subtopic 985-605. In addition, the amendments require that hardware components of a tangible product containing software components always be excluded from the exercisesoftware revenue guidance. This update will be effective prospectively for revenue arrangements entered into or materially modified in fiscal years beginning on or after June 15, 2010. Early adoption is permitted. We are currently evaluating the requirements of stock grants as operatingthis update and have not yet determined the impact on our consolidated financial statements.
Cash, cash flows. SFAS 123R requires the cash flows resulting from the tax benefits from tax deductions in excessequivalents, short-term and long-term investments consist of the compensation costfollowing (in thousands):
As ofDecember 31, 2009 As ofDecember 31, 2008 Cash and cash equivalents: Cash $ 85,612 $ 100,967 Cash equivalents: Time deposits — 73,400 Money market accounts 115,853 55,033 Total cash and cash equivalents $ 201,465 $ 229,400 Short-term investments: Municipal bonds $ 12,549 $ 6,220 Corporate bonds 7,587 — U.S. treasuries and agencies 21,033 — Foreign government bonds 34,674 — Time deposits 2,753 — Auction rate securities 8,177 — Auction rate securities put option 423 — Total short-term investments 87,196 6,220 Long-term investments: Auction rate securities — 6,964 Auction rate securities put option — 1,636 Other long-term investments — 1,900 Total investments $ 87,196 $ 16,720 Total cash, cash equivalents and investments $ 288,661 $ 246,120
The following table summarizes unrealized gains and losses related to our investments designated as available-for-sale (in thousands):
As of December 31, 2009 Adjusted Cost GrossUnrealized Gain GrossUnrealized Loss Cumulative Translation Adjustment Fair Value Municipal bonds $ 12,491 $ 58 $ — $ — $ 12,549 Corporate bonds 7,478 110 (1 ) — 7,587 U.S. treasuries and agencies 21,080 — (47 ) — 21,033 Foreign government bonds 36,105 76 — (1,507 ) 34,674 Time deposits 2,753 — — — 2,753 Auction rate securities 8,600 — (423 ) — 8,177 Auction rate securities put option — 423 — — 423 Total investments $ 88,507 $ 667 $ (471 ) $ (1,507 ) $ 87,196
As of December 31, 2008 Adjusted Cost GrossUnrealized Gain GrossUnrealized Loss Fair Value Municipal securities $ 6,199 $ 28 $ (7 ) $ 6,220 Auction rate securities 8,600 — (1,636 ) 6,964 Auction rate securities put option — 1,636 — 1,636 Other long-term investments 1,900 — — 1,900 Total investments $ 16,699 $ 1,664 $ (1,643 ) $ 16,720
The following table summarizes the contractual maturities of our investments designated as available-for-sale (in thousands):
As of December 31, 2009 Adjusted Cost Fair Value Due in less than 1 year $ 44,029 $ 43,267 Due in 1 to 5 years 44,478 43,929 Total investments $ 88,507 $ 87,196
As of December 31, 2009 Due in less than 1 year Adjusted Cost Fair Value Municipal bonds $ 4,103 $ 4,110 Corporate bonds 5,384 5,473 U.S. treasuries and agencies 5,065 5,057 Foreign government bonds 18,124 17,274 Time deposits 2,753 2,753 Auction rate securities 8,600 8,177 Auction rate securities put option — 423 Total investments $ 44,029 $ 43,267
As of December 31, 2009 Due in 1 to 5 years Adjusted Cost Fair Value Municipal bonds $ 8,388 $ 8,439 Corporate bonds 2,094 2,114 U.S. treasuries and agencies 16,015 15,976 Foreign government bonds 17,981 17,400 Time deposits — — Auction rate securities — — Auction rate securities put option — — Total investments $ 44,478 $ 43,929
Note 3 – Fair value measurements
FASB ASC 820, clarifies the definition of fair value, prescribes methods for measuring fair value, establishes a fair value hierarchy based on the inputs used to measure fair value and expands disclosures about the use of fair value measurements. Effective January 1, 2009, we adopted FASB ASC 820 for our nonfinancial assets and nonfinancial liabilities, except those items recognized (excess tax benefits) to be classifiedor disclosed at fair value on an annual or more frequently recurring basis. The adoption of FASB ASC 820 did not have a material impact on our fair value measurements as financing cash flows. Aswe did not have any items that were measured at fair value on a result, $4.3 million of excess tax benefitsnonrecurring basis for the year ended December 31, 20062009. In April 2009, FASB ASC 820 was updated to provide additional guidance for estimating fair value when the volume and level of activity for the asset or liability have been classified as financing cash flows. Prior tosignificantly decreased. The update also includes guidance on identifying circumstances that indicate a transaction is not orderly. We adopted the effective date of SFAS 123R, we applied Accounting Principles Board Opinion 25 (“APB 25”),“Accounting for Stock Issued to Employees”update on April 1, 2009 and related interpretations forit did not have a material impact on our stock option grants. APB 25 providesfair value measurements.
The following tables present our assets and liabilities that are measured at fair value on a recurring basis and are categorized using the compensation expense relative to our stock options is measuredfair value hierarchy. The fair value hierarchy has three levels based on the intrinsicreliability of the inputs used to determine fair value.
Fair Value Measurements at Reporting Date Using Description December 31, 2009 Quoted Prices in Active Markets for Identical Assets(Level 1) Significant Other Observable Inputs(Level 2) Significant Unobservable Inputs(Level 3) Assets Money Market Funds $ 115,853 $ 115,853 $ — $ — Short-term investments available-for-sale 87,196 78,596 — 8,600 Derivatives 11,016 — 11,016 — Total Assets $ 214,065 $ 194,449 $ 11,016 $ 8,600 Liabilities Derivatives $ (318 ) $ — $ (318 ) $ — Total Liabilities $ (318 ) $ — $ (318 ) $ —
Fair Value Measurements Using Significant Unobservable Inputs(Level 3) Short-term investmentsavailable-for-sale Beginning Balance, January 1, 2008 $ 8,600 Total gains (realized/unrealized) Included in earnings 423 Included in other comprehensive income — Total losses (realized/unrealized) Included in earnings (423 ) Included in other comprehensive income — Purchases, issuances and settlements — Transfer in and/or out of Level 3 — Ending Balance, December 31, 2009 $ 8,600 The amount of total gains or (losses) for the period included in earnings (or changes in net assets) attributableto the change in unrealized gains or losses relating to assets still held at the reporting date $ —
Short-term investments available-for-sale are valued using a market approach (Level 1) based on the quoted market prices of identical instruments when available or other observable inputs such as trading prices of identical instruments in inactive markets. Short-term investments available-for-sale consist of debt securities issued by states of the U.S. and political subdivisions of the states, corporate debt securities and debt securities issued by U.S. government corporations and agencies. All short-term investments available-for-sale have contractual maturities of less than 24 months.
Derivatives include foreign currency forward and option contracts. Our foreign currency forward contracts are valued using an income approach (Level 2) based on the spot rate less the contract rate multiplied by the notional amount. Our foreign currency option contracts are valued using a market approach based on the quoted market prices which are derived from observable inputs including current and future spot rates, interest rate spreads as well as quoted market prices of identical instruments.
Short-term debt securities available-for-sale included in Level 3 are reported at their fair market value and consist of auction rate securities backed by education loan revenue bonds. One of our auction rate securities is from the Vermont Student Assistance Corporation and has a par value of $2.2 million. The other of our auction rate securities is from the New Hampshire Health and Education Facilities Authority and has a par value of $6.4 million. The ratings for these securities at December 31, 2009, were Baa3/A/AAA and Aaa/NR/AAA, respectively. Historically, we reported the fair market value of these securities at par as differences between par value and the purchase price or settlement value were historically comprised of accrued interest. Auction rate securities are variable rate debt instruments whose interest rates are typically reset approximately every 7 to 35 days. On January 15, 2010, and in prior auction periods beginning in February 2008, the auction process for these securities failed. At December 31, 2009, we reported these as short-term investments at their estimated fair market value of $8.2 million.
In November 2008, we accepted the UBS Auction Rate Securities Rights (the “Rights”) agreement offered by UBS as a liquidity alternative to the failed auction process. This Rights agreement is related to the auction rates securities discussed above. The Rights agreement is a nontransferable right to sell our auction rate securities, at par value, back to UBS at any time during the period June 30, 2010, through July 2, 2012. At December 31, 2009, we reported the Rights agreement at its estimated fair market value of $423,000 as a component of short-term debt securities available for sale.
Due to the fact that our Rights agreement has an initial exercise date that is less than one year from now, we are now reporting our auction rate securities and the corresponding Rights agreement as short-term. We continue to have the ability to hold our auction rate securities to their ultimate maturities which are in excess of one year and we have not made a determination as to whether we will exercise our option under the Rights agreement or if we do choose to exercise our option, at what point during the period June 30, 2010 through July 2, 2012, we would exercise our option. However, due to the fact that our Rights agreement has an initial exercise date that is less than one year from now, we are now reporting our auction rate securities and the corresponding Rights agreement as short-term. We have recorded the unrealized loss related to the auction rate securities and the unrealized gain related to the Rights agreement as a component of other income (expense), in our Consolidated Statements of Income.
The estimated fair market value of both the auction rate securities and the Rights agreement was determined using significant unobservable inputs (Level 3) as prescribed by FASB ASC 820. We considered many factors in determining the fair market value of the stockauction rate securities as well as our corresponding Rights agreement at December 31, 2009, including the fact that the debt instruments underlying the auction rate securities have redemption features which call for redemption at 100% of par value, current credit curves for like securities and discount factors to account for the illiquidity of the market for these securities. During the year ended December 31, 2009, we did not make any changes to our valuation techniques or related inputs.
FASB ASC 815 requires companies to recognize all of their derivative instruments as either assets or liabilities in the statement of financial position at fair value. The accounting for changes in the fair value (i.e., gains or losses) of a derivative instrument depends on whether it has been designated and qualifies as part of a hedging relationship and further, on the type of hedging relationship. For those derivative instruments that are designated and qualify as hedging instruments, a company must designate the hedging instrument, based upon the exposure being hedged, as a fair value hedge, cash flow hedge, or a hedge of a net investment in a foreign operation.
We have operations in over 40 countries. Sales outside of the Americas as a percentage of consolidated sales were 57% and 57% for the years ended December 31, 2009 and 2008, respectively. Our activities expose us to a variety of market risks, including the effects of changes in foreign currency exchange rates. These financial risks are monitored and managed by us as an integral part of our overall risk management program.
We maintain a foreign currency risk management strategy that uses derivative instruments (foreign currency forward and purchased option contracts) to help protect our earnings and cash flows from fluctuations caused by the volatility in currency exchange rates. Movements in foreign currency exchange rates pose a risk to our operations and competitive position, since exchange rate changes may affect our profitability and cash flow, and the business or pricing strategies of our non-U.S. based competitors.
The vast majority of our foreign sales are denominated in the customers’ local currency. We purchase foreign currency forward and option contracts as hedges of forecasted sales that are denominated in foreign currencies and as hedges of foreign currency denominated receivables. These contracts are entered into to protect against the risk that the eventual dollar-net-cash inflows resulting from such sales or firm commitments will be adversely affected by changes in exchange rates. We also purchase foreign currency forward contracts as hedges of forecasted expenses that are denominated in foreign currencies. These contracts are entered into to protect against the risk that the eventual dollar-net-cash outflows resulting from foreign currency operating and cost of revenue expenses will be adversely affected by changes in exchange rates.
In accordance with FASB ASC 815, we designate foreign currency forward and purchased option contracts as cash flow hedges of forecasted revenues or forecasted expenses. In addition, we hedge our foreign currency denominated balance sheet exposures using foreign currency forward contracts. These derivatives are not designated as hedging instruments under FASB ASC 815. None of our derivative instruments contain a credit-risk-related contingent feature.
Cash flow hedges
To protect against the reduction in value caused by a fluctuation in foreign currency exchange rates of forecasted foreign currency cash flows resulting from international sales over the next one to two years, we have instituted a foreign currency cash flow hedging program. We hedge portions of our forecasted revenue and forecasted expenses denominated in foreign currencies with forward and purchased option contracts. For forward contracts, when the dollar strengthens significantly against the foreign currencies, the change in the present value of future foreign currency cash flows may be offset by the change in the fair value of the forward contracts designated as hedges. For option contracts, when the dollar strengthens significantly against the foreign currencies, the change in the present value of future foreign currency cash flows may be offset by the change in the fair value of the option contracts net of the premium paid designated as hedges. Our foreign currency purchased option contracts are purchased “at-the-money” or “out-of-the-money”. We purchase foreign currency forward and option contracts for up to 100% of our forecasted exposures in selected currencies (primarily in Euro, Japanese yen, British pound sterling, South Korean won and Hungarian forint) and limit the duration of these contracts to 40 months or less.
For derivative instruments that are designated and qualify as a cash flow hedge, the effective portion of the gain or loss on the derivative is reported as a component of accumulated other comprehensive income (“OCI”) and reclassified into earnings in the same line item (net sales, operating expenses, or cost of sales) associated with the forecasted transaction and in the same period or periods during which the hedged transaction affects earnings. Gains and losses on the derivative representing either hedge ineffectiveness or hedge components excluded from the assessment of effectiveness are recognized in current earnings or expenses during the current period and are classified as a component of “net foreign exchange gain (loss)”. Hedge effectiveness of foreign currency forwards and purchased option contracts designated as cash flow hedges are measured by comparing the hedging instrument’s cumulative change in fair value from inception to maturity to the forecasted transaction’s terminal value.
We held forward contracts with a notional amount of $28.6 million dollar equivalent of Euro, $4.0 million dollar equivalent of British pound sterling, $24.4 million dollar equivalent of Japanese yen, and $17.8 million dollar equivalent of Hungarian forint at dateDecember 31, 2009. These contracts are for terms of grant.up to 24 months. At December 31, 2008, we held forward contracts with a notional amount of $54.9 million dollar equivalent of Euro, $6.2 million dollar equivalent of British pound sterling, $18.9 million dollar equivalent of Japanese yen, $4.7 million dollar equivalent of South Korean won and $21.7 million dollar equivalent of Hungarian forint.
We held purchased option contracts with a notional amount of $28.4 million dollar equivalent of Euro at December 31, 2009. These contracts are for terms of up to 12 months. At December 31, 2008, we held purchased option contracts with a notional amount of $111.3 million dollar equivalent of Euro.
At December 31, 2009, we expect to reclassify $2.8 million of gains on derivative instruments from accumulated other comprehensive income to net sales during the next twelve months when the hedged international sales occur. At December 31, 2009, we expect to reclassify $3.7 million of gains on derivative instruments from accumulated OCI to cost of sales and $2.0 million of gains on derivative instruments from accumulated OCI to operating expenses during the next twelve months when the hedged international expenses occur. Expected amounts are based on derivative valuations at December 31, 2009. Actual results may vary as a result of changes in the corresponding exchange rate subsequent to this date.
During the year ended December 31, 2009, hedges with a notional amount of $22.8 million were determined to be ineffective. As a result, we recorded a net gain of adopting SFAS 123R$1.2 million related to these hedges as a component of “net foreign exchange gain (loss)” during the year ended December 31, 2009. We did not record any gains or losses due to the ineffectiveness of our hedges during the year ended December 31, 2008.Other Derivatives
Other derivatives not designated as hedging instruments under FASB ASC 815 consist primarily of foreign currency forward contracts that we use to hedge our foreign denominated net receivable or net payable positions to protect against the change in value caused by a fluctuation in foreign currency exchange rates. We typically hedge up to 90% of our outstanding foreign denominated net receivables or net payables and typically limit the duration of these foreign currency forward contracts to approximately 90 days. The gain or loss on the derivatives as well as the offsetting gain or loss on the hedge item attributable to the hedged risk is recognized in current earnings under the line item “net foreign exchange gain (loss)”. As of December 31, 2009 and December 31, 2008, we held foreign currency forward contracts with a notional amount of $45.2 million and $67.1 million, respectively.
Effective January 1, 2006,2009, we adopted the updated disclosure requirements of FASB ASC 815. The following table presents the fair value of derivative instruments on our income before income taxesConsolidated Balance Sheets and net incomethe effect of derivative instruments on our Consolidated Statements of Income.
Fair Values of Derivative Instruments (in thousands):
In thousands Asset Derivatives December 31, 2009 December 31, 2008 Balance Sheet Location Fair Value Balance Sheet Location Fair Value Derivatives designated as hedginginstruments under FASB ASC 815 Foreign exchange contracts – ST forwards Prepaid expenses and other current assets $ 7,947 Prepaid expenses and other current assets $ 5,260 Foreign exchange contracts – LT forwards Other long-term assets 274 Other long-term assets 2,654 Foreign exchange contracts – ST options Prepaid expenses and other current assets 1,821 Prepaid expenses and other current assets 5,705 Foreign exchange contracts – LT options Other long-term assets — Other long-term assets 3,838 Total derivatives designated ashedging instruments under FASB ASC 815 $ 10,042 $ 17,457 Derivatives not designated ashedging instruments under FASB ASC 815 Foreign exchange contracts – ST forwards Prepaid expenses and other current assets $ 974 Prepaid expenses and other current assets $ 2,745 Total derivatives not designated ashedging instruments under FASB ASC 815 $ 974 $ 2,745 Total derivatives $ 11,016 $ 20,202
Liability Derivatives December 31, 2009 December 31, 2008 Balance Sheet Location Fair Value Balance Sheet Location Fair Value Derivatives designated as hedginginstruments under FASB ASC 815 Foreign exchange contracts – ST forwards Accrued expenses and other liabilities $ — Accrued expenses and other liabilities $ (1,803 ) Foreign exchange contracts – LT forwards Other long-term liabilities — Other long-term liabilities — Foreign exchange contracts – ST options Accrued expenses and other liabilities — Accrued expenses and other liabilities — Foreign exchange contracts – LT options Other long-term liabilities — Other long-term liabilities — Total derivatives designated ashedging instruments under FASB ASC 815 $ — $ (1,803 ) Derivatives not designated ashedging instruments under FASB ASC 815 Foreign exchange contracts – ST forwards Accrued expenses and other liabilities $ (318 ) Accrued expenses and other liabilities $ (3,280 ) Total derivatives not designated ashedging instruments under FASB ASC 815 $ (318 ) $ (3,280 ) Total derivatives $ (318 ) $ (5,083 )
The following table shows the effect of derivative instruments on our Consolidated Statements of Income for the year ended December 31, 2006 are $9.42009 (in thousands):
Derivatives in FASB ASC 815 Cash Flow Hedging Relationship Amount of Gain or (Loss) Recognized in OCI on Derivative (Effective Portion) (in thousands) Location of Gain or (Loss) Reclassified from Accumulated OCI into Income (Effective Portion) Amount of Gain or (Loss) Reclassified from Accumulated OCI into Income (Effective Portion) (in thousands) Location of Gain or (Loss) Recognized in Income on Derivative (Ineffective Portion and Amount Excluded from Effectiveness Testing) Amount of Gain or (Loss) Recognized in Income on Derivative (Ineffective Portion and Amount Excluded from Effectiveness Testing) 2009 2009 2009 Foreign exchange contracts – forwards and options $ (6,304 ) Net sales $ 1,399 Net foreign exchange gain (loss) $ 1,132 Foreign exchange contracts – forwards and options 2,055 Cost of sales (74 ) Net foreign exchange gain (loss) (41 ) Foreign exchange contracts – forwards and options 1,427 Operating expenses 517 Net foreign exchange gain (loss) 81 Total $ (2,822 ) $ 1,842 $ 1,172
Derivatives not Designated as Hedging Instruments under FASB ASC 815 Location of Gain (Loss) Recognized in Income on Derivative Amount of Gain (Loss) Recognized in Income on Derivative 2009 Foreign exchange contracts – forwards Net foreign exchange gain/(loss) $ (1,669 ) Total $ (1,669 )
Note 5 – Inventories
Inventories, net consist of the following (in thousands):
December 31, 2009 2008 Raw materials $ 42,121 $ 48,004 Work-in-process 2,042 4,150 Finished goods 42,352 55,204 $ 86,515 $ 107,358
Note 6 – Property and equipment
Property and equipment consist of the following (in thousands):
December 31, 2009 2008 Land $ 17,076 $ 7,210 Buildings 138,367 136,802 Furniture and equipment 154,558 144,979 310,001 288,991 Accumulated depreciation (156,736 ) (134,514 ) $ 153,265 $ 154,477
Depreciation expense for the years ended December 31, 2009, 2008 and 2007, was $22.3 million, $20.9 million and $22.2 million, respectively.
Intangibles at December 31, 2009 and 2008 are as follows:
2009 2008 Gross Carrying Amount Accumulated Amortization Net Carrying Amount Gross Carrying Amount Accumulated Amortization Net Carrying Amount Capitalized software development costs $ 38,928 $ (20,455 ) $ 18,473 $ 25,610 $ (11,344 ) $ 14,266 Acquired technology 28,022 (20,967 ) 7,055 27,503 (16,804 ) 10,699 Patents 19,033 (5,377 ) 13,656 16,068 (4,506 ) 11,562 Other 12,577 (8,371 ) 4,206 11,401 (6,013 ) 5,388 $ 98,560 $ (55,170 ) $ 43,390 $ 80,582 $ (38,667 ) $ 41,915
Software development costs capitalized during 2009, 2008 and 2007 were $13.3 million, $9.5 million and $8.3 million, respectively, and related amortization was $9.1 million, $10.3 million and $8.9 million, respectively. Included in these capitalized costs for the years ended December 31, 2009, 2008, and 2007 were costs related to stock based compensation of $734,000, $451,000 and $422,000, respectively. Amortization of capitalized software development costs is computed on an individual product basis for those products available for market and is recognized based on the product’s estimated economic life, generally three years. Patents are amortized using the straight-line method over their estimated period of benefit, generally ten to seventeen years. Total intangible assets amortization expenses were $16.5 million, $16.2 million and $14.4 million for the years ended December 31, 2009, 2008 and 2007, respectively.
Capitalized software development costs, acquired technology, patents and other have weighted-average useful lives of 2.2 years, 1.8 years, 5.3 years, and 1.8 years, respectively, as of December 31, 2009. The estimated future amortization expense related to intangible assets as of December 31, 2009 is as follows:
Amount(in thousands) 2010 $ 18,097 2011 12,986 2012 7,187 2013 1,868 2014 1,186 Thereafter 2,066 $ 43,390
Acquisition intangibles are amortized over their useful lives, which range from three to eight years. Amortization expense for acquisition intangibles was approximately $3.9 million and $4.2 million for 2009 and 2008, respectively, of which approximately $3.4 million and $3.6 million was recorded in cost of sales and approximately $503,000 and $580,000 was recorded in operating expenses for 2009 and 2008, respectively. The estimated amortization expense of acquisition intangibles in future years will be recorded in our Consolidated Statements of Income as follows (in thousands):
Fiscal Year Cost of Sales Acquisition related costs and amortization, net Total 2010 $ 2,701 $ 369 $ 3,070 2011 2,160 221 2,381 2012 1,126 206 1,332 2013 87 75 162 Thereafter — — — Total $ 6,074 $ 871 $ 6,945
Note 8 – Goodwill
The carrying amount of goodwill for 2008 and 2009 are as follows:
Amount(in thousands) Balance as of December 31, 2007 $ 54,111 Acquisitions/purchase accounting adjustments 10,818 Divestitures — Foreign currency translation impact (368 ) Balance as of December 31, 2008 $ 64,561 Acquisitions/purchase accounting adjustments — Divestitures — Foreign currency translation impact 218 Balance as of December 31, 2009 $ 64,779
The excess purchase price over the fair value of assets acquired is recorded as goodwill. As we have one operating segment, we allocate goodwill to one reporting unit for goodwill impairment testing. In accordance with FASB ASC 350, goodwill is tested for impairment on an annual basis, and between annual tests if indicators of potential impairment exist, using a fair-value-based approach based on the market capitalization of the reporting unit. Our annual impairment test was performed as of February 28, 2009. No impairment of goodwill has been identified during the period presented. Goodwill is deductible for tax purposes in certain jurisdictions.
The components of income before income taxes are as follows (in thousands):
Years Ended December 31, 2009 2008 2007 Domestic $ 34,953 $ 15,921 $ 31,685 Foreign 15,292 82,216 81,742 $ 50,245 $ 98,137 $ 113,427
The provision for income taxes charged to operations is as follows (in thousands):
Years Ended December 31, 2009 2008 2007 Current tax expense: U.S. federal $ 3,117 $ 14,631 $ 15,957 State 136 1,391 1,155 Foreign 13,760 18,910 9,925 Total current 17,013 34,932 27,037 Deferred tax expense (benefit): U.S. federal 9,920 (11,008 ) 628 State 387 (373 ) (156 ) Foreign (2,864 ) (1,570 ) (2,783 ) Total deferred 7,443 (12,951 ) (2,311 ) Change in valuation allowance 8,704 (8,671 ) (18,332 ) Total provision $ 33,160 $ 13,310 $ 6,394
Deferred tax liabilities (assets) at December 31, 2009 and 2008 as follows (in thousands):
December 31, 2009 2008 Capitalized software $ 5,978 $ 4,615 Depreciation and amortization 10,577 9,536 Unrealized gain on derivative instruments — 4,153 Undistributed earnings of foreign subsidiaries 9,278 10,075 Gross deferred tax liabilities 25,833 28,379 Operating loss carryforwards (57,422 ) (43,360 ) Intangible assets (44,159 ) (58,987 ) Vacation and other accruals (3,700 ) (4,890 ) Inventory valuation and warranty provisions (6,702 ) (12,665 ) Doubtful accounts and sales provisions (1,088 ) (1,512 ) Unrealized exchange loss (917 ) (1,345 ) Deferred revenue . (853 ) (71 ) Accrued rent expenses (111 ) (117 ) Accrued legal expenses (710 ) (1,466 ) Unrealized loss on derivative instruments (242 ) — 10% minority stock investment (900 ) (920 ) Stock-based compensation (4,483 ) (5,353 ) Research and development tax credit carryforward (2,054 ) — Foreign tax credit carryforward (1,775 ) — Other (657 ) (783 ) Gross deferred tax assets (125,773 ) (131,469 ) Valuation allowance 99,862 85,815 Net deferred tax liability (asset) $ (78 ) $ (17,275 )
A reconciliation of income taxes at the U.S. federal statutory income tax rate to the effective tax rate follows:
Years Ended December 31, 2009 2008 2007 U.S. federal statutory tax rate 35 % 35 % 35 % Domestic production activities — — (1 ) Foreign taxes (less) than federal statutory rate (6 ) (9 ) (14 ) Change in valuation allowance 17 (9 ) (16 ) Research and development tax credit (4 ) (2 ) (1 ) Tax exempt interest — (1 ) (1 ) State income taxes, net of federal tax benefit 1 1 1 Employee share-based compensation 7 2 2 Intercompany profit 15 (5 ) — Other 1 2 1 Effective tax rate 66 % 14 % 6 %
Certain prior year amounts in the reconciliation of income taxes at the U.S. federal statutory income tax rate to the effective tax rate have been reclassified to conform to the 2009 presentation as shown in the following tables:
2008 foreign taxes (less) than federal statutory rate as reported in prior year Form 10-K (14 ) Reclassification (a) 5 2008 foreign taxes (less) than federal statutory rate as reported in current year Form 10-K (9 ) 2008 intercompany profit as reported in prior year Form 10-K — Reclassification (a) (5 ) 2008 intercompany profit as reported in current year Form 10-K (5 )
(a) These amounts represent income taxes on intercompany profit previously included in foreign taxes (less) than the federal statutory rate and reclassified to intercompany profit for comparability to corresponding amounts reported in 2009. The reclassification did not have any impact on our total income tax expense.
For the year ended December 31, 2009, we generated a federal net operating loss of approximately $3.3 million and tax credits of approximately $3.8 million. The federal net operating loss can be carried back two years and the federal tax credits can be carried back one year.
As of December 31, 2009, eleven of our subsidiaries have available, for income tax purposes, foreign net operating loss carryforwards of an aggregate of approximately $286 million, of which $12.1 million expire during the years 2011 - - 2018 and $273.9 million of which may be carried forward indefinitely. Our tax valuation allowance relates to our ability to realize certain of these foreign net operating loss carryforwards and benefits of tax deductible goodwill in excess of book goodwill.
We maintain a manufacturing facility in Hungary. As a result of certain foreign investment incentives available under Hungarian law, the profit from our Hungarian operation was subject to a reduced income tax rate. This special tax status terminated on January 1, 2008, with the merger of our Hungary manufacturing operations with its Hungarian parent company. The merger was effective on January 1, 2008. The aggregate tax benefit of the exemption was $8.7 million lower, respectively, than if we had continued to account for share-based compensation under APB 25. Basic and diluted earnings per share for the year ended December 31, 2006 are $0.112007.
In 2003, we restructured the organization of our manufacturing operation in Hungary. The tax deductible goodwill in excess of book goodwill created by this restructuring resulted in our being required to record a gross deferred tax asset of $91.0 million. Because we did not expect to have sufficient taxable income in the relevant jurisdiction in future periods to realize the benefit of this deferred tax asset, a full valuation allowance was established. Following the approval of the merger of our Hungarian manufacturing operation with its Hungarian parent company in December 2007, we released $8.7 million and $0.11 lower,$18.3 million in 2008 and 2007, respectively, than if we had continued to account for share-based compensation under APB 25. Deferred stock-based compensation balancesof the valuation allowance previously required under APB 25 were adjusted against previously recorded common stock and additional paid-in capital balances upon adoption of SFAS 123R, as required. Had we previously recognized compensation costs as prescribed by SFAS 123, previously reported net income, basic earnings per share and diluted earnings per share would have changed to the pro forma amounts shown below (in thousands, except per share amounts):
Years Ended December 31,
2005
2004
Net income, as reported $ 61,517 $ 48,610 Stock-based compensation included in reported net income, net of related tax effects 959 — Total stock-based compensation expense determined under fair value method for all awards, net of related tax effects (13,998 ) (12,741 )
Pro-forma net income $ 48,478 $ 35,869
Earnings per share: Basic - as reported $ 0.78 $ 0.62 Basic - pro-forma $ 0.62 $ 0.46 Diluted - as reported $ 0.76 $ 0.59 Diluted - pro-forma $ 0.60 $ 0.44
Pro-forma disclosuresestablished for the excess tax deductible goodwill to reflect the tax benefit we expected to realize in future periods.
For the year 2009, we expected to recognize an additional tax benefit of $9.7 million related to these assets. Effective January 1, 2010, a new tax law in Hungary provides for an enhanced deduction for the qualified research and development expenses of NI Hungary Software and Hardware Manufacturing Kft. ("NI Hungary"). During the three months ended December 31, 2006 are2009, we obtained confirmation of the application of this new tax law for the qualified research and development expenses of NI Hungary. Based on the application of this new tax law to the qualified research and development expense of NI Hungary, we no longer expect to have sufficient future taxable income in Hungary to realize the benefits of these tax assets. As such, we recorded an income tax charge of $21.6 million during the three months ended December 31, 2009, $18.4 million of which was related to a valuation allowance on the previously recognized assets created by the restructuring and $3.2 million of which was related to tax benefits from other assets that we will no longer be able to realize as a result of this change. We do not presented becauseexpect to realize the amounts aretax benefit of the remaining assets created by the restructuring and therefore we have a full valuation allowance of $98.2 million against those assets at December 31, 2009.
We have not provided for U.S. federal income and foreign withholding taxes on approximately $267.5 million of certain non-U.S. subsidiaries’ undistributed earnings as of December 31, 2009. These earnings would become subject to taxes of approximately $85.7 million, if they were actually or deemed to be remitted to the parent company as dividends or if we should sell our stock in these subsidiaries. We intend to permanently reinvest the undistributed earnings.
We adopted the provisions of FASB ASC 740, on January 1, 2007. FASB ASC 740 clarifies the accounting for uncertainty in income taxes recognized in an entity's financial statements and prescribes a recognition threshold and measurement attribute for financial statement disclosure of tax positions taken or expected to be taken on a tax return. We recognized no material adjustment to the Consolidated Statementsliability for unrecognized income tax benefits. A reconciliation of Income.the beginning and ending amount of unrecognized tax benefit is as follows (in thousands):
2009 2008 Balance at beginning of period $ 9,364 $ 8,273 Additions based on tax positions related to the current year 2,060 1,946 Additions for tax positions of prior years 1,272 366 Reductions as a result of the lapse of the applicable statute of limitations (1,634 ) (1,221 ) Balance at end of period $ 11,062 $ 9,364
All of our unrecognized tax benefits at December 31, 2009 would affect our effective income tax rate if recognized. As of December 31, 2009, it is deemed reasonably possible that the Company will recognize tax benefits in the amount of $2.3 million in the next twelve months due to the closing of open tax years. The nature of the uncertainty relates to deductions taken on returns that have not been examined by the applicable tax authority.
We recognize interest and penalties related to income tax matters in income tax expense. During the years ended December 31, 2009 and 2008, we recognized interest expense related to uncertain tax positions of approximately $506,000 and $365,000, respectively. The tax years 2002 through 2009 remain open to examination by the major taxing jurisdictions in which we file income tax returns.
Note 10 – Stockholders’ equity and stock-based compensation
Stock option plans
Our stockholders approved the 1994 Incentive Stock Option Plan (the “1994 Plan”) on May 9, 1994. At the time of approval, 9,112,500 shares of our common stock were reserved for issuance under this plan. In 1997, an additional 7,087,500 shares of our common stock were reserved for issuance under this plan, and an additional 750,000 shares were reserved for issuance under this plan, as amended, in 2004. The 1994 Plan terminated in May 2005, except with respect to outstanding awards previously granted thereunder. Awards under the plan were either incentive stock options within the meaning of Section 422 of the Internal Revenue Code or nonqualified options. The right to purchase shares vests over a five to ten-year period, beginning on the date of grant. Vesting of ten year awards may accelerate based on the Company’s previous year’s earnings and revenue growth but shares cannot accelerate to vest over a period of less than five years. Stock options must be exercised within ten years from date of grant. Stock options were issued at the market price at the grant date. As part of the requirements of SFAS 123R, the Company isFASB ASC 718, we are required to estimate potential forfeitures of stock grants and adjust compensation cost recorded accordingly. The estimate of forfeitures will be adjusted over the requisite service period to the extent that actual forfeitures differ, or are expected to differ, from such estimates. Changes in estimated forfeitures will be recognized through a cumulative catch-up adjustment in the period of change and will also impact the amount of stock compensation expense to be recognized in future periods.
Transactions under all stock option plans are summarized as follows:Number of
shares under
option
Weighted
average
exercise
price
Outstanding at December 31, 2003 9,726,418 $ 18.07 Exercised (882,539 ) 9.60 Canceled (325,912 ) 27.66 Granted 1,262,599 29.71
Outstanding at December 31, 2004 9,780,566 $ 20.02 Exercised (1,188,614 ) 10.72 Canceled (358,444 ) 29.49 Granted 244,725 24.24
Outstanding at December 31, 2005 8,478,233 $ 21.05 Exercised (1,398,617 ) 13.16 Canceled (164,943 ) 27.32 Granted 0 0
Outstanding at December 31, 2006 6,914,673 $ 22.49
Options exercisable at December 31: 2004 6,353,236 $ 17.23 2005 5,946,139 19.10 2006 5,384,470 21.53
Number of
shares under
option
Weighted
average
fair value
Weighted average, grant date fair value of options granted during: 2004 1,262,599 $ 16.72 2005 244,725 12.85 2006 0 0
Number ofshares underoption Weightedaverageexerciseprice Outstanding at December 31, 2006 6,914,673 $ 22.49 Exercised (1,515,107 ) 15.22 Canceled (104,925 ) 27.33 Granted — — Outstanding at December 31, 2007 5,294,641 $ 24.47 Exercised (925,743 ) 17.30 Canceled (96,331 ) 26.98 Granted — — Outstanding at December 31, 2008 4,272,567 $ 25.97 Exercised (379,630 ) 15.40 Canceled (181,434 ) 26.80 Granted — — Outstanding at December 31, 2009 3,711,503 $ 26.93 Options exercisable at December 31: 2007 4,368,972 $ 24.17 2008 3,812,334 26.00 2009 3,493,574 26.94
The aggregate intrinsic value of stock options at exercise, represented in the table above, was $25.5$2.3 million, $19.1$11.0 million and $18.3$22.3 million for the years ended December 31, 2006, 20052009, 2008 and 2004,2007, respectively. Total unrecognized stock-based compensation expense related to non-vested stock options was approximately $18.1$2.5 million as of the end of 2006,December 31, 2009, related to approximately 1,530,000218,000 shares with a per share weighted average fair value of $15.93.$17.50. We anticipate this expense to be recognized over a weighted average period of approximately 4.04.3 years.Outstanding and Exercisable by Price Range
As of December 31, 2006
Options Outstanding
Options Exercisable
Range of Exercise prices
Number
outstanding
as of
12/31/2006
Weighted
average
remaining
contractual life
Weighted
average
exercise
price
Number
exercisable
as of
12/31/2006
Weighted
average
exercise price
$8.6667 -$12.2222 1,072,535 1.27 $ 10.98 1,045,669 $ 10.9677 12.3611 - 15.3055 976,976 1.54 $ 15.23 967,192 $ 15.2258 15.5555 - 21.0417 1,720,096 5.18 $ 20.64 1,223,332 $ 20.6330 21.2533 - 29.5400 839,349 6.80 $ 25.53 538,372 $ 25.5261 29.8500 - 34.3750 2,305,717 5.60 $ 31.19 1,609,905 $ 31.5078
$8.6667 - $34.3750 6,914,673 3.94 $ 22.4883 5,384,470 $ 21.5254
Outstanding and Exercisable by Price Range as of December 31, 2009 Options Outstanding Options Exercisable Range of Exercise prices Number outstanding as of 12/31/2009 Weighted average remaining contractual life Weighted average exercise price Number exercisable as of 12/31/2009 Weighted average exercise price $16.08 – $21.95 1,238,441 1.74 $ 20.69 1,188,337 $ 20.71 $22.30 – $29.85 1,257,625 3.90 $ 28.15 1,098,218 $ 28.08 $30.51 – $34.38 1,215,437 0.41 $ 32.02 1,207,019 $ 32.02 $16.08 – $34.38 3,711,503 2.04 $ 26.93 3,493,574 $ 26.94
The weighted average remaining contractual life of options exercisable as of December 31, 20062009 was 3.371.9 years. The aggregate intrinsic value of options outstanding as of December 31, 20062009 was $32.9$9.4 million. The aggregate intrinsic value of options currently exercisable as of December 31, 20062009 was $30.8$8.8 million. No options were granted in the yearyears ended December 31, 20062009, 2008 and 2007 as our incentive option plan terminated in May 2005. The fair value of options granted in 2004 and 2005 were estimated on the date of grant using the Black-Scholes option-pricing model with the following weighted-average assumptions:2005
2004
Dividend expense yield 0.2% 0.2% Expected life 5.5 years 5.5 years Expected volatility 43.3% 53.2% Risk-free interest rate 4.0% 2.7%
Restricted stock plan
Our stockholders approved theour 2005 Incentive Plan on May 10, 2005. At the time of approval, 2,700,000 shares of our common stock were reserved for issuance under this plan, as well as the number of shares which had been reserved but not issued under the 1994 Plan (our incentive stock option plan which terminated in May 2005), and any shares that returned to the 1994 Plan as a result of termination of options or repurchase of shares issued under such plan. The 2005 Plan, administered by the Compensation Committee of the Board of Directors, provides for granting of incentive awards in the form of restricted stock and restricted stock units (“RSUs”) to directors, executive officers and employees of the Company and its subsidiaries. Awards vest over a three, five or ten-year period, beginning on the date of grant. Vesting of ten year awards may accelerate based on the Company’s previous year’s earnings and growth but ten year awards cannot accelerate to vest over a period of less than five years. Shares available for grant at December 31, 20062009 were 3,804,106.2,089,302. As part of the requirements of SFAS 123R, the Company isFASB ASC 718, we are required to estimate potential forfeitures of restricted stock unitsRSUs and adjust compensation cost recorded accordingly. The estimate of forfeitures will be adjusted over the requisite service period to the extent that actual forfeitures differ, or are expected to differ, from such estimates. Changes in estimated forfeitures will be recognized through a cumulative catch-up adjustment in the period of change and will also impact the amount of stock compensation expense to be recognized in future periods.
Transactions under the restricted stock plan2005 Plan are summarized as follows:RSUs
Number of RSUs
Weighted Average Grant Price
Balance at January 1, 2005 0 $ 0.00 Granted 813,305 $ 22.24 Earned 0 $ 0.00 Canceled (15,000 ) $ 22.12
Balance at December 31, 2005 798,305 $ 22.24 Granted 693,805 $ 32.21 Earned (113,794 ) $ 31.67 Canceled (53,383 ) $ 25.93
Balance at December 31, 2006 1,324,933 $ 26.77
RSUs Number of RSUs Weighted Average Grant Price Balance at January 1, 2007 1,324,933 $ 26.77 Granted 801,780 $ 27.90 Earned (209,303 ) $ 27.85 Canceled (75,776 ) $ 27.64 Balance at December 31, 2007 1,841,634 $ 26.86 Granted 763,182 $ 28.51 Earned (320,251 ) $ 29.42 Canceled (119,337 ) $ 28.19 Balance at December 31, 2008 2,165,228 $ 26.99 Granted 604,083 $ 21.80 Earned (407,156 ) $ 22.04 Canceled (57,721 ) $ 27.88 Balance at December 31, 2009 2,304,434 $ 26.48
Total unrecognized stock-based compensation expense related to non-vested restricted stock unitsRSU’s was approximately $32.6$57.1 million as of the end of 2006,December 31, 2009, related to 1,324,9332,304,434 shares with a per share weighted average fair value of $27.24.$26.48. We anticipate this expense to be recognized over a weighted average period of approximately 77.3 years.
Employee stock purchase plan
Our employee stock purchase plan permits substantially all domestic employees and employees of designated subsidiaries to acquire our common stock at a purchase price of 85% of the lower of the market price at the beginning or the end of the participationpurchase period. On December 21, 2005, our Compensation Committee amended theThe plan has quarterly purchase periods to be quarterly beginning on November 1, February 1, May 1, and AugustNovember 1 of each year. The initial period commencedAt our annual shareholders meeting held on April 1, 2006 and ended on July 31, 2006.May 7, 2007, our shareholders approved an additional 3 million shares of common stock to be reserved for issuance under this plan. Employees may designate up to 15% of their compensation for the purchase of common stock.stock under this plan. Common stock reserved for future employee purchases aggregated 823,3091,755,071 shares at December 31, 2006.2009. Shares issued under this plan were 539,541838,536 in the year ended December 31, 2006.2009. The weighted average fair value of the employees’ purchase rights was $22.34$19.05 per share and was estimated using the Black-Scholes model with the following assumptions:2006
2005
2004
Dividend expense yield 0.2% 0.2% 0.2% Expected life 3 months 6 months 6 months Expected volatility 29% 29% 35% Risk-free interest rate 4.5% 3.2% 1.0%
2009 2008 2007 Dividend expense yield 0.5% 0.3% 0.3% Expected life 3 months 3 months 3 months Expected volatility 45% 26% 23% Risk-free interest rate 0.8% 3.8% 5.0%
Weighted average, grant date fair value of purchase rights granted under the Employee Stock Purchase Plan:Number of shares
Weighted average fair value
2004 380,211 $ 7.73 2005 467,932 6.08 2006 539,541 6.62
Plan are as follows:
Numberof shares Weightedaveragefair value 2007 549,719 $ 6.19 2008 679,983 5.86 2009 838,536 5.75
Stock-based compensation included in total cost of sales and operating expenses for the years ended December 31, 2009, 2008 and 2007 are summarized as follows (in thousands):
2009 2008 2007 Stock-based compensation Total cost of sales $ 1,284 $ 1,063 $ 911 Sales and marketing 8,774 8,479 7,322 Research and development 7,236 7,121 6,435 General and administrative 3,005 3,084 2,866 Provision for income taxes (3,765 ) (4,601 ) (3,839 ) Total $ 16,534 $ 15,146 $ 13,695
Authorized Preferred Stock and Preferred Stock Purchase Rights Plan
We have 5,000,000 authorized shares of preferred stock. On January 21, 2004, our Board of Directors designated 750,000 of these shares as Series A Participating Preferred Stock in conjunction with its adoption of a Preferred Stock Rights Agreement (the “Rights Agreement”) and declaration of a dividend of one preferred share purchase right (a “Right”) for each share of common stock outstanding held as of May 10, 2004 or issued thereafter. Each Right will entitle its holder to purchase one one-thousandth of a share of National Instruments’ Series A Participating Preferred Stock at an exercise price of $200, subject to adjustment, under certain circumstances. The Rights Agreement was not adopted in response to any effort to acquire control of National Instruments.
The Rights only become exercisable in certain limited circumstances following the tenth day after a person or group announces acquisitions of or tender offers for 20% or more of our common stock. In addition, if an acquirer (subject to certain exclusions for certain current stockholders of National Instruments, an “Acquiring Person”) obtains 20% or more of our common stock, then each Right (other than the Rights owned by an Acquiring Person or its affiliates) will entitle the holder to purchase, for the exercise price, shares of our common stock having a value equal to two times the exercise price. Under certain circumstances, our Board of Directors may redeem the Rights, in whole, but not in part, at a purchase price of $0.01 per Right. The Rights have no voting privileges and are attached to and automatically traded with our common stock until the occurrence of specified trigger events. The Rights will expire on the earlier of May 10, 2014 or the exchange or redemption of the Rights. Comprehensive income
Our comprehensive income is comprised of net income, foreign currency translation and unrealized gains and losses on forward and option contracts and securities available for sale. Comprehensive income for 2006, 2005 and 2004 was $76.9 million, $57.2 million and $57.7 million, respectively.
Recently issued accounting pronouncements
In July 2006, the Financial Accounting Standards Board (“FASB”) issued FASB Interpretation (“FIN”) 48,Accounting for Uncertainty in Income Taxes – an interpretation of Statement of Financial Accounting Standards (“SFAS”) 109. This interpretation clarifies the accounting for uncertainty in income taxes recognized in an entity’s financial statements in accordance with SFAS 109,Accounting for Income Taxes. It prescribes a recognition threshold and measurement attribute for financial statement disclosure of tax positions taken or expected to be taken on a tax return. This interpretation is effective for fiscal years beginning after December 15, 2006. We adopted FIN 48 on January 1, 2007 as required. The cumulative effect of adopting FIN 48 was recorded in retained earnings upon adoption. The adoption of FIN 48 did not have a significant impact on our financial position or results of operations.
In September 2006, the Securities and Exchange Commission (“SEC”) issued Staff Accounting Bulletin (“SAB”) 108 regarding the process of quantifying financial statement misstatements. SAB 108 states that registrants should use both a balance sheet approach and an income statement approach when quantifying and evaluating the materiality of a misstatement. The interpretations in SAB 108 contain guidance on correcting errors under the dual approach as well as provide transition guidance for correcting errors. This interpretation does not change the requirements within SFAS 154,Accounting Changes and Error Corrections – a replacement of APB 20 and FASB Statement 3, for the correction of an error on financial statements. SAB 108 is effective for annual financial statements covering the first fiscal year ending after November 15, 2006. We adopted this interpretation on December 31, 2006. The adoption of SAB 108 did not have a significant effect on our consolidated financial statements.
In September 2006, the FASB issued SFAS 157,Fair Value Measurements. This standard defines fair value, establishes a framework for measuring fair value in accounting principles generally accepted in the United States of America, and expands disclosure about fair value measurements. This pronouncement applies under other accounting standards that require or permit fair value measurements. Accordingly, this statement does not require any new fair value measurement. This statement is effective for fiscal years beginning after November 15, 2007, and interim periods within those fiscal years. We will be required to adopt SFAS 157 in the first quarter of fiscal year 2008. We are currently evaluating the requirements of SFAS 157 and have not yet determined the impact on our consolidated financial statements.
In March 2006, the Emerging Issues Task Force (“EITF”) reached a consensus on EITF Issue 06-3,How Taxes Collected from Customers and Remitted to Governmental Authorities Should Be Presented in the Income Statement (that is, Gross versus Net Presentation). Taxes within the scope of EITF Issue 06-3 include any taxes assessed by a governmental authority that are directly imposed on a revenue-producing transaction between a seller and a customer and may include, but are not limited to, sales taxes, use taxes, value-added taxes, and some excise taxes. The EITF concluded that the presentation of these taxes on either a gross (included in revenues and costs) or a net (excluded from revenue) basis is an accounting policy decision that should be disclosed. For any such taxes that are reported on a gross basis, a company should disclose the amounts of those taxes in interim and annual financial statements. Our policy is to exclude all such taxes from revenue. The provisions of EITF 06-3 are effective for interim and annual reporting periods beginning after December 15, 2006. The adoption of EITF 06-3 will not have any effect on our consolidated financial statements.
Note 2: Short-term investments
Short-term investments at December 31, 2006 and 2005, consisting of corporate, state and municipal securities, were acquired at an aggregate cost of $150.2 million and $119.8 million, respectively. The contractual maturities of these securities, which are classified as available-for-sale and carried at fair value, are as follows (in thousands):
December 31,
2006
2005
Less than 90 days $ 73,787 $ 61,855 90 days to one year 31,309 42,222 One year through two years 38,559 11,877 Two years or more 6,535 3,892
$ 150,190 $ 119,846
Note 3: Inventories
Inventories, net consist of the following (in thousands):
December 31,
2006
2005
Raw materials $ 38,270 $ 28,497 Work-in-process 4,321 4,634 Finished goods 34,547 29,696
$ 77,138 $ 62,827
Note 4: Property and equipment
Property and equipment consist of the following (in thousands):
December 31,
2006
2005
Land $ 7,165 $ 7,085 Buildings 125,228 124,428 Furniture and equipment 110,710 91,073
243,103 222,586 Accumulated depreciation (97,678 ) (78,256 )
$ 145,425 $ 144,330
Depreciation expense for the years ended December 31, 2006, 2005 and 2004, was $20.2 million, $17.8 million and $17.3 million, respectively.
Note 5: Intangibles
Intangibles at December 31, 2006 and 2005 are as follows:
2006
2005
Gross Carrying Amount
Accumulated Amortization
Net Carrying Amount
Gross Carrying Amount
Accumulated Amortization
Net Carrying Amount
Capitalized software development costs $ 57,571 $ (41,791 ) $ 15,780 $ 50,201 $ (32,651 ) $ 17,550 Acquired technology 20,814 (9,734 ) 11,080 20,257 (6,296 ) 13,961 Patents 12,928 (3,076 ) 9,852 11,647 (2,445 ) 9,202 Other 6,452 (3,099 ) 3,353 4,826 (1,937 ) 2,889
$ 97,765 $ (57,700 ) $ 40,065 $ 86,931 $ (43,329 ) $ 43,602
Software development costs capitalized during 2006, 2005 and 2004 were $7.4 million, $13.4 million and $5.0 million, respectively, and related amortization was $9.1 million, $7.2 million and $6.6 million, respectively. Amortization of capitalized software development costs is computed on an individual product basis for those products available for market and is recognized based on the product’s estimated economic life, generally three years. Patents are amortized using the straight-line method over their estimated period of benefit, generally ten to seventeen years. Total intangible assets amortization expenses were $13.9 million, $10.7 million and $8.3 million for the years ended December 31, 2006, 2005 and 2004, respectively.
Capitalized software development costs, acquired technology, patents and other have weighted-average useful lives of 2.1 years, 4.1 years, 7.7 years and 3.7 years, respectively, as of the end of December 31, 2006. The estimated future amortization expense related to intangible assets as of December 31, 2006 is as follows:
Amount (in thousands)
2007 $ 13,044 2008 10,219 2009 5,046 2010 2,477 2011 1,569 Thereafter 7,710
$ 40,065
We established a valuation reserve in 2004 for the estimated total impairment of our $2.5 million cost-method investment in a start-up company. This impairment was based on our lack of expected recovery of our investment based on the start-up company’s lack of profitability.
Note 6: Goodwill
The carrying amount of goodwill for 2005 and 2006 are as follows:
Amount (in thousands)
Balance as of December 31, 2004 $ 13,356 Acquisitions/purchase accounting adjustments 39,177 Divestitures —
Balance as of December 31, 2005 52,533 Acquisitions/purchase accounting adjustments — Divestitures — Foreign currency translation impact 810
Balance as of December 31, 2006 $ 53,343
The excess purchase price over the fair value of assets acquired is recorded as goodwill. In accordance with SFAS 142,Goodwill and Other Intangible Assets, goodwill is tested for impairment on an annual basis, and between annual tests if indicators of potential impairment exist, using a fair-value-based approach. Our annual impairment test was performed on April 6, 2006. No impairment of goodwill was identified during any of the periods presented.
Note 7: Income taxes
The components of income before income taxes are as follows (in thousands):
Years Ended December 31,
2006
2005
2004
Domestic $ 40,681 $ 40,460 $ 37,786 Foreign 54,621 40,220 27,027
$ 95,302 $ 80,680 $ 64,813
The provision for income taxes charged to operations is as follows (in thousands):
Years Ended December 31,
2006
2005
2004
Current tax expense: U.S. federal $ 17,966 $ 11,022 $ 10,594 State 901 1,029 1,106 Foreign 5,190 3,725 3,300
Total current 24,057 15,776 15,000
Deferred tax expense (benefit): U.S. federal (1,233 ) 2,396 1,041 State (90 ) (102 ) 121 Foreign (140 ) 1,093 41
Total deferred (1,463 ) 3,387 1,203
Total provision $ 22,594 $ 19,163 $ 16,203
Deferred tax liabilities (assets) at December 31, 2006 and 2005 as follows (in thousands):
December 31,
2006
2005
Capitalized software $ 5,392 $ 6,288 Unrealized gain on derivative instruments — 86 Depreciation and amortization 9,071 8,598 Unrealized exchange gain 2 1,238 Undistributed earnings of foreign subsidiaries 10,313 4,410
Gross deferred tax liabilities 24,778 20,620
Operating loss carryforwards (34,154 ) (22,672 ) Intangibles (85,684 ) (71,125 ) Vacation and other accruals (3,783 ) (2,946 ) Inventory valuation and warranty provisions (6,666 ) (9,043 ) Doubtful accounts and sales provisions (1,328 ) (1,545 ) Intercompany profit (3,242 ) (2,442 ) Deferred revenue (2,613 ) — Accrued rent expenses (17 ) (17 ) Accrued legal expenses (1,450 ) (12 ) Unrealized loss on derivative instruments (149 ) — 10% minority stock investment (906 ) (911 ) Stock-based compensation (1,954 ) (563 ) Other (691 ) (629 )
Gross deferred tax assets (142,637 ) (111,905 )
Valuation allowance 117,768 91,534
Net deferred tax liability (asset) $ (91 ) $ 249
A reconciliation of income taxes at the U.S. federal statutory income tax rate to the effective tax rate follows:
Years Ended December 31,
2006
2005
2004
U.S. federal statutory tax rate 35 % 35 % 35 % Foreign sales corporation/ETI benefit (1 ) (2 ) (3 ) Domestic production activities (1 ) (1 ) — Foreign taxes more (less) than federal statutory rate (11 ) (7 ) (6 ) Change in valuation allowance — (1 ) — Research and development tax credit (1 ) (1 ) (1 ) Tax exempt interest (1 ) (1 ) (1 ) State income taxes, net of federal tax benefit 1 1 1 Employee share-based compensation 3 — — Other — 1 —
Effective tax rate 24 % 24 % 25 %
As of December 31, 2006, thirteen of our subsidiaries have available, for income tax purposes, foreign net operating loss carryforwards of an aggregate of approximately $214.4 million, of which $8.5 million expire during the years 2008 — 2013 and $205.9 million of which may be carried forward indefinitely. Our tax valuation allowance relates to the realizability of certain of these foreign net operating loss carryforwards and benefits of tax deductible goodwill in excess of book goodwill.
We maintain a manufacturing facility in Hungary. As a result of certain foreign investment incentives available under Hungarian law, the profit from our Hungarian operation is currently subject to a reduced income tax rate. Based on our capital investment in Hungary and current exemption limits which apply to this and any capital investments made through December 31, 2005, we currently expect this special tax status will terminate on or before December 31, 2008. The aggregate tax benefit of the exemption was $5.4 million and $3.4 million for the years ended December 31, 2006 and 2005, respectively.
In 2003, we restructured the organization of our manufacturing operation in Hungary. The tax deductible goodwill in excess of book goodwill created by this restructuring resulted in our being required to record a gross deferred tax asset of $91.0 million. The amortization of this excess tax deductible goodwill resulted in a $32.1 million and $20.1 million deferred tax asset for the associated net operating loss for the years ended December 31, 2006 and 2005, respectively. As of December 31, 2006 and 2005, the gross deferred tax asset related to the excess tax goodwill was $85.7 million and $71.1 million, respectively. Because we do not expect to have significant taxable income in the relevant jurisdiction in future periods to realize the benefit of these deferred tax assets, a valuation allowance for the entire amount of these deferred tax assets has been established.
We have not provided for U.S. federal income and foreign withholding taxes on approximately $111.8 million of certain non-U.S. subsidiaries’ undistributed earnings as of December 31, 2006. These earnings would become subject to taxes of approximately $36.5 million, if they were actually or deemed to be remitted to the parent company as dividends or if we should sell our stock in these subsidiaries. We currently intend to reinvest indefinitely these undistributed earnings.
Note 8: Stockholders’ equity
Stock repurchases and retirements In
Since 1998, our Board of Directors approved theand we maintained various stock repurchase and retirement of shares of common stock to reduce the dilutive effect of our stock plans.programs. Pursuant to the 1998 repurchase programthese plans we have repurchasedhad purchased and retired a total of 1,402,7257,354,966 shares for approximately $23.1$184.9 million from 1998 through December 31, 2007. During 2008, we purchased an additional 4,110,042 share for approximately $103.6 million. In 2002,At December 31, 2008, there were 723,092 shares available for repurchase under the plan approved in April 2008. On January 23, 2009, our Board of Directors approved a new share repurchase and retirement plan which replacedthat increased the 1998 plan. Underaggregate number of shares of common stock we are authorized to purchase from 591,324 to 3.0 million. During 2009, we purchased an additional 1,443,441 shares for approximately $34.6 million. At December 31, 2009, there were 1,688,327 shares available for repurchase under the plan approved in 2002, weJanuary 2009. Our share repurchase plan does not have authorization to repurchase up to 6,222,106 shares of National Instruments stock. This plan has noan expiration date. Pursuant to our repurchase program, we have repurchased and retired a total of 3,222,106 shares for approximately $82.0 million.
Note 9:11 – Employee retirement plan
We have a defined contribution retirement plan pursuant to Section 401(k) of the Internal Revenue Code. Substantially all domestic employees with at least thirty30 days of continuous service are eligible to participate and may contribute up to 15% of their compensation. The Board of Directors has elected to make matching contributions equal to 50% of employee contributions, which may be applied to a maximum of 6% of each participant’s compensation. Employees are eligible for our matching contributions after one year of continuous service. Company contributions vest immediately. Our policy prohibits participants from direct investment in shares of our common stock within the plan. Company contributions charged to expense were $3.0$3.9 million, $2.6$3.7 million and $2.4$3.3 million in 2006, 20052009, 2008 and 2004,2007, respectively.
Fair value of financial instrumentsIn accordance with FASB ASC 280, Segment Reporting (FASB ASC 280), we determine operating segments using the management approach. The estimated fair value amounts disclosed below have been determined using available market informationmanagement approach designates the internal organization that is used by management for making operating decisions and valuation methodologies described below. For certainassessing performance as the source of our financial instruments, including cashoperating segments. It also requires disclosures about products and cash equivalents, accounts receivable, accounts payableservices, geographic areas and accrued liabilities,major customers.
We have defined our operating segment based on geographic regions. We sell our products in three geographic regions. Our sales to these regions share similar economic characteristics, similar product mix, similar customers, and similar distribution methods. Accordingly, we have elected to aggregate these three geographic regions into a single operating segment. Revenue from the carrying amount approximates fair value due to the short-term maturity of these instruments. The estimated fair values of the other assets (liabilities)sale of our remaining financial instruments at December 31, 2006products which are similar in nature and 2005software maintenance are reflected as total net sales in our Consolidated Statements of Income.
Total net sales, operating income, interest income and long-lived assets, classified by the major geographic areas in which we operate, are as follows (in thousands):December 31,
2006
2005
Carrying
Amount
Fair
Value
Carrying
Amount
Fair
Value
Short-term investments $ 150,190 $ 150,190 $ 119,846 $ 119,846 Other assets/liabilities: Forward contracts (1,043 ) (1,043 ) 523 523
The fair values of short-term investments
Years Ended December 31, 2009 2008 2007 Net sales: Americas: Unaffiliated customer sales $ 292,999 $ 355,878 $ 331,482 Geographic transfers 86,145 132,563 115,709 379,144 488,441 447,191 Europe: Unaffiliated customer sales 210,188 267,373 230,940 Geographic transfers 189,076 204,282 159,992 399,264 471,655 390,932 Asia Pacific: Unaffiliated customer sales 173,407 197,286 177,956 Eliminations (275,221 ) (336,845 ) (275,701 ) $ 676,594 $ 820,537 $ 740,378
Years Ended December 31, 2009 2008 2007 Operating income: Americas $ 46,816 $ 71,467 $ 76,292 Europe 87,250 105,748 92,469 Asia Pacific 45,439 61,642 59,845 Unallocated: Research and development expenses (132,974 ) (143,140 ) (126,515 ) $ 46,531 $ 95,717 $ 102,091
Years Ended December 31, 2009 2008 2007 Interest income: Americas $ 803 $ 2,603 $ 5,138 Europe 727 3,291 4,485 Asia Pacific 99 102 199 $ 1,629 $ 5,996 $ 9,822
December 31, 2009 2008 Long-lived assets: Americas $ 100,489 $ 107,701 Europe 36,555 39,280 Asia Pacific 16,221 7,496 $ 153,265 $ 154,477
Total sales outside the United States for 2009, 2008 and foreign currency forward contracts2007 were estimated based upon quotes from brokers as of the applicable balance sheet date.$412.7 million, $499.3 million and $437.0 million, respectively.
Note 11: Derivative instruments13 – Commitments, contingencies and hedging activitiesleases
We have operations in 40 countries. Approximately 52% of our revenues are generated outsidecommitments under non-cancelable operating leases primarily for office facilities throughout the Americas. Our activities exposeworld. Certain leases require us to a varietypay property taxes, insurance and routine maintenance, and include escalation clauses. Future minimum lease payments as of market risks, includingDecember 31, 2009, for each of the effects of changes in foreign-currency exchange rates. These financial risksnext five years are monitored and managed by us as an integral part of our overall risk management program. We maintain a foreign-currency risk management strategy that uses derivative instruments (foreign currency forward and purchased options contracts) to protect our earnings and cash flows from fluctuations caused by the volatility in currency exchange rates. Movements in foreign-currency exchange rates pose a risk to our operations and competitive position, since exchange rate changes may affect our profitability and cash flow, and the business or pricing strategies of our non-U.S. based competitors.
Foreign currency fair value and cash flow hedges
The vast majority of our foreign sales are denominated in the customers’ local currency. We purchase foreign currency forward and purchased options contracts as hedges of forecasted sales that are denominated in foreign currencies and as hedges of foreign currency denominated receivables. These contracts are entered into to protect against the risk that the eventual dollar-net-cash inflows resulting from such sales or firm commitments will be adversely affected by changes in exchange rates.
We held forward contracts with notional amounts totaling $19.6follows (in thousands):
2010 $ 14,415 2011 9,898 2012 6,982 2013 4,611 2014 3,665 Thereafter 12,130 $ 51,701
Rent expense under operating leases was approximately $12.3 million, $11.7 million and $24.1$10.2 million at December 31, 2006 and 2005, respectively, that were designated as foreign currency fair value hedges of our foreign denominated receivables. The fair value of these contracts, which are for 90-day periods, is a liability of $617,000 and a receivable of $278,000 at December 31, 2006 and 2005, respectively. We recorded net losses of $1.0 million, net gains of $2.2 million and net losses of $2.6 million for fair value hedges for the years ended December 31, 2006, 20052009, 2008 and 2004, respectively, which was recorded2007, respectively.
As of December 31, 2009, we have non-cancelable purchase commitments with various suppliers of customized inventory and inventory components totaling approximately $6.5 million over the next twelve months.
As of December 31, 2009, we have outstanding guarantees for payment of customs and foreign grants totaling approximately $5.2 million.
Note 14 – Litigation
We filed a patent infringement action on January 25, 2001, in “Foreign Exchange Gain (Loss).” We hedge up to 90%the U.S. District Court, Eastern District of Texas (Marshall Division) claiming that The MathWorks, Inc. (“MathWorks”) infringed certain of our outstanding foreign denominated receivables. We held forward contracts withU.S. patents. On January 30, 2003, a notionaljury found infringement by MathWorks of three of the patents involved and awarded us specified damages. On September 23, 2003, the District Court entered final judgment in favor of us and entered an injunction against MathWorks’ sale of its Simulink and related products and stayed the injunction pending appeal. Upon appeal, the judgment and the injunction were affirmed by the U.S. Court of Appeals for the Federal Circuit (September 3, 2004). Subsequently the stay of injunction was lifted by the District Court. In November 2004, the final judgment amount of $26.6$7.4 million which had been held in escrow pending appeal was released to us.
An action was filed by MathWorks against us on September 22, 2004, in the U.S. District Court, Eastern District of Texas (Marshall Division), claiming that on that day MathWorks had released modified versions of its Simulink and $7.1related products, and seeking a declaratory judgment that the modified products do not infringe the three patents adjudged infringed in the District Court's decision of September 23, 2003 (and affirmed by the Court of Appeals on September 3, 2004). On November 2, 2004, MathWorks served the complaint on us. We filed an answer to MathWorks’ declaratory judgment complaint, denying MathWorks’ claims of non-infringement and alleging our own affirmative defenses. On January 5, 2005, the Court denied a contempt motion by us to enjoin the modified Simulink products under the injunction in effect from the first case. On January 7, 2005, we amended our answer to include counterclaims that MathWorks’ modified products are infringing three of our patents, and requested unspecified damages and an injunction. MathWorks filed its reply to our counterclaims on February 7, 2005, denying the counterclaims and alleging affirmative defenses. On March 2, 2005, we filed a notice of appeal regarding the Court's denial of the contempt motion. On March 15, 2005, the Court stayed MathWorks’ declaratory judgment action, pending a decision on the appeal by the Court of Appeals for the Federal Circuit. On February 9, 2006, the Court of Appeals for the Federal Circuit affirmed the District Court’s January 2005 order. On November 22, 2006, the District Court lifted the stay. The case schedule has yet to be set in this action. During the fourth quarter of 2004, we accrued $4 million at December 31, 2006 and 2005, respectively, that were designated as foreign currency cash flow hedges related to our probable loss from this contingency, which consists entirely of anticipated sales transactions.patent defense costs that are probable of being incurred. In the fourth quarter of 2006, we accrued an additional $600,000 related to this contingency. During the third quarter of 2009, we reduced the accrual by $2 million to reflect a decrease in the estimated costs that are probable of being incurred in this action. To date, we have charged a cumulative total of $623,000 against this accrual. At December 31, 2009, the remaining accrual was $2 million.
On February 1, 2008, we acquired all of the outstanding shares of microLEX Systems ApS, (“microLEX”) a premier provider of virtual instrumentation-based video, audio and mixed-signal test solutions. This acquisition was accounted for as a business combination. The purchase price of the acquisition, which included legal and accounting fees, was $17.8 million in cash. The allocation of the purchase price was determined using the fair value of these contracts, whichassets and liabilities acquired as of February 1, 2008. We funded the purchase price from existing cash balances. Our consolidated financial statements include the operating results from the date of acquisition. Pro-forma results or operations have not been presented because the effects of those operations were not material. The following table summarizes the allocation of the purchase price of microLEX (in thousands):
Goodwill $ 10,818 Acquired core technology 5,201 Non-competition agreements 159 Trademarks 119 Customer relationships 354 Current assets acquired 3,057 Long-term assets acquired 20 Current liabilities assumed (486 ) Deferred tax liabilities (1,458 ) Total assets acquired $ 17,784
Goodwill is not deductible for tax purposes. Existing technology, non-competition agreements, trademarks, and customer relationships have useful lives of 5 years, 3 years, 3 years, and 5 years, respectively, from the date of acquisition. These assets are not deductible for terms uptax purposes.
Note 16 – Quarterly results (unaudited)
The following quarterly results have been derived from unaudited consolidated financial statements that, in the opinion of management, reflect all adjustments (consisting only of normal recurring adjustments) necessary for a fair presentation of such quarterly information. The operating results for any quarter are not necessarily indicative of the results to twelve months, is a liabilitybe expected for any future period. The unaudited quarterly financial data for each of $427,000 and a receivable of $245,000 at December 31, 2006 and 2005, respectively, and a net unrealized deferred loss of $427,000 and a net unrealized deferred gain of $245,000 at December 31, 2006 and 2005, respectively, was recordedthe eight quarters in “Accumulated Other Comprehensive Income.” We hedge up to 100% of anticipated foreign currency denominated sales transactions for up to 40 months. We recorded net losses of $1.0 million and net gains of $105,000 and net losses of $5.8 million for cash flow hedges for the two years ended December 31, 2006, 2005 and 2004, respectively, which was included in “Net Sales.” As of December 31, 2006, $427,000 of deferred losses on cash flow hedges recorded in “Accumulated Other Comprehensive Income” are expected to be reclassified to earnings during the next twelve months. The actual foreign sales expected to occur over the next twelve months will necessitate the reclassifying to earnings of these derivative gains.
Hedge effectiveness of a foreign currency option contract designated as a cash flow hedge is measured by comparing the hedging instrument’s cumulative change in fair value from inception to maturity to the forecasted transaction’s terminal value. No amounts were excluded from the assessment of hedge effectiveness nor were there any amounts of ineffectiveness recorded in the consolidated statements of income for the years ended December 31, 2006 and 2005.
Note 12: Segment information
In accordance with SFAS 131,Disclosures about Segments of an Enterprise and Related Information, we determine operating segments using the management approach. The management approach designates the internal organization that is used by management for making operating decisions and assessing performance as the source of our operating segments. It also requires disclosures about products and services, geographic areas and major customers.
While we sell our products to many different markets, management has chosen to organize the Company by geographic areas, and as a result has determined that we have one operating segment. Substantially all of the interest income, depreciation and amortization is recorded in the Americas. Net sales, operating income and identifiable assets, classified by the major geographic areas in which we operate,2009 are as follows (in thousands)thousands, except per share data):
Years Ended December 31,
2006
2005
2004
Net sales: Americas: Unaffiliated customer sales $ 317,780 $ 275,524 $ 243,651 Geographic transfers 125,096 87,072 84,520
442,876 362,596 328,171
Europe: Unaffiliated customer sales 193,364 171,499 164,895 Geographic transfers 159,369 125,650 99,958
352,733 297,149 264,853
Asia Pacific: Unaffiliated customer sales 149,263 124,818 105,542
Eliminations (284,465 ) (212,722 ) (184,478 )
$ 660,407 $ 571,841 $ 514,088
Years Ended December 31,
2006
2005
2004
Operating income: Americas $ 67,644 $ 63,267 $ 53,472 Europe 78,402 61,790 55,705 Asia Pacific 54,771 40,996 38,211 Unallocated: Research and development expenses (113,095 ) (87,841 ) (84,692 )
$ 87,722 $ 78,212 $ 62,696
December 31,
2006
2005
Identifiable assets: Americas $ 476,027 $ 436,170 Europe 188,388 129,420 Asia Pacific 56,805 42,746
$ 721,220 $ 608,336
Total sales outside
Three Months Ended Mar. 31,2009 Jun. 30,2009 Sep. 30,2009 Dec. 31,2009 Net sales $ 157,799 $ 152,163 $ 165,035 $ 201,597 Gross profit 116,916 111,677 123,136 154,981 Operating income (2,479 ) 2,341 10,688 35,981 Net income 358 4,430 9,931 2,366 Basic earnings per share $ 0.00 $ 0.06 $ 0.13 $ 0.03 Weighted average shares outstanding-basic 77,277 77,556 77,653 77,589 Diluted earnings per share $ 0.00 $ 0.06 $ 0.13 $ 0.03 Weighted average shares outstanding-diluted 77,436 77,824 78,103 78,325 Dividends declared per share $ 0.12 $ 0.12 $ 0.12 $ 0.12
Three Months Ended Mar. 31,2008 Jun. 30,2008 Sep. 30,2008 Dec. 31,2008 Net sales $ 192,918 $ 210,474 $ 215,038 $ 202,107 Gross profit 143,849 157,034 160,531 152,014 Operating income 18,065 27,834 27,946 21,872 Net income 17,616 24,734 23,159 19,318 Basic earnings per share $ 0.22 $ 0.32 $ 0.29 $ 0.25 Weighted average shares outstanding-basic 78,840 78,484 78,834 78,110 Diluted earnings per share $ 0.22 $ 0.31 $ 0.29 $ 0.25 Weighted average shares outstanding-diluted 79,825 79,549 79,841 78,522 Dividends declared per share $ 0.11 $ 0.11 $ 0.11 $ 0.11
Note 17 – Subsequent events
In accordance with FASB ASC 855, Subsequent Events (FASB ASC 855), we have evaluated subsequent events through February 17, 2010, the United States for 2006, 2005 and 2004date the financial statements were $373.7 million, $323.9 million and $293.3 million, respectively.issued.
On January 22, 2010, our Board of Directors declared a quarterly cash dividend of $0.13 per common share, payable March 1, 2010, to shareholders of record on February 8, 2010.
From January 29, 2010 to February 12, 2010, we have repurchased 683,832 shares of our common stock at an average price of $29.97 under our share repurchase plan. The maximum number of shares that may yet be purchased under our plan is 1,004,495. Our purchase plan does not have an expiration date.
Note 13: Commitments, contingencies and leases
We have commitments under non-cancelable operating leases primarily for office facilities. Certain leases require us to pay property taxes, insurance and routine maintenance, and include escalation clauses. Future minimum lease payments as of December 31, 2006, for each of the next five years are as follows (in thousands):
2007 $ 7,241 2008 5,682 2009 4,883 2010 3,103 2011 1,983 Thereafter 799
$ 23,691
Rent expense under operating leases was approximately $8.7 million, $7.8 million and $6.5 million for the years ended December 31, 2006, 2005 and 2004, respectively.
As of December 31, 2006, we have non-cancelable purchase commitments with various suppliers of customized inventory and inventory components totaling approximately $7.0 million over the next twelve months.
As of December 31, 2006, we have outstanding guarantees for payment of customs and foreign grants totaling approximately $3.5 million.
Note 14: ��Litigation
We filed a patent infringement action on January 25, 2001 in the U.S. District Court, Eastern District of Texas (Marshall Division) claiming that The MathWorks, Inc. (“MathWorks”) infringed certain of our U.S. patents. On January 30, 2003, a jury found infringement by MathWorks of three of the patents involved and awarded us specified damages. On June 23, 2003, the District Court entered final judgment in favor of us and entered an injunction against MathWorks’ sale of its Simulink and related products and stayed the injunction pending appeal. Upon appeal, the judgment and the injunction were affirmed by the U.S. Court of Appeals for the Federal Circuit (September 3, 2004). Subsequently the stay of injunction was lifted by the District Court. In November 2004, the final judgment amount of $7.4 million which had been held in escrow pending appeal was released to us.
An action was filed by MathWorks against us on September 22, 2004, in the U.S. District Court, Eastern District of Texas (Marshall Division), claiming that on that day MathWorks had released modified versions of its Simulink and related products, and seeking a declaratory judgment that the modified products do not infringe the three patents adjudged infringed in the District Court’s decision of June 23, 2003, (and affirmed by the Court of Appeals on September 3, 2004). On November 2, 2004, MathWorks served the complaint on us. We filed an answer to MathWorks’ declaratory judgment complaint, denying MathWorks’ claims of non-infringement and alleging our own affirmative defenses. On January 5, 2005, the Court denied a contempt motion by us to enjoin the modified Simulink products under the injunction in effect from the first case. On January 7, 2005, we amended our answer to include counterclaims that MathWorks’ modified products are infringing three of our patents, and requested unspecified damages and an injunction. MathWorks filed its reply to our counterclaims on February 7, 2005, denying the counterclaims and alleging affirmative defenses. On March 2, 2005, we filed a notice of appeal regarding the Court’s denial of the contempt motion. On March 15, 2005, the Court stayed MathWorks’ declaratory judgment action, pending a decision on the appeal by the Court of Appeals for the Federal Circuit. On February 9, 2006, the Court of Appeals for the Federal Circuit affirmed the District Court’s January 2005 order. On November 22, 2006, the District Court lifted the stay. The case schedule has yet to be set in this action. During the fourth quarter of 2004, we accrued $4 million related to our probable loss from this contingency, which consists entirely of anticipated patent defense costs that are probable of being incurred. In the fourth quarter of 2006, we accrued an additional $600,000 related to this contingency. We charged approximately $57,000 against this accrual during the fourth quarter of 2006. We have charged a total of $602,000 against this accrual through December 31, 2006.
Note 15: Acquisitions
On January 31, 2005, we acquired all of the common stock of Toronto, Canada-based Electronics Workbench, a supplier of electronics design automation software. The acquisition was accounted for as a purchase. The purchase price of the acquisition, subject to adjustment as provided for in the purchase agreement, was $12.1 million in cash. We funded the purchase price from existing cash balances. Our consolidated financial statements include the operating results from the date of acquisition. Pro-forma results of operations have not been presented because the effects of those operations were not material. In accordance with SFAS 141, Business Combinations, the total purchase consideration has been allocated to the assets acquired and liabilities assumed, including identifiable intangible assets, based on their respective estimated fair values at the date of acquisition.
On April 29, 2005, we acquired the operating assets of Measurement Computing Corporation (MCC), a provider of low-cost data acquisition products. The acquisition was accounted for as a purchase. We acquired the operating assets of MCC, which included the legal positions of MCC and SoftWIRE in litigation against us. As a result of the asset acquisition, a pending legal action was dismissed with prejudice and we eliminated our remaining $1.9 million accrual for patent defense costs related to MCC. The gain that resulted from the elimination of the accrual was recorded in general and administrative expenses. The purchase price of the acquisition, subject to adjustment as provided for in the purchase agreement, was $33.2 million in cash. We funded the purchase price from existing cash balances. Our consolidated financial statements include the operating results from the date of acquisition. Pro-forma results of operations have not been presented because the effects of those operations were not material. In accordance with SFAS 141, the total purchase consideration has been allocated to the assets acquired and liabilities assumed, including identifiable assets, based on their respective estimated fair values at the date of acquisition.
On October 17, 2005, we acquired the operating assets of IOtech, Inc., a provider of PC-based data acquisition and instrumentation products. The acquisition was accounted for as a purchase. The purchase price of the acquisition, subject to adjustment as provided for in the purchase agreement, was $17.6 million in cash. We funded the purchase price from existing cash balances. Our consolidated financial statements include the operating results from the date of acquisition. Pro-forma results of operations have not been presented because the effects of those operations were not material. In accordance with SFAS 141, the total purchase consideration has been allocated to the assets acquired and liabilities assumed, including identifiable assets, based on their respective estimated fair values at the date of acquisition.
Goodwill is deductible for tax purposes. Goodwill is not amortized but is reviewed periodically for impairment. Acquired core technology and intangible assets are amortized over their useful lives, which range from three to eight years. Amortization expense for intangible assets acquired was approximately $3.2 million and $2.0 million for 2006 and 2005, respectively, of which approximately $2.7 million and $1.5 million was recorded in cost of sales and approximately $490,000 and $490,000 was recorded in operating expenses. The estimated amortization expense of intangible assets acquired for the current fiscal year and in future years will be recorded in the consolidated statements of income as follows (in thousands):
Fiscal Year
Cost of Sales
Acquisition related costs and amortization, net
Total
2007 $ 2,689 $ 450 $ 3,139 2008 2,532 412 2,944 2009 2,259 338 2,597 2010 1,725 177 1,902 Thereafter 1,166 271 1,437
Total $ 10,371 $ 1,648 $ 12,019
Note 16: Related party transactions
During 2002, we contributed approximately $3.6 million to the National Instruments Foundation, a 501(c)(3) charitable foundation established in 2002 for the purpose of continued promotion of scientific and engineering research and education at higher education institutions worldwide. This contribution was recorded as general and administrative expense in 2002. Two of the four directors of the National Instruments Foundation are current officers of National Instruments.
Note 17: Quarterly results (unaudited)
The following quarterly results have been derived from unaudited consolidated financial statements that, in the opinion of management, reflect all adjustments (consisting only of normal recurring adjustments) necessary for a fair presentation of such quarterly information. The operating results for any quarter are not necessarily indicative of the results to be expected for any future period. The unaudited quarterly financial data for each of the eight quarters in the two years ended December 31, 2006 are as follows (in thousands, except per share data):
Three Months Ended
Mar. 31, 2006
Jun. 30, 2006
Sep. 30, 2006
Dec. 31, 2006
Net sales $ 154,752 $ 160,123 $ 164,079 $ 181,453 Gross profit 113,247 119,271 121,648 135,915 Operating income 15,826 20,911 22,367 28,616 Net income 12,602 17,021 18,651 24,434 Basic earnings per share $ 0.16 $ 0.21 $ 0.23 $ 0.31 Weighted average shares outstanding-basic 79,053 79,611 79,637 79,767 Diluted earnings per share $ 0.15 $ 0.21 $ 0.23 $ 0.30 Weighted average shares outstanding-diluted 81,608 81,653 81,274 81,524 Dividends declared per share $ 0.06 $ 0.06 $ 0.06 $ 0.06
Three Months Ended
Mar. 31, 2005
Jun. 30, 2005
Sep. 30, 2005
Dec. 31, 2005
Net sales $ 129,740 $ 140,822 $ 141,618 $ 159,661 Gross profit 97,376 104,109 103,725 117,322 Operating income 14,182 19,093 18,343 26,594 Net income 11,136 15,024 14,399 20,958 Basic earnings per share $ 0.14 $ 0.19 $ 0.18 $ 0.27 Weighted average shares outstanding-basic 79,175 78,303 78,158 78,505 Diluted earnings per share $ 0.14 $ 0.19 $ 0.18 $ 0.26 Weighted average shares outstanding-diluted 81,924 80,190 80,575 80,821 Dividends declared per share $ 0.05 $ 0.05 $ 0.05 $ 0.05
Note 18: Subsequent Event
On January 30, 2007, our Board of Directors declared a quarterly cash dividend of $0.07 per common share, payable March 5, 2007, to shareholders of record on February 12, 2007.
On January 30, 2007, our Board of Directors granted authorization for the repurchase of an additional 1,522,106 shares of our common stock under our share repurchase plan.
SCHEDULE II
NATIONAL INSTRUMENTS CORPORATION
VALUATION AND QUALIFYING ACCOUNTS
(In thousands)
Allowance for doubtful accounts and sales returns:
Year
Description
Balance at Beginning of Period
Provision for Bad Debt Expense
Write-Offs Charged to Allowances
Balance at End of Period
2004 Allowance for doubtful accounts and sales returns $ 3,244 $ 596 $ 329 $ 3,511 2005 Allowance for doubtful accounts and sales returns 3,511 1,462 239 4,734 2006 Allowance for doubtful accounts and sales returns 4,734 33 407 4,360
We own approximately 17 acres of land in an industrial park in Penang, Malaysia.
ITEM 3. LEGAL PROCEEDINGS
We filed a patent infringement action on January 25, 2001, in the U.S. District Court, Eastern District of Texas (Marshall Division) claiming that The MathWorks, Inc. (“MathWorks”) infringed certain of our U.S. patents. On January 30, 2003, a jury found infringement by MathWorks of three of the patents involved and awarded us specified damages. On JuneSeptember 23, 2003, the District Court entered final judgment in favor of us and entered an injunction against MathWorks’ sale of its Simulink and related products and stayed the injunction pending appeal. Upon appeal, the judgment and the injunction were affirmed by the U.S. Court of Appeals for the Federal Circuit (September 3, 2004). Subsequently the stay of injunction was lifted by the District Court. In November 2004, the final judgment amount of $7.4 million which had been held in escrow pending appeal was released to us.
An action was filed by MathWorks against us on September 22, 2004, in the U.S. District Court, Eastern District of Texas (Marshall Division), claiming that on that day MathWorks had released modified versions of its Simulink and related products, and seeking a declaratory judgment that the modified products do not infringe the three patents adjudged infringed in the District Court’sCourt's decision of JuneSeptember 23, 2003 (and affirmed by the Court of Appeals on September 3, 2004). On November 2, 2004, MathWorks served the complaint on us. We filed an answer to MathWorks’ declaratory judgment complaint, denying MathWorks’ claims of non-infringement and alleging our own affirmative defenses. On January 5, 2005, the Court denied a contempt motion by us to enjoin the modified Simulink products under the injunction in effect from the first case. On January 7, 2005, we amended our answer to include counterclaims that MathWorks’ modified products are infringing three of our patents, and requested unspecified damages and an injunction. MathWorks filed its reply to our counterclaims on February 7, 2005, denying the counterclaims and alleging affirmative defenses. On March 2, 2005, we filed a notice of appeal regarding the Court’sCourt's denial of the contempt motion. On March 15, 2005, the Court stayed MathWorks’ declaratory judgment action, pending a decision on the appeal by the Court of Appeals for the Federal Circuit. On February 9, 2006, the Court of Appeals for the Federal Circuit affirmed the District Court’s January 2005 order. On November 22, 2006, the District Court lifted the stay. The case schedule has yet to be set in this action. During the fourth quarter of 2004, we accrued $4 million related to our probable loss from this contingency, which consists entirely of anticipated patent defense costs that are probable of being incurred. In the fourth quarter of 2006, we accrued an additional $600,000 related to this contingency. We charged approximately $57,000 against this accrual duringDuring the fourththird quarter of 2006. We2009, we reduced the accrual by $2 million to reflect a decrease in the estimated costs that are probable of being incurred in this action. To date, we have charged a cumulative total of $602,000$623,000 against this accrual throughaccrual. At December 31, 2006.2009, the remaining accrual was $2 million.
ITEM 4. SUBMISSION OF MATTERS TO A VOTE OF SECURITY HOLDERS
No matter was submitted to a vote of our security holders during the fourth quarter of the fiscal year covered by this report.
PART II
ITEM 5. MARKET FOR THE REGISTRANT’S COMMON EQUITY, RELATED STOCKHOLDER MATTERS AND ISSUER PURCHASES OF EQUITY SECURITIES
Our common stock, $0.01 par value, began trading on The NASDAQ Stock Market (formerly known as the Nasdaq National Market) under the symbol NATI effective March 13, 1995. Prior to that date, there was no public market for our common stock. The high and low closing prices for our common stock, as reported by Nasdaq for the two most recent fiscal years, are as indicated in the following table.High Low 2006 First Quarter 2006 $ 36.28 $ 31.32 Second Quarter 2006 33.67 26.18 Third Quarter 2006 27.89 24.55 Fourth Quarter 2006 31.60 26.63 2005 First Quarter 2005 $ 29.14 $ 24.68 Second Quarter 2005 24.37 20.92 Third Quarter 2005 29.25 21.35 Fourth Quarter 2005 32.74 23.15
High Low 2009 First Quarter 2009 $ 23.40 $ 15.82 Second Quarter 2009 23.61 18.41 Third Quarter 2009 28.42 21.26 Fourth Quarter 2009 29.85 26.52 2008 First Quarter 2008 $ 31.95 $ 24.19 Second Quarter 2008 31.85 25.59 Third Quarter 2008 34.63 25.88 Fourth Quarter 2008 27.99 20.20
At the close of business on February 16, 2007,15, 2010, there were approximately 600473 holders of record of our common stock and approximately 16,00026,500 shareholders of beneficial interest.
We believe factors such as quarterly fluctuations in our results of operations, announcements by us or our competitors, technological innovations, new product introductions, governmental regulations, litigation, changes in earnings estimates by analysts or changes in our financial guidance may cause the market price of our Common Stockcommon stock to fluctuate, perhaps substantially. In addition, stock prices for many technology companies fluctuate widely for reasons that may be unrelated to their operating results. These broad market and industry fluctuations may adversely affect the market price of our Common Stock. We paidcommon stock.
Our cash dividends of $0.06dividend payments for the two most recent fiscal years are indicated in the following table on a per share basis. The dividends were paid on each of February 27, 2006, May 30, 2006, August 28, 2006 and November 27, 2006, and paid cash dividends of $0.05 per share on each of February 25, 2005, May 31, 2005, August 25, 2005 and November 28, 2005. the dates set forth below;
2009 March 2, 2009 $ 0.12 June 1, 2009 0.12 August 31, 2009 0.12 November 30, 2009 0.12 2008 March 3, 2008 $ 0.11 June 2, 2008 0.11 September 2, 2008 0.11 December 1, 2008 0.11
Our policy as to future dividends will be based on, among other considerations, our views on potential future capital requirements related to research and development, expansion into new market areas, investments and acquisitions, share dilution management, legal risks, and challenges to our business model.
See Item 12 for information regarding securities authorized for issuance under our equity compensation plans.
Performance Graph
The following graph compares the cumulative total return to stockholders of NI’s common stock from December 31, 2004 to December 31, 2009 to the cumulative return over such period of (i) Nasdaq Composite Index and (ii) Russell 2000 Index. We use the Russell 2000 Index due to the fact that we have not been able to identify a published industry or line of business index that we believe appropriately reflects our industry or line of business. We considered that our primary competitors are divisions of large corporations that have other significant business operations such that any index comprised of such competitors would not be reflective of our industry or line of business. We have also considered using a peer group index but do not believe such index is appropriate as we have not been able to identify other public companies that we believe are principally in the same line of business as we are.
The graph assumes that $100 was invested on December 31, 2004 in NI’s common stock and in each of the other two indices and the reinvestment of all dividends, if any. Stockholders are cautioned against drawing any conclusions from the data contained therein, as past results are not necessarily indicative of future performance.
The information contained in the Performance Graph shall not be deemed to be “soliciting material” or to be “filed” with the SEC, nor shall such information be incorporated by reference into any future filing under the Securities Act of 1933, as amended (the “Securities Act”), or the Exchange Act, except to the extent that NI specifically incorporates it by reference into any such filing. The graph is presented in accordance with SEC requirements.
ISSUER PURCHASES OF EQUITY SECURITIESPeriod
Total number of shares
Average
price paid
per share
Total number of
shares purchased as
part of a publicly
announced plan or
program
Maximum number of
shares that may yet
be purchased under
the plan or program
October 1, 2006 to October 31, 2006———3,000,000November 1, 2006 to November 30, 2006———3,000,000December 1, 2006 to December 31, 2006———3,000,000
Total———
Period Total number of shares Average price paid per share Total number of shares purchased as part of a publicly announced plan or program Maximum number of shares that may yet be purchased under the plan or program (1) October 1, 2009 to October 31, 2009 — — — 2,262,168 November 1, 2009 to November 30, 2009 573,841 $ 28.55 573,841 1,688,327 December 1, 2009 to December 31, 2009 — — — 1,688,327 Total 573,841 $ 28.55 573,841
(1) For the past several years, we have maintained various stock repurchase programs. In January 2007, our board of directors approved a new shareThis repurchase plan that increases the aggregate number of shares of common stock that we are authorized to repurchase from 1.5 million to 3.0 million. There is nodoes not have an expiration date for this share repurchase program.date.ITEM 6. SELECTED CONSOLIDATED FINANCIAL DATA
The following selected consolidated financial data should be read in conjunction with theour consolidated financial statements, including the Notes to Consolidated Financial Statements contained in thethis Form 10-K. The information set forth below is not necessarily indicative of the results of our future operations. The information should be read in conjunction with “Management’s Discussion and Analysis of Financial Condition and Results of Operations.”Years Ended December 31,
2006
2005
2004
2003
2002
(in thousands, except per share data)
Statements of Income Data: Net sales: Americas $ 317,780 $ 275,524 $ 243,651 $ 200,210 $ 195,770 Europe 193,364 171,499 164,895 137,761 122,800 Asia Pacific 149,263 124,818 105,542 87,921 72,220
Consolidated net sales 660,407 571,841 514,088 425,892 390,790 Cost of sales 170,326 149,309 135,473 111,672 105,086
Gross profit 490,081 422,532 378,615 314,220 285,704
Operating expenses: Sales and marketing 235,072 211,280 188,727 160,478 145,671 Research and development 113,095 87,841 84,692 70,896 63,964 General and administrative 54,192 45,199 42,500 42,497 35,714
Total operating expenses 402,359 344,320 315,919 273,871 245,349
Operating income 87,722 78,212 62,696 40,349 40,355 Other income (expense): Interest income 6,847 3,758 2,905 2,511 3,295 Net foreign exchange gain (loss) 740 (1,566 ) 1,287 1,125 (724 ) Other income (expense), net (7 ) 276 (2,075 ) 506 692
Income before income taxes 95,302 80,680 64,813 44,491 43,618 Provision for income taxes 22,594 19,163 16,203 11,123 12,213
Net income $ 72,708 $ 61,517 $ 48,610 $ 33,368 $ 31,405
Basic earnings per share $ 0.91 $ 0.78 $ 0.62 $ 0.43 $ 0.41
Weighted average shares outstanding - basic 79,519 78,552 78,680 77,438 76,829
Diluted earnings per share $ 0.89 $ 0.76 $ 0.59 $ 0.41 $ 0.39
Weighted average shares outstanding - diluted 81,519 80,910 82,096 80,946 80,117
Cash dividends paid per common share $ 0.24 $ 0.20 $ 0.18 $ 0.07 $ —
December 31,
2006
2005
2004
2003
2002
(in thousands)
Balance Sheet Data: Cash and cash equivalents $ 100,287 $ 55,864 $ 76,216 $ 53,446 $ 12,840 Short-term investments 150,190 119,846 150,392 141,227 141,038 Working capital 374,512 274,686 309,635 255,330 211,453 Total assets 721,220 608,336 582,093 525,151 458,714 Long-term debt, net of current portion — — — — — Total stockholders' equity 596,682 503,850 486,449 439,452 386,463
Years Ended December 31, 2009 2008 2007 2006 2005 (in thousands, except per share data) Statements of Income Data: Net sales: Americas $ 292,999 $ 355,878 $ 331,482 $ 317,780 $ 275,524 Europe . 210,188 267,373 230,940 193,364 171,499 Asia Pacific 173,407 197,286 177,956 149,263 124,818 Consolidated net sales 676,594 820,537 740,378 660,407 571,841 Cost of sales 169,884 207,109 185,267 173,348 151,939 Gross profit 506,710 613,428 555,111 487,059 419,902 Operating expenses: Sales and marketing 269,267 307,409 264,060 232,050 208,650 Research and development 132,974 143,140 126,515 113,095 87,841 General and administrative 57,938 67,162 62,445 54,192 45,199 Total operating expenses 460,179 517,711 453,020 399,337 341,690 Operating income 46,531 95,717 102,091 87,722 78,212 Other income (expense): Interest income 1,629 5,996 9,822 6,847 3,758 Net foreign exchange gain (loss) 734 (3,737 ) 1,672 740 (1,566 ) Other income (expense), net 1,351 161 (158 ) (7 ) 276 Income before income taxes 50,245 98,137 113,427 95,302 80,680 Provision for income taxes 33,160 13,310 6,394 22,594 19,163 Net income $ 17,085 $ 84,827 $ 107,033 $ 72,708 $ 61,517 Basic earnings per share $ 0.22 $ 1.08 $ 1.35 $ 0.91 $ 0.78 Weighted average shares outstanding - basic 77,520 78,567 79,468 79,519 78,552 Diluted earnings per share $ 0.22 $ 1.07 $ 1.32 $ 0.89 $ 0.76 Weighted average shares outstanding - diluted 78,026 79,515 81,043 81,519 80,910 Cash dividends declared per common share $ 0.48 $ 0.44 $ 0.34 $ 0.24 $ 0.20
December 31, 2009 2008 2007 2006 2005 (in thousands) Balance Sheet Data: Cash and cash equivalents $ 201,465 $ 229,400 $ 194,839 $ 100,287 $ 55,864 Short-term investments 87,196 6,220 93,838 150,190 119,846 Working capital 413,759 398,292 419,874 379,733 274,686 Total assets 813,029 832,591 818,812 721,220 608,336 Long-term debt, net of current portion — — — — — Total stockholders’ equity 654,420 664,438 661,086 596,682 503,850
ITEM 7. MANAGEMENT'SMANAGEMENT’S DISCUSSION AND ANALYSIS OF FINANCIAL CONDITION AND RESULTS OF OPERATIONS
The following “Management’s Discussion and Analysis of Financial Condition and Results of Operations” contains forward-looking statements within the meaning of Section 27A of the Securities Act of 1933 and Section 21E of the Securities Exchange Act of 1934. Any statements contained herein regarding our future financial performance or operations (including, without limitation, statements to the effect that we “believe,” “expect,” “plan,” “may,” “will,” “project,” “continue,” or “estimate” or other variations thereof or comparable terminology or the negative thereof) should be considered forward-looking statements. Actual results could differ materially from those projected in the forward-looking statements as a result of a number of important factors including those set forth under the heading “Risk Factors”“Risk Factors” beginning on page 8,10, and elsewhere in this Form 10-K. Although we believe that the expectations reflected in the forward-looking statements are reasonable, we cannot guarantee future results, levels of activity, performance or achievements. You should not place undue reliance on these forward-looking statements. We disclaim any obligation to update information contained in any forward-looking statement.
Overview
National Instruments designs, develops, manufactures and markets instrumentationCorporation (“we”, “us” or “our”) is a leading supplier of measurement and automation softwareproducts that engineers and hardware for general commercial, industrial and scientific applications. We offer hundredsscientists use in a wide range of products used to create virtual instrumentation systems for measurement and automation. We have identifiedindustries. These industries comprise a large and diverse market for design, control and test applications. We provide flexible application software and modular, multifunctional hardware that users combine with industry-standard computers, networks and third party devices to create measurement, automation and embedded systems, which we also refer to as “virtual instruments”. Our products are used in a variety of applications from researchapproach gives customers the ability to quickly and development to production testing, monitoringcost-effectively design, prototype and industrial control.deploy unique custom-defined solutions for their design, control and test application needs. We sell to a large number of customers in a wide variety of industries. No single customer accounted for more than 3% of our sales in 2006, 20052009, 2008 or 2004.2007.
The key strategies that management focuses on in running our business are the following:
Expanding our broad customer base:base
We strive to increase our already broad customer base by serving a large market on many computer platforms, through a global marketing and distribution network. We also seek to acquire new technologies and expertise from time to time in order to open up new opportunities for our existing product portfolio. While we continue our efforts to expand our customer base, we are also benefiting from our efforts in increasing order size from both new and existing customers.
Maintaining a high level of customer satisfaction:satisfaction
To maintain a high level of customer satisfaction we strive to offer innovative, modular and integrated products through a global sales and support network. We strive to maintain a high degree of backwards compatibility across different platforms in order to preserve the customer’s investment in our products. In this time of intense global competition, we believe it is crucial that we continue to offer products with quality and reliability, and that these products provide cost-effective solutions for our customers.
Leveraging external and internal technology:technology
Our product strategy is to provide superior products by leveraging generally available technology, supporting open architectures on multiple platforms and by leveraging our core technologies such as custom ASICs (application-specificapplication specific integrated circuits)circuits (“ASICs”) across multiple products.
We sell into the test and measurement (“T&M”) and the industrial automation (“IA”)industrial/embedded applications in a broad range of industries and as such are subject to the economic and industry forces which drive those markets. It has been our experience that the performance of these industries and our performance is impacted by general trends in industrial production for the global economy and by the specific performance of certain vertical markets that are intensive consumers of measurement technologies. Examples of these markets are semiconductor capital equipment, telecom, defense, aerospace, automotive and others. In assessing our business, our management considerswe consider the trends in the Global Purchasing Managers Index (published(“PMI”) published by JP Morgan),Morgan, global industrial production as well as industry reports on the specific vertical industries mentioned earlier.that we target. Starting in August 2009, the PMI has had readings above 50 which are indicative of expansion in the industrial global economy. However, we believe there is still a substantial amount of uncertainty about the global industrial economic conditions. We are unable to predict whether the current expansion cycle, as measured by the PMI, will be sustained throughout 2010. This continuing uncertainty in the global industrial economy is likely to continue to have an adverse effect on the spending patterns of businesses including our current and potential customers which could adversely affect our revenues and therefore harm our business and result of operations.
We distribute our software and hardware products primarily through a direct sales organization. We also use independent distributors, OEMs, VARs, system integrators and consultants to market and sell our products. We have sales offices in the United StatesU.S. and sales offices and distributors in key international markets. Sales outside of the Americas accounted for approximately 52%57%, 52%57% and 53% of55% or our revenues in 2006, 2005,2009, 2008 and 2004,2007, respectively. The vast majority of our foreign sales are denominated in the customers’ local currency, which exposes us to the effects of changes in foreign-currencyforeign currency exchange rates. We expect that a significant portion of our total revenues will continue to be derived from international sales. See (See Note 12 – Segment information of Notes to Consolidated Financial Statements for details concerning the geographic breakdown of our net sales, operating income, interest income and identifiable assets.long-lived assets).
We manufacture a substantial majority of our products at our facilityfacilities in Debrecen, Hungary. Additional production primarily of low volume or newly introduced products is done in Austin, Texas. Our product manufacturing operations can be divided into four areas: electronic circuit card and module assembly; chassis and cable assembly; technical manuals and product support documentation; and software duplication. We manufacture most of the electronic circuit card assemblies, modules and chassismodules in-house, although subcontractors are used from time to time. Beginning in 2005, some chassis have been produced byWe currently use subcontractors in Asia.Asia to manufacture a significant portion of our chassis but we review these arrangements periodically. We manufacture some of our electronic cable assemblies in-house, but many assemblies are produced by subcontractors. We primarily subcontract our software duplication, our technical manuals and product support documentation.
We believe that our long-term growth and success depends on delivering high quality software and hardware products on a timely basis. Accordingly, we focus significant efforts on research and development. We focus our research and development efforts on enhancing existing products and developing new products that incorporate appropriate features and functionality to be competitive with respect to technology, price and price/performance. Our success also is dependantdependent on our ability to obtain and maintain patents and other proprietary rights related to technologies used in our products. We have engaged in litigation and where necessary, will likely engage in future litigation to protect our intellectual property rights. In monitoring and policing our intellectual property rights, we have been and may be required to spend significant resources.
We have been profitable in every year since 1990. However, there can be no assurance that our net sales will grow or that we will remain profitable in future periods. Our operating results fluctuate from period to period due to changes in global economic conditions and a number of other factors. As a result, we believe historical results of operations should not be relied upon as indications of future performance.
Results of Operations
The following table sets forth, for the periods indicated, the percentage of net sales represented by certain items reflected in our consolidated statementsConsolidated Statements of income:Years Ended December 31,
2006
2005
2004
Net sales: Americas 48.1 % 48.2 % 47.4 % Europe 29.3 30.0 32.1 Asia Pacific 22.6 21.8 20.5
Consolidated net sales 100.0 100.0 100.0 Cost of sales 25.8 26.1 26.4
Gross profit 74.2 73.9 73.6 Operating expenses: Sales and marketing 35.6 36.9 36.7 Research and development 17.1 15.4 16.4 General and administrative 8.2 7.9 8.3
Total operating expenses 60.9 60.2 61.4
Operating income 13.3 13.7 12.2 Other income (expense): Interest income 1.0 0.7 0.5 Net foreign exchange gain (loss) 0.1 (0.3 ) 0.3 Other income (expense), net — — (0.4 )
Income before income taxes 14.4 14.1 12.6 Provision for income taxes 3.4 3.3 3.1
Net income 11.0 % 10.8 % 9.5 %
Income:
Years Ended December 31, 2009 2008 2007 Net sales: Americas 43.3 % 43.4 % 44.8 % Europe 31.1 32.6 31.2 Asia Pacific 25.6 �� 24.0 24.0 Consolidated net sales 100.0 100.0 100.0 Cost of sales 25.1 25.2 25.0 Gross profit 74.9 74.8 75.0 Operating expenses: Sales and marketing 39.8 37.5 35.7 Research and development 19.6 17.4 17.1 General and administrative 8.6 8.2 8.4 Total operating expenses 68.0 63.1 61.2 Operating income 6.9 11.7 13.8 Other income (expense): Interest income 0.2 0.7 1.3 Net foreign exchange gain (loss) 0.1 (0.5 ) 0.2 Other income (expense), net 0.2 — — Income before income taxes 7.4 11.9 15.3 Provision for income taxes 4.9 1.6 0.8 Net income 2.5 % 10.3 % 14.5 %
Net Sales.In 2006, consolidatedSales. Consolidated net sales were $660.4$677 million, $821 million and $740 million for the years ended December 31, 2009, 2008 and 2007, respectively, a 15%decrease of 18% in 2009 compared to 2008 following an increase of 11% in 2008 compared to 2007. The decrease in 2009 can be attributed to declines in sales volume across all regions of our business. Instrument control products which comprised approximately 7% of our revenues for the year ended December 31, 2009, saw a year-over-year decline of 31%. Products in the areas of virtual instrumentation and graphical system design which comprised approximately 93% of our revenues for the year ended December 31, 2009, saw a year-over-year decline of 16%. Revenues from our instrument control products are the level achievedmost sensitive to the cycles of the global industrial economy. For the year ended December 31, 2009, our order backlog increased by approximately $8 million. Backlog is a measure of orders that were received but that had not shipped to customers at the end of the quarter. We did not take any significant action with regard to pricing during the year ended December 31, 2009, and thus, the decrease in 2005, which followed anrevenues is attributable to a decrease in customer orders. The increase in net sales of 11% in 2005 from the level achieved in 2004. The increase in sales in 20062008, compared to 2005 was primarily attributable2007 can be attributed to volume growth in the introductionareas of newmodular instruments, particularly RF test products, PXI, software and upgraded products, an increased market acceptance of our productsCompactRIO which performed very well in all regions and the current year impact of prior year acquisitions. The increase in sales in 2005 compared to 2004 was primarily attributable to the introduction of new and upgraded products, the increase in unit volume from the increased market acceptance of our products in all regions and the strengthlight of the Euro.industry contraction. The increases in these areas were offset by declines in revenue from instrument control products which are the most sensitive to downturns in the Global PMI.
Sales in the Americas increased $42.3were $293 million, or 15%, to $317.8$356 million and $331 million for the years ended December 31, 2009, 2008 and 2007, respectively, a decrease of 18% in 20062009 compared to 2005, which followed a 13%2008 following an increase in 2005 over 2004 levels. The increasesof 8% in sales in the Americas in 2006 and 2005 were attributable2008 compared to an increased market acceptance of our products and from revenue of $34.4 million and $21.9 million, respectively, from acquired companies. (See Note 15 of Notes to Consolidated Financial Statements for a description of acquisitions).2007. Sales outside of the Americas, as a percentage of consolidated sales were 57%, 57% and 55% for 2006, remained flat at 52% with 2005. European revenue was $193.4the years ended December 31, 2009, 2008 and 2007, respectively. Sales in Europe were $210 million, $267 million and $231 million for the years ended December 31, 2009, 2008 and 2007, respectively, a decrease of 21% in 2006,2009 compared to 2008 following an increase of 13% from 2005,16% in 2008 compared to 2007. Sales in Asia were $173 million, $197 million and $178 million for the years ended December 31, 2009, 2008 and 2007, respectively, a decrease of 12% in 2009 compared to 2008 following a 4%an increase of 11% in 2005 from 2004. Asia Pacific revenue grew 20%2008 compared to $149.3 million in 2006, which followed an 18% increase in 2005 over 2004 levels.2007. We expect sales outside of North Americathe Americas to continue to represent a significant portion of our revenue. We intend to continue to expand our international operations by increasing our presence in existing markets, adding a presence in some new geographical markets and continuing the use of distributors to sell our products in some countries.
Almost all sales made by our direct sales offices in the Americas, outside of the U.S., in Europe and in Asia Pacific are denominated in local currencies, and accordingly, the U.S. dollar equivalent of these sales is affected by changes in the foreign currency exchange rates. Between 2006 and 2005,For 2009, net of hedging results, the change in the exchange rates had the effect of decreasing our consolidated sales by 0.5%$29 million or 4%, decreasing America’s sales by $6 million or 2%, decreasing European sales by 3%$17 million or 6%, and had no material effect ondecreasing sales in Asia Pacific. The increase in sales in Europe and Asia was the resultPacific by $6 million or 3% compared to 2008. For 2008, net of the change in exchange rates and the increase in local currency product pricing in each region. Since most of our international operating expenses are also incurred in local currencies,hedging results, the change in exchange rates had the effect of decreasing operating expenses $1.5increasing our consolidated sales by $34 million or 0.4%4%, in 2006,increasing America’s sales by $1.7 million or 0.5%, increasing European sales by $28 million or 12%, and increasing operating expenses $4.2sales in Asia Pacific by $4.3 million or 1.2% in 2005, and $4.4 million, or 1.4%, in 2004.2% compared to 2007.
Gross Profit.Profit.As a percentage of sales, gross profitmargin was 74%75% in each of 2006, 2005,2009, 75% in 2008 and 2004. Our75% in 2007. In 2009, we were successful in implementing cost reduction strategies throughout our manufacturing cycle which allowed us to maintain a stable gross margin percentage despite the 18% decrease in 2006 remained flat with 2005 primarily becausesales volume in 2009. For the favorableyears ended December 31, 2009, 2008 and 2007, charges related to acquisition related intangibles and stock based compensation were $4.7 million, $4.7 million and $3.6 million, respectively. For the years ended December 31, 2009 and 2008, the net impact of higher sales volume and improved product margins resulting from both price increases and cost reductions on certain products were offset entirely by the negative impact of unfavorablechange in foreign currency exchange rates had the expensingeffect of stock-based compensation, the increase in the amortizationdecreasing our cost of acquisition intangiblesgoods sold by $3 million or 1%, and the write-off in the first quarterincreasing our cost of 2006 of some capitalized facility costs due to the continued transition of production to our manufacturing facility in Hungary. Our gross margin in 2005 remained flat with 2004 primarily because the favorable impacts of foreign currency exchange rates and higher sales volume were offsetgoods sold by the reduced margins realized on product lines from acquired companies as well as the impact of the amortization of acquisition related intangibles and a reduction of selling prices of some of our products. There can be no assurance that we will maintain our historical margins. We believe our current manufacturing capacity is adequate to meet current needs.$1.1 million or 4%, respectively.
Sales and Marketing.Marketing.Sales and marketing expenseexpenses were $269 million, $307 million and $264 million for the years ended December 31, 2009, 2008 and 2007, respectively, a decrease of 12% in 2006 increased2009 compared to $235.1 million, an 11% increase from 2005,2008 following an increase of 12%16% in 2005 over 2004. Sales2008 compared to 2007. As a percentage of net sales, sales and marketing expenseexpenses were 40%, 38% and 36% for 2009, 2008 and 2007, respectively. For 2009, the increase in sales and marketing expenses as a percentage of revenue was 36%due to the 18% decrease in 2006, down from 37%revenue. For 2009, the decrease in 2005sales and 2004. Approximately 84%marketing expenses in absolute dollars was due to a decrease in travel, tradeshows and advertising of $15 million, a decrease in variable compensation of $4.2 million and a decrease caused by the net impact of changes in foreign currency exchange rates of $9 million. Temporary cost cutting measures which included a company-wide wage reduction as well as a reduction in the number of accrued vacation hours that employees are allowed to carry beyond December 31, 2009, resulted in additional cost savings of $7 million compared to 2008. For 2008, the increase in sales and marketing expense, both in 2006 comparedabsolute dollars and as a percentage of sales, was consistent with our plan to 2005 is attributablemake additional investments in our field sales force during 2008. Approximately 65% of the increase in 2008 over 2007, can be attributed to the increase in sales and marketing personnel, costs due to the increaseincreases in salesstock-based compensation and marketing personnel, the increase in variable compensation from higher sales volume and fromvolume. In addition, during 2008, the net impact of foreign currency exchange rates had the expensingeffect of stock-based compensation. Approximately 60% of the increase inincreasing our sales and marketing expensesexpense by $10 million or 3%. We plan to continue to make additional investments in 2005 compared to 2004 is attributable to the increaseour field sales force in sales and marketing personnel costs,2010. However, due to the increasecontinuing uncertainty in the industrial economy, the extent of our field sales and marketing personnel, the increaseexpansion during 2010 will be dependent on our overall sales volumes in variable compensation from higher sales volume and from the effects of the change in currency exchange rates, with the remaining fraction of the increase attributable to increases in advertising, tradeshows and special events.2010. We expect sales and marketing expenses in future periods to increase in absolute dollars, andcontinue to fluctuate as a percentage of sales based on recruiting, marketing and advertising campaign costs associated with major new product releases and entry into new market areas, investment in web sales and marketing efforts, increasing product demonstration costs and the timing of domestic and international conferences and trade shows.
Research and Development.Development.Research and development expenses were $133 million, $143 million and $127 million for the years ended December 31, 2009, 2008 and 2007, respectively, a decrease of 7% in 2006 increased 29%2009 compared to 20052008 following an increase of 4%13% in 2005 over 2004. Research2008 compared to 2007. As a percentage of net sales, research and development expenseexpenses were 20%, 17% and 17% for 2009, 2008 and 2007, respectively. For 2009, the increase in research and development expenses as a percentage of revenue was 17.1%due to the 18% decrease in 2006, up from 15.4%revenue. For 2009, the decrease in 2005research and 16.4%development expenses in 2004. Theabsolute dollars was due to a decrease in variable compensation of $2.9 million and a decrease caused by the net impact of changes in foreign currency exchange rates of $327,000. Temporary cost cutting measures which included a company-wide wage reduction as well as a reduction in the number of accrued vacation hours that employees were allowed to carry beyond December 31, 2009, resulted in additional cost savings of $7 million. These decreases were offset by personnel costs related to a net headcount increase of 42 people during 2009. For 2008, the increase in research and development costs in 2006expenses in absolute dollars and as a percentage of revenue was primarily due to increases in personnel costs from the hiring of additional product development engineers and from the impact of the expensing ofas well as increases related to stock-based compensation and fromwas consistent with our plan to continue to grow our research and development capacity in line with the decreaseoverall revenue growth of the company. During 2008, we had a net headcount increase of 109 people in our worldwide research and development group. In addition, during 2008, the capitalizationnet impact of software development costs. The decrease inforeign currency exchange rates had the effect of increasing our research and development expense as a percentage of revenue in 2005 compared to 2004 was primarily due to the increase in the capitalization of software development costs. The increase in research and development expense in absolute dollars in 2005 was primarily due to increases in personnel costs from the hiring of additional product development engineers, which was partially offset by the decrease in expense from the increase in the capitalization of software development costs. Research and development personnel increased from 1,036 at December 31, 2005 to 1,122 at December 31, 2006.$2.7 million or 2%. We plan to continue making a significant investmentto make additional investments in research and development in order2010. However, due to remain competitivethe continuing uncertainty in the industrial economy, the extent of our research and support revenue growth.development expansion during 2010 will be dependent on our overall sales volumes in 2010.
We capitalize software development costs in accordance with Statement ofthe Financial Accounting Standards (“SFAS”) 86, “Accounting for the Costs of Computer Board (FASB) Accounting Standards Codification (ASC) 985, Software to be Sold, Leased, or Otherwise Marketed.” (FASB ASC 985). We amortize such costs over the related product’s estimated economic useful life, generally three years, beginning when a product becomes available for general release. Software amortization expense included in cost of goods sold totaled $9.1$9 million, $7.2$10 million and $6.6$9 million during 2006, 20052009, 2008 and 2004,2007, respectively. Internally developed software costs capitalized during such years2009, 2008 and 2007 were $7.4$13 million, $13.4$10 million and $5.0$8 million, respectively. Capitalization of internally developed software costs varies depending on the timing of when each project reaches technological feasibility and the length and scope of the development cycle of each individual project. (See Note 57 - Intangibles of Notes to Consolidated Financial Statements for a description of intangibles.)intangibles).
General and Administrative.Administrative.General and administrative expenses were $58 million, $67 million and $62 million for the years ended December 31, 2009, 2008 and 2007, respectively, a decrease of 13% in 2006 increased 20%2009 compared to 2005,2008 following an increase of 6%8% in 2005 over 2004. The 20% increase in2008 compared to 2007. As a percentage of net sales, general and administrative expenses were 9%, 8% and 8% in 2006 from 2005 was primarily attributable to increases in personnel costs from both2009, 2008 and 2007. For 2009, the increase in international general and administrative personnel and the impact of the expensing of stock-based compensation, and the effect of decreased litigation costs in the prior year, primarily from the reversal of previously accrued estimated patent defense costs associated with the SoftWIRE legal matter which resulted in a gain of $1.9 million in 2005. The 6% increase in general and administrative expenses in 2005 from the prior year period was primarily due to the litigation settlement in 2004 which resulted in the $6.0 million net gain in 2004 from the judgment award against The MathWorks, Inc. (See Note 14 of Notes to Consolidated Financial Statements.) General and administrative expenses as a percentage of revenue increasedwas due to 8.2% during 2006 from 7.9% during 2005.the 18% decrease in revenue. For 2009, the decrease in general and administrative expenses was due to a decrease caused by the net impact of changes in foreign currency exchange rates of $2.6 million, a reduction of our patent litigation accrual which resulted in a non-cash decrease to our operating expenses of $2 million and a decrease in variable compensation of $948,000. Temporary cost cutting measures which include a company-wide wage reduction as well as a reduction in the number of accrued vacation hours that employees are allowed to carry beyond December 31, 2009, resulted in additional cost savings of $1.8 million. For 2008, the increase in absolute dollars compared to 2007 can primarily be attributed to the net impact of foreign currency exchange rates which had the effect of increasing our general and administrative expense by $2.4 million or 4%. We expect that general and administrative expenses in future periods will fluctuate in absolute amountsdollars and as a percentage of revenue.
Interest Income.Income.Interest income increased 82%was $1.6 million, $6 million and $10 million for the years ended December 31, 2009, 2008 and 2007, respectively, a decrease of 73% in 2006 from 2005, which followed an increase2009 compared to 2008 following a decrease of 29%40% in 2005 from 2004. The increase2008 compared to 2007. For 2009, the decrease is attributable to significant decreases in investment yields for high grade treasury, municipal and corporate bonds. For 2008, the decrease is attributable to a decrease in invested funds as well as to the rapid rate of decrease in interest income in 2006 was due to higher yields on larger invested funds. The increase in interest income in 2005 versus 2004 was due to higher yields.rates during the second half of 2008. The primary source of interest income is from the investment of our cash and short-term investments. Net cash provided by operating activities totaled $97.9 million and $88.1 million in 2006 and 2005, respectively.
Net Foreign Exchange Gain (Loss). We experienced net Net foreign exchange gains of $740,000 in 2006, compared to losses of $1.6gain (loss) was $734,000, $(3.7) million in 2005 and gains of $1.3$1.7 million in 2004.for the years ended December 31, 2009, 2008 and 2007, respectively. These results are attributable to movements in the foreign currency exchange rates between the U.S. dollar and the localforeign currencies in countries in whichwhere our sales subsidiaries are located.functional currency is not the U.S. dollar. We recognize the local currency as the functional currency in virtually all of our international subsidiaries.
We utilize foreign currency forward contracts to hedge our foreign denominated net foreign currency balance sheet positions to protect against the change in value caused by a majorityfluctuation in foreign currency exchange rates. We typically hedge up to 90% of our outstanding foreign currency-denominated receivables in order to reduce our exposure to significant foreign currency fluctuations. Wedenominated net receivable or payable positions and typically limit the duration of our “receivables”these foreign currency forward contracts to approximately 90 days. We also utilize The gain or loss on these derivatives as well as the offsetting gain or loss on the hedge item attributable to the hedged risk is recognized in current earnings under the line item “net foreign exchange gain (loss)”. Our hedging strategy reduced our foreign exchange gains by $1.7 million in 2009, reduced our foreign exchange losses by $1.2 million in 2008 and reduced our foreign exchange gains by $1.1 million in 2007.
To protect against the change in the value caused by a fluctuation in foreign currency exchange rates of forecasted foreign currency cash flows resulting from international sales and expenses over the next one to two years, we have instituted a foreign currency cash flow hedging program. We hedge portions of our forecasted revenue and forecasted expenses denominated in foreign currencies with forward and option contracts. For forward contracts, andwhen the dollar strengthens significantly against the foreign currency purchased option contractscurrencies, the change in order to reduce our exposure to fluctuations inthe present value of future foreign currency cash flows. We purchase theseflows may be offset by the change in the fair value of the forward contracts for up to 100%designated as hedges. For purchased option contracts, when the dollar strengthens significantly against the foreign currencies, the change in the present value of our forecastedfuture foreign currency cash flows may be offset by the change in selected currencies (primarily the euro, yen and pound sterling) and limitfair value of the durationoption contracts designated as hedges, net of these contracts to 40 months.the premium paid. Our foreign currency purchased option contracts are purchased “at-the-money” or “out-of-the-money.” We purchase foreign currency forward and option contracts for up to 100% of our forecasted exposures in selected currencies (primarily in Euro, Japanese yen, British pound sterling and Hungarian forint) and limit the duration of these contracts to 40 months or less. As a result, our hedging activities only partially address our risks infrom foreign currency transactions, and there can be no assurance that this strategy will be successful. We do not invest in contracts for speculative purposes. (See Note 114 - Derivative instruments and hedging activities of Notes to Consolidated Financial Statements for a description of our forward and purchased option contracts and hedged positions.) Our hedging strategy reduced our foreign exchange gains for December 31, 2006 by $1.0 million and reduced our foreign exchange loss for December 31, 2005 by $2.2 million.positions).
Other Income (Expense), Net. We established a valuation reserve in the fourth quarter of 2004 for the estimated total impairment of a $2.5 million cost-method investment.Provision for Income Taxes.Our provision for income taxes reflectsreflected an effective tax rate of 24%66%, 14% and 6% for the years ended December 31, 2009, 2008 and 2007, respectively. The increase in 2006 and 2005 and 25% in 2004. Ourour effective tax rate is lower thanin 2009 compared to 2008 was driven by changes in our valuation allowances, tax charges related to inter-company profits and an increase in equity compensation expense as a percentage of pre-tax book income. (See Note 9 – Income taxes of Notes to Consolidated Financial Statements for further discussion regarding changes in our effective tax rate and a reconciliation of income taxes at the U.S. federal statutory income tax rate of 35% primarily as a result of the extraterritorial income exclusion, tax-exempt interest and reducedto our effective tax rates in certain foreign jurisdictions. The decreases in our tax rate in 2006 and 2005 from 2004 are due to increased profits in foreign jurisdictions with reduced income tax rates.rate).
Liquidity and Capital Resources
Working Capital, Cash and Cash Equivalents, Short-term Investments and Long-term Investments. We currently finance The following table presents our working capital, cash and cash equivalents and marketable securities (in thousands):
December 31,2009 December 31,2008 Increase/(Decrease) Working capital $ 413,759 $ 398,292 $ 15,467 Cash and cash equivalents (1) 201,465 229,400 (27,935 ) Short-term investments (1) 87,196 6,220 80,976 Long-term investments — 10,500 (10,500 ) Total cash, cash equivalents, short and long-term investments $ 288,661 $ 246,120 $ 42,541
(1)Included in working capital
Our working capital increased by $15 million during the year ended December 31, 2009 compared to December 31, 2008, due to cash provided by operations offset by repurchases of shares of our common stock, dividend payments and capital expenditures throughexpenditures.
Our cash flow from operations. At December 31, 2006, we had working capitaland cash equivalent balances are held in numerous financial institutions throughout the world, including substantial amounts held outside of approximately $374.5 million comparedthe U.S.; however, the majority of our cash and investments that are located outside of the U.S. are denominated in the U.S. dollar. Most of the amounts held outside of the U.S. could be repatriated to $274.7the U.S., but under current law, would be subject to U.S. federal income taxes, less applicable foreign tax credits. In some countries repatriation of certain foreign balances is restricted by local laws. We have provided for the U.S. federal tax liability on these amounts for financial statement purposes, except for foreign earnings that are considered indefinitely reinvested outside of the U.S. Repatriation could result in additional U.S. federal income tax payments in future years. We utilize a variety of tax planning and financing strategies with the objective of having our worldwide cash available in the locations in which it is needed.Cash Provided and (Used) in 2009 and 2008. Cash and cash equivalents decreased to $201 million at December 31, 2005. Net2009 from $229 million at December 31, 2008. The following table summarizes the proceeds and (uses) of cash (in thousands):
December 31, 2009 2008 Cash provided by operating activities $ 135,651 $ 121,818 Cash (used in)/provided by investing activities (111,915 ) 18,756 Cash (used in) financing activities (51,671 ) (106,013 ) Net (decrease)/increase in cash equivalents (27,935 ) 34,561 Cash and cash equivalents at beginning of year 229,400 194,839 Cash and cash equivalents at end of year $ 201,465 $ 229,400
Our operating activities provided $136 million and $122 million for the years ended December 31, 2009 and 2008, respectively, a 11% increase. For 2009, cash provided by operating activities was the result of $17 million of net income, $77 million in 2006, 2005net non-cash operating expenses which consisted of depreciation and 2004 totaled $97.9amortization, stock-based compensation, benefits from deferred income taxes, and by $41 million $88.1in net cash provided by changes in operating assets and liabilities, principally a $18 million decrease in accounts receivable, a $21 million decrease in inventories and $65.6a $13 million respectively.decrease in prepaid expenses and other assets, offset by a decrease of $10 million in accounts payable, taxes and other liabilities. In 2008, cash provided by operating activities was primarily the result of $84.8 million in net income and $51.3 million in net non-cash operating expenses which primarily consisted of depreciation and amortization, stock-based compensation, and benefits from deferred income taxes, offset in part by $14.3 million in net cash used by changes in operating assets and liabilities, principally a $24.6 million increase in inventory.
Accounts receivable increaseddecreased to $117.2$104 million at December 31, 20062009 from $95.7$122 million at December 31, 2005,2008, as a result of higherlower sales levelsvolumes during 2009. This decrease in the fourth quarter of 2006 compared to the fourth quarter of 2005. Daysrevenue also caused our days sales outstanding at December 31, 2006 increased to 59 days from 55increase to 61 days at December 31, 2005. 2009, compared to 57 days at December 31, 2008. We typically bill customers on an open account basis subject to our standard net thirty day payment terms. If, in the longer term, our revenue increases, it is likely that our accounts receivable balance will also increase. Our accounts receivable could also increase if customers delay their payments or if we grant extended payment terms to customers, both of which are more likely to occur during challenging economic times when our customers may face issues gaining access to sufficient funding or credit.
Consolidated inventory balances have increaseddecreased to $77.1$87 million at December 31, 20062009 from $62.8$107 million at December 31, 2005.2008. Inventory turns decreased to 2.41.8 per year for 2006 from 2.7at December 31, 2009 compared to 2.1 per year for 2005.at December 31, 2008. The increasedecrease in inventory in 2006during 2009 was principally to support the transfer of one of our two remaining Austin based production lines todriven by a reduction in our manufacturing facilityactivities in Hungary. The additionalresponse to the decreased demand for our products. Our inventory is intended aslevels will continue to be determined based upon our anticipated demand for products and our need to keep sufficient inventory on hand to meet our customers’ demands. We attempt to balance such considerations against the risk of obsolescence or potentially excess inventory levels. Rapid changes in industrial demand could have a buffer to support continued production as bothsignificant impact on our inventory balances in future periods.
Investing activities used cash of $112 million during 2009, which was the capital equipment andresult of the inventory needed to support its operation were physically moved to Hungary in September 2006. Cash used in 2006 fornet purchase of short-term investments of $74 million, the purchase of property and equipment totaled $18.5of $21 million, for the capitalization of internally developed software costs totaled $7.4of $13 million and for additions tothe acquisition of other intangibles totaled $3.1of $5 million. Cash used in 2005 for acquisitions totaled $63.9For 2008, investing activities provided cash of $19 million forwhich was primarily the result of the net sale of $77 million of short-term investments, offset by the purchase of property and equipment totaled $15.4of $26 million, fora net cash payment of $17 million related to the acquisition of microLEX Systems ApS (see Note 15 - Acquisitions of Notes to Consolidated Financial Statements), capitalization of internally developed software costs totaled $13.4of $10 million and for additions tothe acquisition of other intangibles totaled $4.3of $3 million. Cash
Financing activities used in 2004 for$52 million during 2009, which was the purchaseresult of property$35 million used to repurchase our common stock and equipment totaled $12.6$37 million for the capitalizationused to pay dividends to our shareholders, offset by $22 million received as a result of internally developed software costs totaled $5.0 million and for additions to other intangibles totaled $3.1 million. Cash provided by the issuance of our common stock totaled $37.1from the exercise of stock options and sales of our common stock through our employee stock purchase plan. For 2008, financing activities used $106 million $23.2which was the result of $104 million used to repurchase our common stock and $16.8$35 million used to pay dividends to our shareholders, offset by $31 million received as a result of the issuance of our common stock from the exercise of stock options and our employee stock purchase plan.
From time to time our Board of Directors has authorized various programs to repurchase shares of our common stock depending on market conditions and other factors. Under such programs, we repurchased a total of 1,443,441, 4,110,042 and 2,730,125 shares of our common stock at weighted average prices of $23.96, $25.22 and $29.20 per share, in 2006, 2005the years ended December 31, 2009, 2008 and 2004, respectively, and cash used for payment2007, respectively.
On January 23, 2009, our Board of dividends totaled $19.0 million, $15.8 million and $14.5 million in 2006, 2005 and 2004, respectively. The issuanceDirectors approved a new share repurchase plan which increased the aggregate number of shares of common stock wasthat we are authorized to repurchase from 591,324 to 3.0 million. At December 31, 2009, there were 1,688,327 shares remaining available for repurchase under this plan. This repurchase plan does not have an expiration date.
During 2009, we received reduced proceeds from the exercise of stock options compared to 2008. The timing and number of stock option exercises and the amount of cash proceeds we receive through those exercises are not within our control, and in the future we may not generate as much cash from the exercise of stock options as we have in the past. Moreover, it is now our practice to issue restricted stock units and not stock options to eligible employees under our Employee Stock Purchase Plan, our 1994 Incentive Plan and our 2005 Incentive Plan.which will reduce the number of stock options available for exercise in the future. Unlike the exercise of stock options, the issuance of shares upon vesting of restricted stock units does not result in any cash proceeds to us.
Contractual Cash used for the repurchase of common stock totaled $16.5 million, $49.5 million and $16.1 million in 2006, 2005 and 2004, respectively.Obligations.
The following summarizes our contractual cash obligations as of December 31, 20062009 (in thousands):Payments Due by Period
Total
2007
2008
2009
2010
2011
Beyond
Long-term debt $ — $ — $ — $ — $ — $ — $ — Capital lease obligations — — — — — — — Operating leases 23,691 7,241 5,682 4,883 3,103 1,983 799 Other long-term obligations — — — — — — —
Total contractual cash obligations $ 23,691 $ 7,241 $ 5,682 $ 4,883 $ 3,103 $ 1,983 $ 799
Payments Due by Period Total 2010 2011 2012 2013 2014 Beyond Long-term debt $ — $ — $ — $ — $ — $ — $ — Capital lease obligations — — — — — ��� — Operating leases 51,701 14,415 9,898 6,982 4,611 3,665 12,130 Total contractual cash obligations $ 51,701 $ 14,415 $ 9,898 $ 6,982 $ 4,611 $ 3,665 $ 12,130
The following summarizes our other commercial commitments as of December 31, 20062009 (in thousands):Total
2007
2008
2009
2010
2011
Beyond
Guarantees $ 3,500 $ 3,500 $ — $ — $ — $ — $ — Purchase obligations 7,004 7,004 — — — — —
Total commercial commitments $ 10,504 $ 10,504 $ — $ — $ — $ — $ —
Total 2010 2011 2012 2013 2014 Beyond Guarantees $ 5,200 $ 5,200 $ — $ — $ — $ — $ — Purchase obligations 6,500 6,500 — — — — — Total commercial commitments $ 11,700 $ 11,700 $ — $ — $ — $ — $ —
We currently expecthave commitments under non-cancelable operating leases primarily for office facilities throughout the world. Certain leases require us to fund expenditures for capital requirements as well as liquidity needs created by changes in working capital from a combination of available cashpay property taxes, insurance and short-term investment balancesroutine maintenance, and internally generated funds.include escalation clauses. As of December 31, 2006 and 2005, we had no debt outstanding. We believe that our cash flow from operations and existing cash balances and short-term investments will be sufficient to meet our cash requirements for at least the next twelve months. Cash requirements for periods beyond the next twelve months will depend on our profitability, our ability to manage working capital requirements and our rate of growth. Financial Risk Management
Our international sales are subject to inherent risks, including fluctuations in local economies; difficulties in staffing and managing foreign operations; greater difficulty in accounts receivable collection; costs and risks of localizing products for foreign countries; unexpected changes in regulatory requirements, tariffs and other trade barriers; difficulties in the repatriation of earnings and burdens of complying with a wide variety of foreign laws. The vast majority of our sales outside of North America are denominated in local currencies, and accordingly, we are subject to the risks associated with fluctuations in currency rates. In particular, increases in the value of the dollar against foreign currencies decrease the U.S. dollar value of foreign sales requiring that we either increase our price in the local currency, which could render our product prices noncompetitive, or suffer reduced revenues and gross margins as measured in U.S. dollars. These dynamics have adversely affected our revenue growth in international markets in previous years. Our foreign currency hedging program includes both foreign currency forward and purchased option contracts to reduce the effect of exchange rate fluctuations. However, our hedging program will not eliminate all of our foreign exchange risks. (See “Net Foreign Exchange Gain (Loss)” and Note 11 of Notes to Consolidated Financial Statements.)
The marketplace for our products dictates that many of our products be shipped very quickly after an order is received. As a result, we are required to maintain significant inventories. Therefore, inventory obsolescence is a risk for us due to frequent engineering changes, shifting customer demand, the emergence of new industry standards and rapid technological advances including the introduction by us or our competitors of products embodying new technology. While we adjust for excess and obsolete inventories and we monitor the valuation of our inventories, there can be no assurance that our valuation adjustments will be sufficient.
Off-Balance Sheet Arrangements
We have no debt or off-balance sheet debt. As of December 31, 2006,2009, we have non-cancelable operating lease obligations of approximately $23.7$52 million compared to $50 million at December 31, 2008. Rent expense under operating leases was $12 million, $12 million and contractual$10 million for the years ended December 31, 2009, 2008 and 2007, respectively.
Purchase obligations primarily represent purchase commitments for customized inventory and inventory components. As of December 31, 2009, we had non-cancelable purchase commitments with various suppliers of general components and customized inventory and inventory components totaling approximately $6.5 million over the next twelve months. At December 31, 2008, we had non-cancelable purchase commitments with various suppliers of customized inventory and inventory components totaling approximately $7.0$8.4 million.
Guarantees are related to payments of customs and foreign grants. As of December 31, 2006,2009, we have outstanding guarantees for payment of customs and foreign grants totaling approximately $3.5$5.2 million. (See Note 13 of Notes to Consolidated Financial Statements.) As of December 31, 2006,2008, we have outstanding guarantees for payment of customs and foreign grants totaling approximately $2.4 million.
Off-Balance Sheet Arrangements. We do not have any debt or off-balance sheet debt. As of December 31, 2009, we did not have any relationships with any unconsolidated entities or financial partnerships, such as entities often referred to as structured finance entities, which would have been established for the purpose of facilitating off-balance sheet arrangements. As such, we are not exposed to any financing, liquidity, market or credit risk that could arise if we were engaged in such relationships.
Market RiskProspective Capital Needs. We are exposedbelieve that our existing cash, cash equivalents and marketable securities, together with cash generated from operations and from the exercise of employee stock options and the purchase of common stock through our employee stock purchase plan, will be sufficient to a varietycover our working capital needs, capital expenditures, investment requirements, commitments, payment of risks, including foreign currency fluctuationsdividends to our shareholders and changes in the market valuerepurchases of our investments. Incommon stock for at least the normal coursenext 12 months. However, we may choose or be required to raise additional funds by selling equity or debt securities to the public or to selected investors, or by borrowing money from financial institutions. Historically, we have not had to rely on debt, public or private, to fund our operating, financing or investing activities. We could also choose or be required to reduce certain expenditures, such as payments of business, we employ established policies and procedures to manage our exposure to fluctuations in foreign currency values and changes in the market valuedividends or repurchases of our investments.
Foreign Currency Hedging Activities. Our objective in managing our exposurecommon stock. In addition, even though we may not need additional funds, we may still elect to foreign currency exchange rate fluctuations issell additional equity or debt securities or obtain credit facilities for other reasons. If we elect to reduceraise additional funds, we may not be able to obtain such funds on a timely basis on acceptable terms, if at all. If we raise additional funds by issuing additional equity or convertible debt securities, the impactownership percentages of adverse fluctuations in such exchange rates on our earnings and cash flow. Accordingly,existing shareholders would be reduced. In addition, the equity or debt securities that we utilize purchased foreign currency option contracts and forward contractsissue may have rights, preferences or privileges senior to hedge our exposure on anticipated transactions and firm commitments. The principal currencies hedged are the euro, British pound and Japanese yen. We monitor our foreign exchange exposures regularly to ensure the overall effectivenessthose of our foreign currency hedge positions. However, there can be no assurance that our foreign currency hedging activities will substantially offset the impact of fluctuations in currency exchange rates on our results of operations and financial position. Based on the foreign exchange instruments outstanding at December 31, 2006 and 2005, an adverse change (defined as 20% in the Asian currencies and 10% in all other currencies) in exchange rates would result in a decline in the aggregate fair market value of all of our instruments outstanding of approximately $6.6 million and $4.2 million, respectively. However, as we utilize foreign currency instruments for hedging anticipated and firmly committed transactions,common stock.
Although we believe that a loss in fair valuewe have sufficient capital to fund our activities for at least the next 12 months, our future capital requirements may vary materially from those instrumentsnow planned. We anticipate that the amount of capital we will be substantially offset by increasesneed in the value of the underlying exposure. (See Note 10 of Notes to Consolidated Financial Statements for a description of our financial instruments at December 31, 2006 and 2005.)Short-term Investments. The fair value of our investments in marketable securities at December 31, 2006 and 2005 was $150.2 million and $119.8 million, respectively. Investments with maturities beyond one year are classified as short-term basedfuture will depend on their highly liquid nature and because such marketable securities represent the investment of cash that is available for current operations. Our investment policy is to manage our investment portfolio to preserve principal and liquidity while maximizing the return on our investment portfolio through the full investment of available funds. We diversify our marketable securities portfolio by investing in multiple types of investment-grade securities. Our investment portfolio is primarily invested in securities with at least an investment grade rating to minimize interest rate and credit risk as well as to provide for an immediate source of funds. Based on our investment portfolio and interest rates at December 31, 2006 and 2005, a 100 basis point increase or decrease in interest rates would result in a decrease or increase of approximately $750,000 and $600,000, respectively, in the fair value of our investment portfolio. Although changes in interest rates may affect the fair value of our investment portfolio and cause unrealized gains or losses, such gains or losses would not be realized unless the investments are sold.
many factors, including:
· general economic and political conditions and specific conditions in the markets we address, including the continuing volatility in the industrial economy, current general economic volatility and trends in the industrial economy in various geographic regions in which we do business;
· the inability of certain of our customers who depend on credit to have access to their traditional sources of credit to finance the purchase of products from us, particularly in the current global economic environment, which may lead them to reduce their level of purchases or to seek credit or other accommodations from us;
· the overall levels of sales of our products and gross profit margins;
· our business, product, capital expenditure and research and development plans, and product and technology roadmaps;
· repurchases of our common stock;
· required levels of research and development and other operating costs;
· litigation expenses, settlements and judgments;
· the levels of inventory and accounts receivable that we maintain;
· acquisitions of other businesses, assets, products or technologies;
· capital improvements for new and existing facilities;
· our relationships with suppliers and customers; and,
· the level of exercises of stock options and stock purchases under our employee stock purchase plan.
Recently Issued Accounting Pronouncements
In July 2006,April 2009, the Financial Accounting Standards Board (“FASB”) issued FASB Interpretation (“FIN”) 48,Accountingupdated FASB ASC 820 providing additional guidance for Uncertainty in Income Taxes – an interpretationestimating fair value when the volume and level of Statement of Financial Accounting Standards (“SFAS”) 109.activity for the asset or liability have significantly decreased. This interpretation clarifies the accounting for uncertainty in income taxes recognized in an entity’s financial statements in accordance with SFAS 109,Accounting for Income Taxes. It prescribesupdate also includes guidance on identifying circumstances that indicate a recognition threshold and measurement attribute for financial statement disclosure of tax positions taken or expected to be taken on a tax return. This interpretationtransaction is effective for fiscal years beginning after December 15, 2006.not orderly. We adopted FIN 48the update on JanuaryApril 1, 20072009 as required. The cumulative effect of adopting FIN 48 was recorded in retained earnings upon adoption. The adoption of FIN 48required and concluded it did not have a significantmaterial impact on our consolidated financial position or results of operations.
In September 2006,2009, the SecuritiesFASB updated FASB ASC 105, Generally Accepted Accounting Principles (FASB ASC 105). The update establishes the FASB Standards Accounting Codification (“Codification”) as the source of authoritative U.S. generally accepted accounting principles (“GAAP”) recognized by the FASB to be applied to nongovernmental entities and Exchange Commission (“SEC”) issued Staff Accounting Bulletin (“SAB”) 108 regardingrules and interpretive releases of the process of quantifying financial statement misstatements. SAB 108 states that registrants should use both a balance sheet approachSEC as authoritative GAAP for SEC registrants. The Codification supersedes all existing non-SEC accounting and an income statement approach when quantifying and evaluating the materiality of a misstatement. The interpretations in SAB 108 contain guidance on correcting errors under the dual approach as well as provide transition guidance for correcting errors.reporting standards. This interpretation does not change the requirements within SFAS 154,Accounting Changes and Error Corrections – a replacement of APB 20 and FASB Statement 3, for the correction of an error on financial statements. SAB 108update is effective for annual financial statements covering the first fiscal yearissued for interim and annual periods ending after NovemberSeptember 15, 2006.2009. We adopted this interpretationthe update on December 31, 2006. The adoption of SAB 108July 1, 2009, as required and concluded it did not have a significant effectmaterial impact on our consolidated financial statements.position or results of operations.
In September 2006,October 2009, the FASB issued SFAS 157,Fair Value Measurements. This standard defines fair value, establishesupdated FASB ASC 605, Revenue Recognition (FASB ASC 605) that amended the criteria for separating consideration in multiple-deliverable arrangements. The amendments establish a frameworkselling price hierarchy for measuring fair value in accounting principles generally accepteddetermining the selling price of a deliverable. The selling price used for each deliverable will be based on vendor-specific objective evidence if available, third–party evidence if vendor-specific objective evidence is not available, or estimated selling price if neither vendor-specific objective evidence nor third-party evidence is available. The amendments will change the application of the residual method of allocation and require that arrangement consideration be allocated at the inception of the arrangement to all deliverables using the relative selling price method. The relative selling price method allocates any discount in the United Statesarrangement proportionally to each deliverable on the basis of America, and expands disclosure about fair value measurements.each deliverable’s selling price. This pronouncement applies under other accounting standards that requireupdate will be effective prospectively for revenue arrangements entered into or permit fair value measurements. Accordingly, this statement does not require any new fair value measurement. This statement is effective formaterially modified in fiscal years beginning on or after NovemberJune 15, 2007, and interim periods within those fiscal years. We will be required to adopt SFAS 157 in the first quarter of fiscal year 2008.2010. Early adoption is permitted. We are currently evaluating the requirements of SFAS 157this update and have not yet determined the impact on our consolidated financial statements.
In March 2006,October 2009, the Emerging Issues Task Force (“EITF”) reached a consensus on EITF Issue 06-3,How Taxes Collected from CustomersFASB updated FASB ASC 985, Software (FASB ASC 985) that changes the accounting model for revenue arrangements that include both tangible products and Remittedsoftware elements. Tangible products containing software components and non-software components that function together to Governmental Authorities Should Be Presented indeliver the Income Statement (that is, Gross versus Net Presentation). Taxestangible product’s essential functionality are no longer within the scope of EITF Issue 06-3 include any taxes assessed bythe software revenue guidance in Subtopic 985-605. In addition, the amendments require that hardware components of a governmental authority thattangible product containing software components always be excluded from the software revenue guidance. This update will be effective prospectively for revenue arrangements entered into or materially modified in fiscal years beginning on or after June 15, 2010. Early adoption is permitted. We are directly imposed on a revenue-producing transaction between a sellercurrently evaluating the requirements of this update and a customer and may include, but arehave not limited to, sales taxes, use taxes, value-added taxes, and some excise taxes. The EITF concluded thatyet determined the presentation of these taxes on either a gross (included in revenues and costs) or a net (excluded from revenue) basis is an accounting policy decision that should be disclosed. For any such taxes that are reported on a gross basis, a company should disclose the amounts of those taxes in interim and annual financial statements. Our policy is to exclude all such taxes from revenue. The provisions of EITF 06-3 are effective for interim and annual reporting periods beginning after December 15, 2006. The adoption of EITF 06-3 will not have any effectimpact on our consolidated financial statements.
Critical Accounting Policies
The preparation of our financial statements in conformity with generally accepted accounting principles requires us to make estimates and assumptions that affect the reported amounts of assets, liabilities, revenues, expenses and related disclosures of contingent assets and liabilities. We base our estimates on past experience and other assumptions that we believe are reasonable under the circumstances, and we evaluate these estimates on an ongoing basis. Our critical accounting policies are those that affect our financial statements materially and involve difficult, subjective or complex judgments by management. Although these estimates are based on management's best knowledge of current events and actions that may impact the company in the future, actual results may be materially different from the estimates.
Our critical accounting policies are as follows:
o Revenue recognition
We derive revenue primarily from the sale/licensing of integrated hardware and software solutions. We also sell application software licenses which are sold separately as well as training and post contract support services. The products and services are generally sold under standardized licensing and sales arrangements with payment terms ranging from net 30 days in the United States to net 30 days and up to net 90 days in some international markets. Approximately 95% of our product/license sales include both hardware and software in the customer arrangement, with a small percentage of sales including other services. We offer rights of return and standard warranties for product defects related to our products. The rights of return are generally for a period of up to 30 days after the delivery date. The standard warranties cover periods ranging from 90 days to three years. We do not enter into contracts requiring product acceptance from the customer.
· Revenue is recognized in accordance with the provisions of SOP 97-2 when persuasive evidence of an arrangement exists, delivery has occurred, the fee is fixed or determinable, and collectability is probable. We enter into certain arrangements where we are obligated to deliver multiple products and/or services (“multiple elements”). In these transactions, we allocate the total revenue among the elements based on the sales price of each element when sold separately (“vendor-specific objective evidence”).recognition
We derive revenue primarily from the sale/licensing of integrated hardware and software solutions. Independent sales of application software licenses include post contract support services. In addition, training services are sold separately. The products and services are generally sold under standardized licensing and sales arrangements with payment terms ranging from net 30 days in the U.S. to net 30 days and up to net 90 days in some international markets. Approximately 83% of our product/license sales include both hardware and software in the customer arrangement, with a small percentage of sales including other services. We offer rights of return and standard warranties for product defects related to our products. The rights of return are generally for a period of up to 30 days after the delivery date. The standard warranties cover periods ranging from 90 days to three years. We do not generally enter into contracts requiring product acceptance from the customer.
Revenue is recognized in accordance with the provisions of FASB ASC 985, when persuasive evidence of an arrangement exists, delivery has occurred, the fee is fixed or determinable, and collectability is probable. We enter into certain arrangements where we are obligated to deliver multiple products and/or services (“multiple elements”). In these transactions, we allocate the total revenue among the elements based on vendor specific objective evidence (“VSOE”) of fair value as determined by the sales price of each element when sold separately.
When VSOE of fair value is available for the undelivered element of a multiple element arrangements, sales revenue is generally recognized on the date the product is shipped, using the residual method under FASB ASC 985, with a portion of revenue recorded as deferred (unearned) due to applicable undelivered elements. Undelivered elements for our multiple element arrangements with a customer are generally restricted to post contract support and training and education. The amount of revenue allocated to these undelivered elements is based on the VSOE of fair value for those undelivered elements. Deferred revenue due to undelivered elements is recognized ratably on a straight-line basis over the service period or when the service is completed. When VSOE of fair value is not available for the undelivered element of a multiple element arrangement, sales revenue is generally recognized ratably, on a straight-line basis over the service period of the undelivered element, generally 12 months or when the service is completed in accordance with the subscription method under FASB ASC 985. Deferred revenue at December 31, 2009 and 2008 was $57 million and $46 million, respectively.
The application of FASB ASC 985, requires judgment, including whether a software arrangement includes multiple elements, and if so, whether VSOE of fair value exists for those elements. Changes to the elements in a software arrangement, the ability to identify VSOE for those elements, the fair value of the respective elements, and changes to a product’s estimated life cycle could materially impact the amount of our earned and unearned revenue. Judgment is also required to assess whether future releases of certain software represent new products or upgrades and enhancements to existing products.
· Sales revenue from product sales is generally recognized on the date the product is shipped, with a portion of revenue recorded as deferred (unearned) due to applicable undelivered elements. Undelivered elements for our multiple-element arrangements with a customer are generally restricted to post contract support and training and education. The amount of revenue allocated to these undelivered elements is based on the vendor-specific objective evidence (“VSOE”) of fair value for those undelivered elements. Deferred revenue due to undelivered elements is recognized ratably on a straight-line basis over the service period or when the service is completed. Deferred revenue at December 31, 2006 and 2005 was $22.2 million and $16.0 million, respectively.
The application of SOP 97-2 requires judgment, including whether a software arrangement includes multiple elements, and if so, whether VSOE of fair value exists for those elements. Changes to the elements in a software arrangement, the ability to identify VSOE for those elements, the fair value of the respective elements, and changes to a product's estimated life cycle could materially impact the amount of earned and unearned revenue. Judgment is also required to assess whether future releases of certain software represent new products or upgrades and enhancements to existing products.
Provision for estimated sales returns is made by reducing recorded revenue based on historical experience. The accounts receivable are net ofEstimating allowances for doubtful accounts and sales returns of $4.4 million and $4.7 million at December 31, 2006 and 2005, respectively.
The preparation of financial statements requires that we make estimates and assumptions of potential future product returns related to current period product revenue. We analyze historical returns, current economic trends, and changes in customer demand and acceptance of our products when evaluating the adequacy of our sales returns allowance. Significant judgments and estimates must be made and used in connection with establishing the sales returns allowance in any accounting period. A provision for estimated sales returns is made by reducing recorded revenue by the amount of the allowance. Accounts receivable is reported net of the allowance for sales returns. The allowance for sales returns was $1.9 million and $1.8 million at December 31, 2009 and 2008, respectively. Material differences may result in the amount and timing of our revenue for any period if we made different judgments or utilized different estimates or if actual results varied materially from our estimates.
· o Estimating allowances, specifically sales returns, the allowance for doubtful accounts and the adjustment for excess and obsolete inventories
In addition to estimating an allowance for sales returns, we must also make estimates about the uncollectability of our accounts receivables. We specifically analyze accounts receivable and analyze historical bad debts, customer concentrations, customer credit-worthiness and current economic trends when evaluating the adequacy of our allowance for doubtful accounts. Our allowance for doubtful accounts was $2.7 million and $3.9 million at December 31, 2009 and 2008, respectively. We also write down our inventory for estimated obsolescence or unmarketable inventory equal to the difference between the cost of inventory and estimated market value based on assumptions of future demand and market conditions. Our allowance for excess and obsolete inventories was $4.4 million and $4.4 million at December 31, 2009 and 2008, respectively. Significant judgments and estimates must be made and used in connection with establishing these allowances. Material differences may result in the amount and timing of our bad debt and inventory obsolescence if we made different judgments or utilized different estimates or if actual results varied materially from our estimates.
· The preparation of financial statements requires that we make estimates and assumptions that affect the reported amount of assets and liabilities and disclosure of contingent assets and liabilities at the date of the financial statements and the reported amounts of revenues and expenses during the reported period. Specifically, we must make estimates of potential future product returns related to current period product revenue. Management analyzes historical returns, current economic trends, and changes in customer demand and acceptance of our products when evaluating the adequacy of our sales returns and other allowances. Significant management judgments and estimates must be made and used in connection with establishing the sales returns and other allowances in any accounting period. The allowance for sales returns was $1.5 million at December 31, 2006. Material differences may result in the amount and timing of our revenue for any period if management made different judgments or utilized different estimates. Similarly, management must make estimates of the uncollectability of our accounts receivables. Management specifically analyzes accounts receivable and analyzes historical bad debts, customer concentrations, customer credit-worthiness and current economic trends when evaluating the adequacy of our allowance for doubtful accounts. The allowance for doubtful accounts was $2.9 million at December 31, 2006. We write down our inventory for estimated obsolescence or unmarketable inventory equal to the difference between the cost of inventory and estimated market value based on assumptions of future demand and market conditions. Our adjustment for excess and obsolete inventories was $5.2 million at December 31, 2006. If actual market conditions are less favorable than those projected by management, additional inventory write downs would be required.
o Accounting for costs of computer software
We capitalize costs related to the development and acquisition of certain software products. Capitalization of costs begins when technological feasibility has been established and ends when the product is available for general release to customers. Technological feasibility for our products is established when the product is available for beta release. Judgment is required in determining when technological feasibility of a product is established. Amortization is computed on an individual product basis for those products available for market and has been recognized based on the product’s estimated economic life, generally three years. At each balance sheet date, the unamortized costs are reviewed by management and reduced to net realized value when necessary. As of December 31, 2009, unamortized capitalized software development costs were $18 million.
· We capitalize costs related to the development and acquisition of certain software products. Capitalization of costs begins when technological feasibility has been established and ends when the product is available for general release to customers. Judgment is required in determining when technological feasibility of a product is established. Amortization is computed on an individual product basis for those products available for market and has been recognized based on the product’s estimated economic life, generally three years. At each balance sheet date, the unamortized costs are reviewed by management and reduced to net realized value when necessary. As of December 31, 2006, unamortized capitalized software development costs was $15.8 million.
o Valuation of long-lived and intangible assets
We assess the impairment of identifiable intangibles, long-lived assets and related goodwill whenever events or changes in circumstances indicate that the carrying value may not be recoverable. In accordance with FASB ASC 350, Intangibles – Goodwill and Other (FASB ASC 350), goodwill is tested for impairment on an annual basis, and between annual tests if indicators of potential impairment exist, using a fair-value-based approach based on the market capitalization of the reporting unit. Our annual impairment test was performed as of February 28, 2009. No impairment of goodwill has been identified during the period presented. Goodwill is deductible for tax purposes in certain jurisdictions. We have defined our operating segment based on geographic regions. We sell our products in three geographic regions. Our sales to these regions share similar economic characteristics, similar product mix, similar customers, and similar distribution methods. Accordingly, we have elected to aggregate these three geographic regions into a single operating segment. As we have one reporting segment, we allocate goodwill to one reporting unit for goodwill impairment testing. Factors considered important which could trigger an impairment review include the following:
· We assess the impairment of identifiable intangibles, long-lived assets and related goodwill whenever events or changes in circumstances indicate that the carrying value may not be recoverable. Factors considered important which could trigger an impairment review include the following:
oSignificantsignificant underperformance relative to expected historical or projected future operating results;
o· Significantsignificant changes in the manner of our use of the acquired assets or the strategy for our overall business;
o· Significantsignificant negative industry or economic trends; and,
o· Ourour market capitalization relative to net book value.
When it is determined that the carrying value of intangibles, long-lived assets and related goodwill may not be recoverable based upon the existence of one or more of the above indicators of impairment, the measurement of any impairment is determined and the carrying value is reduced as appropriate. As of December 31, 2009, we had net goodwill of approximately $65 million.
· When it is determined that the carrying value of intangibles, long-lived assets and related goodwill may not be recoverable based upon the existence of one or more of the above indicators of impairment, the measurement of any impairment is determined and the carrying value is reduced as appropriate. As of December 31, 2006, we had net goodwill of approximately $53.3 million.
o Accounting for income taxes
We account for income taxes under the asset and liability method that requires the recognition of deferred tax assets and liabilities for the expected future tax consequences of events that have been recognized in our financial statements or tax returns. Judgment is required in assessing the future tax consequences of events that have been recognized in our financial statements or tax returns. Variations in the actual outcome of these future tax consequences could materially impact our financial position or our results of operations. In estimating future tax consequences, all expected future events are considered other than enactments of changes in tax laws or rates. Valuation allowances are established when necessary to reduce deferred tax assets to amounts which are more likely than not to be realized.
As a result of certain foreign investment incentives available under Hungarian law, the profit from our Hungarian operation was subject to a reduced income tax rate. This special tax status terminated on January 1, 2008, with the merger of our Hungarian manufacturing operations with its Hungarian parent company. The tax position of our Hungarian operation continued to benefit from assets created by the restructuring of our operations in Hungary. Realization of these assets was based on estimated future earnings in Hungary. Partial release of the valuation allowance on these assets resulted in income tax benefits of $18.3 million for the year ended December 31, 2007, and $8.7 million for the year ended December 31, 2008.
For the year 2009, we expected to recognize an additional tax benefit of $9.7 million related to these assets. Effective January 1, 2010, a new tax law in Hungary provides for an enhanced deduction for the qualified research and development expenses of NI Hungary Software and Hardware Manufacturing Kft. ("NI Hungary"). During the three months ended December 31, 2009, we obtained confirmation of the application of this new tax law for the qualified research and development expenses of NI Hungary. Based on the application of this new tax law to the qualified research and development expense of NI Hungary, we no longer expect to have sufficient future taxable income in Hungary to realize the benefits of these tax assets. As such, we recorded an income tax charge of $21.6 million during the three months ended December 31, 2009, $18.4 million of which was related to a valuation allowance on the previously recognized assets created by the restructuring and $3.2 million of which was related to tax benefits from other assets that we will no longer be able to realize as a result of this change. We do not expect to realize the tax benefit of the remaining assets created by the restructuring and therefore we have a full valuation allowance of $98.2 million against those assets at December 31, 2009.For additional discussion about our income taxes including components of income before income taxes, our provision for income taxes charged to operations, components of our deferred tax assets and liabilities, a reconciliation of income taxes at the U.S. federal statutory rate of 35% to our effective tax rate and other tax matters, see Note 9 – Income taxes of Notes to Consolidated Financial Statements.· We account for income taxes under the asset and liability method that requires the recognition of deferred tax assets and liabilities for the expected future tax consequences of events that have been recognized in our financial statements or tax returns. Judgment is required in assessing the future tax consequences of events that have been recognized in our financial statements or tax returns. Variations in the actual outcome of these future tax consequences could materially impact our financial position or our results of operations. In estimating future tax consequences, all expected future events are considered other than enactments of changes in tax laws or rates. Valuation allowances are established when necessary to reduce deferred tax assets to amounts which are more likely than not to be realized.Loss contingencies
As a result of certain foreign investment incentives available under Hungarian law, the profit from our Hungarian operation is currently subject to a reduced income tax rate. These benefits may not be available in the future due to changes in Hungary’s political condition and/or tax laws. The reduction or elimination of these foreign investment incentives would result in the reduction or elimination of certain tax benefits thereby increasing our future effective income tax rate, which could have a material adverse effect on our operating results.
We accrue for probable losses from contingencies including legal defense costs, on an undiscounted basis, in accordance with FASB ASC 450, Contingencies (FASB ASC 450), when such costs are considered probable of being incurred and are reasonably estimable. We periodically evaluate available information, both internal and external, relative to such contingencies and adjust this accrual as necessary. Disclosure of a contingency is required if there is at least a reasonable possibility that a loss has been incurred. In determining whether a loss should be accrued we evaluate, among other factors, the degree of probability of an unfavorable outcome and the ability to make a reasonable estimate of the amount of loss. Changes in these factors could materially impact our financial position or our results of operation.
We receive a substantial income tax benefit from the extraterritorial income (“ETI”) exemption under U.S. law. The ETI rules were repealed for transactions after December 31, 2004, with a two-year transition period, and ceased to be available as of December 31, 2006. The repeal of ETI will increase our future effective income tax rate by approximately one percentage point in December 31, 2007. However, we believe this increase will be offset entirely by the effects of the expected increased benefit from the deduction for income from qualified domestic production activities and increased profits in certain foreign jurisdictions with reduced income tax rates.
o Loss contingencies
We accrue for probable losses from contingencies including legal defense costs, on an undiscounted basis, in accordance with SFAS 5,Accounting for Loss Contingencies, when such costs are considered probable of being incurred and are reasonably estimable. We periodically evaluate available information, both internal and external, relative to such contingencies and adjust this accrual as necessary. Disclosure of a contingency is required if there is at least a reasonable possibility that a loss has been incurred. In determining whether a loss should be accrued we evaluate, among other factors, the degree of probability of an unfavorable outcome and the ability to make a reasonable estimate of the amount of loss. Changes in these factors could materially impact our financial position or our results of operation.
ITEM 7A. QUANTITATIVE AND QUALITATIVE DISCLOSURES ABOUT MARKET RISK
Financial Risk Management
Our international sales are subject to inherent risks, including fluctuations in local economies; fluctuations in foreign currencies relative to the U.S. dollar; difficulties in staffing and managing foreign operations; greater difficulty in accounts receivable collection; costs and risks of localizing products for foreign countries; unexpected changes in regulatory requirements, tariffs and other trade barriers; difficulties in the repatriation of earnings and burdens of complying with a wide variety of foreign laws. The informationvast majority of our sales outside of North America are denominated in local currencies, and accordingly, the U.S. dollar equivalent of these sales is affected by changes in the foreign currency exchange rates. Net of hedging results, the change in exchange rates had the effect of decreasing our consolidated sales by $29 million or 4% for the year ended December 31, 2009, compared to 2008. If the local currencies in which we sell our products strengthen against the U.S. dollar, we may need to lower our prices in the local currency to remain competitive in our international markets which could have a material adverse effect on our gross and net profit margins. If the local currencies in which we sell our products weaken against the U.S. dollar and if the local sales prices cannot be raised due to competitive pressures, we will experience a deterioration of our gross and net profit margins. Since most of our international operating expenses are also incurred in local currencies, the change in exchange rates had the effect of decreasing our operating expenses by $12 million or 2% for the year ended December 31, 2009, compared to 2008. Currently, we are experiencing significant volatility in foreign currency exchange rates in many of the markets in which we do business. This has had a significant impact on the revaluation of our foreign currency denominated firm commitments and on our ability to forecast our U.S. dollar equivalent revenues and expenses. In the past, these dynamics have also adversely affected our revenue growth in international markets and will likely pose similar challenges in the future. Our foreign currency hedging program includes both foreign currency forward and purchased option contracts to reduce the effect of exchange rate fluctuations. However, our hedging program will not eliminate all of our foreign exchange risks, particularly when market conditions experience the recent level of volatility. (See “Net Foreign Exchange Gain (Loss)” and Note 4 – Derivative instruments and hedging activities of Notes to Consolidated Financial Statements).
Inventory ManagementThe marketplace for our products dictates that many of our products be shipped very quickly after an order is received. As a result, we are required to maintain significant inventories. Therefore, inventory obsolescence is a risk for us due to frequent engineering changes, shifting customer demand, the emergence of new industry standards and rapid technological advances including the introduction by this itemus or our competitors of products embodying new technology. While we adjust for excess and obsolete inventories and we monitor the valuation of our inventories, there can be no assurance that our valuation adjustments will be sufficient.
Market RiskWe are exposed to a variety of risks, including foreign currency fluctuations and changes in the market value of our investments. In the normal course of business, we employ established policies and procedures to manage our exposure to fluctuations in foreign currency values and changes in the market value of our investments.Cash, Cash Equivalents and Short-Term Investments
At December 31, 2009, we had $289 million in cash, cash equivalents and short-term investments. We maintain cash and cash equivalents with various financial institutions located in many countries throughout the world. Approximately $114 million or 39% of these amounts were held in domestic accounts with various financial institutions and $175 million or 61% was held in accounts outside of the U.S. with various financial institutions. At December 31, 2009, $85 million or 42% of our cash and cash equivalents was held in cash in various operating accounts throughout the world, and $116 million or 58% was held in money market accounts. The most significant of our operating accounts was our domestic operating account which held approximately $22 million or 11% of our total cash and cash equivalents at a bank that carried a A1 rating at December 31, 2009. Our short-term investment balance is incorporatedcomprised of $35 million held in our investment accounts in the U.S. and $52 million held in investment accounts of our foreign subsidiaries.
Short-term debt securities available-for-sale included auction rate securities backed by referenceeducation loan revenue bonds. One of our auction rate securities is from the Vermont Student Assistance Corporation and has a par value of $2.2 million. The other of our auction rate securities is from the New Hampshire Health and Education Facilities Authority and has a par value of $6.4 million. At December 31, 2009, we reported these auction rate securities at their estimated fair market value of $8.2 million as a component of short-term debt securities available for sale. We are also a party to “Item 7—Management’s Discussiona UBS Auction Rate Securities Rights (the “Rights”) agreement. The Rights agreement is a nontransferable right to sell our auction rate securities, at par value, back to UBS at any time during the period June 30, 2010, through July 2, 2012. At December 31, 2009, we reported the Rights agreement at its estimated fair market value of $423,000 as a component of short-term debt securities available for sale. See Note 3 – Fair value measurements in Notes to Consolidated Financial Statements for further discussion of our auction rate securities and Analysisour Rights agreement.
Due to the fact that our Rights agreement has an initial exercise date that is less than one year from now, we are now reporting our auction rate securities and the corresponding Rights agreement as short-term. We continue to have the ability to hold our auction rate securities to their ultimate maturities which are in excess of one year and we have not made a determination as to whether we will exercise our option under the Rights agreement or if we do choose to exercise our option, at what point during the period June 30, 2010 through July 2, 2012, we would exercise our option. We have recorded the unrealized loss related to the auction rate securities and the unrealized gain related to the Rights agreement as a component of other income (expense), in our Consolidated Statements of Income.
We do not anticipate that the auction rate market will provide liquidity for these securities in the foreseeable future. Should we need or desire to access the funds invested in those securities prior to their maturity or prior to our exercise period under the Rights agreement discussed above, we may be unable to find a buyer in a secondary market outside the auction process or if a buyer in a secondary market is found, we would likely realize a loss.
We maintain an investment portfolio of various types of security holdings and maturities. Pursuant to FASB ASC 820, cash equivalents and short-term investments available-for-sale are valued using a market approach (Level 1) based on the quoted market prices of identical instruments when available or other observable inputs such as trading prices of identical instruments in inactive markets. The estimated fair market value of both the auction rate securities and the Rights agreement was determined using significant unobservable inputs (Level 3) as prescribed by FASB ASC 820.
The goal of our investment policy is to manage our investment portfolio to preserve principal and liquidity while maximizing the return on our investment portfolio through the full investment of available funds. We place our cash investments in instruments that meet credit quality standards, as specified in our corporate investment policy guidelines. These guidelines also limit the amount of credit exposure to any one issue, issuer or type of instrument. Other than our auction rate securities discussed above, at December 31, 2009, our cash equivalents and short-term investments carried ratings from the major credit rating agencies that were in accordance with our corporate investment policy. Our investment policy allows investments in the following; government and federal agency obligations, repurchase agreements (“Repos”), certificates of deposit and time deposits, corporate obligations, medium term notes and deposit notes, commercial paper including asset-backed commercial paper (“ABCP”), puttable bonds, general obligation and revenue bonds, money market funds, taxable commercial paper, corporate notes/bonds, municipal notes, municipal obligations, variable rate demand notes and tax exempt commercial paper. All such instruments must carry minimum ratings of A1/P1/F1, MIG1/VMIG1/SP1 and A2/A/A, as applicable, all of which are considered “investment grade”. Our investment policy for marketable securities requires that all securities mature in three years or less, with a weighted average maturity of no longer than 18 months with at least 10% maturing in 90 days or less.
We account for our investments in debt and equity instruments under FASB ASC 320. Our investments are classified as available-for-sale and accordingly are reported at fair value, with unrealized gains and losses reported as other comprehensive income, a component of shareholders’ equity. Unrealized losses are charged against income when a decline in fair value is determined to be other than temporary. Investments with maturities beyond one year are classified as short-term based on their highly liquid nature and because such marketable securities represent the investment of cash that is available for current operations. The fair value of our short-term investments in debt securities at December 31, 2009 and December 31, 2008 was $87 million and $6 million, respectively. The increase was due to the net purchase of $74 million of short-term investments and the transfer of $8.6 related to our auction rate securities and our rights agreement from long-term investments to short-term investments during the year ended December 31, 2009. The net purchase of $74 million of short term investments was done to diversify our holdings from money market accounts to debt securities and to take advantage of higher yields associated with longer maturity debt securities. We follow the guidance provided by FASB ASC 320 to assess whether our investments with unrealized loss positions are other than temporarily impaired. Realized gains and losses and declines in value judged to be other than temporary are determined based on the specific identification method and are reported in other income (expense), net, in our Consolidated Statements of Income.Long-Term Investments
At December 31, 2008, our long-term investments consisted primarily of Aaa/A/AAA rated investments in auction rate securities that we originally purchased for $8.6 million. These auction rate securities consist of education loan revenue bonds. Auction rate securities are variable rate debt instruments whose interest rates are typically reset approximately every 7 to 35 days. At December 31, 2008, we classified these investments as long-term due to the fact that the underlying securities have contractual maturities that are greater than one year. These contractual maturities are also in excess of the guidelines provided for in our corporate investment policy. The auction rate securities are classified as available-for-sale. At December 31, 2008, we reported these long-term investments at their estimated fair market value of $7.0 million. In November 2008, we accepted the Rights agreement offered by UBS as a liquidity alternative to the failed auction process. The Rights agreement is a nontransferable right to sell our auction rate securities, at par value, back to UBS at any time during the period June 30, 2010, through July 2, 2012. At December 31, 2008, we reported the Rights agreement at its estimated fair market value of $1.6 million. At December 31, 2008 he estimated fair market value of both the auction rate securities and the Rights agreement was determined using significant unobservable inputs (Level 3) as prescribed by FASB ASC 820. These auction rate securities and the Rights agreement are now reported as a component of short-term investments as discussed above.
Interest Rate Risk
Investments in both fixed rate and floating rate instruments carry a degree of interest rate risk. Fixed rate securities may have their market value adversely impacted due to an increase in interest rates, while floating rate securities may produce less income than expected if interest rates fall. Due in part to these factors, our future investment income may fall short of expectations due to changes in interest rates or if the decline in fair value of our publicly traded debt investments is judged to be other-than-temporary. We may suffer losses in principal if we are forced to sell securities that have declined in market value due to changes in interest rates. However, because any debt securities we hold are classified as available-for-sale, no gains or losses are realized in the income statement due to changes in interest rates unless such securities are sold prior to maturity or unless declines in value are determined to be other-than-temporary. These securities are reported at fair value with the related unrealized gains and losses included in accumulated other comprehensive income (loss), a component of shareholders’ equity, net of tax.
In a declining interest rate environment, as short-term investments mature, reinvestment occurs at less favorable market rates. Given the short-term nature of certain investments, the current interest rate environment of low or declining rates will likely negatively impact our investment income.
In order to assess the interest rate risk associated with our investment portfolio, we performed a sensitivity analysis to determine the impact a change in interest rates would have on the value of the investment portfolio assuming a 100 basis point parallel shift in the yield curve. Based on our investment positions as of December 31, 2009, a 100 basis point increase or decrease in interest rates across all maturities would result in a $614,000 increase or decrease in the fair market value of the portfolio. As of December 31, 2008, a similar 100 basis point shift in the yield curve would have resulted in a $50,000 increase or decrease in the fair market value of the portfolio. Such losses would only be realized if we sold the investments prior to maturity or if there is a other than temporary impairment.
Actual future gains and losses associated with our investments may differ from the sensitivity analyses performed as of December 31, 2009 due to the inherent limitations associated with predicting the changes in the timing and level of interest rates and our actual exposures and positions.
Economic conditions in 2008 and 2009 had negative effects on the financial markets. In response to these conditions, we shifted a larger percentage of our portfolio to money market funds, U.S. Treasuries and time deposits toward the end of 2008. This had a negative impact on our investment income in 2009. As we noted some stabilization in the financial markets throughout 2009, we made net purchases of $74 million of short-term investments, primarily to diversify our holdings from money market accounts to debt securities and to take advantage of higher yields associated with longer maturity debt securities. However, yields, even at longer maturities, remained at or near historic lows throughout 2009. We cannot predict when interest rates and investment yields will rise. If yields continue to stay at these low levels, our investment income will continue to be negatively impacted.
Exchange Rate RiskOur objective in managing our exposure to foreign currency exchange rate fluctuations is to reduce the impact of adverse fluctuations in such exchange rates on our earnings and cash flow. Accordingly, we utilize purchased foreign currency option and forward contracts to hedge our exposure on anticipated transactions and firm commitments. The principal currencies hedged are the Euro, British pound, Japanese yen and Hungarian forint. We monitor our foreign exchange exposures regularly to help ensure the overall effectiveness of our foreign currency hedge positions. There can be no assurance that our foreign currency hedging activities will substantially offset the impact of fluctuations in currency exchanges rates on our results of operations and financial position. Based on the foreign exchange instruments outstanding at December 31, 2009 and December 31, 2008, an adverse change (defined as 20% in the Asian currencies and 10% in all other currencies) in exchange rates would result in a decline in the aggregate settlement value of all of our instruments outstanding of approximately $22 million and $31 million, respectively. However, as we utilize foreign currency instruments for hedging anticipated and firmly committed transactions, we believe that a loss in settlement value for those instruments will be substantially offset by increases in the value of the underlying exposure. (See Note 4 - Derivative instruments and hedging activities of Notes to Consolidated Financial ConditionStatements for a further description of our derivative instruments and Results of Operations—Market Risk” above.hedging activities).
ITEM 8. FINANCIAL STATEMENTS AND SUPPLEMENTARY DATA
The information required by this item is incorporated by reference to the Consolidated Financial Statements set forth on pages F-1 through F-27 and S-1F-31 hereof.
ITEM 9. CHANGES IN AND DISAGREEMENTS WITH ACCOUNTANTS ON ACCOUNTING AND FINANCIAL DISCLOSURE
There were no disagreements with accountants on accounting and financial disclosure for the year ended December 31, 2006.2009.
ITEM 9A. CONTROLS AND PROCEDURES
Evaluation of Disclosure Controls and Procedures
As of the end of the period covered by this Annual Report on Form 10-K, as required by paragraph (b) of Rule 13a-15 or Rule 15d-15 under the Securities Exchange Act of 1934, as amended, we evaluated under the supervision of our Chief Executive Officer, Dr. James Truchard, and our Chief Financial Officer, the effectivenessAlex Davern, based on their evaluation of our disclosure controls and procedures (as defined in Rules 13a-15(e) orand 15d-15(e) of the Securities Exchange Act of 1934, as amended). Based on this evaluation, our Chief Executive Officer and our Chief Financial Officer, required by paragraph (b) of Rule 13a – 15 or Rule 15d – 15, have concluded that our disclosure controls and procedures arewere effective at the reasonable assurance level, to ensure the timely collection, evaluation and disclosure of information relating to us that information we are requiredwould potentially be subject to disclose in reports that we file or submitdisclosure under the Securities Exchange Act of 1934, (i)as amended, and the rules and regulations promulgated there under, and that such information is recorded, processed, summarized and reported within the time periods specified in Securities and Exchange Commissionthe SEC’s rules and forms,forms. These disclosure controls and (ii)procedures include, without limitation, controls and procedures designed to ensure that information required to be disclosed by us in the reports we file or submit is accumulated and communicated to our management, including our Chief Executive Officer and our Chief Financial Officer, as appropriate to allow timely decisions regarding required disclosure. Our disclosure controls and procedures are designed to provide reasonable assurance that such information is accumulated and communicated to our management. Our disclosure controls and procedures include components of our internal control over financial reporting. Management’s assessment of the effectiveness of our internal controlcontrols over financial reporting is expressed at the level of reasonable assurance because a control system, no matter how well designed and operated, can provide only reasonable, but not absolute assurance that the control system’s objectives will be met. We continue to enhance our internal control over financial reporting in key functional areas with the goal of monitoring our operations at the level of documentation, segregation of duties, and systems security necessary, as well as transactional control procedures required under Auditing Standard No. 5 issued by the Public Company Accounting Oversight Board. We discuss and disclose these matters to the audit committee of our board of directors and to our auditors.
Management Report on Internal Control over Financial Reporting
Our management is responsible for establishing and maintaining adequate internal control over financial reporting to provide reasonable assurance regarding the reliability of our financial reporting and the preparation of financial statements for external purposes in accordance with generally accepted accounting principles. Internal control over financial reporting includes those policies and procedures that (i) pertain to the maintenance of records that in reasonable detail accurately and fairly reflect the transactions and dispositions of the assets of the company, (ii) provide reasonable assurance that transactions are recorded as necessary to permit preparation of financial statements in accordance with generally accepted accounting principles, and that receipts and expenditures of the Company are being made only in accordance with authorizations of management and directors of the Company; and (iii) provide reasonable assurance regarding prevention or timely detection of unauthorized acquisition, use or disposition of the Company’s assets that could have a material effect on the financial statements.
Management assessed our internal control over financial reporting as of December 31, 2006,2009, which was the end of our fiscal year. Management based its assessment on criteria established in Internal Control – Integrated Framework issued by the Committee of Sponsoring Organizations of the Treadway Commission. Management’s assessment included evaluation of such elements as the design and operating effectiveness of key financial reporting controls, process documentation, accounting policies, and our overall control environment. This assessment is supported by testing and monitoring performed by our finance organization.
Based on our assessment, management has concluded that our internal control over financial reporting was effective as of the end of the fiscal year to provide reasonable assurance regarding the reliability of financial reporting and the preparation of financial statements for external reporting purposes in accordance with generally accepted accounting principles. We reviewed the results of management’s assessment with the Audit Committee of our Board of Directors.
Our independent registered public accounting firm, Ernst & Young LLP, who also audited our consolidated financial statements, audited management’s assessment and independently assessed the effectiveness of our internal control over financial reporting. Ernst & Young LLP has issued their attestation report, which is included in Part II, Item 8 of this Form 10-K.
Changes in Internal Control over Financial Reporting
During the three months ended December 31, 2006,2009, there was no change in our internal control over financial reporting identified in connection with the evaluation required by paragraph (d) of Rule 13a-15 or Rule 15d-15 that has materially affected, or is reasonably likely to materially affect, our internal control over financial reporting.
ITEM 9B. OTHER INFORMATION
None.
PART III
Certain information required by Part III is omitted from this Report in that we intend to file a definitive proxy statement pursuant to Regulation 14A with the Securities and Exchange Commission (the “Proxy Statement”) relating to our annual meeting of stockholders not later than 120 days after the end of the fiscal year covered by this Report, and such information is incorporated by reference herein.
ITEM 10. DIRECTORS, EXECUTIVE OFFICERS AND CORPORATE GOVERNANCE
The information concerning our directors required by this Item pursuant to Item 401 of Regulation S-K will appear in our Proxy Statement under the section “Election of Directors” and such information is incorporated herein by reference.
The information concerning our executive officers required by this Item pursuant to Item 401 of Regulation S-K will appear in our Proxy Statement under the section “Executive Officers” and such information is incorporated herein by reference.
The information required by this Item pursuant to Item 405 of Regulation S-K regarding compliance with Section 16(a) of the Securities Exchange Act of 1934, as amended, will appear in our Proxy Statement under the section “Section 16(a) Beneficial Ownership Reporting Compliance” and such information is incorporated herein by reference.
The information concerning our code of ethics that applies to our principal executive officer, our principal financial officer, our controller or person performing similar functions required by this Item pursuant to Item 406 of Regulation S-K will appear in our Proxy Statement under the section “Code of Ethics” and such information is incorporated herein by reference.
The information required by this Item pursuant to Item 407(c)(3) of Regulation S-K regarding material changes, if any, to procedures by which security holders may recommend nominees to our board of directors will appear in our Proxy Statement under the section “Deadline for Receipt of Stockholder Proposals” and such information is incorporated herein by reference.
The information required by this Item pursuant to Item 407(d)(4) and Item 407(d)(5) of Regulation S-K regarding our Audit Committee and our audit committee financial expert(s), respectively, will appear in our Proxy Statement under the heading “Corporate Governance” and such information is incorporated herein by reference.
ITEM 11. EXECUTIVE COMPENSATION
The information required by this Item pursuant to Item 402 of Regulation S-K regarding director compensation will appear in our Proxy Statement under the section “Board Compensation” and such information is incorporated herein by reference.
The information required by this Item pursuant to Item 402 of Regulation S-K regarding executive officer compensation, including our Compensation Discussion & Analysis, will appear in our Proxy Statement under the section “Executive Compensation” and such information is incorporated herein by reference.
The information required by this Item pursuant to Item 407(e)(4) of Regulation S-K will appear in our Proxy Statement under the section “Compensation Committee Interlocks and Insider Participation” and such information is incorporated herein by reference.
The information required by this Item pursuant to Item 407(e)(5) will appear in our Proxy Statement under the section “Compensation Committee Report” and such information is incorporated herein by reference.
ITEM 12. SECURITY OWNERSHIP OF CERTAIN BENEFICIAL OWNERS AND MANAGEMENT AND RELATED STOCKHOLDER MATTERS
From time to time our directors, executive officers and other insiders may adopt stock trading plans pursuant to Rule 10b5-1(c) promulgated by the Securities and Exchange Commission under the Securities Exchange Act of 1934, as amended. Jeffrey L. Kodosky and James J. Truchard have made periodic sales of our stock pursuant to such plans.
The information required by this Item pursuant to Item 403 of Regulation S-K concerning security ownership of certain beneficial owners and management will appear in our Proxy Statement under the section “Security Ownership” and such information is incorporated herein by reference.
The information required by this Item pursuant to Item 201(d) of Regulation S-K concerning securities authorized for issuance under equity compensation plans will appear in our Proxy Statement under the section “Equity Compensation Plans Information” and such information is incorporated herein by reference.
ITEM 13. CERTAIN RELATIONSHIPS AND RELATED TRANSACTIONS AND DIRECTOR INDEPENDENCE During 2002, we irrevocably contributed approximately $3.6 million to the National Instruments Foundation, a 501(c)(3) charitable foundation established in 2002 for the purpose of continued promotion of scientific and engineering research and education at higher education institutions worldwide. Two of the four directors of the National Instruments Foundation are current officers of National Instruments.
In addition, the information required by this Item pursuant to Item 404 of Regulation S-K will appear in our Proxy Statement under the section “Certain Relationships and Related Transactions” and such information is incorporated herein by reference.
The information required by this Item pursuant to Item 407(a) of Regulation S-K regarding the independence of our directors will appear in our Proxy Statement under the section “Corporate Governance” and such information is incorporated herein by reference.
ITEM 14. PRINCIPAL ACCOUNTING FEES AND SERVICES
The information concerning principal accountant fees and services required by this Item is incorporated by reference to our Proxy Statement under the heading “Independent Public Accountants.”
The information concerning pre-approval policies for audit and non-audit services required by this Item is incorporated by reference to our Proxy Statement under the heading “Audit Committee Pre-Approval of Audit and Permissible Non-Audit Services of Independent Auditors.”
PART IV
ITEM 15. EXHIBITS AND FINANCIAL STATEMENT SCHEDULES
(a) Documents FilesFiled with Report
1. Financial Statements.
2. Financial Statement Schedules.
None
3. Exhibits.
ExhibitNumber Description 3.1(2) Certificate of Incorporation, as amended, of the Company. 3.2(11) Amended and Restated Bylaws of the Company. 3.3(4) Certificate of Designation of Rights, Preferences and Privileges of Series A Participating Preferred Stock of the Company. 4.1(1) Specimen of Common Stock certificate of the Company. 4.2(3) Rights Agreement dated as of January 21, 2004, between the Company and EquiServe Trust Company, N.A. 10.1(1) Form of Indemnification Agreement. 10.2(5) 1994 Incentive Plan, as amended.* 10.3(9) 1994 Employee Stock Purchase Plan.* 10.5(7) 2005 Incentive Plan.* 10.6(8) National Instruments Corporation Annual Incentive Program.* 10.7(6) National Instruments Corporation Annual Incentive Program, as amended.* 10.8(10) Form of Restricted Stock Unit Award Agreement (Non-Employee Director).* 10.9(10) Form of Restricted Stock Unit Award Agreement (Performance Vesting).* 10.10(10) Form of Restricted Stock Unit Award Agreement (Current Employee).* 10.11(10) Form of Restricted Stock Unit Award Agreement (Newly Hired Employee).* 21.1 Subsidiaries of the Company. 23.1 Consent of Independent Registered Public Accounting Firm F-4Firm.Consolidated Balance SheetsF-5Consolidated Statements of IncomeF-6Consolidated Statements of Cash FlowsF-7Consolidated Statements of Stockholders' EquityF-8Notes to Consolidated Financial StatementsF-9
2.
Financial Statements Schedules.
See Schedule II - Valuation and Qualifying Accounts at page S-1
3.
Exhibits.
Exhibit
NumberDescription
3.1
(2)
Certificate of Incorporation, as amended, of the Company.
3.2
(2)
Amended and Restated Bylaws of the Company.
3.3
(4)
Certificate of Designation of Rights, Preferences and Privileges of Series A Participating Preferred Stock of the Company.
4.1
(1)
Specimen of Common Stock certificate of the Company.
4.2
(3)
Rights Agreement dated as of January 21, 2004, between the Company and EquiServe Trust Company, N.A.
10.1
(1)
Form of Indemnification Agreement.
10.2
(5)
1994 Incentive Plan, as amended.*
10.3
1994 Employee Stock Purchase Plan.*
10.4
(6)
Long-Term Incentive Program.*
10.5
(7)
2005 Incentive Plan.*
10.6
(8)
National Instruments Corporation Annual Incentive Program.*
10.7
(9)
2006 Annual Incentive Program Goals and Awards for the Named Executive Officers.*
10.8
(10)
Form of Restricted Stock Unit Award Agreement (Non-Employee Director).*
10.9
(10)
Form of Restricted Stock Unit Award Agreement (Performance Vesting).*
10.10
(10)
Form of Restricted Stock Unit Award Agreement (Current Employee).*
10.11
(10)
Form of Restricted Stock Unit Award Agreement (Newly Hired Employee).*
21.1
Subsidiaries of the Company.
23.1
Consent of Independent Registered Public Accounting Firm.
23.2
Consent of Independent Registered Public Accounting Firm.
24.0
Power of Attorney (included on page 33).
31.1
Certification of Chief Executive Officer Pursuant to 18 U.S.C. Section 1350, as Adopted Pursuant to Section 302 of the Sarbanes-Oxley Act of 2002.
31.2
Certification of Chief Financial Officer Pursuant to 18 U.S.C. Section 1350, as Adopted Pursuant to Section 302 of the Sarbanes-Oxley Act of 2002.
32.1
Certification of Chief Executive Officer and Chief Financial Officer Pursuant to 18 U.S.C. Section 1350, as Adopted Pursuant to Section 906 of the Sarbanes-Oxley Act of 2002.
24.0 Power of Attorney (included on page 41). 31.1 Certification of Chief Executive Officer Pursuant to 18 U.S.C. Section 1350, as Adopted Pursuant to Section 302 of the Sarbanes-Oxley Act of 2002. 31.2 Certification of Chief Financial Officer Pursuant to 18 U.S.C. Section 1350, as Adopted Pursuant to Section 302 of the Sarbanes-Oxley Act of 2002. 32.1 Certification of Chief Executive Officer and Chief Financial Officer Pursuant to 18 U.S.C. Section 1350, as Adopted Pursuant to Section 906 of the Sarbanes-Oxley Act of 2002.
(1) Incorporated by reference to the Company's Registration Statement on Form S-1 (Reg. No. 33-88386) declared effective March 13, 1995.
(2) Incorporated by reference to the same-numbered exhibit filed with the Company's Annual Report on Form 10-K for the fiscal year ended December 31, 2003.
(3) Incorporated by reference to exhibit 4.1 filed with the Company's currentCurrent Report on Form 8-K filed on January 28, 2004.
(4) Incorporated by reference to the same-numbered exhibit filed with the Company's Form 8-K on April 27, 2004.
(5) Incorporated by reference to the same-numbered exhibit filed with the Company's Form 10-Q on August 5, 2004.
(6) Incorporated by reference to exhibit 99.2 filed with the Company's Current Report on Form 8-K filed on October 28, 2008. (7) Incorporated by reference to exhibit A of the Company's Proxy Statement dated and filed on April 4, 2005. (8) Incorporated by reference to exhibit 99.2 filed with the Company's Current Report on Form 8-K filed on October 22, 2008. (9) Incorporated by reference to exhibit 10.3 filed with the Company's Annual Report on Form 10-K for the fiscal year ended December 31, 2006. (10) Incorporated by reference to the same-numbered exhibit filed with the Company's Form 10-Q on August 2, 2006. (11) Incorporated by reference to the same-numbered exhibit filed with the Company's Annual Report on Form 10-K for the fiscal year ended December 31, 2004.2007.
(7)Incorporated by reference to exhibit A of the Company's Proxy Statement dated and filed on April 4, 2005.
(8)Incorporated by reference to the exhibit 10.1 filed with the Company's Current Report on Form 8-K filed June 27, 2006.
(9)Incorporated by reference to the exhibit 10.2 filed with the Company's Current Report on Form 8-K filed June 27, 2006.
(10)Incorporated by reference to the same-numbered exhibit filed with the Company's Form 10-Q filed on August 2, 2006.
* Management Contract or Compensatory Plan or Arrangement.
(b) Exhibits
See Item 15(a)(3) above.
(c) Financial Statement Schedules
See Item 15(a)(2) above.
SIGNATURES
Pursuant to the requirements of Section 13 or 15(d) of the Securities Exchange Act of 1934, the registrant has duly caused this report to be signed on its behalf by the undersigned thereunto duly authorized.Registrant Registrant
NATIONAL INSTRUMENTS CORPORATION
February 20, 200717, 2010
BY: By:
/s/ Dr. James J. TruchardDr. James J. Truchard
Chairman of the Board and President
POWER OF ATTORNEY
KNOW ALL PERSONS BY THESE PRESENTS, that each person whose signature appears below constitutes and appoints Dr. James J. Truchard and Alexander M. Davern, jointly and severally, his or her attorneys-in-fact, each with the power of substitution, for him or her in any and all capacities, to sign any amendments to this Report on Form 10-K, and to file the same, with exhibits thereto and other documents in connection therewith, with the Securities and Exchange Commission, hereby ratifying and conformingconfirming all that each of said attorneys-in-fact, or his substitute or substitutes, may do or cause to be done by virtue hereof.
Pursuant to the requirements of the Securities Exchange Act of 1934, this report has been signed below by the following persons on behalf of the registrant and in the capacities and on the dates indicated.Signature
Capacity in Which Signed
Date
/s/ Dr. James J. Truchard
Chairman of the Board and President(Principal Executive Officer) February 17, 2010 Dr. James J. Truchard
Chairman of the Board and
President (Principal Executive Officer)
February 20, 2007
/s/ Alex M. Davern
Chief Financial Officer and Treasurer(Principal Financial and Accounting Officer) February 17, 2010 Alex M. Davern
Chief Financial Officer
and Treasurer (Principal Financial
and Accounting Officer)
February 20, 2007
/s/ Jeffrey L. Kodosky
Director February 17, 2010 Jeffrey L. Kodosky
Director
February 16, 2007
/s/ Dr. Donald M. Carlton
Director February 17, 2010 Dr. Donald M. Carlton
Director
February 16, 2007
/s/ Dr. Ben G. Streetman
Dr. Ben G. Streetman
Director
February 16, 2007
/s/ R. Gary Daniels
R. Gary Daniels
Director
February 16, 2007
/s/ Charles J. Roesslein
Director February 17, 2010 Charles J. Roesslein
Director
February 16, 2007
/s/ Duy-Loan T. Le
Director February 17, 2010 Duy-Loan T. Le
/s/ John Medica Director
February 16, 200717, 2010 John Medica
NATIONAL INSTRUMENTS CORPORATION
INDEX TO FINANCIAL STATEMENTS
Page No. Financial Statements: Page No.Report of Independent Registered Public Accounting FirmF-2Report of Independent Registered Public Accounting Firm on Internal Control over Financial Reporting F-3F-2 Report of Independent Registered Public Accounting Firm F-4F-3 Consolidated Balance Sheets as of December 31, 20062009 and 20052008 F-5F-4 Consolidated Statements of Income for each of the Three Years in the period Ended December 31, 20062009 F-6F-5 Consolidated Statements of Cash Flows for each of the Three Years in the period Ended December 31, 20062009 F-7F-6 Consolidated Statements of Stockholders' Equity for each of the Three Years in the period Ended December 31, 20062009 F-8F-7 Notes to Consolidated Financial Statements F-9F-8
Financial Statement Schedules:For each of the Three Years in the period Ended December 31, 2006 Schedule II--Valuation and Qualifying AccountsS-1
All other schedules are omitted because they are not applicable.
The Board of Directors and Shareholders of National Instruments Corporation:
We have audited the accompanying consolidated balance sheets of National Instruments Corporation and subsidiaries as of December 31, 20062009 and 20052008, and the related consolidated statements of income, stockholders’stockholders' equity, and cash flows for each of the twothree fiscal years in the period ended December 31, 2006. Our audits also included the financial statement schedule listed in the Index at Item 15.2009. These financial statements and schedule are the responsibility of the Company’sCompany's management. Our responsibility is to express an opinion on these financial statements and schedule based on our audits.
We conducted our audits in accordance with the standards of the Public Company Accounting Oversight Board (United States). Those standards require that we plan and perform the audit to obtain reasonable assurance about whether the financial statements are free of material misstatement. An audit includes examining, on a test basis, evidence supporting the amounts and disclosures in the financial statements. An audit also includes assessing the accounting principles used and significant estimates made by management, as well as evaluating the overall financial statement presentation. We believe that our audits provide a reasonable basis for our opinion.
In our opinion, the financial statements referred to above present fairly, in all material respects, the consolidated financial position of National Instruments Corporation and subsidiaries at December 31, 20062009 and 20052008, and the consolidated results of their operations and their cash flows for each of the twothree fiscal years in the period ended December 31, 2006,2009, in conformity with U.S. generally accepted accounting principles. Also, in our opinion, the related financial statement schedule, when considered in relation to the basic financial statements taken as a whole, presents fairly in all material respects the information set forth therein.As discussed in Note 1 to the consolidated financial statements, effective January 1, 2006, the Company changed its method of accounting for stock-based compensation to conform to Statement of Financial Accounting Standards No. 123(R), Share-Based Payment.
We also have audited, in accordance with the standards of the Public Company Accounting Oversight Board (United States), the effectiveness of National Instruments Corporation’sCorporation internal control over financial reporting as of December 31, 2006,2009, based on criteria established in Internal Control-Integrated Framework issued by the Committee of Sponsoring Organizations of the Treadway Commission and our report dated February 15, 200717, 2010 expressed an unqualified opinion thereon./s/ Ernst & Young LLP
Austin, Texas
February 15, 2007
/s/ Ernst & Young LLP
Austin, TexasFebruary 17, 2010
Report of Independent Registered Public Accounting Firm on Internal Control over Financial Reporting
The Board of Directors and Shareholders of National Instruments Corporation:
We have audited management’s assessment, included in the Management’s Report on Internal Control over Financial Reporting, that National Instruments Corporation maintained effectiveCorporation’s internal control over financial reporting as of December 31, 2006,2009, based on criteria established in Internal Control—Integrated Framework issued by the Committee of Sponsoring Organizations of the Treadway Commission (the COSO criteria). National Instruments Corporation’s management is responsible for maintaining effective internal control over financial reporting, and for its assessment of the effectiveness of internal control over financial reporting.reporting included in the accompanying Management Report on Internal Control over Financial Reporting. Our responsibility is to express an opinion on management’s assessment and an opinion on the effectiveness of the company’s internal control over financial reporting based on our audit.
We conducted our audit in accordance with the standards of the Public Company Accounting Oversight Board (United States). Those standards require that we plan and perform the audit to obtain reasonable assurance about whether effective internal control over financial reporting was maintained in all material respects. Our audit included obtaining an understanding of internal control over financial reporting, evaluating management’s assessment,assessing the risk that a material weakness exists, testing and evaluating the design and operating effectiveness of internal control based on the assessed risk, and performing such other procedures as we considered necessary in the circumstances. We believe that our audit provides a reasonable basis for our opinion.
A company’s internal control over financial reporting is a process designed to provide reasonable assurance regarding the reliability of financial reporting and the preparation of financial statements for external purposes in accordance with generally accepted accounting principles. A company’s internal control over financial reporting includes those policies and procedures that (1) pertain to the maintenance of records that, in reasonable detail, accurately and fairly reflect the transactions and dispositions of the assets of the company; (2) provide reasonable assurance that transactions are recorded as necessary to permit preparation of financial statements in accordance with generally accepted accounting principles, and that receipts and expenditures of the company are being made only in accordance with authorizations of management and directors of the company; and (3) provide reasonable assurance regarding prevention or timely detection of unauthorized acquisition, use or disposition of the company’s assets that could have a material effect on the financial statements.
Because of its inherent limitations, internal control over financial reporting may not prevent or detect misstatements. Also, projections of any evaluation of effectiveness to future periods are subject to the risk that controls may become inadequate because of changes in conditions, or that the degree of compliance with the policies or procedures may deteriorate.
In our opinion, management’s assessment that National Instruments Corporation maintained effective internal control over financial reporting as of December 31, 2006, is fairly stated, in all material respects, based on the COSO criteria. Also, in our opinion, National Instruments Corporation maintained, in all material respects, effective internal control over financial reporting as of December 31, 2006,2009, based on the COSO criteria.
We also have audited, in accordance with the standards of the Public Company Accounting Oversight Board (United States), the consolidated balance sheets of National Instruments Corporation as of December 31, 20062009 and 2005,2008, and the related consolidated statements of income, stockholders’ equity, and cash flows for each of the twothree years in the period ended December 31, 2006 of National Instruments Corporation2009 and our report dated February 15, 200717, 2010 expressed an unqualified opinion thereon./s/ Ernst & Young LLP
Austin, Texas
February 15, 2007
/s/ Ernst & Young LLP
Austin, TexasFebruary 17, 2010
Report of Independent Registered Public Accounting Firm
To the Board of Directors and Stockholders of National Instruments Corporation:
In our opinion, the consolidated statements of income, of stockholders’ equity and of cash flows (appearing on pages F-6 through F-8 of this National Instruments Corporation 2006 Annual Report on Form 10-K) for the year ended December 31, 2004 present fairly, in all material respects, the results of operations and cash flows of National Instruments Corporation and its subsidiaries for the year ended December 31, 2004, in conformity with accounting principles generally accepted in the United States of America. In addition, in our opinion, the financial statement schedule for the year ended December 31, 2004 presents fairly, in all material respects, the information set forth therein when read in conjunction with the related consolidated financial statements. These financial statements and financial statement schedule are the responsibility of the Company’s management. Our responsibility is to express an opinion on these financial statements and financial statement schedule based on our audit. We conducted our audit of these statements in accordance with the standards of the Public Company Accounting Oversight Board (United States). Those standards require that we plan and perform the audit to obtain reasonable assurance about whether the financial statements are free of material misstatement. An audit includes examining, on a test basis, evidence supporting the amounts and disclosures in the financial statements, assessing the accounting principles used and significant estimates made by management, and evaluating the overall financial statement presentation. We believe that our audit provides a reasonable basis for our opinion.
/s/ PricewaterhouseCoopers LLP
Austin, Texas
March 4, 2005
NATIONAL INSTRUMENTS CORPORATION
(in thousands, except share data)December 31,
2006
2005
Assets
Current assets: Cash and cash equivalents $ 100,287 $ 55,864 Short-term investments 150,190 119,846 Accounts receivable, net 117,235 95,733 Inventories, net 77,138 62,827 Prepaid expenses and other current assets 11,393 13,146 Deferred income taxes, net 20,851 14,890
Total current assets 477,094 362,306 Property and equipment, net 145,425 144,330 Goodwill, net 53,343 52,533 Intangible assets, net 40,065 43,602 Other long-term assets 5,293 5,565
Total assets $ 721,220 $ 608,336
Liabilities and Stockholders' Equity
Current liabilities: Accounts payable $ 32,001 $ 30,832 Accrued compensation 20,912 18,084 Deferred revenue 22,208 16,018 Accrued expenses and other liabilities 15,934 8,838 Other taxes payable 11,527 13,848
Total current liabilities 102,582 87,620 Deferred income taxes 21,956 16,866
Total liabilities 124,538 104,486
Commitments and contingencies Stockholders' equity: Preferred stock: par value $0.01; 5,000,000 shares authorized; none issued and outstanding — — Common stock: par value $0.01; 180,000,000 shares authorized; 79,883,837 and 79,276,086 shares issued and outstanding, respectively 799 793 Additional paid-in capital 109,851 91,430 Deferred stock-based compensation — (16,547 ) Retained earnings 483,533 429,859 Accumulated other comprehensive income (loss) 2,499 (1,685 )
Total stockholders' equity 596,682 503,850
Total liabilities and stockholders' equity $ 721,220 $ 608,336
December 31, 2009 2008 Assets Current assets: Cash and cash equivalents $ 201,465 $ 229,400 Short-term investments 87,196 6,220 Accounts receivable, net 103,957 121,548 Inventories, net 86,515 107,358 Prepaid expenses and other current assets 36,523 43,062 Deferred income taxes, net 16,522 21,435 Total current assets 532,178 529,023 Long-term investments — 10,500 Property and equipment, net 153,265 154,477 Goodwill, net 64,779 64,561 Intangible assets, net 43,390 41,915 Other long-term assets 19,417 32,115 Total assets $ 813,029 $ 832,591 Liabilities and Stockholders’ Equity Current liabilities: Accounts payable $ 23,502 $ 30,876 Accrued compensation 14,934 22,012 Deferred revenue 57,242 45,514 Accrued expenses and other liabilities 8,560 18,848 Other taxes payable 14,181 13,481 Total current liabilities 118,419 130,731 Deferred income taxes 25,012 25,157 Liability for uncertain tax positions 11,062 9,364 Other long-term liabilities 4,116 2,901 Total liabilities 158,609 168,153 Commitments and contingencies Stockholders’ equity: Preferred stock: par value $0.01; 5,000,000 shares authorized; none issued and outstanding — — Common stock: par value $0.01; 180,000,000 shares authorized;77,367,874 and 77,193,063 shares issued and outstanding, respectively 774 772 Additional paid-in capital 336,446 300,352 Retained earnings 303,655 352,831 Accumulated other comprehensive income 13,545 10,483 Total stockholders’ equity 654,420 664,438 Total liabilities and stockholders’ equity $ 813,029 $ 832,591
The accompanying notes are an integral part of these financial statements.
NATIONAL INSTRUMENTS CORPORATION
(in thousands, except per share data)For the Years Ended December 31,
2006
2005
2004
Net sales $ 660,407 $ 571,841 $ 514,088 Cost of sales (1) 170,326 149,309 135,473
Gross profit 490,081 422,532 378,615
Operating expenses: Sales and marketing (2) 235,072 211,280 188,727 Research and development (3) 113,095 87,841 84,692 General and administrative (4) 54,192 45,199 42,500
Total operating expenses 402,359 344,320 315,919
Operating income 87,722 78,212 62,696
Other income (expense): Interest income 6,847 3,758 2,905 Net foreign exchange gain (loss) 740 (1,566 ) 1,287 Other income (expense), net (7 ) 276 (2,075 )
Income before income taxes 95,302 80,680 64,813 Provision for income taxes (5) 22,594 19,163 16,203
Net income $ 72,708 $ 61,517 $ 48,610
Basic earnings per share $ 0.91 $ 0.78 $ 0.62
Weighted average shares outstanding - basic 79,519 78,552 78,680
Diluted earnings per share $ 0.89 $ 0.76 $ 0.59
Weighted average shares outstanding - diluted 81,519 80,910 82,096
Dividends declared per share $ 0.24 $ 0.20 $ 0.18
The following footnotes apply to the years ended December 31, 2006, 2005 and 2004:
(1)including $598, $101 and $0, respectively, of non-cash stock compensation.(2)including $6,008, $500 and $0, respectively, of non-cash stock compensation.(3)including $5,201, $598 and $0, respectively, of non-cash stock compensation.(4)including $2,333, $345 and $0, respectively, of non-cash stock compensation.(5)including $2,403, $364 and $0, respectively, of benefit from non-cash stock compensation.
For the YearsEnded December 31, 2009 2008 2007 Net sales: Product $ 623,736 $ 765,441 $ 701,589 Software maintenance 52,858 55,096 38,789 Total net sales 676,594 820,537 740,378 Cost of sales: Product 164,700 201,064 180,556 Software maintenance 5,184 6,045 4,711 Total cost of sales 169,884 207,109 185,267 Gross profit 506,710 613,428 555,111 Operating expenses: Sales and marketing 269,267 307,409 264,060 Research and development 132,974 143,140 126,515 General and administrative 57,938 67,162 62,445 Total operating expenses 460,179 517,711 453,020 Operating income 46,531 95,717 102,091 Other income (expense): Interest income 1,629 5,996 9,822 Net foreign exchange gain (loss) 734 (3,737 ) 1,672 Other income (expense), net 1,351 161 (158 ) Income before income taxes 50,245 98,137 113,427 Provision for income taxes 33,160 13,310 6,394 Net income $ 17,085 $ 84,827 $ 107,033 Basic earnings per share $ 0.22 $ 1.08 $ 1.35 Weighted average shares outstanding - basic 77,520 78,567 79,468 Diluted earnings per share $ 0.22 $ 1.07 $ 1.32 Weighted average shares outstanding – diluted �� 78,026 79,515 81,043 Dividends declared per share $ 0.48 $ 0.44 $ 0.34
The accompanying notes are an integral part of these financial statements.
NATIONAL INSTRUMENTS CORPORATION
(in thousands)For the Years Ended December 31,
2006
2005
2004
Cash flow from operating activities: Net income $ 72,708 $ 61,517 $ 48,610 Adjustments to reconcile net income to net cash provided by operating activities: Depreciation and amortization 34,181 28,553 25,592 Stock-based compensation 14,507 1,545 — Impairment of cost method investment — — 2,500 Gain on sale of subsidiary — — (242 ) Provision for (benefit from) deferred income taxes (339 ) 3,219 (825 ) Tax benefit from stock option plans (4,271 ) 675 3,071 Changes in operating assets and liabilities: Accounts receivable (21,502 ) (4,080 ) (9,342 ) Inventories (14,311 ) (4,572 ) (15,230 ) Prepaid expenses and other assets 2,116 (2,177 ) 4,624 Accounts payable 1,169 4,647 (4,359 ) Deferred revenue 6,190 3,847 3,385 Taxes and other liabilities 7,443 (5,124 ) 7,848
Net cash provided by operating activities 97,891 88,050 65,632
Cash flow from investing activities: Proceeds from sale of subsidiary — — 680 Acquisitions, net of cash received — (63,891 ) — Capital expenditures (18,503 ) (15,383 ) (12,596 ) Capitalization of internally developed software (7,370 ) (13,380 ) (5,007 ) Additions to other intangibles (3,115 ) (4,288 ) (3,050 ) Purchases of short-term investments (244,238 ) (124,227 ) (125,954 ) Sales and maturities of short-term investments 213,894 154,773 116,789
Net cash used in investing activities (59,332 ) (66,396 ) (29,138 )
Cash flow from financing activities: Proceeds from issuance of common stock 37,146 23,222 16,826 Repurchase of common stock (16,519 ) (49,452 ) (16,064 ) Dividends paid (19,034 ) (15,776 ) (14,486 ) Tax benefit from stock option plans 4,271 — —
Net cash provided by (used in) financing activities 5,864 (42,006 ) (13,724 )
Net change in cash and cash equivalents 44,423 (20,352 ) 22,770 Cash and cash equivalents at beginning of period 55,864 76,216 53,446
Cash and cash equivalents at end of period $ 100,287 $ 55,864 $ 76,216
Cash paid for interest and income taxes Interest $ 41 $ 17 $ 31 Income taxes $ 9,827 $ 15,117 $ 10,622
For the Years Ended December 31, 2009 2008 2007 Cash flow from operating activities: Net income $ 17,085 $ 84,827 $ 107,033 Adjustments to reconcile net income to net cash provided by operating activities: Depreciation and amortization 38,365 37,103 36,605 Stock-based compensation 20,299 19,854 17,754 Tax expense/(benefit from) deferred income taxes 17,196 (4,475 ) (16,954 ) Tax expense/(benefit from) stock option plans 1,450 (1,213 ) (2,964 ) Changes in operating assets and liabilities: Accounts receivable 17,591 12,159 (14,047 ) Inventories 20,843 (24,578 ) (5,537 ) Prepaid expenses and other assets 12,740 (10,340 ) (12,330 ) Accounts payable (7,374 ) (5,648 ) 4,186 Deferred revenue 11,728 9,423 13,883 Taxes and other liabilities (14,272 ) 4,706 19,743 Net cash provided by operating activities 135,651 121,818 147,372 Cash flow from investing activities: Acquisitions, net of cash received — (17,310 ) — Capital expenditures (20,847 ) (25,771 ) (24,864 ) Capitalization of internally developed software (12,583 ) (9,487 ) (8,263 ) Additions to other intangibles (4,602 ) (3,010 ) (6,447 ) Purchases of short-term investments (93,087 ) (9,061 ) (87,586 ) Sales and maturities of short-term investments 19,204 86,179 143,938 Purchases of foreign currency option contracts — (2,784 ) (2,242 ) Net cash provided by (used in) investing activities (111,915 ) 18,756 14,536 Cash flow from financing activities: Proceeds from issuance of common stock 21,672 31,150 36,460 Repurchase of common stock (34,585 ) (103,641 ) (79,728 ) Dividends paid (37,308 ) (34,735 ) (27,052 ) Tax (expense)/benefit from stock option plans (1,450 ) 1,213 2,964 Net cash (used in) financing activities (51,671 ) (106,013 ) (67,356 ) Net change in cash and cash equivalents (27,935 ) 34,561 94,552 Cash and cash equivalents at beginning of period 229,400 194,839 100,287 Cash and cash equivalents at end of period $ 201,465 $ 229,400 $ 194,839 Cash paid for interest and income taxes: Interest $ 23 $ 116 $ 159 Income taxes $ 14,608 $ 17,214 $ 21,147
The accompanying notes are an integral part of these financial statements.
NATIONAL INSTRUMENTS CORPORATION
(in thousands, except share data)Common
Stock
Shares
Common
Stock
Amount
Additional
Paid-In
Capital
Deferred
Compensation
Retained
Earnings
Accumulated
Other
Comprehensive
Income/(Loss)
Total
Stockholders'
Equity
Balance at December 31, 2003 78,269,235 $ 783 $ 95,070 $ — $ 349,994 $ (6,395 ) $ 439,452 Net income 48,610 48,610 Foreign currency translation adjustment (net of $1,013 tax expense) 3,050 3,050 Unrealized loss on securities available for sale (net of $0 tax benefit) (417 ) (417 ) Unrealized gain on derivative instruments (net of $2,136 tax expense) 6,407 6,407
Total comprehensive income 57,650
Issuance of common stock under employee plans, including tax benefits 1,234,195 12 19,885 19,897 Repurchase and retirement of common stock (557,850 ) (6 ) (16,058 ) (16,064 ) Dividends declared (14,486 ) (14,486 )
Balance at December 31, 2004 78,945,580 $ 789 $ 98,897 $ — $ 384,118 $ 2,645 $ 486,449 Net income 61,517 61,517 Foreign currency translation adjustment(net of $1,636 tax benefit) (5,181 ) (5,181 ) Unrealized gain on securities available for sale (net of $0 tax expense) 50 50 Unrealized gain on derivative instruments (net of $253 tax expense) 801 801
Total comprehensive income 57,187
Net activity related to restricted stock units 813,305 8 18,084 (16,547 ) 1,545 Issuance of common stock under employee plans, including tax benefits 1,573,547 16 23,206 23,222 Repurchase and retirement of common stock (2,056,346 ) (20 ) (49,432 ) (49,452 ) Dividends declared (15,776 ) (15,776 ) Disqualified dispositions 675 675
Balance at December 31, 2005 79,276,086 $ 793 $ 91,430 ($ 16,547 ) $ 429,859 ($ 1,685 ) $ 503,850 Net income 72,708 72,708 Foreign currency translation adjustment (net of $1,434 tax expense) 4,542 4,542 Unrealized gain on securities available for sale (net of $0 tax expense) 78 78 Unrealized loss on derivative instruments (net of $138 tax benefit) (436 ) (436 )
Total comprehensive income 76,892
Issuance of common stock under employee plans, including tax benefits 1,915,172 19 37,127 37,146 Stock-based compensation under
restricted stock plan 113,794 1 5,082 5,083 Stock-based compensation under stock
option and employee stock purchase plans 9,424 9,424 Repurchase and retirement of common stock (607,910 ) (6 ) (16,513 ) (16,519 ) Effect of adoption of SFAS 123R (813,305 ) (8 ) (16,539 ) 16,547 — Dividends declared (19,034 ) (19,034 ) Disqualified dispositions (160 ) (160 )
Balance at December 31, 2006 $ 79,883,837 $ 799 $ 109,851 $ — $ 483,533 $ 2,499 $ 596,682
CommonStockShares CommonStockAmount AdditionalPaid-InCapital DeferredCompensation RetainedEarnings AccumulatedOtherComprehensiveIncome/(Loss) TotalStockholders’Equity Balance at December 31, 2006 79,883,837 $ 799 $ 207,808 $ — $ 385,480 $ 2,499 $ 596,586 Net income 107,033 107,033 Foreign currency translation adjustment(net of $286 tax expense) 4,483 4,483 Unrealized gain on securities available-for-sale(net of $13 tax expense) 200 200 Unrealized loss on derivative instruments(net of $7 tax benefit) (117 ) (117 ) Total comprehensive income 111,599 Issuance of common stock under employee plans, including tax benefits 2,251,657 22 36,438 36,460 Stock-based compensation 17,754 17,754 Repurchase and retirement of common stock (2,730,135 ) (27 ) (7,102 ) (72,599 ) (79,728 ) Dividends paid (27,052 ) (27,052 ) Disqualified dispositions 5,467 5,467 Balance at December 31, 2007 79,405,359 $ 794 $ 260,365 $ — $ 392,862 $ 7,065 $ 661,086 Net income 84,827 84,827 Foreign currency translation adjustment(net of $681 tax benefit) (4,188 ) (4,188 ) Unrealized loss on securities available-for-sale(net of $82 tax benefit) (502 ) (502 ) Unrealized gain on derivative instruments(net of $1,320 tax expense) 8,108 8,108 Total comprehensive income 88,245 Issuance of common stock under employee plans, including tax benefits 1,897,746 19 31,131 31,150 Stock-based compensation 19,854 19,854 Repurchase and retirement of common stock (4,110,042 ) (41 ) (13,477 ) (90,123 ) (103,641 ) Dividends paid (34,735 ) (34,735 ) Disqualified dispositions 2,479 2,479 Balance at December 31, 2008 77,193,063 $ 772 $ 300,352 $ — $ 352,831 $ 10,483 $ 664,438 Net income 17,085 17,085 Foreign currency translation adjustment(net of $1,799 tax expense) 927 927 Unrealized gain on securities available-for-sale(net of $1,093 tax expense) 563 563 Unrealized gain on derivative instruments(net of $3,053 tax expense) 1,572 1,572 Total comprehensive income 20,147 Issuance of common stock under employee plans, including tax benefits 1,618,252 16 21,656 21,672 Stock-based compensation 20,574 20,574 Repurchase and retirement of common stock (1,443,441 ) (14 ) (5,618 ) (28,953 ) (34,585 ) Dividends paid (37,308 ) (37,308 ) Disqualified dispositions (518 ) (518 ) Balance at December 31, 2009 77,367,874 $ 774 $ 336,446 $ — $ 303,655 $ 13,545 $ 654,420
The accompanying notes are an integral part of these financial statements.
NATIONAL INSTRUMENTS CORPORATION
Note 1:1 – Operations and summary of significant accounting policies
National Instruments Corporation is a Delaware corporation. We engage in the design, development, manufacture and marketing of instrumentationprovide flexible application software and specialty computer plug-in cards and accessoriesmodular, multifunction hardware that users combine with industry standardindustry-standard computers, networks and the Internetthird party devices to create measurement, automation and automation systems.embedded systems, which we also refer to as “virtual instruments.” Our approach gives customers the ability to quickly and cost-effectively design, prototype and deploy unique custom-defined solutions for their design, control and test application needs. We offer hundreds of products used to create virtual instrumentation systems for general, commercial, industrial and scientific applications. Our products may be used in different environments, and consequently, specific application of our products is determined by the customer and generally is not known to us. We approach all markets with essentially the same products, which are used in a variety of applications from research and development to production testing, monitoring and industrial control. The following industries and applications are served by us worldwide: advanced research, automotive, commercial aerospace, computers and electronics, continuous process manufacturing, education, government/defense, medical research/pharmaceutical, power/energy, semiconductors, automated test equipment, telecommunications and others. TheThese financial statements have been prepared in accordance with accounting principles generally accepted in the United States of America.
Principles of consolidation
The consolidated financial statementsConsolidated Financial Statements include the accounts of National Instruments Corporation and its subsidiaries. All significant intercompany accounts and transactions have been eliminated.
We have historically recorded the excess of the purchase price over the par or stated value of retired shares of our common stock as a reduction of additional paid-in capital. We completed our review of this accounting policy under FASB ASC 505, Equity (FASB ASC 505). Based on this review, we have reclassified a portion of the excess of the purchase price over the par or stated value of retired shares of our common stock from a reduction of additional paid-in capital to a reduction of retained earnings. This reclassification did not have any impact on previously reported statements of income, earning per share amounts, statements of cash flows or total stockholders’ equity. Certain prior year amounts from our Consolidated Statements of Stockholders’ Equity have been reclassified to conform to the 2009 presentation as shown in the following table:
APIC RE 2006 Beginning Balance 12/31/06 balance as previously reported $ 109,851 $ 483,437 Cumulative reclassification of share repurchase 97,957 (97,957 ) 12/31/06 balance as reported in current Form 10-K $ 207,808 $ 385,480 2007 Activity Repurchase and retirement of common stock as previously reported $ (79,701 ) $ — Reclassification of 2007 activity 72,599 (72,599 ) Repurchase and retirement of common stock as reported in current Form 10-K $ (7,102 ) $ (72,599 ) 2007 Ending Balance 12/31/07 balance as previously reported $ 89,809 $ 563,418 Cumulative reclassification of share repurchase 170,556 (170,556 ) 12/31/07 balance as reported in current Form 10-K $ 260,365 $ 392,862 2008 Activity Repurchase and retirement of common stock as previously reported $ (103,600 ) $ — Reclassification of 2008 activity 90,123 (90,123 ) Repurchase and retirement of common stock as reported in current Form 10-K $ (13,477 ) $ (90,123 ) 2008 Ending Balance 12/31/08 balance as previously reported $ 39,673 $ 613,510 Cumulative reclassification of share repurchase 260,679 (260,679 ) 12/31/08 balance as reported in current Form 10-K $ 300,352 $ 352,831
Going forward, we will account for the retired shares of our common stock by recording the excess of the purchase price over par value as a reduction of retained earnings, to the extent that the excess of the purchase price over par value exceeds the original proceeds received from the issuance of the same shares of our common stock, as prescribed by FASB ASC 505.
Use of estimates Judgments and estimates are required in the
The preparation of our financial statements to conformin conformity with U.S. generally accepted accounting principles. Theprinciples requires us to make estimates and underlying assumptions that affect the reported amounts of assets, liabilities, revenues, expenses and liabilities,related disclosures of contingent assets and liabilities. We base our estimates on past experience and other assumptions that we believe are reasonable under the disclosurecircumstances, and we evaluate these estimates on an ongoing basis. Our critical accounting policies are those that affect our financial statements materially and involve difficult, subjective or complex judgments by management. Although these estimates are based on management's best knowledge of contingencies atcurrent events and actions that may impact the balance sheet date andcompany in the reported revenues and expenses forfuture, actual results may be materially different from the period. Actual results could differ from those estimates.
Cash and cash equivalents
Cash and cash equivalents include cash and highly liquid investments with maturities of three months or less at the date of acquisition. Short-term
Short-Term Investments
We maintain an investment portfolio of various types of security holdings and maturities. Pursuant to FASB ASC 820, cash equivalents and short-term investments Short-term available-for-sale are valued using the market approach (Level 1) based on unadjusted quoted prices in active markets for identical assets at the measurement date. Our short-term investments also include auction rate securities that we originally purchased for $8.6 million. These auction rate securities consist of corporate, state and municipaleducation loan revenue bonds. Auction rate securities with readily determinableare variable rate debt instruments whose interest rates are typically reset approximately every 7 to 35 days. In November 2008, we accepted the UBS Auction Rate Securities Rights (“the Rights”) agreement offered by UBS as a liquidity alternative to the failed auction process. The Rights agreement is a nontransferable right to sell our auction rate securities, at par value, back to UBS at any time during the period June 30, 2010, through July 2, 2012. The estimated fair market valuesvalue of both the auction rate securities and maturitiesthe Rights agreement was determined using significant unobservable inputs (Level 3) as prescribed by FASB ASC 820.
We account for our investments in excessdebt and equity instruments under FASB ASC 320. Our investments are classified as available-for-sale and accordingly are reported at fair value, with unrealized gains and losses reported as other comprehensive income, a component of three months at the date of acquisition.stockholders’ equity. Unrealized losses are charged against income when a decline in fair value is determined to be other than temporary. Investments with maturities beyond one year are classified as short-term based on their highly liquid nature and because such marketable securities represent the investment of cash that is available for current operations. Our investments are classified as available-for-sale and accordingly are reported atThe fair value of our short-term investments in debt securities at December 31, 2009 and December 31, 2008 was $87 million and $6 million, respectively. The increase was due to the net purchase of $74 million of short-term investments and the transfer of $8.6 related to our auction rate securities and our rights agreement from long-term investments to short-term investments during the year ended December 31, 2009. The net purchase of $74 million of short term investments was done to diversify our holdings from money market accounts to debt securities and to take advantage of higher yields associated with longer maturity debt securities. We follow the guidance provided by FASB ASC 320 to assess whether our investments with unrealized loss positions are other than temporarily impaired. Realized gains and losses reported as other comprehensive income. Unrealized losses are charged against income when a declineand declines in fair value is determinedjudged to be other than temporary. Thetemporary are determined based on the specific identification method and are reported in other income (expense), net, in our Consolidated Statements of Income.
Accounts Receivable, net
Accounts receivable are recorded net of allowance for sales returns of $1.9 million and $1.8 million at December 31, 2009 and 2008, respectively, and net of allowances for doubtful accounts of $2.7 million and $3.9 million at December 31, 2009 and 2008, respectively. A provision for estimated sales returns is used to determinemade by reducing recorded revenue based on historical experience. We analyze historical returns, current economic trends and changes in customer demand and acceptance of our products when evaluating the costadequacy of securities sold.our sales returns allowance. Our allowance for doubtful accounts is based on historical experience. We analyze historical bad debts, customer concentrations, customer creditworthiness and current economic trends when evaluating the adequacy of our allowance for doubtful accounts.
Year Description Balance atBeginningof Period Provisions Write-Offs Balance atEnd ofPeriod 2007 Allowance for doubtful accounts and sales returns $ 4,360 $ 1,940 $ 698 $ 5,602 2008 Allowance for doubtful accounts and sales returns 5,602 447 367 5,682 2009 Allowance for doubtful accounts and sales returns 5,682 337 1,400 4,619
Inventories
Inventories are stated at the lower-of-cost or market. Cost is determined using standard costs, which approximate the first-in first-out (FIFO)(“FIFO”) method. Cost includes the acquisition cost of purchased components, parts and subassemblies, in-bound freight costs, labor and overhead. Market is replacement cost with respect to raw materials and is net realizable value with respect to work in process and finished goods.
Inventory is shown net of adjustment for excess and obsolete inventories of $5.2$4.4 million and $6.0$4.4 million at December 31, 20062009 and 2005,2008, respectively.
Long-Term Investments
At December 31, 2008, our long-term investments primarily consisted of auction rate securities that we originally purchased for $8.6 million as well as our Rights agreement with UBS. At December 31, 2008, we classified these investments as long-term due to the fact that the market for these securities was inactive, the underlying securities generally had contractual maturities that were in excess of the guidelines provided for in our investment policy, the fact that we had the ability to hold the debt instruments to their ultimate maturity and the fact that we had not made a determination as to whether we would exercise our rights under the Rights agreement. The auction rate securities were classified as available-for-sale. At December 31, 2008, we reported our auction rate securities at their estimated fair market value of $7.0 million and our Rights agreement at its estimated fair market value of $1.6 million. The estimated fair market value of both the auction rate securities and the Rights agreement was determined using significant unobservable inputs (Level 3) as prescribed by FASB ASC 820. These auction rate securities and the Rights agreement are now reported as a component of short-term investments as discussed above.
Property and equipment
Property and equipment are recorded at cost. Depreciation is computed using the straight-line method over the estimated useful lives of the assets, which range from twenty to forty years for buildings, three to seven years for purchased internal use software and for equipment which are each included in furniture and equipment. Leasehold improvements are depreciated over the shorter of the life of the lease or the asset.
Intangible assets
We capitalize costs related to the development and acquisition of certain software products. In accordance with Statement of Financial Accounting Standards (“SFAS”) 86,Accounting for the Costs of Computer Software to Be Sold, Leased or Otherwise Marketed,FASB ASC 985, capitalization of costs begins when technological feasibility has been established and ends when the product is available for general release to customers. Technological feasibility for our products is established when the product is available for beta release. Amortization is computed on an individual product basis for those products available for market and is recognized based on the product’s estimated economic life, generally three years. Patents are amortized using the straight-line method over their estimated period of benefit, generally ten to seventeen years. At each balance sheet date, the unamortized costs for all intangible assets are reviewed by management and reduced to net realizable value when necessary.
Goodwill
GoodwillThe excess purchase price over the fair value of assets acquired is recorded as goodwill. As we have one operating segment, we allocate goodwill to one reporting unit for goodwill impairment testing. In accordance with SFAS 142,FASB ASC 350, Intangibles – Goodwill and Other Intangible Assets, (FASB ASC 350), goodwill is tested for impairment on an annual basis, and between annual tests if indicators of potential impairment exist, using a fair-value-based approach.approach based on the market capitalization of the reporting unit. Our annual impairment test was performed on April 6, 2006.as of February 28, 2009. No impairment of goodwill was identified.has been identified during the period presented. Goodwill is deductible for tax purposes in certain jurisdictions.
Concentrations of credit risk Financial
We maintain cash and cash equivalents with various financial institutions located in many countries throughout the world. At December 31, 2009, $85 million or 42% of our cash and cash equivalents was held in cash in various operating accounts with financial institutions throughout the world and $116 million or 58% was held in money market accounts. The most significant of our operating accounts was our domestic operating account which held approximately $22 million or 11% of our total cash and cash equivalents at a bank that carried an A1 rating at December 31, 2009. From a geographic standpoint, approximately $78 million or 39% was held in various domestic accounts with financial institutions and $123 million or 61% was held in various accounts outside of the U. S. with financial institutions. At December 31, 2009, our short-term investments consist of $35 million or 40% of foreign government bonds, $21 million or 24% of U.S. treasuries and agencies, $12 million or 14% of municipal bonds, $9 million or 10% of auction rate securities and our auction rate securities put option, $8 million or 9% of corporate bonds and $3 million or 3% in time deposits.
The goal of our investment policy is to manage our investment portfolio to preserve principal and liquidity while maximizing the return on our investment portfolio through the full investment of available funds. We place our cash investments in instruments that potentially subject us to concentrationsmeet credit quality standards, as specified in our corporate investment policy guidelines. These guidelines also limit the amount of credit risk consist principallyexposure to any one issue, issuer or type of instrument. With the exception of our auction rate security from the Vermont Student Assistance Corporation, at December 31, 2009, our cash equivalents and short-term investments carried ratings from the major credit rating agencies that were in accordance with our corporate investment policy. Our investment policy allows investments in the following; government and federal agency obligations, repurchase agreements (“Repos”), certificates of deposit and time deposits, corporate obligations, medium term notes and deposit notes, commercial paper including asset-backed commercial paper (“ABCP”), puttable bonds, general obligation and revenue bonds, money market funds, taxable commercial paper, corporate notes/bonds, municipal notes, municipal obligations, variable rate demand notes and tax exempt commercial paper. All such instruments must carry minimum ratings of A1/P1/F1, MIG1/VMIG1/SP1 and A2/A/A, as applicable, all of which are considered “investment grade”. Our investment policy for marketable securities requires that all securities mature in three years or less, with a weighted average maturity of no longer than 18 months with at least 10% maturing in 90 days or less. We actively monitor our investment portfolio to ensure compliance with our investment objective to preserve capital, meet liquidity requirements and maximize return on our investments. We do not require collateral or enter into master netting arrangements to mitigate our credit risk. (See Note 2 – Cash, cash equivalents, short-term and long-term investments in Notes to Consolidated Financial Statements for further discussion and analysis of our investments.).
At December 31, 2009, we held foreign currency forward and option contracts cashwith an aggregate notional amount of $148.4 million with various counterparties and cash equivalents, short-term investments and trade accounts receivable. We have no significant concentrations of credit risk at December 31, 2006.with varying maturity dates. Our counterparties in our foreign currency forward and option contracts are major financial institutions. We do not anticipate nonperformance by these counterparties. We maintain cash(See Note 4 – Derivative instruments and cash equivalents with various financial institutions locatedhedging activities in many countries worldwide. Our short-term investments are diversified among and limitedNotes to high-quality securities with high credit ratings. Consolidated Financial Statements).
Concentration of credit risk with respect to trade accounts receivable is limited due to the large number of customers and their dispersion across many countries and industries. The amount of sales to any individual customer did not exceed 3% of revenue for the periods presented. The largest trade account receivable from any individual customer at December 31, 20062009 was approximately $1.8$1.9 million.
Key supplier risk
Our manufacturing processes use large volumes of high-quality components and subassemblies supplied by outside sources. Several of thosethese components are available through singlesole or limited sources. Supply shortages of or quality problems in connection with some of these key components could require us to procure components from replacement suppliers, which would cause significant delays in fulfillment of orders and likely result in additional costs. In order to manage this risk, we maintain safety stock of some of these single sourced components and subassemblies and perform regular assessments of suppliers performance, grading key suppliers in critical areas such as quality and “on-time” delivery.
Revenue recognition
We derive revenue primarily from the sale/licensing of integrated hardware and software solutions. We also sellIndependent sales of application software licenses which are sold separately as well as training andinclude post contract support services. In addition, training services are sold separately. The products and services are generally sold under standardized licensing and sales arrangements with payment terms ranging from net 30 days in the United States to net 30 days and up to net 90 days in some international markets. Approximately 95%83% of our product/license sales include both hardware and software in the customer arrangement, with a small percentage of sales including other services. We offer rights of return and standard warranties for product defects related to our products. The rights of return are generally for a period of up to 30 days after the delivery date. The standard warranties cover periods ranging from 90 days to three years. With the exception of our former German systems integration subsidiary, which accounted for less than 1.5% of our revenues in the year ended December 31, 2004, weWe do not generally enter into contracts requiring product acceptance from the customer. This subsidiary was sold in December 2004.
Revenue is recognized in accordance with the provisions of SOP 97-2FASB ASC 985, when persuasive evidence of an arrangement exists, delivery has occurred, the fee is fixed or determinable, and collectability is probable. We enter into certain arrangements where we are obligated to deliver multiple products and/or services (“multiple elements”). In these transactions, we allocate the total revenue among the elements based on vendor specific objective evidence (“VSOE”) of fair value as determined by the sales price of each element when sold separately (“vendor-specific objective evidence”). Salesseparately.
When VSOE of fair value is available for the undelivered element of a multiple element arrangements, sales revenue from product sales is generally recognized on the date the product is shipped, using the residual method under FASB ASC 985, with a portion of revenue recorded as deferred (unearned) due to applicable undelivered elements. Undelivered elements for our multiple-elementmultiple element arrangements with a customer are generally restricted to post contract support and training and education. The amount of revenue allocated to these undelivered elements is based on the vendor-specific objective evidence (“VSOE”)VSOE of fair value for those undelivered elements. Deferred revenue due to undelivered elements is recognized ratably on a straight-line basis over the service period or when the service is completed. When VSOE of fair value is not available for the undelivered element of a multiple element arrangement, sales revenue is generally recognized ratably, on a straight-line basis over the service period of the undelivered element, generally 12 months or when the service is completed in accordance with the subscription method under FASB ASC 985. Deferred revenue at December 31, 20062009 and 20052008 was $22.2$57 million and $16.0$46 million, respectively.
The application of SOP 97-2FASB ASC 985 requires judgment, including whether a software arrangement includes multiple elements, and if so, whether VSOE of fair value exists for those elements. Changes to the elements in a software arrangement, the ability to identify VSOE for those elements, the fair value of the respective elements, and changes to a product'sproduct’s estimated life cycle could materially impact the amount of our earned and unearned revenue. Judgment is also required to assess whether future releases of certain software represent new products or upgrades and enhancements to existing products. Provision
Product revenue
Our product revenue is generated predominantly from the sales of measurement and automation products. Our products consist of application software and hardware components together with related driver software.
Software maintenance revenue
Software maintenance revenue is post contract customer support that provides the customer with unspecified upgrades/updates and technical support.Shipping and handling costsOur shipping and handling costs charged to customers are included in net sales, and the associated expense is recorded in cost of sales for estimated sales returns is made by reducing recorded revenue based on historical experience. Management analyzes historical returns, current economic trends, and changes in customer demand and acceptance of our products when evaluating the adequacy of our allowance for sales returns. The accounts receivable are net of allowance for sales returns of $1.5 million and $1.3 million at December 31, 2006 and 2005, respectively. Similarly, management must make estimates of the uncollectability of our accounts receivables. Management specifically analyzes accounts receivable and analyzes historical bad debts, customer concentrations, customer credit-worthiness and current economic trends when evaluating the adequacy of our allowance for doubtful accounts. The accounts receivable are net of allowances for doubtful accounts of $2.9 million and $3.4 million at December 31, 2006 and 2005, respectively.all periods presented.
Warranty reserve
We offer a one-year limited warranty on most hardware products, with a two or three-year warranty on a subset of our hardware products, which is included in the sales price of many of our products. Provision is made for estimated future warranty costs at the time of the sale pursuant to SFAS 5,Accounting for Loss FASB ASC 450, Contingencies (FASB ASC 450), for the estimated costs that may be incurred under the basic limited warranty. Our estimate is based on historical experience and product sales during this period.
The warranty reserve for the years ended December 31, 20062009 and 2005,2008, respectively, was as follows (in thousands):2006
2005
Balance at the beginning of the period $ 915 $ 815 Accruals for warranties issued during the period 1,593 1,652 Settlements made (in cash or in kind) during the period (1,641 ) (1,552 )
Balance at the end of the period $ 867 $ 915
2009 2008 Balance at the beginning of the period $ 952 $ 750 Accruals for warranties issued during the period 1,991 1,836 Settlements made (in cash or in kind) during the period (2,022 ) (1,634 ) Balance at the end of the period $ 921 $ 952
Loss contingencies
We accrue for probable losses from contingencies including legal defense costs, on an undiscounted basis, in accordance with SFAS 5, Accounting for Loss FASB ASC 450, Contingencies (FASB ASC 450), when such costs are considered probable of being incurred and are reasonably estimable. We periodically evaluate available information, both internal and external, relative to such contingencies and adjust this accrual as necessary.
Advertising expense
We expense costs of advertising as incurred. Advertising expense for the years ended December 31, 2006, 20052009, 2008 and 20042007 was $47.3$13.6 million, $42.5$19.3 million and $39.7$20.0 million, respectively.
Foreign currency translation
The functional currency for our international sales operations is the applicable local currency. The assets and liabilities of these operations are translated at the rate of exchange in effect on the balance sheet date and sales and expenses are translated at average rates. The resulting gains or losses from translation are included in a separate component of other comprehensive income. Gains and losses resulting from re-measuring monetary asset and liability accounts that are denominated in a currency other than a subsidiary’s functional currency are included in net foreign exchange gain (loss) and are included in net income.
Foreign currency hedging instruments
All of our derivative instruments are recognized on the balance sheet at their fair value. We currently use foreign currency forward and purchased option contracts to hedge our exposure to material foreign currency denominated receivables and forecasted foreign currency cash flows.
On the date the derivative contract is entered into, we designate the derivative as either a hedge of the fair value of foreign currency denominated receivables (“fair-value” hedge) or as a hedge of the variability of foreign currency cash flows to be received or paid (“cash flow” hedge). Changes in the fair market value or as a hedge of a fair-value hedge are recorded, along with the loss or gain on the re-measurement of foreign-currency-denominated receivables, in current earnings.our foreign denominated net receivable positions (“other derivatives”). Changes in the fair value of derivatives that are designated and qualify as cash flow hedges under SFAS 133FASB ASC 815, Derivatives and Hedging (FASB ASC 815) and that are deemed to be highly effective are recorded in other comprehensive income. These amounts are subsequently reclassified into earnings in the period during which the hedgehedged transaction is realized. The gain or loss on the other derivatives as well as the offsetting gain or loss on the hedged item attributable to the hedged risk is recognized in current earnings under the line item “Net foreign exchange gain (loss)”. We do not enter into derivative contracts for speculative purposes.
We formally document all relationships between hedging instruments and hedged items, as well as our risk-management objective and strategy for undertaking various hedge transactions. This process includes linking all derivatives that are designated as fair-value or cash flow hedges to specific assets and liabilities on the balance sheet or to specific firm commitments or forecasted transactions. We also formally assess, both at the hedge’s inception and on an ongoing basis, whether the hedging instruments are highly effective in offsetting changes in cash flows of hedged items.
We prospectively discontinue hedge accounting if (1) it is determined that the derivative is no longer highly effective in offsetting changes in the fair value of a hedged item (forecasted transactions); or (2) the derivative is de-designated as a hedge instrument, because it is unlikely that a forecasted transaction will occur. When hedge accounting is discontinued, the derivative is sold and the resulting gains and losses are recognized immediately in earnings.
Income taxes
We account for income taxes under the asset and liability method as set forth in SFAS 109,Accounting for FASB ASC 740, Income Taxes.Taxes (FASB ASC 740). Deferred tax assets and liabilities are recognized for the expected tax consequences of temporary differences between the tax bases of assets and liabilities and their reported amounts. Valuation allowances are established when necessary to reduce deferred tax assets to amounts which are more likely than not to be realized.
Earnings per share On January 21, 2004, we declared a stock split effected in the form of a dividend of one share of common stock for each two shares of common stock outstanding. The dividend was paid on February 20, 2004 to holders of record as of the close of business on February 5, 2004. All per share data and numbers of common shares, where appropriate, have been retroactively adjusted to reflect the stock split.
Basic earnings per share (“EPS”) is computed by dividing net income by the weighted average number of common shares outstanding during each period. Diluted EPS is computed by dividing net income by the weighted average number of common shares and common share equivalents outstanding (if dilutive) during each period. The number of common share equivalents, which include stock options and restricted stock units, is computed using the treasury stock method.
The reconciliation of the denominators used to calculate basic EPS and diluted EPS for the years ended December 31, 2006, 20052009, 2008 and 2004,2007, respectively, are as follows (in thousands):Years Ended December 31,
2006
2005
2004
Weighted average shares outstanding-basic 79,519 78,552 78,680 Plus: Common share equivalents Stock options, restricted stock units 2,000 2,358 3,416
Weighted average shares outstanding-diluted 81,519 80,910 82,096
Years Ended December 31, 2009 2008 2007 Weighted average shares outstanding-basic�� 77,520 78,567 79,468 Plus: Common share equivalents Stock options, restricted stock units 506 948 1,575 Weighted average shares outstanding-diluted 78,026 79,515 81,043
Stock options to acquire 3,295,000, 3,056,0002,711,976, 2,402,934 and 2,523,0002,304,078 shares for the years ended December 31, 2006, 20052009, 2008 and 2004,2007, respectively, were excluded in the computations of diluted EPS because the effect of including the stock options would have been anti-dilutive.
Stock-based compensation plans
Effective January 1, 2006, we adopted Statement of Financial Accounting Standards 123R (“SFAS 123R”),“Share-based Payments”FASB ASC 718, Compensation – Stock Compensation (FASB ASC 718), using the modified-prospective-transition method. Under this method, prior periods are not restated. Under this transition method, stock compensation cost recognized beginning January 1, 2006 includes: (a) compensation cost for all share-based payments granted prior to, but not yet vested as of January 1, 2006, based on the grant date fair value estimated in accordance with the original provisions of SFAS 123,FASB ASC 718, and (b) compensation cost for all share-based payments granted on or subsequent to January 1, 2006, based on the grant-date fair value estimated in accordance with the provisions of SFAS 123R.FASB ASC 718. Prior
Comprehensive income
Our comprehensive income is comprised of net income, foreign currency translation and unrealized gains and losses on forward and option contracts and securities available-for-sale. Comprehensive income for 2009, 2008 and 2007 was $20.1 million, $88.2 million and $111.6 million, respectively.
Recently Issued Accounting Pronouncements
In April 2009, the FASB updated FASB ASC 820 providing additional guidance for estimating fair value when the volume and level of activity for the asset or liability have significantly decreased. This update also includes guidance on identifying circumstances that indicate a transaction is not orderly. We adopted the update on April 1, 2009 as required and concluded it did not have a material impact on our consolidated financial position or results of operations.
In September 2009, the FASB updated FASB ASC 105, Generally Accepted Accounting Principles (FASB ASC 105). The update establishes the FASB Standards Accounting Codification (“Codification”) as the source of authoritative U.S. generally accepted accounting principles (“GAAP”) recognized by the FASB to adopting SFAS 123R, we presentedbe applied to nongovernmental entities and rules and interpretive releases of the SEC as authoritative GAAP for SEC registrants. The Codification supersedes all tax benefitsexisting non-SEC accounting and reporting standards. This update is effective for financial statements issued for interim and annual periods ending after September 15, 2009. We adopted the update on July 1, 2009, as required and concluded it did not have a material impact on our consolidated financial position or results of deductions resultingoperations.
In October 2009, the FASB updated FASB ASC 605, Revenue Recognition (FASB ASC 605) that amended the criteria for separating consideration in multiple-deliverable arrangements. The amendments establish a selling price hierarchy for determining the selling price of a deliverable. The selling price used for each deliverable will be based on vendor-specific objective evidence if available, third–party evidence if vendor-specific objective evidence is not available, or estimated selling price if neither vendor-specific objective evidence nor third-party evidence is available. The amendments will change the application of the residual method of allocation and require that arrangement consideration be allocated at the inception of the arrangement to all deliverables using the relative selling price method. The relative selling price method allocates any discount in the arrangement proportionally to each deliverable on the basis of each deliverable’s selling price. This update will be effective prospectively for revenue arrangements entered into or materially modified in fiscal years beginning on or after June 15, 2010. Early adoption is permitted. We are currently evaluating the requirements of this update and have not yet determined the impact on our consolidated financial statements.
In October 2009, the FASB updated FASB ASC 985, Software (FASB ASC 985) that changes the accounting model for revenue arrangements that include both tangible products and software elements. Tangible products containing software components and nonsoftware components that function together to deliver the tangible product’s essential functionality are no longer within the scope of the software revenue guidance in Subtopic 985-605. In addition, the amendments require that hardware components of a tangible product containing software components always be excluded from the exercisesoftware revenue guidance. This update will be effective prospectively for revenue arrangements entered into or materially modified in fiscal years beginning on or after June 15, 2010. Early adoption is permitted. We are currently evaluating the requirements of stock grants as operatingthis update and have not yet determined the impact on our consolidated financial statements.
Cash, cash flows. SFAS 123R requires the cash flows resulting from the tax benefits from tax deductions in excessequivalents, short-term and long-term investments consist of the compensation costfollowing (in thousands):
As ofDecember 31, 2009 As ofDecember 31, 2008 Cash and cash equivalents: Cash $ 85,612 $ 100,967 Cash equivalents: Time deposits — 73,400 Money market accounts 115,853 55,033 Total cash and cash equivalents $ 201,465 $ 229,400 Short-term investments: Municipal bonds $ 12,549 $ 6,220 Corporate bonds 7,587 — U.S. treasuries and agencies 21,033 — Foreign government bonds 34,674 — Time deposits 2,753 — Auction rate securities 8,177 — Auction rate securities put option 423 — Total short-term investments 87,196 6,220 Long-term investments: Auction rate securities — 6,964 Auction rate securities put option — 1,636 Other long-term investments — 1,900 Total investments $ 87,196 $ 16,720 Total cash, cash equivalents and investments $ 288,661 $ 246,120
The following table summarizes unrealized gains and losses related to our investments designated as available-for-sale (in thousands):
As of December 31, 2009 Adjusted Cost GrossUnrealized Gain GrossUnrealized Loss Cumulative Translation Adjustment Fair Value Municipal bonds $ 12,491 $ 58 $ — $ — $ 12,549 Corporate bonds 7,478 110 (1 ) — 7,587 U.S. treasuries and agencies 21,080 — (47 ) — 21,033 Foreign government bonds 36,105 76 — (1,507 ) 34,674 Time deposits 2,753 — — — 2,753 Auction rate securities 8,600 — (423 ) — 8,177 Auction rate securities put option — 423 — — 423 Total investments $ 88,507 $ 667 $ (471 ) $ (1,507 ) $ 87,196
As of December 31, 2008 Adjusted Cost GrossUnrealized Gain GrossUnrealized Loss Fair Value Municipal securities $ 6,199 $ 28 $ (7 ) $ 6,220 Auction rate securities 8,600 — (1,636 ) 6,964 Auction rate securities put option — 1,636 — 1,636 Other long-term investments 1,900 — — 1,900 Total investments $ 16,699 $ 1,664 $ (1,643 ) $ 16,720
The following table summarizes the contractual maturities of our investments designated as available-for-sale (in thousands):
As of December 31, 2009 Adjusted Cost Fair Value Due in less than 1 year $ 44,029 $ 43,267 Due in 1 to 5 years 44,478 43,929 Total investments $ 88,507 $ 87,196
As of December 31, 2009 Due in less than 1 year Adjusted Cost Fair Value Municipal bonds $ 4,103 $ 4,110 Corporate bonds 5,384 5,473 U.S. treasuries and agencies 5,065 5,057 Foreign government bonds 18,124 17,274 Time deposits 2,753 2,753 Auction rate securities 8,600 8,177 Auction rate securities put option — 423 Total investments $ 44,029 $ 43,267
As of December 31, 2009 Due in 1 to 5 years Adjusted Cost Fair Value Municipal bonds $ 8,388 $ 8,439 Corporate bonds 2,094 2,114 U.S. treasuries and agencies 16,015 15,976 Foreign government bonds 17,981 17,400 Time deposits — — Auction rate securities — — Auction rate securities put option — — Total investments $ 44,478 $ 43,929
Note 3 – Fair value measurements
FASB ASC 820, clarifies the definition of fair value, prescribes methods for measuring fair value, establishes a fair value hierarchy based on the inputs used to measure fair value and expands disclosures about the use of fair value measurements. Effective January 1, 2009, we adopted FASB ASC 820 for our nonfinancial assets and nonfinancial liabilities, except those items recognized (excess tax benefits) to be classifiedor disclosed at fair value on an annual or more frequently recurring basis. The adoption of FASB ASC 820 did not have a material impact on our fair value measurements as financing cash flows. Aswe did not have any items that were measured at fair value on a result, $4.3 million of excess tax benefitsnonrecurring basis for the year ended December 31, 20062009. In April 2009, FASB ASC 820 was updated to provide additional guidance for estimating fair value when the volume and level of activity for the asset or liability have been classified as financing cash flows. Prior tosignificantly decreased. The update also includes guidance on identifying circumstances that indicate a transaction is not orderly. We adopted the effective date of SFAS 123R, we applied Accounting Principles Board Opinion 25 (“APB 25”),“Accounting for Stock Issued to Employees”update on April 1, 2009 and related interpretations forit did not have a material impact on our stock option grants. APB 25 providesfair value measurements.
The following tables present our assets and liabilities that are measured at fair value on a recurring basis and are categorized using the compensation expense relative to our stock options is measuredfair value hierarchy. The fair value hierarchy has three levels based on the intrinsicreliability of the inputs used to determine fair value.
Fair Value Measurements at Reporting Date Using Description December 31, 2009 Quoted Prices in Active Markets for Identical Assets(Level 1) Significant Other Observable Inputs(Level 2) Significant Unobservable Inputs(Level 3) Assets Money Market Funds $ 115,853 $ 115,853 $ — $ — Short-term investments available-for-sale 87,196 78,596 — 8,600 Derivatives 11,016 — 11,016 — Total Assets $ 214,065 $ 194,449 $ 11,016 $ 8,600 Liabilities Derivatives $ (318 ) $ — $ (318 ) $ — Total Liabilities $ (318 ) $ — $ (318 ) $ —
Fair Value Measurements Using Significant Unobservable Inputs(Level 3) Short-term investmentsavailable-for-sale Beginning Balance, January 1, 2008 $ 8,600 Total gains (realized/unrealized) Included in earnings 423 Included in other comprehensive income — Total losses (realized/unrealized) Included in earnings (423 ) Included in other comprehensive income — Purchases, issuances and settlements — Transfer in and/or out of Level 3 — Ending Balance, December 31, 2009 $ 8,600 The amount of total gains or (losses) for the period included in earnings (or changes in net assets) attributableto the change in unrealized gains or losses relating to assets still held at the reporting date $ —
Short-term investments available-for-sale are valued using a market approach (Level 1) based on the quoted market prices of identical instruments when available or other observable inputs such as trading prices of identical instruments in inactive markets. Short-term investments available-for-sale consist of debt securities issued by states of the U.S. and political subdivisions of the states, corporate debt securities and debt securities issued by U.S. government corporations and agencies. All short-term investments available-for-sale have contractual maturities of less than 24 months.
Derivatives include foreign currency forward and option contracts. Our foreign currency forward contracts are valued using an income approach (Level 2) based on the spot rate less the contract rate multiplied by the notional amount. Our foreign currency option contracts are valued using a market approach based on the quoted market prices which are derived from observable inputs including current and future spot rates, interest rate spreads as well as quoted market prices of identical instruments.
Short-term debt securities available-for-sale included in Level 3 are reported at their fair market value and consist of auction rate securities backed by education loan revenue bonds. One of our auction rate securities is from the Vermont Student Assistance Corporation and has a par value of $2.2 million. The other of our auction rate securities is from the New Hampshire Health and Education Facilities Authority and has a par value of $6.4 million. The ratings for these securities at December 31, 2009, were Baa3/A/AAA and Aaa/NR/AAA, respectively. Historically, we reported the fair market value of these securities at par as differences between par value and the purchase price or settlement value were historically comprised of accrued interest. Auction rate securities are variable rate debt instruments whose interest rates are typically reset approximately every 7 to 35 days. On January 15, 2010, and in prior auction periods beginning in February 2008, the auction process for these securities failed. At December 31, 2009, we reported these as short-term investments at their estimated fair market value of $8.2 million.
In November 2008, we accepted the UBS Auction Rate Securities Rights (the “Rights”) agreement offered by UBS as a liquidity alternative to the failed auction process. This Rights agreement is related to the auction rates securities discussed above. The Rights agreement is a nontransferable right to sell our auction rate securities, at par value, back to UBS at any time during the period June 30, 2010, through July 2, 2012. At December 31, 2009, we reported the Rights agreement at its estimated fair market value of $423,000 as a component of short-term debt securities available for sale.
Due to the fact that our Rights agreement has an initial exercise date that is less than one year from now, we are now reporting our auction rate securities and the corresponding Rights agreement as short-term. We continue to have the ability to hold our auction rate securities to their ultimate maturities which are in excess of one year and we have not made a determination as to whether we will exercise our option under the Rights agreement or if we do choose to exercise our option, at what point during the period June 30, 2010 through July 2, 2012, we would exercise our option. However, due to the fact that our Rights agreement has an initial exercise date that is less than one year from now, we are now reporting our auction rate securities and the corresponding Rights agreement as short-term. We have recorded the unrealized loss related to the auction rate securities and the unrealized gain related to the Rights agreement as a component of other income (expense), in our Consolidated Statements of Income.
The estimated fair market value of both the auction rate securities and the Rights agreement was determined using significant unobservable inputs (Level 3) as prescribed by FASB ASC 820. We considered many factors in determining the fair market value of the stockauction rate securities as well as our corresponding Rights agreement at December 31, 2009, including the fact that the debt instruments underlying the auction rate securities have redemption features which call for redemption at 100% of par value, current credit curves for like securities and discount factors to account for the illiquidity of the market for these securities. During the year ended December 31, 2009, we did not make any changes to our valuation techniques or related inputs.
FASB ASC 815 requires companies to recognize all of their derivative instruments as either assets or liabilities in the statement of financial position at fair value. The accounting for changes in the fair value (i.e., gains or losses) of a derivative instrument depends on whether it has been designated and qualifies as part of a hedging relationship and further, on the type of hedging relationship. For those derivative instruments that are designated and qualify as hedging instruments, a company must designate the hedging instrument, based upon the exposure being hedged, as a fair value hedge, cash flow hedge, or a hedge of a net investment in a foreign operation.
We have operations in over 40 countries. Sales outside of the Americas as a percentage of consolidated sales were 57% and 57% for the years ended December 31, 2009 and 2008, respectively. Our activities expose us to a variety of market risks, including the effects of changes in foreign currency exchange rates. These financial risks are monitored and managed by us as an integral part of our overall risk management program.
We maintain a foreign currency risk management strategy that uses derivative instruments (foreign currency forward and purchased option contracts) to help protect our earnings and cash flows from fluctuations caused by the volatility in currency exchange rates. Movements in foreign currency exchange rates pose a risk to our operations and competitive position, since exchange rate changes may affect our profitability and cash flow, and the business or pricing strategies of our non-U.S. based competitors.
The vast majority of our foreign sales are denominated in the customers’ local currency. We purchase foreign currency forward and option contracts as hedges of forecasted sales that are denominated in foreign currencies and as hedges of foreign currency denominated receivables. These contracts are entered into to protect against the risk that the eventual dollar-net-cash inflows resulting from such sales or firm commitments will be adversely affected by changes in exchange rates. We also purchase foreign currency forward contracts as hedges of forecasted expenses that are denominated in foreign currencies. These contracts are entered into to protect against the risk that the eventual dollar-net-cash outflows resulting from foreign currency operating and cost of revenue expenses will be adversely affected by changes in exchange rates.
In accordance with FASB ASC 815, we designate foreign currency forward and purchased option contracts as cash flow hedges of forecasted revenues or forecasted expenses. In addition, we hedge our foreign currency denominated balance sheet exposures using foreign currency forward contracts. These derivatives are not designated as hedging instruments under FASB ASC 815. None of our derivative instruments contain a credit-risk-related contingent feature.
Cash flow hedges
To protect against the reduction in value caused by a fluctuation in foreign currency exchange rates of forecasted foreign currency cash flows resulting from international sales over the next one to two years, we have instituted a foreign currency cash flow hedging program. We hedge portions of our forecasted revenue and forecasted expenses denominated in foreign currencies with forward and purchased option contracts. For forward contracts, when the dollar strengthens significantly against the foreign currencies, the change in the present value of future foreign currency cash flows may be offset by the change in the fair value of the forward contracts designated as hedges. For option contracts, when the dollar strengthens significantly against the foreign currencies, the change in the present value of future foreign currency cash flows may be offset by the change in the fair value of the option contracts net of the premium paid designated as hedges. Our foreign currency purchased option contracts are purchased “at-the-money” or “out-of-the-money”. We purchase foreign currency forward and option contracts for up to 100% of our forecasted exposures in selected currencies (primarily in Euro, Japanese yen, British pound sterling, South Korean won and Hungarian forint) and limit the duration of these contracts to 40 months or less.
For derivative instruments that are designated and qualify as a cash flow hedge, the effective portion of the gain or loss on the derivative is reported as a component of accumulated other comprehensive income (“OCI”) and reclassified into earnings in the same line item (net sales, operating expenses, or cost of sales) associated with the forecasted transaction and in the same period or periods during which the hedged transaction affects earnings. Gains and losses on the derivative representing either hedge ineffectiveness or hedge components excluded from the assessment of effectiveness are recognized in current earnings or expenses during the current period and are classified as a component of “net foreign exchange gain (loss)”. Hedge effectiveness of foreign currency forwards and purchased option contracts designated as cash flow hedges are measured by comparing the hedging instrument’s cumulative change in fair value from inception to maturity to the forecasted transaction’s terminal value.
We held forward contracts with a notional amount of $28.6 million dollar equivalent of Euro, $4.0 million dollar equivalent of British pound sterling, $24.4 million dollar equivalent of Japanese yen, and $17.8 million dollar equivalent of Hungarian forint at dateDecember 31, 2009. These contracts are for terms of grant.up to 24 months. At December 31, 2008, we held forward contracts with a notional amount of $54.9 million dollar equivalent of Euro, $6.2 million dollar equivalent of British pound sterling, $18.9 million dollar equivalent of Japanese yen, $4.7 million dollar equivalent of South Korean won and $21.7 million dollar equivalent of Hungarian forint.
We held purchased option contracts with a notional amount of $28.4 million dollar equivalent of Euro at December 31, 2009. These contracts are for terms of up to 12 months. At December 31, 2008, we held purchased option contracts with a notional amount of $111.3 million dollar equivalent of Euro.
At December 31, 2009, we expect to reclassify $2.8 million of gains on derivative instruments from accumulated other comprehensive income to net sales during the next twelve months when the hedged international sales occur. At December 31, 2009, we expect to reclassify $3.7 million of gains on derivative instruments from accumulated OCI to cost of sales and $2.0 million of gains on derivative instruments from accumulated OCI to operating expenses during the next twelve months when the hedged international expenses occur. Expected amounts are based on derivative valuations at December 31, 2009. Actual results may vary as a result of changes in the corresponding exchange rate subsequent to this date.
During the year ended December 31, 2009, hedges with a notional amount of $22.8 million were determined to be ineffective. As a result, we recorded a net gain of adopting SFAS 123R$1.2 million related to these hedges as a component of “net foreign exchange gain (loss)” during the year ended December 31, 2009. We did not record any gains or losses due to the ineffectiveness of our hedges during the year ended December 31, 2008.Other Derivatives
Other derivatives not designated as hedging instruments under FASB ASC 815 consist primarily of foreign currency forward contracts that we use to hedge our foreign denominated net receivable or net payable positions to protect against the change in value caused by a fluctuation in foreign currency exchange rates. We typically hedge up to 90% of our outstanding foreign denominated net receivables or net payables and typically limit the duration of these foreign currency forward contracts to approximately 90 days. The gain or loss on the derivatives as well as the offsetting gain or loss on the hedge item attributable to the hedged risk is recognized in current earnings under the line item “net foreign exchange gain (loss)”. As of December 31, 2009 and December 31, 2008, we held foreign currency forward contracts with a notional amount of $45.2 million and $67.1 million, respectively.
Effective January 1, 2006,2009, we adopted the updated disclosure requirements of FASB ASC 815. The following table presents the fair value of derivative instruments on our income before income taxesConsolidated Balance Sheets and net incomethe effect of derivative instruments on our Consolidated Statements of Income.
Fair Values of Derivative Instruments (in thousands):
In thousands Asset Derivatives December 31, 2009 December 31, 2008 Balance Sheet Location Fair Value Balance Sheet Location Fair Value Derivatives designated as hedginginstruments under FASB ASC 815 Foreign exchange contracts – ST forwards Prepaid expenses and other current assets $ 7,947 Prepaid expenses and other current assets $ 5,260 Foreign exchange contracts – LT forwards Other long-term assets 274 Other long-term assets 2,654 Foreign exchange contracts – ST options Prepaid expenses and other current assets 1,821 Prepaid expenses and other current assets 5,705 Foreign exchange contracts – LT options Other long-term assets — Other long-term assets 3,838 Total derivatives designated ashedging instruments under FASB ASC 815 $ 10,042 $ 17,457 Derivatives not designated ashedging instruments under FASB ASC 815 Foreign exchange contracts – ST forwards Prepaid expenses and other current assets $ 974 Prepaid expenses and other current assets $ 2,745 Total derivatives not designated ashedging instruments under FASB ASC 815 $ 974 $ 2,745 Total derivatives $ 11,016 $ 20,202
Liability Derivatives December 31, 2009 December 31, 2008 Balance Sheet Location Fair Value Balance Sheet Location Fair Value Derivatives designated as hedginginstruments under FASB ASC 815 Foreign exchange contracts – ST forwards Accrued expenses and other liabilities $ — Accrued expenses and other liabilities $ (1,803 ) Foreign exchange contracts – LT forwards Other long-term liabilities — Other long-term liabilities — Foreign exchange contracts – ST options Accrued expenses and other liabilities — Accrued expenses and other liabilities — Foreign exchange contracts – LT options Other long-term liabilities — Other long-term liabilities — Total derivatives designated ashedging instruments under FASB ASC 815 $ — $ (1,803 ) Derivatives not designated ashedging instruments under FASB ASC 815 Foreign exchange contracts – ST forwards Accrued expenses and other liabilities $ (318 ) Accrued expenses and other liabilities $ (3,280 ) Total derivatives not designated ashedging instruments under FASB ASC 815 $ (318 ) $ (3,280 ) Total derivatives $ (318 ) $ (5,083 )
The following table shows the effect of derivative instruments on our Consolidated Statements of Income for the year ended December 31, 2006 are $9.42009 (in thousands):
Derivatives in FASB ASC 815 Cash Flow Hedging Relationship Amount of Gain or (Loss) Recognized in OCI on Derivative (Effective Portion) (in thousands) Location of Gain or (Loss) Reclassified from Accumulated OCI into Income (Effective Portion) Amount of Gain or (Loss) Reclassified from Accumulated OCI into Income (Effective Portion) (in thousands) Location of Gain or (Loss) Recognized in Income on Derivative (Ineffective Portion and Amount Excluded from Effectiveness Testing) Amount of Gain or (Loss) Recognized in Income on Derivative (Ineffective Portion and Amount Excluded from Effectiveness Testing) 2009 2009 2009 Foreign exchange contracts – forwards and options $ (6,304 ) Net sales $ 1,399 Net foreign exchange gain (loss) $ 1,132 Foreign exchange contracts – forwards and options 2,055 Cost of sales (74 ) Net foreign exchange gain (loss) (41 ) Foreign exchange contracts – forwards and options 1,427 Operating expenses 517 Net foreign exchange gain (loss) 81 Total $ (2,822 ) $ 1,842 $ 1,172
Derivatives not Designated as Hedging Instruments under FASB ASC 815 Location of Gain (Loss) Recognized in Income on Derivative Amount of Gain (Loss) Recognized in Income on Derivative 2009 Foreign exchange contracts – forwards Net foreign exchange gain/(loss) $ (1,669 ) Total $ (1,669 )
Note 5 – Inventories
Inventories, net consist of the following (in thousands):
December 31, 2009 2008 Raw materials $ 42,121 $ 48,004 Work-in-process 2,042 4,150 Finished goods 42,352 55,204 $ 86,515 $ 107,358
Note 6 – Property and equipment
Property and equipment consist of the following (in thousands):
December 31, 2009 2008 Land $ 17,076 $ 7,210 Buildings 138,367 136,802 Furniture and equipment 154,558 144,979 310,001 288,991 Accumulated depreciation (156,736 ) (134,514 ) $ 153,265 $ 154,477
Depreciation expense for the years ended December 31, 2009, 2008 and 2007, was $22.3 million, $20.9 million and $22.2 million, respectively.
Intangibles at December 31, 2009 and 2008 are as follows:
2009 2008 Gross Carrying Amount Accumulated Amortization Net Carrying Amount Gross Carrying Amount Accumulated Amortization Net Carrying Amount Capitalized software development costs $ 38,928 $ (20,455 ) $ 18,473 $ 25,610 $ (11,344 ) $ 14,266 Acquired technology 28,022 (20,967 ) 7,055 27,503 (16,804 ) 10,699 Patents 19,033 (5,377 ) 13,656 16,068 (4,506 ) 11,562 Other 12,577 (8,371 ) 4,206 11,401 (6,013 ) 5,388 $ 98,560 $ (55,170 ) $ 43,390 $ 80,582 $ (38,667 ) $ 41,915
Software development costs capitalized during 2009, 2008 and 2007 were $13.3 million, $9.5 million and $8.3 million, respectively, and related amortization was $9.1 million, $10.3 million and $8.9 million, respectively. Included in these capitalized costs for the years ended December 31, 2009, 2008, and 2007 were costs related to stock based compensation of $734,000, $451,000 and $422,000, respectively. Amortization of capitalized software development costs is computed on an individual product basis for those products available for market and is recognized based on the product’s estimated economic life, generally three years. Patents are amortized using the straight-line method over their estimated period of benefit, generally ten to seventeen years. Total intangible assets amortization expenses were $16.5 million, $16.2 million and $14.4 million for the years ended December 31, 2009, 2008 and 2007, respectively.
Capitalized software development costs, acquired technology, patents and other have weighted-average useful lives of 2.2 years, 1.8 years, 5.3 years, and 1.8 years, respectively, as of December 31, 2009. The estimated future amortization expense related to intangible assets as of December 31, 2009 is as follows:
Amount(in thousands) 2010 $ 18,097 2011 12,986 2012 7,187 2013 1,868 2014 1,186 Thereafter 2,066 $ 43,390
Acquisition intangibles are amortized over their useful lives, which range from three to eight years. Amortization expense for acquisition intangibles was approximately $3.9 million and $4.2 million for 2009 and 2008, respectively, of which approximately $3.4 million and $3.6 million was recorded in cost of sales and approximately $503,000 and $580,000 was recorded in operating expenses for 2009 and 2008, respectively. The estimated amortization expense of acquisition intangibles in future years will be recorded in our Consolidated Statements of Income as follows (in thousands):
Fiscal Year Cost of Sales Acquisition related costs and amortization, net Total 2010 $ 2,701 $ 369 $ 3,070 2011 2,160 221 2,381 2012 1,126 206 1,332 2013 87 75 162 Thereafter — — — Total $ 6,074 $ 871 $ 6,945
Note 8 – Goodwill
The carrying amount of goodwill for 2008 and 2009 are as follows:
Amount(in thousands) Balance as of December 31, 2007 $ 54,111 Acquisitions/purchase accounting adjustments 10,818 Divestitures — Foreign currency translation impact (368 ) Balance as of December 31, 2008 $ 64,561 Acquisitions/purchase accounting adjustments — Divestitures — Foreign currency translation impact 218 Balance as of December 31, 2009 $ 64,779
The excess purchase price over the fair value of assets acquired is recorded as goodwill. As we have one operating segment, we allocate goodwill to one reporting unit for goodwill impairment testing. In accordance with FASB ASC 350, goodwill is tested for impairment on an annual basis, and between annual tests if indicators of potential impairment exist, using a fair-value-based approach based on the market capitalization of the reporting unit. Our annual impairment test was performed as of February 28, 2009. No impairment of goodwill has been identified during the period presented. Goodwill is deductible for tax purposes in certain jurisdictions.
The components of income before income taxes are as follows (in thousands):
Years Ended December 31, 2009 2008 2007 Domestic $ 34,953 $ 15,921 $ 31,685 Foreign 15,292 82,216 81,742 $ 50,245 $ 98,137 $ 113,427
The provision for income taxes charged to operations is as follows (in thousands):
Years Ended December 31, 2009 2008 2007 Current tax expense: U.S. federal $ 3,117 $ 14,631 $ 15,957 State 136 1,391 1,155 Foreign 13,760 18,910 9,925 Total current 17,013 34,932 27,037 Deferred tax expense (benefit): U.S. federal 9,920 (11,008 ) 628 State 387 (373 ) (156 ) Foreign (2,864 ) (1,570 ) (2,783 ) Total deferred 7,443 (12,951 ) (2,311 ) Change in valuation allowance 8,704 (8,671 ) (18,332 ) Total provision $ 33,160 $ 13,310 $ 6,394
Deferred tax liabilities (assets) at December 31, 2009 and 2008 as follows (in thousands):
December 31, 2009 2008 Capitalized software $ 5,978 $ 4,615 Depreciation and amortization 10,577 9,536 Unrealized gain on derivative instruments — 4,153 Undistributed earnings of foreign subsidiaries 9,278 10,075 Gross deferred tax liabilities 25,833 28,379 Operating loss carryforwards (57,422 ) (43,360 ) Intangible assets (44,159 ) (58,987 ) Vacation and other accruals (3,700 ) (4,890 ) Inventory valuation and warranty provisions (6,702 ) (12,665 ) Doubtful accounts and sales provisions (1,088 ) (1,512 ) Unrealized exchange loss (917 ) (1,345 ) Deferred revenue . (853 ) (71 ) Accrued rent expenses (111 ) (117 ) Accrued legal expenses (710 ) (1,466 ) Unrealized loss on derivative instruments (242 ) — 10% minority stock investment (900 ) (920 ) Stock-based compensation (4,483 ) (5,353 ) Research and development tax credit carryforward (2,054 ) — Foreign tax credit carryforward (1,775 ) — Other (657 ) (783 ) Gross deferred tax assets (125,773 ) (131,469 ) Valuation allowance 99,862 85,815 Net deferred tax liability (asset) $ (78 ) $ (17,275 )
A reconciliation of income taxes at the U.S. federal statutory income tax rate to the effective tax rate follows:
Years Ended December 31, 2009 2008 2007 U.S. federal statutory tax rate 35 % 35 % 35 % Domestic production activities — — (1 ) Foreign taxes (less) than federal statutory rate (6 ) (9 ) (14 ) Change in valuation allowance 17 (9 ) (16 ) Research and development tax credit (4 ) (2 ) (1 ) Tax exempt interest — (1 ) (1 ) State income taxes, net of federal tax benefit 1 1 1 Employee share-based compensation 7 2 2 Intercompany profit 15 (5 ) — Other 1 2 1 Effective tax rate 66 % 14 % 6 %
Certain prior year amounts in the reconciliation of income taxes at the U.S. federal statutory income tax rate to the effective tax rate have been reclassified to conform to the 2009 presentation as shown in the following tables:
2008 foreign taxes (less) than federal statutory rate as reported in prior year Form 10-K (14 ) Reclassification (a) 5 2008 foreign taxes (less) than federal statutory rate as reported in current year Form 10-K (9 ) 2008 intercompany profit as reported in prior year Form 10-K — Reclassification (a) (5 ) 2008 intercompany profit as reported in current year Form 10-K (5 )
(a) These amounts represent income taxes on intercompany profit previously included in foreign taxes (less) than the federal statutory rate and reclassified to intercompany profit for comparability to corresponding amounts reported in 2009. The reclassification did not have any impact on our total income tax expense.
For the year ended December 31, 2009, we generated a federal net operating loss of approximately $3.3 million and tax credits of approximately $3.8 million. The federal net operating loss can be carried back two years and the federal tax credits can be carried back one year.
As of December 31, 2009, eleven of our subsidiaries have available, for income tax purposes, foreign net operating loss carryforwards of an aggregate of approximately $286 million, of which $12.1 million expire during the years 2011 - - 2018 and $273.9 million of which may be carried forward indefinitely. Our tax valuation allowance relates to our ability to realize certain of these foreign net operating loss carryforwards and benefits of tax deductible goodwill in excess of book goodwill.
We maintain a manufacturing facility in Hungary. As a result of certain foreign investment incentives available under Hungarian law, the profit from our Hungarian operation was subject to a reduced income tax rate. This special tax status terminated on January 1, 2008, with the merger of our Hungary manufacturing operations with its Hungarian parent company. The merger was effective on January 1, 2008. The aggregate tax benefit of the exemption was $8.7 million lower, respectively, than if we had continued to account for share-based compensation under APB 25. Basic and diluted earnings per share for the year ended December 31, 2006 are $0.112007.
In 2003, we restructured the organization of our manufacturing operation in Hungary. The tax deductible goodwill in excess of book goodwill created by this restructuring resulted in our being required to record a gross deferred tax asset of $91.0 million. Because we did not expect to have sufficient taxable income in the relevant jurisdiction in future periods to realize the benefit of this deferred tax asset, a full valuation allowance was established. Following the approval of the merger of our Hungarian manufacturing operation with its Hungarian parent company in December 2007, we released $8.7 million and $0.11 lower,$18.3 million in 2008 and 2007, respectively, than if we had continued to account for share-based compensation under APB 25. Deferred stock-based compensation balancesof the valuation allowance previously required under APB 25 were adjusted against previously recorded common stock and additional paid-in capital balances upon adoption of SFAS 123R, as required. Had we previously recognized compensation costs as prescribed by SFAS 123, previously reported net income, basic earnings per share and diluted earnings per share would have changed to the pro forma amounts shown below (in thousands, except per share amounts):
Years Ended December 31,
2005
2004
Net income, as reported $ 61,517 $ 48,610 Stock-based compensation included in reported net income, net of related tax effects 959 — Total stock-based compensation expense determined under fair value method for all awards, net of related tax effects (13,998 ) (12,741 )
Pro-forma net income $ 48,478 $ 35,869
Earnings per share: Basic - as reported $ 0.78 $ 0.62 Basic - pro-forma $ 0.62 $ 0.46 Diluted - as reported $ 0.76 $ 0.59 Diluted - pro-forma $ 0.60 $ 0.44
Pro-forma disclosuresestablished for the excess tax deductible goodwill to reflect the tax benefit we expected to realize in future periods.
For the year 2009, we expected to recognize an additional tax benefit of $9.7 million related to these assets. Effective January 1, 2010, a new tax law in Hungary provides for an enhanced deduction for the qualified research and development expenses of NI Hungary Software and Hardware Manufacturing Kft. ("NI Hungary"). During the three months ended December 31, 2006 are2009, we obtained confirmation of the application of this new tax law for the qualified research and development expenses of NI Hungary. Based on the application of this new tax law to the qualified research and development expense of NI Hungary, we no longer expect to have sufficient future taxable income in Hungary to realize the benefits of these tax assets. As such, we recorded an income tax charge of $21.6 million during the three months ended December 31, 2009, $18.4 million of which was related to a valuation allowance on the previously recognized assets created by the restructuring and $3.2 million of which was related to tax benefits from other assets that we will no longer be able to realize as a result of this change. We do not presented becauseexpect to realize the amounts aretax benefit of the remaining assets created by the restructuring and therefore we have a full valuation allowance of $98.2 million against those assets at December 31, 2009.
We have not provided for U.S. federal income and foreign withholding taxes on approximately $267.5 million of certain non-U.S. subsidiaries’ undistributed earnings as of December 31, 2009. These earnings would become subject to taxes of approximately $85.7 million, if they were actually or deemed to be remitted to the parent company as dividends or if we should sell our stock in these subsidiaries. We intend to permanently reinvest the undistributed earnings.
We adopted the provisions of FASB ASC 740, on January 1, 2007. FASB ASC 740 clarifies the accounting for uncertainty in income taxes recognized in an entity's financial statements and prescribes a recognition threshold and measurement attribute for financial statement disclosure of tax positions taken or expected to be taken on a tax return. We recognized no material adjustment to the Consolidated Statementsliability for unrecognized income tax benefits. A reconciliation of Income.the beginning and ending amount of unrecognized tax benefit is as follows (in thousands):
2009 2008 Balance at beginning of period $ 9,364 $ 8,273 Additions based on tax positions related to the current year 2,060 1,946 Additions for tax positions of prior years 1,272 366 Reductions as a result of the lapse of the applicable statute of limitations (1,634 ) (1,221 ) Balance at end of period $ 11,062 $ 9,364
All of our unrecognized tax benefits at December 31, 2009 would affect our effective income tax rate if recognized. As of December 31, 2009, it is deemed reasonably possible that the Company will recognize tax benefits in the amount of $2.3 million in the next twelve months due to the closing of open tax years. The nature of the uncertainty relates to deductions taken on returns that have not been examined by the applicable tax authority.
We recognize interest and penalties related to income tax matters in income tax expense. During the years ended December 31, 2009 and 2008, we recognized interest expense related to uncertain tax positions of approximately $506,000 and $365,000, respectively. The tax years 2002 through 2009 remain open to examination by the major taxing jurisdictions in which we file income tax returns.
Note 10 – Stockholders’ equity and stock-based compensation
Stock option plans
Our stockholders approved the 1994 Incentive Stock Option Plan (the “1994 Plan”) on May 9, 1994. At the time of approval, 9,112,500 shares of our common stock were reserved for issuance under this plan. In 1997, an additional 7,087,500 shares of our common stock were reserved for issuance under this plan, and an additional 750,000 shares were reserved for issuance under this plan, as amended, in 2004. The 1994 Plan terminated in May 2005, except with respect to outstanding awards previously granted thereunder. Awards under the plan were either incentive stock options within the meaning of Section 422 of the Internal Revenue Code or nonqualified options. The right to purchase shares vests over a five to ten-year period, beginning on the date of grant. Vesting of ten year awards may accelerate based on the Company’s previous year’s earnings and revenue growth but shares cannot accelerate to vest over a period of less than five years. Stock options must be exercised within ten years from date of grant. Stock options were issued at the market price at the grant date. As part of the requirements of SFAS 123R, the Company isFASB ASC 718, we are required to estimate potential forfeitures of stock grants and adjust compensation cost recorded accordingly. The estimate of forfeitures will be adjusted over the requisite service period to the extent that actual forfeitures differ, or are expected to differ, from such estimates. Changes in estimated forfeitures will be recognized through a cumulative catch-up adjustment in the period of change and will also impact the amount of stock compensation expense to be recognized in future periods.
Transactions under all stock option plans are summarized as follows:Number of
shares under
option
Weighted
average
exercise
price
Outstanding at December 31, 2003 9,726,418 $ 18.07 Exercised (882,539 ) 9.60 Canceled (325,912 ) 27.66 Granted 1,262,599 29.71
Outstanding at December 31, 2004 9,780,566 $ 20.02 Exercised (1,188,614 ) 10.72 Canceled (358,444 ) 29.49 Granted 244,725 24.24
Outstanding at December 31, 2005 8,478,233 $ 21.05 Exercised (1,398,617 ) 13.16 Canceled (164,943 ) 27.32 Granted 0 0
Outstanding at December 31, 2006 6,914,673 $ 22.49
Options exercisable at December 31: 2004 6,353,236 $ 17.23 2005 5,946,139 19.10 2006 5,384,470 21.53
Number of
shares under
option
Weighted
average
fair value
Weighted average, grant date fair value of options granted during: 2004 1,262,599 $ 16.72 2005 244,725 12.85 2006 0 0
Number ofshares underoption Weightedaverageexerciseprice Outstanding at December 31, 2006 6,914,673 $ 22.49 Exercised (1,515,107 ) 15.22 Canceled (104,925 ) 27.33 Granted — — Outstanding at December 31, 2007 5,294,641 $ 24.47 Exercised (925,743 ) 17.30 Canceled (96,331 ) 26.98 Granted — — Outstanding at December 31, 2008 4,272,567 $ 25.97 Exercised (379,630 ) 15.40 Canceled (181,434 ) 26.80 Granted — — Outstanding at December 31, 2009 3,711,503 $ 26.93 Options exercisable at December 31: 2007 4,368,972 $ 24.17 2008 3,812,334 26.00 2009 3,493,574 26.94
The aggregate intrinsic value of stock options at exercise, represented in the table above, was $25.5$2.3 million, $19.1$11.0 million and $18.3$22.3 million for the years ended December 31, 2006, 20052009, 2008 and 2004,2007, respectively. Total unrecognized stock-based compensation expense related to non-vested stock options was approximately $18.1$2.5 million as of the end of 2006,December 31, 2009, related to approximately 1,530,000218,000 shares with a per share weighted average fair value of $15.93.$17.50. We anticipate this expense to be recognized over a weighted average period of approximately 4.04.3 years.Outstanding and Exercisable by Price Range
As of December 31, 2006
Options Outstanding
Options Exercisable
Range of Exercise prices
Number
outstanding
as of
12/31/2006
Weighted
average
remaining
contractual life
Weighted
average
exercise
price
Number
exercisable
as of
12/31/2006
Weighted
average
exercise price
$8.6667 -$12.2222 1,072,535 1.27 $ 10.98 1,045,669 $ 10.9677 12.3611 - 15.3055 976,976 1.54 $ 15.23 967,192 $ 15.2258 15.5555 - 21.0417 1,720,096 5.18 $ 20.64 1,223,332 $ 20.6330 21.2533 - 29.5400 839,349 6.80 $ 25.53 538,372 $ 25.5261 29.8500 - 34.3750 2,305,717 5.60 $ 31.19 1,609,905 $ 31.5078
$8.6667 - $34.3750 6,914,673 3.94 $ 22.4883 5,384,470 $ 21.5254
Outstanding and Exercisable by Price Range as of December 31, 2009 Options Outstanding Options Exercisable Range of Exercise prices Number outstanding as of 12/31/2009 Weighted average remaining contractual life Weighted average exercise price Number exercisable as of 12/31/2009 Weighted average exercise price $16.08 – $21.95 1,238,441 1.74 $ 20.69 1,188,337 $ 20.71 $22.30 – $29.85 1,257,625 3.90 $ 28.15 1,098,218 $ 28.08 $30.51 – $34.38 1,215,437 0.41 $ 32.02 1,207,019 $ 32.02 $16.08 – $34.38 3,711,503 2.04 $ 26.93 3,493,574 $ 26.94
The weighted average remaining contractual life of options exercisable as of December 31, 20062009 was 3.371.9 years. The aggregate intrinsic value of options outstanding as of December 31, 20062009 was $32.9$9.4 million. The aggregate intrinsic value of options currently exercisable as of December 31, 20062009 was $30.8$8.8 million. No options were granted in the yearyears ended December 31, 20062009, 2008 and 2007 as our incentive option plan terminated in May 2005. The fair value of options granted in 2004 and 2005 were estimated on the date of grant using the Black-Scholes option-pricing model with the following weighted-average assumptions:2005
2004
Dividend expense yield 0.2% 0.2% Expected life 5.5 years 5.5 years Expected volatility 43.3% 53.2% Risk-free interest rate 4.0% 2.7%
Restricted stock plan
Our stockholders approved theour 2005 Incentive Plan on May 10, 2005. At the time of approval, 2,700,000 shares of our common stock were reserved for issuance under this plan, as well as the number of shares which had been reserved but not issued under the 1994 Plan (our incentive stock option plan which terminated in May 2005), and any shares that returned to the 1994 Plan as a result of termination of options or repurchase of shares issued under such plan. The 2005 Plan, administered by the Compensation Committee of the Board of Directors, provides for granting of incentive awards in the form of restricted stock and restricted stock units (“RSUs”) to directors, executive officers and employees of the Company and its subsidiaries. Awards vest over a three, five or ten-year period, beginning on the date of grant. Vesting of ten year awards may accelerate based on the Company’s previous year’s earnings and growth but ten year awards cannot accelerate to vest over a period of less than five years. Shares available for grant at December 31, 20062009 were 3,804,106.2,089,302. As part of the requirements of SFAS 123R, the Company isFASB ASC 718, we are required to estimate potential forfeitures of restricted stock unitsRSUs and adjust compensation cost recorded accordingly. The estimate of forfeitures will be adjusted over the requisite service period to the extent that actual forfeitures differ, or are expected to differ, from such estimates. Changes in estimated forfeitures will be recognized through a cumulative catch-up adjustment in the period of change and will also impact the amount of stock compensation expense to be recognized in future periods.
Transactions under the restricted stock plan2005 Plan are summarized as follows:RSUs
Number of RSUs
Weighted Average Grant Price
Balance at January 1, 2005 0 $ 0.00 Granted 813,305 $ 22.24 Earned 0 $ 0.00 Canceled (15,000 ) $ 22.12
Balance at December 31, 2005 798,305 $ 22.24 Granted 693,805 $ 32.21 Earned (113,794 ) $ 31.67 Canceled (53,383 ) $ 25.93
Balance at December 31, 2006 1,324,933 $ 26.77
RSUs Number of RSUs Weighted Average Grant Price Balance at January 1, 2007 1,324,933 $ 26.77 Granted 801,780 $ 27.90 Earned (209,303 ) $ 27.85 Canceled (75,776 ) $ 27.64 Balance at December 31, 2007 1,841,634 $ 26.86 Granted 763,182 $ 28.51 Earned (320,251 ) $ 29.42 Canceled (119,337 ) $ 28.19 Balance at December 31, 2008 2,165,228 $ 26.99 Granted 604,083 $ 21.80 Earned (407,156 ) $ 22.04 Canceled (57,721 ) $ 27.88 Balance at December 31, 2009 2,304,434 $ 26.48
Total unrecognized stock-based compensation expense related to non-vested restricted stock unitsRSU’s was approximately $32.6$57.1 million as of the end of 2006,December 31, 2009, related to 1,324,9332,304,434 shares with a per share weighted average fair value of $27.24.$26.48. We anticipate this expense to be recognized over a weighted average period of approximately 77.3 years.
Employee stock purchase plan
Our employee stock purchase plan permits substantially all domestic employees and employees of designated subsidiaries to acquire our common stock at a purchase price of 85% of the lower of the market price at the beginning or the end of the participationpurchase period. On December 21, 2005, our Compensation Committee amended theThe plan has quarterly purchase periods to be quarterly beginning on November 1, February 1, May 1, and AugustNovember 1 of each year. The initial period commencedAt our annual shareholders meeting held on April 1, 2006 and ended on July 31, 2006.May 7, 2007, our shareholders approved an additional 3 million shares of common stock to be reserved for issuance under this plan. Employees may designate up to 15% of their compensation for the purchase of common stock.stock under this plan. Common stock reserved for future employee purchases aggregated 823,3091,755,071 shares at December 31, 2006.2009. Shares issued under this plan were 539,541838,536 in the year ended December 31, 2006.2009. The weighted average fair value of the employees’ purchase rights was $22.34$19.05 per share and was estimated using the Black-Scholes model with the following assumptions:2006
2005
2004
Dividend expense yield 0.2% 0.2% 0.2% Expected life 3 months 6 months 6 months Expected volatility 29% 29% 35% Risk-free interest rate 4.5% 3.2% 1.0%
2009 2008 2007 Dividend expense yield 0.5% 0.3% 0.3% Expected life 3 months 3 months 3 months Expected volatility 45% 26% 23% Risk-free interest rate 0.8% 3.8% 5.0%
Weighted average, grant date fair value of purchase rights granted under the Employee Stock Purchase Plan:Number of shares
Weighted average fair value
2004 380,211 $ 7.73 2005 467,932 6.08 2006 539,541 6.62
Plan are as follows:
Numberof shares Weightedaveragefair value 2007 549,719 $ 6.19 2008 679,983 5.86 2009 838,536 5.75
Stock-based compensation included in total cost of sales and operating expenses for the years ended December 31, 2009, 2008 and 2007 are summarized as follows (in thousands):
2009 2008 2007 Stock-based compensation Total cost of sales $ 1,284 $ 1,063 $ 911 Sales and marketing 8,774 8,479 7,322 Research and development 7,236 7,121 6,435 General and administrative 3,005 3,084 2,866 Provision for income taxes (3,765 ) (4,601 ) (3,839 ) Total $ 16,534 $ 15,146 $ 13,695
Authorized Preferred Stock and Preferred Stock Purchase Rights Plan
We have 5,000,000 authorized shares of preferred stock. On January 21, 2004, our Board of Directors designated 750,000 of these shares as Series A Participating Preferred Stock in conjunction with its adoption of a Preferred Stock Rights Agreement (the “Rights Agreement”) and declaration of a dividend of one preferred share purchase right (a “Right”) for each share of common stock outstanding held as of May 10, 2004 or issued thereafter. Each Right will entitle its holder to purchase one one-thousandth of a share of National Instruments’ Series A Participating Preferred Stock at an exercise price of $200, subject to adjustment, under certain circumstances. The Rights Agreement was not adopted in response to any effort to acquire control of National Instruments.
The Rights only become exercisable in certain limited circumstances following the tenth day after a person or group announces acquisitions of or tender offers for 20% or more of our common stock. In addition, if an acquirer (subject to certain exclusions for certain current stockholders of National Instruments, an “Acquiring Person”) obtains 20% or more of our common stock, then each Right (other than the Rights owned by an Acquiring Person or its affiliates) will entitle the holder to purchase, for the exercise price, shares of our common stock having a value equal to two times the exercise price. Under certain circumstances, our Board of Directors may redeem the Rights, in whole, but not in part, at a purchase price of $0.01 per Right. The Rights have no voting privileges and are attached to and automatically traded with our common stock until the occurrence of specified trigger events. The Rights will expire on the earlier of May 10, 2014 or the exchange or redemption of the Rights. Comprehensive income
Our comprehensive income is comprised of net income, foreign currency translation and unrealized gains and losses on forward and option contracts and securities available for sale. Comprehensive income for 2006, 2005 and 2004 was $76.9 million, $57.2 million and $57.7 million, respectively.
Recently issued accounting pronouncements
In July 2006, the Financial Accounting Standards Board (“FASB”) issued FASB Interpretation (“FIN”) 48,Accounting for Uncertainty in Income Taxes – an interpretation of Statement of Financial Accounting Standards (“SFAS”) 109. This interpretation clarifies the accounting for uncertainty in income taxes recognized in an entity’s financial statements in accordance with SFAS 109,Accounting for Income Taxes. It prescribes a recognition threshold and measurement attribute for financial statement disclosure of tax positions taken or expected to be taken on a tax return. This interpretation is effective for fiscal years beginning after December 15, 2006. We adopted FIN 48 on January 1, 2007 as required. The cumulative effect of adopting FIN 48 was recorded in retained earnings upon adoption. The adoption of FIN 48 did not have a significant impact on our financial position or results of operations.
In September 2006, the Securities and Exchange Commission (“SEC”) issued Staff Accounting Bulletin (“SAB”) 108 regarding the process of quantifying financial statement misstatements. SAB 108 states that registrants should use both a balance sheet approach and an income statement approach when quantifying and evaluating the materiality of a misstatement. The interpretations in SAB 108 contain guidance on correcting errors under the dual approach as well as provide transition guidance for correcting errors. This interpretation does not change the requirements within SFAS 154,Accounting Changes and Error Corrections – a replacement of APB 20 and FASB Statement 3, for the correction of an error on financial statements. SAB 108 is effective for annual financial statements covering the first fiscal year ending after November 15, 2006. We adopted this interpretation on December 31, 2006. The adoption of SAB 108 did not have a significant effect on our consolidated financial statements.
In September 2006, the FASB issued SFAS 157,Fair Value Measurements. This standard defines fair value, establishes a framework for measuring fair value in accounting principles generally accepted in the United States of America, and expands disclosure about fair value measurements. This pronouncement applies under other accounting standards that require or permit fair value measurements. Accordingly, this statement does not require any new fair value measurement. This statement is effective for fiscal years beginning after November 15, 2007, and interim periods within those fiscal years. We will be required to adopt SFAS 157 in the first quarter of fiscal year 2008. We are currently evaluating the requirements of SFAS 157 and have not yet determined the impact on our consolidated financial statements.
In March 2006, the Emerging Issues Task Force (“EITF”) reached a consensus on EITF Issue 06-3,How Taxes Collected from Customers and Remitted to Governmental Authorities Should Be Presented in the Income Statement (that is, Gross versus Net Presentation). Taxes within the scope of EITF Issue 06-3 include any taxes assessed by a governmental authority that are directly imposed on a revenue-producing transaction between a seller and a customer and may include, but are not limited to, sales taxes, use taxes, value-added taxes, and some excise taxes. The EITF concluded that the presentation of these taxes on either a gross (included in revenues and costs) or a net (excluded from revenue) basis is an accounting policy decision that should be disclosed. For any such taxes that are reported on a gross basis, a company should disclose the amounts of those taxes in interim and annual financial statements. Our policy is to exclude all such taxes from revenue. The provisions of EITF 06-3 are effective for interim and annual reporting periods beginning after December 15, 2006. The adoption of EITF 06-3 will not have any effect on our consolidated financial statements.
Note 2: Short-term investments
Short-term investments at December 31, 2006 and 2005, consisting of corporate, state and municipal securities, were acquired at an aggregate cost of $150.2 million and $119.8 million, respectively. The contractual maturities of these securities, which are classified as available-for-sale and carried at fair value, are as follows (in thousands):
December 31,
2006
2005
Less than 90 days $ 73,787 $ 61,855 90 days to one year 31,309 42,222 One year through two years 38,559 11,877 Two years or more 6,535 3,892
$ 150,190 $ 119,846
Note 3: Inventories
Inventories, net consist of the following (in thousands):
December 31,
2006
2005
Raw materials $ 38,270 $ 28,497 Work-in-process 4,321 4,634 Finished goods 34,547 29,696
$ 77,138 $ 62,827
Note 4: Property and equipment
Property and equipment consist of the following (in thousands):
December 31,
2006
2005
Land $ 7,165 $ 7,085 Buildings 125,228 124,428 Furniture and equipment 110,710 91,073
243,103 222,586 Accumulated depreciation (97,678 ) (78,256 )
$ 145,425 $ 144,330
Depreciation expense for the years ended December 31, 2006, 2005 and 2004, was $20.2 million, $17.8 million and $17.3 million, respectively.
Note 5: Intangibles
Intangibles at December 31, 2006 and 2005 are as follows:
2006
2005
Gross Carrying Amount
Accumulated Amortization
Net Carrying Amount
Gross Carrying Amount
Accumulated Amortization
Net Carrying Amount
Capitalized software development costs $ 57,571 $ (41,791 ) $ 15,780 $ 50,201 $ (32,651 ) $ 17,550 Acquired technology 20,814 (9,734 ) 11,080 20,257 (6,296 ) 13,961 Patents 12,928 (3,076 ) 9,852 11,647 (2,445 ) 9,202 Other 6,452 (3,099 ) 3,353 4,826 (1,937 ) 2,889
$ 97,765 $ (57,700 ) $ 40,065 $ 86,931 $ (43,329 ) $ 43,602
Software development costs capitalized during 2006, 2005 and 2004 were $7.4 million, $13.4 million and $5.0 million, respectively, and related amortization was $9.1 million, $7.2 million and $6.6 million, respectively. Amortization of capitalized software development costs is computed on an individual product basis for those products available for market and is recognized based on the product’s estimated economic life, generally three years. Patents are amortized using the straight-line method over their estimated period of benefit, generally ten to seventeen years. Total intangible assets amortization expenses were $13.9 million, $10.7 million and $8.3 million for the years ended December 31, 2006, 2005 and 2004, respectively.
Capitalized software development costs, acquired technology, patents and other have weighted-average useful lives of 2.1 years, 4.1 years, 7.7 years and 3.7 years, respectively, as of the end of December 31, 2006. The estimated future amortization expense related to intangible assets as of December 31, 2006 is as follows:
Amount (in thousands)
2007 $ 13,044 2008 10,219 2009 5,046 2010 2,477 2011 1,569 Thereafter 7,710
$ 40,065
We established a valuation reserve in 2004 for the estimated total impairment of our $2.5 million cost-method investment in a start-up company. This impairment was based on our lack of expected recovery of our investment based on the start-up company’s lack of profitability.
Note 6: Goodwill
The carrying amount of goodwill for 2005 and 2006 are as follows:
Amount (in thousands)
Balance as of December 31, 2004 $ 13,356 Acquisitions/purchase accounting adjustments 39,177 Divestitures —
Balance as of December 31, 2005 52,533 Acquisitions/purchase accounting adjustments — Divestitures — Foreign currency translation impact 810
Balance as of December 31, 2006 $ 53,343
The excess purchase price over the fair value of assets acquired is recorded as goodwill. In accordance with SFAS 142,Goodwill and Other Intangible Assets, goodwill is tested for impairment on an annual basis, and between annual tests if indicators of potential impairment exist, using a fair-value-based approach. Our annual impairment test was performed on April 6, 2006. No impairment of goodwill was identified during any of the periods presented.
Note 7: Income taxes
The components of income before income taxes are as follows (in thousands):
Years Ended December 31,
2006
2005
2004
Domestic $ 40,681 $ 40,460 $ 37,786 Foreign 54,621 40,220 27,027
$ 95,302 $ 80,680 $ 64,813
The provision for income taxes charged to operations is as follows (in thousands):
Years Ended December 31,
2006
2005
2004
Current tax expense: U.S. federal $ 17,966 $ 11,022 $ 10,594 State 901 1,029 1,106 Foreign 5,190 3,725 3,300
Total current 24,057 15,776 15,000
Deferred tax expense (benefit): U.S. federal (1,233 ) 2,396 1,041 State (90 ) (102 ) 121 Foreign (140 ) 1,093 41
Total deferred (1,463 ) 3,387 1,203
Total provision $ 22,594 $ 19,163 $ 16,203
Deferred tax liabilities (assets) at December 31, 2006 and 2005 as follows (in thousands):
December 31,
2006
2005
Capitalized software $ 5,392 $ 6,288 Unrealized gain on derivative instruments — 86 Depreciation and amortization 9,071 8,598 Unrealized exchange gain 2 1,238 Undistributed earnings of foreign subsidiaries 10,313 4,410
Gross deferred tax liabilities 24,778 20,620
Operating loss carryforwards (34,154 ) (22,672 ) Intangibles (85,684 ) (71,125 ) Vacation and other accruals (3,783 ) (2,946 ) Inventory valuation and warranty provisions (6,666 ) (9,043 ) Doubtful accounts and sales provisions (1,328 ) (1,545 ) Intercompany profit (3,242 ) (2,442 ) Deferred revenue (2,613 ) — Accrued rent expenses (17 ) (17 ) Accrued legal expenses (1,450 ) (12 ) Unrealized loss on derivative instruments (149 ) — 10% minority stock investment (906 ) (911 ) Stock-based compensation (1,954 ) (563 ) Other (691 ) (629 )
Gross deferred tax assets (142,637 ) (111,905 )
Valuation allowance 117,768 91,534
Net deferred tax liability (asset) $ (91 ) $ 249
A reconciliation of income taxes at the U.S. federal statutory income tax rate to the effective tax rate follows:
Years Ended December 31,
2006
2005
2004
U.S. federal statutory tax rate 35 % 35 % 35 % Foreign sales corporation/ETI benefit (1 ) (2 ) (3 ) Domestic production activities (1 ) (1 ) — Foreign taxes more (less) than federal statutory rate (11 ) (7 ) (6 ) Change in valuation allowance — (1 ) — Research and development tax credit (1 ) (1 ) (1 ) Tax exempt interest (1 ) (1 ) (1 ) State income taxes, net of federal tax benefit 1 1 1 Employee share-based compensation 3 — — Other — 1 —
Effective tax rate 24 % 24 % 25 %
As of December 31, 2006, thirteen of our subsidiaries have available, for income tax purposes, foreign net operating loss carryforwards of an aggregate of approximately $214.4 million, of which $8.5 million expire during the years 2008 — 2013 and $205.9 million of which may be carried forward indefinitely. Our tax valuation allowance relates to the realizability of certain of these foreign net operating loss carryforwards and benefits of tax deductible goodwill in excess of book goodwill.
We maintain a manufacturing facility in Hungary. As a result of certain foreign investment incentives available under Hungarian law, the profit from our Hungarian operation is currently subject to a reduced income tax rate. Based on our capital investment in Hungary and current exemption limits which apply to this and any capital investments made through December 31, 2005, we currently expect this special tax status will terminate on or before December 31, 2008. The aggregate tax benefit of the exemption was $5.4 million and $3.4 million for the years ended December 31, 2006 and 2005, respectively.
In 2003, we restructured the organization of our manufacturing operation in Hungary. The tax deductible goodwill in excess of book goodwill created by this restructuring resulted in our being required to record a gross deferred tax asset of $91.0 million. The amortization of this excess tax deductible goodwill resulted in a $32.1 million and $20.1 million deferred tax asset for the associated net operating loss for the years ended December 31, 2006 and 2005, respectively. As of December 31, 2006 and 2005, the gross deferred tax asset related to the excess tax goodwill was $85.7 million and $71.1 million, respectively. Because we do not expect to have significant taxable income in the relevant jurisdiction in future periods to realize the benefit of these deferred tax assets, a valuation allowance for the entire amount of these deferred tax assets has been established.
We have not provided for U.S. federal income and foreign withholding taxes on approximately $111.8 million of certain non-U.S. subsidiaries’ undistributed earnings as of December 31, 2006. These earnings would become subject to taxes of approximately $36.5 million, if they were actually or deemed to be remitted to the parent company as dividends or if we should sell our stock in these subsidiaries. We currently intend to reinvest indefinitely these undistributed earnings.
Note 8: Stockholders’ equity
Stock repurchases and retirements In
Since 1998, our Board of Directors approved theand we maintained various stock repurchase and retirement of shares of common stock to reduce the dilutive effect of our stock plans.programs. Pursuant to the 1998 repurchase programthese plans we have repurchasedhad purchased and retired a total of 1,402,7257,354,966 shares for approximately $23.1$184.9 million from 1998 through December 31, 2007. During 2008, we purchased an additional 4,110,042 share for approximately $103.6 million. In 2002,At December 31, 2008, there were 723,092 shares available for repurchase under the plan approved in April 2008. On January 23, 2009, our Board of Directors approved a new share repurchase and retirement plan which replacedthat increased the 1998 plan. Underaggregate number of shares of common stock we are authorized to purchase from 591,324 to 3.0 million. During 2009, we purchased an additional 1,443,441 shares for approximately $34.6 million. At December 31, 2009, there were 1,688,327 shares available for repurchase under the plan approved in 2002, weJanuary 2009. Our share repurchase plan does not have authorization to repurchase up to 6,222,106 shares of National Instruments stock. This plan has noan expiration date. Pursuant to our repurchase program, we have repurchased and retired a total of 3,222,106 shares for approximately $82.0 million.
Note 9:11 – Employee retirement plan
We have a defined contribution retirement plan pursuant to Section 401(k) of the Internal Revenue Code. Substantially all domestic employees with at least thirty30 days of continuous service are eligible to participate and may contribute up to 15% of their compensation. The Board of Directors has elected to make matching contributions equal to 50% of employee contributions, which may be applied to a maximum of 6% of each participant’s compensation. Employees are eligible for our matching contributions after one year of continuous service. Company contributions vest immediately. Our policy prohibits participants from direct investment in shares of our common stock within the plan. Company contributions charged to expense were $3.0$3.9 million, $2.6$3.7 million and $2.4$3.3 million in 2006, 20052009, 2008 and 2004,2007, respectively.
Fair value of financial instrumentsIn accordance with FASB ASC 280, Segment Reporting (FASB ASC 280), we determine operating segments using the management approach. The estimated fair value amounts disclosed below have been determined using available market informationmanagement approach designates the internal organization that is used by management for making operating decisions and valuation methodologies described below. For certainassessing performance as the source of our financial instruments, including cashoperating segments. It also requires disclosures about products and cash equivalents, accounts receivable, accounts payableservices, geographic areas and accrued liabilities,major customers.
We have defined our operating segment based on geographic regions. We sell our products in three geographic regions. Our sales to these regions share similar economic characteristics, similar product mix, similar customers, and similar distribution methods. Accordingly, we have elected to aggregate these three geographic regions into a single operating segment. Revenue from the carrying amount approximates fair value due to the short-term maturity of these instruments. The estimated fair values of the other assets (liabilities)sale of our remaining financial instruments at December 31, 2006products which are similar in nature and 2005software maintenance are reflected as total net sales in our Consolidated Statements of Income.
Total net sales, operating income, interest income and long-lived assets, classified by the major geographic areas in which we operate, are as follows (in thousands):December 31,
2006
2005
Carrying
Amount
Fair
Value
Carrying
Amount
Fair
Value
Short-term investments $ 150,190 $ 150,190 $ 119,846 $ 119,846 Other assets/liabilities: Forward contracts (1,043 ) (1,043 ) 523 523
The fair values of short-term investments
Years Ended December 31, 2009 2008 2007 Net sales: Americas: Unaffiliated customer sales $ 292,999 $ 355,878 $ 331,482 Geographic transfers 86,145 132,563 115,709 379,144 488,441 447,191 Europe: Unaffiliated customer sales 210,188 267,373 230,940 Geographic transfers 189,076 204,282 159,992 399,264 471,655 390,932 Asia Pacific: Unaffiliated customer sales 173,407 197,286 177,956 Eliminations (275,221 ) (336,845 ) (275,701 ) $ 676,594 $ 820,537 $ 740,378
Years Ended December 31, 2009 2008 2007 Operating income: Americas $ 46,816 $ 71,467 $ 76,292 Europe 87,250 105,748 92,469 Asia Pacific 45,439 61,642 59,845 Unallocated: Research and development expenses (132,974 ) (143,140 ) (126,515 ) $ 46,531 $ 95,717 $ 102,091
Years Ended December 31, 2009 2008 2007 Interest income: Americas $ 803 $ 2,603 $ 5,138 Europe 727 3,291 4,485 Asia Pacific 99 102 199 $ 1,629 $ 5,996 $ 9,822
December 31, 2009 2008 Long-lived assets: Americas $ 100,489 $ 107,701 Europe 36,555 39,280 Asia Pacific 16,221 7,496 $ 153,265 $ 154,477
Total sales outside the United States for 2009, 2008 and foreign currency forward contracts2007 were estimated based upon quotes from brokers as of the applicable balance sheet date.$412.7 million, $499.3 million and $437.0 million, respectively.
Note 11: Derivative instruments13 – Commitments, contingencies and hedging activitiesleases
We have operations in 40 countries. Approximately 52% of our revenues are generated outsidecommitments under non-cancelable operating leases primarily for office facilities throughout the Americas. Our activities exposeworld. Certain leases require us to a varietypay property taxes, insurance and routine maintenance, and include escalation clauses. Future minimum lease payments as of market risks, includingDecember 31, 2009, for each of the effects of changes in foreign-currency exchange rates. These financial risksnext five years are monitored and managed by us as an integral part of our overall risk management program. We maintain a foreign-currency risk management strategy that uses derivative instruments (foreign currency forward and purchased options contracts) to protect our earnings and cash flows from fluctuations caused by the volatility in currency exchange rates. Movements in foreign-currency exchange rates pose a risk to our operations and competitive position, since exchange rate changes may affect our profitability and cash flow, and the business or pricing strategies of our non-U.S. based competitors.
Foreign currency fair value and cash flow hedges
The vast majority of our foreign sales are denominated in the customers’ local currency. We purchase foreign currency forward and purchased options contracts as hedges of forecasted sales that are denominated in foreign currencies and as hedges of foreign currency denominated receivables. These contracts are entered into to protect against the risk that the eventual dollar-net-cash inflows resulting from such sales or firm commitments will be adversely affected by changes in exchange rates.
We held forward contracts with notional amounts totaling $19.6follows (in thousands):
2010 $ 14,415 2011 9,898 2012 6,982 2013 4,611 2014 3,665 Thereafter 12,130 $ 51,701
Rent expense under operating leases was approximately $12.3 million, $11.7 million and $24.1$10.2 million at December 31, 2006 and 2005, respectively, that were designated as foreign currency fair value hedges of our foreign denominated receivables. The fair value of these contracts, which are for 90-day periods, is a liability of $617,000 and a receivable of $278,000 at December 31, 2006 and 2005, respectively. We recorded net losses of $1.0 million, net gains of $2.2 million and net losses of $2.6 million for fair value hedges for the years ended December 31, 2006, 20052009, 2008 and 2004, respectively, which was recorded2007, respectively.
As of December 31, 2009, we have non-cancelable purchase commitments with various suppliers of customized inventory and inventory components totaling approximately $6.5 million over the next twelve months.
As of December 31, 2009, we have outstanding guarantees for payment of customs and foreign grants totaling approximately $5.2 million.
Note 14 – Litigation
We filed a patent infringement action on January 25, 2001, in “Foreign Exchange Gain (Loss).” We hedge up to 90%the U.S. District Court, Eastern District of Texas (Marshall Division) claiming that The MathWorks, Inc. (“MathWorks”) infringed certain of our outstanding foreign denominated receivables. We held forward contracts withU.S. patents. On January 30, 2003, a notionaljury found infringement by MathWorks of three of the patents involved and awarded us specified damages. On September 23, 2003, the District Court entered final judgment in favor of us and entered an injunction against MathWorks’ sale of its Simulink and related products and stayed the injunction pending appeal. Upon appeal, the judgment and the injunction were affirmed by the U.S. Court of Appeals for the Federal Circuit (September 3, 2004). Subsequently the stay of injunction was lifted by the District Court. In November 2004, the final judgment amount of $26.6$7.4 million which had been held in escrow pending appeal was released to us.
An action was filed by MathWorks against us on September 22, 2004, in the U.S. District Court, Eastern District of Texas (Marshall Division), claiming that on that day MathWorks had released modified versions of its Simulink and $7.1related products, and seeking a declaratory judgment that the modified products do not infringe the three patents adjudged infringed in the District Court's decision of September 23, 2003 (and affirmed by the Court of Appeals on September 3, 2004). On November 2, 2004, MathWorks served the complaint on us. We filed an answer to MathWorks’ declaratory judgment complaint, denying MathWorks’ claims of non-infringement and alleging our own affirmative defenses. On January 5, 2005, the Court denied a contempt motion by us to enjoin the modified Simulink products under the injunction in effect from the first case. On January 7, 2005, we amended our answer to include counterclaims that MathWorks’ modified products are infringing three of our patents, and requested unspecified damages and an injunction. MathWorks filed its reply to our counterclaims on February 7, 2005, denying the counterclaims and alleging affirmative defenses. On March 2, 2005, we filed a notice of appeal regarding the Court's denial of the contempt motion. On March 15, 2005, the Court stayed MathWorks’ declaratory judgment action, pending a decision on the appeal by the Court of Appeals for the Federal Circuit. On February 9, 2006, the Court of Appeals for the Federal Circuit affirmed the District Court’s January 2005 order. On November 22, 2006, the District Court lifted the stay. The case schedule has yet to be set in this action. During the fourth quarter of 2004, we accrued $4 million at December 31, 2006 and 2005, respectively, that were designated as foreign currency cash flow hedges related to our probable loss from this contingency, which consists entirely of anticipated sales transactions.patent defense costs that are probable of being incurred. In the fourth quarter of 2006, we accrued an additional $600,000 related to this contingency. During the third quarter of 2009, we reduced the accrual by $2 million to reflect a decrease in the estimated costs that are probable of being incurred in this action. To date, we have charged a cumulative total of $623,000 against this accrual. At December 31, 2009, the remaining accrual was $2 million.
On February 1, 2008, we acquired all of the outstanding shares of microLEX Systems ApS, (“microLEX”) a premier provider of virtual instrumentation-based video, audio and mixed-signal test solutions. This acquisition was accounted for as a business combination. The purchase price of the acquisition, which included legal and accounting fees, was $17.8 million in cash. The allocation of the purchase price was determined using the fair value of these contracts, whichassets and liabilities acquired as of February 1, 2008. We funded the purchase price from existing cash balances. Our consolidated financial statements include the operating results from the date of acquisition. Pro-forma results or operations have not been presented because the effects of those operations were not material. The following table summarizes the allocation of the purchase price of microLEX (in thousands):
Goodwill $ 10,818 Acquired core technology 5,201 Non-competition agreements 159 Trademarks 119 Customer relationships 354 Current assets acquired 3,057 Long-term assets acquired 20 Current liabilities assumed (486 ) Deferred tax liabilities (1,458 ) Total assets acquired $ 17,784
Goodwill is not deductible for tax purposes. Existing technology, non-competition agreements, trademarks, and customer relationships have useful lives of 5 years, 3 years, 3 years, and 5 years, respectively, from the date of acquisition. These assets are not deductible for terms uptax purposes.
Note 16 – Quarterly results (unaudited)
The following quarterly results have been derived from unaudited consolidated financial statements that, in the opinion of management, reflect all adjustments (consisting only of normal recurring adjustments) necessary for a fair presentation of such quarterly information. The operating results for any quarter are not necessarily indicative of the results to twelve months, is a liabilitybe expected for any future period. The unaudited quarterly financial data for each of $427,000 and a receivable of $245,000 at December 31, 2006 and 2005, respectively, and a net unrealized deferred loss of $427,000 and a net unrealized deferred gain of $245,000 at December 31, 2006 and 2005, respectively, was recordedthe eight quarters in “Accumulated Other Comprehensive Income.” We hedge up to 100% of anticipated foreign currency denominated sales transactions for up to 40 months. We recorded net losses of $1.0 million and net gains of $105,000 and net losses of $5.8 million for cash flow hedges for the two years ended December 31, 2006, 2005 and 2004, respectively, which was included in “Net Sales.” As of December 31, 2006, $427,000 of deferred losses on cash flow hedges recorded in “Accumulated Other Comprehensive Income” are expected to be reclassified to earnings during the next twelve months. The actual foreign sales expected to occur over the next twelve months will necessitate the reclassifying to earnings of these derivative gains.
Hedge effectiveness of a foreign currency option contract designated as a cash flow hedge is measured by comparing the hedging instrument’s cumulative change in fair value from inception to maturity to the forecasted transaction’s terminal value. No amounts were excluded from the assessment of hedge effectiveness nor were there any amounts of ineffectiveness recorded in the consolidated statements of income for the years ended December 31, 2006 and 2005.
Note 12: Segment information
In accordance with SFAS 131,Disclosures about Segments of an Enterprise and Related Information, we determine operating segments using the management approach. The management approach designates the internal organization that is used by management for making operating decisions and assessing performance as the source of our operating segments. It also requires disclosures about products and services, geographic areas and major customers.
While we sell our products to many different markets, management has chosen to organize the Company by geographic areas, and as a result has determined that we have one operating segment. Substantially all of the interest income, depreciation and amortization is recorded in the Americas. Net sales, operating income and identifiable assets, classified by the major geographic areas in which we operate,2009 are as follows (in thousands)thousands, except per share data):
Years Ended December 31,
2006
2005
2004
Net sales: Americas: Unaffiliated customer sales $ 317,780 $ 275,524 $ 243,651 Geographic transfers 125,096 87,072 84,520
442,876 362,596 328,171
Europe: Unaffiliated customer sales 193,364 171,499 164,895 Geographic transfers 159,369 125,650 99,958
352,733 297,149 264,853
Asia Pacific: Unaffiliated customer sales 149,263 124,818 105,542
Eliminations (284,465 ) (212,722 ) (184,478 )
$ 660,407 $ 571,841 $ 514,088
Years Ended December 31,
2006
2005
2004
Operating income: Americas $ 67,644 $ 63,267 $ 53,472 Europe 78,402 61,790 55,705 Asia Pacific 54,771 40,996 38,211 Unallocated: Research and development expenses (113,095 ) (87,841 ) (84,692 )
$ 87,722 $ 78,212 $ 62,696
December 31,
2006
2005
Identifiable assets: Americas $ 476,027 $ 436,170 Europe 188,388 129,420 Asia Pacific 56,805 42,746
$ 721,220 $ 608,336
Total sales outside
Three Months Ended Mar. 31,2009 Jun. 30,2009 Sep. 30,2009 Dec. 31,2009 Net sales $ 157,799 $ 152,163 $ 165,035 $ 201,597 Gross profit 116,916 111,677 123,136 154,981 Operating income (2,479 ) 2,341 10,688 35,981 Net income 358 4,430 9,931 2,366 Basic earnings per share $ 0.00 $ 0.06 $ 0.13 $ 0.03 Weighted average shares outstanding-basic 77,277 77,556 77,653 77,589 Diluted earnings per share $ 0.00 $ 0.06 $ 0.13 $ 0.03 Weighted average shares outstanding-diluted 77,436 77,824 78,103 78,325 Dividends declared per share $ 0.12 $ 0.12 $ 0.12 $ 0.12
Three Months Ended Mar. 31,2008 Jun. 30,2008 Sep. 30,2008 Dec. 31,2008 Net sales $ 192,918 $ 210,474 $ 215,038 $ 202,107 Gross profit 143,849 157,034 160,531 152,014 Operating income 18,065 27,834 27,946 21,872 Net income 17,616 24,734 23,159 19,318 Basic earnings per share $ 0.22 $ 0.32 $ 0.29 $ 0.25 Weighted average shares outstanding-basic 78,840 78,484 78,834 78,110 Diluted earnings per share $ 0.22 $ 0.31 $ 0.29 $ 0.25 Weighted average shares outstanding-diluted 79,825 79,549 79,841 78,522 Dividends declared per share $ 0.11 $ 0.11 $ 0.11 $ 0.11
Note 17 – Subsequent events
In accordance with FASB ASC 855, Subsequent Events (FASB ASC 855), we have evaluated subsequent events through February 17, 2010, the United States for 2006, 2005 and 2004date the financial statements were $373.7 million, $323.9 million and $293.3 million, respectively.issued.
On January 22, 2010, our Board of Directors declared a quarterly cash dividend of $0.13 per common share, payable March 1, 2010, to shareholders of record on February 8, 2010.
From January 29, 2010 to February 12, 2010, we have repurchased 683,832 shares of our common stock at an average price of $29.97 under our share repurchase plan. The maximum number of shares that may yet be purchased under our plan is 1,004,495. Our purchase plan does not have an expiration date.
Note 13: Commitments, contingencies and leases
We have commitments under non-cancelable operating leases primarily for office facilities. Certain leases require us to pay property taxes, insurance and routine maintenance, and include escalation clauses. Future minimum lease payments as of December 31, 2006, for each of the next five years are as follows (in thousands):
2007 $ 7,241 2008 5,682 2009 4,883 2010 3,103 2011 1,983 Thereafter 799
$ 23,691
Rent expense under operating leases was approximately $8.7 million, $7.8 million and $6.5 million for the years ended December 31, 2006, 2005 and 2004, respectively.
As of December 31, 2006, we have non-cancelable purchase commitments with various suppliers of customized inventory and inventory components totaling approximately $7.0 million over the next twelve months.
As of December 31, 2006, we have outstanding guarantees for payment of customs and foreign grants totaling approximately $3.5 million.
Note 14: ��Litigation
We filed a patent infringement action on January 25, 2001 in the U.S. District Court, Eastern District of Texas (Marshall Division) claiming that The MathWorks, Inc. (“MathWorks”) infringed certain of our U.S. patents. On January 30, 2003, a jury found infringement by MathWorks of three of the patents involved and awarded us specified damages. On June 23, 2003, the District Court entered final judgment in favor of us and entered an injunction against MathWorks’ sale of its Simulink and related products and stayed the injunction pending appeal. Upon appeal, the judgment and the injunction were affirmed by the U.S. Court of Appeals for the Federal Circuit (September 3, 2004). Subsequently the stay of injunction was lifted by the District Court. In November 2004, the final judgment amount of $7.4 million which had been held in escrow pending appeal was released to us.
An action was filed by MathWorks against us on September 22, 2004, in the U.S. District Court, Eastern District of Texas (Marshall Division), claiming that on that day MathWorks had released modified versions of its Simulink and related products, and seeking a declaratory judgment that the modified products do not infringe the three patents adjudged infringed in the District Court’s decision of June 23, 2003, (and affirmed by the Court of Appeals on September 3, 2004). On November 2, 2004, MathWorks served the complaint on us. We filed an answer to MathWorks’ declaratory judgment complaint, denying MathWorks’ claims of non-infringement and alleging our own affirmative defenses. On January 5, 2005, the Court denied a contempt motion by us to enjoin the modified Simulink products under the injunction in effect from the first case. On January 7, 2005, we amended our answer to include counterclaims that MathWorks’ modified products are infringing three of our patents, and requested unspecified damages and an injunction. MathWorks filed its reply to our counterclaims on February 7, 2005, denying the counterclaims and alleging affirmative defenses. On March 2, 2005, we filed a notice of appeal regarding the Court’s denial of the contempt motion. On March 15, 2005, the Court stayed MathWorks’ declaratory judgment action, pending a decision on the appeal by the Court of Appeals for the Federal Circuit. On February 9, 2006, the Court of Appeals for the Federal Circuit affirmed the District Court’s January 2005 order. On November 22, 2006, the District Court lifted the stay. The case schedule has yet to be set in this action. During the fourth quarter of 2004, we accrued $4 million related to our probable loss from this contingency, which consists entirely of anticipated patent defense costs that are probable of being incurred. In the fourth quarter of 2006, we accrued an additional $600,000 related to this contingency. We charged approximately $57,000 against this accrual during the fourth quarter of 2006. We have charged a total of $602,000 against this accrual through December 31, 2006.
Note 15: Acquisitions
On January 31, 2005, we acquired all of the common stock of Toronto, Canada-based Electronics Workbench, a supplier of electronics design automation software. The acquisition was accounted for as a purchase. The purchase price of the acquisition, subject to adjustment as provided for in the purchase agreement, was $12.1 million in cash. We funded the purchase price from existing cash balances. Our consolidated financial statements include the operating results from the date of acquisition. Pro-forma results of operations have not been presented because the effects of those operations were not material. In accordance with SFAS 141, Business Combinations, the total purchase consideration has been allocated to the assets acquired and liabilities assumed, including identifiable intangible assets, based on their respective estimated fair values at the date of acquisition.
On April 29, 2005, we acquired the operating assets of Measurement Computing Corporation (MCC), a provider of low-cost data acquisition products. The acquisition was accounted for as a purchase. We acquired the operating assets of MCC, which included the legal positions of MCC and SoftWIRE in litigation against us. As a result of the asset acquisition, a pending legal action was dismissed with prejudice and we eliminated our remaining $1.9 million accrual for patent defense costs related to MCC. The gain that resulted from the elimination of the accrual was recorded in general and administrative expenses. The purchase price of the acquisition, subject to adjustment as provided for in the purchase agreement, was $33.2 million in cash. We funded the purchase price from existing cash balances. Our consolidated financial statements include the operating results from the date of acquisition. Pro-forma results of operations have not been presented because the effects of those operations were not material. In accordance with SFAS 141, the total purchase consideration has been allocated to the assets acquired and liabilities assumed, including identifiable assets, based on their respective estimated fair values at the date of acquisition.
On October 17, 2005, we acquired the operating assets of IOtech, Inc., a provider of PC-based data acquisition and instrumentation products. The acquisition was accounted for as a purchase. The purchase price of the acquisition, subject to adjustment as provided for in the purchase agreement, was $17.6 million in cash. We funded the purchase price from existing cash balances. Our consolidated financial statements include the operating results from the date of acquisition. Pro-forma results of operations have not been presented because the effects of those operations were not material. In accordance with SFAS 141, the total purchase consideration has been allocated to the assets acquired and liabilities assumed, including identifiable assets, based on their respective estimated fair values at the date of acquisition.
Goodwill is deductible for tax purposes. Goodwill is not amortized but is reviewed periodically for impairment. Acquired core technology and intangible assets are amortized over their useful lives, which range from three to eight years. Amortization expense for intangible assets acquired was approximately $3.2 million and $2.0 million for 2006 and 2005, respectively, of which approximately $2.7 million and $1.5 million was recorded in cost of sales and approximately $490,000 and $490,000 was recorded in operating expenses. The estimated amortization expense of intangible assets acquired for the current fiscal year and in future years will be recorded in the consolidated statements of income as follows (in thousands):
Fiscal Year
Cost of Sales
Acquisition related costs and amortization, net
Total
2007 $ 2,689 $ 450 $ 3,139 2008 2,532 412 2,944 2009 2,259 338 2,597 2010 1,725 177 1,902 Thereafter 1,166 271 1,437
Total $ 10,371 $ 1,648 $ 12,019
Note 16: Related party transactions
During 2002, we contributed approximately $3.6 million to the National Instruments Foundation, a 501(c)(3) charitable foundation established in 2002 for the purpose of continued promotion of scientific and engineering research and education at higher education institutions worldwide. This contribution was recorded as general and administrative expense in 2002. Two of the four directors of the National Instruments Foundation are current officers of National Instruments.
Note 17: Quarterly results (unaudited)
The following quarterly results have been derived from unaudited consolidated financial statements that, in the opinion of management, reflect all adjustments (consisting only of normal recurring adjustments) necessary for a fair presentation of such quarterly information. The operating results for any quarter are not necessarily indicative of the results to be expected for any future period. The unaudited quarterly financial data for each of the eight quarters in the two years ended December 31, 2006 are as follows (in thousands, except per share data):
Three Months Ended
Mar. 31, 2006
Jun. 30, 2006
Sep. 30, 2006
Dec. 31, 2006
Net sales $ 154,752 $ 160,123 $ 164,079 $ 181,453 Gross profit 113,247 119,271 121,648 135,915 Operating income 15,826 20,911 22,367 28,616 Net income 12,602 17,021 18,651 24,434 Basic earnings per share $ 0.16 $ 0.21 $ 0.23 $ 0.31 Weighted average shares outstanding-basic 79,053 79,611 79,637 79,767 Diluted earnings per share $ 0.15 $ 0.21 $ 0.23 $ 0.30 Weighted average shares outstanding-diluted 81,608 81,653 81,274 81,524 Dividends declared per share $ 0.06 $ 0.06 $ 0.06 $ 0.06
Three Months Ended
Mar. 31, 2005
Jun. 30, 2005
Sep. 30, 2005
Dec. 31, 2005
Net sales $ 129,740 $ 140,822 $ 141,618 $ 159,661 Gross profit 97,376 104,109 103,725 117,322 Operating income 14,182 19,093 18,343 26,594 Net income 11,136 15,024 14,399 20,958 Basic earnings per share $ 0.14 $ 0.19 $ 0.18 $ 0.27 Weighted average shares outstanding-basic 79,175 78,303 78,158 78,505 Diluted earnings per share $ 0.14 $ 0.19 $ 0.18 $ 0.26 Weighted average shares outstanding-diluted 81,924 80,190 80,575 80,821 Dividends declared per share $ 0.05 $ 0.05 $ 0.05 $ 0.05
Note 18: Subsequent Event
On January 30, 2007, our Board of Directors declared a quarterly cash dividend of $0.07 per common share, payable March 5, 2007, to shareholders of record on February 12, 2007.
On January 30, 2007, our Board of Directors granted authorization for the repurchase of an additional 1,522,106 shares of our common stock under our share repurchase plan.
SCHEDULE II
NATIONAL INSTRUMENTS CORPORATION
VALUATION AND QUALIFYING ACCOUNTS
(In thousands)
Allowance for doubtful accounts and sales returns:
Year
Description
Balance at Beginning of Period
Provision for Bad Debt Expense
Write-Offs Charged to Allowances
Balance at End of Period
2004 Allowance for doubtful accounts and sales returns $ 3,244 $ 596 $ 329 $ 3,511 2005 Allowance for doubtful accounts and sales returns 3,511 1,462 239 4,734 2006 Allowance for doubtful accounts and sales returns 4,734 33 407 4,360
| High | Low | ||||
|---|---|---|---|---|---|
| 2006 | |||||
| First Quarter 2006 | $ | 36.28 | $ | 31.32 | |
| Second Quarter 2006 | 33.67 | 26.18 | |||
| Third Quarter 2006 | 27.89 | 24.55 | |||
| Fourth Quarter 2006 | 31.60 | 26.63 | |||
| 2005 | |||||
| First Quarter 2005 | $ | 29.14 | $ | 24.68 | |
| Second Quarter 2005 | 24.37 | 20.92 | |||
| Third Quarter 2005 | 29.25 | 21.35 | |||
| Fourth Quarter 2005 | 32.74 | 23.15 | |||
| High | Low | |||||||
| 2009 | ||||||||
| First Quarter 2009 | $ | 23.40 | $ | 15.82 | ||||
| Second Quarter 2009 | 23.61 | 18.41 | ||||||
| Third Quarter 2009 | 28.42 | 21.26 | ||||||
| Fourth Quarter 2009 | 29.85 | 26.52 | ||||||
| 2008 | ||||||||
| First Quarter 2008 | $ | 31.95 | $ | 24.19 | ||||
| Second Quarter 2008 | 31.85 | 25.59 | ||||||
| Third Quarter 2008 | 34.63 | 25.88 | ||||||
| Fourth Quarter 2008 | 27.99 | 20.20 | ||||||
We paidcommon stock.
| 2009 | ||||
| March 2, 2009 | $ | 0.12 | ||
| June 1, 2009 | 0.12 | |||
| August 31, 2009 | 0.12 | |||
| November 30, 2009 | 0.12 | |||
| 2008 | ||||
| March 3, 2008 | $ | 0.11 | ||
| June 2, 2008 | 0.11 | |||
| September 2, 2008 | 0.11 | |||
| December 1, 2008 | 0.11 | |||
Period | Total number of shares | Average price paid per share | Total number of shares purchased as part of a publicly announced plan or program | Maximum number of shares that may yet be purchased under the plan or program (1) | ||||||||||||
| October 1, 2009 to October 31, 2009 | — | — | — | 2,262,168 | ||||||||||||
| November 1, 2009 to November 30, 2009 | 573,841 | $ | 28.55 | 573,841 | 1,688,327 | |||||||||||
| December 1, 2009 to December 31, 2009 | — | — | — | 1,688,327 | ||||||||||||
| Total | 573,841 | $ | 28.55 | 573,841 | ||||||||||||
| Years Ended December 31, | |||||||||||||||||
|---|---|---|---|---|---|---|---|---|---|---|---|---|---|---|---|---|---|
| 2006 | 2005 | 2004 | 2003 | 2002 | |||||||||||||
| (in thousands, except per share data) | |||||||||||||||||
| Statements of Income Data: | |||||||||||||||||
| Net sales: | |||||||||||||||||
| Americas | $ | 317,780 | $ | 275,524 | $ | 243,651 | $ | 200,210 | $ | 195,770 | |||||||
| Europe | 193,364 | 171,499 | 164,895 | 137,761 | 122,800 | ||||||||||||
| Asia Pacific | 149,263 | 124,818 | 105,542 | 87,921 | 72,220 | ||||||||||||
| Consolidated net sales | 660,407 | 571,841 | 514,088 | 425,892 | 390,790 | ||||||||||||
| Cost of sales | 170,326 | 149,309 | 135,473 | 111,672 | 105,086 | ||||||||||||
| Gross profit | 490,081 | 422,532 | 378,615 | 314,220 | 285,704 | ||||||||||||
| Operating expenses: | |||||||||||||||||
| Sales and marketing | 235,072 | 211,280 | 188,727 | 160,478 | 145,671 | ||||||||||||
| Research and development | 113,095 | 87,841 | 84,692 | 70,896 | 63,964 | ||||||||||||
| General and administrative | 54,192 | 45,199 | 42,500 | 42,497 | 35,714 | ||||||||||||
| Total operating expenses | 402,359 | 344,320 | 315,919 | 273,871 | 245,349 | ||||||||||||
| Operating income | 87,722 | 78,212 | 62,696 | 40,349 | 40,355 | ||||||||||||
| Other income (expense): | |||||||||||||||||
| Interest income | 6,847 | 3,758 | 2,905 | 2,511 | 3,295 | ||||||||||||
| Net foreign exchange gain (loss) | 740 | (1,566 | ) | 1,287 | 1,125 | (724 | ) | ||||||||||
| Other income (expense), net | (7 | ) | 276 | (2,075 | ) | 506 | 692 | ||||||||||
| Income before income taxes | 95,302 | 80,680 | 64,813 | 44,491 | 43,618 | ||||||||||||
| Provision for income taxes | 22,594 | 19,163 | 16,203 | 11,123 | 12,213 | ||||||||||||
| Net income | $ | 72,708 | $ | 61,517 | $ | 48,610 | $ | 33,368 | $ | 31,405 | |||||||
| Basic earnings per share | $ | 0.91 | $ | 0.78 | $ | 0.62 | $ | 0.43 | $ | 0.41 | |||||||
| Weighted average shares outstanding - basic | 79,519 | 78,552 | 78,680 | 77,438 | 76,829 | ||||||||||||
| Diluted earnings per share | $ | 0.89 | $ | 0.76 | $ | 0.59 | $ | 0.41 | $ | 0.39 | |||||||
| Weighted average shares outstanding - diluted | 81,519 | 80,910 | 82,096 | 80,946 | 80,117 | ||||||||||||
| Cash dividends paid per common share | $ | 0.24 | $ | 0.20 | $ | 0.18 | $ | 0.07 | $ | — | |||||||
| December 31, | |||||||||||||||||
|---|---|---|---|---|---|---|---|---|---|---|---|---|---|---|---|---|---|
| 2006 | 2005 | 2004 | 2003 | 2002 | |||||||||||||
| (in thousands) | |||||||||||||||||
| Balance Sheet Data: | |||||||||||||||||
| Cash and cash equivalents | $ | 100,287 | $ | 55,864 | $ | 76,216 | $ | 53,446 | $ | 12,840 | |||||||
| Short-term investments | 150,190 | 119,846 | 150,392 | 141,227 | 141,038 | ||||||||||||
| Working capital | 374,512 | 274,686 | 309,635 | 255,330 | 211,453 | ||||||||||||
| Total assets | 721,220 | 608,336 | 582,093 | 525,151 | 458,714 | ||||||||||||
| Long-term debt, net of current portion | — | — | — | — | — | ||||||||||||
| Total stockholders' equity | 596,682 | 503,850 | 486,449 | 439,452 | 386,463 | ||||||||||||
| Years Ended December 31, | ||||||||||||||||||||
| 2009 | 2008 | 2007 | 2006 | 2005 | ||||||||||||||||
| (in thousands, except per share data) | ||||||||||||||||||||
| Statements of Income Data: | ||||||||||||||||||||
| Net sales: | ||||||||||||||||||||
| Americas | $ | 292,999 | $ | 355,878 | $ | 331,482 | $ | 317,780 | $ | 275,524 | ||||||||||
| Europe . | 210,188 | 267,373 | 230,940 | 193,364 | 171,499 | |||||||||||||||
| Asia Pacific | 173,407 | 197,286 | 177,956 | 149,263 | 124,818 | |||||||||||||||
| Consolidated net sales | 676,594 | 820,537 | 740,378 | 660,407 | 571,841 | |||||||||||||||
| Cost of sales | 169,884 | 207,109 | 185,267 | 173,348 | 151,939 | |||||||||||||||
| Gross profit | 506,710 | 613,428 | 555,111 | 487,059 | 419,902 | |||||||||||||||
| Operating expenses: | ||||||||||||||||||||
| Sales and marketing | 269,267 | 307,409 | 264,060 | 232,050 | 208,650 | |||||||||||||||
| Research and development | 132,974 | 143,140 | 126,515 | 113,095 | 87,841 | |||||||||||||||
| General and administrative | 57,938 | 67,162 | 62,445 | 54,192 | 45,199 | |||||||||||||||
| Total operating expenses | 460,179 | 517,711 | 453,020 | 399,337 | 341,690 | |||||||||||||||
| Operating income | 46,531 | 95,717 | 102,091 | 87,722 | 78,212 | |||||||||||||||
| Other income (expense): | ||||||||||||||||||||
| Interest income | 1,629 | 5,996 | 9,822 | 6,847 | 3,758 | |||||||||||||||
| Net foreign exchange gain (loss) | 734 | (3,737 | ) | 1,672 | 740 | (1,566 | ) | |||||||||||||
| Other income (expense), net | 1,351 | 161 | (158 | ) | (7 | ) | 276 | |||||||||||||
| Income before income taxes | 50,245 | 98,137 | 113,427 | 95,302 | 80,680 | |||||||||||||||
| Provision for income taxes | 33,160 | 13,310 | 6,394 | 22,594 | 19,163 | |||||||||||||||
| Net income | $ | 17,085 | $ | 84,827 | $ | 107,033 | $ | 72,708 | $ | 61,517 | ||||||||||
| Basic earnings per share | $ | 0.22 | $ | 1.08 | $ | 1.35 | $ | 0.91 | $ | 0.78 | ||||||||||
| Weighted average shares outstanding - basic | 77,520 | 78,567 | 79,468 | 79,519 | 78,552 | |||||||||||||||
| Diluted earnings per share | $ | 0.22 | $ | 1.07 | $ | 1.32 | $ | 0.89 | $ | 0.76 | ||||||||||
| Weighted average shares outstanding - diluted | 78,026 | 79,515 | 81,043 | 81,519 | 80,910 | |||||||||||||||
| Cash dividends declared per common share | $ | 0.48 | $ | 0.44 | $ | 0.34 | $ | 0.24 | $ | 0.20 | ||||||||||
| December 31, | ||||||||||||||||||||
| 2009 | 2008 | 2007 | 2006 | 2005 | ||||||||||||||||
| (in thousands) | ||||||||||||||||||||
| Balance Sheet Data: | ||||||||||||||||||||
| Cash and cash equivalents | $ | 201,465 | $ | 229,400 | $ | 194,839 | $ | 100,287 | $ | 55,864 | ||||||||||
| Short-term investments | 87,196 | 6,220 | 93,838 | 150,190 | 119,846 | |||||||||||||||
| Working capital | 413,759 | 398,292 | 419,874 | 379,733 | 274,686 | |||||||||||||||
| Total assets | 813,029 | 832,591 | 818,812 | 721,220 | 608,336 | |||||||||||||||
| Long-term debt, net of current portion | — | — | — | — | — | |||||||||||||||
| Total stockholders’ equity | 654,420 | 664,438 | 661,086 | 596,682 | 503,850 | |||||||||||||||
ITEM 7. MANAGEMENT'SMANAGEMENT’S DISCUSSION AND ANALYSIS OF FINANCIAL CONDITION AND RESULTS OF OPERATIONS
The following “Management’s Discussion and Analysis of Financial Condition and Results of Operations” contains forward-looking statements within the meaning of Section 27A of the Securities Act of 1933 and Section 21E of the Securities Exchange Act of 1934. Any statements contained herein regarding our future financial performance or operations (including, without limitation, statements to the effect that we “believe,” “expect,” “plan,” “may,” “will,” “project,” “continue,” or “estimate” or other variations thereof or comparable terminology or the negative thereof) should be considered forward-looking statements. Actual results could differ materially from those projected in the forward-looking statements as a result of a number of important factors including those set forth under the heading “Risk Factors”“Risk Factors” beginning on page 8,10, and elsewhere in this Form 10-K. Although we believe that the expectations reflected in the forward-looking statements are reasonable, we cannot guarantee future results, levels of activity, performance or achievements. You should not place undue reliance on these forward-looking statements. We disclaim any obligation to update information contained in any forward-looking statement.
Overview
National Instruments designs, develops, manufactures and markets instrumentationCorporation (“we”, “us” or “our”) is a leading supplier of measurement and automation softwareproducts that engineers and hardware for general commercial, industrial and scientific applications. We offer hundredsscientists use in a wide range of products used to create virtual instrumentation systems for measurement and automation. We have identifiedindustries. These industries comprise a large and diverse market for design, control and test applications. We provide flexible application software and modular, multifunctional hardware that users combine with industry-standard computers, networks and third party devices to create measurement, automation and embedded systems, which we also refer to as “virtual instruments”. Our products are used in a variety of applications from researchapproach gives customers the ability to quickly and development to production testing, monitoringcost-effectively design, prototype and industrial control.deploy unique custom-defined solutions for their design, control and test application needs. We sell to a large number of customers in a wide variety of industries. No single customer accounted for more than 3% of our sales in 2006, 20052009, 2008 or 2004.2007.
The key strategies that management focuses on in running our business are the following:
Expanding our broad customer base:base
We strive to increase our already broad customer base by serving a large market on many computer platforms, through a global marketing and distribution network. We also seek to acquire new technologies and expertise from time to time in order to open up new opportunities for our existing product portfolio. While we continue our efforts to expand our customer base, we are also benefiting from our efforts in increasing order size from both new and existing customers.
Maintaining a high level of customer satisfaction:satisfaction
To maintain a high level of customer satisfaction we strive to offer innovative, modular and integrated products through a global sales and support network. We strive to maintain a high degree of backwards compatibility across different platforms in order to preserve the customer’s investment in our products. In this time of intense global competition, we believe it is crucial that we continue to offer products with quality and reliability, and that these products provide cost-effective solutions for our customers.
Leveraging external and internal technology:technology
Our product strategy is to provide superior products by leveraging generally available technology, supporting open architectures on multiple platforms and by leveraging our core technologies such as custom ASICs (application-specificapplication specific integrated circuits)circuits (“ASICs”) across multiple products.
We sell into the test and measurement (“T&M”) and the industrial automation (“IA”)industrial/embedded applications in a broad range of industries and as such are subject to the economic and industry forces which drive those markets. It has been our experience that the performance of these industries and our performance is impacted by general trends in industrial production for the global economy and by the specific performance of certain vertical markets that are intensive consumers of measurement technologies. Examples of these markets are semiconductor capital equipment, telecom, defense, aerospace, automotive and others. In assessing our business, our management considerswe consider the trends in the Global Purchasing Managers Index (published(“PMI”) published by JP Morgan),Morgan, global industrial production as well as industry reports on the specific vertical industries mentioned earlier.that we target. Starting in August 2009, the PMI has had readings above 50 which are indicative of expansion in the industrial global economy. However, we believe there is still a substantial amount of uncertainty about the global industrial economic conditions. We are unable to predict whether the current expansion cycle, as measured by the PMI, will be sustained throughout 2010. This continuing uncertainty in the global industrial economy is likely to continue to have an adverse effect on the spending patterns of businesses including our current and potential customers which could adversely affect our revenues and therefore harm our business and result of operations.
We distribute our software and hardware products primarily through a direct sales organization. We also use independent distributors, OEMs, VARs, system integrators and consultants to market and sell our products. We have sales offices in the United StatesU.S. and sales offices and distributors in key international markets. Sales outside of the Americas accounted for approximately 52%57%, 52%57% and 53% of55% or our revenues in 2006, 2005,2009, 2008 and 2004,2007, respectively. The vast majority of our foreign sales are denominated in the customers’ local currency, which exposes us to the effects of changes in foreign-currencyforeign currency exchange rates. We expect that a significant portion of our total revenues will continue to be derived from international sales. See (See Note 12 – Segment information of Notes to Consolidated Financial Statements for details concerning the geographic breakdown of our net sales, operating income, interest income and identifiable assets.long-lived assets).
We manufacture a substantial majority of our products at our facilityfacilities in Debrecen, Hungary. Additional production primarily of low volume or newly introduced products is done in Austin, Texas. Our product manufacturing operations can be divided into four areas: electronic circuit card and module assembly; chassis and cable assembly; technical manuals and product support documentation; and software duplication. We manufacture most of the electronic circuit card assemblies, modules and chassismodules in-house, although subcontractors are used from time to time. Beginning in 2005, some chassis have been produced byWe currently use subcontractors in Asia.Asia to manufacture a significant portion of our chassis but we review these arrangements periodically. We manufacture some of our electronic cable assemblies in-house, but many assemblies are produced by subcontractors. We primarily subcontract our software duplication, our technical manuals and product support documentation.
We believe that our long-term growth and success depends on delivering high quality software and hardware products on a timely basis. Accordingly, we focus significant efforts on research and development. We focus our research and development efforts on enhancing existing products and developing new products that incorporate appropriate features and functionality to be competitive with respect to technology, price and price/performance. Our success also is dependantdependent on our ability to obtain and maintain patents and other proprietary rights related to technologies used in our products. We have engaged in litigation and where necessary, will likely engage in future litigation to protect our intellectual property rights. In monitoring and policing our intellectual property rights, we have been and may be required to spend significant resources.
We have been profitable in every year since 1990. However, there can be no assurance that our net sales will grow or that we will remain profitable in future periods. Our operating results fluctuate from period to period due to changes in global economic conditions and a number of other factors. As a result, we believe historical results of operations should not be relied upon as indications of future performance.
Results of Operations
The following table sets forth, for the periods indicated, the percentage of net sales represented by certain items reflected in our consolidated statementsConsolidated Statements of income:Years Ended December 31,
2006
2005
2004
Net sales: Americas 48.1 % 48.2 % 47.4 % Europe 29.3 30.0 32.1 Asia Pacific 22.6 21.8 20.5
Consolidated net sales 100.0 100.0 100.0 Cost of sales 25.8 26.1 26.4
Gross profit 74.2 73.9 73.6 Operating expenses: Sales and marketing 35.6 36.9 36.7 Research and development 17.1 15.4 16.4 General and administrative 8.2 7.9 8.3
Total operating expenses 60.9 60.2 61.4
Operating income 13.3 13.7 12.2 Other income (expense): Interest income 1.0 0.7 0.5 Net foreign exchange gain (loss) 0.1 (0.3 ) 0.3 Other income (expense), net — — (0.4 )
Income before income taxes 14.4 14.1 12.6 Provision for income taxes 3.4 3.3 3.1
Net income 11.0 % 10.8 % 9.5 %
Income:
Years Ended December 31, 2009 2008 2007 Net sales: Americas 43.3 % 43.4 % 44.8 % Europe 31.1 32.6 31.2 Asia Pacific 25.6 �� 24.0 24.0 Consolidated net sales 100.0 100.0 100.0 Cost of sales 25.1 25.2 25.0 Gross profit 74.9 74.8 75.0 Operating expenses: Sales and marketing 39.8 37.5 35.7 Research and development 19.6 17.4 17.1 General and administrative 8.6 8.2 8.4 Total operating expenses 68.0 63.1 61.2 Operating income 6.9 11.7 13.8 Other income (expense): Interest income 0.2 0.7 1.3 Net foreign exchange gain (loss) 0.1 (0.5 ) 0.2 Other income (expense), net 0.2 — — Income before income taxes 7.4 11.9 15.3 Provision for income taxes 4.9 1.6 0.8 Net income 2.5 % 10.3 % 14.5 %
Net Sales.In 2006, consolidatedSales. Consolidated net sales were $660.4$677 million, $821 million and $740 million for the years ended December 31, 2009, 2008 and 2007, respectively, a 15%decrease of 18% in 2009 compared to 2008 following an increase of 11% in 2008 compared to 2007. The decrease in 2009 can be attributed to declines in sales volume across all regions of our business. Instrument control products which comprised approximately 7% of our revenues for the year ended December 31, 2009, saw a year-over-year decline of 31%. Products in the areas of virtual instrumentation and graphical system design which comprised approximately 93% of our revenues for the year ended December 31, 2009, saw a year-over-year decline of 16%. Revenues from our instrument control products are the level achievedmost sensitive to the cycles of the global industrial economy. For the year ended December 31, 2009, our order backlog increased by approximately $8 million. Backlog is a measure of orders that were received but that had not shipped to customers at the end of the quarter. We did not take any significant action with regard to pricing during the year ended December 31, 2009, and thus, the decrease in 2005, which followed anrevenues is attributable to a decrease in customer orders. The increase in net sales of 11% in 2005 from the level achieved in 2004. The increase in sales in 20062008, compared to 2005 was primarily attributable2007 can be attributed to volume growth in the introductionareas of newmodular instruments, particularly RF test products, PXI, software and upgraded products, an increased market acceptance of our productsCompactRIO which performed very well in all regions and the current year impact of prior year acquisitions. The increase in sales in 2005 compared to 2004 was primarily attributable to the introduction of new and upgraded products, the increase in unit volume from the increased market acceptance of our products in all regions and the strengthlight of the Euro.industry contraction. The increases in these areas were offset by declines in revenue from instrument control products which are the most sensitive to downturns in the Global PMI.
Sales in the Americas increased $42.3were $293 million, or 15%, to $317.8$356 million and $331 million for the years ended December 31, 2009, 2008 and 2007, respectively, a decrease of 18% in 20062009 compared to 2005, which followed a 13%2008 following an increase in 2005 over 2004 levels. The increasesof 8% in sales in the Americas in 2006 and 2005 were attributable2008 compared to an increased market acceptance of our products and from revenue of $34.4 million and $21.9 million, respectively, from acquired companies. (See Note 15 of Notes to Consolidated Financial Statements for a description of acquisitions).2007. Sales outside of the Americas, as a percentage of consolidated sales were 57%, 57% and 55% for 2006, remained flat at 52% with 2005. European revenue was $193.4the years ended December 31, 2009, 2008 and 2007, respectively. Sales in Europe were $210 million, $267 million and $231 million for the years ended December 31, 2009, 2008 and 2007, respectively, a decrease of 21% in 2006,2009 compared to 2008 following an increase of 13% from 2005,16% in 2008 compared to 2007. Sales in Asia were $173 million, $197 million and $178 million for the years ended December 31, 2009, 2008 and 2007, respectively, a decrease of 12% in 2009 compared to 2008 following a 4%an increase of 11% in 2005 from 2004. Asia Pacific revenue grew 20%2008 compared to $149.3 million in 2006, which followed an 18% increase in 2005 over 2004 levels.2007. We expect sales outside of North Americathe Americas to continue to represent a significant portion of our revenue. We intend to continue to expand our international operations by increasing our presence in existing markets, adding a presence in some new geographical markets and continuing the use of distributors to sell our products in some countries.
Almost all sales made by our direct sales offices in the Americas, outside of the U.S., in Europe and in Asia Pacific are denominated in local currencies, and accordingly, the U.S. dollar equivalent of these sales is affected by changes in the foreign currency exchange rates. Between 2006 and 2005,For 2009, net of hedging results, the change in the exchange rates had the effect of decreasing our consolidated sales by 0.5%$29 million or 4%, decreasing America’s sales by $6 million or 2%, decreasing European sales by 3%$17 million or 6%, and had no material effect ondecreasing sales in Asia Pacific. The increase in sales in Europe and Asia was the resultPacific by $6 million or 3% compared to 2008. For 2008, net of the change in exchange rates and the increase in local currency product pricing in each region. Since most of our international operating expenses are also incurred in local currencies,hedging results, the change in exchange rates had the effect of decreasing operating expenses $1.5increasing our consolidated sales by $34 million or 0.4%4%, in 2006,increasing America’s sales by $1.7 million or 0.5%, increasing European sales by $28 million or 12%, and increasing operating expenses $4.2sales in Asia Pacific by $4.3 million or 1.2% in 2005, and $4.4 million, or 1.4%, in 2004.2% compared to 2007.
Gross Profit.Profit.As a percentage of sales, gross profitmargin was 74%75% in each of 2006, 2005,2009, 75% in 2008 and 2004. Our75% in 2007. In 2009, we were successful in implementing cost reduction strategies throughout our manufacturing cycle which allowed us to maintain a stable gross margin percentage despite the 18% decrease in 2006 remained flat with 2005 primarily becausesales volume in 2009. For the favorableyears ended December 31, 2009, 2008 and 2007, charges related to acquisition related intangibles and stock based compensation were $4.7 million, $4.7 million and $3.6 million, respectively. For the years ended December 31, 2009 and 2008, the net impact of higher sales volume and improved product margins resulting from both price increases and cost reductions on certain products were offset entirely by the negative impact of unfavorablechange in foreign currency exchange rates had the expensingeffect of stock-based compensation, the increase in the amortizationdecreasing our cost of acquisition intangiblesgoods sold by $3 million or 1%, and the write-off in the first quarterincreasing our cost of 2006 of some capitalized facility costs due to the continued transition of production to our manufacturing facility in Hungary. Our gross margin in 2005 remained flat with 2004 primarily because the favorable impacts of foreign currency exchange rates and higher sales volume were offsetgoods sold by the reduced margins realized on product lines from acquired companies as well as the impact of the amortization of acquisition related intangibles and a reduction of selling prices of some of our products. There can be no assurance that we will maintain our historical margins. We believe our current manufacturing capacity is adequate to meet current needs.$1.1 million or 4%, respectively.
Sales and Marketing.Marketing.Sales and marketing expenseexpenses were $269 million, $307 million and $264 million for the years ended December 31, 2009, 2008 and 2007, respectively, a decrease of 12% in 2006 increased2009 compared to $235.1 million, an 11% increase from 2005,2008 following an increase of 12%16% in 2005 over 2004. Sales2008 compared to 2007. As a percentage of net sales, sales and marketing expenseexpenses were 40%, 38% and 36% for 2009, 2008 and 2007, respectively. For 2009, the increase in sales and marketing expenses as a percentage of revenue was 36%due to the 18% decrease in 2006, down from 37%revenue. For 2009, the decrease in 2005sales and 2004. Approximately 84%marketing expenses in absolute dollars was due to a decrease in travel, tradeshows and advertising of $15 million, a decrease in variable compensation of $4.2 million and a decrease caused by the net impact of changes in foreign currency exchange rates of $9 million. Temporary cost cutting measures which included a company-wide wage reduction as well as a reduction in the number of accrued vacation hours that employees are allowed to carry beyond December 31, 2009, resulted in additional cost savings of $7 million compared to 2008. For 2008, the increase in sales and marketing expense, both in 2006 comparedabsolute dollars and as a percentage of sales, was consistent with our plan to 2005 is attributablemake additional investments in our field sales force during 2008. Approximately 65% of the increase in 2008 over 2007, can be attributed to the increase in sales and marketing personnel, costs due to the increaseincreases in salesstock-based compensation and marketing personnel, the increase in variable compensation from higher sales volume and fromvolume. In addition, during 2008, the net impact of foreign currency exchange rates had the expensingeffect of stock-based compensation. Approximately 60% of the increase inincreasing our sales and marketing expensesexpense by $10 million or 3%. We plan to continue to make additional investments in 2005 compared to 2004 is attributable to the increaseour field sales force in sales and marketing personnel costs,2010. However, due to the increasecontinuing uncertainty in the industrial economy, the extent of our field sales and marketing personnel, the increaseexpansion during 2010 will be dependent on our overall sales volumes in variable compensation from higher sales volume and from the effects of the change in currency exchange rates, with the remaining fraction of the increase attributable to increases in advertising, tradeshows and special events.2010. We expect sales and marketing expenses in future periods to increase in absolute dollars, andcontinue to fluctuate as a percentage of sales based on recruiting, marketing and advertising campaign costs associated with major new product releases and entry into new market areas, investment in web sales and marketing efforts, increasing product demonstration costs and the timing of domestic and international conferences and trade shows.
Research and Development.Development.Research and development expenses were $133 million, $143 million and $127 million for the years ended December 31, 2009, 2008 and 2007, respectively, a decrease of 7% in 2006 increased 29%2009 compared to 20052008 following an increase of 4%13% in 2005 over 2004. Research2008 compared to 2007. As a percentage of net sales, research and development expenseexpenses were 20%, 17% and 17% for 2009, 2008 and 2007, respectively. For 2009, the increase in research and development expenses as a percentage of revenue was 17.1%due to the 18% decrease in 2006, up from 15.4%revenue. For 2009, the decrease in 2005research and 16.4%development expenses in 2004. Theabsolute dollars was due to a decrease in variable compensation of $2.9 million and a decrease caused by the net impact of changes in foreign currency exchange rates of $327,000. Temporary cost cutting measures which included a company-wide wage reduction as well as a reduction in the number of accrued vacation hours that employees were allowed to carry beyond December 31, 2009, resulted in additional cost savings of $7 million. These decreases were offset by personnel costs related to a net headcount increase of 42 people during 2009. For 2008, the increase in research and development costs in 2006expenses in absolute dollars and as a percentage of revenue was primarily due to increases in personnel costs from the hiring of additional product development engineers and from the impact of the expensing ofas well as increases related to stock-based compensation and fromwas consistent with our plan to continue to grow our research and development capacity in line with the decreaseoverall revenue growth of the company. During 2008, we had a net headcount increase of 109 people in our worldwide research and development group. In addition, during 2008, the capitalizationnet impact of software development costs. The decrease inforeign currency exchange rates had the effect of increasing our research and development expense as a percentage of revenue in 2005 compared to 2004 was primarily due to the increase in the capitalization of software development costs. The increase in research and development expense in absolute dollars in 2005 was primarily due to increases in personnel costs from the hiring of additional product development engineers, which was partially offset by the decrease in expense from the increase in the capitalization of software development costs. Research and development personnel increased from 1,036 at December 31, 2005 to 1,122 at December 31, 2006.$2.7 million or 2%. We plan to continue making a significant investmentto make additional investments in research and development in order2010. However, due to remain competitivethe continuing uncertainty in the industrial economy, the extent of our research and support revenue growth.development expansion during 2010 will be dependent on our overall sales volumes in 2010.
We capitalize software development costs in accordance with Statement ofthe Financial Accounting Standards (“SFAS”) 86, “Accounting for the Costs of Computer Board (FASB) Accounting Standards Codification (ASC) 985, Software to be Sold, Leased, or Otherwise Marketed.” (FASB ASC 985). We amortize such costs over the related product’s estimated economic useful life, generally three years, beginning when a product becomes available for general release. Software amortization expense included in cost of goods sold totaled $9.1$9 million, $7.2$10 million and $6.6$9 million during 2006, 20052009, 2008 and 2004,2007, respectively. Internally developed software costs capitalized during such years2009, 2008 and 2007 were $7.4$13 million, $13.4$10 million and $5.0$8 million, respectively. Capitalization of internally developed software costs varies depending on the timing of when each project reaches technological feasibility and the length and scope of the development cycle of each individual project. (See Note 57 - Intangibles of Notes to Consolidated Financial Statements for a description of intangibles.)intangibles).
General and Administrative.Administrative.General and administrative expenses were $58 million, $67 million and $62 million for the years ended December 31, 2009, 2008 and 2007, respectively, a decrease of 13% in 2006 increased 20%2009 compared to 2005,2008 following an increase of 6%8% in 2005 over 2004. The 20% increase in2008 compared to 2007. As a percentage of net sales, general and administrative expenses were 9%, 8% and 8% in 2006 from 2005 was primarily attributable to increases in personnel costs from both2009, 2008 and 2007. For 2009, the increase in international general and administrative personnel and the impact of the expensing of stock-based compensation, and the effect of decreased litigation costs in the prior year, primarily from the reversal of previously accrued estimated patent defense costs associated with the SoftWIRE legal matter which resulted in a gain of $1.9 million in 2005. The 6% increase in general and administrative expenses in 2005 from the prior year period was primarily due to the litigation settlement in 2004 which resulted in the $6.0 million net gain in 2004 from the judgment award against The MathWorks, Inc. (See Note 14 of Notes to Consolidated Financial Statements.) General and administrative expenses as a percentage of revenue increasedwas due to 8.2% during 2006 from 7.9% during 2005.the 18% decrease in revenue. For 2009, the decrease in general and administrative expenses was due to a decrease caused by the net impact of changes in foreign currency exchange rates of $2.6 million, a reduction of our patent litigation accrual which resulted in a non-cash decrease to our operating expenses of $2 million and a decrease in variable compensation of $948,000. Temporary cost cutting measures which include a company-wide wage reduction as well as a reduction in the number of accrued vacation hours that employees are allowed to carry beyond December 31, 2009, resulted in additional cost savings of $1.8 million. For 2008, the increase in absolute dollars compared to 2007 can primarily be attributed to the net impact of foreign currency exchange rates which had the effect of increasing our general and administrative expense by $2.4 million or 4%. We expect that general and administrative expenses in future periods will fluctuate in absolute amountsdollars and as a percentage of revenue.
Interest Income.Income.Interest income increased 82%was $1.6 million, $6 million and $10 million for the years ended December 31, 2009, 2008 and 2007, respectively, a decrease of 73% in 2006 from 2005, which followed an increase2009 compared to 2008 following a decrease of 29%40% in 2005 from 2004. The increase2008 compared to 2007. For 2009, the decrease is attributable to significant decreases in investment yields for high grade treasury, municipal and corporate bonds. For 2008, the decrease is attributable to a decrease in invested funds as well as to the rapid rate of decrease in interest income in 2006 was due to higher yields on larger invested funds. The increase in interest income in 2005 versus 2004 was due to higher yields.rates during the second half of 2008. The primary source of interest income is from the investment of our cash and short-term investments. Net cash provided by operating activities totaled $97.9 million and $88.1 million in 2006 and 2005, respectively.
Net Foreign Exchange Gain (Loss). We experienced net Net foreign exchange gains of $740,000 in 2006, compared to losses of $1.6gain (loss) was $734,000, $(3.7) million in 2005 and gains of $1.3$1.7 million in 2004.for the years ended December 31, 2009, 2008 and 2007, respectively. These results are attributable to movements in the foreign currency exchange rates between the U.S. dollar and the localforeign currencies in countries in whichwhere our sales subsidiaries are located.functional currency is not the U.S. dollar. We recognize the local currency as the functional currency in virtually all of our international subsidiaries.
We utilize foreign currency forward contracts to hedge our foreign denominated net foreign currency balance sheet positions to protect against the change in value caused by a majorityfluctuation in foreign currency exchange rates. We typically hedge up to 90% of our outstanding foreign currency-denominated receivables in order to reduce our exposure to significant foreign currency fluctuations. Wedenominated net receivable or payable positions and typically limit the duration of our “receivables”these foreign currency forward contracts to approximately 90 days. We also utilize The gain or loss on these derivatives as well as the offsetting gain or loss on the hedge item attributable to the hedged risk is recognized in current earnings under the line item “net foreign exchange gain (loss)”. Our hedging strategy reduced our foreign exchange gains by $1.7 million in 2009, reduced our foreign exchange losses by $1.2 million in 2008 and reduced our foreign exchange gains by $1.1 million in 2007.
To protect against the change in the value caused by a fluctuation in foreign currency exchange rates of forecasted foreign currency cash flows resulting from international sales and expenses over the next one to two years, we have instituted a foreign currency cash flow hedging program. We hedge portions of our forecasted revenue and forecasted expenses denominated in foreign currencies with forward and option contracts. For forward contracts, andwhen the dollar strengthens significantly against the foreign currency purchased option contractscurrencies, the change in order to reduce our exposure to fluctuations inthe present value of future foreign currency cash flows. We purchase theseflows may be offset by the change in the fair value of the forward contracts for up to 100%designated as hedges. For purchased option contracts, when the dollar strengthens significantly against the foreign currencies, the change in the present value of our forecastedfuture foreign currency cash flows may be offset by the change in selected currencies (primarily the euro, yen and pound sterling) and limitfair value of the durationoption contracts designated as hedges, net of these contracts to 40 months.the premium paid. Our foreign currency purchased option contracts are purchased “at-the-money” or “out-of-the-money.” We purchase foreign currency forward and option contracts for up to 100% of our forecasted exposures in selected currencies (primarily in Euro, Japanese yen, British pound sterling and Hungarian forint) and limit the duration of these contracts to 40 months or less. As a result, our hedging activities only partially address our risks infrom foreign currency transactions, and there can be no assurance that this strategy will be successful. We do not invest in contracts for speculative purposes. (See Note 114 - Derivative instruments and hedging activities of Notes to Consolidated Financial Statements for a description of our forward and purchased option contracts and hedged positions.) Our hedging strategy reduced our foreign exchange gains for December 31, 2006 by $1.0 million and reduced our foreign exchange loss for December 31, 2005 by $2.2 million.positions).
Other Income (Expense), Net. We established a valuation reserve in the fourth quarter of 2004 for the estimated total impairment of a $2.5 million cost-method investment.Provision for Income Taxes.Our provision for income taxes reflectsreflected an effective tax rate of 24%66%, 14% and 6% for the years ended December 31, 2009, 2008 and 2007, respectively. The increase in 2006 and 2005 and 25% in 2004. Ourour effective tax rate is lower thanin 2009 compared to 2008 was driven by changes in our valuation allowances, tax charges related to inter-company profits and an increase in equity compensation expense as a percentage of pre-tax book income. (See Note 9 – Income taxes of Notes to Consolidated Financial Statements for further discussion regarding changes in our effective tax rate and a reconciliation of income taxes at the U.S. federal statutory income tax rate of 35% primarily as a result of the extraterritorial income exclusion, tax-exempt interest and reducedto our effective tax rates in certain foreign jurisdictions. The decreases in our tax rate in 2006 and 2005 from 2004 are due to increased profits in foreign jurisdictions with reduced income tax rates.rate).
Liquidity and Capital Resources
Working Capital, Cash and Cash Equivalents, Short-term Investments and Long-term Investments. We currently finance The following table presents our working capital, cash and cash equivalents and marketable securities (in thousands):
December 31,2009 December 31,2008 Increase/(Decrease) Working capital $ 413,759 $ 398,292 $ 15,467 Cash and cash equivalents (1) 201,465 229,400 (27,935 ) Short-term investments (1) 87,196 6,220 80,976 Long-term investments — 10,500 (10,500 ) Total cash, cash equivalents, short and long-term investments $ 288,661 $ 246,120 $ 42,541
(1)Included in working capital
Our working capital increased by $15 million during the year ended December 31, 2009 compared to December 31, 2008, due to cash provided by operations offset by repurchases of shares of our common stock, dividend payments and capital expenditures throughexpenditures.
Our cash flow from operations. At December 31, 2006, we had working capitaland cash equivalent balances are held in numerous financial institutions throughout the world, including substantial amounts held outside of approximately $374.5 million comparedthe U.S.; however, the majority of our cash and investments that are located outside of the U.S. are denominated in the U.S. dollar. Most of the amounts held outside of the U.S. could be repatriated to $274.7the U.S., but under current law, would be subject to U.S. federal income taxes, less applicable foreign tax credits. In some countries repatriation of certain foreign balances is restricted by local laws. We have provided for the U.S. federal tax liability on these amounts for financial statement purposes, except for foreign earnings that are considered indefinitely reinvested outside of the U.S. Repatriation could result in additional U.S. federal income tax payments in future years. We utilize a variety of tax planning and financing strategies with the objective of having our worldwide cash available in the locations in which it is needed.Cash Provided and (Used) in 2009 and 2008. Cash and cash equivalents decreased to $201 million at December 31, 2005. Net2009 from $229 million at December 31, 2008. The following table summarizes the proceeds and (uses) of cash (in thousands):
December 31, 2009 2008 Cash provided by operating activities $ 135,651 $ 121,818 Cash (used in)/provided by investing activities (111,915 ) 18,756 Cash (used in) financing activities (51,671 ) (106,013 ) Net (decrease)/increase in cash equivalents (27,935 ) 34,561 Cash and cash equivalents at beginning of year 229,400 194,839 Cash and cash equivalents at end of year $ 201,465 $ 229,400
Our operating activities provided $136 million and $122 million for the years ended December 31, 2009 and 2008, respectively, a 11% increase. For 2009, cash provided by operating activities was the result of $17 million of net income, $77 million in 2006, 2005net non-cash operating expenses which consisted of depreciation and 2004 totaled $97.9amortization, stock-based compensation, benefits from deferred income taxes, and by $41 million $88.1in net cash provided by changes in operating assets and liabilities, principally a $18 million decrease in accounts receivable, a $21 million decrease in inventories and $65.6a $13 million respectively.decrease in prepaid expenses and other assets, offset by a decrease of $10 million in accounts payable, taxes and other liabilities. In 2008, cash provided by operating activities was primarily the result of $84.8 million in net income and $51.3 million in net non-cash operating expenses which primarily consisted of depreciation and amortization, stock-based compensation, and benefits from deferred income taxes, offset in part by $14.3 million in net cash used by changes in operating assets and liabilities, principally a $24.6 million increase in inventory.
Accounts receivable increaseddecreased to $117.2$104 million at December 31, 20062009 from $95.7$122 million at December 31, 2005,2008, as a result of higherlower sales levelsvolumes during 2009. This decrease in the fourth quarter of 2006 compared to the fourth quarter of 2005. Daysrevenue also caused our days sales outstanding at December 31, 2006 increased to 59 days from 55increase to 61 days at December 31, 2005. 2009, compared to 57 days at December 31, 2008. We typically bill customers on an open account basis subject to our standard net thirty day payment terms. If, in the longer term, our revenue increases, it is likely that our accounts receivable balance will also increase. Our accounts receivable could also increase if customers delay their payments or if we grant extended payment terms to customers, both of which are more likely to occur during challenging economic times when our customers may face issues gaining access to sufficient funding or credit.
Consolidated inventory balances have increaseddecreased to $77.1$87 million at December 31, 20062009 from $62.8$107 million at December 31, 2005.2008. Inventory turns decreased to 2.41.8 per year for 2006 from 2.7at December 31, 2009 compared to 2.1 per year for 2005.at December 31, 2008. The increasedecrease in inventory in 2006during 2009 was principally to support the transfer of one of our two remaining Austin based production lines todriven by a reduction in our manufacturing facilityactivities in Hungary. The additionalresponse to the decreased demand for our products. Our inventory is intended aslevels will continue to be determined based upon our anticipated demand for products and our need to keep sufficient inventory on hand to meet our customers’ demands. We attempt to balance such considerations against the risk of obsolescence or potentially excess inventory levels. Rapid changes in industrial demand could have a buffer to support continued production as bothsignificant impact on our inventory balances in future periods.
Investing activities used cash of $112 million during 2009, which was the capital equipment andresult of the inventory needed to support its operation were physically moved to Hungary in September 2006. Cash used in 2006 fornet purchase of short-term investments of $74 million, the purchase of property and equipment totaled $18.5of $21 million, for the capitalization of internally developed software costs totaled $7.4of $13 million and for additions tothe acquisition of other intangibles totaled $3.1of $5 million. Cash used in 2005 for acquisitions totaled $63.9For 2008, investing activities provided cash of $19 million forwhich was primarily the result of the net sale of $77 million of short-term investments, offset by the purchase of property and equipment totaled $15.4of $26 million, fora net cash payment of $17 million related to the acquisition of microLEX Systems ApS (see Note 15 - Acquisitions of Notes to Consolidated Financial Statements), capitalization of internally developed software costs totaled $13.4of $10 million and for additions tothe acquisition of other intangibles totaled $4.3of $3 million. Cash
Financing activities used in 2004 for$52 million during 2009, which was the purchaseresult of property$35 million used to repurchase our common stock and equipment totaled $12.6$37 million for the capitalizationused to pay dividends to our shareholders, offset by $22 million received as a result of internally developed software costs totaled $5.0 million and for additions to other intangibles totaled $3.1 million. Cash provided by the issuance of our common stock totaled $37.1from the exercise of stock options and sales of our common stock through our employee stock purchase plan. For 2008, financing activities used $106 million $23.2which was the result of $104 million used to repurchase our common stock and $16.8$35 million used to pay dividends to our shareholders, offset by $31 million received as a result of the issuance of our common stock from the exercise of stock options and our employee stock purchase plan.
From time to time our Board of Directors has authorized various programs to repurchase shares of our common stock depending on market conditions and other factors. Under such programs, we repurchased a total of 1,443,441, 4,110,042 and 2,730,125 shares of our common stock at weighted average prices of $23.96, $25.22 and $29.20 per share, in 2006, 2005the years ended December 31, 2009, 2008 and 2004, respectively, and cash used for payment2007, respectively.
On January 23, 2009, our Board of dividends totaled $19.0 million, $15.8 million and $14.5 million in 2006, 2005 and 2004, respectively. The issuanceDirectors approved a new share repurchase plan which increased the aggregate number of shares of common stock wasthat we are authorized to repurchase from 591,324 to 3.0 million. At December 31, 2009, there were 1,688,327 shares remaining available for repurchase under this plan. This repurchase plan does not have an expiration date.
During 2009, we received reduced proceeds from the exercise of stock options compared to 2008. The timing and number of stock option exercises and the amount of cash proceeds we receive through those exercises are not within our control, and in the future we may not generate as much cash from the exercise of stock options as we have in the past. Moreover, it is now our practice to issue restricted stock units and not stock options to eligible employees under our Employee Stock Purchase Plan, our 1994 Incentive Plan and our 2005 Incentive Plan.which will reduce the number of stock options available for exercise in the future. Unlike the exercise of stock options, the issuance of shares upon vesting of restricted stock units does not result in any cash proceeds to us.
Contractual Cash used for the repurchase of common stock totaled $16.5 million, $49.5 million and $16.1 million in 2006, 2005 and 2004, respectively.Obligations.
The following summarizes our contractual cash obligations as of December 31, 20062009 (in thousands):Payments Due by Period
Total
2007
2008
2009
2010
2011
Beyond
Long-term debt $ — $ — $ — $ — $ — $ — $ — Capital lease obligations — — — — — — — Operating leases 23,691 7,241 5,682 4,883 3,103 1,983 799 Other long-term obligations — — — — — — —
Total contractual cash obligations $ 23,691 $ 7,241 $ 5,682 $ 4,883 $ 3,103 $ 1,983 $ 799
Payments Due by Period Total 2010 2011 2012 2013 2014 Beyond Long-term debt $ — $ — $ — $ — $ — $ — $ — Capital lease obligations — — — — — ��� — Operating leases 51,701 14,415 9,898 6,982 4,611 3,665 12,130 Total contractual cash obligations $ 51,701 $ 14,415 $ 9,898 $ 6,982 $ 4,611 $ 3,665 $ 12,130
The following summarizes our other commercial commitments as of December 31, 20062009 (in thousands):Total
2007
2008
2009
2010
2011
Beyond
Guarantees $ 3,500 $ 3,500 $ — $ — $ — $ — $ — Purchase obligations 7,004 7,004 — — — — —
Total commercial commitments $ 10,504 $ 10,504 $ — $ — $ — $ — $ —
Total 2010 2011 2012 2013 2014 Beyond Guarantees $ 5,200 $ 5,200 $ — $ — $ — $ — $ — Purchase obligations 6,500 6,500 — — — — — Total commercial commitments $ 11,700 $ 11,700 $ — $ — $ — $ — $ —
We currently expecthave commitments under non-cancelable operating leases primarily for office facilities throughout the world. Certain leases require us to fund expenditures for capital requirements as well as liquidity needs created by changes in working capital from a combination of available cashpay property taxes, insurance and short-term investment balancesroutine maintenance, and internally generated funds.include escalation clauses. As of December 31, 2006 and 2005, we had no debt outstanding. We believe that our cash flow from operations and existing cash balances and short-term investments will be sufficient to meet our cash requirements for at least the next twelve months. Cash requirements for periods beyond the next twelve months will depend on our profitability, our ability to manage working capital requirements and our rate of growth. Financial Risk Management
Our international sales are subject to inherent risks, including fluctuations in local economies; difficulties in staffing and managing foreign operations; greater difficulty in accounts receivable collection; costs and risks of localizing products for foreign countries; unexpected changes in regulatory requirements, tariffs and other trade barriers; difficulties in the repatriation of earnings and burdens of complying with a wide variety of foreign laws. The vast majority of our sales outside of North America are denominated in local currencies, and accordingly, we are subject to the risks associated with fluctuations in currency rates. In particular, increases in the value of the dollar against foreign currencies decrease the U.S. dollar value of foreign sales requiring that we either increase our price in the local currency, which could render our product prices noncompetitive, or suffer reduced revenues and gross margins as measured in U.S. dollars. These dynamics have adversely affected our revenue growth in international markets in previous years. Our foreign currency hedging program includes both foreign currency forward and purchased option contracts to reduce the effect of exchange rate fluctuations. However, our hedging program will not eliminate all of our foreign exchange risks. (See “Net Foreign Exchange Gain (Loss)” and Note 11 of Notes to Consolidated Financial Statements.)
The marketplace for our products dictates that many of our products be shipped very quickly after an order is received. As a result, we are required to maintain significant inventories. Therefore, inventory obsolescence is a risk for us due to frequent engineering changes, shifting customer demand, the emergence of new industry standards and rapid technological advances including the introduction by us or our competitors of products embodying new technology. While we adjust for excess and obsolete inventories and we monitor the valuation of our inventories, there can be no assurance that our valuation adjustments will be sufficient.
Off-Balance Sheet Arrangements
We have no debt or off-balance sheet debt. As of December 31, 2006,2009, we have non-cancelable operating lease obligations of approximately $23.7$52 million compared to $50 million at December 31, 2008. Rent expense under operating leases was $12 million, $12 million and contractual$10 million for the years ended December 31, 2009, 2008 and 2007, respectively.
Purchase obligations primarily represent purchase commitments for customized inventory and inventory components. As of December 31, 2009, we had non-cancelable purchase commitments with various suppliers of general components and customized inventory and inventory components totaling approximately $6.5 million over the next twelve months. At December 31, 2008, we had non-cancelable purchase commitments with various suppliers of customized inventory and inventory components totaling approximately $7.0$8.4 million.
Guarantees are related to payments of customs and foreign grants. As of December 31, 2006,2009, we have outstanding guarantees for payment of customs and foreign grants totaling approximately $3.5$5.2 million. (See Note 13 of Notes to Consolidated Financial Statements.) As of December 31, 2006,2008, we have outstanding guarantees for payment of customs and foreign grants totaling approximately $2.4 million.
Off-Balance Sheet Arrangements. We do not have any debt or off-balance sheet debt. As of December 31, 2009, we did not have any relationships with any unconsolidated entities or financial partnerships, such as entities often referred to as structured finance entities, which would have been established for the purpose of facilitating off-balance sheet arrangements. As such, we are not exposed to any financing, liquidity, market or credit risk that could arise if we were engaged in such relationships.
Market RiskProspective Capital Needs. We are exposedbelieve that our existing cash, cash equivalents and marketable securities, together with cash generated from operations and from the exercise of employee stock options and the purchase of common stock through our employee stock purchase plan, will be sufficient to a varietycover our working capital needs, capital expenditures, investment requirements, commitments, payment of risks, including foreign currency fluctuationsdividends to our shareholders and changes in the market valuerepurchases of our investments. Incommon stock for at least the normal coursenext 12 months. However, we may choose or be required to raise additional funds by selling equity or debt securities to the public or to selected investors, or by borrowing money from financial institutions. Historically, we have not had to rely on debt, public or private, to fund our operating, financing or investing activities. We could also choose or be required to reduce certain expenditures, such as payments of business, we employ established policies and procedures to manage our exposure to fluctuations in foreign currency values and changes in the market valuedividends or repurchases of our investments.
Foreign Currency Hedging Activities. Our objective in managing our exposurecommon stock. In addition, even though we may not need additional funds, we may still elect to foreign currency exchange rate fluctuations issell additional equity or debt securities or obtain credit facilities for other reasons. If we elect to reduceraise additional funds, we may not be able to obtain such funds on a timely basis on acceptable terms, if at all. If we raise additional funds by issuing additional equity or convertible debt securities, the impactownership percentages of adverse fluctuations in such exchange rates on our earnings and cash flow. Accordingly,existing shareholders would be reduced. In addition, the equity or debt securities that we utilize purchased foreign currency option contracts and forward contractsissue may have rights, preferences or privileges senior to hedge our exposure on anticipated transactions and firm commitments. The principal currencies hedged are the euro, British pound and Japanese yen. We monitor our foreign exchange exposures regularly to ensure the overall effectivenessthose of our foreign currency hedge positions. However, there can be no assurance that our foreign currency hedging activities will substantially offset the impact of fluctuations in currency exchange rates on our results of operations and financial position. Based on the foreign exchange instruments outstanding at December 31, 2006 and 2005, an adverse change (defined as 20% in the Asian currencies and 10% in all other currencies) in exchange rates would result in a decline in the aggregate fair market value of all of our instruments outstanding of approximately $6.6 million and $4.2 million, respectively. However, as we utilize foreign currency instruments for hedging anticipated and firmly committed transactions,common stock.
Although we believe that a loss in fair valuewe have sufficient capital to fund our activities for at least the next 12 months, our future capital requirements may vary materially from those instrumentsnow planned. We anticipate that the amount of capital we will be substantially offset by increasesneed in the value of the underlying exposure. (See Note 10 of Notes to Consolidated Financial Statements for a description of our financial instruments at December 31, 2006 and 2005.)Short-term Investments. The fair value of our investments in marketable securities at December 31, 2006 and 2005 was $150.2 million and $119.8 million, respectively. Investments with maturities beyond one year are classified as short-term basedfuture will depend on their highly liquid nature and because such marketable securities represent the investment of cash that is available for current operations. Our investment policy is to manage our investment portfolio to preserve principal and liquidity while maximizing the return on our investment portfolio through the full investment of available funds. We diversify our marketable securities portfolio by investing in multiple types of investment-grade securities. Our investment portfolio is primarily invested in securities with at least an investment grade rating to minimize interest rate and credit risk as well as to provide for an immediate source of funds. Based on our investment portfolio and interest rates at December 31, 2006 and 2005, a 100 basis point increase or decrease in interest rates would result in a decrease or increase of approximately $750,000 and $600,000, respectively, in the fair value of our investment portfolio. Although changes in interest rates may affect the fair value of our investment portfolio and cause unrealized gains or losses, such gains or losses would not be realized unless the investments are sold.
many factors, including:
· general economic and political conditions and specific conditions in the markets we address, including the continuing volatility in the industrial economy, current general economic volatility and trends in the industrial economy in various geographic regions in which we do business;
· the inability of certain of our customers who depend on credit to have access to their traditional sources of credit to finance the purchase of products from us, particularly in the current global economic environment, which may lead them to reduce their level of purchases or to seek credit or other accommodations from us;
· the overall levels of sales of our products and gross profit margins;
· our business, product, capital expenditure and research and development plans, and product and technology roadmaps;
· repurchases of our common stock;
· required levels of research and development and other operating costs;
· litigation expenses, settlements and judgments;
· the levels of inventory and accounts receivable that we maintain;
· acquisitions of other businesses, assets, products or technologies;
· capital improvements for new and existing facilities;
· our relationships with suppliers and customers; and,
· the level of exercises of stock options and stock purchases under our employee stock purchase plan.
Recently Issued Accounting Pronouncements
In July 2006,April 2009, the Financial Accounting Standards Board (“FASB”) issued FASB Interpretation (“FIN”) 48,Accountingupdated FASB ASC 820 providing additional guidance for Uncertainty in Income Taxes – an interpretationestimating fair value when the volume and level of Statement of Financial Accounting Standards (“SFAS”) 109.activity for the asset or liability have significantly decreased. This interpretation clarifies the accounting for uncertainty in income taxes recognized in an entity’s financial statements in accordance with SFAS 109,Accounting for Income Taxes. It prescribesupdate also includes guidance on identifying circumstances that indicate a recognition threshold and measurement attribute for financial statement disclosure of tax positions taken or expected to be taken on a tax return. This interpretationtransaction is effective for fiscal years beginning after December 15, 2006.not orderly. We adopted FIN 48the update on JanuaryApril 1, 20072009 as required. The cumulative effect of adopting FIN 48 was recorded in retained earnings upon adoption. The adoption of FIN 48required and concluded it did not have a significantmaterial impact on our consolidated financial position or results of operations.
In September 2006,2009, the SecuritiesFASB updated FASB ASC 105, Generally Accepted Accounting Principles (FASB ASC 105). The update establishes the FASB Standards Accounting Codification (“Codification”) as the source of authoritative U.S. generally accepted accounting principles (“GAAP”) recognized by the FASB to be applied to nongovernmental entities and Exchange Commission (“SEC”) issued Staff Accounting Bulletin (“SAB”) 108 regardingrules and interpretive releases of the process of quantifying financial statement misstatements. SAB 108 states that registrants should use both a balance sheet approachSEC as authoritative GAAP for SEC registrants. The Codification supersedes all existing non-SEC accounting and an income statement approach when quantifying and evaluating the materiality of a misstatement. The interpretations in SAB 108 contain guidance on correcting errors under the dual approach as well as provide transition guidance for correcting errors.reporting standards. This interpretation does not change the requirements within SFAS 154,Accounting Changes and Error Corrections – a replacement of APB 20 and FASB Statement 3, for the correction of an error on financial statements. SAB 108update is effective for annual financial statements covering the first fiscal yearissued for interim and annual periods ending after NovemberSeptember 15, 2006.2009. We adopted this interpretationthe update on December 31, 2006. The adoption of SAB 108July 1, 2009, as required and concluded it did not have a significant effectmaterial impact on our consolidated financial statements.position or results of operations.
In September 2006,October 2009, the FASB issued SFAS 157,Fair Value Measurements. This standard defines fair value, establishesupdated FASB ASC 605, Revenue Recognition (FASB ASC 605) that amended the criteria for separating consideration in multiple-deliverable arrangements. The amendments establish a frameworkselling price hierarchy for measuring fair value in accounting principles generally accepteddetermining the selling price of a deliverable. The selling price used for each deliverable will be based on vendor-specific objective evidence if available, third–party evidence if vendor-specific objective evidence is not available, or estimated selling price if neither vendor-specific objective evidence nor third-party evidence is available. The amendments will change the application of the residual method of allocation and require that arrangement consideration be allocated at the inception of the arrangement to all deliverables using the relative selling price method. The relative selling price method allocates any discount in the United Statesarrangement proportionally to each deliverable on the basis of America, and expands disclosure about fair value measurements.each deliverable’s selling price. This pronouncement applies under other accounting standards that requireupdate will be effective prospectively for revenue arrangements entered into or permit fair value measurements. Accordingly, this statement does not require any new fair value measurement. This statement is effective formaterially modified in fiscal years beginning on or after NovemberJune 15, 2007, and interim periods within those fiscal years. We will be required to adopt SFAS 157 in the first quarter of fiscal year 2008.2010. Early adoption is permitted. We are currently evaluating the requirements of SFAS 157this update and have not yet determined the impact on our consolidated financial statements.
In March 2006,October 2009, the Emerging Issues Task Force (“EITF”) reached a consensus on EITF Issue 06-3,How Taxes Collected from CustomersFASB updated FASB ASC 985, Software (FASB ASC 985) that changes the accounting model for revenue arrangements that include both tangible products and Remittedsoftware elements. Tangible products containing software components and non-software components that function together to Governmental Authorities Should Be Presented indeliver the Income Statement (that is, Gross versus Net Presentation). Taxestangible product’s essential functionality are no longer within the scope of EITF Issue 06-3 include any taxes assessed bythe software revenue guidance in Subtopic 985-605. In addition, the amendments require that hardware components of a governmental authority thattangible product containing software components always be excluded from the software revenue guidance. This update will be effective prospectively for revenue arrangements entered into or materially modified in fiscal years beginning on or after June 15, 2010. Early adoption is permitted. We are directly imposed on a revenue-producing transaction between a sellercurrently evaluating the requirements of this update and a customer and may include, but arehave not limited to, sales taxes, use taxes, value-added taxes, and some excise taxes. The EITF concluded thatyet determined the presentation of these taxes on either a gross (included in revenues and costs) or a net (excluded from revenue) basis is an accounting policy decision that should be disclosed. For any such taxes that are reported on a gross basis, a company should disclose the amounts of those taxes in interim and annual financial statements. Our policy is to exclude all such taxes from revenue. The provisions of EITF 06-3 are effective for interim and annual reporting periods beginning after December 15, 2006. The adoption of EITF 06-3 will not have any effectimpact on our consolidated financial statements.
Critical Accounting Policies
The preparation of our financial statements in conformity with generally accepted accounting principles requires us to make estimates and assumptions that affect the reported amounts of assets, liabilities, revenues, expenses and related disclosures of contingent assets and liabilities. We base our estimates on past experience and other assumptions that we believe are reasonable under the circumstances, and we evaluate these estimates on an ongoing basis. Our critical accounting policies are those that affect our financial statements materially and involve difficult, subjective or complex judgments by management. Although these estimates are based on management's best knowledge of current events and actions that may impact the company in the future, actual results may be materially different from the estimates.
Our critical accounting policies are as follows:
o Revenue recognition
We derive revenue primarily from the sale/licensing of integrated hardware and software solutions. We also sell application software licenses which are sold separately as well as training and post contract support services. The products and services are generally sold under standardized licensing and sales arrangements with payment terms ranging from net 30 days in the United States to net 30 days and up to net 90 days in some international markets. Approximately 95% of our product/license sales include both hardware and software in the customer arrangement, with a small percentage of sales including other services. We offer rights of return and standard warranties for product defects related to our products. The rights of return are generally for a period of up to 30 days after the delivery date. The standard warranties cover periods ranging from 90 days to three years. We do not enter into contracts requiring product acceptance from the customer.
· Revenue is recognized in accordance with the provisions of SOP 97-2 when persuasive evidence of an arrangement exists, delivery has occurred, the fee is fixed or determinable, and collectability is probable. We enter into certain arrangements where we are obligated to deliver multiple products and/or services (“multiple elements”). In these transactions, we allocate the total revenue among the elements based on the sales price of each element when sold separately (“vendor-specific objective evidence”).recognition
We derive revenue primarily from the sale/licensing of integrated hardware and software solutions. Independent sales of application software licenses include post contract support services. In addition, training services are sold separately. The products and services are generally sold under standardized licensing and sales arrangements with payment terms ranging from net 30 days in the U.S. to net 30 days and up to net 90 days in some international markets. Approximately 83% of our product/license sales include both hardware and software in the customer arrangement, with a small percentage of sales including other services. We offer rights of return and standard warranties for product defects related to our products. The rights of return are generally for a period of up to 30 days after the delivery date. The standard warranties cover periods ranging from 90 days to three years. We do not generally enter into contracts requiring product acceptance from the customer.
Revenue is recognized in accordance with the provisions of FASB ASC 985, when persuasive evidence of an arrangement exists, delivery has occurred, the fee is fixed or determinable, and collectability is probable. We enter into certain arrangements where we are obligated to deliver multiple products and/or services (“multiple elements”). In these transactions, we allocate the total revenue among the elements based on vendor specific objective evidence (“VSOE”) of fair value as determined by the sales price of each element when sold separately.
When VSOE of fair value is available for the undelivered element of a multiple element arrangements, sales revenue is generally recognized on the date the product is shipped, using the residual method under FASB ASC 985, with a portion of revenue recorded as deferred (unearned) due to applicable undelivered elements. Undelivered elements for our multiple element arrangements with a customer are generally restricted to post contract support and training and education. The amount of revenue allocated to these undelivered elements is based on the VSOE of fair value for those undelivered elements. Deferred revenue due to undelivered elements is recognized ratably on a straight-line basis over the service period or when the service is completed. When VSOE of fair value is not available for the undelivered element of a multiple element arrangement, sales revenue is generally recognized ratably, on a straight-line basis over the service period of the undelivered element, generally 12 months or when the service is completed in accordance with the subscription method under FASB ASC 985. Deferred revenue at December 31, 2009 and 2008 was $57 million and $46 million, respectively.
The application of FASB ASC 985, requires judgment, including whether a software arrangement includes multiple elements, and if so, whether VSOE of fair value exists for those elements. Changes to the elements in a software arrangement, the ability to identify VSOE for those elements, the fair value of the respective elements, and changes to a product’s estimated life cycle could materially impact the amount of our earned and unearned revenue. Judgment is also required to assess whether future releases of certain software represent new products or upgrades and enhancements to existing products.
· Sales revenue from product sales is generally recognized on the date the product is shipped, with a portion of revenue recorded as deferred (unearned) due to applicable undelivered elements. Undelivered elements for our multiple-element arrangements with a customer are generally restricted to post contract support and training and education. The amount of revenue allocated to these undelivered elements is based on the vendor-specific objective evidence (“VSOE”) of fair value for those undelivered elements. Deferred revenue due to undelivered elements is recognized ratably on a straight-line basis over the service period or when the service is completed. Deferred revenue at December 31, 2006 and 2005 was $22.2 million and $16.0 million, respectively.
The application of SOP 97-2 requires judgment, including whether a software arrangement includes multiple elements, and if so, whether VSOE of fair value exists for those elements. Changes to the elements in a software arrangement, the ability to identify VSOE for those elements, the fair value of the respective elements, and changes to a product's estimated life cycle could materially impact the amount of earned and unearned revenue. Judgment is also required to assess whether future releases of certain software represent new products or upgrades and enhancements to existing products.
Provision for estimated sales returns is made by reducing recorded revenue based on historical experience. The accounts receivable are net ofEstimating allowances for doubtful accounts and sales returns of $4.4 million and $4.7 million at December 31, 2006 and 2005, respectively.
The preparation of financial statements requires that we make estimates and assumptions of potential future product returns related to current period product revenue. We analyze historical returns, current economic trends, and changes in customer demand and acceptance of our products when evaluating the adequacy of our sales returns allowance. Significant judgments and estimates must be made and used in connection with establishing the sales returns allowance in any accounting period. A provision for estimated sales returns is made by reducing recorded revenue by the amount of the allowance. Accounts receivable is reported net of the allowance for sales returns. The allowance for sales returns was $1.9 million and $1.8 million at December 31, 2009 and 2008, respectively. Material differences may result in the amount and timing of our revenue for any period if we made different judgments or utilized different estimates or if actual results varied materially from our estimates.
· o Estimating allowances, specifically sales returns, the allowance for doubtful accounts and the adjustment for excess and obsolete inventories
In addition to estimating an allowance for sales returns, we must also make estimates about the uncollectability of our accounts receivables. We specifically analyze accounts receivable and analyze historical bad debts, customer concentrations, customer credit-worthiness and current economic trends when evaluating the adequacy of our allowance for doubtful accounts. Our allowance for doubtful accounts was $2.7 million and $3.9 million at December 31, 2009 and 2008, respectively. We also write down our inventory for estimated obsolescence or unmarketable inventory equal to the difference between the cost of inventory and estimated market value based on assumptions of future demand and market conditions. Our allowance for excess and obsolete inventories was $4.4 million and $4.4 million at December 31, 2009 and 2008, respectively. Significant judgments and estimates must be made and used in connection with establishing these allowances. Material differences may result in the amount and timing of our bad debt and inventory obsolescence if we made different judgments or utilized different estimates or if actual results varied materially from our estimates.
· The preparation of financial statements requires that we make estimates and assumptions that affect the reported amount of assets and liabilities and disclosure of contingent assets and liabilities at the date of the financial statements and the reported amounts of revenues and expenses during the reported period. Specifically, we must make estimates of potential future product returns related to current period product revenue. Management analyzes historical returns, current economic trends, and changes in customer demand and acceptance of our products when evaluating the adequacy of our sales returns and other allowances. Significant management judgments and estimates must be made and used in connection with establishing the sales returns and other allowances in any accounting period. The allowance for sales returns was $1.5 million at December 31, 2006. Material differences may result in the amount and timing of our revenue for any period if management made different judgments or utilized different estimates. Similarly, management must make estimates of the uncollectability of our accounts receivables. Management specifically analyzes accounts receivable and analyzes historical bad debts, customer concentrations, customer credit-worthiness and current economic trends when evaluating the adequacy of our allowance for doubtful accounts. The allowance for doubtful accounts was $2.9 million at December 31, 2006. We write down our inventory for estimated obsolescence or unmarketable inventory equal to the difference between the cost of inventory and estimated market value based on assumptions of future demand and market conditions. Our adjustment for excess and obsolete inventories was $5.2 million at December 31, 2006. If actual market conditions are less favorable than those projected by management, additional inventory write downs would be required.
o Accounting for costs of computer software
We capitalize costs related to the development and acquisition of certain software products. Capitalization of costs begins when technological feasibility has been established and ends when the product is available for general release to customers. Technological feasibility for our products is established when the product is available for beta release. Judgment is required in determining when technological feasibility of a product is established. Amortization is computed on an individual product basis for those products available for market and has been recognized based on the product’s estimated economic life, generally three years. At each balance sheet date, the unamortized costs are reviewed by management and reduced to net realized value when necessary. As of December 31, 2009, unamortized capitalized software development costs were $18 million.
· We capitalize costs related to the development and acquisition of certain software products. Capitalization of costs begins when technological feasibility has been established and ends when the product is available for general release to customers. Judgment is required in determining when technological feasibility of a product is established. Amortization is computed on an individual product basis for those products available for market and has been recognized based on the product’s estimated economic life, generally three years. At each balance sheet date, the unamortized costs are reviewed by management and reduced to net realized value when necessary. As of December 31, 2006, unamortized capitalized software development costs was $15.8 million.
o Valuation of long-lived and intangible assets
We assess the impairment of identifiable intangibles, long-lived assets and related goodwill whenever events or changes in circumstances indicate that the carrying value may not be recoverable. In accordance with FASB ASC 350, Intangibles – Goodwill and Other (FASB ASC 350), goodwill is tested for impairment on an annual basis, and between annual tests if indicators of potential impairment exist, using a fair-value-based approach based on the market capitalization of the reporting unit. Our annual impairment test was performed as of February 28, 2009. No impairment of goodwill has been identified during the period presented. Goodwill is deductible for tax purposes in certain jurisdictions. We have defined our operating segment based on geographic regions. We sell our products in three geographic regions. Our sales to these regions share similar economic characteristics, similar product mix, similar customers, and similar distribution methods. Accordingly, we have elected to aggregate these three geographic regions into a single operating segment. As we have one reporting segment, we allocate goodwill to one reporting unit for goodwill impairment testing. Factors considered important which could trigger an impairment review include the following:
· We assess the impairment of identifiable intangibles, long-lived assets and related goodwill whenever events or changes in circumstances indicate that the carrying value may not be recoverable. Factors considered important which could trigger an impairment review include the following:
oSignificantsignificant underperformance relative to expected historical or projected future operating results;
o· Significantsignificant changes in the manner of our use of the acquired assets or the strategy for our overall business;
o· Significantsignificant negative industry or economic trends; and,
o· Ourour market capitalization relative to net book value.
When it is determined that the carrying value of intangibles, long-lived assets and related goodwill may not be recoverable based upon the existence of one or more of the above indicators of impairment, the measurement of any impairment is determined and the carrying value is reduced as appropriate. As of December 31, 2009, we had net goodwill of approximately $65 million.
· When it is determined that the carrying value of intangibles, long-lived assets and related goodwill may not be recoverable based upon the existence of one or more of the above indicators of impairment, the measurement of any impairment is determined and the carrying value is reduced as appropriate. As of December 31, 2006, we had net goodwill of approximately $53.3 million.
o Accounting for income taxes
We account for income taxes under the asset and liability method that requires the recognition of deferred tax assets and liabilities for the expected future tax consequences of events that have been recognized in our financial statements or tax returns. Judgment is required in assessing the future tax consequences of events that have been recognized in our financial statements or tax returns. Variations in the actual outcome of these future tax consequences could materially impact our financial position or our results of operations. In estimating future tax consequences, all expected future events are considered other than enactments of changes in tax laws or rates. Valuation allowances are established when necessary to reduce deferred tax assets to amounts which are more likely than not to be realized.
As a result of certain foreign investment incentives available under Hungarian law, the profit from our Hungarian operation was subject to a reduced income tax rate. This special tax status terminated on January 1, 2008, with the merger of our Hungarian manufacturing operations with its Hungarian parent company. The tax position of our Hungarian operation continued to benefit from assets created by the restructuring of our operations in Hungary. Realization of these assets was based on estimated future earnings in Hungary. Partial release of the valuation allowance on these assets resulted in income tax benefits of $18.3 million for the year ended December 31, 2007, and $8.7 million for the year ended December 31, 2008.
For the year 2009, we expected to recognize an additional tax benefit of $9.7 million related to these assets. Effective January 1, 2010, a new tax law in Hungary provides for an enhanced deduction for the qualified research and development expenses of NI Hungary Software and Hardware Manufacturing Kft. ("NI Hungary"). During the three months ended December 31, 2009, we obtained confirmation of the application of this new tax law for the qualified research and development expenses of NI Hungary. Based on the application of this new tax law to the qualified research and development expense of NI Hungary, we no longer expect to have sufficient future taxable income in Hungary to realize the benefits of these tax assets. As such, we recorded an income tax charge of $21.6 million during the three months ended December 31, 2009, $18.4 million of which was related to a valuation allowance on the previously recognized assets created by the restructuring and $3.2 million of which was related to tax benefits from other assets that we will no longer be able to realize as a result of this change. We do not expect to realize the tax benefit of the remaining assets created by the restructuring and therefore we have a full valuation allowance of $98.2 million against those assets at December 31, 2009.For additional discussion about our income taxes including components of income before income taxes, our provision for income taxes charged to operations, components of our deferred tax assets and liabilities, a reconciliation of income taxes at the U.S. federal statutory rate of 35% to our effective tax rate and other tax matters, see Note 9 – Income taxes of Notes to Consolidated Financial Statements.· We account for income taxes under the asset and liability method that requires the recognition of deferred tax assets and liabilities for the expected future tax consequences of events that have been recognized in our financial statements or tax returns. Judgment is required in assessing the future tax consequences of events that have been recognized in our financial statements or tax returns. Variations in the actual outcome of these future tax consequences could materially impact our financial position or our results of operations. In estimating future tax consequences, all expected future events are considered other than enactments of changes in tax laws or rates. Valuation allowances are established when necessary to reduce deferred tax assets to amounts which are more likely than not to be realized.Loss contingencies
As a result of certain foreign investment incentives available under Hungarian law, the profit from our Hungarian operation is currently subject to a reduced income tax rate. These benefits may not be available in the future due to changes in Hungary’s political condition and/or tax laws. The reduction or elimination of these foreign investment incentives would result in the reduction or elimination of certain tax benefits thereby increasing our future effective income tax rate, which could have a material adverse effect on our operating results.
We accrue for probable losses from contingencies including legal defense costs, on an undiscounted basis, in accordance with FASB ASC 450, Contingencies (FASB ASC 450), when such costs are considered probable of being incurred and are reasonably estimable. We periodically evaluate available information, both internal and external, relative to such contingencies and adjust this accrual as necessary. Disclosure of a contingency is required if there is at least a reasonable possibility that a loss has been incurred. In determining whether a loss should be accrued we evaluate, among other factors, the degree of probability of an unfavorable outcome and the ability to make a reasonable estimate of the amount of loss. Changes in these factors could materially impact our financial position or our results of operation.
We receive a substantial income tax benefit from the extraterritorial income (“ETI”) exemption under U.S. law. The ETI rules were repealed for transactions after December 31, 2004, with a two-year transition period, and ceased to be available as of December 31, 2006. The repeal of ETI will increase our future effective income tax rate by approximately one percentage point in December 31, 2007. However, we believe this increase will be offset entirely by the effects of the expected increased benefit from the deduction for income from qualified domestic production activities and increased profits in certain foreign jurisdictions with reduced income tax rates.
o Loss contingencies
We accrue for probable losses from contingencies including legal defense costs, on an undiscounted basis, in accordance with SFAS 5,Accounting for Loss Contingencies, when such costs are considered probable of being incurred and are reasonably estimable. We periodically evaluate available information, both internal and external, relative to such contingencies and adjust this accrual as necessary. Disclosure of a contingency is required if there is at least a reasonable possibility that a loss has been incurred. In determining whether a loss should be accrued we evaluate, among other factors, the degree of probability of an unfavorable outcome and the ability to make a reasonable estimate of the amount of loss. Changes in these factors could materially impact our financial position or our results of operation.
ITEM 7A. QUANTITATIVE AND QUALITATIVE DISCLOSURES ABOUT MARKET RISK
Financial Risk Management
Our international sales are subject to inherent risks, including fluctuations in local economies; fluctuations in foreign currencies relative to the U.S. dollar; difficulties in staffing and managing foreign operations; greater difficulty in accounts receivable collection; costs and risks of localizing products for foreign countries; unexpected changes in regulatory requirements, tariffs and other trade barriers; difficulties in the repatriation of earnings and burdens of complying with a wide variety of foreign laws. The informationvast majority of our sales outside of North America are denominated in local currencies, and accordingly, the U.S. dollar equivalent of these sales is affected by changes in the foreign currency exchange rates. Net of hedging results, the change in exchange rates had the effect of decreasing our consolidated sales by $29 million or 4% for the year ended December 31, 2009, compared to 2008. If the local currencies in which we sell our products strengthen against the U.S. dollar, we may need to lower our prices in the local currency to remain competitive in our international markets which could have a material adverse effect on our gross and net profit margins. If the local currencies in which we sell our products weaken against the U.S. dollar and if the local sales prices cannot be raised due to competitive pressures, we will experience a deterioration of our gross and net profit margins. Since most of our international operating expenses are also incurred in local currencies, the change in exchange rates had the effect of decreasing our operating expenses by $12 million or 2% for the year ended December 31, 2009, compared to 2008. Currently, we are experiencing significant volatility in foreign currency exchange rates in many of the markets in which we do business. This has had a significant impact on the revaluation of our foreign currency denominated firm commitments and on our ability to forecast our U.S. dollar equivalent revenues and expenses. In the past, these dynamics have also adversely affected our revenue growth in international markets and will likely pose similar challenges in the future. Our foreign currency hedging program includes both foreign currency forward and purchased option contracts to reduce the effect of exchange rate fluctuations. However, our hedging program will not eliminate all of our foreign exchange risks, particularly when market conditions experience the recent level of volatility. (See “Net Foreign Exchange Gain (Loss)” and Note 4 – Derivative instruments and hedging activities of Notes to Consolidated Financial Statements).
Inventory ManagementThe marketplace for our products dictates that many of our products be shipped very quickly after an order is received. As a result, we are required to maintain significant inventories. Therefore, inventory obsolescence is a risk for us due to frequent engineering changes, shifting customer demand, the emergence of new industry standards and rapid technological advances including the introduction by this itemus or our competitors of products embodying new technology. While we adjust for excess and obsolete inventories and we monitor the valuation of our inventories, there can be no assurance that our valuation adjustments will be sufficient.
Market RiskWe are exposed to a variety of risks, including foreign currency fluctuations and changes in the market value of our investments. In the normal course of business, we employ established policies and procedures to manage our exposure to fluctuations in foreign currency values and changes in the market value of our investments.Cash, Cash Equivalents and Short-Term Investments
At December 31, 2009, we had $289 million in cash, cash equivalents and short-term investments. We maintain cash and cash equivalents with various financial institutions located in many countries throughout the world. Approximately $114 million or 39% of these amounts were held in domestic accounts with various financial institutions and $175 million or 61% was held in accounts outside of the U.S. with various financial institutions. At December 31, 2009, $85 million or 42% of our cash and cash equivalents was held in cash in various operating accounts throughout the world, and $116 million or 58% was held in money market accounts. The most significant of our operating accounts was our domestic operating account which held approximately $22 million or 11% of our total cash and cash equivalents at a bank that carried a A1 rating at December 31, 2009. Our short-term investment balance is incorporatedcomprised of $35 million held in our investment accounts in the U.S. and $52 million held in investment accounts of our foreign subsidiaries.
Short-term debt securities available-for-sale included auction rate securities backed by referenceeducation loan revenue bonds. One of our auction rate securities is from the Vermont Student Assistance Corporation and has a par value of $2.2 million. The other of our auction rate securities is from the New Hampshire Health and Education Facilities Authority and has a par value of $6.4 million. At December 31, 2009, we reported these auction rate securities at their estimated fair market value of $8.2 million as a component of short-term debt securities available for sale. We are also a party to “Item 7—Management’s Discussiona UBS Auction Rate Securities Rights (the “Rights”) agreement. The Rights agreement is a nontransferable right to sell our auction rate securities, at par value, back to UBS at any time during the period June 30, 2010, through July 2, 2012. At December 31, 2009, we reported the Rights agreement at its estimated fair market value of $423,000 as a component of short-term debt securities available for sale. See Note 3 – Fair value measurements in Notes to Consolidated Financial Statements for further discussion of our auction rate securities and Analysisour Rights agreement.
Due to the fact that our Rights agreement has an initial exercise date that is less than one year from now, we are now reporting our auction rate securities and the corresponding Rights agreement as short-term. We continue to have the ability to hold our auction rate securities to their ultimate maturities which are in excess of one year and we have not made a determination as to whether we will exercise our option under the Rights agreement or if we do choose to exercise our option, at what point during the period June 30, 2010 through July 2, 2012, we would exercise our option. We have recorded the unrealized loss related to the auction rate securities and the unrealized gain related to the Rights agreement as a component of other income (expense), in our Consolidated Statements of Income.
We do not anticipate that the auction rate market will provide liquidity for these securities in the foreseeable future. Should we need or desire to access the funds invested in those securities prior to their maturity or prior to our exercise period under the Rights agreement discussed above, we may be unable to find a buyer in a secondary market outside the auction process or if a buyer in a secondary market is found, we would likely realize a loss.
We maintain an investment portfolio of various types of security holdings and maturities. Pursuant to FASB ASC 820, cash equivalents and short-term investments available-for-sale are valued using a market approach (Level 1) based on the quoted market prices of identical instruments when available or other observable inputs such as trading prices of identical instruments in inactive markets. The estimated fair market value of both the auction rate securities and the Rights agreement was determined using significant unobservable inputs (Level 3) as prescribed by FASB ASC 820.
The goal of our investment policy is to manage our investment portfolio to preserve principal and liquidity while maximizing the return on our investment portfolio through the full investment of available funds. We place our cash investments in instruments that meet credit quality standards, as specified in our corporate investment policy guidelines. These guidelines also limit the amount of credit exposure to any one issue, issuer or type of instrument. Other than our auction rate securities discussed above, at December 31, 2009, our cash equivalents and short-term investments carried ratings from the major credit rating agencies that were in accordance with our corporate investment policy. Our investment policy allows investments in the following; government and federal agency obligations, repurchase agreements (“Repos”), certificates of deposit and time deposits, corporate obligations, medium term notes and deposit notes, commercial paper including asset-backed commercial paper (“ABCP”), puttable bonds, general obligation and revenue bonds, money market funds, taxable commercial paper, corporate notes/bonds, municipal notes, municipal obligations, variable rate demand notes and tax exempt commercial paper. All such instruments must carry minimum ratings of A1/P1/F1, MIG1/VMIG1/SP1 and A2/A/A, as applicable, all of which are considered “investment grade”. Our investment policy for marketable securities requires that all securities mature in three years or less, with a weighted average maturity of no longer than 18 months with at least 10% maturing in 90 days or less.
We account for our investments in debt and equity instruments under FASB ASC 320. Our investments are classified as available-for-sale and accordingly are reported at fair value, with unrealized gains and losses reported as other comprehensive income, a component of shareholders’ equity. Unrealized losses are charged against income when a decline in fair value is determined to be other than temporary. Investments with maturities beyond one year are classified as short-term based on their highly liquid nature and because such marketable securities represent the investment of cash that is available for current operations. The fair value of our short-term investments in debt securities at December 31, 2009 and December 31, 2008 was $87 million and $6 million, respectively. The increase was due to the net purchase of $74 million of short-term investments and the transfer of $8.6 related to our auction rate securities and our rights agreement from long-term investments to short-term investments during the year ended December 31, 2009. The net purchase of $74 million of short term investments was done to diversify our holdings from money market accounts to debt securities and to take advantage of higher yields associated with longer maturity debt securities. We follow the guidance provided by FASB ASC 320 to assess whether our investments with unrealized loss positions are other than temporarily impaired. Realized gains and losses and declines in value judged to be other than temporary are determined based on the specific identification method and are reported in other income (expense), net, in our Consolidated Statements of Income.Long-Term Investments
At December 31, 2008, our long-term investments consisted primarily of Aaa/A/AAA rated investments in auction rate securities that we originally purchased for $8.6 million. These auction rate securities consist of education loan revenue bonds. Auction rate securities are variable rate debt instruments whose interest rates are typically reset approximately every 7 to 35 days. At December 31, 2008, we classified these investments as long-term due to the fact that the underlying securities have contractual maturities that are greater than one year. These contractual maturities are also in excess of the guidelines provided for in our corporate investment policy. The auction rate securities are classified as available-for-sale. At December 31, 2008, we reported these long-term investments at their estimated fair market value of $7.0 million. In November 2008, we accepted the Rights agreement offered by UBS as a liquidity alternative to the failed auction process. The Rights agreement is a nontransferable right to sell our auction rate securities, at par value, back to UBS at any time during the period June 30, 2010, through July 2, 2012. At December 31, 2008, we reported the Rights agreement at its estimated fair market value of $1.6 million. At December 31, 2008 he estimated fair market value of both the auction rate securities and the Rights agreement was determined using significant unobservable inputs (Level 3) as prescribed by FASB ASC 820. These auction rate securities and the Rights agreement are now reported as a component of short-term investments as discussed above.
Interest Rate Risk
Investments in both fixed rate and floating rate instruments carry a degree of interest rate risk. Fixed rate securities may have their market value adversely impacted due to an increase in interest rates, while floating rate securities may produce less income than expected if interest rates fall. Due in part to these factors, our future investment income may fall short of expectations due to changes in interest rates or if the decline in fair value of our publicly traded debt investments is judged to be other-than-temporary. We may suffer losses in principal if we are forced to sell securities that have declined in market value due to changes in interest rates. However, because any debt securities we hold are classified as available-for-sale, no gains or losses are realized in the income statement due to changes in interest rates unless such securities are sold prior to maturity or unless declines in value are determined to be other-than-temporary. These securities are reported at fair value with the related unrealized gains and losses included in accumulated other comprehensive income (loss), a component of shareholders’ equity, net of tax.
In a declining interest rate environment, as short-term investments mature, reinvestment occurs at less favorable market rates. Given the short-term nature of certain investments, the current interest rate environment of low or declining rates will likely negatively impact our investment income.
In order to assess the interest rate risk associated with our investment portfolio, we performed a sensitivity analysis to determine the impact a change in interest rates would have on the value of the investment portfolio assuming a 100 basis point parallel shift in the yield curve. Based on our investment positions as of December 31, 2009, a 100 basis point increase or decrease in interest rates across all maturities would result in a $614,000 increase or decrease in the fair market value of the portfolio. As of December 31, 2008, a similar 100 basis point shift in the yield curve would have resulted in a $50,000 increase or decrease in the fair market value of the portfolio. Such losses would only be realized if we sold the investments prior to maturity or if there is a other than temporary impairment.
Actual future gains and losses associated with our investments may differ from the sensitivity analyses performed as of December 31, 2009 due to the inherent limitations associated with predicting the changes in the timing and level of interest rates and our actual exposures and positions.
Economic conditions in 2008 and 2009 had negative effects on the financial markets. In response to these conditions, we shifted a larger percentage of our portfolio to money market funds, U.S. Treasuries and time deposits toward the end of 2008. This had a negative impact on our investment income in 2009. As we noted some stabilization in the financial markets throughout 2009, we made net purchases of $74 million of short-term investments, primarily to diversify our holdings from money market accounts to debt securities and to take advantage of higher yields associated with longer maturity debt securities. However, yields, even at longer maturities, remained at or near historic lows throughout 2009. We cannot predict when interest rates and investment yields will rise. If yields continue to stay at these low levels, our investment income will continue to be negatively impacted.
Exchange Rate RiskOur objective in managing our exposure to foreign currency exchange rate fluctuations is to reduce the impact of adverse fluctuations in such exchange rates on our earnings and cash flow. Accordingly, we utilize purchased foreign currency option and forward contracts to hedge our exposure on anticipated transactions and firm commitments. The principal currencies hedged are the Euro, British pound, Japanese yen and Hungarian forint. We monitor our foreign exchange exposures regularly to help ensure the overall effectiveness of our foreign currency hedge positions. There can be no assurance that our foreign currency hedging activities will substantially offset the impact of fluctuations in currency exchanges rates on our results of operations and financial position. Based on the foreign exchange instruments outstanding at December 31, 2009 and December 31, 2008, an adverse change (defined as 20% in the Asian currencies and 10% in all other currencies) in exchange rates would result in a decline in the aggregate settlement value of all of our instruments outstanding of approximately $22 million and $31 million, respectively. However, as we utilize foreign currency instruments for hedging anticipated and firmly committed transactions, we believe that a loss in settlement value for those instruments will be substantially offset by increases in the value of the underlying exposure. (See Note 4 - Derivative instruments and hedging activities of Notes to Consolidated Financial ConditionStatements for a further description of our derivative instruments and Results of Operations—Market Risk” above.hedging activities).
ITEM 8. FINANCIAL STATEMENTS AND SUPPLEMENTARY DATA
The information required by this item is incorporated by reference to the Consolidated Financial Statements set forth on pages F-1 through F-27 and S-1F-31 hereof.
ITEM 9. CHANGES IN AND DISAGREEMENTS WITH ACCOUNTANTS ON ACCOUNTING AND FINANCIAL DISCLOSURE
There were no disagreements with accountants on accounting and financial disclosure for the year ended December 31, 2006.2009.
ITEM 9A. CONTROLS AND PROCEDURES
Evaluation of Disclosure Controls and Procedures
As of the end of the period covered by this Annual Report on Form 10-K, as required by paragraph (b) of Rule 13a-15 or Rule 15d-15 under the Securities Exchange Act of 1934, as amended, we evaluated under the supervision of our Chief Executive Officer, Dr. James Truchard, and our Chief Financial Officer, the effectivenessAlex Davern, based on their evaluation of our disclosure controls and procedures (as defined in Rules 13a-15(e) orand 15d-15(e) of the Securities Exchange Act of 1934, as amended). Based on this evaluation, our Chief Executive Officer and our Chief Financial Officer, required by paragraph (b) of Rule 13a – 15 or Rule 15d – 15, have concluded that our disclosure controls and procedures arewere effective at the reasonable assurance level, to ensure the timely collection, evaluation and disclosure of information relating to us that information we are requiredwould potentially be subject to disclose in reports that we file or submitdisclosure under the Securities Exchange Act of 1934, (i)as amended, and the rules and regulations promulgated there under, and that such information is recorded, processed, summarized and reported within the time periods specified in Securities and Exchange Commissionthe SEC’s rules and forms,forms. These disclosure controls and (ii)procedures include, without limitation, controls and procedures designed to ensure that information required to be disclosed by us in the reports we file or submit is accumulated and communicated to our management, including our Chief Executive Officer and our Chief Financial Officer, as appropriate to allow timely decisions regarding required disclosure. Our disclosure controls and procedures are designed to provide reasonable assurance that such information is accumulated and communicated to our management. Our disclosure controls and procedures include components of our internal control over financial reporting. Management’s assessment of the effectiveness of our internal controlcontrols over financial reporting is expressed at the level of reasonable assurance because a control system, no matter how well designed and operated, can provide only reasonable, but not absolute assurance that the control system’s objectives will be met. We continue to enhance our internal control over financial reporting in key functional areas with the goal of monitoring our operations at the level of documentation, segregation of duties, and systems security necessary, as well as transactional control procedures required under Auditing Standard No. 5 issued by the Public Company Accounting Oversight Board. We discuss and disclose these matters to the audit committee of our board of directors and to our auditors.
Management Report on Internal Control over Financial Reporting
Our management is responsible for establishing and maintaining adequate internal control over financial reporting to provide reasonable assurance regarding the reliability of our financial reporting and the preparation of financial statements for external purposes in accordance with generally accepted accounting principles. Internal control over financial reporting includes those policies and procedures that (i) pertain to the maintenance of records that in reasonable detail accurately and fairly reflect the transactions and dispositions of the assets of the company, (ii) provide reasonable assurance that transactions are recorded as necessary to permit preparation of financial statements in accordance with generally accepted accounting principles, and that receipts and expenditures of the Company are being made only in accordance with authorizations of management and directors of the Company; and (iii) provide reasonable assurance regarding prevention or timely detection of unauthorized acquisition, use or disposition of the Company’s assets that could have a material effect on the financial statements.
Management assessed our internal control over financial reporting as of December 31, 2006,2009, which was the end of our fiscal year. Management based its assessment on criteria established in Internal Control – Integrated Framework issued by the Committee of Sponsoring Organizations of the Treadway Commission. Management’s assessment included evaluation of such elements as the design and operating effectiveness of key financial reporting controls, process documentation, accounting policies, and our overall control environment. This assessment is supported by testing and monitoring performed by our finance organization.
Based on our assessment, management has concluded that our internal control over financial reporting was effective as of the end of the fiscal year to provide reasonable assurance regarding the reliability of financial reporting and the preparation of financial statements for external reporting purposes in accordance with generally accepted accounting principles. We reviewed the results of management’s assessment with the Audit Committee of our Board of Directors.
Our independent registered public accounting firm, Ernst & Young LLP, who also audited our consolidated financial statements, audited management’s assessment and independently assessed the effectiveness of our internal control over financial reporting. Ernst & Young LLP has issued their attestation report, which is included in Part II, Item 8 of this Form 10-K.
Changes in Internal Control over Financial Reporting
During the three months ended December 31, 2006,2009, there was no change in our internal control over financial reporting identified in connection with the evaluation required by paragraph (d) of Rule 13a-15 or Rule 15d-15 that has materially affected, or is reasonably likely to materially affect, our internal control over financial reporting.
ITEM 9B. OTHER INFORMATION
None.
PART III
Certain information required by Part III is omitted from this Report in that we intend to file a definitive proxy statement pursuant to Regulation 14A with the Securities and Exchange Commission (the “Proxy Statement”) relating to our annual meeting of stockholders not later than 120 days after the end of the fiscal year covered by this Report, and such information is incorporated by reference herein.
ITEM 10. DIRECTORS, EXECUTIVE OFFICERS AND CORPORATE GOVERNANCE
The information concerning our directors required by this Item pursuant to Item 401 of Regulation S-K will appear in our Proxy Statement under the section “Election of Directors” and such information is incorporated herein by reference.
The information concerning our executive officers required by this Item pursuant to Item 401 of Regulation S-K will appear in our Proxy Statement under the section “Executive Officers” and such information is incorporated herein by reference.
The information required by this Item pursuant to Item 405 of Regulation S-K regarding compliance with Section 16(a) of the Securities Exchange Act of 1934, as amended, will appear in our Proxy Statement under the section “Section 16(a) Beneficial Ownership Reporting Compliance” and such information is incorporated herein by reference.
The information concerning our code of ethics that applies to our principal executive officer, our principal financial officer, our controller or person performing similar functions required by this Item pursuant to Item 406 of Regulation S-K will appear in our Proxy Statement under the section “Code of Ethics” and such information is incorporated herein by reference.
The information required by this Item pursuant to Item 407(c)(3) of Regulation S-K regarding material changes, if any, to procedures by which security holders may recommend nominees to our board of directors will appear in our Proxy Statement under the section “Deadline for Receipt of Stockholder Proposals” and such information is incorporated herein by reference.
The information required by this Item pursuant to Item 407(d)(4) and Item 407(d)(5) of Regulation S-K regarding our Audit Committee and our audit committee financial expert(s), respectively, will appear in our Proxy Statement under the heading “Corporate Governance” and such information is incorporated herein by reference.
ITEM 11. EXECUTIVE COMPENSATION
The information required by this Item pursuant to Item 402 of Regulation S-K regarding director compensation will appear in our Proxy Statement under the section “Board Compensation” and such information is incorporated herein by reference.
The information required by this Item pursuant to Item 402 of Regulation S-K regarding executive officer compensation, including our Compensation Discussion & Analysis, will appear in our Proxy Statement under the section “Executive Compensation” and such information is incorporated herein by reference.
The information required by this Item pursuant to Item 407(e)(4) of Regulation S-K will appear in our Proxy Statement under the section “Compensation Committee Interlocks and Insider Participation” and such information is incorporated herein by reference.
The information required by this Item pursuant to Item 407(e)(5) will appear in our Proxy Statement under the section “Compensation Committee Report” and such information is incorporated herein by reference.
ITEM 12. SECURITY OWNERSHIP OF CERTAIN BENEFICIAL OWNERS AND MANAGEMENT AND RELATED STOCKHOLDER MATTERS
From time to time our directors, executive officers and other insiders may adopt stock trading plans pursuant to Rule 10b5-1(c) promulgated by the Securities and Exchange Commission under the Securities Exchange Act of 1934, as amended. Jeffrey L. Kodosky and James J. Truchard have made periodic sales of our stock pursuant to such plans.
The information required by this Item pursuant to Item 403 of Regulation S-K concerning security ownership of certain beneficial owners and management will appear in our Proxy Statement under the section “Security Ownership” and such information is incorporated herein by reference.
The information required by this Item pursuant to Item 201(d) of Regulation S-K concerning securities authorized for issuance under equity compensation plans will appear in our Proxy Statement under the section “Equity Compensation Plans Information” and such information is incorporated herein by reference.
ITEM 13. CERTAIN RELATIONSHIPS AND RELATED TRANSACTIONS AND DIRECTOR INDEPENDENCE During 2002, we irrevocably contributed approximately $3.6 million to the National Instruments Foundation, a 501(c)(3) charitable foundation established in 2002 for the purpose of continued promotion of scientific and engineering research and education at higher education institutions worldwide. Two of the four directors of the National Instruments Foundation are current officers of National Instruments.
In addition, the information required by this Item pursuant to Item 404 of Regulation S-K will appear in our Proxy Statement under the section “Certain Relationships and Related Transactions” and such information is incorporated herein by reference.
The information required by this Item pursuant to Item 407(a) of Regulation S-K regarding the independence of our directors will appear in our Proxy Statement under the section “Corporate Governance” and such information is incorporated herein by reference.
ITEM 14. PRINCIPAL ACCOUNTING FEES AND SERVICES
The information concerning principal accountant fees and services required by this Item is incorporated by reference to our Proxy Statement under the heading “Independent Public Accountants.”
The information concerning pre-approval policies for audit and non-audit services required by this Item is incorporated by reference to our Proxy Statement under the heading “Audit Committee Pre-Approval of Audit and Permissible Non-Audit Services of Independent Auditors.”
PART IV
ITEM 15. EXHIBITS AND FINANCIAL STATEMENT SCHEDULES
(a) Documents FilesFiled with Report
1. Financial Statements.
2. Financial Statement Schedules.
None
3. Exhibits.
ExhibitNumber Description 3.1(2) Certificate of Incorporation, as amended, of the Company. 3.2(11) Amended and Restated Bylaws of the Company. 3.3(4) Certificate of Designation of Rights, Preferences and Privileges of Series A Participating Preferred Stock of the Company. 4.1(1) Specimen of Common Stock certificate of the Company. 4.2(3) Rights Agreement dated as of January 21, 2004, between the Company and EquiServe Trust Company, N.A. 10.1(1) Form of Indemnification Agreement. 10.2(5) 1994 Incentive Plan, as amended.* 10.3(9) 1994 Employee Stock Purchase Plan.* 10.5(7) 2005 Incentive Plan.* 10.6(8) National Instruments Corporation Annual Incentive Program.* 10.7(6) National Instruments Corporation Annual Incentive Program, as amended.* 10.8(10) Form of Restricted Stock Unit Award Agreement (Non-Employee Director).* 10.9(10) Form of Restricted Stock Unit Award Agreement (Performance Vesting).* 10.10(10) Form of Restricted Stock Unit Award Agreement (Current Employee).* 10.11(10) Form of Restricted Stock Unit Award Agreement (Newly Hired Employee).* 21.1 Subsidiaries of the Company. 23.1 Consent of Independent Registered Public Accounting Firm F-4Firm.Consolidated Balance SheetsF-5Consolidated Statements of IncomeF-6Consolidated Statements of Cash FlowsF-7Consolidated Statements of Stockholders' EquityF-8Notes to Consolidated Financial StatementsF-9
2.
Financial Statements Schedules.
See Schedule II - Valuation and Qualifying Accounts at page S-1
3.
Exhibits.
Exhibit
NumberDescription
3.1
(2)
Certificate of Incorporation, as amended, of the Company.
3.2
(2)
Amended and Restated Bylaws of the Company.
3.3
(4)
Certificate of Designation of Rights, Preferences and Privileges of Series A Participating Preferred Stock of the Company.
4.1
(1)
Specimen of Common Stock certificate of the Company.
4.2
(3)
Rights Agreement dated as of January 21, 2004, between the Company and EquiServe Trust Company, N.A.
10.1
(1)
Form of Indemnification Agreement.
10.2
(5)
1994 Incentive Plan, as amended.*
10.3
1994 Employee Stock Purchase Plan.*
10.4
(6)
Long-Term Incentive Program.*
10.5
(7)
2005 Incentive Plan.*
10.6
(8)
National Instruments Corporation Annual Incentive Program.*
10.7
(9)
2006 Annual Incentive Program Goals and Awards for the Named Executive Officers.*
10.8
(10)
Form of Restricted Stock Unit Award Agreement (Non-Employee Director).*
10.9
(10)
Form of Restricted Stock Unit Award Agreement (Performance Vesting).*
10.10
(10)
Form of Restricted Stock Unit Award Agreement (Current Employee).*
10.11
(10)
Form of Restricted Stock Unit Award Agreement (Newly Hired Employee).*
21.1
Subsidiaries of the Company.
23.1
Consent of Independent Registered Public Accounting Firm.
23.2
Consent of Independent Registered Public Accounting Firm.
24.0
Power of Attorney (included on page 33).
31.1
Certification of Chief Executive Officer Pursuant to 18 U.S.C. Section 1350, as Adopted Pursuant to Section 302 of the Sarbanes-Oxley Act of 2002.
31.2
Certification of Chief Financial Officer Pursuant to 18 U.S.C. Section 1350, as Adopted Pursuant to Section 302 of the Sarbanes-Oxley Act of 2002.
32.1
Certification of Chief Executive Officer and Chief Financial Officer Pursuant to 18 U.S.C. Section 1350, as Adopted Pursuant to Section 906 of the Sarbanes-Oxley Act of 2002.
24.0 Power of Attorney (included on page 41). 31.1 Certification of Chief Executive Officer Pursuant to 18 U.S.C. Section 1350, as Adopted Pursuant to Section 302 of the Sarbanes-Oxley Act of 2002. 31.2 Certification of Chief Financial Officer Pursuant to 18 U.S.C. Section 1350, as Adopted Pursuant to Section 302 of the Sarbanes-Oxley Act of 2002. 32.1 Certification of Chief Executive Officer and Chief Financial Officer Pursuant to 18 U.S.C. Section 1350, as Adopted Pursuant to Section 906 of the Sarbanes-Oxley Act of 2002.
(1) Incorporated by reference to the Company's Registration Statement on Form S-1 (Reg. No. 33-88386) declared effective March 13, 1995.
(2) Incorporated by reference to the same-numbered exhibit filed with the Company's Annual Report on Form 10-K for the fiscal year ended December 31, 2003.
(3) Incorporated by reference to exhibit 4.1 filed with the Company's currentCurrent Report on Form 8-K filed on January 28, 2004.
(4) Incorporated by reference to the same-numbered exhibit filed with the Company's Form 8-K on April 27, 2004.
(5) Incorporated by reference to the same-numbered exhibit filed with the Company's Form 10-Q on August 5, 2004.
(6) Incorporated by reference to exhibit 99.2 filed with the Company's Current Report on Form 8-K filed on October 28, 2008. (7) Incorporated by reference to exhibit A of the Company's Proxy Statement dated and filed on April 4, 2005. (8) Incorporated by reference to exhibit 99.2 filed with the Company's Current Report on Form 8-K filed on October 22, 2008. (9) Incorporated by reference to exhibit 10.3 filed with the Company's Annual Report on Form 10-K for the fiscal year ended December 31, 2006. (10) Incorporated by reference to the same-numbered exhibit filed with the Company's Form 10-Q on August 2, 2006. (11) Incorporated by reference to the same-numbered exhibit filed with the Company's Annual Report on Form 10-K for the fiscal year ended December 31, 2004.2007.
(7)Incorporated by reference to exhibit A of the Company's Proxy Statement dated and filed on April 4, 2005.
(8)Incorporated by reference to the exhibit 10.1 filed with the Company's Current Report on Form 8-K filed June 27, 2006.
(9)Incorporated by reference to the exhibit 10.2 filed with the Company's Current Report on Form 8-K filed June 27, 2006.
(10)Incorporated by reference to the same-numbered exhibit filed with the Company's Form 10-Q filed on August 2, 2006.
* Management Contract or Compensatory Plan or Arrangement.
(b) Exhibits
See Item 15(a)(3) above.
(c) Financial Statement Schedules
See Item 15(a)(2) above.
SIGNATURES
Pursuant to the requirements of Section 13 or 15(d) of the Securities Exchange Act of 1934, the registrant has duly caused this report to be signed on its behalf by the undersigned thereunto duly authorized.Registrant Registrant
NATIONAL INSTRUMENTS CORPORATION
February 20, 200717, 2010
BY: By:
/s/ Dr. James J. TruchardDr. James J. Truchard
Chairman of the Board and President
POWER OF ATTORNEY
KNOW ALL PERSONS BY THESE PRESENTS, that each person whose signature appears below constitutes and appoints Dr. James J. Truchard and Alexander M. Davern, jointly and severally, his or her attorneys-in-fact, each with the power of substitution, for him or her in any and all capacities, to sign any amendments to this Report on Form 10-K, and to file the same, with exhibits thereto and other documents in connection therewith, with the Securities and Exchange Commission, hereby ratifying and conformingconfirming all that each of said attorneys-in-fact, or his substitute or substitutes, may do or cause to be done by virtue hereof.
Pursuant to the requirements of the Securities Exchange Act of 1934, this report has been signed below by the following persons on behalf of the registrant and in the capacities and on the dates indicated.Signature
Capacity in Which Signed
Date
/s/ Dr. James J. Truchard
Chairman of the Board and President(Principal Executive Officer) February 17, 2010 Dr. James J. Truchard
Chairman of the Board and
President (Principal Executive Officer)
February 20, 2007
/s/ Alex M. Davern
Chief Financial Officer and Treasurer(Principal Financial and Accounting Officer) February 17, 2010 Alex M. Davern
Chief Financial Officer
and Treasurer (Principal Financial
and Accounting Officer)
February 20, 2007
/s/ Jeffrey L. Kodosky
Director February 17, 2010 Jeffrey L. Kodosky
Director
February 16, 2007
/s/ Dr. Donald M. Carlton
Director February 17, 2010 Dr. Donald M. Carlton
Director
February 16, 2007
/s/ Dr. Ben G. Streetman
Dr. Ben G. Streetman
Director
February 16, 2007
/s/ R. Gary Daniels
R. Gary Daniels
Director
February 16, 2007
/s/ Charles J. Roesslein
Director February 17, 2010 Charles J. Roesslein
Director
February 16, 2007
/s/ Duy-Loan T. Le
Director February 17, 2010 Duy-Loan T. Le
/s/ John Medica Director
February 16, 200717, 2010 John Medica
NATIONAL INSTRUMENTS CORPORATION
INDEX TO FINANCIAL STATEMENTS
Page No. Financial Statements: Page No.Report of Independent Registered Public Accounting FirmF-2Report of Independent Registered Public Accounting Firm on Internal Control over Financial Reporting F-3F-2 Report of Independent Registered Public Accounting Firm F-4F-3 Consolidated Balance Sheets as of December 31, 20062009 and 20052008 F-5F-4 Consolidated Statements of Income for each of the Three Years in the period Ended December 31, 20062009 F-6F-5 Consolidated Statements of Cash Flows for each of the Three Years in the period Ended December 31, 20062009 F-7F-6 Consolidated Statements of Stockholders' Equity for each of the Three Years in the period Ended December 31, 20062009 F-8F-7 Notes to Consolidated Financial Statements F-9F-8
Financial Statement Schedules:For each of the Three Years in the period Ended December 31, 2006 Schedule II--Valuation and Qualifying AccountsS-1
All other schedules are omitted because they are not applicable.
The Board of Directors and Shareholders of National Instruments Corporation:
We have audited the accompanying consolidated balance sheets of National Instruments Corporation and subsidiaries as of December 31, 20062009 and 20052008, and the related consolidated statements of income, stockholders’stockholders' equity, and cash flows for each of the twothree fiscal years in the period ended December 31, 2006. Our audits also included the financial statement schedule listed in the Index at Item 15.2009. These financial statements and schedule are the responsibility of the Company’sCompany's management. Our responsibility is to express an opinion on these financial statements and schedule based on our audits.
We conducted our audits in accordance with the standards of the Public Company Accounting Oversight Board (United States). Those standards require that we plan and perform the audit to obtain reasonable assurance about whether the financial statements are free of material misstatement. An audit includes examining, on a test basis, evidence supporting the amounts and disclosures in the financial statements. An audit also includes assessing the accounting principles used and significant estimates made by management, as well as evaluating the overall financial statement presentation. We believe that our audits provide a reasonable basis for our opinion.
In our opinion, the financial statements referred to above present fairly, in all material respects, the consolidated financial position of National Instruments Corporation and subsidiaries at December 31, 20062009 and 20052008, and the consolidated results of their operations and their cash flows for each of the twothree fiscal years in the period ended December 31, 2006,2009, in conformity with U.S. generally accepted accounting principles. Also, in our opinion, the related financial statement schedule, when considered in relation to the basic financial statements taken as a whole, presents fairly in all material respects the information set forth therein.As discussed in Note 1 to the consolidated financial statements, effective January 1, 2006, the Company changed its method of accounting for stock-based compensation to conform to Statement of Financial Accounting Standards No. 123(R), Share-Based Payment.
We also have audited, in accordance with the standards of the Public Company Accounting Oversight Board (United States), the effectiveness of National Instruments Corporation’sCorporation internal control over financial reporting as of December 31, 2006,2009, based on criteria established in Internal Control-Integrated Framework issued by the Committee of Sponsoring Organizations of the Treadway Commission and our report dated February 15, 200717, 2010 expressed an unqualified opinion thereon./s/ Ernst & Young LLP
Austin, Texas
February 15, 2007
/s/ Ernst & Young LLP
Austin, TexasFebruary 17, 2010
Report of Independent Registered Public Accounting Firm on Internal Control over Financial Reporting
The Board of Directors and Shareholders of National Instruments Corporation:
We have audited management’s assessment, included in the Management’s Report on Internal Control over Financial Reporting, that National Instruments Corporation maintained effectiveCorporation’s internal control over financial reporting as of December 31, 2006,2009, based on criteria established in Internal Control—Integrated Framework issued by the Committee of Sponsoring Organizations of the Treadway Commission (the COSO criteria). National Instruments Corporation’s management is responsible for maintaining effective internal control over financial reporting, and for its assessment of the effectiveness of internal control over financial reporting.reporting included in the accompanying Management Report on Internal Control over Financial Reporting. Our responsibility is to express an opinion on management’s assessment and an opinion on the effectiveness of the company’s internal control over financial reporting based on our audit.
We conducted our audit in accordance with the standards of the Public Company Accounting Oversight Board (United States). Those standards require that we plan and perform the audit to obtain reasonable assurance about whether effective internal control over financial reporting was maintained in all material respects. Our audit included obtaining an understanding of internal control over financial reporting, evaluating management’s assessment,assessing the risk that a material weakness exists, testing and evaluating the design and operating effectiveness of internal control based on the assessed risk, and performing such other procedures as we considered necessary in the circumstances. We believe that our audit provides a reasonable basis for our opinion.
A company’s internal control over financial reporting is a process designed to provide reasonable assurance regarding the reliability of financial reporting and the preparation of financial statements for external purposes in accordance with generally accepted accounting principles. A company’s internal control over financial reporting includes those policies and procedures that (1) pertain to the maintenance of records that, in reasonable detail, accurately and fairly reflect the transactions and dispositions of the assets of the company; (2) provide reasonable assurance that transactions are recorded as necessary to permit preparation of financial statements in accordance with generally accepted accounting principles, and that receipts and expenditures of the company are being made only in accordance with authorizations of management and directors of the company; and (3) provide reasonable assurance regarding prevention or timely detection of unauthorized acquisition, use or disposition of the company’s assets that could have a material effect on the financial statements.
Because of its inherent limitations, internal control over financial reporting may not prevent or detect misstatements. Also, projections of any evaluation of effectiveness to future periods are subject to the risk that controls may become inadequate because of changes in conditions, or that the degree of compliance with the policies or procedures may deteriorate.
In our opinion, management’s assessment that National Instruments Corporation maintained effective internal control over financial reporting as of December 31, 2006, is fairly stated, in all material respects, based on the COSO criteria. Also, in our opinion, National Instruments Corporation maintained, in all material respects, effective internal control over financial reporting as of December 31, 2006,2009, based on the COSO criteria.
We also have audited, in accordance with the standards of the Public Company Accounting Oversight Board (United States), the consolidated balance sheets of National Instruments Corporation as of December 31, 20062009 and 2005,2008, and the related consolidated statements of income, stockholders’ equity, and cash flows for each of the twothree years in the period ended December 31, 2006 of National Instruments Corporation2009 and our report dated February 15, 200717, 2010 expressed an unqualified opinion thereon./s/ Ernst & Young LLP
Austin, Texas
February 15, 2007
/s/ Ernst & Young LLP
Austin, TexasFebruary 17, 2010
Report of Independent Registered Public Accounting Firm
To the Board of Directors and Stockholders of National Instruments Corporation:
In our opinion, the consolidated statements of income, of stockholders’ equity and of cash flows (appearing on pages F-6 through F-8 of this National Instruments Corporation 2006 Annual Report on Form 10-K) for the year ended December 31, 2004 present fairly, in all material respects, the results of operations and cash flows of National Instruments Corporation and its subsidiaries for the year ended December 31, 2004, in conformity with accounting principles generally accepted in the United States of America. In addition, in our opinion, the financial statement schedule for the year ended December 31, 2004 presents fairly, in all material respects, the information set forth therein when read in conjunction with the related consolidated financial statements. These financial statements and financial statement schedule are the responsibility of the Company’s management. Our responsibility is to express an opinion on these financial statements and financial statement schedule based on our audit. We conducted our audit of these statements in accordance with the standards of the Public Company Accounting Oversight Board (United States). Those standards require that we plan and perform the audit to obtain reasonable assurance about whether the financial statements are free of material misstatement. An audit includes examining, on a test basis, evidence supporting the amounts and disclosures in the financial statements, assessing the accounting principles used and significant estimates made by management, and evaluating the overall financial statement presentation. We believe that our audit provides a reasonable basis for our opinion.
/s/ PricewaterhouseCoopers LLP
Austin, Texas
March 4, 2005
NATIONAL INSTRUMENTS CORPORATION
(in thousands, except share data)December 31,
2006
2005
Assets
Current assets: Cash and cash equivalents $ 100,287 $ 55,864 Short-term investments 150,190 119,846 Accounts receivable, net 117,235 95,733 Inventories, net 77,138 62,827 Prepaid expenses and other current assets 11,393 13,146 Deferred income taxes, net 20,851 14,890
Total current assets 477,094 362,306 Property and equipment, net 145,425 144,330 Goodwill, net 53,343 52,533 Intangible assets, net 40,065 43,602 Other long-term assets 5,293 5,565
Total assets $ 721,220 $ 608,336
Liabilities and Stockholders' Equity
Current liabilities: Accounts payable $ 32,001 $ 30,832 Accrued compensation 20,912 18,084 Deferred revenue 22,208 16,018 Accrued expenses and other liabilities 15,934 8,838 Other taxes payable 11,527 13,848
Total current liabilities 102,582 87,620 Deferred income taxes 21,956 16,866
Total liabilities 124,538 104,486
Commitments and contingencies Stockholders' equity: Preferred stock: par value $0.01; 5,000,000 shares authorized; none issued and outstanding — — Common stock: par value $0.01; 180,000,000 shares authorized; 79,883,837 and 79,276,086 shares issued and outstanding, respectively 799 793 Additional paid-in capital 109,851 91,430 Deferred stock-based compensation — (16,547 ) Retained earnings 483,533 429,859 Accumulated other comprehensive income (loss) 2,499 (1,685 )
Total stockholders' equity 596,682 503,850
Total liabilities and stockholders' equity $ 721,220 $ 608,336
December 31, 2009 2008 Assets Current assets: Cash and cash equivalents $ 201,465 $ 229,400 Short-term investments 87,196 6,220 Accounts receivable, net 103,957 121,548 Inventories, net 86,515 107,358 Prepaid expenses and other current assets 36,523 43,062 Deferred income taxes, net 16,522 21,435 Total current assets 532,178 529,023 Long-term investments — 10,500 Property and equipment, net 153,265 154,477 Goodwill, net 64,779 64,561 Intangible assets, net 43,390 41,915 Other long-term assets 19,417 32,115 Total assets $ 813,029 $ 832,591 Liabilities and Stockholders’ Equity Current liabilities: Accounts payable $ 23,502 $ 30,876 Accrued compensation 14,934 22,012 Deferred revenue 57,242 45,514 Accrued expenses and other liabilities 8,560 18,848 Other taxes payable 14,181 13,481 Total current liabilities 118,419 130,731 Deferred income taxes 25,012 25,157 Liability for uncertain tax positions 11,062 9,364 Other long-term liabilities 4,116 2,901 Total liabilities 158,609 168,153 Commitments and contingencies Stockholders’ equity: Preferred stock: par value $0.01; 5,000,000 shares authorized; none issued and outstanding — — Common stock: par value $0.01; 180,000,000 shares authorized;77,367,874 and 77,193,063 shares issued and outstanding, respectively 774 772 Additional paid-in capital 336,446 300,352 Retained earnings 303,655 352,831 Accumulated other comprehensive income 13,545 10,483 Total stockholders’ equity 654,420 664,438 Total liabilities and stockholders’ equity $ 813,029 $ 832,591
The accompanying notes are an integral part of these financial statements.
NATIONAL INSTRUMENTS CORPORATION
(in thousands, except per share data)For the Years Ended December 31,
2006
2005
2004
Net sales $ 660,407 $ 571,841 $ 514,088 Cost of sales (1) 170,326 149,309 135,473
Gross profit 490,081 422,532 378,615
Operating expenses: Sales and marketing (2) 235,072 211,280 188,727 Research and development (3) 113,095 87,841 84,692 General and administrative (4) 54,192 45,199 42,500
Total operating expenses 402,359 344,320 315,919
Operating income 87,722 78,212 62,696
Other income (expense): Interest income 6,847 3,758 2,905 Net foreign exchange gain (loss) 740 (1,566 ) 1,287 Other income (expense), net (7 ) 276 (2,075 )
Income before income taxes 95,302 80,680 64,813 Provision for income taxes (5) 22,594 19,163 16,203
Net income $ 72,708 $ 61,517 $ 48,610
Basic earnings per share $ 0.91 $ 0.78 $ 0.62
Weighted average shares outstanding - basic 79,519 78,552 78,680
Diluted earnings per share $ 0.89 $ 0.76 $ 0.59
Weighted average shares outstanding - diluted 81,519 80,910 82,096
Dividends declared per share $ 0.24 $ 0.20 $ 0.18
The following footnotes apply to the years ended December 31, 2006, 2005 and 2004:
(1)including $598, $101 and $0, respectively, of non-cash stock compensation.(2)including $6,008, $500 and $0, respectively, of non-cash stock compensation.(3)including $5,201, $598 and $0, respectively, of non-cash stock compensation.(4)including $2,333, $345 and $0, respectively, of non-cash stock compensation.(5)including $2,403, $364 and $0, respectively, of benefit from non-cash stock compensation.
For the YearsEnded December 31, 2009 2008 2007 Net sales: Product $ 623,736 $ 765,441 $ 701,589 Software maintenance 52,858 55,096 38,789 Total net sales 676,594 820,537 740,378 Cost of sales: Product 164,700 201,064 180,556 Software maintenance 5,184 6,045 4,711 Total cost of sales 169,884 207,109 185,267 Gross profit 506,710 613,428 555,111 Operating expenses: Sales and marketing 269,267 307,409 264,060 Research and development 132,974 143,140 126,515 General and administrative 57,938 67,162 62,445 Total operating expenses 460,179 517,711 453,020 Operating income 46,531 95,717 102,091 Other income (expense): Interest income 1,629 5,996 9,822 Net foreign exchange gain (loss) 734 (3,737 ) 1,672 Other income (expense), net 1,351 161 (158 ) Income before income taxes 50,245 98,137 113,427 Provision for income taxes 33,160 13,310 6,394 Net income $ 17,085 $ 84,827 $ 107,033 Basic earnings per share $ 0.22 $ 1.08 $ 1.35 Weighted average shares outstanding - basic 77,520 78,567 79,468 Diluted earnings per share $ 0.22 $ 1.07 $ 1.32 Weighted average shares outstanding – diluted �� 78,026 79,515 81,043 Dividends declared per share $ 0.48 $ 0.44 $ 0.34
The accompanying notes are an integral part of these financial statements.
NATIONAL INSTRUMENTS CORPORATION
(in thousands)For the Years Ended December 31,
2006
2005
2004
Cash flow from operating activities: Net income $ 72,708 $ 61,517 $ 48,610 Adjustments to reconcile net income to net cash provided by operating activities: Depreciation and amortization 34,181 28,553 25,592 Stock-based compensation 14,507 1,545 — Impairment of cost method investment — — 2,500 Gain on sale of subsidiary — — (242 ) Provision for (benefit from) deferred income taxes (339 ) 3,219 (825 ) Tax benefit from stock option plans (4,271 ) 675 3,071 Changes in operating assets and liabilities: Accounts receivable (21,502 ) (4,080 ) (9,342 ) Inventories (14,311 ) (4,572 ) (15,230 ) Prepaid expenses and other assets 2,116 (2,177 ) 4,624 Accounts payable 1,169 4,647 (4,359 ) Deferred revenue 6,190 3,847 3,385 Taxes and other liabilities 7,443 (5,124 ) 7,848
Net cash provided by operating activities 97,891 88,050 65,632
Cash flow from investing activities: Proceeds from sale of subsidiary — — 680 Acquisitions, net of cash received — (63,891 ) — Capital expenditures (18,503 ) (15,383 ) (12,596 ) Capitalization of internally developed software (7,370 ) (13,380 ) (5,007 ) Additions to other intangibles (3,115 ) (4,288 ) (3,050 ) Purchases of short-term investments (244,238 ) (124,227 ) (125,954 ) Sales and maturities of short-term investments 213,894 154,773 116,789
Net cash used in investing activities (59,332 ) (66,396 ) (29,138 )
Cash flow from financing activities: Proceeds from issuance of common stock 37,146 23,222 16,826 Repurchase of common stock (16,519 ) (49,452 ) (16,064 ) Dividends paid (19,034 ) (15,776 ) (14,486 ) Tax benefit from stock option plans 4,271 — —
Net cash provided by (used in) financing activities 5,864 (42,006 ) (13,724 )
Net change in cash and cash equivalents 44,423 (20,352 ) 22,770 Cash and cash equivalents at beginning of period 55,864 76,216 53,446
Cash and cash equivalents at end of period $ 100,287 $ 55,864 $ 76,216
Cash paid for interest and income taxes Interest $ 41 $ 17 $ 31 Income taxes $ 9,827 $ 15,117 $ 10,622
For the Years Ended December 31, 2009 2008 2007 Cash flow from operating activities: Net income $ 17,085 $ 84,827 $ 107,033 Adjustments to reconcile net income to net cash provided by operating activities: Depreciation and amortization 38,365 37,103 36,605 Stock-based compensation 20,299 19,854 17,754 Tax expense/(benefit from) deferred income taxes 17,196 (4,475 ) (16,954 ) Tax expense/(benefit from) stock option plans 1,450 (1,213 ) (2,964 ) Changes in operating assets and liabilities: Accounts receivable 17,591 12,159 (14,047 ) Inventories 20,843 (24,578 ) (5,537 ) Prepaid expenses and other assets 12,740 (10,340 ) (12,330 ) Accounts payable (7,374 ) (5,648 ) 4,186 Deferred revenue 11,728 9,423 13,883 Taxes and other liabilities (14,272 ) 4,706 19,743 Net cash provided by operating activities 135,651 121,818 147,372 Cash flow from investing activities: Acquisitions, net of cash received — (17,310 ) — Capital expenditures (20,847 ) (25,771 ) (24,864 ) Capitalization of internally developed software (12,583 ) (9,487 ) (8,263 ) Additions to other intangibles (4,602 ) (3,010 ) (6,447 ) Purchases of short-term investments (93,087 ) (9,061 ) (87,586 ) Sales and maturities of short-term investments 19,204 86,179 143,938 Purchases of foreign currency option contracts — (2,784 ) (2,242 ) Net cash provided by (used in) investing activities (111,915 ) 18,756 14,536 Cash flow from financing activities: Proceeds from issuance of common stock 21,672 31,150 36,460 Repurchase of common stock (34,585 ) (103,641 ) (79,728 ) Dividends paid (37,308 ) (34,735 ) (27,052 ) Tax (expense)/benefit from stock option plans (1,450 ) 1,213 2,964 Net cash (used in) financing activities (51,671 ) (106,013 ) (67,356 ) Net change in cash and cash equivalents (27,935 ) 34,561 94,552 Cash and cash equivalents at beginning of period 229,400 194,839 100,287 Cash and cash equivalents at end of period $ 201,465 $ 229,400 $ 194,839 Cash paid for interest and income taxes: Interest $ 23 $ 116 $ 159 Income taxes $ 14,608 $ 17,214 $ 21,147
The accompanying notes are an integral part of these financial statements.
NATIONAL INSTRUMENTS CORPORATION
(in thousands, except share data)Common
Stock
Shares
Common
Stock
Amount
Additional
Paid-In
Capital
Deferred
Compensation
Retained
Earnings
Accumulated
Other
Comprehensive
Income/(Loss)
Total
Stockholders'
Equity
Balance at December 31, 2003 78,269,235 $ 783 $ 95,070 $ — $ 349,994 $ (6,395 ) $ 439,452 Net income 48,610 48,610 Foreign currency translation adjustment (net of $1,013 tax expense) 3,050 3,050 Unrealized loss on securities available for sale (net of $0 tax benefit) (417 ) (417 ) Unrealized gain on derivative instruments (net of $2,136 tax expense) 6,407 6,407
Total comprehensive income 57,650
Issuance of common stock under employee plans, including tax benefits 1,234,195 12 19,885 19,897 Repurchase and retirement of common stock (557,850 ) (6 ) (16,058 ) (16,064 ) Dividends declared (14,486 ) (14,486 )
Balance at December 31, 2004 78,945,580 $ 789 $ 98,897 $ — $ 384,118 $ 2,645 $ 486,449 Net income 61,517 61,517 Foreign currency translation adjustment(net of $1,636 tax benefit) (5,181 ) (5,181 ) Unrealized gain on securities available for sale (net of $0 tax expense) 50 50 Unrealized gain on derivative instruments (net of $253 tax expense) 801 801
Total comprehensive income 57,187
Net activity related to restricted stock units 813,305 8 18,084 (16,547 ) 1,545 Issuance of common stock under employee plans, including tax benefits 1,573,547 16 23,206 23,222 Repurchase and retirement of common stock (2,056,346 ) (20 ) (49,432 ) (49,452 ) Dividends declared (15,776 ) (15,776 ) Disqualified dispositions 675 675
Balance at December 31, 2005 79,276,086 $ 793 $ 91,430 ($ 16,547 ) $ 429,859 ($ 1,685 ) $ 503,850 Net income 72,708 72,708 Foreign currency translation adjustment (net of $1,434 tax expense) 4,542 4,542 Unrealized gain on securities available for sale (net of $0 tax expense) 78 78 Unrealized loss on derivative instruments (net of $138 tax benefit) (436 ) (436 )
Total comprehensive income 76,892
Issuance of common stock under employee plans, including tax benefits 1,915,172 19 37,127 37,146 Stock-based compensation under
restricted stock plan 113,794 1 5,082 5,083 Stock-based compensation under stock
option and employee stock purchase plans 9,424 9,424 Repurchase and retirement of common stock (607,910 ) (6 ) (16,513 ) (16,519 ) Effect of adoption of SFAS 123R (813,305 ) (8 ) (16,539 ) 16,547 — Dividends declared (19,034 ) (19,034 ) Disqualified dispositions (160 ) (160 )
Balance at December 31, 2006 $ 79,883,837 $ 799 $ 109,851 $ — $ 483,533 $ 2,499 $ 596,682
CommonStockShares CommonStockAmount AdditionalPaid-InCapital DeferredCompensation RetainedEarnings AccumulatedOtherComprehensiveIncome/(Loss) TotalStockholders’Equity Balance at December 31, 2006 79,883,837 $ 799 $ 207,808 $ — $ 385,480 $ 2,499 $ 596,586 Net income 107,033 107,033 Foreign currency translation adjustment(net of $286 tax expense) 4,483 4,483 Unrealized gain on securities available-for-sale(net of $13 tax expense) 200 200 Unrealized loss on derivative instruments(net of $7 tax benefit) (117 ) (117 ) Total comprehensive income 111,599 Issuance of common stock under employee plans, including tax benefits 2,251,657 22 36,438 36,460 Stock-based compensation 17,754 17,754 Repurchase and retirement of common stock (2,730,135 ) (27 ) (7,102 ) (72,599 ) (79,728 ) Dividends paid (27,052 ) (27,052 ) Disqualified dispositions 5,467 5,467 Balance at December 31, 2007 79,405,359 $ 794 $ 260,365 $ — $ 392,862 $ 7,065 $ 661,086 Net income 84,827 84,827 Foreign currency translation adjustment(net of $681 tax benefit) (4,188 ) (4,188 ) Unrealized loss on securities available-for-sale(net of $82 tax benefit) (502 ) (502 ) Unrealized gain on derivative instruments(net of $1,320 tax expense) 8,108 8,108 Total comprehensive income 88,245 Issuance of common stock under employee plans, including tax benefits 1,897,746 19 31,131 31,150 Stock-based compensation 19,854 19,854 Repurchase and retirement of common stock (4,110,042 ) (41 ) (13,477 ) (90,123 ) (103,641 ) Dividends paid (34,735 ) (34,735 ) Disqualified dispositions 2,479 2,479 Balance at December 31, 2008 77,193,063 $ 772 $ 300,352 $ — $ 352,831 $ 10,483 $ 664,438 Net income 17,085 17,085 Foreign currency translation adjustment(net of $1,799 tax expense) 927 927 Unrealized gain on securities available-for-sale(net of $1,093 tax expense) 563 563 Unrealized gain on derivative instruments(net of $3,053 tax expense) 1,572 1,572 Total comprehensive income 20,147 Issuance of common stock under employee plans, including tax benefits 1,618,252 16 21,656 21,672 Stock-based compensation 20,574 20,574 Repurchase and retirement of common stock (1,443,441 ) (14 ) (5,618 ) (28,953 ) (34,585 ) Dividends paid (37,308 ) (37,308 ) Disqualified dispositions (518 ) (518 ) Balance at December 31, 2009 77,367,874 $ 774 $ 336,446 $ — $ 303,655 $ 13,545 $ 654,420
The accompanying notes are an integral part of these financial statements.
NATIONAL INSTRUMENTS CORPORATION
Note 1:1 – Operations and summary of significant accounting policies
National Instruments Corporation is a Delaware corporation. We engage in the design, development, manufacture and marketing of instrumentationprovide flexible application software and specialty computer plug-in cards and accessoriesmodular, multifunction hardware that users combine with industry standardindustry-standard computers, networks and the Internetthird party devices to create measurement, automation and automation systems.embedded systems, which we also refer to as “virtual instruments.” Our approach gives customers the ability to quickly and cost-effectively design, prototype and deploy unique custom-defined solutions for their design, control and test application needs. We offer hundreds of products used to create virtual instrumentation systems for general, commercial, industrial and scientific applications. Our products may be used in different environments, and consequently, specific application of our products is determined by the customer and generally is not known to us. We approach all markets with essentially the same products, which are used in a variety of applications from research and development to production testing, monitoring and industrial control. The following industries and applications are served by us worldwide: advanced research, automotive, commercial aerospace, computers and electronics, continuous process manufacturing, education, government/defense, medical research/pharmaceutical, power/energy, semiconductors, automated test equipment, telecommunications and others. TheThese financial statements have been prepared in accordance with accounting principles generally accepted in the United States of America.
Principles of consolidation
The consolidated financial statementsConsolidated Financial Statements include the accounts of National Instruments Corporation and its subsidiaries. All significant intercompany accounts and transactions have been eliminated.
We have historically recorded the excess of the purchase price over the par or stated value of retired shares of our common stock as a reduction of additional paid-in capital. We completed our review of this accounting policy under FASB ASC 505, Equity (FASB ASC 505). Based on this review, we have reclassified a portion of the excess of the purchase price over the par or stated value of retired shares of our common stock from a reduction of additional paid-in capital to a reduction of retained earnings. This reclassification did not have any impact on previously reported statements of income, earning per share amounts, statements of cash flows or total stockholders’ equity. Certain prior year amounts from our Consolidated Statements of Stockholders’ Equity have been reclassified to conform to the 2009 presentation as shown in the following table:
APIC RE 2006 Beginning Balance 12/31/06 balance as previously reported $ 109,851 $ 483,437 Cumulative reclassification of share repurchase 97,957 (97,957 ) 12/31/06 balance as reported in current Form 10-K $ 207,808 $ 385,480 2007 Activity Repurchase and retirement of common stock as previously reported $ (79,701 ) $ — Reclassification of 2007 activity 72,599 (72,599 ) Repurchase and retirement of common stock as reported in current Form 10-K $ (7,102 ) $ (72,599 ) 2007 Ending Balance 12/31/07 balance as previously reported $ 89,809 $ 563,418 Cumulative reclassification of share repurchase 170,556 (170,556 ) 12/31/07 balance as reported in current Form 10-K $ 260,365 $ 392,862 2008 Activity Repurchase and retirement of common stock as previously reported $ (103,600 ) $ — Reclassification of 2008 activity 90,123 (90,123 ) Repurchase and retirement of common stock as reported in current Form 10-K $ (13,477 ) $ (90,123 ) 2008 Ending Balance 12/31/08 balance as previously reported $ 39,673 $ 613,510 Cumulative reclassification of share repurchase 260,679 (260,679 ) 12/31/08 balance as reported in current Form 10-K $ 300,352 $ 352,831
Going forward, we will account for the retired shares of our common stock by recording the excess of the purchase price over par value as a reduction of retained earnings, to the extent that the excess of the purchase price over par value exceeds the original proceeds received from the issuance of the same shares of our common stock, as prescribed by FASB ASC 505.
Use of estimates Judgments and estimates are required in the
The preparation of our financial statements to conformin conformity with U.S. generally accepted accounting principles. Theprinciples requires us to make estimates and underlying assumptions that affect the reported amounts of assets, liabilities, revenues, expenses and liabilities,related disclosures of contingent assets and liabilities. We base our estimates on past experience and other assumptions that we believe are reasonable under the disclosurecircumstances, and we evaluate these estimates on an ongoing basis. Our critical accounting policies are those that affect our financial statements materially and involve difficult, subjective or complex judgments by management. Although these estimates are based on management's best knowledge of contingencies atcurrent events and actions that may impact the balance sheet date andcompany in the reported revenues and expenses forfuture, actual results may be materially different from the period. Actual results could differ from those estimates.
Cash and cash equivalents
Cash and cash equivalents include cash and highly liquid investments with maturities of three months or less at the date of acquisition. Short-term
Short-Term Investments
We maintain an investment portfolio of various types of security holdings and maturities. Pursuant to FASB ASC 820, cash equivalents and short-term investments Short-term available-for-sale are valued using the market approach (Level 1) based on unadjusted quoted prices in active markets for identical assets at the measurement date. Our short-term investments also include auction rate securities that we originally purchased for $8.6 million. These auction rate securities consist of corporate, state and municipaleducation loan revenue bonds. Auction rate securities with readily determinableare variable rate debt instruments whose interest rates are typically reset approximately every 7 to 35 days. In November 2008, we accepted the UBS Auction Rate Securities Rights (“the Rights”) agreement offered by UBS as a liquidity alternative to the failed auction process. The Rights agreement is a nontransferable right to sell our auction rate securities, at par value, back to UBS at any time during the period June 30, 2010, through July 2, 2012. The estimated fair market valuesvalue of both the auction rate securities and maturitiesthe Rights agreement was determined using significant unobservable inputs (Level 3) as prescribed by FASB ASC 820.
We account for our investments in excessdebt and equity instruments under FASB ASC 320. Our investments are classified as available-for-sale and accordingly are reported at fair value, with unrealized gains and losses reported as other comprehensive income, a component of three months at the date of acquisition.stockholders’ equity. Unrealized losses are charged against income when a decline in fair value is determined to be other than temporary. Investments with maturities beyond one year are classified as short-term based on their highly liquid nature and because such marketable securities represent the investment of cash that is available for current operations. Our investments are classified as available-for-sale and accordingly are reported atThe fair value of our short-term investments in debt securities at December 31, 2009 and December 31, 2008 was $87 million and $6 million, respectively. The increase was due to the net purchase of $74 million of short-term investments and the transfer of $8.6 related to our auction rate securities and our rights agreement from long-term investments to short-term investments during the year ended December 31, 2009. The net purchase of $74 million of short term investments was done to diversify our holdings from money market accounts to debt securities and to take advantage of higher yields associated with longer maturity debt securities. We follow the guidance provided by FASB ASC 320 to assess whether our investments with unrealized loss positions are other than temporarily impaired. Realized gains and losses reported as other comprehensive income. Unrealized losses are charged against income when a declineand declines in fair value is determinedjudged to be other than temporary. Thetemporary are determined based on the specific identification method and are reported in other income (expense), net, in our Consolidated Statements of Income.
Accounts Receivable, net
Accounts receivable are recorded net of allowance for sales returns of $1.9 million and $1.8 million at December 31, 2009 and 2008, respectively, and net of allowances for doubtful accounts of $2.7 million and $3.9 million at December 31, 2009 and 2008, respectively. A provision for estimated sales returns is used to determinemade by reducing recorded revenue based on historical experience. We analyze historical returns, current economic trends and changes in customer demand and acceptance of our products when evaluating the costadequacy of securities sold.our sales returns allowance. Our allowance for doubtful accounts is based on historical experience. We analyze historical bad debts, customer concentrations, customer creditworthiness and current economic trends when evaluating the adequacy of our allowance for doubtful accounts.
Year Description Balance atBeginningof Period Provisions Write-Offs Balance atEnd ofPeriod 2007 Allowance for doubtful accounts and sales returns $ 4,360 $ 1,940 $ 698 $ 5,602 2008 Allowance for doubtful accounts and sales returns 5,602 447 367 5,682 2009 Allowance for doubtful accounts and sales returns 5,682 337 1,400 4,619
Inventories
Inventories are stated at the lower-of-cost or market. Cost is determined using standard costs, which approximate the first-in first-out (FIFO)(“FIFO”) method. Cost includes the acquisition cost of purchased components, parts and subassemblies, in-bound freight costs, labor and overhead. Market is replacement cost with respect to raw materials and is net realizable value with respect to work in process and finished goods.
Inventory is shown net of adjustment for excess and obsolete inventories of $5.2$4.4 million and $6.0$4.4 million at December 31, 20062009 and 2005,2008, respectively.
Long-Term Investments
At December 31, 2008, our long-term investments primarily consisted of auction rate securities that we originally purchased for $8.6 million as well as our Rights agreement with UBS. At December 31, 2008, we classified these investments as long-term due to the fact that the market for these securities was inactive, the underlying securities generally had contractual maturities that were in excess of the guidelines provided for in our investment policy, the fact that we had the ability to hold the debt instruments to their ultimate maturity and the fact that we had not made a determination as to whether we would exercise our rights under the Rights agreement. The auction rate securities were classified as available-for-sale. At December 31, 2008, we reported our auction rate securities at their estimated fair market value of $7.0 million and our Rights agreement at its estimated fair market value of $1.6 million. The estimated fair market value of both the auction rate securities and the Rights agreement was determined using significant unobservable inputs (Level 3) as prescribed by FASB ASC 820. These auction rate securities and the Rights agreement are now reported as a component of short-term investments as discussed above.
Property and equipment
Property and equipment are recorded at cost. Depreciation is computed using the straight-line method over the estimated useful lives of the assets, which range from twenty to forty years for buildings, three to seven years for purchased internal use software and for equipment which are each included in furniture and equipment. Leasehold improvements are depreciated over the shorter of the life of the lease or the asset.
Intangible assets
We capitalize costs related to the development and acquisition of certain software products. In accordance with Statement of Financial Accounting Standards (“SFAS”) 86,Accounting for the Costs of Computer Software to Be Sold, Leased or Otherwise Marketed,FASB ASC 985, capitalization of costs begins when technological feasibility has been established and ends when the product is available for general release to customers. Technological feasibility for our products is established when the product is available for beta release. Amortization is computed on an individual product basis for those products available for market and is recognized based on the product’s estimated economic life, generally three years. Patents are amortized using the straight-line method over their estimated period of benefit, generally ten to seventeen years. At each balance sheet date, the unamortized costs for all intangible assets are reviewed by management and reduced to net realizable value when necessary.
Goodwill
GoodwillThe excess purchase price over the fair value of assets acquired is recorded as goodwill. As we have one operating segment, we allocate goodwill to one reporting unit for goodwill impairment testing. In accordance with SFAS 142,FASB ASC 350, Intangibles – Goodwill and Other Intangible Assets, (FASB ASC 350), goodwill is tested for impairment on an annual basis, and between annual tests if indicators of potential impairment exist, using a fair-value-based approach.approach based on the market capitalization of the reporting unit. Our annual impairment test was performed on April 6, 2006.as of February 28, 2009. No impairment of goodwill was identified.has been identified during the period presented. Goodwill is deductible for tax purposes in certain jurisdictions.
Concentrations of credit risk Financial
We maintain cash and cash equivalents with various financial institutions located in many countries throughout the world. At December 31, 2009, $85 million or 42% of our cash and cash equivalents was held in cash in various operating accounts with financial institutions throughout the world and $116 million or 58% was held in money market accounts. The most significant of our operating accounts was our domestic operating account which held approximately $22 million or 11% of our total cash and cash equivalents at a bank that carried an A1 rating at December 31, 2009. From a geographic standpoint, approximately $78 million or 39% was held in various domestic accounts with financial institutions and $123 million or 61% was held in various accounts outside of the U. S. with financial institutions. At December 31, 2009, our short-term investments consist of $35 million or 40% of foreign government bonds, $21 million or 24% of U.S. treasuries and agencies, $12 million or 14% of municipal bonds, $9 million or 10% of auction rate securities and our auction rate securities put option, $8 million or 9% of corporate bonds and $3 million or 3% in time deposits.
The goal of our investment policy is to manage our investment portfolio to preserve principal and liquidity while maximizing the return on our investment portfolio through the full investment of available funds. We place our cash investments in instruments that potentially subject us to concentrationsmeet credit quality standards, as specified in our corporate investment policy guidelines. These guidelines also limit the amount of credit risk consist principallyexposure to any one issue, issuer or type of instrument. With the exception of our auction rate security from the Vermont Student Assistance Corporation, at December 31, 2009, our cash equivalents and short-term investments carried ratings from the major credit rating agencies that were in accordance with our corporate investment policy. Our investment policy allows investments in the following; government and federal agency obligations, repurchase agreements (“Repos”), certificates of deposit and time deposits, corporate obligations, medium term notes and deposit notes, commercial paper including asset-backed commercial paper (“ABCP”), puttable bonds, general obligation and revenue bonds, money market funds, taxable commercial paper, corporate notes/bonds, municipal notes, municipal obligations, variable rate demand notes and tax exempt commercial paper. All such instruments must carry minimum ratings of A1/P1/F1, MIG1/VMIG1/SP1 and A2/A/A, as applicable, all of which are considered “investment grade”. Our investment policy for marketable securities requires that all securities mature in three years or less, with a weighted average maturity of no longer than 18 months with at least 10% maturing in 90 days or less. We actively monitor our investment portfolio to ensure compliance with our investment objective to preserve capital, meet liquidity requirements and maximize return on our investments. We do not require collateral or enter into master netting arrangements to mitigate our credit risk. (See Note 2 – Cash, cash equivalents, short-term and long-term investments in Notes to Consolidated Financial Statements for further discussion and analysis of our investments.).
At December 31, 2009, we held foreign currency forward and option contracts cashwith an aggregate notional amount of $148.4 million with various counterparties and cash equivalents, short-term investments and trade accounts receivable. We have no significant concentrations of credit risk at December 31, 2006.with varying maturity dates. Our counterparties in our foreign currency forward and option contracts are major financial institutions. We do not anticipate nonperformance by these counterparties. We maintain cash(See Note 4 – Derivative instruments and cash equivalents with various financial institutions locatedhedging activities in many countries worldwide. Our short-term investments are diversified among and limitedNotes to high-quality securities with high credit ratings. Consolidated Financial Statements).
Concentration of credit risk with respect to trade accounts receivable is limited due to the large number of customers and their dispersion across many countries and industries. The amount of sales to any individual customer did not exceed 3% of revenue for the periods presented. The largest trade account receivable from any individual customer at December 31, 20062009 was approximately $1.8$1.9 million.
Key supplier risk
Our manufacturing processes use large volumes of high-quality components and subassemblies supplied by outside sources. Several of thosethese components are available through singlesole or limited sources. Supply shortages of or quality problems in connection with some of these key components could require us to procure components from replacement suppliers, which would cause significant delays in fulfillment of orders and likely result in additional costs. In order to manage this risk, we maintain safety stock of some of these single sourced components and subassemblies and perform regular assessments of suppliers performance, grading key suppliers in critical areas such as quality and “on-time” delivery.
Revenue recognition
We derive revenue primarily from the sale/licensing of integrated hardware and software solutions. We also sellIndependent sales of application software licenses which are sold separately as well as training andinclude post contract support services. In addition, training services are sold separately. The products and services are generally sold under standardized licensing and sales arrangements with payment terms ranging from net 30 days in the United States to net 30 days and up to net 90 days in some international markets. Approximately 95%83% of our product/license sales include both hardware and software in the customer arrangement, with a small percentage of sales including other services. We offer rights of return and standard warranties for product defects related to our products. The rights of return are generally for a period of up to 30 days after the delivery date. The standard warranties cover periods ranging from 90 days to three years. With the exception of our former German systems integration subsidiary, which accounted for less than 1.5% of our revenues in the year ended December 31, 2004, weWe do not generally enter into contracts requiring product acceptance from the customer. This subsidiary was sold in December 2004.
Revenue is recognized in accordance with the provisions of SOP 97-2FASB ASC 985, when persuasive evidence of an arrangement exists, delivery has occurred, the fee is fixed or determinable, and collectability is probable. We enter into certain arrangements where we are obligated to deliver multiple products and/or services (“multiple elements”). In these transactions, we allocate the total revenue among the elements based on vendor specific objective evidence (“VSOE”) of fair value as determined by the sales price of each element when sold separately (“vendor-specific objective evidence”). Salesseparately.
When VSOE of fair value is available for the undelivered element of a multiple element arrangements, sales revenue from product sales is generally recognized on the date the product is shipped, using the residual method under FASB ASC 985, with a portion of revenue recorded as deferred (unearned) due to applicable undelivered elements. Undelivered elements for our multiple-elementmultiple element arrangements with a customer are generally restricted to post contract support and training and education. The amount of revenue allocated to these undelivered elements is based on the vendor-specific objective evidence (“VSOE”)VSOE of fair value for those undelivered elements. Deferred revenue due to undelivered elements is recognized ratably on a straight-line basis over the service period or when the service is completed. When VSOE of fair value is not available for the undelivered element of a multiple element arrangement, sales revenue is generally recognized ratably, on a straight-line basis over the service period of the undelivered element, generally 12 months or when the service is completed in accordance with the subscription method under FASB ASC 985. Deferred revenue at December 31, 20062009 and 20052008 was $22.2$57 million and $16.0$46 million, respectively.
The application of SOP 97-2FASB ASC 985 requires judgment, including whether a software arrangement includes multiple elements, and if so, whether VSOE of fair value exists for those elements. Changes to the elements in a software arrangement, the ability to identify VSOE for those elements, the fair value of the respective elements, and changes to a product'sproduct’s estimated life cycle could materially impact the amount of our earned and unearned revenue. Judgment is also required to assess whether future releases of certain software represent new products or upgrades and enhancements to existing products. Provision
Product revenue
Our product revenue is generated predominantly from the sales of measurement and automation products. Our products consist of application software and hardware components together with related driver software.
Software maintenance revenue
Software maintenance revenue is post contract customer support that provides the customer with unspecified upgrades/updates and technical support.Shipping and handling costsOur shipping and handling costs charged to customers are included in net sales, and the associated expense is recorded in cost of sales for estimated sales returns is made by reducing recorded revenue based on historical experience. Management analyzes historical returns, current economic trends, and changes in customer demand and acceptance of our products when evaluating the adequacy of our allowance for sales returns. The accounts receivable are net of allowance for sales returns of $1.5 million and $1.3 million at December 31, 2006 and 2005, respectively. Similarly, management must make estimates of the uncollectability of our accounts receivables. Management specifically analyzes accounts receivable and analyzes historical bad debts, customer concentrations, customer credit-worthiness and current economic trends when evaluating the adequacy of our allowance for doubtful accounts. The accounts receivable are net of allowances for doubtful accounts of $2.9 million and $3.4 million at December 31, 2006 and 2005, respectively.all periods presented.
Warranty reserve
We offer a one-year limited warranty on most hardware products, with a two or three-year warranty on a subset of our hardware products, which is included in the sales price of many of our products. Provision is made for estimated future warranty costs at the time of the sale pursuant to SFAS 5,Accounting for Loss FASB ASC 450, Contingencies (FASB ASC 450), for the estimated costs that may be incurred under the basic limited warranty. Our estimate is based on historical experience and product sales during this period.
The warranty reserve for the years ended December 31, 20062009 and 2005,2008, respectively, was as follows (in thousands):2006
2005
Balance at the beginning of the period $ 915 $ 815 Accruals for warranties issued during the period 1,593 1,652 Settlements made (in cash or in kind) during the period (1,641 ) (1,552 )
Balance at the end of the period $ 867 $ 915
2009 2008 Balance at the beginning of the period $ 952 $ 750 Accruals for warranties issued during the period 1,991 1,836 Settlements made (in cash or in kind) during the period (2,022 ) (1,634 ) Balance at the end of the period $ 921 $ 952
Loss contingencies
We accrue for probable losses from contingencies including legal defense costs, on an undiscounted basis, in accordance with SFAS 5, Accounting for Loss FASB ASC 450, Contingencies (FASB ASC 450), when such costs are considered probable of being incurred and are reasonably estimable. We periodically evaluate available information, both internal and external, relative to such contingencies and adjust this accrual as necessary.
Advertising expense
We expense costs of advertising as incurred. Advertising expense for the years ended December 31, 2006, 20052009, 2008 and 20042007 was $47.3$13.6 million, $42.5$19.3 million and $39.7$20.0 million, respectively.
Foreign currency translation
The functional currency for our international sales operations is the applicable local currency. The assets and liabilities of these operations are translated at the rate of exchange in effect on the balance sheet date and sales and expenses are translated at average rates. The resulting gains or losses from translation are included in a separate component of other comprehensive income. Gains and losses resulting from re-measuring monetary asset and liability accounts that are denominated in a currency other than a subsidiary’s functional currency are included in net foreign exchange gain (loss) and are included in net income.
Foreign currency hedging instruments
All of our derivative instruments are recognized on the balance sheet at their fair value. We currently use foreign currency forward and purchased option contracts to hedge our exposure to material foreign currency denominated receivables and forecasted foreign currency cash flows.
On the date the derivative contract is entered into, we designate the derivative as either a hedge of the fair value of foreign currency denominated receivables (“fair-value” hedge) or as a hedge of the variability of foreign currency cash flows to be received or paid (“cash flow” hedge). Changes in the fair market value or as a hedge of a fair-value hedge are recorded, along with the loss or gain on the re-measurement of foreign-currency-denominated receivables, in current earnings.our foreign denominated net receivable positions (“other derivatives”). Changes in the fair value of derivatives that are designated and qualify as cash flow hedges under SFAS 133FASB ASC 815, Derivatives and Hedging (FASB ASC 815) and that are deemed to be highly effective are recorded in other comprehensive income. These amounts are subsequently reclassified into earnings in the period during which the hedgehedged transaction is realized. The gain or loss on the other derivatives as well as the offsetting gain or loss on the hedged item attributable to the hedged risk is recognized in current earnings under the line item “Net foreign exchange gain (loss)”. We do not enter into derivative contracts for speculative purposes.
We formally document all relationships between hedging instruments and hedged items, as well as our risk-management objective and strategy for undertaking various hedge transactions. This process includes linking all derivatives that are designated as fair-value or cash flow hedges to specific assets and liabilities on the balance sheet or to specific firm commitments or forecasted transactions. We also formally assess, both at the hedge’s inception and on an ongoing basis, whether the hedging instruments are highly effective in offsetting changes in cash flows of hedged items.
We prospectively discontinue hedge accounting if (1) it is determined that the derivative is no longer highly effective in offsetting changes in the fair value of a hedged item (forecasted transactions); or (2) the derivative is de-designated as a hedge instrument, because it is unlikely that a forecasted transaction will occur. When hedge accounting is discontinued, the derivative is sold and the resulting gains and losses are recognized immediately in earnings.
Income taxes
We account for income taxes under the asset and liability method as set forth in SFAS 109,Accounting for FASB ASC 740, Income Taxes.Taxes (FASB ASC 740). Deferred tax assets and liabilities are recognized for the expected tax consequences of temporary differences between the tax bases of assets and liabilities and their reported amounts. Valuation allowances are established when necessary to reduce deferred tax assets to amounts which are more likely than not to be realized.
Earnings per share On January 21, 2004, we declared a stock split effected in the form of a dividend of one share of common stock for each two shares of common stock outstanding. The dividend was paid on February 20, 2004 to holders of record as of the close of business on February 5, 2004. All per share data and numbers of common shares, where appropriate, have been retroactively adjusted to reflect the stock split.
Basic earnings per share (“EPS”) is computed by dividing net income by the weighted average number of common shares outstanding during each period. Diluted EPS is computed by dividing net income by the weighted average number of common shares and common share equivalents outstanding (if dilutive) during each period. The number of common share equivalents, which include stock options and restricted stock units, is computed using the treasury stock method.
The reconciliation of the denominators used to calculate basic EPS and diluted EPS for the years ended December 31, 2006, 20052009, 2008 and 2004,2007, respectively, are as follows (in thousands):Years Ended December 31,
2006
2005
2004
Weighted average shares outstanding-basic 79,519 78,552 78,680 Plus: Common share equivalents Stock options, restricted stock units 2,000 2,358 3,416
Weighted average shares outstanding-diluted 81,519 80,910 82,096
Years Ended December 31, 2009 2008 2007 Weighted average shares outstanding-basic�� 77,520 78,567 79,468 Plus: Common share equivalents Stock options, restricted stock units 506 948 1,575 Weighted average shares outstanding-diluted 78,026 79,515 81,043
Stock options to acquire 3,295,000, 3,056,0002,711,976, 2,402,934 and 2,523,0002,304,078 shares for the years ended December 31, 2006, 20052009, 2008 and 2004,2007, respectively, were excluded in the computations of diluted EPS because the effect of including the stock options would have been anti-dilutive.
Stock-based compensation plans
Effective January 1, 2006, we adopted Statement of Financial Accounting Standards 123R (“SFAS 123R”),“Share-based Payments”FASB ASC 718, Compensation – Stock Compensation (FASB ASC 718), using the modified-prospective-transition method. Under this method, prior periods are not restated. Under this transition method, stock compensation cost recognized beginning January 1, 2006 includes: (a) compensation cost for all share-based payments granted prior to, but not yet vested as of January 1, 2006, based on the grant date fair value estimated in accordance with the original provisions of SFAS 123,FASB ASC 718, and (b) compensation cost for all share-based payments granted on or subsequent to January 1, 2006, based on the grant-date fair value estimated in accordance with the provisions of SFAS 123R.FASB ASC 718. Prior
Comprehensive income
Our comprehensive income is comprised of net income, foreign currency translation and unrealized gains and losses on forward and option contracts and securities available-for-sale. Comprehensive income for 2009, 2008 and 2007 was $20.1 million, $88.2 million and $111.6 million, respectively.
Recently Issued Accounting Pronouncements
In April 2009, the FASB updated FASB ASC 820 providing additional guidance for estimating fair value when the volume and level of activity for the asset or liability have significantly decreased. This update also includes guidance on identifying circumstances that indicate a transaction is not orderly. We adopted the update on April 1, 2009 as required and concluded it did not have a material impact on our consolidated financial position or results of operations.
In September 2009, the FASB updated FASB ASC 105, Generally Accepted Accounting Principles (FASB ASC 105). The update establishes the FASB Standards Accounting Codification (“Codification”) as the source of authoritative U.S. generally accepted accounting principles (“GAAP”) recognized by the FASB to adopting SFAS 123R, we presentedbe applied to nongovernmental entities and rules and interpretive releases of the SEC as authoritative GAAP for SEC registrants. The Codification supersedes all tax benefitsexisting non-SEC accounting and reporting standards. This update is effective for financial statements issued for interim and annual periods ending after September 15, 2009. We adopted the update on July 1, 2009, as required and concluded it did not have a material impact on our consolidated financial position or results of deductions resultingoperations.
In October 2009, the FASB updated FASB ASC 605, Revenue Recognition (FASB ASC 605) that amended the criteria for separating consideration in multiple-deliverable arrangements. The amendments establish a selling price hierarchy for determining the selling price of a deliverable. The selling price used for each deliverable will be based on vendor-specific objective evidence if available, third–party evidence if vendor-specific objective evidence is not available, or estimated selling price if neither vendor-specific objective evidence nor third-party evidence is available. The amendments will change the application of the residual method of allocation and require that arrangement consideration be allocated at the inception of the arrangement to all deliverables using the relative selling price method. The relative selling price method allocates any discount in the arrangement proportionally to each deliverable on the basis of each deliverable’s selling price. This update will be effective prospectively for revenue arrangements entered into or materially modified in fiscal years beginning on or after June 15, 2010. Early adoption is permitted. We are currently evaluating the requirements of this update and have not yet determined the impact on our consolidated financial statements.
In October 2009, the FASB updated FASB ASC 985, Software (FASB ASC 985) that changes the accounting model for revenue arrangements that include both tangible products and software elements. Tangible products containing software components and nonsoftware components that function together to deliver the tangible product’s essential functionality are no longer within the scope of the software revenue guidance in Subtopic 985-605. In addition, the amendments require that hardware components of a tangible product containing software components always be excluded from the exercisesoftware revenue guidance. This update will be effective prospectively for revenue arrangements entered into or materially modified in fiscal years beginning on or after June 15, 2010. Early adoption is permitted. We are currently evaluating the requirements of stock grants as operatingthis update and have not yet determined the impact on our consolidated financial statements.
Cash, cash flows. SFAS 123R requires the cash flows resulting from the tax benefits from tax deductions in excessequivalents, short-term and long-term investments consist of the compensation costfollowing (in thousands):
As ofDecember 31, 2009 As ofDecember 31, 2008 Cash and cash equivalents: Cash $ 85,612 $ 100,967 Cash equivalents: Time deposits — 73,400 Money market accounts 115,853 55,033 Total cash and cash equivalents $ 201,465 $ 229,400 Short-term investments: Municipal bonds $ 12,549 $ 6,220 Corporate bonds 7,587 — U.S. treasuries and agencies 21,033 — Foreign government bonds 34,674 — Time deposits 2,753 — Auction rate securities 8,177 — Auction rate securities put option 423 — Total short-term investments 87,196 6,220 Long-term investments: Auction rate securities — 6,964 Auction rate securities put option — 1,636 Other long-term investments — 1,900 Total investments $ 87,196 $ 16,720 Total cash, cash equivalents and investments $ 288,661 $ 246,120
The following table summarizes unrealized gains and losses related to our investments designated as available-for-sale (in thousands):
As of December 31, 2009 Adjusted Cost GrossUnrealized Gain GrossUnrealized Loss Cumulative Translation Adjustment Fair Value Municipal bonds $ 12,491 $ 58 $ — $ — $ 12,549 Corporate bonds 7,478 110 (1 ) — 7,587 U.S. treasuries and agencies 21,080 — (47 ) — 21,033 Foreign government bonds 36,105 76 — (1,507 ) 34,674 Time deposits 2,753 — — — 2,753 Auction rate securities 8,600 — (423 ) — 8,177 Auction rate securities put option — 423 — — 423 Total investments $ 88,507 $ 667 $ (471 ) $ (1,507 ) $ 87,196
As of December 31, 2008 Adjusted Cost GrossUnrealized Gain GrossUnrealized Loss Fair Value Municipal securities $ 6,199 $ 28 $ (7 ) $ 6,220 Auction rate securities 8,600 — (1,636 ) 6,964 Auction rate securities put option — 1,636 — 1,636 Other long-term investments 1,900 — — 1,900 Total investments $ 16,699 $ 1,664 $ (1,643 ) $ 16,720
The following table summarizes the contractual maturities of our investments designated as available-for-sale (in thousands):
As of December 31, 2009 Adjusted Cost Fair Value Due in less than 1 year $ 44,029 $ 43,267 Due in 1 to 5 years 44,478 43,929 Total investments $ 88,507 $ 87,196
As of December 31, 2009 Due in less than 1 year Adjusted Cost Fair Value Municipal bonds $ 4,103 $ 4,110 Corporate bonds 5,384 5,473 U.S. treasuries and agencies 5,065 5,057 Foreign government bonds 18,124 17,274 Time deposits 2,753 2,753 Auction rate securities 8,600 8,177 Auction rate securities put option — 423 Total investments $ 44,029 $ 43,267
As of December 31, 2009 Due in 1 to 5 years Adjusted Cost Fair Value Municipal bonds $ 8,388 $ 8,439 Corporate bonds 2,094 2,114 U.S. treasuries and agencies 16,015 15,976 Foreign government bonds 17,981 17,400 Time deposits — — Auction rate securities — — Auction rate securities put option — — Total investments $ 44,478 $ 43,929
Note 3 – Fair value measurements
FASB ASC 820, clarifies the definition of fair value, prescribes methods for measuring fair value, establishes a fair value hierarchy based on the inputs used to measure fair value and expands disclosures about the use of fair value measurements. Effective January 1, 2009, we adopted FASB ASC 820 for our nonfinancial assets and nonfinancial liabilities, except those items recognized (excess tax benefits) to be classifiedor disclosed at fair value on an annual or more frequently recurring basis. The adoption of FASB ASC 820 did not have a material impact on our fair value measurements as financing cash flows. Aswe did not have any items that were measured at fair value on a result, $4.3 million of excess tax benefitsnonrecurring basis for the year ended December 31, 20062009. In April 2009, FASB ASC 820 was updated to provide additional guidance for estimating fair value when the volume and level of activity for the asset or liability have been classified as financing cash flows. Prior tosignificantly decreased. The update also includes guidance on identifying circumstances that indicate a transaction is not orderly. We adopted the effective date of SFAS 123R, we applied Accounting Principles Board Opinion 25 (“APB 25”),“Accounting for Stock Issued to Employees”update on April 1, 2009 and related interpretations forit did not have a material impact on our stock option grants. APB 25 providesfair value measurements.
The following tables present our assets and liabilities that are measured at fair value on a recurring basis and are categorized using the compensation expense relative to our stock options is measuredfair value hierarchy. The fair value hierarchy has three levels based on the intrinsicreliability of the inputs used to determine fair value.
Fair Value Measurements at Reporting Date Using Description December 31, 2009 Quoted Prices in Active Markets for Identical Assets(Level 1) Significant Other Observable Inputs(Level 2) Significant Unobservable Inputs(Level 3) Assets Money Market Funds $ 115,853 $ 115,853 $ — $ — Short-term investments available-for-sale 87,196 78,596 — 8,600 Derivatives 11,016 — 11,016 — Total Assets $ 214,065 $ 194,449 $ 11,016 $ 8,600 Liabilities Derivatives $ (318 ) $ — $ (318 ) $ — Total Liabilities $ (318 ) $ — $ (318 ) $ —
Fair Value Measurements Using Significant Unobservable Inputs(Level 3) Short-term investmentsavailable-for-sale Beginning Balance, January 1, 2008 $ 8,600 Total gains (realized/unrealized) Included in earnings 423 Included in other comprehensive income — Total losses (realized/unrealized) Included in earnings (423 ) Included in other comprehensive income — Purchases, issuances and settlements — Transfer in and/or out of Level 3 — Ending Balance, December 31, 2009 $ 8,600 The amount of total gains or (losses) for the period included in earnings (or changes in net assets) attributableto the change in unrealized gains or losses relating to assets still held at the reporting date $ —
Short-term investments available-for-sale are valued using a market approach (Level 1) based on the quoted market prices of identical instruments when available or other observable inputs such as trading prices of identical instruments in inactive markets. Short-term investments available-for-sale consist of debt securities issued by states of the U.S. and political subdivisions of the states, corporate debt securities and debt securities issued by U.S. government corporations and agencies. All short-term investments available-for-sale have contractual maturities of less than 24 months.
Derivatives include foreign currency forward and option contracts. Our foreign currency forward contracts are valued using an income approach (Level 2) based on the spot rate less the contract rate multiplied by the notional amount. Our foreign currency option contracts are valued using a market approach based on the quoted market prices which are derived from observable inputs including current and future spot rates, interest rate spreads as well as quoted market prices of identical instruments.
Short-term debt securities available-for-sale included in Level 3 are reported at their fair market value and consist of auction rate securities backed by education loan revenue bonds. One of our auction rate securities is from the Vermont Student Assistance Corporation and has a par value of $2.2 million. The other of our auction rate securities is from the New Hampshire Health and Education Facilities Authority and has a par value of $6.4 million. The ratings for these securities at December 31, 2009, were Baa3/A/AAA and Aaa/NR/AAA, respectively. Historically, we reported the fair market value of these securities at par as differences between par value and the purchase price or settlement value were historically comprised of accrued interest. Auction rate securities are variable rate debt instruments whose interest rates are typically reset approximately every 7 to 35 days. On January 15, 2010, and in prior auction periods beginning in February 2008, the auction process for these securities failed. At December 31, 2009, we reported these as short-term investments at their estimated fair market value of $8.2 million.
In November 2008, we accepted the UBS Auction Rate Securities Rights (the “Rights”) agreement offered by UBS as a liquidity alternative to the failed auction process. This Rights agreement is related to the auction rates securities discussed above. The Rights agreement is a nontransferable right to sell our auction rate securities, at par value, back to UBS at any time during the period June 30, 2010, through July 2, 2012. At December 31, 2009, we reported the Rights agreement at its estimated fair market value of $423,000 as a component of short-term debt securities available for sale.
Due to the fact that our Rights agreement has an initial exercise date that is less than one year from now, we are now reporting our auction rate securities and the corresponding Rights agreement as short-term. We continue to have the ability to hold our auction rate securities to their ultimate maturities which are in excess of one year and we have not made a determination as to whether we will exercise our option under the Rights agreement or if we do choose to exercise our option, at what point during the period June 30, 2010 through July 2, 2012, we would exercise our option. However, due to the fact that our Rights agreement has an initial exercise date that is less than one year from now, we are now reporting our auction rate securities and the corresponding Rights agreement as short-term. We have recorded the unrealized loss related to the auction rate securities and the unrealized gain related to the Rights agreement as a component of other income (expense), in our Consolidated Statements of Income.
The estimated fair market value of both the auction rate securities and the Rights agreement was determined using significant unobservable inputs (Level 3) as prescribed by FASB ASC 820. We considered many factors in determining the fair market value of the stockauction rate securities as well as our corresponding Rights agreement at December 31, 2009, including the fact that the debt instruments underlying the auction rate securities have redemption features which call for redemption at 100% of par value, current credit curves for like securities and discount factors to account for the illiquidity of the market for these securities. During the year ended December 31, 2009, we did not make any changes to our valuation techniques or related inputs.
FASB ASC 815 requires companies to recognize all of their derivative instruments as either assets or liabilities in the statement of financial position at fair value. The accounting for changes in the fair value (i.e., gains or losses) of a derivative instrument depends on whether it has been designated and qualifies as part of a hedging relationship and further, on the type of hedging relationship. For those derivative instruments that are designated and qualify as hedging instruments, a company must designate the hedging instrument, based upon the exposure being hedged, as a fair value hedge, cash flow hedge, or a hedge of a net investment in a foreign operation.
We have operations in over 40 countries. Sales outside of the Americas as a percentage of consolidated sales were 57% and 57% for the years ended December 31, 2009 and 2008, respectively. Our activities expose us to a variety of market risks, including the effects of changes in foreign currency exchange rates. These financial risks are monitored and managed by us as an integral part of our overall risk management program.
We maintain a foreign currency risk management strategy that uses derivative instruments (foreign currency forward and purchased option contracts) to help protect our earnings and cash flows from fluctuations caused by the volatility in currency exchange rates. Movements in foreign currency exchange rates pose a risk to our operations and competitive position, since exchange rate changes may affect our profitability and cash flow, and the business or pricing strategies of our non-U.S. based competitors.
The vast majority of our foreign sales are denominated in the customers’ local currency. We purchase foreign currency forward and option contracts as hedges of forecasted sales that are denominated in foreign currencies and as hedges of foreign currency denominated receivables. These contracts are entered into to protect against the risk that the eventual dollar-net-cash inflows resulting from such sales or firm commitments will be adversely affected by changes in exchange rates. We also purchase foreign currency forward contracts as hedges of forecasted expenses that are denominated in foreign currencies. These contracts are entered into to protect against the risk that the eventual dollar-net-cash outflows resulting from foreign currency operating and cost of revenue expenses will be adversely affected by changes in exchange rates.
In accordance with FASB ASC 815, we designate foreign currency forward and purchased option contracts as cash flow hedges of forecasted revenues or forecasted expenses. In addition, we hedge our foreign currency denominated balance sheet exposures using foreign currency forward contracts. These derivatives are not designated as hedging instruments under FASB ASC 815. None of our derivative instruments contain a credit-risk-related contingent feature.
Cash flow hedges
To protect against the reduction in value caused by a fluctuation in foreign currency exchange rates of forecasted foreign currency cash flows resulting from international sales over the next one to two years, we have instituted a foreign currency cash flow hedging program. We hedge portions of our forecasted revenue and forecasted expenses denominated in foreign currencies with forward and purchased option contracts. For forward contracts, when the dollar strengthens significantly against the foreign currencies, the change in the present value of future foreign currency cash flows may be offset by the change in the fair value of the forward contracts designated as hedges. For option contracts, when the dollar strengthens significantly against the foreign currencies, the change in the present value of future foreign currency cash flows may be offset by the change in the fair value of the option contracts net of the premium paid designated as hedges. Our foreign currency purchased option contracts are purchased “at-the-money” or “out-of-the-money”. We purchase foreign currency forward and option contracts for up to 100% of our forecasted exposures in selected currencies (primarily in Euro, Japanese yen, British pound sterling, South Korean won and Hungarian forint) and limit the duration of these contracts to 40 months or less.
For derivative instruments that are designated and qualify as a cash flow hedge, the effective portion of the gain or loss on the derivative is reported as a component of accumulated other comprehensive income (“OCI”) and reclassified into earnings in the same line item (net sales, operating expenses, or cost of sales) associated with the forecasted transaction and in the same period or periods during which the hedged transaction affects earnings. Gains and losses on the derivative representing either hedge ineffectiveness or hedge components excluded from the assessment of effectiveness are recognized in current earnings or expenses during the current period and are classified as a component of “net foreign exchange gain (loss)”. Hedge effectiveness of foreign currency forwards and purchased option contracts designated as cash flow hedges are measured by comparing the hedging instrument’s cumulative change in fair value from inception to maturity to the forecasted transaction’s terminal value.
We held forward contracts with a notional amount of $28.6 million dollar equivalent of Euro, $4.0 million dollar equivalent of British pound sterling, $24.4 million dollar equivalent of Japanese yen, and $17.8 million dollar equivalent of Hungarian forint at dateDecember 31, 2009. These contracts are for terms of grant.up to 24 months. At December 31, 2008, we held forward contracts with a notional amount of $54.9 million dollar equivalent of Euro, $6.2 million dollar equivalent of British pound sterling, $18.9 million dollar equivalent of Japanese yen, $4.7 million dollar equivalent of South Korean won and $21.7 million dollar equivalent of Hungarian forint.
We held purchased option contracts with a notional amount of $28.4 million dollar equivalent of Euro at December 31, 2009. These contracts are for terms of up to 12 months. At December 31, 2008, we held purchased option contracts with a notional amount of $111.3 million dollar equivalent of Euro.
At December 31, 2009, we expect to reclassify $2.8 million of gains on derivative instruments from accumulated other comprehensive income to net sales during the next twelve months when the hedged international sales occur. At December 31, 2009, we expect to reclassify $3.7 million of gains on derivative instruments from accumulated OCI to cost of sales and $2.0 million of gains on derivative instruments from accumulated OCI to operating expenses during the next twelve months when the hedged international expenses occur. Expected amounts are based on derivative valuations at December 31, 2009. Actual results may vary as a result of changes in the corresponding exchange rate subsequent to this date.
During the year ended December 31, 2009, hedges with a notional amount of $22.8 million were determined to be ineffective. As a result, we recorded a net gain of adopting SFAS 123R$1.2 million related to these hedges as a component of “net foreign exchange gain (loss)” during the year ended December 31, 2009. We did not record any gains or losses due to the ineffectiveness of our hedges during the year ended December 31, 2008.Other Derivatives
Other derivatives not designated as hedging instruments under FASB ASC 815 consist primarily of foreign currency forward contracts that we use to hedge our foreign denominated net receivable or net payable positions to protect against the change in value caused by a fluctuation in foreign currency exchange rates. We typically hedge up to 90% of our outstanding foreign denominated net receivables or net payables and typically limit the duration of these foreign currency forward contracts to approximately 90 days. The gain or loss on the derivatives as well as the offsetting gain or loss on the hedge item attributable to the hedged risk is recognized in current earnings under the line item “net foreign exchange gain (loss)”. As of December 31, 2009 and December 31, 2008, we held foreign currency forward contracts with a notional amount of $45.2 million and $67.1 million, respectively.
Effective January 1, 2006,2009, we adopted the updated disclosure requirements of FASB ASC 815. The following table presents the fair value of derivative instruments on our income before income taxesConsolidated Balance Sheets and net incomethe effect of derivative instruments on our Consolidated Statements of Income.
Fair Values of Derivative Instruments (in thousands):
In thousands Asset Derivatives December 31, 2009 December 31, 2008 Balance Sheet Location Fair Value Balance Sheet Location Fair Value Derivatives designated as hedginginstruments under FASB ASC 815 Foreign exchange contracts – ST forwards Prepaid expenses and other current assets $ 7,947 Prepaid expenses and other current assets $ 5,260 Foreign exchange contracts – LT forwards Other long-term assets 274 Other long-term assets 2,654 Foreign exchange contracts – ST options Prepaid expenses and other current assets 1,821 Prepaid expenses and other current assets 5,705 Foreign exchange contracts – LT options Other long-term assets — Other long-term assets 3,838 Total derivatives designated ashedging instruments under FASB ASC 815 $ 10,042 $ 17,457 Derivatives not designated ashedging instruments under FASB ASC 815 Foreign exchange contracts – ST forwards Prepaid expenses and other current assets $ 974 Prepaid expenses and other current assets $ 2,745 Total derivatives not designated ashedging instruments under FASB ASC 815 $ 974 $ 2,745 Total derivatives $ 11,016 $ 20,202
Liability Derivatives December 31, 2009 December 31, 2008 Balance Sheet Location Fair Value Balance Sheet Location Fair Value Derivatives designated as hedginginstruments under FASB ASC 815 Foreign exchange contracts – ST forwards Accrued expenses and other liabilities $ — Accrued expenses and other liabilities $ (1,803 ) Foreign exchange contracts – LT forwards Other long-term liabilities — Other long-term liabilities — Foreign exchange contracts – ST options Accrued expenses and other liabilities — Accrued expenses and other liabilities — Foreign exchange contracts – LT options Other long-term liabilities — Other long-term liabilities — Total derivatives designated ashedging instruments under FASB ASC 815 $ — $ (1,803 ) Derivatives not designated ashedging instruments under FASB ASC 815 Foreign exchange contracts – ST forwards Accrued expenses and other liabilities $ (318 ) Accrued expenses and other liabilities $ (3,280 ) Total derivatives not designated ashedging instruments under FASB ASC 815 $ (318 ) $ (3,280 ) Total derivatives $ (318 ) $ (5,083 )
The following table shows the effect of derivative instruments on our Consolidated Statements of Income for the year ended December 31, 2006 are $9.42009 (in thousands):
Derivatives in FASB ASC 815 Cash Flow Hedging Relationship Amount of Gain or (Loss) Recognized in OCI on Derivative (Effective Portion) (in thousands) Location of Gain or (Loss) Reclassified from Accumulated OCI into Income (Effective Portion) Amount of Gain or (Loss) Reclassified from Accumulated OCI into Income (Effective Portion) (in thousands) Location of Gain or (Loss) Recognized in Income on Derivative (Ineffective Portion and Amount Excluded from Effectiveness Testing) Amount of Gain or (Loss) Recognized in Income on Derivative (Ineffective Portion and Amount Excluded from Effectiveness Testing) 2009 2009 2009 Foreign exchange contracts – forwards and options $ (6,304 ) Net sales $ 1,399 Net foreign exchange gain (loss) $ 1,132 Foreign exchange contracts – forwards and options 2,055 Cost of sales (74 ) Net foreign exchange gain (loss) (41 ) Foreign exchange contracts – forwards and options 1,427 Operating expenses 517 Net foreign exchange gain (loss) 81 Total $ (2,822 ) $ 1,842 $ 1,172
Derivatives not Designated as Hedging Instruments under FASB ASC 815 Location of Gain (Loss) Recognized in Income on Derivative Amount of Gain (Loss) Recognized in Income on Derivative 2009 Foreign exchange contracts – forwards Net foreign exchange gain/(loss) $ (1,669 ) Total $ (1,669 )
Note 5 – Inventories
Inventories, net consist of the following (in thousands):
December 31, 2009 2008 Raw materials $ 42,121 $ 48,004 Work-in-process 2,042 4,150 Finished goods 42,352 55,204 $ 86,515 $ 107,358
Note 6 – Property and equipment
Property and equipment consist of the following (in thousands):
December 31, 2009 2008 Land $ 17,076 $ 7,210 Buildings 138,367 136,802 Furniture and equipment 154,558 144,979 310,001 288,991 Accumulated depreciation (156,736 ) (134,514 ) $ 153,265 $ 154,477
Depreciation expense for the years ended December 31, 2009, 2008 and 2007, was $22.3 million, $20.9 million and $22.2 million, respectively.
Intangibles at December 31, 2009 and 2008 are as follows:
2009 2008 Gross Carrying Amount Accumulated Amortization Net Carrying Amount Gross Carrying Amount Accumulated Amortization Net Carrying Amount Capitalized software development costs $ 38,928 $ (20,455 ) $ 18,473 $ 25,610 $ (11,344 ) $ 14,266 Acquired technology 28,022 (20,967 ) 7,055 27,503 (16,804 ) 10,699 Patents 19,033 (5,377 ) 13,656 16,068 (4,506 ) 11,562 Other 12,577 (8,371 ) 4,206 11,401 (6,013 ) 5,388 $ 98,560 $ (55,170 ) $ 43,390 $ 80,582 $ (38,667 ) $ 41,915
Software development costs capitalized during 2009, 2008 and 2007 were $13.3 million, $9.5 million and $8.3 million, respectively, and related amortization was $9.1 million, $10.3 million and $8.9 million, respectively. Included in these capitalized costs for the years ended December 31, 2009, 2008, and 2007 were costs related to stock based compensation of $734,000, $451,000 and $422,000, respectively. Amortization of capitalized software development costs is computed on an individual product basis for those products available for market and is recognized based on the product’s estimated economic life, generally three years. Patents are amortized using the straight-line method over their estimated period of benefit, generally ten to seventeen years. Total intangible assets amortization expenses were $16.5 million, $16.2 million and $14.4 million for the years ended December 31, 2009, 2008 and 2007, respectively.
Capitalized software development costs, acquired technology, patents and other have weighted-average useful lives of 2.2 years, 1.8 years, 5.3 years, and 1.8 years, respectively, as of December 31, 2009. The estimated future amortization expense related to intangible assets as of December 31, 2009 is as follows:
Amount(in thousands) 2010 $ 18,097 2011 12,986 2012 7,187 2013 1,868 2014 1,186 Thereafter 2,066 $ 43,390
Acquisition intangibles are amortized over their useful lives, which range from three to eight years. Amortization expense for acquisition intangibles was approximately $3.9 million and $4.2 million for 2009 and 2008, respectively, of which approximately $3.4 million and $3.6 million was recorded in cost of sales and approximately $503,000 and $580,000 was recorded in operating expenses for 2009 and 2008, respectively. The estimated amortization expense of acquisition intangibles in future years will be recorded in our Consolidated Statements of Income as follows (in thousands):
Fiscal Year Cost of Sales Acquisition related costs and amortization, net Total 2010 $ 2,701 $ 369 $ 3,070 2011 2,160 221 2,381 2012 1,126 206 1,332 2013 87 75 162 Thereafter — — — Total $ 6,074 $ 871 $ 6,945
Note 8 – Goodwill
The carrying amount of goodwill for 2008 and 2009 are as follows:
Amount(in thousands) Balance as of December 31, 2007 $ 54,111 Acquisitions/purchase accounting adjustments 10,818 Divestitures — Foreign currency translation impact (368 ) Balance as of December 31, 2008 $ 64,561 Acquisitions/purchase accounting adjustments — Divestitures — Foreign currency translation impact 218 Balance as of December 31, 2009 $ 64,779
The excess purchase price over the fair value of assets acquired is recorded as goodwill. As we have one operating segment, we allocate goodwill to one reporting unit for goodwill impairment testing. In accordance with FASB ASC 350, goodwill is tested for impairment on an annual basis, and between annual tests if indicators of potential impairment exist, using a fair-value-based approach based on the market capitalization of the reporting unit. Our annual impairment test was performed as of February 28, 2009. No impairment of goodwill has been identified during the period presented. Goodwill is deductible for tax purposes in certain jurisdictions.
The components of income before income taxes are as follows (in thousands):
Years Ended December 31, 2009 2008 2007 Domestic $ 34,953 $ 15,921 $ 31,685 Foreign 15,292 82,216 81,742 $ 50,245 $ 98,137 $ 113,427
The provision for income taxes charged to operations is as follows (in thousands):
Years Ended December 31, 2009 2008 2007 Current tax expense: U.S. federal $ 3,117 $ 14,631 $ 15,957 State 136 1,391 1,155 Foreign 13,760 18,910 9,925 Total current 17,013 34,932 27,037 Deferred tax expense (benefit): U.S. federal 9,920 (11,008 ) 628 State 387 (373 ) (156 ) Foreign (2,864 ) (1,570 ) (2,783 ) Total deferred 7,443 (12,951 ) (2,311 ) Change in valuation allowance 8,704 (8,671 ) (18,332 ) Total provision $ 33,160 $ 13,310 $ 6,394
Deferred tax liabilities (assets) at December 31, 2009 and 2008 as follows (in thousands):
December 31, 2009 2008 Capitalized software $ 5,978 $ 4,615 Depreciation and amortization 10,577 9,536 Unrealized gain on derivative instruments — 4,153 Undistributed earnings of foreign subsidiaries 9,278 10,075 Gross deferred tax liabilities 25,833 28,379 Operating loss carryforwards (57,422 ) (43,360 ) Intangible assets (44,159 ) (58,987 ) Vacation and other accruals (3,700 ) (4,890 ) Inventory valuation and warranty provisions (6,702 ) (12,665 ) Doubtful accounts and sales provisions (1,088 ) (1,512 ) Unrealized exchange loss (917 ) (1,345 ) Deferred revenue . (853 ) (71 ) Accrued rent expenses (111 ) (117 ) Accrued legal expenses (710 ) (1,466 ) Unrealized loss on derivative instruments (242 ) — 10% minority stock investment (900 ) (920 ) Stock-based compensation (4,483 ) (5,353 ) Research and development tax credit carryforward (2,054 ) — Foreign tax credit carryforward (1,775 ) — Other (657 ) (783 ) Gross deferred tax assets (125,773 ) (131,469 ) Valuation allowance 99,862 85,815 Net deferred tax liability (asset) $ (78 ) $ (17,275 )
A reconciliation of income taxes at the U.S. federal statutory income tax rate to the effective tax rate follows:
Years Ended December 31, 2009 2008 2007 U.S. federal statutory tax rate 35 % 35 % 35 % Domestic production activities — — (1 ) Foreign taxes (less) than federal statutory rate (6 ) (9 ) (14 ) Change in valuation allowance 17 (9 ) (16 ) Research and development tax credit (4 ) (2 ) (1 ) Tax exempt interest — (1 ) (1 ) State income taxes, net of federal tax benefit 1 1 1 Employee share-based compensation 7 2 2 Intercompany profit 15 (5 ) — Other 1 2 1 Effective tax rate 66 % 14 % 6 %
Certain prior year amounts in the reconciliation of income taxes at the U.S. federal statutory income tax rate to the effective tax rate have been reclassified to conform to the 2009 presentation as shown in the following tables:
2008 foreign taxes (less) than federal statutory rate as reported in prior year Form 10-K (14 ) Reclassification (a) 5 2008 foreign taxes (less) than federal statutory rate as reported in current year Form 10-K (9 ) 2008 intercompany profit as reported in prior year Form 10-K — Reclassification (a) (5 ) 2008 intercompany profit as reported in current year Form 10-K (5 )
(a) These amounts represent income taxes on intercompany profit previously included in foreign taxes (less) than the federal statutory rate and reclassified to intercompany profit for comparability to corresponding amounts reported in 2009. The reclassification did not have any impact on our total income tax expense.
For the year ended December 31, 2009, we generated a federal net operating loss of approximately $3.3 million and tax credits of approximately $3.8 million. The federal net operating loss can be carried back two years and the federal tax credits can be carried back one year.
As of December 31, 2009, eleven of our subsidiaries have available, for income tax purposes, foreign net operating loss carryforwards of an aggregate of approximately $286 million, of which $12.1 million expire during the years 2011 - - 2018 and $273.9 million of which may be carried forward indefinitely. Our tax valuation allowance relates to our ability to realize certain of these foreign net operating loss carryforwards and benefits of tax deductible goodwill in excess of book goodwill.
We maintain a manufacturing facility in Hungary. As a result of certain foreign investment incentives available under Hungarian law, the profit from our Hungarian operation was subject to a reduced income tax rate. This special tax status terminated on January 1, 2008, with the merger of our Hungary manufacturing operations with its Hungarian parent company. The merger was effective on January 1, 2008. The aggregate tax benefit of the exemption was $8.7 million lower, respectively, than if we had continued to account for share-based compensation under APB 25. Basic and diluted earnings per share for the year ended December 31, 2006 are $0.112007.
In 2003, we restructured the organization of our manufacturing operation in Hungary. The tax deductible goodwill in excess of book goodwill created by this restructuring resulted in our being required to record a gross deferred tax asset of $91.0 million. Because we did not expect to have sufficient taxable income in the relevant jurisdiction in future periods to realize the benefit of this deferred tax asset, a full valuation allowance was established. Following the approval of the merger of our Hungarian manufacturing operation with its Hungarian parent company in December 2007, we released $8.7 million and $0.11 lower,$18.3 million in 2008 and 2007, respectively, than if we had continued to account for share-based compensation under APB 25. Deferred stock-based compensation balancesof the valuation allowance previously required under APB 25 were adjusted against previously recorded common stock and additional paid-in capital balances upon adoption of SFAS 123R, as required. Had we previously recognized compensation costs as prescribed by SFAS 123, previously reported net income, basic earnings per share and diluted earnings per share would have changed to the pro forma amounts shown below (in thousands, except per share amounts):
Years Ended December 31,
2005
2004
Net income, as reported $ 61,517 $ 48,610 Stock-based compensation included in reported net income, net of related tax effects 959 — Total stock-based compensation expense determined under fair value method for all awards, net of related tax effects (13,998 ) (12,741 )
Pro-forma net income $ 48,478 $ 35,869
Earnings per share: Basic - as reported $ 0.78 $ 0.62 Basic - pro-forma $ 0.62 $ 0.46 Diluted - as reported $ 0.76 $ 0.59 Diluted - pro-forma $ 0.60 $ 0.44
Pro-forma disclosuresestablished for the excess tax deductible goodwill to reflect the tax benefit we expected to realize in future periods.
For the year 2009, we expected to recognize an additional tax benefit of $9.7 million related to these assets. Effective January 1, 2010, a new tax law in Hungary provides for an enhanced deduction for the qualified research and development expenses of NI Hungary Software and Hardware Manufacturing Kft. ("NI Hungary"). During the three months ended December 31, 2006 are2009, we obtained confirmation of the application of this new tax law for the qualified research and development expenses of NI Hungary. Based on the application of this new tax law to the qualified research and development expense of NI Hungary, we no longer expect to have sufficient future taxable income in Hungary to realize the benefits of these tax assets. As such, we recorded an income tax charge of $21.6 million during the three months ended December 31, 2009, $18.4 million of which was related to a valuation allowance on the previously recognized assets created by the restructuring and $3.2 million of which was related to tax benefits from other assets that we will no longer be able to realize as a result of this change. We do not presented becauseexpect to realize the amounts aretax benefit of the remaining assets created by the restructuring and therefore we have a full valuation allowance of $98.2 million against those assets at December 31, 2009.
We have not provided for U.S. federal income and foreign withholding taxes on approximately $267.5 million of certain non-U.S. subsidiaries’ undistributed earnings as of December 31, 2009. These earnings would become subject to taxes of approximately $85.7 million, if they were actually or deemed to be remitted to the parent company as dividends or if we should sell our stock in these subsidiaries. We intend to permanently reinvest the undistributed earnings.
We adopted the provisions of FASB ASC 740, on January 1, 2007. FASB ASC 740 clarifies the accounting for uncertainty in income taxes recognized in an entity's financial statements and prescribes a recognition threshold and measurement attribute for financial statement disclosure of tax positions taken or expected to be taken on a tax return. We recognized no material adjustment to the Consolidated Statementsliability for unrecognized income tax benefits. A reconciliation of Income.the beginning and ending amount of unrecognized tax benefit is as follows (in thousands):
2009 2008 Balance at beginning of period $ 9,364 $ 8,273 Additions based on tax positions related to the current year 2,060 1,946 Additions for tax positions of prior years 1,272 366 Reductions as a result of the lapse of the applicable statute of limitations (1,634 ) (1,221 ) Balance at end of period $ 11,062 $ 9,364
All of our unrecognized tax benefits at December 31, 2009 would affect our effective income tax rate if recognized. As of December 31, 2009, it is deemed reasonably possible that the Company will recognize tax benefits in the amount of $2.3 million in the next twelve months due to the closing of open tax years. The nature of the uncertainty relates to deductions taken on returns that have not been examined by the applicable tax authority.
We recognize interest and penalties related to income tax matters in income tax expense. During the years ended December 31, 2009 and 2008, we recognized interest expense related to uncertain tax positions of approximately $506,000 and $365,000, respectively. The tax years 2002 through 2009 remain open to examination by the major taxing jurisdictions in which we file income tax returns.
Note 10 – Stockholders’ equity and stock-based compensation
Stock option plans
Our stockholders approved the 1994 Incentive Stock Option Plan (the “1994 Plan”) on May 9, 1994. At the time of approval, 9,112,500 shares of our common stock were reserved for issuance under this plan. In 1997, an additional 7,087,500 shares of our common stock were reserved for issuance under this plan, and an additional 750,000 shares were reserved for issuance under this plan, as amended, in 2004. The 1994 Plan terminated in May 2005, except with respect to outstanding awards previously granted thereunder. Awards under the plan were either incentive stock options within the meaning of Section 422 of the Internal Revenue Code or nonqualified options. The right to purchase shares vests over a five to ten-year period, beginning on the date of grant. Vesting of ten year awards may accelerate based on the Company’s previous year’s earnings and revenue growth but shares cannot accelerate to vest over a period of less than five years. Stock options must be exercised within ten years from date of grant. Stock options were issued at the market price at the grant date. As part of the requirements of SFAS 123R, the Company isFASB ASC 718, we are required to estimate potential forfeitures of stock grants and adjust compensation cost recorded accordingly. The estimate of forfeitures will be adjusted over the requisite service period to the extent that actual forfeitures differ, or are expected to differ, from such estimates. Changes in estimated forfeitures will be recognized through a cumulative catch-up adjustment in the period of change and will also impact the amount of stock compensation expense to be recognized in future periods.
Transactions under all stock option plans are summarized as follows:Number of
shares under
option
Weighted
average
exercise
price
Outstanding at December 31, 2003 9,726,418 $ 18.07 Exercised (882,539 ) 9.60 Canceled (325,912 ) 27.66 Granted 1,262,599 29.71
Outstanding at December 31, 2004 9,780,566 $ 20.02 Exercised (1,188,614 ) 10.72 Canceled (358,444 ) 29.49 Granted 244,725 24.24
Outstanding at December 31, 2005 8,478,233 $ 21.05 Exercised (1,398,617 ) 13.16 Canceled (164,943 ) 27.32 Granted 0 0
Outstanding at December 31, 2006 6,914,673 $ 22.49
Options exercisable at December 31: 2004 6,353,236 $ 17.23 2005 5,946,139 19.10 2006 5,384,470 21.53
Number of
shares under
option
Weighted
average
fair value
Weighted average, grant date fair value of options granted during: 2004 1,262,599 $ 16.72 2005 244,725 12.85 2006 0 0
Number ofshares underoption Weightedaverageexerciseprice Outstanding at December 31, 2006 6,914,673 $ 22.49 Exercised (1,515,107 ) 15.22 Canceled (104,925 ) 27.33 Granted — — Outstanding at December 31, 2007 5,294,641 $ 24.47 Exercised (925,743 ) 17.30 Canceled (96,331 ) 26.98 Granted — — Outstanding at December 31, 2008 4,272,567 $ 25.97 Exercised (379,630 ) 15.40 Canceled (181,434 ) 26.80 Granted — — Outstanding at December 31, 2009 3,711,503 $ 26.93 Options exercisable at December 31: 2007 4,368,972 $ 24.17 2008 3,812,334 26.00 2009 3,493,574 26.94
The aggregate intrinsic value of stock options at exercise, represented in the table above, was $25.5$2.3 million, $19.1$11.0 million and $18.3$22.3 million for the years ended December 31, 2006, 20052009, 2008 and 2004,2007, respectively. Total unrecognized stock-based compensation expense related to non-vested stock options was approximately $18.1$2.5 million as of the end of 2006,December 31, 2009, related to approximately 1,530,000218,000 shares with a per share weighted average fair value of $15.93.$17.50. We anticipate this expense to be recognized over a weighted average period of approximately 4.04.3 years.Outstanding and Exercisable by Price Range
As of December 31, 2006
Options Outstanding
Options Exercisable
Range of Exercise prices
Number
outstanding
as of
12/31/2006
Weighted
average
remaining
contractual life
Weighted
average
exercise
price
Number
exercisable
as of
12/31/2006
Weighted
average
exercise price
$8.6667 -$12.2222 1,072,535 1.27 $ 10.98 1,045,669 $ 10.9677 12.3611 - 15.3055 976,976 1.54 $ 15.23 967,192 $ 15.2258 15.5555 - 21.0417 1,720,096 5.18 $ 20.64 1,223,332 $ 20.6330 21.2533 - 29.5400 839,349 6.80 $ 25.53 538,372 $ 25.5261 29.8500 - 34.3750 2,305,717 5.60 $ 31.19 1,609,905 $ 31.5078
$8.6667 - $34.3750 6,914,673 3.94 $ 22.4883 5,384,470 $ 21.5254
Outstanding and Exercisable by Price Range as of December 31, 2009 Options Outstanding Options Exercisable Range of Exercise prices Number outstanding as of 12/31/2009 Weighted average remaining contractual life Weighted average exercise price Number exercisable as of 12/31/2009 Weighted average exercise price $16.08 – $21.95 1,238,441 1.74 $ 20.69 1,188,337 $ 20.71 $22.30 – $29.85 1,257,625 3.90 $ 28.15 1,098,218 $ 28.08 $30.51 – $34.38 1,215,437 0.41 $ 32.02 1,207,019 $ 32.02 $16.08 – $34.38 3,711,503 2.04 $ 26.93 3,493,574 $ 26.94
The weighted average remaining contractual life of options exercisable as of December 31, 20062009 was 3.371.9 years. The aggregate intrinsic value of options outstanding as of December 31, 20062009 was $32.9$9.4 million. The aggregate intrinsic value of options currently exercisable as of December 31, 20062009 was $30.8$8.8 million. No options were granted in the yearyears ended December 31, 20062009, 2008 and 2007 as our incentive option plan terminated in May 2005. The fair value of options granted in 2004 and 2005 were estimated on the date of grant using the Black-Scholes option-pricing model with the following weighted-average assumptions:2005
2004
Dividend expense yield 0.2% 0.2% Expected life 5.5 years 5.5 years Expected volatility 43.3% 53.2% Risk-free interest rate 4.0% 2.7%
Restricted stock plan
Our stockholders approved theour 2005 Incentive Plan on May 10, 2005. At the time of approval, 2,700,000 shares of our common stock were reserved for issuance under this plan, as well as the number of shares which had been reserved but not issued under the 1994 Plan (our incentive stock option plan which terminated in May 2005), and any shares that returned to the 1994 Plan as a result of termination of options or repurchase of shares issued under such plan. The 2005 Plan, administered by the Compensation Committee of the Board of Directors, provides for granting of incentive awards in the form of restricted stock and restricted stock units (“RSUs”) to directors, executive officers and employees of the Company and its subsidiaries. Awards vest over a three, five or ten-year period, beginning on the date of grant. Vesting of ten year awards may accelerate based on the Company’s previous year’s earnings and growth but ten year awards cannot accelerate to vest over a period of less than five years. Shares available for grant at December 31, 20062009 were 3,804,106.2,089,302. As part of the requirements of SFAS 123R, the Company isFASB ASC 718, we are required to estimate potential forfeitures of restricted stock unitsRSUs and adjust compensation cost recorded accordingly. The estimate of forfeitures will be adjusted over the requisite service period to the extent that actual forfeitures differ, or are expected to differ, from such estimates. Changes in estimated forfeitures will be recognized through a cumulative catch-up adjustment in the period of change and will also impact the amount of stock compensation expense to be recognized in future periods.
Transactions under the restricted stock plan2005 Plan are summarized as follows:RSUs
Number of RSUs
Weighted Average Grant Price
Balance at January 1, 2005 0 $ 0.00 Granted 813,305 $ 22.24 Earned 0 $ 0.00 Canceled (15,000 ) $ 22.12
Balance at December 31, 2005 798,305 $ 22.24 Granted 693,805 $ 32.21 Earned (113,794 ) $ 31.67 Canceled (53,383 ) $ 25.93
Balance at December 31, 2006 1,324,933 $ 26.77
RSUs Number of RSUs Weighted Average Grant Price Balance at January 1, 2007 1,324,933 $ 26.77 Granted 801,780 $ 27.90 Earned (209,303 ) $ 27.85 Canceled (75,776 ) $ 27.64 Balance at December 31, 2007 1,841,634 $ 26.86 Granted 763,182 $ 28.51 Earned (320,251 ) $ 29.42 Canceled (119,337 ) $ 28.19 Balance at December 31, 2008 2,165,228 $ 26.99 Granted 604,083 $ 21.80 Earned (407,156 ) $ 22.04 Canceled (57,721 ) $ 27.88 Balance at December 31, 2009 2,304,434 $ 26.48
Total unrecognized stock-based compensation expense related to non-vested restricted stock unitsRSU’s was approximately $32.6$57.1 million as of the end of 2006,December 31, 2009, related to 1,324,9332,304,434 shares with a per share weighted average fair value of $27.24.$26.48. We anticipate this expense to be recognized over a weighted average period of approximately 77.3 years.
Employee stock purchase plan
Our employee stock purchase plan permits substantially all domestic employees and employees of designated subsidiaries to acquire our common stock at a purchase price of 85% of the lower of the market price at the beginning or the end of the participationpurchase period. On December 21, 2005, our Compensation Committee amended theThe plan has quarterly purchase periods to be quarterly beginning on November 1, February 1, May 1, and AugustNovember 1 of each year. The initial period commencedAt our annual shareholders meeting held on April 1, 2006 and ended on July 31, 2006.May 7, 2007, our shareholders approved an additional 3 million shares of common stock to be reserved for issuance under this plan. Employees may designate up to 15% of their compensation for the purchase of common stock.stock under this plan. Common stock reserved for future employee purchases aggregated 823,3091,755,071 shares at December 31, 2006.2009. Shares issued under this plan were 539,541838,536 in the year ended December 31, 2006.2009. The weighted average fair value of the employees’ purchase rights was $22.34$19.05 per share and was estimated using the Black-Scholes model with the following assumptions:2006
2005
2004
Dividend expense yield 0.2% 0.2% 0.2% Expected life 3 months 6 months 6 months Expected volatility 29% 29% 35% Risk-free interest rate 4.5% 3.2% 1.0%
2009 2008 2007 Dividend expense yield 0.5% 0.3% 0.3% Expected life 3 months 3 months 3 months Expected volatility 45% 26% 23% Risk-free interest rate 0.8% 3.8% 5.0%
Weighted average, grant date fair value of purchase rights granted under the Employee Stock Purchase Plan:Number of shares
Weighted average fair value
2004 380,211 $ 7.73 2005 467,932 6.08 2006 539,541 6.62
Plan are as follows:
Numberof shares Weightedaveragefair value 2007 549,719 $ 6.19 2008 679,983 5.86 2009 838,536 5.75
Stock-based compensation included in total cost of sales and operating expenses for the years ended December 31, 2009, 2008 and 2007 are summarized as follows (in thousands):
2009 2008 2007 Stock-based compensation Total cost of sales $ 1,284 $ 1,063 $ 911 Sales and marketing 8,774 8,479 7,322 Research and development 7,236 7,121 6,435 General and administrative 3,005 3,084 2,866 Provision for income taxes (3,765 ) (4,601 ) (3,839 ) Total $ 16,534 $ 15,146 $ 13,695
Authorized Preferred Stock and Preferred Stock Purchase Rights Plan
We have 5,000,000 authorized shares of preferred stock. On January 21, 2004, our Board of Directors designated 750,000 of these shares as Series A Participating Preferred Stock in conjunction with its adoption of a Preferred Stock Rights Agreement (the “Rights Agreement”) and declaration of a dividend of one preferred share purchase right (a “Right”) for each share of common stock outstanding held as of May 10, 2004 or issued thereafter. Each Right will entitle its holder to purchase one one-thousandth of a share of National Instruments’ Series A Participating Preferred Stock at an exercise price of $200, subject to adjustment, under certain circumstances. The Rights Agreement was not adopted in response to any effort to acquire control of National Instruments.
The Rights only become exercisable in certain limited circumstances following the tenth day after a person or group announces acquisitions of or tender offers for 20% or more of our common stock. In addition, if an acquirer (subject to certain exclusions for certain current stockholders of National Instruments, an “Acquiring Person”) obtains 20% or more of our common stock, then each Right (other than the Rights owned by an Acquiring Person or its affiliates) will entitle the holder to purchase, for the exercise price, shares of our common stock having a value equal to two times the exercise price. Under certain circumstances, our Board of Directors may redeem the Rights, in whole, but not in part, at a purchase price of $0.01 per Right. The Rights have no voting privileges and are attached to and automatically traded with our common stock until the occurrence of specified trigger events. The Rights will expire on the earlier of May 10, 2014 or the exchange or redemption of the Rights. Comprehensive income
Our comprehensive income is comprised of net income, foreign currency translation and unrealized gains and losses on forward and option contracts and securities available for sale. Comprehensive income for 2006, 2005 and 2004 was $76.9 million, $57.2 million and $57.7 million, respectively.
Recently issued accounting pronouncements
In July 2006, the Financial Accounting Standards Board (“FASB”) issued FASB Interpretation (“FIN”) 48,Accounting for Uncertainty in Income Taxes – an interpretation of Statement of Financial Accounting Standards (“SFAS”) 109. This interpretation clarifies the accounting for uncertainty in income taxes recognized in an entity’s financial statements in accordance with SFAS 109,Accounting for Income Taxes. It prescribes a recognition threshold and measurement attribute for financial statement disclosure of tax positions taken or expected to be taken on a tax return. This interpretation is effective for fiscal years beginning after December 15, 2006. We adopted FIN 48 on January 1, 2007 as required. The cumulative effect of adopting FIN 48 was recorded in retained earnings upon adoption. The adoption of FIN 48 did not have a significant impact on our financial position or results of operations.
In September 2006, the Securities and Exchange Commission (“SEC”) issued Staff Accounting Bulletin (“SAB”) 108 regarding the process of quantifying financial statement misstatements. SAB 108 states that registrants should use both a balance sheet approach and an income statement approach when quantifying and evaluating the materiality of a misstatement. The interpretations in SAB 108 contain guidance on correcting errors under the dual approach as well as provide transition guidance for correcting errors. This interpretation does not change the requirements within SFAS 154,Accounting Changes and Error Corrections – a replacement of APB 20 and FASB Statement 3, for the correction of an error on financial statements. SAB 108 is effective for annual financial statements covering the first fiscal year ending after November 15, 2006. We adopted this interpretation on December 31, 2006. The adoption of SAB 108 did not have a significant effect on our consolidated financial statements.
In September 2006, the FASB issued SFAS 157,Fair Value Measurements. This standard defines fair value, establishes a framework for measuring fair value in accounting principles generally accepted in the United States of America, and expands disclosure about fair value measurements. This pronouncement applies under other accounting standards that require or permit fair value measurements. Accordingly, this statement does not require any new fair value measurement. This statement is effective for fiscal years beginning after November 15, 2007, and interim periods within those fiscal years. We will be required to adopt SFAS 157 in the first quarter of fiscal year 2008. We are currently evaluating the requirements of SFAS 157 and have not yet determined the impact on our consolidated financial statements.
In March 2006, the Emerging Issues Task Force (“EITF”) reached a consensus on EITF Issue 06-3,How Taxes Collected from Customers and Remitted to Governmental Authorities Should Be Presented in the Income Statement (that is, Gross versus Net Presentation). Taxes within the scope of EITF Issue 06-3 include any taxes assessed by a governmental authority that are directly imposed on a revenue-producing transaction between a seller and a customer and may include, but are not limited to, sales taxes, use taxes, value-added taxes, and some excise taxes. The EITF concluded that the presentation of these taxes on either a gross (included in revenues and costs) or a net (excluded from revenue) basis is an accounting policy decision that should be disclosed. For any such taxes that are reported on a gross basis, a company should disclose the amounts of those taxes in interim and annual financial statements. Our policy is to exclude all such taxes from revenue. The provisions of EITF 06-3 are effective for interim and annual reporting periods beginning after December 15, 2006. The adoption of EITF 06-3 will not have any effect on our consolidated financial statements.
Note 2: Short-term investments
Short-term investments at December 31, 2006 and 2005, consisting of corporate, state and municipal securities, were acquired at an aggregate cost of $150.2 million and $119.8 million, respectively. The contractual maturities of these securities, which are classified as available-for-sale and carried at fair value, are as follows (in thousands):
December 31,
2006
2005
Less than 90 days $ 73,787 $ 61,855 90 days to one year 31,309 42,222 One year through two years 38,559 11,877 Two years or more 6,535 3,892
$ 150,190 $ 119,846
Note 3: Inventories
Inventories, net consist of the following (in thousands):
December 31,
2006
2005
Raw materials $ 38,270 $ 28,497 Work-in-process 4,321 4,634 Finished goods 34,547 29,696
$ 77,138 $ 62,827
Note 4: Property and equipment
Property and equipment consist of the following (in thousands):
December 31,
2006
2005
Land $ 7,165 $ 7,085 Buildings 125,228 124,428 Furniture and equipment 110,710 91,073
243,103 222,586 Accumulated depreciation (97,678 ) (78,256 )
$ 145,425 $ 144,330
Depreciation expense for the years ended December 31, 2006, 2005 and 2004, was $20.2 million, $17.8 million and $17.3 million, respectively.
Note 5: Intangibles
Intangibles at December 31, 2006 and 2005 are as follows:
2006
2005
Gross Carrying Amount
Accumulated Amortization
Net Carrying Amount
Gross Carrying Amount
Accumulated Amortization
Net Carrying Amount
Capitalized software development costs $ 57,571 $ (41,791 ) $ 15,780 $ 50,201 $ (32,651 ) $ 17,550 Acquired technology 20,814 (9,734 ) 11,080 20,257 (6,296 ) 13,961 Patents 12,928 (3,076 ) 9,852 11,647 (2,445 ) 9,202 Other 6,452 (3,099 ) 3,353 4,826 (1,937 ) 2,889
$ 97,765 $ (57,700 ) $ 40,065 $ 86,931 $ (43,329 ) $ 43,602
Software development costs capitalized during 2006, 2005 and 2004 were $7.4 million, $13.4 million and $5.0 million, respectively, and related amortization was $9.1 million, $7.2 million and $6.6 million, respectively. Amortization of capitalized software development costs is computed on an individual product basis for those products available for market and is recognized based on the product’s estimated economic life, generally three years. Patents are amortized using the straight-line method over their estimated period of benefit, generally ten to seventeen years. Total intangible assets amortization expenses were $13.9 million, $10.7 million and $8.3 million for the years ended December 31, 2006, 2005 and 2004, respectively.
Capitalized software development costs, acquired technology, patents and other have weighted-average useful lives of 2.1 years, 4.1 years, 7.7 years and 3.7 years, respectively, as of the end of December 31, 2006. The estimated future amortization expense related to intangible assets as of December 31, 2006 is as follows:
Amount (in thousands)
2007 $ 13,044 2008 10,219 2009 5,046 2010 2,477 2011 1,569 Thereafter 7,710
$ 40,065
We established a valuation reserve in 2004 for the estimated total impairment of our $2.5 million cost-method investment in a start-up company. This impairment was based on our lack of expected recovery of our investment based on the start-up company’s lack of profitability.
Note 6: Goodwill
The carrying amount of goodwill for 2005 and 2006 are as follows:
Amount (in thousands)
Balance as of December 31, 2004 $ 13,356 Acquisitions/purchase accounting adjustments 39,177 Divestitures —
Balance as of December 31, 2005 52,533 Acquisitions/purchase accounting adjustments — Divestitures — Foreign currency translation impact 810
Balance as of December 31, 2006 $ 53,343
The excess purchase price over the fair value of assets acquired is recorded as goodwill. In accordance with SFAS 142,Goodwill and Other Intangible Assets, goodwill is tested for impairment on an annual basis, and between annual tests if indicators of potential impairment exist, using a fair-value-based approach. Our annual impairment test was performed on April 6, 2006. No impairment of goodwill was identified during any of the periods presented.
Note 7: Income taxes
The components of income before income taxes are as follows (in thousands):
Years Ended December 31,
2006
2005
2004
Domestic $ 40,681 $ 40,460 $ 37,786 Foreign 54,621 40,220 27,027
$ 95,302 $ 80,680 $ 64,813
The provision for income taxes charged to operations is as follows (in thousands):
Years Ended December 31,
2006
2005
2004
Current tax expense: U.S. federal $ 17,966 $ 11,022 $ 10,594 State 901 1,029 1,106 Foreign 5,190 3,725 3,300
Total current 24,057 15,776 15,000
Deferred tax expense (benefit): U.S. federal (1,233 ) 2,396 1,041 State (90 ) (102 ) 121 Foreign (140 ) 1,093 41
Total deferred (1,463 ) 3,387 1,203
Total provision $ 22,594 $ 19,163 $ 16,203
Deferred tax liabilities (assets) at December 31, 2006 and 2005 as follows (in thousands):
December 31,
2006
2005
Capitalized software $ 5,392 $ 6,288 Unrealized gain on derivative instruments — 86 Depreciation and amortization 9,071 8,598 Unrealized exchange gain 2 1,238 Undistributed earnings of foreign subsidiaries 10,313 4,410
Gross deferred tax liabilities 24,778 20,620
Operating loss carryforwards (34,154 ) (22,672 ) Intangibles (85,684 ) (71,125 ) Vacation and other accruals (3,783 ) (2,946 ) Inventory valuation and warranty provisions (6,666 ) (9,043 ) Doubtful accounts and sales provisions (1,328 ) (1,545 ) Intercompany profit (3,242 ) (2,442 ) Deferred revenue (2,613 ) — Accrued rent expenses (17 ) (17 ) Accrued legal expenses (1,450 ) (12 ) Unrealized loss on derivative instruments (149 ) — 10% minority stock investment (906 ) (911 ) Stock-based compensation (1,954 ) (563 ) Other (691 ) (629 )
Gross deferred tax assets (142,637 ) (111,905 )
Valuation allowance 117,768 91,534
Net deferred tax liability (asset) $ (91 ) $ 249
A reconciliation of income taxes at the U.S. federal statutory income tax rate to the effective tax rate follows:
Years Ended December 31,
2006
2005
2004
U.S. federal statutory tax rate 35 % 35 % 35 % Foreign sales corporation/ETI benefit (1 ) (2 ) (3 ) Domestic production activities (1 ) (1 ) — Foreign taxes more (less) than federal statutory rate (11 ) (7 ) (6 ) Change in valuation allowance — (1 ) — Research and development tax credit (1 ) (1 ) (1 ) Tax exempt interest (1 ) (1 ) (1 ) State income taxes, net of federal tax benefit 1 1 1 Employee share-based compensation 3 — — Other — 1 —
Effective tax rate 24 % 24 % 25 %
As of December 31, 2006, thirteen of our subsidiaries have available, for income tax purposes, foreign net operating loss carryforwards of an aggregate of approximately $214.4 million, of which $8.5 million expire during the years 2008 — 2013 and $205.9 million of which may be carried forward indefinitely. Our tax valuation allowance relates to the realizability of certain of these foreign net operating loss carryforwards and benefits of tax deductible goodwill in excess of book goodwill.
We maintain a manufacturing facility in Hungary. As a result of certain foreign investment incentives available under Hungarian law, the profit from our Hungarian operation is currently subject to a reduced income tax rate. Based on our capital investment in Hungary and current exemption limits which apply to this and any capital investments made through December 31, 2005, we currently expect this special tax status will terminate on or before December 31, 2008. The aggregate tax benefit of the exemption was $5.4 million and $3.4 million for the years ended December 31, 2006 and 2005, respectively.
In 2003, we restructured the organization of our manufacturing operation in Hungary. The tax deductible goodwill in excess of book goodwill created by this restructuring resulted in our being required to record a gross deferred tax asset of $91.0 million. The amortization of this excess tax deductible goodwill resulted in a $32.1 million and $20.1 million deferred tax asset for the associated net operating loss for the years ended December 31, 2006 and 2005, respectively. As of December 31, 2006 and 2005, the gross deferred tax asset related to the excess tax goodwill was $85.7 million and $71.1 million, respectively. Because we do not expect to have significant taxable income in the relevant jurisdiction in future periods to realize the benefit of these deferred tax assets, a valuation allowance for the entire amount of these deferred tax assets has been established.
We have not provided for U.S. federal income and foreign withholding taxes on approximately $111.8 million of certain non-U.S. subsidiaries’ undistributed earnings as of December 31, 2006. These earnings would become subject to taxes of approximately $36.5 million, if they were actually or deemed to be remitted to the parent company as dividends or if we should sell our stock in these subsidiaries. We currently intend to reinvest indefinitely these undistributed earnings.
Note 8: Stockholders’ equity
Stock repurchases and retirements In
Since 1998, our Board of Directors approved theand we maintained various stock repurchase and retirement of shares of common stock to reduce the dilutive effect of our stock plans.programs. Pursuant to the 1998 repurchase programthese plans we have repurchasedhad purchased and retired a total of 1,402,7257,354,966 shares for approximately $23.1$184.9 million from 1998 through December 31, 2007. During 2008, we purchased an additional 4,110,042 share for approximately $103.6 million. In 2002,At December 31, 2008, there were 723,092 shares available for repurchase under the plan approved in April 2008. On January 23, 2009, our Board of Directors approved a new share repurchase and retirement plan which replacedthat increased the 1998 plan. Underaggregate number of shares of common stock we are authorized to purchase from 591,324 to 3.0 million. During 2009, we purchased an additional 1,443,441 shares for approximately $34.6 million. At December 31, 2009, there were 1,688,327 shares available for repurchase under the plan approved in 2002, weJanuary 2009. Our share repurchase plan does not have authorization to repurchase up to 6,222,106 shares of National Instruments stock. This plan has noan expiration date. Pursuant to our repurchase program, we have repurchased and retired a total of 3,222,106 shares for approximately $82.0 million.
Note 9:11 – Employee retirement plan
We have a defined contribution retirement plan pursuant to Section 401(k) of the Internal Revenue Code. Substantially all domestic employees with at least thirty30 days of continuous service are eligible to participate and may contribute up to 15% of their compensation. The Board of Directors has elected to make matching contributions equal to 50% of employee contributions, which may be applied to a maximum of 6% of each participant’s compensation. Employees are eligible for our matching contributions after one year of continuous service. Company contributions vest immediately. Our policy prohibits participants from direct investment in shares of our common stock within the plan. Company contributions charged to expense were $3.0$3.9 million, $2.6$3.7 million and $2.4$3.3 million in 2006, 20052009, 2008 and 2004,2007, respectively.
Fair value of financial instrumentsIn accordance with FASB ASC 280, Segment Reporting (FASB ASC 280), we determine operating segments using the management approach. The estimated fair value amounts disclosed below have been determined using available market informationmanagement approach designates the internal organization that is used by management for making operating decisions and valuation methodologies described below. For certainassessing performance as the source of our financial instruments, including cashoperating segments. It also requires disclosures about products and cash equivalents, accounts receivable, accounts payableservices, geographic areas and accrued liabilities,major customers.
We have defined our operating segment based on geographic regions. We sell our products in three geographic regions. Our sales to these regions share similar economic characteristics, similar product mix, similar customers, and similar distribution methods. Accordingly, we have elected to aggregate these three geographic regions into a single operating segment. Revenue from the carrying amount approximates fair value due to the short-term maturity of these instruments. The estimated fair values of the other assets (liabilities)sale of our remaining financial instruments at December 31, 2006products which are similar in nature and 2005software maintenance are reflected as total net sales in our Consolidated Statements of Income.
Total net sales, operating income, interest income and long-lived assets, classified by the major geographic areas in which we operate, are as follows (in thousands):December 31,
2006
2005
Carrying
Amount
Fair
Value
Carrying
Amount
Fair
Value
Short-term investments $ 150,190 $ 150,190 $ 119,846 $ 119,846 Other assets/liabilities: Forward contracts (1,043 ) (1,043 ) 523 523
The fair values of short-term investments
Years Ended December 31, 2009 2008 2007 Net sales: Americas: Unaffiliated customer sales $ 292,999 $ 355,878 $ 331,482 Geographic transfers 86,145 132,563 115,709 379,144 488,441 447,191 Europe: Unaffiliated customer sales 210,188 267,373 230,940 Geographic transfers 189,076 204,282 159,992 399,264 471,655 390,932 Asia Pacific: Unaffiliated customer sales 173,407 197,286 177,956 Eliminations (275,221 ) (336,845 ) (275,701 ) $ 676,594 $ 820,537 $ 740,378
Years Ended December 31, 2009 2008 2007 Operating income: Americas $ 46,816 $ 71,467 $ 76,292 Europe 87,250 105,748 92,469 Asia Pacific 45,439 61,642 59,845 Unallocated: Research and development expenses (132,974 ) (143,140 ) (126,515 ) $ 46,531 $ 95,717 $ 102,091
Years Ended December 31, 2009 2008 2007 Interest income: Americas $ 803 $ 2,603 $ 5,138 Europe 727 3,291 4,485 Asia Pacific 99 102 199 $ 1,629 $ 5,996 $ 9,822
December 31, 2009 2008 Long-lived assets: Americas $ 100,489 $ 107,701 Europe 36,555 39,280 Asia Pacific 16,221 7,496 $ 153,265 $ 154,477
Total sales outside the United States for 2009, 2008 and foreign currency forward contracts2007 were estimated based upon quotes from brokers as of the applicable balance sheet date.$412.7 million, $499.3 million and $437.0 million, respectively.
Note 11: Derivative instruments13 – Commitments, contingencies and hedging activitiesleases
We have operations in 40 countries. Approximately 52% of our revenues are generated outsidecommitments under non-cancelable operating leases primarily for office facilities throughout the Americas. Our activities exposeworld. Certain leases require us to a varietypay property taxes, insurance and routine maintenance, and include escalation clauses. Future minimum lease payments as of market risks, includingDecember 31, 2009, for each of the effects of changes in foreign-currency exchange rates. These financial risksnext five years are monitored and managed by us as an integral part of our overall risk management program. We maintain a foreign-currency risk management strategy that uses derivative instruments (foreign currency forward and purchased options contracts) to protect our earnings and cash flows from fluctuations caused by the volatility in currency exchange rates. Movements in foreign-currency exchange rates pose a risk to our operations and competitive position, since exchange rate changes may affect our profitability and cash flow, and the business or pricing strategies of our non-U.S. based competitors.
Foreign currency fair value and cash flow hedges
The vast majority of our foreign sales are denominated in the customers’ local currency. We purchase foreign currency forward and purchased options contracts as hedges of forecasted sales that are denominated in foreign currencies and as hedges of foreign currency denominated receivables. These contracts are entered into to protect against the risk that the eventual dollar-net-cash inflows resulting from such sales or firm commitments will be adversely affected by changes in exchange rates.
We held forward contracts with notional amounts totaling $19.6follows (in thousands):
2010 $ 14,415 2011 9,898 2012 6,982 2013 4,611 2014 3,665 Thereafter 12,130 $ 51,701
Rent expense under operating leases was approximately $12.3 million, $11.7 million and $24.1$10.2 million at December 31, 2006 and 2005, respectively, that were designated as foreign currency fair value hedges of our foreign denominated receivables. The fair value of these contracts, which are for 90-day periods, is a liability of $617,000 and a receivable of $278,000 at December 31, 2006 and 2005, respectively. We recorded net losses of $1.0 million, net gains of $2.2 million and net losses of $2.6 million for fair value hedges for the years ended December 31, 2006, 20052009, 2008 and 2004, respectively, which was recorded2007, respectively.
As of December 31, 2009, we have non-cancelable purchase commitments with various suppliers of customized inventory and inventory components totaling approximately $6.5 million over the next twelve months.
As of December 31, 2009, we have outstanding guarantees for payment of customs and foreign grants totaling approximately $5.2 million.
Note 14 – Litigation
We filed a patent infringement action on January 25, 2001, in “Foreign Exchange Gain (Loss).” We hedge up to 90%the U.S. District Court, Eastern District of Texas (Marshall Division) claiming that The MathWorks, Inc. (“MathWorks”) infringed certain of our outstanding foreign denominated receivables. We held forward contracts withU.S. patents. On January 30, 2003, a notionaljury found infringement by MathWorks of three of the patents involved and awarded us specified damages. On September 23, 2003, the District Court entered final judgment in favor of us and entered an injunction against MathWorks’ sale of its Simulink and related products and stayed the injunction pending appeal. Upon appeal, the judgment and the injunction were affirmed by the U.S. Court of Appeals for the Federal Circuit (September 3, 2004). Subsequently the stay of injunction was lifted by the District Court. In November 2004, the final judgment amount of $26.6$7.4 million which had been held in escrow pending appeal was released to us.
An action was filed by MathWorks against us on September 22, 2004, in the U.S. District Court, Eastern District of Texas (Marshall Division), claiming that on that day MathWorks had released modified versions of its Simulink and $7.1related products, and seeking a declaratory judgment that the modified products do not infringe the three patents adjudged infringed in the District Court's decision of September 23, 2003 (and affirmed by the Court of Appeals on September 3, 2004). On November 2, 2004, MathWorks served the complaint on us. We filed an answer to MathWorks’ declaratory judgment complaint, denying MathWorks’ claims of non-infringement and alleging our own affirmative defenses. On January 5, 2005, the Court denied a contempt motion by us to enjoin the modified Simulink products under the injunction in effect from the first case. On January 7, 2005, we amended our answer to include counterclaims that MathWorks’ modified products are infringing three of our patents, and requested unspecified damages and an injunction. MathWorks filed its reply to our counterclaims on February 7, 2005, denying the counterclaims and alleging affirmative defenses. On March 2, 2005, we filed a notice of appeal regarding the Court's denial of the contempt motion. On March 15, 2005, the Court stayed MathWorks’ declaratory judgment action, pending a decision on the appeal by the Court of Appeals for the Federal Circuit. On February 9, 2006, the Court of Appeals for the Federal Circuit affirmed the District Court’s January 2005 order. On November 22, 2006, the District Court lifted the stay. The case schedule has yet to be set in this action. During the fourth quarter of 2004, we accrued $4 million at December 31, 2006 and 2005, respectively, that were designated as foreign currency cash flow hedges related to our probable loss from this contingency, which consists entirely of anticipated sales transactions.patent defense costs that are probable of being incurred. In the fourth quarter of 2006, we accrued an additional $600,000 related to this contingency. During the third quarter of 2009, we reduced the accrual by $2 million to reflect a decrease in the estimated costs that are probable of being incurred in this action. To date, we have charged a cumulative total of $623,000 against this accrual. At December 31, 2009, the remaining accrual was $2 million.
On February 1, 2008, we acquired all of the outstanding shares of microLEX Systems ApS, (“microLEX”) a premier provider of virtual instrumentation-based video, audio and mixed-signal test solutions. This acquisition was accounted for as a business combination. The purchase price of the acquisition, which included legal and accounting fees, was $17.8 million in cash. The allocation of the purchase price was determined using the fair value of these contracts, whichassets and liabilities acquired as of February 1, 2008. We funded the purchase price from existing cash balances. Our consolidated financial statements include the operating results from the date of acquisition. Pro-forma results or operations have not been presented because the effects of those operations were not material. The following table summarizes the allocation of the purchase price of microLEX (in thousands):
Goodwill $ 10,818 Acquired core technology 5,201 Non-competition agreements 159 Trademarks 119 Customer relationships 354 Current assets acquired 3,057 Long-term assets acquired 20 Current liabilities assumed (486 ) Deferred tax liabilities (1,458 ) Total assets acquired $ 17,784
Goodwill is not deductible for tax purposes. Existing technology, non-competition agreements, trademarks, and customer relationships have useful lives of 5 years, 3 years, 3 years, and 5 years, respectively, from the date of acquisition. These assets are not deductible for terms uptax purposes.
Note 16 – Quarterly results (unaudited)
The following quarterly results have been derived from unaudited consolidated financial statements that, in the opinion of management, reflect all adjustments (consisting only of normal recurring adjustments) necessary for a fair presentation of such quarterly information. The operating results for any quarter are not necessarily indicative of the results to twelve months, is a liabilitybe expected for any future period. The unaudited quarterly financial data for each of $427,000 and a receivable of $245,000 at December 31, 2006 and 2005, respectively, and a net unrealized deferred loss of $427,000 and a net unrealized deferred gain of $245,000 at December 31, 2006 and 2005, respectively, was recordedthe eight quarters in “Accumulated Other Comprehensive Income.” We hedge up to 100% of anticipated foreign currency denominated sales transactions for up to 40 months. We recorded net losses of $1.0 million and net gains of $105,000 and net losses of $5.8 million for cash flow hedges for the two years ended December 31, 2006, 2005 and 2004, respectively, which was included in “Net Sales.” As of December 31, 2006, $427,000 of deferred losses on cash flow hedges recorded in “Accumulated Other Comprehensive Income” are expected to be reclassified to earnings during the next twelve months. The actual foreign sales expected to occur over the next twelve months will necessitate the reclassifying to earnings of these derivative gains.
Hedge effectiveness of a foreign currency option contract designated as a cash flow hedge is measured by comparing the hedging instrument’s cumulative change in fair value from inception to maturity to the forecasted transaction’s terminal value. No amounts were excluded from the assessment of hedge effectiveness nor were there any amounts of ineffectiveness recorded in the consolidated statements of income for the years ended December 31, 2006 and 2005.
Note 12: Segment information
In accordance with SFAS 131,Disclosures about Segments of an Enterprise and Related Information, we determine operating segments using the management approach. The management approach designates the internal organization that is used by management for making operating decisions and assessing performance as the source of our operating segments. It also requires disclosures about products and services, geographic areas and major customers.
While we sell our products to many different markets, management has chosen to organize the Company by geographic areas, and as a result has determined that we have one operating segment. Substantially all of the interest income, depreciation and amortization is recorded in the Americas. Net sales, operating income and identifiable assets, classified by the major geographic areas in which we operate,2009 are as follows (in thousands)thousands, except per share data):
Years Ended December 31,
2006
2005
2004
Net sales: Americas: Unaffiliated customer sales $ 317,780 $ 275,524 $ 243,651 Geographic transfers 125,096 87,072 84,520
442,876 362,596 328,171
Europe: Unaffiliated customer sales 193,364 171,499 164,895 Geographic transfers 159,369 125,650 99,958
352,733 297,149 264,853
Asia Pacific: Unaffiliated customer sales 149,263 124,818 105,542
Eliminations (284,465 ) (212,722 ) (184,478 )
$ 660,407 $ 571,841 $ 514,088
Years Ended December 31,
2006
2005
2004
Operating income: Americas $ 67,644 $ 63,267 $ 53,472 Europe 78,402 61,790 55,705 Asia Pacific 54,771 40,996 38,211 Unallocated: Research and development expenses (113,095 ) (87,841 ) (84,692 )
$ 87,722 $ 78,212 $ 62,696
December 31,
2006
2005
Identifiable assets: Americas $ 476,027 $ 436,170 Europe 188,388 129,420 Asia Pacific 56,805 42,746
$ 721,220 $ 608,336
Total sales outside
Three Months Ended Mar. 31,2009 Jun. 30,2009 Sep. 30,2009 Dec. 31,2009 Net sales $ 157,799 $ 152,163 $ 165,035 $ 201,597 Gross profit 116,916 111,677 123,136 154,981 Operating income (2,479 ) 2,341 10,688 35,981 Net income 358 4,430 9,931 2,366 Basic earnings per share $ 0.00 $ 0.06 $ 0.13 $ 0.03 Weighted average shares outstanding-basic 77,277 77,556 77,653 77,589 Diluted earnings per share $ 0.00 $ 0.06 $ 0.13 $ 0.03 Weighted average shares outstanding-diluted 77,436 77,824 78,103 78,325 Dividends declared per share $ 0.12 $ 0.12 $ 0.12 $ 0.12
Three Months Ended Mar. 31,2008 Jun. 30,2008 Sep. 30,2008 Dec. 31,2008 Net sales $ 192,918 $ 210,474 $ 215,038 $ 202,107 Gross profit 143,849 157,034 160,531 152,014 Operating income 18,065 27,834 27,946 21,872 Net income 17,616 24,734 23,159 19,318 Basic earnings per share $ 0.22 $ 0.32 $ 0.29 $ 0.25 Weighted average shares outstanding-basic 78,840 78,484 78,834 78,110 Diluted earnings per share $ 0.22 $ 0.31 $ 0.29 $ 0.25 Weighted average shares outstanding-diluted 79,825 79,549 79,841 78,522 Dividends declared per share $ 0.11 $ 0.11 $ 0.11 $ 0.11
Note 17 – Subsequent events
In accordance with FASB ASC 855, Subsequent Events (FASB ASC 855), we have evaluated subsequent events through February 17, 2010, the United States for 2006, 2005 and 2004date the financial statements were $373.7 million, $323.9 million and $293.3 million, respectively.issued.
On January 22, 2010, our Board of Directors declared a quarterly cash dividend of $0.13 per common share, payable March 1, 2010, to shareholders of record on February 8, 2010.
From January 29, 2010 to February 12, 2010, we have repurchased 683,832 shares of our common stock at an average price of $29.97 under our share repurchase plan. The maximum number of shares that may yet be purchased under our plan is 1,004,495. Our purchase plan does not have an expiration date.
Note 13: Commitments, contingencies and leases
We have commitments under non-cancelable operating leases primarily for office facilities. Certain leases require us to pay property taxes, insurance and routine maintenance, and include escalation clauses. Future minimum lease payments as of December 31, 2006, for each of the next five years are as follows (in thousands):
2007 $ 7,241 2008 5,682 2009 4,883 2010 3,103 2011 1,983 Thereafter 799
$ 23,691
Rent expense under operating leases was approximately $8.7 million, $7.8 million and $6.5 million for the years ended December 31, 2006, 2005 and 2004, respectively.
As of December 31, 2006, we have non-cancelable purchase commitments with various suppliers of customized inventory and inventory components totaling approximately $7.0 million over the next twelve months.
As of December 31, 2006, we have outstanding guarantees for payment of customs and foreign grants totaling approximately $3.5 million.
Note 14: ��Litigation
We filed a patent infringement action on January 25, 2001 in the U.S. District Court, Eastern District of Texas (Marshall Division) claiming that The MathWorks, Inc. (“MathWorks”) infringed certain of our U.S. patents. On January 30, 2003, a jury found infringement by MathWorks of three of the patents involved and awarded us specified damages. On June 23, 2003, the District Court entered final judgment in favor of us and entered an injunction against MathWorks’ sale of its Simulink and related products and stayed the injunction pending appeal. Upon appeal, the judgment and the injunction were affirmed by the U.S. Court of Appeals for the Federal Circuit (September 3, 2004). Subsequently the stay of injunction was lifted by the District Court. In November 2004, the final judgment amount of $7.4 million which had been held in escrow pending appeal was released to us.
An action was filed by MathWorks against us on September 22, 2004, in the U.S. District Court, Eastern District of Texas (Marshall Division), claiming that on that day MathWorks had released modified versions of its Simulink and related products, and seeking a declaratory judgment that the modified products do not infringe the three patents adjudged infringed in the District Court’s decision of June 23, 2003, (and affirmed by the Court of Appeals on September 3, 2004). On November 2, 2004, MathWorks served the complaint on us. We filed an answer to MathWorks’ declaratory judgment complaint, denying MathWorks’ claims of non-infringement and alleging our own affirmative defenses. On January 5, 2005, the Court denied a contempt motion by us to enjoin the modified Simulink products under the injunction in effect from the first case. On January 7, 2005, we amended our answer to include counterclaims that MathWorks’ modified products are infringing three of our patents, and requested unspecified damages and an injunction. MathWorks filed its reply to our counterclaims on February 7, 2005, denying the counterclaims and alleging affirmative defenses. On March 2, 2005, we filed a notice of appeal regarding the Court’s denial of the contempt motion. On March 15, 2005, the Court stayed MathWorks’ declaratory judgment action, pending a decision on the appeal by the Court of Appeals for the Federal Circuit. On February 9, 2006, the Court of Appeals for the Federal Circuit affirmed the District Court’s January 2005 order. On November 22, 2006, the District Court lifted the stay. The case schedule has yet to be set in this action. During the fourth quarter of 2004, we accrued $4 million related to our probable loss from this contingency, which consists entirely of anticipated patent defense costs that are probable of being incurred. In the fourth quarter of 2006, we accrued an additional $600,000 related to this contingency. We charged approximately $57,000 against this accrual during the fourth quarter of 2006. We have charged a total of $602,000 against this accrual through December 31, 2006.
Note 15: Acquisitions
On January 31, 2005, we acquired all of the common stock of Toronto, Canada-based Electronics Workbench, a supplier of electronics design automation software. The acquisition was accounted for as a purchase. The purchase price of the acquisition, subject to adjustment as provided for in the purchase agreement, was $12.1 million in cash. We funded the purchase price from existing cash balances. Our consolidated financial statements include the operating results from the date of acquisition. Pro-forma results of operations have not been presented because the effects of those operations were not material. In accordance with SFAS 141, Business Combinations, the total purchase consideration has been allocated to the assets acquired and liabilities assumed, including identifiable intangible assets, based on their respective estimated fair values at the date of acquisition.
On April 29, 2005, we acquired the operating assets of Measurement Computing Corporation (MCC), a provider of low-cost data acquisition products. The acquisition was accounted for as a purchase. We acquired the operating assets of MCC, which included the legal positions of MCC and SoftWIRE in litigation against us. As a result of the asset acquisition, a pending legal action was dismissed with prejudice and we eliminated our remaining $1.9 million accrual for patent defense costs related to MCC. The gain that resulted from the elimination of the accrual was recorded in general and administrative expenses. The purchase price of the acquisition, subject to adjustment as provided for in the purchase agreement, was $33.2 million in cash. We funded the purchase price from existing cash balances. Our consolidated financial statements include the operating results from the date of acquisition. Pro-forma results of operations have not been presented because the effects of those operations were not material. In accordance with SFAS 141, the total purchase consideration has been allocated to the assets acquired and liabilities assumed, including identifiable assets, based on their respective estimated fair values at the date of acquisition.
On October 17, 2005, we acquired the operating assets of IOtech, Inc., a provider of PC-based data acquisition and instrumentation products. The acquisition was accounted for as a purchase. The purchase price of the acquisition, subject to adjustment as provided for in the purchase agreement, was $17.6 million in cash. We funded the purchase price from existing cash balances. Our consolidated financial statements include the operating results from the date of acquisition. Pro-forma results of operations have not been presented because the effects of those operations were not material. In accordance with SFAS 141, the total purchase consideration has been allocated to the assets acquired and liabilities assumed, including identifiable assets, based on their respective estimated fair values at the date of acquisition.
Goodwill is deductible for tax purposes. Goodwill is not amortized but is reviewed periodically for impairment. Acquired core technology and intangible assets are amortized over their useful lives, which range from three to eight years. Amortization expense for intangible assets acquired was approximately $3.2 million and $2.0 million for 2006 and 2005, respectively, of which approximately $2.7 million and $1.5 million was recorded in cost of sales and approximately $490,000 and $490,000 was recorded in operating expenses. The estimated amortization expense of intangible assets acquired for the current fiscal year and in future years will be recorded in the consolidated statements of income as follows (in thousands):
Fiscal Year
Cost of Sales
Acquisition related costs and amortization, net
Total
2007 $ 2,689 $ 450 $ 3,139 2008 2,532 412 2,944 2009 2,259 338 2,597 2010 1,725 177 1,902 Thereafter 1,166 271 1,437
Total $ 10,371 $ 1,648 $ 12,019
Note 16: Related party transactions
During 2002, we contributed approximately $3.6 million to the National Instruments Foundation, a 501(c)(3) charitable foundation established in 2002 for the purpose of continued promotion of scientific and engineering research and education at higher education institutions worldwide. This contribution was recorded as general and administrative expense in 2002. Two of the four directors of the National Instruments Foundation are current officers of National Instruments.
Note 17: Quarterly results (unaudited)
The following quarterly results have been derived from unaudited consolidated financial statements that, in the opinion of management, reflect all adjustments (consisting only of normal recurring adjustments) necessary for a fair presentation of such quarterly information. The operating results for any quarter are not necessarily indicative of the results to be expected for any future period. The unaudited quarterly financial data for each of the eight quarters in the two years ended December 31, 2006 are as follows (in thousands, except per share data):
Three Months Ended
Mar. 31, 2006
Jun. 30, 2006
Sep. 30, 2006
Dec. 31, 2006
Net sales $ 154,752 $ 160,123 $ 164,079 $ 181,453 Gross profit 113,247 119,271 121,648 135,915 Operating income 15,826 20,911 22,367 28,616 Net income 12,602 17,021 18,651 24,434 Basic earnings per share $ 0.16 $ 0.21 $ 0.23 $ 0.31 Weighted average shares outstanding-basic 79,053 79,611 79,637 79,767 Diluted earnings per share $ 0.15 $ 0.21 $ 0.23 $ 0.30 Weighted average shares outstanding-diluted 81,608 81,653 81,274 81,524 Dividends declared per share $ 0.06 $ 0.06 $ 0.06 $ 0.06
Three Months Ended
Mar. 31, 2005
Jun. 30, 2005
Sep. 30, 2005
Dec. 31, 2005
Net sales $ 129,740 $ 140,822 $ 141,618 $ 159,661 Gross profit 97,376 104,109 103,725 117,322 Operating income 14,182 19,093 18,343 26,594 Net income 11,136 15,024 14,399 20,958 Basic earnings per share $ 0.14 $ 0.19 $ 0.18 $ 0.27 Weighted average shares outstanding-basic 79,175 78,303 78,158 78,505 Diluted earnings per share $ 0.14 $ 0.19 $ 0.18 $ 0.26 Weighted average shares outstanding-diluted 81,924 80,190 80,575 80,821 Dividends declared per share $ 0.05 $ 0.05 $ 0.05 $ 0.05
Note 18: Subsequent Event
On January 30, 2007, our Board of Directors declared a quarterly cash dividend of $0.07 per common share, payable March 5, 2007, to shareholders of record on February 12, 2007.
On January 30, 2007, our Board of Directors granted authorization for the repurchase of an additional 1,522,106 shares of our common stock under our share repurchase plan.
SCHEDULE II
NATIONAL INSTRUMENTS CORPORATION
VALUATION AND QUALIFYING ACCOUNTS
(In thousands)
Allowance for doubtful accounts and sales returns:
Year
Description
Balance at Beginning of Period
Provision for Bad Debt Expense
Write-Offs Charged to Allowances
Balance at End of Period
2004 Allowance for doubtful accounts and sales returns $ 3,244 $ 596 $ 329 $ 3,511 2005 Allowance for doubtful accounts and sales returns 3,511 1,462 239 4,734 2006 Allowance for doubtful accounts and sales returns 4,734 33 407 4,360
2007.
base
satisfaction
technology
that we target. Starting in August 2009, the PMI has had readings above 50 which are indicative of expansion in the industrial global economy. However, we believe there is still a substantial amount of uncertainty about the global industrial economic conditions. We are unable to predict whether the current expansion cycle, as measured by the PMI, will be sustained throughout 2010. This continuing uncertainty in the global industrial economy is likely to continue to have an adverse effect on the spending patterns of businesses including our current and potential customers which could adversely affect our revenues and therefore harm our business and result of operations.
long-lived assets).
| Years Ended December 31, | ||||||||||||||
|---|---|---|---|---|---|---|---|---|---|---|---|---|---|---|
| 2006 | 2005 | 2004 | ||||||||||||
| Net sales: | ||||||||||||||
| Americas | 48.1 | % | 48.2 | % | 47.4 | % | ||||||||
| Europe | 29.3 | 30.0 | 32.1 | |||||||||||
| Asia Pacific | 22.6 | 21.8 | 20.5 | |||||||||||
| Consolidated net sales | 100.0 | 100.0 | 100.0 | |||||||||||
| Cost of sales | 25.8 | 26.1 | 26.4 | |||||||||||
| Gross profit | 74.2 | 73.9 | 73.6 | |||||||||||
| Operating expenses: | ||||||||||||||
| Sales and marketing | 35.6 | 36.9 | 36.7 | |||||||||||
| Research and development | 17.1 | 15.4 | 16.4 | |||||||||||
| General and administrative | 8.2 | 7.9 | 8.3 | |||||||||||
| Total operating expenses | 60.9 | 60.2 | 61.4 | |||||||||||
| Operating income | 13.3 | 13.7 | 12.2 | |||||||||||
| Other income (expense): | ||||||||||||||
| Interest income | 1.0 | 0.7 | 0.5 | |||||||||||
| Net foreign exchange gain (loss) | 0.1 | (0.3 | ) | 0.3 | ||||||||||
| Other income (expense), net | — | — | (0.4 | ) | ||||||||||
| Income before income taxes | 14.4 | 14.1 | 12.6 | |||||||||||
| Provision for income taxes | 3.4 | 3.3 | 3.1 | |||||||||||
| Net income | 11.0 | % | 10.8 | % | 9.5 | % | ||||||||
Income:
| Years Ended December 31, | ||||||||||||
| 2009 | 2008 | 2007 | ||||||||||
| Net sales: | ||||||||||||
| Americas | 43.3 | % | 43.4 | % | 44.8 | % | ||||||
| Europe | 31.1 | 32.6 | 31.2 | |||||||||
| Asia Pacific | 25.6 | �� | 24.0 | 24.0 | ||||||||
| Consolidated net sales | 100.0 | 100.0 | 100.0 | |||||||||
| Cost of sales | 25.1 | 25.2 | 25.0 | |||||||||
| Gross profit | 74.9 | 74.8 | 75.0 | |||||||||
| Operating expenses: | ||||||||||||
| Sales and marketing | 39.8 | 37.5 | 35.7 | |||||||||
| Research and development | 19.6 | 17.4 | 17.1 | |||||||||
| General and administrative | 8.6 | 8.2 | 8.4 | |||||||||
| Total operating expenses | 68.0 | 63.1 | 61.2 | |||||||||
| Operating income | 6.9 | 11.7 | 13.8 | |||||||||
| Other income (expense): | ||||||||||||
| Interest income | 0.2 | 0.7 | 1.3 | |||||||||
| Net foreign exchange gain (loss) | 0.1 | (0.5 | ) | 0.2 | ||||||||
| Other income (expense), net | 0.2 | — | — | |||||||||
| Income before income taxes | 7.4 | 11.9 | 15.3 | |||||||||
| Provision for income taxes | 4.9 | 1.6 | 0.8 | |||||||||
| Net income | 2.5 | % | 10.3 | % | 14.5 | % | ||||||
2% compared to 2007.
We also utilize The gain or loss on these derivatives as well as the offsetting gain or loss on the hedge item attributable to the hedged risk is recognized in current earnings under the line item “net foreign exchange gain (loss)”. Our hedging strategy reduced our foreign exchange gains by $1.7 million in 2009, reduced our foreign exchange losses by $1.2 million in 2008 and reduced our foreign exchange gains by $1.1 million in 2007.
positions).
Provision for Income Taxes.Our provision for income taxes reflectsreflected an effective tax rate of 24%66%, 14% and 6% for the years ended December 31, 2009, 2008 and 2007, respectively. The increase in 2006 and 2005 and 25% in 2004. Ourour effective tax rate is lower thanin 2009 compared to 2008 was driven by changes in our valuation allowances, tax charges related to inter-company profits and an increase in equity compensation expense as a percentage of pre-tax book income. (See Note 9 – Income taxes of Notes to Consolidated Financial Statements for further discussion regarding changes in our effective tax rate and a reconciliation of income taxes at the U.S. federal statutory income tax rate of 35% primarily as a result of the extraterritorial income exclusion, tax-exempt interest and reducedto our effective tax rates in certain foreign jurisdictions. The decreases in our tax rate in 2006 and 2005 from 2004 are due to increased profits in foreign jurisdictions with reduced income tax rates.rate).
We currently finance The following table presents our working capital, cash and cash equivalents and marketable securities (in thousands):
December 31, 2009 | December 31, 2008 | Increase/ (Decrease) | ||||||||||
| Working capital | $ | 413,759 | $ | 398,292 | $ | 15,467 | ||||||
Cash and cash equivalents (1) | 201,465 | 229,400 | (27,935 | ) | ||||||||
Short-term investments (1) | 87,196 | 6,220 | 80,976 | |||||||||
| Long-term investments | — | 10,500 | (10,500 | ) | ||||||||
| Total cash, cash equivalents, short and long-term investments | $ | 288,661 | $ | 246,120 | $ | 42,541 | ||||||
| December 31, | ||||||||
| 2009 | 2008 | |||||||
| Cash provided by operating activities | $ | 135,651 | $ | 121,818 | ||||
| Cash (used in)/provided by investing activities | (111,915 | ) | 18,756 | |||||
| Cash (used in) financing activities | (51,671 | ) | (106,013 | ) | ||||
| Net (decrease)/increase in cash equivalents | (27,935 | ) | 34,561 | |||||
| Cash and cash equivalents at beginning of year | 229,400 | 194,839 | ||||||
| Cash and cash equivalents at end of year | $ | 201,465 | $ | 229,400 | ||||
decrease in prepaid expenses and other assets, offset by a decrease of $10 million in accounts payable, taxes and other liabilities. In 2008, cash provided by operating activities was primarily the result of $84.8 million in net income and $51.3 million in net non-cash operating expenses which primarily consisted of depreciation and amortization, stock-based compensation, and benefits from deferred income taxes, offset in part by $14.3 million in net cash used by changes in operating assets and liabilities, principally a $24.6 million increase in inventory.
Cash provided by the issuance of our common stock totaled $37.1from the exercise of stock options and sales of our common stock through our employee stock purchase plan. For 2008, financing activities used $106 million $23.2which was the result of $104 million used to repurchase our common stock and $16.8$35 million used to pay dividends to our shareholders, offset by $31 million received as a result of the issuance of our common stock from the exercise of stock options and our employee stock purchase plan.
Obligations.
The following summarizes our contractual cash obligations as of December 31,| Payments Due by Period | |||||||||||||||||||||||
|---|---|---|---|---|---|---|---|---|---|---|---|---|---|---|---|---|---|---|---|---|---|---|---|
| Total | 2007 | 2008 | 2009 | 2010 | 2011 | Beyond | |||||||||||||||||
| Long-term debt | $ | — | $ | — | $ | — | $ | — | $ | — | $ | — | $ | — | |||||||||
| Capital lease obligations | — | — | — | — | — | — | — | ||||||||||||||||
| Operating leases | 23,691 | 7,241 | 5,682 | 4,883 | 3,103 | 1,983 | 799 | ||||||||||||||||
| Other long-term obligations | — | — | — | — | — | — | — | ||||||||||||||||
| Total contractual cash obligations | $ | 23,691 | $ | 7,241 | $ | 5,682 | $ | 4,883 | $ | 3,103 | $ | 1,983 | $ | 799 | |||||||||
| Payments Due by Period | ||||||||||||||||||||||||||||
| Total | 2010 | 2011 | 2012 | 2013 | 2014 | Beyond | ||||||||||||||||||||||
| Long-term debt | $ | — | $ | — | $ | — | $ | — | $ | — | $ | — | $ | — | ||||||||||||||
| Capital lease obligations | — | — | — | — | — | ��� | — | |||||||||||||||||||||
| Operating leases | 51,701 | 14,415 | 9,898 | 6,982 | 4,611 | 3,665 | 12,130 | |||||||||||||||||||||
| Total contractual cash obligations | $ | 51,701 | $ | 14,415 | $ | 9,898 | $ | 6,982 | $ | 4,611 | $ | 3,665 | $ | 12,130 | ||||||||||||||
| Total | 2007 | 2008 | 2009 | 2010 | 2011 | Beyond | |||||||||||||||||
|---|---|---|---|---|---|---|---|---|---|---|---|---|---|---|---|---|---|---|---|---|---|---|---|
| Guarantees | $ | 3,500 | $ | 3,500 | $ | — | $ | — | $ | — | $ | — | $ | — | |||||||||
| Purchase obligations | 7,004 | 7,004 | — | — | — | — | — | ||||||||||||||||
| Total commercial commitments | $ | 10,504 | $ | 10,504 | $ | — | $ | — | $ | — | $ | — | $ | — | |||||||||
| Total | 2010 | 2011 | 2012 | 2013 | 2014 | Beyond | ||||||||||||||||||||||
| Guarantees | $ | 5,200 | $ | 5,200 | $ | — | $ | — | $ | — | $ | — | $ | — | ||||||||||||||
| Purchase obligations | 6,500 | 6,500 | — | — | — | — | — | |||||||||||||||||||||
| Total commercial commitments | $ | 11,700 | $ | 11,700 | $ | — | $ | — | $ | — | $ | — | $ | — | ||||||||||||||
Financial Risk Management
Our international sales are subject to inherent risks, including fluctuations in local economies; difficulties in staffing and managing foreign operations; greater difficulty in accounts receivable collection; costs and risks of localizing products for foreign countries; unexpected changes in regulatory requirements, tariffs and other trade barriers; difficulties in the repatriation of earnings and burdens of complying with a wide variety of foreign laws. The vast majority of our sales outside of North America are denominated in local currencies, and accordingly, we are subject to the risks associated with fluctuations in currency rates. In particular, increases in the value of the dollar against foreign currencies decrease the U.S. dollar value of foreign sales requiring that we either increase our price in the local currency, which could render our product prices noncompetitive, or suffer reduced revenues and gross margins as measured in U.S. dollars. These dynamics have adversely affected our revenue growth in international markets in previous years. Our foreign currency hedging program includes both foreign currency forward and purchased option contracts to reduce the effect of exchange rate fluctuations. However, our hedging program will not eliminate all of our foreign exchange risks. (See “Net Foreign Exchange Gain (Loss)” and Note 11 of Notes to Consolidated Financial Statements.)
The marketplace for our products dictates that many of our products be shipped very quickly after an order is received. As a result, we are required to maintain significant inventories. Therefore, inventory obsolescence is a risk for us due to frequent engineering changes, shifting customer demand, the emergence of new industry standards and rapid technological advances including the introduction by us or our competitors of products embodying new technology. While we adjust for excess and obsolete inventories and we monitor the valuation of our inventories, there can be no assurance that our valuation adjustments will be sufficient.
Off-Balance Sheet Arrangements
We have no debt or off-balance sheet debt. As of December 31, 2006,2009, we have non-cancelable operating lease obligations of approximately $23.7$52 million compared to $50 million at December 31, 2008. Rent expense under operating leases was $12 million, $12 million and contractual$10 million for the years ended December 31, 2009, 2008 and 2007, respectively.
We are exposedbelieve that our existing cash, cash equivalents and marketable securities, together with cash generated from operations and from the exercise of employee stock options and the purchase of common stock through our employee stock purchase plan, will be sufficient to a varietycover our working capital needs, capital expenditures, investment requirements, commitments, payment of risks, including foreign currency fluctuationsdividends to our shareholders and changes in the market valuerepurchases of our investments. Incommon stock for at least the normal coursenext 12 months. However, we may choose or be required to raise additional funds by selling equity or debt securities to the public or to selected investors, or by borrowing money from financial institutions. Historically, we have not had to rely on debt, public or private, to fund our operating, financing or investing activities. We could also choose or be required to reduce certain expenditures, such as payments of business, we employ established policies and procedures to manage our exposure to fluctuations in foreign currency values and changes in the market valuedividends or repurchases of our investments.
Foreign Currency Hedging Activities. Our objective in managing our exposurecommon stock. In addition, even though we may not need additional funds, we may still elect to foreign currency exchange rate fluctuations issell additional equity or debt securities or obtain credit facilities for other reasons. If we elect to reduceraise additional funds, we may not be able to obtain such funds on a timely basis on acceptable terms, if at all. If we raise additional funds by issuing additional equity or convertible debt securities, the impactownership percentages of adverse fluctuations in such exchange rates on our earnings and cash flow. Accordingly,existing shareholders would be reduced. In addition, the equity or debt securities that we utilize purchased foreign currency option contracts and forward contractsissue may have rights, preferences or privileges senior to hedge our exposure on anticipated transactions and firm commitments. The principal currencies hedged are the euro, British pound and Japanese yen. We monitor our foreign exchange exposures regularly to ensure the overall effectivenessthose of our foreign currency hedge positions. However, there can be no assurance that our foreign currency hedging activities will substantially offset the impact of fluctuations in currency exchange rates on our results of operations and financial position. Based on the foreign exchange instruments outstanding at December 31, 2006 and 2005, an adverse change (defined as 20% in the Asian currencies and 10% in all other currencies) in exchange rates would result in a decline in the aggregate fair market value of all of our instruments outstanding of approximately $6.6 million and $4.2 million, respectively. However, as we utilize foreign currency instruments for hedging anticipated and firmly committed transactions,common stock.
Short-term Investments. The fair value of our investments in marketable securities at December 31, 2006 and 2005 was $150.2 million and $119.8 million, respectively. Investments with maturities beyond one year are classified as short-term basedfuture will depend on their highly liquid nature and because such marketable securities represent the investment of cash that is available for current operations. Our investment policy is to manage our investment portfolio to preserve principal and liquidity while maximizing the return on our investment portfolio through the full investment of available funds. We diversify our marketable securities portfolio by investing in multiple types of investment-grade securities. Our investment portfolio is primarily invested in securities with at least an investment grade rating to minimize interest rate and credit risk as well as to provide for an immediate source of funds. Based on our investment portfolio and interest rates at December 31, 2006 and 2005, a 100 basis point increase or decrease in interest rates would result in a decrease or increase of approximately $750,000 and $600,000, respectively, in the fair value of our investment portfolio. Although changes in interest rates may affect the fair value of our investment portfolio and cause unrealized gains or losses, such gains or losses would not be realized unless the investments are sold.
many factors, including:
| · | general economic and political conditions and specific conditions in the markets we address, including the continuing volatility in the industrial economy, current general economic volatility and trends in the industrial economy in various geographic regions in which we do business; |
| · | the inability of certain of our customers who depend on credit to have access to their traditional sources of credit to finance the purchase of products from us, particularly in the current global economic environment, which may lead them to reduce their level of purchases or to seek credit or other accommodations from us; |
| · | the overall levels of sales of our products and gross profit margins; |
| · | our business, product, capital expenditure and research and development plans, and product and technology roadmaps; |
| · | repurchases of our common stock; |
| · | required levels of research and development and other operating costs; |
| · | litigation expenses, settlements and judgments; |
| · | the levels of inventory and accounts receivable that we maintain; |
| · | acquisitions of other businesses, assets, products or technologies; |
| · | capital improvements for new and existing facilities; |
| · | our relationships with suppliers and customers; and, |
| · | the level of exercises of stock options and stock purchases under our employee stock purchase plan. |
|
| · | Revenue |
| · |
| · |
|
| · |
|
| · |
|
| · |
| · |
|
| · |
|
ITEM 8. FINANCIAL STATEMENTS AND SUPPLEMENTARY DATA
The information required by this item is incorporated by reference to the Consolidated Financial Statements set forth on pages F-1 through F-27 and S-1F-31 hereof.
ITEM 9. CHANGES IN AND DISAGREEMENTS WITH ACCOUNTANTS ON ACCOUNTING AND FINANCIAL DISCLOSURE
There were no disagreements with accountants on accounting and financial disclosure for the year ended December 31, 2006.2009.
ITEM 9A. CONTROLS AND PROCEDURES
Evaluation of Disclosure Controls and Procedures
As of the end of the period covered by this Annual Report on Form 10-K, as required by paragraph (b) of Rule 13a-15 or Rule 15d-15 under the Securities Exchange Act of 1934, as amended, we evaluated under the supervision of our Chief Executive Officer, Dr. James Truchard, and our Chief Financial Officer, the effectivenessAlex Davern, based on their evaluation of our disclosure controls and procedures (as defined in Rules 13a-15(e) orand 15d-15(e) of the Securities Exchange Act of 1934, as amended). Based on this evaluation, our Chief Executive Officer and our Chief Financial Officer, required by paragraph (b) of Rule 13a – 15 or Rule 15d – 15, have concluded that our disclosure controls and procedures arewere effective at the reasonable assurance level, to ensure the timely collection, evaluation and disclosure of information relating to us that information we are requiredwould potentially be subject to disclose in reports that we file or submitdisclosure under the Securities Exchange Act of 1934, (i)as amended, and the rules and regulations promulgated there under, and that such information is recorded, processed, summarized and reported within the time periods specified in Securities and Exchange Commissionthe SEC’s rules and forms,forms. These disclosure controls and (ii)procedures include, without limitation, controls and procedures designed to ensure that information required to be disclosed by us in the reports we file or submit is accumulated and communicated to our management, including our Chief Executive Officer and our Chief Financial Officer, as appropriate to allow timely decisions regarding required disclosure. Our disclosure controls and procedures are designed to provide reasonable assurance that such information is accumulated and communicated to our management. Our disclosure controls and procedures include components of our internal control over financial reporting. Management’s assessment of the effectiveness of our internal controlcontrols over financial reporting is expressed at the level of reasonable assurance because a control system, no matter how well designed and operated, can provide only reasonable, but not absolute assurance that the control system’s objectives will be met. We continue to enhance our internal control over financial reporting in key functional areas with the goal of monitoring our operations at the level of documentation, segregation of duties, and systems security necessary, as well as transactional control procedures required under Auditing Standard No. 5 issued by the Public Company Accounting Oversight Board. We discuss and disclose these matters to the audit committee of our board of directors and to our auditors.
Management Report on Internal Control over Financial Reporting
Our management is responsible for establishing and maintaining adequate internal control over financial reporting to provide reasonable assurance regarding the reliability of our financial reporting and the preparation of financial statements for external purposes in accordance with generally accepted accounting principles. Internal control over financial reporting includes those policies and procedures that (i) pertain to the maintenance of records that in reasonable detail accurately and fairly reflect the transactions and dispositions of the assets of the company, (ii) provide reasonable assurance that transactions are recorded as necessary to permit preparation of financial statements in accordance with generally accepted accounting principles, and that receipts and expenditures of the Company are being made only in accordance with authorizations of management and directors of the Company; and (iii) provide reasonable assurance regarding prevention or timely detection of unauthorized acquisition, use or disposition of the Company’s assets that could have a material effect on the financial statements.
Management assessed our internal control over financial reporting as of December 31, 2006,2009, which was the end of our fiscal year. Management based its assessment on criteria established in Internal Control – Integrated Framework issued by the Committee of Sponsoring Organizations of the Treadway Commission. Management’s assessment included evaluation of such elements as the design and operating effectiveness of key financial reporting controls, process documentation, accounting policies, and our overall control environment. This assessment is supported by testing and monitoring performed by our finance organization.
Based on our assessment, management has concluded that our internal control over financial reporting was effective as of the end of the fiscal year to provide reasonable assurance regarding the reliability of financial reporting and the preparation of financial statements for external reporting purposes in accordance with generally accepted accounting principles. We reviewed the results of management’s assessment with the Audit Committee of our Board of Directors.
Our independent registered public accounting firm, Ernst & Young LLP, who also audited our consolidated financial statements, audited management’s assessment and independently assessed the effectiveness of our internal control over financial reporting. Ernst & Young LLP has issued their attestation report, which is included in Part II, Item 8 of this Form 10-K.
Changes in Internal Control over Financial Reporting
During the three months ended December 31, 2006,2009, there was no change in our internal control over financial reporting identified in connection with the evaluation required by paragraph (d) of Rule 13a-15 or Rule 15d-15 that has materially affected, or is reasonably likely to materially affect, our internal control over financial reporting.
ITEM 9B. OTHER INFORMATION
None.
PART III
Certain information required by Part III is omitted from this Report in that we intend to file a definitive proxy statement pursuant to Regulation 14A with the Securities and Exchange Commission (the “Proxy Statement”) relating to our annual meeting of stockholders not later than 120 days after the end of the fiscal year covered by this Report, and such information is incorporated by reference herein.
ITEM 10. DIRECTORS, EXECUTIVE OFFICERS AND CORPORATE GOVERNANCE
The information concerning our directors required by this Item pursuant to Item 401 of Regulation S-K will appear in our Proxy Statement under the section “Election of Directors” and such information is incorporated herein by reference.
The information concerning our executive officers required by this Item pursuant to Item 401 of Regulation S-K will appear in our Proxy Statement under the section “Executive Officers” and such information is incorporated herein by reference.
The information required by this Item pursuant to Item 405 of Regulation S-K regarding compliance with Section 16(a) of the Securities Exchange Act of 1934, as amended, will appear in our Proxy Statement under the section “Section 16(a) Beneficial Ownership Reporting Compliance” and such information is incorporated herein by reference.
The information concerning our code of ethics that applies to our principal executive officer, our principal financial officer, our controller or person performing similar functions required by this Item pursuant to Item 406 of Regulation S-K will appear in our Proxy Statement under the section “Code of Ethics” and such information is incorporated herein by reference.
The information required by this Item pursuant to Item 407(c)(3) of Regulation S-K regarding material changes, if any, to procedures by which security holders may recommend nominees to our board of directors will appear in our Proxy Statement under the section “Deadline for Receipt of Stockholder Proposals” and such information is incorporated herein by reference.
The information required by this Item pursuant to Item 407(d)(4) and Item 407(d)(5) of Regulation S-K regarding our Audit Committee and our audit committee financial expert(s), respectively, will appear in our Proxy Statement under the heading “Corporate Governance” and such information is incorporated herein by reference.
ITEM 11. EXECUTIVE COMPENSATION
The information required by this Item pursuant to Item 402 of Regulation S-K regarding director compensation will appear in our Proxy Statement under the section “Board Compensation” and such information is incorporated herein by reference.
The information required by this Item pursuant to Item 402 of Regulation S-K regarding executive officer compensation, including our Compensation Discussion & Analysis, will appear in our Proxy Statement under the section “Executive Compensation” and such information is incorporated herein by reference.
The information required by this Item pursuant to Item 407(e)(4) of Regulation S-K will appear in our Proxy Statement under the section “Compensation Committee Interlocks and Insider Participation” and such information is incorporated herein by reference.
The information required by this Item pursuant to Item 407(e)(5) will appear in our Proxy Statement under the section “Compensation Committee Report” and such information is incorporated herein by reference.
ITEM 12. SECURITY OWNERSHIP OF CERTAIN BENEFICIAL OWNERS AND MANAGEMENT AND RELATED STOCKHOLDER MATTERS
From time to time our directors, executive officers and other insiders may adopt stock trading plans pursuant to Rule 10b5-1(c) promulgated by the Securities and Exchange Commission under the Securities Exchange Act of 1934, as amended. Jeffrey L. Kodosky and James J. Truchard have made periodic sales of our stock pursuant to such plans.
The information required by this Item pursuant to Item 403 of Regulation S-K concerning security ownership of certain beneficial owners and management will appear in our Proxy Statement under the section “Security Ownership” and such information is incorporated herein by reference.
The information required by this Item pursuant to Item 201(d) of Regulation S-K concerning securities authorized for issuance under equity compensation plans will appear in our Proxy Statement under the section “Equity Compensation Plans Information” and such information is incorporated herein by reference.
ITEM 13. CERTAIN RELATIONSHIPS AND RELATED TRANSACTIONS AND DIRECTOR INDEPENDENCE During 2002, we irrevocably contributed approximately $3.6 million to the National Instruments Foundation, a 501(c)(3) charitable foundation established in 2002 for the purpose of continued promotion of scientific and engineering research and education at higher education institutions worldwide. Two of the four directors of the National Instruments Foundation are current officers of National Instruments.
In addition, the information required by this Item pursuant to Item 404 of Regulation S-K will appear in our Proxy Statement under the section “Certain Relationships and Related Transactions” and such information is incorporated herein by reference.
The information required by this Item pursuant to Item 407(a) of Regulation S-K regarding the independence of our directors will appear in our Proxy Statement under the section “Corporate Governance” and such information is incorporated herein by reference.
ITEM 14. PRINCIPAL ACCOUNTING FEES AND SERVICES
The information concerning principal accountant fees and services required by this Item is incorporated by reference to our Proxy Statement under the heading “Independent Public Accountants.”
The information concerning pre-approval policies for audit and non-audit services required by this Item is incorporated by reference to our Proxy Statement under the heading “Audit Committee Pre-Approval of Audit and Permissible Non-Audit Services of Independent Auditors.”
PART IV
ITEM 15. EXHIBITS AND FINANCIAL STATEMENT SCHEDULES
(a) Documents FilesFiled with Report
1. Financial Statements.
2. Financial Statement Schedules.
None
3. Exhibits.
ExhibitNumber Description 3.1(2) Certificate of Incorporation, as amended, of the Company. 3.2(11) Amended and Restated Bylaws of the Company. 3.3(4) Certificate of Designation of Rights, Preferences and Privileges of Series A Participating Preferred Stock of the Company. 4.1(1) Specimen of Common Stock certificate of the Company. 4.2(3) Rights Agreement dated as of January 21, 2004, between the Company and EquiServe Trust Company, N.A. 10.1(1) Form of Indemnification Agreement. 10.2(5) 1994 Incentive Plan, as amended.* 10.3(9) 1994 Employee Stock Purchase Plan.* 10.5(7) 2005 Incentive Plan.* 10.6(8) National Instruments Corporation Annual Incentive Program.* 10.7(6) National Instruments Corporation Annual Incentive Program, as amended.* 10.8(10) Form of Restricted Stock Unit Award Agreement (Non-Employee Director).* 10.9(10) Form of Restricted Stock Unit Award Agreement (Performance Vesting).* 10.10(10) Form of Restricted Stock Unit Award Agreement (Current Employee).* 10.11(10) Form of Restricted Stock Unit Award Agreement (Newly Hired Employee).* 21.1 Subsidiaries of the Company. 23.1 Consent of Independent Registered Public Accounting Firm F-4Firm.Consolidated Balance SheetsF-5Consolidated Statements of IncomeF-6Consolidated Statements of Cash FlowsF-7Consolidated Statements of Stockholders' EquityF-8Notes to Consolidated Financial StatementsF-9
2.
Financial Statements Schedules.
See Schedule II - Valuation and Qualifying Accounts at page S-1
3.
Exhibits.
Exhibit
NumberDescription
3.1
(2)
Certificate of Incorporation, as amended, of the Company.
3.2
(2)
Amended and Restated Bylaws of the Company.
3.3
(4)
Certificate of Designation of Rights, Preferences and Privileges of Series A Participating Preferred Stock of the Company.
4.1
(1)
Specimen of Common Stock certificate of the Company.
4.2
(3)
Rights Agreement dated as of January 21, 2004, between the Company and EquiServe Trust Company, N.A.
10.1
(1)
Form of Indemnification Agreement.
10.2
(5)
1994 Incentive Plan, as amended.*
10.3
1994 Employee Stock Purchase Plan.*
10.4
(6)
Long-Term Incentive Program.*
10.5
(7)
2005 Incentive Plan.*
10.6
(8)
National Instruments Corporation Annual Incentive Program.*
10.7
(9)
2006 Annual Incentive Program Goals and Awards for the Named Executive Officers.*
10.8
(10)
Form of Restricted Stock Unit Award Agreement (Non-Employee Director).*
10.9
(10)
Form of Restricted Stock Unit Award Agreement (Performance Vesting).*
10.10
(10)
Form of Restricted Stock Unit Award Agreement (Current Employee).*
10.11
(10)
Form of Restricted Stock Unit Award Agreement (Newly Hired Employee).*
21.1
Subsidiaries of the Company.
23.1
Consent of Independent Registered Public Accounting Firm.
23.2
Consent of Independent Registered Public Accounting Firm.
24.0
Power of Attorney (included on page 33).
31.1
Certification of Chief Executive Officer Pursuant to 18 U.S.C. Section 1350, as Adopted Pursuant to Section 302 of the Sarbanes-Oxley Act of 2002.
31.2
Certification of Chief Financial Officer Pursuant to 18 U.S.C. Section 1350, as Adopted Pursuant to Section 302 of the Sarbanes-Oxley Act of 2002.
32.1
Certification of Chief Executive Officer and Chief Financial Officer Pursuant to 18 U.S.C. Section 1350, as Adopted Pursuant to Section 906 of the Sarbanes-Oxley Act of 2002.
24.0 Power of Attorney (included on page 41). 31.1 Certification of Chief Executive Officer Pursuant to 18 U.S.C. Section 1350, as Adopted Pursuant to Section 302 of the Sarbanes-Oxley Act of 2002. 31.2 Certification of Chief Financial Officer Pursuant to 18 U.S.C. Section 1350, as Adopted Pursuant to Section 302 of the Sarbanes-Oxley Act of 2002. 32.1 Certification of Chief Executive Officer and Chief Financial Officer Pursuant to 18 U.S.C. Section 1350, as Adopted Pursuant to Section 906 of the Sarbanes-Oxley Act of 2002.
(1) Incorporated by reference to the Company's Registration Statement on Form S-1 (Reg. No. 33-88386) declared effective March 13, 1995.
(2) Incorporated by reference to the same-numbered exhibit filed with the Company's Annual Report on Form 10-K for the fiscal year ended December 31, 2003.
(3) Incorporated by reference to exhibit 4.1 filed with the Company's currentCurrent Report on Form 8-K filed on January 28, 2004.
(4) Incorporated by reference to the same-numbered exhibit filed with the Company's Form 8-K on April 27, 2004.
(5) Incorporated by reference to the same-numbered exhibit filed with the Company's Form 10-Q on August 5, 2004.
(6) Incorporated by reference to exhibit 99.2 filed with the Company's Current Report on Form 8-K filed on October 28, 2008. (7) Incorporated by reference to exhibit A of the Company's Proxy Statement dated and filed on April 4, 2005. (8) Incorporated by reference to exhibit 99.2 filed with the Company's Current Report on Form 8-K filed on October 22, 2008. (9) Incorporated by reference to exhibit 10.3 filed with the Company's Annual Report on Form 10-K for the fiscal year ended December 31, 2006. (10) Incorporated by reference to the same-numbered exhibit filed with the Company's Form 10-Q on August 2, 2006. (11) Incorporated by reference to the same-numbered exhibit filed with the Company's Annual Report on Form 10-K for the fiscal year ended December 31, 2004.2007.
(7)Incorporated by reference to exhibit A of the Company's Proxy Statement dated and filed on April 4, 2005.
(8)Incorporated by reference to the exhibit 10.1 filed with the Company's Current Report on Form 8-K filed June 27, 2006.
(9)Incorporated by reference to the exhibit 10.2 filed with the Company's Current Report on Form 8-K filed June 27, 2006.
(10)Incorporated by reference to the same-numbered exhibit filed with the Company's Form 10-Q filed on August 2, 2006.
* Management Contract or Compensatory Plan or Arrangement.
(b) Exhibits
See Item 15(a)(3) above.
(c) Financial Statement Schedules
See Item 15(a)(2) above.
SIGNATURES
Pursuant to the requirements of Section 13 or 15(d) of the Securities Exchange Act of 1934, the registrant has duly caused this report to be signed on its behalf by the undersigned thereunto duly authorized.Registrant Registrant
NATIONAL INSTRUMENTS CORPORATION
February 20, 200717, 2010
BY: By:
/s/ Dr. James J. TruchardDr. James J. Truchard
Chairman of the Board and President
POWER OF ATTORNEY
KNOW ALL PERSONS BY THESE PRESENTS, that each person whose signature appears below constitutes and appoints Dr. James J. Truchard and Alexander M. Davern, jointly and severally, his or her attorneys-in-fact, each with the power of substitution, for him or her in any and all capacities, to sign any amendments to this Report on Form 10-K, and to file the same, with exhibits thereto and other documents in connection therewith, with the Securities and Exchange Commission, hereby ratifying and conformingconfirming all that each of said attorneys-in-fact, or his substitute or substitutes, may do or cause to be done by virtue hereof.
Pursuant to the requirements of the Securities Exchange Act of 1934, this report has been signed below by the following persons on behalf of the registrant and in the capacities and on the dates indicated.Signature
Capacity in Which Signed
Date
/s/ Dr. James J. Truchard
Chairman of the Board and President(Principal Executive Officer) February 17, 2010 Dr. James J. Truchard
Chairman of the Board and
President (Principal Executive Officer)
February 20, 2007
/s/ Alex M. Davern
Chief Financial Officer and Treasurer(Principal Financial and Accounting Officer) February 17, 2010 Alex M. Davern
Chief Financial Officer
and Treasurer (Principal Financial
and Accounting Officer)
February 20, 2007
/s/ Jeffrey L. Kodosky
Director February 17, 2010 Jeffrey L. Kodosky
Director
February 16, 2007
/s/ Dr. Donald M. Carlton
Director February 17, 2010 Dr. Donald M. Carlton
Director
February 16, 2007
/s/ Dr. Ben G. Streetman
Dr. Ben G. Streetman
Director
February 16, 2007
/s/ R. Gary Daniels
R. Gary Daniels
Director
February 16, 2007
/s/ Charles J. Roesslein
Director February 17, 2010 Charles J. Roesslein
Director
February 16, 2007
/s/ Duy-Loan T. Le
Director February 17, 2010 Duy-Loan T. Le
/s/ John Medica Director
February 16, 200717, 2010 John Medica
NATIONAL INSTRUMENTS CORPORATION
INDEX TO FINANCIAL STATEMENTS
Page No. Financial Statements: Page No.Report of Independent Registered Public Accounting FirmF-2Report of Independent Registered Public Accounting Firm on Internal Control over Financial Reporting F-3F-2 Report of Independent Registered Public Accounting Firm F-4F-3 Consolidated Balance Sheets as of December 31, 20062009 and 20052008 F-5F-4 Consolidated Statements of Income for each of the Three Years in the period Ended December 31, 20062009 F-6F-5 Consolidated Statements of Cash Flows for each of the Three Years in the period Ended December 31, 20062009 F-7F-6 Consolidated Statements of Stockholders' Equity for each of the Three Years in the period Ended December 31, 20062009 F-8F-7 Notes to Consolidated Financial Statements F-9F-8
Financial Statement Schedules:For each of the Three Years in the period Ended December 31, 2006 Schedule II--Valuation and Qualifying AccountsS-1
All other schedules are omitted because they are not applicable.
The Board of Directors and Shareholders of National Instruments Corporation:
We have audited the accompanying consolidated balance sheets of National Instruments Corporation and subsidiaries as of December 31, 20062009 and 20052008, and the related consolidated statements of income, stockholders’stockholders' equity, and cash flows for each of the twothree fiscal years in the period ended December 31, 2006. Our audits also included the financial statement schedule listed in the Index at Item 15.2009. These financial statements and schedule are the responsibility of the Company’sCompany's management. Our responsibility is to express an opinion on these financial statements and schedule based on our audits.
We conducted our audits in accordance with the standards of the Public Company Accounting Oversight Board (United States). Those standards require that we plan and perform the audit to obtain reasonable assurance about whether the financial statements are free of material misstatement. An audit includes examining, on a test basis, evidence supporting the amounts and disclosures in the financial statements. An audit also includes assessing the accounting principles used and significant estimates made by management, as well as evaluating the overall financial statement presentation. We believe that our audits provide a reasonable basis for our opinion.
In our opinion, the financial statements referred to above present fairly, in all material respects, the consolidated financial position of National Instruments Corporation and subsidiaries at December 31, 20062009 and 20052008, and the consolidated results of their operations and their cash flows for each of the twothree fiscal years in the period ended December 31, 2006,2009, in conformity with U.S. generally accepted accounting principles. Also, in our opinion, the related financial statement schedule, when considered in relation to the basic financial statements taken as a whole, presents fairly in all material respects the information set forth therein.As discussed in Note 1 to the consolidated financial statements, effective January 1, 2006, the Company changed its method of accounting for stock-based compensation to conform to Statement of Financial Accounting Standards No. 123(R), Share-Based Payment.
We also have audited, in accordance with the standards of the Public Company Accounting Oversight Board (United States), the effectiveness of National Instruments Corporation’sCorporation internal control over financial reporting as of December 31, 2006,2009, based on criteria established in Internal Control-Integrated Framework issued by the Committee of Sponsoring Organizations of the Treadway Commission and our report dated February 15, 200717, 2010 expressed an unqualified opinion thereon./s/ Ernst & Young LLP
Austin, Texas
February 15, 2007
/s/ Ernst & Young LLP
Austin, TexasFebruary 17, 2010
Report of Independent Registered Public Accounting Firm on Internal Control over Financial Reporting
The Board of Directors and Shareholders of National Instruments Corporation:
We have audited management’s assessment, included in the Management’s Report on Internal Control over Financial Reporting, that National Instruments Corporation maintained effectiveCorporation’s internal control over financial reporting as of December 31, 2006,2009, based on criteria established in Internal Control—Integrated Framework issued by the Committee of Sponsoring Organizations of the Treadway Commission (the COSO criteria). National Instruments Corporation’s management is responsible for maintaining effective internal control over financial reporting, and for its assessment of the effectiveness of internal control over financial reporting.reporting included in the accompanying Management Report on Internal Control over Financial Reporting. Our responsibility is to express an opinion on management’s assessment and an opinion on the effectiveness of the company’s internal control over financial reporting based on our audit.
We conducted our audit in accordance with the standards of the Public Company Accounting Oversight Board (United States). Those standards require that we plan and perform the audit to obtain reasonable assurance about whether effective internal control over financial reporting was maintained in all material respects. Our audit included obtaining an understanding of internal control over financial reporting, evaluating management’s assessment,assessing the risk that a material weakness exists, testing and evaluating the design and operating effectiveness of internal control based on the assessed risk, and performing such other procedures as we considered necessary in the circumstances. We believe that our audit provides a reasonable basis for our opinion.
A company’s internal control over financial reporting is a process designed to provide reasonable assurance regarding the reliability of financial reporting and the preparation of financial statements for external purposes in accordance with generally accepted accounting principles. A company’s internal control over financial reporting includes those policies and procedures that (1) pertain to the maintenance of records that, in reasonable detail, accurately and fairly reflect the transactions and dispositions of the assets of the company; (2) provide reasonable assurance that transactions are recorded as necessary to permit preparation of financial statements in accordance with generally accepted accounting principles, and that receipts and expenditures of the company are being made only in accordance with authorizations of management and directors of the company; and (3) provide reasonable assurance regarding prevention or timely detection of unauthorized acquisition, use or disposition of the company’s assets that could have a material effect on the financial statements.
Because of its inherent limitations, internal control over financial reporting may not prevent or detect misstatements. Also, projections of any evaluation of effectiveness to future periods are subject to the risk that controls may become inadequate because of changes in conditions, or that the degree of compliance with the policies or procedures may deteriorate.
In our opinion, management’s assessment that National Instruments Corporation maintained effective internal control over financial reporting as of December 31, 2006, is fairly stated, in all material respects, based on the COSO criteria. Also, in our opinion, National Instruments Corporation maintained, in all material respects, effective internal control over financial reporting as of December 31, 2006,2009, based on the COSO criteria.
We also have audited, in accordance with the standards of the Public Company Accounting Oversight Board (United States), the consolidated balance sheets of National Instruments Corporation as of December 31, 20062009 and 2005,2008, and the related consolidated statements of income, stockholders’ equity, and cash flows for each of the twothree years in the period ended December 31, 2006 of National Instruments Corporation2009 and our report dated February 15, 200717, 2010 expressed an unqualified opinion thereon./s/ Ernst & Young LLP
Austin, Texas
February 15, 2007
/s/ Ernst & Young LLP
Austin, TexasFebruary 17, 2010
Report of Independent Registered Public Accounting Firm
To the Board of Directors and Stockholders of National Instruments Corporation:
In our opinion, the consolidated statements of income, of stockholders’ equity and of cash flows (appearing on pages F-6 through F-8 of this National Instruments Corporation 2006 Annual Report on Form 10-K) for the year ended December 31, 2004 present fairly, in all material respects, the results of operations and cash flows of National Instruments Corporation and its subsidiaries for the year ended December 31, 2004, in conformity with accounting principles generally accepted in the United States of America. In addition, in our opinion, the financial statement schedule for the year ended December 31, 2004 presents fairly, in all material respects, the information set forth therein when read in conjunction with the related consolidated financial statements. These financial statements and financial statement schedule are the responsibility of the Company’s management. Our responsibility is to express an opinion on these financial statements and financial statement schedule based on our audit. We conducted our audit of these statements in accordance with the standards of the Public Company Accounting Oversight Board (United States). Those standards require that we plan and perform the audit to obtain reasonable assurance about whether the financial statements are free of material misstatement. An audit includes examining, on a test basis, evidence supporting the amounts and disclosures in the financial statements, assessing the accounting principles used and significant estimates made by management, and evaluating the overall financial statement presentation. We believe that our audit provides a reasonable basis for our opinion.
/s/ PricewaterhouseCoopers LLP
Austin, Texas
March 4, 2005
NATIONAL INSTRUMENTS CORPORATION
(in thousands, except share data)December 31,
2006
2005
Assets
Current assets: Cash and cash equivalents $ 100,287 $ 55,864 Short-term investments 150,190 119,846 Accounts receivable, net 117,235 95,733 Inventories, net 77,138 62,827 Prepaid expenses and other current assets 11,393 13,146 Deferred income taxes, net 20,851 14,890
Total current assets 477,094 362,306 Property and equipment, net 145,425 144,330 Goodwill, net 53,343 52,533 Intangible assets, net 40,065 43,602 Other long-term assets 5,293 5,565
Total assets $ 721,220 $ 608,336
Liabilities and Stockholders' Equity
Current liabilities: Accounts payable $ 32,001 $ 30,832 Accrued compensation 20,912 18,084 Deferred revenue 22,208 16,018 Accrued expenses and other liabilities 15,934 8,838 Other taxes payable 11,527 13,848
Total current liabilities 102,582 87,620 Deferred income taxes 21,956 16,866
Total liabilities 124,538 104,486
Commitments and contingencies Stockholders' equity: Preferred stock: par value $0.01; 5,000,000 shares authorized; none issued and outstanding — — Common stock: par value $0.01; 180,000,000 shares authorized; 79,883,837 and 79,276,086 shares issued and outstanding, respectively 799 793 Additional paid-in capital 109,851 91,430 Deferred stock-based compensation — (16,547 ) Retained earnings 483,533 429,859 Accumulated other comprehensive income (loss) 2,499 (1,685 )
Total stockholders' equity 596,682 503,850
Total liabilities and stockholders' equity $ 721,220 $ 608,336
December 31, 2009 2008 Assets Current assets: Cash and cash equivalents $ 201,465 $ 229,400 Short-term investments 87,196 6,220 Accounts receivable, net 103,957 121,548 Inventories, net 86,515 107,358 Prepaid expenses and other current assets 36,523 43,062 Deferred income taxes, net 16,522 21,435 Total current assets 532,178 529,023 Long-term investments — 10,500 Property and equipment, net 153,265 154,477 Goodwill, net 64,779 64,561 Intangible assets, net 43,390 41,915 Other long-term assets 19,417 32,115 Total assets $ 813,029 $ 832,591 Liabilities and Stockholders’ Equity Current liabilities: Accounts payable $ 23,502 $ 30,876 Accrued compensation 14,934 22,012 Deferred revenue 57,242 45,514 Accrued expenses and other liabilities 8,560 18,848 Other taxes payable 14,181 13,481 Total current liabilities 118,419 130,731 Deferred income taxes 25,012 25,157 Liability for uncertain tax positions 11,062 9,364 Other long-term liabilities 4,116 2,901 Total liabilities 158,609 168,153 Commitments and contingencies Stockholders’ equity: Preferred stock: par value $0.01; 5,000,000 shares authorized; none issued and outstanding — — Common stock: par value $0.01; 180,000,000 shares authorized;77,367,874 and 77,193,063 shares issued and outstanding, respectively 774 772 Additional paid-in capital 336,446 300,352 Retained earnings 303,655 352,831 Accumulated other comprehensive income 13,545 10,483 Total stockholders’ equity 654,420 664,438 Total liabilities and stockholders’ equity $ 813,029 $ 832,591
The accompanying notes are an integral part of these financial statements.
NATIONAL INSTRUMENTS CORPORATION
(in thousands, except per share data)For the Years Ended December 31,
2006
2005
2004
Net sales $ 660,407 $ 571,841 $ 514,088 Cost of sales (1) 170,326 149,309 135,473
Gross profit 490,081 422,532 378,615
Operating expenses: Sales and marketing (2) 235,072 211,280 188,727 Research and development (3) 113,095 87,841 84,692 General and administrative (4) 54,192 45,199 42,500
Total operating expenses 402,359 344,320 315,919
Operating income 87,722 78,212 62,696
Other income (expense): Interest income 6,847 3,758 2,905 Net foreign exchange gain (loss) 740 (1,566 ) 1,287 Other income (expense), net (7 ) 276 (2,075 )
Income before income taxes 95,302 80,680 64,813 Provision for income taxes (5) 22,594 19,163 16,203
Net income $ 72,708 $ 61,517 $ 48,610
Basic earnings per share $ 0.91 $ 0.78 $ 0.62
Weighted average shares outstanding - basic 79,519 78,552 78,680
Diluted earnings per share $ 0.89 $ 0.76 $ 0.59
Weighted average shares outstanding - diluted 81,519 80,910 82,096
Dividends declared per share $ 0.24 $ 0.20 $ 0.18
The following footnotes apply to the years ended December 31, 2006, 2005 and 2004:
(1)including $598, $101 and $0, respectively, of non-cash stock compensation.(2)including $6,008, $500 and $0, respectively, of non-cash stock compensation.(3)including $5,201, $598 and $0, respectively, of non-cash stock compensation.(4)including $2,333, $345 and $0, respectively, of non-cash stock compensation.(5)including $2,403, $364 and $0, respectively, of benefit from non-cash stock compensation.
For the YearsEnded December 31, 2009 2008 2007 Net sales: Product $ 623,736 $ 765,441 $ 701,589 Software maintenance 52,858 55,096 38,789 Total net sales 676,594 820,537 740,378 Cost of sales: Product 164,700 201,064 180,556 Software maintenance 5,184 6,045 4,711 Total cost of sales 169,884 207,109 185,267 Gross profit 506,710 613,428 555,111 Operating expenses: Sales and marketing 269,267 307,409 264,060 Research and development 132,974 143,140 126,515 General and administrative 57,938 67,162 62,445 Total operating expenses 460,179 517,711 453,020 Operating income 46,531 95,717 102,091 Other income (expense): Interest income 1,629 5,996 9,822 Net foreign exchange gain (loss) 734 (3,737 ) 1,672 Other income (expense), net 1,351 161 (158 ) Income before income taxes 50,245 98,137 113,427 Provision for income taxes 33,160 13,310 6,394 Net income $ 17,085 $ 84,827 $ 107,033 Basic earnings per share $ 0.22 $ 1.08 $ 1.35 Weighted average shares outstanding - basic 77,520 78,567 79,468 Diluted earnings per share $ 0.22 $ 1.07 $ 1.32 Weighted average shares outstanding – diluted �� 78,026 79,515 81,043 Dividends declared per share $ 0.48 $ 0.44 $ 0.34
The accompanying notes are an integral part of these financial statements.
NATIONAL INSTRUMENTS CORPORATION
(in thousands)For the Years Ended December 31,
2006
2005
2004
Cash flow from operating activities: Net income $ 72,708 $ 61,517 $ 48,610 Adjustments to reconcile net income to net cash provided by operating activities: Depreciation and amortization 34,181 28,553 25,592 Stock-based compensation 14,507 1,545 — Impairment of cost method investment — — 2,500 Gain on sale of subsidiary — — (242 ) Provision for (benefit from) deferred income taxes (339 ) 3,219 (825 ) Tax benefit from stock option plans (4,271 ) 675 3,071 Changes in operating assets and liabilities: Accounts receivable (21,502 ) (4,080 ) (9,342 ) Inventories (14,311 ) (4,572 ) (15,230 ) Prepaid expenses and other assets 2,116 (2,177 ) 4,624 Accounts payable 1,169 4,647 (4,359 ) Deferred revenue 6,190 3,847 3,385 Taxes and other liabilities 7,443 (5,124 ) 7,848
Net cash provided by operating activities 97,891 88,050 65,632
Cash flow from investing activities: Proceeds from sale of subsidiary — — 680 Acquisitions, net of cash received — (63,891 ) — Capital expenditures (18,503 ) (15,383 ) (12,596 ) Capitalization of internally developed software (7,370 ) (13,380 ) (5,007 ) Additions to other intangibles (3,115 ) (4,288 ) (3,050 ) Purchases of short-term investments (244,238 ) (124,227 ) (125,954 ) Sales and maturities of short-term investments 213,894 154,773 116,789
Net cash used in investing activities (59,332 ) (66,396 ) (29,138 )
Cash flow from financing activities: Proceeds from issuance of common stock 37,146 23,222 16,826 Repurchase of common stock (16,519 ) (49,452 ) (16,064 ) Dividends paid (19,034 ) (15,776 ) (14,486 ) Tax benefit from stock option plans 4,271 — —
Net cash provided by (used in) financing activities 5,864 (42,006 ) (13,724 )
Net change in cash and cash equivalents 44,423 (20,352 ) 22,770 Cash and cash equivalents at beginning of period 55,864 76,216 53,446
Cash and cash equivalents at end of period $ 100,287 $ 55,864 $ 76,216
Cash paid for interest and income taxes Interest $ 41 $ 17 $ 31 Income taxes $ 9,827 $ 15,117 $ 10,622
For the Years Ended December 31, 2009 2008 2007 Cash flow from operating activities: Net income $ 17,085 $ 84,827 $ 107,033 Adjustments to reconcile net income to net cash provided by operating activities: Depreciation and amortization 38,365 37,103 36,605 Stock-based compensation 20,299 19,854 17,754 Tax expense/(benefit from) deferred income taxes 17,196 (4,475 ) (16,954 ) Tax expense/(benefit from) stock option plans 1,450 (1,213 ) (2,964 ) Changes in operating assets and liabilities: Accounts receivable 17,591 12,159 (14,047 ) Inventories 20,843 (24,578 ) (5,537 ) Prepaid expenses and other assets 12,740 (10,340 ) (12,330 ) Accounts payable (7,374 ) (5,648 ) 4,186 Deferred revenue 11,728 9,423 13,883 Taxes and other liabilities (14,272 ) 4,706 19,743 Net cash provided by operating activities 135,651 121,818 147,372 Cash flow from investing activities: Acquisitions, net of cash received — (17,310 ) — Capital expenditures (20,847 ) (25,771 ) (24,864 ) Capitalization of internally developed software (12,583 ) (9,487 ) (8,263 ) Additions to other intangibles (4,602 ) (3,010 ) (6,447 ) Purchases of short-term investments (93,087 ) (9,061 ) (87,586 ) Sales and maturities of short-term investments 19,204 86,179 143,938 Purchases of foreign currency option contracts — (2,784 ) (2,242 ) Net cash provided by (used in) investing activities (111,915 ) 18,756 14,536 Cash flow from financing activities: Proceeds from issuance of common stock 21,672 31,150 36,460 Repurchase of common stock (34,585 ) (103,641 ) (79,728 ) Dividends paid (37,308 ) (34,735 ) (27,052 ) Tax (expense)/benefit from stock option plans (1,450 ) 1,213 2,964 Net cash (used in) financing activities (51,671 ) (106,013 ) (67,356 ) Net change in cash and cash equivalents (27,935 ) 34,561 94,552 Cash and cash equivalents at beginning of period 229,400 194,839 100,287 Cash and cash equivalents at end of period $ 201,465 $ 229,400 $ 194,839 Cash paid for interest and income taxes: Interest $ 23 $ 116 $ 159 Income taxes $ 14,608 $ 17,214 $ 21,147
The accompanying notes are an integral part of these financial statements.
NATIONAL INSTRUMENTS CORPORATION
(in thousands, except share data)Common
Stock
Shares
Common
Stock
Amount
Additional
Paid-In
Capital
Deferred
Compensation
Retained
Earnings
Accumulated
Other
Comprehensive
Income/(Loss)
Total
Stockholders'
Equity
Balance at December 31, 2003 78,269,235 $ 783 $ 95,070 $ — $ 349,994 $ (6,395 ) $ 439,452 Net income 48,610 48,610 Foreign currency translation adjustment (net of $1,013 tax expense) 3,050 3,050 Unrealized loss on securities available for sale (net of $0 tax benefit) (417 ) (417 ) Unrealized gain on derivative instruments (net of $2,136 tax expense) 6,407 6,407
Total comprehensive income 57,650
Issuance of common stock under employee plans, including tax benefits 1,234,195 12 19,885 19,897 Repurchase and retirement of common stock (557,850 ) (6 ) (16,058 ) (16,064 ) Dividends declared (14,486 ) (14,486 )
Balance at December 31, 2004 78,945,580 $ 789 $ 98,897 $ — $ 384,118 $ 2,645 $ 486,449 Net income 61,517 61,517 Foreign currency translation adjustment(net of $1,636 tax benefit) (5,181 ) (5,181 ) Unrealized gain on securities available for sale (net of $0 tax expense) 50 50 Unrealized gain on derivative instruments (net of $253 tax expense) 801 801
Total comprehensive income 57,187
Net activity related to restricted stock units 813,305 8 18,084 (16,547 ) 1,545 Issuance of common stock under employee plans, including tax benefits 1,573,547 16 23,206 23,222 Repurchase and retirement of common stock (2,056,346 ) (20 ) (49,432 ) (49,452 ) Dividends declared (15,776 ) (15,776 ) Disqualified dispositions 675 675
Balance at December 31, 2005 79,276,086 $ 793 $ 91,430 ($ 16,547 ) $ 429,859 ($ 1,685 ) $ 503,850 Net income 72,708 72,708 Foreign currency translation adjustment (net of $1,434 tax expense) 4,542 4,542 Unrealized gain on securities available for sale (net of $0 tax expense) 78 78 Unrealized loss on derivative instruments (net of $138 tax benefit) (436 ) (436 )
Total comprehensive income 76,892
Issuance of common stock under employee plans, including tax benefits 1,915,172 19 37,127 37,146 Stock-based compensation under
restricted stock plan 113,794 1 5,082 5,083 Stock-based compensation under stock
option and employee stock purchase plans 9,424 9,424 Repurchase and retirement of common stock (607,910 ) (6 ) (16,513 ) (16,519 ) Effect of adoption of SFAS 123R (813,305 ) (8 ) (16,539 ) 16,547 — Dividends declared (19,034 ) (19,034 ) Disqualified dispositions (160 ) (160 )
Balance at December 31, 2006 $ 79,883,837 $ 799 $ 109,851 $ — $ 483,533 $ 2,499 $ 596,682
CommonStockShares CommonStockAmount AdditionalPaid-InCapital DeferredCompensation RetainedEarnings AccumulatedOtherComprehensiveIncome/(Loss) TotalStockholders’Equity Balance at December 31, 2006 79,883,837 $ 799 $ 207,808 $ — $ 385,480 $ 2,499 $ 596,586 Net income 107,033 107,033 Foreign currency translation adjustment(net of $286 tax expense) 4,483 4,483 Unrealized gain on securities available-for-sale(net of $13 tax expense) 200 200 Unrealized loss on derivative instruments(net of $7 tax benefit) (117 ) (117 ) Total comprehensive income 111,599 Issuance of common stock under employee plans, including tax benefits 2,251,657 22 36,438 36,460 Stock-based compensation 17,754 17,754 Repurchase and retirement of common stock (2,730,135 ) (27 ) (7,102 ) (72,599 ) (79,728 ) Dividends paid (27,052 ) (27,052 ) Disqualified dispositions 5,467 5,467 Balance at December 31, 2007 79,405,359 $ 794 $ 260,365 $ — $ 392,862 $ 7,065 $ 661,086 Net income 84,827 84,827 Foreign currency translation adjustment(net of $681 tax benefit) (4,188 ) (4,188 ) Unrealized loss on securities available-for-sale(net of $82 tax benefit) (502 ) (502 ) Unrealized gain on derivative instruments(net of $1,320 tax expense) 8,108 8,108 Total comprehensive income 88,245 Issuance of common stock under employee plans, including tax benefits 1,897,746 19 31,131 31,150 Stock-based compensation 19,854 19,854 Repurchase and retirement of common stock (4,110,042 ) (41 ) (13,477 ) (90,123 ) (103,641 ) Dividends paid (34,735 ) (34,735 ) Disqualified dispositions 2,479 2,479 Balance at December 31, 2008 77,193,063 $ 772 $ 300,352 $ — $ 352,831 $ 10,483 $ 664,438 Net income 17,085 17,085 Foreign currency translation adjustment(net of $1,799 tax expense) 927 927 Unrealized gain on securities available-for-sale(net of $1,093 tax expense) 563 563 Unrealized gain on derivative instruments(net of $3,053 tax expense) 1,572 1,572 Total comprehensive income 20,147 Issuance of common stock under employee plans, including tax benefits 1,618,252 16 21,656 21,672 Stock-based compensation 20,574 20,574 Repurchase and retirement of common stock (1,443,441 ) (14 ) (5,618 ) (28,953 ) (34,585 ) Dividends paid (37,308 ) (37,308 ) Disqualified dispositions (518 ) (518 ) Balance at December 31, 2009 77,367,874 $ 774 $ 336,446 $ — $ 303,655 $ 13,545 $ 654,420
The accompanying notes are an integral part of these financial statements.
NATIONAL INSTRUMENTS CORPORATION
Note 1:1 – Operations and summary of significant accounting policies
National Instruments Corporation is a Delaware corporation. We engage in the design, development, manufacture and marketing of instrumentationprovide flexible application software and specialty computer plug-in cards and accessoriesmodular, multifunction hardware that users combine with industry standardindustry-standard computers, networks and the Internetthird party devices to create measurement, automation and automation systems.embedded systems, which we also refer to as “virtual instruments.” Our approach gives customers the ability to quickly and cost-effectively design, prototype and deploy unique custom-defined solutions for their design, control and test application needs. We offer hundreds of products used to create virtual instrumentation systems for general, commercial, industrial and scientific applications. Our products may be used in different environments, and consequently, specific application of our products is determined by the customer and generally is not known to us. We approach all markets with essentially the same products, which are used in a variety of applications from research and development to production testing, monitoring and industrial control. The following industries and applications are served by us worldwide: advanced research, automotive, commercial aerospace, computers and electronics, continuous process manufacturing, education, government/defense, medical research/pharmaceutical, power/energy, semiconductors, automated test equipment, telecommunications and others. TheThese financial statements have been prepared in accordance with accounting principles generally accepted in the United States of America.
Principles of consolidation
The consolidated financial statementsConsolidated Financial Statements include the accounts of National Instruments Corporation and its subsidiaries. All significant intercompany accounts and transactions have been eliminated.
We have historically recorded the excess of the purchase price over the par or stated value of retired shares of our common stock as a reduction of additional paid-in capital. We completed our review of this accounting policy under FASB ASC 505, Equity (FASB ASC 505). Based on this review, we have reclassified a portion of the excess of the purchase price over the par or stated value of retired shares of our common stock from a reduction of additional paid-in capital to a reduction of retained earnings. This reclassification did not have any impact on previously reported statements of income, earning per share amounts, statements of cash flows or total stockholders’ equity. Certain prior year amounts from our Consolidated Statements of Stockholders’ Equity have been reclassified to conform to the 2009 presentation as shown in the following table:
APIC RE 2006 Beginning Balance 12/31/06 balance as previously reported $ 109,851 $ 483,437 Cumulative reclassification of share repurchase 97,957 (97,957 ) 12/31/06 balance as reported in current Form 10-K $ 207,808 $ 385,480 2007 Activity Repurchase and retirement of common stock as previously reported $ (79,701 ) $ — Reclassification of 2007 activity 72,599 (72,599 ) Repurchase and retirement of common stock as reported in current Form 10-K $ (7,102 ) $ (72,599 ) 2007 Ending Balance 12/31/07 balance as previously reported $ 89,809 $ 563,418 Cumulative reclassification of share repurchase 170,556 (170,556 ) 12/31/07 balance as reported in current Form 10-K $ 260,365 $ 392,862 2008 Activity Repurchase and retirement of common stock as previously reported $ (103,600 ) $ — Reclassification of 2008 activity 90,123 (90,123 ) Repurchase and retirement of common stock as reported in current Form 10-K $ (13,477 ) $ (90,123 ) 2008 Ending Balance 12/31/08 balance as previously reported $ 39,673 $ 613,510 Cumulative reclassification of share repurchase 260,679 (260,679 ) 12/31/08 balance as reported in current Form 10-K $ 300,352 $ 352,831
Going forward, we will account for the retired shares of our common stock by recording the excess of the purchase price over par value as a reduction of retained earnings, to the extent that the excess of the purchase price over par value exceeds the original proceeds received from the issuance of the same shares of our common stock, as prescribed by FASB ASC 505.
Use of estimates Judgments and estimates are required in the
The preparation of our financial statements to conformin conformity with U.S. generally accepted accounting principles. Theprinciples requires us to make estimates and underlying assumptions that affect the reported amounts of assets, liabilities, revenues, expenses and liabilities,related disclosures of contingent assets and liabilities. We base our estimates on past experience and other assumptions that we believe are reasonable under the disclosurecircumstances, and we evaluate these estimates on an ongoing basis. Our critical accounting policies are those that affect our financial statements materially and involve difficult, subjective or complex judgments by management. Although these estimates are based on management's best knowledge of contingencies atcurrent events and actions that may impact the balance sheet date andcompany in the reported revenues and expenses forfuture, actual results may be materially different from the period. Actual results could differ from those estimates.
Cash and cash equivalents
Cash and cash equivalents include cash and highly liquid investments with maturities of three months or less at the date of acquisition. Short-term
Short-Term Investments
We maintain an investment portfolio of various types of security holdings and maturities. Pursuant to FASB ASC 820, cash equivalents and short-term investments Short-term available-for-sale are valued using the market approach (Level 1) based on unadjusted quoted prices in active markets for identical assets at the measurement date. Our short-term investments also include auction rate securities that we originally purchased for $8.6 million. These auction rate securities consist of corporate, state and municipaleducation loan revenue bonds. Auction rate securities with readily determinableare variable rate debt instruments whose interest rates are typically reset approximately every 7 to 35 days. In November 2008, we accepted the UBS Auction Rate Securities Rights (“the Rights”) agreement offered by UBS as a liquidity alternative to the failed auction process. The Rights agreement is a nontransferable right to sell our auction rate securities, at par value, back to UBS at any time during the period June 30, 2010, through July 2, 2012. The estimated fair market valuesvalue of both the auction rate securities and maturitiesthe Rights agreement was determined using significant unobservable inputs (Level 3) as prescribed by FASB ASC 820.
We account for our investments in excessdebt and equity instruments under FASB ASC 320. Our investments are classified as available-for-sale and accordingly are reported at fair value, with unrealized gains and losses reported as other comprehensive income, a component of three months at the date of acquisition.stockholders’ equity. Unrealized losses are charged against income when a decline in fair value is determined to be other than temporary. Investments with maturities beyond one year are classified as short-term based on their highly liquid nature and because such marketable securities represent the investment of cash that is available for current operations. Our investments are classified as available-for-sale and accordingly are reported atThe fair value of our short-term investments in debt securities at December 31, 2009 and December 31, 2008 was $87 million and $6 million, respectively. The increase was due to the net purchase of $74 million of short-term investments and the transfer of $8.6 related to our auction rate securities and our rights agreement from long-term investments to short-term investments during the year ended December 31, 2009. The net purchase of $74 million of short term investments was done to diversify our holdings from money market accounts to debt securities and to take advantage of higher yields associated with longer maturity debt securities. We follow the guidance provided by FASB ASC 320 to assess whether our investments with unrealized loss positions are other than temporarily impaired. Realized gains and losses reported as other comprehensive income. Unrealized losses are charged against income when a declineand declines in fair value is determinedjudged to be other than temporary. Thetemporary are determined based on the specific identification method and are reported in other income (expense), net, in our Consolidated Statements of Income.
Accounts Receivable, net
Accounts receivable are recorded net of allowance for sales returns of $1.9 million and $1.8 million at December 31, 2009 and 2008, respectively, and net of allowances for doubtful accounts of $2.7 million and $3.9 million at December 31, 2009 and 2008, respectively. A provision for estimated sales returns is used to determinemade by reducing recorded revenue based on historical experience. We analyze historical returns, current economic trends and changes in customer demand and acceptance of our products when evaluating the costadequacy of securities sold.our sales returns allowance. Our allowance for doubtful accounts is based on historical experience. We analyze historical bad debts, customer concentrations, customer creditworthiness and current economic trends when evaluating the adequacy of our allowance for doubtful accounts.
Year Description Balance atBeginningof Period Provisions Write-Offs Balance atEnd ofPeriod 2007 Allowance for doubtful accounts and sales returns $ 4,360 $ 1,940 $ 698 $ 5,602 2008 Allowance for doubtful accounts and sales returns 5,602 447 367 5,682 2009 Allowance for doubtful accounts and sales returns 5,682 337 1,400 4,619
Inventories
Inventories are stated at the lower-of-cost or market. Cost is determined using standard costs, which approximate the first-in first-out (FIFO)(“FIFO”) method. Cost includes the acquisition cost of purchased components, parts and subassemblies, in-bound freight costs, labor and overhead. Market is replacement cost with respect to raw materials and is net realizable value with respect to work in process and finished goods.
Inventory is shown net of adjustment for excess and obsolete inventories of $5.2$4.4 million and $6.0$4.4 million at December 31, 20062009 and 2005,2008, respectively.
Long-Term Investments
At December 31, 2008, our long-term investments primarily consisted of auction rate securities that we originally purchased for $8.6 million as well as our Rights agreement with UBS. At December 31, 2008, we classified these investments as long-term due to the fact that the market for these securities was inactive, the underlying securities generally had contractual maturities that were in excess of the guidelines provided for in our investment policy, the fact that we had the ability to hold the debt instruments to their ultimate maturity and the fact that we had not made a determination as to whether we would exercise our rights under the Rights agreement. The auction rate securities were classified as available-for-sale. At December 31, 2008, we reported our auction rate securities at their estimated fair market value of $7.0 million and our Rights agreement at its estimated fair market value of $1.6 million. The estimated fair market value of both the auction rate securities and the Rights agreement was determined using significant unobservable inputs (Level 3) as prescribed by FASB ASC 820. These auction rate securities and the Rights agreement are now reported as a component of short-term investments as discussed above.
Property and equipment
Property and equipment are recorded at cost. Depreciation is computed using the straight-line method over the estimated useful lives of the assets, which range from twenty to forty years for buildings, three to seven years for purchased internal use software and for equipment which are each included in furniture and equipment. Leasehold improvements are depreciated over the shorter of the life of the lease or the asset.
Intangible assets
We capitalize costs related to the development and acquisition of certain software products. In accordance with Statement of Financial Accounting Standards (“SFAS”) 86,Accounting for the Costs of Computer Software to Be Sold, Leased or Otherwise Marketed,FASB ASC 985, capitalization of costs begins when technological feasibility has been established and ends when the product is available for general release to customers. Technological feasibility for our products is established when the product is available for beta release. Amortization is computed on an individual product basis for those products available for market and is recognized based on the product’s estimated economic life, generally three years. Patents are amortized using the straight-line method over their estimated period of benefit, generally ten to seventeen years. At each balance sheet date, the unamortized costs for all intangible assets are reviewed by management and reduced to net realizable value when necessary.
Goodwill
GoodwillThe excess purchase price over the fair value of assets acquired is recorded as goodwill. As we have one operating segment, we allocate goodwill to one reporting unit for goodwill impairment testing. In accordance with SFAS 142,FASB ASC 350, Intangibles – Goodwill and Other Intangible Assets, (FASB ASC 350), goodwill is tested for impairment on an annual basis, and between annual tests if indicators of potential impairment exist, using a fair-value-based approach.approach based on the market capitalization of the reporting unit. Our annual impairment test was performed on April 6, 2006.as of February 28, 2009. No impairment of goodwill was identified.has been identified during the period presented. Goodwill is deductible for tax purposes in certain jurisdictions.
Concentrations of credit risk Financial
We maintain cash and cash equivalents with various financial institutions located in many countries throughout the world. At December 31, 2009, $85 million or 42% of our cash and cash equivalents was held in cash in various operating accounts with financial institutions throughout the world and $116 million or 58% was held in money market accounts. The most significant of our operating accounts was our domestic operating account which held approximately $22 million or 11% of our total cash and cash equivalents at a bank that carried an A1 rating at December 31, 2009. From a geographic standpoint, approximately $78 million or 39% was held in various domestic accounts with financial institutions and $123 million or 61% was held in various accounts outside of the U. S. with financial institutions. At December 31, 2009, our short-term investments consist of $35 million or 40% of foreign government bonds, $21 million or 24% of U.S. treasuries and agencies, $12 million or 14% of municipal bonds, $9 million or 10% of auction rate securities and our auction rate securities put option, $8 million or 9% of corporate bonds and $3 million or 3% in time deposits.
The goal of our investment policy is to manage our investment portfolio to preserve principal and liquidity while maximizing the return on our investment portfolio through the full investment of available funds. We place our cash investments in instruments that potentially subject us to concentrationsmeet credit quality standards, as specified in our corporate investment policy guidelines. These guidelines also limit the amount of credit risk consist principallyexposure to any one issue, issuer or type of instrument. With the exception of our auction rate security from the Vermont Student Assistance Corporation, at December 31, 2009, our cash equivalents and short-term investments carried ratings from the major credit rating agencies that were in accordance with our corporate investment policy. Our investment policy allows investments in the following; government and federal agency obligations, repurchase agreements (“Repos”), certificates of deposit and time deposits, corporate obligations, medium term notes and deposit notes, commercial paper including asset-backed commercial paper (“ABCP”), puttable bonds, general obligation and revenue bonds, money market funds, taxable commercial paper, corporate notes/bonds, municipal notes, municipal obligations, variable rate demand notes and tax exempt commercial paper. All such instruments must carry minimum ratings of A1/P1/F1, MIG1/VMIG1/SP1 and A2/A/A, as applicable, all of which are considered “investment grade”. Our investment policy for marketable securities requires that all securities mature in three years or less, with a weighted average maturity of no longer than 18 months with at least 10% maturing in 90 days or less. We actively monitor our investment portfolio to ensure compliance with our investment objective to preserve capital, meet liquidity requirements and maximize return on our investments. We do not require collateral or enter into master netting arrangements to mitigate our credit risk. (See Note 2 – Cash, cash equivalents, short-term and long-term investments in Notes to Consolidated Financial Statements for further discussion and analysis of our investments.).
At December 31, 2009, we held foreign currency forward and option contracts cashwith an aggregate notional amount of $148.4 million with various counterparties and cash equivalents, short-term investments and trade accounts receivable. We have no significant concentrations of credit risk at December 31, 2006.with varying maturity dates. Our counterparties in our foreign currency forward and option contracts are major financial institutions. We do not anticipate nonperformance by these counterparties. We maintain cash(See Note 4 – Derivative instruments and cash equivalents with various financial institutions locatedhedging activities in many countries worldwide. Our short-term investments are diversified among and limitedNotes to high-quality securities with high credit ratings. Consolidated Financial Statements).
Concentration of credit risk with respect to trade accounts receivable is limited due to the large number of customers and their dispersion across many countries and industries. The amount of sales to any individual customer did not exceed 3% of revenue for the periods presented. The largest trade account receivable from any individual customer at December 31, 20062009 was approximately $1.8$1.9 million.
Key supplier risk
Our manufacturing processes use large volumes of high-quality components and subassemblies supplied by outside sources. Several of thosethese components are available through singlesole or limited sources. Supply shortages of or quality problems in connection with some of these key components could require us to procure components from replacement suppliers, which would cause significant delays in fulfillment of orders and likely result in additional costs. In order to manage this risk, we maintain safety stock of some of these single sourced components and subassemblies and perform regular assessments of suppliers performance, grading key suppliers in critical areas such as quality and “on-time” delivery.
Revenue recognition
We derive revenue primarily from the sale/licensing of integrated hardware and software solutions. We also sellIndependent sales of application software licenses which are sold separately as well as training andinclude post contract support services. In addition, training services are sold separately. The products and services are generally sold under standardized licensing and sales arrangements with payment terms ranging from net 30 days in the United States to net 30 days and up to net 90 days in some international markets. Approximately 95%83% of our product/license sales include both hardware and software in the customer arrangement, with a small percentage of sales including other services. We offer rights of return and standard warranties for product defects related to our products. The rights of return are generally for a period of up to 30 days after the delivery date. The standard warranties cover periods ranging from 90 days to three years. With the exception of our former German systems integration subsidiary, which accounted for less than 1.5% of our revenues in the year ended December 31, 2004, weWe do not generally enter into contracts requiring product acceptance from the customer. This subsidiary was sold in December 2004.
Revenue is recognized in accordance with the provisions of SOP 97-2FASB ASC 985, when persuasive evidence of an arrangement exists, delivery has occurred, the fee is fixed or determinable, and collectability is probable. We enter into certain arrangements where we are obligated to deliver multiple products and/or services (“multiple elements”). In these transactions, we allocate the total revenue among the elements based on vendor specific objective evidence (“VSOE”) of fair value as determined by the sales price of each element when sold separately (“vendor-specific objective evidence”). Salesseparately.
When VSOE of fair value is available for the undelivered element of a multiple element arrangements, sales revenue from product sales is generally recognized on the date the product is shipped, using the residual method under FASB ASC 985, with a portion of revenue recorded as deferred (unearned) due to applicable undelivered elements. Undelivered elements for our multiple-elementmultiple element arrangements with a customer are generally restricted to post contract support and training and education. The amount of revenue allocated to these undelivered elements is based on the vendor-specific objective evidence (“VSOE”)VSOE of fair value for those undelivered elements. Deferred revenue due to undelivered elements is recognized ratably on a straight-line basis over the service period or when the service is completed. When VSOE of fair value is not available for the undelivered element of a multiple element arrangement, sales revenue is generally recognized ratably, on a straight-line basis over the service period of the undelivered element, generally 12 months or when the service is completed in accordance with the subscription method under FASB ASC 985. Deferred revenue at December 31, 20062009 and 20052008 was $22.2$57 million and $16.0$46 million, respectively.
The application of SOP 97-2FASB ASC 985 requires judgment, including whether a software arrangement includes multiple elements, and if so, whether VSOE of fair value exists for those elements. Changes to the elements in a software arrangement, the ability to identify VSOE for those elements, the fair value of the respective elements, and changes to a product'sproduct’s estimated life cycle could materially impact the amount of our earned and unearned revenue. Judgment is also required to assess whether future releases of certain software represent new products or upgrades and enhancements to existing products. Provision
Product revenue
Our product revenue is generated predominantly from the sales of measurement and automation products. Our products consist of application software and hardware components together with related driver software.
Software maintenance revenue
Software maintenance revenue is post contract customer support that provides the customer with unspecified upgrades/updates and technical support.Shipping and handling costsOur shipping and handling costs charged to customers are included in net sales, and the associated expense is recorded in cost of sales for estimated sales returns is made by reducing recorded revenue based on historical experience. Management analyzes historical returns, current economic trends, and changes in customer demand and acceptance of our products when evaluating the adequacy of our allowance for sales returns. The accounts receivable are net of allowance for sales returns of $1.5 million and $1.3 million at December 31, 2006 and 2005, respectively. Similarly, management must make estimates of the uncollectability of our accounts receivables. Management specifically analyzes accounts receivable and analyzes historical bad debts, customer concentrations, customer credit-worthiness and current economic trends when evaluating the adequacy of our allowance for doubtful accounts. The accounts receivable are net of allowances for doubtful accounts of $2.9 million and $3.4 million at December 31, 2006 and 2005, respectively.all periods presented.
Warranty reserve
We offer a one-year limited warranty on most hardware products, with a two or three-year warranty on a subset of our hardware products, which is included in the sales price of many of our products. Provision is made for estimated future warranty costs at the time of the sale pursuant to SFAS 5,Accounting for Loss FASB ASC 450, Contingencies (FASB ASC 450), for the estimated costs that may be incurred under the basic limited warranty. Our estimate is based on historical experience and product sales during this period.
The warranty reserve for the years ended December 31, 20062009 and 2005,2008, respectively, was as follows (in thousands):2006
2005
Balance at the beginning of the period $ 915 $ 815 Accruals for warranties issued during the period 1,593 1,652 Settlements made (in cash or in kind) during the period (1,641 ) (1,552 )
Balance at the end of the period $ 867 $ 915
2009 2008 Balance at the beginning of the period $ 952 $ 750 Accruals for warranties issued during the period 1,991 1,836 Settlements made (in cash or in kind) during the period (2,022 ) (1,634 ) Balance at the end of the period $ 921 $ 952
Loss contingencies
We accrue for probable losses from contingencies including legal defense costs, on an undiscounted basis, in accordance with SFAS 5, Accounting for Loss FASB ASC 450, Contingencies (FASB ASC 450), when such costs are considered probable of being incurred and are reasonably estimable. We periodically evaluate available information, both internal and external, relative to such contingencies and adjust this accrual as necessary.
Advertising expense
We expense costs of advertising as incurred. Advertising expense for the years ended December 31, 2006, 20052009, 2008 and 20042007 was $47.3$13.6 million, $42.5$19.3 million and $39.7$20.0 million, respectively.
Foreign currency translation
The functional currency for our international sales operations is the applicable local currency. The assets and liabilities of these operations are translated at the rate of exchange in effect on the balance sheet date and sales and expenses are translated at average rates. The resulting gains or losses from translation are included in a separate component of other comprehensive income. Gains and losses resulting from re-measuring monetary asset and liability accounts that are denominated in a currency other than a subsidiary’s functional currency are included in net foreign exchange gain (loss) and are included in net income.
Foreign currency hedging instruments
All of our derivative instruments are recognized on the balance sheet at their fair value. We currently use foreign currency forward and purchased option contracts to hedge our exposure to material foreign currency denominated receivables and forecasted foreign currency cash flows.
On the date the derivative contract is entered into, we designate the derivative as either a hedge of the fair value of foreign currency denominated receivables (“fair-value” hedge) or as a hedge of the variability of foreign currency cash flows to be received or paid (“cash flow” hedge). Changes in the fair market value or as a hedge of a fair-value hedge are recorded, along with the loss or gain on the re-measurement of foreign-currency-denominated receivables, in current earnings.our foreign denominated net receivable positions (“other derivatives”). Changes in the fair value of derivatives that are designated and qualify as cash flow hedges under SFAS 133FASB ASC 815, Derivatives and Hedging (FASB ASC 815) and that are deemed to be highly effective are recorded in other comprehensive income. These amounts are subsequently reclassified into earnings in the period during which the hedgehedged transaction is realized. The gain or loss on the other derivatives as well as the offsetting gain or loss on the hedged item attributable to the hedged risk is recognized in current earnings under the line item “Net foreign exchange gain (loss)”. We do not enter into derivative contracts for speculative purposes.
We formally document all relationships between hedging instruments and hedged items, as well as our risk-management objective and strategy for undertaking various hedge transactions. This process includes linking all derivatives that are designated as fair-value or cash flow hedges to specific assets and liabilities on the balance sheet or to specific firm commitments or forecasted transactions. We also formally assess, both at the hedge’s inception and on an ongoing basis, whether the hedging instruments are highly effective in offsetting changes in cash flows of hedged items.
We prospectively discontinue hedge accounting if (1) it is determined that the derivative is no longer highly effective in offsetting changes in the fair value of a hedged item (forecasted transactions); or (2) the derivative is de-designated as a hedge instrument, because it is unlikely that a forecasted transaction will occur. When hedge accounting is discontinued, the derivative is sold and the resulting gains and losses are recognized immediately in earnings.
Income taxes
We account for income taxes under the asset and liability method as set forth in SFAS 109,Accounting for FASB ASC 740, Income Taxes.Taxes (FASB ASC 740). Deferred tax assets and liabilities are recognized for the expected tax consequences of temporary differences between the tax bases of assets and liabilities and their reported amounts. Valuation allowances are established when necessary to reduce deferred tax assets to amounts which are more likely than not to be realized.
Earnings per share On January 21, 2004, we declared a stock split effected in the form of a dividend of one share of common stock for each two shares of common stock outstanding. The dividend was paid on February 20, 2004 to holders of record as of the close of business on February 5, 2004. All per share data and numbers of common shares, where appropriate, have been retroactively adjusted to reflect the stock split.
Basic earnings per share (“EPS”) is computed by dividing net income by the weighted average number of common shares outstanding during each period. Diluted EPS is computed by dividing net income by the weighted average number of common shares and common share equivalents outstanding (if dilutive) during each period. The number of common share equivalents, which include stock options and restricted stock units, is computed using the treasury stock method.
The reconciliation of the denominators used to calculate basic EPS and diluted EPS for the years ended December 31, 2006, 20052009, 2008 and 2004,2007, respectively, are as follows (in thousands):Years Ended December 31,
2006
2005
2004
Weighted average shares outstanding-basic 79,519 78,552 78,680 Plus: Common share equivalents Stock options, restricted stock units 2,000 2,358 3,416
Weighted average shares outstanding-diluted 81,519 80,910 82,096
Years Ended December 31, 2009 2008 2007 Weighted average shares outstanding-basic�� 77,520 78,567 79,468 Plus: Common share equivalents Stock options, restricted stock units 506 948 1,575 Weighted average shares outstanding-diluted 78,026 79,515 81,043
Stock options to acquire 3,295,000, 3,056,0002,711,976, 2,402,934 and 2,523,0002,304,078 shares for the years ended December 31, 2006, 20052009, 2008 and 2004,2007, respectively, were excluded in the computations of diluted EPS because the effect of including the stock options would have been anti-dilutive.
Stock-based compensation plans
Effective January 1, 2006, we adopted Statement of Financial Accounting Standards 123R (“SFAS 123R”),“Share-based Payments”FASB ASC 718, Compensation – Stock Compensation (FASB ASC 718), using the modified-prospective-transition method. Under this method, prior periods are not restated. Under this transition method, stock compensation cost recognized beginning January 1, 2006 includes: (a) compensation cost for all share-based payments granted prior to, but not yet vested as of January 1, 2006, based on the grant date fair value estimated in accordance with the original provisions of SFAS 123,FASB ASC 718, and (b) compensation cost for all share-based payments granted on or subsequent to January 1, 2006, based on the grant-date fair value estimated in accordance with the provisions of SFAS 123R.FASB ASC 718. Prior
Comprehensive income
Our comprehensive income is comprised of net income, foreign currency translation and unrealized gains and losses on forward and option contracts and securities available-for-sale. Comprehensive income for 2009, 2008 and 2007 was $20.1 million, $88.2 million and $111.6 million, respectively.
Recently Issued Accounting Pronouncements
In April 2009, the FASB updated FASB ASC 820 providing additional guidance for estimating fair value when the volume and level of activity for the asset or liability have significantly decreased. This update also includes guidance on identifying circumstances that indicate a transaction is not orderly. We adopted the update on April 1, 2009 as required and concluded it did not have a material impact on our consolidated financial position or results of operations.
In September 2009, the FASB updated FASB ASC 105, Generally Accepted Accounting Principles (FASB ASC 105). The update establishes the FASB Standards Accounting Codification (“Codification”) as the source of authoritative U.S. generally accepted accounting principles (“GAAP”) recognized by the FASB to adopting SFAS 123R, we presentedbe applied to nongovernmental entities and rules and interpretive releases of the SEC as authoritative GAAP for SEC registrants. The Codification supersedes all tax benefitsexisting non-SEC accounting and reporting standards. This update is effective for financial statements issued for interim and annual periods ending after September 15, 2009. We adopted the update on July 1, 2009, as required and concluded it did not have a material impact on our consolidated financial position or results of deductions resultingoperations.
In October 2009, the FASB updated FASB ASC 605, Revenue Recognition (FASB ASC 605) that amended the criteria for separating consideration in multiple-deliverable arrangements. The amendments establish a selling price hierarchy for determining the selling price of a deliverable. The selling price used for each deliverable will be based on vendor-specific objective evidence if available, third–party evidence if vendor-specific objective evidence is not available, or estimated selling price if neither vendor-specific objective evidence nor third-party evidence is available. The amendments will change the application of the residual method of allocation and require that arrangement consideration be allocated at the inception of the arrangement to all deliverables using the relative selling price method. The relative selling price method allocates any discount in the arrangement proportionally to each deliverable on the basis of each deliverable’s selling price. This update will be effective prospectively for revenue arrangements entered into or materially modified in fiscal years beginning on or after June 15, 2010. Early adoption is permitted. We are currently evaluating the requirements of this update and have not yet determined the impact on our consolidated financial statements.
In October 2009, the FASB updated FASB ASC 985, Software (FASB ASC 985) that changes the accounting model for revenue arrangements that include both tangible products and software elements. Tangible products containing software components and nonsoftware components that function together to deliver the tangible product’s essential functionality are no longer within the scope of the software revenue guidance in Subtopic 985-605. In addition, the amendments require that hardware components of a tangible product containing software components always be excluded from the exercisesoftware revenue guidance. This update will be effective prospectively for revenue arrangements entered into or materially modified in fiscal years beginning on or after June 15, 2010. Early adoption is permitted. We are currently evaluating the requirements of stock grants as operatingthis update and have not yet determined the impact on our consolidated financial statements.
Cash, cash flows. SFAS 123R requires the cash flows resulting from the tax benefits from tax deductions in excessequivalents, short-term and long-term investments consist of the compensation costfollowing (in thousands):
As ofDecember 31, 2009 As ofDecember 31, 2008 Cash and cash equivalents: Cash $ 85,612 $ 100,967 Cash equivalents: Time deposits — 73,400 Money market accounts 115,853 55,033 Total cash and cash equivalents $ 201,465 $ 229,400 Short-term investments: Municipal bonds $ 12,549 $ 6,220 Corporate bonds 7,587 — U.S. treasuries and agencies 21,033 — Foreign government bonds 34,674 — Time deposits 2,753 — Auction rate securities 8,177 — Auction rate securities put option 423 — Total short-term investments 87,196 6,220 Long-term investments: Auction rate securities — 6,964 Auction rate securities put option — 1,636 Other long-term investments — 1,900 Total investments $ 87,196 $ 16,720 Total cash, cash equivalents and investments $ 288,661 $ 246,120
The following table summarizes unrealized gains and losses related to our investments designated as available-for-sale (in thousands):
As of December 31, 2009 Adjusted Cost GrossUnrealized Gain GrossUnrealized Loss Cumulative Translation Adjustment Fair Value Municipal bonds $ 12,491 $ 58 $ — $ — $ 12,549 Corporate bonds 7,478 110 (1 ) — 7,587 U.S. treasuries and agencies 21,080 — (47 ) — 21,033 Foreign government bonds 36,105 76 — (1,507 ) 34,674 Time deposits 2,753 — — — 2,753 Auction rate securities 8,600 — (423 ) — 8,177 Auction rate securities put option — 423 — — 423 Total investments $ 88,507 $ 667 $ (471 ) $ (1,507 ) $ 87,196
As of December 31, 2008 Adjusted Cost GrossUnrealized Gain GrossUnrealized Loss Fair Value Municipal securities $ 6,199 $ 28 $ (7 ) $ 6,220 Auction rate securities 8,600 — (1,636 ) 6,964 Auction rate securities put option — 1,636 — 1,636 Other long-term investments 1,900 — — 1,900 Total investments $ 16,699 $ 1,664 $ (1,643 ) $ 16,720
The following table summarizes the contractual maturities of our investments designated as available-for-sale (in thousands):
As of December 31, 2009 Adjusted Cost Fair Value Due in less than 1 year $ 44,029 $ 43,267 Due in 1 to 5 years 44,478 43,929 Total investments $ 88,507 $ 87,196
As of December 31, 2009 Due in less than 1 year Adjusted Cost Fair Value Municipal bonds $ 4,103 $ 4,110 Corporate bonds 5,384 5,473 U.S. treasuries and agencies 5,065 5,057 Foreign government bonds 18,124 17,274 Time deposits 2,753 2,753 Auction rate securities 8,600 8,177 Auction rate securities put option — 423 Total investments $ 44,029 $ 43,267
As of December 31, 2009 Due in 1 to 5 years Adjusted Cost Fair Value Municipal bonds $ 8,388 $ 8,439 Corporate bonds 2,094 2,114 U.S. treasuries and agencies 16,015 15,976 Foreign government bonds 17,981 17,400 Time deposits — — Auction rate securities — — Auction rate securities put option — — Total investments $ 44,478 $ 43,929
Note 3 – Fair value measurements
FASB ASC 820, clarifies the definition of fair value, prescribes methods for measuring fair value, establishes a fair value hierarchy based on the inputs used to measure fair value and expands disclosures about the use of fair value measurements. Effective January 1, 2009, we adopted FASB ASC 820 for our nonfinancial assets and nonfinancial liabilities, except those items recognized (excess tax benefits) to be classifiedor disclosed at fair value on an annual or more frequently recurring basis. The adoption of FASB ASC 820 did not have a material impact on our fair value measurements as financing cash flows. Aswe did not have any items that were measured at fair value on a result, $4.3 million of excess tax benefitsnonrecurring basis for the year ended December 31, 20062009. In April 2009, FASB ASC 820 was updated to provide additional guidance for estimating fair value when the volume and level of activity for the asset or liability have been classified as financing cash flows. Prior tosignificantly decreased. The update also includes guidance on identifying circumstances that indicate a transaction is not orderly. We adopted the effective date of SFAS 123R, we applied Accounting Principles Board Opinion 25 (“APB 25”),“Accounting for Stock Issued to Employees”update on April 1, 2009 and related interpretations forit did not have a material impact on our stock option grants. APB 25 providesfair value measurements.
The following tables present our assets and liabilities that are measured at fair value on a recurring basis and are categorized using the compensation expense relative to our stock options is measuredfair value hierarchy. The fair value hierarchy has three levels based on the intrinsicreliability of the inputs used to determine fair value.
Fair Value Measurements at Reporting Date Using Description December 31, 2009 Quoted Prices in Active Markets for Identical Assets(Level 1) Significant Other Observable Inputs(Level 2) Significant Unobservable Inputs(Level 3) Assets Money Market Funds $ 115,853 $ 115,853 $ — $ — Short-term investments available-for-sale 87,196 78,596 — 8,600 Derivatives 11,016 — 11,016 — Total Assets $ 214,065 $ 194,449 $ 11,016 $ 8,600 Liabilities Derivatives $ (318 ) $ — $ (318 ) $ — Total Liabilities $ (318 ) $ — $ (318 ) $ —
Fair Value Measurements Using Significant Unobservable Inputs(Level 3) Short-term investmentsavailable-for-sale Beginning Balance, January 1, 2008 $ 8,600 Total gains (realized/unrealized) Included in earnings 423 Included in other comprehensive income — Total losses (realized/unrealized) Included in earnings (423 ) Included in other comprehensive income — Purchases, issuances and settlements — Transfer in and/or out of Level 3 — Ending Balance, December 31, 2009 $ 8,600 The amount of total gains or (losses) for the period included in earnings (or changes in net assets) attributableto the change in unrealized gains or losses relating to assets still held at the reporting date $ —
Short-term investments available-for-sale are valued using a market approach (Level 1) based on the quoted market prices of identical instruments when available or other observable inputs such as trading prices of identical instruments in inactive markets. Short-term investments available-for-sale consist of debt securities issued by states of the U.S. and political subdivisions of the states, corporate debt securities and debt securities issued by U.S. government corporations and agencies. All short-term investments available-for-sale have contractual maturities of less than 24 months.
Derivatives include foreign currency forward and option contracts. Our foreign currency forward contracts are valued using an income approach (Level 2) based on the spot rate less the contract rate multiplied by the notional amount. Our foreign currency option contracts are valued using a market approach based on the quoted market prices which are derived from observable inputs including current and future spot rates, interest rate spreads as well as quoted market prices of identical instruments.
Short-term debt securities available-for-sale included in Level 3 are reported at their fair market value and consist of auction rate securities backed by education loan revenue bonds. One of our auction rate securities is from the Vermont Student Assistance Corporation and has a par value of $2.2 million. The other of our auction rate securities is from the New Hampshire Health and Education Facilities Authority and has a par value of $6.4 million. The ratings for these securities at December 31, 2009, were Baa3/A/AAA and Aaa/NR/AAA, respectively. Historically, we reported the fair market value of these securities at par as differences between par value and the purchase price or settlement value were historically comprised of accrued interest. Auction rate securities are variable rate debt instruments whose interest rates are typically reset approximately every 7 to 35 days. On January 15, 2010, and in prior auction periods beginning in February 2008, the auction process for these securities failed. At December 31, 2009, we reported these as short-term investments at their estimated fair market value of $8.2 million.
In November 2008, we accepted the UBS Auction Rate Securities Rights (the “Rights”) agreement offered by UBS as a liquidity alternative to the failed auction process. This Rights agreement is related to the auction rates securities discussed above. The Rights agreement is a nontransferable right to sell our auction rate securities, at par value, back to UBS at any time during the period June 30, 2010, through July 2, 2012. At December 31, 2009, we reported the Rights agreement at its estimated fair market value of $423,000 as a component of short-term debt securities available for sale.
Due to the fact that our Rights agreement has an initial exercise date that is less than one year from now, we are now reporting our auction rate securities and the corresponding Rights agreement as short-term. We continue to have the ability to hold our auction rate securities to their ultimate maturities which are in excess of one year and we have not made a determination as to whether we will exercise our option under the Rights agreement or if we do choose to exercise our option, at what point during the period June 30, 2010 through July 2, 2012, we would exercise our option. However, due to the fact that our Rights agreement has an initial exercise date that is less than one year from now, we are now reporting our auction rate securities and the corresponding Rights agreement as short-term. We have recorded the unrealized loss related to the auction rate securities and the unrealized gain related to the Rights agreement as a component of other income (expense), in our Consolidated Statements of Income.
The estimated fair market value of both the auction rate securities and the Rights agreement was determined using significant unobservable inputs (Level 3) as prescribed by FASB ASC 820. We considered many factors in determining the fair market value of the stockauction rate securities as well as our corresponding Rights agreement at December 31, 2009, including the fact that the debt instruments underlying the auction rate securities have redemption features which call for redemption at 100% of par value, current credit curves for like securities and discount factors to account for the illiquidity of the market for these securities. During the year ended December 31, 2009, we did not make any changes to our valuation techniques or related inputs.
FASB ASC 815 requires companies to recognize all of their derivative instruments as either assets or liabilities in the statement of financial position at fair value. The accounting for changes in the fair value (i.e., gains or losses) of a derivative instrument depends on whether it has been designated and qualifies as part of a hedging relationship and further, on the type of hedging relationship. For those derivative instruments that are designated and qualify as hedging instruments, a company must designate the hedging instrument, based upon the exposure being hedged, as a fair value hedge, cash flow hedge, or a hedge of a net investment in a foreign operation.
We have operations in over 40 countries. Sales outside of the Americas as a percentage of consolidated sales were 57% and 57% for the years ended December 31, 2009 and 2008, respectively. Our activities expose us to a variety of market risks, including the effects of changes in foreign currency exchange rates. These financial risks are monitored and managed by us as an integral part of our overall risk management program.
We maintain a foreign currency risk management strategy that uses derivative instruments (foreign currency forward and purchased option contracts) to help protect our earnings and cash flows from fluctuations caused by the volatility in currency exchange rates. Movements in foreign currency exchange rates pose a risk to our operations and competitive position, since exchange rate changes may affect our profitability and cash flow, and the business or pricing strategies of our non-U.S. based competitors.
The vast majority of our foreign sales are denominated in the customers’ local currency. We purchase foreign currency forward and option contracts as hedges of forecasted sales that are denominated in foreign currencies and as hedges of foreign currency denominated receivables. These contracts are entered into to protect against the risk that the eventual dollar-net-cash inflows resulting from such sales or firm commitments will be adversely affected by changes in exchange rates. We also purchase foreign currency forward contracts as hedges of forecasted expenses that are denominated in foreign currencies. These contracts are entered into to protect against the risk that the eventual dollar-net-cash outflows resulting from foreign currency operating and cost of revenue expenses will be adversely affected by changes in exchange rates.
In accordance with FASB ASC 815, we designate foreign currency forward and purchased option contracts as cash flow hedges of forecasted revenues or forecasted expenses. In addition, we hedge our foreign currency denominated balance sheet exposures using foreign currency forward contracts. These derivatives are not designated as hedging instruments under FASB ASC 815. None of our derivative instruments contain a credit-risk-related contingent feature.
Cash flow hedges
To protect against the reduction in value caused by a fluctuation in foreign currency exchange rates of forecasted foreign currency cash flows resulting from international sales over the next one to two years, we have instituted a foreign currency cash flow hedging program. We hedge portions of our forecasted revenue and forecasted expenses denominated in foreign currencies with forward and purchased option contracts. For forward contracts, when the dollar strengthens significantly against the foreign currencies, the change in the present value of future foreign currency cash flows may be offset by the change in the fair value of the forward contracts designated as hedges. For option contracts, when the dollar strengthens significantly against the foreign currencies, the change in the present value of future foreign currency cash flows may be offset by the change in the fair value of the option contracts net of the premium paid designated as hedges. Our foreign currency purchased option contracts are purchased “at-the-money” or “out-of-the-money”. We purchase foreign currency forward and option contracts for up to 100% of our forecasted exposures in selected currencies (primarily in Euro, Japanese yen, British pound sterling, South Korean won and Hungarian forint) and limit the duration of these contracts to 40 months or less.
For derivative instruments that are designated and qualify as a cash flow hedge, the effective portion of the gain or loss on the derivative is reported as a component of accumulated other comprehensive income (“OCI”) and reclassified into earnings in the same line item (net sales, operating expenses, or cost of sales) associated with the forecasted transaction and in the same period or periods during which the hedged transaction affects earnings. Gains and losses on the derivative representing either hedge ineffectiveness or hedge components excluded from the assessment of effectiveness are recognized in current earnings or expenses during the current period and are classified as a component of “net foreign exchange gain (loss)”. Hedge effectiveness of foreign currency forwards and purchased option contracts designated as cash flow hedges are measured by comparing the hedging instrument’s cumulative change in fair value from inception to maturity to the forecasted transaction’s terminal value.
We held forward contracts with a notional amount of $28.6 million dollar equivalent of Euro, $4.0 million dollar equivalent of British pound sterling, $24.4 million dollar equivalent of Japanese yen, and $17.8 million dollar equivalent of Hungarian forint at dateDecember 31, 2009. These contracts are for terms of grant.up to 24 months. At December 31, 2008, we held forward contracts with a notional amount of $54.9 million dollar equivalent of Euro, $6.2 million dollar equivalent of British pound sterling, $18.9 million dollar equivalent of Japanese yen, $4.7 million dollar equivalent of South Korean won and $21.7 million dollar equivalent of Hungarian forint.
We held purchased option contracts with a notional amount of $28.4 million dollar equivalent of Euro at December 31, 2009. These contracts are for terms of up to 12 months. At December 31, 2008, we held purchased option contracts with a notional amount of $111.3 million dollar equivalent of Euro.
At December 31, 2009, we expect to reclassify $2.8 million of gains on derivative instruments from accumulated other comprehensive income to net sales during the next twelve months when the hedged international sales occur. At December 31, 2009, we expect to reclassify $3.7 million of gains on derivative instruments from accumulated OCI to cost of sales and $2.0 million of gains on derivative instruments from accumulated OCI to operating expenses during the next twelve months when the hedged international expenses occur. Expected amounts are based on derivative valuations at December 31, 2009. Actual results may vary as a result of changes in the corresponding exchange rate subsequent to this date.
During the year ended December 31, 2009, hedges with a notional amount of $22.8 million were determined to be ineffective. As a result, we recorded a net gain of adopting SFAS 123R$1.2 million related to these hedges as a component of “net foreign exchange gain (loss)” during the year ended December 31, 2009. We did not record any gains or losses due to the ineffectiveness of our hedges during the year ended December 31, 2008.Other Derivatives
Other derivatives not designated as hedging instruments under FASB ASC 815 consist primarily of foreign currency forward contracts that we use to hedge our foreign denominated net receivable or net payable positions to protect against the change in value caused by a fluctuation in foreign currency exchange rates. We typically hedge up to 90% of our outstanding foreign denominated net receivables or net payables and typically limit the duration of these foreign currency forward contracts to approximately 90 days. The gain or loss on the derivatives as well as the offsetting gain or loss on the hedge item attributable to the hedged risk is recognized in current earnings under the line item “net foreign exchange gain (loss)”. As of December 31, 2009 and December 31, 2008, we held foreign currency forward contracts with a notional amount of $45.2 million and $67.1 million, respectively.
Effective January 1, 2006,2009, we adopted the updated disclosure requirements of FASB ASC 815. The following table presents the fair value of derivative instruments on our income before income taxesConsolidated Balance Sheets and net incomethe effect of derivative instruments on our Consolidated Statements of Income.
Fair Values of Derivative Instruments (in thousands):
In thousands Asset Derivatives December 31, 2009 December 31, 2008 Balance Sheet Location Fair Value Balance Sheet Location Fair Value Derivatives designated as hedginginstruments under FASB ASC 815 Foreign exchange contracts – ST forwards Prepaid expenses and other current assets $ 7,947 Prepaid expenses and other current assets $ 5,260 Foreign exchange contracts – LT forwards Other long-term assets 274 Other long-term assets 2,654 Foreign exchange contracts – ST options Prepaid expenses and other current assets 1,821 Prepaid expenses and other current assets 5,705 Foreign exchange contracts – LT options Other long-term assets — Other long-term assets 3,838 Total derivatives designated ashedging instruments under FASB ASC 815 $ 10,042 $ 17,457 Derivatives not designated ashedging instruments under FASB ASC 815 Foreign exchange contracts – ST forwards Prepaid expenses and other current assets $ 974 Prepaid expenses and other current assets $ 2,745 Total derivatives not designated ashedging instruments under FASB ASC 815 $ 974 $ 2,745 Total derivatives $ 11,016 $ 20,202
Liability Derivatives December 31, 2009 December 31, 2008 Balance Sheet Location Fair Value Balance Sheet Location Fair Value Derivatives designated as hedginginstruments under FASB ASC 815 Foreign exchange contracts – ST forwards Accrued expenses and other liabilities $ — Accrued expenses and other liabilities $ (1,803 ) Foreign exchange contracts – LT forwards Other long-term liabilities — Other long-term liabilities — Foreign exchange contracts – ST options Accrued expenses and other liabilities — Accrued expenses and other liabilities — Foreign exchange contracts – LT options Other long-term liabilities — Other long-term liabilities — Total derivatives designated ashedging instruments under FASB ASC 815 $ — $ (1,803 ) Derivatives not designated ashedging instruments under FASB ASC 815 Foreign exchange contracts – ST forwards Accrued expenses and other liabilities $ (318 ) Accrued expenses and other liabilities $ (3,280 ) Total derivatives not designated ashedging instruments under FASB ASC 815 $ (318 ) $ (3,280 ) Total derivatives $ (318 ) $ (5,083 )
The following table shows the effect of derivative instruments on our Consolidated Statements of Income for the year ended December 31, 2006 are $9.42009 (in thousands):
Derivatives in FASB ASC 815 Cash Flow Hedging Relationship Amount of Gain or (Loss) Recognized in OCI on Derivative (Effective Portion) (in thousands) Location of Gain or (Loss) Reclassified from Accumulated OCI into Income (Effective Portion) Amount of Gain or (Loss) Reclassified from Accumulated OCI into Income (Effective Portion) (in thousands) Location of Gain or (Loss) Recognized in Income on Derivative (Ineffective Portion and Amount Excluded from Effectiveness Testing) Amount of Gain or (Loss) Recognized in Income on Derivative (Ineffective Portion and Amount Excluded from Effectiveness Testing) 2009 2009 2009 Foreign exchange contracts – forwards and options $ (6,304 ) Net sales $ 1,399 Net foreign exchange gain (loss) $ 1,132 Foreign exchange contracts – forwards and options 2,055 Cost of sales (74 ) Net foreign exchange gain (loss) (41 ) Foreign exchange contracts – forwards and options 1,427 Operating expenses 517 Net foreign exchange gain (loss) 81 Total $ (2,822 ) $ 1,842 $ 1,172
Derivatives not Designated as Hedging Instruments under FASB ASC 815 Location of Gain (Loss) Recognized in Income on Derivative Amount of Gain (Loss) Recognized in Income on Derivative 2009 Foreign exchange contracts – forwards Net foreign exchange gain/(loss) $ (1,669 ) Total $ (1,669 )
Note 5 – Inventories
Inventories, net consist of the following (in thousands):
December 31, 2009 2008 Raw materials $ 42,121 $ 48,004 Work-in-process 2,042 4,150 Finished goods 42,352 55,204 $ 86,515 $ 107,358
Note 6 – Property and equipment
Property and equipment consist of the following (in thousands):
December 31, 2009 2008 Land $ 17,076 $ 7,210 Buildings 138,367 136,802 Furniture and equipment 154,558 144,979 310,001 288,991 Accumulated depreciation (156,736 ) (134,514 ) $ 153,265 $ 154,477
Depreciation expense for the years ended December 31, 2009, 2008 and 2007, was $22.3 million, $20.9 million and $22.2 million, respectively.
Intangibles at December 31, 2009 and 2008 are as follows:
2009 2008 Gross Carrying Amount Accumulated Amortization Net Carrying Amount Gross Carrying Amount Accumulated Amortization Net Carrying Amount Capitalized software development costs $ 38,928 $ (20,455 ) $ 18,473 $ 25,610 $ (11,344 ) $ 14,266 Acquired technology 28,022 (20,967 ) 7,055 27,503 (16,804 ) 10,699 Patents 19,033 (5,377 ) 13,656 16,068 (4,506 ) 11,562 Other 12,577 (8,371 ) 4,206 11,401 (6,013 ) 5,388 $ 98,560 $ (55,170 ) $ 43,390 $ 80,582 $ (38,667 ) $ 41,915
Software development costs capitalized during 2009, 2008 and 2007 were $13.3 million, $9.5 million and $8.3 million, respectively, and related amortization was $9.1 million, $10.3 million and $8.9 million, respectively. Included in these capitalized costs for the years ended December 31, 2009, 2008, and 2007 were costs related to stock based compensation of $734,000, $451,000 and $422,000, respectively. Amortization of capitalized software development costs is computed on an individual product basis for those products available for market and is recognized based on the product’s estimated economic life, generally three years. Patents are amortized using the straight-line method over their estimated period of benefit, generally ten to seventeen years. Total intangible assets amortization expenses were $16.5 million, $16.2 million and $14.4 million for the years ended December 31, 2009, 2008 and 2007, respectively.
Capitalized software development costs, acquired technology, patents and other have weighted-average useful lives of 2.2 years, 1.8 years, 5.3 years, and 1.8 years, respectively, as of December 31, 2009. The estimated future amortization expense related to intangible assets as of December 31, 2009 is as follows:
Amount(in thousands) 2010 $ 18,097 2011 12,986 2012 7,187 2013 1,868 2014 1,186 Thereafter 2,066 $ 43,390
Acquisition intangibles are amortized over their useful lives, which range from three to eight years. Amortization expense for acquisition intangibles was approximately $3.9 million and $4.2 million for 2009 and 2008, respectively, of which approximately $3.4 million and $3.6 million was recorded in cost of sales and approximately $503,000 and $580,000 was recorded in operating expenses for 2009 and 2008, respectively. The estimated amortization expense of acquisition intangibles in future years will be recorded in our Consolidated Statements of Income as follows (in thousands):
Fiscal Year Cost of Sales Acquisition related costs and amortization, net Total 2010 $ 2,701 $ 369 $ 3,070 2011 2,160 221 2,381 2012 1,126 206 1,332 2013 87 75 162 Thereafter — — — Total $ 6,074 $ 871 $ 6,945
Note 8 – Goodwill
The carrying amount of goodwill for 2008 and 2009 are as follows:
Amount(in thousands) Balance as of December 31, 2007 $ 54,111 Acquisitions/purchase accounting adjustments 10,818 Divestitures — Foreign currency translation impact (368 ) Balance as of December 31, 2008 $ 64,561 Acquisitions/purchase accounting adjustments — Divestitures — Foreign currency translation impact 218 Balance as of December 31, 2009 $ 64,779
The excess purchase price over the fair value of assets acquired is recorded as goodwill. As we have one operating segment, we allocate goodwill to one reporting unit for goodwill impairment testing. In accordance with FASB ASC 350, goodwill is tested for impairment on an annual basis, and between annual tests if indicators of potential impairment exist, using a fair-value-based approach based on the market capitalization of the reporting unit. Our annual impairment test was performed as of February 28, 2009. No impairment of goodwill has been identified during the period presented. Goodwill is deductible for tax purposes in certain jurisdictions.
The components of income before income taxes are as follows (in thousands):
Years Ended December 31, 2009 2008 2007 Domestic $ 34,953 $ 15,921 $ 31,685 Foreign 15,292 82,216 81,742 $ 50,245 $ 98,137 $ 113,427
The provision for income taxes charged to operations is as follows (in thousands):
Years Ended December 31, 2009 2008 2007 Current tax expense: U.S. federal $ 3,117 $ 14,631 $ 15,957 State 136 1,391 1,155 Foreign 13,760 18,910 9,925 Total current 17,013 34,932 27,037 Deferred tax expense (benefit): U.S. federal 9,920 (11,008 ) 628 State 387 (373 ) (156 ) Foreign (2,864 ) (1,570 ) (2,783 ) Total deferred 7,443 (12,951 ) (2,311 ) Change in valuation allowance 8,704 (8,671 ) (18,332 ) Total provision $ 33,160 $ 13,310 $ 6,394
Deferred tax liabilities (assets) at December 31, 2009 and 2008 as follows (in thousands):
December 31, 2009 2008 Capitalized software $ 5,978 $ 4,615 Depreciation and amortization 10,577 9,536 Unrealized gain on derivative instruments — 4,153 Undistributed earnings of foreign subsidiaries 9,278 10,075 Gross deferred tax liabilities 25,833 28,379 Operating loss carryforwards (57,422 ) (43,360 ) Intangible assets (44,159 ) (58,987 ) Vacation and other accruals (3,700 ) (4,890 ) Inventory valuation and warranty provisions (6,702 ) (12,665 ) Doubtful accounts and sales provisions (1,088 ) (1,512 ) Unrealized exchange loss (917 ) (1,345 ) Deferred revenue . (853 ) (71 ) Accrued rent expenses (111 ) (117 ) Accrued legal expenses (710 ) (1,466 ) Unrealized loss on derivative instruments (242 ) — 10% minority stock investment (900 ) (920 ) Stock-based compensation (4,483 ) (5,353 ) Research and development tax credit carryforward (2,054 ) — Foreign tax credit carryforward (1,775 ) — Other (657 ) (783 ) Gross deferred tax assets (125,773 ) (131,469 ) Valuation allowance 99,862 85,815 Net deferred tax liability (asset) $ (78 ) $ (17,275 )
A reconciliation of income taxes at the U.S. federal statutory income tax rate to the effective tax rate follows:
Years Ended December 31, 2009 2008 2007 U.S. federal statutory tax rate 35 % 35 % 35 % Domestic production activities — — (1 ) Foreign taxes (less) than federal statutory rate (6 ) (9 ) (14 ) Change in valuation allowance 17 (9 ) (16 ) Research and development tax credit (4 ) (2 ) (1 ) Tax exempt interest — (1 ) (1 ) State income taxes, net of federal tax benefit 1 1 1 Employee share-based compensation 7 2 2 Intercompany profit 15 (5 ) — Other 1 2 1 Effective tax rate 66 % 14 % 6 %
Certain prior year amounts in the reconciliation of income taxes at the U.S. federal statutory income tax rate to the effective tax rate have been reclassified to conform to the 2009 presentation as shown in the following tables:
2008 foreign taxes (less) than federal statutory rate as reported in prior year Form 10-K (14 ) Reclassification (a) 5 2008 foreign taxes (less) than federal statutory rate as reported in current year Form 10-K (9 ) 2008 intercompany profit as reported in prior year Form 10-K — Reclassification (a) (5 ) 2008 intercompany profit as reported in current year Form 10-K (5 )
(a) These amounts represent income taxes on intercompany profit previously included in foreign taxes (less) than the federal statutory rate and reclassified to intercompany profit for comparability to corresponding amounts reported in 2009. The reclassification did not have any impact on our total income tax expense.
For the year ended December 31, 2009, we generated a federal net operating loss of approximately $3.3 million and tax credits of approximately $3.8 million. The federal net operating loss can be carried back two years and the federal tax credits can be carried back one year.
As of December 31, 2009, eleven of our subsidiaries have available, for income tax purposes, foreign net operating loss carryforwards of an aggregate of approximately $286 million, of which $12.1 million expire during the years 2011 - - 2018 and $273.9 million of which may be carried forward indefinitely. Our tax valuation allowance relates to our ability to realize certain of these foreign net operating loss carryforwards and benefits of tax deductible goodwill in excess of book goodwill.
We maintain a manufacturing facility in Hungary. As a result of certain foreign investment incentives available under Hungarian law, the profit from our Hungarian operation was subject to a reduced income tax rate. This special tax status terminated on January 1, 2008, with the merger of our Hungary manufacturing operations with its Hungarian parent company. The merger was effective on January 1, 2008. The aggregate tax benefit of the exemption was $8.7 million lower, respectively, than if we had continued to account for share-based compensation under APB 25. Basic and diluted earnings per share for the year ended December 31, 2006 are $0.112007.
In 2003, we restructured the organization of our manufacturing operation in Hungary. The tax deductible goodwill in excess of book goodwill created by this restructuring resulted in our being required to record a gross deferred tax asset of $91.0 million. Because we did not expect to have sufficient taxable income in the relevant jurisdiction in future periods to realize the benefit of this deferred tax asset, a full valuation allowance was established. Following the approval of the merger of our Hungarian manufacturing operation with its Hungarian parent company in December 2007, we released $8.7 million and $0.11 lower,$18.3 million in 2008 and 2007, respectively, than if we had continued to account for share-based compensation under APB 25. Deferred stock-based compensation balancesof the valuation allowance previously required under APB 25 were adjusted against previously recorded common stock and additional paid-in capital balances upon adoption of SFAS 123R, as required. Had we previously recognized compensation costs as prescribed by SFAS 123, previously reported net income, basic earnings per share and diluted earnings per share would have changed to the pro forma amounts shown below (in thousands, except per share amounts):
Years Ended December 31,
2005
2004
Net income, as reported $ 61,517 $ 48,610 Stock-based compensation included in reported net income, net of related tax effects 959 — Total stock-based compensation expense determined under fair value method for all awards, net of related tax effects (13,998 ) (12,741 )
Pro-forma net income $ 48,478 $ 35,869
Earnings per share: Basic - as reported $ 0.78 $ 0.62 Basic - pro-forma $ 0.62 $ 0.46 Diluted - as reported $ 0.76 $ 0.59 Diluted - pro-forma $ 0.60 $ 0.44
Pro-forma disclosuresestablished for the excess tax deductible goodwill to reflect the tax benefit we expected to realize in future periods.
For the year 2009, we expected to recognize an additional tax benefit of $9.7 million related to these assets. Effective January 1, 2010, a new tax law in Hungary provides for an enhanced deduction for the qualified research and development expenses of NI Hungary Software and Hardware Manufacturing Kft. ("NI Hungary"). During the three months ended December 31, 2006 are2009, we obtained confirmation of the application of this new tax law for the qualified research and development expenses of NI Hungary. Based on the application of this new tax law to the qualified research and development expense of NI Hungary, we no longer expect to have sufficient future taxable income in Hungary to realize the benefits of these tax assets. As such, we recorded an income tax charge of $21.6 million during the three months ended December 31, 2009, $18.4 million of which was related to a valuation allowance on the previously recognized assets created by the restructuring and $3.2 million of which was related to tax benefits from other assets that we will no longer be able to realize as a result of this change. We do not presented becauseexpect to realize the amounts aretax benefit of the remaining assets created by the restructuring and therefore we have a full valuation allowance of $98.2 million against those assets at December 31, 2009.
We have not provided for U.S. federal income and foreign withholding taxes on approximately $267.5 million of certain non-U.S. subsidiaries’ undistributed earnings as of December 31, 2009. These earnings would become subject to taxes of approximately $85.7 million, if they were actually or deemed to be remitted to the parent company as dividends or if we should sell our stock in these subsidiaries. We intend to permanently reinvest the undistributed earnings.
We adopted the provisions of FASB ASC 740, on January 1, 2007. FASB ASC 740 clarifies the accounting for uncertainty in income taxes recognized in an entity's financial statements and prescribes a recognition threshold and measurement attribute for financial statement disclosure of tax positions taken or expected to be taken on a tax return. We recognized no material adjustment to the Consolidated Statementsliability for unrecognized income tax benefits. A reconciliation of Income.the beginning and ending amount of unrecognized tax benefit is as follows (in thousands):
2009 2008 Balance at beginning of period $ 9,364 $ 8,273 Additions based on tax positions related to the current year 2,060 1,946 Additions for tax positions of prior years 1,272 366 Reductions as a result of the lapse of the applicable statute of limitations (1,634 ) (1,221 ) Balance at end of period $ 11,062 $ 9,364
All of our unrecognized tax benefits at December 31, 2009 would affect our effective income tax rate if recognized. As of December 31, 2009, it is deemed reasonably possible that the Company will recognize tax benefits in the amount of $2.3 million in the next twelve months due to the closing of open tax years. The nature of the uncertainty relates to deductions taken on returns that have not been examined by the applicable tax authority.
We recognize interest and penalties related to income tax matters in income tax expense. During the years ended December 31, 2009 and 2008, we recognized interest expense related to uncertain tax positions of approximately $506,000 and $365,000, respectively. The tax years 2002 through 2009 remain open to examination by the major taxing jurisdictions in which we file income tax returns.
Note 10 – Stockholders’ equity and stock-based compensation
Stock option plans
Our stockholders approved the 1994 Incentive Stock Option Plan (the “1994 Plan”) on May 9, 1994. At the time of approval, 9,112,500 shares of our common stock were reserved for issuance under this plan. In 1997, an additional 7,087,500 shares of our common stock were reserved for issuance under this plan, and an additional 750,000 shares were reserved for issuance under this plan, as amended, in 2004. The 1994 Plan terminated in May 2005, except with respect to outstanding awards previously granted thereunder. Awards under the plan were either incentive stock options within the meaning of Section 422 of the Internal Revenue Code or nonqualified options. The right to purchase shares vests over a five to ten-year period, beginning on the date of grant. Vesting of ten year awards may accelerate based on the Company’s previous year’s earnings and revenue growth but shares cannot accelerate to vest over a period of less than five years. Stock options must be exercised within ten years from date of grant. Stock options were issued at the market price at the grant date. As part of the requirements of SFAS 123R, the Company isFASB ASC 718, we are required to estimate potential forfeitures of stock grants and adjust compensation cost recorded accordingly. The estimate of forfeitures will be adjusted over the requisite service period to the extent that actual forfeitures differ, or are expected to differ, from such estimates. Changes in estimated forfeitures will be recognized through a cumulative catch-up adjustment in the period of change and will also impact the amount of stock compensation expense to be recognized in future periods.
Transactions under all stock option plans are summarized as follows:Number of
shares under
option
Weighted
average
exercise
price
Outstanding at December 31, 2003 9,726,418 $ 18.07 Exercised (882,539 ) 9.60 Canceled (325,912 ) 27.66 Granted 1,262,599 29.71
Outstanding at December 31, 2004 9,780,566 $ 20.02 Exercised (1,188,614 ) 10.72 Canceled (358,444 ) 29.49 Granted 244,725 24.24
Outstanding at December 31, 2005 8,478,233 $ 21.05 Exercised (1,398,617 ) 13.16 Canceled (164,943 ) 27.32 Granted 0 0
Outstanding at December 31, 2006 6,914,673 $ 22.49
Options exercisable at December 31: 2004 6,353,236 $ 17.23 2005 5,946,139 19.10 2006 5,384,470 21.53
Number of
shares under
option
Weighted
average
fair value
Weighted average, grant date fair value of options granted during: 2004 1,262,599 $ 16.72 2005 244,725 12.85 2006 0 0
Number ofshares underoption Weightedaverageexerciseprice Outstanding at December 31, 2006 6,914,673 $ 22.49 Exercised (1,515,107 ) 15.22 Canceled (104,925 ) 27.33 Granted — — Outstanding at December 31, 2007 5,294,641 $ 24.47 Exercised (925,743 ) 17.30 Canceled (96,331 ) 26.98 Granted — — Outstanding at December 31, 2008 4,272,567 $ 25.97 Exercised (379,630 ) 15.40 Canceled (181,434 ) 26.80 Granted — — Outstanding at December 31, 2009 3,711,503 $ 26.93 Options exercisable at December 31: 2007 4,368,972 $ 24.17 2008 3,812,334 26.00 2009 3,493,574 26.94
The aggregate intrinsic value of stock options at exercise, represented in the table above, was $25.5$2.3 million, $19.1$11.0 million and $18.3$22.3 million for the years ended December 31, 2006, 20052009, 2008 and 2004,2007, respectively. Total unrecognized stock-based compensation expense related to non-vested stock options was approximately $18.1$2.5 million as of the end of 2006,December 31, 2009, related to approximately 1,530,000218,000 shares with a per share weighted average fair value of $15.93.$17.50. We anticipate this expense to be recognized over a weighted average period of approximately 4.04.3 years.Outstanding and Exercisable by Price Range
As of December 31, 2006
Options Outstanding
Options Exercisable
Range of Exercise prices
Number
outstanding
as of
12/31/2006
Weighted
average
remaining
contractual life
Weighted
average
exercise
price
Number
exercisable
as of
12/31/2006
Weighted
average
exercise price
$8.6667 -$12.2222 1,072,535 1.27 $ 10.98 1,045,669 $ 10.9677 12.3611 - 15.3055 976,976 1.54 $ 15.23 967,192 $ 15.2258 15.5555 - 21.0417 1,720,096 5.18 $ 20.64 1,223,332 $ 20.6330 21.2533 - 29.5400 839,349 6.80 $ 25.53 538,372 $ 25.5261 29.8500 - 34.3750 2,305,717 5.60 $ 31.19 1,609,905 $ 31.5078
$8.6667 - $34.3750 6,914,673 3.94 $ 22.4883 5,384,470 $ 21.5254
Outstanding and Exercisable by Price Range as of December 31, 2009 Options Outstanding Options Exercisable Range of Exercise prices Number outstanding as of 12/31/2009 Weighted average remaining contractual life Weighted average exercise price Number exercisable as of 12/31/2009 Weighted average exercise price $16.08 – $21.95 1,238,441 1.74 $ 20.69 1,188,337 $ 20.71 $22.30 – $29.85 1,257,625 3.90 $ 28.15 1,098,218 $ 28.08 $30.51 – $34.38 1,215,437 0.41 $ 32.02 1,207,019 $ 32.02 $16.08 – $34.38 3,711,503 2.04 $ 26.93 3,493,574 $ 26.94
The weighted average remaining contractual life of options exercisable as of December 31, 20062009 was 3.371.9 years. The aggregate intrinsic value of options outstanding as of December 31, 20062009 was $32.9$9.4 million. The aggregate intrinsic value of options currently exercisable as of December 31, 20062009 was $30.8$8.8 million. No options were granted in the yearyears ended December 31, 20062009, 2008 and 2007 as our incentive option plan terminated in May 2005. The fair value of options granted in 2004 and 2005 were estimated on the date of grant using the Black-Scholes option-pricing model with the following weighted-average assumptions:2005
2004
Dividend expense yield 0.2% 0.2% Expected life 5.5 years 5.5 years Expected volatility 43.3% 53.2% Risk-free interest rate 4.0% 2.7%
Restricted stock plan
Our stockholders approved theour 2005 Incentive Plan on May 10, 2005. At the time of approval, 2,700,000 shares of our common stock were reserved for issuance under this plan, as well as the number of shares which had been reserved but not issued under the 1994 Plan (our incentive stock option plan which terminated in May 2005), and any shares that returned to the 1994 Plan as a result of termination of options or repurchase of shares issued under such plan. The 2005 Plan, administered by the Compensation Committee of the Board of Directors, provides for granting of incentive awards in the form of restricted stock and restricted stock units (“RSUs”) to directors, executive officers and employees of the Company and its subsidiaries. Awards vest over a three, five or ten-year period, beginning on the date of grant. Vesting of ten year awards may accelerate based on the Company’s previous year’s earnings and growth but ten year awards cannot accelerate to vest over a period of less than five years. Shares available for grant at December 31, 20062009 were 3,804,106.2,089,302. As part of the requirements of SFAS 123R, the Company isFASB ASC 718, we are required to estimate potential forfeitures of restricted stock unitsRSUs and adjust compensation cost recorded accordingly. The estimate of forfeitures will be adjusted over the requisite service period to the extent that actual forfeitures differ, or are expected to differ, from such estimates. Changes in estimated forfeitures will be recognized through a cumulative catch-up adjustment in the period of change and will also impact the amount of stock compensation expense to be recognized in future periods.
Transactions under the restricted stock plan2005 Plan are summarized as follows:RSUs
Number of RSUs
Weighted Average Grant Price
Balance at January 1, 2005 0 $ 0.00 Granted 813,305 $ 22.24 Earned 0 $ 0.00 Canceled (15,000 ) $ 22.12
Balance at December 31, 2005 798,305 $ 22.24 Granted 693,805 $ 32.21 Earned (113,794 ) $ 31.67 Canceled (53,383 ) $ 25.93
Balance at December 31, 2006 1,324,933 $ 26.77
RSUs Number of RSUs Weighted Average Grant Price Balance at January 1, 2007 1,324,933 $ 26.77 Granted 801,780 $ 27.90 Earned (209,303 ) $ 27.85 Canceled (75,776 ) $ 27.64 Balance at December 31, 2007 1,841,634 $ 26.86 Granted 763,182 $ 28.51 Earned (320,251 ) $ 29.42 Canceled (119,337 ) $ 28.19 Balance at December 31, 2008 2,165,228 $ 26.99 Granted 604,083 $ 21.80 Earned (407,156 ) $ 22.04 Canceled (57,721 ) $ 27.88 Balance at December 31, 2009 2,304,434 $ 26.48
Total unrecognized stock-based compensation expense related to non-vested restricted stock unitsRSU’s was approximately $32.6$57.1 million as of the end of 2006,December 31, 2009, related to 1,324,9332,304,434 shares with a per share weighted average fair value of $27.24.$26.48. We anticipate this expense to be recognized over a weighted average period of approximately 77.3 years.
Employee stock purchase plan
Our employee stock purchase plan permits substantially all domestic employees and employees of designated subsidiaries to acquire our common stock at a purchase price of 85% of the lower of the market price at the beginning or the end of the participationpurchase period. On December 21, 2005, our Compensation Committee amended theThe plan has quarterly purchase periods to be quarterly beginning on November 1, February 1, May 1, and AugustNovember 1 of each year. The initial period commencedAt our annual shareholders meeting held on April 1, 2006 and ended on July 31, 2006.May 7, 2007, our shareholders approved an additional 3 million shares of common stock to be reserved for issuance under this plan. Employees may designate up to 15% of their compensation for the purchase of common stock.stock under this plan. Common stock reserved for future employee purchases aggregated 823,3091,755,071 shares at December 31, 2006.2009. Shares issued under this plan were 539,541838,536 in the year ended December 31, 2006.2009. The weighted average fair value of the employees’ purchase rights was $22.34$19.05 per share and was estimated using the Black-Scholes model with the following assumptions:2006
2005
2004
Dividend expense yield 0.2% 0.2% 0.2% Expected life 3 months 6 months 6 months Expected volatility 29% 29% 35% Risk-free interest rate 4.5% 3.2% 1.0%
2009 2008 2007 Dividend expense yield 0.5% 0.3% 0.3% Expected life 3 months 3 months 3 months Expected volatility 45% 26% 23% Risk-free interest rate 0.8% 3.8% 5.0%
Weighted average, grant date fair value of purchase rights granted under the Employee Stock Purchase Plan:Number of shares
Weighted average fair value
2004 380,211 $ 7.73 2005 467,932 6.08 2006 539,541 6.62
Plan are as follows:
Numberof shares Weightedaveragefair value 2007 549,719 $ 6.19 2008 679,983 5.86 2009 838,536 5.75
Stock-based compensation included in total cost of sales and operating expenses for the years ended December 31, 2009, 2008 and 2007 are summarized as follows (in thousands):
2009 2008 2007 Stock-based compensation Total cost of sales $ 1,284 $ 1,063 $ 911 Sales and marketing 8,774 8,479 7,322 Research and development 7,236 7,121 6,435 General and administrative 3,005 3,084 2,866 Provision for income taxes (3,765 ) (4,601 ) (3,839 ) Total $ 16,534 $ 15,146 $ 13,695
Authorized Preferred Stock and Preferred Stock Purchase Rights Plan
We have 5,000,000 authorized shares of preferred stock. On January 21, 2004, our Board of Directors designated 750,000 of these shares as Series A Participating Preferred Stock in conjunction with its adoption of a Preferred Stock Rights Agreement (the “Rights Agreement”) and declaration of a dividend of one preferred share purchase right (a “Right”) for each share of common stock outstanding held as of May 10, 2004 or issued thereafter. Each Right will entitle its holder to purchase one one-thousandth of a share of National Instruments’ Series A Participating Preferred Stock at an exercise price of $200, subject to adjustment, under certain circumstances. The Rights Agreement was not adopted in response to any effort to acquire control of National Instruments.
The Rights only become exercisable in certain limited circumstances following the tenth day after a person or group announces acquisitions of or tender offers for 20% or more of our common stock. In addition, if an acquirer (subject to certain exclusions for certain current stockholders of National Instruments, an “Acquiring Person”) obtains 20% or more of our common stock, then each Right (other than the Rights owned by an Acquiring Person or its affiliates) will entitle the holder to purchase, for the exercise price, shares of our common stock having a value equal to two times the exercise price. Under certain circumstances, our Board of Directors may redeem the Rights, in whole, but not in part, at a purchase price of $0.01 per Right. The Rights have no voting privileges and are attached to and automatically traded with our common stock until the occurrence of specified trigger events. The Rights will expire on the earlier of May 10, 2014 or the exchange or redemption of the Rights. Comprehensive income
Our comprehensive income is comprised of net income, foreign currency translation and unrealized gains and losses on forward and option contracts and securities available for sale. Comprehensive income for 2006, 2005 and 2004 was $76.9 million, $57.2 million and $57.7 million, respectively.
Recently issued accounting pronouncements
In July 2006, the Financial Accounting Standards Board (“FASB”) issued FASB Interpretation (“FIN”) 48,Accounting for Uncertainty in Income Taxes – an interpretation of Statement of Financial Accounting Standards (“SFAS”) 109. This interpretation clarifies the accounting for uncertainty in income taxes recognized in an entity’s financial statements in accordance with SFAS 109,Accounting for Income Taxes. It prescribes a recognition threshold and measurement attribute for financial statement disclosure of tax positions taken or expected to be taken on a tax return. This interpretation is effective for fiscal years beginning after December 15, 2006. We adopted FIN 48 on January 1, 2007 as required. The cumulative effect of adopting FIN 48 was recorded in retained earnings upon adoption. The adoption of FIN 48 did not have a significant impact on our financial position or results of operations.
In September 2006, the Securities and Exchange Commission (“SEC”) issued Staff Accounting Bulletin (“SAB”) 108 regarding the process of quantifying financial statement misstatements. SAB 108 states that registrants should use both a balance sheet approach and an income statement approach when quantifying and evaluating the materiality of a misstatement. The interpretations in SAB 108 contain guidance on correcting errors under the dual approach as well as provide transition guidance for correcting errors. This interpretation does not change the requirements within SFAS 154,Accounting Changes and Error Corrections – a replacement of APB 20 and FASB Statement 3, for the correction of an error on financial statements. SAB 108 is effective for annual financial statements covering the first fiscal year ending after November 15, 2006. We adopted this interpretation on December 31, 2006. The adoption of SAB 108 did not have a significant effect on our consolidated financial statements.
In September 2006, the FASB issued SFAS 157,Fair Value Measurements. This standard defines fair value, establishes a framework for measuring fair value in accounting principles generally accepted in the United States of America, and expands disclosure about fair value measurements. This pronouncement applies under other accounting standards that require or permit fair value measurements. Accordingly, this statement does not require any new fair value measurement. This statement is effective for fiscal years beginning after November 15, 2007, and interim periods within those fiscal years. We will be required to adopt SFAS 157 in the first quarter of fiscal year 2008. We are currently evaluating the requirements of SFAS 157 and have not yet determined the impact on our consolidated financial statements.
In March 2006, the Emerging Issues Task Force (“EITF”) reached a consensus on EITF Issue 06-3,How Taxes Collected from Customers and Remitted to Governmental Authorities Should Be Presented in the Income Statement (that is, Gross versus Net Presentation). Taxes within the scope of EITF Issue 06-3 include any taxes assessed by a governmental authority that are directly imposed on a revenue-producing transaction between a seller and a customer and may include, but are not limited to, sales taxes, use taxes, value-added taxes, and some excise taxes. The EITF concluded that the presentation of these taxes on either a gross (included in revenues and costs) or a net (excluded from revenue) basis is an accounting policy decision that should be disclosed. For any such taxes that are reported on a gross basis, a company should disclose the amounts of those taxes in interim and annual financial statements. Our policy is to exclude all such taxes from revenue. The provisions of EITF 06-3 are effective for interim and annual reporting periods beginning after December 15, 2006. The adoption of EITF 06-3 will not have any effect on our consolidated financial statements.
Note 2: Short-term investments
Short-term investments at December 31, 2006 and 2005, consisting of corporate, state and municipal securities, were acquired at an aggregate cost of $150.2 million and $119.8 million, respectively. The contractual maturities of these securities, which are classified as available-for-sale and carried at fair value, are as follows (in thousands):
December 31,
2006
2005
Less than 90 days $ 73,787 $ 61,855 90 days to one year 31,309 42,222 One year through two years 38,559 11,877 Two years or more 6,535 3,892
$ 150,190 $ 119,846
Note 3: Inventories
Inventories, net consist of the following (in thousands):
December 31,
2006
2005
Raw materials $ 38,270 $ 28,497 Work-in-process 4,321 4,634 Finished goods 34,547 29,696
$ 77,138 $ 62,827
Note 4: Property and equipment
Property and equipment consist of the following (in thousands):
December 31,
2006
2005
Land $ 7,165 $ 7,085 Buildings 125,228 124,428 Furniture and equipment 110,710 91,073
243,103 222,586 Accumulated depreciation (97,678 ) (78,256 )
$ 145,425 $ 144,330
Depreciation expense for the years ended December 31, 2006, 2005 and 2004, was $20.2 million, $17.8 million and $17.3 million, respectively.
Note 5: Intangibles
Intangibles at December 31, 2006 and 2005 are as follows:
2006
2005
Gross Carrying Amount
Accumulated Amortization
Net Carrying Amount
Gross Carrying Amount
Accumulated Amortization
Net Carrying Amount
Capitalized software development costs $ 57,571 $ (41,791 ) $ 15,780 $ 50,201 $ (32,651 ) $ 17,550 Acquired technology 20,814 (9,734 ) 11,080 20,257 (6,296 ) 13,961 Patents 12,928 (3,076 ) 9,852 11,647 (2,445 ) 9,202 Other 6,452 (3,099 ) 3,353 4,826 (1,937 ) 2,889
$ 97,765 $ (57,700 ) $ 40,065 $ 86,931 $ (43,329 ) $ 43,602
Software development costs capitalized during 2006, 2005 and 2004 were $7.4 million, $13.4 million and $5.0 million, respectively, and related amortization was $9.1 million, $7.2 million and $6.6 million, respectively. Amortization of capitalized software development costs is computed on an individual product basis for those products available for market and is recognized based on the product’s estimated economic life, generally three years. Patents are amortized using the straight-line method over their estimated period of benefit, generally ten to seventeen years. Total intangible assets amortization expenses were $13.9 million, $10.7 million and $8.3 million for the years ended December 31, 2006, 2005 and 2004, respectively.
Capitalized software development costs, acquired technology, patents and other have weighted-average useful lives of 2.1 years, 4.1 years, 7.7 years and 3.7 years, respectively, as of the end of December 31, 2006. The estimated future amortization expense related to intangible assets as of December 31, 2006 is as follows:
Amount (in thousands)
2007 $ 13,044 2008 10,219 2009 5,046 2010 2,477 2011 1,569 Thereafter 7,710
$ 40,065
We established a valuation reserve in 2004 for the estimated total impairment of our $2.5 million cost-method investment in a start-up company. This impairment was based on our lack of expected recovery of our investment based on the start-up company’s lack of profitability.
Note 6: Goodwill
The carrying amount of goodwill for 2005 and 2006 are as follows:
Amount (in thousands)
Balance as of December 31, 2004 $ 13,356 Acquisitions/purchase accounting adjustments 39,177 Divestitures —
Balance as of December 31, 2005 52,533 Acquisitions/purchase accounting adjustments — Divestitures — Foreign currency translation impact 810
Balance as of December 31, 2006 $ 53,343
The excess purchase price over the fair value of assets acquired is recorded as goodwill. In accordance with SFAS 142,Goodwill and Other Intangible Assets, goodwill is tested for impairment on an annual basis, and between annual tests if indicators of potential impairment exist, using a fair-value-based approach. Our annual impairment test was performed on April 6, 2006. No impairment of goodwill was identified during any of the periods presented.
Note 7: Income taxes
The components of income before income taxes are as follows (in thousands):
Years Ended December 31,
2006
2005
2004
Domestic $ 40,681 $ 40,460 $ 37,786 Foreign 54,621 40,220 27,027
$ 95,302 $ 80,680 $ 64,813
The provision for income taxes charged to operations is as follows (in thousands):
Years Ended December 31,
2006
2005
2004
Current tax expense: U.S. federal $ 17,966 $ 11,022 $ 10,594 State 901 1,029 1,106 Foreign 5,190 3,725 3,300
Total current 24,057 15,776 15,000
Deferred tax expense (benefit): U.S. federal (1,233 ) 2,396 1,041 State (90 ) (102 ) 121 Foreign (140 ) 1,093 41
Total deferred (1,463 ) 3,387 1,203
Total provision $ 22,594 $ 19,163 $ 16,203
Deferred tax liabilities (assets) at December 31, 2006 and 2005 as follows (in thousands):
December 31,
2006
2005
Capitalized software $ 5,392 $ 6,288 Unrealized gain on derivative instruments — 86 Depreciation and amortization 9,071 8,598 Unrealized exchange gain 2 1,238 Undistributed earnings of foreign subsidiaries 10,313 4,410
Gross deferred tax liabilities 24,778 20,620
Operating loss carryforwards (34,154 ) (22,672 ) Intangibles (85,684 ) (71,125 ) Vacation and other accruals (3,783 ) (2,946 ) Inventory valuation and warranty provisions (6,666 ) (9,043 ) Doubtful accounts and sales provisions (1,328 ) (1,545 ) Intercompany profit (3,242 ) (2,442 ) Deferred revenue (2,613 ) — Accrued rent expenses (17 ) (17 ) Accrued legal expenses (1,450 ) (12 ) Unrealized loss on derivative instruments (149 ) — 10% minority stock investment (906 ) (911 ) Stock-based compensation (1,954 ) (563 ) Other (691 ) (629 )
Gross deferred tax assets (142,637 ) (111,905 )
Valuation allowance 117,768 91,534
Net deferred tax liability (asset) $ (91 ) $ 249
A reconciliation of income taxes at the U.S. federal statutory income tax rate to the effective tax rate follows:
Years Ended December 31,
2006
2005
2004
U.S. federal statutory tax rate 35 % 35 % 35 % Foreign sales corporation/ETI benefit (1 ) (2 ) (3 ) Domestic production activities (1 ) (1 ) — Foreign taxes more (less) than federal statutory rate (11 ) (7 ) (6 ) Change in valuation allowance — (1 ) — Research and development tax credit (1 ) (1 ) (1 ) Tax exempt interest (1 ) (1 ) (1 ) State income taxes, net of federal tax benefit 1 1 1 Employee share-based compensation 3 — — Other — 1 —
Effective tax rate 24 % 24 % 25 %
As of December 31, 2006, thirteen of our subsidiaries have available, for income tax purposes, foreign net operating loss carryforwards of an aggregate of approximately $214.4 million, of which $8.5 million expire during the years 2008 — 2013 and $205.9 million of which may be carried forward indefinitely. Our tax valuation allowance relates to the realizability of certain of these foreign net operating loss carryforwards and benefits of tax deductible goodwill in excess of book goodwill.
We maintain a manufacturing facility in Hungary. As a result of certain foreign investment incentives available under Hungarian law, the profit from our Hungarian operation is currently subject to a reduced income tax rate. Based on our capital investment in Hungary and current exemption limits which apply to this and any capital investments made through December 31, 2005, we currently expect this special tax status will terminate on or before December 31, 2008. The aggregate tax benefit of the exemption was $5.4 million and $3.4 million for the years ended December 31, 2006 and 2005, respectively.
In 2003, we restructured the organization of our manufacturing operation in Hungary. The tax deductible goodwill in excess of book goodwill created by this restructuring resulted in our being required to record a gross deferred tax asset of $91.0 million. The amortization of this excess tax deductible goodwill resulted in a $32.1 million and $20.1 million deferred tax asset for the associated net operating loss for the years ended December 31, 2006 and 2005, respectively. As of December 31, 2006 and 2005, the gross deferred tax asset related to the excess tax goodwill was $85.7 million and $71.1 million, respectively. Because we do not expect to have significant taxable income in the relevant jurisdiction in future periods to realize the benefit of these deferred tax assets, a valuation allowance for the entire amount of these deferred tax assets has been established.
We have not provided for U.S. federal income and foreign withholding taxes on approximately $111.8 million of certain non-U.S. subsidiaries’ undistributed earnings as of December 31, 2006. These earnings would become subject to taxes of approximately $36.5 million, if they were actually or deemed to be remitted to the parent company as dividends or if we should sell our stock in these subsidiaries. We currently intend to reinvest indefinitely these undistributed earnings.
Note 8: Stockholders’ equity
Stock repurchases and retirements In
Since 1998, our Board of Directors approved theand we maintained various stock repurchase and retirement of shares of common stock to reduce the dilutive effect of our stock plans.programs. Pursuant to the 1998 repurchase programthese plans we have repurchasedhad purchased and retired a total of 1,402,7257,354,966 shares for approximately $23.1$184.9 million from 1998 through December 31, 2007. During 2008, we purchased an additional 4,110,042 share for approximately $103.6 million. In 2002,At December 31, 2008, there were 723,092 shares available for repurchase under the plan approved in April 2008. On January 23, 2009, our Board of Directors approved a new share repurchase and retirement plan which replacedthat increased the 1998 plan. Underaggregate number of shares of common stock we are authorized to purchase from 591,324 to 3.0 million. During 2009, we purchased an additional 1,443,441 shares for approximately $34.6 million. At December 31, 2009, there were 1,688,327 shares available for repurchase under the plan approved in 2002, weJanuary 2009. Our share repurchase plan does not have authorization to repurchase up to 6,222,106 shares of National Instruments stock. This plan has noan expiration date. Pursuant to our repurchase program, we have repurchased and retired a total of 3,222,106 shares for approximately $82.0 million.
Note 9:11 – Employee retirement plan
We have a defined contribution retirement plan pursuant to Section 401(k) of the Internal Revenue Code. Substantially all domestic employees with at least thirty30 days of continuous service are eligible to participate and may contribute up to 15% of their compensation. The Board of Directors has elected to make matching contributions equal to 50% of employee contributions, which may be applied to a maximum of 6% of each participant’s compensation. Employees are eligible for our matching contributions after one year of continuous service. Company contributions vest immediately. Our policy prohibits participants from direct investment in shares of our common stock within the plan. Company contributions charged to expense were $3.0$3.9 million, $2.6$3.7 million and $2.4$3.3 million in 2006, 20052009, 2008 and 2004,2007, respectively.
Fair value of financial instrumentsIn accordance with FASB ASC 280, Segment Reporting (FASB ASC 280), we determine operating segments using the management approach. The estimated fair value amounts disclosed below have been determined using available market informationmanagement approach designates the internal organization that is used by management for making operating decisions and valuation methodologies described below. For certainassessing performance as the source of our financial instruments, including cashoperating segments. It also requires disclosures about products and cash equivalents, accounts receivable, accounts payableservices, geographic areas and accrued liabilities,major customers.
We have defined our operating segment based on geographic regions. We sell our products in three geographic regions. Our sales to these regions share similar economic characteristics, similar product mix, similar customers, and similar distribution methods. Accordingly, we have elected to aggregate these three geographic regions into a single operating segment. Revenue from the carrying amount approximates fair value due to the short-term maturity of these instruments. The estimated fair values of the other assets (liabilities)sale of our remaining financial instruments at December 31, 2006products which are similar in nature and 2005software maintenance are reflected as total net sales in our Consolidated Statements of Income.
Total net sales, operating income, interest income and long-lived assets, classified by the major geographic areas in which we operate, are as follows (in thousands):December 31,
2006
2005
Carrying
Amount
Fair
Value
Carrying
Amount
Fair
Value
Short-term investments $ 150,190 $ 150,190 $ 119,846 $ 119,846 Other assets/liabilities: Forward contracts (1,043 ) (1,043 ) 523 523
The fair values of short-term investments
Years Ended December 31, 2009 2008 2007 Net sales: Americas: Unaffiliated customer sales $ 292,999 $ 355,878 $ 331,482 Geographic transfers 86,145 132,563 115,709 379,144 488,441 447,191 Europe: Unaffiliated customer sales 210,188 267,373 230,940 Geographic transfers 189,076 204,282 159,992 399,264 471,655 390,932 Asia Pacific: Unaffiliated customer sales 173,407 197,286 177,956 Eliminations (275,221 ) (336,845 ) (275,701 ) $ 676,594 $ 820,537 $ 740,378
Years Ended December 31, 2009 2008 2007 Operating income: Americas $ 46,816 $ 71,467 $ 76,292 Europe 87,250 105,748 92,469 Asia Pacific 45,439 61,642 59,845 Unallocated: Research and development expenses (132,974 ) (143,140 ) (126,515 ) $ 46,531 $ 95,717 $ 102,091
Years Ended December 31, 2009 2008 2007 Interest income: Americas $ 803 $ 2,603 $ 5,138 Europe 727 3,291 4,485 Asia Pacific 99 102 199 $ 1,629 $ 5,996 $ 9,822
December 31, 2009 2008 Long-lived assets: Americas $ 100,489 $ 107,701 Europe 36,555 39,280 Asia Pacific 16,221 7,496 $ 153,265 $ 154,477
Total sales outside the United States for 2009, 2008 and foreign currency forward contracts2007 were estimated based upon quotes from brokers as of the applicable balance sheet date.$412.7 million, $499.3 million and $437.0 million, respectively.
Note 11: Derivative instruments13 – Commitments, contingencies and hedging activitiesleases
We have operations in 40 countries. Approximately 52% of our revenues are generated outsidecommitments under non-cancelable operating leases primarily for office facilities throughout the Americas. Our activities exposeworld. Certain leases require us to a varietypay property taxes, insurance and routine maintenance, and include escalation clauses. Future minimum lease payments as of market risks, includingDecember 31, 2009, for each of the effects of changes in foreign-currency exchange rates. These financial risksnext five years are monitored and managed by us as an integral part of our overall risk management program. We maintain a foreign-currency risk management strategy that uses derivative instruments (foreign currency forward and purchased options contracts) to protect our earnings and cash flows from fluctuations caused by the volatility in currency exchange rates. Movements in foreign-currency exchange rates pose a risk to our operations and competitive position, since exchange rate changes may affect our profitability and cash flow, and the business or pricing strategies of our non-U.S. based competitors.
Foreign currency fair value and cash flow hedges
The vast majority of our foreign sales are denominated in the customers’ local currency. We purchase foreign currency forward and purchased options contracts as hedges of forecasted sales that are denominated in foreign currencies and as hedges of foreign currency denominated receivables. These contracts are entered into to protect against the risk that the eventual dollar-net-cash inflows resulting from such sales or firm commitments will be adversely affected by changes in exchange rates.
We held forward contracts with notional amounts totaling $19.6follows (in thousands):
2010 $ 14,415 2011 9,898 2012 6,982 2013 4,611 2014 3,665 Thereafter 12,130 $ 51,701
Rent expense under operating leases was approximately $12.3 million, $11.7 million and $24.1$10.2 million at December 31, 2006 and 2005, respectively, that were designated as foreign currency fair value hedges of our foreign denominated receivables. The fair value of these contracts, which are for 90-day periods, is a liability of $617,000 and a receivable of $278,000 at December 31, 2006 and 2005, respectively. We recorded net losses of $1.0 million, net gains of $2.2 million and net losses of $2.6 million for fair value hedges for the years ended December 31, 2006, 20052009, 2008 and 2004, respectively, which was recorded2007, respectively.
As of December 31, 2009, we have non-cancelable purchase commitments with various suppliers of customized inventory and inventory components totaling approximately $6.5 million over the next twelve months.
As of December 31, 2009, we have outstanding guarantees for payment of customs and foreign grants totaling approximately $5.2 million.
Note 14 – Litigation
We filed a patent infringement action on January 25, 2001, in “Foreign Exchange Gain (Loss).” We hedge up to 90%the U.S. District Court, Eastern District of Texas (Marshall Division) claiming that The MathWorks, Inc. (“MathWorks”) infringed certain of our outstanding foreign denominated receivables. We held forward contracts withU.S. patents. On January 30, 2003, a notionaljury found infringement by MathWorks of three of the patents involved and awarded us specified damages. On September 23, 2003, the District Court entered final judgment in favor of us and entered an injunction against MathWorks’ sale of its Simulink and related products and stayed the injunction pending appeal. Upon appeal, the judgment and the injunction were affirmed by the U.S. Court of Appeals for the Federal Circuit (September 3, 2004). Subsequently the stay of injunction was lifted by the District Court. In November 2004, the final judgment amount of $26.6$7.4 million which had been held in escrow pending appeal was released to us.
An action was filed by MathWorks against us on September 22, 2004, in the U.S. District Court, Eastern District of Texas (Marshall Division), claiming that on that day MathWorks had released modified versions of its Simulink and $7.1related products, and seeking a declaratory judgment that the modified products do not infringe the three patents adjudged infringed in the District Court's decision of September 23, 2003 (and affirmed by the Court of Appeals on September 3, 2004). On November 2, 2004, MathWorks served the complaint on us. We filed an answer to MathWorks’ declaratory judgment complaint, denying MathWorks’ claims of non-infringement and alleging our own affirmative defenses. On January 5, 2005, the Court denied a contempt motion by us to enjoin the modified Simulink products under the injunction in effect from the first case. On January 7, 2005, we amended our answer to include counterclaims that MathWorks’ modified products are infringing three of our patents, and requested unspecified damages and an injunction. MathWorks filed its reply to our counterclaims on February 7, 2005, denying the counterclaims and alleging affirmative defenses. On March 2, 2005, we filed a notice of appeal regarding the Court's denial of the contempt motion. On March 15, 2005, the Court stayed MathWorks’ declaratory judgment action, pending a decision on the appeal by the Court of Appeals for the Federal Circuit. On February 9, 2006, the Court of Appeals for the Federal Circuit affirmed the District Court’s January 2005 order. On November 22, 2006, the District Court lifted the stay. The case schedule has yet to be set in this action. During the fourth quarter of 2004, we accrued $4 million at December 31, 2006 and 2005, respectively, that were designated as foreign currency cash flow hedges related to our probable loss from this contingency, which consists entirely of anticipated sales transactions.patent defense costs that are probable of being incurred. In the fourth quarter of 2006, we accrued an additional $600,000 related to this contingency. During the third quarter of 2009, we reduced the accrual by $2 million to reflect a decrease in the estimated costs that are probable of being incurred in this action. To date, we have charged a cumulative total of $623,000 against this accrual. At December 31, 2009, the remaining accrual was $2 million.
On February 1, 2008, we acquired all of the outstanding shares of microLEX Systems ApS, (“microLEX”) a premier provider of virtual instrumentation-based video, audio and mixed-signal test solutions. This acquisition was accounted for as a business combination. The purchase price of the acquisition, which included legal and accounting fees, was $17.8 million in cash. The allocation of the purchase price was determined using the fair value of these contracts, whichassets and liabilities acquired as of February 1, 2008. We funded the purchase price from existing cash balances. Our consolidated financial statements include the operating results from the date of acquisition. Pro-forma results or operations have not been presented because the effects of those operations were not material. The following table summarizes the allocation of the purchase price of microLEX (in thousands):
Goodwill $ 10,818 Acquired core technology 5,201 Non-competition agreements 159 Trademarks 119 Customer relationships 354 Current assets acquired 3,057 Long-term assets acquired 20 Current liabilities assumed (486 ) Deferred tax liabilities (1,458 ) Total assets acquired $ 17,784
Goodwill is not deductible for tax purposes. Existing technology, non-competition agreements, trademarks, and customer relationships have useful lives of 5 years, 3 years, 3 years, and 5 years, respectively, from the date of acquisition. These assets are not deductible for terms uptax purposes.
Note 16 – Quarterly results (unaudited)
The following quarterly results have been derived from unaudited consolidated financial statements that, in the opinion of management, reflect all adjustments (consisting only of normal recurring adjustments) necessary for a fair presentation of such quarterly information. The operating results for any quarter are not necessarily indicative of the results to twelve months, is a liabilitybe expected for any future period. The unaudited quarterly financial data for each of $427,000 and a receivable of $245,000 at December 31, 2006 and 2005, respectively, and a net unrealized deferred loss of $427,000 and a net unrealized deferred gain of $245,000 at December 31, 2006 and 2005, respectively, was recordedthe eight quarters in “Accumulated Other Comprehensive Income.” We hedge up to 100% of anticipated foreign currency denominated sales transactions for up to 40 months. We recorded net losses of $1.0 million and net gains of $105,000 and net losses of $5.8 million for cash flow hedges for the two years ended December 31, 2006, 2005 and 2004, respectively, which was included in “Net Sales.” As of December 31, 2006, $427,000 of deferred losses on cash flow hedges recorded in “Accumulated Other Comprehensive Income” are expected to be reclassified to earnings during the next twelve months. The actual foreign sales expected to occur over the next twelve months will necessitate the reclassifying to earnings of these derivative gains.
Hedge effectiveness of a foreign currency option contract designated as a cash flow hedge is measured by comparing the hedging instrument’s cumulative change in fair value from inception to maturity to the forecasted transaction’s terminal value. No amounts were excluded from the assessment of hedge effectiveness nor were there any amounts of ineffectiveness recorded in the consolidated statements of income for the years ended December 31, 2006 and 2005.
Note 12: Segment information
In accordance with SFAS 131,Disclosures about Segments of an Enterprise and Related Information, we determine operating segments using the management approach. The management approach designates the internal organization that is used by management for making operating decisions and assessing performance as the source of our operating segments. It also requires disclosures about products and services, geographic areas and major customers.
While we sell our products to many different markets, management has chosen to organize the Company by geographic areas, and as a result has determined that we have one operating segment. Substantially all of the interest income, depreciation and amortization is recorded in the Americas. Net sales, operating income and identifiable assets, classified by the major geographic areas in which we operate,2009 are as follows (in thousands)thousands, except per share data):
Years Ended December 31,
2006
2005
2004
Net sales: Americas: Unaffiliated customer sales $ 317,780 $ 275,524 $ 243,651 Geographic transfers 125,096 87,072 84,520
442,876 362,596 328,171
Europe: Unaffiliated customer sales 193,364 171,499 164,895 Geographic transfers 159,369 125,650 99,958
352,733 297,149 264,853
Asia Pacific: Unaffiliated customer sales 149,263 124,818 105,542
Eliminations (284,465 ) (212,722 ) (184,478 )
$ 660,407 $ 571,841 $ 514,088
Years Ended December 31,
2006
2005
2004
Operating income: Americas $ 67,644 $ 63,267 $ 53,472 Europe 78,402 61,790 55,705 Asia Pacific 54,771 40,996 38,211 Unallocated: Research and development expenses (113,095 ) (87,841 ) (84,692 )
$ 87,722 $ 78,212 $ 62,696
December 31,
2006
2005
Identifiable assets: Americas $ 476,027 $ 436,170 Europe 188,388 129,420 Asia Pacific 56,805 42,746
$ 721,220 $ 608,336
Total sales outside
Three Months Ended Mar. 31,2009 Jun. 30,2009 Sep. 30,2009 Dec. 31,2009 Net sales $ 157,799 $ 152,163 $ 165,035 $ 201,597 Gross profit 116,916 111,677 123,136 154,981 Operating income (2,479 ) 2,341 10,688 35,981 Net income 358 4,430 9,931 2,366 Basic earnings per share $ 0.00 $ 0.06 $ 0.13 $ 0.03 Weighted average shares outstanding-basic 77,277 77,556 77,653 77,589 Diluted earnings per share $ 0.00 $ 0.06 $ 0.13 $ 0.03 Weighted average shares outstanding-diluted 77,436 77,824 78,103 78,325 Dividends declared per share $ 0.12 $ 0.12 $ 0.12 $ 0.12
Three Months Ended Mar. 31,2008 Jun. 30,2008 Sep. 30,2008 Dec. 31,2008 Net sales $ 192,918 $ 210,474 $ 215,038 $ 202,107 Gross profit 143,849 157,034 160,531 152,014 Operating income 18,065 27,834 27,946 21,872 Net income 17,616 24,734 23,159 19,318 Basic earnings per share $ 0.22 $ 0.32 $ 0.29 $ 0.25 Weighted average shares outstanding-basic 78,840 78,484 78,834 78,110 Diluted earnings per share $ 0.22 $ 0.31 $ 0.29 $ 0.25 Weighted average shares outstanding-diluted 79,825 79,549 79,841 78,522 Dividends declared per share $ 0.11 $ 0.11 $ 0.11 $ 0.11
Note 17 – Subsequent events
In accordance with FASB ASC 855, Subsequent Events (FASB ASC 855), we have evaluated subsequent events through February 17, 2010, the United States for 2006, 2005 and 2004date the financial statements were $373.7 million, $323.9 million and $293.3 million, respectively.issued.
On January 22, 2010, our Board of Directors declared a quarterly cash dividend of $0.13 per common share, payable March 1, 2010, to shareholders of record on February 8, 2010.
From January 29, 2010 to February 12, 2010, we have repurchased 683,832 shares of our common stock at an average price of $29.97 under our share repurchase plan. The maximum number of shares that may yet be purchased under our plan is 1,004,495. Our purchase plan does not have an expiration date.
Note 13: Commitments, contingencies and leases
We have commitments under non-cancelable operating leases primarily for office facilities. Certain leases require us to pay property taxes, insurance and routine maintenance, and include escalation clauses. Future minimum lease payments as of December 31, 2006, for each of the next five years are as follows (in thousands):
2007 $ 7,241 2008 5,682 2009 4,883 2010 3,103 2011 1,983 Thereafter 799
$ 23,691
Rent expense under operating leases was approximately $8.7 million, $7.8 million and $6.5 million for the years ended December 31, 2006, 2005 and 2004, respectively.
As of December 31, 2006, we have non-cancelable purchase commitments with various suppliers of customized inventory and inventory components totaling approximately $7.0 million over the next twelve months.
As of December 31, 2006, we have outstanding guarantees for payment of customs and foreign grants totaling approximately $3.5 million.
Note 14: ��Litigation
We filed a patent infringement action on January 25, 2001 in the U.S. District Court, Eastern District of Texas (Marshall Division) claiming that The MathWorks, Inc. (“MathWorks”) infringed certain of our U.S. patents. On January 30, 2003, a jury found infringement by MathWorks of three of the patents involved and awarded us specified damages. On June 23, 2003, the District Court entered final judgment in favor of us and entered an injunction against MathWorks’ sale of its Simulink and related products and stayed the injunction pending appeal. Upon appeal, the judgment and the injunction were affirmed by the U.S. Court of Appeals for the Federal Circuit (September 3, 2004). Subsequently the stay of injunction was lifted by the District Court. In November 2004, the final judgment amount of $7.4 million which had been held in escrow pending appeal was released to us.
An action was filed by MathWorks against us on September 22, 2004, in the U.S. District Court, Eastern District of Texas (Marshall Division), claiming that on that day MathWorks had released modified versions of its Simulink and related products, and seeking a declaratory judgment that the modified products do not infringe the three patents adjudged infringed in the District Court’s decision of June 23, 2003, (and affirmed by the Court of Appeals on September 3, 2004). On November 2, 2004, MathWorks served the complaint on us. We filed an answer to MathWorks’ declaratory judgment complaint, denying MathWorks’ claims of non-infringement and alleging our own affirmative defenses. On January 5, 2005, the Court denied a contempt motion by us to enjoin the modified Simulink products under the injunction in effect from the first case. On January 7, 2005, we amended our answer to include counterclaims that MathWorks’ modified products are infringing three of our patents, and requested unspecified damages and an injunction. MathWorks filed its reply to our counterclaims on February 7, 2005, denying the counterclaims and alleging affirmative defenses. On March 2, 2005, we filed a notice of appeal regarding the Court’s denial of the contempt motion. On March 15, 2005, the Court stayed MathWorks’ declaratory judgment action, pending a decision on the appeal by the Court of Appeals for the Federal Circuit. On February 9, 2006, the Court of Appeals for the Federal Circuit affirmed the District Court’s January 2005 order. On November 22, 2006, the District Court lifted the stay. The case schedule has yet to be set in this action. During the fourth quarter of 2004, we accrued $4 million related to our probable loss from this contingency, which consists entirely of anticipated patent defense costs that are probable of being incurred. In the fourth quarter of 2006, we accrued an additional $600,000 related to this contingency. We charged approximately $57,000 against this accrual during the fourth quarter of 2006. We have charged a total of $602,000 against this accrual through December 31, 2006.
Note 15: Acquisitions
On January 31, 2005, we acquired all of the common stock of Toronto, Canada-based Electronics Workbench, a supplier of electronics design automation software. The acquisition was accounted for as a purchase. The purchase price of the acquisition, subject to adjustment as provided for in the purchase agreement, was $12.1 million in cash. We funded the purchase price from existing cash balances. Our consolidated financial statements include the operating results from the date of acquisition. Pro-forma results of operations have not been presented because the effects of those operations were not material. In accordance with SFAS 141, Business Combinations, the total purchase consideration has been allocated to the assets acquired and liabilities assumed, including identifiable intangible assets, based on their respective estimated fair values at the date of acquisition.
On April 29, 2005, we acquired the operating assets of Measurement Computing Corporation (MCC), a provider of low-cost data acquisition products. The acquisition was accounted for as a purchase. We acquired the operating assets of MCC, which included the legal positions of MCC and SoftWIRE in litigation against us. As a result of the asset acquisition, a pending legal action was dismissed with prejudice and we eliminated our remaining $1.9 million accrual for patent defense costs related to MCC. The gain that resulted from the elimination of the accrual was recorded in general and administrative expenses. The purchase price of the acquisition, subject to adjustment as provided for in the purchase agreement, was $33.2 million in cash. We funded the purchase price from existing cash balances. Our consolidated financial statements include the operating results from the date of acquisition. Pro-forma results of operations have not been presented because the effects of those operations were not material. In accordance with SFAS 141, the total purchase consideration has been allocated to the assets acquired and liabilities assumed, including identifiable assets, based on their respective estimated fair values at the date of acquisition.
On October 17, 2005, we acquired the operating assets of IOtech, Inc., a provider of PC-based data acquisition and instrumentation products. The acquisition was accounted for as a purchase. The purchase price of the acquisition, subject to adjustment as provided for in the purchase agreement, was $17.6 million in cash. We funded the purchase price from existing cash balances. Our consolidated financial statements include the operating results from the date of acquisition. Pro-forma results of operations have not been presented because the effects of those operations were not material. In accordance with SFAS 141, the total purchase consideration has been allocated to the assets acquired and liabilities assumed, including identifiable assets, based on their respective estimated fair values at the date of acquisition.
Goodwill is deductible for tax purposes. Goodwill is not amortized but is reviewed periodically for impairment. Acquired core technology and intangible assets are amortized over their useful lives, which range from three to eight years. Amortization expense for intangible assets acquired was approximately $3.2 million and $2.0 million for 2006 and 2005, respectively, of which approximately $2.7 million and $1.5 million was recorded in cost of sales and approximately $490,000 and $490,000 was recorded in operating expenses. The estimated amortization expense of intangible assets acquired for the current fiscal year and in future years will be recorded in the consolidated statements of income as follows (in thousands):
Fiscal Year
Cost of Sales
Acquisition related costs and amortization, net
Total
2007 $ 2,689 $ 450 $ 3,139 2008 2,532 412 2,944 2009 2,259 338 2,597 2010 1,725 177 1,902 Thereafter 1,166 271 1,437
Total $ 10,371 $ 1,648 $ 12,019
Note 16: Related party transactions
During 2002, we contributed approximately $3.6 million to the National Instruments Foundation, a 501(c)(3) charitable foundation established in 2002 for the purpose of continued promotion of scientific and engineering research and education at higher education institutions worldwide. This contribution was recorded as general and administrative expense in 2002. Two of the four directors of the National Instruments Foundation are current officers of National Instruments.
Note 17: Quarterly results (unaudited)
The following quarterly results have been derived from unaudited consolidated financial statements that, in the opinion of management, reflect all adjustments (consisting only of normal recurring adjustments) necessary for a fair presentation of such quarterly information. The operating results for any quarter are not necessarily indicative of the results to be expected for any future period. The unaudited quarterly financial data for each of the eight quarters in the two years ended December 31, 2006 are as follows (in thousands, except per share data):
Three Months Ended
Mar. 31, 2006
Jun. 30, 2006
Sep. 30, 2006
Dec. 31, 2006
Net sales $ 154,752 $ 160,123 $ 164,079 $ 181,453 Gross profit 113,247 119,271 121,648 135,915 Operating income 15,826 20,911 22,367 28,616 Net income 12,602 17,021 18,651 24,434 Basic earnings per share $ 0.16 $ 0.21 $ 0.23 $ 0.31 Weighted average shares outstanding-basic 79,053 79,611 79,637 79,767 Diluted earnings per share $ 0.15 $ 0.21 $ 0.23 $ 0.30 Weighted average shares outstanding-diluted 81,608 81,653 81,274 81,524 Dividends declared per share $ 0.06 $ 0.06 $ 0.06 $ 0.06
Three Months Ended
Mar. 31, 2005
Jun. 30, 2005
Sep. 30, 2005
Dec. 31, 2005
Net sales $ 129,740 $ 140,822 $ 141,618 $ 159,661 Gross profit 97,376 104,109 103,725 117,322 Operating income 14,182 19,093 18,343 26,594 Net income 11,136 15,024 14,399 20,958 Basic earnings per share $ 0.14 $ 0.19 $ 0.18 $ 0.27 Weighted average shares outstanding-basic 79,175 78,303 78,158 78,505 Diluted earnings per share $ 0.14 $ 0.19 $ 0.18 $ 0.26 Weighted average shares outstanding-diluted 81,924 80,190 80,575 80,821 Dividends declared per share $ 0.05 $ 0.05 $ 0.05 $ 0.05
Note 18: Subsequent Event
On January 30, 2007, our Board of Directors declared a quarterly cash dividend of $0.07 per common share, payable March 5, 2007, to shareholders of record on February 12, 2007.
On January 30, 2007, our Board of Directors granted authorization for the repurchase of an additional 1,522,106 shares of our common stock under our share repurchase plan.
SCHEDULE II
NATIONAL INSTRUMENTS CORPORATION
VALUATION AND QUALIFYING ACCOUNTS
(In thousands)
Allowance for doubtful accounts and sales returns:
Year
Description
Balance at Beginning of Period
Provision for Bad Debt Expense
Write-Offs Charged to Allowances
Balance at End of Period
2004 Allowance for doubtful accounts and sales returns $ 3,244 $ 596 $ 329 $ 3,511 2005 Allowance for doubtful accounts and sales returns 3,511 1,462 239 4,734 2006 Allowance for doubtful accounts and sales returns 4,734 33 407 4,360
We continue to enhance our internal control over financial reporting in key functional areas with the goal of monitoring our operations at the level of documentation, segregation of duties, and systems security necessary, as well as transactional control procedures required under Auditing Standard No. 5 issued by the Public Company Accounting Oversight Board. We discuss and disclose these matters to the audit committee of our board of directors and to our auditors.
ITEM 10. DIRECTORS, EXECUTIVE OFFICERS AND CORPORATE GOVERNANCE
The information concerning our directors required by this Item pursuant to Item 401 of Regulation S-K will appear in our Proxy Statement under the section “Election of Directors” and such information is incorporated herein by reference.
The information concerning our executive officers required by this Item pursuant to Item 401 of Regulation S-K will appear in our Proxy Statement under the section “Executive Officers” and such information is incorporated herein by reference.
The information required by this Item pursuant to Item 405 of Regulation S-K regarding compliance with Section 16(a) of the Securities Exchange Act of 1934, as amended, will appear in our Proxy Statement under the section “Section 16(a) Beneficial Ownership Reporting Compliance” and such information is incorporated herein by reference.
The information concerning our code of ethics that applies to our principal executive officer, our principal financial officer, our controller or person performing similar functions required by this Item pursuant to Item 406 of Regulation S-K will appear in our Proxy Statement under the section “Code of Ethics” and such information is incorporated herein by reference.
The information required by this Item pursuant to Item 407(c)(3) of Regulation S-K regarding material changes, if any, to procedures by which security holders may recommend nominees to our board of directors will appear in our Proxy Statement under the section “Deadline for Receipt of Stockholder Proposals” and such information is incorporated herein by reference.
The information required by this Item pursuant to Item 407(d)(4) and Item 407(d)(5) of Regulation S-K regarding our Audit Committee and our audit committee financial expert(s), respectively, will appear in our Proxy Statement under the heading “Corporate Governance” and such information is incorporated herein by reference.
ITEM 11. EXECUTIVE COMPENSATION
The information required by this Item pursuant to Item 402 of Regulation S-K regarding director compensation will appear in our Proxy Statement under the section “Board Compensation” and such information is incorporated herein by reference.
The information required by this Item pursuant to Item 402 of Regulation S-K regarding executive officer compensation, including our Compensation Discussion & Analysis, will appear in our Proxy Statement under the section “Executive Compensation” and such information is incorporated herein by reference.
The information required by this Item pursuant to Item 407(e)(4) of Regulation S-K will appear in our Proxy Statement under the section “Compensation Committee Interlocks and Insider Participation” and such information is incorporated herein by reference.
The information required by this Item pursuant to Item 407(e)(5) will appear in our Proxy Statement under the section “Compensation Committee Report” and such information is incorporated herein by reference.
ITEM 12. SECURITY OWNERSHIP OF CERTAIN BENEFICIAL OWNERS AND MANAGEMENT AND RELATED STOCKHOLDER MATTERS
From time to time our directors, executive officers and other insiders may adopt stock trading plans pursuant to Rule 10b5-1(c) promulgated by the Securities and Exchange Commission under the Securities Exchange Act of 1934, as amended. Jeffrey L. Kodosky and James J. Truchard have made periodic sales of our stock pursuant to such plans.
The information required by this Item pursuant to Item 403 of Regulation S-K concerning security ownership of certain beneficial owners and management will appear in our Proxy Statement under the section “Security Ownership” and such information is incorporated herein by reference.
The information required by this Item pursuant to Item 201(d) of Regulation S-K concerning securities authorized for issuance under equity compensation plans will appear in our Proxy Statement under the section “Equity Compensation Plans Information” and such information is incorporated herein by reference.
ITEM 13. CERTAIN RELATIONSHIPS AND RELATED TRANSACTIONS AND DIRECTOR INDEPENDENCE During 2002, we irrevocably contributed approximately $3.6 million to the National Instruments Foundation, a 501(c)(3) charitable foundation established in 2002 for the purpose of continued promotion of scientific and engineering research and education at higher education institutions worldwide. Two of the four directors of the National Instruments Foundation are current officers of National Instruments.
In addition, the information required by this Item pursuant to Item 404 of Regulation S-K will appear in our Proxy Statement under the section “Certain Relationships and Related Transactions” and such information is incorporated herein by reference.
The information required by this Item pursuant to Item 407(a) of Regulation S-K regarding the independence of our directors will appear in our Proxy Statement under the section “Corporate Governance” and such information is incorporated herein by reference.
ITEM 14. PRINCIPAL ACCOUNTING FEES AND SERVICES
The information concerning principal accountant fees and services required by this Item is incorporated by reference to our Proxy Statement under the heading “Independent Public Accountants.”
The information concerning pre-approval policies for audit and non-audit services required by this Item is incorporated by reference to our Proxy Statement under the heading “Audit Committee Pre-Approval of Audit and Permissible Non-Audit Services of Independent Auditors.”
PART IV
ITEM 15. EXHIBITS AND FINANCIAL STATEMENT SCHEDULES
(a) Documents FilesFiled with Report
1. Financial Statements.
2. Financial Statement Schedules.
None
3. Exhibits.
ExhibitNumber Description 3.1(2) Certificate of Incorporation, as amended, of the Company. 3.2(11) Amended and Restated Bylaws of the Company. 3.3(4) Certificate of Designation of Rights, Preferences and Privileges of Series A Participating Preferred Stock of the Company. 4.1(1) Specimen of Common Stock certificate of the Company. 4.2(3) Rights Agreement dated as of January 21, 2004, between the Company and EquiServe Trust Company, N.A. 10.1(1) Form of Indemnification Agreement. 10.2(5) 1994 Incentive Plan, as amended.* 10.3(9) 1994 Employee Stock Purchase Plan.* 10.5(7) 2005 Incentive Plan.* 10.6(8) National Instruments Corporation Annual Incentive Program.* 10.7(6) National Instruments Corporation Annual Incentive Program, as amended.* 10.8(10) Form of Restricted Stock Unit Award Agreement (Non-Employee Director).* 10.9(10) Form of Restricted Stock Unit Award Agreement (Performance Vesting).* 10.10(10) Form of Restricted Stock Unit Award Agreement (Current Employee).* 10.11(10) Form of Restricted Stock Unit Award Agreement (Newly Hired Employee).* 21.1 Subsidiaries of the Company. 23.1 Consent of Independent Registered Public Accounting Firm F-4Firm.Consolidated Balance SheetsF-5Consolidated Statements of IncomeF-6Consolidated Statements of Cash FlowsF-7Consolidated Statements of Stockholders' EquityF-8Notes to Consolidated Financial StatementsF-9
2.
Financial Statements Schedules.
See Schedule II - Valuation and Qualifying Accounts at page S-1
3.
Exhibits.
Exhibit
NumberDescription
3.1
(2)
Certificate of Incorporation, as amended, of the Company.
3.2
(2)
Amended and Restated Bylaws of the Company.
3.3
(4)
Certificate of Designation of Rights, Preferences and Privileges of Series A Participating Preferred Stock of the Company.
4.1
(1)
Specimen of Common Stock certificate of the Company.
4.2
(3)
Rights Agreement dated as of January 21, 2004, between the Company and EquiServe Trust Company, N.A.
10.1
(1)
Form of Indemnification Agreement.
10.2
(5)
1994 Incentive Plan, as amended.*
10.3
1994 Employee Stock Purchase Plan.*
10.4
(6)
Long-Term Incentive Program.*
10.5
(7)
2005 Incentive Plan.*
10.6
(8)
National Instruments Corporation Annual Incentive Program.*
10.7
(9)
2006 Annual Incentive Program Goals and Awards for the Named Executive Officers.*
10.8
(10)
Form of Restricted Stock Unit Award Agreement (Non-Employee Director).*
10.9
(10)
Form of Restricted Stock Unit Award Agreement (Performance Vesting).*
10.10
(10)
Form of Restricted Stock Unit Award Agreement (Current Employee).*
10.11
(10)
Form of Restricted Stock Unit Award Agreement (Newly Hired Employee).*
21.1
Subsidiaries of the Company.
23.1
Consent of Independent Registered Public Accounting Firm.
23.2
Consent of Independent Registered Public Accounting Firm.
24.0
Power of Attorney (included on page 33).
31.1
Certification of Chief Executive Officer Pursuant to 18 U.S.C. Section 1350, as Adopted Pursuant to Section 302 of the Sarbanes-Oxley Act of 2002.
31.2
Certification of Chief Financial Officer Pursuant to 18 U.S.C. Section 1350, as Adopted Pursuant to Section 302 of the Sarbanes-Oxley Act of 2002.
32.1
Certification of Chief Executive Officer and Chief Financial Officer Pursuant to 18 U.S.C. Section 1350, as Adopted Pursuant to Section 906 of the Sarbanes-Oxley Act of 2002.
24.0 Power of Attorney (included on page 41). 31.1 Certification of Chief Executive Officer Pursuant to 18 U.S.C. Section 1350, as Adopted Pursuant to Section 302 of the Sarbanes-Oxley Act of 2002. 31.2 Certification of Chief Financial Officer Pursuant to 18 U.S.C. Section 1350, as Adopted Pursuant to Section 302 of the Sarbanes-Oxley Act of 2002. 32.1 Certification of Chief Executive Officer and Chief Financial Officer Pursuant to 18 U.S.C. Section 1350, as Adopted Pursuant to Section 906 of the Sarbanes-Oxley Act of 2002.
(1) Incorporated by reference to the Company's Registration Statement on Form S-1 (Reg. No. 33-88386) declared effective March 13, 1995.
(2) Incorporated by reference to the same-numbered exhibit filed with the Company's Annual Report on Form 10-K for the fiscal year ended December 31, 2003.
(3) Incorporated by reference to exhibit 4.1 filed with the Company's currentCurrent Report on Form 8-K filed on January 28, 2004.
(4) Incorporated by reference to the same-numbered exhibit filed with the Company's Form 8-K on April 27, 2004.
(5) Incorporated by reference to the same-numbered exhibit filed with the Company's Form 10-Q on August 5, 2004.
(6) Incorporated by reference to exhibit 99.2 filed with the Company's Current Report on Form 8-K filed on October 28, 2008. (7) Incorporated by reference to exhibit A of the Company's Proxy Statement dated and filed on April 4, 2005. (8) Incorporated by reference to exhibit 99.2 filed with the Company's Current Report on Form 8-K filed on October 22, 2008. (9) Incorporated by reference to exhibit 10.3 filed with the Company's Annual Report on Form 10-K for the fiscal year ended December 31, 2006. (10) Incorporated by reference to the same-numbered exhibit filed with the Company's Form 10-Q on August 2, 2006. (11) Incorporated by reference to the same-numbered exhibit filed with the Company's Annual Report on Form 10-K for the fiscal year ended December 31, 2004.2007.
(7)Incorporated by reference to exhibit A of the Company's Proxy Statement dated and filed on April 4, 2005.
(8)Incorporated by reference to the exhibit 10.1 filed with the Company's Current Report on Form 8-K filed June 27, 2006.
(9)Incorporated by reference to the exhibit 10.2 filed with the Company's Current Report on Form 8-K filed June 27, 2006.
(10)Incorporated by reference to the same-numbered exhibit filed with the Company's Form 10-Q filed on August 2, 2006.
* Management Contract or Compensatory Plan or Arrangement.
(b) Exhibits
See Item 15(a)(3) above.
(c) Financial Statement Schedules
See Item 15(a)(2) above.
SIGNATURES
Pursuant to the requirements of Section 13 or 15(d) of the Securities Exchange Act of 1934, the registrant has duly caused this report to be signed on its behalf by the undersigned thereunto duly authorized.Registrant Registrant
NATIONAL INSTRUMENTS CORPORATION
February 20, 200717, 2010
BY: By:
/s/ Dr. James J. TruchardDr. James J. Truchard
Chairman of the Board and President
POWER OF ATTORNEY
KNOW ALL PERSONS BY THESE PRESENTS, that each person whose signature appears below constitutes and appoints Dr. James J. Truchard and Alexander M. Davern, jointly and severally, his or her attorneys-in-fact, each with the power of substitution, for him or her in any and all capacities, to sign any amendments to this Report on Form 10-K, and to file the same, with exhibits thereto and other documents in connection therewith, with the Securities and Exchange Commission, hereby ratifying and conformingconfirming all that each of said attorneys-in-fact, or his substitute or substitutes, may do or cause to be done by virtue hereof.
Pursuant to the requirements of the Securities Exchange Act of 1934, this report has been signed below by the following persons on behalf of the registrant and in the capacities and on the dates indicated.Signature
Capacity in Which Signed
Date
/s/ Dr. James J. Truchard
Chairman of the Board and President(Principal Executive Officer) February 17, 2010 Dr. James J. Truchard
Chairman of the Board and
President (Principal Executive Officer)
February 20, 2007
/s/ Alex M. Davern
Chief Financial Officer and Treasurer(Principal Financial and Accounting Officer) February 17, 2010 Alex M. Davern
Chief Financial Officer
and Treasurer (Principal Financial
and Accounting Officer)
February 20, 2007
/s/ Jeffrey L. Kodosky
Director February 17, 2010 Jeffrey L. Kodosky
Director
February 16, 2007
/s/ Dr. Donald M. Carlton
Director February 17, 2010 Dr. Donald M. Carlton
Director
February 16, 2007
/s/ Dr. Ben G. Streetman
Dr. Ben G. Streetman
Director
February 16, 2007
/s/ R. Gary Daniels
R. Gary Daniels
Director
February 16, 2007
/s/ Charles J. Roesslein
Director February 17, 2010 Charles J. Roesslein
Director
February 16, 2007
/s/ Duy-Loan T. Le
Director February 17, 2010 Duy-Loan T. Le
/s/ John Medica Director
February 16, 200717, 2010 John Medica
NATIONAL INSTRUMENTS CORPORATION
INDEX TO FINANCIAL STATEMENTS
Page No. Financial Statements: Page No.Report of Independent Registered Public Accounting FirmF-2Report of Independent Registered Public Accounting Firm on Internal Control over Financial Reporting F-3F-2 Report of Independent Registered Public Accounting Firm F-4F-3 Consolidated Balance Sheets as of December 31, 20062009 and 20052008 F-5F-4 Consolidated Statements of Income for each of the Three Years in the period Ended December 31, 20062009 F-6F-5 Consolidated Statements of Cash Flows for each of the Three Years in the period Ended December 31, 20062009 F-7F-6 Consolidated Statements of Stockholders' Equity for each of the Three Years in the period Ended December 31, 20062009 F-8F-7 Notes to Consolidated Financial Statements F-9F-8
Financial Statement Schedules:For each of the Three Years in the period Ended December 31, 2006 Schedule II--Valuation and Qualifying AccountsS-1
All other schedules are omitted because they are not applicable.
The Board of Directors and Shareholders of National Instruments Corporation:
We have audited the accompanying consolidated balance sheets of National Instruments Corporation and subsidiaries as of December 31, 20062009 and 20052008, and the related consolidated statements of income, stockholders’stockholders' equity, and cash flows for each of the twothree fiscal years in the period ended December 31, 2006. Our audits also included the financial statement schedule listed in the Index at Item 15.2009. These financial statements and schedule are the responsibility of the Company’sCompany's management. Our responsibility is to express an opinion on these financial statements and schedule based on our audits.
We conducted our audits in accordance with the standards of the Public Company Accounting Oversight Board (United States). Those standards require that we plan and perform the audit to obtain reasonable assurance about whether the financial statements are free of material misstatement. An audit includes examining, on a test basis, evidence supporting the amounts and disclosures in the financial statements. An audit also includes assessing the accounting principles used and significant estimates made by management, as well as evaluating the overall financial statement presentation. We believe that our audits provide a reasonable basis for our opinion.
In our opinion, the financial statements referred to above present fairly, in all material respects, the consolidated financial position of National Instruments Corporation and subsidiaries at December 31, 20062009 and 20052008, and the consolidated results of their operations and their cash flows for each of the twothree fiscal years in the period ended December 31, 2006,2009, in conformity with U.S. generally accepted accounting principles. Also, in our opinion, the related financial statement schedule, when considered in relation to the basic financial statements taken as a whole, presents fairly in all material respects the information set forth therein.As discussed in Note 1 to the consolidated financial statements, effective January 1, 2006, the Company changed its method of accounting for stock-based compensation to conform to Statement of Financial Accounting Standards No. 123(R), Share-Based Payment.
We also have audited, in accordance with the standards of the Public Company Accounting Oversight Board (United States), the effectiveness of National Instruments Corporation’sCorporation internal control over financial reporting as of December 31, 2006,2009, based on criteria established in Internal Control-Integrated Framework issued by the Committee of Sponsoring Organizations of the Treadway Commission and our report dated February 15, 200717, 2010 expressed an unqualified opinion thereon./s/ Ernst & Young LLP
Austin, Texas
February 15, 2007
/s/ Ernst & Young LLP
Austin, TexasFebruary 17, 2010
Report of Independent Registered Public Accounting Firm on Internal Control over Financial Reporting
The Board of Directors and Shareholders of National Instruments Corporation:
We have audited management’s assessment, included in the Management’s Report on Internal Control over Financial Reporting, that National Instruments Corporation maintained effectiveCorporation’s internal control over financial reporting as of December 31, 2006,2009, based on criteria established in Internal Control—Integrated Framework issued by the Committee of Sponsoring Organizations of the Treadway Commission (the COSO criteria). National Instruments Corporation’s management is responsible for maintaining effective internal control over financial reporting, and for its assessment of the effectiveness of internal control over financial reporting.reporting included in the accompanying Management Report on Internal Control over Financial Reporting. Our responsibility is to express an opinion on management’s assessment and an opinion on the effectiveness of the company’s internal control over financial reporting based on our audit.
We conducted our audit in accordance with the standards of the Public Company Accounting Oversight Board (United States). Those standards require that we plan and perform the audit to obtain reasonable assurance about whether effective internal control over financial reporting was maintained in all material respects. Our audit included obtaining an understanding of internal control over financial reporting, evaluating management’s assessment,assessing the risk that a material weakness exists, testing and evaluating the design and operating effectiveness of internal control based on the assessed risk, and performing such other procedures as we considered necessary in the circumstances. We believe that our audit provides a reasonable basis for our opinion.
A company’s internal control over financial reporting is a process designed to provide reasonable assurance regarding the reliability of financial reporting and the preparation of financial statements for external purposes in accordance with generally accepted accounting principles. A company’s internal control over financial reporting includes those policies and procedures that (1) pertain to the maintenance of records that, in reasonable detail, accurately and fairly reflect the transactions and dispositions of the assets of the company; (2) provide reasonable assurance that transactions are recorded as necessary to permit preparation of financial statements in accordance with generally accepted accounting principles, and that receipts and expenditures of the company are being made only in accordance with authorizations of management and directors of the company; and (3) provide reasonable assurance regarding prevention or timely detection of unauthorized acquisition, use or disposition of the company’s assets that could have a material effect on the financial statements.
Because of its inherent limitations, internal control over financial reporting may not prevent or detect misstatements. Also, projections of any evaluation of effectiveness to future periods are subject to the risk that controls may become inadequate because of changes in conditions, or that the degree of compliance with the policies or procedures may deteriorate.
In our opinion, management’s assessment that National Instruments Corporation maintained effective internal control over financial reporting as of December 31, 2006, is fairly stated, in all material respects, based on the COSO criteria. Also, in our opinion, National Instruments Corporation maintained, in all material respects, effective internal control over financial reporting as of December 31, 2006,2009, based on the COSO criteria.
We also have audited, in accordance with the standards of the Public Company Accounting Oversight Board (United States), the consolidated balance sheets of National Instruments Corporation as of December 31, 20062009 and 2005,2008, and the related consolidated statements of income, stockholders’ equity, and cash flows for each of the twothree years in the period ended December 31, 2006 of National Instruments Corporation2009 and our report dated February 15, 200717, 2010 expressed an unqualified opinion thereon./s/ Ernst & Young LLP
Austin, Texas
February 15, 2007
/s/ Ernst & Young LLP
Austin, TexasFebruary 17, 2010
Report of Independent Registered Public Accounting Firm
To the Board of Directors and Stockholders of National Instruments Corporation:
In our opinion, the consolidated statements of income, of stockholders’ equity and of cash flows (appearing on pages F-6 through F-8 of this National Instruments Corporation 2006 Annual Report on Form 10-K) for the year ended December 31, 2004 present fairly, in all material respects, the results of operations and cash flows of National Instruments Corporation and its subsidiaries for the year ended December 31, 2004, in conformity with accounting principles generally accepted in the United States of America. In addition, in our opinion, the financial statement schedule for the year ended December 31, 2004 presents fairly, in all material respects, the information set forth therein when read in conjunction with the related consolidated financial statements. These financial statements and financial statement schedule are the responsibility of the Company’s management. Our responsibility is to express an opinion on these financial statements and financial statement schedule based on our audit. We conducted our audit of these statements in accordance with the standards of the Public Company Accounting Oversight Board (United States). Those standards require that we plan and perform the audit to obtain reasonable assurance about whether the financial statements are free of material misstatement. An audit includes examining, on a test basis, evidence supporting the amounts and disclosures in the financial statements, assessing the accounting principles used and significant estimates made by management, and evaluating the overall financial statement presentation. We believe that our audit provides a reasonable basis for our opinion.
/s/ PricewaterhouseCoopers LLP
Austin, Texas
March 4, 2005
NATIONAL INSTRUMENTS CORPORATION
(in thousands, except share data)December 31,
2006
2005
Assets
Current assets: Cash and cash equivalents $ 100,287 $ 55,864 Short-term investments 150,190 119,846 Accounts receivable, net 117,235 95,733 Inventories, net 77,138 62,827 Prepaid expenses and other current assets 11,393 13,146 Deferred income taxes, net 20,851 14,890
Total current assets 477,094 362,306 Property and equipment, net 145,425 144,330 Goodwill, net 53,343 52,533 Intangible assets, net 40,065 43,602 Other long-term assets 5,293 5,565
Total assets $ 721,220 $ 608,336
Liabilities and Stockholders' Equity
Current liabilities: Accounts payable $ 32,001 $ 30,832 Accrued compensation 20,912 18,084 Deferred revenue 22,208 16,018 Accrued expenses and other liabilities 15,934 8,838 Other taxes payable 11,527 13,848
Total current liabilities 102,582 87,620 Deferred income taxes 21,956 16,866
Total liabilities 124,538 104,486
Commitments and contingencies Stockholders' equity: Preferred stock: par value $0.01; 5,000,000 shares authorized; none issued and outstanding — — Common stock: par value $0.01; 180,000,000 shares authorized; 79,883,837 and 79,276,086 shares issued and outstanding, respectively 799 793 Additional paid-in capital 109,851 91,430 Deferred stock-based compensation — (16,547 ) Retained earnings 483,533 429,859 Accumulated other comprehensive income (loss) 2,499 (1,685 )
Total stockholders' equity 596,682 503,850
Total liabilities and stockholders' equity $ 721,220 $ 608,336
December 31, 2009 2008 Assets Current assets: Cash and cash equivalents $ 201,465 $ 229,400 Short-term investments 87,196 6,220 Accounts receivable, net 103,957 121,548 Inventories, net 86,515 107,358 Prepaid expenses and other current assets 36,523 43,062 Deferred income taxes, net 16,522 21,435 Total current assets 532,178 529,023 Long-term investments — 10,500 Property and equipment, net 153,265 154,477 Goodwill, net 64,779 64,561 Intangible assets, net 43,390 41,915 Other long-term assets 19,417 32,115 Total assets $ 813,029 $ 832,591 Liabilities and Stockholders’ Equity Current liabilities: Accounts payable $ 23,502 $ 30,876 Accrued compensation 14,934 22,012 Deferred revenue 57,242 45,514 Accrued expenses and other liabilities 8,560 18,848 Other taxes payable 14,181 13,481 Total current liabilities 118,419 130,731 Deferred income taxes 25,012 25,157 Liability for uncertain tax positions 11,062 9,364 Other long-term liabilities 4,116 2,901 Total liabilities 158,609 168,153 Commitments and contingencies Stockholders’ equity: Preferred stock: par value $0.01; 5,000,000 shares authorized; none issued and outstanding — — Common stock: par value $0.01; 180,000,000 shares authorized;77,367,874 and 77,193,063 shares issued and outstanding, respectively 774 772 Additional paid-in capital 336,446 300,352 Retained earnings 303,655 352,831 Accumulated other comprehensive income 13,545 10,483 Total stockholders’ equity 654,420 664,438 Total liabilities and stockholders’ equity $ 813,029 $ 832,591
The accompanying notes are an integral part of these financial statements.
NATIONAL INSTRUMENTS CORPORATION
(in thousands, except per share data)For the Years Ended December 31,
2006
2005
2004
Net sales $ 660,407 $ 571,841 $ 514,088 Cost of sales (1) 170,326 149,309 135,473
Gross profit 490,081 422,532 378,615
Operating expenses: Sales and marketing (2) 235,072 211,280 188,727 Research and development (3) 113,095 87,841 84,692 General and administrative (4) 54,192 45,199 42,500
Total operating expenses 402,359 344,320 315,919
Operating income 87,722 78,212 62,696
Other income (expense): Interest income 6,847 3,758 2,905 Net foreign exchange gain (loss) 740 (1,566 ) 1,287 Other income (expense), net (7 ) 276 (2,075 )
Income before income taxes 95,302 80,680 64,813 Provision for income taxes (5) 22,594 19,163 16,203
Net income $ 72,708 $ 61,517 $ 48,610
Basic earnings per share $ 0.91 $ 0.78 $ 0.62
Weighted average shares outstanding - basic 79,519 78,552 78,680
Diluted earnings per share $ 0.89 $ 0.76 $ 0.59
Weighted average shares outstanding - diluted 81,519 80,910 82,096
Dividends declared per share $ 0.24 $ 0.20 $ 0.18
The following footnotes apply to the years ended December 31, 2006, 2005 and 2004:
(1)including $598, $101 and $0, respectively, of non-cash stock compensation.(2)including $6,008, $500 and $0, respectively, of non-cash stock compensation.(3)including $5,201, $598 and $0, respectively, of non-cash stock compensation.(4)including $2,333, $345 and $0, respectively, of non-cash stock compensation.(5)including $2,403, $364 and $0, respectively, of benefit from non-cash stock compensation.
For the YearsEnded December 31, 2009 2008 2007 Net sales: Product $ 623,736 $ 765,441 $ 701,589 Software maintenance 52,858 55,096 38,789 Total net sales 676,594 820,537 740,378 Cost of sales: Product 164,700 201,064 180,556 Software maintenance 5,184 6,045 4,711 Total cost of sales 169,884 207,109 185,267 Gross profit 506,710 613,428 555,111 Operating expenses: Sales and marketing 269,267 307,409 264,060 Research and development 132,974 143,140 126,515 General and administrative 57,938 67,162 62,445 Total operating expenses 460,179 517,711 453,020 Operating income 46,531 95,717 102,091 Other income (expense): Interest income 1,629 5,996 9,822 Net foreign exchange gain (loss) 734 (3,737 ) 1,672 Other income (expense), net 1,351 161 (158 ) Income before income taxes 50,245 98,137 113,427 Provision for income taxes 33,160 13,310 6,394 Net income $ 17,085 $ 84,827 $ 107,033 Basic earnings per share $ 0.22 $ 1.08 $ 1.35 Weighted average shares outstanding - basic 77,520 78,567 79,468 Diluted earnings per share $ 0.22 $ 1.07 $ 1.32 Weighted average shares outstanding – diluted �� 78,026 79,515 81,043 Dividends declared per share $ 0.48 $ 0.44 $ 0.34
The accompanying notes are an integral part of these financial statements.
NATIONAL INSTRUMENTS CORPORATION
(in thousands)For the Years Ended December 31,
2006
2005
2004
Cash flow from operating activities: Net income $ 72,708 $ 61,517 $ 48,610 Adjustments to reconcile net income to net cash provided by operating activities: Depreciation and amortization 34,181 28,553 25,592 Stock-based compensation 14,507 1,545 — Impairment of cost method investment — — 2,500 Gain on sale of subsidiary — — (242 ) Provision for (benefit from) deferred income taxes (339 ) 3,219 (825 ) Tax benefit from stock option plans (4,271 ) 675 3,071 Changes in operating assets and liabilities: Accounts receivable (21,502 ) (4,080 ) (9,342 ) Inventories (14,311 ) (4,572 ) (15,230 ) Prepaid expenses and other assets 2,116 (2,177 ) 4,624 Accounts payable 1,169 4,647 (4,359 ) Deferred revenue 6,190 3,847 3,385 Taxes and other liabilities 7,443 (5,124 ) 7,848
Net cash provided by operating activities 97,891 88,050 65,632
Cash flow from investing activities: Proceeds from sale of subsidiary — — 680 Acquisitions, net of cash received — (63,891 ) — Capital expenditures (18,503 ) (15,383 ) (12,596 ) Capitalization of internally developed software (7,370 ) (13,380 ) (5,007 ) Additions to other intangibles (3,115 ) (4,288 ) (3,050 ) Purchases of short-term investments (244,238 ) (124,227 ) (125,954 ) Sales and maturities of short-term investments 213,894 154,773 116,789
Net cash used in investing activities (59,332 ) (66,396 ) (29,138 )
Cash flow from financing activities: Proceeds from issuance of common stock 37,146 23,222 16,826 Repurchase of common stock (16,519 ) (49,452 ) (16,064 ) Dividends paid (19,034 ) (15,776 ) (14,486 ) Tax benefit from stock option plans 4,271 — —
Net cash provided by (used in) financing activities 5,864 (42,006 ) (13,724 )
Net change in cash and cash equivalents 44,423 (20,352 ) 22,770 Cash and cash equivalents at beginning of period 55,864 76,216 53,446
Cash and cash equivalents at end of period $ 100,287 $ 55,864 $ 76,216
Cash paid for interest and income taxes Interest $ 41 $ 17 $ 31 Income taxes $ 9,827 $ 15,117 $ 10,622
For the Years Ended December 31, 2009 2008 2007 Cash flow from operating activities: Net income $ 17,085 $ 84,827 $ 107,033 Adjustments to reconcile net income to net cash provided by operating activities: Depreciation and amortization 38,365 37,103 36,605 Stock-based compensation 20,299 19,854 17,754 Tax expense/(benefit from) deferred income taxes 17,196 (4,475 ) (16,954 ) Tax expense/(benefit from) stock option plans 1,450 (1,213 ) (2,964 ) Changes in operating assets and liabilities: Accounts receivable 17,591 12,159 (14,047 ) Inventories 20,843 (24,578 ) (5,537 ) Prepaid expenses and other assets 12,740 (10,340 ) (12,330 ) Accounts payable (7,374 ) (5,648 ) 4,186 Deferred revenue 11,728 9,423 13,883 Taxes and other liabilities (14,272 ) 4,706 19,743 Net cash provided by operating activities 135,651 121,818 147,372 Cash flow from investing activities: Acquisitions, net of cash received — (17,310 ) — Capital expenditures (20,847 ) (25,771 ) (24,864 ) Capitalization of internally developed software (12,583 ) (9,487 ) (8,263 ) Additions to other intangibles (4,602 ) (3,010 ) (6,447 ) Purchases of short-term investments (93,087 ) (9,061 ) (87,586 ) Sales and maturities of short-term investments 19,204 86,179 143,938 Purchases of foreign currency option contracts — (2,784 ) (2,242 ) Net cash provided by (used in) investing activities (111,915 ) 18,756 14,536 Cash flow from financing activities: Proceeds from issuance of common stock 21,672 31,150 36,460 Repurchase of common stock (34,585 ) (103,641 ) (79,728 ) Dividends paid (37,308 ) (34,735 ) (27,052 ) Tax (expense)/benefit from stock option plans (1,450 ) 1,213 2,964 Net cash (used in) financing activities (51,671 ) (106,013 ) (67,356 ) Net change in cash and cash equivalents (27,935 ) 34,561 94,552 Cash and cash equivalents at beginning of period 229,400 194,839 100,287 Cash and cash equivalents at end of period $ 201,465 $ 229,400 $ 194,839 Cash paid for interest and income taxes: Interest $ 23 $ 116 $ 159 Income taxes $ 14,608 $ 17,214 $ 21,147
The accompanying notes are an integral part of these financial statements.
NATIONAL INSTRUMENTS CORPORATION
(in thousands, except share data)Common
Stock
Shares
Common
Stock
Amount
Additional
Paid-In
Capital
Deferred
Compensation
Retained
Earnings
Accumulated
Other
Comprehensive
Income/(Loss)
Total
Stockholders'
Equity
Balance at December 31, 2003 78,269,235 $ 783 $ 95,070 $ — $ 349,994 $ (6,395 ) $ 439,452 Net income 48,610 48,610 Foreign currency translation adjustment (net of $1,013 tax expense) 3,050 3,050 Unrealized loss on securities available for sale (net of $0 tax benefit) (417 ) (417 ) Unrealized gain on derivative instruments (net of $2,136 tax expense) 6,407 6,407
Total comprehensive income 57,650
Issuance of common stock under employee plans, including tax benefits 1,234,195 12 19,885 19,897 Repurchase and retirement of common stock (557,850 ) (6 ) (16,058 ) (16,064 ) Dividends declared (14,486 ) (14,486 )
Balance at December 31, 2004 78,945,580 $ 789 $ 98,897 $ — $ 384,118 $ 2,645 $ 486,449 Net income 61,517 61,517 Foreign currency translation adjustment(net of $1,636 tax benefit) (5,181 ) (5,181 ) Unrealized gain on securities available for sale (net of $0 tax expense) 50 50 Unrealized gain on derivative instruments (net of $253 tax expense) 801 801
Total comprehensive income 57,187
Net activity related to restricted stock units 813,305 8 18,084 (16,547 ) 1,545 Issuance of common stock under employee plans, including tax benefits 1,573,547 16 23,206 23,222 Repurchase and retirement of common stock (2,056,346 ) (20 ) (49,432 ) (49,452 ) Dividends declared (15,776 ) (15,776 ) Disqualified dispositions 675 675
Balance at December 31, 2005 79,276,086 $ 793 $ 91,430 ($ 16,547 ) $ 429,859 ($ 1,685 ) $ 503,850 Net income 72,708 72,708 Foreign currency translation adjustment (net of $1,434 tax expense) 4,542 4,542 Unrealized gain on securities available for sale (net of $0 tax expense) 78 78 Unrealized loss on derivative instruments (net of $138 tax benefit) (436 ) (436 )
Total comprehensive income 76,892
Issuance of common stock under employee plans, including tax benefits 1,915,172 19 37,127 37,146 Stock-based compensation under
restricted stock plan 113,794 1 5,082 5,083 Stock-based compensation under stock
option and employee stock purchase plans 9,424 9,424 Repurchase and retirement of common stock (607,910 ) (6 ) (16,513 ) (16,519 ) Effect of adoption of SFAS 123R (813,305 ) (8 ) (16,539 ) 16,547 — Dividends declared (19,034 ) (19,034 ) Disqualified dispositions (160 ) (160 )
Balance at December 31, 2006 $ 79,883,837 $ 799 $ 109,851 $ — $ 483,533 $ 2,499 $ 596,682
CommonStockShares CommonStockAmount AdditionalPaid-InCapital DeferredCompensation RetainedEarnings AccumulatedOtherComprehensiveIncome/(Loss) TotalStockholders’Equity Balance at December 31, 2006 79,883,837 $ 799 $ 207,808 $ — $ 385,480 $ 2,499 $ 596,586 Net income 107,033 107,033 Foreign currency translation adjustment(net of $286 tax expense) 4,483 4,483 Unrealized gain on securities available-for-sale(net of $13 tax expense) 200 200 Unrealized loss on derivative instruments(net of $7 tax benefit) (117 ) (117 ) Total comprehensive income 111,599 Issuance of common stock under employee plans, including tax benefits 2,251,657 22 36,438 36,460 Stock-based compensation 17,754 17,754 Repurchase and retirement of common stock (2,730,135 ) (27 ) (7,102 ) (72,599 ) (79,728 ) Dividends paid (27,052 ) (27,052 ) Disqualified dispositions 5,467 5,467 Balance at December 31, 2007 79,405,359 $ 794 $ 260,365 $ — $ 392,862 $ 7,065 $ 661,086 Net income 84,827 84,827 Foreign currency translation adjustment(net of $681 tax benefit) (4,188 ) (4,188 ) Unrealized loss on securities available-for-sale(net of $82 tax benefit) (502 ) (502 ) Unrealized gain on derivative instruments(net of $1,320 tax expense) 8,108 8,108 Total comprehensive income 88,245 Issuance of common stock under employee plans, including tax benefits 1,897,746 19 31,131 31,150 Stock-based compensation 19,854 19,854 Repurchase and retirement of common stock (4,110,042 ) (41 ) (13,477 ) (90,123 ) (103,641 ) Dividends paid (34,735 ) (34,735 ) Disqualified dispositions 2,479 2,479 Balance at December 31, 2008 77,193,063 $ 772 $ 300,352 $ — $ 352,831 $ 10,483 $ 664,438 Net income 17,085 17,085 Foreign currency translation adjustment(net of $1,799 tax expense) 927 927 Unrealized gain on securities available-for-sale(net of $1,093 tax expense) 563 563 Unrealized gain on derivative instruments(net of $3,053 tax expense) 1,572 1,572 Total comprehensive income 20,147 Issuance of common stock under employee plans, including tax benefits 1,618,252 16 21,656 21,672 Stock-based compensation 20,574 20,574 Repurchase and retirement of common stock (1,443,441 ) (14 ) (5,618 ) (28,953 ) (34,585 ) Dividends paid (37,308 ) (37,308 ) Disqualified dispositions (518 ) (518 ) Balance at December 31, 2009 77,367,874 $ 774 $ 336,446 $ — $ 303,655 $ 13,545 $ 654,420
The accompanying notes are an integral part of these financial statements.
NATIONAL INSTRUMENTS CORPORATION
Note 1:1 – Operations and summary of significant accounting policies
National Instruments Corporation is a Delaware corporation. We engage in the design, development, manufacture and marketing of instrumentationprovide flexible application software and specialty computer plug-in cards and accessoriesmodular, multifunction hardware that users combine with industry standardindustry-standard computers, networks and the Internetthird party devices to create measurement, automation and automation systems.embedded systems, which we also refer to as “virtual instruments.” Our approach gives customers the ability to quickly and cost-effectively design, prototype and deploy unique custom-defined solutions for their design, control and test application needs. We offer hundreds of products used to create virtual instrumentation systems for general, commercial, industrial and scientific applications. Our products may be used in different environments, and consequently, specific application of our products is determined by the customer and generally is not known to us. We approach all markets with essentially the same products, which are used in a variety of applications from research and development to production testing, monitoring and industrial control. The following industries and applications are served by us worldwide: advanced research, automotive, commercial aerospace, computers and electronics, continuous process manufacturing, education, government/defense, medical research/pharmaceutical, power/energy, semiconductors, automated test equipment, telecommunications and others. TheThese financial statements have been prepared in accordance with accounting principles generally accepted in the United States of America.
Principles of consolidation
The consolidated financial statementsConsolidated Financial Statements include the accounts of National Instruments Corporation and its subsidiaries. All significant intercompany accounts and transactions have been eliminated.
We have historically recorded the excess of the purchase price over the par or stated value of retired shares of our common stock as a reduction of additional paid-in capital. We completed our review of this accounting policy under FASB ASC 505, Equity (FASB ASC 505). Based on this review, we have reclassified a portion of the excess of the purchase price over the par or stated value of retired shares of our common stock from a reduction of additional paid-in capital to a reduction of retained earnings. This reclassification did not have any impact on previously reported statements of income, earning per share amounts, statements of cash flows or total stockholders’ equity. Certain prior year amounts from our Consolidated Statements of Stockholders’ Equity have been reclassified to conform to the 2009 presentation as shown in the following table:
APIC RE 2006 Beginning Balance 12/31/06 balance as previously reported $ 109,851 $ 483,437 Cumulative reclassification of share repurchase 97,957 (97,957 ) 12/31/06 balance as reported in current Form 10-K $ 207,808 $ 385,480 2007 Activity Repurchase and retirement of common stock as previously reported $ (79,701 ) $ — Reclassification of 2007 activity 72,599 (72,599 ) Repurchase and retirement of common stock as reported in current Form 10-K $ (7,102 ) $ (72,599 ) 2007 Ending Balance 12/31/07 balance as previously reported $ 89,809 $ 563,418 Cumulative reclassification of share repurchase 170,556 (170,556 ) 12/31/07 balance as reported in current Form 10-K $ 260,365 $ 392,862 2008 Activity Repurchase and retirement of common stock as previously reported $ (103,600 ) $ — Reclassification of 2008 activity 90,123 (90,123 ) Repurchase and retirement of common stock as reported in current Form 10-K $ (13,477 ) $ (90,123 ) 2008 Ending Balance 12/31/08 balance as previously reported $ 39,673 $ 613,510 Cumulative reclassification of share repurchase 260,679 (260,679 ) 12/31/08 balance as reported in current Form 10-K $ 300,352 $ 352,831
Going forward, we will account for the retired shares of our common stock by recording the excess of the purchase price over par value as a reduction of retained earnings, to the extent that the excess of the purchase price over par value exceeds the original proceeds received from the issuance of the same shares of our common stock, as prescribed by FASB ASC 505.
Use of estimates Judgments and estimates are required in the
The preparation of our financial statements to conformin conformity with U.S. generally accepted accounting principles. Theprinciples requires us to make estimates and underlying assumptions that affect the reported amounts of assets, liabilities, revenues, expenses and liabilities,related disclosures of contingent assets and liabilities. We base our estimates on past experience and other assumptions that we believe are reasonable under the disclosurecircumstances, and we evaluate these estimates on an ongoing basis. Our critical accounting policies are those that affect our financial statements materially and involve difficult, subjective or complex judgments by management. Although these estimates are based on management's best knowledge of contingencies atcurrent events and actions that may impact the balance sheet date andcompany in the reported revenues and expenses forfuture, actual results may be materially different from the period. Actual results could differ from those estimates.
Cash and cash equivalents
Cash and cash equivalents include cash and highly liquid investments with maturities of three months or less at the date of acquisition. Short-term
Short-Term Investments
We maintain an investment portfolio of various types of security holdings and maturities. Pursuant to FASB ASC 820, cash equivalents and short-term investments Short-term available-for-sale are valued using the market approach (Level 1) based on unadjusted quoted prices in active markets for identical assets at the measurement date. Our short-term investments also include auction rate securities that we originally purchased for $8.6 million. These auction rate securities consist of corporate, state and municipaleducation loan revenue bonds. Auction rate securities with readily determinableare variable rate debt instruments whose interest rates are typically reset approximately every 7 to 35 days. In November 2008, we accepted the UBS Auction Rate Securities Rights (“the Rights”) agreement offered by UBS as a liquidity alternative to the failed auction process. The Rights agreement is a nontransferable right to sell our auction rate securities, at par value, back to UBS at any time during the period June 30, 2010, through July 2, 2012. The estimated fair market valuesvalue of both the auction rate securities and maturitiesthe Rights agreement was determined using significant unobservable inputs (Level 3) as prescribed by FASB ASC 820.
We account for our investments in excessdebt and equity instruments under FASB ASC 320. Our investments are classified as available-for-sale and accordingly are reported at fair value, with unrealized gains and losses reported as other comprehensive income, a component of three months at the date of acquisition.stockholders’ equity. Unrealized losses are charged against income when a decline in fair value is determined to be other than temporary. Investments with maturities beyond one year are classified as short-term based on their highly liquid nature and because such marketable securities represent the investment of cash that is available for current operations. Our investments are classified as available-for-sale and accordingly are reported atThe fair value of our short-term investments in debt securities at December 31, 2009 and December 31, 2008 was $87 million and $6 million, respectively. The increase was due to the net purchase of $74 million of short-term investments and the transfer of $8.6 related to our auction rate securities and our rights agreement from long-term investments to short-term investments during the year ended December 31, 2009. The net purchase of $74 million of short term investments was done to diversify our holdings from money market accounts to debt securities and to take advantage of higher yields associated with longer maturity debt securities. We follow the guidance provided by FASB ASC 320 to assess whether our investments with unrealized loss positions are other than temporarily impaired. Realized gains and losses reported as other comprehensive income. Unrealized losses are charged against income when a declineand declines in fair value is determinedjudged to be other than temporary. Thetemporary are determined based on the specific identification method and are reported in other income (expense), net, in our Consolidated Statements of Income.
Accounts Receivable, net
Accounts receivable are recorded net of allowance for sales returns of $1.9 million and $1.8 million at December 31, 2009 and 2008, respectively, and net of allowances for doubtful accounts of $2.7 million and $3.9 million at December 31, 2009 and 2008, respectively. A provision for estimated sales returns is used to determinemade by reducing recorded revenue based on historical experience. We analyze historical returns, current economic trends and changes in customer demand and acceptance of our products when evaluating the costadequacy of securities sold.our sales returns allowance. Our allowance for doubtful accounts is based on historical experience. We analyze historical bad debts, customer concentrations, customer creditworthiness and current economic trends when evaluating the adequacy of our allowance for doubtful accounts.
Year Description Balance atBeginningof Period Provisions Write-Offs Balance atEnd ofPeriod 2007 Allowance for doubtful accounts and sales returns $ 4,360 $ 1,940 $ 698 $ 5,602 2008 Allowance for doubtful accounts and sales returns 5,602 447 367 5,682 2009 Allowance for doubtful accounts and sales returns 5,682 337 1,400 4,619
Inventories
Inventories are stated at the lower-of-cost or market. Cost is determined using standard costs, which approximate the first-in first-out (FIFO)(“FIFO”) method. Cost includes the acquisition cost of purchased components, parts and subassemblies, in-bound freight costs, labor and overhead. Market is replacement cost with respect to raw materials and is net realizable value with respect to work in process and finished goods.
Inventory is shown net of adjustment for excess and obsolete inventories of $5.2$4.4 million and $6.0$4.4 million at December 31, 20062009 and 2005,2008, respectively.
Long-Term Investments
At December 31, 2008, our long-term investments primarily consisted of auction rate securities that we originally purchased for $8.6 million as well as our Rights agreement with UBS. At December 31, 2008, we classified these investments as long-term due to the fact that the market for these securities was inactive, the underlying securities generally had contractual maturities that were in excess of the guidelines provided for in our investment policy, the fact that we had the ability to hold the debt instruments to their ultimate maturity and the fact that we had not made a determination as to whether we would exercise our rights under the Rights agreement. The auction rate securities were classified as available-for-sale. At December 31, 2008, we reported our auction rate securities at their estimated fair market value of $7.0 million and our Rights agreement at its estimated fair market value of $1.6 million. The estimated fair market value of both the auction rate securities and the Rights agreement was determined using significant unobservable inputs (Level 3) as prescribed by FASB ASC 820. These auction rate securities and the Rights agreement are now reported as a component of short-term investments as discussed above.
Property and equipment
Property and equipment are recorded at cost. Depreciation is computed using the straight-line method over the estimated useful lives of the assets, which range from twenty to forty years for buildings, three to seven years for purchased internal use software and for equipment which are each included in furniture and equipment. Leasehold improvements are depreciated over the shorter of the life of the lease or the asset.
Intangible assets
We capitalize costs related to the development and acquisition of certain software products. In accordance with Statement of Financial Accounting Standards (“SFAS”) 86,Accounting for the Costs of Computer Software to Be Sold, Leased or Otherwise Marketed,FASB ASC 985, capitalization of costs begins when technological feasibility has been established and ends when the product is available for general release to customers. Technological feasibility for our products is established when the product is available for beta release. Amortization is computed on an individual product basis for those products available for market and is recognized based on the product’s estimated economic life, generally three years. Patents are amortized using the straight-line method over their estimated period of benefit, generally ten to seventeen years. At each balance sheet date, the unamortized costs for all intangible assets are reviewed by management and reduced to net realizable value when necessary.
Goodwill
GoodwillThe excess purchase price over the fair value of assets acquired is recorded as goodwill. As we have one operating segment, we allocate goodwill to one reporting unit for goodwill impairment testing. In accordance with SFAS 142,FASB ASC 350, Intangibles – Goodwill and Other Intangible Assets, (FASB ASC 350), goodwill is tested for impairment on an annual basis, and between annual tests if indicators of potential impairment exist, using a fair-value-based approach.approach based on the market capitalization of the reporting unit. Our annual impairment test was performed on April 6, 2006.as of February 28, 2009. No impairment of goodwill was identified.has been identified during the period presented. Goodwill is deductible for tax purposes in certain jurisdictions.
Concentrations of credit risk Financial
We maintain cash and cash equivalents with various financial institutions located in many countries throughout the world. At December 31, 2009, $85 million or 42% of our cash and cash equivalents was held in cash in various operating accounts with financial institutions throughout the world and $116 million or 58% was held in money market accounts. The most significant of our operating accounts was our domestic operating account which held approximately $22 million or 11% of our total cash and cash equivalents at a bank that carried an A1 rating at December 31, 2009. From a geographic standpoint, approximately $78 million or 39% was held in various domestic accounts with financial institutions and $123 million or 61% was held in various accounts outside of the U. S. with financial institutions. At December 31, 2009, our short-term investments consist of $35 million or 40% of foreign government bonds, $21 million or 24% of U.S. treasuries and agencies, $12 million or 14% of municipal bonds, $9 million or 10% of auction rate securities and our auction rate securities put option, $8 million or 9% of corporate bonds and $3 million or 3% in time deposits.
The goal of our investment policy is to manage our investment portfolio to preserve principal and liquidity while maximizing the return on our investment portfolio through the full investment of available funds. We place our cash investments in instruments that potentially subject us to concentrationsmeet credit quality standards, as specified in our corporate investment policy guidelines. These guidelines also limit the amount of credit risk consist principallyexposure to any one issue, issuer or type of instrument. With the exception of our auction rate security from the Vermont Student Assistance Corporation, at December 31, 2009, our cash equivalents and short-term investments carried ratings from the major credit rating agencies that were in accordance with our corporate investment policy. Our investment policy allows investments in the following; government and federal agency obligations, repurchase agreements (“Repos”), certificates of deposit and time deposits, corporate obligations, medium term notes and deposit notes, commercial paper including asset-backed commercial paper (“ABCP”), puttable bonds, general obligation and revenue bonds, money market funds, taxable commercial paper, corporate notes/bonds, municipal notes, municipal obligations, variable rate demand notes and tax exempt commercial paper. All such instruments must carry minimum ratings of A1/P1/F1, MIG1/VMIG1/SP1 and A2/A/A, as applicable, all of which are considered “investment grade”. Our investment policy for marketable securities requires that all securities mature in three years or less, with a weighted average maturity of no longer than 18 months with at least 10% maturing in 90 days or less. We actively monitor our investment portfolio to ensure compliance with our investment objective to preserve capital, meet liquidity requirements and maximize return on our investments. We do not require collateral or enter into master netting arrangements to mitigate our credit risk. (See Note 2 – Cash, cash equivalents, short-term and long-term investments in Notes to Consolidated Financial Statements for further discussion and analysis of our investments.).
At December 31, 2009, we held foreign currency forward and option contracts cashwith an aggregate notional amount of $148.4 million with various counterparties and cash equivalents, short-term investments and trade accounts receivable. We have no significant concentrations of credit risk at December 31, 2006.with varying maturity dates. Our counterparties in our foreign currency forward and option contracts are major financial institutions. We do not anticipate nonperformance by these counterparties. We maintain cash(See Note 4 – Derivative instruments and cash equivalents with various financial institutions locatedhedging activities in many countries worldwide. Our short-term investments are diversified among and limitedNotes to high-quality securities with high credit ratings. Consolidated Financial Statements).
Concentration of credit risk with respect to trade accounts receivable is limited due to the large number of customers and their dispersion across many countries and industries. The amount of sales to any individual customer did not exceed 3% of revenue for the periods presented. The largest trade account receivable from any individual customer at December 31, 20062009 was approximately $1.8$1.9 million.
Key supplier risk
Our manufacturing processes use large volumes of high-quality components and subassemblies supplied by outside sources. Several of thosethese components are available through singlesole or limited sources. Supply shortages of or quality problems in connection with some of these key components could require us to procure components from replacement suppliers, which would cause significant delays in fulfillment of orders and likely result in additional costs. In order to manage this risk, we maintain safety stock of some of these single sourced components and subassemblies and perform regular assessments of suppliers performance, grading key suppliers in critical areas such as quality and “on-time” delivery.
Revenue recognition
We derive revenue primarily from the sale/licensing of integrated hardware and software solutions. We also sellIndependent sales of application software licenses which are sold separately as well as training andinclude post contract support services. In addition, training services are sold separately. The products and services are generally sold under standardized licensing and sales arrangements with payment terms ranging from net 30 days in the United States to net 30 days and up to net 90 days in some international markets. Approximately 95%83% of our product/license sales include both hardware and software in the customer arrangement, with a small percentage of sales including other services. We offer rights of return and standard warranties for product defects related to our products. The rights of return are generally for a period of up to 30 days after the delivery date. The standard warranties cover periods ranging from 90 days to three years. With the exception of our former German systems integration subsidiary, which accounted for less than 1.5% of our revenues in the year ended December 31, 2004, weWe do not generally enter into contracts requiring product acceptance from the customer. This subsidiary was sold in December 2004.
Revenue is recognized in accordance with the provisions of SOP 97-2FASB ASC 985, when persuasive evidence of an arrangement exists, delivery has occurred, the fee is fixed or determinable, and collectability is probable. We enter into certain arrangements where we are obligated to deliver multiple products and/or services (“multiple elements”). In these transactions, we allocate the total revenue among the elements based on vendor specific objective evidence (“VSOE”) of fair value as determined by the sales price of each element when sold separately (“vendor-specific objective evidence”). Salesseparately.
When VSOE of fair value is available for the undelivered element of a multiple element arrangements, sales revenue from product sales is generally recognized on the date the product is shipped, using the residual method under FASB ASC 985, with a portion of revenue recorded as deferred (unearned) due to applicable undelivered elements. Undelivered elements for our multiple-elementmultiple element arrangements with a customer are generally restricted to post contract support and training and education. The amount of revenue allocated to these undelivered elements is based on the vendor-specific objective evidence (“VSOE”)VSOE of fair value for those undelivered elements. Deferred revenue due to undelivered elements is recognized ratably on a straight-line basis over the service period or when the service is completed. When VSOE of fair value is not available for the undelivered element of a multiple element arrangement, sales revenue is generally recognized ratably, on a straight-line basis over the service period of the undelivered element, generally 12 months or when the service is completed in accordance with the subscription method under FASB ASC 985. Deferred revenue at December 31, 20062009 and 20052008 was $22.2$57 million and $16.0$46 million, respectively.
The application of SOP 97-2FASB ASC 985 requires judgment, including whether a software arrangement includes multiple elements, and if so, whether VSOE of fair value exists for those elements. Changes to the elements in a software arrangement, the ability to identify VSOE for those elements, the fair value of the respective elements, and changes to a product'sproduct’s estimated life cycle could materially impact the amount of our earned and unearned revenue. Judgment is also required to assess whether future releases of certain software represent new products or upgrades and enhancements to existing products. Provision
Product revenue
Our product revenue is generated predominantly from the sales of measurement and automation products. Our products consist of application software and hardware components together with related driver software.
Software maintenance revenue
Software maintenance revenue is post contract customer support that provides the customer with unspecified upgrades/updates and technical support.Shipping and handling costsOur shipping and handling costs charged to customers are included in net sales, and the associated expense is recorded in cost of sales for estimated sales returns is made by reducing recorded revenue based on historical experience. Management analyzes historical returns, current economic trends, and changes in customer demand and acceptance of our products when evaluating the adequacy of our allowance for sales returns. The accounts receivable are net of allowance for sales returns of $1.5 million and $1.3 million at December 31, 2006 and 2005, respectively. Similarly, management must make estimates of the uncollectability of our accounts receivables. Management specifically analyzes accounts receivable and analyzes historical bad debts, customer concentrations, customer credit-worthiness and current economic trends when evaluating the adequacy of our allowance for doubtful accounts. The accounts receivable are net of allowances for doubtful accounts of $2.9 million and $3.4 million at December 31, 2006 and 2005, respectively.all periods presented.
Warranty reserve
We offer a one-year limited warranty on most hardware products, with a two or three-year warranty on a subset of our hardware products, which is included in the sales price of many of our products. Provision is made for estimated future warranty costs at the time of the sale pursuant to SFAS 5,Accounting for Loss FASB ASC 450, Contingencies (FASB ASC 450), for the estimated costs that may be incurred under the basic limited warranty. Our estimate is based on historical experience and product sales during this period.
The warranty reserve for the years ended December 31, 20062009 and 2005,2008, respectively, was as follows (in thousands):2006
2005
Balance at the beginning of the period $ 915 $ 815 Accruals for warranties issued during the period 1,593 1,652 Settlements made (in cash or in kind) during the period (1,641 ) (1,552 )
Balance at the end of the period $ 867 $ 915
2009 2008 Balance at the beginning of the period $ 952 $ 750 Accruals for warranties issued during the period 1,991 1,836 Settlements made (in cash or in kind) during the period (2,022 ) (1,634 ) Balance at the end of the period $ 921 $ 952
Loss contingencies
We accrue for probable losses from contingencies including legal defense costs, on an undiscounted basis, in accordance with SFAS 5, Accounting for Loss FASB ASC 450, Contingencies (FASB ASC 450), when such costs are considered probable of being incurred and are reasonably estimable. We periodically evaluate available information, both internal and external, relative to such contingencies and adjust this accrual as necessary.
Advertising expense
We expense costs of advertising as incurred. Advertising expense for the years ended December 31, 2006, 20052009, 2008 and 20042007 was $47.3$13.6 million, $42.5$19.3 million and $39.7$20.0 million, respectively.
Foreign currency translation
The functional currency for our international sales operations is the applicable local currency. The assets and liabilities of these operations are translated at the rate of exchange in effect on the balance sheet date and sales and expenses are translated at average rates. The resulting gains or losses from translation are included in a separate component of other comprehensive income. Gains and losses resulting from re-measuring monetary asset and liability accounts that are denominated in a currency other than a subsidiary’s functional currency are included in net foreign exchange gain (loss) and are included in net income.
Foreign currency hedging instruments
All of our derivative instruments are recognized on the balance sheet at their fair value. We currently use foreign currency forward and purchased option contracts to hedge our exposure to material foreign currency denominated receivables and forecasted foreign currency cash flows.
On the date the derivative contract is entered into, we designate the derivative as either a hedge of the fair value of foreign currency denominated receivables (“fair-value” hedge) or as a hedge of the variability of foreign currency cash flows to be received or paid (“cash flow” hedge). Changes in the fair market value or as a hedge of a fair-value hedge are recorded, along with the loss or gain on the re-measurement of foreign-currency-denominated receivables, in current earnings.our foreign denominated net receivable positions (“other derivatives”). Changes in the fair value of derivatives that are designated and qualify as cash flow hedges under SFAS 133FASB ASC 815, Derivatives and Hedging (FASB ASC 815) and that are deemed to be highly effective are recorded in other comprehensive income. These amounts are subsequently reclassified into earnings in the period during which the hedgehedged transaction is realized. The gain or loss on the other derivatives as well as the offsetting gain or loss on the hedged item attributable to the hedged risk is recognized in current earnings under the line item “Net foreign exchange gain (loss)”. We do not enter into derivative contracts for speculative purposes.
We formally document all relationships between hedging instruments and hedged items, as well as our risk-management objective and strategy for undertaking various hedge transactions. This process includes linking all derivatives that are designated as fair-value or cash flow hedges to specific assets and liabilities on the balance sheet or to specific firm commitments or forecasted transactions. We also formally assess, both at the hedge’s inception and on an ongoing basis, whether the hedging instruments are highly effective in offsetting changes in cash flows of hedged items.
We prospectively discontinue hedge accounting if (1) it is determined that the derivative is no longer highly effective in offsetting changes in the fair value of a hedged item (forecasted transactions); or (2) the derivative is de-designated as a hedge instrument, because it is unlikely that a forecasted transaction will occur. When hedge accounting is discontinued, the derivative is sold and the resulting gains and losses are recognized immediately in earnings.
Income taxes
We account for income taxes under the asset and liability method as set forth in SFAS 109,Accounting for FASB ASC 740, Income Taxes.Taxes (FASB ASC 740). Deferred tax assets and liabilities are recognized for the expected tax consequences of temporary differences between the tax bases of assets and liabilities and their reported amounts. Valuation allowances are established when necessary to reduce deferred tax assets to amounts which are more likely than not to be realized.
Earnings per share On January 21, 2004, we declared a stock split effected in the form of a dividend of one share of common stock for each two shares of common stock outstanding. The dividend was paid on February 20, 2004 to holders of record as of the close of business on February 5, 2004. All per share data and numbers of common shares, where appropriate, have been retroactively adjusted to reflect the stock split.
Basic earnings per share (“EPS”) is computed by dividing net income by the weighted average number of common shares outstanding during each period. Diluted EPS is computed by dividing net income by the weighted average number of common shares and common share equivalents outstanding (if dilutive) during each period. The number of common share equivalents, which include stock options and restricted stock units, is computed using the treasury stock method.
The reconciliation of the denominators used to calculate basic EPS and diluted EPS for the years ended December 31, 2006, 20052009, 2008 and 2004,2007, respectively, are as follows (in thousands):Years Ended December 31,
2006
2005
2004
Weighted average shares outstanding-basic 79,519 78,552 78,680 Plus: Common share equivalents Stock options, restricted stock units 2,000 2,358 3,416
Weighted average shares outstanding-diluted 81,519 80,910 82,096
Years Ended December 31, 2009 2008 2007 Weighted average shares outstanding-basic�� 77,520 78,567 79,468 Plus: Common share equivalents Stock options, restricted stock units 506 948 1,575 Weighted average shares outstanding-diluted 78,026 79,515 81,043
Stock options to acquire 3,295,000, 3,056,0002,711,976, 2,402,934 and 2,523,0002,304,078 shares for the years ended December 31, 2006, 20052009, 2008 and 2004,2007, respectively, were excluded in the computations of diluted EPS because the effect of including the stock options would have been anti-dilutive.
Stock-based compensation plans
Effective January 1, 2006, we adopted Statement of Financial Accounting Standards 123R (“SFAS 123R”),“Share-based Payments”FASB ASC 718, Compensation – Stock Compensation (FASB ASC 718), using the modified-prospective-transition method. Under this method, prior periods are not restated. Under this transition method, stock compensation cost recognized beginning January 1, 2006 includes: (a) compensation cost for all share-based payments granted prior to, but not yet vested as of January 1, 2006, based on the grant date fair value estimated in accordance with the original provisions of SFAS 123,FASB ASC 718, and (b) compensation cost for all share-based payments granted on or subsequent to January 1, 2006, based on the grant-date fair value estimated in accordance with the provisions of SFAS 123R.FASB ASC 718. Prior
Comprehensive income
Our comprehensive income is comprised of net income, foreign currency translation and unrealized gains and losses on forward and option contracts and securities available-for-sale. Comprehensive income for 2009, 2008 and 2007 was $20.1 million, $88.2 million and $111.6 million, respectively.
Recently Issued Accounting Pronouncements
In April 2009, the FASB updated FASB ASC 820 providing additional guidance for estimating fair value when the volume and level of activity for the asset or liability have significantly decreased. This update also includes guidance on identifying circumstances that indicate a transaction is not orderly. We adopted the update on April 1, 2009 as required and concluded it did not have a material impact on our consolidated financial position or results of operations.
In September 2009, the FASB updated FASB ASC 105, Generally Accepted Accounting Principles (FASB ASC 105). The update establishes the FASB Standards Accounting Codification (“Codification”) as the source of authoritative U.S. generally accepted accounting principles (“GAAP”) recognized by the FASB to adopting SFAS 123R, we presentedbe applied to nongovernmental entities and rules and interpretive releases of the SEC as authoritative GAAP for SEC registrants. The Codification supersedes all tax benefitsexisting non-SEC accounting and reporting standards. This update is effective for financial statements issued for interim and annual periods ending after September 15, 2009. We adopted the update on July 1, 2009, as required and concluded it did not have a material impact on our consolidated financial position or results of deductions resultingoperations.
In October 2009, the FASB updated FASB ASC 605, Revenue Recognition (FASB ASC 605) that amended the criteria for separating consideration in multiple-deliverable arrangements. The amendments establish a selling price hierarchy for determining the selling price of a deliverable. The selling price used for each deliverable will be based on vendor-specific objective evidence if available, third–party evidence if vendor-specific objective evidence is not available, or estimated selling price if neither vendor-specific objective evidence nor third-party evidence is available. The amendments will change the application of the residual method of allocation and require that arrangement consideration be allocated at the inception of the arrangement to all deliverables using the relative selling price method. The relative selling price method allocates any discount in the arrangement proportionally to each deliverable on the basis of each deliverable’s selling price. This update will be effective prospectively for revenue arrangements entered into or materially modified in fiscal years beginning on or after June 15, 2010. Early adoption is permitted. We are currently evaluating the requirements of this update and have not yet determined the impact on our consolidated financial statements.
In October 2009, the FASB updated FASB ASC 985, Software (FASB ASC 985) that changes the accounting model for revenue arrangements that include both tangible products and software elements. Tangible products containing software components and nonsoftware components that function together to deliver the tangible product’s essential functionality are no longer within the scope of the software revenue guidance in Subtopic 985-605. In addition, the amendments require that hardware components of a tangible product containing software components always be excluded from the exercisesoftware revenue guidance. This update will be effective prospectively for revenue arrangements entered into or materially modified in fiscal years beginning on or after June 15, 2010. Early adoption is permitted. We are currently evaluating the requirements of stock grants as operatingthis update and have not yet determined the impact on our consolidated financial statements.
Cash, cash flows. SFAS 123R requires the cash flows resulting from the tax benefits from tax deductions in excessequivalents, short-term and long-term investments consist of the compensation costfollowing (in thousands):
As ofDecember 31, 2009 As ofDecember 31, 2008 Cash and cash equivalents: Cash $ 85,612 $ 100,967 Cash equivalents: Time deposits — 73,400 Money market accounts 115,853 55,033 Total cash and cash equivalents $ 201,465 $ 229,400 Short-term investments: Municipal bonds $ 12,549 $ 6,220 Corporate bonds 7,587 — U.S. treasuries and agencies 21,033 — Foreign government bonds 34,674 — Time deposits 2,753 — Auction rate securities 8,177 — Auction rate securities put option 423 — Total short-term investments 87,196 6,220 Long-term investments: Auction rate securities — 6,964 Auction rate securities put option — 1,636 Other long-term investments — 1,900 Total investments $ 87,196 $ 16,720 Total cash, cash equivalents and investments $ 288,661 $ 246,120
The following table summarizes unrealized gains and losses related to our investments designated as available-for-sale (in thousands):
As of December 31, 2009 Adjusted Cost GrossUnrealized Gain GrossUnrealized Loss Cumulative Translation Adjustment Fair Value Municipal bonds $ 12,491 $ 58 $ — $ — $ 12,549 Corporate bonds 7,478 110 (1 ) — 7,587 U.S. treasuries and agencies 21,080 — (47 ) — 21,033 Foreign government bonds 36,105 76 — (1,507 ) 34,674 Time deposits 2,753 — — — 2,753 Auction rate securities 8,600 — (423 ) — 8,177 Auction rate securities put option — 423 — — 423 Total investments $ 88,507 $ 667 $ (471 ) $ (1,507 ) $ 87,196
As of December 31, 2008 Adjusted Cost GrossUnrealized Gain GrossUnrealized Loss Fair Value Municipal securities $ 6,199 $ 28 $ (7 ) $ 6,220 Auction rate securities 8,600 — (1,636 ) 6,964 Auction rate securities put option — 1,636 — 1,636 Other long-term investments 1,900 — — 1,900 Total investments $ 16,699 $ 1,664 $ (1,643 ) $ 16,720
The following table summarizes the contractual maturities of our investments designated as available-for-sale (in thousands):
As of December 31, 2009 Adjusted Cost Fair Value Due in less than 1 year $ 44,029 $ 43,267 Due in 1 to 5 years 44,478 43,929 Total investments $ 88,507 $ 87,196
As of December 31, 2009 Due in less than 1 year Adjusted Cost Fair Value Municipal bonds $ 4,103 $ 4,110 Corporate bonds 5,384 5,473 U.S. treasuries and agencies 5,065 5,057 Foreign government bonds 18,124 17,274 Time deposits 2,753 2,753 Auction rate securities 8,600 8,177 Auction rate securities put option — 423 Total investments $ 44,029 $ 43,267
As of December 31, 2009 Due in 1 to 5 years Adjusted Cost Fair Value Municipal bonds $ 8,388 $ 8,439 Corporate bonds 2,094 2,114 U.S. treasuries and agencies 16,015 15,976 Foreign government bonds 17,981 17,400 Time deposits — — Auction rate securities — — Auction rate securities put option — — Total investments $ 44,478 $ 43,929
Note 3 – Fair value measurements
FASB ASC 820, clarifies the definition of fair value, prescribes methods for measuring fair value, establishes a fair value hierarchy based on the inputs used to measure fair value and expands disclosures about the use of fair value measurements. Effective January 1, 2009, we adopted FASB ASC 820 for our nonfinancial assets and nonfinancial liabilities, except those items recognized (excess tax benefits) to be classifiedor disclosed at fair value on an annual or more frequently recurring basis. The adoption of FASB ASC 820 did not have a material impact on our fair value measurements as financing cash flows. Aswe did not have any items that were measured at fair value on a result, $4.3 million of excess tax benefitsnonrecurring basis for the year ended December 31, 20062009. In April 2009, FASB ASC 820 was updated to provide additional guidance for estimating fair value when the volume and level of activity for the asset or liability have been classified as financing cash flows. Prior tosignificantly decreased. The update also includes guidance on identifying circumstances that indicate a transaction is not orderly. We adopted the effective date of SFAS 123R, we applied Accounting Principles Board Opinion 25 (“APB 25”),“Accounting for Stock Issued to Employees”update on April 1, 2009 and related interpretations forit did not have a material impact on our stock option grants. APB 25 providesfair value measurements.
The following tables present our assets and liabilities that are measured at fair value on a recurring basis and are categorized using the compensation expense relative to our stock options is measuredfair value hierarchy. The fair value hierarchy has three levels based on the intrinsicreliability of the inputs used to determine fair value.
Fair Value Measurements at Reporting Date Using Description December 31, 2009 Quoted Prices in Active Markets for Identical Assets(Level 1) Significant Other Observable Inputs(Level 2) Significant Unobservable Inputs(Level 3) Assets Money Market Funds $ 115,853 $ 115,853 $ — $ — Short-term investments available-for-sale 87,196 78,596 — 8,600 Derivatives 11,016 — 11,016 — Total Assets $ 214,065 $ 194,449 $ 11,016 $ 8,600 Liabilities Derivatives $ (318 ) $ — $ (318 ) $ — Total Liabilities $ (318 ) $ — $ (318 ) $ —
Fair Value Measurements Using Significant Unobservable Inputs(Level 3) Short-term investmentsavailable-for-sale Beginning Balance, January 1, 2008 $ 8,600 Total gains (realized/unrealized) Included in earnings 423 Included in other comprehensive income — Total losses (realized/unrealized) Included in earnings (423 ) Included in other comprehensive income — Purchases, issuances and settlements — Transfer in and/or out of Level 3 — Ending Balance, December 31, 2009 $ 8,600 The amount of total gains or (losses) for the period included in earnings (or changes in net assets) attributableto the change in unrealized gains or losses relating to assets still held at the reporting date $ —
Short-term investments available-for-sale are valued using a market approach (Level 1) based on the quoted market prices of identical instruments when available or other observable inputs such as trading prices of identical instruments in inactive markets. Short-term investments available-for-sale consist of debt securities issued by states of the U.S. and political subdivisions of the states, corporate debt securities and debt securities issued by U.S. government corporations and agencies. All short-term investments available-for-sale have contractual maturities of less than 24 months.
Derivatives include foreign currency forward and option contracts. Our foreign currency forward contracts are valued using an income approach (Level 2) based on the spot rate less the contract rate multiplied by the notional amount. Our foreign currency option contracts are valued using a market approach based on the quoted market prices which are derived from observable inputs including current and future spot rates, interest rate spreads as well as quoted market prices of identical instruments.
Short-term debt securities available-for-sale included in Level 3 are reported at their fair market value and consist of auction rate securities backed by education loan revenue bonds. One of our auction rate securities is from the Vermont Student Assistance Corporation and has a par value of $2.2 million. The other of our auction rate securities is from the New Hampshire Health and Education Facilities Authority and has a par value of $6.4 million. The ratings for these securities at December 31, 2009, were Baa3/A/AAA and Aaa/NR/AAA, respectively. Historically, we reported the fair market value of these securities at par as differences between par value and the purchase price or settlement value were historically comprised of accrued interest. Auction rate securities are variable rate debt instruments whose interest rates are typically reset approximately every 7 to 35 days. On January 15, 2010, and in prior auction periods beginning in February 2008, the auction process for these securities failed. At December 31, 2009, we reported these as short-term investments at their estimated fair market value of $8.2 million.
In November 2008, we accepted the UBS Auction Rate Securities Rights (the “Rights”) agreement offered by UBS as a liquidity alternative to the failed auction process. This Rights agreement is related to the auction rates securities discussed above. The Rights agreement is a nontransferable right to sell our auction rate securities, at par value, back to UBS at any time during the period June 30, 2010, through July 2, 2012. At December 31, 2009, we reported the Rights agreement at its estimated fair market value of $423,000 as a component of short-term debt securities available for sale.
Due to the fact that our Rights agreement has an initial exercise date that is less than one year from now, we are now reporting our auction rate securities and the corresponding Rights agreement as short-term. We continue to have the ability to hold our auction rate securities to their ultimate maturities which are in excess of one year and we have not made a determination as to whether we will exercise our option under the Rights agreement or if we do choose to exercise our option, at what point during the period June 30, 2010 through July 2, 2012, we would exercise our option. However, due to the fact that our Rights agreement has an initial exercise date that is less than one year from now, we are now reporting our auction rate securities and the corresponding Rights agreement as short-term. We have recorded the unrealized loss related to the auction rate securities and the unrealized gain related to the Rights agreement as a component of other income (expense), in our Consolidated Statements of Income.
The estimated fair market value of both the auction rate securities and the Rights agreement was determined using significant unobservable inputs (Level 3) as prescribed by FASB ASC 820. We considered many factors in determining the fair market value of the stockauction rate securities as well as our corresponding Rights agreement at December 31, 2009, including the fact that the debt instruments underlying the auction rate securities have redemption features which call for redemption at 100% of par value, current credit curves for like securities and discount factors to account for the illiquidity of the market for these securities. During the year ended December 31, 2009, we did not make any changes to our valuation techniques or related inputs.
FASB ASC 815 requires companies to recognize all of their derivative instruments as either assets or liabilities in the statement of financial position at fair value. The accounting for changes in the fair value (i.e., gains or losses) of a derivative instrument depends on whether it has been designated and qualifies as part of a hedging relationship and further, on the type of hedging relationship. For those derivative instruments that are designated and qualify as hedging instruments, a company must designate the hedging instrument, based upon the exposure being hedged, as a fair value hedge, cash flow hedge, or a hedge of a net investment in a foreign operation.
We have operations in over 40 countries. Sales outside of the Americas as a percentage of consolidated sales were 57% and 57% for the years ended December 31, 2009 and 2008, respectively. Our activities expose us to a variety of market risks, including the effects of changes in foreign currency exchange rates. These financial risks are monitored and managed by us as an integral part of our overall risk management program.
We maintain a foreign currency risk management strategy that uses derivative instruments (foreign currency forward and purchased option contracts) to help protect our earnings and cash flows from fluctuations caused by the volatility in currency exchange rates. Movements in foreign currency exchange rates pose a risk to our operations and competitive position, since exchange rate changes may affect our profitability and cash flow, and the business or pricing strategies of our non-U.S. based competitors.
The vast majority of our foreign sales are denominated in the customers’ local currency. We purchase foreign currency forward and option contracts as hedges of forecasted sales that are denominated in foreign currencies and as hedges of foreign currency denominated receivables. These contracts are entered into to protect against the risk that the eventual dollar-net-cash inflows resulting from such sales or firm commitments will be adversely affected by changes in exchange rates. We also purchase foreign currency forward contracts as hedges of forecasted expenses that are denominated in foreign currencies. These contracts are entered into to protect against the risk that the eventual dollar-net-cash outflows resulting from foreign currency operating and cost of revenue expenses will be adversely affected by changes in exchange rates.
In accordance with FASB ASC 815, we designate foreign currency forward and purchased option contracts as cash flow hedges of forecasted revenues or forecasted expenses. In addition, we hedge our foreign currency denominated balance sheet exposures using foreign currency forward contracts. These derivatives are not designated as hedging instruments under FASB ASC 815. None of our derivative instruments contain a credit-risk-related contingent feature.
Cash flow hedges
To protect against the reduction in value caused by a fluctuation in foreign currency exchange rates of forecasted foreign currency cash flows resulting from international sales over the next one to two years, we have instituted a foreign currency cash flow hedging program. We hedge portions of our forecasted revenue and forecasted expenses denominated in foreign currencies with forward and purchased option contracts. For forward contracts, when the dollar strengthens significantly against the foreign currencies, the change in the present value of future foreign currency cash flows may be offset by the change in the fair value of the forward contracts designated as hedges. For option contracts, when the dollar strengthens significantly against the foreign currencies, the change in the present value of future foreign currency cash flows may be offset by the change in the fair value of the option contracts net of the premium paid designated as hedges. Our foreign currency purchased option contracts are purchased “at-the-money” or “out-of-the-money”. We purchase foreign currency forward and option contracts for up to 100% of our forecasted exposures in selected currencies (primarily in Euro, Japanese yen, British pound sterling, South Korean won and Hungarian forint) and limit the duration of these contracts to 40 months or less.
For derivative instruments that are designated and qualify as a cash flow hedge, the effective portion of the gain or loss on the derivative is reported as a component of accumulated other comprehensive income (“OCI”) and reclassified into earnings in the same line item (net sales, operating expenses, or cost of sales) associated with the forecasted transaction and in the same period or periods during which the hedged transaction affects earnings. Gains and losses on the derivative representing either hedge ineffectiveness or hedge components excluded from the assessment of effectiveness are recognized in current earnings or expenses during the current period and are classified as a component of “net foreign exchange gain (loss)”. Hedge effectiveness of foreign currency forwards and purchased option contracts designated as cash flow hedges are measured by comparing the hedging instrument’s cumulative change in fair value from inception to maturity to the forecasted transaction’s terminal value.
We held forward contracts with a notional amount of $28.6 million dollar equivalent of Euro, $4.0 million dollar equivalent of British pound sterling, $24.4 million dollar equivalent of Japanese yen, and $17.8 million dollar equivalent of Hungarian forint at dateDecember 31, 2009. These contracts are for terms of grant.up to 24 months. At December 31, 2008, we held forward contracts with a notional amount of $54.9 million dollar equivalent of Euro, $6.2 million dollar equivalent of British pound sterling, $18.9 million dollar equivalent of Japanese yen, $4.7 million dollar equivalent of South Korean won and $21.7 million dollar equivalent of Hungarian forint.
We held purchased option contracts with a notional amount of $28.4 million dollar equivalent of Euro at December 31, 2009. These contracts are for terms of up to 12 months. At December 31, 2008, we held purchased option contracts with a notional amount of $111.3 million dollar equivalent of Euro.
At December 31, 2009, we expect to reclassify $2.8 million of gains on derivative instruments from accumulated other comprehensive income to net sales during the next twelve months when the hedged international sales occur. At December 31, 2009, we expect to reclassify $3.7 million of gains on derivative instruments from accumulated OCI to cost of sales and $2.0 million of gains on derivative instruments from accumulated OCI to operating expenses during the next twelve months when the hedged international expenses occur. Expected amounts are based on derivative valuations at December 31, 2009. Actual results may vary as a result of changes in the corresponding exchange rate subsequent to this date.
During the year ended December 31, 2009, hedges with a notional amount of $22.8 million were determined to be ineffective. As a result, we recorded a net gain of adopting SFAS 123R$1.2 million related to these hedges as a component of “net foreign exchange gain (loss)” during the year ended December 31, 2009. We did not record any gains or losses due to the ineffectiveness of our hedges during the year ended December 31, 2008.Other Derivatives
Other derivatives not designated as hedging instruments under FASB ASC 815 consist primarily of foreign currency forward contracts that we use to hedge our foreign denominated net receivable or net payable positions to protect against the change in value caused by a fluctuation in foreign currency exchange rates. We typically hedge up to 90% of our outstanding foreign denominated net receivables or net payables and typically limit the duration of these foreign currency forward contracts to approximately 90 days. The gain or loss on the derivatives as well as the offsetting gain or loss on the hedge item attributable to the hedged risk is recognized in current earnings under the line item “net foreign exchange gain (loss)”. As of December 31, 2009 and December 31, 2008, we held foreign currency forward contracts with a notional amount of $45.2 million and $67.1 million, respectively.
Effective January 1, 2006,2009, we adopted the updated disclosure requirements of FASB ASC 815. The following table presents the fair value of derivative instruments on our income before income taxesConsolidated Balance Sheets and net incomethe effect of derivative instruments on our Consolidated Statements of Income.
Fair Values of Derivative Instruments (in thousands):
In thousands Asset Derivatives December 31, 2009 December 31, 2008 Balance Sheet Location Fair Value Balance Sheet Location Fair Value Derivatives designated as hedginginstruments under FASB ASC 815 Foreign exchange contracts – ST forwards Prepaid expenses and other current assets $ 7,947 Prepaid expenses and other current assets $ 5,260 Foreign exchange contracts – LT forwards Other long-term assets 274 Other long-term assets 2,654 Foreign exchange contracts – ST options Prepaid expenses and other current assets 1,821 Prepaid expenses and other current assets 5,705 Foreign exchange contracts – LT options Other long-term assets — Other long-term assets 3,838 Total derivatives designated ashedging instruments under FASB ASC 815 $ 10,042 $ 17,457 Derivatives not designated ashedging instruments under FASB ASC 815 Foreign exchange contracts – ST forwards Prepaid expenses and other current assets $ 974 Prepaid expenses and other current assets $ 2,745 Total derivatives not designated ashedging instruments under FASB ASC 815 $ 974 $ 2,745 Total derivatives $ 11,016 $ 20,202
Liability Derivatives December 31, 2009 December 31, 2008 Balance Sheet Location Fair Value Balance Sheet Location Fair Value Derivatives designated as hedginginstruments under FASB ASC 815 Foreign exchange contracts – ST forwards Accrued expenses and other liabilities $ — Accrued expenses and other liabilities $ (1,803 ) Foreign exchange contracts – LT forwards Other long-term liabilities — Other long-term liabilities — Foreign exchange contracts – ST options Accrued expenses and other liabilities — Accrued expenses and other liabilities — Foreign exchange contracts – LT options Other long-term liabilities — Other long-term liabilities — Total derivatives designated ashedging instruments under FASB ASC 815 $ — $ (1,803 ) Derivatives not designated ashedging instruments under FASB ASC 815 Foreign exchange contracts – ST forwards Accrued expenses and other liabilities $ (318 ) Accrued expenses and other liabilities $ (3,280 ) Total derivatives not designated ashedging instruments under FASB ASC 815 $ (318 ) $ (3,280 ) Total derivatives $ (318 ) $ (5,083 )
The following table shows the effect of derivative instruments on our Consolidated Statements of Income for the year ended December 31, 2006 are $9.42009 (in thousands):
Derivatives in FASB ASC 815 Cash Flow Hedging Relationship Amount of Gain or (Loss) Recognized in OCI on Derivative (Effective Portion) (in thousands) Location of Gain or (Loss) Reclassified from Accumulated OCI into Income (Effective Portion) Amount of Gain or (Loss) Reclassified from Accumulated OCI into Income (Effective Portion) (in thousands) Location of Gain or (Loss) Recognized in Income on Derivative (Ineffective Portion and Amount Excluded from Effectiveness Testing) Amount of Gain or (Loss) Recognized in Income on Derivative (Ineffective Portion and Amount Excluded from Effectiveness Testing) 2009 2009 2009 Foreign exchange contracts – forwards and options $ (6,304 ) Net sales $ 1,399 Net foreign exchange gain (loss) $ 1,132 Foreign exchange contracts – forwards and options 2,055 Cost of sales (74 ) Net foreign exchange gain (loss) (41 ) Foreign exchange contracts – forwards and options 1,427 Operating expenses 517 Net foreign exchange gain (loss) 81 Total $ (2,822 ) $ 1,842 $ 1,172
Derivatives not Designated as Hedging Instruments under FASB ASC 815 Location of Gain (Loss) Recognized in Income on Derivative Amount of Gain (Loss) Recognized in Income on Derivative 2009 Foreign exchange contracts – forwards Net foreign exchange gain/(loss) $ (1,669 ) Total $ (1,669 )
Note 5 – Inventories
Inventories, net consist of the following (in thousands):
December 31, 2009 2008 Raw materials $ 42,121 $ 48,004 Work-in-process 2,042 4,150 Finished goods 42,352 55,204 $ 86,515 $ 107,358
Note 6 – Property and equipment
Property and equipment consist of the following (in thousands):
December 31, 2009 2008 Land $ 17,076 $ 7,210 Buildings 138,367 136,802 Furniture and equipment 154,558 144,979 310,001 288,991 Accumulated depreciation (156,736 ) (134,514 ) $ 153,265 $ 154,477
Depreciation expense for the years ended December 31, 2009, 2008 and 2007, was $22.3 million, $20.9 million and $22.2 million, respectively.
Intangibles at December 31, 2009 and 2008 are as follows:
2009 2008 Gross Carrying Amount Accumulated Amortization Net Carrying Amount Gross Carrying Amount Accumulated Amortization Net Carrying Amount Capitalized software development costs $ 38,928 $ (20,455 ) $ 18,473 $ 25,610 $ (11,344 ) $ 14,266 Acquired technology 28,022 (20,967 ) 7,055 27,503 (16,804 ) 10,699 Patents 19,033 (5,377 ) 13,656 16,068 (4,506 ) 11,562 Other 12,577 (8,371 ) 4,206 11,401 (6,013 ) 5,388 $ 98,560 $ (55,170 ) $ 43,390 $ 80,582 $ (38,667 ) $ 41,915
Software development costs capitalized during 2009, 2008 and 2007 were $13.3 million, $9.5 million and $8.3 million, respectively, and related amortization was $9.1 million, $10.3 million and $8.9 million, respectively. Included in these capitalized costs for the years ended December 31, 2009, 2008, and 2007 were costs related to stock based compensation of $734,000, $451,000 and $422,000, respectively. Amortization of capitalized software development costs is computed on an individual product basis for those products available for market and is recognized based on the product’s estimated economic life, generally three years. Patents are amortized using the straight-line method over their estimated period of benefit, generally ten to seventeen years. Total intangible assets amortization expenses were $16.5 million, $16.2 million and $14.4 million for the years ended December 31, 2009, 2008 and 2007, respectively.
Capitalized software development costs, acquired technology, patents and other have weighted-average useful lives of 2.2 years, 1.8 years, 5.3 years, and 1.8 years, respectively, as of December 31, 2009. The estimated future amortization expense related to intangible assets as of December 31, 2009 is as follows:
Amount(in thousands) 2010 $ 18,097 2011 12,986 2012 7,187 2013 1,868 2014 1,186 Thereafter 2,066 $ 43,390
Acquisition intangibles are amortized over their useful lives, which range from three to eight years. Amortization expense for acquisition intangibles was approximately $3.9 million and $4.2 million for 2009 and 2008, respectively, of which approximately $3.4 million and $3.6 million was recorded in cost of sales and approximately $503,000 and $580,000 was recorded in operating expenses for 2009 and 2008, respectively. The estimated amortization expense of acquisition intangibles in future years will be recorded in our Consolidated Statements of Income as follows (in thousands):
Fiscal Year Cost of Sales Acquisition related costs and amortization, net Total 2010 $ 2,701 $ 369 $ 3,070 2011 2,160 221 2,381 2012 1,126 206 1,332 2013 87 75 162 Thereafter — — — Total $ 6,074 $ 871 $ 6,945
Note 8 – Goodwill
The carrying amount of goodwill for 2008 and 2009 are as follows:
Amount(in thousands) Balance as of December 31, 2007 $ 54,111 Acquisitions/purchase accounting adjustments 10,818 Divestitures — Foreign currency translation impact (368 ) Balance as of December 31, 2008 $ 64,561 Acquisitions/purchase accounting adjustments — Divestitures — Foreign currency translation impact 218 Balance as of December 31, 2009 $ 64,779
The excess purchase price over the fair value of assets acquired is recorded as goodwill. As we have one operating segment, we allocate goodwill to one reporting unit for goodwill impairment testing. In accordance with FASB ASC 350, goodwill is tested for impairment on an annual basis, and between annual tests if indicators of potential impairment exist, using a fair-value-based approach based on the market capitalization of the reporting unit. Our annual impairment test was performed as of February 28, 2009. No impairment of goodwill has been identified during the period presented. Goodwill is deductible for tax purposes in certain jurisdictions.
The components of income before income taxes are as follows (in thousands):
Years Ended December 31, 2009 2008 2007 Domestic $ 34,953 $ 15,921 $ 31,685 Foreign 15,292 82,216 81,742 $ 50,245 $ 98,137 $ 113,427
The provision for income taxes charged to operations is as follows (in thousands):
Years Ended December 31, 2009 2008 2007 Current tax expense: U.S. federal $ 3,117 $ 14,631 $ 15,957 State 136 1,391 1,155 Foreign 13,760 18,910 9,925 Total current 17,013 34,932 27,037 Deferred tax expense (benefit): U.S. federal 9,920 (11,008 ) 628 State 387 (373 ) (156 ) Foreign (2,864 ) (1,570 ) (2,783 ) Total deferred 7,443 (12,951 ) (2,311 ) Change in valuation allowance 8,704 (8,671 ) (18,332 ) Total provision $ 33,160 $ 13,310 $ 6,394
Deferred tax liabilities (assets) at December 31, 2009 and 2008 as follows (in thousands):
December 31, 2009 2008 Capitalized software $ 5,978 $ 4,615 Depreciation and amortization 10,577 9,536 Unrealized gain on derivative instruments — 4,153 Undistributed earnings of foreign subsidiaries 9,278 10,075 Gross deferred tax liabilities 25,833 28,379 Operating loss carryforwards (57,422 ) (43,360 ) Intangible assets (44,159 ) (58,987 ) Vacation and other accruals (3,700 ) (4,890 ) Inventory valuation and warranty provisions (6,702 ) (12,665 ) Doubtful accounts and sales provisions (1,088 ) (1,512 ) Unrealized exchange loss (917 ) (1,345 ) Deferred revenue . (853 ) (71 ) Accrued rent expenses (111 ) (117 ) Accrued legal expenses (710 ) (1,466 ) Unrealized loss on derivative instruments (242 ) — 10% minority stock investment (900 ) (920 ) Stock-based compensation (4,483 ) (5,353 ) Research and development tax credit carryforward (2,054 ) — Foreign tax credit carryforward (1,775 ) — Other (657 ) (783 ) Gross deferred tax assets (125,773 ) (131,469 ) Valuation allowance 99,862 85,815 Net deferred tax liability (asset) $ (78 ) $ (17,275 )
A reconciliation of income taxes at the U.S. federal statutory income tax rate to the effective tax rate follows:
Years Ended December 31, 2009 2008 2007 U.S. federal statutory tax rate 35 % 35 % 35 % Domestic production activities — — (1 ) Foreign taxes (less) than federal statutory rate (6 ) (9 ) (14 ) Change in valuation allowance 17 (9 ) (16 ) Research and development tax credit (4 ) (2 ) (1 ) Tax exempt interest — (1 ) (1 ) State income taxes, net of federal tax benefit 1 1 1 Employee share-based compensation 7 2 2 Intercompany profit 15 (5 ) — Other 1 2 1 Effective tax rate 66 % 14 % 6 %
Certain prior year amounts in the reconciliation of income taxes at the U.S. federal statutory income tax rate to the effective tax rate have been reclassified to conform to the 2009 presentation as shown in the following tables:
2008 foreign taxes (less) than federal statutory rate as reported in prior year Form 10-K (14 ) Reclassification (a) 5 2008 foreign taxes (less) than federal statutory rate as reported in current year Form 10-K (9 ) 2008 intercompany profit as reported in prior year Form 10-K — Reclassification (a) (5 ) 2008 intercompany profit as reported in current year Form 10-K (5 )
(a) These amounts represent income taxes on intercompany profit previously included in foreign taxes (less) than the federal statutory rate and reclassified to intercompany profit for comparability to corresponding amounts reported in 2009. The reclassification did not have any impact on our total income tax expense.
For the year ended December 31, 2009, we generated a federal net operating loss of approximately $3.3 million and tax credits of approximately $3.8 million. The federal net operating loss can be carried back two years and the federal tax credits can be carried back one year.
As of December 31, 2009, eleven of our subsidiaries have available, for income tax purposes, foreign net operating loss carryforwards of an aggregate of approximately $286 million, of which $12.1 million expire during the years 2011 - - 2018 and $273.9 million of which may be carried forward indefinitely. Our tax valuation allowance relates to our ability to realize certain of these foreign net operating loss carryforwards and benefits of tax deductible goodwill in excess of book goodwill.
We maintain a manufacturing facility in Hungary. As a result of certain foreign investment incentives available under Hungarian law, the profit from our Hungarian operation was subject to a reduced income tax rate. This special tax status terminated on January 1, 2008, with the merger of our Hungary manufacturing operations with its Hungarian parent company. The merger was effective on January 1, 2008. The aggregate tax benefit of the exemption was $8.7 million lower, respectively, than if we had continued to account for share-based compensation under APB 25. Basic and diluted earnings per share for the year ended December 31, 2006 are $0.112007.
In 2003, we restructured the organization of our manufacturing operation in Hungary. The tax deductible goodwill in excess of book goodwill created by this restructuring resulted in our being required to record a gross deferred tax asset of $91.0 million. Because we did not expect to have sufficient taxable income in the relevant jurisdiction in future periods to realize the benefit of this deferred tax asset, a full valuation allowance was established. Following the approval of the merger of our Hungarian manufacturing operation with its Hungarian parent company in December 2007, we released $8.7 million and $0.11 lower,$18.3 million in 2008 and 2007, respectively, than if we had continued to account for share-based compensation under APB 25. Deferred stock-based compensation balancesof the valuation allowance previously required under APB 25 were adjusted against previously recorded common stock and additional paid-in capital balances upon adoption of SFAS 123R, as required. Had we previously recognized compensation costs as prescribed by SFAS 123, previously reported net income, basic earnings per share and diluted earnings per share would have changed to the pro forma amounts shown below (in thousands, except per share amounts):
Years Ended December 31,
2005
2004
Net income, as reported $ 61,517 $ 48,610 Stock-based compensation included in reported net income, net of related tax effects 959 — Total stock-based compensation expense determined under fair value method for all awards, net of related tax effects (13,998 ) (12,741 )
Pro-forma net income $ 48,478 $ 35,869
Earnings per share: Basic - as reported $ 0.78 $ 0.62 Basic - pro-forma $ 0.62 $ 0.46 Diluted - as reported $ 0.76 $ 0.59 Diluted - pro-forma $ 0.60 $ 0.44
Pro-forma disclosuresestablished for the excess tax deductible goodwill to reflect the tax benefit we expected to realize in future periods.
For the year 2009, we expected to recognize an additional tax benefit of $9.7 million related to these assets. Effective January 1, 2010, a new tax law in Hungary provides for an enhanced deduction for the qualified research and development expenses of NI Hungary Software and Hardware Manufacturing Kft. ("NI Hungary"). During the three months ended December 31, 2006 are2009, we obtained confirmation of the application of this new tax law for the qualified research and development expenses of NI Hungary. Based on the application of this new tax law to the qualified research and development expense of NI Hungary, we no longer expect to have sufficient future taxable income in Hungary to realize the benefits of these tax assets. As such, we recorded an income tax charge of $21.6 million during the three months ended December 31, 2009, $18.4 million of which was related to a valuation allowance on the previously recognized assets created by the restructuring and $3.2 million of which was related to tax benefits from other assets that we will no longer be able to realize as a result of this change. We do not presented becauseexpect to realize the amounts aretax benefit of the remaining assets created by the restructuring and therefore we have a full valuation allowance of $98.2 million against those assets at December 31, 2009.
We have not provided for U.S. federal income and foreign withholding taxes on approximately $267.5 million of certain non-U.S. subsidiaries’ undistributed earnings as of December 31, 2009. These earnings would become subject to taxes of approximately $85.7 million, if they were actually or deemed to be remitted to the parent company as dividends or if we should sell our stock in these subsidiaries. We intend to permanently reinvest the undistributed earnings.
We adopted the provisions of FASB ASC 740, on January 1, 2007. FASB ASC 740 clarifies the accounting for uncertainty in income taxes recognized in an entity's financial statements and prescribes a recognition threshold and measurement attribute for financial statement disclosure of tax positions taken or expected to be taken on a tax return. We recognized no material adjustment to the Consolidated Statementsliability for unrecognized income tax benefits. A reconciliation of Income.the beginning and ending amount of unrecognized tax benefit is as follows (in thousands):
2009 2008 Balance at beginning of period $ 9,364 $ 8,273 Additions based on tax positions related to the current year 2,060 1,946 Additions for tax positions of prior years 1,272 366 Reductions as a result of the lapse of the applicable statute of limitations (1,634 ) (1,221 ) Balance at end of period $ 11,062 $ 9,364
All of our unrecognized tax benefits at December 31, 2009 would affect our effective income tax rate if recognized. As of December 31, 2009, it is deemed reasonably possible that the Company will recognize tax benefits in the amount of $2.3 million in the next twelve months due to the closing of open tax years. The nature of the uncertainty relates to deductions taken on returns that have not been examined by the applicable tax authority.
We recognize interest and penalties related to income tax matters in income tax expense. During the years ended December 31, 2009 and 2008, we recognized interest expense related to uncertain tax positions of approximately $506,000 and $365,000, respectively. The tax years 2002 through 2009 remain open to examination by the major taxing jurisdictions in which we file income tax returns.
Note 10 – Stockholders’ equity and stock-based compensation
Stock option plans
Our stockholders approved the 1994 Incentive Stock Option Plan (the “1994 Plan”) on May 9, 1994. At the time of approval, 9,112,500 shares of our common stock were reserved for issuance under this plan. In 1997, an additional 7,087,500 shares of our common stock were reserved for issuance under this plan, and an additional 750,000 shares were reserved for issuance under this plan, as amended, in 2004. The 1994 Plan terminated in May 2005, except with respect to outstanding awards previously granted thereunder. Awards under the plan were either incentive stock options within the meaning of Section 422 of the Internal Revenue Code or nonqualified options. The right to purchase shares vests over a five to ten-year period, beginning on the date of grant. Vesting of ten year awards may accelerate based on the Company’s previous year’s earnings and revenue growth but shares cannot accelerate to vest over a period of less than five years. Stock options must be exercised within ten years from date of grant. Stock options were issued at the market price at the grant date. As part of the requirements of SFAS 123R, the Company isFASB ASC 718, we are required to estimate potential forfeitures of stock grants and adjust compensation cost recorded accordingly. The estimate of forfeitures will be adjusted over the requisite service period to the extent that actual forfeitures differ, or are expected to differ, from such estimates. Changes in estimated forfeitures will be recognized through a cumulative catch-up adjustment in the period of change and will also impact the amount of stock compensation expense to be recognized in future periods.
Transactions under all stock option plans are summarized as follows:Number of
shares under
option
Weighted
average
exercise
price
Outstanding at December 31, 2003 9,726,418 $ 18.07 Exercised (882,539 ) 9.60 Canceled (325,912 ) 27.66 Granted 1,262,599 29.71
Outstanding at December 31, 2004 9,780,566 $ 20.02 Exercised (1,188,614 ) 10.72 Canceled (358,444 ) 29.49 Granted 244,725 24.24
Outstanding at December 31, 2005 8,478,233 $ 21.05 Exercised (1,398,617 ) 13.16 Canceled (164,943 ) 27.32 Granted 0 0
Outstanding at December 31, 2006 6,914,673 $ 22.49
Options exercisable at December 31: 2004 6,353,236 $ 17.23 2005 5,946,139 19.10 2006 5,384,470 21.53
Number of
shares under
option
Weighted
average
fair value
Weighted average, grant date fair value of options granted during: 2004 1,262,599 $ 16.72 2005 244,725 12.85 2006 0 0
Number ofshares underoption Weightedaverageexerciseprice Outstanding at December 31, 2006 6,914,673 $ 22.49 Exercised (1,515,107 ) 15.22 Canceled (104,925 ) 27.33 Granted — — Outstanding at December 31, 2007 5,294,641 $ 24.47 Exercised (925,743 ) 17.30 Canceled (96,331 ) 26.98 Granted — — Outstanding at December 31, 2008 4,272,567 $ 25.97 Exercised (379,630 ) 15.40 Canceled (181,434 ) 26.80 Granted — — Outstanding at December 31, 2009 3,711,503 $ 26.93 Options exercisable at December 31: 2007 4,368,972 $ 24.17 2008 3,812,334 26.00 2009 3,493,574 26.94
The aggregate intrinsic value of stock options at exercise, represented in the table above, was $25.5$2.3 million, $19.1$11.0 million and $18.3$22.3 million for the years ended December 31, 2006, 20052009, 2008 and 2004,2007, respectively. Total unrecognized stock-based compensation expense related to non-vested stock options was approximately $18.1$2.5 million as of the end of 2006,December 31, 2009, related to approximately 1,530,000218,000 shares with a per share weighted average fair value of $15.93.$17.50. We anticipate this expense to be recognized over a weighted average period of approximately 4.04.3 years.Outstanding and Exercisable by Price Range
As of December 31, 2006
Options Outstanding
Options Exercisable
Range of Exercise prices
Number
outstanding
as of
12/31/2006
Weighted
average
remaining
contractual life
Weighted
average
exercise
price
Number
exercisable
as of
12/31/2006
Weighted
average
exercise price
$8.6667 -$12.2222 1,072,535 1.27 $ 10.98 1,045,669 $ 10.9677 12.3611 - 15.3055 976,976 1.54 $ 15.23 967,192 $ 15.2258 15.5555 - 21.0417 1,720,096 5.18 $ 20.64 1,223,332 $ 20.6330 21.2533 - 29.5400 839,349 6.80 $ 25.53 538,372 $ 25.5261 29.8500 - 34.3750 2,305,717 5.60 $ 31.19 1,609,905 $ 31.5078
$8.6667 - $34.3750 6,914,673 3.94 $ 22.4883 5,384,470 $ 21.5254
Outstanding and Exercisable by Price Range as of December 31, 2009 Options Outstanding Options Exercisable Range of Exercise prices Number outstanding as of 12/31/2009 Weighted average remaining contractual life Weighted average exercise price Number exercisable as of 12/31/2009 Weighted average exercise price $16.08 – $21.95 1,238,441 1.74 $ 20.69 1,188,337 $ 20.71 $22.30 – $29.85 1,257,625 3.90 $ 28.15 1,098,218 $ 28.08 $30.51 – $34.38 1,215,437 0.41 $ 32.02 1,207,019 $ 32.02 $16.08 – $34.38 3,711,503 2.04 $ 26.93 3,493,574 $ 26.94
The weighted average remaining contractual life of options exercisable as of December 31, 20062009 was 3.371.9 years. The aggregate intrinsic value of options outstanding as of December 31, 20062009 was $32.9$9.4 million. The aggregate intrinsic value of options currently exercisable as of December 31, 20062009 was $30.8$8.8 million. No options were granted in the yearyears ended December 31, 20062009, 2008 and 2007 as our incentive option plan terminated in May 2005. The fair value of options granted in 2004 and 2005 were estimated on the date of grant using the Black-Scholes option-pricing model with the following weighted-average assumptions:2005
2004
Dividend expense yield 0.2% 0.2% Expected life 5.5 years 5.5 years Expected volatility 43.3% 53.2% Risk-free interest rate 4.0% 2.7%
Restricted stock plan
Our stockholders approved theour 2005 Incentive Plan on May 10, 2005. At the time of approval, 2,700,000 shares of our common stock were reserved for issuance under this plan, as well as the number of shares which had been reserved but not issued under the 1994 Plan (our incentive stock option plan which terminated in May 2005), and any shares that returned to the 1994 Plan as a result of termination of options or repurchase of shares issued under such plan. The 2005 Plan, administered by the Compensation Committee of the Board of Directors, provides for granting of incentive awards in the form of restricted stock and restricted stock units (“RSUs”) to directors, executive officers and employees of the Company and its subsidiaries. Awards vest over a three, five or ten-year period, beginning on the date of grant. Vesting of ten year awards may accelerate based on the Company’s previous year’s earnings and growth but ten year awards cannot accelerate to vest over a period of less than five years. Shares available for grant at December 31, 20062009 were 3,804,106.2,089,302. As part of the requirements of SFAS 123R, the Company isFASB ASC 718, we are required to estimate potential forfeitures of restricted stock unitsRSUs and adjust compensation cost recorded accordingly. The estimate of forfeitures will be adjusted over the requisite service period to the extent that actual forfeitures differ, or are expected to differ, from such estimates. Changes in estimated forfeitures will be recognized through a cumulative catch-up adjustment in the period of change and will also impact the amount of stock compensation expense to be recognized in future periods.
Transactions under the restricted stock plan2005 Plan are summarized as follows:RSUs
Number of RSUs
Weighted Average Grant Price
Balance at January 1, 2005 0 $ 0.00 Granted 813,305 $ 22.24 Earned 0 $ 0.00 Canceled (15,000 ) $ 22.12
Balance at December 31, 2005 798,305 $ 22.24 Granted 693,805 $ 32.21 Earned (113,794 ) $ 31.67 Canceled (53,383 ) $ 25.93
Balance at December 31, 2006 1,324,933 $ 26.77
RSUs Number of RSUs Weighted Average Grant Price Balance at January 1, 2007 1,324,933 $ 26.77 Granted 801,780 $ 27.90 Earned (209,303 ) $ 27.85 Canceled (75,776 ) $ 27.64 Balance at December 31, 2007 1,841,634 $ 26.86 Granted 763,182 $ 28.51 Earned (320,251 ) $ 29.42 Canceled (119,337 ) $ 28.19 Balance at December 31, 2008 2,165,228 $ 26.99 Granted 604,083 $ 21.80 Earned (407,156 ) $ 22.04 Canceled (57,721 ) $ 27.88 Balance at December 31, 2009 2,304,434 $ 26.48
Total unrecognized stock-based compensation expense related to non-vested restricted stock unitsRSU’s was approximately $32.6$57.1 million as of the end of 2006,December 31, 2009, related to 1,324,9332,304,434 shares with a per share weighted average fair value of $27.24.$26.48. We anticipate this expense to be recognized over a weighted average period of approximately 77.3 years.
Employee stock purchase plan
Our employee stock purchase plan permits substantially all domestic employees and employees of designated subsidiaries to acquire our common stock at a purchase price of 85% of the lower of the market price at the beginning or the end of the participationpurchase period. On December 21, 2005, our Compensation Committee amended theThe plan has quarterly purchase periods to be quarterly beginning on November 1, February 1, May 1, and AugustNovember 1 of each year. The initial period commencedAt our annual shareholders meeting held on April 1, 2006 and ended on July 31, 2006.May 7, 2007, our shareholders approved an additional 3 million shares of common stock to be reserved for issuance under this plan. Employees may designate up to 15% of their compensation for the purchase of common stock.stock under this plan. Common stock reserved for future employee purchases aggregated 823,3091,755,071 shares at December 31, 2006.2009. Shares issued under this plan were 539,541838,536 in the year ended December 31, 2006.2009. The weighted average fair value of the employees’ purchase rights was $22.34$19.05 per share and was estimated using the Black-Scholes model with the following assumptions:2006
2005
2004
Dividend expense yield 0.2% 0.2% 0.2% Expected life 3 months 6 months 6 months Expected volatility 29% 29% 35% Risk-free interest rate 4.5% 3.2% 1.0%
2009 2008 2007 Dividend expense yield 0.5% 0.3% 0.3% Expected life 3 months 3 months 3 months Expected volatility 45% 26% 23% Risk-free interest rate 0.8% 3.8% 5.0%
Weighted average, grant date fair value of purchase rights granted under the Employee Stock Purchase Plan:Number of shares
Weighted average fair value
2004 380,211 $ 7.73 2005 467,932 6.08 2006 539,541 6.62
Plan are as follows:
Numberof shares Weightedaveragefair value 2007 549,719 $ 6.19 2008 679,983 5.86 2009 838,536 5.75
Stock-based compensation included in total cost of sales and operating expenses for the years ended December 31, 2009, 2008 and 2007 are summarized as follows (in thousands):
2009 2008 2007 Stock-based compensation Total cost of sales $ 1,284 $ 1,063 $ 911 Sales and marketing 8,774 8,479 7,322 Research and development 7,236 7,121 6,435 General and administrative 3,005 3,084 2,866 Provision for income taxes (3,765 ) (4,601 ) (3,839 ) Total $ 16,534 $ 15,146 $ 13,695
Authorized Preferred Stock and Preferred Stock Purchase Rights Plan
We have 5,000,000 authorized shares of preferred stock. On January 21, 2004, our Board of Directors designated 750,000 of these shares as Series A Participating Preferred Stock in conjunction with its adoption of a Preferred Stock Rights Agreement (the “Rights Agreement”) and declaration of a dividend of one preferred share purchase right (a “Right”) for each share of common stock outstanding held as of May 10, 2004 or issued thereafter. Each Right will entitle its holder to purchase one one-thousandth of a share of National Instruments’ Series A Participating Preferred Stock at an exercise price of $200, subject to adjustment, under certain circumstances. The Rights Agreement was not adopted in response to any effort to acquire control of National Instruments.
The Rights only become exercisable in certain limited circumstances following the tenth day after a person or group announces acquisitions of or tender offers for 20% or more of our common stock. In addition, if an acquirer (subject to certain exclusions for certain current stockholders of National Instruments, an “Acquiring Person”) obtains 20% or more of our common stock, then each Right (other than the Rights owned by an Acquiring Person or its affiliates) will entitle the holder to purchase, for the exercise price, shares of our common stock having a value equal to two times the exercise price. Under certain circumstances, our Board of Directors may redeem the Rights, in whole, but not in part, at a purchase price of $0.01 per Right. The Rights have no voting privileges and are attached to and automatically traded with our common stock until the occurrence of specified trigger events. The Rights will expire on the earlier of May 10, 2014 or the exchange or redemption of the Rights. Comprehensive income
Our comprehensive income is comprised of net income, foreign currency translation and unrealized gains and losses on forward and option contracts and securities available for sale. Comprehensive income for 2006, 2005 and 2004 was $76.9 million, $57.2 million and $57.7 million, respectively.
Recently issued accounting pronouncements
In July 2006, the Financial Accounting Standards Board (“FASB”) issued FASB Interpretation (“FIN”) 48,Accounting for Uncertainty in Income Taxes – an interpretation of Statement of Financial Accounting Standards (“SFAS”) 109. This interpretation clarifies the accounting for uncertainty in income taxes recognized in an entity’s financial statements in accordance with SFAS 109,Accounting for Income Taxes. It prescribes a recognition threshold and measurement attribute for financial statement disclosure of tax positions taken or expected to be taken on a tax return. This interpretation is effective for fiscal years beginning after December 15, 2006. We adopted FIN 48 on January 1, 2007 as required. The cumulative effect of adopting FIN 48 was recorded in retained earnings upon adoption. The adoption of FIN 48 did not have a significant impact on our financial position or results of operations.
In September 2006, the Securities and Exchange Commission (“SEC”) issued Staff Accounting Bulletin (“SAB”) 108 regarding the process of quantifying financial statement misstatements. SAB 108 states that registrants should use both a balance sheet approach and an income statement approach when quantifying and evaluating the materiality of a misstatement. The interpretations in SAB 108 contain guidance on correcting errors under the dual approach as well as provide transition guidance for correcting errors. This interpretation does not change the requirements within SFAS 154,Accounting Changes and Error Corrections – a replacement of APB 20 and FASB Statement 3, for the correction of an error on financial statements. SAB 108 is effective for annual financial statements covering the first fiscal year ending after November 15, 2006. We adopted this interpretation on December 31, 2006. The adoption of SAB 108 did not have a significant effect on our consolidated financial statements.
In September 2006, the FASB issued SFAS 157,Fair Value Measurements. This standard defines fair value, establishes a framework for measuring fair value in accounting principles generally accepted in the United States of America, and expands disclosure about fair value measurements. This pronouncement applies under other accounting standards that require or permit fair value measurements. Accordingly, this statement does not require any new fair value measurement. This statement is effective for fiscal years beginning after November 15, 2007, and interim periods within those fiscal years. We will be required to adopt SFAS 157 in the first quarter of fiscal year 2008. We are currently evaluating the requirements of SFAS 157 and have not yet determined the impact on our consolidated financial statements.
In March 2006, the Emerging Issues Task Force (“EITF”) reached a consensus on EITF Issue 06-3,How Taxes Collected from Customers and Remitted to Governmental Authorities Should Be Presented in the Income Statement (that is, Gross versus Net Presentation). Taxes within the scope of EITF Issue 06-3 include any taxes assessed by a governmental authority that are directly imposed on a revenue-producing transaction between a seller and a customer and may include, but are not limited to, sales taxes, use taxes, value-added taxes, and some excise taxes. The EITF concluded that the presentation of these taxes on either a gross (included in revenues and costs) or a net (excluded from revenue) basis is an accounting policy decision that should be disclosed. For any such taxes that are reported on a gross basis, a company should disclose the amounts of those taxes in interim and annual financial statements. Our policy is to exclude all such taxes from revenue. The provisions of EITF 06-3 are effective for interim and annual reporting periods beginning after December 15, 2006. The adoption of EITF 06-3 will not have any effect on our consolidated financial statements.
Note 2: Short-term investments
Short-term investments at December 31, 2006 and 2005, consisting of corporate, state and municipal securities, were acquired at an aggregate cost of $150.2 million and $119.8 million, respectively. The contractual maturities of these securities, which are classified as available-for-sale and carried at fair value, are as follows (in thousands):
December 31,
2006
2005
Less than 90 days $ 73,787 $ 61,855 90 days to one year 31,309 42,222 One year through two years 38,559 11,877 Two years or more 6,535 3,892
$ 150,190 $ 119,846
Note 3: Inventories
Inventories, net consist of the following (in thousands):
December 31,
2006
2005
Raw materials $ 38,270 $ 28,497 Work-in-process 4,321 4,634 Finished goods 34,547 29,696
$ 77,138 $ 62,827
Note 4: Property and equipment
Property and equipment consist of the following (in thousands):
December 31,
2006
2005
Land $ 7,165 $ 7,085 Buildings 125,228 124,428 Furniture and equipment 110,710 91,073
243,103 222,586 Accumulated depreciation (97,678 ) (78,256 )
$ 145,425 $ 144,330
Depreciation expense for the years ended December 31, 2006, 2005 and 2004, was $20.2 million, $17.8 million and $17.3 million, respectively.
Note 5: Intangibles
Intangibles at December 31, 2006 and 2005 are as follows:
2006
2005
Gross Carrying Amount
Accumulated Amortization
Net Carrying Amount
Gross Carrying Amount
Accumulated Amortization
Net Carrying Amount
Capitalized software development costs $ 57,571 $ (41,791 ) $ 15,780 $ 50,201 $ (32,651 ) $ 17,550 Acquired technology 20,814 (9,734 ) 11,080 20,257 (6,296 ) 13,961 Patents 12,928 (3,076 ) 9,852 11,647 (2,445 ) 9,202 Other 6,452 (3,099 ) 3,353 4,826 (1,937 ) 2,889
$ 97,765 $ (57,700 ) $ 40,065 $ 86,931 $ (43,329 ) $ 43,602
Software development costs capitalized during 2006, 2005 and 2004 were $7.4 million, $13.4 million and $5.0 million, respectively, and related amortization was $9.1 million, $7.2 million and $6.6 million, respectively. Amortization of capitalized software development costs is computed on an individual product basis for those products available for market and is recognized based on the product’s estimated economic life, generally three years. Patents are amortized using the straight-line method over their estimated period of benefit, generally ten to seventeen years. Total intangible assets amortization expenses were $13.9 million, $10.7 million and $8.3 million for the years ended December 31, 2006, 2005 and 2004, respectively.
Capitalized software development costs, acquired technology, patents and other have weighted-average useful lives of 2.1 years, 4.1 years, 7.7 years and 3.7 years, respectively, as of the end of December 31, 2006. The estimated future amortization expense related to intangible assets as of December 31, 2006 is as follows:
Amount (in thousands)
2007 $ 13,044 2008 10,219 2009 5,046 2010 2,477 2011 1,569 Thereafter 7,710
$ 40,065
We established a valuation reserve in 2004 for the estimated total impairment of our $2.5 million cost-method investment in a start-up company. This impairment was based on our lack of expected recovery of our investment based on the start-up company’s lack of profitability.
Note 6: Goodwill
The carrying amount of goodwill for 2005 and 2006 are as follows:
Amount (in thousands)
Balance as of December 31, 2004 $ 13,356 Acquisitions/purchase accounting adjustments 39,177 Divestitures —
Balance as of December 31, 2005 52,533 Acquisitions/purchase accounting adjustments — Divestitures — Foreign currency translation impact 810
Balance as of December 31, 2006 $ 53,343
The excess purchase price over the fair value of assets acquired is recorded as goodwill. In accordance with SFAS 142,Goodwill and Other Intangible Assets, goodwill is tested for impairment on an annual basis, and between annual tests if indicators of potential impairment exist, using a fair-value-based approach. Our annual impairment test was performed on April 6, 2006. No impairment of goodwill was identified during any of the periods presented.
Note 7: Income taxes
The components of income before income taxes are as follows (in thousands):
Years Ended December 31,
2006
2005
2004
Domestic $ 40,681 $ 40,460 $ 37,786 Foreign 54,621 40,220 27,027
$ 95,302 $ 80,680 $ 64,813
The provision for income taxes charged to operations is as follows (in thousands):
Years Ended December 31,
2006
2005
2004
Current tax expense: U.S. federal $ 17,966 $ 11,022 $ 10,594 State 901 1,029 1,106 Foreign 5,190 3,725 3,300
Total current 24,057 15,776 15,000
Deferred tax expense (benefit): U.S. federal (1,233 ) 2,396 1,041 State (90 ) (102 ) 121 Foreign (140 ) 1,093 41
Total deferred (1,463 ) 3,387 1,203
Total provision $ 22,594 $ 19,163 $ 16,203
Deferred tax liabilities (assets) at December 31, 2006 and 2005 as follows (in thousands):
December 31,
2006
2005
Capitalized software $ 5,392 $ 6,288 Unrealized gain on derivative instruments — 86 Depreciation and amortization 9,071 8,598 Unrealized exchange gain 2 1,238 Undistributed earnings of foreign subsidiaries 10,313 4,410
Gross deferred tax liabilities 24,778 20,620
Operating loss carryforwards (34,154 ) (22,672 ) Intangibles (85,684 ) (71,125 ) Vacation and other accruals (3,783 ) (2,946 ) Inventory valuation and warranty provisions (6,666 ) (9,043 ) Doubtful accounts and sales provisions (1,328 ) (1,545 ) Intercompany profit (3,242 ) (2,442 ) Deferred revenue (2,613 ) — Accrued rent expenses (17 ) (17 ) Accrued legal expenses (1,450 ) (12 ) Unrealized loss on derivative instruments (149 ) — 10% minority stock investment (906 ) (911 ) Stock-based compensation (1,954 ) (563 ) Other (691 ) (629 )
Gross deferred tax assets (142,637 ) (111,905 )
Valuation allowance 117,768 91,534
Net deferred tax liability (asset) $ (91 ) $ 249
A reconciliation of income taxes at the U.S. federal statutory income tax rate to the effective tax rate follows:
Years Ended December 31,
2006
2005
2004
U.S. federal statutory tax rate 35 % 35 % 35 % Foreign sales corporation/ETI benefit (1 ) (2 ) (3 ) Domestic production activities (1 ) (1 ) — Foreign taxes more (less) than federal statutory rate (11 ) (7 ) (6 ) Change in valuation allowance — (1 ) — Research and development tax credit (1 ) (1 ) (1 ) Tax exempt interest (1 ) (1 ) (1 ) State income taxes, net of federal tax benefit 1 1 1 Employee share-based compensation 3 — — Other — 1 —
Effective tax rate 24 % 24 % 25 %
As of December 31, 2006, thirteen of our subsidiaries have available, for income tax purposes, foreign net operating loss carryforwards of an aggregate of approximately $214.4 million, of which $8.5 million expire during the years 2008 — 2013 and $205.9 million of which may be carried forward indefinitely. Our tax valuation allowance relates to the realizability of certain of these foreign net operating loss carryforwards and benefits of tax deductible goodwill in excess of book goodwill.
We maintain a manufacturing facility in Hungary. As a result of certain foreign investment incentives available under Hungarian law, the profit from our Hungarian operation is currently subject to a reduced income tax rate. Based on our capital investment in Hungary and current exemption limits which apply to this and any capital investments made through December 31, 2005, we currently expect this special tax status will terminate on or before December 31, 2008. The aggregate tax benefit of the exemption was $5.4 million and $3.4 million for the years ended December 31, 2006 and 2005, respectively.
In 2003, we restructured the organization of our manufacturing operation in Hungary. The tax deductible goodwill in excess of book goodwill created by this restructuring resulted in our being required to record a gross deferred tax asset of $91.0 million. The amortization of this excess tax deductible goodwill resulted in a $32.1 million and $20.1 million deferred tax asset for the associated net operating loss for the years ended December 31, 2006 and 2005, respectively. As of December 31, 2006 and 2005, the gross deferred tax asset related to the excess tax goodwill was $85.7 million and $71.1 million, respectively. Because we do not expect to have significant taxable income in the relevant jurisdiction in future periods to realize the benefit of these deferred tax assets, a valuation allowance for the entire amount of these deferred tax assets has been established.
We have not provided for U.S. federal income and foreign withholding taxes on approximately $111.8 million of certain non-U.S. subsidiaries’ undistributed earnings as of December 31, 2006. These earnings would become subject to taxes of approximately $36.5 million, if they were actually or deemed to be remitted to the parent company as dividends or if we should sell our stock in these subsidiaries. We currently intend to reinvest indefinitely these undistributed earnings.
Note 8: Stockholders’ equity
Stock repurchases and retirements In
Since 1998, our Board of Directors approved theand we maintained various stock repurchase and retirement of shares of common stock to reduce the dilutive effect of our stock plans.programs. Pursuant to the 1998 repurchase programthese plans we have repurchasedhad purchased and retired a total of 1,402,7257,354,966 shares for approximately $23.1$184.9 million from 1998 through December 31, 2007. During 2008, we purchased an additional 4,110,042 share for approximately $103.6 million. In 2002,At December 31, 2008, there were 723,092 shares available for repurchase under the plan approved in April 2008. On January 23, 2009, our Board of Directors approved a new share repurchase and retirement plan which replacedthat increased the 1998 plan. Underaggregate number of shares of common stock we are authorized to purchase from 591,324 to 3.0 million. During 2009, we purchased an additional 1,443,441 shares for approximately $34.6 million. At December 31, 2009, there were 1,688,327 shares available for repurchase under the plan approved in 2002, weJanuary 2009. Our share repurchase plan does not have authorization to repurchase up to 6,222,106 shares of National Instruments stock. This plan has noan expiration date. Pursuant to our repurchase program, we have repurchased and retired a total of 3,222,106 shares for approximately $82.0 million.
Note 9:11 – Employee retirement plan
We have a defined contribution retirement plan pursuant to Section 401(k) of the Internal Revenue Code. Substantially all domestic employees with at least thirty30 days of continuous service are eligible to participate and may contribute up to 15% of their compensation. The Board of Directors has elected to make matching contributions equal to 50% of employee contributions, which may be applied to a maximum of 6% of each participant’s compensation. Employees are eligible for our matching contributions after one year of continuous service. Company contributions vest immediately. Our policy prohibits participants from direct investment in shares of our common stock within the plan. Company contributions charged to expense were $3.0$3.9 million, $2.6$3.7 million and $2.4$3.3 million in 2006, 20052009, 2008 and 2004,2007, respectively.
Fair value of financial instrumentsIn accordance with FASB ASC 280, Segment Reporting (FASB ASC 280), we determine operating segments using the management approach. The estimated fair value amounts disclosed below have been determined using available market informationmanagement approach designates the internal organization that is used by management for making operating decisions and valuation methodologies described below. For certainassessing performance as the source of our financial instruments, including cashoperating segments. It also requires disclosures about products and cash equivalents, accounts receivable, accounts payableservices, geographic areas and accrued liabilities,major customers.
We have defined our operating segment based on geographic regions. We sell our products in three geographic regions. Our sales to these regions share similar economic characteristics, similar product mix, similar customers, and similar distribution methods. Accordingly, we have elected to aggregate these three geographic regions into a single operating segment. Revenue from the carrying amount approximates fair value due to the short-term maturity of these instruments. The estimated fair values of the other assets (liabilities)sale of our remaining financial instruments at December 31, 2006products which are similar in nature and 2005software maintenance are reflected as total net sales in our Consolidated Statements of Income.
Total net sales, operating income, interest income and long-lived assets, classified by the major geographic areas in which we operate, are as follows (in thousands):December 31,
2006
2005
Carrying
Amount
Fair
Value
Carrying
Amount
Fair
Value
Short-term investments $ 150,190 $ 150,190 $ 119,846 $ 119,846 Other assets/liabilities: Forward contracts (1,043 ) (1,043 ) 523 523
The fair values of short-term investments
Years Ended December 31, 2009 2008 2007 Net sales: Americas: Unaffiliated customer sales $ 292,999 $ 355,878 $ 331,482 Geographic transfers 86,145 132,563 115,709 379,144 488,441 447,191 Europe: Unaffiliated customer sales 210,188 267,373 230,940 Geographic transfers 189,076 204,282 159,992 399,264 471,655 390,932 Asia Pacific: Unaffiliated customer sales 173,407 197,286 177,956 Eliminations (275,221 ) (336,845 ) (275,701 ) $ 676,594 $ 820,537 $ 740,378
Years Ended December 31, 2009 2008 2007 Operating income: Americas $ 46,816 $ 71,467 $ 76,292 Europe 87,250 105,748 92,469 Asia Pacific 45,439 61,642 59,845 Unallocated: Research and development expenses (132,974 ) (143,140 ) (126,515 ) $ 46,531 $ 95,717 $ 102,091
Years Ended December 31, 2009 2008 2007 Interest income: Americas $ 803 $ 2,603 $ 5,138 Europe 727 3,291 4,485 Asia Pacific 99 102 199 $ 1,629 $ 5,996 $ 9,822
December 31, 2009 2008 Long-lived assets: Americas $ 100,489 $ 107,701 Europe 36,555 39,280 Asia Pacific 16,221 7,496 $ 153,265 $ 154,477
Total sales outside the United States for 2009, 2008 and foreign currency forward contracts2007 were estimated based upon quotes from brokers as of the applicable balance sheet date.$412.7 million, $499.3 million and $437.0 million, respectively.
Note 11: Derivative instruments13 – Commitments, contingencies and hedging activitiesleases
We have operations in 40 countries. Approximately 52% of our revenues are generated outsidecommitments under non-cancelable operating leases primarily for office facilities throughout the Americas. Our activities exposeworld. Certain leases require us to a varietypay property taxes, insurance and routine maintenance, and include escalation clauses. Future minimum lease payments as of market risks, includingDecember 31, 2009, for each of the effects of changes in foreign-currency exchange rates. These financial risksnext five years are monitored and managed by us as an integral part of our overall risk management program. We maintain a foreign-currency risk management strategy that uses derivative instruments (foreign currency forward and purchased options contracts) to protect our earnings and cash flows from fluctuations caused by the volatility in currency exchange rates. Movements in foreign-currency exchange rates pose a risk to our operations and competitive position, since exchange rate changes may affect our profitability and cash flow, and the business or pricing strategies of our non-U.S. based competitors.
Foreign currency fair value and cash flow hedges
The vast majority of our foreign sales are denominated in the customers’ local currency. We purchase foreign currency forward and purchased options contracts as hedges of forecasted sales that are denominated in foreign currencies and as hedges of foreign currency denominated receivables. These contracts are entered into to protect against the risk that the eventual dollar-net-cash inflows resulting from such sales or firm commitments will be adversely affected by changes in exchange rates.
We held forward contracts with notional amounts totaling $19.6follows (in thousands):
2010 $ 14,415 2011 9,898 2012 6,982 2013 4,611 2014 3,665 Thereafter 12,130 $ 51,701
Rent expense under operating leases was approximately $12.3 million, $11.7 million and $24.1$10.2 million at December 31, 2006 and 2005, respectively, that were designated as foreign currency fair value hedges of our foreign denominated receivables. The fair value of these contracts, which are for 90-day periods, is a liability of $617,000 and a receivable of $278,000 at December 31, 2006 and 2005, respectively. We recorded net losses of $1.0 million, net gains of $2.2 million and net losses of $2.6 million for fair value hedges for the years ended December 31, 2006, 20052009, 2008 and 2004, respectively, which was recorded2007, respectively.
As of December 31, 2009, we have non-cancelable purchase commitments with various suppliers of customized inventory and inventory components totaling approximately $6.5 million over the next twelve months.
As of December 31, 2009, we have outstanding guarantees for payment of customs and foreign grants totaling approximately $5.2 million.
Note 14 – Litigation
We filed a patent infringement action on January 25, 2001, in “Foreign Exchange Gain (Loss).” We hedge up to 90%the U.S. District Court, Eastern District of Texas (Marshall Division) claiming that The MathWorks, Inc. (“MathWorks”) infringed certain of our outstanding foreign denominated receivables. We held forward contracts withU.S. patents. On January 30, 2003, a notionaljury found infringement by MathWorks of three of the patents involved and awarded us specified damages. On September 23, 2003, the District Court entered final judgment in favor of us and entered an injunction against MathWorks’ sale of its Simulink and related products and stayed the injunction pending appeal. Upon appeal, the judgment and the injunction were affirmed by the U.S. Court of Appeals for the Federal Circuit (September 3, 2004). Subsequently the stay of injunction was lifted by the District Court. In November 2004, the final judgment amount of $26.6$7.4 million which had been held in escrow pending appeal was released to us.
An action was filed by MathWorks against us on September 22, 2004, in the U.S. District Court, Eastern District of Texas (Marshall Division), claiming that on that day MathWorks had released modified versions of its Simulink and $7.1related products, and seeking a declaratory judgment that the modified products do not infringe the three patents adjudged infringed in the District Court's decision of September 23, 2003 (and affirmed by the Court of Appeals on September 3, 2004). On November 2, 2004, MathWorks served the complaint on us. We filed an answer to MathWorks’ declaratory judgment complaint, denying MathWorks’ claims of non-infringement and alleging our own affirmative defenses. On January 5, 2005, the Court denied a contempt motion by us to enjoin the modified Simulink products under the injunction in effect from the first case. On January 7, 2005, we amended our answer to include counterclaims that MathWorks’ modified products are infringing three of our patents, and requested unspecified damages and an injunction. MathWorks filed its reply to our counterclaims on February 7, 2005, denying the counterclaims and alleging affirmative defenses. On March 2, 2005, we filed a notice of appeal regarding the Court's denial of the contempt motion. On March 15, 2005, the Court stayed MathWorks’ declaratory judgment action, pending a decision on the appeal by the Court of Appeals for the Federal Circuit. On February 9, 2006, the Court of Appeals for the Federal Circuit affirmed the District Court’s January 2005 order. On November 22, 2006, the District Court lifted the stay. The case schedule has yet to be set in this action. During the fourth quarter of 2004, we accrued $4 million at December 31, 2006 and 2005, respectively, that were designated as foreign currency cash flow hedges related to our probable loss from this contingency, which consists entirely of anticipated sales transactions.patent defense costs that are probable of being incurred. In the fourth quarter of 2006, we accrued an additional $600,000 related to this contingency. During the third quarter of 2009, we reduced the accrual by $2 million to reflect a decrease in the estimated costs that are probable of being incurred in this action. To date, we have charged a cumulative total of $623,000 against this accrual. At December 31, 2009, the remaining accrual was $2 million.
On February 1, 2008, we acquired all of the outstanding shares of microLEX Systems ApS, (“microLEX”) a premier provider of virtual instrumentation-based video, audio and mixed-signal test solutions. This acquisition was accounted for as a business combination. The purchase price of the acquisition, which included legal and accounting fees, was $17.8 million in cash. The allocation of the purchase price was determined using the fair value of these contracts, whichassets and liabilities acquired as of February 1, 2008. We funded the purchase price from existing cash balances. Our consolidated financial statements include the operating results from the date of acquisition. Pro-forma results or operations have not been presented because the effects of those operations were not material. The following table summarizes the allocation of the purchase price of microLEX (in thousands):
Goodwill $ 10,818 Acquired core technology 5,201 Non-competition agreements 159 Trademarks 119 Customer relationships 354 Current assets acquired 3,057 Long-term assets acquired 20 Current liabilities assumed (486 ) Deferred tax liabilities (1,458 ) Total assets acquired $ 17,784
Goodwill is not deductible for tax purposes. Existing technology, non-competition agreements, trademarks, and customer relationships have useful lives of 5 years, 3 years, 3 years, and 5 years, respectively, from the date of acquisition. These assets are not deductible for terms uptax purposes.
Note 16 – Quarterly results (unaudited)
The following quarterly results have been derived from unaudited consolidated financial statements that, in the opinion of management, reflect all adjustments (consisting only of normal recurring adjustments) necessary for a fair presentation of such quarterly information. The operating results for any quarter are not necessarily indicative of the results to twelve months, is a liabilitybe expected for any future period. The unaudited quarterly financial data for each of $427,000 and a receivable of $245,000 at December 31, 2006 and 2005, respectively, and a net unrealized deferred loss of $427,000 and a net unrealized deferred gain of $245,000 at December 31, 2006 and 2005, respectively, was recordedthe eight quarters in “Accumulated Other Comprehensive Income.” We hedge up to 100% of anticipated foreign currency denominated sales transactions for up to 40 months. We recorded net losses of $1.0 million and net gains of $105,000 and net losses of $5.8 million for cash flow hedges for the two years ended December 31, 2006, 2005 and 2004, respectively, which was included in “Net Sales.” As of December 31, 2006, $427,000 of deferred losses on cash flow hedges recorded in “Accumulated Other Comprehensive Income” are expected to be reclassified to earnings during the next twelve months. The actual foreign sales expected to occur over the next twelve months will necessitate the reclassifying to earnings of these derivative gains.
Hedge effectiveness of a foreign currency option contract designated as a cash flow hedge is measured by comparing the hedging instrument’s cumulative change in fair value from inception to maturity to the forecasted transaction’s terminal value. No amounts were excluded from the assessment of hedge effectiveness nor were there any amounts of ineffectiveness recorded in the consolidated statements of income for the years ended December 31, 2006 and 2005.
Note 12: Segment information
In accordance with SFAS 131,Disclosures about Segments of an Enterprise and Related Information, we determine operating segments using the management approach. The management approach designates the internal organization that is used by management for making operating decisions and assessing performance as the source of our operating segments. It also requires disclosures about products and services, geographic areas and major customers.
While we sell our products to many different markets, management has chosen to organize the Company by geographic areas, and as a result has determined that we have one operating segment. Substantially all of the interest income, depreciation and amortization is recorded in the Americas. Net sales, operating income and identifiable assets, classified by the major geographic areas in which we operate,2009 are as follows (in thousands)thousands, except per share data):
Years Ended December 31,
2006
2005
2004
Net sales: Americas: Unaffiliated customer sales $ 317,780 $ 275,524 $ 243,651 Geographic transfers 125,096 87,072 84,520
442,876 362,596 328,171
Europe: Unaffiliated customer sales 193,364 171,499 164,895 Geographic transfers 159,369 125,650 99,958
352,733 297,149 264,853
Asia Pacific: Unaffiliated customer sales 149,263 124,818 105,542
Eliminations (284,465 ) (212,722 ) (184,478 )
$ 660,407 $ 571,841 $ 514,088
Years Ended December 31,
2006
2005
2004
Operating income: Americas $ 67,644 $ 63,267 $ 53,472 Europe 78,402 61,790 55,705 Asia Pacific 54,771 40,996 38,211 Unallocated: Research and development expenses (113,095 ) (87,841 ) (84,692 )
$ 87,722 $ 78,212 $ 62,696
December 31,
2006
2005
Identifiable assets: Americas $ 476,027 $ 436,170 Europe 188,388 129,420 Asia Pacific 56,805 42,746
$ 721,220 $ 608,336
Total sales outside
Three Months Ended Mar. 31,2009 Jun. 30,2009 Sep. 30,2009 Dec. 31,2009 Net sales $ 157,799 $ 152,163 $ 165,035 $ 201,597 Gross profit 116,916 111,677 123,136 154,981 Operating income (2,479 ) 2,341 10,688 35,981 Net income 358 4,430 9,931 2,366 Basic earnings per share $ 0.00 $ 0.06 $ 0.13 $ 0.03 Weighted average shares outstanding-basic 77,277 77,556 77,653 77,589 Diluted earnings per share $ 0.00 $ 0.06 $ 0.13 $ 0.03 Weighted average shares outstanding-diluted 77,436 77,824 78,103 78,325 Dividends declared per share $ 0.12 $ 0.12 $ 0.12 $ 0.12
Three Months Ended Mar. 31,2008 Jun. 30,2008 Sep. 30,2008 Dec. 31,2008 Net sales $ 192,918 $ 210,474 $ 215,038 $ 202,107 Gross profit 143,849 157,034 160,531 152,014 Operating income 18,065 27,834 27,946 21,872 Net income 17,616 24,734 23,159 19,318 Basic earnings per share $ 0.22 $ 0.32 $ 0.29 $ 0.25 Weighted average shares outstanding-basic 78,840 78,484 78,834 78,110 Diluted earnings per share $ 0.22 $ 0.31 $ 0.29 $ 0.25 Weighted average shares outstanding-diluted 79,825 79,549 79,841 78,522 Dividends declared per share $ 0.11 $ 0.11 $ 0.11 $ 0.11
Note 17 – Subsequent events
In accordance with FASB ASC 855, Subsequent Events (FASB ASC 855), we have evaluated subsequent events through February 17, 2010, the United States for 2006, 2005 and 2004date the financial statements were $373.7 million, $323.9 million and $293.3 million, respectively.issued.
On January 22, 2010, our Board of Directors declared a quarterly cash dividend of $0.13 per common share, payable March 1, 2010, to shareholders of record on February 8, 2010.
From January 29, 2010 to February 12, 2010, we have repurchased 683,832 shares of our common stock at an average price of $29.97 under our share repurchase plan. The maximum number of shares that may yet be purchased under our plan is 1,004,495. Our purchase plan does not have an expiration date.
Note 13: Commitments, contingencies and leases
We have commitments under non-cancelable operating leases primarily for office facilities. Certain leases require us to pay property taxes, insurance and routine maintenance, and include escalation clauses. Future minimum lease payments as of December 31, 2006, for each of the next five years are as follows (in thousands):
2007 $ 7,241 2008 5,682 2009 4,883 2010 3,103 2011 1,983 Thereafter 799
$ 23,691
Rent expense under operating leases was approximately $8.7 million, $7.8 million and $6.5 million for the years ended December 31, 2006, 2005 and 2004, respectively.
As of December 31, 2006, we have non-cancelable purchase commitments with various suppliers of customized inventory and inventory components totaling approximately $7.0 million over the next twelve months.
As of December 31, 2006, we have outstanding guarantees for payment of customs and foreign grants totaling approximately $3.5 million.
Note 14: ��Litigation
We filed a patent infringement action on January 25, 2001 in the U.S. District Court, Eastern District of Texas (Marshall Division) claiming that The MathWorks, Inc. (“MathWorks”) infringed certain of our U.S. patents. On January 30, 2003, a jury found infringement by MathWorks of three of the patents involved and awarded us specified damages. On June 23, 2003, the District Court entered final judgment in favor of us and entered an injunction against MathWorks’ sale of its Simulink and related products and stayed the injunction pending appeal. Upon appeal, the judgment and the injunction were affirmed by the U.S. Court of Appeals for the Federal Circuit (September 3, 2004). Subsequently the stay of injunction was lifted by the District Court. In November 2004, the final judgment amount of $7.4 million which had been held in escrow pending appeal was released to us.
An action was filed by MathWorks against us on September 22, 2004, in the U.S. District Court, Eastern District of Texas (Marshall Division), claiming that on that day MathWorks had released modified versions of its Simulink and related products, and seeking a declaratory judgment that the modified products do not infringe the three patents adjudged infringed in the District Court’s decision of June 23, 2003, (and affirmed by the Court of Appeals on September 3, 2004). On November 2, 2004, MathWorks served the complaint on us. We filed an answer to MathWorks’ declaratory judgment complaint, denying MathWorks’ claims of non-infringement and alleging our own affirmative defenses. On January 5, 2005, the Court denied a contempt motion by us to enjoin the modified Simulink products under the injunction in effect from the first case. On January 7, 2005, we amended our answer to include counterclaims that MathWorks’ modified products are infringing three of our patents, and requested unspecified damages and an injunction. MathWorks filed its reply to our counterclaims on February 7, 2005, denying the counterclaims and alleging affirmative defenses. On March 2, 2005, we filed a notice of appeal regarding the Court’s denial of the contempt motion. On March 15, 2005, the Court stayed MathWorks’ declaratory judgment action, pending a decision on the appeal by the Court of Appeals for the Federal Circuit. On February 9, 2006, the Court of Appeals for the Federal Circuit affirmed the District Court’s January 2005 order. On November 22, 2006, the District Court lifted the stay. The case schedule has yet to be set in this action. During the fourth quarter of 2004, we accrued $4 million related to our probable loss from this contingency, which consists entirely of anticipated patent defense costs that are probable of being incurred. In the fourth quarter of 2006, we accrued an additional $600,000 related to this contingency. We charged approximately $57,000 against this accrual during the fourth quarter of 2006. We have charged a total of $602,000 against this accrual through December 31, 2006.
Note 15: Acquisitions
On January 31, 2005, we acquired all of the common stock of Toronto, Canada-based Electronics Workbench, a supplier of electronics design automation software. The acquisition was accounted for as a purchase. The purchase price of the acquisition, subject to adjustment as provided for in the purchase agreement, was $12.1 million in cash. We funded the purchase price from existing cash balances. Our consolidated financial statements include the operating results from the date of acquisition. Pro-forma results of operations have not been presented because the effects of those operations were not material. In accordance with SFAS 141, Business Combinations, the total purchase consideration has been allocated to the assets acquired and liabilities assumed, including identifiable intangible assets, based on their respective estimated fair values at the date of acquisition.
On April 29, 2005, we acquired the operating assets of Measurement Computing Corporation (MCC), a provider of low-cost data acquisition products. The acquisition was accounted for as a purchase. We acquired the operating assets of MCC, which included the legal positions of MCC and SoftWIRE in litigation against us. As a result of the asset acquisition, a pending legal action was dismissed with prejudice and we eliminated our remaining $1.9 million accrual for patent defense costs related to MCC. The gain that resulted from the elimination of the accrual was recorded in general and administrative expenses. The purchase price of the acquisition, subject to adjustment as provided for in the purchase agreement, was $33.2 million in cash. We funded the purchase price from existing cash balances. Our consolidated financial statements include the operating results from the date of acquisition. Pro-forma results of operations have not been presented because the effects of those operations were not material. In accordance with SFAS 141, the total purchase consideration has been allocated to the assets acquired and liabilities assumed, including identifiable assets, based on their respective estimated fair values at the date of acquisition.
On October 17, 2005, we acquired the operating assets of IOtech, Inc., a provider of PC-based data acquisition and instrumentation products. The acquisition was accounted for as a purchase. The purchase price of the acquisition, subject to adjustment as provided for in the purchase agreement, was $17.6 million in cash. We funded the purchase price from existing cash balances. Our consolidated financial statements include the operating results from the date of acquisition. Pro-forma results of operations have not been presented because the effects of those operations were not material. In accordance with SFAS 141, the total purchase consideration has been allocated to the assets acquired and liabilities assumed, including identifiable assets, based on their respective estimated fair values at the date of acquisition.
Goodwill is deductible for tax purposes. Goodwill is not amortized but is reviewed periodically for impairment. Acquired core technology and intangible assets are amortized over their useful lives, which range from three to eight years. Amortization expense for intangible assets acquired was approximately $3.2 million and $2.0 million for 2006 and 2005, respectively, of which approximately $2.7 million and $1.5 million was recorded in cost of sales and approximately $490,000 and $490,000 was recorded in operating expenses. The estimated amortization expense of intangible assets acquired for the current fiscal year and in future years will be recorded in the consolidated statements of income as follows (in thousands):
Fiscal Year
Cost of Sales
Acquisition related costs and amortization, net
Total
2007 $ 2,689 $ 450 $ 3,139 2008 2,532 412 2,944 2009 2,259 338 2,597 2010 1,725 177 1,902 Thereafter 1,166 271 1,437
Total $ 10,371 $ 1,648 $ 12,019
Note 16: Related party transactions
During 2002, we contributed approximately $3.6 million to the National Instruments Foundation, a 501(c)(3) charitable foundation established in 2002 for the purpose of continued promotion of scientific and engineering research and education at higher education institutions worldwide. This contribution was recorded as general and administrative expense in 2002. Two of the four directors of the National Instruments Foundation are current officers of National Instruments.
Note 17: Quarterly results (unaudited)
The following quarterly results have been derived from unaudited consolidated financial statements that, in the opinion of management, reflect all adjustments (consisting only of normal recurring adjustments) necessary for a fair presentation of such quarterly information. The operating results for any quarter are not necessarily indicative of the results to be expected for any future period. The unaudited quarterly financial data for each of the eight quarters in the two years ended December 31, 2006 are as follows (in thousands, except per share data):
Three Months Ended
Mar. 31, 2006
Jun. 30, 2006
Sep. 30, 2006
Dec. 31, 2006
Net sales $ 154,752 $ 160,123 $ 164,079 $ 181,453 Gross profit 113,247 119,271 121,648 135,915 Operating income 15,826 20,911 22,367 28,616 Net income 12,602 17,021 18,651 24,434 Basic earnings per share $ 0.16 $ 0.21 $ 0.23 $ 0.31 Weighted average shares outstanding-basic 79,053 79,611 79,637 79,767 Diluted earnings per share $ 0.15 $ 0.21 $ 0.23 $ 0.30 Weighted average shares outstanding-diluted 81,608 81,653 81,274 81,524 Dividends declared per share $ 0.06 $ 0.06 $ 0.06 $ 0.06
Three Months Ended
Mar. 31, 2005
Jun. 30, 2005
Sep. 30, 2005
Dec. 31, 2005
Net sales $ 129,740 $ 140,822 $ 141,618 $ 159,661 Gross profit 97,376 104,109 103,725 117,322 Operating income 14,182 19,093 18,343 26,594 Net income 11,136 15,024 14,399 20,958 Basic earnings per share $ 0.14 $ 0.19 $ 0.18 $ 0.27 Weighted average shares outstanding-basic 79,175 78,303 78,158 78,505 Diluted earnings per share $ 0.14 $ 0.19 $ 0.18 $ 0.26 Weighted average shares outstanding-diluted 81,924 80,190 80,575 80,821 Dividends declared per share $ 0.05 $ 0.05 $ 0.05 $ 0.05
Note 18: Subsequent Event
On January 30, 2007, our Board of Directors declared a quarterly cash dividend of $0.07 per common share, payable March 5, 2007, to shareholders of record on February 12, 2007.
On January 30, 2007, our Board of Directors granted authorization for the repurchase of an additional 1,522,106 shares of our common stock under our share repurchase plan.
SCHEDULE II
NATIONAL INSTRUMENTS CORPORATION
VALUATION AND QUALIFYING ACCOUNTS
(In thousands)
Allowance for doubtful accounts and sales returns:
Year
Description
Balance at Beginning of Period
Provision for Bad Debt Expense
Write-Offs Charged to Allowances
Balance at End of Period
2004 Allowance for doubtful accounts and sales returns $ 3,244 $ 596 $ 329 $ 3,511 2005 Allowance for doubtful accounts and sales returns 3,511 1,462 239 4,734 2006 Allowance for doubtful accounts and sales returns 4,734 33 407 4,360
During 2002, we irrevocably contributed approximately $3.6 million to the National Instruments Foundation, a 501(c)(3) charitable foundation established in 2002 for the purpose of continued promotion of scientific and engineering research and education at higher education institutions worldwide. Two of the four directors of the National Instruments Foundation are current officers of National Instruments.
ITEM 14. PRINCIPAL ACCOUNTING FEES AND SERVICES
The information concerning principal accountant fees and services required by this Item is incorporated by reference to our Proxy Statement under the heading “Independent Public Accountants.”
The information concerning pre-approval policies for audit and non-audit services required by this Item is incorporated by reference to our Proxy Statement under the heading “Audit Committee Pre-Approval of Audit and Permissible Non-Audit Services of Independent Auditors.”
PART IV
ITEM 15. EXHIBITS AND FINANCIAL STATEMENT SCHEDULES
(a) Documents FilesFiled with Report
1. Financial Statements.
2. Financial Statement Schedules.
None
3. Exhibits.
ExhibitNumber Description 3.1(2) Certificate of Incorporation, as amended, of the Company. 3.2(11) Amended and Restated Bylaws of the Company. 3.3(4) Certificate of Designation of Rights, Preferences and Privileges of Series A Participating Preferred Stock of the Company. 4.1(1) Specimen of Common Stock certificate of the Company. 4.2(3) Rights Agreement dated as of January 21, 2004, between the Company and EquiServe Trust Company, N.A. 10.1(1) Form of Indemnification Agreement. 10.2(5) 1994 Incentive Plan, as amended.* 10.3(9) 1994 Employee Stock Purchase Plan.* 10.5(7) 2005 Incentive Plan.* 10.6(8) National Instruments Corporation Annual Incentive Program.* 10.7(6) National Instruments Corporation Annual Incentive Program, as amended.* 10.8(10) Form of Restricted Stock Unit Award Agreement (Non-Employee Director).* 10.9(10) Form of Restricted Stock Unit Award Agreement (Performance Vesting).* 10.10(10) Form of Restricted Stock Unit Award Agreement (Current Employee).* 10.11(10) Form of Restricted Stock Unit Award Agreement (Newly Hired Employee).* 21.1 Subsidiaries of the Company. 23.1 Consent of Independent Registered Public Accounting Firm F-4Firm.Consolidated Balance SheetsF-5Consolidated Statements of IncomeF-6Consolidated Statements of Cash FlowsF-7Consolidated Statements of Stockholders' EquityF-8Notes to Consolidated Financial StatementsF-9
2.
Financial Statements Schedules.
See Schedule II - Valuation and Qualifying Accounts at page S-1
3.
Exhibits.
Exhibit
NumberDescription
3.1
(2)
Certificate of Incorporation, as amended, of the Company.
3.2
(2)
Amended and Restated Bylaws of the Company.
3.3
(4)
Certificate of Designation of Rights, Preferences and Privileges of Series A Participating Preferred Stock of the Company.
4.1
(1)
Specimen of Common Stock certificate of the Company.
4.2
(3)
Rights Agreement dated as of January 21, 2004, between the Company and EquiServe Trust Company, N.A.
10.1
(1)
Form of Indemnification Agreement.
10.2
(5)
1994 Incentive Plan, as amended.*
10.3
1994 Employee Stock Purchase Plan.*
10.4
(6)
Long-Term Incentive Program.*
10.5
(7)
2005 Incentive Plan.*
10.6
(8)
National Instruments Corporation Annual Incentive Program.*
10.7
(9)
2006 Annual Incentive Program Goals and Awards for the Named Executive Officers.*
10.8
(10)
Form of Restricted Stock Unit Award Agreement (Non-Employee Director).*
10.9
(10)
Form of Restricted Stock Unit Award Agreement (Performance Vesting).*
10.10
(10)
Form of Restricted Stock Unit Award Agreement (Current Employee).*
10.11
(10)
Form of Restricted Stock Unit Award Agreement (Newly Hired Employee).*
21.1
Subsidiaries of the Company.
23.1
Consent of Independent Registered Public Accounting Firm.
23.2
Consent of Independent Registered Public Accounting Firm.
24.0
Power of Attorney (included on page 33).
31.1
Certification of Chief Executive Officer Pursuant to 18 U.S.C. Section 1350, as Adopted Pursuant to Section 302 of the Sarbanes-Oxley Act of 2002.
31.2
Certification of Chief Financial Officer Pursuant to 18 U.S.C. Section 1350, as Adopted Pursuant to Section 302 of the Sarbanes-Oxley Act of 2002.
32.1
Certification of Chief Executive Officer and Chief Financial Officer Pursuant to 18 U.S.C. Section 1350, as Adopted Pursuant to Section 906 of the Sarbanes-Oxley Act of 2002.
24.0 Power of Attorney (included on page 41). 31.1 Certification of Chief Executive Officer Pursuant to 18 U.S.C. Section 1350, as Adopted Pursuant to Section 302 of the Sarbanes-Oxley Act of 2002. 31.2 Certification of Chief Financial Officer Pursuant to 18 U.S.C. Section 1350, as Adopted Pursuant to Section 302 of the Sarbanes-Oxley Act of 2002. 32.1 Certification of Chief Executive Officer and Chief Financial Officer Pursuant to 18 U.S.C. Section 1350, as Adopted Pursuant to Section 906 of the Sarbanes-Oxley Act of 2002.
(1) Incorporated by reference to the Company's Registration Statement on Form S-1 (Reg. No. 33-88386) declared effective March 13, 1995.
(2) Incorporated by reference to the same-numbered exhibit filed with the Company's Annual Report on Form 10-K for the fiscal year ended December 31, 2003.
(3) Incorporated by reference to exhibit 4.1 filed with the Company's currentCurrent Report on Form 8-K filed on January 28, 2004.
(4) Incorporated by reference to the same-numbered exhibit filed with the Company's Form 8-K on April 27, 2004.
(5) Incorporated by reference to the same-numbered exhibit filed with the Company's Form 10-Q on August 5, 2004.
(6) Incorporated by reference to exhibit 99.2 filed with the Company's Current Report on Form 8-K filed on October 28, 2008. (7) Incorporated by reference to exhibit A of the Company's Proxy Statement dated and filed on April 4, 2005. (8) Incorporated by reference to exhibit 99.2 filed with the Company's Current Report on Form 8-K filed on October 22, 2008. (9) Incorporated by reference to exhibit 10.3 filed with the Company's Annual Report on Form 10-K for the fiscal year ended December 31, 2006. (10) Incorporated by reference to the same-numbered exhibit filed with the Company's Form 10-Q on August 2, 2006. (11) Incorporated by reference to the same-numbered exhibit filed with the Company's Annual Report on Form 10-K for the fiscal year ended December 31, 2004.2007.
(7)Incorporated by reference to exhibit A of the Company's Proxy Statement dated and filed on April 4, 2005.
(8)Incorporated by reference to the exhibit 10.1 filed with the Company's Current Report on Form 8-K filed June 27, 2006.
(9)Incorporated by reference to the exhibit 10.2 filed with the Company's Current Report on Form 8-K filed June 27, 2006.
(10)Incorporated by reference to the same-numbered exhibit filed with the Company's Form 10-Q filed on August 2, 2006.
* Management Contract or Compensatory Plan or Arrangement.
(b) Exhibits
See Item 15(a)(3) above.
(c) Financial Statement Schedules
See Item 15(a)(2) above.
SIGNATURES
Pursuant to the requirements of Section 13 or 15(d) of the Securities Exchange Act of 1934, the registrant has duly caused this report to be signed on its behalf by the undersigned thereunto duly authorized.Registrant Registrant
NATIONAL INSTRUMENTS CORPORATION
February 20, 200717, 2010
BY: By:
/s/ Dr. James J. TruchardDr. James J. Truchard
Chairman of the Board and President
POWER OF ATTORNEY
KNOW ALL PERSONS BY THESE PRESENTS, that each person whose signature appears below constitutes and appoints Dr. James J. Truchard and Alexander M. Davern, jointly and severally, his or her attorneys-in-fact, each with the power of substitution, for him or her in any and all capacities, to sign any amendments to this Report on Form 10-K, and to file the same, with exhibits thereto and other documents in connection therewith, with the Securities and Exchange Commission, hereby ratifying and conformingconfirming all that each of said attorneys-in-fact, or his substitute or substitutes, may do or cause to be done by virtue hereof.
Pursuant to the requirements of the Securities Exchange Act of 1934, this report has been signed below by the following persons on behalf of the registrant and in the capacities and on the dates indicated.Signature
Capacity in Which Signed
Date
/s/ Dr. James J. Truchard
Chairman of the Board and President(Principal Executive Officer) February 17, 2010 Dr. James J. Truchard
Chairman of the Board and
President (Principal Executive Officer)
February 20, 2007
/s/ Alex M. Davern
Chief Financial Officer and Treasurer(Principal Financial and Accounting Officer) February 17, 2010 Alex M. Davern
Chief Financial Officer
and Treasurer (Principal Financial
and Accounting Officer)
February 20, 2007
/s/ Jeffrey L. Kodosky
Director February 17, 2010 Jeffrey L. Kodosky
Director
February 16, 2007
/s/ Dr. Donald M. Carlton
Director February 17, 2010 Dr. Donald M. Carlton
Director
February 16, 2007
/s/ Dr. Ben G. Streetman
Dr. Ben G. Streetman
Director
February 16, 2007
/s/ R. Gary Daniels
R. Gary Daniels
Director
February 16, 2007
/s/ Charles J. Roesslein
Director February 17, 2010 Charles J. Roesslein
Director
February 16, 2007
/s/ Duy-Loan T. Le
Director February 17, 2010 Duy-Loan T. Le
/s/ John Medica Director
February 16, 200717, 2010 John Medica
NATIONAL INSTRUMENTS CORPORATION
INDEX TO FINANCIAL STATEMENTS
Page No. Financial Statements: Page No.Report of Independent Registered Public Accounting FirmF-2Report of Independent Registered Public Accounting Firm on Internal Control over Financial Reporting F-3F-2 Report of Independent Registered Public Accounting Firm F-4F-3 Consolidated Balance Sheets as of December 31, 20062009 and 20052008 F-5F-4 Consolidated Statements of Income for each of the Three Years in the period Ended December 31, 20062009 F-6F-5 Consolidated Statements of Cash Flows for each of the Three Years in the period Ended December 31, 20062009 F-7F-6 Consolidated Statements of Stockholders' Equity for each of the Three Years in the period Ended December 31, 20062009 F-8F-7 Notes to Consolidated Financial Statements F-9F-8
Financial Statement Schedules:For each of the Three Years in the period Ended December 31, 2006 Schedule II--Valuation and Qualifying AccountsS-1
All other schedules are omitted because they are not applicable.
The Board of Directors and Shareholders of National Instruments Corporation:
We have audited the accompanying consolidated balance sheets of National Instruments Corporation and subsidiaries as of December 31, 20062009 and 20052008, and the related consolidated statements of income, stockholders’stockholders' equity, and cash flows for each of the twothree fiscal years in the period ended December 31, 2006. Our audits also included the financial statement schedule listed in the Index at Item 15.2009. These financial statements and schedule are the responsibility of the Company’sCompany's management. Our responsibility is to express an opinion on these financial statements and schedule based on our audits.
We conducted our audits in accordance with the standards of the Public Company Accounting Oversight Board (United States). Those standards require that we plan and perform the audit to obtain reasonable assurance about whether the financial statements are free of material misstatement. An audit includes examining, on a test basis, evidence supporting the amounts and disclosures in the financial statements. An audit also includes assessing the accounting principles used and significant estimates made by management, as well as evaluating the overall financial statement presentation. We believe that our audits provide a reasonable basis for our opinion.
In our opinion, the financial statements referred to above present fairly, in all material respects, the consolidated financial position of National Instruments Corporation and subsidiaries at December 31, 20062009 and 20052008, and the consolidated results of their operations and their cash flows for each of the twothree fiscal years in the period ended December 31, 2006,2009, in conformity with U.S. generally accepted accounting principles. Also, in our opinion, the related financial statement schedule, when considered in relation to the basic financial statements taken as a whole, presents fairly in all material respects the information set forth therein.As discussed in Note 1 to the consolidated financial statements, effective January 1, 2006, the Company changed its method of accounting for stock-based compensation to conform to Statement of Financial Accounting Standards No. 123(R), Share-Based Payment.
We also have audited, in accordance with the standards of the Public Company Accounting Oversight Board (United States), the effectiveness of National Instruments Corporation’sCorporation internal control over financial reporting as of December 31, 2006,2009, based on criteria established in Internal Control-Integrated Framework issued by the Committee of Sponsoring Organizations of the Treadway Commission and our report dated February 15, 200717, 2010 expressed an unqualified opinion thereon./s/ Ernst & Young LLP
Austin, Texas
February 15, 2007
/s/ Ernst & Young LLP
Austin, TexasFebruary 17, 2010
Report of Independent Registered Public Accounting Firm on Internal Control over Financial Reporting
The Board of Directors and Shareholders of National Instruments Corporation:
We have audited management’s assessment, included in the Management’s Report on Internal Control over Financial Reporting, that National Instruments Corporation maintained effectiveCorporation’s internal control over financial reporting as of December 31, 2006,2009, based on criteria established in Internal Control—Integrated Framework issued by the Committee of Sponsoring Organizations of the Treadway Commission (the COSO criteria). National Instruments Corporation’s management is responsible for maintaining effective internal control over financial reporting, and for its assessment of the effectiveness of internal control over financial reporting.reporting included in the accompanying Management Report on Internal Control over Financial Reporting. Our responsibility is to express an opinion on management’s assessment and an opinion on the effectiveness of the company’s internal control over financial reporting based on our audit.
We conducted our audit in accordance with the standards of the Public Company Accounting Oversight Board (United States). Those standards require that we plan and perform the audit to obtain reasonable assurance about whether effective internal control over financial reporting was maintained in all material respects. Our audit included obtaining an understanding of internal control over financial reporting, evaluating management’s assessment,assessing the risk that a material weakness exists, testing and evaluating the design and operating effectiveness of internal control based on the assessed risk, and performing such other procedures as we considered necessary in the circumstances. We believe that our audit provides a reasonable basis for our opinion.
A company’s internal control over financial reporting is a process designed to provide reasonable assurance regarding the reliability of financial reporting and the preparation of financial statements for external purposes in accordance with generally accepted accounting principles. A company’s internal control over financial reporting includes those policies and procedures that (1) pertain to the maintenance of records that, in reasonable detail, accurately and fairly reflect the transactions and dispositions of the assets of the company; (2) provide reasonable assurance that transactions are recorded as necessary to permit preparation of financial statements in accordance with generally accepted accounting principles, and that receipts and expenditures of the company are being made only in accordance with authorizations of management and directors of the company; and (3) provide reasonable assurance regarding prevention or timely detection of unauthorized acquisition, use or disposition of the company’s assets that could have a material effect on the financial statements.
Because of its inherent limitations, internal control over financial reporting may not prevent or detect misstatements. Also, projections of any evaluation of effectiveness to future periods are subject to the risk that controls may become inadequate because of changes in conditions, or that the degree of compliance with the policies or procedures may deteriorate.
In our opinion, management’s assessment that National Instruments Corporation maintained effective internal control over financial reporting as of December 31, 2006, is fairly stated, in all material respects, based on the COSO criteria. Also, in our opinion, National Instruments Corporation maintained, in all material respects, effective internal control over financial reporting as of December 31, 2006,2009, based on the COSO criteria.
We also have audited, in accordance with the standards of the Public Company Accounting Oversight Board (United States), the consolidated balance sheets of National Instruments Corporation as of December 31, 20062009 and 2005,2008, and the related consolidated statements of income, stockholders’ equity, and cash flows for each of the twothree years in the period ended December 31, 2006 of National Instruments Corporation2009 and our report dated February 15, 200717, 2010 expressed an unqualified opinion thereon./s/ Ernst & Young LLP
Austin, Texas
February 15, 2007
/s/ Ernst & Young LLP
Austin, TexasFebruary 17, 2010
Report of Independent Registered Public Accounting Firm
To the Board of Directors and Stockholders of National Instruments Corporation:
In our opinion, the consolidated statements of income, of stockholders’ equity and of cash flows (appearing on pages F-6 through F-8 of this National Instruments Corporation 2006 Annual Report on Form 10-K) for the year ended December 31, 2004 present fairly, in all material respects, the results of operations and cash flows of National Instruments Corporation and its subsidiaries for the year ended December 31, 2004, in conformity with accounting principles generally accepted in the United States of America. In addition, in our opinion, the financial statement schedule for the year ended December 31, 2004 presents fairly, in all material respects, the information set forth therein when read in conjunction with the related consolidated financial statements. These financial statements and financial statement schedule are the responsibility of the Company’s management. Our responsibility is to express an opinion on these financial statements and financial statement schedule based on our audit. We conducted our audit of these statements in accordance with the standards of the Public Company Accounting Oversight Board (United States). Those standards require that we plan and perform the audit to obtain reasonable assurance about whether the financial statements are free of material misstatement. An audit includes examining, on a test basis, evidence supporting the amounts and disclosures in the financial statements, assessing the accounting principles used and significant estimates made by management, and evaluating the overall financial statement presentation. We believe that our audit provides a reasonable basis for our opinion.
/s/ PricewaterhouseCoopers LLP
Austin, Texas
March 4, 2005
NATIONAL INSTRUMENTS CORPORATION
(in thousands, except share data)December 31,
2006
2005
Assets
Current assets: Cash and cash equivalents $ 100,287 $ 55,864 Short-term investments 150,190 119,846 Accounts receivable, net 117,235 95,733 Inventories, net 77,138 62,827 Prepaid expenses and other current assets 11,393 13,146 Deferred income taxes, net 20,851 14,890
Total current assets 477,094 362,306 Property and equipment, net 145,425 144,330 Goodwill, net 53,343 52,533 Intangible assets, net 40,065 43,602 Other long-term assets 5,293 5,565
Total assets $ 721,220 $ 608,336
Liabilities and Stockholders' Equity
Current liabilities: Accounts payable $ 32,001 $ 30,832 Accrued compensation 20,912 18,084 Deferred revenue 22,208 16,018 Accrued expenses and other liabilities 15,934 8,838 Other taxes payable 11,527 13,848
Total current liabilities 102,582 87,620 Deferred income taxes 21,956 16,866
Total liabilities 124,538 104,486
Commitments and contingencies Stockholders' equity: Preferred stock: par value $0.01; 5,000,000 shares authorized; none issued and outstanding — — Common stock: par value $0.01; 180,000,000 shares authorized; 79,883,837 and 79,276,086 shares issued and outstanding, respectively 799 793 Additional paid-in capital 109,851 91,430 Deferred stock-based compensation — (16,547 ) Retained earnings 483,533 429,859 Accumulated other comprehensive income (loss) 2,499 (1,685 )
Total stockholders' equity 596,682 503,850
Total liabilities and stockholders' equity $ 721,220 $ 608,336
December 31, 2009 2008 Assets Current assets: Cash and cash equivalents $ 201,465 $ 229,400 Short-term investments 87,196 6,220 Accounts receivable, net 103,957 121,548 Inventories, net 86,515 107,358 Prepaid expenses and other current assets 36,523 43,062 Deferred income taxes, net 16,522 21,435 Total current assets 532,178 529,023 Long-term investments — 10,500 Property and equipment, net 153,265 154,477 Goodwill, net 64,779 64,561 Intangible assets, net 43,390 41,915 Other long-term assets 19,417 32,115 Total assets $ 813,029 $ 832,591 Liabilities and Stockholders’ Equity Current liabilities: Accounts payable $ 23,502 $ 30,876 Accrued compensation 14,934 22,012 Deferred revenue 57,242 45,514 Accrued expenses and other liabilities 8,560 18,848 Other taxes payable 14,181 13,481 Total current liabilities 118,419 130,731 Deferred income taxes 25,012 25,157 Liability for uncertain tax positions 11,062 9,364 Other long-term liabilities 4,116 2,901 Total liabilities 158,609 168,153 Commitments and contingencies Stockholders’ equity: Preferred stock: par value $0.01; 5,000,000 shares authorized; none issued and outstanding — — Common stock: par value $0.01; 180,000,000 shares authorized;77,367,874 and 77,193,063 shares issued and outstanding, respectively 774 772 Additional paid-in capital 336,446 300,352 Retained earnings 303,655 352,831 Accumulated other comprehensive income 13,545 10,483 Total stockholders’ equity 654,420 664,438 Total liabilities and stockholders’ equity $ 813,029 $ 832,591
The accompanying notes are an integral part of these financial statements.
NATIONAL INSTRUMENTS CORPORATION
(in thousands, except per share data)For the Years Ended December 31,
2006
2005
2004
Net sales $ 660,407 $ 571,841 $ 514,088 Cost of sales (1) 170,326 149,309 135,473
Gross profit 490,081 422,532 378,615
Operating expenses: Sales and marketing (2) 235,072 211,280 188,727 Research and development (3) 113,095 87,841 84,692 General and administrative (4) 54,192 45,199 42,500
Total operating expenses 402,359 344,320 315,919
Operating income 87,722 78,212 62,696
Other income (expense): Interest income 6,847 3,758 2,905 Net foreign exchange gain (loss) 740 (1,566 ) 1,287 Other income (expense), net (7 ) 276 (2,075 )
Income before income taxes 95,302 80,680 64,813 Provision for income taxes (5) 22,594 19,163 16,203
Net income $ 72,708 $ 61,517 $ 48,610
Basic earnings per share $ 0.91 $ 0.78 $ 0.62
Weighted average shares outstanding - basic 79,519 78,552 78,680
Diluted earnings per share $ 0.89 $ 0.76 $ 0.59
Weighted average shares outstanding - diluted 81,519 80,910 82,096
Dividends declared per share $ 0.24 $ 0.20 $ 0.18
The following footnotes apply to the years ended December 31, 2006, 2005 and 2004:
(1)including $598, $101 and $0, respectively, of non-cash stock compensation.(2)including $6,008, $500 and $0, respectively, of non-cash stock compensation.(3)including $5,201, $598 and $0, respectively, of non-cash stock compensation.(4)including $2,333, $345 and $0, respectively, of non-cash stock compensation.(5)including $2,403, $364 and $0, respectively, of benefit from non-cash stock compensation.
For the YearsEnded December 31, 2009 2008 2007 Net sales: Product $ 623,736 $ 765,441 $ 701,589 Software maintenance 52,858 55,096 38,789 Total net sales 676,594 820,537 740,378 Cost of sales: Product 164,700 201,064 180,556 Software maintenance 5,184 6,045 4,711 Total cost of sales 169,884 207,109 185,267 Gross profit 506,710 613,428 555,111 Operating expenses: Sales and marketing 269,267 307,409 264,060 Research and development 132,974 143,140 126,515 General and administrative 57,938 67,162 62,445 Total operating expenses 460,179 517,711 453,020 Operating income 46,531 95,717 102,091 Other income (expense): Interest income 1,629 5,996 9,822 Net foreign exchange gain (loss) 734 (3,737 ) 1,672 Other income (expense), net 1,351 161 (158 ) Income before income taxes 50,245 98,137 113,427 Provision for income taxes 33,160 13,310 6,394 Net income $ 17,085 $ 84,827 $ 107,033 Basic earnings per share $ 0.22 $ 1.08 $ 1.35 Weighted average shares outstanding - basic 77,520 78,567 79,468 Diluted earnings per share $ 0.22 $ 1.07 $ 1.32 Weighted average shares outstanding – diluted �� 78,026 79,515 81,043 Dividends declared per share $ 0.48 $ 0.44 $ 0.34
The accompanying notes are an integral part of these financial statements.
NATIONAL INSTRUMENTS CORPORATION
(in thousands)For the Years Ended December 31,
2006
2005
2004
Cash flow from operating activities: Net income $ 72,708 $ 61,517 $ 48,610 Adjustments to reconcile net income to net cash provided by operating activities: Depreciation and amortization 34,181 28,553 25,592 Stock-based compensation 14,507 1,545 — Impairment of cost method investment — — 2,500 Gain on sale of subsidiary — — (242 ) Provision for (benefit from) deferred income taxes (339 ) 3,219 (825 ) Tax benefit from stock option plans (4,271 ) 675 3,071 Changes in operating assets and liabilities: Accounts receivable (21,502 ) (4,080 ) (9,342 ) Inventories (14,311 ) (4,572 ) (15,230 ) Prepaid expenses and other assets 2,116 (2,177 ) 4,624 Accounts payable 1,169 4,647 (4,359 ) Deferred revenue 6,190 3,847 3,385 Taxes and other liabilities 7,443 (5,124 ) 7,848
Net cash provided by operating activities 97,891 88,050 65,632
Cash flow from investing activities: Proceeds from sale of subsidiary — — 680 Acquisitions, net of cash received — (63,891 ) — Capital expenditures (18,503 ) (15,383 ) (12,596 ) Capitalization of internally developed software (7,370 ) (13,380 ) (5,007 ) Additions to other intangibles (3,115 ) (4,288 ) (3,050 ) Purchases of short-term investments (244,238 ) (124,227 ) (125,954 ) Sales and maturities of short-term investments 213,894 154,773 116,789
Net cash used in investing activities (59,332 ) (66,396 ) (29,138 )
Cash flow from financing activities: Proceeds from issuance of common stock 37,146 23,222 16,826 Repurchase of common stock (16,519 ) (49,452 ) (16,064 ) Dividends paid (19,034 ) (15,776 ) (14,486 ) Tax benefit from stock option plans 4,271 — —
Net cash provided by (used in) financing activities 5,864 (42,006 ) (13,724 )
Net change in cash and cash equivalents 44,423 (20,352 ) 22,770 Cash and cash equivalents at beginning of period 55,864 76,216 53,446
Cash and cash equivalents at end of period $ 100,287 $ 55,864 $ 76,216
Cash paid for interest and income taxes Interest $ 41 $ 17 $ 31 Income taxes $ 9,827 $ 15,117 $ 10,622
For the Years Ended December 31, 2009 2008 2007 Cash flow from operating activities: Net income $ 17,085 $ 84,827 $ 107,033 Adjustments to reconcile net income to net cash provided by operating activities: Depreciation and amortization 38,365 37,103 36,605 Stock-based compensation 20,299 19,854 17,754 Tax expense/(benefit from) deferred income taxes 17,196 (4,475 ) (16,954 ) Tax expense/(benefit from) stock option plans 1,450 (1,213 ) (2,964 ) Changes in operating assets and liabilities: Accounts receivable 17,591 12,159 (14,047 ) Inventories 20,843 (24,578 ) (5,537 ) Prepaid expenses and other assets 12,740 (10,340 ) (12,330 ) Accounts payable (7,374 ) (5,648 ) 4,186 Deferred revenue 11,728 9,423 13,883 Taxes and other liabilities (14,272 ) 4,706 19,743 Net cash provided by operating activities 135,651 121,818 147,372 Cash flow from investing activities: Acquisitions, net of cash received — (17,310 ) — Capital expenditures (20,847 ) (25,771 ) (24,864 ) Capitalization of internally developed software (12,583 ) (9,487 ) (8,263 ) Additions to other intangibles (4,602 ) (3,010 ) (6,447 ) Purchases of short-term investments (93,087 ) (9,061 ) (87,586 ) Sales and maturities of short-term investments 19,204 86,179 143,938 Purchases of foreign currency option contracts — (2,784 ) (2,242 ) Net cash provided by (used in) investing activities (111,915 ) 18,756 14,536 Cash flow from financing activities: Proceeds from issuance of common stock 21,672 31,150 36,460 Repurchase of common stock (34,585 ) (103,641 ) (79,728 ) Dividends paid (37,308 ) (34,735 ) (27,052 ) Tax (expense)/benefit from stock option plans (1,450 ) 1,213 2,964 Net cash (used in) financing activities (51,671 ) (106,013 ) (67,356 ) Net change in cash and cash equivalents (27,935 ) 34,561 94,552 Cash and cash equivalents at beginning of period 229,400 194,839 100,287 Cash and cash equivalents at end of period $ 201,465 $ 229,400 $ 194,839 Cash paid for interest and income taxes: Interest $ 23 $ 116 $ 159 Income taxes $ 14,608 $ 17,214 $ 21,147
The accompanying notes are an integral part of these financial statements.
NATIONAL INSTRUMENTS CORPORATION
(in thousands, except share data)Common
Stock
Shares
Common
Stock
Amount
Additional
Paid-In
Capital
Deferred
Compensation
Retained
Earnings
Accumulated
Other
Comprehensive
Income/(Loss)
Total
Stockholders'
Equity
Balance at December 31, 2003 78,269,235 $ 783 $ 95,070 $ — $ 349,994 $ (6,395 ) $ 439,452 Net income 48,610 48,610 Foreign currency translation adjustment (net of $1,013 tax expense) 3,050 3,050 Unrealized loss on securities available for sale (net of $0 tax benefit) (417 ) (417 ) Unrealized gain on derivative instruments (net of $2,136 tax expense) 6,407 6,407
Total comprehensive income 57,650
Issuance of common stock under employee plans, including tax benefits 1,234,195 12 19,885 19,897 Repurchase and retirement of common stock (557,850 ) (6 ) (16,058 ) (16,064 ) Dividends declared (14,486 ) (14,486 )
Balance at December 31, 2004 78,945,580 $ 789 $ 98,897 $ — $ 384,118 $ 2,645 $ 486,449 Net income 61,517 61,517 Foreign currency translation adjustment(net of $1,636 tax benefit) (5,181 ) (5,181 ) Unrealized gain on securities available for sale (net of $0 tax expense) 50 50 Unrealized gain on derivative instruments (net of $253 tax expense) 801 801
Total comprehensive income 57,187
Net activity related to restricted stock units 813,305 8 18,084 (16,547 ) 1,545 Issuance of common stock under employee plans, including tax benefits 1,573,547 16 23,206 23,222 Repurchase and retirement of common stock (2,056,346 ) (20 ) (49,432 ) (49,452 ) Dividends declared (15,776 ) (15,776 ) Disqualified dispositions 675 675
Balance at December 31, 2005 79,276,086 $ 793 $ 91,430 ($ 16,547 ) $ 429,859 ($ 1,685 ) $ 503,850 Net income 72,708 72,708 Foreign currency translation adjustment (net of $1,434 tax expense) 4,542 4,542 Unrealized gain on securities available for sale (net of $0 tax expense) 78 78 Unrealized loss on derivative instruments (net of $138 tax benefit) (436 ) (436 )
Total comprehensive income 76,892
Issuance of common stock under employee plans, including tax benefits 1,915,172 19 37,127 37,146 Stock-based compensation under
restricted stock plan 113,794 1 5,082 5,083 Stock-based compensation under stock
option and employee stock purchase plans 9,424 9,424 Repurchase and retirement of common stock (607,910 ) (6 ) (16,513 ) (16,519 ) Effect of adoption of SFAS 123R (813,305 ) (8 ) (16,539 ) 16,547 — Dividends declared (19,034 ) (19,034 ) Disqualified dispositions (160 ) (160 )
Balance at December 31, 2006 $ 79,883,837 $ 799 $ 109,851 $ — $ 483,533 $ 2,499 $ 596,682
CommonStockShares CommonStockAmount AdditionalPaid-InCapital DeferredCompensation RetainedEarnings AccumulatedOtherComprehensiveIncome/(Loss) TotalStockholders’Equity Balance at December 31, 2006 79,883,837 $ 799 $ 207,808 $ — $ 385,480 $ 2,499 $ 596,586 Net income 107,033 107,033 Foreign currency translation adjustment(net of $286 tax expense) 4,483 4,483 Unrealized gain on securities available-for-sale(net of $13 tax expense) 200 200 Unrealized loss on derivative instruments(net of $7 tax benefit) (117 ) (117 ) Total comprehensive income 111,599 Issuance of common stock under employee plans, including tax benefits 2,251,657 22 36,438 36,460 Stock-based compensation 17,754 17,754 Repurchase and retirement of common stock (2,730,135 ) (27 ) (7,102 ) (72,599 ) (79,728 ) Dividends paid (27,052 ) (27,052 ) Disqualified dispositions 5,467 5,467 Balance at December 31, 2007 79,405,359 $ 794 $ 260,365 $ — $ 392,862 $ 7,065 $ 661,086 Net income 84,827 84,827 Foreign currency translation adjustment(net of $681 tax benefit) (4,188 ) (4,188 ) Unrealized loss on securities available-for-sale(net of $82 tax benefit) (502 ) (502 ) Unrealized gain on derivative instruments(net of $1,320 tax expense) 8,108 8,108 Total comprehensive income 88,245 Issuance of common stock under employee plans, including tax benefits 1,897,746 19 31,131 31,150 Stock-based compensation 19,854 19,854 Repurchase and retirement of common stock (4,110,042 ) (41 ) (13,477 ) (90,123 ) (103,641 ) Dividends paid (34,735 ) (34,735 ) Disqualified dispositions 2,479 2,479 Balance at December 31, 2008 77,193,063 $ 772 $ 300,352 $ — $ 352,831 $ 10,483 $ 664,438 Net income 17,085 17,085 Foreign currency translation adjustment(net of $1,799 tax expense) 927 927 Unrealized gain on securities available-for-sale(net of $1,093 tax expense) 563 563 Unrealized gain on derivative instruments(net of $3,053 tax expense) 1,572 1,572 Total comprehensive income 20,147 Issuance of common stock under employee plans, including tax benefits 1,618,252 16 21,656 21,672 Stock-based compensation 20,574 20,574 Repurchase and retirement of common stock (1,443,441 ) (14 ) (5,618 ) (28,953 ) (34,585 ) Dividends paid (37,308 ) (37,308 ) Disqualified dispositions (518 ) (518 ) Balance at December 31, 2009 77,367,874 $ 774 $ 336,446 $ — $ 303,655 $ 13,545 $ 654,420
The accompanying notes are an integral part of these financial statements.
NATIONAL INSTRUMENTS CORPORATION
Note 1:1 – Operations and summary of significant accounting policies
National Instruments Corporation is a Delaware corporation. We engage in the design, development, manufacture and marketing of instrumentationprovide flexible application software and specialty computer plug-in cards and accessoriesmodular, multifunction hardware that users combine with industry standardindustry-standard computers, networks and the Internetthird party devices to create measurement, automation and automation systems.embedded systems, which we also refer to as “virtual instruments.” Our approach gives customers the ability to quickly and cost-effectively design, prototype and deploy unique custom-defined solutions for their design, control and test application needs. We offer hundreds of products used to create virtual instrumentation systems for general, commercial, industrial and scientific applications. Our products may be used in different environments, and consequently, specific application of our products is determined by the customer and generally is not known to us. We approach all markets with essentially the same products, which are used in a variety of applications from research and development to production testing, monitoring and industrial control. The following industries and applications are served by us worldwide: advanced research, automotive, commercial aerospace, computers and electronics, continuous process manufacturing, education, government/defense, medical research/pharmaceutical, power/energy, semiconductors, automated test equipment, telecommunications and others. TheThese financial statements have been prepared in accordance with accounting principles generally accepted in the United States of America.
Principles of consolidation
The consolidated financial statementsConsolidated Financial Statements include the accounts of National Instruments Corporation and its subsidiaries. All significant intercompany accounts and transactions have been eliminated.
We have historically recorded the excess of the purchase price over the par or stated value of retired shares of our common stock as a reduction of additional paid-in capital. We completed our review of this accounting policy under FASB ASC 505, Equity (FASB ASC 505). Based on this review, we have reclassified a portion of the excess of the purchase price over the par or stated value of retired shares of our common stock from a reduction of additional paid-in capital to a reduction of retained earnings. This reclassification did not have any impact on previously reported statements of income, earning per share amounts, statements of cash flows or total stockholders’ equity. Certain prior year amounts from our Consolidated Statements of Stockholders’ Equity have been reclassified to conform to the 2009 presentation as shown in the following table:
APIC RE 2006 Beginning Balance 12/31/06 balance as previously reported $ 109,851 $ 483,437 Cumulative reclassification of share repurchase 97,957 (97,957 ) 12/31/06 balance as reported in current Form 10-K $ 207,808 $ 385,480 2007 Activity Repurchase and retirement of common stock as previously reported $ (79,701 ) $ — Reclassification of 2007 activity 72,599 (72,599 ) Repurchase and retirement of common stock as reported in current Form 10-K $ (7,102 ) $ (72,599 ) 2007 Ending Balance 12/31/07 balance as previously reported $ 89,809 $ 563,418 Cumulative reclassification of share repurchase 170,556 (170,556 ) 12/31/07 balance as reported in current Form 10-K $ 260,365 $ 392,862 2008 Activity Repurchase and retirement of common stock as previously reported $ (103,600 ) $ — Reclassification of 2008 activity 90,123 (90,123 ) Repurchase and retirement of common stock as reported in current Form 10-K $ (13,477 ) $ (90,123 ) 2008 Ending Balance 12/31/08 balance as previously reported $ 39,673 $ 613,510 Cumulative reclassification of share repurchase 260,679 (260,679 ) 12/31/08 balance as reported in current Form 10-K $ 300,352 $ 352,831
Going forward, we will account for the retired shares of our common stock by recording the excess of the purchase price over par value as a reduction of retained earnings, to the extent that the excess of the purchase price over par value exceeds the original proceeds received from the issuance of the same shares of our common stock, as prescribed by FASB ASC 505.
Use of estimates Judgments and estimates are required in the
The preparation of our financial statements to conformin conformity with U.S. generally accepted accounting principles. Theprinciples requires us to make estimates and underlying assumptions that affect the reported amounts of assets, liabilities, revenues, expenses and liabilities,related disclosures of contingent assets and liabilities. We base our estimates on past experience and other assumptions that we believe are reasonable under the disclosurecircumstances, and we evaluate these estimates on an ongoing basis. Our critical accounting policies are those that affect our financial statements materially and involve difficult, subjective or complex judgments by management. Although these estimates are based on management's best knowledge of contingencies atcurrent events and actions that may impact the balance sheet date andcompany in the reported revenues and expenses forfuture, actual results may be materially different from the period. Actual results could differ from those estimates.
Cash and cash equivalents
Cash and cash equivalents include cash and highly liquid investments with maturities of three months or less at the date of acquisition. Short-term
Short-Term Investments
We maintain an investment portfolio of various types of security holdings and maturities. Pursuant to FASB ASC 820, cash equivalents and short-term investments Short-term available-for-sale are valued using the market approach (Level 1) based on unadjusted quoted prices in active markets for identical assets at the measurement date. Our short-term investments also include auction rate securities that we originally purchased for $8.6 million. These auction rate securities consist of corporate, state and municipaleducation loan revenue bonds. Auction rate securities with readily determinableare variable rate debt instruments whose interest rates are typically reset approximately every 7 to 35 days. In November 2008, we accepted the UBS Auction Rate Securities Rights (“the Rights”) agreement offered by UBS as a liquidity alternative to the failed auction process. The Rights agreement is a nontransferable right to sell our auction rate securities, at par value, back to UBS at any time during the period June 30, 2010, through July 2, 2012. The estimated fair market valuesvalue of both the auction rate securities and maturitiesthe Rights agreement was determined using significant unobservable inputs (Level 3) as prescribed by FASB ASC 820.
We account for our investments in excessdebt and equity instruments under FASB ASC 320. Our investments are classified as available-for-sale and accordingly are reported at fair value, with unrealized gains and losses reported as other comprehensive income, a component of three months at the date of acquisition.stockholders’ equity. Unrealized losses are charged against income when a decline in fair value is determined to be other than temporary. Investments with maturities beyond one year are classified as short-term based on their highly liquid nature and because such marketable securities represent the investment of cash that is available for current operations. Our investments are classified as available-for-sale and accordingly are reported atThe fair value of our short-term investments in debt securities at December 31, 2009 and December 31, 2008 was $87 million and $6 million, respectively. The increase was due to the net purchase of $74 million of short-term investments and the transfer of $8.6 related to our auction rate securities and our rights agreement from long-term investments to short-term investments during the year ended December 31, 2009. The net purchase of $74 million of short term investments was done to diversify our holdings from money market accounts to debt securities and to take advantage of higher yields associated with longer maturity debt securities. We follow the guidance provided by FASB ASC 320 to assess whether our investments with unrealized loss positions are other than temporarily impaired. Realized gains and losses reported as other comprehensive income. Unrealized losses are charged against income when a declineand declines in fair value is determinedjudged to be other than temporary. Thetemporary are determined based on the specific identification method and are reported in other income (expense), net, in our Consolidated Statements of Income.
Accounts Receivable, net
Accounts receivable are recorded net of allowance for sales returns of $1.9 million and $1.8 million at December 31, 2009 and 2008, respectively, and net of allowances for doubtful accounts of $2.7 million and $3.9 million at December 31, 2009 and 2008, respectively. A provision for estimated sales returns is used to determinemade by reducing recorded revenue based on historical experience. We analyze historical returns, current economic trends and changes in customer demand and acceptance of our products when evaluating the costadequacy of securities sold.our sales returns allowance. Our allowance for doubtful accounts is based on historical experience. We analyze historical bad debts, customer concentrations, customer creditworthiness and current economic trends when evaluating the adequacy of our allowance for doubtful accounts.
Year Description Balance atBeginningof Period Provisions Write-Offs Balance atEnd ofPeriod 2007 Allowance for doubtful accounts and sales returns $ 4,360 $ 1,940 $ 698 $ 5,602 2008 Allowance for doubtful accounts and sales returns 5,602 447 367 5,682 2009 Allowance for doubtful accounts and sales returns 5,682 337 1,400 4,619
Inventories
Inventories are stated at the lower-of-cost or market. Cost is determined using standard costs, which approximate the first-in first-out (FIFO)(“FIFO”) method. Cost includes the acquisition cost of purchased components, parts and subassemblies, in-bound freight costs, labor and overhead. Market is replacement cost with respect to raw materials and is net realizable value with respect to work in process and finished goods.
Inventory is shown net of adjustment for excess and obsolete inventories of $5.2$4.4 million and $6.0$4.4 million at December 31, 20062009 and 2005,2008, respectively.
Long-Term Investments
At December 31, 2008, our long-term investments primarily consisted of auction rate securities that we originally purchased for $8.6 million as well as our Rights agreement with UBS. At December 31, 2008, we classified these investments as long-term due to the fact that the market for these securities was inactive, the underlying securities generally had contractual maturities that were in excess of the guidelines provided for in our investment policy, the fact that we had the ability to hold the debt instruments to their ultimate maturity and the fact that we had not made a determination as to whether we would exercise our rights under the Rights agreement. The auction rate securities were classified as available-for-sale. At December 31, 2008, we reported our auction rate securities at their estimated fair market value of $7.0 million and our Rights agreement at its estimated fair market value of $1.6 million. The estimated fair market value of both the auction rate securities and the Rights agreement was determined using significant unobservable inputs (Level 3) as prescribed by FASB ASC 820. These auction rate securities and the Rights agreement are now reported as a component of short-term investments as discussed above.
Property and equipment
Property and equipment are recorded at cost. Depreciation is computed using the straight-line method over the estimated useful lives of the assets, which range from twenty to forty years for buildings, three to seven years for purchased internal use software and for equipment which are each included in furniture and equipment. Leasehold improvements are depreciated over the shorter of the life of the lease or the asset.
Intangible assets
We capitalize costs related to the development and acquisition of certain software products. In accordance with Statement of Financial Accounting Standards (“SFAS”) 86,Accounting for the Costs of Computer Software to Be Sold, Leased or Otherwise Marketed,FASB ASC 985, capitalization of costs begins when technological feasibility has been established and ends when the product is available for general release to customers. Technological feasibility for our products is established when the product is available for beta release. Amortization is computed on an individual product basis for those products available for market and is recognized based on the product’s estimated economic life, generally three years. Patents are amortized using the straight-line method over their estimated period of benefit, generally ten to seventeen years. At each balance sheet date, the unamortized costs for all intangible assets are reviewed by management and reduced to net realizable value when necessary.
Goodwill
GoodwillThe excess purchase price over the fair value of assets acquired is recorded as goodwill. As we have one operating segment, we allocate goodwill to one reporting unit for goodwill impairment testing. In accordance with SFAS 142,FASB ASC 350, Intangibles – Goodwill and Other Intangible Assets, (FASB ASC 350), goodwill is tested for impairment on an annual basis, and between annual tests if indicators of potential impairment exist, using a fair-value-based approach.approach based on the market capitalization of the reporting unit. Our annual impairment test was performed on April 6, 2006.as of February 28, 2009. No impairment of goodwill was identified.has been identified during the period presented. Goodwill is deductible for tax purposes in certain jurisdictions.
Concentrations of credit risk Financial
We maintain cash and cash equivalents with various financial institutions located in many countries throughout the world. At December 31, 2009, $85 million or 42% of our cash and cash equivalents was held in cash in various operating accounts with financial institutions throughout the world and $116 million or 58% was held in money market accounts. The most significant of our operating accounts was our domestic operating account which held approximately $22 million or 11% of our total cash and cash equivalents at a bank that carried an A1 rating at December 31, 2009. From a geographic standpoint, approximately $78 million or 39% was held in various domestic accounts with financial institutions and $123 million or 61% was held in various accounts outside of the U. S. with financial institutions. At December 31, 2009, our short-term investments consist of $35 million or 40% of foreign government bonds, $21 million or 24% of U.S. treasuries and agencies, $12 million or 14% of municipal bonds, $9 million or 10% of auction rate securities and our auction rate securities put option, $8 million or 9% of corporate bonds and $3 million or 3% in time deposits.
The goal of our investment policy is to manage our investment portfolio to preserve principal and liquidity while maximizing the return on our investment portfolio through the full investment of available funds. We place our cash investments in instruments that potentially subject us to concentrationsmeet credit quality standards, as specified in our corporate investment policy guidelines. These guidelines also limit the amount of credit risk consist principallyexposure to any one issue, issuer or type of instrument. With the exception of our auction rate security from the Vermont Student Assistance Corporation, at December 31, 2009, our cash equivalents and short-term investments carried ratings from the major credit rating agencies that were in accordance with our corporate investment policy. Our investment policy allows investments in the following; government and federal agency obligations, repurchase agreements (“Repos”), certificates of deposit and time deposits, corporate obligations, medium term notes and deposit notes, commercial paper including asset-backed commercial paper (“ABCP”), puttable bonds, general obligation and revenue bonds, money market funds, taxable commercial paper, corporate notes/bonds, municipal notes, municipal obligations, variable rate demand notes and tax exempt commercial paper. All such instruments must carry minimum ratings of A1/P1/F1, MIG1/VMIG1/SP1 and A2/A/A, as applicable, all of which are considered “investment grade”. Our investment policy for marketable securities requires that all securities mature in three years or less, with a weighted average maturity of no longer than 18 months with at least 10% maturing in 90 days or less. We actively monitor our investment portfolio to ensure compliance with our investment objective to preserve capital, meet liquidity requirements and maximize return on our investments. We do not require collateral or enter into master netting arrangements to mitigate our credit risk. (See Note 2 – Cash, cash equivalents, short-term and long-term investments in Notes to Consolidated Financial Statements for further discussion and analysis of our investments.).
At December 31, 2009, we held foreign currency forward and option contracts cashwith an aggregate notional amount of $148.4 million with various counterparties and cash equivalents, short-term investments and trade accounts receivable. We have no significant concentrations of credit risk at December 31, 2006.with varying maturity dates. Our counterparties in our foreign currency forward and option contracts are major financial institutions. We do not anticipate nonperformance by these counterparties. We maintain cash(See Note 4 – Derivative instruments and cash equivalents with various financial institutions locatedhedging activities in many countries worldwide. Our short-term investments are diversified among and limitedNotes to high-quality securities with high credit ratings. Consolidated Financial Statements).
Concentration of credit risk with respect to trade accounts receivable is limited due to the large number of customers and their dispersion across many countries and industries. The amount of sales to any individual customer did not exceed 3% of revenue for the periods presented. The largest trade account receivable from any individual customer at December 31, 20062009 was approximately $1.8$1.9 million.
Key supplier risk
Our manufacturing processes use large volumes of high-quality components and subassemblies supplied by outside sources. Several of thosethese components are available through singlesole or limited sources. Supply shortages of or quality problems in connection with some of these key components could require us to procure components from replacement suppliers, which would cause significant delays in fulfillment of orders and likely result in additional costs. In order to manage this risk, we maintain safety stock of some of these single sourced components and subassemblies and perform regular assessments of suppliers performance, grading key suppliers in critical areas such as quality and “on-time” delivery.
Revenue recognition
We derive revenue primarily from the sale/licensing of integrated hardware and software solutions. We also sellIndependent sales of application software licenses which are sold separately as well as training andinclude post contract support services. In addition, training services are sold separately. The products and services are generally sold under standardized licensing and sales arrangements with payment terms ranging from net 30 days in the United States to net 30 days and up to net 90 days in some international markets. Approximately 95%83% of our product/license sales include both hardware and software in the customer arrangement, with a small percentage of sales including other services. We offer rights of return and standard warranties for product defects related to our products. The rights of return are generally for a period of up to 30 days after the delivery date. The standard warranties cover periods ranging from 90 days to three years. With the exception of our former German systems integration subsidiary, which accounted for less than 1.5% of our revenues in the year ended December 31, 2004, weWe do not generally enter into contracts requiring product acceptance from the customer. This subsidiary was sold in December 2004.
Revenue is recognized in accordance with the provisions of SOP 97-2FASB ASC 985, when persuasive evidence of an arrangement exists, delivery has occurred, the fee is fixed or determinable, and collectability is probable. We enter into certain arrangements where we are obligated to deliver multiple products and/or services (“multiple elements”). In these transactions, we allocate the total revenue among the elements based on vendor specific objective evidence (“VSOE”) of fair value as determined by the sales price of each element when sold separately (“vendor-specific objective evidence”). Salesseparately.
When VSOE of fair value is available for the undelivered element of a multiple element arrangements, sales revenue from product sales is generally recognized on the date the product is shipped, using the residual method under FASB ASC 985, with a portion of revenue recorded as deferred (unearned) due to applicable undelivered elements. Undelivered elements for our multiple-elementmultiple element arrangements with a customer are generally restricted to post contract support and training and education. The amount of revenue allocated to these undelivered elements is based on the vendor-specific objective evidence (“VSOE”)VSOE of fair value for those undelivered elements. Deferred revenue due to undelivered elements is recognized ratably on a straight-line basis over the service period or when the service is completed. When VSOE of fair value is not available for the undelivered element of a multiple element arrangement, sales revenue is generally recognized ratably, on a straight-line basis over the service period of the undelivered element, generally 12 months or when the service is completed in accordance with the subscription method under FASB ASC 985. Deferred revenue at December 31, 20062009 and 20052008 was $22.2$57 million and $16.0$46 million, respectively.
The application of SOP 97-2FASB ASC 985 requires judgment, including whether a software arrangement includes multiple elements, and if so, whether VSOE of fair value exists for those elements. Changes to the elements in a software arrangement, the ability to identify VSOE for those elements, the fair value of the respective elements, and changes to a product'sproduct’s estimated life cycle could materially impact the amount of our earned and unearned revenue. Judgment is also required to assess whether future releases of certain software represent new products or upgrades and enhancements to existing products. Provision
Product revenue
Our product revenue is generated predominantly from the sales of measurement and automation products. Our products consist of application software and hardware components together with related driver software.
Software maintenance revenue
Software maintenance revenue is post contract customer support that provides the customer with unspecified upgrades/updates and technical support.Shipping and handling costsOur shipping and handling costs charged to customers are included in net sales, and the associated expense is recorded in cost of sales for estimated sales returns is made by reducing recorded revenue based on historical experience. Management analyzes historical returns, current economic trends, and changes in customer demand and acceptance of our products when evaluating the adequacy of our allowance for sales returns. The accounts receivable are net of allowance for sales returns of $1.5 million and $1.3 million at December 31, 2006 and 2005, respectively. Similarly, management must make estimates of the uncollectability of our accounts receivables. Management specifically analyzes accounts receivable and analyzes historical bad debts, customer concentrations, customer credit-worthiness and current economic trends when evaluating the adequacy of our allowance for doubtful accounts. The accounts receivable are net of allowances for doubtful accounts of $2.9 million and $3.4 million at December 31, 2006 and 2005, respectively.all periods presented.
Warranty reserve
We offer a one-year limited warranty on most hardware products, with a two or three-year warranty on a subset of our hardware products, which is included in the sales price of many of our products. Provision is made for estimated future warranty costs at the time of the sale pursuant to SFAS 5,Accounting for Loss FASB ASC 450, Contingencies (FASB ASC 450), for the estimated costs that may be incurred under the basic limited warranty. Our estimate is based on historical experience and product sales during this period.
The warranty reserve for the years ended December 31, 20062009 and 2005,2008, respectively, was as follows (in thousands):2006
2005
Balance at the beginning of the period $ 915 $ 815 Accruals for warranties issued during the period 1,593 1,652 Settlements made (in cash or in kind) during the period (1,641 ) (1,552 )
Balance at the end of the period $ 867 $ 915
2009 2008 Balance at the beginning of the period $ 952 $ 750 Accruals for warranties issued during the period 1,991 1,836 Settlements made (in cash or in kind) during the period (2,022 ) (1,634 ) Balance at the end of the period $ 921 $ 952
Loss contingencies
We accrue for probable losses from contingencies including legal defense costs, on an undiscounted basis, in accordance with SFAS 5, Accounting for Loss FASB ASC 450, Contingencies (FASB ASC 450), when such costs are considered probable of being incurred and are reasonably estimable. We periodically evaluate available information, both internal and external, relative to such contingencies and adjust this accrual as necessary.
Advertising expense
We expense costs of advertising as incurred. Advertising expense for the years ended December 31, 2006, 20052009, 2008 and 20042007 was $47.3$13.6 million, $42.5$19.3 million and $39.7$20.0 million, respectively.
Foreign currency translation
The functional currency for our international sales operations is the applicable local currency. The assets and liabilities of these operations are translated at the rate of exchange in effect on the balance sheet date and sales and expenses are translated at average rates. The resulting gains or losses from translation are included in a separate component of other comprehensive income. Gains and losses resulting from re-measuring monetary asset and liability accounts that are denominated in a currency other than a subsidiary’s functional currency are included in net foreign exchange gain (loss) and are included in net income.
Foreign currency hedging instruments
All of our derivative instruments are recognized on the balance sheet at their fair value. We currently use foreign currency forward and purchased option contracts to hedge our exposure to material foreign currency denominated receivables and forecasted foreign currency cash flows.
On the date the derivative contract is entered into, we designate the derivative as either a hedge of the fair value of foreign currency denominated receivables (“fair-value” hedge) or as a hedge of the variability of foreign currency cash flows to be received or paid (“cash flow” hedge). Changes in the fair market value or as a hedge of a fair-value hedge are recorded, along with the loss or gain on the re-measurement of foreign-currency-denominated receivables, in current earnings.our foreign denominated net receivable positions (“other derivatives”). Changes in the fair value of derivatives that are designated and qualify as cash flow hedges under SFAS 133FASB ASC 815, Derivatives and Hedging (FASB ASC 815) and that are deemed to be highly effective are recorded in other comprehensive income. These amounts are subsequently reclassified into earnings in the period during which the hedgehedged transaction is realized. The gain or loss on the other derivatives as well as the offsetting gain or loss on the hedged item attributable to the hedged risk is recognized in current earnings under the line item “Net foreign exchange gain (loss)”. We do not enter into derivative contracts for speculative purposes.
We formally document all relationships between hedging instruments and hedged items, as well as our risk-management objective and strategy for undertaking various hedge transactions. This process includes linking all derivatives that are designated as fair-value or cash flow hedges to specific assets and liabilities on the balance sheet or to specific firm commitments or forecasted transactions. We also formally assess, both at the hedge’s inception and on an ongoing basis, whether the hedging instruments are highly effective in offsetting changes in cash flows of hedged items.
We prospectively discontinue hedge accounting if (1) it is determined that the derivative is no longer highly effective in offsetting changes in the fair value of a hedged item (forecasted transactions); or (2) the derivative is de-designated as a hedge instrument, because it is unlikely that a forecasted transaction will occur. When hedge accounting is discontinued, the derivative is sold and the resulting gains and losses are recognized immediately in earnings.
Income taxes
We account for income taxes under the asset and liability method as set forth in SFAS 109,Accounting for FASB ASC 740, Income Taxes.Taxes (FASB ASC 740). Deferred tax assets and liabilities are recognized for the expected tax consequences of temporary differences between the tax bases of assets and liabilities and their reported amounts. Valuation allowances are established when necessary to reduce deferred tax assets to amounts which are more likely than not to be realized.
Earnings per share On January 21, 2004, we declared a stock split effected in the form of a dividend of one share of common stock for each two shares of common stock outstanding. The dividend was paid on February 20, 2004 to holders of record as of the close of business on February 5, 2004. All per share data and numbers of common shares, where appropriate, have been retroactively adjusted to reflect the stock split.
Basic earnings per share (“EPS”) is computed by dividing net income by the weighted average number of common shares outstanding during each period. Diluted EPS is computed by dividing net income by the weighted average number of common shares and common share equivalents outstanding (if dilutive) during each period. The number of common share equivalents, which include stock options and restricted stock units, is computed using the treasury stock method.
The reconciliation of the denominators used to calculate basic EPS and diluted EPS for the years ended December 31, 2006, 20052009, 2008 and 2004,2007, respectively, are as follows (in thousands):Years Ended December 31,
2006
2005
2004
Weighted average shares outstanding-basic 79,519 78,552 78,680 Plus: Common share equivalents Stock options, restricted stock units 2,000 2,358 3,416
Weighted average shares outstanding-diluted 81,519 80,910 82,096
Years Ended December 31, 2009 2008 2007 Weighted average shares outstanding-basic�� 77,520 78,567 79,468 Plus: Common share equivalents Stock options, restricted stock units 506 948 1,575 Weighted average shares outstanding-diluted 78,026 79,515 81,043
Stock options to acquire 3,295,000, 3,056,0002,711,976, 2,402,934 and 2,523,0002,304,078 shares for the years ended December 31, 2006, 20052009, 2008 and 2004,2007, respectively, were excluded in the computations of diluted EPS because the effect of including the stock options would have been anti-dilutive.
Stock-based compensation plans
Effective January 1, 2006, we adopted Statement of Financial Accounting Standards 123R (“SFAS 123R”),“Share-based Payments”FASB ASC 718, Compensation – Stock Compensation (FASB ASC 718), using the modified-prospective-transition method. Under this method, prior periods are not restated. Under this transition method, stock compensation cost recognized beginning January 1, 2006 includes: (a) compensation cost for all share-based payments granted prior to, but not yet vested as of January 1, 2006, based on the grant date fair value estimated in accordance with the original provisions of SFAS 123,FASB ASC 718, and (b) compensation cost for all share-based payments granted on or subsequent to January 1, 2006, based on the grant-date fair value estimated in accordance with the provisions of SFAS 123R.FASB ASC 718. Prior
Comprehensive income
Our comprehensive income is comprised of net income, foreign currency translation and unrealized gains and losses on forward and option contracts and securities available-for-sale. Comprehensive income for 2009, 2008 and 2007 was $20.1 million, $88.2 million and $111.6 million, respectively.
Recently Issued Accounting Pronouncements
In April 2009, the FASB updated FASB ASC 820 providing additional guidance for estimating fair value when the volume and level of activity for the asset or liability have significantly decreased. This update also includes guidance on identifying circumstances that indicate a transaction is not orderly. We adopted the update on April 1, 2009 as required and concluded it did not have a material impact on our consolidated financial position or results of operations.
In September 2009, the FASB updated FASB ASC 105, Generally Accepted Accounting Principles (FASB ASC 105). The update establishes the FASB Standards Accounting Codification (“Codification”) as the source of authoritative U.S. generally accepted accounting principles (“GAAP”) recognized by the FASB to adopting SFAS 123R, we presentedbe applied to nongovernmental entities and rules and interpretive releases of the SEC as authoritative GAAP for SEC registrants. The Codification supersedes all tax benefitsexisting non-SEC accounting and reporting standards. This update is effective for financial statements issued for interim and annual periods ending after September 15, 2009. We adopted the update on July 1, 2009, as required and concluded it did not have a material impact on our consolidated financial position or results of deductions resultingoperations.
In October 2009, the FASB updated FASB ASC 605, Revenue Recognition (FASB ASC 605) that amended the criteria for separating consideration in multiple-deliverable arrangements. The amendments establish a selling price hierarchy for determining the selling price of a deliverable. The selling price used for each deliverable will be based on vendor-specific objective evidence if available, third–party evidence if vendor-specific objective evidence is not available, or estimated selling price if neither vendor-specific objective evidence nor third-party evidence is available. The amendments will change the application of the residual method of allocation and require that arrangement consideration be allocated at the inception of the arrangement to all deliverables using the relative selling price method. The relative selling price method allocates any discount in the arrangement proportionally to each deliverable on the basis of each deliverable’s selling price. This update will be effective prospectively for revenue arrangements entered into or materially modified in fiscal years beginning on or after June 15, 2010. Early adoption is permitted. We are currently evaluating the requirements of this update and have not yet determined the impact on our consolidated financial statements.
In October 2009, the FASB updated FASB ASC 985, Software (FASB ASC 985) that changes the accounting model for revenue arrangements that include both tangible products and software elements. Tangible products containing software components and nonsoftware components that function together to deliver the tangible product’s essential functionality are no longer within the scope of the software revenue guidance in Subtopic 985-605. In addition, the amendments require that hardware components of a tangible product containing software components always be excluded from the exercisesoftware revenue guidance. This update will be effective prospectively for revenue arrangements entered into or materially modified in fiscal years beginning on or after June 15, 2010. Early adoption is permitted. We are currently evaluating the requirements of stock grants as operatingthis update and have not yet determined the impact on our consolidated financial statements.
Cash, cash flows. SFAS 123R requires the cash flows resulting from the tax benefits from tax deductions in excessequivalents, short-term and long-term investments consist of the compensation costfollowing (in thousands):
As ofDecember 31, 2009 As ofDecember 31, 2008 Cash and cash equivalents: Cash $ 85,612 $ 100,967 Cash equivalents: Time deposits — 73,400 Money market accounts 115,853 55,033 Total cash and cash equivalents $ 201,465 $ 229,400 Short-term investments: Municipal bonds $ 12,549 $ 6,220 Corporate bonds 7,587 — U.S. treasuries and agencies 21,033 — Foreign government bonds 34,674 — Time deposits 2,753 — Auction rate securities 8,177 — Auction rate securities put option 423 — Total short-term investments 87,196 6,220 Long-term investments: Auction rate securities — 6,964 Auction rate securities put option — 1,636 Other long-term investments — 1,900 Total investments $ 87,196 $ 16,720 Total cash, cash equivalents and investments $ 288,661 $ 246,120
The following table summarizes unrealized gains and losses related to our investments designated as available-for-sale (in thousands):
As of December 31, 2009 Adjusted Cost GrossUnrealized Gain GrossUnrealized Loss Cumulative Translation Adjustment Fair Value Municipal bonds $ 12,491 $ 58 $ — $ — $ 12,549 Corporate bonds 7,478 110 (1 ) — 7,587 U.S. treasuries and agencies 21,080 — (47 ) — 21,033 Foreign government bonds 36,105 76 — (1,507 ) 34,674 Time deposits 2,753 — — — 2,753 Auction rate securities 8,600 — (423 ) — 8,177 Auction rate securities put option — 423 — — 423 Total investments $ 88,507 $ 667 $ (471 ) $ (1,507 ) $ 87,196
As of December 31, 2008 Adjusted Cost GrossUnrealized Gain GrossUnrealized Loss Fair Value Municipal securities $ 6,199 $ 28 $ (7 ) $ 6,220 Auction rate securities 8,600 — (1,636 ) 6,964 Auction rate securities put option — 1,636 — 1,636 Other long-term investments 1,900 — — 1,900 Total investments $ 16,699 $ 1,664 $ (1,643 ) $ 16,720
The following table summarizes the contractual maturities of our investments designated as available-for-sale (in thousands):
As of December 31, 2009 Adjusted Cost Fair Value Due in less than 1 year $ 44,029 $ 43,267 Due in 1 to 5 years 44,478 43,929 Total investments $ 88,507 $ 87,196
As of December 31, 2009 Due in less than 1 year Adjusted Cost Fair Value Municipal bonds $ 4,103 $ 4,110 Corporate bonds 5,384 5,473 U.S. treasuries and agencies 5,065 5,057 Foreign government bonds 18,124 17,274 Time deposits 2,753 2,753 Auction rate securities 8,600 8,177 Auction rate securities put option — 423 Total investments $ 44,029 $ 43,267
As of December 31, 2009 Due in 1 to 5 years Adjusted Cost Fair Value Municipal bonds $ 8,388 $ 8,439 Corporate bonds 2,094 2,114 U.S. treasuries and agencies 16,015 15,976 Foreign government bonds 17,981 17,400 Time deposits — — Auction rate securities — — Auction rate securities put option — — Total investments $ 44,478 $ 43,929
Note 3 – Fair value measurements
FASB ASC 820, clarifies the definition of fair value, prescribes methods for measuring fair value, establishes a fair value hierarchy based on the inputs used to measure fair value and expands disclosures about the use of fair value measurements. Effective January 1, 2009, we adopted FASB ASC 820 for our nonfinancial assets and nonfinancial liabilities, except those items recognized (excess tax benefits) to be classifiedor disclosed at fair value on an annual or more frequently recurring basis. The adoption of FASB ASC 820 did not have a material impact on our fair value measurements as financing cash flows. Aswe did not have any items that were measured at fair value on a result, $4.3 million of excess tax benefitsnonrecurring basis for the year ended December 31, 20062009. In April 2009, FASB ASC 820 was updated to provide additional guidance for estimating fair value when the volume and level of activity for the asset or liability have been classified as financing cash flows. Prior tosignificantly decreased. The update also includes guidance on identifying circumstances that indicate a transaction is not orderly. We adopted the effective date of SFAS 123R, we applied Accounting Principles Board Opinion 25 (“APB 25”),“Accounting for Stock Issued to Employees”update on April 1, 2009 and related interpretations forit did not have a material impact on our stock option grants. APB 25 providesfair value measurements.
The following tables present our assets and liabilities that are measured at fair value on a recurring basis and are categorized using the compensation expense relative to our stock options is measuredfair value hierarchy. The fair value hierarchy has three levels based on the intrinsicreliability of the inputs used to determine fair value.
Fair Value Measurements at Reporting Date Using Description December 31, 2009 Quoted Prices in Active Markets for Identical Assets(Level 1) Significant Other Observable Inputs(Level 2) Significant Unobservable Inputs(Level 3) Assets Money Market Funds $ 115,853 $ 115,853 $ — $ — Short-term investments available-for-sale 87,196 78,596 — 8,600 Derivatives 11,016 — 11,016 — Total Assets $ 214,065 $ 194,449 $ 11,016 $ 8,600 Liabilities Derivatives $ (318 ) $ — $ (318 ) $ — Total Liabilities $ (318 ) $ — $ (318 ) $ —
Fair Value Measurements Using Significant Unobservable Inputs(Level 3) Short-term investmentsavailable-for-sale Beginning Balance, January 1, 2008 $ 8,600 Total gains (realized/unrealized) Included in earnings 423 Included in other comprehensive income — Total losses (realized/unrealized) Included in earnings (423 ) Included in other comprehensive income — Purchases, issuances and settlements — Transfer in and/or out of Level 3 — Ending Balance, December 31, 2009 $ 8,600 The amount of total gains or (losses) for the period included in earnings (or changes in net assets) attributableto the change in unrealized gains or losses relating to assets still held at the reporting date $ —
Short-term investments available-for-sale are valued using a market approach (Level 1) based on the quoted market prices of identical instruments when available or other observable inputs such as trading prices of identical instruments in inactive markets. Short-term investments available-for-sale consist of debt securities issued by states of the U.S. and political subdivisions of the states, corporate debt securities and debt securities issued by U.S. government corporations and agencies. All short-term investments available-for-sale have contractual maturities of less than 24 months.
Derivatives include foreign currency forward and option contracts. Our foreign currency forward contracts are valued using an income approach (Level 2) based on the spot rate less the contract rate multiplied by the notional amount. Our foreign currency option contracts are valued using a market approach based on the quoted market prices which are derived from observable inputs including current and future spot rates, interest rate spreads as well as quoted market prices of identical instruments.
Short-term debt securities available-for-sale included in Level 3 are reported at their fair market value and consist of auction rate securities backed by education loan revenue bonds. One of our auction rate securities is from the Vermont Student Assistance Corporation and has a par value of $2.2 million. The other of our auction rate securities is from the New Hampshire Health and Education Facilities Authority and has a par value of $6.4 million. The ratings for these securities at December 31, 2009, were Baa3/A/AAA and Aaa/NR/AAA, respectively. Historically, we reported the fair market value of these securities at par as differences between par value and the purchase price or settlement value were historically comprised of accrued interest. Auction rate securities are variable rate debt instruments whose interest rates are typically reset approximately every 7 to 35 days. On January 15, 2010, and in prior auction periods beginning in February 2008, the auction process for these securities failed. At December 31, 2009, we reported these as short-term investments at their estimated fair market value of $8.2 million.
In November 2008, we accepted the UBS Auction Rate Securities Rights (the “Rights”) agreement offered by UBS as a liquidity alternative to the failed auction process. This Rights agreement is related to the auction rates securities discussed above. The Rights agreement is a nontransferable right to sell our auction rate securities, at par value, back to UBS at any time during the period June 30, 2010, through July 2, 2012. At December 31, 2009, we reported the Rights agreement at its estimated fair market value of $423,000 as a component of short-term debt securities available for sale.
Due to the fact that our Rights agreement has an initial exercise date that is less than one year from now, we are now reporting our auction rate securities and the corresponding Rights agreement as short-term. We continue to have the ability to hold our auction rate securities to their ultimate maturities which are in excess of one year and we have not made a determination as to whether we will exercise our option under the Rights agreement or if we do choose to exercise our option, at what point during the period June 30, 2010 through July 2, 2012, we would exercise our option. However, due to the fact that our Rights agreement has an initial exercise date that is less than one year from now, we are now reporting our auction rate securities and the corresponding Rights agreement as short-term. We have recorded the unrealized loss related to the auction rate securities and the unrealized gain related to the Rights agreement as a component of other income (expense), in our Consolidated Statements of Income.
The estimated fair market value of both the auction rate securities and the Rights agreement was determined using significant unobservable inputs (Level 3) as prescribed by FASB ASC 820. We considered many factors in determining the fair market value of the stockauction rate securities as well as our corresponding Rights agreement at December 31, 2009, including the fact that the debt instruments underlying the auction rate securities have redemption features which call for redemption at 100% of par value, current credit curves for like securities and discount factors to account for the illiquidity of the market for these securities. During the year ended December 31, 2009, we did not make any changes to our valuation techniques or related inputs.
FASB ASC 815 requires companies to recognize all of their derivative instruments as either assets or liabilities in the statement of financial position at fair value. The accounting for changes in the fair value (i.e., gains or losses) of a derivative instrument depends on whether it has been designated and qualifies as part of a hedging relationship and further, on the type of hedging relationship. For those derivative instruments that are designated and qualify as hedging instruments, a company must designate the hedging instrument, based upon the exposure being hedged, as a fair value hedge, cash flow hedge, or a hedge of a net investment in a foreign operation.
We have operations in over 40 countries. Sales outside of the Americas as a percentage of consolidated sales were 57% and 57% for the years ended December 31, 2009 and 2008, respectively. Our activities expose us to a variety of market risks, including the effects of changes in foreign currency exchange rates. These financial risks are monitored and managed by us as an integral part of our overall risk management program.
We maintain a foreign currency risk management strategy that uses derivative instruments (foreign currency forward and purchased option contracts) to help protect our earnings and cash flows from fluctuations caused by the volatility in currency exchange rates. Movements in foreign currency exchange rates pose a risk to our operations and competitive position, since exchange rate changes may affect our profitability and cash flow, and the business or pricing strategies of our non-U.S. based competitors.
The vast majority of our foreign sales are denominated in the customers’ local currency. We purchase foreign currency forward and option contracts as hedges of forecasted sales that are denominated in foreign currencies and as hedges of foreign currency denominated receivables. These contracts are entered into to protect against the risk that the eventual dollar-net-cash inflows resulting from such sales or firm commitments will be adversely affected by changes in exchange rates. We also purchase foreign currency forward contracts as hedges of forecasted expenses that are denominated in foreign currencies. These contracts are entered into to protect against the risk that the eventual dollar-net-cash outflows resulting from foreign currency operating and cost of revenue expenses will be adversely affected by changes in exchange rates.
In accordance with FASB ASC 815, we designate foreign currency forward and purchased option contracts as cash flow hedges of forecasted revenues or forecasted expenses. In addition, we hedge our foreign currency denominated balance sheet exposures using foreign currency forward contracts. These derivatives are not designated as hedging instruments under FASB ASC 815. None of our derivative instruments contain a credit-risk-related contingent feature.
Cash flow hedges
To protect against the reduction in value caused by a fluctuation in foreign currency exchange rates of forecasted foreign currency cash flows resulting from international sales over the next one to two years, we have instituted a foreign currency cash flow hedging program. We hedge portions of our forecasted revenue and forecasted expenses denominated in foreign currencies with forward and purchased option contracts. For forward contracts, when the dollar strengthens significantly against the foreign currencies, the change in the present value of future foreign currency cash flows may be offset by the change in the fair value of the forward contracts designated as hedges. For option contracts, when the dollar strengthens significantly against the foreign currencies, the change in the present value of future foreign currency cash flows may be offset by the change in the fair value of the option contracts net of the premium paid designated as hedges. Our foreign currency purchased option contracts are purchased “at-the-money” or “out-of-the-money”. We purchase foreign currency forward and option contracts for up to 100% of our forecasted exposures in selected currencies (primarily in Euro, Japanese yen, British pound sterling, South Korean won and Hungarian forint) and limit the duration of these contracts to 40 months or less.
For derivative instruments that are designated and qualify as a cash flow hedge, the effective portion of the gain or loss on the derivative is reported as a component of accumulated other comprehensive income (“OCI”) and reclassified into earnings in the same line item (net sales, operating expenses, or cost of sales) associated with the forecasted transaction and in the same period or periods during which the hedged transaction affects earnings. Gains and losses on the derivative representing either hedge ineffectiveness or hedge components excluded from the assessment of effectiveness are recognized in current earnings or expenses during the current period and are classified as a component of “net foreign exchange gain (loss)”. Hedge effectiveness of foreign currency forwards and purchased option contracts designated as cash flow hedges are measured by comparing the hedging instrument’s cumulative change in fair value from inception to maturity to the forecasted transaction’s terminal value.
We held forward contracts with a notional amount of $28.6 million dollar equivalent of Euro, $4.0 million dollar equivalent of British pound sterling, $24.4 million dollar equivalent of Japanese yen, and $17.8 million dollar equivalent of Hungarian forint at dateDecember 31, 2009. These contracts are for terms of grant.up to 24 months. At December 31, 2008, we held forward contracts with a notional amount of $54.9 million dollar equivalent of Euro, $6.2 million dollar equivalent of British pound sterling, $18.9 million dollar equivalent of Japanese yen, $4.7 million dollar equivalent of South Korean won and $21.7 million dollar equivalent of Hungarian forint.
We held purchased option contracts with a notional amount of $28.4 million dollar equivalent of Euro at December 31, 2009. These contracts are for terms of up to 12 months. At December 31, 2008, we held purchased option contracts with a notional amount of $111.3 million dollar equivalent of Euro.
At December 31, 2009, we expect to reclassify $2.8 million of gains on derivative instruments from accumulated other comprehensive income to net sales during the next twelve months when the hedged international sales occur. At December 31, 2009, we expect to reclassify $3.7 million of gains on derivative instruments from accumulated OCI to cost of sales and $2.0 million of gains on derivative instruments from accumulated OCI to operating expenses during the next twelve months when the hedged international expenses occur. Expected amounts are based on derivative valuations at December 31, 2009. Actual results may vary as a result of changes in the corresponding exchange rate subsequent to this date.
During the year ended December 31, 2009, hedges with a notional amount of $22.8 million were determined to be ineffective. As a result, we recorded a net gain of adopting SFAS 123R$1.2 million related to these hedges as a component of “net foreign exchange gain (loss)” during the year ended December 31, 2009. We did not record any gains or losses due to the ineffectiveness of our hedges during the year ended December 31, 2008.Other Derivatives
Other derivatives not designated as hedging instruments under FASB ASC 815 consist primarily of foreign currency forward contracts that we use to hedge our foreign denominated net receivable or net payable positions to protect against the change in value caused by a fluctuation in foreign currency exchange rates. We typically hedge up to 90% of our outstanding foreign denominated net receivables or net payables and typically limit the duration of these foreign currency forward contracts to approximately 90 days. The gain or loss on the derivatives as well as the offsetting gain or loss on the hedge item attributable to the hedged risk is recognized in current earnings under the line item “net foreign exchange gain (loss)”. As of December 31, 2009 and December 31, 2008, we held foreign currency forward contracts with a notional amount of $45.2 million and $67.1 million, respectively.
Effective January 1, 2006,2009, we adopted the updated disclosure requirements of FASB ASC 815. The following table presents the fair value of derivative instruments on our income before income taxesConsolidated Balance Sheets and net incomethe effect of derivative instruments on our Consolidated Statements of Income.
Fair Values of Derivative Instruments (in thousands):
In thousands Asset Derivatives December 31, 2009 December 31, 2008 Balance Sheet Location Fair Value Balance Sheet Location Fair Value Derivatives designated as hedginginstruments under FASB ASC 815 Foreign exchange contracts – ST forwards Prepaid expenses and other current assets $ 7,947 Prepaid expenses and other current assets $ 5,260 Foreign exchange contracts – LT forwards Other long-term assets 274 Other long-term assets 2,654 Foreign exchange contracts – ST options Prepaid expenses and other current assets 1,821 Prepaid expenses and other current assets 5,705 Foreign exchange contracts – LT options Other long-term assets — Other long-term assets 3,838 Total derivatives designated ashedging instruments under FASB ASC 815 $ 10,042 $ 17,457 Derivatives not designated ashedging instruments under FASB ASC 815 Foreign exchange contracts – ST forwards Prepaid expenses and other current assets $ 974 Prepaid expenses and other current assets $ 2,745 Total derivatives not designated ashedging instruments under FASB ASC 815 $ 974 $ 2,745 Total derivatives $ 11,016 $ 20,202
Liability Derivatives December 31, 2009 December 31, 2008 Balance Sheet Location Fair Value Balance Sheet Location Fair Value Derivatives designated as hedginginstruments under FASB ASC 815 Foreign exchange contracts – ST forwards Accrued expenses and other liabilities $ — Accrued expenses and other liabilities $ (1,803 ) Foreign exchange contracts – LT forwards Other long-term liabilities — Other long-term liabilities — Foreign exchange contracts – ST options Accrued expenses and other liabilities — Accrued expenses and other liabilities — Foreign exchange contracts – LT options Other long-term liabilities — Other long-term liabilities — Total derivatives designated ashedging instruments under FASB ASC 815 $ — $ (1,803 ) Derivatives not designated ashedging instruments under FASB ASC 815 Foreign exchange contracts – ST forwards Accrued expenses and other liabilities $ (318 ) Accrued expenses and other liabilities $ (3,280 ) Total derivatives not designated ashedging instruments under FASB ASC 815 $ (318 ) $ (3,280 ) Total derivatives $ (318 ) $ (5,083 )
The following table shows the effect of derivative instruments on our Consolidated Statements of Income for the year ended December 31, 2006 are $9.42009 (in thousands):
Derivatives in FASB ASC 815 Cash Flow Hedging Relationship Amount of Gain or (Loss) Recognized in OCI on Derivative (Effective Portion) (in thousands) Location of Gain or (Loss) Reclassified from Accumulated OCI into Income (Effective Portion) Amount of Gain or (Loss) Reclassified from Accumulated OCI into Income (Effective Portion) (in thousands) Location of Gain or (Loss) Recognized in Income on Derivative (Ineffective Portion and Amount Excluded from Effectiveness Testing) Amount of Gain or (Loss) Recognized in Income on Derivative (Ineffective Portion and Amount Excluded from Effectiveness Testing) 2009 2009 2009 Foreign exchange contracts – forwards and options $ (6,304 ) Net sales $ 1,399 Net foreign exchange gain (loss) $ 1,132 Foreign exchange contracts – forwards and options 2,055 Cost of sales (74 ) Net foreign exchange gain (loss) (41 ) Foreign exchange contracts – forwards and options 1,427 Operating expenses 517 Net foreign exchange gain (loss) 81 Total $ (2,822 ) $ 1,842 $ 1,172
Derivatives not Designated as Hedging Instruments under FASB ASC 815 Location of Gain (Loss) Recognized in Income on Derivative Amount of Gain (Loss) Recognized in Income on Derivative 2009 Foreign exchange contracts – forwards Net foreign exchange gain/(loss) $ (1,669 ) Total $ (1,669 )
Note 5 – Inventories
Inventories, net consist of the following (in thousands):
December 31, 2009 2008 Raw materials $ 42,121 $ 48,004 Work-in-process 2,042 4,150 Finished goods 42,352 55,204 $ 86,515 $ 107,358
Note 6 – Property and equipment
Property and equipment consist of the following (in thousands):
December 31, 2009 2008 Land $ 17,076 $ 7,210 Buildings 138,367 136,802 Furniture and equipment 154,558 144,979 310,001 288,991 Accumulated depreciation (156,736 ) (134,514 ) $ 153,265 $ 154,477
Depreciation expense for the years ended December 31, 2009, 2008 and 2007, was $22.3 million, $20.9 million and $22.2 million, respectively.
Intangibles at December 31, 2009 and 2008 are as follows:
2009 2008 Gross Carrying Amount Accumulated Amortization Net Carrying Amount Gross Carrying Amount Accumulated Amortization Net Carrying Amount Capitalized software development costs $ 38,928 $ (20,455 ) $ 18,473 $ 25,610 $ (11,344 ) $ 14,266 Acquired technology 28,022 (20,967 ) 7,055 27,503 (16,804 ) 10,699 Patents 19,033 (5,377 ) 13,656 16,068 (4,506 ) 11,562 Other 12,577 (8,371 ) 4,206 11,401 (6,013 ) 5,388 $ 98,560 $ (55,170 ) $ 43,390 $ 80,582 $ (38,667 ) $ 41,915
Software development costs capitalized during 2009, 2008 and 2007 were $13.3 million, $9.5 million and $8.3 million, respectively, and related amortization was $9.1 million, $10.3 million and $8.9 million, respectively. Included in these capitalized costs for the years ended December 31, 2009, 2008, and 2007 were costs related to stock based compensation of $734,000, $451,000 and $422,000, respectively. Amortization of capitalized software development costs is computed on an individual product basis for those products available for market and is recognized based on the product’s estimated economic life, generally three years. Patents are amortized using the straight-line method over their estimated period of benefit, generally ten to seventeen years. Total intangible assets amortization expenses were $16.5 million, $16.2 million and $14.4 million for the years ended December 31, 2009, 2008 and 2007, respectively.
Capitalized software development costs, acquired technology, patents and other have weighted-average useful lives of 2.2 years, 1.8 years, 5.3 years, and 1.8 years, respectively, as of December 31, 2009. The estimated future amortization expense related to intangible assets as of December 31, 2009 is as follows:
Amount(in thousands) 2010 $ 18,097 2011 12,986 2012 7,187 2013 1,868 2014 1,186 Thereafter 2,066 $ 43,390
Acquisition intangibles are amortized over their useful lives, which range from three to eight years. Amortization expense for acquisition intangibles was approximately $3.9 million and $4.2 million for 2009 and 2008, respectively, of which approximately $3.4 million and $3.6 million was recorded in cost of sales and approximately $503,000 and $580,000 was recorded in operating expenses for 2009 and 2008, respectively. The estimated amortization expense of acquisition intangibles in future years will be recorded in our Consolidated Statements of Income as follows (in thousands):
Fiscal Year Cost of Sales Acquisition related costs and amortization, net Total 2010 $ 2,701 $ 369 $ 3,070 2011 2,160 221 2,381 2012 1,126 206 1,332 2013 87 75 162 Thereafter — — — Total $ 6,074 $ 871 $ 6,945
Note 8 – Goodwill
The carrying amount of goodwill for 2008 and 2009 are as follows:
Amount(in thousands) Balance as of December 31, 2007 $ 54,111 Acquisitions/purchase accounting adjustments 10,818 Divestitures — Foreign currency translation impact (368 ) Balance as of December 31, 2008 $ 64,561 Acquisitions/purchase accounting adjustments — Divestitures — Foreign currency translation impact 218 Balance as of December 31, 2009 $ 64,779
The excess purchase price over the fair value of assets acquired is recorded as goodwill. As we have one operating segment, we allocate goodwill to one reporting unit for goodwill impairment testing. In accordance with FASB ASC 350, goodwill is tested for impairment on an annual basis, and between annual tests if indicators of potential impairment exist, using a fair-value-based approach based on the market capitalization of the reporting unit. Our annual impairment test was performed as of February 28, 2009. No impairment of goodwill has been identified during the period presented. Goodwill is deductible for tax purposes in certain jurisdictions.
The components of income before income taxes are as follows (in thousands):
Years Ended December 31, 2009 2008 2007 Domestic $ 34,953 $ 15,921 $ 31,685 Foreign 15,292 82,216 81,742 $ 50,245 $ 98,137 $ 113,427
The provision for income taxes charged to operations is as follows (in thousands):
Years Ended December 31, 2009 2008 2007 Current tax expense: U.S. federal $ 3,117 $ 14,631 $ 15,957 State 136 1,391 1,155 Foreign 13,760 18,910 9,925 Total current 17,013 34,932 27,037 Deferred tax expense (benefit): U.S. federal 9,920 (11,008 ) 628 State 387 (373 ) (156 ) Foreign (2,864 ) (1,570 ) (2,783 ) Total deferred 7,443 (12,951 ) (2,311 ) Change in valuation allowance 8,704 (8,671 ) (18,332 ) Total provision $ 33,160 $ 13,310 $ 6,394
Deferred tax liabilities (assets) at December 31, 2009 and 2008 as follows (in thousands):
December 31, 2009 2008 Capitalized software $ 5,978 $ 4,615 Depreciation and amortization 10,577 9,536 Unrealized gain on derivative instruments — 4,153 Undistributed earnings of foreign subsidiaries 9,278 10,075 Gross deferred tax liabilities 25,833 28,379 Operating loss carryforwards (57,422 ) (43,360 ) Intangible assets (44,159 ) (58,987 ) Vacation and other accruals (3,700 ) (4,890 ) Inventory valuation and warranty provisions (6,702 ) (12,665 ) Doubtful accounts and sales provisions (1,088 ) (1,512 ) Unrealized exchange loss (917 ) (1,345 ) Deferred revenue . (853 ) (71 ) Accrued rent expenses (111 ) (117 ) Accrued legal expenses (710 ) (1,466 ) Unrealized loss on derivative instruments (242 ) — 10% minority stock investment (900 ) (920 ) Stock-based compensation (4,483 ) (5,353 ) Research and development tax credit carryforward (2,054 ) — Foreign tax credit carryforward (1,775 ) — Other (657 ) (783 ) Gross deferred tax assets (125,773 ) (131,469 ) Valuation allowance 99,862 85,815 Net deferred tax liability (asset) $ (78 ) $ (17,275 )
A reconciliation of income taxes at the U.S. federal statutory income tax rate to the effective tax rate follows:
Years Ended December 31, 2009 2008 2007 U.S. federal statutory tax rate 35 % 35 % 35 % Domestic production activities — — (1 ) Foreign taxes (less) than federal statutory rate (6 ) (9 ) (14 ) Change in valuation allowance 17 (9 ) (16 ) Research and development tax credit (4 ) (2 ) (1 ) Tax exempt interest — (1 ) (1 ) State income taxes, net of federal tax benefit 1 1 1 Employee share-based compensation 7 2 2 Intercompany profit 15 (5 ) — Other 1 2 1 Effective tax rate 66 % 14 % 6 %
Certain prior year amounts in the reconciliation of income taxes at the U.S. federal statutory income tax rate to the effective tax rate have been reclassified to conform to the 2009 presentation as shown in the following tables:
2008 foreign taxes (less) than federal statutory rate as reported in prior year Form 10-K (14 ) Reclassification (a) 5 2008 foreign taxes (less) than federal statutory rate as reported in current year Form 10-K (9 ) 2008 intercompany profit as reported in prior year Form 10-K — Reclassification (a) (5 ) 2008 intercompany profit as reported in current year Form 10-K (5 )
(a) These amounts represent income taxes on intercompany profit previously included in foreign taxes (less) than the federal statutory rate and reclassified to intercompany profit for comparability to corresponding amounts reported in 2009. The reclassification did not have any impact on our total income tax expense.
For the year ended December 31, 2009, we generated a federal net operating loss of approximately $3.3 million and tax credits of approximately $3.8 million. The federal net operating loss can be carried back two years and the federal tax credits can be carried back one year.
As of December 31, 2009, eleven of our subsidiaries have available, for income tax purposes, foreign net operating loss carryforwards of an aggregate of approximately $286 million, of which $12.1 million expire during the years 2011 - - 2018 and $273.9 million of which may be carried forward indefinitely. Our tax valuation allowance relates to our ability to realize certain of these foreign net operating loss carryforwards and benefits of tax deductible goodwill in excess of book goodwill.
We maintain a manufacturing facility in Hungary. As a result of certain foreign investment incentives available under Hungarian law, the profit from our Hungarian operation was subject to a reduced income tax rate. This special tax status terminated on January 1, 2008, with the merger of our Hungary manufacturing operations with its Hungarian parent company. The merger was effective on January 1, 2008. The aggregate tax benefit of the exemption was $8.7 million lower, respectively, than if we had continued to account for share-based compensation under APB 25. Basic and diluted earnings per share for the year ended December 31, 2006 are $0.112007.
In 2003, we restructured the organization of our manufacturing operation in Hungary. The tax deductible goodwill in excess of book goodwill created by this restructuring resulted in our being required to record a gross deferred tax asset of $91.0 million. Because we did not expect to have sufficient taxable income in the relevant jurisdiction in future periods to realize the benefit of this deferred tax asset, a full valuation allowance was established. Following the approval of the merger of our Hungarian manufacturing operation with its Hungarian parent company in December 2007, we released $8.7 million and $0.11 lower,$18.3 million in 2008 and 2007, respectively, than if we had continued to account for share-based compensation under APB 25. Deferred stock-based compensation balancesof the valuation allowance previously required under APB 25 were adjusted against previously recorded common stock and additional paid-in capital balances upon adoption of SFAS 123R, as required. Had we previously recognized compensation costs as prescribed by SFAS 123, previously reported net income, basic earnings per share and diluted earnings per share would have changed to the pro forma amounts shown below (in thousands, except per share amounts):
Years Ended December 31,
2005
2004
Net income, as reported $ 61,517 $ 48,610 Stock-based compensation included in reported net income, net of related tax effects 959 — Total stock-based compensation expense determined under fair value method for all awards, net of related tax effects (13,998 ) (12,741 )
Pro-forma net income $ 48,478 $ 35,869
Earnings per share: Basic - as reported $ 0.78 $ 0.62 Basic - pro-forma $ 0.62 $ 0.46 Diluted - as reported $ 0.76 $ 0.59 Diluted - pro-forma $ 0.60 $ 0.44
Pro-forma disclosuresestablished for the excess tax deductible goodwill to reflect the tax benefit we expected to realize in future periods.
For the year 2009, we expected to recognize an additional tax benefit of $9.7 million related to these assets. Effective January 1, 2010, a new tax law in Hungary provides for an enhanced deduction for the qualified research and development expenses of NI Hungary Software and Hardware Manufacturing Kft. ("NI Hungary"). During the three months ended December 31, 2006 are2009, we obtained confirmation of the application of this new tax law for the qualified research and development expenses of NI Hungary. Based on the application of this new tax law to the qualified research and development expense of NI Hungary, we no longer expect to have sufficient future taxable income in Hungary to realize the benefits of these tax assets. As such, we recorded an income tax charge of $21.6 million during the three months ended December 31, 2009, $18.4 million of which was related to a valuation allowance on the previously recognized assets created by the restructuring and $3.2 million of which was related to tax benefits from other assets that we will no longer be able to realize as a result of this change. We do not presented becauseexpect to realize the amounts aretax benefit of the remaining assets created by the restructuring and therefore we have a full valuation allowance of $98.2 million against those assets at December 31, 2009.
We have not provided for U.S. federal income and foreign withholding taxes on approximately $267.5 million of certain non-U.S. subsidiaries’ undistributed earnings as of December 31, 2009. These earnings would become subject to taxes of approximately $85.7 million, if they were actually or deemed to be remitted to the parent company as dividends or if we should sell our stock in these subsidiaries. We intend to permanently reinvest the undistributed earnings.
We adopted the provisions of FASB ASC 740, on January 1, 2007. FASB ASC 740 clarifies the accounting for uncertainty in income taxes recognized in an entity's financial statements and prescribes a recognition threshold and measurement attribute for financial statement disclosure of tax positions taken or expected to be taken on a tax return. We recognized no material adjustment to the Consolidated Statementsliability for unrecognized income tax benefits. A reconciliation of Income.the beginning and ending amount of unrecognized tax benefit is as follows (in thousands):
2009 2008 Balance at beginning of period $ 9,364 $ 8,273 Additions based on tax positions related to the current year 2,060 1,946 Additions for tax positions of prior years 1,272 366 Reductions as a result of the lapse of the applicable statute of limitations (1,634 ) (1,221 ) Balance at end of period $ 11,062 $ 9,364
All of our unrecognized tax benefits at December 31, 2009 would affect our effective income tax rate if recognized. As of December 31, 2009, it is deemed reasonably possible that the Company will recognize tax benefits in the amount of $2.3 million in the next twelve months due to the closing of open tax years. The nature of the uncertainty relates to deductions taken on returns that have not been examined by the applicable tax authority.
We recognize interest and penalties related to income tax matters in income tax expense. During the years ended December 31, 2009 and 2008, we recognized interest expense related to uncertain tax positions of approximately $506,000 and $365,000, respectively. The tax years 2002 through 2009 remain open to examination by the major taxing jurisdictions in which we file income tax returns.
Note 10 – Stockholders’ equity and stock-based compensation
Stock option plans
Our stockholders approved the 1994 Incentive Stock Option Plan (the “1994 Plan”) on May 9, 1994. At the time of approval, 9,112,500 shares of our common stock were reserved for issuance under this plan. In 1997, an additional 7,087,500 shares of our common stock were reserved for issuance under this plan, and an additional 750,000 shares were reserved for issuance under this plan, as amended, in 2004. The 1994 Plan terminated in May 2005, except with respect to outstanding awards previously granted thereunder. Awards under the plan were either incentive stock options within the meaning of Section 422 of the Internal Revenue Code or nonqualified options. The right to purchase shares vests over a five to ten-year period, beginning on the date of grant. Vesting of ten year awards may accelerate based on the Company’s previous year’s earnings and revenue growth but shares cannot accelerate to vest over a period of less than five years. Stock options must be exercised within ten years from date of grant. Stock options were issued at the market price at the grant date. As part of the requirements of SFAS 123R, the Company isFASB ASC 718, we are required to estimate potential forfeitures of stock grants and adjust compensation cost recorded accordingly. The estimate of forfeitures will be adjusted over the requisite service period to the extent that actual forfeitures differ, or are expected to differ, from such estimates. Changes in estimated forfeitures will be recognized through a cumulative catch-up adjustment in the period of change and will also impact the amount of stock compensation expense to be recognized in future periods.
Transactions under all stock option plans are summarized as follows:Number of
shares under
option
Weighted
average
exercise
price
Outstanding at December 31, 2003 9,726,418 $ 18.07 Exercised (882,539 ) 9.60 Canceled (325,912 ) 27.66 Granted 1,262,599 29.71
Outstanding at December 31, 2004 9,780,566 $ 20.02 Exercised (1,188,614 ) 10.72 Canceled (358,444 ) 29.49 Granted 244,725 24.24
Outstanding at December 31, 2005 8,478,233 $ 21.05 Exercised (1,398,617 ) 13.16 Canceled (164,943 ) 27.32 Granted 0 0
Outstanding at December 31, 2006 6,914,673 $ 22.49
Options exercisable at December 31: 2004 6,353,236 $ 17.23 2005 5,946,139 19.10 2006 5,384,470 21.53
Number of
shares under
option
Weighted
average
fair value
Weighted average, grant date fair value of options granted during: 2004 1,262,599 $ 16.72 2005 244,725 12.85 2006 0 0
Number ofshares underoption Weightedaverageexerciseprice Outstanding at December 31, 2006 6,914,673 $ 22.49 Exercised (1,515,107 ) 15.22 Canceled (104,925 ) 27.33 Granted — — Outstanding at December 31, 2007 5,294,641 $ 24.47 Exercised (925,743 ) 17.30 Canceled (96,331 ) 26.98 Granted — — Outstanding at December 31, 2008 4,272,567 $ 25.97 Exercised (379,630 ) 15.40 Canceled (181,434 ) 26.80 Granted — — Outstanding at December 31, 2009 3,711,503 $ 26.93 Options exercisable at December 31: 2007 4,368,972 $ 24.17 2008 3,812,334 26.00 2009 3,493,574 26.94
The aggregate intrinsic value of stock options at exercise, represented in the table above, was $25.5$2.3 million, $19.1$11.0 million and $18.3$22.3 million for the years ended December 31, 2006, 20052009, 2008 and 2004,2007, respectively. Total unrecognized stock-based compensation expense related to non-vested stock options was approximately $18.1$2.5 million as of the end of 2006,December 31, 2009, related to approximately 1,530,000218,000 shares with a per share weighted average fair value of $15.93.$17.50. We anticipate this expense to be recognized over a weighted average period of approximately 4.04.3 years.Outstanding and Exercisable by Price Range
As of December 31, 2006
Options Outstanding
Options Exercisable
Range of Exercise prices
Number
outstanding
as of
12/31/2006
Weighted
average
remaining
contractual life
Weighted
average
exercise
price
Number
exercisable
as of
12/31/2006
Weighted
average
exercise price
$8.6667 -$12.2222 1,072,535 1.27 $ 10.98 1,045,669 $ 10.9677 12.3611 - 15.3055 976,976 1.54 $ 15.23 967,192 $ 15.2258 15.5555 - 21.0417 1,720,096 5.18 $ 20.64 1,223,332 $ 20.6330 21.2533 - 29.5400 839,349 6.80 $ 25.53 538,372 $ 25.5261 29.8500 - 34.3750 2,305,717 5.60 $ 31.19 1,609,905 $ 31.5078
$8.6667 - $34.3750 6,914,673 3.94 $ 22.4883 5,384,470 $ 21.5254
Outstanding and Exercisable by Price Range as of December 31, 2009 Options Outstanding Options Exercisable Range of Exercise prices Number outstanding as of 12/31/2009 Weighted average remaining contractual life Weighted average exercise price Number exercisable as of 12/31/2009 Weighted average exercise price $16.08 – $21.95 1,238,441 1.74 $ 20.69 1,188,337 $ 20.71 $22.30 – $29.85 1,257,625 3.90 $ 28.15 1,098,218 $ 28.08 $30.51 – $34.38 1,215,437 0.41 $ 32.02 1,207,019 $ 32.02 $16.08 – $34.38 3,711,503 2.04 $ 26.93 3,493,574 $ 26.94
The weighted average remaining contractual life of options exercisable as of December 31, 20062009 was 3.371.9 years. The aggregate intrinsic value of options outstanding as of December 31, 20062009 was $32.9$9.4 million. The aggregate intrinsic value of options currently exercisable as of December 31, 20062009 was $30.8$8.8 million. No options were granted in the yearyears ended December 31, 20062009, 2008 and 2007 as our incentive option plan terminated in May 2005. The fair value of options granted in 2004 and 2005 were estimated on the date of grant using the Black-Scholes option-pricing model with the following weighted-average assumptions:2005
2004
Dividend expense yield 0.2% 0.2% Expected life 5.5 years 5.5 years Expected volatility 43.3% 53.2% Risk-free interest rate 4.0% 2.7%
Restricted stock plan
Our stockholders approved theour 2005 Incentive Plan on May 10, 2005. At the time of approval, 2,700,000 shares of our common stock were reserved for issuance under this plan, as well as the number of shares which had been reserved but not issued under the 1994 Plan (our incentive stock option plan which terminated in May 2005), and any shares that returned to the 1994 Plan as a result of termination of options or repurchase of shares issued under such plan. The 2005 Plan, administered by the Compensation Committee of the Board of Directors, provides for granting of incentive awards in the form of restricted stock and restricted stock units (“RSUs”) to directors, executive officers and employees of the Company and its subsidiaries. Awards vest over a three, five or ten-year period, beginning on the date of grant. Vesting of ten year awards may accelerate based on the Company’s previous year’s earnings and growth but ten year awards cannot accelerate to vest over a period of less than five years. Shares available for grant at December 31, 20062009 were 3,804,106.2,089,302. As part of the requirements of SFAS 123R, the Company isFASB ASC 718, we are required to estimate potential forfeitures of restricted stock unitsRSUs and adjust compensation cost recorded accordingly. The estimate of forfeitures will be adjusted over the requisite service period to the extent that actual forfeitures differ, or are expected to differ, from such estimates. Changes in estimated forfeitures will be recognized through a cumulative catch-up adjustment in the period of change and will also impact the amount of stock compensation expense to be recognized in future periods.
Transactions under the restricted stock plan2005 Plan are summarized as follows:RSUs
Number of RSUs
Weighted Average Grant Price
Balance at January 1, 2005 0 $ 0.00 Granted 813,305 $ 22.24 Earned 0 $ 0.00 Canceled (15,000 ) $ 22.12
Balance at December 31, 2005 798,305 $ 22.24 Granted 693,805 $ 32.21 Earned (113,794 ) $ 31.67 Canceled (53,383 ) $ 25.93
Balance at December 31, 2006 1,324,933 $ 26.77
RSUs Number of RSUs Weighted Average Grant Price Balance at January 1, 2007 1,324,933 $ 26.77 Granted 801,780 $ 27.90 Earned (209,303 ) $ 27.85 Canceled (75,776 ) $ 27.64 Balance at December 31, 2007 1,841,634 $ 26.86 Granted 763,182 $ 28.51 Earned (320,251 ) $ 29.42 Canceled (119,337 ) $ 28.19 Balance at December 31, 2008 2,165,228 $ 26.99 Granted 604,083 $ 21.80 Earned (407,156 ) $ 22.04 Canceled (57,721 ) $ 27.88 Balance at December 31, 2009 2,304,434 $ 26.48
Total unrecognized stock-based compensation expense related to non-vested restricted stock unitsRSU’s was approximately $32.6$57.1 million as of the end of 2006,December 31, 2009, related to 1,324,9332,304,434 shares with a per share weighted average fair value of $27.24.$26.48. We anticipate this expense to be recognized over a weighted average period of approximately 77.3 years.
Employee stock purchase plan
Our employee stock purchase plan permits substantially all domestic employees and employees of designated subsidiaries to acquire our common stock at a purchase price of 85% of the lower of the market price at the beginning or the end of the participationpurchase period. On December 21, 2005, our Compensation Committee amended theThe plan has quarterly purchase periods to be quarterly beginning on November 1, February 1, May 1, and AugustNovember 1 of each year. The initial period commencedAt our annual shareholders meeting held on April 1, 2006 and ended on July 31, 2006.May 7, 2007, our shareholders approved an additional 3 million shares of common stock to be reserved for issuance under this plan. Employees may designate up to 15% of their compensation for the purchase of common stock.stock under this plan. Common stock reserved for future employee purchases aggregated 823,3091,755,071 shares at December 31, 2006.2009. Shares issued under this plan were 539,541838,536 in the year ended December 31, 2006.2009. The weighted average fair value of the employees’ purchase rights was $22.34$19.05 per share and was estimated using the Black-Scholes model with the following assumptions:2006
2005
2004
Dividend expense yield 0.2% 0.2% 0.2% Expected life 3 months 6 months 6 months Expected volatility 29% 29% 35% Risk-free interest rate 4.5% 3.2% 1.0%
2009 2008 2007 Dividend expense yield 0.5% 0.3% 0.3% Expected life 3 months 3 months 3 months Expected volatility 45% 26% 23% Risk-free interest rate 0.8% 3.8% 5.0%
Weighted average, grant date fair value of purchase rights granted under the Employee Stock Purchase Plan:Number of shares
Weighted average fair value
2004 380,211 $ 7.73 2005 467,932 6.08 2006 539,541 6.62
Plan are as follows:
Numberof shares Weightedaveragefair value 2007 549,719 $ 6.19 2008 679,983 5.86 2009 838,536 5.75
Stock-based compensation included in total cost of sales and operating expenses for the years ended December 31, 2009, 2008 and 2007 are summarized as follows (in thousands):
2009 2008 2007 Stock-based compensation Total cost of sales $ 1,284 $ 1,063 $ 911 Sales and marketing 8,774 8,479 7,322 Research and development 7,236 7,121 6,435 General and administrative 3,005 3,084 2,866 Provision for income taxes (3,765 ) (4,601 ) (3,839 ) Total $ 16,534 $ 15,146 $ 13,695
Authorized Preferred Stock and Preferred Stock Purchase Rights Plan
We have 5,000,000 authorized shares of preferred stock. On January 21, 2004, our Board of Directors designated 750,000 of these shares as Series A Participating Preferred Stock in conjunction with its adoption of a Preferred Stock Rights Agreement (the “Rights Agreement”) and declaration of a dividend of one preferred share purchase right (a “Right”) for each share of common stock outstanding held as of May 10, 2004 or issued thereafter. Each Right will entitle its holder to purchase one one-thousandth of a share of National Instruments’ Series A Participating Preferred Stock at an exercise price of $200, subject to adjustment, under certain circumstances. The Rights Agreement was not adopted in response to any effort to acquire control of National Instruments.
The Rights only become exercisable in certain limited circumstances following the tenth day after a person or group announces acquisitions of or tender offers for 20% or more of our common stock. In addition, if an acquirer (subject to certain exclusions for certain current stockholders of National Instruments, an “Acquiring Person”) obtains 20% or more of our common stock, then each Right (other than the Rights owned by an Acquiring Person or its affiliates) will entitle the holder to purchase, for the exercise price, shares of our common stock having a value equal to two times the exercise price. Under certain circumstances, our Board of Directors may redeem the Rights, in whole, but not in part, at a purchase price of $0.01 per Right. The Rights have no voting privileges and are attached to and automatically traded with our common stock until the occurrence of specified trigger events. The Rights will expire on the earlier of May 10, 2014 or the exchange or redemption of the Rights. Comprehensive income
Our comprehensive income is comprised of net income, foreign currency translation and unrealized gains and losses on forward and option contracts and securities available for sale. Comprehensive income for 2006, 2005 and 2004 was $76.9 million, $57.2 million and $57.7 million, respectively.
Recently issued accounting pronouncements
In July 2006, the Financial Accounting Standards Board (“FASB”) issued FASB Interpretation (“FIN”) 48,Accounting for Uncertainty in Income Taxes – an interpretation of Statement of Financial Accounting Standards (“SFAS”) 109. This interpretation clarifies the accounting for uncertainty in income taxes recognized in an entity’s financial statements in accordance with SFAS 109,Accounting for Income Taxes. It prescribes a recognition threshold and measurement attribute for financial statement disclosure of tax positions taken or expected to be taken on a tax return. This interpretation is effective for fiscal years beginning after December 15, 2006. We adopted FIN 48 on January 1, 2007 as required. The cumulative effect of adopting FIN 48 was recorded in retained earnings upon adoption. The adoption of FIN 48 did not have a significant impact on our financial position or results of operations.
In September 2006, the Securities and Exchange Commission (“SEC”) issued Staff Accounting Bulletin (“SAB”) 108 regarding the process of quantifying financial statement misstatements. SAB 108 states that registrants should use both a balance sheet approach and an income statement approach when quantifying and evaluating the materiality of a misstatement. The interpretations in SAB 108 contain guidance on correcting errors under the dual approach as well as provide transition guidance for correcting errors. This interpretation does not change the requirements within SFAS 154,Accounting Changes and Error Corrections – a replacement of APB 20 and FASB Statement 3, for the correction of an error on financial statements. SAB 108 is effective for annual financial statements covering the first fiscal year ending after November 15, 2006. We adopted this interpretation on December 31, 2006. The adoption of SAB 108 did not have a significant effect on our consolidated financial statements.
In September 2006, the FASB issued SFAS 157,Fair Value Measurements. This standard defines fair value, establishes a framework for measuring fair value in accounting principles generally accepted in the United States of America, and expands disclosure about fair value measurements. This pronouncement applies under other accounting standards that require or permit fair value measurements. Accordingly, this statement does not require any new fair value measurement. This statement is effective for fiscal years beginning after November 15, 2007, and interim periods within those fiscal years. We will be required to adopt SFAS 157 in the first quarter of fiscal year 2008. We are currently evaluating the requirements of SFAS 157 and have not yet determined the impact on our consolidated financial statements.
In March 2006, the Emerging Issues Task Force (“EITF”) reached a consensus on EITF Issue 06-3,How Taxes Collected from Customers and Remitted to Governmental Authorities Should Be Presented in the Income Statement (that is, Gross versus Net Presentation). Taxes within the scope of EITF Issue 06-3 include any taxes assessed by a governmental authority that are directly imposed on a revenue-producing transaction between a seller and a customer and may include, but are not limited to, sales taxes, use taxes, value-added taxes, and some excise taxes. The EITF concluded that the presentation of these taxes on either a gross (included in revenues and costs) or a net (excluded from revenue) basis is an accounting policy decision that should be disclosed. For any such taxes that are reported on a gross basis, a company should disclose the amounts of those taxes in interim and annual financial statements. Our policy is to exclude all such taxes from revenue. The provisions of EITF 06-3 are effective for interim and annual reporting periods beginning after December 15, 2006. The adoption of EITF 06-3 will not have any effect on our consolidated financial statements.
Note 2: Short-term investments
Short-term investments at December 31, 2006 and 2005, consisting of corporate, state and municipal securities, were acquired at an aggregate cost of $150.2 million and $119.8 million, respectively. The contractual maturities of these securities, which are classified as available-for-sale and carried at fair value, are as follows (in thousands):
December 31,
2006
2005
Less than 90 days $ 73,787 $ 61,855 90 days to one year 31,309 42,222 One year through two years 38,559 11,877 Two years or more 6,535 3,892
$ 150,190 $ 119,846
Note 3: Inventories
Inventories, net consist of the following (in thousands):
December 31,
2006
2005
Raw materials $ 38,270 $ 28,497 Work-in-process 4,321 4,634 Finished goods 34,547 29,696
$ 77,138 $ 62,827
Note 4: Property and equipment
Property and equipment consist of the following (in thousands):
December 31,
2006
2005
Land $ 7,165 $ 7,085 Buildings 125,228 124,428 Furniture and equipment 110,710 91,073
243,103 222,586 Accumulated depreciation (97,678 ) (78,256 )
$ 145,425 $ 144,330
Depreciation expense for the years ended December 31, 2006, 2005 and 2004, was $20.2 million, $17.8 million and $17.3 million, respectively.
Note 5: Intangibles
Intangibles at December 31, 2006 and 2005 are as follows:
2006
2005
Gross Carrying Amount
Accumulated Amortization
Net Carrying Amount
Gross Carrying Amount
Accumulated Amortization
Net Carrying Amount
Capitalized software development costs $ 57,571 $ (41,791 ) $ 15,780 $ 50,201 $ (32,651 ) $ 17,550 Acquired technology 20,814 (9,734 ) 11,080 20,257 (6,296 ) 13,961 Patents 12,928 (3,076 ) 9,852 11,647 (2,445 ) 9,202 Other 6,452 (3,099 ) 3,353 4,826 (1,937 ) 2,889
$ 97,765 $ (57,700 ) $ 40,065 $ 86,931 $ (43,329 ) $ 43,602
Software development costs capitalized during 2006, 2005 and 2004 were $7.4 million, $13.4 million and $5.0 million, respectively, and related amortization was $9.1 million, $7.2 million and $6.6 million, respectively. Amortization of capitalized software development costs is computed on an individual product basis for those products available for market and is recognized based on the product’s estimated economic life, generally three years. Patents are amortized using the straight-line method over their estimated period of benefit, generally ten to seventeen years. Total intangible assets amortization expenses were $13.9 million, $10.7 million and $8.3 million for the years ended December 31, 2006, 2005 and 2004, respectively.
Capitalized software development costs, acquired technology, patents and other have weighted-average useful lives of 2.1 years, 4.1 years, 7.7 years and 3.7 years, respectively, as of the end of December 31, 2006. The estimated future amortization expense related to intangible assets as of December 31, 2006 is as follows:
Amount (in thousands)
2007 $ 13,044 2008 10,219 2009 5,046 2010 2,477 2011 1,569 Thereafter 7,710
$ 40,065
We established a valuation reserve in 2004 for the estimated total impairment of our $2.5 million cost-method investment in a start-up company. This impairment was based on our lack of expected recovery of our investment based on the start-up company’s lack of profitability.
Note 6: Goodwill
The carrying amount of goodwill for 2005 and 2006 are as follows:
Amount (in thousands)
Balance as of December 31, 2004 $ 13,356 Acquisitions/purchase accounting adjustments 39,177 Divestitures —
Balance as of December 31, 2005 52,533 Acquisitions/purchase accounting adjustments — Divestitures — Foreign currency translation impact 810
Balance as of December 31, 2006 $ 53,343
The excess purchase price over the fair value of assets acquired is recorded as goodwill. In accordance with SFAS 142,Goodwill and Other Intangible Assets, goodwill is tested for impairment on an annual basis, and between annual tests if indicators of potential impairment exist, using a fair-value-based approach. Our annual impairment test was performed on April 6, 2006. No impairment of goodwill was identified during any of the periods presented.
Note 7: Income taxes
The components of income before income taxes are as follows (in thousands):
Years Ended December 31,
2006
2005
2004
Domestic $ 40,681 $ 40,460 $ 37,786 Foreign 54,621 40,220 27,027
$ 95,302 $ 80,680 $ 64,813
The provision for income taxes charged to operations is as follows (in thousands):
Years Ended December 31,
2006
2005
2004
Current tax expense: U.S. federal $ 17,966 $ 11,022 $ 10,594 State 901 1,029 1,106 Foreign 5,190 3,725 3,300
Total current 24,057 15,776 15,000
Deferred tax expense (benefit): U.S. federal (1,233 ) 2,396 1,041 State (90 ) (102 ) 121 Foreign (140 ) 1,093 41
Total deferred (1,463 ) 3,387 1,203
Total provision $ 22,594 $ 19,163 $ 16,203
Deferred tax liabilities (assets) at December 31, 2006 and 2005 as follows (in thousands):
December 31,
2006
2005
Capitalized software $ 5,392 $ 6,288 Unrealized gain on derivative instruments — 86 Depreciation and amortization 9,071 8,598 Unrealized exchange gain 2 1,238 Undistributed earnings of foreign subsidiaries 10,313 4,410
Gross deferred tax liabilities 24,778 20,620
Operating loss carryforwards (34,154 ) (22,672 ) Intangibles (85,684 ) (71,125 ) Vacation and other accruals (3,783 ) (2,946 ) Inventory valuation and warranty provisions (6,666 ) (9,043 ) Doubtful accounts and sales provisions (1,328 ) (1,545 ) Intercompany profit (3,242 ) (2,442 ) Deferred revenue (2,613 ) — Accrued rent expenses (17 ) (17 ) Accrued legal expenses (1,450 ) (12 ) Unrealized loss on derivative instruments (149 ) — 10% minority stock investment (906 ) (911 ) Stock-based compensation (1,954 ) (563 ) Other (691 ) (629 )
Gross deferred tax assets (142,637 ) (111,905 )
Valuation allowance 117,768 91,534
Net deferred tax liability (asset) $ (91 ) $ 249
A reconciliation of income taxes at the U.S. federal statutory income tax rate to the effective tax rate follows:
Years Ended December 31,
2006
2005
2004
U.S. federal statutory tax rate 35 % 35 % 35 % Foreign sales corporation/ETI benefit (1 ) (2 ) (3 ) Domestic production activities (1 ) (1 ) — Foreign taxes more (less) than federal statutory rate (11 ) (7 ) (6 ) Change in valuation allowance — (1 ) — Research and development tax credit (1 ) (1 ) (1 ) Tax exempt interest (1 ) (1 ) (1 ) State income taxes, net of federal tax benefit 1 1 1 Employee share-based compensation 3 — — Other — 1 —
Effective tax rate 24 % 24 % 25 %
As of December 31, 2006, thirteen of our subsidiaries have available, for income tax purposes, foreign net operating loss carryforwards of an aggregate of approximately $214.4 million, of which $8.5 million expire during the years 2008 — 2013 and $205.9 million of which may be carried forward indefinitely. Our tax valuation allowance relates to the realizability of certain of these foreign net operating loss carryforwards and benefits of tax deductible goodwill in excess of book goodwill.
We maintain a manufacturing facility in Hungary. As a result of certain foreign investment incentives available under Hungarian law, the profit from our Hungarian operation is currently subject to a reduced income tax rate. Based on our capital investment in Hungary and current exemption limits which apply to this and any capital investments made through December 31, 2005, we currently expect this special tax status will terminate on or before December 31, 2008. The aggregate tax benefit of the exemption was $5.4 million and $3.4 million for the years ended December 31, 2006 and 2005, respectively.
In 2003, we restructured the organization of our manufacturing operation in Hungary. The tax deductible goodwill in excess of book goodwill created by this restructuring resulted in our being required to record a gross deferred tax asset of $91.0 million. The amortization of this excess tax deductible goodwill resulted in a $32.1 million and $20.1 million deferred tax asset for the associated net operating loss for the years ended December 31, 2006 and 2005, respectively. As of December 31, 2006 and 2005, the gross deferred tax asset related to the excess tax goodwill was $85.7 million and $71.1 million, respectively. Because we do not expect to have significant taxable income in the relevant jurisdiction in future periods to realize the benefit of these deferred tax assets, a valuation allowance for the entire amount of these deferred tax assets has been established.
We have not provided for U.S. federal income and foreign withholding taxes on approximately $111.8 million of certain non-U.S. subsidiaries’ undistributed earnings as of December 31, 2006. These earnings would become subject to taxes of approximately $36.5 million, if they were actually or deemed to be remitted to the parent company as dividends or if we should sell our stock in these subsidiaries. We currently intend to reinvest indefinitely these undistributed earnings.
Note 8: Stockholders’ equity
Stock repurchases and retirements In
Since 1998, our Board of Directors approved theand we maintained various stock repurchase and retirement of shares of common stock to reduce the dilutive effect of our stock plans.programs. Pursuant to the 1998 repurchase programthese plans we have repurchasedhad purchased and retired a total of 1,402,7257,354,966 shares for approximately $23.1$184.9 million from 1998 through December 31, 2007. During 2008, we purchased an additional 4,110,042 share for approximately $103.6 million. In 2002,At December 31, 2008, there were 723,092 shares available for repurchase under the plan approved in April 2008. On January 23, 2009, our Board of Directors approved a new share repurchase and retirement plan which replacedthat increased the 1998 plan. Underaggregate number of shares of common stock we are authorized to purchase from 591,324 to 3.0 million. During 2009, we purchased an additional 1,443,441 shares for approximately $34.6 million. At December 31, 2009, there were 1,688,327 shares available for repurchase under the plan approved in 2002, weJanuary 2009. Our share repurchase plan does not have authorization to repurchase up to 6,222,106 shares of National Instruments stock. This plan has noan expiration date. Pursuant to our repurchase program, we have repurchased and retired a total of 3,222,106 shares for approximately $82.0 million.
Note 9:11 – Employee retirement plan
We have a defined contribution retirement plan pursuant to Section 401(k) of the Internal Revenue Code. Substantially all domestic employees with at least thirty30 days of continuous service are eligible to participate and may contribute up to 15% of their compensation. The Board of Directors has elected to make matching contributions equal to 50% of employee contributions, which may be applied to a maximum of 6% of each participant’s compensation. Employees are eligible for our matching contributions after one year of continuous service. Company contributions vest immediately. Our policy prohibits participants from direct investment in shares of our common stock within the plan. Company contributions charged to expense were $3.0$3.9 million, $2.6$3.7 million and $2.4$3.3 million in 2006, 20052009, 2008 and 2004,2007, respectively.
Fair value of financial instrumentsIn accordance with FASB ASC 280, Segment Reporting (FASB ASC 280), we determine operating segments using the management approach. The estimated fair value amounts disclosed below have been determined using available market informationmanagement approach designates the internal organization that is used by management for making operating decisions and valuation methodologies described below. For certainassessing performance as the source of our financial instruments, including cashoperating segments. It also requires disclosures about products and cash equivalents, accounts receivable, accounts payableservices, geographic areas and accrued liabilities,major customers.
We have defined our operating segment based on geographic regions. We sell our products in three geographic regions. Our sales to these regions share similar economic characteristics, similar product mix, similar customers, and similar distribution methods. Accordingly, we have elected to aggregate these three geographic regions into a single operating segment. Revenue from the carrying amount approximates fair value due to the short-term maturity of these instruments. The estimated fair values of the other assets (liabilities)sale of our remaining financial instruments at December 31, 2006products which are similar in nature and 2005software maintenance are reflected as total net sales in our Consolidated Statements of Income.
Total net sales, operating income, interest income and long-lived assets, classified by the major geographic areas in which we operate, are as follows (in thousands):December 31,
2006
2005
Carrying
Amount
Fair
Value
Carrying
Amount
Fair
Value
Short-term investments $ 150,190 $ 150,190 $ 119,846 $ 119,846 Other assets/liabilities: Forward contracts (1,043 ) (1,043 ) 523 523
The fair values of short-term investments
Years Ended December 31, 2009 2008 2007 Net sales: Americas: Unaffiliated customer sales $ 292,999 $ 355,878 $ 331,482 Geographic transfers 86,145 132,563 115,709 379,144 488,441 447,191 Europe: Unaffiliated customer sales 210,188 267,373 230,940 Geographic transfers 189,076 204,282 159,992 399,264 471,655 390,932 Asia Pacific: Unaffiliated customer sales 173,407 197,286 177,956 Eliminations (275,221 ) (336,845 ) (275,701 ) $ 676,594 $ 820,537 $ 740,378
Years Ended December 31, 2009 2008 2007 Operating income: Americas $ 46,816 $ 71,467 $ 76,292 Europe 87,250 105,748 92,469 Asia Pacific 45,439 61,642 59,845 Unallocated: Research and development expenses (132,974 ) (143,140 ) (126,515 ) $ 46,531 $ 95,717 $ 102,091
Years Ended December 31, 2009 2008 2007 Interest income: Americas $ 803 $ 2,603 $ 5,138 Europe 727 3,291 4,485 Asia Pacific 99 102 199 $ 1,629 $ 5,996 $ 9,822
December 31, 2009 2008 Long-lived assets: Americas $ 100,489 $ 107,701 Europe 36,555 39,280 Asia Pacific 16,221 7,496 $ 153,265 $ 154,477
Total sales outside the United States for 2009, 2008 and foreign currency forward contracts2007 were estimated based upon quotes from brokers as of the applicable balance sheet date.$412.7 million, $499.3 million and $437.0 million, respectively.
Note 11: Derivative instruments13 – Commitments, contingencies and hedging activitiesleases
We have operations in 40 countries. Approximately 52% of our revenues are generated outsidecommitments under non-cancelable operating leases primarily for office facilities throughout the Americas. Our activities exposeworld. Certain leases require us to a varietypay property taxes, insurance and routine maintenance, and include escalation clauses. Future minimum lease payments as of market risks, includingDecember 31, 2009, for each of the effects of changes in foreign-currency exchange rates. These financial risksnext five years are monitored and managed by us as an integral part of our overall risk management program. We maintain a foreign-currency risk management strategy that uses derivative instruments (foreign currency forward and purchased options contracts) to protect our earnings and cash flows from fluctuations caused by the volatility in currency exchange rates. Movements in foreign-currency exchange rates pose a risk to our operations and competitive position, since exchange rate changes may affect our profitability and cash flow, and the business or pricing strategies of our non-U.S. based competitors.
Foreign currency fair value and cash flow hedges
The vast majority of our foreign sales are denominated in the customers’ local currency. We purchase foreign currency forward and purchased options contracts as hedges of forecasted sales that are denominated in foreign currencies and as hedges of foreign currency denominated receivables. These contracts are entered into to protect against the risk that the eventual dollar-net-cash inflows resulting from such sales or firm commitments will be adversely affected by changes in exchange rates.
We held forward contracts with notional amounts totaling $19.6follows (in thousands):
2010 $ 14,415 2011 9,898 2012 6,982 2013 4,611 2014 3,665 Thereafter 12,130 $ 51,701
Rent expense under operating leases was approximately $12.3 million, $11.7 million and $24.1$10.2 million at December 31, 2006 and 2005, respectively, that were designated as foreign currency fair value hedges of our foreign denominated receivables. The fair value of these contracts, which are for 90-day periods, is a liability of $617,000 and a receivable of $278,000 at December 31, 2006 and 2005, respectively. We recorded net losses of $1.0 million, net gains of $2.2 million and net losses of $2.6 million for fair value hedges for the years ended December 31, 2006, 20052009, 2008 and 2004, respectively, which was recorded2007, respectively.
As of December 31, 2009, we have non-cancelable purchase commitments with various suppliers of customized inventory and inventory components totaling approximately $6.5 million over the next twelve months.
As of December 31, 2009, we have outstanding guarantees for payment of customs and foreign grants totaling approximately $5.2 million.
Note 14 – Litigation
We filed a patent infringement action on January 25, 2001, in “Foreign Exchange Gain (Loss).” We hedge up to 90%the U.S. District Court, Eastern District of Texas (Marshall Division) claiming that The MathWorks, Inc. (“MathWorks”) infringed certain of our outstanding foreign denominated receivables. We held forward contracts withU.S. patents. On January 30, 2003, a notionaljury found infringement by MathWorks of three of the patents involved and awarded us specified damages. On September 23, 2003, the District Court entered final judgment in favor of us and entered an injunction against MathWorks’ sale of its Simulink and related products and stayed the injunction pending appeal. Upon appeal, the judgment and the injunction were affirmed by the U.S. Court of Appeals for the Federal Circuit (September 3, 2004). Subsequently the stay of injunction was lifted by the District Court. In November 2004, the final judgment amount of $26.6$7.4 million which had been held in escrow pending appeal was released to us.
An action was filed by MathWorks against us on September 22, 2004, in the U.S. District Court, Eastern District of Texas (Marshall Division), claiming that on that day MathWorks had released modified versions of its Simulink and $7.1related products, and seeking a declaratory judgment that the modified products do not infringe the three patents adjudged infringed in the District Court's decision of September 23, 2003 (and affirmed by the Court of Appeals on September 3, 2004). On November 2, 2004, MathWorks served the complaint on us. We filed an answer to MathWorks’ declaratory judgment complaint, denying MathWorks’ claims of non-infringement and alleging our own affirmative defenses. On January 5, 2005, the Court denied a contempt motion by us to enjoin the modified Simulink products under the injunction in effect from the first case. On January 7, 2005, we amended our answer to include counterclaims that MathWorks’ modified products are infringing three of our patents, and requested unspecified damages and an injunction. MathWorks filed its reply to our counterclaims on February 7, 2005, denying the counterclaims and alleging affirmative defenses. On March 2, 2005, we filed a notice of appeal regarding the Court's denial of the contempt motion. On March 15, 2005, the Court stayed MathWorks’ declaratory judgment action, pending a decision on the appeal by the Court of Appeals for the Federal Circuit. On February 9, 2006, the Court of Appeals for the Federal Circuit affirmed the District Court’s January 2005 order. On November 22, 2006, the District Court lifted the stay. The case schedule has yet to be set in this action. During the fourth quarter of 2004, we accrued $4 million at December 31, 2006 and 2005, respectively, that were designated as foreign currency cash flow hedges related to our probable loss from this contingency, which consists entirely of anticipated sales transactions.patent defense costs that are probable of being incurred. In the fourth quarter of 2006, we accrued an additional $600,000 related to this contingency. During the third quarter of 2009, we reduced the accrual by $2 million to reflect a decrease in the estimated costs that are probable of being incurred in this action. To date, we have charged a cumulative total of $623,000 against this accrual. At December 31, 2009, the remaining accrual was $2 million.
On February 1, 2008, we acquired all of the outstanding shares of microLEX Systems ApS, (“microLEX”) a premier provider of virtual instrumentation-based video, audio and mixed-signal test solutions. This acquisition was accounted for as a business combination. The purchase price of the acquisition, which included legal and accounting fees, was $17.8 million in cash. The allocation of the purchase price was determined using the fair value of these contracts, whichassets and liabilities acquired as of February 1, 2008. We funded the purchase price from existing cash balances. Our consolidated financial statements include the operating results from the date of acquisition. Pro-forma results or operations have not been presented because the effects of those operations were not material. The following table summarizes the allocation of the purchase price of microLEX (in thousands):
Goodwill $ 10,818 Acquired core technology 5,201 Non-competition agreements 159 Trademarks 119 Customer relationships 354 Current assets acquired 3,057 Long-term assets acquired 20 Current liabilities assumed (486 ) Deferred tax liabilities (1,458 ) Total assets acquired $ 17,784
Goodwill is not deductible for tax purposes. Existing technology, non-competition agreements, trademarks, and customer relationships have useful lives of 5 years, 3 years, 3 years, and 5 years, respectively, from the date of acquisition. These assets are not deductible for terms uptax purposes.
Note 16 – Quarterly results (unaudited)
The following quarterly results have been derived from unaudited consolidated financial statements that, in the opinion of management, reflect all adjustments (consisting only of normal recurring adjustments) necessary for a fair presentation of such quarterly information. The operating results for any quarter are not necessarily indicative of the results to twelve months, is a liabilitybe expected for any future period. The unaudited quarterly financial data for each of $427,000 and a receivable of $245,000 at December 31, 2006 and 2005, respectively, and a net unrealized deferred loss of $427,000 and a net unrealized deferred gain of $245,000 at December 31, 2006 and 2005, respectively, was recordedthe eight quarters in “Accumulated Other Comprehensive Income.” We hedge up to 100% of anticipated foreign currency denominated sales transactions for up to 40 months. We recorded net losses of $1.0 million and net gains of $105,000 and net losses of $5.8 million for cash flow hedges for the two years ended December 31, 2006, 2005 and 2004, respectively, which was included in “Net Sales.” As of December 31, 2006, $427,000 of deferred losses on cash flow hedges recorded in “Accumulated Other Comprehensive Income” are expected to be reclassified to earnings during the next twelve months. The actual foreign sales expected to occur over the next twelve months will necessitate the reclassifying to earnings of these derivative gains.
Hedge effectiveness of a foreign currency option contract designated as a cash flow hedge is measured by comparing the hedging instrument’s cumulative change in fair value from inception to maturity to the forecasted transaction’s terminal value. No amounts were excluded from the assessment of hedge effectiveness nor were there any amounts of ineffectiveness recorded in the consolidated statements of income for the years ended December 31, 2006 and 2005.
Note 12: Segment information
In accordance with SFAS 131,Disclosures about Segments of an Enterprise and Related Information, we determine operating segments using the management approach. The management approach designates the internal organization that is used by management for making operating decisions and assessing performance as the source of our operating segments. It also requires disclosures about products and services, geographic areas and major customers.
While we sell our products to many different markets, management has chosen to organize the Company by geographic areas, and as a result has determined that we have one operating segment. Substantially all of the interest income, depreciation and amortization is recorded in the Americas. Net sales, operating income and identifiable assets, classified by the major geographic areas in which we operate,2009 are as follows (in thousands)thousands, except per share data):
Years Ended December 31,
2006
2005
2004
Net sales: Americas: Unaffiliated customer sales $ 317,780 $ 275,524 $ 243,651 Geographic transfers 125,096 87,072 84,520
442,876 362,596 328,171
Europe: Unaffiliated customer sales 193,364 171,499 164,895 Geographic transfers 159,369 125,650 99,958
352,733 297,149 264,853
Asia Pacific: Unaffiliated customer sales 149,263 124,818 105,542
Eliminations (284,465 ) (212,722 ) (184,478 )
$ 660,407 $ 571,841 $ 514,088
Years Ended December 31,
2006
2005
2004
Operating income: Americas $ 67,644 $ 63,267 $ 53,472 Europe 78,402 61,790 55,705 Asia Pacific 54,771 40,996 38,211 Unallocated: Research and development expenses (113,095 ) (87,841 ) (84,692 )
$ 87,722 $ 78,212 $ 62,696
December 31,
2006
2005
Identifiable assets: Americas $ 476,027 $ 436,170 Europe 188,388 129,420 Asia Pacific 56,805 42,746
$ 721,220 $ 608,336
Total sales outside
Three Months Ended Mar. 31,2009 Jun. 30,2009 Sep. 30,2009 Dec. 31,2009 Net sales $ 157,799 $ 152,163 $ 165,035 $ 201,597 Gross profit 116,916 111,677 123,136 154,981 Operating income (2,479 ) 2,341 10,688 35,981 Net income 358 4,430 9,931 2,366 Basic earnings per share $ 0.00 $ 0.06 $ 0.13 $ 0.03 Weighted average shares outstanding-basic 77,277 77,556 77,653 77,589 Diluted earnings per share $ 0.00 $ 0.06 $ 0.13 $ 0.03 Weighted average shares outstanding-diluted 77,436 77,824 78,103 78,325 Dividends declared per share $ 0.12 $ 0.12 $ 0.12 $ 0.12
Three Months Ended Mar. 31,2008 Jun. 30,2008 Sep. 30,2008 Dec. 31,2008 Net sales $ 192,918 $ 210,474 $ 215,038 $ 202,107 Gross profit 143,849 157,034 160,531 152,014 Operating income 18,065 27,834 27,946 21,872 Net income 17,616 24,734 23,159 19,318 Basic earnings per share $ 0.22 $ 0.32 $ 0.29 $ 0.25 Weighted average shares outstanding-basic 78,840 78,484 78,834 78,110 Diluted earnings per share $ 0.22 $ 0.31 $ 0.29 $ 0.25 Weighted average shares outstanding-diluted 79,825 79,549 79,841 78,522 Dividends declared per share $ 0.11 $ 0.11 $ 0.11 $ 0.11
Note 17 – Subsequent events
In accordance with FASB ASC 855, Subsequent Events (FASB ASC 855), we have evaluated subsequent events through February 17, 2010, the United States for 2006, 2005 and 2004date the financial statements were $373.7 million, $323.9 million and $293.3 million, respectively.issued.
On January 22, 2010, our Board of Directors declared a quarterly cash dividend of $0.13 per common share, payable March 1, 2010, to shareholders of record on February 8, 2010.
From January 29, 2010 to February 12, 2010, we have repurchased 683,832 shares of our common stock at an average price of $29.97 under our share repurchase plan. The maximum number of shares that may yet be purchased under our plan is 1,004,495. Our purchase plan does not have an expiration date.
Note 13: Commitments, contingencies and leases
We have commitments under non-cancelable operating leases primarily for office facilities. Certain leases require us to pay property taxes, insurance and routine maintenance, and include escalation clauses. Future minimum lease payments as of December 31, 2006, for each of the next five years are as follows (in thousands):
2007 $ 7,241 2008 5,682 2009 4,883 2010 3,103 2011 1,983 Thereafter 799
$ 23,691
Rent expense under operating leases was approximately $8.7 million, $7.8 million and $6.5 million for the years ended December 31, 2006, 2005 and 2004, respectively.
As of December 31, 2006, we have non-cancelable purchase commitments with various suppliers of customized inventory and inventory components totaling approximately $7.0 million over the next twelve months.
As of December 31, 2006, we have outstanding guarantees for payment of customs and foreign grants totaling approximately $3.5 million.
Note 14: ��Litigation
We filed a patent infringement action on January 25, 2001 in the U.S. District Court, Eastern District of Texas (Marshall Division) claiming that The MathWorks, Inc. (“MathWorks”) infringed certain of our U.S. patents. On January 30, 2003, a jury found infringement by MathWorks of three of the patents involved and awarded us specified damages. On June 23, 2003, the District Court entered final judgment in favor of us and entered an injunction against MathWorks’ sale of its Simulink and related products and stayed the injunction pending appeal. Upon appeal, the judgment and the injunction were affirmed by the U.S. Court of Appeals for the Federal Circuit (September 3, 2004). Subsequently the stay of injunction was lifted by the District Court. In November 2004, the final judgment amount of $7.4 million which had been held in escrow pending appeal was released to us.
An action was filed by MathWorks against us on September 22, 2004, in the U.S. District Court, Eastern District of Texas (Marshall Division), claiming that on that day MathWorks had released modified versions of its Simulink and related products, and seeking a declaratory judgment that the modified products do not infringe the three patents adjudged infringed in the District Court’s decision of June 23, 2003, (and affirmed by the Court of Appeals on September 3, 2004). On November 2, 2004, MathWorks served the complaint on us. We filed an answer to MathWorks’ declaratory judgment complaint, denying MathWorks’ claims of non-infringement and alleging our own affirmative defenses. On January 5, 2005, the Court denied a contempt motion by us to enjoin the modified Simulink products under the injunction in effect from the first case. On January 7, 2005, we amended our answer to include counterclaims that MathWorks’ modified products are infringing three of our patents, and requested unspecified damages and an injunction. MathWorks filed its reply to our counterclaims on February 7, 2005, denying the counterclaims and alleging affirmative defenses. On March 2, 2005, we filed a notice of appeal regarding the Court’s denial of the contempt motion. On March 15, 2005, the Court stayed MathWorks’ declaratory judgment action, pending a decision on the appeal by the Court of Appeals for the Federal Circuit. On February 9, 2006, the Court of Appeals for the Federal Circuit affirmed the District Court’s January 2005 order. On November 22, 2006, the District Court lifted the stay. The case schedule has yet to be set in this action. During the fourth quarter of 2004, we accrued $4 million related to our probable loss from this contingency, which consists entirely of anticipated patent defense costs that are probable of being incurred. In the fourth quarter of 2006, we accrued an additional $600,000 related to this contingency. We charged approximately $57,000 against this accrual during the fourth quarter of 2006. We have charged a total of $602,000 against this accrual through December 31, 2006.
Note 15: Acquisitions
On January 31, 2005, we acquired all of the common stock of Toronto, Canada-based Electronics Workbench, a supplier of electronics design automation software. The acquisition was accounted for as a purchase. The purchase price of the acquisition, subject to adjustment as provided for in the purchase agreement, was $12.1 million in cash. We funded the purchase price from existing cash balances. Our consolidated financial statements include the operating results from the date of acquisition. Pro-forma results of operations have not been presented because the effects of those operations were not material. In accordance with SFAS 141, Business Combinations, the total purchase consideration has been allocated to the assets acquired and liabilities assumed, including identifiable intangible assets, based on their respective estimated fair values at the date of acquisition.
On April 29, 2005, we acquired the operating assets of Measurement Computing Corporation (MCC), a provider of low-cost data acquisition products. The acquisition was accounted for as a purchase. We acquired the operating assets of MCC, which included the legal positions of MCC and SoftWIRE in litigation against us. As a result of the asset acquisition, a pending legal action was dismissed with prejudice and we eliminated our remaining $1.9 million accrual for patent defense costs related to MCC. The gain that resulted from the elimination of the accrual was recorded in general and administrative expenses. The purchase price of the acquisition, subject to adjustment as provided for in the purchase agreement, was $33.2 million in cash. We funded the purchase price from existing cash balances. Our consolidated financial statements include the operating results from the date of acquisition. Pro-forma results of operations have not been presented because the effects of those operations were not material. In accordance with SFAS 141, the total purchase consideration has been allocated to the assets acquired and liabilities assumed, including identifiable assets, based on their respective estimated fair values at the date of acquisition.
On October 17, 2005, we acquired the operating assets of IOtech, Inc., a provider of PC-based data acquisition and instrumentation products. The acquisition was accounted for as a purchase. The purchase price of the acquisition, subject to adjustment as provided for in the purchase agreement, was $17.6 million in cash. We funded the purchase price from existing cash balances. Our consolidated financial statements include the operating results from the date of acquisition. Pro-forma results of operations have not been presented because the effects of those operations were not material. In accordance with SFAS 141, the total purchase consideration has been allocated to the assets acquired and liabilities assumed, including identifiable assets, based on their respective estimated fair values at the date of acquisition.
Goodwill is deductible for tax purposes. Goodwill is not amortized but is reviewed periodically for impairment. Acquired core technology and intangible assets are amortized over their useful lives, which range from three to eight years. Amortization expense for intangible assets acquired was approximately $3.2 million and $2.0 million for 2006 and 2005, respectively, of which approximately $2.7 million and $1.5 million was recorded in cost of sales and approximately $490,000 and $490,000 was recorded in operating expenses. The estimated amortization expense of intangible assets acquired for the current fiscal year and in future years will be recorded in the consolidated statements of income as follows (in thousands):
Fiscal Year
Cost of Sales
Acquisition related costs and amortization, net
Total
2007 $ 2,689 $ 450 $ 3,139 2008 2,532 412 2,944 2009 2,259 338 2,597 2010 1,725 177 1,902 Thereafter 1,166 271 1,437
Total $ 10,371 $ 1,648 $ 12,019
Note 16: Related party transactions
During 2002, we contributed approximately $3.6 million to the National Instruments Foundation, a 501(c)(3) charitable foundation established in 2002 for the purpose of continued promotion of scientific and engineering research and education at higher education institutions worldwide. This contribution was recorded as general and administrative expense in 2002. Two of the four directors of the National Instruments Foundation are current officers of National Instruments.
Note 17: Quarterly results (unaudited)
The following quarterly results have been derived from unaudited consolidated financial statements that, in the opinion of management, reflect all adjustments (consisting only of normal recurring adjustments) necessary for a fair presentation of such quarterly information. The operating results for any quarter are not necessarily indicative of the results to be expected for any future period. The unaudited quarterly financial data for each of the eight quarters in the two years ended December 31, 2006 are as follows (in thousands, except per share data):
Three Months Ended
Mar. 31, 2006
Jun. 30, 2006
Sep. 30, 2006
Dec. 31, 2006
Net sales $ 154,752 $ 160,123 $ 164,079 $ 181,453 Gross profit 113,247 119,271 121,648 135,915 Operating income 15,826 20,911 22,367 28,616 Net income 12,602 17,021 18,651 24,434 Basic earnings per share $ 0.16 $ 0.21 $ 0.23 $ 0.31 Weighted average shares outstanding-basic 79,053 79,611 79,637 79,767 Diluted earnings per share $ 0.15 $ 0.21 $ 0.23 $ 0.30 Weighted average shares outstanding-diluted 81,608 81,653 81,274 81,524 Dividends declared per share $ 0.06 $ 0.06 $ 0.06 $ 0.06
Three Months Ended
Mar. 31, 2005
Jun. 30, 2005
Sep. 30, 2005
Dec. 31, 2005
Net sales $ 129,740 $ 140,822 $ 141,618 $ 159,661 Gross profit 97,376 104,109 103,725 117,322 Operating income 14,182 19,093 18,343 26,594 Net income 11,136 15,024 14,399 20,958 Basic earnings per share $ 0.14 $ 0.19 $ 0.18 $ 0.27 Weighted average shares outstanding-basic 79,175 78,303 78,158 78,505 Diluted earnings per share $ 0.14 $ 0.19 $ 0.18 $ 0.26 Weighted average shares outstanding-diluted 81,924 80,190 80,575 80,821 Dividends declared per share $ 0.05 $ 0.05 $ 0.05 $ 0.05
Note 18: Subsequent Event
On January 30, 2007, our Board of Directors declared a quarterly cash dividend of $0.07 per common share, payable March 5, 2007, to shareholders of record on February 12, 2007.
On January 30, 2007, our Board of Directors granted authorization for the repurchase of an additional 1,522,106 shares of our common stock under our share repurchase plan.
SCHEDULE II
NATIONAL INSTRUMENTS CORPORATION
VALUATION AND QUALIFYING ACCOUNTS
(In thousands)
Allowance for doubtful accounts and sales returns:
Year
Description
Balance at Beginning of Period
Provision for Bad Debt Expense
Write-Offs Charged to Allowances
Balance at End of Period
2004 Allowance for doubtful accounts and sales returns $ 3,244 $ 596 $ 329 $ 3,511 2005 Allowance for doubtful accounts and sales returns 3,511 1,462 239 4,734 2006 Allowance for doubtful accounts and sales returns 4,734 33 407 4,360
ITEM 15. EXHIBITS AND FINANCIAL STATEMENT SCHEDULES
(a) Documents FilesFiled with Report
1. Financial Statements.
2. Financial Statement Schedules.
None
3. Exhibits.
ExhibitNumber Description 3.1(2) Certificate of Incorporation, as amended, of the Company. 3.2(11) Amended and Restated Bylaws of the Company. 3.3(4) Certificate of Designation of Rights, Preferences and Privileges of Series A Participating Preferred Stock of the Company. 4.1(1) Specimen of Common Stock certificate of the Company. 4.2(3) Rights Agreement dated as of January 21, 2004, between the Company and EquiServe Trust Company, N.A. 10.1(1) Form of Indemnification Agreement. 10.2(5) 1994 Incentive Plan, as amended.* 10.3(9) 1994 Employee Stock Purchase Plan.* 10.5(7) 2005 Incentive Plan.* 10.6(8) National Instruments Corporation Annual Incentive Program.* 10.7(6) National Instruments Corporation Annual Incentive Program, as amended.* 10.8(10) Form of Restricted Stock Unit Award Agreement (Non-Employee Director).* 10.9(10) Form of Restricted Stock Unit Award Agreement (Performance Vesting).* 10.10(10) Form of Restricted Stock Unit Award Agreement (Current Employee).* 10.11(10) Form of Restricted Stock Unit Award Agreement (Newly Hired Employee).* 21.1 Subsidiaries of the Company. 23.1 Consent of Independent Registered Public Accounting Firm F-4Firm.Consolidated Balance SheetsF-5Consolidated Statements of IncomeF-6Consolidated Statements of Cash FlowsF-7Consolidated Statements of Stockholders' EquityF-8Notes to Consolidated Financial StatementsF-9
2.
Financial Statements Schedules.
See Schedule II - Valuation and Qualifying Accounts at page S-1
3.
Exhibits.
Exhibit
NumberDescription
3.1
(2)
Certificate of Incorporation, as amended, of the Company.
3.2
(2)
Amended and Restated Bylaws of the Company.
3.3
(4)
Certificate of Designation of Rights, Preferences and Privileges of Series A Participating Preferred Stock of the Company.
4.1
(1)
Specimen of Common Stock certificate of the Company.
4.2
(3)
Rights Agreement dated as of January 21, 2004, between the Company and EquiServe Trust Company, N.A.
10.1
(1)
Form of Indemnification Agreement.
10.2
(5)
1994 Incentive Plan, as amended.*
10.3
1994 Employee Stock Purchase Plan.*
10.4
(6)
Long-Term Incentive Program.*
10.5
(7)
2005 Incentive Plan.*
10.6
(8)
National Instruments Corporation Annual Incentive Program.*
10.7
(9)
2006 Annual Incentive Program Goals and Awards for the Named Executive Officers.*
10.8
(10)
Form of Restricted Stock Unit Award Agreement (Non-Employee Director).*
10.9
(10)
Form of Restricted Stock Unit Award Agreement (Performance Vesting).*
10.10
(10)
Form of Restricted Stock Unit Award Agreement (Current Employee).*
10.11
(10)
Form of Restricted Stock Unit Award Agreement (Newly Hired Employee).*
21.1
Subsidiaries of the Company.
23.1
Consent of Independent Registered Public Accounting Firm.
23.2
Consent of Independent Registered Public Accounting Firm.
24.0
Power of Attorney (included on page 33).
31.1
Certification of Chief Executive Officer Pursuant to 18 U.S.C. Section 1350, as Adopted Pursuant to Section 302 of the Sarbanes-Oxley Act of 2002.
31.2
Certification of Chief Financial Officer Pursuant to 18 U.S.C. Section 1350, as Adopted Pursuant to Section 302 of the Sarbanes-Oxley Act of 2002.
32.1
Certification of Chief Executive Officer and Chief Financial Officer Pursuant to 18 U.S.C. Section 1350, as Adopted Pursuant to Section 906 of the Sarbanes-Oxley Act of 2002.
24.0 Power of Attorney (included on page 41). 31.1 Certification of Chief Executive Officer Pursuant to 18 U.S.C. Section 1350, as Adopted Pursuant to Section 302 of the Sarbanes-Oxley Act of 2002. 31.2 Certification of Chief Financial Officer Pursuant to 18 U.S.C. Section 1350, as Adopted Pursuant to Section 302 of the Sarbanes-Oxley Act of 2002. 32.1 Certification of Chief Executive Officer and Chief Financial Officer Pursuant to 18 U.S.C. Section 1350, as Adopted Pursuant to Section 906 of the Sarbanes-Oxley Act of 2002.
(1) Incorporated by reference to the Company's Registration Statement on Form S-1 (Reg. No. 33-88386) declared effective March 13, 1995.
(2) Incorporated by reference to the same-numbered exhibit filed with the Company's Annual Report on Form 10-K for the fiscal year ended December 31, 2003.
(3) Incorporated by reference to exhibit 4.1 filed with the Company's currentCurrent Report on Form 8-K filed on January 28, 2004.
(4) Incorporated by reference to the same-numbered exhibit filed with the Company's Form 8-K on April 27, 2004.
(5) Incorporated by reference to the same-numbered exhibit filed with the Company's Form 10-Q on August 5, 2004.
(6) Incorporated by reference to exhibit 99.2 filed with the Company's Current Report on Form 8-K filed on October 28, 2008. (7) Incorporated by reference to exhibit A of the Company's Proxy Statement dated and filed on April 4, 2005. (8) Incorporated by reference to exhibit 99.2 filed with the Company's Current Report on Form 8-K filed on October 22, 2008. (9) Incorporated by reference to exhibit 10.3 filed with the Company's Annual Report on Form 10-K for the fiscal year ended December 31, 2006. (10) Incorporated by reference to the same-numbered exhibit filed with the Company's Form 10-Q on August 2, 2006. (11) Incorporated by reference to the same-numbered exhibit filed with the Company's Annual Report on Form 10-K for the fiscal year ended December 31, 2004.2007.
(7)Incorporated by reference to exhibit A of the Company's Proxy Statement dated and filed on April 4, 2005.
(8)Incorporated by reference to the exhibit 10.1 filed with the Company's Current Report on Form 8-K filed June 27, 2006.
(9)Incorporated by reference to the exhibit 10.2 filed with the Company's Current Report on Form 8-K filed June 27, 2006.
(10)Incorporated by reference to the same-numbered exhibit filed with the Company's Form 10-Q filed on August 2, 2006.
* Management Contract or Compensatory Plan or Arrangement.
(b) Exhibits
See Item 15(a)(3) above.
(c) Financial Statement Schedules
See Item 15(a)(2) above.
| (a) | Documents |
Exhibit Number | Description | ||
| 3.1(2) | Certificate of Incorporation, as amended, of the Company. | ||
| 3.2(11) | Amended and Restated Bylaws of the Company. | ||
| 3.3(4) | Certificate of Designation of Rights, Preferences and Privileges of Series A Participating Preferred Stock of the Company. | ||
| 4.1(1) | Specimen of Common Stock certificate of the Company. | ||
| 4.2(3) | Rights Agreement dated as of January 21, 2004, between the Company and EquiServe Trust Company, N.A. | ||
| 10.1(1) | Form of Indemnification Agreement. | ||
| 10.2(5) | 1994 Incentive Plan, as amended.* | ||
| 10.3(9) | 1994 Employee Stock Purchase Plan.* | ||
| 10.5(7) | 2005 Incentive Plan.* | ||
| 10.6(8) | National Instruments Corporation Annual Incentive Program.* | ||
| 10.7(6) | National Instruments Corporation Annual Incentive Program, as amended.* | ||
| 10.8(10) | Form of Restricted Stock Unit Award Agreement (Non-Employee Director).* | ||
| 10.9(10) | Form of Restricted Stock Unit Award Agreement (Performance Vesting).* | ||
| 10.10(10) | Form of Restricted Stock Unit Award Agreement (Current Employee).* | ||
| 10.11(10) | Form of Restricted Stock Unit Award Agreement (Newly Hired Employee).* | ||
| 21.1 | Subsidiaries of the Company. | ||
| 23.1 | Consent of Independent Registered Public Accounting | ||
Exhibit Number | Description | |
|---|---|---|
3.1 | (2) | Certificate of Incorporation, as amended, of the Company. |
3.2 | (2) | Amended and Restated Bylaws of the Company. |
3.3 | (4) | Certificate of Designation of Rights, Preferences and Privileges of Series A Participating Preferred Stock of the Company. |
4.1 | (1) | Specimen of Common Stock certificate of the Company. |
4.2 | (3) | Rights Agreement dated as of January 21, 2004, between the Company and EquiServe Trust Company, N.A. |
10.1 | (1) | Form of Indemnification Agreement. |
10.2 | (5) | 1994 Incentive Plan, as amended.* |
10.3 | 1994 Employee Stock Purchase Plan.* | |
10.4 | (6) | Long-Term Incentive Program.* |
10.5 | (7) | 2005 Incentive Plan.* |
10.6 | (8) | National Instruments Corporation Annual Incentive Program.* |
10.7 | (9) | 2006 Annual Incentive Program Goals and Awards for the Named Executive Officers.* |
10.8 | (10) | Form of Restricted Stock Unit Award Agreement (Non-Employee Director).* |
10.9 | (10) | Form of Restricted Stock Unit Award Agreement (Performance Vesting).* |
10.10 | (10) | Form of Restricted Stock Unit Award Agreement (Current Employee).* |
10.11 | (10) | Form of Restricted Stock Unit Award Agreement (Newly Hired Employee).* |
21.1 | Subsidiaries of the Company. | |
23.1 | Consent of Independent Registered Public Accounting Firm. | |
23.2 | Consent of Independent Registered Public Accounting Firm. | |
24.0 | Power of Attorney (included on page 33). | |
31.1 | Certification of Chief Executive Officer Pursuant to 18 U.S.C. Section 1350, as Adopted Pursuant to Section 302 of the Sarbanes-Oxley Act of 2002. | |
31.2 | Certification of Chief Financial Officer Pursuant to 18 U.S.C. Section 1350, as Adopted Pursuant to Section 302 of the Sarbanes-Oxley Act of 2002. | |
32.1 | Certification of Chief Executive Officer and Chief Financial Officer Pursuant to 18 U.S.C. Section 1350, as Adopted Pursuant to Section 906 of the Sarbanes-Oxley Act of 2002. | |
| 24.0 | Power of Attorney (included on page 41). | |
| 31.1 | Certification of Chief Executive Officer Pursuant to 18 U.S.C. Section 1350, as Adopted Pursuant to Section 302 of the Sarbanes-Oxley Act of 2002. | |
| 31.2 | Certification of Chief Financial Officer Pursuant to 18 U.S.C. Section 1350, as Adopted Pursuant to Section 302 of the Sarbanes-Oxley Act of 2002. | |
| 32.1 | Certification of Chief Executive Officer and Chief Financial Officer Pursuant to 18 U.S.C. Section 1350, as Adopted Pursuant to Section 906 of the Sarbanes-Oxley Act of 2002. | |
| (1) | Incorporated by reference to the Company's Registration Statement on Form S-1 (Reg. |
| (2) | Incorporated by reference to the same-numbered exhibit filed with the Company's Annual Report on Form 10-K for the fiscal year ended December 31, 2003. |
| (3) | Incorporated by reference to exhibit 4.1 filed with the Company's |
| (4) | Incorporated by reference to the same-numbered exhibit filed with the Company's Form 8-K on April 27, 2004. |
| (5) | Incorporated by reference to the same-numbered exhibit filed with the Company's Form 10-Q on August 5, 2004. |
| (6) | Incorporated by reference to exhibit 99.2 filed with the Company's Current Report on Form 8-K filed on October 28, 2008. |
| (7) | Incorporated by reference to exhibit A of the Company's Proxy Statement dated and filed on April 4, 2005. |
| (8) | Incorporated by reference to exhibit 99.2 filed with the Company's Current Report on Form 8-K filed on October 22, 2008. |
| (9) | Incorporated by reference to exhibit 10.3 filed with the Company's Annual Report on Form 10-K for the fiscal year ended December 31, 2006. |
| (10) | Incorporated by reference to the same-numbered exhibit filed with the Company's Form 10-Q on August 2, 2006. |
| (11) | Incorporated by reference to the same-numbered exhibit filed with the Company's Annual Report on Form 10-K for the fiscal year ended December 31, |
| * | Management Contract or Compensatory Plan or Arrangement. |
| (b) | Exhibits |
| (c) | Financial Statement Schedules |
| Registrant | ||||||
| NATIONAL INSTRUMENTS CORPORATION | ||||||
| February | /s/ Dr. James J. Truchard | |||||
| Dr. James J. Truchard | ||||||
| Chairman of the Board and President | ||||||
| Signature | Capacity in Which Signed | Date | |||||
/s/ Dr. James J. Truchard | Chairman of the Board and President (Principal Executive Officer) | February 17, 2010 | |||||
| Dr. James J. Truchard | |||||||
/s/ Alex M. Davern | Chief Financial Officer and Treasurer (Principal Financial and Accounting Officer) | February 17, 2010 | |||||
| Alex M. Davern | |||||||
| /s/ Jeffrey L. Kodosky | Director | February 17, 2010 | |||||
| Jeffrey L. Kodosky | |||||||
| /s/ Dr. Donald M. Carlton | Director | February 17, 2010 | |||||
| Dr. Donald M. Carlton | |||||||
/s/ Charles J. Roesslein | Director | February 17, 2010 | |||||
| Charles J. Roesslein | |||||||
| /s/ Duy-Loan T. Le | Director | February 17, 2010 | |||||
| Duy-Loan T. Le | |||||||
| /s/ John Medica | Director | February | |||||
| John Medica |
| Page No. | ||
| Financial Statements: | ||
| Report of Independent Registered Public Accounting Firm | ||
| Report of Independent Registered Public Accounting Firm | ||
| Consolidated Balance Sheets as of December 31, | ||
| Consolidated Statements of Income for each of the Three Years in the period Ended December 31, | ||
| Consolidated Statements of Cash Flows for each of the Three Years in the period Ended December 31, | ||
| Consolidated Statements of Stockholders' Equity for each of the Three Years in the period Ended December 31, | ||
| Notes to Consolidated Financial Statements |
As discussed in Note 1 to the consolidated financial statements, effective January 1, 2006, the Company changed its method of accounting for stock-based compensation to conform to Statement of Financial Accounting Standards No. 123(R), Share-Based Payment.
Report of Independent Registered Public Accounting Firm
To the Board of Directors and Stockholders of National Instruments Corporation:
In our opinion, the consolidated statements of income, of stockholders’ equity and of cash flows (appearing on pages F-6 through F-8 of this National Instruments Corporation 2006 Annual Report on Form 10-K) for the year ended December 31, 2004 present fairly, in all material respects, the results of operations and cash flows of National Instruments Corporation and its subsidiaries for the year ended December 31, 2004, in conformity with accounting principles generally accepted in the United States of America. In addition, in our opinion, the financial statement schedule for the year ended December 31, 2004 presents fairly, in all material respects, the information set forth therein when read in conjunction with the related consolidated financial statements. These financial statements and financial statement schedule are the responsibility of the Company’s management. Our responsibility is to express an opinion on these financial statements and financial statement schedule based on our audit. We conducted our audit of these statements in accordance with the standards of the Public Company Accounting Oversight Board (United States). Those standards require that we plan and perform the audit to obtain reasonable assurance about whether the financial statements are free of material misstatement. An audit includes examining, on a test basis, evidence supporting the amounts and disclosures in the financial statements, assessing the accounting principles used and significant estimates made by management, and evaluating the overall financial statement presentation. We believe that our audit provides a reasonable basis for our opinion.
| December 31, | ||||||||
|---|---|---|---|---|---|---|---|---|
| 2006 | 2005 | |||||||
| Assets | ||||||||
Current assets: | ||||||||
| Cash and cash equivalents | $ | 100,287 | $ | 55,864 | ||||
| Short-term investments | 150,190 | 119,846 | ||||||
| Accounts receivable, net | 117,235 | 95,733 | ||||||
| Inventories, net | 77,138 | 62,827 | ||||||
| Prepaid expenses and other current assets | 11,393 | 13,146 | ||||||
| Deferred income taxes, net | 20,851 | 14,890 | ||||||
| Total current assets | 477,094 | 362,306 | ||||||
| Property and equipment, net | 145,425 | 144,330 | ||||||
| Goodwill, net | 53,343 | 52,533 | ||||||
| Intangible assets, net | 40,065 | 43,602 | ||||||
| Other long-term assets | 5,293 | 5,565 | ||||||
| Total assets | $ | 721,220 | $ | 608,336 | ||||
Liabilities and Stockholders' Equity | ||||||||
Current liabilities: | ||||||||
| Accounts payable | $ | 32,001 | $ | 30,832 | ||||
| Accrued compensation | 20,912 | 18,084 | ||||||
| Deferred revenue | 22,208 | 16,018 | ||||||
| Accrued expenses and other liabilities | 15,934 | 8,838 | ||||||
| Other taxes payable | 11,527 | 13,848 | ||||||
| Total current liabilities | 102,582 | 87,620 | ||||||
| Deferred income taxes | 21,956 | 16,866 | ||||||
| Total liabilities | 124,538 | 104,486 | ||||||
| Commitments and contingencies | ||||||||
| Stockholders' equity: | ||||||||
| Preferred stock: par value $0.01; 5,000,000 shares authorized; none issued and outstanding | — | — | ||||||
| Common stock: par value $0.01; 180,000,000 shares authorized; | ||||||||
| 79,883,837 and 79,276,086 shares issued and outstanding, respectively | 799 | 793 | ||||||
| Additional paid-in capital | 109,851 | 91,430 | ||||||
| Deferred stock-based compensation | — | (16,547 | ) | |||||
| Retained earnings | 483,533 | 429,859 | ||||||
| Accumulated other comprehensive income (loss) | 2,499 | (1,685 | ) | |||||
| Total stockholders' equity | 596,682 | 503,850 | ||||||
| Total liabilities and stockholders' equity | $ | 721,220 | $ | 608,336 | ||||
| December 31, | ||||||||
| 2009 | 2008 | |||||||
| Assets | ||||||||
| Current assets: | ||||||||
| Cash and cash equivalents | $ | 201,465 | $ | 229,400 | ||||
| Short-term investments | 87,196 | 6,220 | ||||||
| Accounts receivable, net | 103,957 | 121,548 | ||||||
| Inventories, net | 86,515 | 107,358 | ||||||
| Prepaid expenses and other current assets | 36,523 | 43,062 | ||||||
| Deferred income taxes, net | 16,522 | 21,435 | ||||||
| Total current assets | 532,178 | 529,023 | ||||||
| Long-term investments | — | 10,500 | ||||||
| Property and equipment, net | 153,265 | 154,477 | ||||||
| Goodwill, net | 64,779 | 64,561 | ||||||
| Intangible assets, net | 43,390 | 41,915 | ||||||
| Other long-term assets | 19,417 | 32,115 | ||||||
| Total assets | $ | 813,029 | $ | 832,591 | ||||
| Liabilities and Stockholders’ Equity | ||||||||
| Current liabilities: | ||||||||
| Accounts payable | $ | 23,502 | $ | 30,876 | ||||
| Accrued compensation | 14,934 | 22,012 | ||||||
| Deferred revenue | 57,242 | 45,514 | ||||||
| Accrued expenses and other liabilities | 8,560 | 18,848 | ||||||
| Other taxes payable | 14,181 | 13,481 | ||||||
| Total current liabilities | 118,419 | 130,731 | ||||||
| Deferred income taxes | 25,012 | 25,157 | ||||||
| Liability for uncertain tax positions | 11,062 | 9,364 | ||||||
| Other long-term liabilities | 4,116 | 2,901 | ||||||
| Total liabilities | 158,609 | 168,153 | ||||||
| Commitments and contingencies | ||||||||
| Stockholders’ equity: | ||||||||
| Preferred stock: par value $0.01; 5,000,000 shares authorized; none issued and outstanding | — | — | ||||||
Common stock: par value $0.01; 180,000,000 shares authorized; 77,367,874 and 77,193,063 shares issued and outstanding, respectively | 774 | 772 | ||||||
| Additional paid-in capital | 336,446 | 300,352 | ||||||
| Retained earnings | 303,655 | 352,831 | ||||||
| Accumulated other comprehensive income | 13,545 | 10,483 | ||||||
| Total stockholders’ equity | 654,420 | 664,438 | ||||||
| Total liabilities and stockholders’ equity | $ | 813,029 | $ | 832,591 | ||||
| For the Years | |||||||||||
|---|---|---|---|---|---|---|---|---|---|---|---|
| Ended December 31, | |||||||||||
| 2006 | 2005 | 2004 | |||||||||
| Net sales | $ | 660,407 | $ | 571,841 | $ | 514,088 | |||||
| Cost of sales (1) | 170,326 | 149,309 | 135,473 | ||||||||
| Gross profit | 490,081 | 422,532 | 378,615 | ||||||||
| Operating expenses: | |||||||||||
| Sales and marketing (2) | 235,072 | 211,280 | 188,727 | ||||||||
| Research and development (3) | 113,095 | 87,841 | 84,692 | ||||||||
| General and administrative (4) | 54,192 | 45,199 | 42,500 | ||||||||
| Total operating expenses | 402,359 | 344,320 | 315,919 | ||||||||
| Operating income | 87,722 | 78,212 | 62,696 | ||||||||
Other income (expense): | |||||||||||
| Interest income | 6,847 | 3,758 | 2,905 | ||||||||
| Net foreign exchange gain (loss) | 740 | (1,566 | ) | 1,287 | |||||||
| Other income (expense), net | (7 | ) | 276 | (2,075 | ) | ||||||
| Income before income taxes | 95,302 | 80,680 | 64,813 | ||||||||
| Provision for income taxes (5) | 22,594 | 19,163 | 16,203 | ||||||||
| Net income | $ | 72,708 | $ | 61,517 | $ | 48,610 | |||||
| Basic earnings per share | $ | 0.91 | $ | 0.78 | $ | 0.62 | |||||
| Weighted average shares outstanding - basic | 79,519 | 78,552 | 78,680 | ||||||||
| Diluted earnings per share | $ | 0.89 | $ | 0.76 | $ | 0.59 | |||||
| Weighted average shares outstanding - diluted | 81,519 | 80,910 | 82,096 | ||||||||
| Dividends declared per share | $ | 0.24 | $ | 0.20 | $ | 0.18 | |||||
The following footnotes apply to the years ended December 31, 2006, 2005 and 2004:
For the Years Ended December 31, | ||||||||||||
| 2009 | 2008 | 2007 | ||||||||||
| Net sales: | ||||||||||||
| Product | $ | 623,736 | $ | 765,441 | $ | 701,589 | ||||||
| Software maintenance | 52,858 | 55,096 | 38,789 | |||||||||
| Total net sales | 676,594 | 820,537 | 740,378 | |||||||||
| Cost of sales: | ||||||||||||
| Product | 164,700 | 201,064 | 180,556 | |||||||||
| Software maintenance | 5,184 | 6,045 | 4,711 | |||||||||
| Total cost of sales | 169,884 | 207,109 | 185,267 | |||||||||
| Gross profit | 506,710 | 613,428 | 555,111 | |||||||||
| Operating expenses: | ||||||||||||
| Sales and marketing | 269,267 | 307,409 | 264,060 | |||||||||
| Research and development | 132,974 | 143,140 | 126,515 | |||||||||
| General and administrative | 57,938 | 67,162 | 62,445 | |||||||||
| Total operating expenses | 460,179 | 517,711 | 453,020 | |||||||||
| Operating income | 46,531 | 95,717 | 102,091 | |||||||||
| Other income (expense): | ||||||||||||
| Interest income | 1,629 | 5,996 | 9,822 | |||||||||
| Net foreign exchange gain (loss) | 734 | (3,737 | ) | 1,672 | ||||||||
| Other income (expense), net | 1,351 | 161 | (158 | ) | ||||||||
| Income before income taxes | 50,245 | 98,137 | 113,427 | |||||||||
| Provision for income taxes | 33,160 | 13,310 | 6,394 | |||||||||
| Net income | $ | 17,085 | $ | 84,827 | $ | 107,033 | ||||||
| Basic earnings per share | $ | 0.22 | $ | 1.08 | $ | 1.35 | ||||||
| Weighted average shares outstanding - basic | 77,520 | 78,567 | 79,468 | |||||||||
| Diluted earnings per share | $ | 0.22 | $ | 1.07 | $ | 1.32 | ||||||
| Weighted average shares outstanding – diluted �� | 78,026 | 79,515 | 81,043 | |||||||||
| Dividends declared per share | $ | 0.48 | $ | 0.44 | $ | 0.34 | ||||||
| For the Years Ended December 31, | |||||||||||
|---|---|---|---|---|---|---|---|---|---|---|---|
| 2006 | 2005 | 2004 | |||||||||
| Cash flow from operating activities: | |||||||||||
| Net income | $ | 72,708 | $ | 61,517 | $ | 48,610 | |||||
| Adjustments to reconcile net income to net cash provided by operating activities: | |||||||||||
| Depreciation and amortization | 34,181 | 28,553 | 25,592 | ||||||||
| Stock-based compensation | 14,507 | 1,545 | — | ||||||||
| Impairment of cost method investment | — | — | 2,500 | ||||||||
| Gain on sale of subsidiary | — | — | (242 | ) | |||||||
| Provision for (benefit from) deferred income taxes | (339 | ) | 3,219 | (825 | ) | ||||||
| Tax benefit from stock option plans | (4,271 | ) | 675 | 3,071 | |||||||
| Changes in operating assets and liabilities: | |||||||||||
| Accounts receivable | (21,502 | ) | (4,080 | ) | (9,342 | ) | |||||
| Inventories | (14,311 | ) | (4,572 | ) | (15,230 | ) | |||||
| Prepaid expenses and other assets | 2,116 | (2,177 | ) | 4,624 | |||||||
| Accounts payable | 1,169 | 4,647 | (4,359 | ) | |||||||
| Deferred revenue | 6,190 | 3,847 | 3,385 | ||||||||
| Taxes and other liabilities | 7,443 | (5,124 | ) | 7,848 | |||||||
| Net cash provided by operating activities | 97,891 | 88,050 | 65,632 | ||||||||
| Cash flow from investing activities: | |||||||||||
| Proceeds from sale of subsidiary | — | — | 680 | ||||||||
| Acquisitions, net of cash received | — | (63,891 | ) | — | |||||||
| Capital expenditures | (18,503 | ) | (15,383 | ) | (12,596 | ) | |||||
| Capitalization of internally developed software | (7,370 | ) | (13,380 | ) | (5,007 | ) | |||||
| Additions to other intangibles | (3,115 | ) | (4,288 | ) | (3,050 | ) | |||||
| Purchases of short-term investments | (244,238 | ) | (124,227 | ) | (125,954 | ) | |||||
| Sales and maturities of short-term investments | 213,894 | 154,773 | 116,789 | ||||||||
| Net cash used in investing activities | (59,332 | ) | (66,396 | ) | (29,138 | ) | |||||
| Cash flow from financing activities: | |||||||||||
| Proceeds from issuance of common stock | 37,146 | 23,222 | 16,826 | ||||||||
| Repurchase of common stock | (16,519 | ) | (49,452 | ) | (16,064 | ) | |||||
| Dividends paid | (19,034 | ) | (15,776 | ) | (14,486 | ) | |||||
| Tax benefit from stock option plans | 4,271 | — | — | ||||||||
| Net cash provided by (used in) financing activities | 5,864 | (42,006 | ) | (13,724 | ) | ||||||
| Net change in cash and cash equivalents | 44,423 | (20,352 | ) | 22,770 | |||||||
| Cash and cash equivalents at beginning of period | 55,864 | 76,216 | 53,446 | ||||||||
| Cash and cash equivalents at end of period | $ | 100,287 | $ | 55,864 | $ | 76,216 | |||||
| Cash paid for interest and income taxes | |||||||||||
| Interest | $ | 41 | $ | 17 | $ | 31 | |||||
| Income taxes | $ | 9,827 | $ | 15,117 | $ | 10,622 | |||||
| For the Years Ended December 31, | ||||||||||||
| 2009 | 2008 | 2007 | ||||||||||
| Cash flow from operating activities: | ||||||||||||
| Net income | $ | 17,085 | $ | 84,827 | $ | 107,033 | ||||||
| Adjustments to reconcile net income to net cash provided by operating activities: | ||||||||||||
| Depreciation and amortization | 38,365 | 37,103 | 36,605 | |||||||||
| Stock-based compensation | 20,299 | 19,854 | 17,754 | |||||||||
| Tax expense/(benefit from) deferred income taxes | 17,196 | (4,475 | ) | (16,954 | ) | |||||||
| Tax expense/(benefit from) stock option plans | 1,450 | (1,213 | ) | (2,964 | ) | |||||||
| Changes in operating assets and liabilities: | ||||||||||||
| Accounts receivable | 17,591 | 12,159 | (14,047 | ) | ||||||||
| Inventories | 20,843 | (24,578 | ) | (5,537 | ) | |||||||
| Prepaid expenses and other assets | 12,740 | (10,340 | ) | (12,330 | ) | |||||||
| Accounts payable | (7,374 | ) | (5,648 | ) | 4,186 | |||||||
| Deferred revenue | 11,728 | 9,423 | 13,883 | |||||||||
| Taxes and other liabilities | (14,272 | ) | 4,706 | 19,743 | ||||||||
| Net cash provided by operating activities | 135,651 | 121,818 | 147,372 | |||||||||
| Cash flow from investing activities: | ||||||||||||
| Acquisitions, net of cash received | — | (17,310 | ) | — | ||||||||
| Capital expenditures | (20,847 | ) | (25,771 | ) | (24,864 | ) | ||||||
| Capitalization of internally developed software | (12,583 | ) | (9,487 | ) | (8,263 | ) | ||||||
| Additions to other intangibles | (4,602 | ) | (3,010 | ) | (6,447 | ) | ||||||
| Purchases of short-term investments | (93,087 | ) | (9,061 | ) | (87,586 | ) | ||||||
| Sales and maturities of short-term investments | 19,204 | 86,179 | 143,938 | |||||||||
| Purchases of foreign currency option contracts | — | (2,784 | ) | (2,242 | ) | |||||||
| Net cash provided by (used in) investing activities | (111,915 | ) | 18,756 | 14,536 | ||||||||
| Cash flow from financing activities: | ||||||||||||
| Proceeds from issuance of common stock | 21,672 | 31,150 | 36,460 | |||||||||
| Repurchase of common stock | (34,585 | ) | (103,641 | ) | (79,728 | ) | ||||||
| Dividends paid | (37,308 | ) | (34,735 | ) | (27,052 | ) | ||||||
| Tax (expense)/benefit from stock option plans | (1,450 | ) | 1,213 | 2,964 | ||||||||
| Net cash (used in) financing activities | (51,671 | ) | (106,013 | ) | (67,356 | ) | ||||||
| Net change in cash and cash equivalents | (27,935 | ) | 34,561 | 94,552 | ||||||||
| Cash and cash equivalents at beginning of period | 229,400 | 194,839 | 100,287 | |||||||||
| Cash and cash equivalents at end of period | $ | 201,465 | $ | 229,400 | $ | 194,839 | ||||||
| Cash paid for interest and income taxes: | ||||||||||||
| Interest | $ | 23 | $ | 116 | $ | 159 | ||||||
| Income taxes | $ | 14,608 | $ | 17,214 | $ | 21,147 | ||||||
| Common Stock Shares | Common Stock Amount | Additional Paid-In Capital | Deferred Compensation | Retained Earnings | Accumulated Other Comprehensive Income/(Loss) | Total Stockholders' Equity | |||||||||||||||||
|---|---|---|---|---|---|---|---|---|---|---|---|---|---|---|---|---|---|---|---|---|---|---|---|
| Balance at December 31, 2003 | 78,269,235 | $ | 783 | $ | 95,070 | $ | — | $ | 349,994 | $ | (6,395 | ) | $ | 439,452 | |||||||||
| Net income | 48,610 | 48,610 | |||||||||||||||||||||
| Foreign currency translation adjustment | |||||||||||||||||||||||
| (net of $1,013 tax expense) | 3,050 | 3,050 | |||||||||||||||||||||
| Unrealized loss on securities available | |||||||||||||||||||||||
| for sale (net of $0 tax benefit) | (417 | ) | (417 | ) | |||||||||||||||||||
| Unrealized gain on derivative instruments | |||||||||||||||||||||||
| (net of $2,136 tax expense) | 6,407 | 6,407 | |||||||||||||||||||||
| Total comprehensive income | 57,650 | ||||||||||||||||||||||
| Issuance of common stock under employee | |||||||||||||||||||||||
| plans, including tax benefits | 1,234,195 | 12 | 19,885 | 19,897 | |||||||||||||||||||
| Repurchase and retirement of common | |||||||||||||||||||||||
| stock | (557,850 | ) | (6 | ) | (16,058 | ) | (16,064 | ) | |||||||||||||||
| Dividends declared | (14,486 | ) | (14,486 | ) | |||||||||||||||||||
| Balance at December 31, 2004 | 78,945,580 | $ | 789 | $ | 98,897 | $ | — | $ | 384,118 | $ | 2,645 | $ | 486,449 | ||||||||||
| Net income | 61,517 | 61,517 | |||||||||||||||||||||
| Foreign currency translation | |||||||||||||||||||||||
| adjustment(net of $1,636 tax benefit) | (5,181 | ) | (5,181 | ) | |||||||||||||||||||
| Unrealized gain on securities available | |||||||||||||||||||||||
| for sale (net of $0 tax expense) | 50 | 50 | |||||||||||||||||||||
| Unrealized gain on derivative | |||||||||||||||||||||||
| instruments (net of $253 tax expense) | 801 | 801 | |||||||||||||||||||||
| Total comprehensive income | 57,187 | ||||||||||||||||||||||
| Net activity related to restricted | |||||||||||||||||||||||
| stock units | 813,305 | 8 | 18,084 | (16,547 | ) | 1,545 | |||||||||||||||||
| Issuance of common stock under employee | |||||||||||||||||||||||
| plans, including tax benefits | 1,573,547 | 16 | 23,206 | 23,222 | |||||||||||||||||||
| Repurchase and retirement of common | |||||||||||||||||||||||
| stock | (2,056,346 | ) | (20 | ) | (49,432 | ) | (49,452 | ) | |||||||||||||||
| Dividends declared | (15,776 | ) | (15,776 | ) | |||||||||||||||||||
| Disqualified dispositions | 675 | 675 | |||||||||||||||||||||
| Balance at December 31, 2005 | 79,276,086 | $ | 793 | $ | 91,430 | ($ 16,547 | ) | $ | 429,859 | ($ 1,685 | ) | $ | 503,850 | ||||||||||
| Net income | 72,708 | 72,708 | |||||||||||||||||||||
| Foreign currency translation adjustment | |||||||||||||||||||||||
| (net of $1,434 tax expense) | 4,542 | 4,542 | |||||||||||||||||||||
| Unrealized gain on securities available | |||||||||||||||||||||||
| for sale (net of $0 tax expense) | 78 | 78 | |||||||||||||||||||||
| Unrealized loss on derivative instruments | |||||||||||||||||||||||
| (net of $138 tax benefit) | (436 | ) | (436 | ) | |||||||||||||||||||
| Total comprehensive income | 76,892 | ||||||||||||||||||||||
| Issuance of common stock under | |||||||||||||||||||||||
| employee plans, including tax benefits | 1,915,172 | 19 | 37,127 | 37,146 | |||||||||||||||||||
| Stock-based compensation under restricted stock plan | 113,794 | 1 | 5,082 | 5,083 | |||||||||||||||||||
| Stock-based compensation under stock option and employee stock purchase plans | 9,424 | 9,424 | |||||||||||||||||||||
| Repurchase and retirement of common | |||||||||||||||||||||||
| stock | (607,910 | ) | (6 | ) | (16,513 | ) | (16,519 | ) | |||||||||||||||
| Effect of adoption of SFAS 123R | (813,305 | ) | (8 | ) | (16,539 | ) | 16,547 | — | |||||||||||||||
| Dividends declared | (19,034 | ) | (19,034 | ) | |||||||||||||||||||
| Disqualified dispositions | (160 | ) | (160 | ) | |||||||||||||||||||
| Balance at December 31, 2006 | $ | 79,883,837 | $ | 799 | $ | 109,851 | $ | — | $ | 483,533 | $ | 2,499 | $ | 596,682 | |||||||||
Common Stock Shares | Common Stock Amount | Additional Paid-In Capital | Deferred Compensation | Retained Earnings | Accumulated Other Comprehensive Income/(Loss) | Total Stockholders’ Equity | ||||||||||||||||||||||
| Balance at December 31, 2006 | 79,883,837 | $ | 799 | $ | 207,808 | $ | — | $ | 385,480 | $ | 2,499 | $ | 596,586 | |||||||||||||||
| Net income | 107,033 | 107,033 | ||||||||||||||||||||||||||
Foreign currency translation adjustment (net of $286 tax expense) | 4,483 | 4,483 | ||||||||||||||||||||||||||
Unrealized gain on securities available-for-sale (net of $13 tax expense) | 200 | 200 | ||||||||||||||||||||||||||
Unrealized loss on derivative instruments (net of $7 tax benefit) | (117 | ) | (117 | ) | ||||||||||||||||||||||||
Total comprehensive income | 111,599 | |||||||||||||||||||||||||||
Issuance of common stock under employee plans, including tax benefits | 2,251,657 | 22 | 36,438 | 36,460 | ||||||||||||||||||||||||
| Stock-based compensation | 17,754 | 17,754 | ||||||||||||||||||||||||||
| Repurchase and retirement of common stock | (2,730,135 | ) | (27 | ) | (7,102 | ) | (72,599 | ) | (79,728 | ) | ||||||||||||||||||
| Dividends paid | (27,052 | ) | (27,052 | ) | ||||||||||||||||||||||||
| Disqualified dispositions | 5,467 | 5,467 | ||||||||||||||||||||||||||
Balance at December 31, 2007 | 79,405,359 | $ | 794 | $ | 260,365 | $ | — | $ | 392,862 | $ | 7,065 | $ | 661,086 | |||||||||||||||
| Net income | 84,827 | 84,827 | ||||||||||||||||||||||||||
Foreign currency translation adjustment (net of $681 tax benefit) | (4,188 | ) | (4,188 | ) | ||||||||||||||||||||||||
Unrealized loss on securities available-for-sale (net of $82 tax benefit) | (502 | ) | (502 | ) | ||||||||||||||||||||||||
Unrealized gain on derivative instruments (net of $1,320 tax expense) | 8,108 | 8,108 | ||||||||||||||||||||||||||
Total comprehensive income | 88,245 | |||||||||||||||||||||||||||
Issuance of common stock under employee plans, including tax benefits | 1,897,746 | 19 | 31,131 | 31,150 | ||||||||||||||||||||||||
| Stock-based compensation | 19,854 | 19,854 | ||||||||||||||||||||||||||
| Repurchase and retirement of common stock | (4,110,042 | ) | (41 | ) | (13,477 | ) | (90,123 | ) | (103,641 | ) | ||||||||||||||||||
| Dividends paid | (34,735 | ) | (34,735 | ) | ||||||||||||||||||||||||
| Disqualified dispositions | 2,479 | 2,479 | ||||||||||||||||||||||||||
Balance at December 31, 2008 | 77,193,063 | $ | 772 | $ | 300,352 | $ | — | $ | 352,831 | $ | 10,483 | $ | 664,438 | |||||||||||||||
| Net income | 17,085 | 17,085 | ||||||||||||||||||||||||||
Foreign currency translation adjustment (net of $1,799 tax expense) | 927 | 927 | ||||||||||||||||||||||||||
Unrealized gain on securities available-for-sale (net of $1,093 tax expense) | 563 | 563 | ||||||||||||||||||||||||||
Unrealized gain on derivative instruments (net of $3,053 tax expense) | 1,572 | 1,572 | ||||||||||||||||||||||||||
Total comprehensive income | 20,147 | |||||||||||||||||||||||||||
Issuance of common stock under employee plans, including tax benefits | 1,618,252 | 16 | 21,656 | 21,672 | ||||||||||||||||||||||||
| Stock-based compensation | 20,574 | 20,574 | ||||||||||||||||||||||||||
| Repurchase and retirement of common stock | (1,443,441 | ) | (14 | ) | (5,618 | ) | (28,953 | ) | (34,585 | ) | ||||||||||||||||||
| Dividends paid | (37,308 | ) | (37,308 | ) | ||||||||||||||||||||||||
| Disqualified dispositions | (518 | ) | (518 | ) | ||||||||||||||||||||||||
Balance at December 31, 2009 | 77,367,874 | $ | 774 | $ | 336,446 | $ | — | $ | 303,655 | $ | 13,545 | $ | 654,420 | |||||||||||||||
Note 1:1 – Operations and summary of significant accounting policies
National Instruments Corporation is a Delaware corporation. We engage in the design, development, manufacture and marketing of instrumentationprovide flexible application software and specialty computer plug-in cards and accessoriesmodular, multifunction hardware that users combine with industry standardindustry-standard computers, networks and the Internetthird party devices to create measurement, automation and automation systems.embedded systems, which we also refer to as “virtual instruments.” Our approach gives customers the ability to quickly and cost-effectively design, prototype and deploy unique custom-defined solutions for their design, control and test application needs. We offer hundreds of products used to create virtual instrumentation systems for general, commercial, industrial and scientific applications. Our products may be used in different environments, and consequently, specific application of our products is determined by the customer and generally is not known to us. We approach all markets with essentially the same products, which are used in a variety of applications from research and development to production testing, monitoring and industrial control. The following industries and applications are served by us worldwide: advanced research, automotive, commercial aerospace, computers and electronics, continuous process manufacturing, education, government/defense, medical research/pharmaceutical, power/energy, semiconductors, automated test equipment, telecommunications and others. TheThese financial statements have been prepared in accordance with accounting principles generally accepted in the United States of America.
Principles of consolidation
The consolidated financial statementsConsolidated Financial Statements include the accounts of National Instruments Corporation and its subsidiaries. All significant intercompany accounts and transactions have been eliminated.
We have historically recorded the excess of the purchase price over the par or stated value of retired shares of our common stock as a reduction of additional paid-in capital. We completed our review of this accounting policy under FASB ASC 505, Equity (FASB ASC 505). Based on this review, we have reclassified a portion of the excess of the purchase price over the par or stated value of retired shares of our common stock from a reduction of additional paid-in capital to a reduction of retained earnings. This reclassification did not have any impact on previously reported statements of income, earning per share amounts, statements of cash flows or total stockholders’ equity. Certain prior year amounts from our Consolidated Statements of Stockholders’ Equity have been reclassified to conform to the 2009 presentation as shown in the following table:
APIC RE 2006 Beginning Balance 12/31/06 balance as previously reported $ 109,851 $ 483,437 Cumulative reclassification of share repurchase 97,957 (97,957 ) 12/31/06 balance as reported in current Form 10-K $ 207,808 $ 385,480 2007 Activity Repurchase and retirement of common stock as previously reported $ (79,701 ) $ — Reclassification of 2007 activity 72,599 (72,599 ) Repurchase and retirement of common stock as reported in current Form 10-K $ (7,102 ) $ (72,599 ) 2007 Ending Balance 12/31/07 balance as previously reported $ 89,809 $ 563,418 Cumulative reclassification of share repurchase 170,556 (170,556 ) 12/31/07 balance as reported in current Form 10-K $ 260,365 $ 392,862 2008 Activity Repurchase and retirement of common stock as previously reported $ (103,600 ) $ — Reclassification of 2008 activity 90,123 (90,123 ) Repurchase and retirement of common stock as reported in current Form 10-K $ (13,477 ) $ (90,123 ) 2008 Ending Balance 12/31/08 balance as previously reported $ 39,673 $ 613,510 Cumulative reclassification of share repurchase 260,679 (260,679 ) 12/31/08 balance as reported in current Form 10-K $ 300,352 $ 352,831
Going forward, we will account for the retired shares of our common stock by recording the excess of the purchase price over par value as a reduction of retained earnings, to the extent that the excess of the purchase price over par value exceeds the original proceeds received from the issuance of the same shares of our common stock, as prescribed by FASB ASC 505.
Use of estimates Judgments and estimates are required in the
The preparation of our financial statements to conformin conformity with U.S. generally accepted accounting principles. Theprinciples requires us to make estimates and underlying assumptions that affect the reported amounts of assets, liabilities, revenues, expenses and liabilities,related disclosures of contingent assets and liabilities. We base our estimates on past experience and other assumptions that we believe are reasonable under the disclosurecircumstances, and we evaluate these estimates on an ongoing basis. Our critical accounting policies are those that affect our financial statements materially and involve difficult, subjective or complex judgments by management. Although these estimates are based on management's best knowledge of contingencies atcurrent events and actions that may impact the balance sheet date andcompany in the reported revenues and expenses forfuture, actual results may be materially different from the period. Actual results could differ from those estimates.
Cash and cash equivalents
Cash and cash equivalents include cash and highly liquid investments with maturities of three months or less at the date of acquisition. Short-term
Short-Term Investments
We maintain an investment portfolio of various types of security holdings and maturities. Pursuant to FASB ASC 820, cash equivalents and short-term investments Short-term available-for-sale are valued using the market approach (Level 1) based on unadjusted quoted prices in active markets for identical assets at the measurement date. Our short-term investments also include auction rate securities that we originally purchased for $8.6 million. These auction rate securities consist of corporate, state and municipaleducation loan revenue bonds. Auction rate securities with readily determinableare variable rate debt instruments whose interest rates are typically reset approximately every 7 to 35 days. In November 2008, we accepted the UBS Auction Rate Securities Rights (“the Rights”) agreement offered by UBS as a liquidity alternative to the failed auction process. The Rights agreement is a nontransferable right to sell our auction rate securities, at par value, back to UBS at any time during the period June 30, 2010, through July 2, 2012. The estimated fair market valuesvalue of both the auction rate securities and maturitiesthe Rights agreement was determined using significant unobservable inputs (Level 3) as prescribed by FASB ASC 820.
We account for our investments in excessdebt and equity instruments under FASB ASC 320. Our investments are classified as available-for-sale and accordingly are reported at fair value, with unrealized gains and losses reported as other comprehensive income, a component of three months at the date of acquisition.stockholders’ equity. Unrealized losses are charged against income when a decline in fair value is determined to be other than temporary. Investments with maturities beyond one year are classified as short-term based on their highly liquid nature and because such marketable securities represent the investment of cash that is available for current operations. Our investments are classified as available-for-sale and accordingly are reported atThe fair value of our short-term investments in debt securities at December 31, 2009 and December 31, 2008 was $87 million and $6 million, respectively. The increase was due to the net purchase of $74 million of short-term investments and the transfer of $8.6 related to our auction rate securities and our rights agreement from long-term investments to short-term investments during the year ended December 31, 2009. The net purchase of $74 million of short term investments was done to diversify our holdings from money market accounts to debt securities and to take advantage of higher yields associated with longer maturity debt securities. We follow the guidance provided by FASB ASC 320 to assess whether our investments with unrealized loss positions are other than temporarily impaired. Realized gains and losses reported as other comprehensive income. Unrealized losses are charged against income when a declineand declines in fair value is determinedjudged to be other than temporary. Thetemporary are determined based on the specific identification method and are reported in other income (expense), net, in our Consolidated Statements of Income.
Accounts Receivable, net
Accounts receivable are recorded net of allowance for sales returns of $1.9 million and $1.8 million at December 31, 2009 and 2008, respectively, and net of allowances for doubtful accounts of $2.7 million and $3.9 million at December 31, 2009 and 2008, respectively. A provision for estimated sales returns is used to determinemade by reducing recorded revenue based on historical experience. We analyze historical returns, current economic trends and changes in customer demand and acceptance of our products when evaluating the costadequacy of securities sold.our sales returns allowance. Our allowance for doubtful accounts is based on historical experience. We analyze historical bad debts, customer concentrations, customer creditworthiness and current economic trends when evaluating the adequacy of our allowance for doubtful accounts.
Year Description Balance atBeginningof Period Provisions Write-Offs Balance atEnd ofPeriod 2007 Allowance for doubtful accounts and sales returns $ 4,360 $ 1,940 $ 698 $ 5,602 2008 Allowance for doubtful accounts and sales returns 5,602 447 367 5,682 2009 Allowance for doubtful accounts and sales returns 5,682 337 1,400 4,619
Inventories
Inventories are stated at the lower-of-cost or market. Cost is determined using standard costs, which approximate the first-in first-out (FIFO)(“FIFO”) method. Cost includes the acquisition cost of purchased components, parts and subassemblies, in-bound freight costs, labor and overhead. Market is replacement cost with respect to raw materials and is net realizable value with respect to work in process and finished goods.
Inventory is shown net of adjustment for excess and obsolete inventories of $5.2$4.4 million and $6.0$4.4 million at December 31, 20062009 and 2005,2008, respectively.
Long-Term Investments
At December 31, 2008, our long-term investments primarily consisted of auction rate securities that we originally purchased for $8.6 million as well as our Rights agreement with UBS. At December 31, 2008, we classified these investments as long-term due to the fact that the market for these securities was inactive, the underlying securities generally had contractual maturities that were in excess of the guidelines provided for in our investment policy, the fact that we had the ability to hold the debt instruments to their ultimate maturity and the fact that we had not made a determination as to whether we would exercise our rights under the Rights agreement. The auction rate securities were classified as available-for-sale. At December 31, 2008, we reported our auction rate securities at their estimated fair market value of $7.0 million and our Rights agreement at its estimated fair market value of $1.6 million. The estimated fair market value of both the auction rate securities and the Rights agreement was determined using significant unobservable inputs (Level 3) as prescribed by FASB ASC 820. These auction rate securities and the Rights agreement are now reported as a component of short-term investments as discussed above.
Property and equipment
Property and equipment are recorded at cost. Depreciation is computed using the straight-line method over the estimated useful lives of the assets, which range from twenty to forty years for buildings, three to seven years for purchased internal use software and for equipment which are each included in furniture and equipment. Leasehold improvements are depreciated over the shorter of the life of the lease or the asset.
Intangible assets
We capitalize costs related to the development and acquisition of certain software products. In accordance with Statement of Financial Accounting Standards (“SFAS”) 86,Accounting for the Costs of Computer Software to Be Sold, Leased or Otherwise Marketed,FASB ASC 985, capitalization of costs begins when technological feasibility has been established and ends when the product is available for general release to customers. Technological feasibility for our products is established when the product is available for beta release. Amortization is computed on an individual product basis for those products available for market and is recognized based on the product’s estimated economic life, generally three years. Patents are amortized using the straight-line method over their estimated period of benefit, generally ten to seventeen years. At each balance sheet date, the unamortized costs for all intangible assets are reviewed by management and reduced to net realizable value when necessary.
Goodwill
GoodwillThe excess purchase price over the fair value of assets acquired is recorded as goodwill. As we have one operating segment, we allocate goodwill to one reporting unit for goodwill impairment testing. In accordance with SFAS 142,FASB ASC 350, Intangibles – Goodwill and Other Intangible Assets, (FASB ASC 350), goodwill is tested for impairment on an annual basis, and between annual tests if indicators of potential impairment exist, using a fair-value-based approach.approach based on the market capitalization of the reporting unit. Our annual impairment test was performed on April 6, 2006.as of February 28, 2009. No impairment of goodwill was identified.has been identified during the period presented. Goodwill is deductible for tax purposes in certain jurisdictions.
Concentrations of credit risk Financial
We maintain cash and cash equivalents with various financial institutions located in many countries throughout the world. At December 31, 2009, $85 million or 42% of our cash and cash equivalents was held in cash in various operating accounts with financial institutions throughout the world and $116 million or 58% was held in money market accounts. The most significant of our operating accounts was our domestic operating account which held approximately $22 million or 11% of our total cash and cash equivalents at a bank that carried an A1 rating at December 31, 2009. From a geographic standpoint, approximately $78 million or 39% was held in various domestic accounts with financial institutions and $123 million or 61% was held in various accounts outside of the U. S. with financial institutions. At December 31, 2009, our short-term investments consist of $35 million or 40% of foreign government bonds, $21 million or 24% of U.S. treasuries and agencies, $12 million or 14% of municipal bonds, $9 million or 10% of auction rate securities and our auction rate securities put option, $8 million or 9% of corporate bonds and $3 million or 3% in time deposits.
The goal of our investment policy is to manage our investment portfolio to preserve principal and liquidity while maximizing the return on our investment portfolio through the full investment of available funds. We place our cash investments in instruments that potentially subject us to concentrationsmeet credit quality standards, as specified in our corporate investment policy guidelines. These guidelines also limit the amount of credit risk consist principallyexposure to any one issue, issuer or type of instrument. With the exception of our auction rate security from the Vermont Student Assistance Corporation, at December 31, 2009, our cash equivalents and short-term investments carried ratings from the major credit rating agencies that were in accordance with our corporate investment policy. Our investment policy allows investments in the following; government and federal agency obligations, repurchase agreements (“Repos”), certificates of deposit and time deposits, corporate obligations, medium term notes and deposit notes, commercial paper including asset-backed commercial paper (“ABCP”), puttable bonds, general obligation and revenue bonds, money market funds, taxable commercial paper, corporate notes/bonds, municipal notes, municipal obligations, variable rate demand notes and tax exempt commercial paper. All such instruments must carry minimum ratings of A1/P1/F1, MIG1/VMIG1/SP1 and A2/A/A, as applicable, all of which are considered “investment grade”. Our investment policy for marketable securities requires that all securities mature in three years or less, with a weighted average maturity of no longer than 18 months with at least 10% maturing in 90 days or less. We actively monitor our investment portfolio to ensure compliance with our investment objective to preserve capital, meet liquidity requirements and maximize return on our investments. We do not require collateral or enter into master netting arrangements to mitigate our credit risk. (See Note 2 – Cash, cash equivalents, short-term and long-term investments in Notes to Consolidated Financial Statements for further discussion and analysis of our investments.).
At December 31, 2009, we held foreign currency forward and option contracts cashwith an aggregate notional amount of $148.4 million with various counterparties and cash equivalents, short-term investments and trade accounts receivable. We have no significant concentrations of credit risk at December 31, 2006.with varying maturity dates. Our counterparties in our foreign currency forward and option contracts are major financial institutions. We do not anticipate nonperformance by these counterparties. We maintain cash(See Note 4 – Derivative instruments and cash equivalents with various financial institutions locatedhedging activities in many countries worldwide. Our short-term investments are diversified among and limitedNotes to high-quality securities with high credit ratings. Consolidated Financial Statements).
Concentration of credit risk with respect to trade accounts receivable is limited due to the large number of customers and their dispersion across many countries and industries. The amount of sales to any individual customer did not exceed 3% of revenue for the periods presented. The largest trade account receivable from any individual customer at December 31, 20062009 was approximately $1.8$1.9 million.
Key supplier risk
Our manufacturing processes use large volumes of high-quality components and subassemblies supplied by outside sources. Several of thosethese components are available through singlesole or limited sources. Supply shortages of or quality problems in connection with some of these key components could require us to procure components from replacement suppliers, which would cause significant delays in fulfillment of orders and likely result in additional costs. In order to manage this risk, we maintain safety stock of some of these single sourced components and subassemblies and perform regular assessments of suppliers performance, grading key suppliers in critical areas such as quality and “on-time” delivery.
Revenue recognition
We derive revenue primarily from the sale/licensing of integrated hardware and software solutions. We also sellIndependent sales of application software licenses which are sold separately as well as training andinclude post contract support services. In addition, training services are sold separately. The products and services are generally sold under standardized licensing and sales arrangements with payment terms ranging from net 30 days in the United States to net 30 days and up to net 90 days in some international markets. Approximately 95%83% of our product/license sales include both hardware and software in the customer arrangement, with a small percentage of sales including other services. We offer rights of return and standard warranties for product defects related to our products. The rights of return are generally for a period of up to 30 days after the delivery date. The standard warranties cover periods ranging from 90 days to three years. With the exception of our former German systems integration subsidiary, which accounted for less than 1.5% of our revenues in the year ended December 31, 2004, weWe do not generally enter into contracts requiring product acceptance from the customer. This subsidiary was sold in December 2004.
Revenue is recognized in accordance with the provisions of SOP 97-2FASB ASC 985, when persuasive evidence of an arrangement exists, delivery has occurred, the fee is fixed or determinable, and collectability is probable. We enter into certain arrangements where we are obligated to deliver multiple products and/or services (“multiple elements”). In these transactions, we allocate the total revenue among the elements based on vendor specific objective evidence (“VSOE”) of fair value as determined by the sales price of each element when sold separately (“vendor-specific objective evidence”). Salesseparately.
When VSOE of fair value is available for the undelivered element of a multiple element arrangements, sales revenue from product sales is generally recognized on the date the product is shipped, using the residual method under FASB ASC 985, with a portion of revenue recorded as deferred (unearned) due to applicable undelivered elements. Undelivered elements for our multiple-elementmultiple element arrangements with a customer are generally restricted to post contract support and training and education. The amount of revenue allocated to these undelivered elements is based on the vendor-specific objective evidence (“VSOE”)VSOE of fair value for those undelivered elements. Deferred revenue due to undelivered elements is recognized ratably on a straight-line basis over the service period or when the service is completed. When VSOE of fair value is not available for the undelivered element of a multiple element arrangement, sales revenue is generally recognized ratably, on a straight-line basis over the service period of the undelivered element, generally 12 months or when the service is completed in accordance with the subscription method under FASB ASC 985. Deferred revenue at December 31, 20062009 and 20052008 was $22.2$57 million and $16.0$46 million, respectively.
The application of SOP 97-2FASB ASC 985 requires judgment, including whether a software arrangement includes multiple elements, and if so, whether VSOE of fair value exists for those elements. Changes to the elements in a software arrangement, the ability to identify VSOE for those elements, the fair value of the respective elements, and changes to a product'sproduct’s estimated life cycle could materially impact the amount of our earned and unearned revenue. Judgment is also required to assess whether future releases of certain software represent new products or upgrades and enhancements to existing products. Provision
Product revenue
Our product revenue is generated predominantly from the sales of measurement and automation products. Our products consist of application software and hardware components together with related driver software.
Software maintenance revenue
Software maintenance revenue is post contract customer support that provides the customer with unspecified upgrades/updates and technical support.Shipping and handling costsOur shipping and handling costs charged to customers are included in net sales, and the associated expense is recorded in cost of sales for estimated sales returns is made by reducing recorded revenue based on historical experience. Management analyzes historical returns, current economic trends, and changes in customer demand and acceptance of our products when evaluating the adequacy of our allowance for sales returns. The accounts receivable are net of allowance for sales returns of $1.5 million and $1.3 million at December 31, 2006 and 2005, respectively. Similarly, management must make estimates of the uncollectability of our accounts receivables. Management specifically analyzes accounts receivable and analyzes historical bad debts, customer concentrations, customer credit-worthiness and current economic trends when evaluating the adequacy of our allowance for doubtful accounts. The accounts receivable are net of allowances for doubtful accounts of $2.9 million and $3.4 million at December 31, 2006 and 2005, respectively.all periods presented.
Warranty reserve
We offer a one-year limited warranty on most hardware products, with a two or three-year warranty on a subset of our hardware products, which is included in the sales price of many of our products. Provision is made for estimated future warranty costs at the time of the sale pursuant to SFAS 5,Accounting for Loss FASB ASC 450, Contingencies (FASB ASC 450), for the estimated costs that may be incurred under the basic limited warranty. Our estimate is based on historical experience and product sales during this period.
The warranty reserve for the years ended December 31, 20062009 and 2005,2008, respectively, was as follows (in thousands):2006
2005
Balance at the beginning of the period $ 915 $ 815 Accruals for warranties issued during the period 1,593 1,652 Settlements made (in cash or in kind) during the period (1,641 ) (1,552 )
Balance at the end of the period $ 867 $ 915
2009 2008 Balance at the beginning of the period $ 952 $ 750 Accruals for warranties issued during the period 1,991 1,836 Settlements made (in cash or in kind) during the period (2,022 ) (1,634 ) Balance at the end of the period $ 921 $ 952
Loss contingencies
We accrue for probable losses from contingencies including legal defense costs, on an undiscounted basis, in accordance with SFAS 5, Accounting for Loss FASB ASC 450, Contingencies (FASB ASC 450), when such costs are considered probable of being incurred and are reasonably estimable. We periodically evaluate available information, both internal and external, relative to such contingencies and adjust this accrual as necessary.
Advertising expense
We expense costs of advertising as incurred. Advertising expense for the years ended December 31, 2006, 20052009, 2008 and 20042007 was $47.3$13.6 million, $42.5$19.3 million and $39.7$20.0 million, respectively.
Foreign currency translation
The functional currency for our international sales operations is the applicable local currency. The assets and liabilities of these operations are translated at the rate of exchange in effect on the balance sheet date and sales and expenses are translated at average rates. The resulting gains or losses from translation are included in a separate component of other comprehensive income. Gains and losses resulting from re-measuring monetary asset and liability accounts that are denominated in a currency other than a subsidiary’s functional currency are included in net foreign exchange gain (loss) and are included in net income.
Foreign currency hedging instruments
All of our derivative instruments are recognized on the balance sheet at their fair value. We currently use foreign currency forward and purchased option contracts to hedge our exposure to material foreign currency denominated receivables and forecasted foreign currency cash flows.
On the date the derivative contract is entered into, we designate the derivative as either a hedge of the fair value of foreign currency denominated receivables (“fair-value” hedge) or as a hedge of the variability of foreign currency cash flows to be received or paid (“cash flow” hedge). Changes in the fair market value or as a hedge of a fair-value hedge are recorded, along with the loss or gain on the re-measurement of foreign-currency-denominated receivables, in current earnings.our foreign denominated net receivable positions (“other derivatives”). Changes in the fair value of derivatives that are designated and qualify as cash flow hedges under SFAS 133FASB ASC 815, Derivatives and Hedging (FASB ASC 815) and that are deemed to be highly effective are recorded in other comprehensive income. These amounts are subsequently reclassified into earnings in the period during which the hedgehedged transaction is realized. The gain or loss on the other derivatives as well as the offsetting gain or loss on the hedged item attributable to the hedged risk is recognized in current earnings under the line item “Net foreign exchange gain (loss)”. We do not enter into derivative contracts for speculative purposes.
We formally document all relationships between hedging instruments and hedged items, as well as our risk-management objective and strategy for undertaking various hedge transactions. This process includes linking all derivatives that are designated as fair-value or cash flow hedges to specific assets and liabilities on the balance sheet or to specific firm commitments or forecasted transactions. We also formally assess, both at the hedge’s inception and on an ongoing basis, whether the hedging instruments are highly effective in offsetting changes in cash flows of hedged items.
We prospectively discontinue hedge accounting if (1) it is determined that the derivative is no longer highly effective in offsetting changes in the fair value of a hedged item (forecasted transactions); or (2) the derivative is de-designated as a hedge instrument, because it is unlikely that a forecasted transaction will occur. When hedge accounting is discontinued, the derivative is sold and the resulting gains and losses are recognized immediately in earnings.
Income taxes
We account for income taxes under the asset and liability method as set forth in SFAS 109,Accounting for FASB ASC 740, Income Taxes.Taxes (FASB ASC 740). Deferred tax assets and liabilities are recognized for the expected tax consequences of temporary differences between the tax bases of assets and liabilities and their reported amounts. Valuation allowances are established when necessary to reduce deferred tax assets to amounts which are more likely than not to be realized.
Earnings per share On January 21, 2004, we declared a stock split effected in the form of a dividend of one share of common stock for each two shares of common stock outstanding. The dividend was paid on February 20, 2004 to holders of record as of the close of business on February 5, 2004. All per share data and numbers of common shares, where appropriate, have been retroactively adjusted to reflect the stock split.
Basic earnings per share (“EPS”) is computed by dividing net income by the weighted average number of common shares outstanding during each period. Diluted EPS is computed by dividing net income by the weighted average number of common shares and common share equivalents outstanding (if dilutive) during each period. The number of common share equivalents, which include stock options and restricted stock units, is computed using the treasury stock method.
The reconciliation of the denominators used to calculate basic EPS and diluted EPS for the years ended December 31, 2006, 20052009, 2008 and 2004,2007, respectively, are as follows (in thousands):Years Ended December 31,
2006
2005
2004
Weighted average shares outstanding-basic 79,519 78,552 78,680 Plus: Common share equivalents Stock options, restricted stock units 2,000 2,358 3,416
Weighted average shares outstanding-diluted 81,519 80,910 82,096
Years Ended December 31, 2009 2008 2007 Weighted average shares outstanding-basic�� 77,520 78,567 79,468 Plus: Common share equivalents Stock options, restricted stock units 506 948 1,575 Weighted average shares outstanding-diluted 78,026 79,515 81,043
Stock options to acquire 3,295,000, 3,056,0002,711,976, 2,402,934 and 2,523,0002,304,078 shares for the years ended December 31, 2006, 20052009, 2008 and 2004,2007, respectively, were excluded in the computations of diluted EPS because the effect of including the stock options would have been anti-dilutive.
Stock-based compensation plans
Effective January 1, 2006, we adopted Statement of Financial Accounting Standards 123R (“SFAS 123R”),“Share-based Payments”FASB ASC 718, Compensation – Stock Compensation (FASB ASC 718), using the modified-prospective-transition method. Under this method, prior periods are not restated. Under this transition method, stock compensation cost recognized beginning January 1, 2006 includes: (a) compensation cost for all share-based payments granted prior to, but not yet vested as of January 1, 2006, based on the grant date fair value estimated in accordance with the original provisions of SFAS 123,FASB ASC 718, and (b) compensation cost for all share-based payments granted on or subsequent to January 1, 2006, based on the grant-date fair value estimated in accordance with the provisions of SFAS 123R.FASB ASC 718. Prior
Comprehensive income
Our comprehensive income is comprised of net income, foreign currency translation and unrealized gains and losses on forward and option contracts and securities available-for-sale. Comprehensive income for 2009, 2008 and 2007 was $20.1 million, $88.2 million and $111.6 million, respectively.
Recently Issued Accounting Pronouncements
In April 2009, the FASB updated FASB ASC 820 providing additional guidance for estimating fair value when the volume and level of activity for the asset or liability have significantly decreased. This update also includes guidance on identifying circumstances that indicate a transaction is not orderly. We adopted the update on April 1, 2009 as required and concluded it did not have a material impact on our consolidated financial position or results of operations.
In September 2009, the FASB updated FASB ASC 105, Generally Accepted Accounting Principles (FASB ASC 105). The update establishes the FASB Standards Accounting Codification (“Codification”) as the source of authoritative U.S. generally accepted accounting principles (“GAAP”) recognized by the FASB to adopting SFAS 123R, we presentedbe applied to nongovernmental entities and rules and interpretive releases of the SEC as authoritative GAAP for SEC registrants. The Codification supersedes all tax benefitsexisting non-SEC accounting and reporting standards. This update is effective for financial statements issued for interim and annual periods ending after September 15, 2009. We adopted the update on July 1, 2009, as required and concluded it did not have a material impact on our consolidated financial position or results of deductions resultingoperations.
In October 2009, the FASB updated FASB ASC 605, Revenue Recognition (FASB ASC 605) that amended the criteria for separating consideration in multiple-deliverable arrangements. The amendments establish a selling price hierarchy for determining the selling price of a deliverable. The selling price used for each deliverable will be based on vendor-specific objective evidence if available, third–party evidence if vendor-specific objective evidence is not available, or estimated selling price if neither vendor-specific objective evidence nor third-party evidence is available. The amendments will change the application of the residual method of allocation and require that arrangement consideration be allocated at the inception of the arrangement to all deliverables using the relative selling price method. The relative selling price method allocates any discount in the arrangement proportionally to each deliverable on the basis of each deliverable’s selling price. This update will be effective prospectively for revenue arrangements entered into or materially modified in fiscal years beginning on or after June 15, 2010. Early adoption is permitted. We are currently evaluating the requirements of this update and have not yet determined the impact on our consolidated financial statements.
In October 2009, the FASB updated FASB ASC 985, Software (FASB ASC 985) that changes the accounting model for revenue arrangements that include both tangible products and software elements. Tangible products containing software components and nonsoftware components that function together to deliver the tangible product’s essential functionality are no longer within the scope of the software revenue guidance in Subtopic 985-605. In addition, the amendments require that hardware components of a tangible product containing software components always be excluded from the exercisesoftware revenue guidance. This update will be effective prospectively for revenue arrangements entered into or materially modified in fiscal years beginning on or after June 15, 2010. Early adoption is permitted. We are currently evaluating the requirements of stock grants as operatingthis update and have not yet determined the impact on our consolidated financial statements.
Cash, cash flows. SFAS 123R requires the cash flows resulting from the tax benefits from tax deductions in excessequivalents, short-term and long-term investments consist of the compensation costfollowing (in thousands):
As ofDecember 31, 2009 As ofDecember 31, 2008 Cash and cash equivalents: Cash $ 85,612 $ 100,967 Cash equivalents: Time deposits — 73,400 Money market accounts 115,853 55,033 Total cash and cash equivalents $ 201,465 $ 229,400 Short-term investments: Municipal bonds $ 12,549 $ 6,220 Corporate bonds 7,587 — U.S. treasuries and agencies 21,033 — Foreign government bonds 34,674 — Time deposits 2,753 — Auction rate securities 8,177 — Auction rate securities put option 423 — Total short-term investments 87,196 6,220 Long-term investments: Auction rate securities — 6,964 Auction rate securities put option — 1,636 Other long-term investments — 1,900 Total investments $ 87,196 $ 16,720 Total cash, cash equivalents and investments $ 288,661 $ 246,120
The following table summarizes unrealized gains and losses related to our investments designated as available-for-sale (in thousands):
As of December 31, 2009 Adjusted Cost GrossUnrealized Gain GrossUnrealized Loss Cumulative Translation Adjustment Fair Value Municipal bonds $ 12,491 $ 58 $ — $ — $ 12,549 Corporate bonds 7,478 110 (1 ) — 7,587 U.S. treasuries and agencies 21,080 — (47 ) — 21,033 Foreign government bonds 36,105 76 — (1,507 ) 34,674 Time deposits 2,753 — — — 2,753 Auction rate securities 8,600 — (423 ) — 8,177 Auction rate securities put option — 423 — — 423 Total investments $ 88,507 $ 667 $ (471 ) $ (1,507 ) $ 87,196
As of December 31, 2008 Adjusted Cost GrossUnrealized Gain GrossUnrealized Loss Fair Value Municipal securities $ 6,199 $ 28 $ (7 ) $ 6,220 Auction rate securities 8,600 — (1,636 ) 6,964 Auction rate securities put option — 1,636 — 1,636 Other long-term investments 1,900 — — 1,900 Total investments $ 16,699 $ 1,664 $ (1,643 ) $ 16,720
The following table summarizes the contractual maturities of our investments designated as available-for-sale (in thousands):
As of December 31, 2009 Adjusted Cost Fair Value Due in less than 1 year $ 44,029 $ 43,267 Due in 1 to 5 years 44,478 43,929 Total investments $ 88,507 $ 87,196
As of December 31, 2009 Due in less than 1 year Adjusted Cost Fair Value Municipal bonds $ 4,103 $ 4,110 Corporate bonds 5,384 5,473 U.S. treasuries and agencies 5,065 5,057 Foreign government bonds 18,124 17,274 Time deposits 2,753 2,753 Auction rate securities 8,600 8,177 Auction rate securities put option — 423 Total investments $ 44,029 $ 43,267
As of December 31, 2009 Due in 1 to 5 years Adjusted Cost Fair Value Municipal bonds $ 8,388 $ 8,439 Corporate bonds 2,094 2,114 U.S. treasuries and agencies 16,015 15,976 Foreign government bonds 17,981 17,400 Time deposits — — Auction rate securities — — Auction rate securities put option — — Total investments $ 44,478 $ 43,929
Note 3 – Fair value measurements
FASB ASC 820, clarifies the definition of fair value, prescribes methods for measuring fair value, establishes a fair value hierarchy based on the inputs used to measure fair value and expands disclosures about the use of fair value measurements. Effective January 1, 2009, we adopted FASB ASC 820 for our nonfinancial assets and nonfinancial liabilities, except those items recognized (excess tax benefits) to be classifiedor disclosed at fair value on an annual or more frequently recurring basis. The adoption of FASB ASC 820 did not have a material impact on our fair value measurements as financing cash flows. Aswe did not have any items that were measured at fair value on a result, $4.3 million of excess tax benefitsnonrecurring basis for the year ended December 31, 20062009. In April 2009, FASB ASC 820 was updated to provide additional guidance for estimating fair value when the volume and level of activity for the asset or liability have been classified as financing cash flows. Prior tosignificantly decreased. The update also includes guidance on identifying circumstances that indicate a transaction is not orderly. We adopted the effective date of SFAS 123R, we applied Accounting Principles Board Opinion 25 (“APB 25”),“Accounting for Stock Issued to Employees”update on April 1, 2009 and related interpretations forit did not have a material impact on our stock option grants. APB 25 providesfair value measurements.
The following tables present our assets and liabilities that are measured at fair value on a recurring basis and are categorized using the compensation expense relative to our stock options is measuredfair value hierarchy. The fair value hierarchy has three levels based on the intrinsicreliability of the inputs used to determine fair value.
Fair Value Measurements at Reporting Date Using Description December 31, 2009 Quoted Prices in Active Markets for Identical Assets(Level 1) Significant Other Observable Inputs(Level 2) Significant Unobservable Inputs(Level 3) Assets Money Market Funds $ 115,853 $ 115,853 $ — $ — Short-term investments available-for-sale 87,196 78,596 — 8,600 Derivatives 11,016 — 11,016 — Total Assets $ 214,065 $ 194,449 $ 11,016 $ 8,600 Liabilities Derivatives $ (318 ) $ — $ (318 ) $ — Total Liabilities $ (318 ) $ — $ (318 ) $ —
Fair Value Measurements Using Significant Unobservable Inputs(Level 3) Short-term investmentsavailable-for-sale Beginning Balance, January 1, 2008 $ 8,600 Total gains (realized/unrealized) Included in earnings 423 Included in other comprehensive income — Total losses (realized/unrealized) Included in earnings (423 ) Included in other comprehensive income — Purchases, issuances and settlements — Transfer in and/or out of Level 3 — Ending Balance, December 31, 2009 $ 8,600 The amount of total gains or (losses) for the period included in earnings (or changes in net assets) attributableto the change in unrealized gains or losses relating to assets still held at the reporting date $ —
Short-term investments available-for-sale are valued using a market approach (Level 1) based on the quoted market prices of identical instruments when available or other observable inputs such as trading prices of identical instruments in inactive markets. Short-term investments available-for-sale consist of debt securities issued by states of the U.S. and political subdivisions of the states, corporate debt securities and debt securities issued by U.S. government corporations and agencies. All short-term investments available-for-sale have contractual maturities of less than 24 months.
Derivatives include foreign currency forward and option contracts. Our foreign currency forward contracts are valued using an income approach (Level 2) based on the spot rate less the contract rate multiplied by the notional amount. Our foreign currency option contracts are valued using a market approach based on the quoted market prices which are derived from observable inputs including current and future spot rates, interest rate spreads as well as quoted market prices of identical instruments.
Short-term debt securities available-for-sale included in Level 3 are reported at their fair market value and consist of auction rate securities backed by education loan revenue bonds. One of our auction rate securities is from the Vermont Student Assistance Corporation and has a par value of $2.2 million. The other of our auction rate securities is from the New Hampshire Health and Education Facilities Authority and has a par value of $6.4 million. The ratings for these securities at December 31, 2009, were Baa3/A/AAA and Aaa/NR/AAA, respectively. Historically, we reported the fair market value of these securities at par as differences between par value and the purchase price or settlement value were historically comprised of accrued interest. Auction rate securities are variable rate debt instruments whose interest rates are typically reset approximately every 7 to 35 days. On January 15, 2010, and in prior auction periods beginning in February 2008, the auction process for these securities failed. At December 31, 2009, we reported these as short-term investments at their estimated fair market value of $8.2 million.
In November 2008, we accepted the UBS Auction Rate Securities Rights (the “Rights”) agreement offered by UBS as a liquidity alternative to the failed auction process. This Rights agreement is related to the auction rates securities discussed above. The Rights agreement is a nontransferable right to sell our auction rate securities, at par value, back to UBS at any time during the period June 30, 2010, through July 2, 2012. At December 31, 2009, we reported the Rights agreement at its estimated fair market value of $423,000 as a component of short-term debt securities available for sale.
Due to the fact that our Rights agreement has an initial exercise date that is less than one year from now, we are now reporting our auction rate securities and the corresponding Rights agreement as short-term. We continue to have the ability to hold our auction rate securities to their ultimate maturities which are in excess of one year and we have not made a determination as to whether we will exercise our option under the Rights agreement or if we do choose to exercise our option, at what point during the period June 30, 2010 through July 2, 2012, we would exercise our option. However, due to the fact that our Rights agreement has an initial exercise date that is less than one year from now, we are now reporting our auction rate securities and the corresponding Rights agreement as short-term. We have recorded the unrealized loss related to the auction rate securities and the unrealized gain related to the Rights agreement as a component of other income (expense), in our Consolidated Statements of Income.
The estimated fair market value of both the auction rate securities and the Rights agreement was determined using significant unobservable inputs (Level 3) as prescribed by FASB ASC 820. We considered many factors in determining the fair market value of the stockauction rate securities as well as our corresponding Rights agreement at December 31, 2009, including the fact that the debt instruments underlying the auction rate securities have redemption features which call for redemption at 100% of par value, current credit curves for like securities and discount factors to account for the illiquidity of the market for these securities. During the year ended December 31, 2009, we did not make any changes to our valuation techniques or related inputs.
FASB ASC 815 requires companies to recognize all of their derivative instruments as either assets or liabilities in the statement of financial position at fair value. The accounting for changes in the fair value (i.e., gains or losses) of a derivative instrument depends on whether it has been designated and qualifies as part of a hedging relationship and further, on the type of hedging relationship. For those derivative instruments that are designated and qualify as hedging instruments, a company must designate the hedging instrument, based upon the exposure being hedged, as a fair value hedge, cash flow hedge, or a hedge of a net investment in a foreign operation.
We have operations in over 40 countries. Sales outside of the Americas as a percentage of consolidated sales were 57% and 57% for the years ended December 31, 2009 and 2008, respectively. Our activities expose us to a variety of market risks, including the effects of changes in foreign currency exchange rates. These financial risks are monitored and managed by us as an integral part of our overall risk management program.
We maintain a foreign currency risk management strategy that uses derivative instruments (foreign currency forward and purchased option contracts) to help protect our earnings and cash flows from fluctuations caused by the volatility in currency exchange rates. Movements in foreign currency exchange rates pose a risk to our operations and competitive position, since exchange rate changes may affect our profitability and cash flow, and the business or pricing strategies of our non-U.S. based competitors.
The vast majority of our foreign sales are denominated in the customers’ local currency. We purchase foreign currency forward and option contracts as hedges of forecasted sales that are denominated in foreign currencies and as hedges of foreign currency denominated receivables. These contracts are entered into to protect against the risk that the eventual dollar-net-cash inflows resulting from such sales or firm commitments will be adversely affected by changes in exchange rates. We also purchase foreign currency forward contracts as hedges of forecasted expenses that are denominated in foreign currencies. These contracts are entered into to protect against the risk that the eventual dollar-net-cash outflows resulting from foreign currency operating and cost of revenue expenses will be adversely affected by changes in exchange rates.
In accordance with FASB ASC 815, we designate foreign currency forward and purchased option contracts as cash flow hedges of forecasted revenues or forecasted expenses. In addition, we hedge our foreign currency denominated balance sheet exposures using foreign currency forward contracts. These derivatives are not designated as hedging instruments under FASB ASC 815. None of our derivative instruments contain a credit-risk-related contingent feature.
Cash flow hedges
To protect against the reduction in value caused by a fluctuation in foreign currency exchange rates of forecasted foreign currency cash flows resulting from international sales over the next one to two years, we have instituted a foreign currency cash flow hedging program. We hedge portions of our forecasted revenue and forecasted expenses denominated in foreign currencies with forward and purchased option contracts. For forward contracts, when the dollar strengthens significantly against the foreign currencies, the change in the present value of future foreign currency cash flows may be offset by the change in the fair value of the forward contracts designated as hedges. For option contracts, when the dollar strengthens significantly against the foreign currencies, the change in the present value of future foreign currency cash flows may be offset by the change in the fair value of the option contracts net of the premium paid designated as hedges. Our foreign currency purchased option contracts are purchased “at-the-money” or “out-of-the-money”. We purchase foreign currency forward and option contracts for up to 100% of our forecasted exposures in selected currencies (primarily in Euro, Japanese yen, British pound sterling, South Korean won and Hungarian forint) and limit the duration of these contracts to 40 months or less.
For derivative instruments that are designated and qualify as a cash flow hedge, the effective portion of the gain or loss on the derivative is reported as a component of accumulated other comprehensive income (“OCI”) and reclassified into earnings in the same line item (net sales, operating expenses, or cost of sales) associated with the forecasted transaction and in the same period or periods during which the hedged transaction affects earnings. Gains and losses on the derivative representing either hedge ineffectiveness or hedge components excluded from the assessment of effectiveness are recognized in current earnings or expenses during the current period and are classified as a component of “net foreign exchange gain (loss)”. Hedge effectiveness of foreign currency forwards and purchased option contracts designated as cash flow hedges are measured by comparing the hedging instrument’s cumulative change in fair value from inception to maturity to the forecasted transaction’s terminal value.
We held forward contracts with a notional amount of $28.6 million dollar equivalent of Euro, $4.0 million dollar equivalent of British pound sterling, $24.4 million dollar equivalent of Japanese yen, and $17.8 million dollar equivalent of Hungarian forint at dateDecember 31, 2009. These contracts are for terms of grant.up to 24 months. At December 31, 2008, we held forward contracts with a notional amount of $54.9 million dollar equivalent of Euro, $6.2 million dollar equivalent of British pound sterling, $18.9 million dollar equivalent of Japanese yen, $4.7 million dollar equivalent of South Korean won and $21.7 million dollar equivalent of Hungarian forint.
We held purchased option contracts with a notional amount of $28.4 million dollar equivalent of Euro at December 31, 2009. These contracts are for terms of up to 12 months. At December 31, 2008, we held purchased option contracts with a notional amount of $111.3 million dollar equivalent of Euro.
At December 31, 2009, we expect to reclassify $2.8 million of gains on derivative instruments from accumulated other comprehensive income to net sales during the next twelve months when the hedged international sales occur. At December 31, 2009, we expect to reclassify $3.7 million of gains on derivative instruments from accumulated OCI to cost of sales and $2.0 million of gains on derivative instruments from accumulated OCI to operating expenses during the next twelve months when the hedged international expenses occur. Expected amounts are based on derivative valuations at December 31, 2009. Actual results may vary as a result of changes in the corresponding exchange rate subsequent to this date.
During the year ended December 31, 2009, hedges with a notional amount of $22.8 million were determined to be ineffective. As a result, we recorded a net gain of adopting SFAS 123R$1.2 million related to these hedges as a component of “net foreign exchange gain (loss)” during the year ended December 31, 2009. We did not record any gains or losses due to the ineffectiveness of our hedges during the year ended December 31, 2008.Other Derivatives
Other derivatives not designated as hedging instruments under FASB ASC 815 consist primarily of foreign currency forward contracts that we use to hedge our foreign denominated net receivable or net payable positions to protect against the change in value caused by a fluctuation in foreign currency exchange rates. We typically hedge up to 90% of our outstanding foreign denominated net receivables or net payables and typically limit the duration of these foreign currency forward contracts to approximately 90 days. The gain or loss on the derivatives as well as the offsetting gain or loss on the hedge item attributable to the hedged risk is recognized in current earnings under the line item “net foreign exchange gain (loss)”. As of December 31, 2009 and December 31, 2008, we held foreign currency forward contracts with a notional amount of $45.2 million and $67.1 million, respectively.
Effective January 1, 2006,2009, we adopted the updated disclosure requirements of FASB ASC 815. The following table presents the fair value of derivative instruments on our income before income taxesConsolidated Balance Sheets and net incomethe effect of derivative instruments on our Consolidated Statements of Income.
Fair Values of Derivative Instruments (in thousands):
In thousands Asset Derivatives December 31, 2009 December 31, 2008 Balance Sheet Location Fair Value Balance Sheet Location Fair Value Derivatives designated as hedginginstruments under FASB ASC 815 Foreign exchange contracts – ST forwards Prepaid expenses and other current assets $ 7,947 Prepaid expenses and other current assets $ 5,260 Foreign exchange contracts – LT forwards Other long-term assets 274 Other long-term assets 2,654 Foreign exchange contracts – ST options Prepaid expenses and other current assets 1,821 Prepaid expenses and other current assets 5,705 Foreign exchange contracts – LT options Other long-term assets — Other long-term assets 3,838 Total derivatives designated ashedging instruments under FASB ASC 815 $ 10,042 $ 17,457 Derivatives not designated ashedging instruments under FASB ASC 815 Foreign exchange contracts – ST forwards Prepaid expenses and other current assets $ 974 Prepaid expenses and other current assets $ 2,745 Total derivatives not designated ashedging instruments under FASB ASC 815 $ 974 $ 2,745 Total derivatives $ 11,016 $ 20,202
Liability Derivatives December 31, 2009 December 31, 2008 Balance Sheet Location Fair Value Balance Sheet Location Fair Value Derivatives designated as hedginginstruments under FASB ASC 815 Foreign exchange contracts – ST forwards Accrued expenses and other liabilities $ — Accrued expenses and other liabilities $ (1,803 ) Foreign exchange contracts – LT forwards Other long-term liabilities — Other long-term liabilities — Foreign exchange contracts – ST options Accrued expenses and other liabilities — Accrued expenses and other liabilities — Foreign exchange contracts – LT options Other long-term liabilities — Other long-term liabilities — Total derivatives designated ashedging instruments under FASB ASC 815 $ — $ (1,803 ) Derivatives not designated ashedging instruments under FASB ASC 815 Foreign exchange contracts – ST forwards Accrued expenses and other liabilities $ (318 ) Accrued expenses and other liabilities $ (3,280 ) Total derivatives not designated ashedging instruments under FASB ASC 815 $ (318 ) $ (3,280 ) Total derivatives $ (318 ) $ (5,083 )
The following table shows the effect of derivative instruments on our Consolidated Statements of Income for the year ended December 31, 2006 are $9.42009 (in thousands):
Derivatives in FASB ASC 815 Cash Flow Hedging Relationship Amount of Gain or (Loss) Recognized in OCI on Derivative (Effective Portion) (in thousands) Location of Gain or (Loss) Reclassified from Accumulated OCI into Income (Effective Portion) Amount of Gain or (Loss) Reclassified from Accumulated OCI into Income (Effective Portion) (in thousands) Location of Gain or (Loss) Recognized in Income on Derivative (Ineffective Portion and Amount Excluded from Effectiveness Testing) Amount of Gain or (Loss) Recognized in Income on Derivative (Ineffective Portion and Amount Excluded from Effectiveness Testing) 2009 2009 2009 Foreign exchange contracts – forwards and options $ (6,304 ) Net sales $ 1,399 Net foreign exchange gain (loss) $ 1,132 Foreign exchange contracts – forwards and options 2,055 Cost of sales (74 ) Net foreign exchange gain (loss) (41 ) Foreign exchange contracts – forwards and options 1,427 Operating expenses 517 Net foreign exchange gain (loss) 81 Total $ (2,822 ) $ 1,842 $ 1,172
Derivatives not Designated as Hedging Instruments under FASB ASC 815 Location of Gain (Loss) Recognized in Income on Derivative Amount of Gain (Loss) Recognized in Income on Derivative 2009 Foreign exchange contracts – forwards Net foreign exchange gain/(loss) $ (1,669 ) Total $ (1,669 )
Note 5 – Inventories
Inventories, net consist of the following (in thousands):
December 31, 2009 2008 Raw materials $ 42,121 $ 48,004 Work-in-process 2,042 4,150 Finished goods 42,352 55,204 $ 86,515 $ 107,358
Note 6 – Property and equipment
Property and equipment consist of the following (in thousands):
December 31, 2009 2008 Land $ 17,076 $ 7,210 Buildings 138,367 136,802 Furniture and equipment 154,558 144,979 310,001 288,991 Accumulated depreciation (156,736 ) (134,514 ) $ 153,265 $ 154,477
Depreciation expense for the years ended December 31, 2009, 2008 and 2007, was $22.3 million, $20.9 million and $22.2 million, respectively.
Intangibles at December 31, 2009 and 2008 are as follows:
2009 2008 Gross Carrying Amount Accumulated Amortization Net Carrying Amount Gross Carrying Amount Accumulated Amortization Net Carrying Amount Capitalized software development costs $ 38,928 $ (20,455 ) $ 18,473 $ 25,610 $ (11,344 ) $ 14,266 Acquired technology 28,022 (20,967 ) 7,055 27,503 (16,804 ) 10,699 Patents 19,033 (5,377 ) 13,656 16,068 (4,506 ) 11,562 Other 12,577 (8,371 ) 4,206 11,401 (6,013 ) 5,388 $ 98,560 $ (55,170 ) $ 43,390 $ 80,582 $ (38,667 ) $ 41,915
Software development costs capitalized during 2009, 2008 and 2007 were $13.3 million, $9.5 million and $8.3 million, respectively, and related amortization was $9.1 million, $10.3 million and $8.9 million, respectively. Included in these capitalized costs for the years ended December 31, 2009, 2008, and 2007 were costs related to stock based compensation of $734,000, $451,000 and $422,000, respectively. Amortization of capitalized software development costs is computed on an individual product basis for those products available for market and is recognized based on the product’s estimated economic life, generally three years. Patents are amortized using the straight-line method over their estimated period of benefit, generally ten to seventeen years. Total intangible assets amortization expenses were $16.5 million, $16.2 million and $14.4 million for the years ended December 31, 2009, 2008 and 2007, respectively.
Capitalized software development costs, acquired technology, patents and other have weighted-average useful lives of 2.2 years, 1.8 years, 5.3 years, and 1.8 years, respectively, as of December 31, 2009. The estimated future amortization expense related to intangible assets as of December 31, 2009 is as follows:
Amount(in thousands) 2010 $ 18,097 2011 12,986 2012 7,187 2013 1,868 2014 1,186 Thereafter 2,066 $ 43,390
Acquisition intangibles are amortized over their useful lives, which range from three to eight years. Amortization expense for acquisition intangibles was approximately $3.9 million and $4.2 million for 2009 and 2008, respectively, of which approximately $3.4 million and $3.6 million was recorded in cost of sales and approximately $503,000 and $580,000 was recorded in operating expenses for 2009 and 2008, respectively. The estimated amortization expense of acquisition intangibles in future years will be recorded in our Consolidated Statements of Income as follows (in thousands):
Fiscal Year Cost of Sales Acquisition related costs and amortization, net Total 2010 $ 2,701 $ 369 $ 3,070 2011 2,160 221 2,381 2012 1,126 206 1,332 2013 87 75 162 Thereafter — — — Total $ 6,074 $ 871 $ 6,945
Note 8 – Goodwill
The carrying amount of goodwill for 2008 and 2009 are as follows:
Amount(in thousands) Balance as of December 31, 2007 $ 54,111 Acquisitions/purchase accounting adjustments 10,818 Divestitures — Foreign currency translation impact (368 ) Balance as of December 31, 2008 $ 64,561 Acquisitions/purchase accounting adjustments — Divestitures — Foreign currency translation impact 218 Balance as of December 31, 2009 $ 64,779
The excess purchase price over the fair value of assets acquired is recorded as goodwill. As we have one operating segment, we allocate goodwill to one reporting unit for goodwill impairment testing. In accordance with FASB ASC 350, goodwill is tested for impairment on an annual basis, and between annual tests if indicators of potential impairment exist, using a fair-value-based approach based on the market capitalization of the reporting unit. Our annual impairment test was performed as of February 28, 2009. No impairment of goodwill has been identified during the period presented. Goodwill is deductible for tax purposes in certain jurisdictions.
The components of income before income taxes are as follows (in thousands):
Years Ended December 31, 2009 2008 2007 Domestic $ 34,953 $ 15,921 $ 31,685 Foreign 15,292 82,216 81,742 $ 50,245 $ 98,137 $ 113,427
The provision for income taxes charged to operations is as follows (in thousands):
Years Ended December 31, 2009 2008 2007 Current tax expense: U.S. federal $ 3,117 $ 14,631 $ 15,957 State 136 1,391 1,155 Foreign 13,760 18,910 9,925 Total current 17,013 34,932 27,037 Deferred tax expense (benefit): U.S. federal 9,920 (11,008 ) 628 State 387 (373 ) (156 ) Foreign (2,864 ) (1,570 ) (2,783 ) Total deferred 7,443 (12,951 ) (2,311 ) Change in valuation allowance 8,704 (8,671 ) (18,332 ) Total provision $ 33,160 $ 13,310 $ 6,394
Deferred tax liabilities (assets) at December 31, 2009 and 2008 as follows (in thousands):
December 31, 2009 2008 Capitalized software $ 5,978 $ 4,615 Depreciation and amortization 10,577 9,536 Unrealized gain on derivative instruments — 4,153 Undistributed earnings of foreign subsidiaries 9,278 10,075 Gross deferred tax liabilities 25,833 28,379 Operating loss carryforwards (57,422 ) (43,360 ) Intangible assets (44,159 ) (58,987 ) Vacation and other accruals (3,700 ) (4,890 ) Inventory valuation and warranty provisions (6,702 ) (12,665 ) Doubtful accounts and sales provisions (1,088 ) (1,512 ) Unrealized exchange loss (917 ) (1,345 ) Deferred revenue . (853 ) (71 ) Accrued rent expenses (111 ) (117 ) Accrued legal expenses (710 ) (1,466 ) Unrealized loss on derivative instruments (242 ) — 10% minority stock investment (900 ) (920 ) Stock-based compensation (4,483 ) (5,353 ) Research and development tax credit carryforward (2,054 ) — Foreign tax credit carryforward (1,775 ) — Other (657 ) (783 ) Gross deferred tax assets (125,773 ) (131,469 ) Valuation allowance 99,862 85,815 Net deferred tax liability (asset) $ (78 ) $ (17,275 )
A reconciliation of income taxes at the U.S. federal statutory income tax rate to the effective tax rate follows:
Years Ended December 31, 2009 2008 2007 U.S. federal statutory tax rate 35 % 35 % 35 % Domestic production activities — — (1 ) Foreign taxes (less) than federal statutory rate (6 ) (9 ) (14 ) Change in valuation allowance 17 (9 ) (16 ) Research and development tax credit (4 ) (2 ) (1 ) Tax exempt interest — (1 ) (1 ) State income taxes, net of federal tax benefit 1 1 1 Employee share-based compensation 7 2 2 Intercompany profit 15 (5 ) — Other 1 2 1 Effective tax rate 66 % 14 % 6 %
Certain prior year amounts in the reconciliation of income taxes at the U.S. federal statutory income tax rate to the effective tax rate have been reclassified to conform to the 2009 presentation as shown in the following tables:
2008 foreign taxes (less) than federal statutory rate as reported in prior year Form 10-K (14 ) Reclassification (a) 5 2008 foreign taxes (less) than federal statutory rate as reported in current year Form 10-K (9 ) 2008 intercompany profit as reported in prior year Form 10-K — Reclassification (a) (5 ) 2008 intercompany profit as reported in current year Form 10-K (5 )
(a) These amounts represent income taxes on intercompany profit previously included in foreign taxes (less) than the federal statutory rate and reclassified to intercompany profit for comparability to corresponding amounts reported in 2009. The reclassification did not have any impact on our total income tax expense.
For the year ended December 31, 2009, we generated a federal net operating loss of approximately $3.3 million and tax credits of approximately $3.8 million. The federal net operating loss can be carried back two years and the federal tax credits can be carried back one year.
As of December 31, 2009, eleven of our subsidiaries have available, for income tax purposes, foreign net operating loss carryforwards of an aggregate of approximately $286 million, of which $12.1 million expire during the years 2011 - - 2018 and $273.9 million of which may be carried forward indefinitely. Our tax valuation allowance relates to our ability to realize certain of these foreign net operating loss carryforwards and benefits of tax deductible goodwill in excess of book goodwill.
We maintain a manufacturing facility in Hungary. As a result of certain foreign investment incentives available under Hungarian law, the profit from our Hungarian operation was subject to a reduced income tax rate. This special tax status terminated on January 1, 2008, with the merger of our Hungary manufacturing operations with its Hungarian parent company. The merger was effective on January 1, 2008. The aggregate tax benefit of the exemption was $8.7 million lower, respectively, than if we had continued to account for share-based compensation under APB 25. Basic and diluted earnings per share for the year ended December 31, 2006 are $0.112007.
In 2003, we restructured the organization of our manufacturing operation in Hungary. The tax deductible goodwill in excess of book goodwill created by this restructuring resulted in our being required to record a gross deferred tax asset of $91.0 million. Because we did not expect to have sufficient taxable income in the relevant jurisdiction in future periods to realize the benefit of this deferred tax asset, a full valuation allowance was established. Following the approval of the merger of our Hungarian manufacturing operation with its Hungarian parent company in December 2007, we released $8.7 million and $0.11 lower,$18.3 million in 2008 and 2007, respectively, than if we had continued to account for share-based compensation under APB 25. Deferred stock-based compensation balancesof the valuation allowance previously required under APB 25 were adjusted against previously recorded common stock and additional paid-in capital balances upon adoption of SFAS 123R, as required. Had we previously recognized compensation costs as prescribed by SFAS 123, previously reported net income, basic earnings per share and diluted earnings per share would have changed to the pro forma amounts shown below (in thousands, except per share amounts):
Years Ended December 31,
2005
2004
Net income, as reported $ 61,517 $ 48,610 Stock-based compensation included in reported net income, net of related tax effects 959 — Total stock-based compensation expense determined under fair value method for all awards, net of related tax effects (13,998 ) (12,741 )
Pro-forma net income $ 48,478 $ 35,869
Earnings per share: Basic - as reported $ 0.78 $ 0.62 Basic - pro-forma $ 0.62 $ 0.46 Diluted - as reported $ 0.76 $ 0.59 Diluted - pro-forma $ 0.60 $ 0.44
Pro-forma disclosuresestablished for the excess tax deductible goodwill to reflect the tax benefit we expected to realize in future periods.
For the year 2009, we expected to recognize an additional tax benefit of $9.7 million related to these assets. Effective January 1, 2010, a new tax law in Hungary provides for an enhanced deduction for the qualified research and development expenses of NI Hungary Software and Hardware Manufacturing Kft. ("NI Hungary"). During the three months ended December 31, 2006 are2009, we obtained confirmation of the application of this new tax law for the qualified research and development expenses of NI Hungary. Based on the application of this new tax law to the qualified research and development expense of NI Hungary, we no longer expect to have sufficient future taxable income in Hungary to realize the benefits of these tax assets. As such, we recorded an income tax charge of $21.6 million during the three months ended December 31, 2009, $18.4 million of which was related to a valuation allowance on the previously recognized assets created by the restructuring and $3.2 million of which was related to tax benefits from other assets that we will no longer be able to realize as a result of this change. We do not presented becauseexpect to realize the amounts aretax benefit of the remaining assets created by the restructuring and therefore we have a full valuation allowance of $98.2 million against those assets at December 31, 2009.
We have not provided for U.S. federal income and foreign withholding taxes on approximately $267.5 million of certain non-U.S. subsidiaries’ undistributed earnings as of December 31, 2009. These earnings would become subject to taxes of approximately $85.7 million, if they were actually or deemed to be remitted to the parent company as dividends or if we should sell our stock in these subsidiaries. We intend to permanently reinvest the undistributed earnings.
We adopted the provisions of FASB ASC 740, on January 1, 2007. FASB ASC 740 clarifies the accounting for uncertainty in income taxes recognized in an entity's financial statements and prescribes a recognition threshold and measurement attribute for financial statement disclosure of tax positions taken or expected to be taken on a tax return. We recognized no material adjustment to the Consolidated Statementsliability for unrecognized income tax benefits. A reconciliation of Income.the beginning and ending amount of unrecognized tax benefit is as follows (in thousands):
2009 2008 Balance at beginning of period $ 9,364 $ 8,273 Additions based on tax positions related to the current year 2,060 1,946 Additions for tax positions of prior years 1,272 366 Reductions as a result of the lapse of the applicable statute of limitations (1,634 ) (1,221 ) Balance at end of period $ 11,062 $ 9,364
All of our unrecognized tax benefits at December 31, 2009 would affect our effective income tax rate if recognized. As of December 31, 2009, it is deemed reasonably possible that the Company will recognize tax benefits in the amount of $2.3 million in the next twelve months due to the closing of open tax years. The nature of the uncertainty relates to deductions taken on returns that have not been examined by the applicable tax authority.
We recognize interest and penalties related to income tax matters in income tax expense. During the years ended December 31, 2009 and 2008, we recognized interest expense related to uncertain tax positions of approximately $506,000 and $365,000, respectively. The tax years 2002 through 2009 remain open to examination by the major taxing jurisdictions in which we file income tax returns.
Note 10 – Stockholders’ equity and stock-based compensation
Stock option plans
Our stockholders approved the 1994 Incentive Stock Option Plan (the “1994 Plan”) on May 9, 1994. At the time of approval, 9,112,500 shares of our common stock were reserved for issuance under this plan. In 1997, an additional 7,087,500 shares of our common stock were reserved for issuance under this plan, and an additional 750,000 shares were reserved for issuance under this plan, as amended, in 2004. The 1994 Plan terminated in May 2005, except with respect to outstanding awards previously granted thereunder. Awards under the plan were either incentive stock options within the meaning of Section 422 of the Internal Revenue Code or nonqualified options. The right to purchase shares vests over a five to ten-year period, beginning on the date of grant. Vesting of ten year awards may accelerate based on the Company’s previous year’s earnings and revenue growth but shares cannot accelerate to vest over a period of less than five years. Stock options must be exercised within ten years from date of grant. Stock options were issued at the market price at the grant date. As part of the requirements of SFAS 123R, the Company isFASB ASC 718, we are required to estimate potential forfeitures of stock grants and adjust compensation cost recorded accordingly. The estimate of forfeitures will be adjusted over the requisite service period to the extent that actual forfeitures differ, or are expected to differ, from such estimates. Changes in estimated forfeitures will be recognized through a cumulative catch-up adjustment in the period of change and will also impact the amount of stock compensation expense to be recognized in future periods.
Transactions under all stock option plans are summarized as follows:Number of
shares under
option
Weighted
average
exercise
price
Outstanding at December 31, 2003 9,726,418 $ 18.07 Exercised (882,539 ) 9.60 Canceled (325,912 ) 27.66 Granted 1,262,599 29.71
Outstanding at December 31, 2004 9,780,566 $ 20.02 Exercised (1,188,614 ) 10.72 Canceled (358,444 ) 29.49 Granted 244,725 24.24
Outstanding at December 31, 2005 8,478,233 $ 21.05 Exercised (1,398,617 ) 13.16 Canceled (164,943 ) 27.32 Granted 0 0
Outstanding at December 31, 2006 6,914,673 $ 22.49
Options exercisable at December 31: 2004 6,353,236 $ 17.23 2005 5,946,139 19.10 2006 5,384,470 21.53
Number of
shares under
option
Weighted
average
fair value
Weighted average, grant date fair value of options granted during: 2004 1,262,599 $ 16.72 2005 244,725 12.85 2006 0 0
Number ofshares underoption Weightedaverageexerciseprice Outstanding at December 31, 2006 6,914,673 $ 22.49 Exercised (1,515,107 ) 15.22 Canceled (104,925 ) 27.33 Granted — — Outstanding at December 31, 2007 5,294,641 $ 24.47 Exercised (925,743 ) 17.30 Canceled (96,331 ) 26.98 Granted — — Outstanding at December 31, 2008 4,272,567 $ 25.97 Exercised (379,630 ) 15.40 Canceled (181,434 ) 26.80 Granted — — Outstanding at December 31, 2009 3,711,503 $ 26.93 Options exercisable at December 31: 2007 4,368,972 $ 24.17 2008 3,812,334 26.00 2009 3,493,574 26.94
The aggregate intrinsic value of stock options at exercise, represented in the table above, was $25.5$2.3 million, $19.1$11.0 million and $18.3$22.3 million for the years ended December 31, 2006, 20052009, 2008 and 2004,2007, respectively. Total unrecognized stock-based compensation expense related to non-vested stock options was approximately $18.1$2.5 million as of the end of 2006,December 31, 2009, related to approximately 1,530,000218,000 shares with a per share weighted average fair value of $15.93.$17.50. We anticipate this expense to be recognized over a weighted average period of approximately 4.04.3 years.Outstanding and Exercisable by Price Range
As of December 31, 2006
Options Outstanding
Options Exercisable
Range of Exercise prices
Number
outstanding
as of
12/31/2006
Weighted
average
remaining
contractual life
Weighted
average
exercise
price
Number
exercisable
as of
12/31/2006
Weighted
average
exercise price
$8.6667 -$12.2222 1,072,535 1.27 $ 10.98 1,045,669 $ 10.9677 12.3611 - 15.3055 976,976 1.54 $ 15.23 967,192 $ 15.2258 15.5555 - 21.0417 1,720,096 5.18 $ 20.64 1,223,332 $ 20.6330 21.2533 - 29.5400 839,349 6.80 $ 25.53 538,372 $ 25.5261 29.8500 - 34.3750 2,305,717 5.60 $ 31.19 1,609,905 $ 31.5078
$8.6667 - $34.3750 6,914,673 3.94 $ 22.4883 5,384,470 $ 21.5254
Outstanding and Exercisable by Price Range as of December 31, 2009 Options Outstanding Options Exercisable Range of Exercise prices Number outstanding as of 12/31/2009 Weighted average remaining contractual life Weighted average exercise price Number exercisable as of 12/31/2009 Weighted average exercise price $16.08 – $21.95 1,238,441 1.74 $ 20.69 1,188,337 $ 20.71 $22.30 – $29.85 1,257,625 3.90 $ 28.15 1,098,218 $ 28.08 $30.51 – $34.38 1,215,437 0.41 $ 32.02 1,207,019 $ 32.02 $16.08 – $34.38 3,711,503 2.04 $ 26.93 3,493,574 $ 26.94
The weighted average remaining contractual life of options exercisable as of December 31, 20062009 was 3.371.9 years. The aggregate intrinsic value of options outstanding as of December 31, 20062009 was $32.9$9.4 million. The aggregate intrinsic value of options currently exercisable as of December 31, 20062009 was $30.8$8.8 million. No options were granted in the yearyears ended December 31, 20062009, 2008 and 2007 as our incentive option plan terminated in May 2005. The fair value of options granted in 2004 and 2005 were estimated on the date of grant using the Black-Scholes option-pricing model with the following weighted-average assumptions:2005
2004
Dividend expense yield 0.2% 0.2% Expected life 5.5 years 5.5 years Expected volatility 43.3% 53.2% Risk-free interest rate 4.0% 2.7%
Restricted stock plan
Our stockholders approved theour 2005 Incentive Plan on May 10, 2005. At the time of approval, 2,700,000 shares of our common stock were reserved for issuance under this plan, as well as the number of shares which had been reserved but not issued under the 1994 Plan (our incentive stock option plan which terminated in May 2005), and any shares that returned to the 1994 Plan as a result of termination of options or repurchase of shares issued under such plan. The 2005 Plan, administered by the Compensation Committee of the Board of Directors, provides for granting of incentive awards in the form of restricted stock and restricted stock units (“RSUs”) to directors, executive officers and employees of the Company and its subsidiaries. Awards vest over a three, five or ten-year period, beginning on the date of grant. Vesting of ten year awards may accelerate based on the Company’s previous year’s earnings and growth but ten year awards cannot accelerate to vest over a period of less than five years. Shares available for grant at December 31, 20062009 were 3,804,106.2,089,302. As part of the requirements of SFAS 123R, the Company isFASB ASC 718, we are required to estimate potential forfeitures of restricted stock unitsRSUs and adjust compensation cost recorded accordingly. The estimate of forfeitures will be adjusted over the requisite service period to the extent that actual forfeitures differ, or are expected to differ, from such estimates. Changes in estimated forfeitures will be recognized through a cumulative catch-up adjustment in the period of change and will also impact the amount of stock compensation expense to be recognized in future periods.
Transactions under the restricted stock plan2005 Plan are summarized as follows:RSUs
Number of RSUs
Weighted Average Grant Price
Balance at January 1, 2005 0 $ 0.00 Granted 813,305 $ 22.24 Earned 0 $ 0.00 Canceled (15,000 ) $ 22.12
Balance at December 31, 2005 798,305 $ 22.24 Granted 693,805 $ 32.21 Earned (113,794 ) $ 31.67 Canceled (53,383 ) $ 25.93
Balance at December 31, 2006 1,324,933 $ 26.77
RSUs Number of RSUs Weighted Average Grant Price Balance at January 1, 2007 1,324,933 $ 26.77 Granted 801,780 $ 27.90 Earned (209,303 ) $ 27.85 Canceled (75,776 ) $ 27.64 Balance at December 31, 2007 1,841,634 $ 26.86 Granted 763,182 $ 28.51 Earned (320,251 ) $ 29.42 Canceled (119,337 ) $ 28.19 Balance at December 31, 2008 2,165,228 $ 26.99 Granted 604,083 $ 21.80 Earned (407,156 ) $ 22.04 Canceled (57,721 ) $ 27.88 Balance at December 31, 2009 2,304,434 $ 26.48
Total unrecognized stock-based compensation expense related to non-vested restricted stock unitsRSU’s was approximately $32.6$57.1 million as of the end of 2006,December 31, 2009, related to 1,324,9332,304,434 shares with a per share weighted average fair value of $27.24.$26.48. We anticipate this expense to be recognized over a weighted average period of approximately 77.3 years.
Employee stock purchase plan
Our employee stock purchase plan permits substantially all domestic employees and employees of designated subsidiaries to acquire our common stock at a purchase price of 85% of the lower of the market price at the beginning or the end of the participationpurchase period. On December 21, 2005, our Compensation Committee amended theThe plan has quarterly purchase periods to be quarterly beginning on November 1, February 1, May 1, and AugustNovember 1 of each year. The initial period commencedAt our annual shareholders meeting held on April 1, 2006 and ended on July 31, 2006.May 7, 2007, our shareholders approved an additional 3 million shares of common stock to be reserved for issuance under this plan. Employees may designate up to 15% of their compensation for the purchase of common stock.stock under this plan. Common stock reserved for future employee purchases aggregated 823,3091,755,071 shares at December 31, 2006.2009. Shares issued under this plan were 539,541838,536 in the year ended December 31, 2006.2009. The weighted average fair value of the employees’ purchase rights was $22.34$19.05 per share and was estimated using the Black-Scholes model with the following assumptions:2006
2005
2004
Dividend expense yield 0.2% 0.2% 0.2% Expected life 3 months 6 months 6 months Expected volatility 29% 29% 35% Risk-free interest rate 4.5% 3.2% 1.0%
2009 2008 2007 Dividend expense yield 0.5% 0.3% 0.3% Expected life 3 months 3 months 3 months Expected volatility 45% 26% 23% Risk-free interest rate 0.8% 3.8% 5.0%
Weighted average, grant date fair value of purchase rights granted under the Employee Stock Purchase Plan:Number of shares
Weighted average fair value
2004 380,211 $ 7.73 2005 467,932 6.08 2006 539,541 6.62
Plan are as follows:
Numberof shares Weightedaveragefair value 2007 549,719 $ 6.19 2008 679,983 5.86 2009 838,536 5.75
Stock-based compensation included in total cost of sales and operating expenses for the years ended December 31, 2009, 2008 and 2007 are summarized as follows (in thousands):
2009 2008 2007 Stock-based compensation Total cost of sales $ 1,284 $ 1,063 $ 911 Sales and marketing 8,774 8,479 7,322 Research and development 7,236 7,121 6,435 General and administrative 3,005 3,084 2,866 Provision for income taxes (3,765 ) (4,601 ) (3,839 ) Total $ 16,534 $ 15,146 $ 13,695
Authorized Preferred Stock and Preferred Stock Purchase Rights Plan
We have 5,000,000 authorized shares of preferred stock. On January 21, 2004, our Board of Directors designated 750,000 of these shares as Series A Participating Preferred Stock in conjunction with its adoption of a Preferred Stock Rights Agreement (the “Rights Agreement”) and declaration of a dividend of one preferred share purchase right (a “Right”) for each share of common stock outstanding held as of May 10, 2004 or issued thereafter. Each Right will entitle its holder to purchase one one-thousandth of a share of National Instruments’ Series A Participating Preferred Stock at an exercise price of $200, subject to adjustment, under certain circumstances. The Rights Agreement was not adopted in response to any effort to acquire control of National Instruments.
The Rights only become exercisable in certain limited circumstances following the tenth day after a person or group announces acquisitions of or tender offers for 20% or more of our common stock. In addition, if an acquirer (subject to certain exclusions for certain current stockholders of National Instruments, an “Acquiring Person”) obtains 20% or more of our common stock, then each Right (other than the Rights owned by an Acquiring Person or its affiliates) will entitle the holder to purchase, for the exercise price, shares of our common stock having a value equal to two times the exercise price. Under certain circumstances, our Board of Directors may redeem the Rights, in whole, but not in part, at a purchase price of $0.01 per Right. The Rights have no voting privileges and are attached to and automatically traded with our common stock until the occurrence of specified trigger events. The Rights will expire on the earlier of May 10, 2014 or the exchange or redemption of the Rights. Comprehensive income
Our comprehensive income is comprised of net income, foreign currency translation and unrealized gains and losses on forward and option contracts and securities available for sale. Comprehensive income for 2006, 2005 and 2004 was $76.9 million, $57.2 million and $57.7 million, respectively.
Recently issued accounting pronouncements
In July 2006, the Financial Accounting Standards Board (“FASB”) issued FASB Interpretation (“FIN”) 48,Accounting for Uncertainty in Income Taxes – an interpretation of Statement of Financial Accounting Standards (“SFAS”) 109. This interpretation clarifies the accounting for uncertainty in income taxes recognized in an entity’s financial statements in accordance with SFAS 109,Accounting for Income Taxes. It prescribes a recognition threshold and measurement attribute for financial statement disclosure of tax positions taken or expected to be taken on a tax return. This interpretation is effective for fiscal years beginning after December 15, 2006. We adopted FIN 48 on January 1, 2007 as required. The cumulative effect of adopting FIN 48 was recorded in retained earnings upon adoption. The adoption of FIN 48 did not have a significant impact on our financial position or results of operations.
In September 2006, the Securities and Exchange Commission (“SEC”) issued Staff Accounting Bulletin (“SAB”) 108 regarding the process of quantifying financial statement misstatements. SAB 108 states that registrants should use both a balance sheet approach and an income statement approach when quantifying and evaluating the materiality of a misstatement. The interpretations in SAB 108 contain guidance on correcting errors under the dual approach as well as provide transition guidance for correcting errors. This interpretation does not change the requirements within SFAS 154,Accounting Changes and Error Corrections – a replacement of APB 20 and FASB Statement 3, for the correction of an error on financial statements. SAB 108 is effective for annual financial statements covering the first fiscal year ending after November 15, 2006. We adopted this interpretation on December 31, 2006. The adoption of SAB 108 did not have a significant effect on our consolidated financial statements.
In September 2006, the FASB issued SFAS 157,Fair Value Measurements. This standard defines fair value, establishes a framework for measuring fair value in accounting principles generally accepted in the United States of America, and expands disclosure about fair value measurements. This pronouncement applies under other accounting standards that require or permit fair value measurements. Accordingly, this statement does not require any new fair value measurement. This statement is effective for fiscal years beginning after November 15, 2007, and interim periods within those fiscal years. We will be required to adopt SFAS 157 in the first quarter of fiscal year 2008. We are currently evaluating the requirements of SFAS 157 and have not yet determined the impact on our consolidated financial statements.
In March 2006, the Emerging Issues Task Force (“EITF”) reached a consensus on EITF Issue 06-3,How Taxes Collected from Customers and Remitted to Governmental Authorities Should Be Presented in the Income Statement (that is, Gross versus Net Presentation). Taxes within the scope of EITF Issue 06-3 include any taxes assessed by a governmental authority that are directly imposed on a revenue-producing transaction between a seller and a customer and may include, but are not limited to, sales taxes, use taxes, value-added taxes, and some excise taxes. The EITF concluded that the presentation of these taxes on either a gross (included in revenues and costs) or a net (excluded from revenue) basis is an accounting policy decision that should be disclosed. For any such taxes that are reported on a gross basis, a company should disclose the amounts of those taxes in interim and annual financial statements. Our policy is to exclude all such taxes from revenue. The provisions of EITF 06-3 are effective for interim and annual reporting periods beginning after December 15, 2006. The adoption of EITF 06-3 will not have any effect on our consolidated financial statements.
Note 2: Short-term investments
Short-term investments at December 31, 2006 and 2005, consisting of corporate, state and municipal securities, were acquired at an aggregate cost of $150.2 million and $119.8 million, respectively. The contractual maturities of these securities, which are classified as available-for-sale and carried at fair value, are as follows (in thousands):
December 31,
2006
2005
Less than 90 days $ 73,787 $ 61,855 90 days to one year 31,309 42,222 One year through two years 38,559 11,877 Two years or more 6,535 3,892
$ 150,190 $ 119,846
Note 3: Inventories
Inventories, net consist of the following (in thousands):
December 31,
2006
2005
Raw materials $ 38,270 $ 28,497 Work-in-process 4,321 4,634 Finished goods 34,547 29,696
$ 77,138 $ 62,827
Note 4: Property and equipment
Property and equipment consist of the following (in thousands):
December 31,
2006
2005
Land $ 7,165 $ 7,085 Buildings 125,228 124,428 Furniture and equipment 110,710 91,073
243,103 222,586 Accumulated depreciation (97,678 ) (78,256 )
$ 145,425 $ 144,330
Depreciation expense for the years ended December 31, 2006, 2005 and 2004, was $20.2 million, $17.8 million and $17.3 million, respectively.
Note 5: Intangibles
Intangibles at December 31, 2006 and 2005 are as follows:
2006
2005
Gross Carrying Amount
Accumulated Amortization
Net Carrying Amount
Gross Carrying Amount
Accumulated Amortization
Net Carrying Amount
Capitalized software development costs $ 57,571 $ (41,791 ) $ 15,780 $ 50,201 $ (32,651 ) $ 17,550 Acquired technology 20,814 (9,734 ) 11,080 20,257 (6,296 ) 13,961 Patents 12,928 (3,076 ) 9,852 11,647 (2,445 ) 9,202 Other 6,452 (3,099 ) 3,353 4,826 (1,937 ) 2,889
$ 97,765 $ (57,700 ) $ 40,065 $ 86,931 $ (43,329 ) $ 43,602
Software development costs capitalized during 2006, 2005 and 2004 were $7.4 million, $13.4 million and $5.0 million, respectively, and related amortization was $9.1 million, $7.2 million and $6.6 million, respectively. Amortization of capitalized software development costs is computed on an individual product basis for those products available for market and is recognized based on the product’s estimated economic life, generally three years. Patents are amortized using the straight-line method over their estimated period of benefit, generally ten to seventeen years. Total intangible assets amortization expenses were $13.9 million, $10.7 million and $8.3 million for the years ended December 31, 2006, 2005 and 2004, respectively.
Capitalized software development costs, acquired technology, patents and other have weighted-average useful lives of 2.1 years, 4.1 years, 7.7 years and 3.7 years, respectively, as of the end of December 31, 2006. The estimated future amortization expense related to intangible assets as of December 31, 2006 is as follows:
Amount (in thousands)
2007 $ 13,044 2008 10,219 2009 5,046 2010 2,477 2011 1,569 Thereafter 7,710
$ 40,065
We established a valuation reserve in 2004 for the estimated total impairment of our $2.5 million cost-method investment in a start-up company. This impairment was based on our lack of expected recovery of our investment based on the start-up company’s lack of profitability.
Note 6: Goodwill
The carrying amount of goodwill for 2005 and 2006 are as follows:
Amount (in thousands)
Balance as of December 31, 2004 $ 13,356 Acquisitions/purchase accounting adjustments 39,177 Divestitures —
Balance as of December 31, 2005 52,533 Acquisitions/purchase accounting adjustments — Divestitures — Foreign currency translation impact 810
Balance as of December 31, 2006 $ 53,343
The excess purchase price over the fair value of assets acquired is recorded as goodwill. In accordance with SFAS 142,Goodwill and Other Intangible Assets, goodwill is tested for impairment on an annual basis, and between annual tests if indicators of potential impairment exist, using a fair-value-based approach. Our annual impairment test was performed on April 6, 2006. No impairment of goodwill was identified during any of the periods presented.
Note 7: Income taxes
The components of income before income taxes are as follows (in thousands):
Years Ended December 31,
2006
2005
2004
Domestic $ 40,681 $ 40,460 $ 37,786 Foreign 54,621 40,220 27,027
$ 95,302 $ 80,680 $ 64,813
The provision for income taxes charged to operations is as follows (in thousands):
Years Ended December 31,
2006
2005
2004
Current tax expense: U.S. federal $ 17,966 $ 11,022 $ 10,594 State 901 1,029 1,106 Foreign 5,190 3,725 3,300
Total current 24,057 15,776 15,000
Deferred tax expense (benefit): U.S. federal (1,233 ) 2,396 1,041 State (90 ) (102 ) 121 Foreign (140 ) 1,093 41
Total deferred (1,463 ) 3,387 1,203
Total provision $ 22,594 $ 19,163 $ 16,203
Deferred tax liabilities (assets) at December 31, 2006 and 2005 as follows (in thousands):
December 31,
2006
2005
Capitalized software $ 5,392 $ 6,288 Unrealized gain on derivative instruments — 86 Depreciation and amortization 9,071 8,598 Unrealized exchange gain 2 1,238 Undistributed earnings of foreign subsidiaries 10,313 4,410
Gross deferred tax liabilities 24,778 20,620
Operating loss carryforwards (34,154 ) (22,672 ) Intangibles (85,684 ) (71,125 ) Vacation and other accruals (3,783 ) (2,946 ) Inventory valuation and warranty provisions (6,666 ) (9,043 ) Doubtful accounts and sales provisions (1,328 ) (1,545 ) Intercompany profit (3,242 ) (2,442 ) Deferred revenue (2,613 ) — Accrued rent expenses (17 ) (17 ) Accrued legal expenses (1,450 ) (12 ) Unrealized loss on derivative instruments (149 ) — 10% minority stock investment (906 ) (911 ) Stock-based compensation (1,954 ) (563 ) Other (691 ) (629 )
Gross deferred tax assets (142,637 ) (111,905 )
Valuation allowance 117,768 91,534
Net deferred tax liability (asset) $ (91 ) $ 249
A reconciliation of income taxes at the U.S. federal statutory income tax rate to the effective tax rate follows:
Years Ended December 31,
2006
2005
2004
U.S. federal statutory tax rate 35 % 35 % 35 % Foreign sales corporation/ETI benefit (1 ) (2 ) (3 ) Domestic production activities (1 ) (1 ) — Foreign taxes more (less) than federal statutory rate (11 ) (7 ) (6 ) Change in valuation allowance — (1 ) — Research and development tax credit (1 ) (1 ) (1 ) Tax exempt interest (1 ) (1 ) (1 ) State income taxes, net of federal tax benefit 1 1 1 Employee share-based compensation 3 — — Other — 1 —
Effective tax rate 24 % 24 % 25 %
As of December 31, 2006, thirteen of our subsidiaries have available, for income tax purposes, foreign net operating loss carryforwards of an aggregate of approximately $214.4 million, of which $8.5 million expire during the years 2008 — 2013 and $205.9 million of which may be carried forward indefinitely. Our tax valuation allowance relates to the realizability of certain of these foreign net operating loss carryforwards and benefits of tax deductible goodwill in excess of book goodwill.
We maintain a manufacturing facility in Hungary. As a result of certain foreign investment incentives available under Hungarian law, the profit from our Hungarian operation is currently subject to a reduced income tax rate. Based on our capital investment in Hungary and current exemption limits which apply to this and any capital investments made through December 31, 2005, we currently expect this special tax status will terminate on or before December 31, 2008. The aggregate tax benefit of the exemption was $5.4 million and $3.4 million for the years ended December 31, 2006 and 2005, respectively.
In 2003, we restructured the organization of our manufacturing operation in Hungary. The tax deductible goodwill in excess of book goodwill created by this restructuring resulted in our being required to record a gross deferred tax asset of $91.0 million. The amortization of this excess tax deductible goodwill resulted in a $32.1 million and $20.1 million deferred tax asset for the associated net operating loss for the years ended December 31, 2006 and 2005, respectively. As of December 31, 2006 and 2005, the gross deferred tax asset related to the excess tax goodwill was $85.7 million and $71.1 million, respectively. Because we do not expect to have significant taxable income in the relevant jurisdiction in future periods to realize the benefit of these deferred tax assets, a valuation allowance for the entire amount of these deferred tax assets has been established.
We have not provided for U.S. federal income and foreign withholding taxes on approximately $111.8 million of certain non-U.S. subsidiaries’ undistributed earnings as of December 31, 2006. These earnings would become subject to taxes of approximately $36.5 million, if they were actually or deemed to be remitted to the parent company as dividends or if we should sell our stock in these subsidiaries. We currently intend to reinvest indefinitely these undistributed earnings.
Note 8: Stockholders’ equity
Stock repurchases and retirements In
Since 1998, our Board of Directors approved theand we maintained various stock repurchase and retirement of shares of common stock to reduce the dilutive effect of our stock plans.programs. Pursuant to the 1998 repurchase programthese plans we have repurchasedhad purchased and retired a total of 1,402,7257,354,966 shares for approximately $23.1$184.9 million from 1998 through December 31, 2007. During 2008, we purchased an additional 4,110,042 share for approximately $103.6 million. In 2002,At December 31, 2008, there were 723,092 shares available for repurchase under the plan approved in April 2008. On January 23, 2009, our Board of Directors approved a new share repurchase and retirement plan which replacedthat increased the 1998 plan. Underaggregate number of shares of common stock we are authorized to purchase from 591,324 to 3.0 million. During 2009, we purchased an additional 1,443,441 shares for approximately $34.6 million. At December 31, 2009, there were 1,688,327 shares available for repurchase under the plan approved in 2002, weJanuary 2009. Our share repurchase plan does not have authorization to repurchase up to 6,222,106 shares of National Instruments stock. This plan has noan expiration date. Pursuant to our repurchase program, we have repurchased and retired a total of 3,222,106 shares for approximately $82.0 million.
Note 9:11 – Employee retirement plan
We have a defined contribution retirement plan pursuant to Section 401(k) of the Internal Revenue Code. Substantially all domestic employees with at least thirty30 days of continuous service are eligible to participate and may contribute up to 15% of their compensation. The Board of Directors has elected to make matching contributions equal to 50% of employee contributions, which may be applied to a maximum of 6% of each participant’s compensation. Employees are eligible for our matching contributions after one year of continuous service. Company contributions vest immediately. Our policy prohibits participants from direct investment in shares of our common stock within the plan. Company contributions charged to expense were $3.0$3.9 million, $2.6$3.7 million and $2.4$3.3 million in 2006, 20052009, 2008 and 2004,2007, respectively.
Fair value of financial instrumentsIn accordance with FASB ASC 280, Segment Reporting (FASB ASC 280), we determine operating segments using the management approach. The estimated fair value amounts disclosed below have been determined using available market informationmanagement approach designates the internal organization that is used by management for making operating decisions and valuation methodologies described below. For certainassessing performance as the source of our financial instruments, including cashoperating segments. It also requires disclosures about products and cash equivalents, accounts receivable, accounts payableservices, geographic areas and accrued liabilities,major customers.
We have defined our operating segment based on geographic regions. We sell our products in three geographic regions. Our sales to these regions share similar economic characteristics, similar product mix, similar customers, and similar distribution methods. Accordingly, we have elected to aggregate these three geographic regions into a single operating segment. Revenue from the carrying amount approximates fair value due to the short-term maturity of these instruments. The estimated fair values of the other assets (liabilities)sale of our remaining financial instruments at December 31, 2006products which are similar in nature and 2005software maintenance are reflected as total net sales in our Consolidated Statements of Income.
Total net sales, operating income, interest income and long-lived assets, classified by the major geographic areas in which we operate, are as follows (in thousands):December 31,
2006
2005
Carrying
Amount
Fair
Value
Carrying
Amount
Fair
Value
Short-term investments $ 150,190 $ 150,190 $ 119,846 $ 119,846 Other assets/liabilities: Forward contracts (1,043 ) (1,043 ) 523 523
The fair values of short-term investments
Years Ended December 31, 2009 2008 2007 Net sales: Americas: Unaffiliated customer sales $ 292,999 $ 355,878 $ 331,482 Geographic transfers 86,145 132,563 115,709 379,144 488,441 447,191 Europe: Unaffiliated customer sales 210,188 267,373 230,940 Geographic transfers 189,076 204,282 159,992 399,264 471,655 390,932 Asia Pacific: Unaffiliated customer sales 173,407 197,286 177,956 Eliminations (275,221 ) (336,845 ) (275,701 ) $ 676,594 $ 820,537 $ 740,378
Years Ended December 31, 2009 2008 2007 Operating income: Americas $ 46,816 $ 71,467 $ 76,292 Europe 87,250 105,748 92,469 Asia Pacific 45,439 61,642 59,845 Unallocated: Research and development expenses (132,974 ) (143,140 ) (126,515 ) $ 46,531 $ 95,717 $ 102,091
Years Ended December 31, 2009 2008 2007 Interest income: Americas $ 803 $ 2,603 $ 5,138 Europe 727 3,291 4,485 Asia Pacific 99 102 199 $ 1,629 $ 5,996 $ 9,822
December 31, 2009 2008 Long-lived assets: Americas $ 100,489 $ 107,701 Europe 36,555 39,280 Asia Pacific 16,221 7,496 $ 153,265 $ 154,477
Total sales outside the United States for 2009, 2008 and foreign currency forward contracts2007 were estimated based upon quotes from brokers as of the applicable balance sheet date.$412.7 million, $499.3 million and $437.0 million, respectively.
Note 11: Derivative instruments13 – Commitments, contingencies and hedging activitiesleases
We have operations in 40 countries. Approximately 52% of our revenues are generated outsidecommitments under non-cancelable operating leases primarily for office facilities throughout the Americas. Our activities exposeworld. Certain leases require us to a varietypay property taxes, insurance and routine maintenance, and include escalation clauses. Future minimum lease payments as of market risks, includingDecember 31, 2009, for each of the effects of changes in foreign-currency exchange rates. These financial risksnext five years are monitored and managed by us as an integral part of our overall risk management program. We maintain a foreign-currency risk management strategy that uses derivative instruments (foreign currency forward and purchased options contracts) to protect our earnings and cash flows from fluctuations caused by the volatility in currency exchange rates. Movements in foreign-currency exchange rates pose a risk to our operations and competitive position, since exchange rate changes may affect our profitability and cash flow, and the business or pricing strategies of our non-U.S. based competitors.
Foreign currency fair value and cash flow hedges
The vast majority of our foreign sales are denominated in the customers’ local currency. We purchase foreign currency forward and purchased options contracts as hedges of forecasted sales that are denominated in foreign currencies and as hedges of foreign currency denominated receivables. These contracts are entered into to protect against the risk that the eventual dollar-net-cash inflows resulting from such sales or firm commitments will be adversely affected by changes in exchange rates.
We held forward contracts with notional amounts totaling $19.6follows (in thousands):
2010 $ 14,415 2011 9,898 2012 6,982 2013 4,611 2014 3,665 Thereafter 12,130 $ 51,701
Rent expense under operating leases was approximately $12.3 million, $11.7 million and $24.1$10.2 million at December 31, 2006 and 2005, respectively, that were designated as foreign currency fair value hedges of our foreign denominated receivables. The fair value of these contracts, which are for 90-day periods, is a liability of $617,000 and a receivable of $278,000 at December 31, 2006 and 2005, respectively. We recorded net losses of $1.0 million, net gains of $2.2 million and net losses of $2.6 million for fair value hedges for the years ended December 31, 2006, 20052009, 2008 and 2004, respectively, which was recorded2007, respectively.
As of December 31, 2009, we have non-cancelable purchase commitments with various suppliers of customized inventory and inventory components totaling approximately $6.5 million over the next twelve months.
As of December 31, 2009, we have outstanding guarantees for payment of customs and foreign grants totaling approximately $5.2 million.
Note 14 – Litigation
We filed a patent infringement action on January 25, 2001, in “Foreign Exchange Gain (Loss).” We hedge up to 90%the U.S. District Court, Eastern District of Texas (Marshall Division) claiming that The MathWorks, Inc. (“MathWorks”) infringed certain of our outstanding foreign denominated receivables. We held forward contracts withU.S. patents. On January 30, 2003, a notionaljury found infringement by MathWorks of three of the patents involved and awarded us specified damages. On September 23, 2003, the District Court entered final judgment in favor of us and entered an injunction against MathWorks’ sale of its Simulink and related products and stayed the injunction pending appeal. Upon appeal, the judgment and the injunction were affirmed by the U.S. Court of Appeals for the Federal Circuit (September 3, 2004). Subsequently the stay of injunction was lifted by the District Court. In November 2004, the final judgment amount of $26.6$7.4 million which had been held in escrow pending appeal was released to us.
An action was filed by MathWorks against us on September 22, 2004, in the U.S. District Court, Eastern District of Texas (Marshall Division), claiming that on that day MathWorks had released modified versions of its Simulink and $7.1related products, and seeking a declaratory judgment that the modified products do not infringe the three patents adjudged infringed in the District Court's decision of September 23, 2003 (and affirmed by the Court of Appeals on September 3, 2004). On November 2, 2004, MathWorks served the complaint on us. We filed an answer to MathWorks’ declaratory judgment complaint, denying MathWorks’ claims of non-infringement and alleging our own affirmative defenses. On January 5, 2005, the Court denied a contempt motion by us to enjoin the modified Simulink products under the injunction in effect from the first case. On January 7, 2005, we amended our answer to include counterclaims that MathWorks’ modified products are infringing three of our patents, and requested unspecified damages and an injunction. MathWorks filed its reply to our counterclaims on February 7, 2005, denying the counterclaims and alleging affirmative defenses. On March 2, 2005, we filed a notice of appeal regarding the Court's denial of the contempt motion. On March 15, 2005, the Court stayed MathWorks’ declaratory judgment action, pending a decision on the appeal by the Court of Appeals for the Federal Circuit. On February 9, 2006, the Court of Appeals for the Federal Circuit affirmed the District Court’s January 2005 order. On November 22, 2006, the District Court lifted the stay. The case schedule has yet to be set in this action. During the fourth quarter of 2004, we accrued $4 million at December 31, 2006 and 2005, respectively, that were designated as foreign currency cash flow hedges related to our probable loss from this contingency, which consists entirely of anticipated sales transactions.patent defense costs that are probable of being incurred. In the fourth quarter of 2006, we accrued an additional $600,000 related to this contingency. During the third quarter of 2009, we reduced the accrual by $2 million to reflect a decrease in the estimated costs that are probable of being incurred in this action. To date, we have charged a cumulative total of $623,000 against this accrual. At December 31, 2009, the remaining accrual was $2 million.
On February 1, 2008, we acquired all of the outstanding shares of microLEX Systems ApS, (“microLEX”) a premier provider of virtual instrumentation-based video, audio and mixed-signal test solutions. This acquisition was accounted for as a business combination. The purchase price of the acquisition, which included legal and accounting fees, was $17.8 million in cash. The allocation of the purchase price was determined using the fair value of these contracts, whichassets and liabilities acquired as of February 1, 2008. We funded the purchase price from existing cash balances. Our consolidated financial statements include the operating results from the date of acquisition. Pro-forma results or operations have not been presented because the effects of those operations were not material. The following table summarizes the allocation of the purchase price of microLEX (in thousands):
Goodwill $ 10,818 Acquired core technology 5,201 Non-competition agreements 159 Trademarks 119 Customer relationships 354 Current assets acquired 3,057 Long-term assets acquired 20 Current liabilities assumed (486 ) Deferred tax liabilities (1,458 ) Total assets acquired $ 17,784
Goodwill is not deductible for tax purposes. Existing technology, non-competition agreements, trademarks, and customer relationships have useful lives of 5 years, 3 years, 3 years, and 5 years, respectively, from the date of acquisition. These assets are not deductible for terms uptax purposes.
Note 16 – Quarterly results (unaudited)
The following quarterly results have been derived from unaudited consolidated financial statements that, in the opinion of management, reflect all adjustments (consisting only of normal recurring adjustments) necessary for a fair presentation of such quarterly information. The operating results for any quarter are not necessarily indicative of the results to twelve months, is a liabilitybe expected for any future period. The unaudited quarterly financial data for each of $427,000 and a receivable of $245,000 at December 31, 2006 and 2005, respectively, and a net unrealized deferred loss of $427,000 and a net unrealized deferred gain of $245,000 at December 31, 2006 and 2005, respectively, was recordedthe eight quarters in “Accumulated Other Comprehensive Income.” We hedge up to 100% of anticipated foreign currency denominated sales transactions for up to 40 months. We recorded net losses of $1.0 million and net gains of $105,000 and net losses of $5.8 million for cash flow hedges for the two years ended December 31, 2006, 2005 and 2004, respectively, which was included in “Net Sales.” As of December 31, 2006, $427,000 of deferred losses on cash flow hedges recorded in “Accumulated Other Comprehensive Income” are expected to be reclassified to earnings during the next twelve months. The actual foreign sales expected to occur over the next twelve months will necessitate the reclassifying to earnings of these derivative gains.
Hedge effectiveness of a foreign currency option contract designated as a cash flow hedge is measured by comparing the hedging instrument’s cumulative change in fair value from inception to maturity to the forecasted transaction’s terminal value. No amounts were excluded from the assessment of hedge effectiveness nor were there any amounts of ineffectiveness recorded in the consolidated statements of income for the years ended December 31, 2006 and 2005.
Note 12: Segment information
In accordance with SFAS 131,Disclosures about Segments of an Enterprise and Related Information, we determine operating segments using the management approach. The management approach designates the internal organization that is used by management for making operating decisions and assessing performance as the source of our operating segments. It also requires disclosures about products and services, geographic areas and major customers.
While we sell our products to many different markets, management has chosen to organize the Company by geographic areas, and as a result has determined that we have one operating segment. Substantially all of the interest income, depreciation and amortization is recorded in the Americas. Net sales, operating income and identifiable assets, classified by the major geographic areas in which we operate,2009 are as follows (in thousands)thousands, except per share data):
Years Ended December 31,
2006
2005
2004
Net sales: Americas: Unaffiliated customer sales $ 317,780 $ 275,524 $ 243,651 Geographic transfers 125,096 87,072 84,520
442,876 362,596 328,171
Europe: Unaffiliated customer sales 193,364 171,499 164,895 Geographic transfers 159,369 125,650 99,958
352,733 297,149 264,853
Asia Pacific: Unaffiliated customer sales 149,263 124,818 105,542
Eliminations (284,465 ) (212,722 ) (184,478 )
$ 660,407 $ 571,841 $ 514,088
Years Ended December 31,
2006
2005
2004
Operating income: Americas $ 67,644 $ 63,267 $ 53,472 Europe 78,402 61,790 55,705 Asia Pacific 54,771 40,996 38,211 Unallocated: Research and development expenses (113,095 ) (87,841 ) (84,692 )
$ 87,722 $ 78,212 $ 62,696
December 31,
2006
2005
Identifiable assets: Americas $ 476,027 $ 436,170 Europe 188,388 129,420 Asia Pacific 56,805 42,746
$ 721,220 $ 608,336
Total sales outside
Three Months Ended Mar. 31,2009 Jun. 30,2009 Sep. 30,2009 Dec. 31,2009 Net sales $ 157,799 $ 152,163 $ 165,035 $ 201,597 Gross profit 116,916 111,677 123,136 154,981 Operating income (2,479 ) 2,341 10,688 35,981 Net income 358 4,430 9,931 2,366 Basic earnings per share $ 0.00 $ 0.06 $ 0.13 $ 0.03 Weighted average shares outstanding-basic 77,277 77,556 77,653 77,589 Diluted earnings per share $ 0.00 $ 0.06 $ 0.13 $ 0.03 Weighted average shares outstanding-diluted 77,436 77,824 78,103 78,325 Dividends declared per share $ 0.12 $ 0.12 $ 0.12 $ 0.12
Three Months Ended Mar. 31,2008 Jun. 30,2008 Sep. 30,2008 Dec. 31,2008 Net sales $ 192,918 $ 210,474 $ 215,038 $ 202,107 Gross profit 143,849 157,034 160,531 152,014 Operating income 18,065 27,834 27,946 21,872 Net income 17,616 24,734 23,159 19,318 Basic earnings per share $ 0.22 $ 0.32 $ 0.29 $ 0.25 Weighted average shares outstanding-basic 78,840 78,484 78,834 78,110 Diluted earnings per share $ 0.22 $ 0.31 $ 0.29 $ 0.25 Weighted average shares outstanding-diluted 79,825 79,549 79,841 78,522 Dividends declared per share $ 0.11 $ 0.11 $ 0.11 $ 0.11
Note 17 – Subsequent events
In accordance with FASB ASC 855, Subsequent Events (FASB ASC 855), we have evaluated subsequent events through February 17, 2010, the United States for 2006, 2005 and 2004date the financial statements were $373.7 million, $323.9 million and $293.3 million, respectively.issued.
On January 22, 2010, our Board of Directors declared a quarterly cash dividend of $0.13 per common share, payable March 1, 2010, to shareholders of record on February 8, 2010.
From January 29, 2010 to February 12, 2010, we have repurchased 683,832 shares of our common stock at an average price of $29.97 under our share repurchase plan. The maximum number of shares that may yet be purchased under our plan is 1,004,495. Our purchase plan does not have an expiration date.
Note 13: Commitments, contingencies and leases
We have commitments under non-cancelable operating leases primarily for office facilities. Certain leases require us to pay property taxes, insurance and routine maintenance, and include escalation clauses. Future minimum lease payments as of December 31, 2006, for each of the next five years are as follows (in thousands):
2007 $ 7,241 2008 5,682 2009 4,883 2010 3,103 2011 1,983 Thereafter 799
$ 23,691
Rent expense under operating leases was approximately $8.7 million, $7.8 million and $6.5 million for the years ended December 31, 2006, 2005 and 2004, respectively.
As of December 31, 2006, we have non-cancelable purchase commitments with various suppliers of customized inventory and inventory components totaling approximately $7.0 million over the next twelve months.
As of December 31, 2006, we have outstanding guarantees for payment of customs and foreign grants totaling approximately $3.5 million.
Note 14: ��Litigation
We filed a patent infringement action on January 25, 2001 in the U.S. District Court, Eastern District of Texas (Marshall Division) claiming that The MathWorks, Inc. (“MathWorks”) infringed certain of our U.S. patents. On January 30, 2003, a jury found infringement by MathWorks of three of the patents involved and awarded us specified damages. On June 23, 2003, the District Court entered final judgment in favor of us and entered an injunction against MathWorks’ sale of its Simulink and related products and stayed the injunction pending appeal. Upon appeal, the judgment and the injunction were affirmed by the U.S. Court of Appeals for the Federal Circuit (September 3, 2004). Subsequently the stay of injunction was lifted by the District Court. In November 2004, the final judgment amount of $7.4 million which had been held in escrow pending appeal was released to us.
An action was filed by MathWorks against us on September 22, 2004, in the U.S. District Court, Eastern District of Texas (Marshall Division), claiming that on that day MathWorks had released modified versions of its Simulink and related products, and seeking a declaratory judgment that the modified products do not infringe the three patents adjudged infringed in the District Court’s decision of June 23, 2003, (and affirmed by the Court of Appeals on September 3, 2004). On November 2, 2004, MathWorks served the complaint on us. We filed an answer to MathWorks’ declaratory judgment complaint, denying MathWorks’ claims of non-infringement and alleging our own affirmative defenses. On January 5, 2005, the Court denied a contempt motion by us to enjoin the modified Simulink products under the injunction in effect from the first case. On January 7, 2005, we amended our answer to include counterclaims that MathWorks’ modified products are infringing three of our patents, and requested unspecified damages and an injunction. MathWorks filed its reply to our counterclaims on February 7, 2005, denying the counterclaims and alleging affirmative defenses. On March 2, 2005, we filed a notice of appeal regarding the Court’s denial of the contempt motion. On March 15, 2005, the Court stayed MathWorks’ declaratory judgment action, pending a decision on the appeal by the Court of Appeals for the Federal Circuit. On February 9, 2006, the Court of Appeals for the Federal Circuit affirmed the District Court’s January 2005 order. On November 22, 2006, the District Court lifted the stay. The case schedule has yet to be set in this action. During the fourth quarter of 2004, we accrued $4 million related to our probable loss from this contingency, which consists entirely of anticipated patent defense costs that are probable of being incurred. In the fourth quarter of 2006, we accrued an additional $600,000 related to this contingency. We charged approximately $57,000 against this accrual during the fourth quarter of 2006. We have charged a total of $602,000 against this accrual through December 31, 2006.
Note 15: Acquisitions
On January 31, 2005, we acquired all of the common stock of Toronto, Canada-based Electronics Workbench, a supplier of electronics design automation software. The acquisition was accounted for as a purchase. The purchase price of the acquisition, subject to adjustment as provided for in the purchase agreement, was $12.1 million in cash. We funded the purchase price from existing cash balances. Our consolidated financial statements include the operating results from the date of acquisition. Pro-forma results of operations have not been presented because the effects of those operations were not material. In accordance with SFAS 141, Business Combinations, the total purchase consideration has been allocated to the assets acquired and liabilities assumed, including identifiable intangible assets, based on their respective estimated fair values at the date of acquisition.
On April 29, 2005, we acquired the operating assets of Measurement Computing Corporation (MCC), a provider of low-cost data acquisition products. The acquisition was accounted for as a purchase. We acquired the operating assets of MCC, which included the legal positions of MCC and SoftWIRE in litigation against us. As a result of the asset acquisition, a pending legal action was dismissed with prejudice and we eliminated our remaining $1.9 million accrual for patent defense costs related to MCC. The gain that resulted from the elimination of the accrual was recorded in general and administrative expenses. The purchase price of the acquisition, subject to adjustment as provided for in the purchase agreement, was $33.2 million in cash. We funded the purchase price from existing cash balances. Our consolidated financial statements include the operating results from the date of acquisition. Pro-forma results of operations have not been presented because the effects of those operations were not material. In accordance with SFAS 141, the total purchase consideration has been allocated to the assets acquired and liabilities assumed, including identifiable assets, based on their respective estimated fair values at the date of acquisition.
On October 17, 2005, we acquired the operating assets of IOtech, Inc., a provider of PC-based data acquisition and instrumentation products. The acquisition was accounted for as a purchase. The purchase price of the acquisition, subject to adjustment as provided for in the purchase agreement, was $17.6 million in cash. We funded the purchase price from existing cash balances. Our consolidated financial statements include the operating results from the date of acquisition. Pro-forma results of operations have not been presented because the effects of those operations were not material. In accordance with SFAS 141, the total purchase consideration has been allocated to the assets acquired and liabilities assumed, including identifiable assets, based on their respective estimated fair values at the date of acquisition.
Goodwill is deductible for tax purposes. Goodwill is not amortized but is reviewed periodically for impairment. Acquired core technology and intangible assets are amortized over their useful lives, which range from three to eight years. Amortization expense for intangible assets acquired was approximately $3.2 million and $2.0 million for 2006 and 2005, respectively, of which approximately $2.7 million and $1.5 million was recorded in cost of sales and approximately $490,000 and $490,000 was recorded in operating expenses. The estimated amortization expense of intangible assets acquired for the current fiscal year and in future years will be recorded in the consolidated statements of income as follows (in thousands):
Fiscal Year
Cost of Sales
Acquisition related costs and amortization, net
Total
2007 $ 2,689 $ 450 $ 3,139 2008 2,532 412 2,944 2009 2,259 338 2,597 2010 1,725 177 1,902 Thereafter 1,166 271 1,437
Total $ 10,371 $ 1,648 $ 12,019
Note 16: Related party transactions
During 2002, we contributed approximately $3.6 million to the National Instruments Foundation, a 501(c)(3) charitable foundation established in 2002 for the purpose of continued promotion of scientific and engineering research and education at higher education institutions worldwide. This contribution was recorded as general and administrative expense in 2002. Two of the four directors of the National Instruments Foundation are current officers of National Instruments.
Note 17: Quarterly results (unaudited)
The following quarterly results have been derived from unaudited consolidated financial statements that, in the opinion of management, reflect all adjustments (consisting only of normal recurring adjustments) necessary for a fair presentation of such quarterly information. The operating results for any quarter are not necessarily indicative of the results to be expected for any future period. The unaudited quarterly financial data for each of the eight quarters in the two years ended December 31, 2006 are as follows (in thousands, except per share data):
Three Months Ended
Mar. 31, 2006
Jun. 30, 2006
Sep. 30, 2006
Dec. 31, 2006
Net sales $ 154,752 $ 160,123 $ 164,079 $ 181,453 Gross profit 113,247 119,271 121,648 135,915 Operating income 15,826 20,911 22,367 28,616 Net income 12,602 17,021 18,651 24,434 Basic earnings per share $ 0.16 $ 0.21 $ 0.23 $ 0.31 Weighted average shares outstanding-basic 79,053 79,611 79,637 79,767 Diluted earnings per share $ 0.15 $ 0.21 $ 0.23 $ 0.30 Weighted average shares outstanding-diluted 81,608 81,653 81,274 81,524 Dividends declared per share $ 0.06 $ 0.06 $ 0.06 $ 0.06
Three Months Ended
Mar. 31, 2005
Jun. 30, 2005
Sep. 30, 2005
Dec. 31, 2005
Net sales $ 129,740 $ 140,822 $ 141,618 $ 159,661 Gross profit 97,376 104,109 103,725 117,322 Operating income 14,182 19,093 18,343 26,594 Net income 11,136 15,024 14,399 20,958 Basic earnings per share $ 0.14 $ 0.19 $ 0.18 $ 0.27 Weighted average shares outstanding-basic 79,175 78,303 78,158 78,505 Diluted earnings per share $ 0.14 $ 0.19 $ 0.18 $ 0.26 Weighted average shares outstanding-diluted 81,924 80,190 80,575 80,821 Dividends declared per share $ 0.05 $ 0.05 $ 0.05 $ 0.05
Note 18: Subsequent Event
On January 30, 2007, our Board of Directors declared a quarterly cash dividend of $0.07 per common share, payable March 5, 2007, to shareholders of record on February 12, 2007.
On January 30, 2007, our Board of Directors granted authorization for the repurchase of an additional 1,522,106 shares of our common stock under our share repurchase plan.
SCHEDULE II
NATIONAL INSTRUMENTS CORPORATION
VALUATION AND QUALIFYING ACCOUNTS
(In thousands)
Allowance for doubtful accounts and sales returns:
Year
Description
Balance at Beginning of Period
Provision for Bad Debt Expense
Write-Offs Charged to Allowances
Balance at End of Period
2004 Allowance for doubtful accounts and sales returns $ 3,244 $ 596 $ 329 $ 3,511 2005 Allowance for doubtful accounts and sales returns 3,511 1,462 239 4,734 2006 Allowance for doubtful accounts and sales returns 4,734 33 407 4,360
| APIC | RE | |||||||
| 2006 Beginning Balance | ||||||||
| 12/31/06 balance as previously reported | $ | 109,851 | $ | 483,437 | ||||
| Cumulative reclassification of share repurchase | 97,957 | (97,957 | ) | |||||
| 12/31/06 balance as reported in current Form 10-K | $ | 207,808 | $ | 385,480 | ||||
| 2007 Activity | ||||||||
| Repurchase and retirement of common stock as previously reported | $ | (79,701 | ) | $ | — | |||
| Reclassification of 2007 activity | 72,599 | (72,599 | ) | |||||
| Repurchase and retirement of common stock as reported in current Form 10-K | $ | (7,102 | ) | $ | (72,599 | ) | ||
| 2007 Ending Balance | ||||||||
| 12/31/07 balance as previously reported | $ | 89,809 | $ | 563,418 | ||||
| Cumulative reclassification of share repurchase | 170,556 | (170,556 | ) | |||||
| 12/31/07 balance as reported in current Form 10-K | $ | 260,365 | $ | 392,862 | ||||
| 2008 Activity | ||||||||
| Repurchase and retirement of common stock as previously reported | $ | (103,600 | ) | $ | — | |||
| Reclassification of 2008 activity | 90,123 | (90,123 | ) | |||||
| Repurchase and retirement of common stock as reported in current Form 10-K | $ | (13,477 | ) | $ | (90,123 | ) | ||
| 2008 Ending Balance | ||||||||
| 12/31/08 balance as previously reported | $ | 39,673 | $ | 613,510 | ||||
| Cumulative reclassification of share repurchase | 260,679 | (260,679 | ) | |||||
| 12/31/08 balance as reported in current Form 10-K | $ | 300,352 | $ | 352,831 | ||||
Judgments and estimates are required in the
Short-term
Short-term available-for-sale are valued using the market approach (Level 1) based on unadjusted quoted prices in active markets for identical assets at the measurement date. Our short-term investments also include auction rate securities that we originally purchased for $8.6 million. These auction rate securities consist of corporate, state and municipaleducation loan revenue bonds. Auction rate securities with readily determinableare variable rate debt instruments whose interest rates are typically reset approximately every 7 to 35 days. In November 2008, we accepted the UBS Auction Rate Securities Rights (“the Rights”) agreement offered by UBS as a liquidity alternative to the failed auction process. The Rights agreement is a nontransferable right to sell our auction rate securities, at par value, back to UBS at any time during the period June 30, 2010, through July 2, 2012. The estimated fair market valuesvalue of both the auction rate securities and maturitiesthe Rights agreement was determined using significant unobservable inputs (Level 3) as prescribed by FASB ASC 820.
our sales returns allowance. Our allowance for doubtful accounts is based on historical experience. We analyze historical bad debts, customer concentrations, customer creditworthiness and current economic trends when evaluating the adequacy of our allowance for doubtful accounts.
Year | Description | Balance at Beginning of Period | Provisions | Write-Offs | Balance at End of Period | ||||||||||||
| 2007 | Allowance for doubtful accounts and sales returns | $ | 4,360 | $ | 1,940 | $ | 698 | $ | 5,602 | ||||||||
| 2008 | Allowance for doubtful accounts and sales returns | 5,602 | 447 | 367 | 5,682 | ||||||||||||
| 2009 | Allowance for doubtful accounts and sales returns | 5,682 | 337 | 1,400 | 4,619 | ||||||||||||
The excess purchase price over the fair value of assets acquired is recorded as goodwill. As we have one operating segment, we allocate goodwill to one reporting unit for goodwill impairment testing. In accordance with SFAS 142,FASB ASC 350, Intangibles – Goodwill and Other Intangible Assets, (FASB ASC 350), goodwill is tested for impairment on an annual basis, and between annual tests if indicators of potential impairment exist, using a fair-value-based approach.approach based on the market capitalization of the reporting unit. Our annual impairment test was performed on April 6, 2006.as of February 28, 2009. No impairment of goodwill was identified.has been identified during the period presented. Goodwill is deductible for tax purposes in certain jurisdictions.
Financial
with varying maturity dates. Our counterparties in our foreign currency forward and option contracts are major financial institutions. We do not anticipate nonperformance by these counterparties. We maintain cash(See Note 4 – Derivative instruments and cash equivalents with various financial institutions locatedhedging activities in many countries worldwide. Our short-term investments are diversified among and limitedNotes to high-quality securities with high credit ratings. Consolidated Financial Statements).
Salesseparately.
Provision
all periods presented.
| 2006 | 2005 | |||||||
|---|---|---|---|---|---|---|---|---|
| Balance at the beginning of the period | $ | 915 | $ | 815 | ||||
| Accruals for warranties issued during the period | 1,593 | 1,652 | ||||||
| Settlements made (in cash or in kind) during the period | (1,641 | ) | (1,552 | ) | ||||
| Balance at the end of the period | $ | 867 | $ | 915 | ||||
| 2009 | 2008 | |||||||
| Balance at the beginning of the period | $ | 952 | $ | 750 | ||||
| Accruals for warranties issued during the period | 1,991 | 1,836 | ||||||
| Settlements made (in cash or in kind) during the period | (2,022 | ) | (1,634 | ) | ||||
| Balance at the end of the period | $ | 921 | $ | 952 | ||||
On January 21, 2004, we declared a stock split effected in the form of a dividend of one share of common stock for each two shares of common stock outstanding. The dividend was paid on February 20, 2004 to holders of record as of the close of business on February 5, 2004. All per share data and numbers of common shares, where appropriate, have been retroactively adjusted to reflect the stock split.
| Years Ended December 31, | |||||||
|---|---|---|---|---|---|---|---|
| 2006 | 2005 | 2004 | |||||
| Weighted average shares outstanding-basic | 79,519 | 78,552 | 78,680 | ||||
| Plus: Common share equivalents | |||||||
| Stock options, restricted stock units | 2,000 | 2,358 | 3,416 | ||||
| Weighted average shares outstanding-diluted | 81,519 | 80,910 | 82,096 | ||||
| Years Ended December 31, | ||||||||||||
| 2009 | 2008 | 2007 | ||||||||||
| Weighted average shares outstanding-basic�� | 77,520 | 78,567 | 79,468 | |||||||||
| Plus: Common share equivalents | ||||||||||||
| Stock options, restricted stock units | 506 | 948 | 1,575 | |||||||||
| Weighted average shares outstanding-diluted | 78,026 | 79,515 | 81,043 | |||||||||
Prior
As of December 31, 2009 | As of December 31, 2008 | |||||||
| Cash and cash equivalents: | ||||||||
| Cash | $ | 85,612 | $ | 100,967 | ||||
| Cash equivalents: | ||||||||
| Time deposits | — | 73,400 | ||||||
| Money market accounts | 115,853 | 55,033 | ||||||
| Total cash and cash equivalents | $ | 201,465 | $ | 229,400 | ||||
| Short-term investments: | ||||||||
| Municipal bonds | $ | 12,549 | $ | 6,220 | ||||
| Corporate bonds | 7,587 | — | ||||||
| U.S. treasuries and agencies | 21,033 | — | ||||||
| Foreign government bonds | 34,674 | — | ||||||
| Time deposits | 2,753 | — | ||||||
| Auction rate securities | 8,177 | — | ||||||
| Auction rate securities put option | 423 | — | ||||||
| Total short-term investments | 87,196 | 6,220 | ||||||
| Long-term investments: | ||||||||
| Auction rate securities | — | 6,964 | ||||||
| Auction rate securities put option | — | 1,636 | ||||||
| Other long-term investments | — | 1,900 | ||||||
| Total investments | $ | 87,196 | $ | 16,720 | ||||
| Total cash, cash equivalents and investments | $ | 288,661 | $ | 246,120 | ||||
| As of December 31, 2009 | ||||||||||||||||||||
| Adjusted Cost | Gross Unrealized Gain | Gross Unrealized Loss | Cumulative Translation Adjustment | Fair Value | ||||||||||||||||
Municipal bonds | $ | 12,491 | $ | 58 | $ | — | $ | — | $ | 12,549 | ||||||||||
Corporate bonds | 7,478 | 110 | (1 | ) | — | 7,587 | ||||||||||||||
U.S. treasuries and agencies | 21,080 | — | (47 | ) | — | 21,033 | ||||||||||||||
Foreign government bonds | 36,105 | 76 | — | (1,507 | ) | 34,674 | ||||||||||||||
Time deposits | 2,753 | — | — | — | 2,753 | |||||||||||||||
Auction rate securities | 8,600 | — | (423 | ) | — | 8,177 | ||||||||||||||
Auction rate securities put option | — | 423 | — | — | 423 | |||||||||||||||
Total investments | $ | 88,507 | $ | 667 | $ | (471 | ) | $ | (1,507 | ) | $ | 87,196 | ||||||||
| As of December 31, 2008 | ||||||||||||||||
| Adjusted Cost | Gross Unrealized Gain | Gross Unrealized Loss | Fair Value | |||||||||||||
| Municipal securities | $ | 6,199 | $ | 28 | $ | (7 | ) | $ | 6,220 | |||||||
| Auction rate securities | 8,600 | — | (1,636 | ) | 6,964 | |||||||||||
| Auction rate securities put option | — | 1,636 | — | 1,636 | ||||||||||||
| Other long-term investments | 1,900 | — | — | 1,900 | ||||||||||||
| Total investments | $ | 16,699 | $ | 1,664 | $ | (1,643 | ) | $ | 16,720 | |||||||
| As of December 31, 2009 | ||||||||
| Adjusted Cost | Fair Value | |||||||
Due in less than 1 year | $ | 44,029 | $ | 43,267 | ||||
Due in 1 to 5 years | 44,478 | 43,929 | ||||||
Total investments | $ | 88,507 | $ | 87,196 | ||||
| As of December 31, 2009 | ||||||||
Due in less than 1 year | Adjusted Cost | Fair Value | ||||||
Municipal bonds | $ | 4,103 | $ | 4,110 | ||||
Corporate bonds | 5,384 | 5,473 | ||||||
U.S. treasuries and agencies | 5,065 | 5,057 | ||||||
Foreign government bonds | 18,124 | 17,274 | ||||||
Time deposits | 2,753 | 2,753 | ||||||
Auction rate securities | 8,600 | 8,177 | ||||||
Auction rate securities put option | — | 423 | ||||||
Total investments | $ | 44,029 | $ | 43,267 | ||||
| As of December 31, 2009 | ||||||||
| Due in 1 to 5 years | Adjusted Cost | Fair Value | ||||||
Municipal bonds | $ | 8,388 | $ | 8,439 | ||||
Corporate bonds | 2,094 | 2,114 | ||||||
U.S. treasuries and agencies | 16,015 | 15,976 | ||||||
Foreign government bonds | 17,981 | 17,400 | ||||||
Time deposits | — | — | ||||||
Auction rate securities | — | — | ||||||
Auction rate securities put option | — | — | ||||||
Total investments | $ | 44,478 | $ | 43,929 | ||||
Note 3 – Fair value measurements
Prior tosignificantly decreased. The update also includes guidance on identifying circumstances that indicate a transaction is not orderly. We adopted the effective date of SFAS 123R, we applied Accounting Principles Board Opinion 25 (“APB 25”),“Accounting for Stock Issued to Employees”update on April 1, 2009 and related interpretations forit did not have a material impact on our stock option grants. APB 25 providesfair value measurements.
| Fair Value Measurements at Reporting Date Using | ||||||||||||||||
Description | December 31, 2009 | Quoted Prices in Active Markets for Identical Assets (Level 1) | Significant Other Observable Inputs (Level 2) | Significant Unobservable Inputs (Level 3) | ||||||||||||
| Assets | ||||||||||||||||
| Money Market Funds | $ | 115,853 | $ | 115,853 | $ | — | $ | — | ||||||||
| Short-term investments available-for-sale | 87,196 | 78,596 | — | 8,600 | ||||||||||||
| Derivatives | 11,016 | — | 11,016 | — | ||||||||||||
| Total Assets | $ | 214,065 | $ | 194,449 | $ | 11,016 | $ | 8,600 | ||||||||
| Liabilities | ||||||||||||||||
| Derivatives | $ | (318 | ) | $ | — | $ | (318 | ) | $ | — | ||||||
| Total Liabilities | $ | (318 | ) | $ | — | $ | (318 | ) | $ | — | ||||||
Fair Value Measurements Using Significant Unobservable Inputs (Level 3) | ||||
Short-term investments available-for-sale | ||||
| Beginning Balance, January 1, 2008 | $ | 8,600 | ||
| Total gains (realized/unrealized) | ||||
| Included in earnings | 423 | |||
| Included in other comprehensive income | — | |||
| Total losses (realized/unrealized) | ||||
| Included in earnings | (423 | ) | ||
| Included in other comprehensive income | — | |||
| Purchases, issuances and settlements | — | |||
| Transfer in and/or out of Level 3 | — | |||
| Ending Balance, December 31, 2009 | $ | 8,600 | ||
The amount of total gains or (losses) for the period included in earnings (or changes in net assets) attributable to the change in unrealized gains or losses relating to assets still held at the reporting date | $ | — | ||
up to 24 months. At December 31, 2008, we held forward contracts with a notional amount of $54.9 million dollar equivalent of Euro, $6.2 million dollar equivalent of British pound sterling, $18.9 million dollar equivalent of Japanese yen, $4.7 million dollar equivalent of South Korean won and $21.7 million dollar equivalent of Hungarian forint.
| In thousands | Asset Derivatives | |||||||||
| December 31, 2009 | December 31, 2008 | |||||||||
| Balance Sheet Location | Fair Value | Balance Sheet Location | Fair Value | |||||||
Derivatives designated as hedging instruments under FASB ASC 815 | ||||||||||
| Foreign exchange contracts – ST forwards | Prepaid expenses and other current assets | $ | 7,947 | Prepaid expenses and other current assets | $ | 5,260 | ||||
| Foreign exchange contracts – LT forwards | Other long-term assets | 274 | Other long-term assets | 2,654 | ||||||
| Foreign exchange contracts – ST options | Prepaid expenses and other current assets | 1,821 | Prepaid expenses and other current assets | 5,705 | ||||||
| Foreign exchange contracts – LT options | Other long-term assets | — | Other long-term assets | 3,838 | ||||||
Total derivatives designated as hedging instruments under FASB ASC 815 | $ | 10,042 | $ | 17,457 | ||||||
Derivatives not designated as hedging instruments under FASB ASC 815 | ||||||||||
| Foreign exchange contracts – ST forwards | Prepaid expenses and other current assets | $ | 974 | Prepaid expenses and other current assets | $ | 2,745 | ||||
Total derivatives not designated as hedging instruments under FASB ASC 815 | $ | 974 | $ | 2,745 | ||||||
| Total derivatives | $ | 11,016 | $ | 20,202 | ||||||
| Liability Derivatives | ||||||||||
| December 31, 2009 | December 31, 2008 | |||||||||
| Balance Sheet Location | Fair Value | Balance Sheet Location | Fair Value | |||||||
Derivatives designated as hedging instruments under FASB ASC 815 | ||||||||||
| Foreign exchange contracts – ST forwards | Accrued expenses and other liabilities | $ | — | Accrued expenses and other liabilities | $ | (1,803 | ) | |||
| Foreign exchange contracts – LT forwards | Other long-term liabilities | — | Other long-term liabilities | — | ||||||
| Foreign exchange contracts – ST options | Accrued expenses and other liabilities | — | Accrued expenses and other liabilities | — | ||||||
| Foreign exchange contracts – LT options | Other long-term liabilities | — | Other long-term liabilities | — | ||||||
Total derivatives designated as hedging instruments under FASB ASC 815 | $ | — | $ | (1,803 | ) | |||||
Derivatives not designated as hedging instruments under FASB ASC 815 | ||||||||||
| Foreign exchange contracts – ST forwards | Accrued expenses and other liabilities | $ | (318 | ) | Accrued expenses and other liabilities | $ | (3,280 | ) | ||
Total derivatives not designated as hedging instruments under FASB ASC 815 | $ | (318 | ) | $ | (3,280 | ) | ||||
| Total derivatives | $ | (318 | ) | $ | (5,083 | ) | ||||
Derivatives in FASB ASC 815 Cash Flow Hedging Relationship | Amount of Gain or (Loss) Recognized in OCI on Derivative (Effective Portion) (in thousands) | Location of Gain or (Loss) Reclassified from Accumulated OCI into Income (Effective Portion) | Amount of Gain or (Loss) Reclassified from Accumulated OCI into Income (Effective Portion) (in thousands) | Location of Gain or (Loss) Recognized in Income on Derivative (Ineffective Portion and Amount Excluded from Effectiveness Testing) | Amount of Gain or (Loss) Recognized in Income on Derivative (Ineffective Portion and Amount Excluded from Effectiveness Testing) | |||||||||
| 2009 | 2009 | 2009 | ||||||||||||
| Foreign exchange contracts – forwards and options | $ | (6,304 | ) | Net sales | $ | 1,399 | Net foreign exchange gain (loss) | $ | 1,132 | |||||
| Foreign exchange contracts – forwards and options | 2,055 | Cost of sales | (74 | ) | Net foreign exchange gain (loss) | (41 | ) | |||||||
Foreign exchange contracts – forwards and options | 1,427 | Operating expenses | 517 | Net foreign exchange gain (loss) | 81 | |||||||||
Total | $ | (2,822 | ) | $ | 1,842 | $ | 1,172 | |||||||
Derivatives not Designated as Hedging Instruments under FASB ASC 815 | Location of Gain (Loss) Recognized in Income on Derivative | Amount of Gain (Loss) Recognized in Income on Derivative | |||
| 2009 | |||||
| Foreign exchange contracts – forwards | Net foreign exchange gain/(loss) | $ | (1,669 | ) | |
| Total | $ | (1,669 | ) | ||
Note 5 – Inventories
| December 31, | ||||||||
| 2009 | 2008 | |||||||
| Raw materials | $ | 42,121 | $ | 48,004 | ||||
| Work-in-process | 2,042 | 4,150 | ||||||
| Finished goods | 42,352 | 55,204 | ||||||
| $ | 86,515 | $ | 107,358 | |||||
| December 31, | ||||||||
| 2009 | 2008 | |||||||
| Land | $ | 17,076 | $ | 7,210 | ||||
| Buildings | 138,367 | 136,802 | ||||||
| Furniture and equipment | 154,558 | 144,979 | ||||||
| 310,001 | 288,991 | |||||||
| Accumulated depreciation | (156,736 | ) | (134,514 | ) | ||||
| $ | 153,265 | $ | 154,477 | |||||
| 2009 | 2008 | |||||||||||||||||||||||
Gross Carrying Amount | Accumulated Amortization | Net Carrying Amount | Gross Carrying Amount | Accumulated Amortization | Net Carrying Amount | |||||||||||||||||||
| Capitalized software development costs | $ | 38,928 | $ | (20,455 | ) | $ | 18,473 | $ | 25,610 | $ | (11,344 | ) | $ | 14,266 | ||||||||||
Acquired technology | 28,022 | (20,967 | ) | 7,055 | 27,503 | (16,804 | ) | 10,699 | ||||||||||||||||
Patents | 19,033 | (5,377 | ) | 13,656 | 16,068 | (4,506 | ) | 11,562 | ||||||||||||||||
Other | 12,577 | (8,371 | ) | 4,206 | 11,401 | (6,013 | ) | 5,388 | ||||||||||||||||
| $ | 98,560 | $ | (55,170 | ) | $ | 43,390 | $ | 80,582 | $ | (38,667 | ) | $ | 41,915 | |||||||||||
Amount (in thousands) | ||||
| 2010 | $ | 18,097 | ||
| 2011 | 12,986 | |||
| 2012 | 7,187 | |||
| 2013 | 1,868 | |||
| 2014 | 1,186 | |||
| Thereafter | 2,066 | |||
| $ | 43,390 | |||
Fiscal Year | Cost of Sales | Acquisition related costs and amortization, net | Total | |||||||||
| 2010 | $ | 2,701 | $ | 369 | $ | 3,070 | ||||||
| 2011 | 2,160 | 221 | 2,381 | |||||||||
| 2012 | 1,126 | 206 | 1,332 | |||||||||
| 2013 | 87 | 75 | 162 | |||||||||
| Thereafter | — | — | — | |||||||||
| Total | $ | 6,074 | $ | 871 | $ | 6,945 | ||||||
Amount (in thousands) | ||||
| Balance as of December 31, 2007 | $ | 54,111 | ||
| Acquisitions/purchase accounting adjustments | 10,818 | |||
| Divestitures | — | |||
| Foreign currency translation impact | (368 | ) | ||
| Balance as of December 31, 2008 | $ | 64,561 | ||
| Acquisitions/purchase accounting adjustments | — | |||
| Divestitures | — | |||
| Foreign currency translation impact | 218 | |||
| Balance as of December 31, 2009 | $ | 64,779 | ||
| Years Ended December 31, | ||||||||||||
| 2009 | 2008 | 2007 | ||||||||||
| Domestic | $ | 34,953 | $ | 15,921 | $ | 31,685 | ||||||
| Foreign | 15,292 | 82,216 | 81,742 | |||||||||
| $ | 50,245 | $ | 98,137 | $ | 113,427 | |||||||
| Years Ended December 31, | ||||||||||||
| 2009 | 2008 | 2007 | ||||||||||
| Current tax expense: | ||||||||||||
| U.S. federal | $ | 3,117 | $ | 14,631 | $ | 15,957 | ||||||
| State | 136 | 1,391 | 1,155 | |||||||||
| Foreign | 13,760 | 18,910 | 9,925 | |||||||||
| Total current | 17,013 | 34,932 | 27,037 | |||||||||
| Deferred tax expense (benefit): | ||||||||||||
| U.S. federal | 9,920 | (11,008 | ) | 628 | ||||||||
| State | 387 | (373 | ) | (156 | ) | |||||||
| Foreign | (2,864 | ) | (1,570 | ) | (2,783 | ) | ||||||
| Total deferred | 7,443 | (12,951 | ) | (2,311 | ) | |||||||
| Change in valuation allowance | 8,704 | (8,671 | ) | (18,332 | ) | |||||||
| Total provision | $ | 33,160 | $ | 13,310 | $ | 6,394 | ||||||
| December 31, | ||||||||
| 2009 | 2008 | |||||||
| Capitalized software | $ | 5,978 | $ | 4,615 | ||||
| Depreciation and amortization | 10,577 | 9,536 | ||||||
| Unrealized gain on derivative instruments | — | 4,153 | ||||||
| Undistributed earnings of foreign subsidiaries | 9,278 | 10,075 | ||||||
| Gross deferred tax liabilities | 25,833 | 28,379 | ||||||
| Operating loss carryforwards | (57,422 | ) | (43,360 | ) | ||||
| Intangible assets | (44,159 | ) | (58,987 | ) | ||||
| Vacation and other accruals | (3,700 | ) | (4,890 | ) | ||||
| Inventory valuation and warranty provisions | (6,702 | ) | (12,665 | ) | ||||
| Doubtful accounts and sales provisions | (1,088 | ) | (1,512 | ) | ||||
| Unrealized exchange loss | (917 | ) | (1,345 | ) | ||||
| Deferred revenue . | (853 | ) | (71 | ) | ||||
| Accrued rent expenses | (111 | ) | (117 | ) | ||||
| Accrued legal expenses | (710 | ) | (1,466 | ) | ||||
| Unrealized loss on derivative instruments | (242 | ) | — | |||||
| 10% minority stock investment | (900 | ) | (920 | ) | ||||
| Stock-based compensation | (4,483 | ) | (5,353 | ) | ||||
| Research and development tax credit carryforward | (2,054 | ) | — | |||||
| Foreign tax credit carryforward | (1,775 | ) | — | |||||
| Other | (657 | ) | (783 | ) | ||||
| Gross deferred tax assets | (125,773 | ) | (131,469 | ) | ||||
| Valuation allowance | 99,862 | 85,815 | ||||||
| Net deferred tax liability (asset) | $ | (78 | ) | $ | (17,275 | ) | ||
| Years Ended December 31, | ||||||||||||
| 2009 | 2008 | 2007 | ||||||||||
| U.S. federal statutory tax rate | 35 | % | 35 | % | 35 | % | ||||||
| Domestic production activities | — | — | (1 | ) | ||||||||
| Foreign taxes (less) than federal statutory rate | (6 | ) | (9 | ) | (14 | ) | ||||||
| Change in valuation allowance | 17 | (9 | ) | (16 | ) | |||||||
| Research and development tax credit | (4 | ) | (2 | ) | (1 | ) | ||||||
| Tax exempt interest | — | (1 | ) | (1 | ) | |||||||
| State income taxes, net of federal tax benefit | 1 | 1 | 1 | |||||||||
| Employee share-based compensation | 7 | 2 | 2 | |||||||||
| Intercompany profit | 15 | (5 | ) | — | ||||||||
| Other | 1 | 2 | 1 | |||||||||
| Effective tax rate | 66 | % | 14 | % | 6 | % | ||||||
| 2008 foreign taxes (less) than federal statutory rate as reported in prior year Form 10-K | (14 | ) | ||
| Reclassification (a) | 5 | |||
| 2008 foreign taxes (less) than federal statutory rate as reported in current year Form 10-K | (9 | ) | ||
| 2008 intercompany profit as reported in prior year Form 10-K | — | |||
| Reclassification (a) | (5 | ) | ||
| 2008 intercompany profit as reported in current year Form 10-K | (5 | ) |
Had we previously recognized compensation costs as prescribed by SFAS 123, previously reported net income, basic earnings per share and diluted earnings per share would have changed to the pro forma amounts shown below (in thousands, except per share amounts):
| Years Ended December 31, | ||||||||
|---|---|---|---|---|---|---|---|---|
| 2005 | 2004 | |||||||
| Net income, as reported | $ | 61,517 | $ | 48,610 | ||||
| Stock-based compensation included in reported net income, | ||||||||
| net of related tax effects | 959 | — | ||||||
| Total stock-based compensation expense determined under | ||||||||
| fair value method for all awards, net of related tax effects | (13,998 | ) | (12,741 | ) | ||||
| Pro-forma net income | $ | 48,478 | $ | 35,869 | ||||
| Earnings per share: | ||||||||
| Basic - as reported | $ | 0.78 | $ | 0.62 | ||||
| Basic - pro-forma | $ | 0.62 | $ | 0.46 | ||||
| Diluted - as reported | $ | 0.76 | $ | 0.59 | ||||
| Diluted - pro-forma | $ | 0.60 | $ | 0.44 | ||||
Pro-forma disclosuresestablished for the excess tax deductible goodwill to reflect the tax benefit we expected to realize in future periods.
the beginning and ending amount of unrecognized tax benefit is as follows (in thousands):
| 2009 | 2008 | |||||||
Balance at beginning of period | $ | 9,364 | $ | 8,273 | ||||
Additions based on tax positions related to the current year | 2,060 | 1,946 | ||||||
Additions for tax positions of prior years | 1,272 | 366 | ||||||
| Reductions as a result of the lapse of the applicable statute of limitations | (1,634 | ) | (1,221 | ) | ||||
Balance at end of period | $ | 11,062 | $ | 9,364 | ||||
| Number of shares under option | Weighted average exercise price | |||||||
|---|---|---|---|---|---|---|---|---|
| Outstanding at December 31, 2003 | 9,726,418 | $ | 18.07 | |||||
| Exercised | (882,539 | ) | 9.60 | |||||
| Canceled | (325,912 | ) | 27.66 | |||||
| Granted | 1,262,599 | 29.71 | ||||||
| Outstanding at December 31, 2004 | 9,780,566 | $ | 20.02 | |||||
| Exercised | (1,188,614 | ) | 10.72 | |||||
| Canceled | (358,444 | ) | 29.49 | |||||
| Granted | 244,725 | 24.24 | ||||||
| Outstanding at December 31, 2005 | 8,478,233 | $ | 21.05 | |||||
| Exercised | (1,398,617 | ) | 13.16 | |||||
| Canceled | (164,943 | ) | 27.32 | |||||
| Granted | 0 | 0 | ||||||
| Outstanding at December 31, 2006 | 6,914,673 | $ | 22.49 | |||||
| Options exercisable at December 31: | ||||||||
| 2004 | 6,353,236 | $ | 17.23 | |||||
| 2005 | 5,946,139 | 19.10 | ||||||
| 2006 | 5,384,470 | 21.53 | ||||||
| Number of shares under option | Weighted average fair value | |||||||
|---|---|---|---|---|---|---|---|---|
| Weighted average, grant date fair value of options granted during: | ||||||||
| 2004 | 1,262,599 | $ | 16.72 | |||||
| 2005 | 244,725 | 12.85 | ||||||
| 2006 | 0 | 0 | ||||||
Number of shares under option | Weighted average exercise price | |||||||
| Outstanding at December 31, 2006 | 6,914,673 | $ | 22.49 | |||||
| Exercised | (1,515,107 | ) | 15.22 | |||||
| Canceled | (104,925 | ) | 27.33 | |||||
| Granted | — | — | ||||||
| Outstanding at December 31, 2007 | 5,294,641 | $ | 24.47 | |||||
| Exercised | (925,743 | ) | 17.30 | |||||
| Canceled | (96,331 | ) | 26.98 | |||||
| Granted | — | — | ||||||
| Outstanding at December 31, 2008 | 4,272,567 | $ | 25.97 | |||||
| Exercised | (379,630 | ) | 15.40 | |||||
| Canceled | (181,434 | ) | 26.80 | |||||
| Granted | — | — | ||||||
| Outstanding at December 31, 2009 | 3,711,503 | $ | 26.93 | |||||
| Options exercisable at December 31: | ||||||||
| 2007 | 4,368,972 | $ | 24.17 | |||||
| 2008 | 3,812,334 | 26.00 | ||||||
| 2009 | 3,493,574 | 26.94 | ||||||
| Outstanding and Exercisable by Price Range As of December 31, 2006 | |||||||||||||||||
|---|---|---|---|---|---|---|---|---|---|---|---|---|---|---|---|---|---|
| Options Outstanding | Options Exercisable | ||||||||||||||||
| Range of Exercise prices | Number outstanding as of 12/31/2006 | Weighted average remaining contractual life | Weighted average exercise price | Number exercisable as of 12/31/2006 | Weighted average exercise price | ||||||||||||
| $8.6667 -$12.2222 | 1,072,535 | 1.27 | $ | 10.98 | 1,045,669 | $ | 10.9677 | ||||||||||
| 12.3611 - 15.3055 | 976,976 | 1.54 | $ | 15.23 | 967,192 | $ | 15.2258 | ||||||||||
| 15.5555 - 21.0417 | 1,720,096 | 5.18 | $ | 20.64 | 1,223,332 | $ | 20.6330 | ||||||||||
| 21.2533 - 29.5400 | 839,349 | 6.80 | $ | 25.53 | 538,372 | $ | 25.5261 | ||||||||||
| 29.8500 - 34.3750 | 2,305,717 | 5.60 | $ | 31.19 | 1,609,905 | $ | 31.5078 | ||||||||||
| $8.6667 - $34.3750 | 6,914,673 | 3.94 | $ | 22.4883 | 5,384,470 | $ | 21.5254 | ||||||||||
| Outstanding and Exercisable by Price Range as of December 31, 2009 | ||||||||||||||||||||||
| Options Outstanding | Options Exercisable | |||||||||||||||||||||
Range of Exercise prices | Number outstanding as of 12/31/2009 | Weighted average remaining contractual life | Weighted average exercise price | Number exercisable as of 12/31/2009 | Weighted average exercise price | |||||||||||||||||
| $16.08 – $21.95 | 1,238,441 | 1.74 | $ | 20.69 | 1,188,337 | $ | 20.71 | |||||||||||||||
| $22.30 – $29.85 | 1,257,625 | 3.90 | $ | 28.15 | 1,098,218 | $ | 28.08 | |||||||||||||||
| $30.51 – $34.38 | 1,215,437 | 0.41 | $ | 32.02 | 1,207,019 | $ | 32.02 | |||||||||||||||
| $16.08 – $34.38 | 3,711,503 | 2.04 | $ | 26.93 | 3,493,574 | $ | 26.94 | |||||||||||||||
| 2005 | 2004 | |||||||
|---|---|---|---|---|---|---|---|---|
| Dividend expense yield | 0.2% | 0.2% | ||||||
| Expected life | 5.5 years | 5.5 years | ||||||
| Expected volatility | 43.3% | 53.2% | ||||||
| Risk-free interest rate | 4.0% | 2.7% | ||||||
| RSUs | ||||||||
|---|---|---|---|---|---|---|---|---|
| Number of RSUs | Weighted Average Grant Price | |||||||
| Balance at January 1, 2005 | 0 | $ | 0.00 | |||||
| Granted | 813,305 | $ | 22.24 | |||||
| Earned | 0 | $ | 0.00 | |||||
| Canceled | (15,000 | ) | $ | 22.12 | ||||
| Balance at December 31, 2005 | 798,305 | $ | 22.24 | |||||
| Granted | 693,805 | $ | 32.21 | |||||
| Earned | (113,794 | ) | $ | 31.67 | ||||
| Canceled | (53,383 | ) | $ | 25.93 | ||||
| Balance at December 31, 2006 | 1,324,933 | $ | 26.77 | |||||
| RSUs | ||||||||
Number of RSUs | Weighted Average Grant Price | |||||||
Balance at January 1, 2007 | 1,324,933 | $ | 26.77 | |||||
Granted | 801,780 | $ | 27.90 | |||||
Earned | (209,303 | ) | $ | 27.85 | ||||
Canceled | (75,776 | ) | $ | 27.64 | ||||
Balance at December 31, 2007 | 1,841,634 | $ | 26.86 | |||||
Granted | 763,182 | $ | 28.51 | |||||
Earned | (320,251 | ) | $ | 29.42 | ||||
Canceled | (119,337 | ) | $ | 28.19 | ||||
Balance at December 31, 2008 | 2,165,228 | $ | 26.99 | |||||
Granted | 604,083 | $ | 21.80 | |||||
Earned | (407,156 | ) | $ | 22.04 | ||||
Canceled | (57,721 | ) | $ | 27.88 | ||||
Balance at December 31, 2009 | 2,304,434 | $ | 26.48 | |||||
| 2006 | 2005 | 2004 | |||||||||
|---|---|---|---|---|---|---|---|---|---|---|---|
| Dividend expense yield | 0.2% | 0.2% | 0.2% | ||||||||
| Expected life | 3 months | 6 months | 6 months | ||||||||
| Expected volatility | 29% | 29% | 35% | ||||||||
| Risk-free interest rate | 4.5% | 3.2% | 1.0% | ||||||||
| 2009 | 2008 | 2007 | ||||||||||
| Dividend expense yield | 0.5% | 0.3% | 0.3% | |||||||||
| Expected life | 3 months | 3 months | 3 months | |||||||||
| Expected volatility | 45% | 26% | 23% | |||||||||
| Risk-free interest rate | 0.8% | 3.8% | 5.0% | |||||||||
| Number of shares | Weighted average fair value | |||||||
|---|---|---|---|---|---|---|---|---|
| 2004 | 380,211 | $ | 7.73 | |||||
| 2005 | 467,932 | 6.08 | ||||||
| 2006 | 539,541 | 6.62 | ||||||
Plan are as follows:
Number of shares | Weighted average fair value | |||||||
| 2007 | 549,719 | $ | 6.19 | |||||
| 2008 | 679,983 | 5.86 | ||||||
| 2009 | 838,536 | 5.75 | ||||||
| 2009 | 2008 | 2007 | ||||||||||
| Stock-based compensation | ||||||||||||
| Total cost of sales | $ | 1,284 | $ | 1,063 | $ | 911 | ||||||
| Sales and marketing | 8,774 | 8,479 | 7,322 | |||||||||
| Research and development | 7,236 | 7,121 | 6,435 | |||||||||
| General and administrative | 3,005 | 3,084 | 2,866 | |||||||||
| Provision for income taxes | (3,765 | ) | (4,601 | ) | (3,839 | ) | ||||||
| Total | $ | 16,534 | $ | 15,146 | $ | 13,695 | ||||||
Comprehensive income
Our comprehensive income is comprised of net income, foreign currency translation and unrealized gains and losses on forward and option contracts and securities available for sale. Comprehensive income for 2006, 2005 and 2004 was $76.9 million, $57.2 million and $57.7 million, respectively.
Recently issued accounting pronouncements
In July 2006, the Financial Accounting Standards Board (“FASB”) issued FASB Interpretation (“FIN”) 48,Accounting for Uncertainty in Income Taxes – an interpretation of Statement of Financial Accounting Standards (“SFAS”) 109. This interpretation clarifies the accounting for uncertainty in income taxes recognized in an entity’s financial statements in accordance with SFAS 109,Accounting for Income Taxes. It prescribes a recognition threshold and measurement attribute for financial statement disclosure of tax positions taken or expected to be taken on a tax return. This interpretation is effective for fiscal years beginning after December 15, 2006. We adopted FIN 48 on January 1, 2007 as required. The cumulative effect of adopting FIN 48 was recorded in retained earnings upon adoption. The adoption of FIN 48 did not have a significant impact on our financial position or results of operations.
In September 2006, the Securities and Exchange Commission (“SEC”) issued Staff Accounting Bulletin (“SAB”) 108 regarding the process of quantifying financial statement misstatements. SAB 108 states that registrants should use both a balance sheet approach and an income statement approach when quantifying and evaluating the materiality of a misstatement. The interpretations in SAB 108 contain guidance on correcting errors under the dual approach as well as provide transition guidance for correcting errors. This interpretation does not change the requirements within SFAS 154,Accounting Changes and Error Corrections – a replacement of APB 20 and FASB Statement 3, for the correction of an error on financial statements. SAB 108 is effective for annual financial statements covering the first fiscal year ending after November 15, 2006. We adopted this interpretation on December 31, 2006. The adoption of SAB 108 did not have a significant effect on our consolidated financial statements.
In September 2006, the FASB issued SFAS 157,Fair Value Measurements. This standard defines fair value, establishes a framework for measuring fair value in accounting principles generally accepted in the United States of America, and expands disclosure about fair value measurements. This pronouncement applies under other accounting standards that require or permit fair value measurements. Accordingly, this statement does not require any new fair value measurement. This statement is effective for fiscal years beginning after November 15, 2007, and interim periods within those fiscal years. We will be required to adopt SFAS 157 in the first quarter of fiscal year 2008. We are currently evaluating the requirements of SFAS 157 and have not yet determined the impact on our consolidated financial statements.
In March 2006, the Emerging Issues Task Force (“EITF”) reached a consensus on EITF Issue 06-3,How Taxes Collected from Customers and Remitted to Governmental Authorities Should Be Presented in the Income Statement (that is, Gross versus Net Presentation). Taxes within the scope of EITF Issue 06-3 include any taxes assessed by a governmental authority that are directly imposed on a revenue-producing transaction between a seller and a customer and may include, but are not limited to, sales taxes, use taxes, value-added taxes, and some excise taxes. The EITF concluded that the presentation of these taxes on either a gross (included in revenues and costs) or a net (excluded from revenue) basis is an accounting policy decision that should be disclosed. For any such taxes that are reported on a gross basis, a company should disclose the amounts of those taxes in interim and annual financial statements. Our policy is to exclude all such taxes from revenue. The provisions of EITF 06-3 are effective for interim and annual reporting periods beginning after December 15, 2006. The adoption of EITF 06-3 will not have any effect on our consolidated financial statements.
Note 2: Short-term investments
Short-term investments at December 31, 2006 and 2005, consisting of corporate, state and municipal securities, were acquired at an aggregate cost of $150.2 million and $119.8 million, respectively. The contractual maturities of these securities, which are classified as available-for-sale and carried at fair value, are as follows (in thousands):
| December 31, | ||||||||
|---|---|---|---|---|---|---|---|---|
| 2006 | 2005 | |||||||
| Less than 90 days | $ | 73,787 | $ | 61,855 | ||||
| 90 days to one year | 31,309 | 42,222 | ||||||
| One year through two years | 38,559 | 11,877 | ||||||
| Two years or more | 6,535 | 3,892 | ||||||
| $ | 150,190 | $ | 119,846 | |||||
Note 3: Inventories
Inventories, net consist of the following (in thousands):
| December 31, | ||||||||
|---|---|---|---|---|---|---|---|---|
| 2006 | 2005 | |||||||
| Raw materials | $ | 38,270 | $ | 28,497 | ||||
| Work-in-process | 4,321 | 4,634 | ||||||
| Finished goods | 34,547 | 29,696 | ||||||
| $ | 77,138 | $ | 62,827 | |||||
Note 4: Property and equipment
Property and equipment consist of the following (in thousands):
| December 31, | ||||||||
|---|---|---|---|---|---|---|---|---|
| 2006 | 2005 | |||||||
| Land | $ | 7,165 | $ | 7,085 | ||||
| Buildings | 125,228 | 124,428 | ||||||
| Furniture and equipment | 110,710 | 91,073 | ||||||
| 243,103 | 222,586 | |||||||
| Accumulated depreciation | (97,678 | ) | (78,256 | ) | ||||
| $ | 145,425 | $ | 144,330 | |||||
Depreciation expense for the years ended December 31, 2006, 2005 and 2004, was $20.2 million, $17.8 million and $17.3 million, respectively.
Note 5: Intangibles
Intangibles at December 31, 2006 and 2005 are as follows:
| 2006 | 2005 | |||||||||||||||||||
|---|---|---|---|---|---|---|---|---|---|---|---|---|---|---|---|---|---|---|---|---|
| Gross Carrying Amount | Accumulated Amortization | Net Carrying Amount | Gross Carrying Amount | Accumulated Amortization | Net Carrying Amount | |||||||||||||||
| Capitalized software development costs | $ | 57,571 | $ | (41,791 | ) | $ | 15,780 | $ | 50,201 | $ | (32,651 | ) | $ | 17,550 | ||||||
| Acquired technology | 20,814 | (9,734 | ) | 11,080 | 20,257 | (6,296 | ) | 13,961 | ||||||||||||
| Patents | 12,928 | (3,076 | ) | 9,852 | 11,647 | (2,445 | ) | 9,202 | ||||||||||||
| Other | 6,452 | (3,099 | ) | 3,353 | 4,826 | (1,937 | ) | 2,889 | ||||||||||||
| $ | 97,765 | $ | (57,700 | ) | $ | 40,065 | $ | 86,931 | $ | (43,329 | ) | $ | 43,602 | |||||||
Software development costs capitalized during 2006, 2005 and 2004 were $7.4 million, $13.4 million and $5.0 million, respectively, and related amortization was $9.1 million, $7.2 million and $6.6 million, respectively. Amortization of capitalized software development costs is computed on an individual product basis for those products available for market and is recognized based on the product’s estimated economic life, generally three years. Patents are amortized using the straight-line method over their estimated period of benefit, generally ten to seventeen years. Total intangible assets amortization expenses were $13.9 million, $10.7 million and $8.3 million for the years ended December 31, 2006, 2005 and 2004, respectively.
Capitalized software development costs, acquired technology, patents and other have weighted-average useful lives of 2.1 years, 4.1 years, 7.7 years and 3.7 years, respectively, as of the end of December 31, 2006. The estimated future amortization expense related to intangible assets as of December 31, 2006 is as follows:
| Amount | |||||
|---|---|---|---|---|---|
| (in thousands) | |||||
| 2007 | $ | 13,044 | |||
| 2008 | 10,219 | ||||
| 2009 | 5,046 | ||||
| 2010 | 2,477 | ||||
| 2011 | 1,569 | ||||
| Thereafter | 7,710 | ||||
| $ | 40,065 | ||||
We established a valuation reserve in 2004 for the estimated total impairment of our $2.5 million cost-method investment in a start-up company. This impairment was based on our lack of expected recovery of our investment based on the start-up company’s lack of profitability.
Note 6: Goodwill
The carrying amount of goodwill for 2005 and 2006 are as follows:
| Amount | |||||
|---|---|---|---|---|---|
| (in thousands) | |||||
| Balance as of December 31, 2004 | $ | 13,356 | |||
| Acquisitions/purchase accounting adjustments | 39,177 | ||||
| Divestitures | — | ||||
| Balance as of December 31, 2005 | 52,533 | ||||
| Acquisitions/purchase accounting adjustments | — | ||||
| Divestitures | — | ||||
| Foreign currency translation impact | 810 | ||||
| Balance as of December 31, 2006 | $ | 53,343 | |||
The excess purchase price over the fair value of assets acquired is recorded as goodwill. In accordance with SFAS 142,Goodwill and Other Intangible Assets, goodwill is tested for impairment on an annual basis, and between annual tests if indicators of potential impairment exist, using a fair-value-based approach. Our annual impairment test was performed on April 6, 2006. No impairment of goodwill was identified during any of the periods presented.
Note 7: Income taxes
The components of income before income taxes are as follows (in thousands):
| Years Ended December 31, | |||||||||||
|---|---|---|---|---|---|---|---|---|---|---|---|
| 2006 | 2005 | 2004 | |||||||||
| Domestic | $ | 40,681 | $ | 40,460 | $ | 37,786 | |||||
| Foreign | 54,621 | 40,220 | 27,027 | ||||||||
| $ | 95,302 | $ | 80,680 | $ | 64,813 | ||||||
The provision for income taxes charged to operations is as follows (in thousands):
| Years Ended December 31, | |||||||||||
|---|---|---|---|---|---|---|---|---|---|---|---|
| 2006 | 2005 | 2004 | |||||||||
| Current tax expense: | |||||||||||
| U.S. federal | $ | 17,966 | $ | 11,022 | $ | 10,594 | |||||
| State | 901 | 1,029 | 1,106 | ||||||||
| Foreign | 5,190 | 3,725 | 3,300 | ||||||||
| Total current | 24,057 | 15,776 | 15,000 | ||||||||
| Deferred tax expense (benefit): | |||||||||||
| U.S. federal | (1,233 | ) | 2,396 | 1,041 | |||||||
| State | (90 | ) | (102 | ) | 121 | ||||||
| Foreign | (140 | ) | 1,093 | 41 | |||||||
| Total deferred | (1,463 | ) | 3,387 | 1,203 | |||||||
| Total provision | $ | 22,594 | $ | 19,163 | $ | 16,203 | |||||
Deferred tax liabilities (assets) at December 31, 2006 and 2005 as follows (in thousands):
| December 31, | ||||||||
|---|---|---|---|---|---|---|---|---|
| 2006 | 2005 | |||||||
| Capitalized software | $ | 5,392 | $ | 6,288 | ||||
| Unrealized gain on derivative instruments | — | 86 | ||||||
| Depreciation and amortization | 9,071 | 8,598 | ||||||
| Unrealized exchange gain | 2 | 1,238 | ||||||
| Undistributed earnings of foreign subsidiaries | 10,313 | 4,410 | ||||||
| Gross deferred tax liabilities | 24,778 | 20,620 | ||||||
| Operating loss carryforwards | (34,154 | ) | (22,672 | ) | ||||
| Intangibles | (85,684 | ) | (71,125 | ) | ||||
| Vacation and other accruals | (3,783 | ) | (2,946 | ) | ||||
| Inventory valuation and warranty provisions | (6,666 | ) | (9,043 | ) | ||||
| Doubtful accounts and sales provisions | (1,328 | ) | (1,545 | ) | ||||
| Intercompany profit | (3,242 | ) | (2,442 | ) | ||||
| Deferred revenue | (2,613 | ) | — | |||||
| Accrued rent expenses | (17 | ) | (17 | ) | ||||
| Accrued legal expenses | (1,450 | ) | (12 | ) | ||||
| Unrealized loss on derivative instruments | (149 | ) | — | |||||
| 10% minority stock investment | (906 | ) | (911 | ) | ||||
| Stock-based compensation | (1,954 | ) | (563 | ) | ||||
| Other | (691 | ) | (629 | ) | ||||
| Gross deferred tax assets | (142,637 | ) | (111,905 | ) | ||||
| Valuation allowance | 117,768 | 91,534 | ||||||
| Net deferred tax liability (asset) | $ | (91 | ) | $ | 249 | |||
A reconciliation of income taxes at the U.S. federal statutory income tax rate to the effective tax rate follows:
| Years Ended December 31, | |||||||||||
|---|---|---|---|---|---|---|---|---|---|---|---|
| 2006 | 2005 | 2004 | |||||||||
| U.S. federal statutory tax rate | 35 | % | 35 | % | 35 | % | |||||
| Foreign sales corporation/ETI benefit | (1 | ) | (2 | ) | (3 | ) | |||||
| Domestic production activities | (1 | ) | (1 | ) | — | ||||||
| Foreign taxes more (less) than federal statutory rate | (11 | ) | (7 | ) | (6 | ) | |||||
| Change in valuation allowance | — | (1 | ) | — | |||||||
| Research and development tax credit | (1 | ) | (1 | ) | (1 | ) | |||||
| Tax exempt interest | (1 | ) | (1 | ) | (1 | ) | |||||
| State income taxes, net of federal tax benefit | 1 | 1 | 1 | ||||||||
| Employee share-based compensation | 3 | — | — | ||||||||
| Other | — | 1 | — | ||||||||
| Effective tax rate | 24 | % | 24 | % | 25 | % | |||||
As of December 31, 2006, thirteen of our subsidiaries have available, for income tax purposes, foreign net operating loss carryforwards of an aggregate of approximately $214.4 million, of which $8.5 million expire during the years 2008 — 2013 and $205.9 million of which may be carried forward indefinitely. Our tax valuation allowance relates to the realizability of certain of these foreign net operating loss carryforwards and benefits of tax deductible goodwill in excess of book goodwill.
We maintain a manufacturing facility in Hungary. As a result of certain foreign investment incentives available under Hungarian law, the profit from our Hungarian operation is currently subject to a reduced income tax rate. Based on our capital investment in Hungary and current exemption limits which apply to this and any capital investments made through December 31, 2005, we currently expect this special tax status will terminate on or before December 31, 2008. The aggregate tax benefit of the exemption was $5.4 million and $3.4 million for the years ended December 31, 2006 and 2005, respectively.
In 2003, we restructured the organization of our manufacturing operation in Hungary. The tax deductible goodwill in excess of book goodwill created by this restructuring resulted in our being required to record a gross deferred tax asset of $91.0 million. The amortization of this excess tax deductible goodwill resulted in a $32.1 million and $20.1 million deferred tax asset for the associated net operating loss for the years ended December 31, 2006 and 2005, respectively. As of December 31, 2006 and 2005, the gross deferred tax asset related to the excess tax goodwill was $85.7 million and $71.1 million, respectively. Because we do not expect to have significant taxable income in the relevant jurisdiction in future periods to realize the benefit of these deferred tax assets, a valuation allowance for the entire amount of these deferred tax assets has been established.
We have not provided for U.S. federal income and foreign withholding taxes on approximately $111.8 million of certain non-U.S. subsidiaries’ undistributed earnings as of December 31, 2006. These earnings would become subject to taxes of approximately $36.5 million, if they were actually or deemed to be remitted to the parent company as dividends or if we should sell our stock in these subsidiaries. We currently intend to reinvest indefinitely these undistributed earnings.
Note 8: Stockholders’ equity
In
(FASB ASC 280), we determine operating segments using the management approach. The estimated fair value amounts disclosed below have been determined using available market informationmanagement approach designates the internal organization that is used by management for making operating decisions and valuation methodologies described below. For certainassessing performance as the source of our financial instruments, including cashoperating segments. It also requires disclosures about products and cash equivalents, accounts receivable, accounts payableservices, geographic areas and accrued liabilities,major customers.
| December 31, | ||||||||||||||
|---|---|---|---|---|---|---|---|---|---|---|---|---|---|---|
| 2006 | 2005 | |||||||||||||
| Carrying Amount | Fair Value | Carrying Amount | Fair Value | |||||||||||
| Short-term investments | $ | 150,190 | $ | 150,190 | $ | 119,846 | $ | 119,846 | ||||||
| Other assets/liabilities: | ||||||||||||||
| Forward contracts | (1,043 | ) | (1,043 | ) | 523 | 523 | ||||||||
The fair values of short-term investments
| Years Ended December 31, | ||||||||||||
| 2009 | 2008 | 2007 | ||||||||||
| Net sales: | ||||||||||||
| Americas: | ||||||||||||
Unaffiliated customer sales | $ | 292,999 | $ | 355,878 | $ | 331,482 | ||||||
Geographic transfers | 86,145 | 132,563 | 115,709 | |||||||||
| 379,144 | 488,441 | 447,191 | ||||||||||
| Europe: | ||||||||||||
Unaffiliated customer sales | 210,188 | 267,373 | 230,940 | |||||||||
Geographic transfers | 189,076 | 204,282 | 159,992 | |||||||||
| 399,264 | 471,655 | 390,932 | ||||||||||
| Asia Pacific: | ||||||||||||
Unaffiliated customer sales | 173,407 | 197,286 | 177,956 | |||||||||
| Eliminations | (275,221 | ) | (336,845 | ) | (275,701 | ) | ||||||
| $ | 676,594 | $ | 820,537 | $ | 740,378 | |||||||
| Years Ended December 31, | ||||||||||||
| 2009 | 2008 | 2007 | ||||||||||
| Operating income: | ||||||||||||
| Americas | $ | 46,816 | $ | 71,467 | $ | 76,292 | ||||||
| Europe | 87,250 | 105,748 | 92,469 | |||||||||
| Asia Pacific | 45,439 | 61,642 | 59,845 | |||||||||
Unallocated: | ||||||||||||
| Research and development expenses | (132,974 | ) | (143,140 | ) | (126,515 | ) | ||||||
| $ | 46,531 | $ | 95,717 | $ | 102,091 | |||||||
| Years Ended December 31, | ||||||||||||
| 2009 | 2008 | 2007 | ||||||||||
| Interest income: | ||||||||||||
| Americas | $ | 803 | $ | 2,603 | $ | 5,138 | ||||||
| Europe | 727 | 3,291 | 4,485 | |||||||||
| Asia Pacific | 99 | 102 | 199 | |||||||||
| $ | 1,629 | $ | 5,996 | $ | 9,822 | |||||||
| December 31, | ||||||||
| 2009 | 2008 | |||||||
| Long-lived assets: | ||||||||
| Americas | $ | 100,489 | $ | 107,701 | ||||
| Europe | 36,555 | 39,280 | ||||||
| Asia Pacific | 16,221 | 7,496 | ||||||
| $ | 153,265 | $ | 154,477 | |||||
We maintain a foreign-currency risk management strategy that uses derivative instruments (foreign currency forward and purchased options contracts) to protect our earnings and cash flows from fluctuations caused by the volatility in currency exchange rates. Movements in foreign-currency exchange rates pose a risk to our operations and competitive position, since exchange rate changes may affect our profitability and cash flow, and the business or pricing strategies of our non-U.S. based competitors.
Foreign currency fair value and cash flow hedges
The vast majority of our foreign sales are denominated in the customers’ local currency. We purchase foreign currency forward and purchased options contracts as hedges of forecasted sales that are denominated in foreign currencies and as hedges of foreign currency denominated receivables. These contracts are entered into to protect against the risk that the eventual dollar-net-cash inflows resulting from such sales or firm commitments will be adversely affected by changes in exchange rates.
We held forward contracts with notional amounts totaling $19.6follows (in thousands):
| 2010 | $ | 14,415 | ||
| 2011 | 9,898 | |||
| 2012 | 6,982 | |||
| 2013 | 4,611 | |||
| 2014 | 3,665 | |||
| Thereafter | 12,130 | |||
| $ | 51,701 |
We held forward contracts withU.S. patents. On January 30, 2003, a notionaljury found infringement by MathWorks of three of the patents involved and awarded us specified damages. On September 23, 2003, the District Court entered final judgment in favor of us and entered an injunction against MathWorks’ sale of its Simulink and related products and stayed the injunction pending appeal. Upon appeal, the judgment and the injunction were affirmed by the U.S. Court of Appeals for the Federal Circuit (September 3, 2004). Subsequently the stay of injunction was lifted by the District Court. In November 2004, the final judgment amount of $26.6$7.4 million which had been held in escrow pending appeal was released to us.
| Goodwill | $ | 10,818 | ||
| Acquired core technology | 5,201 | |||
| Non-competition agreements | 159 | |||
| Trademarks | 119 | |||
| Customer relationships | 354 | |||
| Current assets acquired | 3,057 | |||
| Long-term assets acquired | 20 | |||
| Current liabilities assumed | (486 | ) | ||
| Deferred tax liabilities | (1,458 | ) | ||
| Total assets acquired | $ | 17,784 |
As of December 31, 2006, $427,000 of deferred losses on cash flow hedges recorded in “Accumulated Other Comprehensive Income” are expected to be reclassified to earnings during the next twelve months. The actual foreign sales expected to occur over the next twelve months will necessitate the reclassifying to earnings of these derivative gains.
Hedge effectiveness of a foreign currency option contract designated as a cash flow hedge is measured by comparing the hedging instrument’s cumulative change in fair value from inception to maturity to the forecasted transaction’s terminal value. No amounts were excluded from the assessment of hedge effectiveness nor were there any amounts of ineffectiveness recorded in the consolidated statements of income for the years ended December 31, 2006 and 2005.
Note 12: Segment information
In accordance with SFAS 131,Disclosures about Segments of an Enterprise and Related Information, we determine operating segments using the management approach. The management approach designates the internal organization that is used by management for making operating decisions and assessing performance as the source of our operating segments. It also requires disclosures about products and services, geographic areas and major customers.
While we sell our products to many different markets, management has chosen to organize the Company by geographic areas, and as a result has determined that we have one operating segment. Substantially all of the interest income, depreciation and amortization is recorded in the Americas. Net sales, operating income and identifiable assets, classified by the major geographic areas in which we operate,2009 are as follows (in thousands)thousands, except per share data):
| Years Ended December 31, | |||||||||||
|---|---|---|---|---|---|---|---|---|---|---|---|
| 2006 | 2005 | 2004 | |||||||||
| Net sales: | |||||||||||
| Americas: | |||||||||||
| Unaffiliated customer sales | $ | 317,780 | $ | 275,524 | $ | 243,651 | |||||
| Geographic transfers | 125,096 | 87,072 | 84,520 | ||||||||
| 442,876 | 362,596 | 328,171 | |||||||||
| Europe: | |||||||||||
| Unaffiliated customer sales | 193,364 | 171,499 | 164,895 | ||||||||
| Geographic transfers | 159,369 | 125,650 | 99,958 | ||||||||
| 352,733 | 297,149 | 264,853 | |||||||||
| Asia Pacific: | |||||||||||
| Unaffiliated customer sales | 149,263 | 124,818 | 105,542 | ||||||||
| Eliminations | (284,465 | ) | (212,722 | ) | (184,478 | ) | |||||
| $ | 660,407 | $ | 571,841 | $ | 514,088 | ||||||
Years Ended December 31, | |||||||||||
|---|---|---|---|---|---|---|---|---|---|---|---|
| 2006 | 2005 | 2004 | |||||||||
| Operating income: | |||||||||||
| Americas | $ | 67,644 | $ | 63,267 | $ | 53,472 | |||||
| Europe | 78,402 | 61,790 | 55,705 | ||||||||
| Asia Pacific | 54,771 | 40,996 | 38,211 | ||||||||
| Unallocated: | |||||||||||
| Research and development expenses | (113,095 | ) | (87,841 | ) | (84,692 | ) | |||||
| $ | 87,722 | $ | 78,212 | $ | 62,696 | ||||||
December 31, | ||||||||
|---|---|---|---|---|---|---|---|---|
| 2006 | 2005 | |||||||
| Identifiable assets: | ||||||||
| Americas | $ | 476,027 | $ | 436,170 | ||||
| Europe | 188,388 | 129,420 | ||||||
| Asia Pacific | 56,805 | 42,746 | ||||||
| $ | 721,220 | $ | 608,336 | |||||
Total sales outside
| Three Months Ended | ||||||||||||||||
Mar. 31, 2009 | Jun. 30, 2009 | Sep. 30, 2009 | Dec. 31, 2009 | |||||||||||||
| Net sales | $ | 157,799 | $ | 152,163 | $ | 165,035 | $ | 201,597 | ||||||||
| Gross profit | 116,916 | 111,677 | 123,136 | 154,981 | ||||||||||||
| Operating income | (2,479 | ) | 2,341 | 10,688 | 35,981 | |||||||||||
| Net income | 358 | 4,430 | 9,931 | 2,366 | ||||||||||||
| Basic earnings per share | $ | 0.00 | $ | 0.06 | $ | 0.13 | $ | 0.03 | ||||||||
| Weighted average shares outstanding-basic | 77,277 | 77,556 | 77,653 | 77,589 | ||||||||||||
| Diluted earnings per share | $ | 0.00 | $ | 0.06 | $ | 0.13 | $ | 0.03 | ||||||||
| Weighted average shares outstanding-diluted | 77,436 | 77,824 | 78,103 | 78,325 | ||||||||||||
| Dividends declared per share | $ | 0.12 | $ | 0.12 | $ | 0.12 | $ | 0.12 | ||||||||
| Three Months Ended | ||||||||||||||||
Mar. 31, 2008 | Jun. 30, 2008 | Sep. 30, 2008 | Dec. 31, 2008 | |||||||||||||
| Net sales | $ | 192,918 | $ | 210,474 | $ | 215,038 | $ | 202,107 | ||||||||
| Gross profit | 143,849 | 157,034 | 160,531 | 152,014 | ||||||||||||
| Operating income | 18,065 | 27,834 | 27,946 | 21,872 | ||||||||||||
| Net income | 17,616 | 24,734 | 23,159 | 19,318 | ||||||||||||
| Basic earnings per share | $ | 0.22 | $ | 0.32 | $ | 0.29 | $ | 0.25 | ||||||||
| Weighted average shares outstanding-basic | 78,840 | 78,484 | 78,834 | 78,110 | ||||||||||||
| Diluted earnings per share | $ | 0.22 | $ | 0.31 | $ | 0.29 | $ | 0.25 | ||||||||
| Weighted average shares outstanding-diluted | 79,825 | 79,549 | 79,841 | 78,522 | ||||||||||||
| Dividends declared per share | $ | 0.11 | $ | 0.11 | $ | 0.11 | $ | 0.11 | ||||||||
Note 13: Commitments, contingencies and leases
| 2007 | $ | 7,241 | |||
| 2008 | 5,682 | ||||
| 2009 | 4,883 | ||||
| 2010 | 3,103 | ||||
| 2011 | 1,983 | ||||
| Thereafter | 799 | ||||
| $ | 23,691 | ||||
| Fiscal Year | Cost of Sales | Acquisition related costs and amortization, net | Total | ||||||||
|---|---|---|---|---|---|---|---|---|---|---|---|
| 2007 | $ | 2,689 | $ | 450 | $ | 3,139 | |||||
| 2008 | 2,532 | 412 | 2,944 | ||||||||
| 2009 | 2,259 | 338 | 2,597 | ||||||||
| 2010 | 1,725 | 177 | 1,902 | ||||||||
| Thereafter | 1,166 | 271 | 1,437 | ||||||||
| Total | $ | 10,371 | $ | 1,648 | $ | 12,019 | |||||
| Three Months Ended | ||||||||||||||
|---|---|---|---|---|---|---|---|---|---|---|---|---|---|---|
| Mar. 31, 2006 | Jun. 30, 2006 | Sep. 30, 2006 | Dec. 31, 2006 | |||||||||||
| Net sales | $ | 154,752 | $ | 160,123 | $ | 164,079 | $ | 181,453 | ||||||
| Gross profit | 113,247 | 119,271 | 121,648 | 135,915 | ||||||||||
| Operating income | 15,826 | 20,911 | 22,367 | 28,616 | ||||||||||
| Net income | 12,602 | 17,021 | 18,651 | 24,434 | ||||||||||
| Basic earnings per share | $ | 0.16 | $ | 0.21 | $ | 0.23 | $ | 0.31 | ||||||
| Weighted average shares outstanding-basic | 79,053 | 79,611 | 79,637 | 79,767 | ||||||||||
| Diluted earnings per share | $ | 0.15 | $ | 0.21 | $ | 0.23 | $ | 0.30 | ||||||
| Weighted average shares outstanding-diluted | 81,608 | 81,653 | 81,274 | 81,524 | ||||||||||
| Dividends declared per share | $ | 0.06 | $ | 0.06 | $ | 0.06 | $ | 0.06 | ||||||
Three Months Ended | ||||||||||||||
|---|---|---|---|---|---|---|---|---|---|---|---|---|---|---|
| Mar. 31, 2005 | Jun. 30, 2005 | Sep. 30, 2005 | Dec. 31, 2005 | |||||||||||
| Net sales | $ | 129,740 | $ | 140,822 | $ | 141,618 | $ | 159,661 | ||||||
| Gross profit | 97,376 | 104,109 | 103,725 | 117,322 | ||||||||||
| Operating income | 14,182 | 19,093 | 18,343 | 26,594 | ||||||||||
| Net income | 11,136 | 15,024 | 14,399 | 20,958 | ||||||||||
| Basic earnings per share | $ | 0.14 | $ | 0.19 | $ | 0.18 | $ | 0.27 | ||||||
| Weighted average shares outstanding-basic | 79,175 | 78,303 | 78,158 | 78,505 | ||||||||||
| Diluted earnings per share | $ | 0.14 | $ | 0.19 | $ | 0.18 | $ | 0.26 | ||||||
| Weighted average shares outstanding-diluted | 81,924 | 80,190 | 80,575 | 80,821 | ||||||||||
| Dividends declared per share | $ | 0.05 | $ | 0.05 | $ | 0.05 | $ | 0.05 | ||||||
| Year | Description | Balance at Beginning of Period | Provision for Bad Debt Expense | Write-Offs Charged to Allowances | Balance at End of Period | ||||||||||||
|---|---|---|---|---|---|---|---|---|---|---|---|---|---|---|---|---|---|
| 2004 | Allowance for doubtful accounts and sales returns | $ | 3,244 | $ | 596 | $ | 329 | $ | 3,511 | ||||||||
| 2005 | Allowance for doubtful accounts and sales returns | 3,511 | 1,462 | 239 | 4,734 | ||||||||||||
| 2006 | Allowance for doubtful accounts and sales returns | 4,734 | 33 | 407 | 4,360 | ||||||||||||