
UNITED STATES
SECURITIES AND EXCHANGE COMMISSION
Washington, D.C. 20549
FORM 10-K
T ANNUAL REPORT PURSUANT TO SECTION 13 OR 15(D) OF THE SECURITIES EXCHANGE ACT OF 1934
For the fiscal year ended: December 31, 20092012 or
£ TRANSITION REPORT PURSUANT TO SECTION 13 OR 15(D) OF THE SECURITIES EXCHANGE ACT OF 1934
For the transition period from ________________ to ________________
Commission file number: 0-25426
![]()
NATIONAL INSTRUMENTS CORPORATION
(Exact name of registrant as specified in its charter)
Delaware | 74-1871327 | |
(State or other jurisdiction of incorporation or organization) | (I.R.S. Employer Identification Number) | |
11500 North MoPac Expressway Austin, Texas | 78759 | |
(address of principal executive offices) | (zip code) |
Registrant's telephone number, including area code: (512) 338-9119
Securities registered pursuant to Section 12(b) of the Act:
Title of Each Class | Name of Each Exchange on Which Registered | |
Common Stock, $0.01 par value | The NASDAQ Stock Market, LLC |
Securities registered pursuant to Section 12(g) of the Act:
Preferred Stock Purchase Rights
Indicate by check mark if the registrant is a well-known seasoned issuer, as defined in Rule 405 of the Securities Act. Yes Tx No £¨
Indicate by check mark if the registrant is not required to file reports pursuant to Section 13 or Section 15(d) of the Act. Yes £¨ No Tx
Indicate by check mark whether the registrant (1) has filed all reports required to be filed by Section 13 or 15(d) of the Securities Exchange Act of 1934 during the preceding 12 months (or for such shorter period that the registrant was required to file such reports), and (2) has been subject to such filing requirements for the past 90 days. Yes Tx No £¨
Indicate by check mark whether the registrant has submitted electronically and posted on its corporate Web site, if any, every Interactive Data File required to be submitted and posted pursuant to Rule 405 of Regulation S-T (§232.405 of this chapter) during the preceding 12 months (or for such shorter period that the registrant was required to submit and post such files). Yes £x No £¨
Indicate by check mark if disclosure of delinquent filers pursuant to Item 405 of Regulation S-K (§229.405 of this chapter) is not contained herein, and will not be contained, to the best of registrant’s knowledge, in definitive proxy or information statements incorporated by reference in Part III of this Form 10-K or any amendment to this Form 10-K. T£
Indicate by check mark whether the registrant is a large accelerated filer, an accelerated filer, a non-accelerated filer or a smaller reporting company. See the definitions of “large accelerated filer”, “accelerated filer” and “smaller reporting company” in Rule 12b-2 of the Exchange Act. (Check one):
Large accelerated filer Tx Accelerated filer £¨ Non-accelerated filer£¨Smaller reporting company £¨
Indicate by check mark whether the registrant is a shell company (as defined in Rule 12b-2 of the Act). Yes £¨ No Tx
The aggregate market value of voting and non-voting common equity held by non-affiliates of the registrant at the close of business on June 30, 2009,2012, was $974,659,387$1,789,299,018 based upon the last sales price reported for such date on the NASDAQ Stock Market. For purposes of this disclosure, shares of Common Stock held by persons who hold more than 5% of the outstanding shares of Common Stock and shares held by officers and directors of the registrant as of June 30, 20092012, have been excluded in that such persons may be deemed to be affiliates. This determinationdetermination is not necessarily conclusive.
At the close of business on February 16, 201014, 2013, registrant had outstanding 78,352,719123,423,525 shares of Common Stock.
1
DOCUMENTS INCORPORATED BY REFERENCE
Part III incorporates certain information by reference from the definitive proxy statement to be filed by the registrant for its Annual Meeting of Stockholders to be held on May 11, 201014, 2013 (the “Proxy Statement”).
PART I
This Form 10-K contains forward-looking statements within the meaning of Section 27A of the Securities Act of 1933 and Section 21E of the Securities Exchange Act of 1934. Any statements contained herein regarding our future financial performance, operations, or operationsother matters (including, without limitation, statements to the effect that we “believe,” “expect,” “plan,” “may,” “will,” “project,” “continue,” or “estimate” or other variations thereof or comparable terminology or the negative thereof) should be considered forward-looking statements. Actual results could differ materially from those projected in the forward-looking statements as a result of a number of important factors including those set forth under the heading “Risk Factors”“Risk Factors” beginning on page 10,11, and elsewhere in this Form 10-K. Although we believe that the expectations reflected in the forward-looking statements are reasonable, we cannot guarantee future results, levels of activity, performance or achievements. You should not place undue reliance on these forward-looking statements. We disclaim any obligation to update information contained in any forward-looking statement.
National Instruments Corporation (“we”NI”, “we”, “us” or “our”) is a leading supplier of measurementdesigns, manufactures and automation products thatsells tools to engineers and scientists use in a wide range of industries. These industries comprise a largethat accelerate productivity, innovation and diverse market fordiscovery. Our graphical system design control and test applications. We provide flexible applicationapproach to engineering provides an integrated software and modular, multifunction hardware platform that users combine with industry-standard computers, networksspeeds the development of systems needing measurement and third-party devices to create measurement, automationcontrol. We believe our long-term vision and embedded systems, which we also refer to as “virtual instruments.” Our approach givesfocus on technology supports the success of our customers, the ability to quicklyemployees, suppliers and cost-effectively design, prototype and deploy unique custom-defined solutions for their design, control and test application needs.
We are based in Austin, Texas, and were incorporated under the laws of the State of Texas in May 1976 and were reincorporated in Delaware in June 1994. OnIn March 13, 1995, we completed an initial public offering of our common stock. Our common stock, $0.01 par value, is quoted on the NASDAQ Stock Market under the trading symbol NATI.
Our Internet website address is http://www.ni.com. Our annual report on Form 10-K, quarterly reports on Form 10-Q, current reports on Form 8-K and amendments to those reports filed or furnished pursuant to Section 13(a) or 15(d) of the Securities Exchange Act of 1934 and every Interactive Data File required to be submitted and posted pursuant to Rule 405 of Regulation S-T are available upon written request and without charge through our Internet website as soon as reasonably practicable after we electronically file such materialmaterials with, or furnish them to, the SEC.SEC, or upon written request without charge. Our Internet website and the information contained therein or connected thereto are not intended to be incorporated into this Annual Report on Form 10-K.
Industry Background
Engineers and scientists have long used instrumentsuse instrumentation to observe, better understand and manage the real-world phenomena, events and processes related to their industries or areas of expertise. InstrumentsInstrumentation systems measure and control electrical signals, such as voltage, current and power, as well as physical phenomena, such as temperature, pressure, speed, flow, volume, torque and vibration. Common general-purpose instruments include voltmeters, signal generators, oscilloscopes, data loggers, spectrum analyzers, cameras, and temperature and pressure monitors and controllers. Some traditional instruments are also highly application specific,application-specific, designed with fixed functionality to measure specific signals for particular vertical industries or applications. Instruments used for industrial automation applications include data loggers, strip chart recorders, programmable logic controllers (“PLCs”), and proprietary turn-key devices and/or systems designed to automate or control specific vertical applications. Measurement
Systems that perform measurement and control functionality is also used in a variety of embedded and/or real-time applications, such as machine monitoring, machine control, and embedded design and prototyping.
Historically, engineers and scientists have used a variety of high-cost systems for design, control,that operated independently and test applications have historically shared common limitations, including: fixed, vendor-defined functionality, proprietary, closed architectures that were generallycould be difficult to program and integrate with other systems; and inflexible operator interfaces that were usually cumbersomecustomize. Due to operate and change. Proprietary instrumentation systems have traditionally been very expensive, with industrial/embedded system prices ranging as high as several million dollars and T&M instrumentation system prices often ranging in the hundreds of thousands of dollars. In addition, the limitations on the programmability of traditional systems means that adapting these systems, adapting them to changing requirementsneeds can be both expensive and time consuming,time-consuming, and users aremust often required to purchase multiple single-purpose instruments.instruments, controllers, loggers and other peripherals.
2
Our Approach to Measurement and Automation
NI offers a user-defineddifferent approach called graphical system design. This approach provides an integrated hardware and software platform for measurement and automation system that consists of an industry standard computer (which may be a mainstream general-purpose computer, workstation, handheld PDA device, or a version of an industry standard computer, workstation, or handheld PDA that is specially designed and packaged for harsh industrial or embedded environments) equipped with our user-friendly application software, cost-effective hardware and driver software. Virtual instrumentation represents a fundamental shift from traditional hardware-centered instrumentation systems to software-centered systems that exploit the computational, display, productivity and connectivity capabilities of computers, networks and the Internet. Because virtual instruments exploit these computation, connectivity, and display capabilities, users can define and change the functionality of their instruments, rather than being restricted by fixed-functions imposed by traditional instrument and automation vendors. Our products empower users to monitor and control traditional instruments, create innovative computer-based systems that can replacebe defined entirely by the customer. This allows systems to more easily adapt to changing requirements and technologies over time. NI hardware and software also leverage commercially available technology whenever possible to deliver performance and cost benefits to our customers. Therefore these customer-defined systems are more flexible, with higher performance and lower costs, compared to traditional instruments at a lower cost,vendor-defined systems.
NI equips engineers and scientists with tools that accelerate productivity, innovation and discovery. Our customers use our platform to develop systems that integratetest, measurement, functionality together with industrialcontrol and embedded capabilities. We believe that giving users flexibilitysystems throughout various industries from design to create their own user-defined virtual instruments for an increasing number of applicationsproduction; in a wide variety of industries,advanced research, and letting users leverage the latest technologies from computers, networkingin teaching engineering and communications shortens system development time and reduces both the short- and long-term costs of developing, owning and operating measurement and automation systems, and improves the efficiency and precision of applications spanning research, design, production and service.
Compared with traditional solutions, we believe our products and computer-based, virtual instrumentation approach provideour graphical system design platform provides the following significant customer benefits:
Abstraction of UseComplexity to Speed Development
Customers face changing requirements and technologies while creating more intelligent systems with fewer resources than ever. Our software-based approach abstracts the complexity of creating these systems by providing higher level interfaces to access changing technology and a way to easily upgrade through software while other fixed function systems require new hardware. When hardware changes are required, our modular, reconfigurable platforms easily migrate users to change only the functions they need while preserving software continuity over time. In this way, the graphical system design platform-based approach accelerates the development of any system that needs measurement and control.
Performance and Efficiency
Our virtual instrument application software brings the power and ease of use ofcommercial computers, PDAs,handheld devices, networks and the Internetinternet to instrumentation.instrumentation and embedded devices. With features such as graphical programming, automatic code generation, capabilities, graphical tools libraries, ready-to-use example programs, libraries of specific instrumentation functions, and the ability to deploy their applications on a range of platforms, usersscientists and engineers can quickly build a virtual instrument system that meets their individual application needs. In addition,Because the continuous performance improvement of PCpersonal computers (“PC”), Field Programmable Gate Arrays (“FPGA”) and networking technologies which are the core platformplatforms for our approach, results inscientists and engineers can quickly realize direct performance benefits, for virtual instrument users in the form of faster execution for software-based measurement and automation applications, resulting in shorter test times, faster automation, higher performing embedded systems and higher manufacturing throughput.
Modularity, Reusability and Reconfigurability
Our products include reusable hardware and software modules that offerto provide considerable flexibility in configuring systems. This ability to reuse and reconfigure measurement and automation systems allows users to reduce development time and improve efficiency by eliminating duplicated programming efforts and to quickly adapt their systems to new and changing needs.needs, eliminate duplicated programming efforts, and ultimately improve their efficiency and productivity. In addition, these features help protect both hardware and software investments against obsolescence.
Lower Total Solution Cost
National Instruments solutions offer price/price to performance and energy efficiencyenergy-efficiency advantages over traditional solutions. Virtual instrumentation provides users the ability to utilize industry standard computers and workstations, portable PDAs and other handheld devices, as well as ruggedized industrial computers equipped with modular and reusable application software, cost-effective hardware and driver software that together perform the functions that would otherwise be performed by costly, proprietary systems. Graphical system design allows customers to equip powerful industry-standard computers, with reusable system design software and modular cost-effective hardware. In addition, virtual instrumentation gives usersthese systems give engineers and scientists the flexibility and portability to adapt to changing needs, whereaswhile offering a smaller form factor that occupies less space on the manufacturing floor and consumes less energy than traditional closed systems are both expensive and time consuming to adapt, if adaptable at all.
Products, Technology and Services
We offer an extensive line of measurement and automation products that empower engineers and scientists to more efficiently create automated test, industrial control and embedded design applications. Our products consist of off-the-shelf application software and modular, cost-effective hardware components together with related driver software. We design our products to work either separately, as stand-alone products or as an integrated solution; however, customers generally purchase our software and hardware together. We believe that the flexibility, functionality and ease of use of our applicationsystem design software promotes sales of our other software and hardware products.
3
System Design Software
For more than 2025 years, we have pioneeredNI has invested in its flagship software product, LabVIEW, which the company believes is the ultimate system design software for measurement and automation application software for virtual instrumentation, which we believe plays an increasingly important role in the development of computer-based systems for test, control,control. LabVIEW promotes problem-solving, accelerates productivity, and design applications. Our application software products leverage the increasing capability of computers, networksempowers innovation. With LabVIEW, users program graphically and the Internet for data analysis, connectivity and presentation power to bring increasing efficiency and precision to measurement and automation applications. Our application software products include LabVIEW, LabVIEW Real-Time, LabVIEW FPGA, Measurement Studio, LabWindows/CVI, DIAdem, NI TestStand, NI VeriStand, and Multisim. Our application software products are integrated with our hardware/driver software.
NI believes that LabVIEW LabWindows/CVIis a comprehensive development environment with the hardware integration and Measurement Studiowide-ranging compatibility that engineers and scientists need to design and deploy measurement and control systems. The LabVIEW programming environment is graphical, with engineering-specific libraries of software functions and hardware interfaces. It also offers data analysis, visualization and sharing features. Engineers and scientists can bring their vision to life with LabVIEW, and have ready-to-use libraries for controlling thousandsaccess to a vast ecosystem of programmable instruments, including ourpartners and technology alliances, and a global and active user community to innovate with confidence. When customers use LabVIEW, combined with the modular hardware products, as well as traditional serial, General Purpose Interface Bus (“GPIB”), VME extensions for instrumentation (“VXI”), PCI, PCI Express,approach with NI Data Acquisition, CompactRIO and PCI Extensions for Instrumentation (“PXI”), PXI Express, Ethernet platforms, they are able to quickly integrate system components and USB measurementdo their jobs faster, better and automation devices from other vendors.
LabVIEW LabWindows/CVI,Real-Time and Measurement Studio is in the way users develop programs. With LabVIEW users program graphically, developing application programs by connecting icons to create “block diagrams” whichFPGA are natural design notations for scientists and engineers.strategic modular software add-ons. With LabVIEW Real-Time, the user can easily configure their application program to execute using a real-time operating system kernel instead of the Windows operating system, so users can easily build virtual instrument solutions for mission-critical applications that require highly reliable operation.applications. In addition, with LabVIEW Real-Time, users can easily configure their programs to executeoperate remotely on embedded processors inside PXIin PXI-based systems, on embedded processors inside CompactRIO distributed I/O systems, or on processors embedded on plug-in PC data acquisition boards. With LabVIEW FPGA, the user can configure their application to execute directly in silicon via a Field Programmable Gate Array (“FPGA”) residing on one of our reconfigurable I/O hardware products. LabVIEW FPGA allows users to easily build their own highly specialized, custom hardware devices for ultra high-performance requirements or for unique or proprietary measurement or control protocols.
Programming Tools
In addition to LabVIEW, NI offers LabWindows/CVI and Measurement Studio as alternative programming environments. LabWindows/CVI users use the conventional, text-based programming language of C for creating test and control applications. Measurement Studio consists of measurement and automation add-on libraries and additional tools for programmers that usewho prefer Microsoft’s Visual Basic, Visual C++, Visual C#, and Visual Studio.NET development environments.
Application Software
NI offers a suite of software product calledproducts, including NI TestStand, NI VeriStand, NI DIAdem and NI Multisim, which are complimentary to LabVIEW.
NI TestStand. NI TestStand is targeted for T&M applications in a manufacturing environment. TestStand is a test management environment for organizing, controlling, and running automated prototype, validation, and manufacturing test systems. It also generates customized test reports and integrates product and test data across the customers’ enterprise and across the Internet. TestStand manages tests that are written in LabVIEW, LabWindows/CVI, Measurement Studio, C and C++, and Visual Basic, so test engineers can easily share and re-use test code throughout their organization and from one product to the next. TestStand is a key element of our strategy to broaden the reach of our application software products across the corporate enterprise.
NI DIAVeriStand.dem offers users configuration-based technical data management, analysis, and report generation tools to interactively mine and analyze data. DIAdem helps users make informed decisions and meet the demands of today’s testing environments, which require quick access to large volumes of scattered data, consistent reporting, and data visualization.
NI DIAdem. NI DIAdem offers users configuration-based technical data management, analysis, and report generation tools to interactively mine and analyze data. DIAdem helps users make informed decisions and meet the demands of today’s testing environments, which require quick access to large volumes of scattered data, consistent reporting, and data visualization.
4
We offer volume licensing that helps customers maximize their software investment by reducing total cost of ownership and simplifying their software budgeting and purchasing.
Hardware Products and Related Driver Software
Using cutting-edge commercial technology, such as the latest ADCs, FPGSs,microprocessors, Analog to Digital Converters (“ADCs”), FPGAs, and PC busses, NIour hardware delivers modular and easy-to-use solutions for a wide range of applications – from automated test and data logging to industrial control and embedded design. Our hardware and related driver software products include data acquisition ("DAQ"(“DAQ”), PXI chassis and controllers, image acquisition, motion control, distributed I/O, modular instruments and embedded control hardware/software, industrial communications interfaces, GPIBGeneral Purpose Interface Bus (“GPIB”) interfaces, and VXIVME Extension for Instrumentation (“VXI”) Controllers. The high level of integration betweenamong our products provides users with the flexibility to mix and match hardware components when developing custom virtual instrumentation systems.
DAQData Acquisition (DAQ) Hardware/Driver Software.Our DAQ hardware and driver software products are “instruments on a board” that users can combine with sensors, signal conditioning hardware and software to acquire analog data and convert it into a digital format that can be accepted by a computer. Computer-based DAQ products are typically a lower-cost solution than traditional instrumentation.instrumentation and exploit the processing power, display, and connectivity capabilities of industry-standard computers. Applications suitable for automation with computer-based DAQ products are widespread throughout many industries, and many systems currently using traditional instrumentation (either manual or computer-controlled) could be displaced by computer-based DAQ systems. We offer a range of computer-based DAQ products including models for digital, analogwith a variety of form factors and timing input-output, and for transferring data directly to a computer’s random-access memory.degrees of performance. In 2006, we introduced NI CompactDAQ, a rugged, portable, USB data acquisition system designed for high-performance mixed-signal measurement systems. In 2008,Since its introduction, we introduced our first data acquisition deviceshave expanded the CompactDAQ platform with wireless and Ethernet technologies that leverage wireless technologies, an extensionhave extended the reach of PC-based data acquisitioncomputer-based DAQ from across the lab to around the world. The platform also offers high-performance stand-alone systems for embedded measurement applications where wiring is difficult or cost-prohibitive.and logging. NI DAQ products also include X Series DAQ which delivers state-of-the-art measurement, generation, timing and triggering on a single device.
PXI Modular Instrumentation Platform. Our PXI modular instrument platform, which was introduced in 1997, is a standard PC packaged in a small, rugged form factor with expansion slots and instrumentation extensions.extensions for timing, triggering and signal sharing. It combines mainstream PC software and PCI hardware with advanced instrumentation capabilities. In essence, PXI is an instrumentation PC with several expansion slots ideal forsupporting complete system-level opportunities and delivering a much higherhigh percentage of the overall system content using our own products. We continue to expand our PXI product offerings with new modules, which address a wide variety of measurement and automation applications. The platform is now a testing standard, with 70a wide array of companies developing on the platform and investing in its future through the PXI System Alliance ("PXISA"(“PXISA”). In 2006, we introduced our first PXI Express products which provide backward software compatibility with PXI while providing advanced capabilities for high-performance instrumentation, such as RF instrumentation. Today, we have a rapidly expanding portfolio of PXI Express products that are further expanding the capabilities of this important platform.
Modular Instruments. We offer a variety of modular instrument devices used in general purpose test and communication test applications. These devices include digitizers, digital multimeters, signal generators, RF analyzers/generators, power supplies, source measurement units and switch modules that users can configure through software to meet their specific measurement tasks. Because these instruments are modular and software-defined, they can be quickly interchanged and easily repurposed to meet evolving test needs. Additionally, NIour modular instruments provide high-speed test execution by harnessing the power of industry-standard PCPC’s FPGAs and advanced timing and synchronization technologies. Options are available for a variety of platforms including PXI, PXI Express, PCI, PCI Express, and USB.
Machine Vision/Image Acquisition. Our machine vision platform includes a range of hardware rangingplatform options, from embedded NI Smart Cameras that integrate the sensor and processor in a single package to plug-in devicesboards for PCI and PXI systems to image processing onsystems. We offer two scalable software options for use across the sensor itselfentire NI vision hardware portfolio. A user can configure a system with NI Vision Builder for Automated Inspection, an easy-to-use, stand-alone package for machine vision, or program it using the NI Vision Development Module, a comprehensive library of imaging functions. With NI Vision hardware, a user can build high-performance, PC based systems using the latest processor techniques with NI Frame Grabbers, save on cost and space by combining an image sensor and real-time embedded processors into one rugged, industrial package with NI Smart Camera. Software options include image acquisition softwareCameras, or harness multicore performance with fanless designs, connectivity to acquire images from thousands of cameras, a world-class image processing library, and a configurable interface for industrial machine vision applications. In 1996, we introduced our first image acquisition hardware which provides users with a cost-effective solution to integrate vision into their measurement and automation applications. Our vision software is designed to work with many different software environments, including LabVIEW. In 2003, we introduced our Vision Builder software for automated inspection and our Compact Vision System, which is a small, ruggedized, industrial vision system that can connect up to three IEEE-1394multiple cameras and that is easily programmed usingreconfigurable digital I/O with NI Vision Builder. In 2007, we introduced our first integrated Smart Cameras which leverage our LabVIEW software to provide integrated solutions for many inspection and other industrial/embedded applications.systems.
5
Motion Control. By integrating flexible software with high-performance hardware, our motion control products offer a powerful solution for motion system design. From automating test equipment and research labs to controlling biomedical, packaging, and manufacturing machines, engineers use our motion products to meet a diverse set of application challenges. Our software tools for motion easily integrate with our other product lines, so users can combine motion control with image acquisition, test, measurement, data acquisition, and automation to create robust, flexible solutions. We introduced our first line of motion control hardware, software and peripheral products in 1997.
DistributedNI LabVIEW Reconfigurable I/O and Embedded Control Hardware/Software.(RIO) Architecture. Our distributedNI reconfigurable I/O (RIO) hardware combined with NI LabVIEW system design software provides a commercial off-the-shelf solution to simplify development and shorten time to market when designing advanced measurement and control systems. All RIO hardware systems, which include CompactRIO, NI Single-Board RIO, R Series boards and PXI-based FlexRIO products, including Compact FieldPoint, and CompactRIO, are designed for remote measurement, industrial control, and embedded data-logging applications. Compact FieldPoint is an intelligent, distributed,feature a standard, high-performance architecture that combines a powerful floating-point processor, reconfigurable FPGA, and modular I/O system that gives industrial system developers an economical solution for distributed data acquisition, monitoringO. Engineers can program all RIO hardware components with LabVIEW, including the LabVIEW FPGA Module, to rapidly create custom timing, signal processing and control applications. Suitable for direct connection to industrial signals, Compact FieldPoint includes a wide array of rugged and isolated analog and digital I/O modules, terminal base options,without requiring expertise in low-level hardware description languages or board-level design. NI provides a breadth of RIO hardware targets that provide varying degrees of performance, cost, I/O rates, and network modules. Withruggedness, to meet any unique application need. NI first released the LabVIEW Real-Time users can download their LabVIEW code and easily create networked systems of intelligent, real-time nodes forRIO architecture in 2003 with the first R Series PXI plug-in board along with the first CompactRIO rugged, high-performance embedded measurement and control. In 2004, we introduced CompactRIO, an advanced embedded control and acquisition system powered by our reconfigurable I/O ("RIO") technology. CompactRIO leverages LabVIEW Real-Time and LabVIEW FPGA for industrial control, process monitoring, and embedded machine applications that require intelligent I/O products with a small form factor, a wide operating temperature, and resistance to shock and vibration. In 2008, we introduced Single-Boardsystem. To date, NI has released over 75 NI RIO which is a board-only, lower-cost version of CompactRIO designed for higher volume system deployments.FPGA-based hardware products.
Industrial Communications Interfaces. In 1995, we began shipping our first interface boards for communicating with serial devices, such as data loggers and PLCs targeted for industrial/embedded applications, and benchtop instruments, such as oscilloscopes, targeted for test and measurement applications. We offer hardware and driver software product lines for communication with industrial devices—Controller Area Network ("CAN"(“CAN”), DeviceNet, Foundation Fieldbus, and RS-485 and RS-232.
GPIB Interfaces/Driver Software. We began selling GPIB products in 1977 and are a leading supplier of GPIB interface boards and driver software to control traditional GPIB instruments. These traditional instruments are manufactured by a variety of third-party vendors and are used primarily in T&M applications. Our diverse portfolio of hardware and software products for GPIB instrument control is available for a wide range of computers. Our GPIB product line also includes products for controlling GPIB instruments using the computer’s standard parallel, USB, IEEE 1394 ("Firewire"), Ethernet, and serial ports.
NI Education Platform
The NI education platform combines software, hardware and courseware designed to create engaging, authentic learning experiences that prepare students for the accompanying NI-VXInext generation of innovation. Our cost-effective, scalable solutions offer academic institutions flexible integration across multiple science and NI-VISA driverengineering disciplines.
Software Products for Teaching
NI Multisim Circuit Design Software. NI Multisim is an industry-standard, Simulation Program with Integrated Circuit Emphasis (SPICE) simulation environment. It is the cornerstone of the NI circuits teaching solution to build expertise through practical application in designing, prototyping, and testing electrical circuits. Developed for the educator who needs to teach all aspects of circuits and electronics, Multisim Education Edition provides the ability to seamlessly move students from theory to simulation to the lab. Regardless of the application area, the powerful environment offers students the ability to visualize and interact with circuit theory and equations and focus on course-specific concepts with SPICE simulation.
NI LabVIEW for Education. LabVIEW is a graphical system design environment used on campuses all over the world to deliver hands-on learning to the classroom, enhance research applications, and foster the next generation of innovation. By teaching with LabVIEW, educators help students accomplish hands-on and system-based learning in a single environment with skills and methods they will use in their careers. With built-in I/O integration and instrument control, thousands of functions for math and signal processing, user interfaces to visualize and explore data, and deployment to multiple hardware targets, students access the power of graphical system design to go from concept to prototype in one semester.
LabVIEW for LEGO® MINDSTORMS®. This version of LabVIEW is specifically designed to extend the LEGO MINDSTORM set’s teaching power, making it easier, and more fun, to manage robotics projects. This easy-to-learn programming environment provides access to tools exclusive to the National Instruments Education Platform. LabVIEW for LEGO MINDSTORMS helps prepare students for university courses and engineering careers where LabVIEW is already in use.
6
Hardware Products for Teaching
National Instruments Educational Laboratory Virtual Instrumentation Suite (NI ELVIS). The NI ELVIS measurement and prototyping platform delivers hands-on lab experience with an integrated suite of more than 12 of the most commonly used instruments in one compact form factor specifically designed for education. Based on industry-standard NI LabVIEW graphical system design software, NI ELVIS, with powerful data acquisition and USB plug-and-play capabilities, offers users the flexibility of virtual instrumentation and allows for quick and easy measurement acquisition and instrumentation across multiple disciplines.
NI myDAQ Measurement and Instrumentation Device. This powerful, portable device allows students to measure and analyze the world around them. It is engineered to work with LabVIEW right out of the box. A user can start simply, with built-in virtual instruments, or get creative and connect the user’s own sensors and controls. NI myDAQ combines hardware with eight ready-to-run software-defined instruments, including a function generator, oscilloscope, and digital multimeter (DMM); these software instruments are also used on the NI ELVIS hardware platform so the lab experience can be extended to experiments anywhere, anytime. With NI LabVIEW graphical system design software, users can extend the instrument functionality into hundreds of custom applications.
NI Universal Software Radio Peripheral (USRP). The NI USRP is an affordable, flexible radio that turns a standard PC into a wireless prototyping platform. The NI USRP platform offers a new approach to RF and communications education, which has traditionally been limited to a focus on mathematical theory. With NI USRP and LabVIEW, students gain hands-on experience exploring a working communications system with live signals to gain a better understanding of the link between theory and practical implementation.
NI Services
NI provides global services and support as part of our commitment to our customers’ success in efficiently building and maintaining high-quality measurement and control systems using graphical system design.
Hardware Services and Maintenance
System Configuration and Deployment. OurNI System Assurance Program provides a fast, easy way to get our customer’s new NI system up and running. Our trained technicians install software and hardware and configure our customers’ PXI, PXI/SCXI combination, and NI CompactRIO system to their specifications.
Calibration. To help our customers’ calibration needs, NI provides calibration solutions, including recalibration services, manual calibration procedures, and automated calibration software. In 2011, the American Association for Laboratory Accreditation (A2LA) accredited NI Calibration Services Austin to one of the highest international calibration standards in the industry, ISO/IEC 17025:2005. National Instruments now offers 17025 calibration services for OEMs and other organizations seeking to maintain compliance with the strictest governmental, medical, transportation and electronics regulations. The new calibration service offering is ideal for companies standardizing their automated test and measurement systems on PXI modular instrumentation, which provides some of the most advanced technology for addressing the latest engineering challenges.
Warranty and Repair. We also offer LabVIEW, LabWindows/CVI, Measurement Studiostandard and TestStandextended warranties to help meet project life-cycle requirements and provide repair services for our products, express repair, and advance replacement services.
Software Maintenance Services
Software Services for End Users: Our Standard Service Program (SSP) is designed to help ensure that our end users are successful with our products. This software productsmaintenance contract provides the end user with regular product upgrades and service packs, professional technical support from local engineers, 24-hours a day access to self-paced online product training, and access to older versions of their owned software.
Volume Licensing for VXI systems.Account-Level Services: The NI Volume License Program (VLP) is designed to meet the needs of the business in addition to the success of each end user. On top of access to the SSP program for each end user, businesses that invest in the VLP receive account-level benefits designed to help effectively manage their software assets and lower their total cost of ownership.
7
Training Coursesand Certification
NI Training Program. . WeNI training helps the customer build the skills to more efficiently develop robust, maintainable applications, and certification confirms the customer’s technical growth and skill using NI software.We offer fee-based training classes and self-paced course kitsonline training for many of our software and hardware products. On-site courses are quoted per customer requests and we include on-line course offerings with live teachers.
NI Certification Program We also offer programs to certify programmers and instructors for our products.
Markets and Applications
Our products are used across many industries in a variety of applications including research and development, simulation and modeling, product design, prototype and validation, production testing and industrial control and field and factory service and repair. We serve the following industries and applications worldwide: advanced research, automotive, automated test equipment, consumer electronics, commercial aerospace, computers and electronics, continuous process manufacturing, education, government/defense, medical research/pharmaceutical, power/energy, semiconductors, telecommunications and others.
Customers
We have a broad customer base of over 35,000 customers worldwide, with no customer accounting for more than 3%7%, 4%, and 4% of our sales in 2009, 2008 or 2007.
Marketing
Through our worldwide marketing efforts, we strive to educate engineers and scientists about the benefits of our virtual instrumentationgraphical system design philosophy, products and technology, and to highlight the performance ease of use and cost advantages of our products. We also seek to present our position as a technologicaltechnology leader among producers of instrumentation software and hardware and to help promulgate industry standards that can benefit users of computer-based instrumentation.
We reach our intended audience through our Web sitewebsite at ni.com as well as through the distribution of written and electronic materials including demonstration versions of our software products, participation in tradeshows and technical conferences and training and user seminars.
We actively market our products in higher education environments, and we identify many colleges, universities and trade and technical schools as key accounts. We offer special academic pricing and products to enable universities to utilize our products in their classes and laboratories. We believe our prominence in the higher education area can contribute to our future success because students gain experience using our products before they enter the work force.
Sales and Distribution
We sell our software and hardware products primarily through a direct sales organization. We also use independent distributors, OEMs, VARs, system integrators and consultants to market our products. Sales through these alternative channels accounted for less than 7% of our total sales in 2012. Our Hungarian manufacturing facility sources a substantial majority of our sales throughout the world. We have sales offices in the United StatesU.S. and sales offices and distributors in key international markets. Sales outside of the U.S. accounted for approximately 61%63%, 61%63% and 59%62%, of our revenues in 2009, 20082012, 2011 and 2007,2010, respectively. The vast majority of our foreign sales are denominated in the customers’ local currency, which exposes us to the effects of changes in foreign currency exchange rates. We expect that a significant portion of our total revenues will continue to be derived from international sales. (See Note 1213 – Segment information of Notes to Consolidated Financial Statements for details concerning the geographic breakdown of our net sales, operating income, interest income and identifiablelong-lived assets.)
We believe the ability to provide comprehensive service and support to our customers is an important factor in our business. We permit customers to return products within 30 days from receipt for a refund of the purchase price less a restocking charge. Our products are generally warranted against defects in materials and workmanship for one year from the date we ship the products to our customers. Historically, warranty costs and returns have not been material.
8
The marketplace for our products dictates that many of our products be shipped very quickly after an order is received. As a result, we are required to maintain significant inventories. Therefore, inventory obsolescence is a risk for us due to frequent engineering changes, shifting customer demand, the emergence of new industry standards and rapid technological advances including the introduction by us or our competitors of products embodying new technology. We strive to mitigate this risk by monitoring inventory levels against product demand and technological changes. Additionally, many of our products have interchangeable parts and many have long lives. There can be no assurance that we will be successful in these efforts in the future.
Our foreign operations are subject to certain risks set forth on page 1417 under “We are Subject to Various Risks Associated with International Operations and Foreign Economies.”
See discussion regarding fluctuations in our quarterly results and seasonality in ITEM 1A, Risk Factors,, “Our Revenues are Subject to Seasonal Variations.”
Competition
The markets in which we operate are characterized by intense competition from numerous competitors, some of which are divisions of large corporations having far greater resources than we have, and we may face further competition from new market entrants in the future. A key competitor is Agilent Technologies Inc. (“Agilent”). Agilent offers hardware and software products that provide solutions that directly compete with our virtual instrumentation products.products including its own line of PXI based hardware. Agilent is aggressively advertising and marketing products that are competitive with our products. Because of Agilent'sAgilent’s strong position in the instrumentation business, changechanges in its marketing strategy or product offerings could have a material adverse effect on our operating results.
We believe our ability to compete successfully depends on a number of factors both within and outside our control, including:
· | general market and economic conditions, particularly in the Euro zone; |
· | our ability to maintain and grow our business with our very largest customers; |
· | our ability to meet the volume and service requirements of our very largest customers; |
· | industry consolidation, including acquisitions by our competitors; |
· | success in developing new products; |
· | timing of our new product introductions; |
· | new product introductions by competitors; |
· | the ability of competitors to more fully leverage low cost geographies for manufacturing and/or distribution; |
· | product pricing; |
· | effectiveness of sales and |
· |
adequate manufacturing capacity and supply of components and materials; |
· | efficiency of manufacturing operations; |
· | strategic relationships with our suppliers; |
· | product quality and performance; |
· |
protection of our products by effective use of intellectual property laws; |
· |
the financial strength of our competitors; |
· | the outcome of any future litigation or commercial dispute; |
· | barriers to entry imposed by competitors with significant market power in new markets; and, |
· |
government actions throughout the world. |
We currently believe that we compete effectively with respect to the foregoing factors; however, there can be no assurance that we will be able to compete successfully in the future.
Research and Development
We believe that our long-term growth and success depends on delivering high quality softwarehardware and hardwaresoftware products on a timely basis. We intend to focus our research and development efforts on enhancing existing products and developing new products that incorporate appropriate features and functionality to be competitive with respect to technology and price/performance characteristics.
9
Our research and development staff strives to build quality into our products at the design stage in an effort to reduce overall development and manufacturing costs. Our research and development staff also designs proprietary application specific integrated circuits (“ASICs”), many of which are designed for use in several of our different products. The goal of our ASIC design program is to further differentiate our products from competing products, to improve manufacturability and to reduce costs. We seek to reduce our time to market for new and enhanced products by sharing our internally developed hardware and software components across multiple products.
As of December 31, 2009,2012, we employed 1,4572,007 people in product research and development. Our research and development expenses were $133$223 million, $143$199 million and $127$158 million for 2009, 20082012, 2011 and 2007,2010, respectively.
Intellectual Property
We rely on a combination of patent, trade secret, copyright and trademark law, contracts and technical measures to establish and protect our proprietary rights in our products. As of December 31, 2009,2012, we held 502 United States678 U.S. patents (495(675 utility patents and 73 design patents) and 2028 patents in foreign countries (18(25 patents registered in Europe in various countries; and 23 patents in Japan), and had 296251 patent applications pending in the United StatesU.S. and foreign countries. 124195 of our issued United StatesU.S. patents are software patents related to LabVIEW, and cover fundamental aspects of the graphical programming approach used in LabVIEW. Our patents expire from 20112013 to 2027.2031. The expiration of any patents in the short term is not expected to have any significant negative impact on our business. No assurance can be given that our pending patent applications will result in the issuance of patents. We also own certain registered trademarks in the United States and abroad. See further discussion regarding risks associated with our patents in ITEM 1A, Risk Factors,, “Our Business Depends on Our Proprietary Rights and We are Subject to Intellectual Property Litigation.”
Manufacturing and Suppliers
We manufacture a substantial majority of our products at our facilityfacilities in Debrecen, Hungary. Additional production primarily of our RF products and of low volume, complex or newly introduced products is done in Austin, Texas. We are currently in the process of ramping up our third manufacturing site in Penang, Malaysia. It is expected that in 2013 our site in Malaysia will produce around 15% to 20% of our total production and will focus primarily on making existing products transferred from our Hungarian production facility to support anticipated growth in our business. Our product manufacturing operations can be divided into four areas: electronic circuit card and module assembly; chassis and cable assembly; technical manuals and product support documentation; and software duplication. We manufacture most of the electronic circuit card assemblies, modules and moduleschassis in-house, although subcontractors are used from time to time. We currently use subcontractors in Asia to manufacture a significant portion of our chassis, but we review these arrangements periodically. We manufacture some of our electronic cable assemblies in-house, but many assemblies are produced by subcontractors. We primarily subcontract our software duplication, our technical manuals and product support documentation.
Our manufacturing processes use large volumes of high-quality components and subassemblies supplied by outside sources in the U.S., Europe and Asia. Several of these components are available through limited sources. Limited source components purchased include custom ASICs chassis and other RF or custom components. Any disruption of our supply of limited source components, whether resulting from business demand, quality, production or delivery problems, could adversely affect our ability to manufacture our products, which could in turn adversely affect our business and results of operations. See “Our Business is Dependent on Key Suppliers” at page 1416 for additional discussion of the risks associated with limited source suppliers.
See “Our Manufacturing Operations are Subject to a Variety of Environmental Regulations and Costs” at page 1518 for discussion of environmental matters as they may affect our business.
Backlog
Backlog is a measure of orders that are received but that are not shipped to customers at the end of thea quarter. We typically ship products shortly following the receipt of an order. Accordingly, our backlog typically represents less than 5 days sales. Backlog should not be viewed as an indicator of our future sales. During the year ended December 31, 2009, our order backlog increased by approximately $8 million.
Employees
As of December 31, 2009,2012, we had 5,1206,869 employees worldwide, including 1,4572,007 in research and development, 2,3383,167 in sales and marketing and customer support, 755936 in manufacturing and 570760 in administration and finance. None of our employees are represented by a labor union and we have never experienced a work stoppage. We consider our employee relations to be good. For elevenfourteen consecutive years, from 1999 to 2009,2012, we have been named among the 100 Best Companies to Work for in America according to FORTUNE magazine.
10
ITEM 1A.RISK FACTORS
Continuing Uncertainty in GeneralUncertain Economic Conditions and Fluctuations in the Global Credit and Equity Markets HaveCould Materially Adversely AffectedAffect Our Financial ConditionBusiness and Results of Operations.Our business is sensitive to changesfluctuations in general economic conditions, both in the U.S. and globally. Due to the continued concerns regarding the availability of credit, our current or potential customers may delay or reduce purchases of our products which may continue to have an adverse effect on our revenuesThe uncertain economic climate, uncertain budget and therefore harm our business and results of operations. The continuing uncertaintytax policies, particularly in the credit markets is likely to continue to have an adverse effect on the U.S. and world economies, whichEurope, negative financial news, volatile foreign currency markets, natural disasters, energy costs, employment levels, labor costs, healthcare costs, declining income or asset values and credit availability, could continue to negatively impact and cause deterioration in the spending patterns of businesses including our current and potential customers.global industrial economy. Historically, our business cycles have corresponded to changesgenerally followed the expansion and contraction cycles in the global industrial economy as measured by the Global Purchasing Managers Index (“PMI”)(PMI). From June 2008The most recent reading for January 2013 showed the PMI had increased to July 2009, this index indicated51.5 up from a reading of 48.8 for September 2012. This marks the second month since May 2012 that the PMI has had a reading above 50. A PMI reading above 50 indicates an expanding industrial economy while a reading below 50 indicates a contracting industrial economy. Starting in August 2009, the index has had readings above 50 which are indicative of expansion in the industrial global economy; however, we continue to believe there is still a substantial amount of uncertainty about the global industrial economy. We are unable to predict whether the current expansion cycle,industrial economy, as measured by the PMI, will be sustained throughout 2010. This continuing uncertainty instrengthen or contract during 2013. If the global industrial economy, is likelyas measured by the PMI, remains at or near a neutral reading of around 50, indicating general weakness, or begins to continue tocontract, it could have an adverse effect on the spending patterns of businesses including our current and potential customers which could adversely affect our revenues and result of operations.
Our Current Domestic Cash Position May Not Be Sufficient to Fund Certain of our Domestic Cash Needs in the Next Twelve Months and We May Need to Seek Funding from External Sources or Repatriate Foreign Earnings.At December 31, 2012, we had $335 million in cash, cash equivalents and short-term investments of which $307 million was held in operating and investment accounts of our foreign subsidiaries. Over the next few months, we will likely seek external financing, most likely in the form of a line of credit, so that we will have sufficient domestic cash to fund continued dividend payments to our stockholders and to fund potential acquisitions. We may also choose to raise additional funds by selling equity or debt securities to the public or to selected investors. If we elect to raise additional funds, we may not be able to obtain such funds on a timely basis on acceptable terms, if at all. If we raise additional funds by issuing additional equity or convertible debt securities, the ownership percentages of our existing stockholders would be reduced. In addition, the equity or debt securities that we issue may have rights, preferences or privileges senior to those of our common stock and a line of credit would likely have covenants or impose other restrictions on our business. We may also choose to repatriate foreign earnings which would be subject to the U.S. federal statutory tax rate of 35% and therefore, harmwould likely have a material adverse effect on our effective tax rate and on our net income and earnings per share. We could also choose to reduce certain expenditures or payments of dividends or suspend our program to repurchase shares of our common stock. Historically, we have not had to rely on debt, public or private, to fund our operating, financing or investing activities.
Orders With a Value of Greater than One Million Dollars Expose Us to Significant Additional Business and Legal Risks that Could Have a Material Adverse Impact on our Business, Results of Operations and Financial Condition. In recent years, we have made a concentrated effort to increase our revenue through the pursuit of orders with a value greater than $1.0 million. As a result of such efforts, this business continues to grow as a percent of our overall business. During 2012, we received a series of orders totaling $59 million for a large graphical system design application from one customer. Including this very large order, we received a total of $76 million in orders from this customer in 2012, of which $72 million or 6% of our total net sales was recognized as revenue in 2012. These type of orders exposes us to significant additional business and legal risks compared to smaller orders. These very large customers frequently require contract terms that vary substantially from our standard terms of sale. These orders can be accompanied by critical delivery commitments and severe contractual liabilities can be imposed on us if we fail to provide the quantity of product at the required delivery times. These customers may also impose product acceptance requirements and product performance evaluations which create uncertainty with respect to the timing of our ability to recognize revenue from such orders. These contracts may have supply constraint requirements which mandate that we allocate large product inventories for a specific contract. These inventory requirements expose us to higher risks of inventory obsolescence and can adversely impact our ability to provide adequate product supply to other customers.
11
Fulfillment of these contracts can severely challenge our supply chain capabilities at the component acquisition, assembly and delivery stages. Our contracts with such customers may allow the customer to cancel or delay orders without liability which exposes our business and result of operations.
Recent Completion of our Third Manufacturing Facility in Penang, Malaysia Could Adversely Affect our Gross Margin, Results of Operations and Earnings if Anticipated Demand is Not Achieved. Construction of our manufacturing and warehousing facility in Penang, Malaysia was completed in the fourth quarter of 2012. We believe this new facility will support our long term manufacturing and warehousing capacity needs. We are currently in the process of ramping up production at our manufacturing site in Penang, Malaysia. In 2013, we expect this site will produce around 15% to 20% of our total production, focused primarily on making existing products transferred from our Hungarian production facility to support anticipated growth in our business. However, if demand for our products does not grow as expected or if it contracts in future periods, we will have excess warehousing and manufacturing capacity which will cause an increase in overhead that will likely negatively impact our gross margins and results of operations.operations in future periods. In addition, we could experience other cost overruns with respect to our Malaysian facility including those associated with;
· | inefficiencies related to start up operations of this facility; |
· | cost overruns related to training a new workforce for this facility; |
· | inefficient inventory management. |
Negative ConditionsIncreases in the Global Credit Markets Have Impaired the LiquidityAmount of Revenue Derived from Large Orders Could Adversely Affect our Gross Margin and Could Lead to Greater Variability in our Quarterly Results. Our large order business, defined as orders with a Portion of Our Investment Portfolio. Our short-term investments include auction rate securities backed by education loan revenue bonds. Onevalue greater than $100,000, continues to grow as a percent of our auction rate securities is from the Vermont Student Assistance Corporation and hasoverall business. As a par value of $2.2 million. The otherpercent of our auction rate securities is from the New Hampshire Healthoverall business, orders over $100,000 reached a new high during 2012. Such orders represented 21%, 14% and Education Facilities Authority12% of our total orders during 2012, 2011 and has a par value of $6.4 million. On January 15, 2010, and in prior auction periods beginning in February 2008, the auction process for these securities failed.respectively. These auction rate securities are classified as available-for-sale. The auction rate market is not expectedorders may be more sensitive to provide liquidity for these securitieschanges in the foreseeable future. Should we need or desire to access the funds invested in those securities prior to their maturity or prior to our exercise period under our Rights agreement with UBS, weglobal industrial economy, may be unablesubject to findgreater discount variability, lower gross margins, and may contract at a buyer in a secondary market outsidefaster pace during an economic downturn. Historically, our gross margins have been stable from period to period. To the auction process or if a buyer in a secondary market is found, we would likely realize a loss. See Note 3 – Fair value measurements in Notes to Consolidated Financial Statements for further discussionextent that the amount of our auction rate securities.revenue derived from larger orders increases in future periods, both in absolute dollars and as a percent of our overall business, our gross margins could decline, could experience greater volatility and see a greater negative impact from future downturns in the global industrial economy. This dynamic may also have an adverse effect on the historical seasonal pattern of our revenues and our results of operations.
We Have Established a Budget and Variations From Our Budget Will Affect Our Financial Results. During the fourth quarter of 2009, weWe have established an operating budget for 2010.2013. Our budgets arebudget was established based on the estimated revenue from sales of our products which are based on economic conditions in the markets in which we do business as well as the timing and volume of our new products and the expected penetration of both new and existing products in the marketplace. Historically,In 2012, we increased our business cycles have corresponded to changes inoverall headcount by 634. During 2013, we will see the global PMI. From June 2008 to July 2009, this index had indicated a contracting industrial economy. Starting in August 2009, the index has had readings above 50 which are indicativefull year impact of expansion in the industrial global economy. We believe there is still a substantial amount of uncertainty about the global industrial economy. We are unable to predict whether the current expansion cycle, as measured by the PMI, will be sustained throughout 2010. This uncertainty as well as the uncertainty as to howthese headcount additions on our business will be impacted by any future expansion or contraction in the global industrial economy, makes forecasting our results difficult. This uncertainty is reflected in key assumptions used to establish our 2010 budget.operating expenses. If demand for our products in 20102013 is less than the demand we have anticipated in setting our 20102013 budget, our operating results could be negatively impacted. If we exceed the level of expenses established in our 20102013 operating budget or if we cannot reduce budgeted expenditures in response to a decreasesdecrease in revenue, our operating results could be adversely affected. Our spending could exceed our budgets due to a number of factors, including:
· | less than expected capacity utilization of our new |
· | inefficiencies related to start up operations of our new manufacturing facility in Penang, Malaysia; |
· | cost overruns related to training a new workforce for our new manufacturing facility in Penang, Malaysia; |
· | increased costs from hiring more product development engineers or other personnel; |
· | increased costs |
· |
increased manufacturing costs resulting from component supply shortages |
· | additional marketing costs for new product introductions or for conferences and tradeshows; |
· | the timing cost or outcome of any future intellectual property litigation or commercial disputes; |
· | increased component costs resulting from vendors increasing prices in response to increased economic activity; or |
· |
additional costs related to acquisitions, if any. |
12
Table of Inventory and Distribution.
Our Quarterly Results are Subject to Fluctuations Due to Various Factors.Factors that May Adversely Affect Our Business and Result of Operations. Our quarterly operating results have fluctuated in the past and may fluctuate significantly in the future due to a number of factors, including:
· | changes in the global economy or global credit markets, particularly in the |
· | increasing concentration in the amount of revenue derived from very large orders and the pricing, margins, and other terms of such orders; |
· | changes in capacity utilization including at our new facility in Malaysia; |
· | fluctuations in foreign currency exchange rates; |
· | changes in the mix of products sold; |
· | the availability and pricing of components from third parties (especially limited sources); |
· |
the difficulty in maintaining margins, including the higher margins traditionally achieved in international sales; |
· | changes in pricing policies by us, our competitors or |
· | the timing, cost or outcome of any future intellectual property litigation or commercial disputes; |
· | delays in product shipments caused by human error or other factors; and, |
· | disruptions in transportation channels. |
We Operate in Intensely Competitive Markets.The markets in which we operate are characterized by intense competition from numerous competitors, some of which are divisions of large corporations having far greater resources than we have, and we may face further competition from new market entrants in the future. A key competitor is Agilent Technologies Inc. (“Agilent”). Agilent offers hardware and software products that provide solutions that directly compete with our virtual instrumentation products.products and Agilent has released its own line of PXI based hardware. Agilent is aggressively advertising and marketing products that are competitive with our products. Because of Agilent’s strong position in the instrumentation business, changes in its marketing strategy or product offerings could have a material adverse effect on our operating results.
We believe our ability to compete successfully depends on a number of factors both within and outside our control, including:
· | general market and economic conditions, particularly in the Euro zone; |
· | our ability to maintain and grow our business with our very largest customers; |
· | our ability to meet the volume and service requirements of our very largest customers; |
· | industry consolidation, including acquisitions by our competitors; |
· | success in developing new products; |
· | timing of our new product introductions; |
· | new product introductions by competitors; |
· | the ability of competitors to more fully leverage low cost geographies for manufacturing and/or distribution; |
· | product pricing; |
· | effectiveness of sales and |
· |
adequate manufacturing capacity and supply of components and materials; |
· | efficiency of manufacturing operations; |
· | strategic relationships with our suppliers; |
· | product quality and performance; |
· |
protection of our products by effective use of intellectual property laws; |
· |
the financial strength of our competitors; |
· | the outcome of any future litigation or commercial dispute; |
· | barriers to entry imposed by competitors with significant market power in new markets; and, |
· |
government actions throughout the world. |
There can be no assurance that we will be able to compete successfully in the future.
13
Tax Law Changes in Hungary Could Have a Negative Impact on our Effective Tax Rate, Earnings and Results of Operations.
Our Income tax Rate could be Affected by a Tax Holiday in Malaysia. Potential future profits from our new manufacturing facility in Penang, Malaysia is expected to be free of tax under a tax holiday with effect from January 1, 2013. If we fail to satisfy the conditions of the tax holiday, this tax benefit may not be available. The expiration of the holiday or future changes in U.S. law pertaining to the taxation of foreign earnings could have a material adverse effect on our operating results.
A Substantial Majority of our Manufacturing, Warehousing and Distribution Capacity is Located Outside of the United States. Our Hungarian manufacturing and warehouse facility sourced a substantial majority of our sales in 2012. In 2013, we expect to transition some of this capacity to our newly completed manufacturing, warehouse and distribution facility in Penang, Malaysia.
In order to enable timely shipment of products to our customers we also maintain the vast majority of our inventory at these international locations. In addition to being subject to the risks of maintaining such a concentration of manufacturing capacity and global inventory, these facilities and their operations are also subject to risks associated with doing business internationally, including:
· | a changing and potentially unstable political environment; |
· | significant and frequent changes in the corporate tax law; |
· | the volatility of the Hungarian forint and Malaysian ringgit relative to the U.S. dollar; |
· | difficulty in managing manufacturing operations in foreign countries; |
· | challenges in expanding capacity to meet increased demand; |
· | difficulty in achieving or maintaining product quality; |
· | interruption to transportation flows for delivery of components to us and finished goods to our customers; |
· | a restrictive labor code; and, |
· | increasing labor costs. |
No assurance can be given that our efforts to mitigate these risks will be successful. Any failure to effectively deal with the risks above could result in an interruption in operations of our facilities in Hungary or Malaysia which could have a material adverse effect on our operating results.
Our centralization of inventory and distribution from a limited number of shipping points is subject to inherent risks, including:
· | burdens of complying with additional and/or more complex VAT and customs regulations; and, |
· | concentration of inventory increasing the risks associated with fire, natural disasters and logistics disruptions to customer order fulfillment. |
Any difficulties with the centralization of our distribution or delays in the implementation of the systems or processes to support this centralized distribution could result in an interruption of our normal operations, including our ability to process orders and ship products to our customers. Any failure or delay in distribution from our facilities in Hungary and Malaysia could have a material adverse effect on our operating results.
14
Our Success Depends on New Product Introductions and Market Acceptance of Our Products.The market for our products is characterized by rapid technological change, evolving industry standards, changes in customer needs and frequent new product introductions, and is therefore highly dependent upon timely product innovation. Our success is dependent on our ability to successfully develop and introduce new and enhanced products on a timely basis to replace declining revenues from older products, and on increasing penetration in domestic and international markets. As has occurred in the past and as may be expected to occur in the future, we have experienced significant delays between the announcement and the commercial availability of new products. Any significant delay in releasing new products could have a material adverse effect on the ultimate success of a product and other related products and could impede continued sales of predecessor products, any of which could have a material adverse effect on our operating results. There can be no assurance that we will be able to introduce new products in accordance with announced release dates, that our new products will achieve market acceptance or that any such acceptance will be sustained for any significant period. Failure of our new products to achieve or sustain market acceptance could have a material adverse effect on our operating results. Moreover, there can be no assurance that our international sales will continue at existing levels or grow in accordance with our efforts to increase foreign market penetration.
Our Revenues are Subject to Seasonal Variations. In previous years, our revenues have been characterized by seasonality, with revenues typically growing from the first quarter to the second quarter, being relatively constant from the second quarter to the third quarter, growing in the fourth quarter compared to the third quarter and declining in the first quarter of the following year from the fourth quarter of the preceding year. This historical trend has been affected and may continue to be affected in the future by broad fluctuations in the global industrial economy as well as the timing of new product introductions or acquisitions. In addition, the increasing percentage of our revenue derived from very large orders could have a significant impact on our historical seasonal trends as these orders may be more sensitive to changes in the global industrial economy, may be subject to greater discount variability, lower gross margins, and may contract at a faster pace during an economic downturn. Our historical seasonal variation could also be significantly impacted if we cannot maintain or grow our business with our very large customers. The continuing economic contraction in the Euro zone could persist or worsen in 2013. If this instability in the Euro zone continues, worsens or negatively affects other economic regions in 2013, it may have a material adverse effect on the seasonal patterns described above as well as on our overall results of operations and profitability. Our total operating expenses have in the past tended to increase in each successive quarter and have fluctuated as a percentage of revenue based on the seasonality of our revenue.
Concentrations of Credit Risk and Uncertain Conditions in the Global Financial Markets May Adversely Affect Our Business and Result of Operations. By virtue of our holdings of cash, investment securities and foreign currency derivatives, we have exposure to many different counterparties, and routinely execute transactions with counterparties in the financial services industry, including commercial banks and investment banks. Many of these transactions expose us to credit risk in the event of a default of our counterparties. We continue to monitor the stability of the financial markets, particularly those in the European region and have taken steps to limit our direct and indirect exposure to these markets; however, we can give no assurance that we will not be negatively impacted by any adverse outcomes in those markets. There can be no assurance that any losses or impairments to the carrying value of our financial assets as a result of defaults by our counterparties, would not materially and adversely affect our business, financial position and results of operations.
Our Acquisitions are Subject to a Number of Costs and Challenges that Could Have a Material Adverse Effect on Our Business and Results of Operations. During the fourth quarter of 2012, we completed three acquisitions including Signalion. During 2011, we completed acquisitions of AWR Corporation (AWR) and Phase Matrix Inc. (PMI). We may in the future acquire additional complementary businesses, products or technologies. Achieving the anticipated benefits of an acquisition depends upon whether the integration of the acquired business, products or technology is accomplished efficiently and effectively. In addition, successful acquisitions generally require, among other things, integration of product offerings, manufacturing operations and coordination of sales and marketing and R&D efforts. These difficulties can become more challenging due to the need to coordinate geographically separated organizations, the complexities of the technologies being integrated, and the necessities of integrating personnel with disparate business backgrounds and combining different corporate cultures. The integration of operations following an acquisition also requires the dedication of management resources, which may distract attention from our day-to-day business and may disrupt key R&D, marketing or sales efforts. Our inability to successfully integrate Signalion or any other acquisition could harm our business. The existing products previously sold by entities we have acquired may be of a lesser quality than our products and/or could contain errors that produce incorrect results on which users rely or cause failure or interruption of systems or processes that could subject us to liability claims that could have a material adverse effect on our operating results or financial position. Furthermore, products acquired in connection with acquisitions may not gain acceptance in our markets, and we may not achieve the anticipated or desired benefits of such transactions.
15
Our Business is Dependent on Key Suppliers.Suppliers and Distributors and Disruptions in these Businesses Could Adversely Affect our Business and Results of Operations. Our manufacturing processes use large volumes of high-quality components and subassemblies supplied by outside sources. Several of these components are only available through limited sources. Limited source components purchased include custom application specific integrated circuits (“ASICs”), chassis and other components. We have in the past experienced delays and quality problems in connection with limited source components, and there can be no assurance that these problems will not recur in the future. Accordingly, our failure to receive components from limited suppliers could result in a material adverse effect on our revenues and operating results. In the event that any of our limited suppliers experience significant financial or operational difficulties due to adverse global economic conditions or otherwise, our business and operating results would likely be adversely impacted until we are able to secure another source for the required materials.
In some countries, we use distributors to support our sales channels. In the event that any of our distributors experience significant financial or operational difficulties due to adverse global economic conditions or we experience disruptions in the use of these distributors, our business and operating results would likely be adversely impacted until we are able to secure another distributor or establish direct sales capabilities in the affected market.
We May Experience Component Shortages.Shortages that May Adversely Affect Our Business and Result of Operations. As has occurred in the past and as may be expected to occur in the future, supply shortages of components used in our products, including limited source components, can result in significant additional costs and inefficiencies in manufacturing. If we are unsuccessful in resolving any such component shortages in a timely manner, we will experience a significant impact on the timing of revenue, a possible loss of revenue, and/or an increase in manufacturing costs, any of which would have a material adverse impact on our operating results.
We Rely on Management Information Systems and Interruptions in our Information Technology Systems Could Adversely Affect our Business. We rely on the efficient and uninterrupted operation of complex information technology systems and networks to operate our business. We rely on a primary global center for our management information systems and on multiple systems in branches not covered by our global center. As with any information system, unforeseen issues may arise that could affect our ability to receive adequate, accurate and timely financial information, which in turn could inhibit effective and timely decisions. Furthermore, it is possible that our global center for information systems or our branch operations could experience a complete or partial shutdown. A significant system or network disruption could be the result of new system implementations, computer viruses, security breaches, facility issues or energy blackouts. If such a shutdown or disruption occurred, it would adversely impact our product shipments and revenues, as order processing and product distribution are heavily dependent on our management information systems. Such an interruption could also result in a loss of our intellectual property or the release of sensitive competitive information or partner, customer or employee personal data. Any loss of such information could harm our competitive position, result in a loss of customer confidence, and cause us to incur significant costs to remedy the damages caused by the disruptions or security breaches. Accordingly, our operating results in such periods would be adversely impacted.
We are continually working to maintain reliable systems to control costs and improve our ability to deliver our products in our markets worldwide. Our efforts include, but are not limited to following: firewalls, antivirus, patches, log monitors, routine backups with offsite retention of storage media, system audits, data partitioning and routine password modifications. No assurance can be given that our efforts will be successful.
We are Subject to Risks Associated with Our Web Site.Website. We devote significant resources to maintain our Web siteWebsite, ni.com, as a key marketing, sales and support tool and expect to continue to do so in the future. However, there can be no assurance that we will be successful in our attempt to leverage the Web to increase sales. Failure to properly maintain our website may interrupt normal operations, including our ability to provide quotes, process orders, ship products, provide services and support to our customers, bill and track our customers, fulfill contractual obligations and otherwise run our business which would have a material adverse effect on our results of operations. We host our Web siteWebsite internally. Any failure to successfully maintain our Web siteWebsite or any significant downtime or outages affecting our Web siteWebsite could have a material adverse impact on our operating results.
16
Adoption of Complex Health Care Legislation and Related Regulations and Financial Reform Could Increase our Operating Costs and Adversely Affect Our Result of Operations. The adoption of the Patient Protection and Affordable Care Act and the related reconciliation measure, the Health Care and Education Reconciliation Act of 2010, and the regulations resulting from such legislation could increase the costs of providing health care to our employees. Due to the complexity of the legislation and the uncertain timing and content of the related regulations, we are unable to predict the amount and timing of any such increased costs. In addition, it is likely that we will incur additional administrative costs to comply with certain provisions of this legislation. Due to the fact that many of the rules and regulations have not yet been defined, we are unable to predict the amount of these costs or to what extent we may need to divert other resources to comply with various provisions of this legislation. Additionally, the Dodd-Frank Wall Street Reform and Consumer Protection Act could result in increased costs to us either as a result of our efforts to comply with the corporate governance provisions which may be applicable to us or due to the impact of such legislation on the derivative contracts or other financial instruments or financial markets that we utilize in the normal course of our business.
Our Product Revenues are Dependent on Certain Industries. Sales of our products are dependent on customers in certain industries, particularly the telecommunications, semiconductor, consumer electronics, automotive, automated test equipment, defense and aerospace industries. As we have experienced in the past, and as we may continue to experience in the future, downturns characterized by diminished product demand in any one or more of these industries may result in decreased sales, and a material adverse effect on our operating results.
Our Products are Complex and May Contain Bugs or Errors.As has occurred in the past and as may be expected to occur in the future, our new software products or new operating systems of third parties on which our products are based often contain bugs or errors that can result in reduced sales and/or cause our support costs to increase, either of which could have a material adverse impact on our operating results.
We are Subject to Various Risks Associated with International Operations and Foreign Economies.Our international sales are subject to inherent risks, including:
· | difficulties and the high tax costs associated with the repatriation of earnings; |
· | fluctuations in local economies; |
· | fluctuations in foreign currencies relative to the U.S. dollar; |
· | difficulties in staffing and managing foreign operations; |
· | greater difficulty in accounts receivable collection; |
· | costs and risks of localizing products for foreign countries; |
· | unexpected changes in regulatory requirements; |
· | tariffs and other trade barriers; and, |
· |
the burdens of complying with a wide variety of foreign laws. |
In many foreign countries, particularly in those with developing economies, it is common to engage in business practices that are prohibited by U.S. regulations applicable to us such as the Foreign Corrupt Practices Act. Although we have policies and procedures designed to ensure compliance with these laws, there can be no assurance that all of our employees, contractors and agents, including those based in or from countries where practices which violate such U.S. laws may be customary, will not take actions in violation of our policies. Any violation of foreign or U.S. laws by our employees, contractors or agents, even if such violation is prohibited by our policies, could have a material adverse effect on our business. We must also comply with various import and export regulations. The application of these various regulations depends on the classification of our products which can change over time as such regulations are modified or interpreted. As a result, even if we are currently in compliance with applicable regulations, there can be no assurance that we will not have to incur additional costs or take additional compliance actions in the future. Failure to comply with these regulations could result in fines and/or termination of import and export privileges, which could have a material adverse effect on our operating results. Additionally, the regulatory environment in some countries is very restrictive as their governments try to protect their local economy and value of their local currency against the U.S. dollar.
The vast majority of our international direct sales officesoutside of North America are denominated in local currencies, and accordingly, the U.S. dollar equivalent of these sales is affected by changes in the foreign currency exchange rates. Net of hedging results, theThe change in exchange rates had the effect of decreasing our consolidated sales by $29$20 million or 4% for the year ended December 31, 2009, compared to 2008. If the local currencies2% in which we sell2012, and increasing our products strengthen against the U.S. dollar, we may need to lower our pricesconsolidated sales by $27 million or 3% in the local currency to remain competitive in our international markets which could have a material adverse effect on our gross and net profit margins. If the local currencies in which we sell our products weaken against the U.S. dollar and if the local sales prices cannot be raised due to competitive pressures, we will experience a deterioration of our gross and net profit margins.2011. Since most of our international operating expenses are also incurred in local currencies, the change in exchange rates had the effect of decreasing our consolidated operating expenses by $12$5.8 million or 2% for1% in 2012, and increasing our consolidated operating expenses by $19 million or 3% in 2011.
17
During 2012, we saw an overall appreciation of the year ended December 31, 2009, comparedU.S. dollar against the major currencies in the markets we do business in and a high level of volatility in the broader foreign currency exchange markets. During 2011, the U.S. dollar generally declined against most of the major currencies in the markets in which we do business. We cannot predict to 2008. Currently,what degree or how long this volatility in the foreign currency exchange markets will continue. In the past, we are experiencinghave noted that significant volatility in foreign currency exchange rates in many of the markets in which we do business. Thisbusiness has had a significant impact on the revaluation of our foreign currency denominated firm commitments, and on our ability to forecast our U.S. dollar equivalent revenues and expenses.expenses and on the effectiveness of our hedging programs. In the past, these dynamics have also adversely affected our revenue growth in international markets and will likelymay pose similar challenges in the future.
Our Business Depends on Our Proprietary Rights and We areHave Been Subject to Intellectual Property LitigationLitigation. .Our success depends on our ability to obtain and maintain patents and other proprietary rights relative to the technologies used in our principal products. Despite our efforts to protect our proprietary rights, unauthorized parties may have in the past infringed or violated certain of our intellectual property rights. We from time to time engage in litigation to protect our intellectual property rights. In monitoring and policing our intellectual property rights, we have been and may be required to spend significant resources. We from time to time may be notified that we are infringing certain patent or intellectual property rights of others. There can be no assurance that any existingfuture intellectual property litigationdispute or any intellectual property litigation initiated in the future, will not causeresult in significant litigation expense, liability, injunction against the sale of some of our products, and a diversion of management’s attention, any of which may have a material adverse effect on our operating results.
Our Reported Financial Results May be Adversely Affected by Changes in Accounting Principles Generally Accepted in the United StatesStates. .We prepare our financial statements in conformity with accounting principles generally accepted in the U.S. These accounting principles are subject to interpretation by the Financial Accounting Standards Board and the Securities and Exchange Commission. A change in these policies or interpretations could have a significant effect on our reported financial results, and could affect the reporting of transactions completed before the announcement of a change.
Our Business Depends on the Continued Service of Key Management and Technical PersonnelPersonnel. .Our success depends upon the continued contributions of our key management, sales, marketing, research and development and operational personnel, including Dr. Truchard, our Chairman and Chief Executive Officer, and other members of our senior management and key technical personnel. We have no agreements providing for the employment of any of our key employees for any fixed term and our key employees may voluntarily terminate their employment with us at any time. The loss of the services of one or more of our key employees in the future could have a material adverse effect on our operating results. We also believe our future success will depend upon our ability to attract and retain additional highly skilled management, technical, marketing, research and development, and operational personnel with experience in managing large and rapidly changing companies, as well as training, motivating and supervising employees. Our failure to attract or retain key technical or managerial talent could have an adverse effect on our operating results. We also recruit and employ foreign nationals to achieve our hiring goals primarily for engineering and software positions. There can be no guarantee that we will continue to be able to recruit foreign nationals at the current rate. There can be no assurance that we will be successful in retaining our existing key personnel or attracting and retaining additional key personnel. Failure to attract and retain a sufficient number of our key personnel could have a material adverse effect on our operating results.
Our Manufacturing Operations are Subject to a Variety of Environmental Regulations and Costs that May Have a Material Adverse Effect on our Business and Results of our Operations. .We must comply with many different governmental regulations related to the use, storage, discharge and disposal of toxic, volatile or otherwise hazardous chemicals used in our manufacturing operations in the U.S., Hungary, and in Hungary.Malaysia. Although we believe that our activities conform to presently applicable environmental regulations, our failure to comply with present or future regulations could result in the imposition of fines, suspension of production or a cessation of operations. Any such environmental regulations could require us to acquire costly equipment or to incur other significant expenses to comply with such regulations. Any failure by us to control the use of or adequately restrict the discharge of hazardous substances could subject us to future liabilities.
18
We Are Subject to the Risk of Product Liability Claims.Our products are designed to provide information upon which users may rely. Our products are also used in “real time” applications requiring extremely rapid and continuous processing and constant feedback. Such applications give rise to the risk that a failure or interruption of the system or application could result in economic damage or bodily harm. We attempt to assure the quality and accuracy of the processes contained in our products, and to limit our product liability exposure through contractual limitations on liability, limited warranties, express disclaimers and warnings as well as disclaimers contained in our “shrink wrap” license agreements with end-users. If our products contain errors that produce incorrect results on which users rely or cause failure or interruption of systems or processes, customer acceptance of our products could be adversely affected. Further, we could be subject to liability claims that could have a material adverse effect on our operating results or financial position. Although we maintain liability insurance for product liability matters, there can be no assurance that such insurance or the contractual limitations used by us to limit our liability will be sufficient to cover or limit any claims which may occur.
Provisions in Our Charter Documents and Delaware Law and Our Stockholder Rights Plan May Delay or Prevent an Acquisition of Us.Our certificate of incorporation and bylaws and Delaware law contain provisions that could make it more difficult for a third party to acquire us without the consent of our Board of Directors. These provisions include a classified Board of Directors, prohibition of stockholder action by written consent, prohibition of stockholders to call special meetings and the requirement that the holders of at least 80% of our shares approve any business combination not otherwise approved by two-thirds of the Board of Directors. Delaware law also imposes some restrictions on mergers and other business combinations between us and any holder of 15% or more of our outstanding common stock. In addition, our Board of Directors has the right to issue preferred stock without stockholder approval, which could be used to dilute the stock ownership of a potential hostile acquirer. Our Board of Directors adopted a stockholders rights plan on January 21, 2004, pursuant to which we declared a dividend of one right for each share of our common stock outstanding as of May 10, 2004. This rights plan replaced a similar rights plan that had been in effect since our initial public offering in 1995. Unless redeemed by us prior to the time the rights are exercised, upon the occurrence of certain events, the rights will entitle the holders to receive upon exercise thereof shares of our preferred stock, or shares of an acquiring entity, having a value equal to twice the then-current exercise price of the right. The issuance of the rights could have the effect of delaying or preventing a change of control of us.
Compliance With Sections 302 and 404 of the Sarbanes-Oxley Act of 2002 is Costly and Challenging. As required by Section 302 of the Sarbanes-Oxley Act of 2002, this Form 10-K contains our management’s certification of adequate disclosure controls and procedures as of December 31, 2012. This report on Form 10-K also contains a report by our management on our internal control over financial reporting including an assessment of the effectiveness of our internal control over financial reporting as of December 31, 2012. This Form 10-K also contains an attestation and report by our external auditors with respect to the effectiveness of our internal control over financial reporting under Section 404. While these assessments and reports did not reveal any material weaknesses in our internal control over financial reporting, compliance with Sections 302 and 404 is required for each future fiscal year end. We expect that the ongoing compliance with Sections 302 and 404 will continue to be both very costly and very challenging and there can be no assurance that material weaknesses will not be identified in future periods. Any adverse results from such ongoing compliance efforts could result in a loss of investor confidence in our financial reports and have an adverse effect on our stock price.
None.
We own approximately 139 acres of land in the Austin, Texas area. Our principal corporate and research and development activities are conducted atin three buildings we own in Austin, Texas. We own approximately 69 acres of land in north Austin, Texas, on which areTexas; a 232,000 square foot office facility, a 140,000 square foot manufacturing and office facility, and a 380,000 square foot research and development facility. We also own a 136,000 square foot office building in Austin, Texas which is being leased to third-parties. third parties.
Our principalprinciple manufacturing and distribution activities are conducted at ourin Debrecen, Hungary and Penang, Malaysia. We own a 239,000 square foot manufacturing and distribution facility in Debrecen, Hungary which we own. and a new 314,000 square foot manufacturing, research and development, and general and administrative facility in Penang, Malaysia. We also own approximately 23 acres of land comprised of two tracts in an industrial park in Penang, Malaysia.
Our German subsidiary, National Instruments Engineering GmbH & Co. KG, owns a 25,500 square foot office building in Aachen, Germany in which a majority of its activities are conducted. National Instruments Engineering owns another 19,375 square foot office building in Aachen, Germany, which is partially leased to third-parties. We own approximately 17 acres of landNational Instruments Corporation (UK) Limited, United Kingdom, owns a 29,270 square foot office building in an industrial park in Penang, Malaysia.
As of December 31, 2009,2012, we also leased a number of sales and support offices in the U. S.U.S. and various countries throughout the world. Our sales and support facilities are currently being utilized below maximum capacity to allow for future headcount growth and design/construction cycles, as needed. We believe our existing facilities are adequate to meet our current requirements.
19
We filedare not currently a patent infringement action on January 25, 2001,party to any material litigation. However, in the U.S. District Court, Eastern District of Texas (Marshall Division) claiming that The MathWorks, Inc. (“MathWorks”) infringed certainordinary course of our U.S. patents. On January 30, 2003, a jury found infringement by MathWorksbusiness, we are involved in legal actions, both as plaintiff and defendant, and could incur uninsured liability in any one or more of three of the patents involved and awarded us specified damages. On September 23, 2003, the District Court entered final judgment in favor of us and entered an injunction against MathWorks’ sale of its Simulink and related products and stayed the injunction pending appeal. Upon appeal, the judgment and the injunction were affirmed by the U.S. Court of Appeals for the Federal Circuit (September 3, 2004). Subsequently the stay of injunction was lifted by the District Court. In November 2004, the final judgment amount of $7.4 million which had been held in escrow pending appeal was released to us.
ITEM 4.MINE SAFETY DISCLOSURES
Not applicable.
20
PART II
ITEM 5.MARKET FOR THE REGISTRANT’S COMMON EQUITY, RELATED STOCKHOLDER MATTERS AND ISSUER PURCHASES OF EQUITY SECURITIES
Our common stock, $0.01 par value, began trading on The NASDAQ Stock Market under the symbol NATI effective March 13, 1995. Prior to that date, there was no public market for our common stock. The high and low closing prices for our common stock, as reported by Nasdaq for the two most recent fiscal years, are as indicated in the following table.table:
|
|
|
|
|
|
|
|
|
|
|
| High |
| Low |
2012 |
|
|
|
|
First Quarter 2012 | $ | 28.52 | $ | 24.51 |
Second Quarter 2012 |
| 28.40 |
| 25.03 |
Third Quarter 2012 |
| 27.87 |
| 24.85 |
Fourth Quarter 2012 |
| 25.90 |
| 23.37 |
|
|
|
|
|
2011 |
|
|
|
|
First Quarter 2011 | $ | 32.80 | $ | 25.26 |
Second Quarter 2011 |
| 32.93 |
| 27.50 |
Third Quarter 2011 |
| 31.02 |
| 22.16 |
Fourth Quarter 2011 |
| 28.29 |
| 21.72 |
| High | Low | |||||||
| 2009 | ||||||||
| First Quarter 2009 | $ | 23.40 | $ | 15.82 | ||||
| Second Quarter 2009 | 23.61 | 18.41 | ||||||
| Third Quarter 2009 | 28.42 | 21.26 | ||||||
| Fourth Quarter 2009 | 29.85 | 26.52 | ||||||
| 2008 | ||||||||
| First Quarter 2008 | $ | 31.95 | $ | 24.19 | ||||
| Second Quarter 2008 | 31.85 | 25.59 | ||||||
| Third Quarter 2008 | 34.63 | 25.88 | ||||||
| Fourth Quarter 2008 | 27.99 | 20.20 | ||||||
At the close of business on February 15, 2010,4, 2013, there were approximately 473404 holders of record of our common stock and approximately 26,500 shareholders25,502 beneficial holders of beneficial interest.
We believe factors such as quarterly fluctuations in our results of operations, announcements by us or our competitors, technological innovations, new product introductions, governmental regulations, litigation, changes in earnings estimates by analysts or changes in our financial guidance may cause the market price of our common stock to fluctuate, perhaps substantially. In addition, stock prices for many technology companies fluctuate widely for reasons that may be unrelated to their operating results. These broad market and industry fluctuations may adversely affect the market price of our common stock.
Our cash dividend payments for the two most recent fiscal years, on a per share basis, are indicated in the following table on a per share basis.table. The dividends were paid on the dates set forth below;below:
Dividend Amount | ||
2012 | ||
March 5, 2012 | $ | 0.14 |
May 25, 2012 | 0.14 | |
August 31, 2012 | 0.14 | |
December 3, 2012 | 0.14 | |
2011 | ||
February 21, 2011 | $ | 0.10 |
May 31, 2011 | 0.10 | |
August 29, 2011 | 0.10 | |
November 28, 2011 | 0.10 |
| 2009 | ||||
| March 2, 2009 | $ | 0.12 | ||
| June 1, 2009 | 0.12 | |||
| August 31, 2009 | 0.12 | |||
| November 30, 2009 | 0.12 | |||
| 2008 | ||||
| March 3, 2008 | $ | 0.11 | ||
| June 2, 2008 | 0.11 | |||
| September 2, 2008 | 0.11 | |||
| December 1, 2008 | 0.11 | |||
Our policy as to future dividends will be based on, among other considerations, our balance of domestic cash, our ability to obtain external financing through a line of credit, or by selling equity or debt securities to the public or to selected investors, our views on changes in tax rates applied to dividend income, potential future capital requirements related to research and development, expansion into new market areas, strategic investments and business acquisitions, share dilution management, legal risks, and challenges to our business model.
On January 31, 2013, our Board of Directors declared a quarterly cash dividend of $0.14 per common share, payable on March 11, 2013, to stockholders of record on February 19, 2013.
See Item 12 for information regarding securities authorized for issuance under our equity compensation plans.
21
Performance Graph
The following graph compares the cumulative total return to stockholdersholders of NI’s common stock from December 31, 20042007 to December 31, 20092012 to the cumulative return over such period of the (i) Nasdaq Composite Index and (ii) Russell 2000 Index. We use the Russell 2000 Index due to the fact that we have not been able to identify a published industry or line of business index that we believe appropriately reflects our industry or line of business. We considered that our primary competitors are divisions of large corporations that have other significant business operations such that any index comprised of such competitors would not be reflective of our industry or line of business. We have also considered using a peer group index but do not believe such index is appropriate as we have not been able to identify other public companies that we believe are principally in the same line of business as we are.
The graph assumes that $100 was invested on December 31, 20042007 in NI’s common stock and in each of the other two indices and the reinvestment of all dividends, if any. Stockholders are cautioned against drawing any conclusions from the data contained therein, as past results are not necessarily indicative of future performance.
![]()
|
|
|
|
|
|
| |||
|
|
|
|
|
|
| |||
| 12/31/07 | 12/31/08 | 12/31/09 | 12/31/10 | 12/31/11 | 12/31/12 | |||
National Instruments | 100 | 73 | 88 | 113 | 117 | 116 | |||
Nasdaq | 100 | 59 | 86 | 100 | 98 | 114 | |||
Russell 2000 | 100 | 65 | 82 | 102 | 97 | 111 | |||
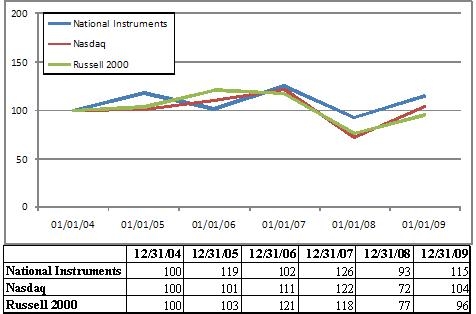
The information contained in the Performance Graph shall not be deemed to be “soliciting material” or to be “filed” with the SEC, nor shall such information be incorporated by reference into any future filing under the Securities Act of 1933, as amended (the “Securities Act”), or the Exchange Act, except to the extent that NI specifically incorporates it by reference into any such filing. The graph is presented in accordance with SEC requirements.
Issuer Purchase of Equity Securities
Period | Total number of shares purchased | Average price paid per share | Total number of shares purchased as part of publicly announced plans or programs | Maximum number of shares that may yet be purchased under the plans or programs (1) | ||||
October 1, 2012 to October 31, 2012 | - | - | - | 3,932,245 | ||||
November 1, 2012 to November 30, 2012 | - | - | - | 3,932,245 | ||||
December 1, 2012 to December 31, 2012 | - | - | - | 3,932,245 | ||||
Total | - | - | - |
Period | Total number of shares | Average price paid per share | Total number of shares purchased as part of a publicly announced plan or program | Maximum number of shares that may yet be purchased under the plan or program (1) | ||||||||||||
| October 1, 2009 to October 31, 2009 | — | — | — | 2,262,168 | ||||||||||||
| November 1, 2009 to November 30, 2009 | 573,841 | $ | 28.55 | 573,841 | 1,688,327 | |||||||||||
| December 1, 2009 to December 31, 2009 | — | — | — | 1,688,327 | ||||||||||||
| Total | 573,841 | $ | 28.55 | 573,841 | ||||||||||||
(1) For the past several years, we have maintained various stock repurchase programs. At December 31, 2012, there were 3,932,245 shares available for repurchase under the plan approved on April 21, 2010. This repurchase plan does not have an expiration date.
22
The following selected consolidated financial data should be read in conjunction with our consolidated financial statements, including the Notes to Consolidated Financial Statements contained in this Form 10-K. The information set forth below is not necessarily indicative of the results of our future operations. The information should be read in conjunction with “Management’s Discussion and Analysis of Financial Condition and Results of Operations.”
|
|
|
|
|
|
|
|
|
|
|
| ||||||||||
|
| For the years ended December 31, | ||||||||
|
| (in thousands, except per share data) | ||||||||
|
| 2012 |
| 2011 |
| 2010 |
| 2009 |
| 2008 |
Statements of Income Data: |
|
|
|
|
|
|
|
|
|
|
Net sales: |
|
|
|
|
|
|
|
|
|
|
Americas | $ | 454,616 | $ | 411,006 | $ | 359,895 | $ | 292,999 | $ | 355,878 |
Europe |
| 297,572 |
| 308,619 |
| 261,118 |
| 210,188 |
| 267,373 |
East Asia |
| 282,512 |
| 215,500 |
| 180,713 |
| 126,147 |
| 142,858 |
Emerging Asia ROW |
| 108,992 |
| 89,048 |
| 71,494 |
| 47,260 |
| 54,428 |
Consolidated net sales |
| 1,143,692 |
| 1,024,173 |
| 873,220 |
| 676,594 |
| 820,537 |
Cost of sales: |
| 280,274 |
| 240,964 |
| 200,083 |
| 169,884 |
| 207,109 |
Gross profit |
| 863,418 |
| 783,209 |
| 673,137 |
| 506,710 |
| 613,428 |
Operating expenses: |
|
|
|
|
|
|
|
|
|
|
Sales and marketing |
| 431,468 |
| 388,768 |
| 319,606 |
| 269,267 |
| 307,409 |
Research and development |
| 222,994 |
| 199,071 |
| 158,149 |
| 132,974 |
| 143,140 |
General and administrative |
| 85,239 |
| 82,658 |
| 67,069 |
| 57,938 |
| 67,162 |
Acquisition related adjustment |
| 6,783 |
| - |
| - |
| - |
| - |
Total operating expenses |
| 746,484 |
| 670,497 |
| 544,824 |
| 460,179 |
| 517,711 |
Operating income |
| 116,934 |
| 112,712 |
| 128,313 |
| 46,531 |
| 95,717 |
Other income (expense): |
|
|
|
|
|
|
|
|
|
|
Interest income |
| 716 |
| 1,319 |
| 1,391 |
| 1,629 |
| 5,996 |
Net foreign exchange (loss) gain |
| (2,246) |
| (2,755) |
| (2,585) |
| 734 |
| (3,737) |
Other (expense) income, net |
| (567) |
| (142) |
| 993 |
| 1,351 |
| 161 |
Income before income taxes |
| 114,837 |
| 111,134 |
| 128,112 |
| 50,245 |
| 98,137 |
Provision for income taxes |
| 24,700 |
| 17,062 |
| 18,996 |
| 33,160 |
| 13,310 |
Net income | $ | 90,137 | $ | 94,072 | $ | 109,116 | $ | 17,085 | $ | 84,827 |
|
|
|
|
|
|
|
|
|
|
|
Basic earnings per share | $ | 0.74 | $ | 0.79 | $ | 0.93 | $ | 0.15 | $ | 0.72 |
|
|
|
|
|
|
|
|
|
|
|
Weighted average shares outstanding - basic |
| 121,973 |
| 119,836 |
| 116,973 |
| 116,280 |
| 117,850 |
|
|
|
|
|
|
|
|
|
|
|
Diluted earnings per share | $ | 0.73 | $ | 0.78 | $ | 0.92 | $ | 0.15 | $ | 0.71 |
|
|
|
|
|
|
|
|
|
|
|
Weighted average shares outstanding - diluted |
| 122,977 |
| 121,220 |
| 118,572 |
| 117,039 |
| 119,272 |
|
|
|
|
|
|
|
|
|
|
|
Cash dividends declared per common share | $ | 0.56 | $ | 0.40 | $ | 0.35 | $ | 0.32 | $ | 0.29 |
|
|
|
|
|
|
|
|
|
|
|
| ||||||||||
|
| December 31, | ||||||||
|
| (in thousands) | ||||||||
|
| 2012 |
| 2011 |
| 2010 |
| 2009 |
| 2008 |
Balance Sheet Data: |
|
|
|
|
|
|
|
|
|
|
Cash and cash equivalents | $ | 161,996 | $ | 142,608 | $ | 219,447 | $ | 201,465 | $ | 229,400 |
Short-term investments |
| 173,166 |
| 223,504 |
| 131,215 |
| 87,196 |
| 6,220 |
Working capital |
| 522,744 |
| 506,644 |
| 484,406 |
| 413,759 |
| 398,292 |
Total assets |
| 1,284,769 |
| 1,154,294 |
| 959,682 |
| 813,029 |
| 832,591 |
Long-term debt, net of current portion |
| - |
| - |
| - |
| - |
| - |
Total stockholders' equity |
| 939,128 |
| 852,011 |
| 744,545 |
| 654,420 |
| 664,438 |
| Years Ended December 31, | ||||||||||||||||||||
| 2009 | 2008 | 2007 | 2006 | 2005 | ||||||||||||||||
| (in thousands, except per share data) | ||||||||||||||||||||
| Statements of Income Data: | ||||||||||||||||||||
| Net sales: | ||||||||||||||||||||
| Americas | $ | 292,999 | $ | 355,878 | $ | 331,482 | $ | 317,780 | $ | 275,524 | ||||||||||
| Europe . | 210,188 | 267,373 | 230,940 | 193,364 | 171,499 | |||||||||||||||
| Asia Pacific | 173,407 | 197,286 | 177,956 | 149,263 | 124,818 | |||||||||||||||
| Consolidated net sales | 676,594 | 820,537 | 740,378 | 660,407 | 571,841 | |||||||||||||||
| Cost of sales | 169,884 | 207,109 | 185,267 | 173,348 | 151,939 | |||||||||||||||
| Gross profit | 506,710 | 613,428 | 555,111 | 487,059 | 419,902 | |||||||||||||||
| Operating expenses: | ||||||||||||||||||||
| Sales and marketing | 269,267 | 307,409 | 264,060 | 232,050 | 208,650 | |||||||||||||||
| Research and development | 132,974 | 143,140 | 126,515 | 113,095 | 87,841 | |||||||||||||||
| General and administrative | 57,938 | 67,162 | 62,445 | 54,192 | 45,199 | |||||||||||||||
| Total operating expenses | 460,179 | 517,711 | 453,020 | 399,337 | 341,690 | |||||||||||||||
| Operating income | 46,531 | 95,717 | 102,091 | 87,722 | 78,212 | |||||||||||||||
| Other income (expense): | ||||||||||||||||||||
| Interest income | 1,629 | 5,996 | 9,822 | 6,847 | 3,758 | |||||||||||||||
| Net foreign exchange gain (loss) | 734 | (3,737 | ) | 1,672 | 740 | (1,566 | ) | |||||||||||||
| Other income (expense), net | 1,351 | 161 | (158 | ) | (7 | ) | 276 | |||||||||||||
| Income before income taxes | 50,245 | 98,137 | 113,427 | 95,302 | 80,680 | |||||||||||||||
| Provision for income taxes | 33,160 | 13,310 | 6,394 | 22,594 | 19,163 | |||||||||||||||
| Net income | $ | 17,085 | $ | 84,827 | $ | 107,033 | $ | 72,708 | $ | 61,517 | ||||||||||
| Basic earnings per share | $ | 0.22 | $ | 1.08 | $ | 1.35 | $ | 0.91 | $ | 0.78 | ||||||||||
| Weighted average shares outstanding - basic | 77,520 | 78,567 | 79,468 | 79,519 | 78,552 | |||||||||||||||
| Diluted earnings per share | $ | 0.22 | $ | 1.07 | $ | 1.32 | $ | 0.89 | $ | 0.76 | ||||||||||
| Weighted average shares outstanding - diluted | 78,026 | 79,515 | 81,043 | 81,519 | 80,910 | |||||||||||||||
| Cash dividends declared per common share | $ | 0.48 | $ | 0.44 | $ | 0.34 | $ | 0.24 | $ | 0.20 | ||||||||||
23
| December 31, | ||||||||||||||||||||
| 2009 | 2008 | 2007 | 2006 | 2005 | ||||||||||||||||
| (in thousands) | ||||||||||||||||||||
| Balance Sheet Data: | ||||||||||||||||||||
| Cash and cash equivalents | $ | 201,465 | $ | 229,400 | $ | 194,839 | $ | 100,287 | $ | 55,864 | ||||||||||
| Short-term investments | 87,196 | 6,220 | 93,838 | 150,190 | 119,846 | |||||||||||||||
| Working capital | 413,759 | 398,292 | 419,874 | 379,733 | 274,686 | |||||||||||||||
| Total assets | 813,029 | 832,591 | 818,812 | 721,220 | 608,336 | |||||||||||||||
| Long-term debt, net of current portion | — | — | — | — | — | |||||||||||||||
| Total stockholders’ equity | 654,420 | 664,438 | 661,086 | 596,682 | 503,850 | |||||||||||||||
The following “Management’s Discussion and Analysis of Financial Condition and Results of Operations” contains forward-looking statements within the meaning of Section 27A of the Securities Act of 1933 and Section 21E of the Securities Exchange Act of 1934. Any statements contained herein regarding our future financial performance, operations, or operationsother activities (including, without limitation, statements to the effect that we “believe,” “expect,” “plan,” “may,” “will,” “project,” “continue,” or “estimate” or other variations thereof or comparable terminology or the negative thereof) should be considered forward-looking statements. Actual results could differ materially from those projected in the forward-looking statements as a result of a number of important factors including those set forth under the heading “Risk Factors”“Risk Factors” beginning on page 10,11, and elsewhere in this Form 10-K. Although we believe that the expectations reflected in the forward-looking statements are reasonable, we cannot guarantee future results, levels of activity, performance or achievements. You should not place undue reliance on these forward-looking statements. We disclaim any obligation to update information contained in any forward-looking statement.
Overview
National Instruments Corporation (“we”, “us” or “our”) is a leading supplier of measurementdesigns, manufactures and automation products thatsells tools to engineers and scientists use in a wide range of industries. These industries comprise a largethat accelerate productivity, innovation and diverse market fordiscovery. Our graphical system design control and test applications. We provide flexible applicationapproach to engineering provides an integrated software and modular, multifunctional hardware platform that users combine with industry-standard computers, networksspeeds the development of systems needing measurement and third party devices to create measurement, automationcontrol. We believe our long-term vision and embedded systems, which we also refer to as “virtual instruments”. Our approach givesfocus on technology supports the success of our customers, the ability to quicklyemployees, suppliers and cost-effectively design, prototype and deploy unique custom-defined solutions for their design, control and test application needs.stockholders. We sell to a large number of customers in a wide variety of industries. We have been profitable in every year since 1990. No single customer accounted for more than 3%7%, 4%, or 4% of our sales in 2009, 20082012, 2011, or 2007.
The key strategies that management focuses on in running our business are the following:
Expanding our broad customer base
We strive to increase our already broad customer base by serving a large market on many computer platforms, through a global marketing and distribution network. We also seek to acquire new technologies and expertise from time to time in order to open new opportunities for our existing product portfolio.
Maintaining a high level of customer satisfaction
To maintain a high level of customer satisfaction we strive to offer innovative, modular and integrated products through a global sales and support network. We strive to maintain a high degree of backwards compatibility across different platforms in order to preserve the customer’s investment in our products. In this time of intense global competition, we believe it is crucial that we continue to offer products with quality and reliability, and that theseour products provide cost-effective solutions for our customers.
Leveraging external and internal technology
Our product strategy is to provide superior products by leveraging generally available technology, supporting open architectures on multiple platforms and by leveraging our core technologies such as custom application specific integrated circuits (“ASICs”) across multiple products.
We sell into test and measurement (“T&M”) and industrial/embedded applications in a broad range of industries and as such are subject to the economic and industry forces which drive those markets. It has been our experience that the performance of these industries and our performance is impacted by general trends in industrial production for the global economy and by the specific performance of certain vertical markets that are intensive consumers of measurement technologies. Examples of these markets are semiconductor capital equipment, telecom and mobile devices, consumer electronics, defense, aerospace automotive and others. automotive.
24
In assessing our business, we consider the trends in the Global Purchasing Managers Index (“PMI”) published by JP Morgan, global industrial production as well as industry reports on the specific vertical industries that we target. Starting in August 2009, theA PMI has had readingsreading above 50 which areis indicative of expansion in the global industrial global economy. However, we believe thereOur business is still a substantial amount of uncertainty aboutsensitive to fluctuations in general economic conditions, both in the U.S. and globally. Historically, our business cycles have generally followed the expansion and contraction cycles in the global industrial economic conditions.economy as measured by the PMI. The most recent reading for January 2013 showed the PMI had increased to 51.5 up from a reading of 48.8 for September 2012. This marks the second month since May 2012 that the PMI has had a reading above 50. For January 2013, the new order element of the PMI was 51.8 up from 48.0 in September 2012. This is the first time in six months that the new order element of the PMI has had a reading above 50. We are unable to predict whether the current expansion cycle,industrial economy, as measured by the PMI, will be sustained throughout 2010. This continuing uncertainty instrengthen or contract during 2013. If the global industrial economy, is likely to continue toas measured by the PMI contracts or remains at a neutral reading at or around 50, indicating general weakness, it could have an adverse effect on the spending patterns of businesses including our current and potential customers which could adversely affect our revenues and therefore harm our business and result of operations.
We distribute our software and hardware products primarily through a direct sales organization. We also use independent distributors, OEMs, VARs, system integrators and consultants to market our products. Sales through these alternative channels account for less than 7% of our total sales in 2012. We have sales offices in the U.S. and sales offices and distributors in key international markets. Sales outside of the Americas accounted for approximately 57%, 57% and 55% or60% of our revenues in 2009, 20082012, 60% of our revenues in 2011 and 2007, respectively.59% of our revenues in 2010. The vast majority of our foreign sales are denominated in the customers’ local currency, which exposes us to the effects of changes in foreign currency exchange rates. We expect that a significant portion of our total revenues will continue to be derived from international sales. (See Note 12 –13 - Segment information of Notes to Consolidated Financial Statements for details concerning the geographic breakdown of our net sales, operating income, interest income and long-lived assets).
We manufacture a substantial majority of our products at our facilities in Debrecen, Hungary. Additional production primarily of low volume or newly introduced products is done in Austin, Texas. We are currently in the process of ramping up our third manufacturing site in Penang, Malaysia. It is expected that in 2013 our site in Malaysia will produce around 15% to 20% of our total production and will focus primarily on making existing products transferred from our Hungarian production facility to support anticipated growth in our business. Our product manufacturing operations can be divided into four areas: electronic circuit card and module assembly; chassis and cable assembly; technical manuals and product support documentation; and software duplication. We manufacture most of the electronic circuit card assemblies, modules and moduleschassis in-house, although subcontractors are used from time to time. We currently use subcontractors in Asia to manufacture a significant portion of our chassis but we review these arrangements periodically. We manufacture some of our electronic cable assemblies in-house, but many assemblies are produced by subcontractors. We primarily subcontract our software duplication, our technical manuals and product support documentation.
We believe that our long-term growth and success dependsdepend on delivering high quality software and hardware products on a timely basis. Accordingly, we focus significant efforts on research and development. We focus our research and development efforts on enhancing existing products and developing new products that incorporate appropriate features and functionality to be competitive with respect to technology, price and performance. Our success also is dependent on our ability to obtain and maintain patents and other proprietary rights related to technologies used in our products. We have engaged in litigation and where necessary, will likely engage in future litigation to protect our intellectual property rights. In monitoring and policing our intellectual property rights, we have been and may be required to spend significant resources.
Our operating results fluctuate from period to period due to changes in global economic conditions and a number of other factors. As a result, we believe our historical results of operations should not be relied upon as indications of future performance.
Results of Operations
The following table sets forth, for the periods indicated, the percentage of net sales represented by certain items reflected in our Consolidated Statements of Income:
|
|
|
|
|
|
|
|
|
|
|
|
|
|
| Years ended December 31, |
| ||||
| 2012 |
| 2011 |
| 2010 |
|
Net sales: |
|
|
|
|
|
|
Americas | 39.8 | % | 40.1 | % | 41.2 | % |
Europe | 26.0 |
| 30.1 |
| 29.9 |
|
East Asia | 24.7 |
| 21.1 |
| 20.7 |
|
Emerging Asia ROW | 9.5 |
| 8.7 |
| 8.2 |
|
Consolidated net sales | 100.0 |
| 100.0 |
| 100.0 |
|
Cost of sales | 24.5 |
| 23.5 |
| 22.9 |
|
Gross profit | 75.5 |
| 76.5 |
| 77.1 |
|
Operating expenses: |
|
|
|
|
|
|
Sales and marketing | 37.7 |
| 38.0 |
| 36.6 |
|
Research and development | 19.5 |
| 19.4 |
| 18.1 |
|
General and administrative | 7.5 |
| 8.1 |
| 7.7 |
|
Acquisition related adjustment | 0.6 |
| - |
| - |
|
Total operating expenses | 65.3 |
| 65.5 |
| 62.4 |
|
Operating income | 10.2 |
| 11.0 |
| 14.7 |
|
Other income (expense): |
|
|
|
|
|
|
Interest income | 0.1 |
| 0.2 |
| 0.2 |
|
Net foreign exchange loss | (0.2) |
| (0.3) |
| (0.3) |
|
Other income, net | (0.0) |
| - |
| 0.1 |
|
Income before income taxes | 10.1 |
| 10.9 |
| 14.7 |
|
Provision for income taxes | 2.2 |
| 1.7 |
| 2.2 |
|
Net income | 7.9 | % | 9.2 | % | 12.5 | % |
25
| Years Ended December 31, | ||||||||||||
| 2009 | 2008 | 2007 | ||||||||||
| Net sales: | ||||||||||||
| Americas | 43.3 | % | 43.4 | % | 44.8 | % | ||||||
| Europe | 31.1 | 32.6 | 31.2 | |||||||||
| Asia Pacific | 25.6 | �� | 24.0 | 24.0 | ||||||||
| Consolidated net sales | 100.0 | 100.0 | 100.0 | |||||||||
| Cost of sales | 25.1 | 25.2 | 25.0 | |||||||||
| Gross profit | 74.9 | 74.8 | 75.0 | |||||||||
| Operating expenses: | ||||||||||||
| Sales and marketing | 39.8 | 37.5 | 35.7 | |||||||||
| Research and development | 19.6 | 17.4 | 17.1 | |||||||||
| General and administrative | 8.6 | 8.2 | 8.4 | |||||||||
| Total operating expenses | 68.0 | 63.1 | 61.2 | |||||||||
| Operating income | 6.9 | 11.7 | 13.8 | |||||||||
| Other income (expense): | ||||||||||||
| Interest income | 0.2 | 0.7 | 1.3 | |||||||||
| Net foreign exchange gain (loss) | 0.1 | (0.5 | ) | 0.2 | ||||||||
| Other income (expense), net | 0.2 | — | — | |||||||||
| Income before income taxes | 7.4 | 11.9 | 15.3 | |||||||||
| Provision for income taxes | 4.9 | 1.6 | 0.8 | |||||||||
| Net income | 2.5 | % | 10.3 | % | 14.5 | % | ||||||
Results of Operations for years ended December 31, 2012, 2011 and 2010
Despite difficult economic conditions throughout 2012, we are pleased with our disciplined execution which allowed us to grow revenue 12% year over year and delivering record revenue of $1.14 billion. While we remain cautious in the short-term due to uncertain economic conditions, we are optimistic about our long-term position in the industry through the sustained differentiation we deliver to our customers through graphical system design.
Net Sales. Consolidated Our net sales were $677$1,144 million, $821$1,024 million and $740$873 million for the years ended December 31, 2009, 20082012, 2011 and 2007,2010, respectively, a decreasean increase of 18%12% in 2009 compared to 20082012 following an increase of 11%17% in 20082011. Product sales were $1,055 million, $956 million and $807 million for the years ended December 31, 2012, 2011 and 2010, respectively, an increase of 10% in 2012 following an increase of 18% in 2011. Software maintenance sales were $87 million, $82 million and $66 million for the years ended December 31, 2012, 2011 and 2010, respectively, an increase of 7% in 2012 following an increase of 24% in 2011. For the year ended December 31, 2012, our net sales were positively impacted by our Settlement Agreement with GSA which was $1.3 million less than the amount previously accrued. For the year ended December 31, 2011, net sales were negatively impacted by the $13 million accrual related to our GSA contract. The revenue increase in 2012 compared to 2007. The decrease in 2009 can be2011 is attributed to declinesincreases in sales volume in the Americas, East Asia and Emerging Asia Rest of World (ROW). In 2011, the revenue increase is attributed to increases in sales volume across all regions of our business. Instrument control products which comprised approximately 7% of our revenues for the year ended December 31, 2009, saw a year-over-year decline of 31%. Products in the areas of virtual instrumentation and graphical system design which comprised approximately 93% of our revenues for the year ended December 31, 2009, saw a year-over-year decline of 16%. Revenues from our instrument control products are the most sensitive to the cycles of the global industrial economy. For the year ended December 31, 2009, our order backlog increased by approximately $8 million. Backlog is a measure of orders that were received but that had not shipped to customers at the end of the quarter.
We did not take any significant action with regard to pricing during the yearyears ended December 31, 2009,2012, 2011 and thus, the decrease2010.
Large orders, defined as orders with a value greater than $100,000, grew by 67%, during 2012 following growth of 38% during 2011. During 2012, 2011 and 2010, these large orders were 21%, 14% and 12%, respectively, of our total orders. During 2012, we received a series of orders totaling $59 million for a large graphical system design application from one customer of which $56 million was recognized in revenues is attributable torevenue during 2012. Including this order, we received a decreasetotal of $76 million in orders from this customer orders. The increase in 2012, of which $72 million or 6% of our total net sales was recognized as revenue in 2008, compared2012. Larger orders may be more sensitive to 2007 can be attributed to volume growthchanges in the areas of modular instruments, particularly RF test products, PXI, softwareglobal industrial economy, may be subject to greater discount variability and CompactRIO which performed very well in light of the industry contraction. The increases in these areas were offset by declines in revenue from instrument control products which are the most sensitive to downturns in the Global PMI.
For the years ended December 31, 2009, 20082012, 2011 and 2007,2010, net sales in the Americas were $455 million, $411 million and $360 million, respectively, a decreasean increase of 18%11% in 2009 compared to 20082012 following an increase of 14% in of 8%2011. Sales in 2008 compared to 2007. Sales outside of the Americas, as a percentage of consolidated sales were 57%40%, 57%40% and 55% for41%, respectively, over the years ended December 31, 2009, 2008 and 2007, respectively. Sales inthree year period. In Europe, net sales were $210$298 million, $267$309 million and $231$261 million, for the years ended December 31, 2009, 2008 and 2007, respectively, a decrease of 21%4% in 2009 compared to 20082012 following an increase of 16%18% in 2008 compared to 2007.2011. The decrease in 2012 was mainly the result of changes in foreign currency exchange rates. Sales in Europe, as a percentage of consolidated sales were 26%, 30% and 30%, respectively, over the three year period. In East Asia, sales were $173$283 million, $197$216 million and $178$181 million, for the years ended December 31, 2009, 2008 and 2007, respectively, a decreasean increase of 12%31% in 2009 compared to 20082012 following an increase of 11%19% in 2008 compared2011. The increase in 2012 was impacted by the large graphical system design application discussed above. Net sales in East Asia, as a percentage of consolidated sales were 25%, 21% and 21%, respectively, over the three year period. We defined East Asia to 2007. include greater China, Japan and Korea. In Emerging Asia ROW, net sales were $109 million, $89 million and $71 million, respectively, an increase of 22% in 2012 following an increase of 25% in 2011. Sales in Emerging Asia ROW, as a percentage of consolidated sales were 10%, 9% and 8%, respectively, over the three year period. We define Emerging Asia ROW to include Southeast Asia, Africa, the Middle East, and the former Russian Republics.
26
We expect sales outside of the Americas to continue to represent a significant portion of our revenue. We intend to continue to expand our international operations by increasing our presence in existing markets, adding a presence in some new geographical markets and continuing the use of distributors to sell our products in some countries.
Almost all of the sales made by our direct sales offices in the Americas, outside of the U.S., in Europe, East Asia, and inEmerging Asia PacificROW are denominated in local currencies, and accordingly, the U.S. dollar equivalent of these sales is affected by changes in foreign currency exchange rates. For 2009, net of hedging results,2012, in local currency terms, our total sales increased by $138 million or 13%, Americas sales increased by $45 million or 11%, European sales increased by $4.6 million or 1%, sales in East Asia increased by $63 million or 29%, and sales in Emerging Asia ROW increased by $25 million or 28%. During this same period, the change in exchange rates had the effect of decreasing our consolidatedtotal sales by $29 million or 4%, decreasing America’s sales by $6$20 million or 2%, decreasing Americas sales by $1.8 million or 0.4%, decreasing European sales by $17$18 million or 6%, increasing East Asia by $4.0 million or 2% and decreasing Emerging Asia ROW sales by $4.9 million or 6%.
For 2011, in local currency terms, our total sales increased by $128 million or 15%, Americas sales increased by $50 million or 14%, European sales increased by $37 million or 16%, and sales in East Asia Pacificincreased by $6$27 million or 3% compared to 2008. For 2008, net of hedging results,15%, and sales in Emerging Asia ROW increased by $14 million or 19%. During this same period, the change in exchange rates had the effect of increasing our consolidatedtotal sales by $34$27 million or 4%3%, increasing America’sAmericas sales by $1.7$1 million or 0.5%0.4%, increasing European sales by $28$13 million or 12%5%, increasing East Asia by $7.4 million or 4% and increasing Emerging Asia ROW sales in Asia Pacific by $4.3$5.7 million or 2% compared8%.
To help protect against a reduction in value caused by a fluctuation in foreign currency exchange rates of forecasted foreign currency cash flows resulting from international sales, we have instituted a foreign currency cash flow hedging program. We hedge portions of our forecasted revenue denominated in foreign currencies with forward and purchased option contracts. During 2012, these hedges had the effect of increasing our consolidated sales by $2.9 million. During 2011, these hedges had the effect of decreasing our consolidated sales by $3.9 million. (See Note 4 - Derivative instruments and hedging activities of Notes to 2007.
Gross Profit. For the years ended December 31, 2012, 2011 and 2010, gross profit was $863 million, $783 million and $673 million, respectively. As a percentage of sales, gross profit was 76%, 77% and 77% in 2012, 2011 and 2010, respectively. During the year ended December 31, 2012, gross margin was 75%negatively impacted by the decline in 2009, 75% in 2008our European business as a result of the weakness of the European industrial economy and 75% in 2007. In 2009, we were successful in implementingthe weaker Euro as well as the lower than average gross margin on our largest order. We continued to focus on cost control and cost reduction strategiesmeasures throughout our manufacturing cycle which allowedcycle. These cost control and cost reduction measures along with sales growth have helped us to maintain a stablerelative stability in our gross margin percentage despite the 18% decrease in sales volume in 2009. For the years ended December 31, 2009, 2008margin.
During 2012 and 2007, charges related to acquisition related intangibles and stock based compensation were $4.7 million, $4.7 million and $3.6 million, respectively. For the years ended December 31, 2009 and 2008, the net impact of2011, the change in foreign currency exchange rates had the effect of decreasing our cost of goods soldsales by $3$1.2 million or 1%, and increasing our cost of goods soldsales by $1.1$4.7 million or 4%2%, respectively.
Operating Expenses. For the years ended December 31, 2009, 20082012, 2011 and 2007,2010, operating expenses were $746 million, $670 million and $545 million, respectively, a decreasean increase of 12%11% in 2009 compared to 20082012, following an increase of 23% in 2011. During 2012, our operating expenses grew 16% in 2008during the first half of the year, compared to 2007. Asthe first half of 2011 and grew by 8% during the second half of the year, compared to the second half of 2012. The 8% growth in the second half of the year includes an adjustment to the accrual related to our AWR acquisition of $6.8 million as a percentageresult of net sales, sales and marketing expenses were 40%, 38% and 36% for 2009, 2008 and 2007, respectively. For 2009,AWR’s performance exceeding our prior expectations. Overall, the increase in sales and marketingour operating expenses as a percentage of revenuein 2012 was due to the 18% decrease in revenue. For 2009, the decrease in sales and marketinghigher personnel related expenses in absolute dollars was due to a decrease in travel, tradeshows and advertising of $15$51 million a decrease inwhich included commissions, variable compensation and benefits, higher expenses for building, equipment and supplies of $4.2$9 million, higher expenses related to marketing and outside services of $8 million, higher travel related expenses of $7.3 million and a decrease caused byhigher equity based compensation of $4.6 million. Over the same period, the net impact of changes in foreign currency exchange rates decreased our operating expense by $5.8 million. The increase in personnel expenses is related to a net increase in our headcount of $9 million. Temporary634 employees during 2012.
27
The increase in our operating expenses in 2011 was due to higher personnel related expenses of $48 million which included commissions, variable compensation and benefits as well as the fact that temporary cost cutting measures which included a company-wide wage reduction as well as a reductionenacted in the number of accrued vacation hours that employees are allowed2009 were still in place in January 2010, higher expenses related to carry beyond December 31, 2009, resulted in additional cost savings of $7 million compared to 2008. For 2008, the increase in sales and marketing expense, both in absolute dollars and as a percentage of sales, was consistent with our plan to make additional investments in our field sales force during 2008. Approximately 65% of the increase in 2008 over 2007, can be attributed to the increase in sales and marketing personnel, increases in stock-based compensation and the increase in variable compensation from higher sales volume. In addition, during 2008, the net impact of foreign currency exchange rates had the effect of increasing our sales and marketing expense by $10 million or 3%. We plan to continue to make additional investments in our field sales force in 2010. However, due to the continuing uncertainty in the industrial economy, the extent of our field sales expansion during 2010 will be dependent on our overall sales volumes in 2010. We expect sales and marketing expenses in future periods to continue to fluctuate as a percentage of sales based on recruiting, marketing and advertising campaign costs associated with major new product releasesoutside services of $25 million, higher expenses for building, equipment and entry into new market areas, investment in web sales and marketing efforts, increasing product demonstration costs and the timingsupplies of domestic and international conferences and trade shows.
For the years ended December 31, 2012, 2011 and 2010, operating expenses as a reductionpercentage of net sales were 65%, 66% and 62%, respectively. The year over year decrease in our operating expenses as a percentage of net sales in 2012 compared to 2011 is attributed to the numberfact that we grew our overall operating expenses by 11% while our net sales grew by 12%. For 2011, the increase in our operating expenses as a percent of accrued vacation hourssales was due to the fact that employees were allowedwe grew our overall operating expense by 23% while our net sales grew by 17%.
We believe that our long-term growth and success depends on developing high quality software and hardware products and delivering those products to carry beyondour customers on a timely basis. To that end, we made investments in research and development and our field sales force a priority. For the years ended December 31, 2009, resulted in additional cost savings of $7 million. These decreases2012 and 2011, our research and development expenses were offset by personnel costs related to a net headcount$223 million and $199 million, respectively, an increase of 42 people during 2009. For 2008,12% following an increase of 26% in 2011. From a regional perspective, the increase in research and development expenses in absolute dollars2012, had a larger impact on the operating income of the Americas as the Americas absorbed $21 million of the overall $24 million increase. The overall increase in research and development expense was primarily due to increasesan increase in personnel costs from the hiring of additional product development engineers as well as increases related to stock-based compensation and was consistent with our plan to continue to grow our research and development capacityheadcount to 2,007 at December 31, 2012 from 1,868 at December 31, 2011. This increase in lineheadcount is consistent with the overall revenue growth of the company. During 2008, we had a net headcount increase of 109 people in our worldwide research and development group. In addition, during 2008, the net impact of foreign currency exchange rates had the effect of increasing our research and development expense by $2.7 million or 2%. Westated plan to continue to make additional investmentsinvestment in research and development a priority to support our long-term growth.
Operating Income.For the years ended December 31, 2012, 2011 and 2010, operating income was $117 million, $113 million and $128 million, respectively, an increase of 4% in 2010. However, due2012, following an decrease of 12% in 2011. As a percentage of net sales, operating income was 10%, 11% and 15%, respectively, over the three year period. Our operating income in 2012 includes the negative impact of the adjustment to the continuing uncertaintyaccrual related to our AWR acquisition of $6.8 million as a result of AWR’s performance exceeding our prior expectations and the positive impact of a $1.3 million favorable settlement from our GSA contract during the second quarter of 2012. The settlement of this matter was $1.3 million less than what we estimated in the industrial economy, the extent2011. The decrease in our operating income as a percent of our research and development expansionsales during 2010 will2011 can be dependent onattributed to our overall increase in operating expenses of 23% when compared to the overall net sales volumesincrease of 17%. Operating income for 2011 was negatively impacted by the $13 million accrual related to our GSA contract, which reduced our revenue in 2010.2011.
We capitalize software development costs in accordance with the Financial Accounting Standards Board (FASB) Accounting Standards Codification (ASC) 985, SoftwareInterest Income. (FASB ASC 985). We amortize such costs over the related product’s estimated economic life, generally three years, beginning when a product becomes available for general release. Software amortization expense included in cost of goods sold totaled $9 million, $10Interest income was $716,000, $1.3 million and $9 million during 2009, 2008 and 2007, respectively. Internally developed software costs capitalized during 2009, 2008 and 2007 were $13 million, $10 million and $8 million, respectively. Capitalization of internally developed software costs varies depending on the timing of when each project reaches technological feasibility and the length and scope of the development cycle of each individual project. (See Note 7 - Intangibles of Notes to Consolidated Financial Statements for a description of intangibles).
Net Foreign Exchange Loss. Net foreign currency exchange rates of $2.6loss was $(2.2) million, a reduction of our patent litigation accrual which resulted in a non-cash decrease to our operating expenses of $2$(2.8) million, and a decrease in variable compensation of $948,000. Temporary cost cutting measures which include a company-wide wage reduction as well as a reduction in the number of accrued vacation hours that employees are allowed to carry beyond December 31, 2009, resulted in additional cost savings of $1.8 million. For 2008, the increase in absolute dollars compared to 2007 can primarily be attributed to the net impact of foreign currency exchange rates which had the effect of increasing our general and administrative expense by $2.4 million or 4%. We expect that general and administrative expenses in future periods will fluctuate in absolute dollars and as a percentage of revenue.
We utilize foreign currency forward contracts to hedge our foreign denominated net foreign currency balance sheet positions to help protect against the change in value caused by a fluctuation in foreign currency exchange rates. We typically hedge up to 90% of our outstanding foreign denominated net receivable or payable positions and typically limit the duration of these foreign currency forward contracts to approximately 90 days. The gain or loss on these derivatives as well as the offsetting gain or loss on the hedgehedged item attributable to the hedged risk is recognized in current earnings under the line item “net“Net foreign exchange gain (loss)”loss”. Our hedging strategy reducedincreased our foreign exchange gainslosses by $1.7$2.1 million in 2009,2012, reduced our foreign exchange losses by $1.2 million$959,000 in 20082011, and reducedincreased our foreign exchange gainsgain by $1.1$1.6 million in 2007.2010.
28
Table of forecasted foreign currency cash flows resulting from international sales and expenses over the next one to two years, we have instituted a foreign currency cash flow hedging program. We hedge portions of our forecasted revenue and forecasted expenses denominated in foreign currencies with forward and option contracts. For forward contracts, when the dollar strengthens significantly against the foreign currencies, the change in the present value of future foreign currency cash flows may be offset by the change in the fair value of the forward contracts designated as hedges. For purchased option contracts, when the dollar strengthens significantly against the foreign currencies, the change in the present value of future foreign currency cash flows may be offset by the change in the fair value of the option contracts designated as hedges, net of the premium paid. Our foreign currency purchased option contracts are purchased “at-the-money” or “out-of-the-money.” We purchase foreign currency forward and option contracts for up to 100% of our forecasted exposures in selected currencies (primarily in Euro, Japanese yen, British pound sterling and Hungarian forint) and limit the duration of these contracts to 40 months or less. As a result, our hedging activities only partially address our risks from foreign currency transactions, and there can be no assurance that this strategy will be successful. We do not invest in contracts for speculative purposes. (See Note 4Contents - Derivative instruments and hedging activities of Notes to Consolidated Financial Statements for a description of our forward and purchased option contracts and hedged positions).
Provision for Income Taxes. Our For the years ended December 31, 2012, 2011 and 2010, our provision for income taxes reflected an effective tax rate of 66%22%, 14%15% and 6% for the years ended December 31, 2009, 2008 and 2007,15%, respectively. The increase infactors that caused our effective tax rate to change in 20092012 compared to 2008 was driven by changes2011 are detailed in our valuation allowances, tax charges related to inter-company profits and an increase in equity compensation expense as a percentage of pre-tax book income. (See the table below:
Years ended | ||
December 31, | ||
Effective tax rate for 2011 | 15 | % |
Decreased profits in foreign jurisdictions with reduced income tax rates | 2 | |
Change in non-deductible stock-based compensation expense as a percentage of net income | 1 | |
Change in enhanced deduction for certain research and development expenses | 1 | |
Change in intercompany profit | (1) | |
Nondeductible acquisition costs | 2 | |
Change in research and development tax credits | 3 | |
Other | (1) | |
Effective tax rate for 2012 | 22 | % |
(See Note 9 – Income taxes of Notes to Consolidated Financial Statements for further discussion regarding changes in our effective tax rate and a reconciliation of income taxes at the U.S. federal statutory income tax rate of 35% to our effective tax rate).
Quarterly results of operations
The following quarterly results have been derived from unaudited consolidated financial statements that, in the opinion of management, reflect all adjustments (consisting only of normal recurring adjustments) necessary for a fair presentation of such quarterly information. The operating results for any quarter are not necessarily indicative of the results to be expected for any future period. You should read the following tables presenting our quarterly results of operations in conjunction with the consolidated financial statements and related notes contained elsewhere in this Annual Report on Form 10-K. The unaudited quarterly financial data for each of the eight quarters in the two years ended December 31, 2012 are as follows:
|
|
|
|
|
|
|
|
|
| ||||||||
|
| Three months ended | ||||||
|
| (in thousands, except per share data) | ||||||
|
| March 31, 2012 |
| June 30, 2012 |
| September 30, 2012 |
| December 31, 2012 |
Net sales | $ | 261,133 | $ | 292,259 | $ | 289,974 | $ | 300,326 |
Gross profit |
| 199,785 |
| 221,408 |
| 216,480 |
| 225,745 |
Operating income |
| 24,344 |
| 34,864 |
| 29,926 |
| 27,800 |
Net income |
| 18,642 |
| 26,441 |
| 24,340 |
| 20,713 |
Basic earnings per share | $ | 0.15 | $ | 0.22 | $ | 0.20 | $ | 0.17 |
Weighted average shares outstanding - basic |
| 120,908 |
| 121,801 |
| 122,402 |
| 122,754 |
Diluted earnings per share | $ | 0.15 | $ | 0.22 | $ | 0.20 | $ | 0.17 |
Weighted average shares outstanding - diluted |
| 121,972 |
| 122,759 |
| 123,074 |
| 123,375 |
Dividends declared per share | $ | 0.14 | $ | 0.14 | $ | 0.14 | $ | 0.14 |
|
|
|
|
|
|
|
|
|
|
|
|
|
|
|
|
|
|
|
| Three months ended | ||||||
|
| (in thousands, except per share data) | ||||||
|
| March 31, 2011 |
| June 30, 2011 |
| September 30, 2011 |
| December 31, 2011 |
Net sales | $ | 237,850 | $ | 253,284 | $ | 254,988 | $ | 278,051 |
Gross profit |
| 185,374 |
| 197,398 |
| 189,773 |
| 210,664 |
Operating income |
| 36,512 |
| 32,942 |
| 10,756 |
| 32,502 |
Net income |
| 30,461 |
| 26,548 |
| 12,736 |
| 24,327 |
Basic earnings per share | $ | 0.26 | $ | 0.22 | $ | 0.11 | $ | 0.20 |
Weighted average shares outstanding - basic |
| 118,693 |
| 119,736 |
| 120,308 |
| 120,582 |
Diluted earnings per share | $ | 0.25 | $ | 0.22 | $ | 0.11 | $ | 0.20 |
Weighted average shares outstanding - diluted |
| 120,443 |
| 121,161 |
| 121,102 |
| 121,453 |
Dividends declared per share | $ | 0.10 | $ | 0.10 | $ | 0.10 | $ | 0.10 |
29
Other operational metrics
We believe that the following additional unaudited operational metrics assists investors in assessing our operational performance relative to our peers and to our historical results.
Acquisition Related Deferred Revenue excluded from Revenue and GSA Accrual Reduction to Revenue. For the three month periods and years ended December 31, 2012 and 2011, the excluded acquisition related deferred revenue and the reduction of revenue resulting from our GSA accrual were as follows:
|
|
|
|
|
|
|
|
|
|
|
|
|
|
|
|
|
|
|
|
|
|
|
|
|
|
|
(In thousands) |
| Three Months Ended December 31, |
| Years Ended December 31, | ||||
|
| 2012 |
| 2011 |
| 2012 |
| 2011 |
Revenue |
|
|
|
|
|
|
|
|
Acquisition related deferred revenue | $ | - | $ | 1,912 | $ | 2,156 | $ | 4,730 |
GSA accrual |
| - |
| - |
| (1,349) |
| 13,107 |
Provision for income taxes |
| - |
| (669) |
| (282) |
| (6,242) |
Total | $ | - | $ | 1,243 | $ | 525 | $ | 11,595 |
Charges Related to Stock-based Compensation, Amortization of Acquired Intangibles and Acquisition Related Transaction Costs. For the three month periods and years ended December 31, 2012 and 2011, the gross charges related to stock-based compensation as a component of cost of sales, sales and marketing, research and development, and general and administrative expenses and the total charges were as follows:
|
|
|
|
|
|
|
|
|
|
|
|
|
|
|
|
|
|
(In thousands) |
| Three Months Ended December 31, |
| Years Ended December 31, | ||||
|
| 2012 |
| 2011 |
| 2012 |
| 2011 |
Stock-based compensation |
|
|
|
|
|
|
|
|
Cost of sales | $ | 430 | $ | 411 | $ | 1,719 | $ | 1,527 |
Sales and marketing |
| 3,033 |
| 2,702 |
| 11,612 |
| 9,711 |
Research and development |
| 2,919 |
| 2,625 |
| 10,909 |
| 8,870 |
General and administrative |
| 908 |
| 831 |
| 3,556 |
| 3,111 |
Provision for income taxes |
| (2,193) |
| (2,041) |
| (7,579) |
| (6,827) |
Total | $ | 5,097 | $ | 4,528 | $ | 20,217 | $ | 16,392 |
For the three month periods and years ended December 31, 2012 and 2011, the gross charges related to the amortization of acquisition related intangibles as a component of cost of sales, sales and marketing, research and development, and other income, net and the total charges were as follows:
|
|
|
|
|
|
|
|
|
|
|
|
|
|
|
|
|
|
(In thousands) |
| Three Months Ended December 31, |
| Years Ended December 31, | ||||
|
| 2012 |
| 2011 |
| 2012 |
| 2011 |
Amortization of acquired intangibles |
|
|
|
|
|
|
|
|
Cost of sales | $ | 2,165 | $ | 2,469 | $ | 8,926 | $ | 7,064 |
Sales and marketing |
| 476 |
| 447 |
| 1,819 |
| 1,071 |
Research and development |
| 217 |
| - |
| 217 |
| - |
Other income, net |
| 194 |
| 190 |
| 765 |
| 955 |
Provision for income taxes |
| (964) |
| (993) |
| (3,717) |
| (2,736) |
Total | $ | 2,088 | $ | 2,113 | $ | 8,010 | $ | 6,354 |
For the three month periods and years ended December 31, 2012 and 2011, the gross charges related to acquisition related transaction costs as a component of cost of sales, sales and marketing, research and development, general and administrative expenses, acquisition related adjustment, and the total charges were as follows:
|
|
|
|
|
|
|
|
|
|
|
|
|
|
|
|
|
|
(In thousands) |
| Three Months Ended December 31, |
| Years Ended December 31, | ||||
|
| 2012 |
| 2011 |
| 2012 |
| 2011 |
Acquisition related transaction costs |
|
|
|
|
|
|
|
|
Cost of sales | $ | (56) | $ | 32 | $ | (24) | $ | 54 |
Sales and marketing |
| 177 |
| 220 |
| 606 |
| 1,349 |
Research and development |
| 165 |
| 106 |
| 360 |
| 176 |
General and administrative |
| 355 |
| 47 |
| 393 |
| 505 |
Acquisition related adjustment |
| 6,783 |
| - |
| 6,783 |
| - |
Provision for income taxes |
| (105) |
| (142) |
| (348) |
| (288) |
Total | $ | 7,319 | $ | 263 | $ | 7,770 | $ | 1,796 |
30
Liquidity and Capital Resources
Working Capital, Cash and Cash Equivalents and Short-term Investments and Long-term Investments. The following table presents our working capital, cash and cash equivalents and marketable securities (in thousands):securities:
|
|
|
|
|
|
|
|
|
|
|
|
|
|
(In thousands) |
| December 31, 2012 |
| December 31, 2011 |
| Increase/(Decrease) |
|
|
|
|
|
|
|
Working capital | $ | 522,744 | $ | 506,644 | $ | 16,100 |
Cash and cash equivalents (1) |
| 161,996 |
| 142,608 |
| 19,388 |
Short-term investments (1) |
| 173,166 |
| 223,504 |
| (50,338) |
Total cash, cash equivalents and short-term investments | $ | 335,162 | $ | 366,112 | $ | (30,950) |
|
|
|
|
|
|
|
(1) Included in working capital |
|
|
|
|
|
|
December 31, 2009 | December 31, 2008 | Increase/ (Decrease) | ||||||||||
| Working capital | $ | 413,759 | $ | 398,292 | $ | 15,467 | ||||||
Cash and cash equivalents (1) | 201,465 | 229,400 | (27,935 | ) | ||||||||
Short-term investments (1) | 87,196 | 6,220 | 80,976 | |||||||||
| Long-term investments | — | 10,500 | (10,500 | ) | ||||||||
| Total cash, cash equivalents, short and long-term investments | $ | 288,661 | $ | 246,120 | $ | 42,541 | ||||||
(1)Included in working capital
Our cash and cash equivalent balances are held in numerous financial institutions throughout the world, including substantial amounts held outside of the U.S.;, however, the majority of our cash and investments that are located outside of the U.S. are denominated in U.S. dollars with the exception of $25 million U.S. dollar equivalent of German government sovereign debt that is denominated in Euro. Our German government sovereign debt holdings have a maximum maturity of 24 months and carry Aaa/AAA ratings. At December 31, 2012, we had $335 million in cash, cash equivalents and short-term investments. Approximately $28 million or 8% of these amounts were held in domestic accounts with various financial institutions and $307 million or 92% was held in accounts outside of the U.S. dollar.with various financial institutions. Of our short-term investments, $1.5 million or 1% is held in our investment accounts in the U.S. and $172 million or 99% is held in investment accounts of our foreign subsidiaries. Most of the amounts held outside of the U.S. could be repatriated to the U.S., but under current law, would be subject to U.S. federal income taxes, less applicable foreign tax credits. In some countries repatriation of certain foreign balances is restricted by local laws. We have provided for the U.S. federal tax liability on these amounts for financial statement purposes, except for foreign earnings that are considered indefinitely reinvested outside of the U.S. Repatriation could result in additional U.S. federal income tax payments in future years. We utilize a variety of tax planning and financing strategies with the objective of having our worldwide cash available in the locations in which it is needed.
Cash Provided and (Used) in 2009the Years ended December 31, 2012 and 20082011. Cash and cash equivalents decreasedincreased to $201$162 million at December 31, 20092012 from $229$143 million at December 31, 2008.2011. The following table summarizes the proceeds and (uses) of cash (in thousands):cash:
|
|
|
|
|
|
|
| ||
(In thousands) |
| December 31, | ||
|
| 2012 |
| 2011 |
Cash provided by operating activities | $ | 132,516 | $ | 169,899 |
Cash used by investing activities |
| (77,827) |
| (236,833) |
Cash used by financing activities |
| (35,301) |
| (9,905) |
Net change in cash equivalents |
| 19,388 |
| (76,839) |
Cash and cash equivalents at beginning of year |
| 142,608 |
| 219,447 |
Cash and cash equivalents at end of period | $ | 161,996 | $ | 142,608 |
| December 31, | ||||||||
| 2009 | 2008 | |||||||
| Cash provided by operating activities | $ | 135,651 | $ | 121,818 | ||||
| Cash (used in)/provided by investing activities | (111,915 | ) | 18,756 | |||||
| Cash (used in) financing activities | (51,671 | ) | (106,013 | ) | ||||
| Net (decrease)/increase in cash equivalents | (27,935 | ) | 34,561 | |||||
| Cash and cash equivalents at beginning of year | 229,400 | 194,839 | ||||||
| Cash and cash equivalents at end of year | $ | 201,465 | $ | 229,400 | ||||
For the years ended December 31, 20092012 and 2008, respectively, a 11% increase. For 2009,2011, cash provided by operating activities was the result of $17$133 million ofand $170 million, respectively. Year over year, we saw a decrease in net income $77of $3.9 million as well as a decrease in net non-cash operating expenses which consisted of depreciation and amortization, stock-based compensation, benefits from deferred income taxes, and by $41 million in net cash provided by changes in operating assets and liabilities principally a $18 million decrease in accounts receivable, a $21 million decrease in inventories and a $13 million decrease in prepaid expenses and other assets, offset by a decrease of $10 million in accounts payable, taxes and other liabilities. In 2008, cash provided by operating activities was primarily the result of $84.8 million in net income and $51.3 million in net non-cash operating expenses which primarily consisted of depreciation and amortization, stock-based compensation, and benefits from deferred income taxes, offset in part by $14.3 million in net cash used by changes in operating assets and liabilities, principally a $24.6 million increase in inventory.
Accounts receivable decreasedincreased to $104$187 million at December 31, 2009 from $1222012 compared to $157 million at December 31, 2008, as a result of lower sales volumes during 2009. This decrease in revenue also caused our days2011. Days sales outstanding to increase to 61was 55 days at December 31, 2009,2012, compared to 5751 days at December 31, 2008.2011. We typically bill customers on an open account basis subject to our standard net thirty30 day payment terms. If, in the longer term, our revenue increases, it is likely that our accounts receivable balance will also increase. Our accounts receivable balance could also increase if customers delay their payments or if we grant extended payment terms to customers, both of which are more likely to occur during challenging economic times when our customers may face issues gaining access to sufficient funding or credit.
31
Consolidated inventory balances decreasedincreased to $87$170 million at December 31, 20092012 from $107$132 million at December 31, 2008.2011. Inventory turns decreased to 1.8 per year atwere 1.9 in each of the years ended December 31, 2009 compared to 2.1 per2012 and 2011. Inventory increased by $38 million during the year atended December 31, 2008. The decrease in inventory during 2009 was driven by a reduction2012, as we took actions to support the expected growth in our manufacturing activities in response to the decreased demand for our products.overall business. Our inventory levels will continue to be determined based upon our anticipated demand for products and our need to keep sufficient inventory on hand to meet our customers’ demands. We attempt to balance suchSuch considerations are balanced against the risk of obsolescence or potentially excess inventory levels. Rapid changes in industrialcustomer demand could have a significant impact on our inventory balances in future periods.
Investing activities used cash of $112$78 million during 2009, which wasthe year ended December 31, 2012, as the result of theour acquisitions of $25 million, net purchase of short-term investments of $74 million,cash received, as well as the purchase of property and equipment and other intangibles of $21$91 million, the capitalization of internally developed software of $13$12 million, and the acquisition of other intangibles of $5 million. For 2008, investing activities provided cash of $19 million which was primarily the result ofoffset by the net sale of $77$50 million of short-term investments, offset byinvestments. For the year ended December 31, 2011, Investing activities used cash of $237 million, which was the result of our acquisitions of AWR Corporation (AWR) and Phase Matrix Inc. (PMI) for $45 million, net of cash received, and $28 million, net of cash received, respectively, as well as the purchase of property and equipment and other intangibles of $26$60 million, athe capitalization of internally developed software of $12 million, and the net cash paymentpurchase of $17$91 million related to the acquisition of microLEX Systems ApS (see short-term investments. (See Note 15 -16 – Acquisitions of Notes to Consolidated Financial Statements), capitalization of internally developed software of $10 million andStatements for further discussion regarding the acquisition of other intangibles of $3 million.
Financing activities used $52cash of $35 million during 2009,the year ended December 31, 2012, which was the result of $35 million used to repurchase our common stock and $37$68 million used to pay dividends to our shareholders,stockholders offset by $22$31 million received as a result offrom the issuance of our common stock from the exercise of stock options and sales of our common stock throughunder our employee stock purchase plan.plan as well as a tax benefit of $2.2 million. For 2008,the year ended December 31, 2011, financing activities used $106$10 million, which was the result of $104 million used to repurchase our common stock and $35$48 million used to pay dividends to our shareholders,stockholders offset by $31$33 million received as a result offrom the issuance of our common stock from the exercise of stock options and under our employee stock purchase plan.
From time to time, our Board of Directors has authorized various programs to repurchase shares of our common stock depending on market conditions and other factors. Under such programs, we repurchased a total of 1,443,441, 4,110,042 and 2,730,1252,089,098 shares of our common stock at a weighted average pricesprice of $23.96, $25.22 and $29.20$20.04 per share in the yearsyear ended December 31, 2009, 2008 and 2007, respectively.
During 2009,the year ended December 31, 2012, we received reducedless proceeds from the exercise of stock options compared to 2008.the year ended December 31, 2011. The timing and number of stock option exercises and the amount of cash proceeds we receive through those exercises are not within our control and in the future, we may not generate as much cash from the exercise of stock options as we have in the past. Moreover, since 2005, it is nowhas been our practice to issue restricted stock units and not stock options to eligible employees which will reduce the number of stock options available for exercise in the future. Unlike the exercise of stock options, the issuance of shares upon vesting of restricted stock units does not result in any cash proceeds to us.
Contractual Cash Obligations. The following summarizes our contractual cash obligations as of December 31, 2009 (in thousands):2012:
|
|
|
|
|
|
|
|
|
|
|
|
|
|
|
|
|
|
|
|
|
|
|
| ||||||
|
| Payments due by period | ||||||||||||
(In thousands) |
| Total |
| 2013 |
| 2014 |
| 2015 |
| 2016 |
| 2017 |
| Beyond |
Long-term debt | $ | - | $ | - | $ | - | $ | - | $ | - | $ | - | $ | - |
Capital lease obligation |
| - |
| - |
| - |
| - |
| - |
| - |
| - |
Operating leases |
| 63,330 |
| 17,096 |
| 14,042 |
| 12,132 |
| 8,030 |
| 5,011 |
| 7,019 |
Total contractual obligations | $ | 63,330 | $ | 17,096 | $ | 14,042 | $ | 12,132 | $ | 8,030 | $ | 5,011 | $ | 7,019 |
| Payments Due by Period | ||||||||||||||||||||||||||||
| Total | 2010 | 2011 | 2012 | 2013 | 2014 | Beyond | ||||||||||||||||||||||
| Long-term debt | $ | — | $ | — | $ | — | $ | — | $ | — | $ | — | $ | — | ||||||||||||||
| Capital lease obligations | — | — | — | — | — | ��� | — | |||||||||||||||||||||
| Operating leases | 51,701 | 14,415 | 9,898 | 6,982 | 4,611 | 3,665 | 12,130 | |||||||||||||||||||||
| Total contractual cash obligations | $ | 51,701 | $ | 14,415 | $ | 9,898 | $ | 6,982 | $ | 4,611 | $ | 3,665 | $ | 12,130 | ||||||||||||||
The following summarizes our other commercial commitments as of December 31, 2009 (in thousands):2012:
|
|
|
|
|
|
|
|
|
|
|
|
|
|
|
|
|
|
|
|
|
|
|
|
|
|
|
|
|
|
(In thousands) |
| Total |
| 2013 |
| 2014 |
| 2015 |
| 2016 |
| 2017 |
| Beyond |
Guarantees | $ | 4,978 | $ | 4,978 | $ | - | $ | - | $ | - | $ | - | $ | - |
Purchase obligations |
| 7,268 |
| 7,268 |
| - |
| - |
| - |
| - |
| - |
Total commercial commitments | $ | 12,246 | $ | 12,246 | $ | - | $ | - | $ | - | $ | - | $ | - |
32
| Total | 2010 | 2011 | 2012 | 2013 | 2014 | Beyond | ||||||||||||||||||||||
| Guarantees | $ | 5,200 | $ | 5,200 | $ | — | $ | — | $ | — | $ | — | $ | — | ||||||||||||||
| Purchase obligations | 6,500 | 6,500 | — | — | — | — | — | |||||||||||||||||||||
| Total commercial commitments | $ | 11,700 | $ | 11,700 | $ | — | $ | — | $ | — | $ | — | $ | — | ||||||||||||||
We have commitments under non-cancelable operating leases primarily for office facilities throughout the world. Certain leases require us to pay property taxes, insurance and routine maintenance, and include escalation clauses. As of December 31, 2009,2012, we havehad non-cancelable operating lease obligations of approximately $52$63 million compared to $50$54 million at December 31, 2008.2011. Rent expense under operating leases was $12$17 million, $12$16 million and $10$14 million for the years ended December 31, 2009, 20082012, 2011 and 2007,2010, respectively.
Purchase obligations primarily represent purchase commitments for customized inventory and inventory components. As of December 31, 2009,2012, we had non-cancelable purchase commitments with various suppliers of customized inventory and inventory components totaling approximately $6.5$7 million over the next twelve months. At December 31, 2008,2011, we had non-cancelable purchase commitments with various suppliers of customized inventory and inventory components totaling approximately $8.4$14 million.
At December 31, 2009,2012, we havehad outstanding guarantees for payment of customs and foreign grants totaling approximately $5.2$5.0 million. As ofAt December 31, 2008,2011, we havehad outstanding guarantees for payment of customs, and foreign grants and potential customer disputes totaling approximately $2.4$4.8 million.
Off-Balance Sheet Arrangements. We do not have any debt or off-balance sheet debt. As of December 31, 2009,2012, we did not have any relationships with any unconsolidated entities or financial partnerships, such as entities often referred to as structured finance entities, which would have been established for the purpose of facilitating off-balance sheet arrangements. As such, we are not exposed to any financing, liquidity, market or credit risk that could arise if we were engaged in such relationships.
Prospective Capital Needs. We believe that our existing cash, cash equivalents and marketable securities,short-term investments, together with cash generated from operations andas well as from the exercise of employee stock options and the purchase of common stock through our employee stock purchase plan, will be sufficient to cover our working capital needs, capital expenditures, investment requirements, commitments, payment of dividends to our shareholdersstockholders and repurchases of our common stock for at least the next 12 months. However,Over the next few months, we will likely seek external financing, most likely in the form of a line of credit so that we will have sufficient domestic cash to fund continued dividends to our stockholders and to fund potential acquisitions. We may also choose or be required to raise additional funds by selling equity or debt securities to the public or to selected investors, or by borrowing money from financial institutions. Historically, we have not had to rely on debt, public or private, to fund our operating, financing or investing activities. We could also choose or be required to reduce certain expenditures, such as payments of dividends or repurchases of our common stock. In addition, even though we may not need additional funds, we may still elect to sell additional equity or debt securities or obtain credit facilities for other reasons.investors. If we elect to raise additional funds, we may not be able to obtain such funds on a timely basis on acceptable terms, if at all. If we raise additional funds by issuing additional equity or convertible debt securities, the ownership percentages of our existing shareholdersstockholders would be reduced. In addition, the equity or debt securities that we issue may have rights, preferences or privileges senior to those of our common stock and a line of credit would likely have covenants or impose other restrictions on our business. We may also choose to repatriate foreign earnings which would be subject to the U.S. federal statutory tax rate of 35% and therefore, would likely have a material adverse effect on our effective tax rate and on our net income and earnings per share. We could also choose to reduce certain expenditures or payments of dividends or suspend our program to repurchase shares of our common stock. Historically, we have not had to rely on debt, public or private, to fund our operating, financing or investing activities.
Although we believe that we have sufficient capital to fund our activities for at least the next 12 months, our future capital requirements may vary materially from those now planned. We anticipate that the amount of capital we will need in the future will depend on many factors, including:
· | general economic and political |
· | difficulties and the high tax costs associated with the repatriation of earnings; |
· | payment of dividends to our stockholders; |
· | the inability of certain of our customers who depend on credit to have access to their traditional sources of credit to finance the purchase of products from us, |
· | acquisitions of other businesses, assets, products or technologies; |
· | required levels of research and development and other operating costs; |
· | capital improvements for new and existing facilities; |
· | the overall levels of sales of our products and gross profit margins; |
· | our business, product, capital expenditure and research and development plans, and product and technology roadmaps; |
· |
the levels of inventory and accounts receivable that we maintain; |
· | repurchases of |
· |
our relationships with suppliers and customers; and, |
· | the level of exercises of stock options and stock purchases under our employee stock purchase plan. |
33
Recently Issued Accounting Pronouncements
Note 1 – Operations and Summary of Significant Accounting Policies for estimating fair value when the volume and level of activity for the asset or liability have significantly decreased. This update also includes guidance on identifying circumstances that indicate a transaction is not orderly. We adopted the update on April 1, 2009 as required and concluded it did not have a material impact on our consolidated financial position or results of operations.
Critical Accounting Policies
The preparation of our financial statements in conformity with generally accepted accounting principles requires us to make estimates and assumptions that affect the reported amounts of assets, liabilities, revenues, expenses and related disclosures of contingent assets and liabilities. We base our estimates on past experience and other assumptions that we believe are reasonable under the circumstances, and we evaluate these estimates on an ongoing basis. Our critical accounting policies are those that affect our financial statements materially and involve difficult, subjective or complex judgments by management. Although these estimates are based on management's best knowledge of current events and actions that may impact the company in the future, actual results may be materially different from the estimates.
Our critical accounting policies are as follows:
· | Revenue recognition |
We derive revenue primarily from the sale/licensing of integratedsell test and measurement solutions that include hardware, and software solutions. Independent sales of application software licenses, include post contract supportand related services. In addition, training services are sold separately. The products and servicesOur sales are generally soldmade under standardized licensing andstandard sales arrangements with payment terms ranging from net 30 days in the U.S. to net 30 days and up to net 90120 days in some international markets. Approximately 83% of our product/license sales include both hardware and software in the customer arrangement, with a small percentage of sales including other services. We offer rights of return and standard warranties for product defects related to our products. The rights of return are generally for a period of up to 30 days after the delivery date. TheOur standard warranties cover periods ranging from 90 days to three years. We do not generally enter into contracts requiring product acceptance from the customer.
In recent years, we have made a concentrated effort to increase our revenue through the pursuit of orders with a value greater than $1.0 million. These orders often include contract terms that vary substantially from our standard terms of sale including product acceptance requirements and product performance evaluations which create uncertainty with respect to the provisionstiming of FASB ASC 985,our ability to recognize revenue from such orders. These orders may also include most favored customer pricing, significant discounts, extended payment terms and volume rebates which also creates uncertainty with respect to the timing of our ability to recognize revenue from such orders.
Sales of application software licenses include post-contract support services. Other services include customer training, customer support, and extended warranties.
We recognize revenue when persuasive evidence of an arrangement exists, delivery has occurred, the feeprice is fixed or determinable and collectability is probable. reasonably assured. Delivery is considered to have occurred when title and risk of loss have transferred to the customer. For most of our hardware and software sales, title and risk of loss transfer upon delivery. For services, we recognize revenue when the service is provided, except for extended warranties for which revenue is recognized ratably over the warranty period.
We enter into certain arrangements wherein which we are obligated to deliver multiple products and/or services (“multiple elements”). In these transactions,These arrangements may include hardware, software, and services. On January 1, 2011, we allocateprospectively adopted accounting rules that changed the totalcriteria for separating consideration in multiple-deliverable arrangements. These rules changed the application of the residual method of allocation and require that arrangement consideration be allocated at the inception of an arrangement to all deliverables using the relative selling price method. Revenue allocated to each element is then recognized when the basic revenue amongrecognition criteria for that element have been met. The relative selling price method allocates any discount in the elementsarrangement proportionally to each deliverable on the basis of each deliverable’s selling price. The selling price used for each deliverable will be based on vendor specificvendor-specific objective evidence (“VSOE”) if available, third–party evidence if VSOE is not available, or estimated selling price if neither VSOE nor third-party evidence is available. The adoption of fair valuethe amended revenue recognition rules did not change the units of accounting for our revenue transactions. It also did not significantly change how we allocated the arrangement consideration to the various units of accounting or the timing of revenue. The impact of our adoption was not material to our consolidated financial statements for the years ended December 31, 2012 and 2011.
34
Software revenue recognition rules are applied to software sold on a stand-alone basis, and to software sold as determined bypart of a multiple element arrangement with hardware where the sales price of each elementsoftware is not required to deliver the tangible product's essential functionality. Under these rules, when sold separately.
The application of FASB ASC 985,revenue recognition standards requires judgment, including whether a software arrangement includes multiple elements, and if so, whether VSOE of fair value exists for those elements. Changes to the elements in a software arrangement, the ability to identify VSOE for those elements, the fair value of the respective elements, and changes to a product’s estimated life cycle could materially impact the amount of our earned and unearned revenue. Judgment is also required to assess whether future releases of certain software represent new products or upgrades and enhancements to existing products.
· | Estimating allowances for sales returns |
The preparation of financial statements requires that we make estimates and assumptions of potential future product returns related to current period product revenue. We analyze historical returns, current economic trends, and changes in customer demand and acceptance of our products when evaluating the adequacy of our sales returns allowance. Significant judgments and estimates must be made and used in connection with establishing the sales returns allowance in any accounting period. A provision for estimated sales returns is made by reducing recorded revenue by the amount of the allowance. Accounts receivable is reported net of the allowance for sales returns. TheOur allowance for sales returns was $1.9$2.1 million and $1.8$1.6 million at December 31, 20092012 and 2008,2011, respectively. Material differences may result in the amount and timing of our revenue for any period if we made different judgments or utilized different estimates or if our actual results varied materially from our estimates.
· | Estimating allowances, specifically the allowance for doubtful accounts and the adjustment for excess and obsolete inventories |
In addition to estimating an allowance for sales returns, we must also make estimates about the uncollectability of our accounts receivables. We specifically analyze accounts receivable and analyze historical bad debts, customer concentrations, customer credit-worthiness and current economic trends when evaluating the adequacy of our allowance for doubtful accounts. Our allowance for doubtful accounts was $2.7 $2.8 million and $3.9$2.6 million at December 31, 20092012 and 2008,2011, respectively. We also write down our inventory for estimated obsolescence or unmarketable inventory equal to the difference between the cost of inventory and estimated market value based on assumptions of future demand and market conditions. Our allowance for excess and obsolete inventories was $4.4$3.8 million and $4.4$4.2 million at December 31, 20092012 and 2008,2011, respectively. Significant judgments and estimates must be made and used in connection with establishing these allowances. Material differences may result in the amount and timing of our bad debt and inventory obsolescence if we made different judgments or utilized different estimates or if actual results varied materially from our estimates.
· | Accounting for costs of computer software |
We capitalize costs related to the development and acquisition of certain software products. Capitalization of costs begins when technological feasibility has been established and ends when the product is available for general release to customers. Technological feasibility for our products is established when the product is available for beta release. Judgment is required in determining when technological feasibility of a product is established. Amortization is computed on an individual product basis for those products available for market and has been recognized based on the product’s estimated economic life, generally three years. At each balance sheet date, the unamortized costs are reviewed by management and reduced to net realized value when necessary. As of December 31, 2009,2012 and 2011 unamortized capitalized software development costs were $18 million.$22 million and $23 million, respectively.
35
· | Valuation of long-lived and intangible assets |
We assess the impairment of identifiable intangibles, long-lived assets and related goodwill whenever events or changes in circumstances indicate that the carrying value may not be recoverable. In accordance with FASB ASC 350, Intangibles – Goodwill and Other (FASB ASC 350), goodwill is tested for impairment on an annual basis, and between annual tests if indicators of potential impairment exist, using a fair-value-based approach based on the market capitalization of the reporting unit. Our annual impairment test was performed as of February 28, 2009.29, 2012. No impairment of goodwill has beenand long-lived and intangible assets was identified during the period presented.2012 and 2011. Goodwill is deductible for tax purposes in certain jurisdictions. We have defined our operating segment based on geographic regions. We sell our products in threefour geographic regions. Our sales to these regions share similar economic characteristics, similar product mix, similar customers, and similar distribution methods. Accordingly, we have elected to aggregate these threefour geographic regions into a single operating segment. As we have one reporting segment, we allocate goodwill to one reporting unit for goodwill impairment testing. Factors considered important which could trigger an impairment review include the following:
· | significant underperformance relative to expected historical or projected future operating results; |
· | significant changes in the manner of our use of the acquired assets or the strategy for our overall business; |
· | significant negative industry or economic trends; and, |
· | our market capitalization relative to net book value. |
When it is determined that the carrying value of intangibles, long-lived assets and related goodwill may not be recoverable based upon the existence of one or more of the above indicators of impairment, the measurement of any impairment is determined and the carrying value is reduced as appropriate. As of December 31, 2009,2012 and 2011, we had net goodwill of approximately $65 million.
· | Accounting for income taxes |
We account for income taxes under the asset and liability method that requires the recognition of deferredmethod. Deferred tax assets and liabilities are recognized for the expected future tax consequences of events that have been recognized in our financial statements ortemporary differences between the tax returns.basis of assets and liabilities and their reported amounts. Valuation allowances are established when necessary to reduce deferred tax assets to amounts which are more likely than not to be realized. Judgment is required in assessing the future tax consequences of events that have been recognized in our financial statements or tax returns. Variations in the actual outcome of these future tax consequences could materially impact our financial position or our results of operations. In estimating future tax consequences, all expected future events are considered other than enactments of changes in tax laws or rates. Valuation allowances are established when necessary to reduce deferredWe account for uncertainty in income taxes recognized in our financial statements using prescribed recognition thresholds and measurement attributes for financial statement disclosure of tax assets to amounts which are more likely than notpositions taken or expected to be realized.
The tax position of our Hungarian operation continuedoperations continues to benefit from assets created by the restructuring of our operations in Hungary. Realization of these assets was based on estimated future earningsHungary in Hungary.2003. In addition, our research and development activities in Hungary continue to benefit from a tax law in Hungary that provides for an enhanced deduction for qualified research and development expenses. Partial release of the valuation allowance on these assets from the restructuring and the enhanced tax deduction for research expenses resulted in income tax benefits of $18.3$17 million and $19 million for the yearyears ended December 31, 2007,2012 and $8.72011, respectively.
Our earnings in Hungary are subject to a statutory tax rate of 19%. The difference between this rate and the statutory U.S. rate of 35% resulted in income tax benefits of $12 million and $16 million for the yearyears ended December 31, 2008.
For additional discussion about our income taxes including components of income before income taxes, our provision for income taxes charged to operations, components of our deferred tax assets and liabilities, a reconciliation of income taxes at the U.S. federal statutory rate of 35% to our effective tax rate and other tax matters, see Note 9 – Income taxes of Notes to Consolidated Financial Statements.
36
Loss contingencies
We accrue for probable losses from contingencies including legal defense costs, on an undiscounted basis, in accordance with FASB ASC 450, Contingencies (FASB ASC 450), when such costs are considered probable of being incurred and are reasonably estimable. We periodically evaluate available information, both internal and external, relative to such contingencies and adjust this accrual as necessary. Disclosure of a contingency is required if there is at least a reasonable possibility that a loss has been incurred. In determining whether a loss should be accrued we evaluate, among other factors, the degree of probability of an unfavorable outcome and theour ability to make a reasonable estimate of the amount of loss. Changes in these factors could materially impact our financial position or our results of operation.
37
Financial Risk Management
Our international sales are subject to inherent risks, including fluctuations in local economies; fluctuations in foreign currencies relative to the U.S. dollar; difficulties in staffing and managing foreign operations; greater difficulty in accounts receivable collection; costs and risks of localizing products for foreign countries; unexpected changes in regulatory requirements, tariffs and other trade barriers; difficulties and costs in the repatriation of earnings and burdens of complying with a wide variety of foreign laws.
The vast majority of our sales outside of North America are denominated in local currencies, and accordingly, the U.S. dollar equivalent of these sales is affected by changes in the foreign currency exchange rates. Net of hedging results, theThe change in exchange rates had the effect of decreasing our consolidated sales by $29$20 million or 4% for2% in 2012, and increasing our consolidated sales by $27 million or 3% in 2011. Since most of our international operating expenses are also incurred in local currencies, the year ended December 31, 2009, comparedchange in exchange rates had the effect of decreasing our consolidated operating expenses by $5.8 million or 1% in 2012, and increasing our consolidated operating expenses by $19 million or 3% in 2011.
During the 2012, there was an overall appreciation of the U.S. dollar against the major currencies we do business in and a high level of volatility in the broader foreign exchange markets. During the first half of 2011, the U.S. dollar generally declined against most of the major currencies in the markets in which we do business. We cannot predict to 2008. what degree or how long this volatility in the foreign currency exchange markets will continue. In the past, we have noted that significant volatility in foreign currency exchange rates in the markets in which we do business has had a significant impact on the revaluation of our foreign currency denominated firm commitments, on our ability to forecast our U.S. dollar equivalent revenues and expenses and on the effectiveness of our hedging programs. In the past, these dynamics have also adversely affected our revenue growth in international markets and may pose similar challenges in the future. We recognize the local currency as the functional currency in virtually all of our international subsidiaries.
If the local currencies in which we sell our products strengthen against the U.S. dollar, we may need to lower our prices in the local currency to remain competitive in our international markets which could have a material adverse effect on our gross and net profit margins. If the local currencies in which we sell our products weaken against the U.S. dollar and if the local sales prices cannot be raised due to competitive pressures, we will experience a deterioration of our gross and net profit margins. Since mostTo help protect against the change in the value caused by a fluctuation in foreign currency exchange rates of forecasted foreign currency cash flows resulting from international sales and expenses over the next one to two years, we have a foreign currency cash flow hedging program. We hedge portions of our internationalforecasted revenue, cost of sales and operating expenses are also incurreddenominated in localforeign currencies with foreign currency forward contracts. For forward contracts, when the dollar strengthens significantly against the foreign currencies, the change in exchange ratesthe present value of future foreign currency cash flows may be offset by the change in the fair value of the forward contracts designated as hedges. For purchased option contracts, when the dollar strengthens significantly against the foreign currencies, the change in the present value of future foreign currency cash flows may be offset by the change in the fair value of the option contracts designated as hedges, net of the premium paid. Our foreign currency purchased option contracts are purchased “at-the-money” or “out-of-the-money.” We purchase foreign currency forward and option contracts for up to 100% of our forecasted exposures in selected currencies (primarily in Euro, Japanese yen, Korean won and Hungarian forint) and limit the duration of these contracts to 40 months or less. As a result, our hedging activities only partially address our risks from foreign currency transactions, and there can be no assurance that this strategy will be successful. We do not invest in contracts for speculative purposes.
During 2012, our hedges had the effect of increasing our consolidated sales by $2.9 million, decreasing our cost of sales by $402,000, and decreasing our operating expenses by $259,000. During 2011, these hedges had the effect of decreasing our consolidated sales by $3.9 million, decreasing our cost of sales by $1.4 million, and decreasing our operating expenses by $12 million or 2% for the year ended December 31, 2009, compared to 2008. Currently, we are experiencing significant volatility in foreign currency exchange rates in many of the markets in which we do business. This has had a significant impact on the revaluation of our foreign currency denominated firm commitments and on our ability to forecast our U.S. dollar equivalent revenues and expenses. In the past, these dynamics have also adversely affected our revenue growth in international markets and will likely pose similar challenges in the future. Our foreign currency hedging program includes both foreign currency forward and purchased option contracts to reduce the effect of exchange rate fluctuations. However, our hedging program will not eliminate all of our foreign exchange risks, particularly when market conditions experience the recent level of volatility.$556,000. (See “Net Foreign Exchange Gain (Loss)” and Note 4 – - Derivative instruments and hedging activities of Notes to Consolidated Financial Statements)Statements for further discussion regarding our cash flow hedging program and its related impacted on our consolidated sales, cost of sales and operating expenses for the years ended December 31, 2012 and 2011).
38
Inventory Management
The marketplace for our products dictates that many of our products be shipped very quickly after an order is received. As a result, we are required to maintain significant inventories. Therefore, inventory obsolescence is a risk for us due to frequent engineering changes, shifting customer demand, the emergence of new industry standards and rapid technological advances including the introduction by us or our competitors of products embodying new technology. However our risk of obsolescence is mitigated as many of our products have interchangeable parts and many have long lives. While we adjust for excess and obsolete inventories and we monitor the valuation of our inventories, there can be no assurance that our valuation adjustments will be sufficient.
In recent years, we have made a concentrated effort to increase our revenue through the pursuit of orders with a value greater than $1.0 million. Fulfillment of these contracts can severely challenge our supply chain capabilities at the component acquisition, assembly and delivery stages. These contracts can also require us to develop specific product mitigation plans for product delivery constraints caused by unexpected or catastrophic situations to help assure quick production recovery and to comply with critical delivery commitments where severe contractual liabilities can be imposed on us if we fail to provide the quantity of products at the required delivery times. In order to mitigate the risks associated with these contractual requirements, we may choose to build inventory levels for certain parts or systems. Because our contracts with such customers may allow the customer to cancel or delay orders without liability, such actions expose our business to increased risk of inventory obsolescence.
Market Risk
We are exposed to a variety of risks, including foreign currency fluctuations and changes in the market value of our investments. In the normal course of business, we employ established policies and procedures to manage our exposure to fluctuations in foreign currency values and changes in the market value of our investments.
Cash, Cash Equivalents and Short-Term Investments
At December 31, 2009,2012, we had $289$335 million in cash, cash equivalents and short-term investments. We maintain cash and cash equivalents with various financial institutions located in many countries throughout the world. Approximately $114$28 million or 39%8% of these amounts were held in domestic accounts with various financial institutions and $175$307 million or 61%92% was held in accounts outside of the U.S. with various financial institutions. At December 31, 2009, $852012, $141 million or 42%87% of our cash and cash equivalents was held in cash in various operating accounts throughout the world, and $116$21 million or 58%13% was held in money market accounts. The most significant of our operating accounts was our domesticHong Kong operating account which held approximately $22$26 million or 11%16% of our total cash and cash equivalents at a bank that carried a A1 ratingA+/A2/AA- ratings at December 31, 2009.2012. Our short-term investment balance is comprised of $35$1.5 million or 1% held in our investment accounts in the U.S. and $52$172 million or 99% held in investment accounts of our foreign subsidiaries.
We value our available-for-sale included auction rate securities backed by education loan revenue bonds. Oneshort term investments based on pricing from third party pricing vendors, who may use quoted prices in active markets for identical assets (Level 1 inputs) or inputs other than quoted prices that are observable either directly or indirectly (Level 2 inputs) in determining fair value. We classify all of our auction ratefixed income available-for-sale securities is fromas having Level 2 inputs. The valuation techniques used to measure the Vermont Student Assistance Corporation and has a parfair value of $2.2 million. The other of our auction rate securities isfinancial instruments having Level 2 inputs were derived from the New Hampshire Health and Education Facilities Authority and has a par value of $6.4 million. At December 31, 2009, we reported these auction rate securities at their estimated fairnon-binding market value of $8.2 million as a component of short-term debt securities available for sale. Weconsensus prices that are also a party to a UBS Auction Rate Securities Rights (the “Rights”) agreement. The Rights agreement is a nontransferable right to sell our auction rate securities, at par value, back to UBS at any time during the period June 30, 2010, through July 2, 2012. At December 31, 2009, we reported the Rights agreement at its estimated faircorroborated by observable market value of $423,000 as a component of short-term debt securities available for sale. See Note 3 – Fair value measurements in Notes to Consolidated Financial Statements for further discussion of our auction rate securities and our Rights agreement.
39
The goal of our investment policy is to manage our investment portfolio to preserve principal and liquidity while maximizing the return on our investment portfolio through the full investment of available funds. We place our cash investments in instruments that meet credit quality standards, as specified in our corporate investment policy guidelines. These guidelines also limit the amount of credit exposure to any one issue, issuer or type of instrument. Other than our auction rate securities discussed above, at December 31, 2009, ourOur cash equivalents and short-term investments carried ratings from the major credit rating agencies that were in accordance with our corporate investment policy. Our investment policy allows investments in the following;following: government and federal agency obligations, repurchase agreements (“Repos”), certificates of deposit and time deposits, corporate obligations, medium term notes and deposit notes, commercial paper including asset-backed commercial paper (“ABCP”), puttable bonds, general obligation and revenue bonds, money market funds, taxable commercial paper, corporate notes/bonds, municipal notes, municipal obligations, variable rate demand notes and tax exempt commercial paper. All such instruments must carry minimum ratings of A1/P1/F1, MIG1/VMIG1/SP1 and A2/A/A, as applicable, all of which are considered “investment grade”. Our investment policy for marketable securities requires that all securities mature in three years or less, with a weighted average maturity of no longer than 18 months with at least 10% maturing in 90 days or less.
We account for our investments in debt and equity instruments under FASB ASC 320.320 Investments – Debt and Equity Securities (FASB ASC 320). Our investments are classified as available-for-sale and accordingly are reported at fair value, with unrealized gains and losses reported as other comprehensive income, a component of shareholders’ equity. Unrealized losses are charged against income when a decline in fair value is determined to be other than temporary. Investments with maturities beyond one year are classified as short-term based on their highly liquid nature and because such marketable securities represent the investment of cash that is available for current operations. The fair value of our short-term investments in debt securities at December 31, 20092012 and December 31, 20082011 was $87$173 million and $6$224 million, respectively. The increasedecrease was due to the net purchasesale of $74$50 million of short-term investments and the transferwhich was used to fund payment of $8.6 relateddividends to our auction rate securitiesstockholders and our rights agreement from long-term investments to short-term investmentsacquisitions during the year ended December 31, 2009. The net purchasefourth quarter of $74 million of short term investments was done to diversify our holdings from money market accounts to debt securities and to take advantage of higher yields associated with longer maturity debt securities. 2012.
We follow the guidance provided by FASB ASC 320 to assess whether our investments with unrealized loss positions are other than temporarily impaired. Realized gains and losses and declines in value judged to be other than temporary are determined based on the specific identification method and are reported in other income (expense), net, in our Consolidated Statements of Income.
Interest Rate Risk
Investments in both fixed rate and floating rate instruments carry a degree of interest rate risk. Fixed rate securities may have their market value adversely impacted due to an increase in interest rates, while floating rate securities may produce less income than expected if interest rates fall. Due in part to these factors, our future investment income may fall short of expectations due to changes in interest rates or if the decline in the fair value of our publicly traded debt investments is judged to be other-than-temporary. We may suffer losses in principal if we are forced to sell securities that have declined in market value due to changes in interest rates. However, because any debt securities we hold are classified as available-for-sale, no gains or losses are realized in theour income statement due to changes in interest rates unless such securities are sold prior to maturity or unless declines in value are determined to be other-than-temporary. These securities are reported at fair value with the related unrealized gains and losses included in accumulated other comprehensive income (loss), a component of shareholders’stockholders’ equity, net of tax.
In a declining interest rate environment, as short-term investments mature, reinvestment occurs at less favorable market rates. Given the short-term nature of certain investments, the current interest rate environment of low or declining rates will likelyhas negatively impactimpacted our investment income.
In order to assess the interest rate risk associated with our investment portfolio, we performed a sensitivity analysis to determine the impact a change in interest rates would have on the value of theour investment portfolio assuming a 100 basis point parallel shift in the yield curve. Based on our investment positions as of December 31, 2009,2012, a 100 basis point increase or decrease in interest rates across all maturities would result in a $614,000$844,000 increase or decrease in the fair market value of theour portfolio. As of December 31, 2008,2011, a similar 100 basis point shift in the yield curve would have resulted in a $50,000$1.9 million increase or decrease in the fair market value of theour portfolio. Such losses would only be realized if we sold the investments prior to maturity or if there is a other than temporary impairment.
40
We continue to monitor the financial markets. In response to these conditions, we shifted a larger percentagestability of our portfolio to money market funds, U.S. Treasuries and time deposits toward the end of 2008. This had a negative impact on our investment income in 2009. As we noted some stabilization in the financial markets, throughout 2009,particularly those in the European region and have taken steps to limit our direct and indirect exposure to these markets; however, we made net purchasescan give no assurance that we will not be negatively impacted by any adverse outcomes in those markets. We also continue to weigh the benefit of $74 million of short-term investments, primarily to diversify our holdings from money market accounts to debt securities and to take advantage ofthe higher yields associated with longer maturity debt securities. However, yields, even atmaturities against the interest rate risk and credit rating risk, also associated with these longer maturities remained at or near historic lows throughout 2009.when making these decisions. We cannot predict when or if interest rates and investment yields will rise. If yields continue to stay at these low levels, our investment income will continue to be negatively impacted.
Exchange Rate Risk
Our objective in managing our exposure to foreign currency exchange rate fluctuations is to reduce the impact of adverse fluctuations in such exchange rates on our earnings and cash flow. Accordingly, we utilize purchased foreign currency option and forward contracts to hedge our exposure on anticipated transactions and firm commitments. The principal currencies hedged are the Euro, British pound, Japanese yen, Korean won and Hungarian forint. We monitor our foreign exchange exposures regularly to help ensure the overall effectiveness of our foreign currency hedge positions. There can be no assurance that our foreign currency hedging activities will substantially offset the impact of fluctuations in currency exchanges rates on our results of operations and financial position. Based on the foreign exchange instruments outstanding at December 31, 20092012 and December 31, 2008,2011, an adverse change (defined as 20% in the Asian currencies and 10% in all other currencies) in exchange rates would result in a decline in the aggregate settlement value of all of our instruments outstanding of approximately $22 million and $31$23 million, respectively. However, as we utilize foreign currency instruments for hedging anticipated and firmly committed transactions, we believe that a loss in settlement value for those instruments will be substantially offset by increases in the value of the underlying exposure. (See Note 4 - Derivative instruments and hedging activities of Notes to Consolidated Financial Statements for a further description of our derivative instruments and hedging activities).
The information required by this item is incorporated by reference to the Consolidated Financial Statements set forth on pages F-151 through F-3180 hereof.
There were no disagreements with accountants on accounting and financial disclosure for the year ended December 31, 2009.
Evaluation of Disclosure Controls and Procedures
As of the end of the period covered by this Annual Report on Form 10-K, our Chief Executive Officer, Dr. James Truchard, and our Executive Vice President, Chief Operating Officer and Chief Financial Officer, Alex Davern, based on their evaluation of our disclosure controls and procedures (as defined in Rules 13a-15(e) and 15d-15(e) of the Securities Exchange Act of 1934, as amended), required by paragraph (b) of Rule 13a – 15 or Rule 15d – 15, have concluded that our disclosure controls and procedures were effective at the reasonable assurance level, to ensure the timely collection, evaluation and disclosure of information relating to us that would potentially be subject to disclosure under the Securities Exchange Act of 1934, as amended, and the rules and regulations promulgated there under,thereunder, and that such information is recorded, processed, summarized and reported within the time periods specified in the SEC’s rules and forms. These disclosure controls and procedures include, without limitation, controls and procedures designed to ensure that information required to be disclosed by us in the reports we file or submit is accumulated and communicated to management, including our Chief Executive Officer and Chief Financial Officer, as appropriate to allow timely decisions regarding required disclosure. Our disclosure controls and procedures include components of our internal control over financial reporting. Our assessment of the effectiveness of our internal controlscontrol over financial reporting is expressed at the level of reasonable assurance because a control system, no matter how well designed and operated, can provide only reasonable, but not absolute assurance that the control system’s objectives will be met. We continue to enhance our internal control over financial reporting in key functional areas with the goal
41
Management Report on Internal Control over Financial Reporting
Our management is responsible for establishing and maintaining adequate internal control over financial reporting to provide reasonable assurance regarding the reliability of our financial reporting and the preparation of financial statements for external purposes in accordance with generally accepted accounting principles. Internal control over financial reporting includes those policies and procedures that (i) pertain to the maintenance of records that in reasonable detail accurately and fairly reflect the transactions and dispositions of the assets of the company, (ii) provide reasonable assurance that transactions are recorded as necessary to permit preparation of financial statements in accordance with generally accepted accounting principles, and that our receipts and expenditures of the Company are being made only in accordance with authorizations of our management and directors of the Company;directors; and (iii) provide reasonable assurance regarding prevention or timely detection of unauthorized acquisition, use or disposition of the Company’sour assets that could have a material effect on theour financial statements.
Management assessed the effectiveness of our internal control over financial reporting as of December 31, 2009,2012, which was the end of our fiscal year. Management based its assessment on criteria established in Internal Control – Integrated Framework issued by the Committee of Sponsoring Organizations of the Treadway Commission. Management’s assessment included evaluation of such elements as the design and operating effectiveness of key financial reporting controls, process documentation, accounting policies, and our overall control environment. This assessment is supported by testing and monitoring performed by our finance organization.
Based on ourthis assessment, management has concluded that our internal control over financial reporting was effective as of the end of the fiscal year to provide reasonable assurance regarding the reliability of financial reporting and the preparation of financial statements for external reporting purposes in accordance with generally accepted accounting principles. We reviewed the results of management’s assessment with the Audit Committee of our Board of Directors.
Our independent registered public accounting firm, Ernst & Young LLP, audited our consolidated financial statements, and independently assessed the effectiveness of our internal control over financial reporting. Ernst & Young LLP has issued their report, which is included in Part II, Item 8 of this Form 10-K.
Changes in Internal Control over Financial Reporting
During the three months ended December 31, 2009,2012, there was no change in our internal control over financial reporting identified in connection with the evaluation required by paragraph (d) of Rule 13a-15 or Rule 15d-15 that has materially affected, or is reasonably likely to materially affect, our internal control over financial reporting.
From time to time, our directors, executive officers and other insiders may adopt stock trading plans pursuant to Rule 10b5-1(c) promulgated by the Securities and Exchange Commission under the Securities Exchange Act of 1934, as amended. Jeffrey L. Kodosky and James J. Truchard have made periodic sales of our stock pursuant to such plans. The foregoing is provided for informational purposes and not in response to any particular requirement of Form 10-K.
42
PART III
Certain information required by Part III is omitted from this Report in that we intend to file a definitive proxy statement pursuant to Regulation 14A with the Securities and Exchange Commission (the “Proxy Statement”) relating to our annual meeting of stockholders not later than 120 days after the end of the fiscal year covered by this Report, and such information is incorporated by reference herein.
The information concerning our directors required by this Item pursuant to Item 401 of Regulation S-K will appear in our Proxy Statement under the section “Election of Directors” and such information is incorporated herein by reference.
The information concerning our executive officers required by this Item pursuant to Item 401 of Regulation S-K will appear in our Proxy Statement under the section “Executive Officers” and such information is incorporated herein by reference.
The information required by this Item pursuant to Item 405 of Regulation S-K regarding compliance with Section 16(a) of the Securities Exchange Act of 1934, as amended, will appear in our Proxy Statement under the section “Section 16(a) Beneficial Ownership Reporting Compliance” and such information is incorporated herein by reference.
The information concerning our code of ethics that applies to our principal executive officer, our principal financial officer, our controller or person performing similar functions required by this Item pursuant to Item 406 of Regulation S-K will appear in our Proxy Statement under the section “Code of Ethics” and such information is incorporated herein by reference.
The information required by this Item pursuant to Item 407(c)(3) of Regulation S-K regarding material changes, if any, to procedures by which security holders may recommend nominees to our board of directors will appear in our Proxy Statement under the section “Deadline for Receipt of Stockholder Proposals” and such information is incorporated herein by reference.
The information required by this Item pursuant to Item 407(d)(4) and Item 407(d)(5) of Regulation S-K regarding our Audit Committee and our audit committee financial expert(s), respectively, will appear in our Proxy Statement under the heading “Corporate Governance” and such information is incorporated herein by reference.
The information required by this Item pursuant to Item 402 of Regulation S-K regarding director compensation will appear in our Proxy Statement under the section “Board Compensation” and such information is incorporated herein by reference.
The information required by this Item pursuant to Item 402 of Regulation S-K regarding executive officer compensation, including our Compensation Discussion & Analysis, will appear in our Proxy Statement under the section “Executive Compensation” and such information is incorporated herein by reference.
The information required by this Item pursuant to Item 407(e)(4) of Regulation S-K will appear in our Proxy Statement under the section “Compensation Committee Interlocks and Insider Participation” and such information is incorporated herein by reference.
The information required by this Item pursuant to Item 407(e)(5) will appear in our Proxy Statement under the section “Compensation Committee Report” and such information is incorporated herein by reference.
ITEM 12.SECURITY OWNERSHIP OF CERTAIN BENEFICIAL OWNERS AND MANAGEMENT AND RELATED STOCKHOLDER MATTERS
The information required by this Item pursuant to Item 403 of Regulation S-K concerning security ownership of certain beneficial owners and management will appear in our Proxy Statement under the section “Security Ownership” and such information is incorporated herein by reference.
The information required by this Item pursuant to Item 201(d) of Regulation S-K concerning securities authorized for issuance under equity compensation plans will appear in our Proxy Statement under the section “Equity Compensation Plans Information” and such information is incorporated herein by reference.
43
ITEM 13.CERTAIN RELATIONSHIPS AND RELATED TRANSACTIONS AND DIRECTOR INDEPENDENCE
The information required by this Item pursuant to Item 404 of Regulation S-K will appear in our Proxy Statement under the section “Certain Relationships and Related Transactions” and such information is incorporated herein by reference.
The information required by this Item pursuant to Item 407(a) of Regulation S-K regarding the independence of our directors will appear in our Proxy Statement under the section “Corporate Governance” and such information is incorporated herein by reference.
The information concerning principal accountant fees and services required by this Item is incorporated by reference to our Proxy Statement under the heading “Independent“Ratification of Independent Registered Public Accountants.Accounting Firm.”
The information concerning pre-approval policies for audit and non-audit services required by this Item is incorporated by reference to our Proxy Statement under the heading “Audit Committee Pre-Approval of Audit and Permissible Non-Audit Services of Independent Auditors.”
44
PART IV
(a)Documents Filed with Report
1. Financial Statements.
Report of Independent Registered Public Accounting Firm | F-1 | |
| on Internal Control over Financial Reporting | F-2 | |
Consolidated Balance Sheets | F-3 | |
Consolidated Statements of Income | F-4 | |
Consolidated Statements of Comprehensive Income | F-5 | |
Consolidated Statements of Cash Flows | F-6 | |
Consolidated Statements of | F-7 | |
Notes to Consolidated Financial Statements | F-8 | |
2. Financial Statement Schedules.
All schedules are omitted because the required information is already included in our notes to our consolidated financial statements or because they are not applicable.
45
3. Exhibits.
3.1(1) | ||
Certificate of Incorporation, as amended, of the Company. | ||
3.2(2) | ||
Amended and Restated Bylaws of the Company. | ||
3.3(3) | ||
Certificate of Designation of Rights, Preferences and Privileges of Series A Participating Preferred Stock of the Company. | ||
4.1(4) | ||
Specimen of Common Stock certificate of the Company. | ||
4.2(5) | ||
Rights Agreement dated as of January 21, 2004, between the Company and EquiServe Trust Company, N.A. | ||
10.1(4) | ||
Form of Indemnification Agreement. | ||
10.2(6) | ||
1994 Incentive Plan, as amended.* | ||
10.3(7) | ||
1994 Employee Stock Purchase | ||
10.5(8) | ||
National Instruments Corporation Annual Incentive Program, as amended.* | ||
10.6(9) | 2005 Incentive Plan.* | |
10.7(10) | 2005 Form of Restricted Stock Unit Award Agreement (Non-Employee Director).* | |
10.8(11) | ||
2005 Form of Restricted Stock Unit Award Agreement (Performance Vesting).* | ||
10.9(12) | ||
2005 Form of Restricted Stock Unit Award Agreement (Current Employee).* | ||
10.10(13) | ||
2005 Form of Restricted Stock Unit Award Agreement (Newly Hired Employee).* | ||
10.11(14) | 2010 Incentive Plan.* | |
10.12(15) | 2010 Form of | |
10.13(16) | 2010 Form of Restricted Stock Unit Award Agreement (Performance Vesting).* | |
10.14(17) | 2010 Form of | |
10.15(18) | 2010 Form of Restricted Stock Unit Award Agreement (Newly Hired Employee).* | |
31.1 | ||
Certification of Chief Executive Officer Pursuant to 18 U.S.C. Section 1350, as Adopted Pursuant to Section 302 of the Sarbanes-Oxley Act of 2002. | ||
31.2 | ||
Certification of Chief Financial Officer Pursuant to 18 U.S.C. Section 1350, as Adopted Pursuant to Section 302 of the Sarbanes-Oxley Act of 2002. | ||
32.1 | ||
Certification of Chief Executive Officer and Chief Financial Officer Pursuant to 18 U.S.C. Section 1350, as Adopted Pursuant to Section 906 of the Sarbanes-Oxley Act of 2002. | ||
101.INS | XBRL Instance Document ** | |
101.SCH | XBRL Taxonomy Extension Schema Document ** | |
101.CAL | XBRL Taxonomy Extension Calculation Linkbase Document ** | |
101.DEF | XBRL Taxonomy Extension Definition Linkbase Document ** | |
101.LAB | XBRL Taxonomy Extension Label Linkbase Document ** | |
101.PRE | XBRL Taxonomy Extension Presentation Linkbase Document ** | |
(1) | Incorporated by reference to the same-numbered exhibit filed with the | |
(2) | ||
Incorporated by reference to the same-numbered exhibit filed with the | ||
(3) | ||
Incorporated by reference to the same-numbered exhibit filed with the | ||
(4) | Incorporated by reference to the Company’s Registration Statement on Form S-1 (Reg. No. 33-88386) declared effective March 13, 1995. | |
(5) | Incorporated by reference to exhibit 4.1 filed with the Company’s Current Report on Form 8-K filed on January 28, 2004. | |
(6) | Incorporated by reference to the same-numbered exhibit filed with the | |
(7) | Incorporated by reference to exhibit 10.1 filed with the Company’s Current Report on Form | |
(8) | Incorporated by reference to exhibit 99.1 filed with the Company’s Current Report on Form 8-K filed on February 24, 2012. | |
(9) | Incorporated by reference to exhibit A of the Company’s Proxy Statement dated and filed on April 4, 2005. | |
(10) | Incorporated by reference to exhibit 10.8 filed with the Company’s Form 10-Q on August 2, 2006. | |
(11) | Incorporated by reference to exhibit 10.9 filed with the Company’s Form 10-Q on August 2, 2006. | |
(12) | Incorporated by reference to exhibit 10.10 filed with the Company’s Form 10-Q on August 2, 2006. | |
(13) | Incorporated by reference to exhibit 10.11 filed with the Company’s Form 10-Q on August 2, 2006. | |
(14) | Incorporated by reference to exhibit 10.1 filed with the Company’s Current Report on Form 8-K filed on May 17, 2010. | |
(15) | Incorporated by reference to exhibit 10.2 filed with the Company’s Current Report on Form 8-K filed on June 24, 2010. | |
(16) | Incorporated by reference to exhibit 10.3 filed with the Company’s Current Report on Form 8-K filed on June 24, 2010. | |
(17) | Incorporated by reference to exhibit 10.4 filed with the Company’s Current Report on Form 8-K filed on June 24, 2010. | |
(18) | Incorporated by reference to exhibit 10.5 filed with the Company’s Current Report on Form 8-K filed on June 24, 2010. | |
* | Management Contract or Compensatory Plan or | |
** | In accordance with Rule 406T of Regulation S-T, these interactive data files are deemed not filed or part of a registration statement or prospectus for purposes of Sections 11 or 12 of the Securities Act of 1933 or Section 18 of the Securities Exchange Act of 1934 and otherwise are not subject to liability. |
46
SIGNATURES
Pursuant to the requirements of Section 13 or 15(d) of the Securities Exchange Act of 1934, the registrant has duly caused this report to be signed on its behalf by the undersigned thereunto duly authorized.
Registrant | ||||
NATIONAL INSTRUMENTS CORPORATION | ||||
February 19, 2013 | BY: | |||
/s/ Dr. James J. Truchard | ||||
Dr. James J. Truchard | ||||
Chairman of the Board and President | ||||
POWER OF ATTORNEY
KNOW ALL PERSONS BY THESE PRESENTS, that each person whose signature appears below constitutes and appoints Dr. James J. Truchard and Alexander M. Davern, jointly and severally, his or her attorneys-in-fact, each with the power of substitution, for him or her in any and all capacities, to sign any amendments to this Report on Form 10-K,10‑K, and to file the same, with exhibits thereto and other documents in connection therewith, with the Securities and Exchange Commission, hereby ratifying and confirming all that each of said attorneys-in-fact, or his substitute or substitutes, may do or cause to be done by virtue hereof.
Pursuant to the requirements of the Securities Exchange Act of 1934, this report has been signed below by the following persons on behalf of the registrant and in the capacities and on the dates indicated.
Signature | Capacity in Which Signed | Date | ||
/s/ Dr. James J. Truchard | Chairman of the Board and President | February | ||
Dr. James J. Truchard | ||||
/s/ Alex M. Davern | EVP, Chief Operating Officer, Chief Financial Officer and Treasurer (Principal Financial and Accounting Officer) | February | ||
Alex M. Davern | ||||
/s/ Jeffrey L. Kodosky | Director | February | ||
Jeffrey L. Kodosky | ||||
/s/ Dr. Donald M. Carlton | Director | February | ||
Dr. Donald M. Carlton | ||||
/s/ Charles J. Roesslein | Director | February | ||
Charles J. Roesslein | ||||
/s/ Duy-Loan T. Le | Director | February | ||
Duy-Loan T. Le | ||||
/s/ John K. Medica | Director | February | ||
John K. Medica | ||||
/s/ John M. Berra | Director | February 19, 2013 | ||
John M. Berra |
47
NATIONAL INSTRUMENTS CORPORATION
INDEX TO FINANCIAL STATEMENTS
Page No. | |||
Financial Statements: | |||
F-1 | |||
Report of Independent Registered Public Accounting Firm on Internal Control over Financial Reporting | F-2 | ||
Consolidated Balance Sheets as of December 31, | F-3 | ||
F-4 | |||
F-5 | |||
F-6 | |||
F-7 | |||
F-8 | |||
All schedules are omitted because the required information is already included in our notes to our consolidated financial statements or because they are not applicable.
48
The Board of Directors and ShareholdersStockholders of National Instruments Corporation:
We have audited the accompanying consolidated balance sheets of National Instruments Corporation as of December 31, 20092012 and 2008,2011, and the related consolidated statements of income, comprehensive income, stockholders' equity, and cash flows for each of the three fiscal years in the period ended December 31, 2009.2012. These financial statements are the responsibility of the Company's management. Our responsibility is to express an opinion on these financial statements based on our audits.
We conducted our audits in accordance with the standards of the Public Company Accounting Oversight Board (United States). Those standards require that we plan and perform the audit to obtain reasonable assurance about whether the financial statements are free of material misstatement. An audit includes examining, on a test basis, evidence supporting the amounts and disclosures in the financial statements. An audit also includes assessing the accounting principles used and significant estimates made by management, as well as evaluating the overall financial statement presentation. We believe that our audits provide a reasonable basis for our opinion.
In our opinion, the financial statements referred to above present fairly, in all material respects, the consolidated financial position of National Instruments Corporation at December 31, 20092012 and 2008,2011, and the consolidated results of theirits operations and theirits cash flows for each of the three fiscal years in the period ended December 31, 2009,2012, in conformity with U.S. generally accepted accounting principles.
We also have audited, in accordance with the standards of the Public Company Accounting Oversight Board (United States), National Instruments CorporationCorporation’s internal control over financial reporting as of December 31, 2009,2012, based on criteria established in Internal Control-Integrated Framework issued by the Committee of Sponsoring Organizations of the Treadway Commission and our report dated February 17, 201019, 2013 expressed an unqualified opinion thereon.
/s/ Ernst & Young LLP
The Board of Directors and ShareholdersStockholders of National Instruments Corporation:
We have audited National Instruments Corporation’s internal control over financial reporting as of December 31, 2009,2012, based on criteria established in Internal Control—Integrated Framework issued by the Committee of Sponsoring Organizations of the Treadway Commission (the COSO criteria). National Instruments Corporation’s management is responsible for maintaining effective internal control over financial reporting, and for its assessment of the effectiveness of internal control over financial reporting included in the accompanying Management Report on Internal Control over Financial Reporting. Our responsibility is to express an opinion on the company’s internal control over financial reporting based on our audit.
We conducted our audit in accordance with the standards of the Public Company Accounting Oversight Board (United States). Those standards require that we plan and perform the audit to obtain reasonable assurance about whether effective internal control over financial reporting was maintained in all material respects. Our audit included obtaining an understanding of internal control over financial reporting, assessing the risk that a material weakness exists, testing and evaluating the design and operating effectiveness of internal control based on the assessed risk, and performing such other procedures as we considered necessary in the circumstances. We believe that our audit provides a reasonable basis for our opinion.
A company’s internal control over financial reporting is a process designed to provide reasonable assurance regarding the reliability of financial reporting and the preparation of financial statements for external purposes in accordance with generally accepted accounting principles. A company’s internal control over financial reporting includes those policies and procedures that (1) pertain to the maintenance of records that, in reasonable detail, accurately and fairly reflect the transactions and dispositions of the assets of the company; (2) provide reasonable assurance that transactions are recorded as necessary to permit preparation of financial statements in accordance with generally accepted accounting principles, and that receipts and expenditures of the company are being made only in accordance with authorizations of management and directors of the company; and (3) provide reasonable assurance regarding prevention or timely detection of unauthorized acquisition, use or disposition of the company’s assets that could have a material effect on the financial statements.
Because of its inherent limitations, internal control over financial reporting may not prevent or detect misstatements. Also, projections of any evaluation of effectiveness to future periods are subject to the risk that controls may become inadequate because of changes in conditions, or that the degree of compliance with the policies or procedures may deteriorate.
In our opinion, National Instruments Corporation maintained, in all material respects, effective internal control over financial reporting as of December 31, 2009,2012, based on the COSO criteria.
We also have audited, in accordance with the standards of the Public Company Accounting Oversight Board (United States), the consolidated balance sheets of National Instruments Corporation as of December 31, 20092012 and 2008,2011, and the related consolidated statements of income, comprehensive income, stockholders’ equity, and cash flows for each of the three years in the period ended December 31, 20092012 and our report dated February 17, 201019, 2013 expressed an unqualified opinion thereon.
/s/ Ernst & Young LLP
Austin, Texas
NATIONAL INSTRUMENTS CORPORATION
(in thousands, except share data)
|
|
|
|
|
|
| December 31, |
| December 31, |
|
| 2012 |
| 2011 |
Assets |
|
|
|
|
Current assets: |
|
|
|
|
Cash and cash equivalents | $ | 161,996 | $ | 142,608 |
Short-term investments |
| 173,166 |
| 223,504 |
Accounts receivable, net |
| 187,060 |
| 157,056 |
Inventories, net |
| 169,990 |
| 131,995 |
Prepaid expenses and other current assets |
| 48,009 |
| 38,082 |
Deferred income taxes, net |
| 27,479 |
| 26,304 |
Total current assets |
| 767,700 |
| 719,549 |
Property and equipment, net |
| 249,721 |
| 190,148 |
Goodwill |
| 147,258 |
| 130,747 |
Intangible assets, net |
| 93,913 |
| 83,866 |
Other long-term assets |
| 26,177 |
| 29,984 |
Total assets | $ | 1,284,769 | $ | 1,154,294 |
Liabilities and stockholders' equity |
|
|
|
|
Current liabilities: |
|
|
|
|
Accounts payable | $ | 65,080 | $ | 41,111 |
Accrued compensation |
| 29,978 |
| 29,616 |
Deferred revenue - current |
| 90,714 |
| 80,059 |
Accrued expenses and other liabilities |
| 34,373 |
| 37,612 |
Other taxes payable |
| 24,811 |
| 24,507 |
Total current liabilities |
| 244,956 |
| 212,905 |
Deferred income taxes |
| 47,630 |
| 43,186 |
Liability for uncertain tax positions |
| 20,920 |
| 19,494 |
Deferred revenue - long-term |
| 20,446 |
| 10,015 |
Other long-term liabilities |
| 11,689 |
| 16,683 |
Total liabilities |
| 345,641 |
| 302,283 |
Commitments and contingencies |
|
|
|
|
Stockholders' equity: |
|
|
|
|
Preferred stock: par value $0.01; 5,000,000 shares authorized; none issued and outstanding |
| - |
| - |
Common stock: par value $0.01; 180,000,000 shares authorized; 122,878,690 and 120,677,143 shares issued and outstanding, respectively |
| 1,229 |
| 1,207 |
Additional paid-in capital |
| 532,845 |
| 471,830 |
Retained earnings |
| 404,210 |
| 382,474 |
Accumulated other comprehensive income (loss) |
| 844 |
| (3,500) |
Total stockholders’ equity |
| 939,128 |
| 852,011 |
Total liabilities and stockholders’ equity | $ | 1,284,769 | $ | 1,154,294 |
| December 31, | ||||||||
| 2009 | 2008 | |||||||
| Assets | ||||||||
| Current assets: | ||||||||
| Cash and cash equivalents | $ | 201,465 | $ | 229,400 | ||||
| Short-term investments | 87,196 | 6,220 | ||||||
| Accounts receivable, net | 103,957 | 121,548 | ||||||
| Inventories, net | 86,515 | 107,358 | ||||||
| Prepaid expenses and other current assets | 36,523 | 43,062 | ||||||
| Deferred income taxes, net | 16,522 | 21,435 | ||||||
| Total current assets | 532,178 | 529,023 | ||||||
| Long-term investments | — | 10,500 | ||||||
| Property and equipment, net | 153,265 | 154,477 | ||||||
| Goodwill, net | 64,779 | 64,561 | ||||||
| Intangible assets, net | 43,390 | 41,915 | ||||||
| Other long-term assets | 19,417 | 32,115 | ||||||
| Total assets | $ | 813,029 | $ | 832,591 | ||||
| Liabilities and Stockholders’ Equity | ||||||||
| Current liabilities: | ||||||||
| Accounts payable | $ | 23,502 | $ | 30,876 | ||||
| Accrued compensation | 14,934 | 22,012 | ||||||
| Deferred revenue | 57,242 | 45,514 | ||||||
| Accrued expenses and other liabilities | 8,560 | 18,848 | ||||||
| Other taxes payable | 14,181 | 13,481 | ||||||
| Total current liabilities | 118,419 | 130,731 | ||||||
| Deferred income taxes | 25,012 | 25,157 | ||||||
| Liability for uncertain tax positions | 11,062 | 9,364 | ||||||
| Other long-term liabilities | 4,116 | 2,901 | ||||||
| Total liabilities | 158,609 | 168,153 | ||||||
| Commitments and contingencies | ||||||||
| Stockholders’ equity: | ||||||||
| Preferred stock: par value $0.01; 5,000,000 shares authorized; none issued and outstanding | — | — | ||||||
Common stock: par value $0.01; 180,000,000 shares authorized; 77,367,874 and 77,193,063 shares issued and outstanding, respectively | 774 | 772 | ||||||
| Additional paid-in capital | 336,446 | 300,352 | ||||||
| Retained earnings | 303,655 | 352,831 | ||||||
| Accumulated other comprehensive income | 13,545 | 10,483 | ||||||
| Total stockholders’ equity | 654,420 | 664,438 | ||||||
| Total liabilities and stockholders’ equity | $ | 813,029 | $ | 832,591 | ||||
The accompanying notes are an integral part of these financial statements.
F-3
NATIONAL INSTRUMENTS CORPORATION
(in thousands, except per share data)
|
|
|
|
|
|
|
|
|
|
|
|
|
|
|
| For the years ended December 31, | ||||
|
| 2012 |
| 2011 |
| 2010 |
|
|
|
|
|
|
|
Net sales: |
|
|
|
|
|
|
Product | $ | 1,054,849 | $ | 955,613 | $ | 807,386 |
Software maintenance |
| 87,494 |
| 81,667 |
| 65,834 |
GSA accrual |
| 1,349 |
| (13,107) |
| - |
Total net sales |
| 1,143,692 |
| 1,024,173 |
| 873,220 |
|
|
|
|
|
|
|
Cost of sales: |
|
|
|
|
|
|
Product |
| 274,839 |
| 235,839 |
| 195,096 |
Software maintenance |
| 5,435 |
| 5,125 |
| 4,987 |
Total cost of sales |
| 280,274 |
| 240,964 |
| 200,083 |
|
|
|
|
|
|
|
Gross profit |
| 863,418 |
| 783,209 |
| 673,137 |
|
|
|
|
|
|
|
Operating expenses: |
|
|
|
|
|
|
Sales and marketing |
| 431,468 |
| 388,768 |
| 319,606 |
Research and development |
| 222,994 |
| 199,071 |
| 158,149 |
General and administrative |
| 85,239 |
| 82,658 |
| 67,069 |
Acquisition related adjustment |
| 6,783 |
| - |
| - |
Total operating expenses |
| 746,484 |
| 670,497 |
| 544,824 |
|
|
|
|
|
|
|
Operating income |
| 116,934 |
| 112,712 |
| 128,313 |
|
|
|
|
|
|
|
Other income: |
|
|
|
|
|
|
Interest income |
| 716 |
| 1,319 |
| 1,391 |
Net foreign exchange loss |
| (2,246) |
| (2,755) |
| (2,585) |
Other (expense) income, net |
| (567) |
| (142) |
| 993 |
Income before income taxes |
| 114,837 |
| 111,134 |
| 128,112 |
Provision for income taxes |
| 24,700 |
| 17,062 |
| 18,996 |
|
|
|
|
|
|
|
Net income | $ | 90,137 | $ | 94,072 | $ | 109,116 |
|
|
|
|
|
|
|
Basic earnings per share | $ | 0.74 | $ | 0.79 | $ | 0.93 |
|
|
|
|
|
|
|
Weighted average shares outstanding - basic |
| 121,973 |
| 119,836 |
| 116,973 |
|
|
|
|
|
|
|
Diluted earnings per share | $ | 0.73 | $ | 0.78 | $ | 0.92 |
|
|
|
|
|
|
|
Weighted average shares outstanding - diluted |
| 122,977 |
| 121,220 |
| 118,572 |
|
|
|
|
|
|
|
Dividends declared per share | $ | 0.56 | $ | 0.40 | $ | 0.35 |
For the Years Ended December 31, | ||||||||||||
| 2009 | 2008 | 2007 | ||||||||||
| Net sales: | ||||||||||||
| Product | $ | 623,736 | $ | 765,441 | $ | 701,589 | ||||||
| Software maintenance | 52,858 | 55,096 | 38,789 | |||||||||
| Total net sales | 676,594 | 820,537 | 740,378 | |||||||||
| Cost of sales: | ||||||||||||
| Product | 164,700 | 201,064 | 180,556 | |||||||||
| Software maintenance | 5,184 | 6,045 | 4,711 | |||||||||
| Total cost of sales | 169,884 | 207,109 | 185,267 | |||||||||
| Gross profit | 506,710 | 613,428 | 555,111 | |||||||||
| Operating expenses: | ||||||||||||
| Sales and marketing | 269,267 | 307,409 | 264,060 | |||||||||
| Research and development | 132,974 | 143,140 | 126,515 | |||||||||
| General and administrative | 57,938 | 67,162 | 62,445 | |||||||||
| Total operating expenses | 460,179 | 517,711 | 453,020 | |||||||||
| Operating income | 46,531 | 95,717 | 102,091 | |||||||||
| Other income (expense): | ||||||||||||
| Interest income | 1,629 | 5,996 | 9,822 | |||||||||
| Net foreign exchange gain (loss) | 734 | (3,737 | ) | 1,672 | ||||||||
| Other income (expense), net | 1,351 | 161 | (158 | ) | ||||||||
| Income before income taxes | 50,245 | 98,137 | 113,427 | |||||||||
| Provision for income taxes | 33,160 | 13,310 | 6,394 | |||||||||
| Net income | $ | 17,085 | $ | 84,827 | $ | 107,033 | ||||||
| Basic earnings per share | $ | 0.22 | $ | 1.08 | $ | 1.35 | ||||||
| Weighted average shares outstanding - basic | 77,520 | 78,567 | 79,468 | |||||||||
| Diluted earnings per share | $ | 0.22 | $ | 1.07 | $ | 1.32 | ||||||
| Weighted average shares outstanding – diluted �� | 78,026 | 79,515 | 81,043 | |||||||||
| Dividends declared per share | $ | 0.48 | $ | 0.44 | $ | 0.34 | ||||||
The accompanying notes are an integral part of these financial statements.
F-4
NATIONAL INSTRUMENTS CORPORATION
CONSOLIDATED STATEMENTS OF COMPREHENSIVE INCOME
(in thousands)
|
|
|
|
|
|
|
|
|
|
|
|
|
|
|
|
|
|
| ||
|
| For the years ended December 31, | ||||
|
| 2012 |
| 2011 |
| 2010 |
|
|
|
|
|
|
|
|
|
|
|
|
|
|
Net income | $ | 90,137 | $ | 94,072 | $ | 109,116 |
Other comprehensive income, before tax and net of reclassification adjustments: |
|
|
|
|
|
|
Foreign currency translation adjustment |
| 2,231 |
| (1,236) |
| (6,174) |
Unrealized gain (loss) on securities available-for-sale |
| 56 |
| (1,017) |
| 768 |
Unrealized gain (loss) on derivative instruments |
| 3,247 |
| (1,045) |
| (11,365) |
Other comprehensive income (loss), before tax |
| 5,534 |
| (3,298) |
| (16,771) |
Tax provision related to items of other comprehensive income |
| (1,190) |
| 508 |
| 2,516 |
Other comprehensive income (loss), net of tax |
| 4,344 |
| (2,790) |
| (14,255) |
Comprehensive income | $ | 94,481 | $ | 91,282 | $ | 94,861 |
|
|
|
|
|
|
|
|
|
|
|
|
|
|
|
|
|
|
|
|
|
The accompanying notes are an integral part of these financial statements. | ||||||
F-5
NATIONAL INSTRUMENTS CORPORATION
(in thousands)
|
|
|
|
|
|
|
|
|
|
|
|
|
|
|
|
|
|
| ||
|
| For the years ended December 31, | ||||
|
| 2012 |
| 2011 |
| 2010 |
Cash flow from operating activities: |
|
|
|
|
|
|
Net income | $ | 90,137 | $ | 94,072 | $ | 109,116 |
Adjustments to reconcile net income to net cash provided by operating activities: |
|
|
|
|
|
|
Depreciation and amortization |
| 58,686 |
| 49,897 |
| 37,872 |
Stock-based compensation |
| 27,796 |
| 23,219 |
| 18,795 |
Tax expense (benefit) from deferred income taxes |
| 1,853 |
| (8,581) |
| 3,668 |
Tax benefit from stock option plans |
| (2,198) |
| (5,151) |
| (96) |
Changes in operating assets and liabilities: |
|
|
|
|
|
|
Accounts receivable |
| (26,007) |
| (21,957) |
| (22,923) |
Inventories |
| (36,154) |
| (11,817) |
| (30,930) |
Prepaid expenses and other assets |
| (7,037) |
| (1,350) |
| (20,411) |
Accounts payable |
| 23,419 |
| 5,573 |
| 9,630 |
Deferred revenue |
| 21,050 |
| 16,953 |
| 14,408 |
Taxes, accrued expenses and other liabilities |
| (19,029) |
| 29,041 |
| 25,929 |
Net cash provided by operating activities |
| 132,516 |
| 169,899 |
| 145,058 |
|
|
|
|
|
|
|
Cash flow from investing activities: |
|
|
|
|
|
|
Capital expenditures |
| (89,073) |
| (54,830) |
| (28,397) |
Capitalization of internally developed software |
| (11,721) |
| (12,065) |
| (15,759) |
Additions to other intangibles |
| (1,890) |
| (5,035) |
| (4,151) |
Acquisitions, net of cash received |
| (25,481) |
| (73,558) |
| (4,218) |
Purchases of short-term investments |
| (188,098) |
| (257,449) |
| (126,691) |
Sales and maturities of short-term investments |
| 238,436 |
| 166,104 |
| 82,672 |
Net cash used in investing activities |
| (77,827) |
| (236,833) |
| (96,544) |
|
|
|
|
|
|
|
Cash flow from financing activities: |
|
|
|
|
|
|
Proceeds from issuance of common stock |
| 30,902 |
| 32,905 |
| 51,852 |
Repurchase of common stock |
| - |
| - |
| (41,862) |
Dividends paid |
| (68,401) |
| (47,961) |
| (40,618) |
Tax benefit from stock option plans |
| 2,198 |
| 5,151 |
| 96 |
Net cash used in financing activities |
| (35,301) |
| (9,905) |
| (30,532) |
|
|
|
|
|
|
|
Net change in cash and cash equivalents |
| 19,388 |
| (76,839) |
| 17,982 |
Cash and cash equivalents at beginning of period |
| 142,608 |
| 219,447 |
| 201,465 |
Cash and cash equivalents at end of period | $ | 161,996 | $ | 142,608 | $ | 219,447 |
Cash paid for interest and income taxes: |
|
|
|
|
|
|
Interest | $ | 68 | $ | 14 | $ | 82 |
Income taxes | $ | 25,059 | $ | 2,393 | $ | 14,807 |
| For the Years Ended December 31, | ||||||||||||
| 2009 | 2008 | 2007 | ||||||||||
| Cash flow from operating activities: | ||||||||||||
| Net income | $ | 17,085 | $ | 84,827 | $ | 107,033 | ||||||
| Adjustments to reconcile net income to net cash provided by operating activities: | ||||||||||||
| Depreciation and amortization | 38,365 | 37,103 | 36,605 | |||||||||
| Stock-based compensation | 20,299 | 19,854 | 17,754 | |||||||||
| Tax expense/(benefit from) deferred income taxes | 17,196 | (4,475 | ) | (16,954 | ) | |||||||
| Tax expense/(benefit from) stock option plans | 1,450 | (1,213 | ) | (2,964 | ) | |||||||
| Changes in operating assets and liabilities: | ||||||||||||
| Accounts receivable | 17,591 | 12,159 | (14,047 | ) | ||||||||
| Inventories | 20,843 | (24,578 | ) | (5,537 | ) | |||||||
| Prepaid expenses and other assets | 12,740 | (10,340 | ) | (12,330 | ) | |||||||
| Accounts payable | (7,374 | ) | (5,648 | ) | 4,186 | |||||||
| Deferred revenue | 11,728 | 9,423 | 13,883 | |||||||||
| Taxes and other liabilities | (14,272 | ) | 4,706 | 19,743 | ||||||||
| Net cash provided by operating activities | 135,651 | 121,818 | 147,372 | |||||||||
| Cash flow from investing activities: | ||||||||||||
| Acquisitions, net of cash received | — | (17,310 | ) | — | ||||||||
| Capital expenditures | (20,847 | ) | (25,771 | ) | (24,864 | ) | ||||||
| Capitalization of internally developed software | (12,583 | ) | (9,487 | ) | (8,263 | ) | ||||||
| Additions to other intangibles | (4,602 | ) | (3,010 | ) | (6,447 | ) | ||||||
| Purchases of short-term investments | (93,087 | ) | (9,061 | ) | (87,586 | ) | ||||||
| Sales and maturities of short-term investments | 19,204 | 86,179 | 143,938 | |||||||||
| Purchases of foreign currency option contracts | — | (2,784 | ) | (2,242 | ) | |||||||
| Net cash provided by (used in) investing activities | (111,915 | ) | 18,756 | 14,536 | ||||||||
| Cash flow from financing activities: | ||||||||||||
| Proceeds from issuance of common stock | 21,672 | 31,150 | 36,460 | |||||||||
| Repurchase of common stock | (34,585 | ) | (103,641 | ) | (79,728 | ) | ||||||
| Dividends paid | (37,308 | ) | (34,735 | ) | (27,052 | ) | ||||||
| Tax (expense)/benefit from stock option plans | (1,450 | ) | 1,213 | 2,964 | ||||||||
| Net cash (used in) financing activities | (51,671 | ) | (106,013 | ) | (67,356 | ) | ||||||
| Net change in cash and cash equivalents | (27,935 | ) | 34,561 | 94,552 | ||||||||
| Cash and cash equivalents at beginning of period | 229,400 | 194,839 | 100,287 | |||||||||
| Cash and cash equivalents at end of period | $ | 201,465 | $ | 229,400 | $ | 194,839 | ||||||
| Cash paid for interest and income taxes: | ||||||||||||
| Interest | $ | 23 | $ | 116 | $ | 159 | ||||||
| Income taxes | $ | 14,608 | $ | 17,214 | $ | 21,147 | ||||||
The accompanying notes are an integral part of these financial statements.
F-6
NATIONAL INSTRUMENTS CORPORATION
(in thousands, except share data)
|
|
|
|
|
|
|
|
|
|
|
|
| Common Stock Shares |
| Common Stock Amount |
| Additional-Paid in Capital |
| Retained Earnings |
| Accumulated Other Comprehensive Income/(Loss) |
| Total Stockholders' Equity |
Balance at December 31, 2009 | 116,051,811 | $ | 1,161 | $ | 336,059 | $ | 303,655 | $ | 13,545 | $ | 654,420 |
Net income |
|
|
|
|
|
| 109,116 |
|
|
| 109,116 |
Other comprehensive income (loss) |
|
|
|
|
|
|
|
| (14,255) |
| (14,255) |
Issuance of common stock under employee plans, including tax benefits | 3,788,994 |
| 38 |
| 51,814 |
|
|
|
|
| 51,852 |
Stock-based compensation |
|
|
|
| 18,897 |
|
|
|
|
| 18,897 |
Repurchase and retirement of common stock | (2,089,098) |
| (21) |
| (6,051) |
| (35,790) |
|
|
| (41,862) |
Business acquisition | 153,268 |
| 1 |
| 2,998 |
|
|
|
|
| 2,999 |
Dividends paid |
|
|
|
|
|
| (40,618) |
|
|
| (40,618) |
Disqualified dispositions |
|
|
|
| 3,996 |
|
|
|
|
| 3,996 |
Balance at December 31, 2010 | 117,904,975 | $ | 1,179 | $ | 407,713 | $ | 336,363 | $ | (710) | $ | 744,545 |
Net income |
|
|
|
|
|
| 94,072 |
|
|
| 94,072 |
Other comprehensive income (loss) |
|
|
|
|
|
|
|
| (2,790) |
| (2,790) |
Issuance of common stock under employee plans, including tax benefits | 2,715,253 |
| 27 |
| 32,878 |
|
|
|
|
| 32,905 |
Stock-based compensation |
|
|
|
| 23,106 |
|
|
|
|
| 23,106 |
Business acquisition | 56,915 |
| 1 |
| 1,813 |
|
|
|
|
| 1,814 |
Dividends paid |
|
|
|
|
|
| (47,961) |
|
|
| (47,961) |
Disqualified dispositions |
|
|
|
| 6,320 |
|
|
|
|
| 6,320 |
Balance at December 31, 2011 | 120,677,143 | $ | 1,207 | $ | 471,830 | $ | 382,474 | $ | (3,500) |
| 852,011 |
Net income |
|
|
|
|
|
| 90,137 |
|
|
| 90,137 |
Other comprehensive income (loss) |
|
|
|
|
|
|
|
| 4,344 |
| 4,344 |
Issuance of common stock under employee plans, including tax benefits | 2,201,547 |
| 22 |
| 30,879 |
|
|
|
|
| 30,901 |
Stock-based compensation |
|
|
|
| 27,679 |
|
|
|
|
| 27,679 |
Dividends paid |
|
|
|
|
|
| (68,401) |
|
|
| (68,401) |
Disqualified dispositions |
|
|
|
| 2,457 |
|
|
|
|
| 2,457 |
Balance at December 31, 2012 | 122,878,690 | $ | 1,229 | $ | 532,845 | $ | 404,210 | $ | 844 | $ | 939,128 |
|
|
|
|
|
|
|
|
|
|
|
|
|
|
|
|
|
|
|
|
|
| �� |
|
The accompanying notes are an integral part of these financial statements. | |||||||||||
F-7
Common Stock Shares | Common Stock Amount | Additional Paid-In Capital | Deferred Compensation | Retained Earnings | Accumulated Other Comprehensive Income/(Loss) | Total Stockholders’ Equity | ||||||||||||||||||||||
| Balance at December 31, 2006 | 79,883,837 | $ | 799 | $ | 207,808 | $ | — | $ | 385,480 | $ | 2,499 | $ | 596,586 | |||||||||||||||
| Net income | 107,033 | 107,033 | ||||||||||||||||||||||||||
Foreign currency translation adjustment (net of $286 tax expense) | 4,483 | 4,483 | ||||||||||||||||||||||||||
Unrealized gain on securities available-for-sale (net of $13 tax expense) | 200 | 200 | ||||||||||||||||||||||||||
Unrealized loss on derivative instruments (net of $7 tax benefit) | (117 | ) | (117 | ) | ||||||||||||||||||||||||
Total comprehensive income | 111,599 | |||||||||||||||||||||||||||
Issuance of common stock under employee plans, including tax benefits | 2,251,657 | 22 | 36,438 | 36,460 | ||||||||||||||||||||||||
| Stock-based compensation | 17,754 | 17,754 | ||||||||||||||||||||||||||
| Repurchase and retirement of common stock | (2,730,135 | ) | (27 | ) | (7,102 | ) | (72,599 | ) | (79,728 | ) | ||||||||||||||||||
| Dividends paid | (27,052 | ) | (27,052 | ) | ||||||||||||||||||||||||
| Disqualified dispositions | 5,467 | 5,467 | ||||||||||||||||||||||||||
Balance at December 31, 2007 | 79,405,359 | $ | 794 | $ | 260,365 | $ | — | $ | 392,862 | $ | 7,065 | $ | 661,086 | |||||||||||||||
| Net income | 84,827 | 84,827 | ||||||||||||||||||||||||||
Foreign currency translation adjustment (net of $681 tax benefit) | (4,188 | ) | (4,188 | ) | ||||||||||||||||||||||||
Unrealized loss on securities available-for-sale (net of $82 tax benefit) | (502 | ) | (502 | ) | ||||||||||||||||||||||||
Unrealized gain on derivative instruments (net of $1,320 tax expense) | 8,108 | 8,108 | ||||||||||||||||||||||||||
Total comprehensive income | 88,245 | |||||||||||||||||||||||||||
Issuance of common stock under employee plans, including tax benefits | 1,897,746 | 19 | 31,131 | 31,150 | ||||||||||||||||||||||||
| Stock-based compensation | 19,854 | 19,854 | ||||||||||||||||||||||||||
| Repurchase and retirement of common stock | (4,110,042 | ) | (41 | ) | (13,477 | ) | (90,123 | ) | (103,641 | ) | ||||||||||||||||||
| Dividends paid | (34,735 | ) | (34,735 | ) | ||||||||||||||||||||||||
| Disqualified dispositions | 2,479 | 2,479 | ||||||||||||||||||||||||||
Balance at December 31, 2008 | 77,193,063 | $ | 772 | $ | 300,352 | $ | — | $ | 352,831 | $ | 10,483 | $ | 664,438 | |||||||||||||||
| Net income | 17,085 | 17,085 | ||||||||||||||||||||||||||
Foreign currency translation adjustment (net of $1,799 tax expense) | 927 | 927 | ||||||||||||||||||||||||||
Unrealized gain on securities available-for-sale (net of $1,093 tax expense) | 563 | 563 | ||||||||||||||||||||||||||
Unrealized gain on derivative instruments (net of $3,053 tax expense) | 1,572 | 1,572 | ||||||||||||||||||||||||||
Total comprehensive income | 20,147 | |||||||||||||||||||||||||||
Issuance of common stock under employee plans, including tax benefits | 1,618,252 | 16 | 21,656 | 21,672 | ||||||||||||||||||||||||
| Stock-based compensation | 20,574 | 20,574 | ||||||||||||||||||||||||||
| Repurchase and retirement of common stock | (1,443,441 | ) | (14 | ) | (5,618 | ) | (28,953 | ) | (34,585 | ) | ||||||||||||||||||
| Dividends paid | (37,308 | ) | (37,308 | ) | ||||||||||||||||||||||||
| Disqualified dispositions | (518 | ) | (518 | ) | ||||||||||||||||||||||||
Balance at December 31, 2009 | 77,367,874 | $ | 774 | $ | 336,446 | $ | — | $ | 303,655 | $ | 13,545 | $ | 654,420 | |||||||||||||||
NATIONAL INSTRUMENTS CORPORATION
Note 1 – Operations and summary of significant accounting policies
National Instruments Corporation is a Delaware corporation. We provide flexible application software and modular, multifunction hardware that users combine with industry-standard computers, networks and third party devices to create measurement, automation and embedded systems, which we also refer to as “virtual instruments.” Our approach gives customers the ability to quickly and cost-effectively design, prototype and deploy unique custom-defined solutions for their design, control and test application needs. We offer hundreds of products used to create virtual instrumentation systems for general, commercial, industrial and scientific applications. Our products may be used in different environments, and consequently, specific application of our products is determined by the customer and generally is not known to us. We approach all markets with essentially the same products, which are used in a variety of applications from research and development to production testing, monitoring and industrial control. The following industries and applications are served by us worldwide: advanced research, automotive, commercial aerospace, computers and electronics, continuous process manufacturing, education, government/defense, medical research/pharmaceutical, power/energy, semiconductors, automated test equipment, telecommunications and others. These financial statements have been prepared in accordance with accounting principles generally accepted in the United States of America.
Principles of consolidation
The Consolidated Financial Statements include the accounts of National Instruments Corporation and its subsidiaries. All significant intercompany accounts and transactions have been eliminated.
Beginning in the three month period ended June 30, 2012, we have separately reported our current and long-term deferred revenue. The separation has no impact on our total reported deferred revenue, total liabilities, or total stockholder’s equity for any period on our Consolidated Balance Sheets. We have historically recordedassessed the excess of the purchase price over the par or stated value of retired shares of our common stock as a reduction of additional paid-in capital. We completed our reviewmateriality of this accounting policy under FASB ASC 505, Equity (FASB ASC 505). Baseditem on this review, we have reclassified a portion of the excess of the purchase price over the par or stated value of retired shares of our common stock from a reduction of additional paid-in capital to a reduction of retained earnings. This reclassification did not have any impact on previously reported statements of income, earning per share amounts, statements of cash flows or total stockholders’ equity.periods and concluded the separation was not material. Certain prior year amounts from our Consolidated Statements of Stockholders’ Equity have been reclassified to conform to the 20092012 presentation as shown in the following table:
(In thousands) | December 31, 2011 | |
Deferred revenue, as previously reported | $ | 90,074 |
Balances as reported in this Form 10-K: | ||
Deferred revenue - current | 80,059 | |
Deferred revenue - long-term | 10,015 | |
| APIC | RE | |||||||
| 2006 Beginning Balance | ||||||||
| 12/31/06 balance as previously reported | $ | 109,851 | $ | 483,437 | ||||
| Cumulative reclassification of share repurchase | 97,957 | (97,957 | ) | |||||
| 12/31/06 balance as reported in current Form 10-K | $ | 207,808 | $ | 385,480 | ||||
| 2007 Activity | ||||||||
| Repurchase and retirement of common stock as previously reported | $ | (79,701 | ) | $ | — | |||
| Reclassification of 2007 activity | 72,599 | (72,599 | ) | |||||
| Repurchase and retirement of common stock as reported in current Form 10-K | $ | (7,102 | ) | $ | (72,599 | ) | ||
| 2007 Ending Balance | ||||||||
| 12/31/07 balance as previously reported | $ | 89,809 | $ | 563,418 | ||||
| Cumulative reclassification of share repurchase | 170,556 | (170,556 | ) | |||||
| 12/31/07 balance as reported in current Form 10-K | $ | 260,365 | $ | 392,862 | ||||
| 2008 Activity | ||||||||
| Repurchase and retirement of common stock as previously reported | $ | (103,600 | ) | $ | — | |||
| Reclassification of 2008 activity | 90,123 | (90,123 | ) | |||||
| Repurchase and retirement of common stock as reported in current Form 10-K | $ | (13,477 | ) | $ | (90,123 | ) | ||
| 2008 Ending Balance | ||||||||
| 12/31/08 balance as previously reported | $ | 39,673 | $ | 613,510 | ||||
| Cumulative reclassification of share repurchase | 260,679 | (260,679 | ) | |||||
| 12/31/08 balance as reported in current Form 10-K | $ | 300,352 | $ | 352,831 | ||||
Use of estimates
The preparation of our financial statements in conformity with U.S. generally accepted accounting principles requires us to make estimates and assumptions that affect the reported amounts of assets, liabilities, revenues, expenses and related disclosures of contingent assets and liabilities. We base our estimates on past experience and other assumptions that we believe are reasonable under the circumstances, and we evaluate these estimates on an ongoing basis. Our critical accounting policies are those that affect our financial statements materially and involve difficult, subjective or complex judgments by management. Although these estimates are based on management's best knowledge of current events and actions that may impact the company in the future, actual results may be materially different from the estimates.
Cash and cash equivalents
Cash and cash equivalents include cash and highly liquid investments with maturities of three months or less at the date of acquisition.
F-8
Short-Term Investments
We maintain an investment portfolio of various types of security holdings and maturities. Pursuant to FASB ASC 820, cash equivalents and short-termvalue our available-for-sale short term investments available-for-sale are valued using the market approach (Level 1) based on unadjustedpricing from third party pricing vendors, who may use quoted prices in active markets for identical assets at(Level 1 inputs) or inputs other than quoted prices that are observable either directly or indirectly (Level 2 inputs) in determining fair value. We classify all of our fixed income available-for-sale securities as having Level 2 inputs. The valuation techniques used to measure the measurement date. Ourfair value of our financial instruments having Level 2 inputs were derived from non-binding market consensus prices that are corroborated by observable market data, quoted market prices for similar instruments, or pricing models, such as discounted cash flow techniques. We believe these sources reflect the credit risk associated with each of our available for sale short term investments. Short-term investments available-for-sale consists of debt securities issued by states of the U.S. and political subdivisions of the U.S., corporate debt securities and debt securities issued by U.S. government corporations and agencies as well as debt securities issued by foreign governments. All short-term investments also include auction rate securities that we originally purchased for $8.6 million. These auction rate securities consistavailable-for-sale have contractual maturities of education loan revenue bonds. Auction rate securities are variable rate debt instruments whose interest rates are typically reset approximately every 7 to 35 days. In November 2008, we accepted the UBS Auction Rate Securities Rights (“the Rights”) agreement offered by UBS as a liquidity alternative to the failed auction process. The Rights agreement is a nontransferable right to sell our auction rate securities, at par value, back to UBS at any time during the period June 30, 2010, through July 2, 2012. The estimated fair market value of both the auction rate securities and the Rights agreement was determined using significant unobservable inputs (Level 3) as prescribed by FASB ASC 820.
Our investments are classified as available-for-sale and accordingly are reported at fair value, with unrealized gains and losses reported as other comprehensive income, a component of stockholders’ equity. Unrealized losses are charged against income when a decline in fair value is determined to be other than temporary. Investments with maturities beyond one year are classified as short-term based on their highly liquid nature and because such marketable securities represent the investment of cash that is available for current operations. The fair value of our short-term investments in debt securities at December 31, 20092012 and December 31, 20082011 was $87$173 million and $6$224 million, respectively. The increasedecrease was due to the net purchasesale of $74$50 million of short-term investments and the transferwhich was used to fund payment of $8.6 relateddividends to our auction rate securitiesstockholders and our rights agreement from long-term investments to short-term investmentsacquisitions during the year endedfourth quarter of 2012. We have $25 million U.S. dollar equivalent of German government sovereign debt and $8 million U.S. dollar equivalent of corporate bonds that are denominated in Euro at December 31, 2009. The net purchase2012. Our German government sovereign debt holdings have a maximum maturity of $74 million of short term investments was done to diversify our holdings from money market accounts to debt securities24 months and to take advantage of higher yields associated with longer maturity debt securities. carry Aaa/AAA ratings.
We follow the guidance provided by FASB ASC 320 to assess whether our investments with unrealized loss positions are other than temporarily impaired. Realized gains and losses and declines in value judged to be other than temporary are determined based on the specific identification method and are reported in other income (expense), net, in our Consolidated Statements of Income.
Accounts Receivable, net
Accounts receivable are recorded net of allowanceallowances for sales returns of $1.9$2.1 million and $1.8$1.6 million at December 31, 20092012 and 2008,2011, respectively, and net of allowances for doubtful accounts of $2.7$2.8 million and $3.9$2.6 million at December 31, 20092012 and 2008,2011, respectively. A provision for estimated sales returns is made by reducing recorded revenue based on historical experience. We analyze historical returns, current economic trends and changes in customer demand and acceptance of our products when evaluating the adequacy of our sales returns allowance. Our allowance for doubtful accounts is based on historical experience. We analyze historical bad debts, customer concentrations, customer creditworthiness and current economic trends when evaluating the adequacy of our allowance for doubtful accounts.
|
|
|
|
|
|
|
|
|
| |
(In thousands) |
|
|
|
|
| |||||
Year | Description |
| Balance at Beginning of Period |
| Provisions/ |
| Write-Offs/ |
| Balance at End of Period | |
2010 | Allowance for doubtful accounts and sales returns | $ | 4,619 | $ | (578) | $ | 273 | $ | 3,768 | |
2011 | Allowance for doubtful accounts and sales returns | $ | 3,768 | $ | 385 | $ | (88) | $ | 4,241 | |
2012 | Allowance for doubtful accounts and sales returns | $ | 4,241 | $ | 1,216 | $ | 587 | $ | 4,870 | |
Year | Description | Balance at Beginning of Period | Provisions | Write-Offs | Balance at End of Period | ||||||||||||
| 2007 | Allowance for doubtful accounts and sales returns | $ | 4,360 | $ | 1,940 | $ | 698 | $ | 5,602 | ||||||||
| 2008 | Allowance for doubtful accounts and sales returns | 5,602 | 447 | 367 | 5,682 | ||||||||||||
| 2009 | Allowance for doubtful accounts and sales returns | 5,682 | 337 | 1,400 | 4,619 | ||||||||||||
Inventories,
Inventories are stated at the lower-of-cost or market. Cost is determined using standard costs, which approximate the first-in first-out (“FIFO”) method. Cost includes the acquisition cost of purchased components, parts and subassemblies, in-bound freight costs, labor and overhead. Market is replacement cost with respect to raw materials and is net realizable value with respect to work in process and finished goods.
Inventory is shown net of adjustment for excess and obsolete inventories of $4.4$3.8million, $4.2 million and $4.4$3.3 million at December 31, 20092012, 2011 and 2008,2010, respectively.
F-9
|
|
|
|
|
|
|
|
|
| |
(In thousands) |
|
|
|
|
|
|
|
|
| |
Year | Description |
| Balance at Beginning of Period |
| Provisions |
| Write-Offs |
| Balance at End of Period | |
2010 | Adjustment for excess and obsolete inventories | $ | 4,390 | $ | 1,785 | $ | 2,835 | $ | 3,340 | |
2011 | Adjustment for excess and obsolete inventories | $ | 3,340 | $ | 3,554 | $ | 2,689 | $ | 4,205 | |
2012 | Adjustment for excess and obsolete inventories | $ | 4,205 | $ | 1,824 | $ | 2,185 | $ | 3,844 | |
Property and equipment,
Property and equipment are recorded at cost. Depreciation is computed using the straight-line method over the estimated useful lives of the assets, which range from twenty to forty years for buildings, three to seven years for purchased internal use software and for equipment which are each included in furniture and equipment. Leasehold improvements are depreciated over the shorter of the life of the lease or the asset.
Intangible assets,
We capitalize costs related to the development and acquisition of certain software products. In accordance with FASB ASC 985, capitalizationCapitalization of costs begins when technological feasibility has been established and ends when the product is available for general release to customers. Technological feasibility for our products is established when the product is available for beta release. Amortization is computed on an individual product basis for those products available for market and is recognized based on the product’s estimated economic life, generally three years. Patents
We use the services of outside counsel to search for, document, and apply for patents. Those costs, along with any filing or application fees, are capitalized. Costs related to patents which are abandoned are written off. Once a patent is granted, the patent costs are amortized usingratably over the straight-line method over their estimated periodlegal life of benefit,the patent, generally ten to seventeen years.
At each balance sheet date, the unamortized costs for all intangible assets are reviewed by management and reduced to net realizable value when necessary.
Goodwill
The excess purchase price over the fair value of net assets acquired is recorded as goodwill. As we have one operating segment, we allocate goodwill to one reporting unit for goodwill impairment testing. In accordance with FASB ASC 350, Intangibles – Goodwill and Other (FASB ASC 350), goodwill is tested for impairment on an annual basis, and between annual tests if indicators of potential impairment exist, using a fair-value-based approach based on the market capitalization of the reporting unit. Our annual impairment test was performed as of February 28, 2009.29, 2012. No impairment of goodwill has beenwas identified during the period presented.2012 and 2011. Goodwill is deductible for tax purposes in certain jurisdictions.
Concentrations of credit risk
We maintain cash and cash equivalents with various financial institutions located in many countries throughout the world. At December 31, 2009, $852012, $141 million or 42%87% of our cash and cash equivalents was held in cash in various operating accounts with financial institutions throughout the world, and $116$21 million or 58%13% was held in money market accounts. The most significant of our operating accounts was our domesticHong Kong operating account which held approximately $22$26 million or 11%16% of our total cash and cash equivalents at a bank that carried an A1 ratingA+/A2/AA- ratings at December 31, 2009.2012. From a geographic standpoint, approximately $78$26 million or 39%16% was held in various domestic accounts with financial institutions and $123$136 million or 61%84% was held in various accounts outside of the U. S.U.S. with financial institutions. At December 31, 2009,2012, our short-term investments consist of $35$25 million or 40%14% of foreign government bonds, $21$136 million or 24%79% of U.S. treasuries and agencies, $12 million or 14% of municipal bonds, $9 million or 10% of auction rate securities and our auction rate securities put option, $8 million or 9%4% of corporate notes, $1.5 million or 1% of municipal bonds, and $3 million or 3%2% in time deposits.
F-10
The goal of our investment policy is to manage our investment portfolio to preserve principal and liquidity while maximizing the return on our investment portfolio through the full investment of available funds. We place our cash investments in instruments that meet credit quality standards, as specified in our corporate investment policy guidelines. These guidelines also limit the amount of credit exposure to any one issue, issuer or type of instrument. With the exception of our auction rate security from the Vermont Student Assistance Corporation, at December 31, 2009, ourOur cash equivalents and short-term investments carried ratings from the major credit rating agencies that were in accordance with our corporate investment policy. Our investment policy allows investments in the following; government and federal agency obligations, repurchase agreements (“Repos”), certificates of deposit and time deposits, corporate obligations, medium term notes and deposit notes, commercial paper including asset-backed commercial paper (“ABCP”), puttable bonds, general obligation and revenue bonds, money market funds, taxable commercial paper, corporate notes/bonds, municipal notes, municipal obligations, variable rate demand notes and tax exempt commercial paper. All such instruments must carry minimum ratings of A1/P1/F1, MIG1/VMIG1/SP1 and A2/A/A, as applicable, all of which are considered “investment grade”. Our investment policy for marketable securities requires that all securities mature in three years or less, with a weighted average maturity of no longer than 18 months with at least 10% maturing in 90 days or less. We actively monitor our investment portfolio to ensure compliance with our investment objective to preserve capital, meet liquidity requirements and maximize return on our investments. We do not require collateral or enter into master netting arrangements to mitigate our credit risk. (See Note 2 – Cash, cash equivalents, short-term and long-term investments in Notes to Consolidated Financial Statements for further discussion and analysis of our investments.)investments).
Concentration of credit risk with respect to trade accounts receivable is limited due to theour large number of customers and their dispersion across many countries and industries. The amount of sales to any individual customer did not exceed 3%7%, 4%, or 4% of revenue for the periods presented.years ended December 31, 2012, 2011, or 2010, respectively. The largest trade account receivable from any individual customer at December 31, 20092012 was approximately $1.9$15 million.
Key supplier risk
Our manufacturing processes use large volumes of high-quality components and subassemblies supplied by outside sources. Several of these components are available through sole or limited sources. Supply shortages of or quality problems in connection with some of these key components could require us to procure components from replacement suppliers, which would cause significant delays in fulfillment of orders and likely result in additional costs. In order to manage this risk, we maintain safety stock of some of these single sourced components and subassemblies and perform regular assessments of suppliers performance, grading key suppliers in critical areas such as quality and “on-time” delivery.
Revenue recognition
We derive revenue primarily from the sale/licensing of integratedsell test and measurement solutions that include hardware, and software solutions. Independent sales of application software licenses, include post contract supportand related services. In addition, training services are sold separately. The products and servicesOur sales are generally soldmade under standardized licensing andstandard sales arrangements with payment terms ranging from net 30 days in the United States to net 30 days and up to net 90120 days in some international markets. Approximately 83% of our product/license sales include both hardware and software in the customer arrangement, with a small percentage of sales including other services. We offer rights of return and standard warranties for product defects related to our products. The rights of return are generally for a period of up to 30 days after the delivery date. TheOur standard warranties cover periods ranging from 90 days to three years. We do not generally enter into contracts requiring product acceptance from the customer.
In recent years, we have made a concentrated effort to increase our revenue through the pursuit of orders with a value greater than $1.0 million. These orders often include contract terms that vary substantially from our standard terms of sale including product acceptance requirements and product performance evaluations which create uncertainty with respect to the provisionstiming of FASB ASC 985,our ability to recognize revenue from such orders. These orders may also include most favored customer pricing, significant discounts, extended payment terms and volume rebates which also creates uncertainty with respect to the timing of our ability to recognize revenue from such orders.
Sales of application software licenses include post-contract support services. Other services include customer training, customer support, and extended warranties.
We recognize revenue when persuasive evidence of an arrangement exists, delivery has occurred, the feeprice is fixed or determinable and collectability is probable. reasonably assured. Delivery is considered to have occurred when title and risk of loss have transferred to the customer. For most of our hardware and software sales, title and risk of loss transfer upon delivery. For services we recognize revenue when the service is provided, except for extended warranties for which revenue is recognized ratably over the warranty period.
F-11
We enter into certain arrangements wherein which we are obligated to deliver multiple products and/or services (“multiple elements”). In these transactions,These arrangements may include hardware, software, and services. On January 1, 2011, we allocateprospectively adopted accounting rules that changed the totalcriteria for separating consideration in multiple-deliverable arrangements. These rules changed the application of the residual method of allocation and require that arrangement consideration be allocated at the inception of an arrangement to all deliverables using the relative selling price method. Revenue allocated to each element is then recognized when the basic revenue amongrecognition criteria for that element have been met. The relative selling price method allocates any discount in the elementsarrangement proportionally to each deliverable on the basis of each deliverable’s selling price. The selling price used for each deliverable will be based on vendor specificvendor-specific objective evidence (“VSOE”) if available, third–party evidence if VSOE is not available, or estimated selling price if neither VSOE nor third-party evidence is available. The adoption of fair valuethe amended revenue recognition rules did not change the units of accounting for our revenue transactions. It also did not significantly change how we allocated the arrangement consideration to the various units of accounting or the timing of revenue. The impact of our adoption was not material to our consolidated financial statements for the years ended December 31, 2012 and 2011.
Software revenue recognition rules are applied to software sold on a stand-alone basis, and to software sold as determined bypart of a multiple element arrangement with hardware where the sales price of each elementsoftware is not required to deliver the tangible product's essential functionality. Under these rules, when sold separately.
The application of FASB ASC 985revenue recognition standards requires judgment, including whether a software arrangement includes multiple elements, and if so, whether VSOE of fair value exists for those elements. Changes to the elements in a software arrangement, the ability to identify VSOE for those elements, the fair value of the respective elements, and changes to a product’s estimated life cycle could materially impact the amount of our earned and unearned revenue. Judgment is also required to assess whether future releases of certain software represent new products or upgrades and enhancements to existing products.
Product revenue
Our product revenue is generated predominantly from the sales of measurement and automation products. Our products consist of application software and hardware components together with related driver software.
Software maintenance revenue
Software maintenance revenue is post contract customer support that provides the customer with unspecified upgrades/updates and technical support.
Shipping and handling costs
Our shipping and handling costs charged to customers are included in net sales, and the associated expense is recorded in cost of sales for all periods presented.
Warranty reserve
We offer a one-year limited warranty on most hardware products with aand extended two or three-year warrantywarranties on a subset of our hardware products, which is included in the sales price of many of our products. Provision is made for estimated future warranty costs at the time of the sale pursuant to FASB ASC 450, Contingencies (FASB ASC 450), for the estimated costs that may be incurred under the basic limited warranty. Our estimate is based on historical experience and product sales during this period.
The warranty reserve for the years ended December 31, 20092012, 2011 and 2008, respectively,2010 was as follows (in thousands):follows:
|
|
|
|
|
|
|
|
|
|
|
|
|
|
(In thousands) |
|
|
|
| ||
|
| 2012 |
| 2011 |
| 2010 |
Balance at the beginning of the period | $ | 1,271 | $ | 921 | $ | 921 |
Accruals for warranties issued during the period |
| 2,270 |
| 2,954 |
| 1,993 |
Settlements made (in cash or in kind) during the period |
| (2,106) |
| (2,604) |
| (1,993) |
Balance at the end of the period | $ | 1,435 | $ | 1,271 | $ | 921 |
F-12
| 2009 | 2008 | |||||||
| Balance at the beginning of the period | $ | 952 | $ | 750 | ||||
| Accruals for warranties issued during the period | 1,991 | 1,836 | ||||||
| Settlements made (in cash or in kind) during the period | (2,022 | ) | (1,634 | ) | ||||
| Balance at the end of the period | $ | 921 | $ | 952 | ||||
Loss contingencies
We accrue for probable losses from contingencies including legal defense costs, on an undiscounted basis in accordance with FASB ASC 450, Contingencies (FASB ASC 450), when such costs are considered probable of being incurred and are reasonably estimable. We periodically evaluate available information, both internal and external, relative to such contingencies and adjust this accrual as necessary.
Advertising expense
We expense costs of advertising as incurred. Advertising expense for the years ended December 31, 2009, 20082012, 2011 and 20072010 was $13.6$14.4 million, $19.3$14.7 million and $20.0$13.2 million, respectively.
Foreign currency translation
The functional currency for our international sales operations is the applicable local currency. The assets and liabilities of these operations are translated at the rate of exchange in effect on the balance sheet date and sales and expenses are translated at average rates. The resulting gains or losses from translation are included in a separate component of other comprehensive income. Gains and losses resulting from re-measuring monetary asset and liability accounts that are denominated in a currency other than a subsidiary’s functional currency are included in net foreign exchange gain (loss)loss and are included in net income.
Foreign currency hedging instruments
All of our derivative instruments are recognized on the balance sheet at their fair value. We currently use foreign currency forward and purchased option contracts to hedge our exposure to material foreign currency denominated receivables and forecasted foreign currency cash flows.
On the date the derivative contract is entered into, we designate the derivative as a hedge of the variability of foreign currency cash flows to be received or paid (“cash flow” hedge) or as a hedge of our foreign denominated net receivable positions (“other derivatives”). Changes in the fair value of derivatives that are designated and qualify as cash flow hedges under FASB ASC 815, Derivatives and Hedging (FASB ASC 815) and that are deemed to be highly effective are recorded in other comprehensive income. These amounts are subsequently reclassified into earnings in the period during which the hedged transaction is realized. The gain or loss on the other derivatives as well as the offsetting gain or loss on the hedged item attributable to the hedged risk is recognized in current earnings under the line item “Net foreign exchange gain (loss)”loss”. We do not enter into derivative contracts for speculative purposes.
We formally document all relationships between hedging instruments and hedged items, as well as our risk-management objective and strategy for undertaking various hedge transactions.transactions at the inception of the hedge. This process includes linking all derivatives that are designated as cash flow hedges to specific forecasted transactions. We also formally assess, both at the hedge’s inception and on an ongoing basis, whether the hedging instruments are highly effective in offsetting changes in cash flows of hedged items.
We prospectively discontinue hedge accounting if (1) it is determined that the derivative is no longer highly effective in offsetting changes in the fair value of a hedged item (forecasted transactions); or (2) the derivative is de-designated as a hedge instrument, because it is unlikely that a forecasted transaction will occur. When hedge accounting is discontinued, the derivative is sold and the resulting gains and losses are recognized immediately in earnings.
F-13
Income taxes
We account for income taxes under the asset and liability method as set forth in FASB ASC 740, Income Taxes (FASB ASC 740).method. Deferred tax assets and liabilities are recognized for the expected tax consequences of temporary differences between the tax basesbasis of assets and liabilities and their reported amounts. Valuation allowances are established when necessary to reduce deferred tax assets to amounts which are more likely than not to be realized.
Earnings per share
Basic earnings per share (“EPS”) is computed by dividing net income by the weighted average number of common shares outstanding during each period. Diluted EPS is computed by dividing net income by the weighted average number of common shares and common share equivalents outstanding (if dilutive) during each period. The number of common share equivalents, which include stock options and restricted stock units (“RSUs”), is computed using the treasury stock method.
The reconciliation of the denominators used to calculate basic EPS and diluted EPS for the years ended December 31, 2009, 20082012, 2011 and 2007, respectively,2010 are as follows (in thousands):follows:
|
|
|
|
|
|
|
|
|
|
|
|
| Years ended December 31, | ||||
(In thousands) | 2012 |
| 2011 |
| 2010 |
Weighted average shares outstanding-basic | 121,973 |
| 119,836 |
| 116,973 |
Plus: Common share equivalents |
|
|
|
|
|
Stock options, restricted stock units | 1,004 |
| 1,384 |
| 1,599 |
Weighted average shares outstanding-diluted | 122,977 |
| 121,220 |
| 118,572 |
| Years Ended December 31, | ||||||||||||
| 2009 | 2008 | 2007 | ||||||||||
| Weighted average shares outstanding-basic�� | 77,520 | 78,567 | 79,468 | |||||||||
| Plus: Common share equivalents | ||||||||||||
| Stock options, restricted stock units | 506 | 948 | 1,575 | |||||||||
| Weighted average shares outstanding-diluted | 78,026 | 79,515 | 81,043 | |||||||||
Stock optionsawards to acquire 2,711,976, 2,402,934986,503, 477,019 and 2,304,078322,896 shares for the years ended December 31, 2009, 20082012, 2011 and 2007,2010, respectively, were excluded in the computations of diluted EPS because the effect of including the stock options would have been anti-dilutive.
On January 21, 2011, our Board of Directors declared a 3 for 2 stock split which was effected as a stock dividend, and paid on February 21, 2011, to stockholders of record on February 4, 2011. All per share data and numbers of common shares, where appropriate, have been retroactively adjusted to reflect the stock split.
Stock-based compensation
Effective January 1, 2006, we adopted FASB ASC 718, CompensationWe account for stock-based compensation plans, which are more fully described in Note 11 – StockStockholders’ Equity and Stock-Based Compensation (FASB ASC 718), using a fair-value method and recognize the modified-prospective-transition method. Under this method, prior periods are not restated. Under this transition method, stock compensation cost recognized beginning January 1, 2006 includes: (a) compensation cost for all share-based payments granted prior to, but not yet vested asexpense in our Consolidated Statement of January 1, 2006, based on the grant date fair value estimated in accordance with the original provisions of FASB ASC 718, and (b) compensation cost for all share-based payments granted on or subsequent to January 1, 2006, based on the grant-date fair value estimated in accordance with the provisions of FASB ASC 718.Income.
Comprehensive income
Our comprehensive income is comprised of net income, foreign currency translation and unrealized gains and losses on forward and option contracts and securities available-for-sale. Comprehensive income for 2009, 20082012, 2011 and 20072010 was $20.1$94.5 million, $88.2$91.3 million and $111.6$94.9 million, respectively.
F-14
Recently Issued Accounting Pronouncements
In April 2009,January 2010, the FASB updated FASB ASC 820, providingFair Value Measurements and Disclosures (FASB ASC 820) that requires additional guidance for estimatingdisclosures and clarifies existing disclosures regarding fair value when the volumemeasurements. The additional disclosures include (i) transfers in and out of Levels 1 and 2 and (ii) activity in Level 3 fair value measurements. The update provides amendments that clarify existing disclosures on level of activitydisaggregation and disclosures about inputs and valuation techniques. This update is effective for interim and annual reporting periods beginning after December 15, 2009, except for the asset or liability have significantly decreased. This update also includes guidance on identifying circumstances that indicate a transaction is not orderly.disclosures about purchases, sales, issuances, and settlements in the roll forward of activity in Level 3 fair value measurements which were effective for fiscal years beginning after December 15, 2010, and for interim periods within those fiscal years. We adopted the update on AprilJanuary 1, 20092010 as required and subsequently adopted on January 1, 2011, the update surrounding disclosures on Level 3 fair value measurements and concluded it did not have a material impact on our consolidated financial position or results of operations.
In October 2009,June 2011, the FASB updated FASB ASC 605, Revenue Recognition220, Comprehensive Income (FASB ASC 605)220) that amendedgives an entity the criteriaoption to present the total of comprehensive income, the components of net income, and the components of other comprehensive income either in a single continuous statement of comprehensive income or in two separate but consecutive statements. In both choices, an entity is required to present each component of net income along with total net income, each component of other comprehensive income along with a total for separating consideration in multiple-deliverable arrangements.other comprehensive income, and a total amount for comprehensive income. The amendments establish a selling price hierarchy for determining the selling price of a deliverable. The selling price used for each deliverable will be based on vendor-specific objective evidence if available, third–party evidence if vendor-specific objective evidence isupdate does not available, or estimated selling price if neither vendor-specific objective evidence nor third-party evidence is available. The amendments will change the applicationitems that must be reported in other comprehensive income or when an item of other comprehensive income must be reclassified to net income. The update does not change the residual methodoption for an entity to present components of allocationother comprehensive income either net of related tax effects or before related tax effects, with one amount shown for the aggregate income tax expense or benefit related to the total of other comprehensive income items. The update does not affect how earnings per share is calculated or presented. The update should be applied retrospectively and require that arrangement consideration be allocated atis effective for fiscal years, and interim periods within those years, beginning after December 15, 2011. We adopted the inception of the arrangement to all deliverables using the relative selling price method. The relative selling price method allocates any discountupdate as required in the arrangement proportionally to each deliverable onfirst quarter of 2012, and concluded that the basis of each deliverable’s selling price. This update will be effective prospectively for revenue arrangements entered into or materially modified in fiscal years beginning on or after June 15, 2010. Early adoption is permitted. We are currently evaluating the requirements of this update and have not yet determined the impact on our consolidated financial statements.
As of December 31, 2009 | As of December 31, 2008 | |||||||
| Cash and cash equivalents: | ||||||||
| Cash | $ | 85,612 | $ | 100,967 | ||||
| Cash equivalents: | ||||||||
| Time deposits | — | 73,400 | ||||||
| Money market accounts | 115,853 | 55,033 | ||||||
| Total cash and cash equivalents | $ | 201,465 | $ | 229,400 | ||||
| Short-term investments: | ||||||||
| Municipal bonds | $ | 12,549 | $ | 6,220 | ||||
| Corporate bonds | 7,587 | — | ||||||
| U.S. treasuries and agencies | 21,033 | — | ||||||
| Foreign government bonds | 34,674 | — | ||||||
| Time deposits | 2,753 | — | ||||||
| Auction rate securities | 8,177 | — | ||||||
| Auction rate securities put option | 423 | — | ||||||
| Total short-term investments | 87,196 | 6,220 | ||||||
| Long-term investments: | ||||||||
| Auction rate securities | — | 6,964 | ||||||
| Auction rate securities put option | — | 1,636 | ||||||
| Other long-term investments | — | 1,900 | ||||||
| Total investments | $ | 87,196 | $ | 16,720 | ||||
| Total cash, cash equivalents and investments | $ | 288,661 | $ | 246,120 | ||||
| As of December 31, 2009 | ||||||||||||||||||||
| Adjusted Cost | Gross Unrealized Gain | Gross Unrealized Loss | Cumulative Translation Adjustment | Fair Value | ||||||||||||||||
Municipal bonds | $ | 12,491 | $ | 58 | $ | — | $ | — | $ | 12,549 | ||||||||||
Corporate bonds | 7,478 | 110 | (1 | ) | — | 7,587 | ||||||||||||||
U.S. treasuries and agencies | 21,080 | — | (47 | ) | — | 21,033 | ||||||||||||||
Foreign government bonds | 36,105 | 76 | — | (1,507 | ) | 34,674 | ||||||||||||||
Time deposits | 2,753 | — | — | — | 2,753 | |||||||||||||||
Auction rate securities | 8,600 | — | (423 | ) | — | 8,177 | ||||||||||||||
Auction rate securities put option | — | 423 | — | — | 423 | |||||||||||||||
Total investments | $ | 88,507 | $ | 667 | $ | (471 | ) | $ | (1,507 | ) | $ | 87,196 | ||||||||
| As of December 31, 2008 | ||||||||||||||||
| Adjusted Cost | Gross Unrealized Gain | Gross Unrealized Loss | Fair Value | |||||||||||||
| Municipal securities | $ | 6,199 | $ | 28 | $ | (7 | ) | $ | 6,220 | |||||||
| Auction rate securities | 8,600 | — | (1,636 | ) | 6,964 | |||||||||||
| Auction rate securities put option | — | 1,636 | — | 1,636 | ||||||||||||
| Other long-term investments | 1,900 | — | — | 1,900 | ||||||||||||
| Total investments | $ | 16,699 | $ | 1,664 | $ | (1,643 | ) | $ | 16,720 | |||||||
| As of December 31, 2009 | ||||||||
| Adjusted Cost | Fair Value | |||||||
Due in less than 1 year | $ | 44,029 | $ | 43,267 | ||||
Due in 1 to 5 years | 44,478 | 43,929 | ||||||
Total investments | $ | 88,507 | $ | 87,196 | ||||
| As of December 31, 2009 | ||||||||
Due in less than 1 year | Adjusted Cost | Fair Value | ||||||
Municipal bonds | $ | 4,103 | $ | 4,110 | ||||
Corporate bonds | 5,384 | 5,473 | ||||||
U.S. treasuries and agencies | 5,065 | 5,057 | ||||||
Foreign government bonds | 18,124 | 17,274 | ||||||
Time deposits | 2,753 | 2,753 | ||||||
Auction rate securities | 8,600 | 8,177 | ||||||
Auction rate securities put option | — | 423 | ||||||
Total investments | $ | 44,029 | $ | 43,267 | ||||
| As of December 31, 2009 | ||||||||
| Due in 1 to 5 years | Adjusted Cost | Fair Value | ||||||
Municipal bonds | $ | 8,388 | $ | 8,439 | ||||
Corporate bonds | 2,094 | 2,114 | ||||||
U.S. treasuries and agencies | 16,015 | 15,976 | ||||||
Foreign government bonds | 17,981 | 17,400 | ||||||
Time deposits | — | — | ||||||
Auction rate securities | — | — | ||||||
Auction rate securities put option | — | — | ||||||
Total investments | $ | 44,478 | $ | 43,929 | ||||
In September 2011, the FASB updated FASB ASC 350, Goodwill and Other (FASB ASC 350) that gives an entity the option to first assess qualitative factors to determine whether the existence of events or circumstances leads to a determination that it is more likely than not that the fair value measurements as we didof a reporting unit is less than its carrying amount. If, after assessing the totality of events or circumstances, an entity determines it is not have any itemsmore likely than not that were measured atthe fair value onof a nonrecurring basisreporting unit is less than its carrying amount, then performing the two-step impairment test is unnecessary. The amendments are effective for the year endedannual and interim goodwill impairment tests performed for fiscal years beginning after December 31, 2009. In April 2009, FASB ASC 820 was updated to provide additional guidance for estimating fair value when the volume and level of activity for the asset or liability have significantly decreased. The update also includes guidance on identifying circumstances that indicate a transaction is not orderly.15, 2011. We adopted the update on April 1, 2009as required in the first quarter of 2012 and concluded it did not have a material impact on our fair value measurements.
Note 2 – Cash, cash equivalents and short-term investments
The following tables presentsummarize unrealized gains and losses related to our cash, cash equivalents and short-term investments designated as available-for-sale:
|
|
|
|
|
|
|
|
|
|
|
|
|
|
|
|
|
|
|
|
|
|
(In thousands) |
| As of December 31, 2012 | ||||||||
|
|
|
| Gross |
| Gross |
| Cumulative |
|
|
|
| Adjusted Cost |
| Unrealized Gain |
| Unrealized Loss |
| Translation Adjustment |
| Fair Value |
Cash | $ | 141,340 | $ | - | $ | - | $ | - | $ | 141,340 |
Money Market Accounts |
| 20,656 |
| - |
| - |
| - |
| 20,656 |
Municipal bonds |
| 1,465 |
| 1 |
| - |
| - |
| 1,466 |
Corporate bonds |
| 8,708 |
| - |
| (20) |
| (910) |
| 7,778 |
U.S. treasuries and agencies |
| 135,953 |
| - |
| (28) |
| - |
| 135,925 |
Foreign government bonds |
| 27,947 |
| 57 |
| - |
| (2,919) |
| 25,085 |
Time deposits |
| 2,912 |
| - |
| - |
| - |
| 2,912 |
Cash, cash equivalents, and short-term investments | $ | 338,981 | $ | 58 | $ | (48) | $ | (3,829) | $ | 335,162 |
F-15
|
|
|
|
|
|
|
|
|
|
|
|
|
|
|
|
|
|
|
|
|
|
(In thousands) |
| As of December 31, 2011 | ||||||||
|
|
|
| Gross |
| Gross |
| Cumulative |
|
|
|
| Adjusted Cost |
| Unrealized Gain |
| Unrealized Loss |
| Translation Adjustment |
| Fair Value |
Cash | $ | 106,431 | $ | - | $ | - | $ | - | $ | 106,431 |
Money Market Accounts |
| 22,677 |
| - |
| - |
| - |
| 22,677 |
Municipal bonds |
| 12,381 |
| 11 |
| - |
| - |
| 12,392 |
Corporate bonds |
| 18,631 |
| - |
| (67) |
| - |
| 18,564 |
U.S. treasuries and agencies |
| 170,926 |
| 2 |
| (9) |
| - |
| 170,919 |
Foreign government bonds |
| 36,460 |
| 240 |
| (1) |
| (4,482) |
| 32,217 |
Time deposits |
| 2,912 |
| - |
| - |
| - |
| 2,912 |
Cash, cash equivalents, and short-term investments | $ | 370,418 | $ | 253 | $ | (77) | $ | (4,482) | $ | 366,112 |
The following tables summarize the contractual maturities of our short-term investments designated as available-for-sale:
|
|
|
|
|
|
|
|
|
|
(In thousands) |
| As of December 31, 2012 | ||
|
| Adjusted Cost |
| Fair Value |
Due in less than 1 year | $ | 65,586 | $ | 62,831 |
Due in 1 to 5 years |
| 111,399 |
| 110,335 |
Total available-for-sale debt securities | $ | 176,985 | $ | 173,166 |
|
|
|
|
|
Due in less than 1 year |
| Adjusted Cost |
| Fair Value |
Corporate bonds | $ | - | $ | - |
U.S. treasuries and agencies |
| 46,458 |
| 46,449 |
Foreign government bonds |
| 16,216 |
| 13,470 |
Time deposits |
| 2,912 |
| 2,912 |
Total available-for-sale debt securities | $ | 65,586 | $ | 62,831 |
|
|
|
|
|
Due in 1 to 5 years |
| Adjusted Cost |
| Fair Value |
Municipal bonds | $ | 1,465 | $ | 1,466 |
Corporate bonds |
| 8,708 |
| 7,778 |
U.S. treasuries and agencies |
| 89,495 |
| 89,476 |
Foreign government bonds |
| 11,731 |
| 11,615 |
Total available-for-sale debt securities | $ | 111,399 | $ | 110,335 |
Note 3 – Fair value measurements
We define fair value to be the price that would be received to sell an asset or paid to transfer a liability in an orderly transaction between market participants at the measurement date. When determining the fair value measurements for assets and liabilities required or permitted to be recorded at fair value, we consider the principal or most liquid market and assumptions that market participants would use when pricing the asset or liability.
We follow a fair value hierarchy that prioritizes the inputs to valuation techniques used to measure fair value into three broad levels. The level in the fair value hierarchy within which the fair value measurement falls is determined based on the lowest level input that is significant to the fair value measurement. The three values of the fair value hierarchy are the following:
F-16
Level 1 – Quoted prices in active markets for identical assets or liabilities
Level 2 – Inputs other than quoted prices included within Level 1 that are observable for the asset or liability, either directly or indirectly
Level 3 – Inputs that are not based on observable market data
Assets and liabilities measured at fair value on a recurring basis and are categorized usingsummarized below:
|
|
|
|
|
|
|
|
|
|
|
|
|
|
|
|
|
|
(In thousands) |
| Fair Value Measurements at Reporting Date Using | ||||||
Description |
| December 31, 2012 |
| Quoted Prices in Active Markets for Identical Assets (Level 1) |
| Significant Other Observable Inputs (Level 2) |
| Significant Unobservable Inputs (Level 3) |
Assets |
|
|
|
|
|
|
|
|
Cash and cash equivalents available for sale: |
|
|
|
|
|
|
|
|
Money Market Funds | $ | 20,656 | $ | 20,656 | $ | - | $ | - |
U.S. treasuries and agencies |
| - |
| - |
| - |
| - |
Short-term investments available for sale: |
|
|
|
|
|
|
|
|
Municipal bonds |
| 1,466 |
| - |
| 1,466 |
| - |
Corporate bonds |
| 7,778 |
| - |
| 7,778 |
| - |
U.S. treasuries and agencies |
| 135,925 |
| - |
| 135,925 |
| - |
Foreign government bonds |
| 25,085 |
| - |
| 25,085 |
| - |
Time deposits |
| 2,912 |
| 2,912 |
| - |
| - |
Derivatives |
| 4,246 |
| - |
| 4,246 |
| - |
Total Assets | $ | 198,068 | $ | 23,568 | $ | 174,500 | $ | - |
|
|
|
|
|
|
|
|
|
Liabilities |
|
|
|
|
|
|
|
|
Derivatives | $ | (2,804) | $ | - | $ | (2,804) | $ | - |
Total Liabilities | $ | (2,804) | $ | - | $ | (2,804) | $ | - |
|
|
|
|
|
|
|
|
|
|
|
|
|
|
|
|
|
|
(In thousands) |
| Fair Value Measurements at Reporting Date Using | ||||||
Description |
| December 31, 2011 |
| Quoted Prices in Active Markets for Identical Assets (Level 1) |
| Significant Other Observable Inputs (Level 2) |
| Significant Unobservable Inputs (Level 3) |
Assets |
|
|
|
|
|
|
|
|
Cash and cash equivalents available for sale: |
|
|
|
|
|
|
|
|
Money Market Funds | $ | 22,677 | $ | 22,677 | $ | - | $ | - |
U.S. Treasuries and Agencies |
| 13,500 |
| - |
| 13,500 |
| - |
Short-term investments available for sale: |
|
|
|
|
|
|
|
|
Municipal bonds |
| 12,392 |
| - |
| 12,392 |
| - |
Corporate bonds |
| 18,564 |
| - |
| 18,564 |
| - |
U.S. treasuries and agencies |
| 157,419 |
| - |
| 157,419 |
| - |
Foreign government bonds |
| 32,217 |
| - |
| 32,217 |
| - |
Time deposits |
| 2,912 |
| 2,912 |
| - |
| - |
Derivatives |
| 4,297 |
| - |
| 4,297 |
| - |
Total Assets | $ | 263,978 | $ | 25,589 | $ | 238,389 | $ | - |
|
|
|
|
|
|
|
|
|
Liabilities |
|
|
|
|
|
|
|
|
Derivatives | $ | (4,542) | $ | - | $ | (4,542) | $ | - |
Total Liabilities | $ | (4,542) | $ | - | $ | (4,542) | $ | - |
F-17
We value our available-for-sale short term investments based on pricing from third party pricing vendors, who may use quoted prices in active markets for identical assets (Level 1 inputs) or inputs other than quoted prices that are observable either directly or indirectly (Level 2 inputs) in determining fair value. We classify all of our fixed income available-for-sale securities as having Level 2 inputs. The valuation techniques used to measure the fair value hierarchy. The fair value hierarchy has three levels based onof our financial instruments having Level 2 inputs were derived from non-binding market consensus prices that are corroborated by observable market data, quoted market prices for similar instruments, or pricing models, such as discounted cash flow techniques. We believe these sources reflect the reliabilitycredit risk associated with each of the inputs used to determine fair value.
| Fair Value Measurements at Reporting Date Using | ||||||||||||||||
Description | December 31, 2009 | Quoted Prices in Active Markets for Identical Assets (Level 1) | Significant Other Observable Inputs (Level 2) | Significant Unobservable Inputs (Level 3) | ||||||||||||
| Assets | ||||||||||||||||
| Money Market Funds | $ | 115,853 | $ | 115,853 | $ | — | $ | — | ||||||||
| Short-term investments available-for-sale | 87,196 | 78,596 | — | 8,600 | ||||||||||||
| Derivatives | 11,016 | — | 11,016 | — | ||||||||||||
| Total Assets | $ | 214,065 | $ | 194,449 | $ | 11,016 | $ | 8,600 | ||||||||
| Liabilities | ||||||||||||||||
| Derivatives | $ | (318 | ) | $ | — | $ | (318 | ) | $ | — | ||||||
| Total Liabilities | $ | (318 | ) | $ | — | $ | (318 | ) | $ | — | ||||||
Fair Value Measurements Using Significant Unobservable Inputs (Level 3) | ||||
Short-term investments available-for-sale | ||||
| Beginning Balance, January 1, 2008 | $ | 8,600 | ||
| Total gains (realized/unrealized) | ||||
| Included in earnings | 423 | |||
| Included in other comprehensive income | — | |||
| Total losses (realized/unrealized) | ||||
| Included in earnings | (423 | ) | ||
| Included in other comprehensive income | — | |||
| Purchases, issuances and settlements | — | |||
| Transfer in and/or out of Level 3 | — | |||
| Ending Balance, December 31, 2009 | $ | 8,600 | ||
The amount of total gains or (losses) for the period included in earnings (or changes in net assets) attributable to the change in unrealized gains or losses relating to assets still held at the reporting date | $ | — | ||
Derivatives include foreign currency forward and option contracts. Our foreign currency forward contracts are valued using an income approach (Level 2) based on the spot rate less the contract rate multiplied by the notional amount. Our foreign currency option contracts are valued using a market approach based on the quoted market prices which are derived from observable inputs including current and future spot rates, interest rate spreads as well as quoted market prices of identicalsimilar instruments.
Our foreign government bonds consist of German government sovereign debt denominated in Euro with maximum maturities of 24 months. Our short-term investments do not involve sovereign debt from any other country in Europe.
We did not makehave any changes to our valuation techniques or related inputs.
The carrying value of net accounts receivable and accounts payable contained in the Consolidated Balance Sheets approximates fair value.
We recognize all of theirour derivative instruments as either assets or liabilities in the statementour statements of financial position at fair value. The accounting for changes in the fair value (i.e., gains or losses) of a derivative instrument depends on whether it has been designated and qualifies as part of a hedging relationship and further, on the type of hedging relationship. For those derivative instruments that are designated and qualify as hedging instruments, a company mustwe designate the hedging instrument, based upon the exposure being hedged, as a fair value hedge, cash flow hedge, or a hedge of a net investment in a foreign operation.
We have operations in over 40 countries. Sales outside of the Americas as a percentageaccounted for 60% of consolidated sales were 57% and 57%our revenues for each of the years ended December 31, 20092012 and 2008, respectively.2011. Our activities expose us to a variety of market risks, including the effects of changes in foreign currency exchange rates. These financial risks are monitored and managed by us as an integral part of our overall risk management program.
We maintain a foreign currency risk management strategy that uses derivative instruments (foreign currency forward and purchased option contracts) to help protect our earnings and cash flows from fluctuations caused by the volatility in currency exchange rates. Movements in foreign currency exchange rates pose a risk to our operations and competitive position, since exchange rate changes may affect our profitability and cash flow, and the business or pricing strategies of our non-U.S. based competitors.
The vast majority of our foreign sales are denominated in the customers’ local currency. We purchase foreign currency forward and option contracts as hedges of forecasted sales that are denominated in foreign currencies and as hedges of foreign currency denominated receivables. These contracts are entered into to help protect against the risk that the eventual dollar-net-cash inflows resulting from such sales or firm commitments will be adversely affected by changes in exchange rates. We also purchase foreign currency forward contracts as hedges of forecasted expenses that are denominated in foreign currencies. These contracts are entered into to help protect against the risk that the eventual dollar-net-cash outflows resulting from foreign currency operating and cost of revenue expenses will be adversely affected by changes in exchange rates.
We designate foreign currency forward and purchased option contracts as cash flow hedges of forecasted revenues or forecasted expenses. In addition, we hedge our foreign currency denominated balance sheet exposures using foreign currency forward contracts. These derivativescontracts that are not designated as hedging instruments under FASB ASC 815.instruments. None of our derivative instruments contain a credit-risk-related contingent feature.
F-18
Cash flow hedges
To help protect against the reduction in value caused by a fluctuation in foreign currency exchange rates of forecasted foreign currency cash flows resulting from international sales over the next one to two years, we have instituted a foreign currency cash flow hedging program. We hedge portions of our forecasted revenue and forecasted expenses denominated in foreign currencies with forward and purchased option contracts. For forward contracts, when the dollar strengthens significantly against the foreign currencies, the change in the present value of future foreign currency cash flows may be offset by the change in the fair value of the forward contracts designated as hedges. For option contracts, when the dollar strengthens significantly against the foreign currencies, the change in the present value of future foreign currency cash flows may be offset by the change in the fair value of the option contracts net of the premium paid designated as hedges. Our foreign currency purchased option contracts are purchased “at-the-money” or “out-of-the-money”. We purchase foreign currency forward and option contracts for up to 100% of our forecasted exposures in selected currencies (primarily in Euro, Japanese yen, British pound sterling, South Korean won and Hungarian forint) and limit the duration of these contracts to 40 months or less.
For derivative instruments that are designated and qualify as a cash flow hedge, the effective portion of the gain or loss on the derivative is reported as a component of accumulated other comprehensive income (“OCI”) and reclassified into earnings in the same line item (net sales, operating expenses, or cost of sales) associated with the forecasted transaction and in the same period or periods during which the hedged transaction affects earnings. Gains and losses on the derivative representing either hedge ineffectiveness or hedge components excluded from the assessment of effectiveness are recognized in current earnings or expenses during the current period and are classified as a component of “net foreign exchange gain (loss)”loss”. Hedge effectiveness of foreign currency forwards and purchased option contracts designated as cash flow hedges are measured by comparing the hedging instrument’s cumulative change in fair value from inception to maturity to the forecasted transaction’s terminal value.
We held forward contracts with athe following notional amountamounts:
|
|
|
|
|
|
|
|
|
|
(In thousands) |
| US Dollar Equivalent | ||
|
| As of December 31, 2012 |
| As of December 31, 2011 |
Euro | $ | 84,770 | $ | 60,992 |
Japanese yen |
| 42,209 |
| 43,569 |
Korean won |
| - |
| 3,309 |
Hungarian forint |
| 36,005 |
| 28,189 |
Total forward contracts notional amount | $ | 162,984 | $ | 136,059 |
The contracts in the foregoing table had contractual maturities of $28.6 million dollar equivalent of Euro, $4.0 million dollar equivalent of British pound sterling, $24.4 million dollar equivalent of Japanese yen, and $17.8 million dollar equivalent of Hungarian forint36 months or less at December 31, 2009. These contracts are for terms of up to 24 months. 2012 and December 31, 2011.
At December 31, 2008, we held forward contracts with a notional amount of $54.9 million dollar equivalent of Euro, $6.2 million dollar equivalent of British pound sterling, $18.9 million dollar equivalent of Japanese yen, $4.7 million dollar equivalent of South Korean won and $21.7 million dollar equivalent of Hungarian forint.
We did not record any gains or losses due to the ineffectiveness offrom our hedges during the year ended December 31, 2008.
Other Derivatives
Other derivatives not designated as hedging instruments under FASB ASC 815 consist primarily of foreign currency forward contracts that we use to hedge our foreign denominated net receivable or net payable positions to protect against the change in value caused by a fluctuation in foreign currency exchange rates. We typically attempt to hedge up to 90% of our outstanding foreign denominated net receivables or net payables and typically limit the duration of these foreign currency forward contracts to approximately 90120 days. The gain or loss on the derivatives as well as the offsetting gain or loss on the hedge item attributable to the hedged risk is recognized in current earnings under the line item “net foreign exchange gain (loss)”loss”. As of December 31, 20092012 and December 31, 2008,2011, we held foreign currency forward contracts with a notional amount of $45.2$69.0 million and $67.1$53.8 million, respectively.
The following table presentstables present the fair value of derivative instruments on our Consolidated Balance Sheets and the effect of derivative instruments on our Consolidated Statements of Income.
F-19
Fair Values of Derivative Instruments (in thousands):Instruments:
|
|
|
|
|
|
|
|
|
|
|
|
|
|
|
|
| Asset Derivatives | ||||||
| December 31, 2012 |
| December 31, 2011 | ||||
(In thousands) |
|
|
|
|
|
|
|
| Balance Sheet Location |
| Fair Value |
| Balance Sheet Location |
| Fair Value |
Derivatives designated as hedging instruments |
|
|
|
|
|
|
|
Foreign exchange contracts - ST forwards | Prepaid expenses and other current assets | $ | 2,956 |
| Prepaid expenses and other current assets | $ | 2,500 |
|
|
|
|
|
|
|
|
Foreign exchange contracts - LT forwards | Other long-term assets |
| 1,046 |
| Other long-term assets |
| 190 |
Total derivatives designated as hedging instruments |
| $ | 4,002 |
|
| $ | 2,690 |
|
|
|
|
|
|
|
|
Derivatives not designated as hedging instruments |
|
|
|
|
|
|
|
|
|
|
|
|
|
|
|
Foreign exchange contracts - ST forwards | Prepaid expenses and other current assets | $ | 244 |
| Prepaid expenses and other current assets | $ | 1,607 |
Total derivatives not designated as hedging instruments |
| $ | 244 |
|
| $ | 1,607 |
|
|
|
|
|
|
|
|
Total derivatives |
| $ | 4,246 |
|
| $ | 4,297 |
|
|
|
|
|
|
|
|
|
|
|
|
|
|
|
|
| Liability Derivatives | ||||||
| December 31, 2012 |
| December 31, 2011 | ||||
(In thousands) |
|
|
|
|
|
|
|
| Balance Sheet Location |
| Fair Value |
| Balance Sheet Location |
| Fair Value |
Derivatives designated as hedging instruments |
|
|
|
|
|
|
|
Foreign exchange contracts - ST forwards | Accrued expenses and other liabilities | $ | (1,292) |
| Accrued expenses and other liabilities | $ | (2,007) |
|
|
|
|
|
|
|
|
Foreign exchange contracts - LT forwards | Other long-term liabilities |
| (798) |
| Other long-term liabilities |
| (1,770) |
Total derivatives designated as hedging instruments |
| $ | (2,090) |
|
| $ | (3,777) |
|
|
|
|
|
|
|
|
Derivatives not designated as hedging instruments |
|
|
|
|
|
|
|
|
|
|
|
|
|
|
|
Foreign exchange contracts - ST forwards | Accrued expenses and other liabilities | $ | (714) |
|
| $ | (765) |
Total derivatives not designated as hedging instruments |
| $ | (714) |
|
| $ | (765) |
|
|
|
|
|
|
|
|
Total derivatives |
| $ | (2,804) |
|
| $ | (4,542) |
| In thousands | Asset Derivatives | |||||||||
| December 31, 2009 | December 31, 2008 | |||||||||
| Balance Sheet Location | Fair Value | Balance Sheet Location | Fair Value | |||||||
Derivatives designated as hedging instruments under FASB ASC 815 | ||||||||||
| Foreign exchange contracts – ST forwards | Prepaid expenses and other current assets | $ | 7,947 | Prepaid expenses and other current assets | $ | 5,260 | ||||
| Foreign exchange contracts – LT forwards | Other long-term assets | 274 | Other long-term assets | 2,654 | ||||||
| Foreign exchange contracts – ST options | Prepaid expenses and other current assets | 1,821 | Prepaid expenses and other current assets | 5,705 | ||||||
| Foreign exchange contracts – LT options | Other long-term assets | — | Other long-term assets | 3,838 | ||||||
Total derivatives designated as hedging instruments under FASB ASC 815 | $ | 10,042 | $ | 17,457 | ||||||
Derivatives not designated as hedging instruments under FASB ASC 815 | ||||||||||
| Foreign exchange contracts – ST forwards | Prepaid expenses and other current assets | $ | 974 | Prepaid expenses and other current assets | $ | 2,745 | ||||
Total derivatives not designated as hedging instruments under FASB ASC 815 | $ | 974 | $ | 2,745 | ||||||
| Total derivatives | $ | 11,016 | $ | 20,202 | ||||||
| Liability Derivatives | ||||||||||
| December 31, 2009 | December 31, 2008 | |||||||||
| Balance Sheet Location | Fair Value | Balance Sheet Location | Fair Value | |||||||
Derivatives designated as hedging instruments under FASB ASC 815 | ||||||||||
| Foreign exchange contracts – ST forwards | Accrued expenses and other liabilities | $ | — | Accrued expenses and other liabilities | $ | (1,803 | ) | |||
| Foreign exchange contracts – LT forwards | Other long-term liabilities | — | Other long-term liabilities | — | ||||||
| Foreign exchange contracts – ST options | Accrued expenses and other liabilities | — | Accrued expenses and other liabilities | — | ||||||
| Foreign exchange contracts – LT options | Other long-term liabilities | — | Other long-term liabilities | — | ||||||
Total derivatives designated as hedging instruments under FASB ASC 815 | $ | — | $ | (1,803 | ) | |||||
Derivatives not designated as hedging instruments under FASB ASC 815 | ||||||||||
| Foreign exchange contracts – ST forwards | Accrued expenses and other liabilities | $ | (318 | ) | Accrued expenses and other liabilities | $ | (3,280 | ) | ||
Total derivatives not designated as hedging instruments under FASB ASC 815 | $ | (318 | ) | $ | (3,280 | ) | ||||
| Total derivatives | $ | (318 | ) | $ | (5,083 | ) | ||||
The following table showstables present the effect of derivative instruments on ourthe Consolidated Statements of Income for the yearyears ended December 31, 2009 (in thousands):2012 and 2011, respectively:
|
|
|
|
|
|
|
|
|
|
|
|
|
|
|
|
|
|
December 31, 2012 | ||||||||
(In thousands) | ||||||||
Derivatives in Cash Flow Hedging Relationship |
| Gain or (Loss) Recognized in OCI on Derivative (Effective Portion) | Location of Gain or (Loss) Reclassified from Accumulated OCI into Income (Effective Portion) |
| Gain or (Loss) Reclassified from Accumulated OCI into Income (Effective Portion) | Location of Gain or (Loss) Recognized in Income on Derivative (Ineffective Portion) |
| Gain or (Loss) Recognized in Income on Derivative (Ineffective Portion) |
Foreign exchange contracts - forwards and options | $ | 30 | Net sales | $ | 2,852 | Net foreign exchange gain (loss) | $ | - |
|
|
|
|
|
|
|
|
|
Foreign exchange contracts - forwards and options |
| 2,036 | Cost of sales |
| 402 | Net foreign exchange gain (loss) |
| - |
|
|
|
|
|
|
|
|
|
Foreign exchange contracts - forwards and options |
| 1,086 | Operating expenses |
| 259 | Net foreign exchange gain (loss) |
| - |
Total | $ | 3,152 |
| $ | 3,513 |
| $ | - |
F-20
Derivatives in FASB ASC 815 Cash Flow Hedging Relationship | Amount of Gain or (Loss) Recognized in OCI on Derivative (Effective Portion) (in thousands) | Location of Gain or (Loss) Reclassified from Accumulated OCI into Income (Effective Portion) | Amount of Gain or (Loss) Reclassified from Accumulated OCI into Income (Effective Portion) (in thousands) | Location of Gain or (Loss) Recognized in Income on Derivative (Ineffective Portion and Amount Excluded from Effectiveness Testing) | Amount of Gain or (Loss) Recognized in Income on Derivative (Ineffective Portion and Amount Excluded from Effectiveness Testing) | |||||||||
| 2009 | 2009 | 2009 | ||||||||||||
| Foreign exchange contracts – forwards and options | $ | (6,304 | ) | Net sales | $ | 1,399 | Net foreign exchange gain (loss) | $ | 1,132 | |||||
| Foreign exchange contracts – forwards and options | 2,055 | Cost of sales | (74 | ) | Net foreign exchange gain (loss) | (41 | ) | |||||||
Foreign exchange contracts – forwards and options | 1,427 | Operating expenses | 517 | Net foreign exchange gain (loss) | 81 | |||||||||
Total | $ | (2,822 | ) | $ | 1,842 | $ | 1,172 | |||||||
|
|
|
|
|
|
|
|
|
|
|
|
|
|
|
|
|
|
December 31, 2011 | ||||||||
(In thousands) | ||||||||
Derivatives in Cash Flow Hedging Relationship |
| Gain or (Loss) Recognized in OCI on Derivative (Effective Portion) | Location of Gain or (Loss) Reclassified from Accumulated OCI into Income (Effective Portion) |
| Gain or (Loss) Reclassified from Accumulated OCI into Income (Effective Portion) | Location of Gain or (Loss) Recognized in Income on Derivative (Ineffective Portion) |
| Gain or (Loss) Recognized in Income on Derivative (Ineffective Portion) |
Foreign exchange contracts - forwards and options | $ | 3,980 | Net sales | $ | (3,855) | Net foreign exchange gain (loss) | $ | - |
|
|
|
|
|
|
|
|
|
Foreign exchange contracts - forwards and options |
| (2,889) | Cost of sales |
| 1,378 | Net foreign exchange gain (loss) |
| - |
|
|
|
|
|
|
|
|
|
Foreign exchange contracts - forwards and options |
| (1,396) | Operating expenses |
| 556 | Net foreign exchange gain (loss) |
| - |
Total | $ | (305) |
| $ | (1,921) |
| $ | - |
Derivatives not Designated as Hedging Instruments under FASB ASC 815 | Location of Gain (Loss) Recognized in Income on Derivative | Amount of Gain (Loss) Recognized in Income on Derivative | |||
| 2009 | |||||
| Foreign exchange contracts – forwards | Net foreign exchange gain/(loss) | $ | (1,669 | ) | |
| Total | $ | (1,669 | ) | ||
|
|
|
|
|
|
(In thousands) |
|
|
|
|
|
Derivatives not Designated as Hedging Instruments | Location of Gain (Loss) Recognized in Income |
| Amount of Gain (Loss) Recognized in Income |
| Amount of Gain (Loss) Recognized in Income |
|
|
| December 31, 2012 |
| December 31, 2011 |
Foreign exchange contracts - forwards | Net foreign exchange (loss)/gain | $ | (2,076) | $ | 951 |
|
|
|
|
|
|
Total |
| $ | (2,076) | $ | 951 |
Note 5 – Inventories
Inventories, net at December 31, 2012 and December 31, 2011, consist of the following (in thousands):following:
|
|
|
|
|
|
|
|
|
|
(In thousands) |
| December 31, 2012 |
| December 31, 2011 |
|
|
|
|
|
Raw materials | $ | 78,244 | $ | 56,139 |
Work-in-process |
| 8,566 |
| 5,708 |
Finished goods |
| 83,180 |
| 70,148 |
| $ | 169,990 | $ | 131,995 |
F-21
| December 31, | ||||||||
| 2009 | 2008 | |||||||
| Raw materials | $ | 42,121 | $ | 48,004 | ||||
| Work-in-process | 2,042 | 4,150 | ||||||
| Finished goods | 42,352 | 55,204 | ||||||
| $ | 86,515 | $ | 107,358 | |||||
Note 6 – Property and equipment
Property and equipment at December 31, 2012 and December 31, 2011, consist of the following (in thousands):following:
|
|
|
|
|
|
|
|
|
|
|
| December 31, |
| December 31, |
(In thousands) |
| 2012 |
| 2011 |
|
|
|
|
|
Land | $ | 27,751 | $ | 23,730 |
Buildings |
| 203,879 |
| 156,317 |
Furniture and equipment |
| 240,413 |
| 206,557 |
|
| 472,043 |
| 386,604 |
Accumulated depreciation |
| (222,322) |
| (196,456) |
| $ | 249,721 | $ | 190,148 |
| December 31, | ||||||||
| 2009 | 2008 | |||||||
| Land | $ | 17,076 | $ | 7,210 | ||||
| Buildings | 138,367 | 136,802 | ||||||
| Furniture and equipment | 154,558 | 144,979 | ||||||
| 310,001 | 288,991 | |||||||
| Accumulated depreciation | (156,736 | ) | (134,514 | ) | ||||
| $ | 153,265 | $ | 154,477 | |||||
Depreciation expense for the years ended December 31, 2009, 20082012, 2011 and 2007,2010, was $22.3$25.9 million, $20.9$21.6 million and $22.2$21.0 million, respectively.
Intangibles at December 31, 20092012 and 2008 areDecember 31, 2011 were as follows:
|
|
|
|
|
|
|
|
|
|
|
|
|
|
|
|
|
|
|
|
|
|
|
|
|
|
(In thousands) |
| December 31, 2012 |
| December 31, 2011 | ||||||||
|
| Gross Carrying Amount |
| Accumulated Amortization |
| Net Carrying Amount |
| Gross Carrying Amount |
| Accumulated Amortization |
| Net Carrying Amount |
Capitalized software development costs | $ | 45,064 | $ | (23,450) | $ | 21,614 | $ | 44,198 | $ | (20,718) | $ | 23,480 |
Acquired technology |
| 89,876 |
| (42,562) |
| 47,314 |
| 67,918 |
| (32,210) |
| 35,708 |
Patents |
| 24,046 |
| (9,398) |
| 14,648 |
| 21,875 |
| (7,992) |
| 13,883 |
Other |
| 27,421 |
| (17,084) |
| 10,337 |
| 24,614 |
| (13,819) |
| 10,795 |
| $ | 186,407 | $ | (92,494) | $ | 93,913 | $ | 158,605 | $ | (74,739) | $ | 83,866 |
| 2009 | 2008 | |||||||||||||||||||||||
Gross Carrying Amount | Accumulated Amortization | Net Carrying Amount | Gross Carrying Amount | Accumulated Amortization | Net Carrying Amount | |||||||||||||||||||
| Capitalized software development costs | $ | 38,928 | $ | (20,455 | ) | $ | 18,473 | $ | 25,610 | $ | (11,344 | ) | $ | 14,266 | ||||||||||
Acquired technology | 28,022 | (20,967 | ) | 7,055 | 27,503 | (16,804 | ) | 10,699 | ||||||||||||||||
Patents | 19,033 | (5,377 | ) | 13,656 | 16,068 | (4,506 | ) | 11,562 | ||||||||||||||||
Other | 12,577 | (8,371 | ) | 4,206 | 11,401 | (6,013 | ) | 5,388 | ||||||||||||||||
| $ | 98,560 | $ | (55,170 | ) | $ | 43,390 | $ | 80,582 | $ | (38,667 | ) | $ | 41,915 | |||||||||||
Software development costs capitalized during 2009, 20082012, 2011 and 20072010 were $13.3$12.2 million, $9.5$12.6 million and $8.3$16.5 million, respectively, and related amortization was $9.1$14.1 million, $10.3$13.4 million and $8.9$10.7 million, respectively. Included in these capitalized costs for the years ended December 31, 2009, 2008,2012, 2011 and 20072010, were costs related to stock based compensation of $734,000, $451,000$519,000, $539,000 and $422,000,$719,000, respectively. We have conformed the prior year balances related to capitalized software development costs to the current year presentation, which is net of fully amortized assets.
Amortization of capitalized software development costs is computed on an individual product basis for those products available for market and is recognized based on the product’s estimated economic life, generally three years. Acquired intangible assets which include acquired technology and other are amortized over their useful lives, which range from three to eight years. Patents are amortized using the straight-line method over their estimated period of benefit, generally ten to seventeen years. Total intangible assets amortization expenses were $16.5$28.1 million, $16.2$25.5 million and $14.4$17.9 million for the years ended December 31, 2009, 20082012, 2011 and 2007,2010, respectively.
Capitalized software development costs, acquired technology, patents and other havehad weighted-average useful lives of 2.21.5 years, 1.82.5 years, 5.34.0 years, and 1.82.0 years, respectively, as of December 31, 2009.2012. The estimated future amortization expense related to intangible assets as of December 31, 2009 is2012 was as follows:
|
|
|
|
|
|
|
| Amount |
|
| (In thousands) |
2013 | $ | 34,892 |
2014 |
| 21,787 |
2015 |
| 15,445 |
2016 |
| 9,220 |
2017 |
| 4,928 |
Thereafter |
| 7,641 |
| $ | 93,913 |
F-22
Amount (in thousands) | ||||
| 2010 | $ | 18,097 | ||
| 2011 | 12,986 | |||
| 2012 | 7,187 | |||
| 2013 | 1,868 | |||
| 2014 | 1,186 | |||
| Thereafter | 2,066 | |||
| $ | 43,390 | |||
The estimated amortization expense of acquisition intangibles in future years will be recordedoverall increase in our acquired technology and other intangible assets can be attributed to our acquisitions in 2012. See Note 16 – Acquisitions of Notes to Consolidated Financial Statements of Income as follows (in thousands):
Fiscal Year | Cost of Sales | Acquisition related costs and amortization, net | Total | |||||||||
| 2010 | $ | 2,701 | $ | 369 | $ | 3,070 | ||||||
| 2011 | 2,160 | 221 | 2,381 | |||||||||
| 2012 | 1,126 | 206 | 1,332 | |||||||||
| 2013 | 87 | 75 | 162 | |||||||||
| Thereafter | — | — | — | |||||||||
| Total | $ | 6,074 | $ | 871 | $ | 6,945 | ||||||
Note 8 – Goodwill
The carrying amount of goodwill for 20082011 and 20092012 are as follows:
Amount | ||
(In thousands) | ||
Balance as of December 31, 2010 | $ | 70,278 |
Acquisitions/purchase accounting adjustment | 60,728 | |
Foreign currency translation impact | (259) | |
Balance as of December 31, 2011 | $ | 130,747 |
Purchase price adjustments | (1,623) | |
Acquisitions | 17,987 | |
Foreign currency translation impact | 147 | |
Balance as of December 31, 2012 | $ | 147,258 |
Amount (in thousands) | ||||
| Balance as of December 31, 2007 | $ | 54,111 | ||
| Acquisitions/purchase accounting adjustments | 10,818 | |||
| Divestitures | — | |||
| Foreign currency translation impact | (368 | ) | ||
| Balance as of December 31, 2008 | $ | 64,561 | ||
| Acquisitions/purchase accounting adjustments | — | |||
| Divestitures | — | |||
| Foreign currency translation impact | 218 | |||
| Balance as of December 31, 2009 | $ | 64,779 | ||
The excess purchase price over the fair value of assets acquired is recorded as goodwill. As we have one operating segment, we allocate goodwill to one reporting unit for goodwill impairment testing. In accordance with FASB ASC 350, goodwillGoodwill is tested for impairment on an annual basis, and between annual tests if indicators of potential impairment exist, using a fair-value-based approach based on the market capitalization of the reporting unit. Our annual impairment test was performed as of February 28, 2009.29, 2012. No impairment of goodwill has beenwas identified during the period presented.2012 and 2011. Goodwill is deductible for tax purposes in certain jurisdictions.
The components of income before income taxes are as follows (in thousands):follows:
|
|
|
|
|
|
|
|
|
|
|
|
|
|
(In thousands) |
| Years Ended December 31, | ||||
|
| 2012 |
| 2011 |
| 2010 |
Domestic | $ | 24,100 | $ | 6,488 | $ | 31,801 |
Foreign |
| 90,737 |
| 104,646 |
| 96,311 |
| $ | 114,837 | $ | 111,134 | $ | 128,112 |
| Years Ended December 31, | ||||||||||||
| 2009 | 2008 | 2007 | ||||||||||
| Domestic | $ | 34,953 | $ | 15,921 | $ | 31,685 | ||||||
| Foreign | 15,292 | 82,216 | 81,742 | |||||||||
| $ | 50,245 | $ | 98,137 | $ | 113,427 | |||||||
The provision for income taxes charged to operations is as follows (in thousands):follows:
|
|
|
|
|
|
|
|
|
|
|
|
|
|
(In thousands) |
| Years Ended December 31, | ||||
|
| 2012 |
| 2011 |
| 2010 |
Current tax expense: |
|
|
|
|
|
|
U.S. federal | $ | 24,538 | $ | 19,381 | $ | 14,605 |
State |
| 1,217 |
| 1,180 |
| 779 |
Foreign |
| 10,544 |
| 8,568 |
| 3,752 |
Total current | $ | 36,299 | $ | 29,129 | $ | 19,136 |
Deferred tax expense (benefit): |
|
|
|
|
|
|
U.S. federal | $ | (10,305) | $ | (12,790) | $ | 1,545 |
State |
| 53 |
| (234) |
| (39) |
Foreign |
| (1,347) |
| 957 |
| (1,646) |
Total deferred | $ | (11,599) | $ | (12,067) | $ | (140) |
Change in valuation allowance |
| - |
| - |
| - |
Total provision | $ | 24,700 | $ | 17,062 | $ | 18,996 |
F-23
| Years Ended December 31, | ||||||||||||
| 2009 | 2008 | 2007 | ||||||||||
| Current tax expense: | ||||||||||||
| U.S. federal | $ | 3,117 | $ | 14,631 | $ | 15,957 | ||||||
| State | 136 | 1,391 | 1,155 | |||||||||
| Foreign | 13,760 | 18,910 | 9,925 | |||||||||
| Total current | 17,013 | 34,932 | 27,037 | |||||||||
| Deferred tax expense (benefit): | ||||||||||||
| U.S. federal | 9,920 | (11,008 | ) | 628 | ||||||||
| State | 387 | (373 | ) | (156 | ) | |||||||
| Foreign | (2,864 | ) | (1,570 | ) | (2,783 | ) | ||||||
| Total deferred | 7,443 | (12,951 | ) | (2,311 | ) | |||||||
| Change in valuation allowance | 8,704 | (8,671 | ) | (18,332 | ) | |||||||
| Total provision | $ | 33,160 | $ | 13,310 | $ | 6,394 | ||||||
Deferred tax liabilities (assets) at December 31, 20092012 and 20082011 as follows (in thousands):follows:
|
|
|
|
|
|
|
|
|
|
(In thousands) |
| December 31, | ||
|
| 2012 |
| 2011 |
Capitalized software | $ | 7,432 | $ | 7,933 |
Depreciation and amortization |
| 15,404 |
| 16,910 |
Intangible assets |
| 9,920 |
| - |
Unrealized gain on derivative instruments |
| 709 |
| 105 |
Undistributed earnings of foreign subsidiaries |
| 8,437 |
| 9,024 |
Gross deferred tax liabilties |
| 41,902 |
| 33,972 |
Operating loss carryforwards |
| (86,285) |
| (61,148) |
Intangible assets |
| - |
| (10,800) |
Vacation and other accruals |
| (5,895) |
| (6,432) |
Inventory valuation and warranty provisions |
| (11,773) |
| (10,724) |
Doubtful accounts and sales provisions |
| (1,229) |
| (1,084) |
Unrealized exchange loss |
| (1,664) |
| (33) |
Deferred revenue |
| (3,987) |
| (1,991) |
Accrued rent expenses |
| (219) |
| (132) |
GSA accrual |
| - |
| (4,831) |
10% minority stock investment |
| (932) |
| (915) |
Stock-based compensation |
| (5,471) |
| (4,640) |
Research and development tax credit carryforward |
| (2,421) |
| (4,562) |
Foreign tax credit carryforward |
| - |
| (1,006) |
Other |
| (561) |
| (518) |
Gross deferred tax assets |
| (120,437) |
| (108,816) |
Valuation allowance |
| 91,649 |
| 79,864 |
Net deferred tax liability | $ | 13,114 | $ | 5,020 |
| December 31, | ||||||||
| 2009 | 2008 | |||||||
| Capitalized software | $ | 5,978 | $ | 4,615 | ||||
| Depreciation and amortization | 10,577 | 9,536 | ||||||
| Unrealized gain on derivative instruments | — | 4,153 | ||||||
| Undistributed earnings of foreign subsidiaries | 9,278 | 10,075 | ||||||
| Gross deferred tax liabilities | 25,833 | 28,379 | ||||||
| Operating loss carryforwards | (57,422 | ) | (43,360 | ) | ||||
| Intangible assets | (44,159 | ) | (58,987 | ) | ||||
| Vacation and other accruals | (3,700 | ) | (4,890 | ) | ||||
| Inventory valuation and warranty provisions | (6,702 | ) | (12,665 | ) | ||||
| Doubtful accounts and sales provisions | (1,088 | ) | (1,512 | ) | ||||
| Unrealized exchange loss | (917 | ) | (1,345 | ) | ||||
| Deferred revenue . | (853 | ) | (71 | ) | ||||
| Accrued rent expenses | (111 | ) | (117 | ) | ||||
| Accrued legal expenses | (710 | ) | (1,466 | ) | ||||
| Unrealized loss on derivative instruments | (242 | ) | — | |||||
| 10% minority stock investment | (900 | ) | (920 | ) | ||||
| Stock-based compensation | (4,483 | ) | (5,353 | ) | ||||
| Research and development tax credit carryforward | (2,054 | ) | — | |||||
| Foreign tax credit carryforward | (1,775 | ) | — | |||||
| Other | (657 | ) | (783 | ) | ||||
| Gross deferred tax assets | (125,773 | ) | (131,469 | ) | ||||
| Valuation allowance | 99,862 | 85,815 | ||||||
| Net deferred tax liability (asset) | $ | (78 | ) | $ | (17,275 | ) | ||
A reconciliation of income taxes at the U.S. federal statutory income tax rate to theour effective tax rate follows:
|
|
|
|
|
|
|
|
|
|
|
|
|
|
| Years Ended December 31, |
| ||||
| 2012 |
| 2011 |
| 2010 |
|
U.S. federal statutory rate | 35 | % | 35 | % | 35 | % |
Foreign taxes (less) than federal statutory rate | (5) |
| (7) |
| (9) |
|
Research and development tax credits | - |
| (3) |
| (3) |
|
Enhanced deduction for certain research and development expenses | (15) |
| (16) |
| (10) |
|
State income taxes, net of federal tax benefit | 1 |
| 1 |
| 1 |
|
Employee share-based compensation | 2 |
| 1 |
| - |
|
Intercompany profit | 2 |
| 3 |
| 1 |
|
Nondeductible acquisition costs | 2 |
| - |
| - |
|
Other | - |
| 1 |
| - |
|
Effective tax rate | 22 | % | 15 | % | 15 | % |
| Years Ended December 31, | ||||||||||||
| 2009 | 2008 | 2007 | ||||||||||
| U.S. federal statutory tax rate | 35 | % | 35 | % | 35 | % | ||||||
| Domestic production activities | — | — | (1 | ) | ||||||||
| Foreign taxes (less) than federal statutory rate | (6 | ) | (9 | ) | (14 | ) | ||||||
| Change in valuation allowance | 17 | (9 | ) | (16 | ) | |||||||
| Research and development tax credit | (4 | ) | (2 | ) | (1 | ) | ||||||
| Tax exempt interest | — | (1 | ) | (1 | ) | |||||||
| State income taxes, net of federal tax benefit | 1 | 1 | 1 | |||||||||
| Employee share-based compensation | 7 | 2 | 2 | |||||||||
| Intercompany profit | 15 | (5 | ) | — | ||||||||
| Other | 1 | 2 | 1 | |||||||||
| Effective tax rate | 66 | % | 14 | % | 6 | % | ||||||
As of income taxes at the U.S. federal statutory income tax rate to the effective tax rate have been reclassified to conform to the 2009 presentation as shown in the following tables:
As of December 31, 2009, eleven2012, 15 of our subsidiaries havehad available, for income tax purposes, foreign net operating loss carryforwards of an aggregate of approximately $286$445 million, of which $12.1$7.9 million expireexpires during the years 2011 - - 20182017 to 2022 and $273.9$437 million of which may be carried forward indefinitely. Our tax valuation allowance relates primarily to our ability to realize certain of these foreign net operating loss carryforwards and benefits of tax deductible goodwill in excess of book goodwill.
F-24
In 2003, we restructured the organization of our manufacturing operation in Hungary. The tax deductible goodwill in excess of book goodwill created by this restructuring resulted in our being required to record a gross deferred tax asset of $91.0$91 million. Because we did not expect to have sufficient taxable income in the relevant jurisdiction in future periods to realize the benefit of this deferred tax asset, a full valuation allowance was established. Following the approval of the merger of our Hungarian manufacturing operation with its Hungarian parent company in December 2007, we released $9.7 million, $8.7 million and $18.3 million in 2009, 2008 and 2007, respectively, of the valuation allowance previously established for the excess tax deductible goodwill to reflect the tax benefit we expected to realize in future periods.
Effective January 1, 2010, a new tax law in Hungary providesprovided for an enhanced deduction for the qualified research and development expenses of NI Hungary Software and Hardware Manufacturing Kft. ("(“NI Hungary"Hungary”). During the three months ended December 31, 2009, we obtained confirmation of the application of this new tax law for the qualified research and development expenses of NI Hungary. Based on the application of this new tax law to the qualified research and development expense of NI Hungary, we no longer expect to have sufficient future taxable income in Hungary to realize the benefits of these tax assets. As such, we recorded an income tax charge of $21.6 million during the three months ended December 31, 2009, $18.4 million of which was related to a valuation allowance on the previously recognized assets created by the restructuring and $3.2 million of which was related to tax benefits from other assets that we will no longer be able to realize as a result of this change. We do not expect to realize the tax benefit of the remaining assets created by the restructuring and therefore we havehad a full valuation allowance of $98.2 million against those assets at December 31, 2009.
We have not provided for U.S. federal income and foreign withholding taxes on approximately $267.5$568 million of certain non-U.S. subsidiaries’ undistributed earnings as of December 31, 2009.2012. These earnings would become subject to taxes of approximately $85.7$188 million, if they were actually or deemed to be remitted to the parent company as dividends or if we should sell our stock in these subsidiaries. We intend to permanently reinvest the undistributed earnings.
We adopted the provisions of FASB ASC 740, on January 1, 2007. FASB ASC 740 clarifies the accountingaccount for uncertainty in income taxes recognized in an entity'sour financial statements and prescribes ausing prescribed recognition thresholdthresholds and measurement attributeattributes for financial statement disclosure of tax positions taken or expected to be taken on aour tax return.returns. We recognized no material adjustment to the liability for unrecognized income tax benefits. A reconciliation of the beginning and ending amount of unrecognized tax benefit is as follows (in thousands):follows:
|
|
|
|
|
|
|
|
|
|
(In thousands) |
| 2012 |
| 2011 |
Balance at beginning of period | $ | 19,494 | $ | 14,953 |
Additions based on tax positions related to the current year |
| 3,150 |
| 6,300 |
Additions for tax positions of prior years |
| 1,764 |
| 1,908 |
Reductions as a result of settlement with taxing authorities |
| (285) |
| - |
Reductions as a result the lapse of the applicable statute of limitations |
| (2,256) |
| (3,667) |
Reduction for tax positions of prior years |
| (947) |
| - |
Balance at end of period | $ | 20,920 | $ | 19,494 |
| 2009 | 2008 | |||||||
Balance at beginning of period | $ | 9,364 | $ | 8,273 | ||||
Additions based on tax positions related to the current year | 2,060 | 1,946 | ||||||
Additions for tax positions of prior years | 1,272 | 366 | ||||||
| Reductions as a result of the lapse of the applicable statute of limitations | (1,634 | ) | (1,221 | ) | ||||
Balance at end of period | $ | 11,062 | $ | 9,364 | ||||
All of our unrecognized tax benefits at December 31, 20092012 would affect our effective income tax rate if recognized. As of December 31, 2009, it is deemed reasonably possible that the Company will recognize tax benefits in the amount of $2.3 million in the next twelve months due to the closing of open tax years. The nature of the uncertainty relates to deductions taken on returns that have not been examined by the applicable tax authority.
We recognize interest and penalties related to income tax matters in income tax expense. During the years ended December 31, 20092012 and 2008,2011, we recognized interest expense related to uncertain tax positions of approximately $506,000$782,000 and $365,000,$627,000, respectively.
The tax years 20022005 through 20092012 remain open to examination by the major taxing jurisdictions in which we file income tax returns. The Internal Revenue Service commenced an examination of our US income tax return for 2008 in the fourth quarter of 2012 as a result of a refund claim filed for that year. The IRS has not proposed any adjustments as of December 31, 2012. As the statute of limitations has expired for 2008 and any assessment would be limited to the amount of the refund claim, we do not anticipate any potential adjustment would result in a material change to our financial position.
Note 10 – Comprehensive income
Our comprehensive income is comprised of net income, foreign currency translation, unrealized gains and losses on forward and option contracts and securities classified as available-for-sale. The accumulated other comprehensive income/(loss), net of tax, as of December 31, 2012 and December 31, 2011, consisted of the following:
|
|
|
|
|
|
|
|
|
|
|
|
|
|
|
|
|
|
|
| December 31, 2012 | ||||||
(In thousands) |
| Currency translation adjustment |
| Investments |
| Derivative instruments |
| Accumulated other comprehensive income |
Balance as of December 31, 2011 | $ | (1,543) | $ | (664) | $ | (1,293) | $ | (3,500) |
Current-period other comprehensive income |
| 2,231 |
| 56 |
| 3,247 |
| 5,534 |
Income tax expense |
| (480) |
| (12) |
| (698) |
| (1,190) |
Balance as of December 31, 2012 | $ | 208 | $ | (620) | $ | 1,256 | $ | 844 |
F-25
|
|
|
|
|
|
|
|
|
|
|
|
|
|
|
|
|
|
|
| December 31, 2011 | ||||||
(In thousands) |
| Currency translation adjustment |
| Investments |
| Derivative instruments |
| Accumulated other comprehensive income |
Balance as of December 31, 2010 | $ | (497) | $ | 196 | $ | (409) | $ | (710) |
Current-period other comprehensive loss |
| (1,236) |
| (1,017) |
| (1,045) |
| (3,298) |
Income tax benefit |
| 190 |
| 157 |
| 161 |
| 508 |
Balance as of December 31, 2011 | $ | (1,543) | $ | (664) | $ | (1,293) | $ | (3,500) |
Note 1011 – Stockholders’ equity and stock-based compensation
Stock option plans
Our stockholders approved the 1994 Incentive Stock Option Plan (the “1994 Plan”) on May 9, 1994. At the time of approval, 9,112,50013,668,750 shares of our common stock were reserved for issuance under this plan. In 1997, an additional 7,087,50010,631,250 shares of our common stock were reserved for issuance under this plan, and an additional 750,0001,125,000 shares were reserved for issuance under this plan as amended, in 2004. The 1994 Plan terminated in May 2005, except with respect to outstanding awards previously granted thereunder. there under.
Awards under the plan were either incentive stock options within the meaning of Section 422 of the Internal Revenue Code or nonqualified options. The right to purchase shares under the options vests over a five to ten-year period, beginning on the date of grant. Vesting of ten year awards may accelerate based on the Company’s previous year’s earnings and revenue growth but shares cannot accelerate to vest over a period of less than five years. Stock options must be exercised within ten years from date of grant. Stock options were issued atwith an exercise price which was equal to the market price of our common stock at the grant date. As part of the requirements of FASB ASC 718, we are required toWe estimate potential forfeitures of stock grants and adjust compensation cost recorded accordingly. The estimate of forfeitures will be adjusted over the requisite service period to the extent that actual forfeitures differ, or are expected to differ, from such estimates. Changes in estimated forfeitures will be recognized through a cumulative catch-up adjustment in the period of change and will also impact the amount of stock compensation expense to be recognized in future periods.
Transactions under all stock option plans are summarized as follows:
|
|
|
|
|
|
|
|
| Number of shares under option |
| Weighted average exercise price |
Outstanding at December 31, 2009 | 5,567,254 | $ | 17.95 |
Exercised | (2,291,757) | $ | 17.55 |
Canceled | (941,049) | $ | 20.93 |
Granted | - | $ | - |
Outstanding at December 31, 2010 | 2,334,448 | $ | 17.15 |
Exercised | (932,895) | $ | 15.94 |
Canceled | (84,337) | $ | 16.23 |
Granted | - | $ | - |
Outstanding at December 31, 2011 | 1,317,216 | $ | 18.07 |
Exercised | (237,146) | $ | 16.59 |
Canceled | (26,945) | $ | 17.07 |
Granted | - | $ | - |
Outstanding at December 31, 2012 | 1,053,125 | $ | 18.44 |
|
|
|
|
Options exercisable at December 31: |
|
|
|
2010 | 2,138,886 | $ | 17.07 |
2011 | 1,270,775 | $ | 18.06 |
2012 | 1,034,559 | $ | 18.44 |
F-26
Number of shares under option | Weighted average exercise price | |||||||
| Outstanding at December 31, 2006 | 6,914,673 | $ | 22.49 | |||||
| Exercised | (1,515,107 | ) | 15.22 | |||||
| Canceled | (104,925 | ) | 27.33 | |||||
| Granted | — | — | ||||||
| Outstanding at December 31, 2007 | 5,294,641 | $ | 24.47 | |||||
| Exercised | (925,743 | ) | 17.30 | |||||
| Canceled | (96,331 | ) | 26.98 | |||||
| Granted | — | — | ||||||
| Outstanding at December 31, 2008 | 4,272,567 | $ | 25.97 | |||||
| Exercised | (379,630 | ) | 15.40 | |||||
| Canceled | (181,434 | ) | 26.80 | |||||
| Granted | — | — | ||||||
| Outstanding at December 31, 2009 | 3,711,503 | $ | 26.93 | |||||
| Options exercisable at December 31: | ||||||||
| 2007 | 4,368,972 | $ | 24.17 | |||||
| 2008 | 3,812,334 | 26.00 | ||||||
| 2009 | 3,493,574 | 26.94 | ||||||
The aggregate intrinsic value of stock options at exercise, represented in the table above, was $2.3$2.4 million, $11.0$13.0 million and $22.3$12.0 million for the years ended December 31, 2009, 20082012, 2011 and 2007,2010, respectively. Total unrecognized stock-based compensation expense related to non-vested stock options was approximately $2.5 million$72,600 as of December 31, 2009,2012, related to approximately 218,00018,600 shares with a per share weighted average fair value of $17.50.$11.79. We anticipate this expense to be recognized over a weighted average period of approximately 4.31.2 years.
|
|
|
|
|
|
|
|
|
|
|
| |
|
|
|
|
|
|
|
|
|
|
|
| |
|
|
| Outstanding and Exercisable by Price Range as of December 31, 2012 | |||||||||
|
|
| Options Outstanding |
| Options Exercisable | |||||||
| Range of Exercise Prices |
| Number outstanding as of 12/31/2012 |
| Weighted average remaining contractual life |
| Weighted average exercise price |
| Number exerciseable as of 12/31/2012 |
| Weighted average exercise price | |
$ | 13.41 - 15.09 |
| 243,751 |
| 1.15 | $ | 14.14 |
| 238,451 | $ | 14.14 | |
$ | 15.09 - 19.69 |
| 108,544 |
| 1.19 | $ | 18.30 |
| 108,544 | $ | 18.30 | |
$ | 19.69 - 21.67 |
| 700,830 |
| 1.22 | $ | 19.95 |
| 687,564 | $ | 19.95 | |
$ | 13.41 - 21.67 |
| 1,053,125 |
| 1.20 | $ | 18.44 |
| 1,034,559 | $ | 18.44 | |
| Outstanding and Exercisable by Price Range as of December 31, 2009 | ||||||||||||||||||||||
| Options Outstanding | Options Exercisable | |||||||||||||||||||||
Range of Exercise prices | Number outstanding as of 12/31/2009 | Weighted average remaining contractual life | Weighted average exercise price | Number exercisable as of 12/31/2009 | Weighted average exercise price | |||||||||||||||||
| $16.08 – $21.95 | 1,238,441 | 1.74 | $ | 20.69 | 1,188,337 | $ | 20.71 | |||||||||||||||
| $22.30 – $29.85 | 1,257,625 | 3.90 | $ | 28.15 | 1,098,218 | $ | 28.08 | |||||||||||||||
| $30.51 – $34.38 | 1,215,437 | 0.41 | $ | 32.02 | 1,207,019 | $ | 32.02 | |||||||||||||||
| $16.08 – $34.38 | 3,711,503 | 2.04 | $ | 26.93 | 3,493,574 | $ | 26.94 | |||||||||||||||
The weighted average remaining contractual life of options exercisable as of December 31, 20092012 was 1.91.2 years. The aggregate intrinsic value of options outstanding as of December 31, 20092012 was $9.4$7.8 million. The aggregate intrinsic value of options currently exercisable as of December 31, 20092012 was $8.8$7.6 million. No options were granted in the years ended December 31, 2009, 20082012, 2011 and 2007 as our incentive option plan terminated in May 2005.
Restricted stock plan
Our stockholders approved our 2005 Incentive Plan (the “2005 Plan”) on May 10, 2005. At the time of approval, 2,700,0004,050,000 shares of our common stock were reserved for issuance under this plan, as well as the number of shares which had been reserved but not issued under the 1994 Plan (our incentive stock option plan which terminated in May 2005), and any shares that returned to the 1994 Plan as a result of termination of options or repurchase of shares issued under such plan. The 2005 Plan, administered by the Compensation Committee of the Board of Directors, providesprovided for granting of incentive awards in the form of restricted stock and restricted stock units (“RSUs”) to directors, executive officers and employees of the Company and its subsidiaries. Awards vest over a three, five or ten-year period, beginning on the date of grant. Vesting of ten year awards may accelerate based on the Company’s previous year’s earnings and growth but ten year awards cannot accelerate to vest over a period of less than five years. SharesThe 2005 Plan terminated on May 11, 2010, except with respect to outstanding awards previously granted thereunder. There were 3,362,304 shares of common stock that were reserved but not issued under the 1994 Plan and the 2005 Plan as of May 11, 2010.
Our stockholders approved our 2010 Incentive Plan (the “2010 Plan”) on May 11, 2010. At the time of approval, 3,000,000 shares of our common stock were reserved for issuance under this plan, as well as the 3,362,304 shares of common stock that were reserved but not issued under the 1994 Plan and the 2005 Plan as of May 11, 2010, and any shares that are returned to the 1994 Plan and the 2005 Plan as a result of the forfeiture or termination of options or RSUs or repurchases of shares issued under these plans. The 2010 Plan, administered by the Compensation Committee of the Board of Directors, provides for granting of incentive awards in the form of restricted stock and RSUs to employees, directors and consultants of the Company and employees and consultants of any parent or subsidiary of the Company. Awards vest over a three, five or ten-year period, beginning on the date of grant. Vesting of ten year awards may accelerate based on the Company’s previous year’s earnings and growth but ten year awards cannot accelerate to vest over a period of less than five years. At December 31, 2012, there were 3,871,389 shares available for grant at December 31, 2009 were 2,089,302. As part ofunder the requirements of FASB ASC 718, we are required to2010 Plan.
We estimate potential forfeitures of RSUs and adjust compensation cost recorded accordingly. The estimate of forfeitures will be adjusted over the requisite service period to the extent that actual forfeitures differ, or are expected to differ, from such estimates. Changes in estimated forfeitures will be recognized through a cumulative catch-up adjustment in the period of change and will also impact the amount of stock compensation expense to be recognized in future periods. During the year ended December 31, 2012, we did not make any changes in accounting principles or methods of estimates related to the 2010 Plan.
F-27
Transactions under the 2005 Planour Restricted Stock Plans are summarized as follows:
|
|
|
|
|
|
|
|
| RSUs | ||
| Number of RSUs |
| Weighted average grant price |
Outstanding at December 31, 2009 | 3,456,651 | $ | 17.65 |
Granted | 294,030 | $ | 22.60 |
Earned | (680,188) | $ | 23.05 |
Canceled | (74,196) | $ | 18.47 |
Outstanding at December 31, 2010 | 2,996,297 | $ | 17.97 |
Granted | 1,370,666 | $ | 30.14 |
Earned | (860,598) | $ | 30.30 |
Canceled | (84,843) | $ | 20.82 |
Outstanding at December 31, 2011 | 3,421,522 | $ | 22.75 |
Granted | 1,311,105 | $ | 26.81 |
Earned | (841,918) | $ | 27.19 |
Canceled | (85,435) | $ | 23.15 |
Outstanding at December 31, 2012 | 3,805,274 | $ | 24.62 |
| RSUs | ||||||||
Number of RSUs | Weighted Average Grant Price | |||||||
Balance at January 1, 2007 | 1,324,933 | $ | 26.77 | |||||
Granted | 801,780 | $ | 27.90 | |||||
Earned | (209,303 | ) | $ | 27.85 | ||||
Canceled | (75,776 | ) | $ | 27.64 | ||||
Balance at December 31, 2007 | 1,841,634 | $ | 26.86 | |||||
Granted | 763,182 | $ | 28.51 | |||||
Earned | (320,251 | ) | $ | 29.42 | ||||
Canceled | (119,337 | ) | $ | 28.19 | ||||
Balance at December 31, 2008 | 2,165,228 | $ | 26.99 | |||||
Granted | 604,083 | $ | 21.80 | |||||
Earned | (407,156 | ) | $ | 22.04 | ||||
Canceled | (57,721 | ) | $ | 27.88 | ||||
Balance at December 31, 2009 | 2,304,434 | $ | 26.48 | |||||
Total unrecognized stock-based compensation expense related to non-vested RSU’sRSUs was approximately $57.1$89.3 million as of December 31, 2009,2012, related to 2,304,4343,805,274 shares with a per share weighted average fair value of $26.48.$24.62. We anticipate this expense to be recognized over a weighted average period of approximately 7.37.4 years.
Employee stock purchase plan
Our employee stock purchase plan permits substantially all domestic employees and employees of designated subsidiaries to acquire our common stock at a purchase price of 85% of the lower of the market price at the beginning or the end of the purchase period. The plan has quarterly purchase periods generally beginning on February 1, May 1, August 1 and November 1 of each year. At our annual shareholders meeting held on May 7, 2007, our shareholders approved an additional 3 million shares of common stock to be reserved for issuance under this plan. Employees may designate up to 15% of their compensation for the purchase of common stock under this plan. CommonOn May 10, 2011, our stockholders approved an additional 3,000,000 shares for issuance under our employee stock purchase plan, and at December 31, 2012, we had 2,557,655 shares of common stock reserved for future employee purchases aggregated 1,755,071 shares at December 31, 2009. Shares issuedissuance under this plan were 838,536 inplan. During the year ended December 31, 2009.2012, we issued 1,122,483 shares under this plan. The weighted average fair valuepurchase price of the employees’ purchase rights for these shares was $19.05$21.84 per share and was estimated using the Black-Scholes model with the following assumptions:
|
|
|
|
|
|
|
|
|
|
|
|
| 2012 |
| 2011 |
| 2010 |
Dividend expense yield | 0.5% |
| 0.4% |
| 0.4% |
Expected life | 3 months |
| 3 months |
| 3 months |
Expected volatility | 40% |
| 44% |
| 25% |
Risk-free interest rate | 0.1% |
| 0.1% |
| 0.1% |
| 2009 | 2008 | 2007 | ||||||||||
| Dividend expense yield | 0.5% | 0.3% | 0.3% | |||||||||
| Expected life | 3 months | 3 months | 3 months | |||||||||
| Expected volatility | 45% | 26% | 23% | |||||||||
| Risk-free interest rate | 0.8% | 3.8% | 5.0% | |||||||||
During the year ended December 31, 2012, we did not make any changes in accounting principles or methods of estimates related to the employee stock purchase plan.
Weighted average, grant date fair value of purchase rights granted under the Employee Stock Purchase Plan are as follows:
|
|
|
|
|
|
|
|
| Number of Shares |
| Weighted average fair value |
2010 | 1,011,765 | $ | 4.35 |
2011 | 940,703 | $ | 6.56 |
2012 | 1,122,483 | $ | 5.93 |
Number of shares | Weighted average fair value | |||||||
| 2007 | 549,719 | $ | 6.19 | |||||
| 2008 | 679,983 | 5.86 | ||||||
| 2009 | 838,536 | 5.75 | ||||||
| 2009 | 2008 | 2007 | ||||||||||
| Stock-based compensation | ||||||||||||
| Total cost of sales | $ | 1,284 | $ | 1,063 | $ | 911 | ||||||
| Sales and marketing | 8,774 | 8,479 | 7,322 | |||||||||
| Research and development | 7,236 | 7,121 | 6,435 | |||||||||
| General and administrative | 3,005 | 3,084 | 2,866 | |||||||||
| Provision for income taxes | (3,765 | ) | (4,601 | ) | (3,839 | ) | ||||||
| Total | $ | 16,534 | $ | 15,146 | $ | 13,695 | ||||||
Authorized Preferred Stock and Preferred Stock Purchase Rights Plan
We have 5,000,000 authorized shares of preferred stock. On January 21, 2004, our Board of Directors designated 750,000 of these shares as Series A Participating Preferred Stock in conjunction with its adoption of a Preferred Stock Rights Agreement (the “Rights Agreement”) and declaration of a dividend of one preferred share purchase right (a “Right”) for each share of common stock outstanding held as of May 10, 2004 or issued thereafter. Each Right will entitle its holder to purchase one one-thousandth of a share of National Instruments’ Series A Participating Preferred Stock at an exercise price of $200,
F-28
subject to adjustment, under certain circumstances. The Rights Agreement was not adopted in response to any effort to acquire control of National Instruments.
The Rights only become exercisable in certain limited circumstances following the tenth day after a person or group announces acquisitions of or tender offers for 20% or more of our common stock. In addition, if an acquirer (subject to certain exclusions for certain current stockholders of National Instruments, an “Acquiring Person”) obtains 20% or more of our common stock, then each Right (other than the Rights owned by an Acquiring Person or its affiliates) will entitle the holder to purchase, for the exercise price, shares of our common stock having a value equal to two times the exercise price. Under certain circumstances, our Board of Directors may redeem the Rights, in whole, but not in part, at a purchase price of $0.01 per Right. The Rights have no voting privileges and are attached to and automatically traded with our common stock until the occurrence of specified trigger events. The Rights will expire on the earlier of May 10, 2014 or the exchange or redemption of the Rights.
There were not any shares of preferred stock issued and outstanding at December 31, 2012 and December 31, 2011.
Stock repurchases and retirements
From time to time, our Board of Directors approvedhas authorized various programs to repurchase shares of our common stock depending on market conditions and other factors. Under such programs, we maintained various stock repurchase programs. Pursuant to these plans we had purchased and retiredrepurchased a total of 7,354,9662,089,098 shares for approximately $184.9 million from 1998 throughof our common stock at a weighted average price of $20.04 per share, in the year ended December 31, 2007. During 2008, we purchased an additional 4,110,042 share for approximately $103.6 million. At December 31, 2008, there were 723,092 shares available for repurchase under the plan approved in2010. On April 2008. On January 23, 2009,21, 2010, our Board of Directors approved a new share repurchase planprogram that increased the aggregate number of shares of common stock that we are authorized to purchaserepurchase from 591,3241,011,147 to 3.0 million. During 2009, we purchased an additional 1,443,441 shares for approximately $34.64.5 million. At December 31, 2009,2012, there were 1,688,3273,932,245 shares remaining available for repurchase under the plan approved in January 2009. Our sharethis plan. This repurchase plan does not have an expiration date.
Note 1112 – Employee retirement plan
We have a defined contribution retirement plan pursuant to Section 401(k) of the Internal Revenue Code. Substantially all domestic employees with at least 30 days of continuous service are eligible to participate and may contribute up to 15% of their compensation. The Board of Directors has elected to make matching contributions equal to 50% of employee contributions, which may be applied to a maximum of 6% of each participant’s compensation. Employees are eligible for matching contributions after one year of continuous service. Company contributions vest immediately. Our policy prohibits participants from direct investment in shares of our common stock within the plan. Company contributions charged to expense were $3.9$5.3 million, $3.7$4.7 million and $3.3$4.4 million in 2009, 20082012, 2011 and 2007,2010, respectively.
Note 1213 – Segment inf
We determine operating segments using the management approach. The management approach designates the internal organization that is used by management for making operating decisions and assessing performance as the source of our operating segments. It also requires disclosures about products and services, geographic areas and major customers.
We have defined our operating segment based on geographic regions. We sell our productsIn the fourth quarter of 2012, we created a new geographical territory in three geographic regions.Asia, resulting in four regions: Americas, Europe, East Asia and Emerging Asia Rest of World (ROW). Our sales to these regions share similar economic characteristics, similar product mix, similar customers, and similar distribution methods. Accordingly, we have elected to aggregate these threefour geographic regions into a single operating segment. Revenue from the sale of our products which are similar in nature and software maintenance are reflected as total net sales in our Consolidated Statements of Income.
Total net sales, operating income, interest income and long-lived assets, classified by the major geographic areas in which we operate, are as follows (in thousands):follows:
|
|
|
|
|
|
|
|
|
|
|
| ||
(In thousands) |
| Years ended December 31, | ||||
|
| 2012 |
| 2011 |
| 2010 |
Net sales: |
|
|
|
|
|
|
Americas | $ | 454,616 | $ | 411,006 | $ | 359,895 |
Europe |
| 297,572 |
| 308,619 |
| 261,118 |
East Asia |
| 282,512 |
| 215,500 |
| 180,713 |
Emerging Asia ROW |
| 108,992 |
| 89,048 |
| 71,494 |
| $ | 1,143,692 | $ | 1,024,173 | $ | 873,220 |
|
|
|
|
|
|
|
|
| Years ended December 31, | ||||
|
| 2012 |
| 2011 |
| 2010 |
Operating income: |
|
|
|
|
|
|
Americas | $ | 41,266 | $ | 55,140 | $ | 71,339 |
Europe |
| 135,600 |
| 142,533 |
| 131,691 |
East Asia |
| 125,879 |
| 85,005 |
| 66,414 |
Emerging Asia ROW |
| 37,183 |
| 29,105 |
| 17,018 |
Unallocated: |
|
|
|
|
|
|
Research and development expenses |
| (222,994) |
| (199,071) |
| (158,149) |
| $ | 116,934 | $ | 112,712 | $ | 128,313 |
|
|
|
|
|
|
|
|
| Years ended December 31, | ||||
|
| 2012 |
| 2011 |
| 2010 |
Interest income: |
|
|
|
|
|
|
Americas | $ | 177 | $ | 408 | $ | 588 |
Europe |
| 432 |
| 771 |
| 699 |
East Asia |
| 23 |
| 23 |
| 14 |
Emerging Asia ROW |
| 84 |
| 117 |
| 90 |
| $ | 716 | $ | 1,319 | $ | 1,391 |
|
|
|
|
|
|
|
|
|
|
| December 31, | ||
|
|
|
| 2012 |
| 2011 |
Long-lived assets: |
|
|
|
|
|
|
Americas |
|
| $ | 120,329 | $ | 110,153 |
Europe |
|
|
| 48,465 |
| 47,000 |
East Asia |
|
|
| 3,428 |
| 4,728 |
Emerging Asia ROW |
|
|
| 77,499 |
| 28,267 |
|
|
| $ | 249,721 | $ | 190,148 |
F-29
| Years Ended December 31, | ||||||||||||
| 2009 | 2008 | 2007 | ||||||||||
| Net sales: | ||||||||||||
| Americas: | ||||||||||||
Unaffiliated customer sales | $ | 292,999 | $ | 355,878 | $ | 331,482 | ||||||
Geographic transfers | 86,145 | 132,563 | 115,709 | |||||||||
| 379,144 | 488,441 | 447,191 | ||||||||||
| Europe: | ||||||||||||
Unaffiliated customer sales | 210,188 | 267,373 | 230,940 | |||||||||
Geographic transfers | 189,076 | 204,282 | 159,992 | |||||||||
| 399,264 | 471,655 | 390,932 | ||||||||||
| Asia Pacific: | ||||||||||||
Unaffiliated customer sales | 173,407 | 197,286 | 177,956 | |||||||||
| Eliminations | (275,221 | ) | (336,845 | ) | (275,701 | ) | ||||||
| $ | 676,594 | $ | 820,537 | $ | 740,378 | |||||||
| Years Ended December 31, | ||||||||||||
| 2009 | 2008 | 2007 | ||||||||||
| Operating income: | ||||||||||||
| Americas | $ | 46,816 | $ | 71,467 | $ | 76,292 | ||||||
| Europe | 87,250 | 105,748 | 92,469 | |||||||||
| Asia Pacific | 45,439 | 61,642 | 59,845 | |||||||||
Unallocated: | ||||||||||||
| Research and development expenses | (132,974 | ) | (143,140 | ) | (126,515 | ) | ||||||
| $ | 46,531 | $ | 95,717 | $ | 102,091 | |||||||
| Years Ended December 31, | ||||||||||||
| 2009 | 2008 | 2007 | ||||||||||
| Interest income: | ||||||||||||
| Americas | $ | 803 | $ | 2,603 | $ | 5,138 | ||||||
| Europe | 727 | 3,291 | 4,485 | |||||||||
| Asia Pacific | 99 | 102 | 199 | |||||||||
| $ | 1,629 | $ | 5,996 | $ | 9,822 | |||||||
| December 31, | ||||||||
| 2009 | 2008 | |||||||
| Long-lived assets: | ||||||||
| Americas | $ | 100,489 | $ | 107,701 | ||||
| Europe | 36,555 | 39,280 | ||||||
| Asia Pacific | 16,221 | 7,496 | ||||||
| $ | 153,265 | $ | 154,477 | |||||
Total sales outside the United StatesU.S. for 2009, 20082012, 2011 and 20072010 were $412.7$721.7 million, $499.3$645.7 million and $437.0$543.7 million, respectively.
Note 1314 – Commitments, contingencies and leases
We have commitments under non-cancelable operating leases primarily for office facilities throughout the world. Certain leases require us to pay property taxes, insurance and routine maintenance, and include escalation clauses. Future minimum lease payments as of December 31, 2009,2012, for each of the next five years are as follows (in thousands):follows:
|
|
|
|
|
|
|
| Amount |
|
| (In thousands) |
2013 | $ | 17,096 |
2014 |
| 14,042 |
2015 |
| 12,132 |
2016 |
| 8,030 |
2017 |
| 5,011 |
Thereafter |
| 7,019 |
| $ | 63,330 |
| 2010 | $ | 14,415 | ||
| 2011 | 9,898 | |||
| 2012 | 6,982 | |||
| 2013 | 4,611 | |||
| 2014 | 3,665 | |||
| Thereafter | 12,130 | |||
| $ | 51,701 |
Rent expense under operating leases was approximately $12.3$17.1 million, $11.7$16.3 million and $10.2$13.5 million for the years ended December 31, 2009, 20082012, 2011 and 2007,2010, respectively.
As of December 31, 2009,2012, we have non-cancelable purchase commitments with various suppliers of customized inventory and inventory components totaling approximately $6.5$7.3 million over the next twelve months.
F-30
As of December 31, 2009,2012, we have outstanding guarantees for payment of customs and foreign grants totaling approximately $5.2$5.0 million, which are generally payable over the next twelve months.
From November 1999 to May 2011, we sold products to the U.S. government under a contract with the General Services Administration ("GSA"). Our previous contract with GSA contained a price reduction or "most favored customer" pricing provision. During 2011 and 2012, we had been in discussions with GSA regarding our compliance with this pricing provision and provided GSA with information regarding our pricing practices. In 2011, GSA conducted an on-site review of our GSA pricing practices and orally informed us that GSA did not agree with our previous determination of the potential non-compliance amount. GSA subsequently requested that we conduct a further analysis of the non-compliance amount based upon a methodology that GSA proposed. This analysis resulted in calculated overpayments (including added interest) by GSA to us of approximately $13.1 million.
Note 1415 – Litigation
We filedare not currently a patent infringement action on January 25, 2001,party to any material litigation. However, in the U.S. District Court, Eastern District of Texas (Marshall Division) claiming that The MathWorks, Inc. (“MathWorks”) infringed certainordinary course of our U.S. patents. On January 30, 2003, a jury found infringement by MathWorksbusiness, we are involved in legal actions, both as plaintiff and defendant, and could incur uninsured liability in any one or more of three of the patents involved and awarded us specified damages. On September 23, 2003, the District Court entered final judgment in favor of us and entered an injunction against MathWorks’ sale of its Simulink and related products and stayed the injunction pending appeal. Upon appeal, the judgment and the injunction were affirmed by the U.S. Court of Appeals for the Federal Circuit (September 3, 2004). Subsequently the stay of injunction was lifted by the District Court. In November 2004, the final judgment amount of $7.4 million which had been held in escrow pending appeal was released to us.
Note 16 – Acquisitions
In the fourth quarter of 2006, we accrued an additional $600,000 related to this contingency. During the third quarter of 2009, we reduced the accrual by $2 million to reflect a decrease in the estimated costs that are probable of being incurred in this action. To date, we have charged a cumulative total of $623,000 against this accrual. At December 31, 2009, the remaining accrual was $2 million.
The allocation of the purchase price was determined using the fair value of assets and liabilities acquired as of February 1, 2008. We funded the purchase price from existing cash balances.respective closing dates. Our consolidated financial statements include the operating results from the date of acquisition. Pro-forma results orof operations have not been presented because the effects of those operations were not material. The following table summarizes the allocation of the purchase price of microLEX (in thousands):these acquisitions:
Amount | ||
(In thousands) | ||
Net tangible assets acquired | $ | 8,099 |
Amortizable intangible assets | 24,137 | |
Deferred tax liability | (7,899) | |
Goodwill | 17,987 | |
Total | $ | 42,324 |
| Goodwill | $ | 10,818 | ||
| Acquired core technology | 5,201 | |||
| Non-competition agreements | 159 | |||
| Trademarks | 119 | |||
| Customer relationships | 354 | |||
| Current assets acquired | 3,057 | |||
| Long-term assets acquired | 20 | |||
| Current liabilities assumed | (486 | ) | ||
| Deferred tax liabilities | (1,458 | ) | ||
| Total assets acquired | $ | 17,784 |
Goodwill is not deductible for tax purposes. Existing technology, non-competition agreements, trademarks, and customer relationshipsAmortizable intangible assets have useful lives of 4 months to 5 years 3 years, 3 years, and 5 years, respectively, from the date of acquisition. These assets are not deductible for tax purposes.purposes for two of the three acquisitions.
F-31
AWR Corporation
On June 30, 2011, we acquired all of the outstanding shares of AWR Corporation (AWR), a privately held company that is a leading supplier of electronic design automation software for designing radio frequency and high-frequency components and systems for the semiconductor, aerospace and defense, communications and test equipment industries. The following quarterly results have been derivedacquisition is expected to improve customer productivity through increased interoperability between upfront design and validation and production test functions. The purchase price of the acquisition was $66 million consisting of $54 million in cash and a three-year earn-out arrangement. We funded the purchase price from unauditedexisting cash balances. The range of potential undiscounted payments that we could be required to make under the earn-out arrangement is between $0 and $29 million and are payable if AWR achieves certain revenue and operating income targets. The fair value of the earn-out arrangement was estimated at $12 million using the income approach, the key assumptions which included probability-weighted revenue and operating expense growth projections. In July 2012, the Company paid the amount due to the former AWR shareholders based on the first earn-out year performance of AWR. The amount paid was $3.3 million, and it is being recorded as a reduction of the earn-out liability. We re-measure the fair value of the earn-out liability each quarter. In the fourth quarter of 2012, we adjusted the acquisition earn out accrual by $6.8 million as AWR’s performance exceeded our prior expectations.
The allocation of the purchase price was determined using the fair value of assets and liabilities acquired as of June 30, 2011. The finalization of our purchase price allocation during the three months ended June 30, 2012 resulted in an increase in acquired deferred tax assets and a decrease in goodwill of approximately $1.6 million. Our consolidated financial statements that, ininclude the opinion of management, reflect all adjustments (consisting only of normal recurring adjustments) necessary for a fair presentation of such quarterly information. The operating results for any quarter arefrom the date of acquisition. Pro-forma results of operations have not necessarily indicativebeen presented because the effects of those operations were not material. The following table summarizes the allocation of the results to be expectedpurchase price of AWR:
Amount | ||
(In thousands) | ||
Net tangible assets acquired | $ | 10,718 |
Amortizable intangible assets | 31,685 | |
Deferred tax liability | (8,387) | |
Goodwill | 32,379 | |
Total | $ | 66,395 |
Goodwill is not deductible for any future period. The unaudited quarterly financial data for eachtax purposes. Amortizable intangible assets have useful lives of 5 years from the date of acquisition.
Phase Matrix Inc.
On May 20, 2011, we acquired all of the eight quartersoutstanding shares of Phase Matrix, Inc. (PMI), a privately held company that designs and manufactures radio frequency and microwave test and measurement instruments, subsystems and components. The acquisition is expected to speed our deployment of high-performance RF and wireless technologies to our production test and R&D customers. The purchase price of the acquisition was $40.7 million consisting of $38.9 million in cash and $1.8 million in shares of our common stock. We funded the twocash portion of the purchase price from existing cash balances.
The allocation of the purchase price was determined using the fair value of assets and liabilities acquired as of May 20, 2011. Our consolidated financial statements include the operating results from the date of acquisition. Pro-forma results of operations have not been presented because the effects of those operations were not material. The following table summarizes the allocation of the purchase price of Phase Matrix, Inc.:
Amount | ||
(In thousands) | ||
Net tangible assets acquired | $ | 5,624 |
Amortizable intangible assets | 8,331 | |
Goodwill | 26,725 | |
Total | $ | 40,680 |
Goodwill is deductible for tax purposes. Amortizable intangible assets have useful lives which range from 9 months to 8 years ended December 31, 2009from the date of acquisition. These assets are as follows (in thousands, except per share data):also deductible for tax purposes.
F-32
| Three Months Ended | ||||||||||||||||
Mar. 31, 2009 | Jun. 30, 2009 | Sep. 30, 2009 | Dec. 31, 2009 | |||||||||||||
| Net sales | $ | 157,799 | $ | 152,163 | $ | 165,035 | $ | 201,597 | ||||||||
| Gross profit | 116,916 | 111,677 | 123,136 | 154,981 | ||||||||||||
| Operating income | (2,479 | ) | 2,341 | 10,688 | 35,981 | |||||||||||
| Net income | 358 | 4,430 | 9,931 | 2,366 | ||||||||||||
| Basic earnings per share | $ | 0.00 | $ | 0.06 | $ | 0.13 | $ | 0.03 | ||||||||
| Weighted average shares outstanding-basic | 77,277 | 77,556 | 77,653 | 77,589 | ||||||||||||
| Diluted earnings per share | $ | 0.00 | $ | 0.06 | $ | 0.13 | $ | 0.03 | ||||||||
| Weighted average shares outstanding-diluted | 77,436 | 77,824 | 78,103 | 78,325 | ||||||||||||
| Dividends declared per share | $ | 0.12 | $ | 0.12 | $ | 0.12 | $ | 0.12 | ||||||||
| Three Months Ended | ||||||||||||||||
Mar. 31, 2008 | Jun. 30, 2008 | Sep. 30, 2008 | Dec. 31, 2008 | |||||||||||||
| Net sales | $ | 192,918 | $ | 210,474 | $ | 215,038 | $ | 202,107 | ||||||||
| Gross profit | 143,849 | 157,034 | 160,531 | 152,014 | ||||||||||||
| Operating income | 18,065 | 27,834 | 27,946 | 21,872 | ||||||||||||
| Net income | 17,616 | 24,734 | 23,159 | 19,318 | ||||||||||||
| Basic earnings per share | $ | 0.22 | $ | 0.32 | $ | 0.29 | $ | 0.25 | ||||||||
| Weighted average shares outstanding-basic | 78,840 | 78,484 | 78,834 | 78,110 | ||||||||||||
| Diluted earnings per share | $ | 0.22 | $ | 0.31 | $ | 0.29 | $ | 0.25 | ||||||||
| Weighted average shares outstanding-diluted | 79,825 | 79,549 | 79,841 | 78,522 | ||||||||||||
| Dividends declared per share | $ | 0.11 | $ | 0.11 | $ | 0.11 | $ | 0.11 | ||||||||
Note 17 – Subsequent events
We have evaluated subsequent events through February 17, 2010, the date the financial statements were issued.
On January 22, 2010,31, 2013, our Board of Directors declared a quarterly cash dividend of $0.13$0.14 per common share, payable March 1, 2010,11, 2013, to shareholdersstockholders of record on February 8, 2010.19, 2013.
F-33